J. 001. · Dubai • Acquired 35% stake in Leighton Contractors (India) Private Limited • Raised...
291
Y4rWELSPUN CORP PIPES AND PLATES WCL/SE~2018 August 16, 2018 BSE Ltd. National Stock Exchange of India Ltd. (Scrip Code-532144) (Symbol: WELCORP, Series EQ) Listing Department, Exchange Plaza, P. J. Towers, Dalal Street, Bandra-Kurla Complex, Mumbai — 400 001. Bandra (E), Mumbai — 400 051. Dear Sir / Madam, Sub.: Compliance of Regulation 34 of the SEBI (Listing Obligations and Disclosure Requirements) Regulations, 2015. In compliance with Regulation 34 of the SEBI (Listing Obligations and Disclosure Requirements) Regulations, 2015, kindly find attached Annual Report of the Company approved and adopted in the 231x1 Annual General Meeting of the Company held on Tuesday, August 14, 2018 at the Registered Office of the Company at Welspun City, Village Versamedi, Taluka Anjar, Dist. Kutch, Cujarat - 370110. Please take the same on record. Thanking you. Yours faithfully, For Welspun Corp Limited Pradeep’joshi Company Secretary FCS - 4959 Weispun Corp Limited Weispun House, 5th Floor, Kamala City, Senapati Bapat Marg, Lower Parel (West), Mumbai 400 013. India. T: +91 22 6613 6000 / 2490 8000 F +91 22 2490 8020 E-mail companysecretary_wclL’~1welspun.com Website : www.welspuncorp.com Registered Address: Welspun City, Village Versarnedi, Taluka Anjar, District Kutch. Gujarat 370 110. India. T +91 2836 662222 F +91 2836 279060 Corporate Identity Number: L27100GJ1995PLC025609
Transcript of J. 001. · Dubai • Acquired 35% stake in Leighton Contractors (India) Private Limited • Raised...

Y4rWELSPUN CORPPIPES AND PLATES
WCL/SE~2018 August 16, 2018
BSE Ltd. National Stock Exchange of India Ltd.(Scrip Code-532144) (Symbol: WELCORP, Series EQ)Listing Department, Exchange Plaza,P. J. Towers, Dalal Street, Bandra-Kurla Complex,Mumbai — 400 001. Bandra (E), Mumbai — 400 051.
Dear Sir / Madam,
Sub.: Compliance of Regulation 34 of the SEBI (Listing Obligations and DisclosureRequirements) Regulations, 2015.
In compliance with Regulation 34 of the SEBI (Listing Obligations and DisclosureRequirements) Regulations, 2015, kindly find attached Annual Report of the Companyapproved and adopted in the 231x1 Annual General Meeting of the Company held onTuesday, August 14, 2018 at the Registered Office of the Company at Welspun City,Village Versamedi, Taluka Anjar, Dist. Kutch, Cujarat - 370110.
Please take the same on record.
Thanking you.
Yours faithfully,For Welspun Corp Limited
Pradeep’joshiCompany SecretaryFCS - 4959
Weispun Corp LimitedWeispun House, 5th Floor, Kamala City, Senapati Bapat Marg, Lower Parel (West), Mumbai 400 013. India.T: +91 22 6613 6000 / 2490 8000 F +91 22 2490 8020E-mail companysecretary_wclL’~1welspun.com Website : www.welspuncorp.com
Registered Address: Welspun City, Village Versarnedi, Taluka Anjar, District Kutch. Gujarat 370 110. India.T +91 2836 662222 F +91 2836 279060
Corporate Identity Number: L27100GJ1995PLC025609

CreatingPossibilities.
TransformingLives.
ANNUAL REPORT2017-18
CreatingPossibilities.
TransformingLives.
ANNUAL REPORT2017-18

Forward-looking Statements
In this Annual Report, we have disclosed forward-looking information to enable investors to comprehend our prospects and take investment decisions. This Report and other statements-written and oral-that we periodically make contain forward-looking statements that set out anticipated results based on the management’s plans and assumptions. We have tried, wherever possible, to identify such statements by using words such as ‘anticipate’, ‘estimate’, ‘expects’, ‘projects’, ‘intends’, ‘plans’, ‘believes’ and words of similar substance in connection with any discussion of future performance. We cannot guarantee that these forward-looking statements will be realised, although we believe we have been prudent in our assumptions. The achievements of results are subject to risks, uncertainties and even inaccurate assumptions. Should known or unknown risks or uncertainties materialise, or should underlying assumptions prove inaccurate, actual results could vary materially from those anticipated, estimated or projected. Readers should keep this in mind. We undertake no obligation to publicly update any forward-looking statement, whether as a result of new information, future events or otherwise.
Contents
Scan this code with a QR reader app on your smart phone or tablet and know more about us
The Welspun Corp Story
01 Welspun Corp at a Glance 04 Our Products and Solutions 06 Our Milestones 08 Our Diversified Global Presence10 Chairman’s Message12 Our Performance 14 Our Strategic Priorities 16 Creating Possibilities,
Transforming Lives 18 Oil & Gas Opportunities20 Water Opportunities22 The People Edge24 Corporate Social Responsibility
Governance Reports
28 Management Discussion and Analysis 52 Directors’ Report 81 Corporate Governance Report89 Business Responsibility Report
Financial Statements
Standalone111 Independent Auditors’ Report 118 Balance Sheet 119 Statement of Profit and Loss120 Cash Flow Statement122 Statement of Changes in Equity123 Notes
Consolidated183 Independent Auditors’ Report 188 Balance Sheet189 Statement of Profit and Loss190 Cash Flow Statement192 Statement of Changes in Equity193 Notes

Creating possibilities. Transforming lives.
FY 2018 remained a year of inflection for us in terms of business environment. At Welspun Corp, we continued to be resilient and worked towards building our capabilities and focusing on future opportunities.
While we started the year on a subdued note, we closed the year with more than 1.6 million MT of order book, our highest ever.
During FY 2018, we improved our profitability and set clear benchmarks for the future by delivering challenging projects that helped our client’s businesses and positively transformed lives of the end-users.
We are on the cusp of a transformation and we intend to utilise our expert processes and innovative manufacturing capabilities to tap new opportunities.
With a renewed vision and leadership, we are identifying new and upcoming possibilities. We are further gearing to leverage them, growing from strength to strength and delivering value for all our stakeholders.
We are optimistic about the limitless possibilities and confident of our capabilities. Going forward, we will remain committed to creating solutions that will transform lives.

Welspun Corp Limited (WCL) is among the world’s largest welded line pipe manufacturers. A flagship company of the $ 2.3 Billion Welspun Group, WCL is a preferred supplier to several Fortune 100 oil and gas companies.
WCL is a one-stop service provider offering comprehensive pipe solutions. The Company manufactures line pipes ranging from 1.5 inch to 140 inches, including Longitudinal Submerged Arc Welded (LSAW), Spiral Helical Submerged Arc Welded (HSAW) and Electric Resistance Welded (ERW) pipes and High-frequency Induction Welded (HFIW) pipes. It also provides specialised coating, double jointing and bending facilities.
Currently, WCL has a manufacturing capacity of 2.425 Million MTPA across five manufacturing plants in India (Dahej and Anjar in Gujarat and Mandya in Karnataka), the US (Little Rock, Arkansas) and Saudi Arabia (Dammam). During FY2018, its order book reached a new benchmark with orders worth ` 109 Billion and 1,657 KMT.
Leading line pipe manufacturer
The Company has a robust team of 4,500+ people. It focuses on building a culture of ‘Engineering Excellence’, coupled with developing an innovative approach as well as its technical capabilities. Over the years, these factors have helped WCL undertake some of the most challenging projects across the world, supported by its state-of-the-art facilities and global scale of operations. It has a credible list of clients that remains unmatched in the industry.
02

Our manufacturing capacity (in KMT)US Facility Saudi Facility India Facility
Vision
Delight our customers through innovation and technology, achieve inclusive and sustainable growth to remain eminent in all our businesses.
MissionLeadership: We endeavour to achieve a leadership position in each segment/sector of our products/services.
Commitment: We are committed to satisfying our customers by providing quality products and services, which give the highest value for money.
Strength: We believe that employees are our most important asset through which we can reach the top in each category of our products and services. Therefore, we emphasise on their all-round development through organised training and workshops.
Aspirations: We commit ourselves to continuous growth to fulfill the aspirations of our Customers, Employees and Shareholders.
Pillars of strength
End-to-end products and solutions
Diversified global presence
Experienced and professional team
Advanced technological prowess
Focus on R&D and pipeline technology
Expertise in delivering complex projects
Partnerships with global giants
HSAW
Total Combined Installed Capacity @2.45 mn MT
Coating Systems
Coating Systems
Coating Systems
HSAW LSAW
ERW/HFIW HSAWERW/HFIW
350 300 700
200 700175Plate & Coil
1,500
Annual Report 2017-18 Financial StatementsThe Welspun Corp Story Governance Reports
03

HSAW Pipes
Helically welded pipes made from Hot-rolled (HR) coils; used for onshore oil, gas and water transmission
Available in24- to 140-inch diameter, moderate wall thickness
ERW/HFIW Pipes
High-frequency electric welded pipes made from HR coils; used for downstream distribution of oil, gas and water
Available in 1.5- to 16-inch diameter, low/moderate wall thickness
LSAW Pipes
Longitudinally welded pipes made from HR plates; used for onshore/offshore oil and gas transmission
Available in 16- to 60-inch diameter, high wall thickness
Offering end-to-end products and solutions
04

Plates and coils
Provides WCL with vertical integration and competitive advantage in a few market segments
Coating systems
Concrete Weight Coating, Double Jointing, 3LPE, 3LPP, DJ, Internal Solvent/Solvent free coating, Coal Tar Enamel, Inside Cement Mortar Lining
Ancillary services
Pipe bending, Logistics, ID Machining, Logistics, Offloading and Dumping management
Annual Report 2017-18 Financial StatementsThe Welspun Corp Story Governance Reports
05

1997Diversified into the pipes business – Submerged Arc Welded (SAW) pipe unit at Dahej, Gujarat, India
1998Established the first 50,000 MTPA HSAW mill at Dahej, Gujarat
2000Commissioned a 200,000 MTPA LSAW mill at Dahej with Mannesmann Germany
Delivering value year on year
2005• Established Welspun City at Anjar,
Gujarat
• Expanded pipe facilities at Anjar, Gujarat
2007Bagged a 1,700 km keystone project from Trans Canada
2008• Integrated plate and coil mill at Anjar,
Gujarat
• Set up 150,000 MTPA HSAW mill at Anjar, Gujarat
• Achieved Level II automation, rolled X-70API Grade of 4.5 metres wide
2009 • Commissioned a 350,000 MTPA
HSAW pipes facility in Arkansas, US
• Started a coil mill at Anjar, Gujarat
2010• Rechristened as ‘Welspun Corp
Limited’
• Increased capacity for LSAW by 350,000 MTPA in Anjar, Gujarat and for HSAW by 100,000 MTPA in Mandya, Karnataka
• Completed investment in the Middle East with a 300,000 MTPA HSAW facility in Saudi Arabia
2001• Embarked on a Joint Venture (JV) with
Eupec Coatings GmbH, Germany
• Set up a pipe coating facility in Dahej, Gujarat
06

2011• Established Welspun Middle East in
Dubai
• Acquired 35% stake in Leighton Contractors (India) Private Limited
• Raised $ 290 million through GDRs & CCDs
2012• Commenced the installation of a
175,000 MTPA HFIW mill in Arkansas, US
• Enhanced the existing capacity of 100,000 MTPA HSAW in Mandya, Karnataka, further by 50%
2013• Achieved the highest-ever pipe
production, sales volumes and order booking at 1 Million MTPA
• Commissioned a 175,000 MTPA small-diameter HFIW mill in the US to cater to the shale gas business
• Demerged non-pipe businesses into Welspun Enterprises
• Strengthened the core-pipe business management team with several new professional CXO-level hires
2014• Received the first order from Shell
USA, single-largest order from Saudi Arabia and strategic orders from Statoil, TOTAL and South Stream
• Commissioned a double jointing plant and internal and external coating plants in Saudi Arabia and Anjar (Gujarat), respectively
• Sustained 1 million MTPA in pipe production, sales volumes and order booking
2015• Recorded high production and sales
volumes at the Saudi Arabia facility with significantly improved financial performance
• Stabilised the HFIW mill and streamlined operations at the US facility
• Revitalised operations at LSAW, and plate and coil mills in India
2016• Surpassed 1 million MTPA in pipe
production and sales volumes for the 4th consecutive year; order book at record high
• Set-up Concrete Weight Coating (CWC) plant at Anjar, Gujarat in JV with Wasco Energy Ltd.
2017• Started production at the Concrete
Weight Coating plant at Anjar, Gujarat
2018• Reported an all-time high order book
of ` 109 Billion at 1,657 KMT
• Surpassed 1 million MTPA in pipe production and sales volumes for the 5th time in six year
Annual Report 2017-18 Financial StatementsThe Welspun Corp Story Governance Reports
07
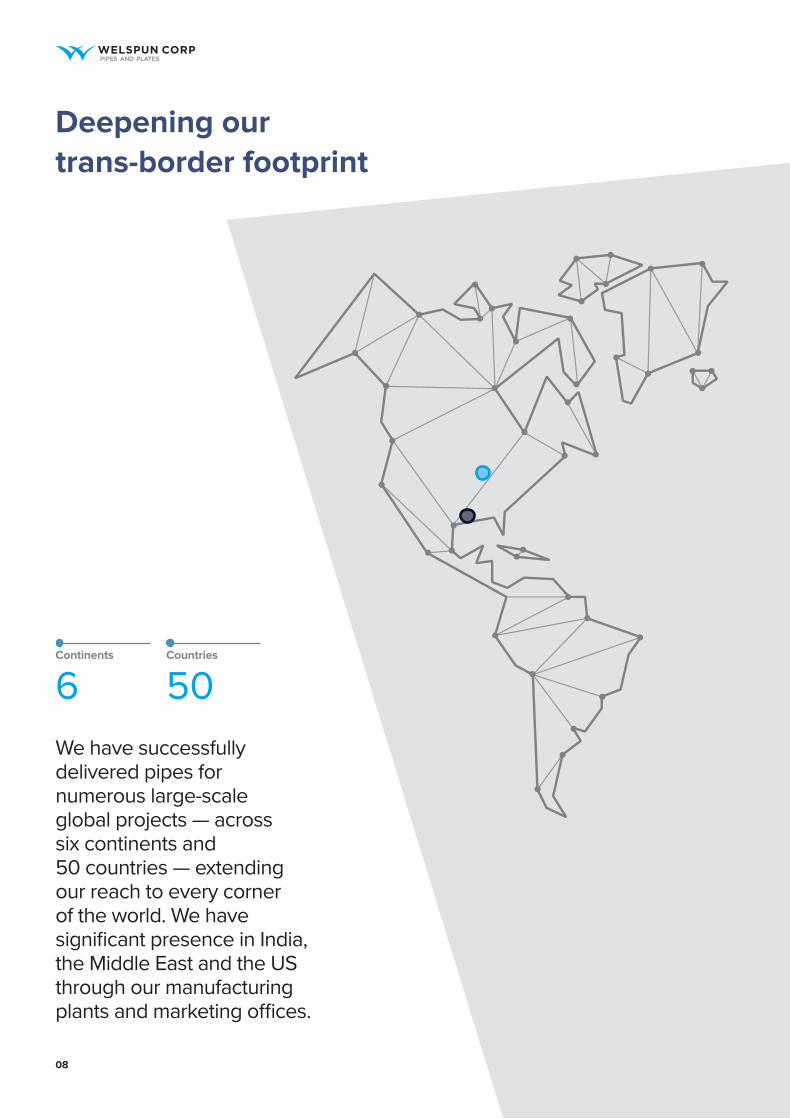
We have successfully delivered pipes for numerous large-scale global projects — across six continents and 50 countries — extending our reach to every corner of the world. We have significant presence in India, the Middle East and the US through our manufacturing plants and marketing offices.
Deepening our trans-border footprint
Continents Countries
6 50
08

Plant Locations
Anjar, India
Dahej, India
Mandya, India
Little Rock, US
Dammam, Saudi Arabia
Marketing Offices
Mumbai, India
Houston, US
Dammam, Saudi Arabia
Graphical representation of map. Not to scale
Annual Report 2017-18 Financial StatementsThe Welspun Corp Story Governance Reports
09

Chairman’s message
My dear fellow stakeholders,
It is with great eagerness that I look forward to sharing my thoughts on Welspun Corp with you every year. This gives me an opportunity not only to introspect on what we did in the year gone by, but also share my thoughts for the Company for the future.
FY18 in review
I believe FY18 was a year of inflection for Welspun Corp.
During the year, we saw significant changes in policy across the globe. The year saw the rise of protectionist policies by all major economies, especially on the steel side. Oil & gas as well as steel prices were volatile, with an increasing trend in prices especially in the latter half of the year. The rupee appreciated from the FY17 level for most part of the year. We started the year with a modest order book of around 600 KMT.Undoubtedly, the business environment was challenging.
However, we demonstrated our resilience in this tough environment. We booked new orders in excess of 2 Million MT for the year, a record for your Company. We ended at a historic-high order book of 1.6 Million MT. WCL crossed the 1 Million MT milestone in sales volumes – fifth time in six years that this coveted milestone was achieved.
Our operational performance also reflected in our financial position. With a continuous focus on maintaining financial discipline, your company was able to bring down the gross debt levels as well as the interest costs during the year. We made pre-payments of close to ` 7bn of higher cost debt, mainly consisting of NCDs. The undivided focus towards realigning debt book to match the business and repayment of debt wherever possible, has yielded results
with net debt going down by more than half to ` 4.2 Billion at FY18 end.
All this has been made possible by the Company’s global manufacturing base, technical excellence, client accreditations and reach across major key markets. WCL’s multi-locational line pipe capacity – spread across India, US and Saudi Arabia – helped us become a local player in each of these key markets and overcome any local content restrictions. Our exceptional track record and experience of delivering pipes with stringent specifications gives us an edge for prestigious and challenging projects. Our technical prowess and strong customer relationships has made us one of the preferred vendors for clients globally. We have also been continuously working on expanding our offering; the latest example being our Concrete Weight Coating facility.
A positive outlook for FY19
We are optimistic on the demand situation for FY19. The recent rise in the crude oil prices has improved the outlook for the pipeline market as higher prices are expected to drive investment into the sector. Demand for small diameter pipe continues to show good traction in Americas region. Large diameter segment is showing early signs of revival, with gas export projects gaining momentum. Demand from oil & gas segment in MENA is expected to pick-up over the course of the year. We see strong demand in the domestic market, especially in the water segment, driven by river-linking
and irrigation projects across states. In India, large diameter pipe demand for the Oil & Gas segment is expected to be driven by expansion of National Gas Grid while small diameter pipes is expected to be driven by City gas distribution and North east connectivity projects. However, competitive pressures remain in the domestic market. Demand outlook for our Plate and Coil Mills division remains satisfactory, although margin challenges remain.
Our order accretion in FY18 has laid a solid foundation for growth in FY19 and beyond. This will enable significant capacity utilisation and better margins, particularly for the US and Saudi Arabia facilities. We have no major capex plans for the year which should help generate positive cash flows and reduce our net debt further. Your company is well on track to achieve its vision of being nil net debt by 2020.
Long-Term Growth Potential
With increasing global population, GDP and improving living standards, as per the industry estimates, global energy demand is expected to grow by about 25 percent by the year 2040. The world will need to pursue different economic energy sources to keep up with this considerable demand growth. The fuel mix will consistently evolve, although oil and gas would remain the dominant source of energy for next couple of decades. The capacity of current global pipeline infrastructure continues to be deficient compared to the future
10

requirements. There are bottlenecks in the transportation of oil and gas from the producing regions to the consuming areas or to the export terminals. Even distribution hubs are short on storage capacity as well. These factors provide opportunities for the large diameter pipes across the globe.
Apart from oil and gas, the water segment also provides a huge opportunity for growth. Depleting availability of fresh water and lack of efficient infrastructure for transporting river water and desalinated seawater will drive pipeline demand. In the Middle East, the opportunity for pipelines lies in the fact that most of the desalination plants are at quite a distance from the consuming centres. While in India, interlinking of major rivers and irrigation projects are expected to provide huge potential demand for pipes.
Your company will continue to leverage its strengths – local presence in key markets, approvals from all major customers, technical expertise – to maintain and grow its leadership position in large-diameter pipelines.
Technology
At Welspun, we put technology at the forefront of everything we do. With our dedicated R&D Facility to facilitate capability enhancement, capacity expansion, de-bottlenecking, automation and product development programs, we have acquired an experience of delivering pipe with stringent specifications for several prestigious and challenging projects. We have a team of technical experts, who belong to various international technical committees for oil and gas pipeline research continuously researching on steel, strain-based and deep sea pipelines, welding technology and consumables, and quality integrated management systems.
Human Capital
As the first principle of the business, we at Welspun consider our human capital as our biggest resource. Thus,
we are constantly working on enhancing our human resource delivery by adopting the latest & best practices for people development and technology oriented human resource. One of the key highlights of the year was the stabilization of Success Factors (SF), one of the best-in-class Human Resource Management Systems. Your company continues to remain focused on building an agile organization that delivers on business strategy and provides an enriching employee experience.
Sustainability
Welspun believes in doing business which is not only consistent with the environment but also helps sustain the same in the long run. Your company has worked on several initiatives towards energy efficiency, emission and water management to minimize the impact of the business activity on the environment. The waste generated at the Anjar plant
is used in co-processing at a nearby cement plant as it has a high calorific value. We will continue to play our part responsibly in and around the region we operates in.
My Sincere gratitude
I take this occasion to express my heartfelt gratitude to our Board of Directors, our Management, our dedicated employees’ and our esteemed customers and suppliers, bankers and investors, for their devotion, support and commitment to Welspun. I strongly believe that, with your support, we will be able to strengthen our engineering excellence and reach new heights, thus setting benchmarks for the whole industry.
Balkrishan Goenka ChairmanWelspun Group
Annual Report 2017-18 Financial StatementsThe Welspun Corp Story Governance Reports
11

FY 17 60,355
75,873 FY 18
FY 17 2.09
2.23FY 18
FY 17 28,094
28,540 FY 18
FY 17 11,065
4,216 FY 18
Measuring our performance in FY2018
Revenue (` mn)
PAT (` mn)
Net Worth (` mn)
EBITDA (` mn)
Net Debt (` mn)
Fixed Asset Coverage Ratio
26% Growth
500% Growth
11% Growth
Reduced by ` 6,849 mn
Improvement by 0.14x
FY 17 264
1,583 FY 18
FY 17 7,370
8,147 FY 18
Financial Performance
Increased by ` 446 mn
12

Sales by Plant
Sales by Type
FY2017-18 Pipes Sales Volume: 1,084 KMT(including all operations)
LSAW
36%HSAW
50%ERW
36%ERW
14%
India
36%India
71%US
21%Saudi Arabia
9%
Annual Report 2017-18 Financial StatementsThe Welspun Corp Story Governance Reports
13

Our strategic priorities
Building a future-ready organisation
Growing product portfolio We have been consistently
adding relevant offerings to our product basket to meet customer requirements. We are further focusing on innovation to meet the evolving demands of the industry.
Over the years, we have transformed exponentially by cultivating our capabilities and growing our market share. As a future-ready organisation, we now aim to drive execution and governance by embracing international regulatory changes and creating best-in-class governance standards.
14

Targeting operational excellence
We have an excellent track record of maintaining high quality and compliance standards. We have leveraged our capabilities globally to offer solutions for some of the world’s most challenging projects.
Developing a sustainable business model
We continue to fortify our position globally with unique customer-centric solutions. With sustainability at the core of our business, our strategy remains to strengthen our business drivers, which will allow us to deliver value for all our stakeholders.
Annual Report 2017-18 Financial StatementsThe Welspun Corp Story Governance Reports
15

Creating possibilities. Transforming lives.
As one of the largest welded line pipe manufacturing companies in the world, we are optimistic about our future growth opportunities.
We believe building capabilities and efficiencies for developing more innovative products will help us make a tangible difference in the lives of our end users. We seek to create solutions that are ready for the challenges of tomorrow by delving into the fundamentals of our clients’ requirements.
At WCL, we are excited about the limitless possibilities and our ability to design solutions that can transform lives across the globe.
1616

Annual Report 2017-18 Financial StatementsThe Welspun Corp Story Governance Reports
17
Annual Report 2017-18 Financial StatementsGovernance Reports
17
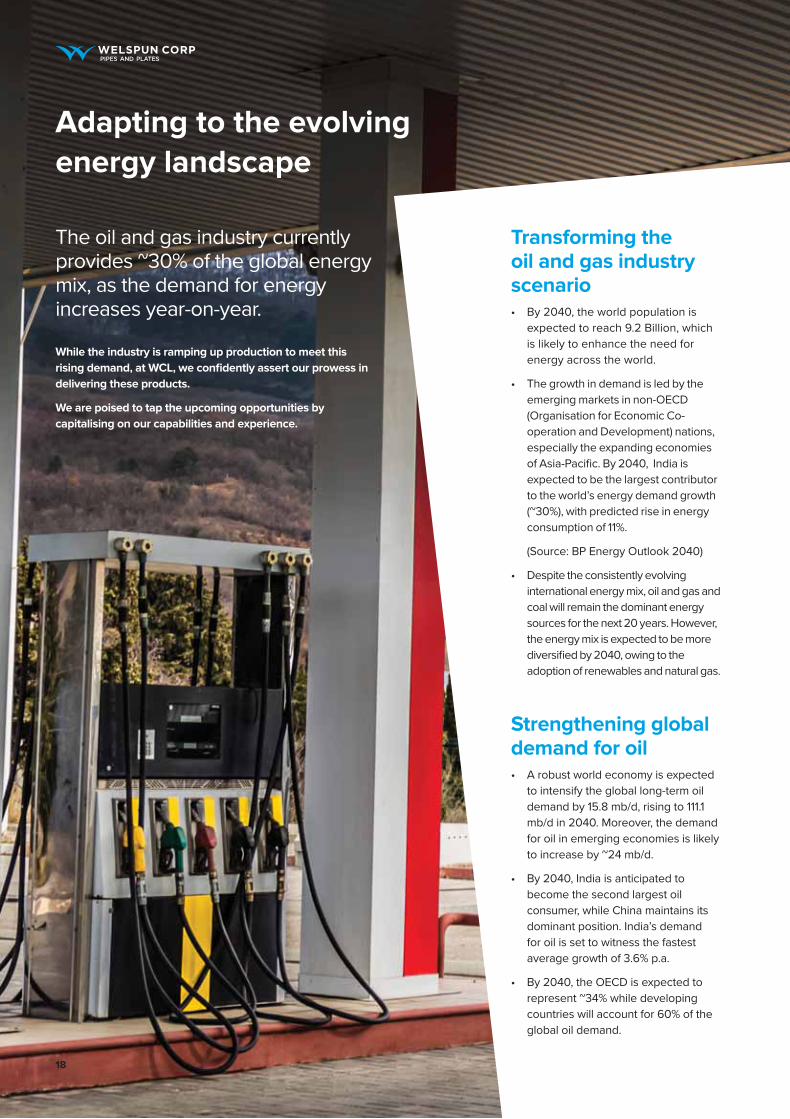
Adapting to the evolving energy landscape
The oil and gas industry currently provides ~30% of the global energy mix, as the demand for energy increases year-on-year.
While the industry is ramping up production to meet this rising demand, at WCL, we confidently assert our prowess in delivering these products.
We are poised to tap the upcoming opportunities by capitalising on our capabilities and experience.
Transforming the oil and gas industry scenario• By 2040, the world population is
expected to reach 9.2 Billion, which is likely to enhance the need for energy across the world.
• The growth in demand is led by the emerging markets in non-OECD (Organisation for Economic Co-operation and Development) nations, especially the expanding economies of Asia-Pacific. By 2040, India is expected to be the largest contributor to the world’s energy demand growth (~30%), with predicted rise in energy consumption of 11%.
(Source: BP Energy Outlook 2040)
• Despite the consistently evolving international energy mix, oil and gas and coal will remain the dominant energy sources for the next 20 years. However, the energy mix is expected to be more diversified by 2040, owing to the adoption of renewables and natural gas.
Strengthening global demand for oil • A robust world economy is expected
to intensify the global long-term oil demand by 15.8 mb/d, rising to 111.1 mb/d in 2040. Moreover, the demand for oil in emerging economies is likely to increase by ~24 mb/d.
• By 2040, India is anticipated to become the second largest oil consumer, while China maintains its dominant position. India’s demand for oil is set to witness the fastest average growth of 3.6% p.a.
• By 2040, the OECD is expected to represent ~34% while developing countries will account for 60% of the global oil demand.
18

Expanding consumption of oil in India • In March 2018, India’s oil refining
capacity reached 247.6 Million tonnes and it was listed as the world’s third largest crude oil and petroleum products consumer.
• Total oil consumption in India has expanded at a CAGR of 2.98% during FY2008-17 to reach 4.43 mb/d by 2017. Going forward, it’s expected to grow further.
Improving Liquefied Natural Gas (LNG) consumption trend • LNG consumption is expected to
surge with rising industrialisation and increased demand for power.
• The transport sector is expected to drive the fastest growth in the demand for LNG, especially in the trucking and marine transport segments with a projected increase of ~5% by 2040.
• On the production side, the US and the Middle East (Qatar and Iran) will contribute over half of the incremental production. By 2040, the US is expected to account for ~1/3rd of the global LNG production.
• By 2040, global LNG supplies will be more than double, with ~40% of the expansion occurring in the next five years.
Changing overview of India’s LNG segment• India’s LNG imports during FY2018
reached 18.05 MMT. Going forward, it intends to increase its LNG import capacity to 50 Million tonnes.
• The Government of India has allowed 100% Foreign Direct Investment (FDI) in upstream and private sector refining projects to reduce dependence on imports and attract investments for the segment.
• The FDI limit for public sector refining projects has been raised to 49% without any disinvestment or dilution of domestic equity in the existing Public-Sector Units (PSUs).
Moving ahead
At WCL, we are aware of the transformations across the energy sector and are gearing to leverage the upcoming opportunities. We are confident of our abilities to design solutions that are ready for the challenges of tomorrow. Going forward, our focus will continue to remain on providing our end users excellent products and services that add value to their lives.
Annual Report 2017-18 Financial StatementsThe Welspun Corp Story Governance Reports
19

Helping secure water for all
Helping secure water for all Water is an essential resource that enables life on earth. It is one of the world’s most critical resources that is depleting fast. As the global population is expected to increase from 7.4 Billion in 2017 to 9.2 Billion by 2040, the demand for water is estimated to rise by ~20-30% every year, during the same period. Therefore, water security and distribution will be a major concern, going forward.
At WCL, we are cognisant of this trend and are confident of the efficiency of our products that will help transport water to remote areas, thereby enabling and empowering communities and people. Currently, we see sound growth opportunities in the water sectors of India and the Middle East.
Understanding India’s water scenario• India extracts groundwater at a
rate that is more than the natural recharging capacity of its aquifers. At 1,544 m3 per capita water availability, the country is already water-starved. This is primarily because India contributes 17% to global population, but enjoys only 4% of the world’s freshwater resources.
• At present, almost half of India’s population – 600 Million people – encounter high to extreme water stress. By 2030, the demand for water in India is expected to be twice that of the supply of water.
• The Government of India has proposed a unique initiative to deal with the threatening water challenge of the country. In one of its major initiatives, the Government proposes to link the key rivers of India. The National River Linking Project seeks to build 30 river links and over 3,000 storage units.
• A US$ 100 Million loan agreement was signed between the Government and the New Development Bank (NDB), with the objective of restoring the 678 km long Indira Gandhi Canal to prevent seepage, conserve water and enhance efficiency of water usage.
“70% of WCL’s current order book comprises of Water orders”
Water 70%Other 30%
20

Growing opportunities in the Middle East• The Middle East is one of the key
demand areas for the water segment with consumption of c.18.3 bn cubic metres.
• Government research initiatives are focusing on industrial wastewater reuse, injection of treated wastewater into aquifers and the use of desalinated seawater for irrigation. The countries in the Middle East are strengthening their water availability, thereby ensuring better agriculture and food security.
• The opportunity for pipelines lies in the fact that producing/processing plants are far from the consumption centers.
• Pipelines will be required for water distribution from desalination plants to all cities with an average distance between 300 km and 500 km for each pipeline.
Moving ahead
We are uniquely placed to help regional governments in India and the Middle East to address the prevalent water crisis. Our wide range of line pipes are designed with a view towards long-term water health, which helps provide sustainable supply of water. Moreover, a track record of successful project execution in difficult terrains and quick turnaround times underlines our customer-centric engineering innovation. Going forward, we will endeavour to be a key enabler in the global journey towards water security.
Source: SWCC Report
Under Construction Working Under Study Private
Annual Report 2017-18 Financial StatementsThe Welspun Corp Story Governance Reports
21
The Welspun Corp Story

Transforming team WCL
Our people are the driving force behind our success in an ever-changing business landscape. Therefore, it is essential to re-equip them consistently with the relevant skill sets for our industry.
At WCL, our Human Resource (HR) strategy continues to evolve around our Group philosophy of Welspun 2.0, as we strive to reinforce our core values of customer centricity, collaboration, technology and inclusive growth.
Our people practices aim to deliver both strategic and operational excellence by enhancing the capabilities of our employees. We have introduced mechanisms to leverage our in-house expertise and strengthen our people management system to execute our business strategy.
HR Strategic Intent
Acquire
Engage
DevelopBest
Experience Story
Operating Model of HR
22

At WCL, we remain committed to provide our people a congenial workplace that embraces diversity and encourages meritocracy. We are confident this approach will help us build an agile organisation that delivers on our business strategy and provides an enriching employee experience.
Key highlights of FY2018
• Recruitment and onboarding: We have a comprehensive onboarding programme. During FY2018, we expanded the programme to include our blue-collar employees as well. We also have a special three-day induction programme for our unionised workforce that focuses on promoting Group values, mission and vision, policies and practices of the organisation. It also serves as an inclusivity activity at WCL.
• New grading structure: We rolled out a new grading structure across all our India offices. The exercise, based on Hay Group’s Job Evaluation methodology, has helped us flatten the organisational structure from 21 levels to 12 levels. This change is expected to bring more accountability into various levels through clearly defined work profiles and de-layering of decision making.
• Digitisation of HR processes: We further strengthened our Human Resource Management Systems (HRMS) by implementing digital tools across various HR practices. The HR procedures were digitised in a structured and systematic manner and include major processes such as succession planning, career development, learning, analytics and compensation.
• Building a talent pipeline: We started to groom our high-potential employees to ensure a strong talent pipeline. We use a combined approach of job enrichment and functional and behavioural capability development for professional as well as personal growth of our people. The approach includes a perfect blend of job rotations, leadership development programmes and focused technical trainings.
We also strengthened our team with recruitment for the bottom-most levels of the organisation to help develop our bench strength of talent for the future.
• Competency mapping and assessment: According to the previous years’ competency mapping and assessment, we designed and delivered the training programmes across all units during the second half of the year. The programmes were formulated based on the competency gaps and training needs identified by the managers/Heads of Departments (HODs). Also, as a measure to enhance the effectiveness of the training programmes, the same were also a part of the goal-setting process for the upcoming year.
• Technology training: We focused on training and developing modules designed specifically to deliver the tasks in the current technology ecosystem.
• Employee engagement initiatives: We launched several employee engagement initiatives to improve communications across all levels and functions. There were programmes such as Town Halls (communiqué by the MD), Employee Connect (one-to-one meetings with HR), Chai pe Charcha (discussions with the Business Unit Heads) and grievance redressal meetings by the Unit Heads, among others. These programmes garnered very good response from all quarters and were appreciated by our people across levels. As a result of these activities, the necessary corrective and preventive measures were put in place.
• Rewards and remunerations: We offer best-in-class compensation packages, with market-linked increments that have provisions for special increments for critical talent and promotions.
Annual Report 2017-18 Financial StatementsThe Welspun Corp Story Governance Reports
23

Enriching communities
We are inspired by our Group’s philosophy of supporting the 3Es of education, empowerment of women and youth and environmental and health care. At WCL, we catalyse progress for communities through various need-based interventions in these domains and invest in inclusive growth.
Our aim is to increase the access to quality education for students in rural India by developing a conducive learning environment in Government-run schools. We initiated the ‘Quality Education Project’, in close association with the Government of Gujarat, aimed at diminishing the Pupil-to-Teacher Ratio (PTR) at the Government-run schools in Anjar (Gujarat). The programme further endeavours to provide students with quality education through the para teacher concept. The para teachers are appointed for specific subjects on a retainership basis and play a key role in hand-holding and improving the academic performance of students.
Helping improve learning outcomes
We also conduct learning camps at Government-run schools in Anjar in association with Pratham, an NGO. The project is aimed at identifying students who require accelerated learning support. The camps are conducted by Pratham staff and community volunteers to enhance the learning outcomes of primary school students.
Supporting education with technology
Our Project Gyaankunj is aimed at enhancing classroom interactions and teaching-learning process with the help of technology. Under this project, we are installing digital education equipment across the schools of Valsad, Kutch and Bharuch districts, thereby creating a positive learning impact in the lives of 4,600 students.
Welspun Vidya Mandir
Welspun Vidya Mandir is our CBSE-affiliated school in Anjar, which provides education up to standard XII to over 1,600 students.
Memorandum of Understanding (MoU) with the Gujarat government for digitalisation of 500 schools
Welspun Foundation, our Group’s CSR division, has signed a MoU with the Government of Gujarat to digitalise 500 primary schools of the state by 2020, which will positively impact 1 lakh students.
Encouraging education
24

Bolstering empowerment
Promoting environment & health
We believe in gender equality and are advocates of women empowerment. Our initiatives are aimed at providing women with equal opportunities for growth and employment.
Assisting India’s sportswomen
Welspun Foundation for Health & Knowledge (WFHK) provides sponsorship to sportswomen to enable them to have a path-breaking career both nationally and internationally.
Generating livelihood opportunities
We further empower village women by offering them income opportunities. Our bio-degradable sanitary pad making centre in Vatar village near Vapi (Gujarat) serves a dual purpose. On one hand, it provides village women employment and on the other, it ensures 100% usage of sanitary pads in the rural communities of Gujarat.
SWASTI Foundation
We collaborated with Walmart to begin the SWASTI Foundation for women empowerment and training. So far, we have successfully trained 2,335 women in foundation-level and 519 women in advanced-level courses.
We undertook several measures towards conserving the environment and improving community healthcare, with significant investments within our manufacturing units as well as across the communities around us.
Reducing our environmental footprint
We installed Variable Frequency Drives (VFDs), digital temperature controllers and LED fixtures as part of our efforts to conserve energy. We also adopted 25 villages in Anjar and planted 10,000 saplings there.
Assisting the Swacch Bharat Mission
We are also participating in the national cause of Swacch Bharat to make India open-defecation free. We have built over 5,000 sanitation blocks in Vapi and Anjar in Gujarat, impacting more than 50 villages.
Curbing malnutrition
We initiated project Navchetna in 15 villages of Anjar and Vapi to reduce malnutrition and anaemia among children in the age group of 0-5 years and among reproductive-age women.
Annual Report 2017-18 Financial StatementsThe Welspun Corp Story Governance Reports
25

Powering rural development Our smart villages model is led the 5Es of e-connectivity, environment, education, essential infrastructure and empowerment. Our ambition is to develop modern and sustainable villages that would provide communities with employment, while creating ancillary livelihood options by leveraging technologies and green growth opportunities. By 2020, we plan to work together with 20 villages to implement replicable smart solutions. Till date, we have started work on five model villages.
Our progress in establishing five model villages
Model Village Vision 2020
• Education: 100% enrolment of children in Anganwadi and primary schools; Government-run schools to be ranked A+ in Gunotsav
• Empowerment: Ensuring Aadhar card, Voter’s ID and ration card for all villagers, 100% assistive devices to all persons with disabilities and strengthening of Self Help Groups (SHGs)
• Environment: 100% sanitation, plantation and safe portable drinking water
• Health: Zero malnutrition case in villages and 100% institutional delivery and functional Primary Health Care Centre
• Essential Infrastructure: Village gate, well-constructed road facility, shops to meet basic needs, centralised public communication centre and banking/ATM facility
Anjar
Vapi
Dahej
Ajpar and Kharapawariya
Moral and Vatar
Vadala
26

Management Discussion and
Analysis

Management Discussion and Analysis
MD & CEO’s Perspective
“FY 2018 was another successful year where we crossed the 1 Million MT mark in sales volumes - the fifth time in six years that we have crossed this coveted milestone. During the year, we booked new orders in excess of 2 Million MT, taking the year-end order book to an all-time high of 1.6 Million MT. This has set the foundation for strong volume growth in FY19. We are working relentlessly to further consolidate our operations and delivery capability across the world, engage with our customers and suppliers to deliver better results, in turn, strengthening our financial position as well.”Vipul Mathur Managing Director & CEO
The Management Discussion and Analysis (MD&A) should be read in conjunction with the Audited Consolidated Financial Statements of Welspun Corp Limited (”Welspun” or “WCL” or the “Company”) and the notes there to for the year ended March31, 2018. This MD&A covers Welspun’s financial position and operations for FY2018. Legal tender is stated in Indian Rupees unless indicated otherwise. The numbers used in the analysis are on a consolidated basis and the corresponding numbers for the previous year have been regrouped and reclassified wherever necessary.
Forward-looking StatementThis analysis contains forward-looking statements, which may be identified by their use of words such as ‘plans’, ‘expects’, ‘will’, ‘anticipates’, ‘believes’, ‘intends’, ‘projects’, ‘estimates’ or other words of similar meaning. All statements that address expectations or projections about the future, including, but not limited to, statements about the Company’s strategy for growth, product development, market position, expenditures, and financial results, are forward-looking statements. Forward-looking statements are based on certain assumptions and expectations of future events. The Company assumes no responsibility to publicly amend, modify or revise any forward-looking statements, on the basis of any subsequent developments, information or events.
28

Company OverviewWelspun Corp Limited is a leading manufacturer of large diameter pipes globally, offering a one-stop solution for all linepipe related requirements with its wide range of high grade line pipes. The pipes, produced at advanced state-of-the-art global manufacturing facilities in India, the US and Saudi Arabia for Longitudinal (LSAW), Spiral (HSAW) and ERW / HFIW, meet stringent specifications. The Company also has a plate and coil mill facility in India, which enhances its backward integration and also its ability to meet requirements of external customers across markets.
Global Customer Base and ReachThe Company’s distinguished clients (Fortune 100 companies) comprise bellwethers of the oil and gas sector (Shell, Saudi Aramco, TOTAL, Chevron, Energy Transfer, South Oil Company, Exxon Mobile, Kinder Morgan, TransCanada, Enbridge to name a few). The Company is a preferred vendor to over 50 major oil and gas companies, enhancing its ability to participate and bid in key projects globally. The Company’s local presence in major markets and ability to quickly respond to customer requirements across many markets has made the Company a supplier of choice for most customers.
Global Economic OverviewIn the year 2017-18, the global economy experienced a cyclical recovery, reflecting a rebound in investment, manufacturing activity and trade. Global GDP grew by 3.8 percent in CY2017 which was half percentage points higher than in CY2016 and the fastest since CY2011. The improvement came against the backdrop of favourable global financial conditions, generally accommodative policies, rising confidence and firming commodity prices. The upturn was broad-based, with growth increasing in more than half of the world’s economies, with out turns better for both the advanced and the Emerging Market and Developing Economy (EMDE) groups.
In advanced economies, growth in CY2017 rebounded to 2.3 percent from 1.7 percent in CY2016, driven by a pickup in capital spending, a turnaround in inventories and strengthening of external demand. Growth among EMDEs accelerated to 4.9 percent in CY2017 from 4.4 percent in CY2016, reflecting firming activity in commodity exporters and continued solid growth in commodity importers.
Looking forward, economic activity in both advanced economics and emerging economics is forecasted to carry into CY2018 and CY2019, with global growth expected at 3.9 percent for both years. For the two-year forecast horizon, the upward revisions to the global outlook result mainly from advanced economies, where growth is now expected to exceed 2 percent in CY2018 and CY2019. This forecast reflects the expectation that favorable global financial conditions and
strong sentiment will help maintain the recent acceleration in demand, especially in investment, with a noticeable impact on growth in economies with large exports. The expected global macroeconomic effects account for around one-half of the cumulative upward revision to the global growth forecast for CY2018 and CY2019, with a range of uncertainty around this baseline projection. The Indian economy is expected to be among the fastest-growing large economies with growth in excess of 7% p.a. expected in both the years. This is driven by strong private consumption as well as the fading transitory effects of the demonetization as well as the Goods and Services Tax (GST)introduction.
Foreign ExchangeDuring FY2018, US Dollar weakened against all major developed market currencies, including Euro (EUR), Japanese Yen (JPY) and Canadian Dollar (CAD). Against USD, both JPY and CAD appreciated ~4%, while EUR showed appreciation of about 13% in the year. The appreciation against US$ has put pressure on the exports and competitive edge of these countries.
Percent change in some of developed market currencies
100
110
120
90
80
04-2
017
05-2
017
06-2
017
07-2
017
08-2
017
09-2
017
10-2
017
11-2
017
12-2
017
01-2
018
02-2
018
03-2
018
USD-JPY
USD-CAD
USD-EUR
Source: Bloomberg
CY2019P
3.9
6.4
7.8
2.7
2
3.8
2.3
2.3
6.9
6.7
CY2014
World US Eurozone China India
CY2015 CY2016 CY2017 CY2018P
GDP Growth across Region (%)
Source: IMF Report April 2018
10.0
9.08.0
7.0
6.0
5.0
4.0
3.0
2.01.0
0
3.4
7.3
7.3
2.4
0.9
3.2
6.9 7.
6
2.6
2.0
3.2
6.7 6.7
1.7 1.8
6.6
7.4
2.4
3.9
2.9
Figure 1
Figure 2
Annual Report 2017-18 Financial StatementsThe Welspun Corp Story Governance Reports
29

Among emerging market currencies, depreciation of China Yuan Renminbi (CNY), Turkish Lira, Brazilian Real and Russian Ruble has significantly enhanced the competitive edge of suppliers from these markets. Among these, the CNY saw the maximum depreciation benefiting the Chinese players exporting to US. INR saw slight appreciation during the year against USD; however, it ended the year against the USD at levels very similar to the previous year’s close.
Global Energy DemandEnergy plays an important role in the every aspect of the world. It powers modern economies and raises living standards. Human activities depend on reliable supplies of electricity; oil plays a leading role to aid mobility and modern products; natural gas, solar and wind energy play an important role to meet variety of needs with less carbon intensity.
By CY2040, world population is expected to reach 9.2 Billion people, up from 7.4 Billion today. Over that same period, global GDP will likely double. As a result, per capita GDP is
projected to rise significantly, particularly in the non-member countries of the Organisation for Economic Co-operation and Development (OECD). Rising living standards for expanding population worldwide means a dependence on reliable modern energy. Combined, these factors are expected to help drive up global energy demand by about 25 percent by the year CY2040. The world will need to pursue different economic energy sources to keep up with this considerable demand growth.
Emerging markets in non-OECD nations will account for essentially all energy demand growth, led by the expanding economies in the Asia-Pacific region. Continuing urbanization and a significant expansion of the middle class, particularly in China and India, will help drive this trend, highlighted by greater access to modern energy in homes, rising industrial demand and significant increases in personal and commercial transportation needs. China, India and other emerging Asian Countries account for around two-thirds of the growth in energy consumption (refer fig. 4). The largest contribution to demand growth – almost 30% – will come from India, whose share of global energy use is expected to rise to 11% by CY2040.
The total energy demand growth is expected to be broadly based across all the main sectors, with the industrial sector accounting for around half of the overall increase (refer fig. 4). Growth in transport demand will be much slower than in the past, reflecting faster gains in vehicle efficiency and promotion of electric vehicles in the coming future.
The world’s fuel mix is consistently evolving, although oil and gas, together with coal, would remain the dominant sources of energy for next couple of decades. With the growth in renewable energy and natural gas, the energy mix by CY2040 is expected to be diversified (refer fig. 4).
End-use sector Region Fuel
Source: BP Energy Outlook 2040, 2018 Edition* Industry non-combusted use of fuels
Transport Industry*
Non-combusted Buildings
0
5
10
1970
1980
1990
2000
2010
2020
2030
2040
15
20
Primary energy demandBillion teo
Other Africa
Other Asia India
China OECD
0
5
10
1970
1980
1990
2000
2010
2020
2030
2040
15
20
0
5
10
1970
1980
1990
2000
2010
2020
2030
2040
15
20
Renewables Hydro
Nuclear Coal
Gas Oil
Percent change in major emerging market currencies
130
120
110
100
90
80
04-2
017
05-2
017
06-2
017
07-2
017
08-2
017
09-2
017
10-2
017
11-2
017
12-2
017
01-2
018
02-2
018
03-2
018
USD-CNY
USD-RUB
USD-TRY
EUR-MXN
USD-BRL
USD-INR
Source: Bloomberg
Figure 3
Figure 4
30

The Oil ScenarioA strong world economy is expected to underpin solid increase in oil demand. Global long-term oil demand is expected to increase by 15.8 Mb/d, rising to 111.1 Mb/d in CY2040. Driven by an expanding middle class, high population growth rates and stronger economic growth potential, developing countries’ oil demand is expected to increase by almost 24 Mb/d. China is anticipated to continue to be the largest oil consumer over the forecast period, adding 6 Mb/d to reach 17.8 Mb/d by CY2040. India will be the region with the second largest overall demand growth, adding 5.9 Mb/d between CY2016 and CY2040. Indian demand growth is also set to witness the fastest average growth of 3.6% p.a.
Most of the demand for oil is used for transportation purposes (road, aviation, marine, rail and domestic
waterways). Till CY2040, the transportation sector is expected to account for two out of every three additional barrels consumed. Also, oil use for industrial purposes (petrochemicals and other industries) is expected to increase, though at a slower pace than in the transportation sector.
Global liquids supply is expected to increase by a lower figure of 11 Mb/d. Supply escalation will be driven initially by US tight oil, with Organization of the Petroleum Exporting Countries (OPEC) taking over from the late 2020s, as Middle-East producers adopt a strategy of growing market share. OPEC output is expected to increase by around 6 Mb/d by CY2040. With OPEC capacity growing modestly, more attention will be focused on the non-OPEC countries. Non-OPEC supply is expected to grow by 5 Mb/d by CY2040, with the US accounting for more than the entire net growth and higher output in Brazil and Russia partially offsetting declines in higher cost, mature regions.
Growing demand for liquid fuels in emerging economies
2016 OECD Non-OECD
Mb/d
2016 Non-OPECdecline
Non-OPECgrowth
OPEC
110
105
100
95
90
85
80
Demand Supply
2040 level
Russia
Other
Brazil
Middle East
US
Africa
China
India
Other Asia
Figure 5
Source: BP Energy Outlook 2040, 2018 Edition
Annual Report 2017-18 Financial StatementsThe Welspun Corp Story Governance Reports
31

Interestingly, while demand in the OECD region in CY2016 accounted for 50% of global demand and that of developing countries accounted for 45%, by CY2040, the situation is anticipated to change significantly. The OECD is expected to
represent just 34% and developing countries are expected to account for 60% of the global demand. The outlook for long-term oil demand is presented in the Table below.
The Gas ScenarioGas holds a quarter share in the global primary energy mix, after oil and coal. The United States, Russia and China represent the world’s largest gas consumers. The largest producers are Russia, the United States, Canada, Qatar and Iran. Many countries are reforming their gas markets to increase the use of gas and to attract new investments. A diverse group of countries worldwide, including Mexico, China and Egypt, are moving ahead with important gas market reforms, allowing more private participation in the supply, transport and marketing of gas which will lead to sustainable balance of demand and supply.
Growth of gas consumption is expected to be strong. Natural gas growth will be supported by a number of factors such as: a) increasing levels of industrialization and power demand (particularly in emerging Asia and Africa), b) continued coal-to-gas switching as industry energy source (especially
in China), c) the increasing availability of low-cost supplies (in North America and the Middle East), and d) continuing expansion of supplies of Liquefied Natural Gas (LNG) increasing the availability of gas globally.
The increase in consumption will be led by industry and the power sector. The fastest rate of growth of gas demand will be in the transport sector as gas is increasingly used in trucking and marine transport. Although the increase in transport demand will be small in absolute amount, the share of gas within transport will increase to almost 5% by CY2040.
On the production side, the US and the Middle East (Qatar and Iran) will contribute over half of the incremental production. By CY2040, the US is expected to account for almost one quarter of global gas production, ahead of both the Middle East and Commonwealth of Independent States (CIS) (each accounting for around 20%). Global LNG supplies will be more than double by CY2040, with around 40% of the expansion occurring over the next five years.
Table 1Long-term oil demand
Mb/d
Particulars 2016 2020 2025 2030 2035 2040 Growth
2016–2040
OECD America 24.7 25.2 24.2 23.0 21.6 20.2 –4.4
OECD Europe 14.0 14.3 13.6 12.9 12.2 11.5 –2.6
OECD Asia Oceania 8.1 8.0 7.6 7.1 6.7 6.2 –1.9
OECD 46.8 47.5 45.5 43.0 40.5 37.9 –8.9
Latin America 5.7 6.0 6.4 6.8 7.0 7.3 1.6
Middle East & Africa 3.8 4.1 4.6 5.2 5.8 6.4 2.6
India 4.4 5.1 6.4 7.7 9.1 10.3 5.9
China 11.8 13.2 14.5 15.7 16.8 17.8 6.0
Other Asia 8.5 9.4 10.3 11.3 12.2 12.8 4.4
OPEC 9.1 9.8 10.7 11.5 12.0 12.4 3.3
Developing countries 43.2 47.5 52.8 58.2 63.0 67.0 23.8
Russia 3.4 3.6 3.7 3.8 3.8 3.7 0.3
Other Eurasia 1.9 2.1 2.3 2.5 2.5 2.5 0.7
Eurasia 5.3 5.7 6.0 6.2 6.3 6.2 0.9
World 95.4 100.7 104.3 107.4 109.7 111.1 15.8
Source: OPEC – World Oil Outlook 2017 Report
32

The abundance and versatility of natural gas makes it a valuable energy source to meet wide variety of needs while also helping the world shift to less carbon-intensive source of energy. Natural gas production is projected to be driven by the development of tight oil and shale gas resources. Global natural gas demand is expected to grow by about 40%, as its share of the world’s energy mix will rise from 23-26% between CY2016 and CY2040. The demand has majorly increased in Asia, Middle East, the US and China, which almost accounted for 30% of global growth. Natural gas resources are geographically and geologically diverse. Technologies, such as horizontal drilling and hydraulic fracturing, have unlocked vast unconventional resources, which have dramatically altered the natural gas supply landscape in the past decade, particularly for North America. Unconventional gas will continue to play a significant role, contributing more than half of the growth in natural gas supply to CY2040.
Liquefied Natural GasThe global LNG trade has continued to grow in CY2017 boosted by additional volumes from Australia and the US and a rise in demand for the fuel in Asia and China.
In CY2017, the world consumed 285 MMTPA of LNG. This was 25 MMTPA or 9.6% higher than a year earlier – the highest annual growth since CY2011. Imports rose in 19 of 29 LNG importing countries. In CY2018, it is expected that the demand growth rate will be 7.2%, adding 20 MMTPA, to reach a total of 305 MMTPA. China will still lead in terms of growth, despite a relatively modest rise compared to last year. South and Southeast Asia will experience their strongest annual growth in recent years, becoming another major growth engine in CY2018.
LNG exports are dominated by the US and Qatar, which will account for almost half of global LNG exports by CY2040. But material increases are also projected in Australia, as existing projects are completed, in Russia and in East and West Africa. The increasing accessibility and competitiveness of gas associated with LNG helps to develop new and expanding markets led by China, together with some smaller Asian countries, such as Pakistan and Bangladesh. Europe remains a key market.
Gas consumption by sector
600
Bcf/d
500
400
300
200
100
01990 2000 2010 2020 2030 2040
Industry Non-combusted
Power Building
Transport
Gas share by sector
50%
40%
30%
20%
10%
0%1990 2000 2010 2020 2030 2040
Transport Non-combusted
Power Industry
Building
Source: BP Energy Outlook 2040, 2018 Edition
Figure 6
Annual Report 2017-18 Financial StatementsThe Welspun Corp Story Governance Reports
33

India’s LNG imports were at the highest ever level in 2017-18. The Indian Government, to enhance the competitiveness of LNG, reduced LNG tax in 2017–2018 to 2.5% from 5%. A total of US$7.5 Billion is set to be invested for the development of LNG terminals, distribution networks and pipelines.
Shale GasShale gas, tight oil, shale oil and tight gas are unconventional types of energy which, due to technological advances of horizontal drilling in combination with a process known as hydraulic fracturing, have greatly expanded the ability for US producers to profitably extract natural gas and oil from low-permeability geological plays.
Global shale gas processing equipment market is expected to witness rapid growth over the 2018-40 period owing to increasing natural gas exploration and development initiatives. Rapidly growing energy demand has resulted in energy companies increasing their efforts to explore unconventional fuel reserves. Unconventional gas has gained center stage in the global energy market, which is mainly driven by rapid development in the US shale gas exploration and production. Other regions have tried to follow suit and have quickened their exploration & production activities. Superior properties such as low carbon emissions and higher calorific value when compared to conventional sources such as coal & petroleum, are presumed to further aid the market.
The huge extraction of shale gas has not only offset the decline in conventional gas production but also has led to a dramatic increase in total natural gas output. The notable growth of shale gas has not only radically changed the energy landscape in the US, but also in the world, and
redirecting of recent growth in liquefied natural gas (LNG) supply to Europe and Asia. The increase in shale gas production has also influenced oil prices. Since natural gas is cheap in the US due to shale gas expansion, the demand for oil could be adversely affected due to its substitution by natural gas through competition. Therefore, the price of oil could also be adversely impacted by the shale gas boom.
As expected, the largest component of natural gas production from shale resource is expected to reach 5.0 Million b/d in CY2023, nearly 35% above the CY2017 level. Natural gas production from shale gas and tight oil plays as a share of total US natural gas production is projected to continue to grow in both share and absolute volume because of the large size of the associated resources, which extend over more than 500,000 square miles.
Tight oil and shale gas production in the United States has increased dramatically, accounting for 54% of crude oil production and 55% of dry natural gas production in CY2017. With the increasing development of tight and shale resources (particularly in the Marcellus and Permian Basin plays), natural gas plant liquids production is expected to increase through 2050, reaching almost 5.6 Million b/d in 2050 compared with 3.7 Million b/d in CY2017.
The key risk lies in the regulatory obstacles that are related to environmental concerns, including water supply quality and the need for costly tailoring of fracking to the more complex nature of rock in some places. Some countries have gone so far as to ban all exploration and production of shale oil. Overall, the global diffusion of Shale oil production remains uncertain, contributing to broader uncertainty about the global oil supply outlook.
LNG increases the global availability of gas
LNG exports LNG imports
80
Bcf/d
70
60
40
50
30
20
10
01990 2000 2010 2020 2030 2040
Source: BP Energy Outlook 2040, 2018 Edition
Middle East N America Russia Africa Australia Other
80
Bcf/d
70
60
40
50
30
20
10
01990 2000 2010 2020 2030 2040
China Other Asia India OECD Asia Europe Other
Figure 7
34

Oil and Gas in IndiaIn FY2017, India had 234.5 MMTPA of refining capacity, making it the 2nd largest refiner in Asia. By March 2018, the oil refining capacity of India reached 247.6 MMTPA. India’s energy demand is expected to double to 1,516 Mtoe by CY2035 from 724 Mtoe in CY2016. Moreover, the country’s share in global primary energy consumption is projected to increase two-fold by CY2035. India’s consumption of petroleum products grew more than 5 per cent to 205.0 MMT in 2017-18 from 194.6 MMT in 2016-17.
India was the 3rd largest consumer of crude oil and petroleum products in the world,. Oil consumption has expanded at a CAGR of 2.98 per cent during FY2008-17 to reach 4.43 MBPD by CY2017. Due to the expected strong growth in demand, India’s dependency on oil imports is likely to increase further. Rapid economic growth is leading to greater outputs, which in turn is increasing the demand of oil for production and transportation. In addition, with rising income levels, demand for automobile is also estimated to rise, in turn leading to augmented demand for oil and gas.
LNG imports into the country accounted for about one-fourth of total gas demand, which is estimated to further increase by two times, over next five years. To meet this rising demand, the country plans to increase its LNG import capacity to 50 Million tonnes in the coming years. India increasingly relies on imported LNG; the country is the fourth largest LNG importer and accounts for 5.68 per cent of global imports. India imported 18.63 MMT of LNG during 2016-17, in comparison to 16.14 MMT in 2015-16. LNG imports during 2017-18 reached 18.05 MMT.
To reduce dependence on imports and improve investments in the country, the Indian government allows 100 per cent Foreign Direct Investment (FDI) in upstream and private sector refining projects. The FDI limit for public sector
refining projects has been raised to 49 per cent without any disinvestment or dilution of domestic equity in the existing Public Sector Units (PSUs). Government has also enacted various policies such as the Open Acreage Licensing Policy (OALP) and Coal Bed Methane (CBM) policy to encourage investment. In CY2017, the government also came up with National Data Repository (NDR) to make Exploration and Production (E&P) data available for commercial exploitation and R&D.
Under unconventional gas, India has technically recoverable shale gas resources of nearly 96 tcf. The Cambay, Krishna Godavari (KG), Cauvery and the Damodar Valley are the most prospective sedimentary basins for carrying out shale gas activities in the country. Around 20 tcf of gas has been classified as technically recoverable reserves in the Cambay basin in Gujarat (the largest basin in the country) spread across 20,000 gross square miles, with a prospective area of 1,940 square miles. It is estimated that the KG basin encloses a series of organically rich shales, containing around 27 tcf of technically recoverable gas. The KG basin, located in Eastern India, holds the country’s largest shale gas reserves, extending over 7,800 gross square miles with a prospective area of around 4,340 square miles.
WaterThe global demand for water has been increasing at a rate of about 1% per year as a function of population growth, economic development and changing consumption patterns, among other factors, and it will continue to grow significantly over the next two decades. The world population is expected to increase from 7.4 Billion in CY2017 to 9.2 Billion by CY2040, with two-thirds of the population living in cities. More than half of this anticipated growth is expected to occur in Africa (+1.3 Billion), with Asia (+0.75 Billion) expected to be the second largest contributor to future population growth. Contemporary global water demand has been estimated at about 4,600 km3 per year and projected to increase by 20%–30% to between 5,500 and 6,000 km3 per year by 2050.
Agriculture accounts for about 70% of global water withdrawals, the vast majority of which is being used for irrigation. Water use by industry, which account for roughly 20% of global withdrawals, is dominated by energy production, which is responsible for approximately 75%, with the remaining 25% of industrial water withdrawals being used for manufacturing. Industrial demand could increase with up to eight times (in relative terms) in regions such as Western, Middle, Eastern and Southern Africa, where industries currently account for a very small proportion of total water use. Domestic water use, which roughly accounts for the remaining 10% of global water withdrawals, is expected to increase significantly over the 2010–2050 period in nearly all regions of the world.
This overall water demand growth situation is expected to be compounded by two factors. First, the number of people living in river basins under severe water stress is projected to reach 3.9 Billion by CY2050, totaling over 40% of the world’s population. In water stressed basins, small changes in water
Oil consumption in India (2008-17) (MBPD)
2006
2007
2008
2009
2010
2011
2012
2013
2014
2015
2016
2017
P
2.74 2.
94 3.08 3.
24 3.32 3.
49 3.69 3.73 3.
85 3.92
4.33 4.43
5.00
4.50
4.00
3.50
3.00
2.50
2.00
1.50
1.00
0.50
0.00
Source: Ministry of Petroleum and Natural Gas
Figure 8
Annual Report 2017-18 Financial StatementsThe Welspun Corp Story Governance Reports
35

regimes (droughts) can have major consequences. Second, groundwater depletion, which more than doubled between CY1960 and CY2000, may become the greatest threat to agriculture and urban water supplies in several regions in the coming decades.
Global Large Diameter Pipe (LDP) MarketIn total, almost 3.6 Million km of oil and gas pipeline network is present worldwide, with the US and Russia accounting for more than two-thirds of the total. Besides, Canada, China, Ukraine, Argentina, the UK, Iran, Mexico and India take the cumulative total to around 80% of the global network by length.
In CY2017, global LDP demand was around 15.7 Million tonnes and is forecasted to remain at around this level in CY2018 before rising to 16.7 Million tonnes in CY2019. China retained its position as the number one LDP market in CY2017 and is forecast to hold this position in CY2018. The Commonwealth of Independent States (CIS) which in the 2010-2015 period was often the largest market in the world found itself as the fifth largest market in CY2017. North America surged into second place for LDP consumption in CY2017, followed by the Middle East and a booming European market. In CY2018, North America is expected to hold its position as the number two market. The CIS market is forecast to see some recovery in CY2018 returning to the third largest market; this is largely driven by the Central Asian countries as opposed to Russia.
Global Longitudinal Submerged Arc Welded (LSAW) marketThe Global LSAW line pipe market saw a recovery into CY2017, with demand rising to 8.8 Million tonnes from 7.4 Million tonnes in CY2017. This growth was primarily driven by two regions — Europe and North America. Europe saw a rapid surge in demand with LSAW consumption hitting 1.76 Million tonnes compared to just 400 KT the year before, driven by projects such as Nord Stream 2 and EUGAL. North America also saw an increase in LSAW demand to 1.67 Million tonnes compared to around 960 KT the year before as major offshore line pipe projects in Mexico helped to boost demand there. Conversely, the CIS continued to see falling LSAW line pipe demand dropping from 2.4 Million tonnes to 1.7 Million tonnes. Demand in Africa, South America and the Middle East also saw small declines. In CY2018, global LSAW demand is expected to be slightly lower than CY2017, down by around 350 KT. This will be largely driven by North America and Europe being forecast to unable to maintain their CY2017 consumption levels. Several other
regions such as China, the wider Asian market, Africa and South America are forecast to see improving fortunes into CY2018, with the Middle East seeing a positive recovery into CY2019.
Global Helical Submerged Arc Welded (HSAW) marketGlobal API HSAW consumption increased in CY2017 to 5.6 Million tonnes from 4.7 Million tonnes in CY2016. China has been one of the major drivers of this growth, seeing consumption increase from 1.7 to 2.3 Million tonnes. The other Asian markets, including India, also saw increasing demand rising from 655 KT to 890 KT.
It is forecasted that the HSAW line pipe demand will continue to slightly pick-up into CY2018, up by around 50 KT or so globally, with better growth expected in CY2019. China is expected to continue to drive a lot of the growth in CY2018, with demand here forecast to be up by around 280 KT. Other Asia is also predicted to see steady growth. Demand though is forecast to fall a little in North America and the Middle East.
LSAW HSAW ERW
China North America Middle East Europe CIS Other Asia Africa South America
Global consumption by region, KT
5K
4K
3K
2K
1K
0K
*Chart represents 2017 consumption data *Other Asia includes India, Australia and Trans-ASEAN Source: MBR
Figure 9
36

Global Electric Resistance Welded (ERW) line pipe marketGlobal ERW line pipe demand (over 16” Outside Diameter [OD]) increased slightly into CY2017 over CY2016, rising to 1.36 Million tonnes vs 1.24 Million tonnes in CY2016, with the market predicted to grow further to just under 1.5 Million
tonnes in CY2018. The North American market has been largely behind the recent growth in this segment. Demand in North America is likely to grow into CY2019 as well.
Elsewhere regions such as the CIS, China and the wider Asian market are all forecast to exhibit increasing demand for ERW line pipe through to CY2019.
Welspun CorpWelspun Corp Limited (WCL) is a one-stop service provider offering complete pipe solutions. WCL has the capability to manufacture line pipes ranging from 1½ inch to 140 inches, along with specialized coating, double jointing and bending. With current capacity of 2.425 Million MTPA spread across India (Dahej, Anjar and Mandya), the USA (Little Rock) and Kingdom of Saudi Arabia (Dammam), Welspun takes pride in being a preferred supplier to most of the Fortune 100 oil & gas companies. With 360 degree abilities, WCL has undertaken some of the most challenging projects in different parts of the world. With business excellence being a clear focus, the Company is on the path of innovation and technology edge supported by its state-of-the-art facilities and global scale operations.
FY18 Performance HighlightsHistoric high order book
The Company ended the FY2018 with a historic high order book position of 1,657 KMT (` 109 Billion). This has been made possible by the Company’s global manufacturing base and reach across major key markets. The all-time high order book sets a strong foundation for robust production and sales volumes in FY2019.
Details of order book:
ERW HSAW LSAW
Source: MBR
Total LDP Consumption by product across years
Product-wise distribution %
Region-wise distribution %
2010 2011 2012 2013 2014 2015 2016 2017 2018P 2019P
20K
15K
10K
5K
0K
Figure 10
Figure 11
HSAW 82ERW 11LSAW 7
MENA 59Asia PAC 22Americas 19
Annual Report 2017-18 Financial StatementsThe Welspun Corp Story Governance Reports
37
High Cost Debt Reduction and Improved Financial Ratios
During the year, WCL reduced its Gross Debt from ` 18,430 Million as on 31 March 2017 to ` 13,864 Million as on 31 March 2018 mainly on account of prepayment of its high cost Non-Convertible Debentures aggregating to ` 7,038 Million by exercising its call option. During the year, the Company raised new Non-Convertible Debentures of ` 2,500 Million carrying a coupon rate of 8.90% per annum repayable in 6 years and having an average maturity of 5.75 years.
WCL’s cash and cash equivalents increased to ` 9,649 Million as on 31 March 2018 from ` 7,365 Million as at the end of previous year. This is also attributed by increase in the EBIDTA of 11% y-o-y basis to ` 8,147 Million and Cash PAT levels improving by 7% year on year basis to ` 5,244 Million. This has enabled WCL to reduce the Net Debt by more than half to ` 4,216 Million as at 31 March 2018 vis-à-vis ` 11,065 Million in the previous year.
As a result of the above measures WCL has reduced its finance cost for the year and strengthened the balance sheet position. The profit and loss ratios and balance sheet ratios have significantly improved over the previous year with the Net Debt to Equity levels at 0.15 times and the Net Debt to EBIDTA (Leverage ratio) levels at 0.52 times. This has also enabled WCL to be geared up to meet its requirement for executing order book of 1.66 million MT.
Concrete Weight Coating (CWC) plant gaining approvals
The recently commissioned CWC plant is gaining approvals from various clients. During the year, the plant was successfully audited by several international oil & gas majors.
Awards
WCL won several awards during the financial year 2018:
• 2nd Annual EKDKN EXCEED award 2018 – OHS category in engineering sector for the best energy practices for Anjar plant
• Sir M. Visvesvaraya Manufacturing Excellence Award- 2017 for Mandya plant
• 11th QCI-DL Shah Quality Award - Platinum : Awarded at 12th national quality conclave for Anjar plant for the project “Case Study on Weld-ability test”
• Salute to Greatness Award 2017 : Awarded by The Martin Luther King Jr Commission of Little Rock, AR
Welspun Corp Differentiators:Multi location line pipe manufacturing facilities complemented with coating capability
The Company’s multi-locational line pipe capacity stands at 2.425 Million MTPA (as tabulated below). The Company has coating facilities in all three countries besides the Plate and Coil mill capacity in India. The details are given in the table below:
Table 2 (000 tonnes)
Particulars India Saudi Arabia US Total
CapacityAnjar Dahej Mandya Dammam Little Rock
LSAW 350 350 - - - 700HSAW 500 50 150 300 350 1,350
ERW/HFIW 200 - - - 175 375Current Lane Pipe Capacity 1,050 400 150 300 525 2,425Plate & Coil 1,500 - - - - 1,500
R&D Focus and Pipeline Technology
Technical Know-how
• Experience of delivering pipe with stringent specifications gives an edge for prestigious and challenging projects
Dedicated R&D facility
• Fully equipped growth machine shop facilities to facilitate capability enhancement, capacity expansion, de-bottlenecking, automation and product development programs
Continuous research
• Continuous research in steel, strain-based and deep sea pipelines; welding technology and consumables, and quality integrated management systems
Technical expert team
• Technical experts, who belong to various international technical committees for oil and gas pipeline research, contribute to the development of new standards for line pipe durability
Advanced Technological Prowess
• Efficient robotic systems
• Highly automated plant process line
• Integrated pipe traceability system
• Precision dimensional control
• Laser-based automatic pipe dimension measurement system
• Heavy press for heavy thickness and low Diameter / Thickness pipes
• Triple random length (for LSAW, HSAW and ERW/HFW in triple random length)
38

Continuous Improvement in Operations and Service Offerings
Pipe ID machining
• Exclusive facility to carry out internal boring up to 6 inch at both ends of pipe (Dia – 48 inch, 28.6 mm thick, Grade – X70M)
Automatic pipe dimension measurement system
• 100% automatic laser-based, non-contact-type, precise pipe dimension measurement system at LSAW – Anjar plant, integrated with climate-controlled automatic calibration system
Automatic pipe traceability system
• Ensure end-to-end traceability right from raw material to finished goods at the Little Rock facility
Integration of machines with SAP for direct data transfer
• Critical machines at LSAW – Anjar and Spiral – Dammam plants are integrated with SAP to automatically transfer important process parameters without any human intervention
Automatic pipe hot induction bend facility
• Upgraded with automatic parameter control, heating and quenching, and dynamic stabilizer to have pipe bends with uniform properties throughout the length & thickness
Online auto tack repair system
• Avoids manual repair work and saves time & resources
Automated tab joining and robotic bead milling
• Developed for consistent and sustainable quality; avoids human error and fatigue during operations
Concrete weight coating
• Welspun Wasco Coatings Private Limited (JV – Welspun and Wasco) set up concrete weight coating facility with capability of concrete thickness up to 150 mm and 18 m long pipe with higher shear strength (>0.4 Mpa)
Focus on Technology
Welspun has undertaken complete integration of IT across plants with 24 x 7 Access. Some of the applications which have been implemented are Success Factors for HR, Ariba for procurement, C4C for marketing, Concur for travel and BIBO for management data, all of them integrated into SAP HANA. This has resulted into significant improvement in terms of seamless process and increased transparency in the operations.
One Welspun
Success Factors for
HR
Ariba for Procurement
Concur for Travel
BIBO for Management
Data
C4C for Marketing
Opportunities for WCLThis section describes the potential opportunities for the Company to grow the business and create shareholder value.
North America
North America remains a key market for pipeline construction and line pipe demand, despite the vast network of existing oil and gas pipeline capacity. Indeed, the total North American pipeline length (large diameter + small diameter) is about 5M km with the majority of it comprising natural gas lines. In the US, of the 4.2M km of pipelines, nearly 3.9M km serves natural gas production and demand, while the rest transports crude oil and liquids. Canada’s pipeline system is comprised of 825k km of transmission, feeder, gathering and distribution lines. Meanwhile, Mexico’s is serviced by more than 10k km of pipeline as the country undergoes a major natural gas infrastructure addition.
Annual Report 2017-18 Financial StatementsThe Welspun Corp Story Governance Reports
39
One Welspun

Jan’14 Jan’15 Jan’16 Jan’17 Jan’18
1750
1500
1250
1000
750
500
250
0
Rig Count
Brent Crude Oil Prices (USD/bbl.)
Source: Investing.in
Source: Industry Reports
There is significant increase in US rig count from mid-2016 which is an indicator of increased exploration activity. This also augurs well for the industry as the higher exploration will eventually translate to an increase in pipeline demand. (refer fig 13)
The rise in the crude oil prices has improved the outlook for the pipeline market as higher prices are expected to drive investment into the sector. This will help existing local pipe manufacturers due to the barriers to entry into the market in the form of approvals and accreditations required from all the major Oil and Gas companies to supply products as well as regulatory restrictions on import of steel products. The policy regarding “Melt in US” and Anti-dumping duty against some exporting countries can provide opportunities for players like Welspun with local manufacturing facilities in the US.
Middle East
The Middle East is a major market in the world for large-diameter line pipe activity. The region has the world’s largest concentration of energy resources. Current estimates suggest that in the Gulf Cooperation Council (GCC) alone, the existing oil and gas pipeline network is some 21,000 km in length. Outside of the GCC, Iran has an extensive gas network, one of the largest in the world. The country has some 30,000km of high-pressure gas pipelines. As the region continues to look to diversify its economies away from oil, there are ongoing plans to invest Billions of dollars in new pipelines and associated infrastructure to allow gas to be distributed to new industrial regions and also allow for increased exports of oil and gas to markets such as Europe and Asia.
US increasing its oil & gas production graduallyNet Export / (Import) of Natural Gas by US (TCF)
2010 2020E 2030E
6
4
2
0
(2)
(4)
3.5
5.5
2.6
Source: Eikon Reuters
In each of these countries, changes in economic development as well as in energy production have resulted in demand being higher than the capacity of current infrastructure. There are bottlenecks in the transportation of oil and gas from the producing regions to the consuming areas or for export. Distribution hubs are short on storage capacity as well. In the US, more than half of the existing pipelines were built before 1970. The potential replacement market is huge with more than 10,000 km of pipelines estimated to be candidates for replacement in the near future.
With discovery of Shale gas, US is now a net exporter of gas (refer fig. 12) and is developing seven LNG terminals to scale Shale export. There will be a significant surge in pipeline demand, which will connect the producing fields to LNG export terminals. The ticket size can be estimated with the fact that average distance for connectivity with these terminals could c. 1,000 km/line.
Figure 12
Figure 13
Figure 14
140
120
100
80
60
40
20
0
Apr
-13
Dec
-13
Aug
-14
Aug
-13
Apr
-14
Dec
-14
Apr
-15
Aug
-15
Dec
-15
Apr
-16
Aug
-16
Dec
-16
Apr
-17
Aug
-17
Dec
-17
Apr
-18
40
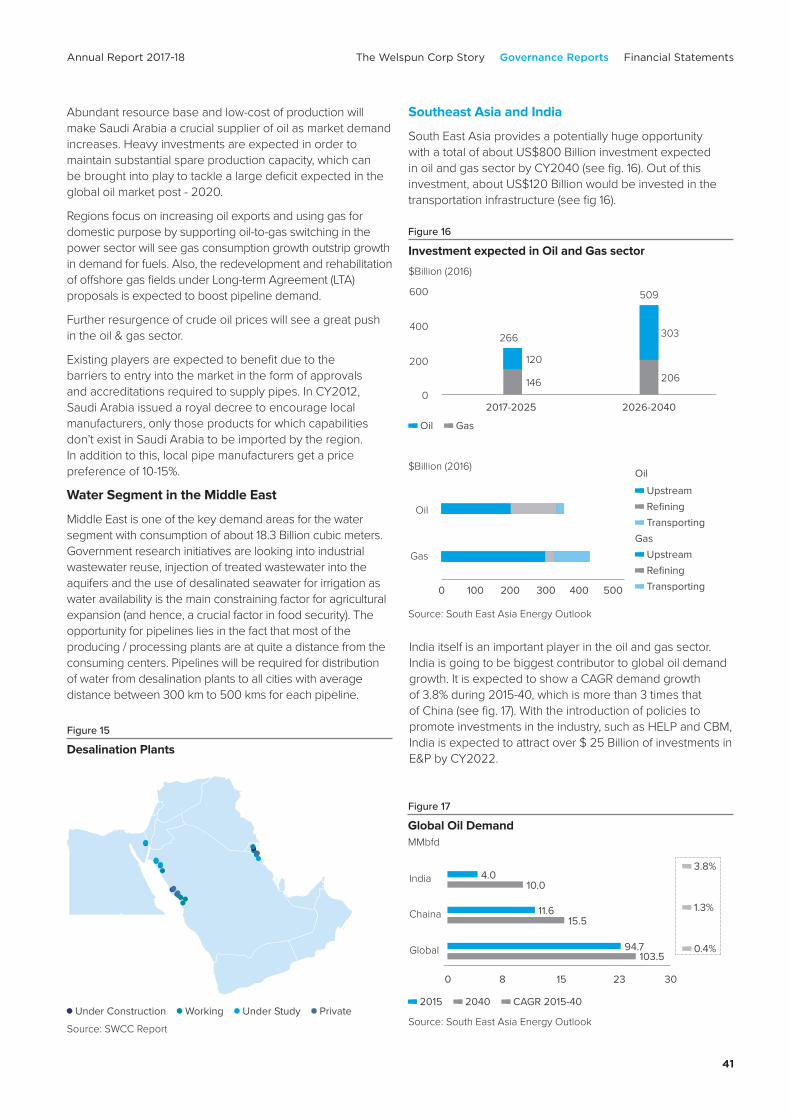
Abundant resource base and low-cost of production will make Saudi Arabia a crucial supplier of oil as market demand increases. Heavy investments are expected in order to maintain substantial spare production capacity, which can be brought into play to tackle a large deficit expected in the global oil market post - 2020.
Regions focus on increasing oil exports and using gas for domestic purpose by supporting oil-to-gas switching in the power sector will see gas consumption growth outstrip growth in demand for fuels. Also, the redevelopment and rehabilitation of offshore gas fields under Long-term Agreement (LTA) proposals is expected to boost pipeline demand.
Further resurgence of crude oil prices will see a great push in the oil & gas sector.
Existing players are expected to benefit due to the barriers to entry into the market in the form of approvals and accreditations required to supply pipes. In CY2012, Saudi Arabia issued a royal decree to encourage local manufacturers, only those products for which capabilities don’t exist in Saudi Arabia to be imported by the region. In addition to this, local pipe manufacturers get a price preference of 10-15%.
Water Segment in the Middle East
Middle East is one of the key demand areas for the water segment with consumption of about 18.3 Billion cubic meters. Government research initiatives are looking into industrial wastewater reuse, injection of treated wastewater into the aquifers and the use of desalinated seawater for irrigation as water availability is the main constraining factor for agricultural expansion (and hence, a crucial factor in food security). The opportunity for pipelines lies in the fact that most of the producing / processing plants are at quite a distance from the consuming centers. Pipelines will be required for distribution of water from desalination plants to all cities with average distance between 300 km to 500 kms for each pipeline.
Southeast Asia and India
South East Asia provides a potentially huge opportunity with a total of about US$800 Billion investment expected in oil and gas sector by CY2040 (see fig. 16). Out of this investment, about US$120 Billion would be invested in the transportation infrastructure (see fig 16).
India itself is an important player in the oil and gas sector. India is going to be biggest contributor to global oil demand growth. It is expected to show a CAGR demand growth of 3.8% during 2015-40, which is more than 3 times that of China (see fig. 17). With the introduction of policies to promote investments in the industry, such as HELP and CBM, India is expected to attract over $ 25 Billion of investments in E&P by CY2022.
$Billion (2016)
0 100 200 300 400 500
Oil
Upstream Refining Transporting
Gas Upstream Refining Transporting
Oil
Gas
Source: South East Asia Energy Outlook
Source: South East Asia Energy Outlook
4.010.0
11.615.5
94.7103.5
2015 2040 CAGR 2015-40
3.8%
1.3%
0.4%
Global Oil DemandMMbfd
0 8 15 23 30
India
Chaina
Global
Desalination Plants
Source: SWCC Report
Under Construction Working Under Study Private
Figure 15
Investment expected in Oil and Gas sector
$Billion (2016)
2026-20402017-2025
509
266
0
200
400
600
Oil Gas
303
120
206146
Figure 16
Figure 17
Annual Report 2017-18 Financial StatementsThe Welspun Corp Story Governance Reports
41

In the current situation, oil pipelines in India are mostly delivering oil from ports as well as from producing areas (particularly from Gujarat) to major oil refineries in Gujarat, Uttar Pradesh and Haryana. There are 12 major crude oil ports and 16 ports handling finished products, mostly on the northwest coast. On the eastern part of the country, pipelines run from West Bengal to the Paradip oil refinery. There is a large network of oil pipelines in the west of India around the Gujarat region going north towards Delhi.
With the rise in the demand for natural gas and supporting infrastructure, the requirement for pipelines is expected to boast in coming future. Currently, the country has more than 16,000 kms of existing natural gas pipeline network with city gas distribution network, connectivity across 14 states/Union Territories (UT) covering more than 150 cities. This is expected to increase with the commissioning of new terminals.
Policies such as anti-dumping duty, Safeguard duty (8-10% on plates and coils) and mandatory local content requirement policy by Ministry of Petroleum and Natural Gas (domestic value addition should be atleast 20% of the cost and 10% purchase price preference for local manufacturers by MoPNG for pipes) will help existing domestic players like Welspun get maximum share out of the future potential of the sector.
Source: Petroleum Planning & Analysis Cell
Under Construction Planned Pipelines
Existing Terminals Advanced Terminals Proposed Terminals
Mundra
DahejJafrabad
Hazira
DhabholJaigarh
Mangalore
Kochi
Karaikal
Ennore
Kakinada
Gangavaram
Dharma Off-shore Digha
Figure 18
Oil and Gas pipeline Network in India
42

Water Segment in IndiaGiven the depleting availability of fresh water and lack of efficient infrastructure, Indian Government is coming up with overall improvement plans for the sector. One of them is inter-linking of major rivers which are expected to provide huge demand for pipes. The National River Linking Project
is one of the major initiatives to address water shortage. It proposes to build 30 river links and more than 3,000 storages across the country. Total project cost is estimated at about US $150 Billion. The Government is expected to start work on three segments of the project shortly and has all the necessary approvals in place. The estimated cost of these three segments is about US $5 Billion.
Also, some states like Gujarat etc. have already adopted irrigation models using pipes. There are other states such as Madhya Pradesh, Tamil Nadu and Rajasthan which provide significant potential demand on the water pipe business.
Risks and ConcernsThe Company’s key risks are:
Economic risks
The macroeconomic outlook was challenging in India as well as in other key markets where the Company operates. Economic slowdown could affect the Company’s order book position, affecting capacity utilisation, sales and profitability. The Economic turnaround globally has strengthened the Company’s position and reach enabling a strong order book. With increasing global trade protectionism has resulted as an advantage to the Company having operating manufacturing units present in the key markets of Kingdom of Saudi Arabia, USA and India. This has enabled improved domestic capacity
utilization for each of its locations. The economic recovery is expected to become more broad- based in FY19 with both the consumption and investment providing support to economic growth. The Company has commenced the year with record highest order book position enabling it to withstand this risk based on its historical performance.
Interest rate risk
Interest expenses are part of the finance costs. Therefore, any major upward fluctuation in interest rates leads to an increase in the cost of debt for the Company. The interest rate risks are mitigated to an extent through fixed interest rates on its rupee borrowings. The Company over the last year has reduced its high cost debt and availed long term borrowings on fixed interest rate.
Legal risks related to tax structure
The Company is liable to pay tax on profits, GST, sales tax, excise duty, service tax, custom duty and other applicable
Figure 19
Source: Industry Research, Ministry of Water Resources
Proposed River Linkages
Annual Report 2017-18 Financial StatementsThe Welspun Corp Story Governance Reports
43

T
taxes. Any changes in tax legislation could lead to an increase in tax payments and, as a result, to a lowering of financial results.
Steel prices
The Company face risk on steel pricing (the basic raw material for us), which it considers in bidding for any project or tender; and more so as the business is a long gestation one with minimum time taken from bid submission to award, varying from four to six months to even a year or two. The Company tries to mitigate this risk by way of arranging back-to-back pre-tender tie-ups with its selected group of pre-approved steel mills (directly or through their nominated trading channel) at the time of bidding for a project or tender – on Price as well as quantity allocation, with the tacit understanding that in case the Company happens to be the successful bidder, the Company will immediately confirm its order of steel. The Company undertakes channel sales where it is exposed to steel price fluctuations, however, the contribution of such business to overall revenue is not significant. The increase or decrease in the steel prices has direct relation to the increase or decrease in pipe pricing.
Volatile crude oil and gas prices
Volatility in crude oil and very low gas prices create uncertainty for oil and gas producers, regarding the viability of new exploration. This, in turn, could create an uncertain future demand for line pipes in the oil and gas segment. With the increase in oil and gas prices in the recent months the demand for line pipes has improved both domestically and internationally. Favourable government policies, stable
SWOT
demand and increase in prices have enable the Company to achieve the highest order book.
Competition
Increased competition in all segments from other players may have an impact on business and profitability. While the potential demand for new oil and gas pipelines remains high in most of the Company’s markets, there have been considerable delays in decisions in many projects owing to policy uncertainty and environmental concerns, among others. This had led to fewer than expected projects coming to the market last year and leading to high level of competition. With the change in Government in the USA, thrust in the infrastructure and focus on the oil & gas and water requirements in Americas, Middle East, Europe and Asia has enabled increase in demand for large diameter pipes.
Currency risks
The Company’s foreign currency exposures are largely denominated in US dollars, Saudi Riyal, or Euro. Volatility in the rupee exchange rate against major currencies will have an adverse impact. Although the Company has implemented a well-defined hedging policy, foreign exchange fluctuations could affect reported results.
Quality risks
The Company is required to produce high-quality products in line with the stringent requirements of clients. Despite best efforts, even a small deviation and resultant rejection of some products may have a larger impact as the cost of raw materials and other overheads may impose an additional cost.
Threats
• Volatility in global energy market and commodity prices
• Tariff /non-tariff barriers favouring local players
• Delays in large projects
S W
0
Strengths• Global reach, strong brand equity, clientele
+global supply chain base• Technical capability (includes deep water and
sour service capability) and strong execution track record
• Strong balance sheet • Diversified product portfolio (includes CWC)• Experienced management team
Weakness• Low capacity utilisation• Relatively low fixed asset turnover/Return on
Capital Employed (ROCE) / Return on Equity (ROE)
Opportunities• New products/applications (includes CWC)• New geographies/clients• Increasing complexity of pipeline
specifications• India - water and oil & gas • Plate and coil mill (expanding capabilities)
44

Human Resource (HR)WCL’s Human Resource Strategy continues to evolve around the Group philosophy of Welspun 2.0. The Company strives to further reinforce the core values of Customer Centricity, Collaboration, Technology and Inclusive Growth.
At WCL, people practices and processes aim to deliver both Strategic and Operational Excellence to the Company by building organizational capability. Mechanisms have been put in place to leverage in-house expertise and people capabilities to create and execute the business strategy.
During the year under report, WCL has made significant progress in enhancing its HR delivery by adopting the latest best practices for people development and technology oriented HR.
Stabilization of Success Factors (SF), one of the best-in-class Human Resource Management Systems, is one of the highlights.
More than 65% employees have over 5 years of experience
<1 year 1-5 years 5-10 years
10-15 years
>15 years
1,400
1,050
700
350
0
425
787
1,253
746
308
Permanent Contracted
Employee count evolution
FY14 FY15 FY16 FY17 FY18
6,000
5,000
4,000
3,000
2,000
4,7194,7004,9185,373
4,871
7801,103
4,091 4,270
903
4,015
1,200
3,806
894
3,519
Operating Model of HR
Acquire
DevelopBest
Experience Story
HR Strategic
Intent
Engage
To ensure personnel development right from the time of hiring, a comprehensive onboarding program has been set up that provides new employees a preview of group operations, its systems, policies and procedures.
For a systematized approach to talent identification and development, competencies are mapped to each individual in SF and the learning and development programs will be selected based on the need identification that emerges from the competency gap analysis in the system.
Performance through People is one of the examples of a development program for first-time managers, aimed at developing a talent pipeline.
Amidst evolving social, economic and political challenges, WCL continues to remain focused on building an agile organization that delivers on business strategy and provides an enriching employee experience.
Figure 20
Figure 21
Annual Report 2017-18 Financial StatementsThe Welspun Corp Story Governance Reports
45

Internal Control and AdequacyManagement of the Company ensures that the internal control system is adequate and commensurate with the size and scale of the Company’s operations and designed to provide reasonable assurance that assets are safeguarded and transactions are rightly executed and recorded in accordance with management authorization and accounting policies. The existing policies are subject to periodic reviews to align with the changing business needs, improve governance and enhance compliance with evolving regulation.
All the records are adequately maintained for preparation of financial statements and other financial information. Apart from internal controls, the Company also audits the efficiency and security of its operations, its information technologies and data in accordance with the global standards. The Audit Committee of the Company met thirteen times during this year to review, among others, the internal audit reports as well as the internal control systems and financial disclosures.
Discussion of Financial AnalysisThis discussion on financial analysis is for consolidated financials of the Company during 2017-18. The Company, together with its subsidiaries, is engaged in the business of production and coating of HSAW pipes and Hot-rolled (HR) steel plates and coils. The FY2017 numbers are shown on comparable basis for all statement of Profit and Loss and Balance Sheet items discussed below.
The highlights of the financial year were:
• High production and sales volumes in India facility which significantly improved financial performance.
• Plate and coil mill production more than doubled.
• FY2018 revenue was at ` 75,873 Million.
Production and sales in KMT – Pipes (including Saudi)
• Pipe production volume for FY2018 (including Saudi) stood at 1,020 K tones, up 7% YoY. Ex-Saudi production volume was 952 K tones, up 11% YoY
• Pipe Sales volume (including Saudi) for FY2018 stood at 1084 K tones up 16% YoY. Ex-Saudi sales volume was 987 K tones, up 19% YoY
• The capacity utilization was over 42% against 39% in FY2017 (including Saudi). The installed capacity of pipes is 2.425 Million MTPA (including Saudi), making the Company one of the largest line pipe companies in the world
Consolidated Revenues Revenue in ` million
Total sales stood at ` 75,873 Million in FY2018 as compared to ` 60,355 Million in FY2017, an increase of 26%, primarily on account of higher volume.
Volumes
Break-up of various cost items as a percentage of sales (consolidated)
Particulars FY2017-18 FY2016-17
` (Million) (%) ` (Million) (%)
Sales 75,873 100.00% 60,355 100.00%
Cost of goods sold 52,878 69.69% 40,402 66.94%
Employee benefit expenses 4,296 5.66% 4,305 7.13%
Manufacturing & Other Expenses
- Store & spares consumed 2,715 3.58% 2,064 3.42%
- Coating & other job charges 178 0.23% 201 0.33%
- Power , fuel & water charges 1,438 1.90% 1,063 1.76%
- Freight material handling charges 4,788 6.31% 3,902 6.47%
- Other expenses 2,745 3.62% 3,293 5.46%
Total Manufacturing & Other Expenses 11,864 15.64% 10,523 17.44%
Total Expenses 69,038 90.99% 55,230 91.51%
1,400
1,200
1,000
800
600
400
200
0
Pipe Production Pipe Sales
FY11
958
908
FY12
819
834
FY13
1,010
1,018
FY14
1,022
1,019
FY15
1,130 1,152
FY16
1,119
1,100
FY17
954
935
FY18
1,020
1,084
Figure 22
46

Particulars FY2017-18 FY2016-17
` (Million) (%) ` (Million) (%)
Other income 1,312 1.73% 2,246 3.72%
EBITDA 8,147 10.74% 7,370 12.21%
Finance costs 1,853 2.44% 2,357 3.91%
Depreciation 3,793 5.00% 3,861 6.40%
Profit before Tax (PBT) 2,501 3.30% 1,152 1.91%
Tax expenses 112 0.15% 258 0.43%
Net loss of joint venture 859 1.13% 793 1.31%
Non-controling interest (NCI) (53) -0.07% (163) -0.27%
Net Profit after NCI 1,583 2.09% 264 0.44%
a. Cost of goods sold
Cost of goods sold increased by 31% to ` 52,878 Million in FY2018 mainly due to higher sales volume. Cost of material consumed as a percentage to net sales has increased from 66.94% in FY2017 to 69.69% in FY2018, mainly due to the increase in the steel price.
b. Manufacturing and other expenses
Manufacturing and other expenses increased by 12.74% which stood at ` 11,864 Million in FY2018. The increase is mainly on account of higher production volume during the year.
c. Employee benefit expenses was flat at ` 4,296 Million in FY2018.
2. Table: Balance Sheet (Consolidated)(` Million)
Particulars As at March 31,
2018 (Audited)
As at March 31,
2017 (Audited)
ASSETS
Non-current assets
Property, plant and equipment 30,326.13 33,481.28
Capital work-in-progress 144.36 249.71
Investment property 8.19 1.23
Goodwill on consolidation 4.68 4.68
Other intangible assets 118.97 71.75
Intangible assets under development 21.32 72.61
Investments accounted for using the equity method 1,144.11 1,836.38
Financial assets
Investments 365.33 347.72
Loans 2,238.09 2,095.23
Other financial assets 149.47 320.51
Deferred tax assets (net) 4.00 -
Other non-current assets 1,184.60 1,028.33
Total non-current assets 35,709.25 39,509.43
d. Finance costs
Finance costs decreased by 21.38% to ` 1,853 Million in FY2018 due to reduction of long term borrowings it mainly includes Non-convertible Debentures.
e. Depreciation/amortisation charge
Depreciation/amortisation charges were flat at `3,793 Million in FY2018.
f. EBITDA
EBITDA for FY2018 is ` 8,147 Million, as compared to ` 7,370 Million for FY2017 an increase of 11% mainly due to higher volume.
g. PAT
Net Profit after NCI was at ` 1,583 Million in FY2018 as compared to ` 264 Million in FY2017.
Annual Report 2017-18 Financial StatementsThe Welspun Corp Story Governance Reports
47

(` Million)
Particulars As at March 31,
2018 (Audited)
As at March 31,
2017 (Audited)
Current assets
Inventories 15,118.57 17,646.59
Financial assets
Investments 3,366.75 5,068.65
Trade receivables 13,198.61 14,651.93
Cash and cash equivalents 5,526.29 1,479.53
Bank balances other than cash and cash equivalents 755.64 816.62
Loans 5.89 6.63
Other financial assets 590.23 573.81
Current tax assets (net) 204.95 1.43
Other current assets 2,450.99 2,708.71
Assets classified as held for sale 6.00 6.00
Total current assets 41,223.92 42,959.90
Total assets 76,933.17 82,469.33
EQUITY AND LIABILITIES
Equity
Equity share capital 1,326.13 1,326.13
Other equity
Reserves and surplus 27,094.80 26,517.62
Other reserves 119.38 250.62
Equity attributable to owners of Welspun Corp Limited 28,540.31 28,094.37
Non-controlling interests 566.12 1,135.39
Total equity 29,106.43 29,229.76
Liabilities
Non-current liabilities
Financial liabilities
Borrowings 12,717.29 15,214.53
Other financial liabilities 1.49 -
Provisions 392.91 350.92
Deferred tax liabilities (net) 3,437.48 3,805.10
Government grants 3,649.58 3,653.64
Other non-current liabilities - -
Total non-current liabilities 20,198.75 23,024.19
Current liabilities
Financial liabilities
Borrowings 125.67 2,203.27
Trade payables 21,340.16 21,931.02
Other financial liabilities 2,436.68 2,485.73
Provisions 195.12 172.87
Government grants 463.35 414.66
Current tax liabilities (net) 1,798.73 803.90
Other current liabilities 1,268.28 2,203.93
Total current liabilities 27,627.99 30,215.38
Total liabilities 47,826.74 53,239.57
Total equity and liabilities 76,933.17 82,469.33
48

3. Surplus funds
Temporary surplus funds are invested in short term securities such as mutual funds and government securities. Nevertheless, in order to achieve higher growth and value creation for the stakeholders, the Company aims to retire high cost debt to improve overall profitability and strengthen the balance sheet.
4. Net worth
Networth at the end of FY2018 was flat at ` 28,540 Million vs. ` 28,094 Million at the end of FY2017.
The details of net worth comprise:
a. Share capital
The number of shares is 265,226,109 (face value of ` 5 each) as at March 31, 2018, same as in the previous financial year.
b. Reserves and surplus
i) Capital Reserve on Consolidation: The balance as of March 31, 2018 amounted to ` 153 Million which is the same as in the previous financial year.
ii) Securities Premium Account: Securities premium account stands at ` 7,770 Million, which is the same as in the previous financial year.
iii) Debenture Redemption Reserve: Debenture redemption reserve stands at ` 506 Million at the end of FY2018 versus ` 1,643 Million at the end of the previous financial year.
iv) The Balance in General Reserve: The balance in general reserve as on March 31, 2018 stands at ` 354 Million as compared to ` 228 Million in the previous financial year.
v) Profit and Loss Account: The balance retained in the profit and loss account as on March 31, 2018 has increased by ` 1,528 Million to ` 18,348 Million.
vi) Hedging Reserve Account: The hedging reserve account stands at ` 11 Million as at March 31, 2018 versus ` 135 Million in the previous financial year.
5. Loan funds
The gross debt at the end of FY2018 stands at ` 13,864 Million down by ` 4,566 Million over the previous year. The components included in Gross Debt are long- term borrowings of ` 12,717 Million, current portion of long-term borrowings of ` 1,021 Million and short-term borrowings of ` 126 Million at the end of FY2018.
Major movements during the year are:
i. The overall long-term borrowings and current portion of long-term debt has gone down by ` 2,488 Million, primarily due to pre-repayment of NCDs and repayment of External Commercial Borrowings (ECBs).
ii. The short term borrowings have decreased by ` 2,078 Million mainly due to decrease in working capital loans.
Cash and bank balances and liquid/current investments for FY2018 have increased by ` 2,284 Million to `9,649 Million.
Net debt decreased by ` 6,849 Million and stands at ` 4,216 Million as of March 31, 2018 after accounting for cash and bank balances and liquid investments.
Net debt to net worth ratio is at 0.15x (versus 0.39x last year) indicating a strong Balance Sheet.
6. Property, plant and equipment (including CWIP and intangibles)
Net block of fixed assets (including CWIP) decreased by ` 3,265 Million to ` 30,610 Million in FY2018 due to depreciation impact.
7. Inventory
The overall inventory decreased by ̀ 2,528 Million to ` 15,119 Million mostly due to decrease in raw materials by ` 2,272 Million and increase in finished goods by ̀ 98 Million. Stores and spares decreased by ̀ 19 Million and Work in progress was reduced by ̀ 335 Million.
On account of the above, the inventory turnover days have decreased from 107 days of net sales in FY2017 to 73 days of net sales in FY2018.
8. Trade receivables
Trade receivables decreased by ` 1,453 Million to ` 13,199 Million in FY2018. Sundry debtors are at 63 days (89 days in FY2017) of sales during the year.
9. Loans
Total loans (current and non-current) increased by ` 142 Million to ` 2,244 Million mainly due to loans given to JVs.
10. Other financial assets
Total financial assets (current and non-current) decreased by ` 155 Million to ` 740 Million.
11. Other current assets
Other current assets decreased by ` 258 Million to ` 2,451 Million in FY2018. The change was largely due to ` 444 Million decreases in balance with statutory authorities and ` 103 Million decrease in export benefit receivables.
Annual Report 2017-18 Financial StatementsThe Welspun Corp Story Governance Reports
49

12. Trade payables
Trade payables have reduced by ` 591 Million to ` 21,340 Million in FY2018 from ` 21,931 Million in FY2017, primarily on account of ` 3,895 Million decreases in acceptances which were partially offset by ` 3,690 increase in other payables.
Trade payables are at 103 days (133 days in FY2017) of sales.
13. Cash conversion cycle
Cash conversion cycle for the current year decreased to 34 days compared to 63 days for FY2017.
14. Liquidity
We broadly define liquidity as our ability to generate sufficient funds from both internal and external sources to meet our obligations and commitments. Our primary liquidity requirements have been to finance our working capital requirements for our operations and for capital expenditures and investments. We have financed our capital requirements primarily through funds generated from our operations, equity/equity-related issuance and borrowings.
15. Cash flows
The table below summarizes our cash flow for the periods indicated:
Particulars March 31, 2018
Net cash generated from operating activities 9,813
Net cash generated from investing activities 1,823
Net cash used in financing activities (7,609)
Net change in cash and bank balances 4,028
50

Governance Reports
27

52
To,The Members,Welspun Corp Limited
Your directors have pleasure in presenting the 23rd Annual Report of your Company along with the Audited Financial Statement for the financial year ended March 31, 2018.
1. Financial Results (` in million)
Particulars Standalone Consolidated
For the year ended For the year ended
31.03.2018 31.03.2017 31.03.2018 31.03.2017
Total income 53,901.15 46,956.24 77,185.34 62,600.65
Profit before finance cost, depreciation & tax 5,791.38 7,153.37 8,147.45 7,370.14
Less : Finance costs 1,457.56 2,073.04 1,853.28 2,357.14
Profit before depreciation & tax 4,333.82 5,080.33 6,294.17 5,013.00
Less: Depreciation/Amortization 2,375.30 2,442.45 3,793.05 3,860.80
Add: Share of net loss of joint ventures accounted for using the equity method
- - (859.14) (793.01)
Profit/(loss) before tax 1,958.52 2,637.88 1,641.98 359.19
Less : Provision for tax
Current Tax 1,063.00 418.10 1,050.14 472.21
Deferred Tax (362.66) 473.77 (938.25) (214.17)
Profit/(Loss) after taxes before Non-controlling interests 1,258.18 1,746.01 1,530.09 101.15
Less :Non-controlling interests - - (52.94) (163.10)
Profit/(loss) after tax for the year (after Non-controlling interests)
1,258.18 1,746.01 1,583.03 264.25
Add : balance brought forward from previous year 7,127.14 6,237.88 16,820.00 17,413.04
Re-measurements of post-employment benefit (net of tax) (10.95) (21.81) (10.96) (22.35)
Dividend on equity shares (132.61) (132.61) (132.61) (132.61)
Tax on dividend (27.00) (27.00) (27.00) (27.00)
Premium on redemption of NCI’s share - - (895.65) -
Transfer to Debenture Redemption Reserve 1,137.26 (500.73) 1,137.26 (500.73)
Transfer to General reserve (125.90) (174.60) (125.90) (174.60)
Balance carried forward to the next year 9,226.12 7,127.14 18,348.17 16,820.00
2. Performance Highlights Production highlights for the year under Report are as under:
(in MT)
Product Standalone Consolidated
FY 2017-18 FY 2016-17 FY 2017-18 FY 2016-17
Pipes 737,711 682,090 951,516 854,157
H. R. Plates & Coils 468,682 232,608 468,682 232,608
Directors’ Report
3. Reserves, Dividend & Dividend Policy. The Board is pleased to recommend a dividend
@ 10% for the year ended March 31, 2018 i.e. `. 0.50 per equity share of ` 5/- each fully paid-up out of the net profits. In respect of the dividend declared for the previous financial years, ` 0.296 million remained unclaimed as on March 31, 2018.
The Board proposes to transfer ` 125.90 million to General Reserves and ̀ 1,137.26 million from Debenture Redemption Reserve to Retained earnings.
In terms of the Regulation 43A of the SEBI (Listing Obligations and Disclosure Requirements) Regulations, 2015, the Board of Directors approved

Annual Report 2017-18 Financial StatementsThe Welspun Corp Story Governance Reports
53
and adopted Dividend Distribution Policy of the Company setting out the parameters and circumstances that will be taken into account by the Board in determining the distribution of dividend to the shareholders and/ or retaining the profits earned by the Company. The Policy is annexed to this Report as Annexure – 1 and is also available on your Company’s website at:
http://www.welspuncorp.com/system/downloads/attachments/000/000/338/original/Dividend_Distribution_Policy_08.05.2017.pdf?1494308856
4. Internal Controls Your Company has adequate internal control
system, which is commensurate with the size, scale and complexity of its operations. Your Company has a process in place to continuously monitor existing controls and identify gaps and implement new and / or improved controls wherever the effect of such gaps would have a material impact on your Company’s operation.
5. Subsidiary/Joint Ventures/Associate Com-panies and their performance
A report on the performance and financial position of each of the subsidiaries and joint venture companies included in the consolidated financial statement is presented in Form AOC-1 annexed to this Report as Annexure - 2.
6. Deposits The Company has not accepted any deposit within
the meaning of the Chapter V to the Companies Act, 2013. Further, no amount on account of principal or interest on deposit was outstanding as at the end of the year under report.
7. Auditors i) Statutory Auditors:
Your Company’s Auditors M/s. Price Waterhouse Chartered Accountants LLP, who have been appointed up to the conclusion of the 24th Annual General Meeting, subject to ratification by the members of the Company at every Annual General Meeting, have given their consent to continue to act as the Auditors of the Company for the remaining tenure. Members are requested to consider their re-appointment as the Auditors of the Company and to fix their remuneration by passing an ordinary resolution under Section 139 of the Companies Act, 2013.
ii) Cost Auditors: M/s. Kiran J. Mehta & Co, Cost Accountants
(Firm Registration No. 000025), are proposed to be appointed as the Cost Auditors under Section 148 of the Companies Act, 2013. The members are requested to approve their remuneration by passing an ordinary resolution pursuant to Rule 14 of the Companies (Audit and Auditors) Rules, 2015.
iii) Secretarial Auditors: The Board of Directors has re-appointed M/s.
M Siroya and Company, Practicing Company Secretary, as the Secretarial Auditor of your Company for the financial year 2018-19.
8. Auditors’ Report (a) Statutory Auditors’ Report:
The Auditors’ observations read with Notes to Accounts are self-explanatory and therefore do not call for any comment.
No frauds or instances of mismanagement were reported by the Statutory Auditor under Section 143(12) of the Companies Act, 2013.
(b) Cost Audit Report : The Company had appointed M/s. Kiran J. Mehta
& Co., Cost Accountants as the Cost Auditors of the Company for the financial year 2017-18. The Cost Audit Report for the year 2016-17 was e-filed on August 10, 2017. The Cost Audit for the financial year 2017-18 is in progress and the report will be e-filed to the Ministry of Corporate Affairs, Government of India, in due course.
(c) Secretarial Audit Report : Secretarial Audit Report given by M/s. M
Siroya and Company, Company Secretaries is annexed with the Report as Annexure 3.
9. Share Capital & ListingA) The Company does not have any equity shares
with differential rights and hence disclosures as required in Rule 4(4) of the Companies (Share Capital and Debentures) Rules, 2014 are not required. The Company has not issued any sweat equity and stock options hence no disclosure is required under Rule 8 (13) of Companies (Share Capital and Debentures) Rules, 2014 and the SEBI (Share Based Employee Benefits) Regulations, 2014 and Rule 12(9) of the Companies (Share Capital and Debentures) Rules, 2014.

54
B) Disclosure of Shares held in suspense account under Clause F of Schedule V to the SEBI (Listing Obligations and Disclosure Requirements) Regulations, 2015
Outstanding Balance in the suspense account lying at the beginning of the year
Number of shareholders who approached issuer
for transfer of shares from suspense account during
the year
Transferred/Credited during the year
Balance outstanding
No of shareholders
No of Shares
No of shareholders
No of Shares
No of shareholders
No of Shares
No of shareholders
No of Shares
207 52,010 3 980 162* 36,820* 45 15,190
*Out of 162 number of shareholders, 159 shareholders comprising of 35,840 unclaimed shares have been transferred to IEPF, with filing of Form IEPF-4 on November 30, 2017.
The voting rights on these shares shall remain frozen till the rightful owner of such shares claims the shares.
C) Listing with the stock exchanges
The Company’s equity shares are listed on the BSE Limited (BSE) and the National Stock Exchange of India Limited (NSE). The Secured Non-Convertible Debentures are listed on the BSE Limited.
Annual listing fees for the year 2017-18 have been paid to BSE and NSE.
10. Extract of the Annual Return An extract of the annual return in Form MGT-9 of the Companies (Management and Administration) Rules, 2014 is attached to this Report as Annexure – 4
11. Conservation of energy, technology absorption and foreign exchange earnings and outgo. Conservation of energy:
Initiatives taken for conservation of energy, its impact are as under
Sr. No.
Description of Energy Efficiency Improvement Measure Energy Savings [kWh/Annum]
Savings [` In million/Annum]
At Plate & Coil Mill, Anjar
1 Pipe line modification to change route of Mill Roll Cooling pump 2,010,790 14.88
2 Impeller trimming in Roller Table Cooling pump. 950,705 7.04
3 Impeller trimming in Indirect Cooling Water pump. 206,277 1.53
4 Reshuffling of pumps and pressure reduction during non-production days for ICW system
147,455 1.09
5 Making Cooling Tower Fans’ operation in auto based on temperature. 376,269 2.78
6 Optimization in Down Coiler Hydraulic “E” System with changing in Wrapper Roll Sequence.
37,083 0.27
At Pipe Mill, Anjar
7 Replacement of Conventional Lighting Fixtures [total 111 nos] with LED Fixtures in Pipes & PCMD.
39,197 0.29
8 Reducing running hours [1 hour/day] of lights in Admin Canteen. 4,200 0.03

Annual Report 2017-18 Financial StatementsThe Welspun Corp Story Governance Reports
55
01. Technology absorption :a. Adoption of Intermediate Seam UT at LSAW pipe
mill for instant feedback to welding engineers.b. Adoption of SAP based BIBO system for
paper-less business review.c. Adoption of de-magnetizer system to reduce
residual magnetism for filed weld joints.02. Research & Development A. Specific areas in which R&D is carried out by the Company. Anjar Pipe Mill:
Establishment of welding consumables to obtain higher all-weld elongation to meet the strain capacity in weld metal.
Development of API 5L X65MS large di-ameter HSAW pipes for onshore sour ser-vice applications.
Development of API 5L X65MS LSAW pipes for onshore high pressure se-vere-sour service applications.
Development of API 5L X80M/CSA 550 grade large diameter heavy wall LSAW pipes for onshore sweet service applica-tions.
Development of hot induction bends without offline heat treatments with uni-form properties along the length using Thermo-Mechanically Controlled hot rolled steels.
Development of very low diameter/thick-ness ratio L450 SAWL pipes for offshore sweet service applications.
Development of domestic steel mill for supply of API 5L X70M hot rolled coils.
Development of low carbon-manganese and high niobium hot rolled plates for the production of LSAW pipes used for strong onshore and offshore sour service applications.
B. Benefits derived as a result of the above R&D. Anjar Pipe Mill:
Improvement in the weld integrity of pipelines subjected to the adverse condi-tions during laying and operation.
Ability to cater large diameters HSAW pipelines for the economic reasons and non-availability of wider plates.
Ability to cater stringent requirements of pipelines for transportation of gas from severe corrosive fields.
Higher strength-to-weight ratio to facili-tate field laying at mountains and lower project cost.
Low cost and eco-friendly hot induction bends from Thermo-Mechanically Con-
Sr. No.
Description of Energy Efficiency Improvement Measure Energy Savings [kWh/Annum]
Savings [` In million/Annum]
9 Reducing running hours [1 hour/day] of Air Conditioners in Admin Block. 24,207 0.18
10 Interlocking unloading valve of entry power pack 37kW with all operations [will get automatically OFF if no operation] in ERW 6”.
14,516 0.11
11 Making Cooling tower fan motor ON-OFF as per set water temperature in LSAW.
10,752 0.08
12 Making Forming Press Exit power pack Trolley TT-1 OFF in auto in idle condition in LSAW.
12,406 0.09
13 Forming Press Hydraulic power pack motor made off during idle time (switched OFF after 30 min. if no operation) in LSAW.
43,615 0.32
14 VFD installations in Hydro Tester pump in SP-2. 45,481 0.34
At Dahej Plant
15 Installation of 26 Nos 70 W LED fixtures at “Street Lights” in place of 150 W HPSV Fixtures.
8,364 0.05
16 Installation of 55 Nos 165 W LED fixtures at “LSAW Shed Lights” in place of 400 W HPSV Fixtures.
9,151 0.06
17 Forming Washing Exit Conveyor Group-1 & Group 2 Tack Welding Entry Conveyor Group–1 and Group-2
7,114 0.05
Total 3,947,583 29.16

56
trolled hot rolled steel plates without heat treatments.
Ability to cater collapse resistant pipelines for transportation of gas from deep sea fields.
Availability of higher grade hot rolled coils for the country’s economic growth and implementation of Make-in-India.
Ability to cater LSAW pipelines as a substi-tute for expansive alloyed steel pipes.
C. Future plan of action Anjar Pipe Mill:
Development of higher strength-to-weight ratio hot induction bends using TMCP steel for API X80M onshore sweet service gas pipelines.
Development of heavy wall deep offshore severe sour low hardness L415M PSL2 grade SAWL pipes.
Development of heavy wall low diame-ter-to-thickness ratio L450 SFDUP SAWL pipes deep offshore severe sour service applications.
Development of API 5L X70M PSL2 strain-based design pipes for pipelines to be laid in high seismic zones.
Use of new wire and flux for pipelines re-quiring low temperature toughness and very low hardness.
Development of clad/CRA lined pipes for special sour service applications.
Anjar Plate and Coil Mill: Development of API 5L X70M plates for
SAWL pipes used for onshore sweet ser-vice applications.
Development of clad plates for clad/CRA lined pipes for special sour service appli-cations.
03. Expenditure on R&D Capital : Nil
Recurring : ` 12.67 million
Total : ` 12.67 million
Total R&D expenditure as a percentage of revenue from operations : 0.03%
Total Foreign exchange: Used - ` 25,890.09 million, Earned- ` 7,894.55 million
12. Corporate Social Responsibility (CSR) Disclosures as required under Rule 9 of the Companies (Corporate Social Responsibility Policy) Rules, 2014 are annexed to this Report as Annexure 5.
13. Directors and Key Managerial PersonnelA) Changes in Directors and Key Managerial Personnel
Since the last report, following changes took place in the Board of Directors and Key Managerial Personnel:-
Mr. Braja Mishra resigned with effect from June 7, 2017.
Mr. Lalitkumar Naik was appointed as the Man-aging Director & Chief Executive Officer with effect from January 1, 2017. He resigned with effect from December 1, 2017.
Mr. Vipul Mathur appointed as the Managing Director & Chief Executive Officer with effect from December 1, 2017.
Mr. S. Krishnan, Chief Financial Officer of the Company elevated as the Executive Director and Chief Financial Officer & Chief Executive Officer (Plate and Coil Mill Division) with effect from December 1, 2017.
Pursuant to Section 160 of the Companies Act, 2013, the Company has received a notice from a member proposing Mr. Vipul Mathur and Mr. S. Krishnan for appointment as directors of the Company. Accordingly, a resolution proposing their appointment has been included in the notice convening the Annual General Meeting.
In accordance with the provisions of the Companies Act, 2013 and the Articles of Association of the Company, Mr. Balkrishan Goenka and Mr. Rajesh Mandawewala are retiring by rotation at the forthcoming Annual General Meeting and being eligible, they have been recommended for re-appointment by the Board.
Details about the directors being (re)-appointed are given in the Notice of the forthcoming Annual General Meeting which is being sent to the members along with the Annual Report.
B) Independent DirectorsThe independent directors have individually declared to the Board that they meet the criteria of independence as provided in Section 149(6) of the Companies Act, 2013 at the time of their respective appointment and there is no change

Annual Report 2017-18 Financial StatementsThe Welspun Corp Story Governance Reports
57
The corporate guarantees were given to secure credit facilities availed by the subsidiaries of your Company, guarantee export obligations of the subsidiaries to the custom authorities and to guarantee performance of the subsidiaries of the Company.
15. Particulars of contracts or arrangements with related partiesAll related party transactions that were entered into during the year under Report were on an arm’s length basis and were in the ordinary course of business. There were no materially significant related party transactions made by the Company with Promoters, Directors, Key Managerial Personnel or other designated persons which
in the circumstances as on the date of this Report which may affect their status as an independent director.
Your Board confirms that in their opinion the independent directors fulfill the conditions specified in SEBI (LODR) and they are independent of the management.
C) Formal Annual Evaluation Like previous financial year, this year also, the Company followed the evaluation process with specific focus on the performance vis-à-vis the plans, meeting challenging situations, performing leadership role within, and effective functioning of the Board etc. The evaluation process sought graded responses to a structured questionnaire for each aspect of the evaluation viz. time spent by each of the directors; accomplishment of specific responsibilities and expertise; conflict of interest;
integrity of the Director; active participation and contribution during discussions. For the financial year 2017-18, the annual performance evaluation was carried out by the Independent Directors, Nomination and Remuneration Committee and the Board, which included evaluation of the Board, Independent Directors, Non-independent Directors, Executive Directors, Chairman, Committees of the Board, Quantity, Quality and Timeliness of Information to the Board. All the results were satisfactory.
D) Committees of the Board of DirectorsInformation on the Audit Committee, the Nomination and Remuneration Committee, the Stakeholders’ Relationship, Share Transfer and Investor Grievance Committee and meetings of those committees held during the year under Report is given in the Corporate Governance Report annexed to the Annual Report as Annexure 7.
14. Particulars of outstanding loans, guarantees and investments under Section 186 are as under:
(` in million)
Name of the Entity / beneficiary Investment Corporate Guarantee
Loans
Welspun Pipes Inc. 0.44 6,517.50 -
Welspun Tradings Limited 50.22 7,060.01 -
Welspun Captive Power Generation Limited* 345.42 - -
Welspun Mauritius Holdings Limited* 1,827.07 - -
Welspun Wasco Coatings Private Limited 147.55 108.49 354.11
Standard Chartered Bank ADR 18.04 - -
Bonds 1,754.20 - -
Welspun Middle East Pipes Company LLC - 2,494.58 -
Welspun Middle East Pipe Coating Company LLC - 361.18 -
* Investment carried at fair value through profit and loss.
might have a potential conflict with the interest of the Company at large.
The Company’s policy on Related Party Transactions as approved by the Board is uploaded on the Company’s website.
Save and except as disclosed in the financial statements none of the Directors had any pecuniary relationships or transactions vis-à-vis the Company.
Disclosures as required under the Companies Act, 2013 are given in Form AOC-2 annexed as Annexure 6 to this Report.

58
to ` 35,779.00 million. The P/ E ratio changed from 12.55 times to 28.46 times. The share price increased by 844.30% in comparison to the rate at which the Company came out with the public issue in February, 1997 (after taking in to consideration the reorganization of share capital done in March, 2005 but without considering other corporate actions not resulting in to any change in the share capital).
(vi) Average percentile increase /(decrease) already made in the salaries of employees other than the managerial personnel in the last financial year and its comparison with the percentile increase/ (decrease) in the managerial remuneration and justification thereof and point out if there are any exceptional circumstances for increase in the managerial remuneration: Aggregate remuneration of employees excluding KMP reduced by 1.2%. Change in the remuneration of the KMP is not comparable due to change in the Managing Director and appointment of Executive Director during the financial year. Considering remuneration of the newly appointed Managing Director and CEO, Executive Director & CFO & CEO (PCMD), the aggregate remuneration of KMP reduced by 6.6%.
(vii) The key parameters for any variable component of remuneration availed by the directors:
1) Total Production (as per Business Plan approved by the Board)
2) Revenue (as per Business Plan approved by the Board)
3) Profit Before Tax (as per Business Plan approved by the Board)
4) Operating Cash Flow (as per Business Plan approved by the Board)
(viii) Affirmation that the remuneration is as per the remuneration policy of the Company: YES, Employees increment in remuneration is based on the individual performance and the Company performance for the Financial Year.
16. Managerial Remunerationa. Details of the ratio of the remuneration of each
director to the median employee’s remuneration and other details as required pursuant to Rule 5(1) of the Companies (Appointment and Remuneration of Managerial Personnel) Rules, 2014.
(i) The ratio of the remuneration of each director to the median remuneration of the employees of the Company for the financial year:
Director’s name for the period
Ratio with reference to median
remuneration of the
employees
Mr. Lalitkumar Naik 01.04.2017 to 30.11.2017 150
Mr. Vipul Mathur 01.12.2017 to 31.03.2018 145
Mr. S. Krishnan 01.12.2017 to 31.03.2018 103
(ii) The percentage increase in remuneration of each director, Chief Financial Officer, Chief Executive Officer, Company Secretary or Manager, if any, in the financial year: Managing Director & CEO: 13.2%. CFO : 11.49%, CS : 4.65%.
(iii) The percentage increase in the median remuneration of employees in the financial year: 8.08%.
(iv) The number of permanent employees on the rolls of the Company: 2,691.
(v) Variations in the market capitalization of the Company, price earnings ratio as at the closing date of the current financial year and previous financial year and percentage increase over decrease in the market quotations of the shares of the company in comparison to the rate at which the Company came out with the last public offer in case of listed companies, and in case of unlisted companies, the variations in the net worth of the Company as at the close of the current financial year and previous financial year : The market cap of the Company increased from ` 21,907.68 million

Annual Report 2017-18 Financial StatementsThe Welspun Corp Story Governance Reports
59
b.
De
tails
of
the
to
p t
en
em
plo
ye
es
in t
erm
s o
f re
mu
ne
rati
on
dra
wn
an
d t
he
nam
e o
f eve
ry o
the
r e
mp
loye
e a
s re
qu
ire
d p
urs
uan
t to
Ru
le 5
(2)
of
the
C
om
pan
ies
(A
pp
oin
tme
nt
an
d R
em
un
era
tio
n o
f M
an
ag
eri
al P
ers
on
ne
l) R
ule
s, 2
014
is
as
un
de
r:
Nam
eD
esi
gn
ati
on
DO
BA
ge
DO
JR
em
un
era
tio
nP
rev
iou
s C
om
pan
yQ
uali
ficati
on
Natu
re o
f
Em
plo
ym
en
t
% O
f E
qu
ity
Sh
are
s h
eld
in
the
Co
mp
an
y
Re
lati
ve
of
an
y
Dir
ecto
r/M
an
ag
er
of
the
Co
mp
an
y
Vip
ul M
ath
ur
Man
ag
ing
Dir
ecto
r &
CE
O21/
03
/19
70
48
02/0
2/2
00
14
0,2
90
,83
3M
an
In
du
stri
es
(In
dia
) Ltd
MB
AP
erm
an
en
t0
%N
o
Lalit
ku
mar
Naik
*M
an
ag
ing
Dir
ecto
r18
/10
/19
61
57
01/
12/2
016
31,0
18,8
43
A
dit
ya B
irla
Gro
up
PG
DM
/ B
Tech
Ch
em
ical
En
gin
eeri
ng
P
erm
an
en
t0
%N
o
S. K
rish
nan
Execu
tive D
irecto
r &
CF
O a
nd
CE
O
(PC
MD
)17
/07/
196
25
60
3/0
6/2
013
28
,30
4,10
9
Un
ited
Ph
osp
ho
rus
Ltd
.M
. C
om
/ L
LB
-Part
I/
A.C
.A/
A.C
.S/
A.I.C
.W.A
Perm
an
en
t0
%N
o
P K
Mu
kh
erj
ee*
Dir
ecto
r#0
2/0
1/19
61
57
02/0
5/1
99
923
,70
5,8
22
Kilb
urn
En
gin
eeri
ng
Ltd
BE
P
erm
an
en
t0
%N
o
Go
dfr
ey J
oh
nD
irecto
r#3
0/0
8/1
96
55
311
/06
/20
1220
,03
4,4
67
Ferr
o T
ech
In
dia
Pvt.
Ltd
.M
BA
Perm
an
en
t0
%N
o
Lal H
otw
an
iD
irecto
r#0
5/0
5/1
95
36
50
1/0
1/20
00
19,8
31,
98
0
Gam
mo
n In
dia
Ltd
.B
.Co
mP
erm
an
en
t0
%N
o
Akh
il Jin
dal
Dir
ecto
r#0
1/12
/19
69
48
01/
07/
20
04
13,0
21,16
4
S K
um
ars
Nati
on
wid
e L
tdM
BA
Perm
an
en
t0
%N
o
Deep
ak
Ch
au
han
Dir
ecto
r#3
0/1
2/1
97
14
60
1/0
9/2
012
12,6
00
,810
G
am
mo
n In
fra p
roje
cts
L
td.
LL
BP
erm
an
en
t0
%N
o
Tri
bh
uw
an
Sin
gh
Kath
ayat
Pre
sid
en
t10
/01/
197
14
720
/06
/19
96
10,3
80
,626
Jin
dal O
rgan
isati
on
BS
C/D
ME
/MB
AP
erm
an
en
t0
%N
o
Gau
ran
g D
esa
i*P
resi
den
t25/0
8/1
972
46
01/
11/2
00
89
,38
0,18
2
Gala
Pre
cis
ion
MB
A (
Fin
)/B
E (
Mech
)P
erm
an
en
t0
%N
o
Su
resh
Ch
an
der
Dara
kP
resi
den
t0
2/0
1/19
68
50
02/0
1/20
08
9,2
08
,16
8
Relia
nce In
du
stri
es
Ltd
.B
Co
m/
DIT
MP
erm
an
en
t0
%N
o
Navin
Ag
arw
al
Sen
ior
Vic
e
Pre
sid
en
t0
1/0
1/19
72
46
02/0
6/2
00
88
,84
0,5
38
M
ah
ind
ra &
Mah
ind
ra L
td.
PG
DB
M F
inan
ce/B
.Co
m
(Ho
ns)
Perm
an
en
t0
%N
o
Vip
in G
an
dh
iV
ice P
resi
den
t18
/01/
196
85
025/1
0/2
00
68
,53
3,8
45
A
sho
k L
eyla
nd
Ltd
.M
BA
Perm
an
en
t0
%N
o
Para
s Jain
Pre
sid
en
t25/0
7/19
58
60
16/0
1/20
06
7,76
6,7
57
Mo
ral O
vers
eas
Ltd
.C
AP
erm
an
en
t0
%N
o
Atu
l Tri
ved
iS
en
ior
Vic
e
Pre
sid
en
t0
3/0
1/19
744
414
/05/2
00
77,
727,
80
5
TC
S L
td.
CA
Perm
an
en
t0
%N
o
Atu
l W
ah
iP
resi
den
t23
/10
/19
56
62
16/0
7/20
127,
56
7,74
8
Ind
ian
Arm
yM
BA
Perm
an
en
t0
%N
o
Gau
rav
Merc
han
tV
ice P
resi
den
t11
/09
/19
73
45
15/0
1/20
147,
527,
36
2
Ess
ar
Ste
el L
imit
ed
B C
om
/MB
AP
erm
an
en
t0
%N
o
Ru
pak G
ho
shS
en
ior
Vic
e
Pre
sid
en
t17
/10
/19
69
49
29
/10
/20
07
7,16
0,0
82
Blu
e S
tar
Ltd
ICW
A/
CA
Perm
an
en
t0
%N
o
Keta
n P
ate
lS
en
ior
Vic
e
Pre
sid
en
t3
1/0
7/19
70
48
03
/11/
20
156
,89
7,0
27
JS
W S
teel Ltd
.C
A/I
CW
A/
B C
om
Perm
an
en
t0
%N
o
San
jay B
atr
aS
en
ior
Vic
e
Pre
sid
en
t20
/08
/19
68
50
26
/12/2
00
06
,86
4,2
45
M
SL
Dip
Mech
/DB
AP
erm
an
en
t0
%N
o
Raje
ev S
ing
h*
Pre
sid
en
t21/
10/1
974
44
06
/12/2
014
5,4
39
,33
0
BG
Gro
up
BE
Met/
MP
M &
IR
Perm
an
en
t0
%N
o
* em
plo
yed
fo
r a p
art
of
the y
ear.
# -
No
t o
n t
he B
oard
.

60
c. Managing Director of the Company was not in receipt of any commission from the Company and at the same time, remuneration or commission from the Company’s Subsidiary Company.
d. Particulars of remuneration to the executive directors including the details of remuneration paid/payable to the executive directors for the financial year 2017-18 are as under:
Name of the Director
Salary & Allowance
Perquisites Commission Service Contract/
Tenure
performance linked
incentives
Notice Period
Severance Fees
Stock Option
Pension
1 Mr. Lalitkumar Naik#` 31.02 million Nil Nil4 years 11 months
Nil 1 month Nil Nil Nil
2 Mr. Vipul Mathur ` 15 million* Nil Nil 5 years Nil 1 month Nil Nil Nil
3 Mr. S Krishnan ` 10 million* Nil Nil 5 Years Nil 1 month NIl Nil Nil
* employed as directors with effect from December 1, 2017. The remuneration is proportionate to their tenure of employment during 2017-18. The remuneration includes unpaid variable component as well.
# ceased to be the Managing Director with effect from November 30, 2017 and hence considered proportionate remuneration for FY 2017-18.
Non-Executive Chairman was paid Commission of ` 27.99 million i.e. @1% of the Net Profits in terms of the approval granted by the members of the Company at the Annual General Meeting held on September 20, 2017. No remuneration or perquisite was paid to, and no service contract was entered into with, or stock options granted to, but the sitting fees were paid to the following directors for attending meetings of Board / Committees of the Board.
SR Name of the Director (`) SR Name of the Director (`)
1 Mr. Atul Desai 212,000 5 Mr. Rajkumar Jain 876,000
2 Mr. Desh Raj Dogra 226,000 6 Mr. Ram Gopal Sharma 655,000
3 Mr. K. H. Viswanathan 948,000 7 Mrs. Revathy Ashok 114,000
4 Mr. Mintoo Bhandari 339,000 8 Mr. Utsav Baijal Nil
The above mentioned sitting fee paid to the non-executive directors was within the limits prescribed under the Companies Act, 2013 for payment of sitting fees. Hence prior approval of the members as stipulated under Regulation 17(6) of the SEBI (Listing Obligations and Disclosure Requirements) Regulations, 2015 was not required.
17. Shareholding of the Directors of the Com-pany as on March 31, 2018
Refer Corporate Governance Report for detail of shareholding of the directors.
Except as mentioned in the Corporate Governance Report, none of the other directors hold any shares or convertible securities in the Company.
18. Corporate Governance Certificate The Compliance certificate obtained from M/s.
JMJA & Associates LLP, Company Secretaries regarding compliance of conditions of corporate governance as stipulated in Chapter IV read with relevant Schedule to the SEBI (Listing Obligations and Disclosure Requirements) Regulations, 2015 is annexed with this Report.
19. Risk management policy With its fast and continuous expansion in different
areas of businesses across the globe, the Company is exposed to plethora of risks which may adversely impact growth and profitability. The Company recognizes that risk management is of concern to all levels of the businesses and requires a structured risk management policy and process involving all personnel. With this objective, the Company had formulated structured Risk Management Policy thereby to effectively address such risks namely, strategic, business, regulatory and operational risks. The Policy envisages identification of risks by each business segment and location, together with the impact that these may have on the business objectives. It also provides a mechanism for categorization of risks into Low, Medium and High according to the severity of risks. The risks identified are reviewed by a committee of senior executives and the Managing Director & CEO of the Company and appropriate actions for mitigation of risks are advised; the risk profile is updated on the basis of change in the business environment.
For the key business risks identified by the Company please refer to the Management Discussion and Analysis annexed to this Report.

Annual Report 2017-18 Financial StatementsThe Welspun Corp Story Governance Reports
61
20. Familiarization program for Independent Director
The details of familiarization program (for independent directors) are disclosed on the Company’s website and a web link thereto is:
http://www.welspuncorp.com/system downloads/attachments/000/000/147/original/Familiarisation_program_-Final_-23.02.2015_(23.05.16).pdf?1491551542
21. Code of Conduct
The Company has Code of Conduct for Board members and Senior Management Personnel. A copy of the Code has been put on the Company’s website for information of all the members of the Board and management personnel.
All Board members and Senior Management Personnel have affirmed compliance of the same.
A declaration signed by the Managing Director & CEO of the Company is given below:
“I hereby confirm that the Company has obtained from all the members of the Board and Management Personnel, affirmation that they have complied with the Code of Conduct for the financial year 2017-18.”
Sd/- Vipul Mathur Managing Director& CEO DIN: 0007990476
22. Miscellaneous Disclosures During the year under Report, there was no change
in the general nature of business of your Company.
No material change or commitment has occurred which would have affected the financial position of your Company between the end of the financial year of your Company to which the financial statements relate and the date of the Report.
No significant and material order was passed by the regulators or courts or tribunals which would have impacted the going concern status and your Company’s operations in future.
Your Company has not made any provision of money for the purchase of, or subscription for, shares in your Company, to be held by or for the benefit of the employees of your Company and hence the disclosure as required under Rule 16(4) of the Companies (Share Capital and Debentures) Rules, 2014 is not required.
Further, during the year under Report no case of sexual harassments was reported to the Internal Complaints Committee formed under the provisions of Sexual Harassment of Women at workplace (Prevention, Prohibition and Redressal) Act, 2013.
23. Directors’ Responsibility Statement Pursuant to Section 134(3)(c) & 134(5) of the
Companies Act, 2013, your directors hereby confirm that:
a. in the preparation of the annual accounts, the applicable accounting standards had been fol-lowed along with proper explanation relating to material departures;
b. the directors had selected such accounting policies and applied them consistently and made judgments and estimates that are rea-sonable and prudent so as to give a true and fair view of the state of affairs of the Company at the end of the financial year and of the profit and loss of the Company for that period;
c. the directors had taken proper and sufficient care for the maintenance of adequate account-ing records in accordance with the provisions of the Companies Act, 2013 for safeguarding the assets of the Company and for preventing and detecting fraud and other irregularities;
d. the directors had prepared the annual ac-counts on a going concern basis;
e. being a listed company, the directors had laid down internal financial controls to be followed by the Company and that such internal finan-cial controls are adequate and were operating effectively; and
f. the directors had devised proper systems to ensure compliance with the provisions of all applicable laws and that such systems were adequate and operating effectively.
AcknowledgementsYour directors thank the Government Authorities, Financial Institutions, Banks, Customers, Suppliers, Shareholders, Employees and other business associates of the Company, who through their continued support and co-operation, have helped as the partner in your company’s progress and achievement of its objectives.
For and on behalf of the Board of Directors
Vipul Mathur Managing Director & CEO
DIN : 0007990476
S. KrishnanExecutive Director & CFO and CEO (PCMD)
DIN: 06829167Date: May 2, 2018Place: Mumbai

62
Welspun Corp Limited’s Dividend Distribution Policy
1. REGULATORY FRAMEWORK The Securities Exchange Board of India (“SEBI”)
on July 8, 2016 inserted Regulation 43A in SEBI (Listing Obligations and Disclosure Requirements) Regulations, 2015, which requires top five hundred listed companies (based on market capitalization of every financial year) to formulate a Dividend Distribution Policy.
Welspun Corp Limited (“Company”) being one of the top five hundred listed companies as per the market capitalization as on the last day of the immediately preceding financial year, frames this policy to comply with the requirements of the SEBI (Listing Obligations and Disclosure Requirements) Regulations, 2015.
2. OBJECTIVE & PHILOSOPHY
The objective of this Policy is to provide predictability of dividend to the investors and at the same time to enable them to plan for utilization of their income and to ensure the right balance between the quantum of dividend paid and amount of profits retained in the business for various purposes. Through this Policy, the Company would endeavor to maintain a consistent approach to dividend pay-out plans, subject to the applicable laws and conditions.
The philosophy of the Company is to maximize the shareholders’ wealth in the Company through various means. The focus will continue to be on sustainable returns, through an appropriate capital strategy for both medium term and longer term value creation. Accordingly, the Board would continue to adopt a progressive and dynamic dividend policy, ensuring the immediate as well as long term needs of the business.
3. DIVIDEND DECLARATION - CIRCUMSTANCES AND FINANCIAL PARAMETERS.
The Board will consider present situation of the Company, internal and external factors influencing performance of the Company, its strategy and business plan for the future. After considering such factors, the Board will endeavor to achieve distributing upto 25% of Profit After Tax for a financial year, on standalone basis, with equity shareholders (including by way of dividend and Dividend Distribution Tax thereon).
The shareholders may expect dividend in following circumstances:
a. The Board will assess the Company’s financial requirement, including present and future organic and inorganic growth opportunities and other relevant factors.
b. In the circumstances where no material event has occurred affecting the long term business stability of the Company.
c. No event has happened which may have long term material effect on the business of the Company. In such circumstances, dividend may be recommended or declared at the discretion of the Board.
Any deviation from the Policy may be disclosed in the Directors’ Report to the Shareholders.
In the event of inadequacy or absence of profits in any year, the Company may declare dividend out of free reserves subject to the fulfillment of the conditions prescribed under applicable laws and in compliance with the terms of sanction from the Banks / Financial Institutions.
4. FACTORS FOR DETERMINING DIVIDEND In determining the Company’s dividend payout, the Board of Directors would consider a variety of factors,
including:A. Internal Factors B. External Factors
i) Stability / trends of earnings ii) Liquidity of funds iii) Need for additional capital iv) Acquisitions and/or any other potential strategic action v) Expansion of business vi) Past dividend trends vii) Dividend type and time of its payment
i) Prevailing legal requirements, tax rules, Government policies, Statutory conditions or restrictions as may be provided under applicable laws
ii) State of the industry or economy of the country iii) Capital market scenarioiv) Financial covenants stipulated by the lendersv) Covenants in agreement with shareholding group(s)
Annexure - 1

Annual Report 2017-18 Financial StatementsThe Welspun Corp Story Governance Reports
63
5. PARAMETERS WITH REGARDS TO VARIOUS CLASSES OF SHARES
The Company shall first declare dividend on outstanding preference shares, if any, at the rate of dividend fixed at the time of issue of preference shares and thereafter, the dividend would be declared on equity shares.
6. UTILIZATION OF RETAINED EARNINGS The earnings retained by the Company after
distribution of dividend to the members may be used, inter alia, to:-
a. Maintain existing operations;
b. Acquisitions, expansion or diversification; c. Funding organic and inorganic growth;
d. Short-term investment in risk-free instruments with moderate returns;
e. Repayment of borrowings; f. Meet contingent and other liabilities;
g. Issue of Bonus Shares;
h. Buyback of securities; i. Investment in Subsidiaries;
j. Research and Development;
k. Innovation;
l. Acquisition of Intellectual Property Rights;
m. Any other purpose as the Board may deem appropriate in the best interest of the Company;
7. AMENDMENTS / MODIFICATIONS i. This Policy would be subject to revision/
amendment in accordance with the guidelines as may be issued by Ministry of Corporate Affairs, Securities Exchange Board of India or such other regulatory authority as may be authorized, from time to time, on the subject matter.
ii. The Company reserves its right to alter, modify, add, delete or amend any of the provisions of this Policy.
iii. In case of any amendment(s), clarification(s), circular(s) etc. issued by the relevant authorities, not being consistent with the provisions laid down under this Policy, then such amendment(s), clarification(s), circular(s) etc. shall prevail upon the provisions hereunder and this Policy shall stand amended accordingly from the effective date as laid down under such amendment(s), clarification(s), circular(s) etc.
iv. Any difficulty or ambiguity in this Policy will be resolved by the Board of Directors in line with the broad intent of this Policy. The Board may also establish further rules and procedures, from time to time, to give effect to the intent of this Policy and further the objective of good corporate governance.
v. When the Company proposes to declare dividend on the basis of parameters other than what is mentioned in the Policy or proposes to change its dividend distribution policy, the same along with the rationale shall be disclosed.
Approved & adopted by the Board of Directors at its meeting held on May 8, 2017.

64
Form AOC-I (Pursuant to first proviso to sub-section (3) of section 129 read with Rule 5 of
Companies (Accounts) Rules, 2014)
Statement containing salient features of the financial statement of subsidiaries/associate companies/joint ventures
Part “A”: Subsidiaries
(Information in respect of each subsidiary to be presented with amounts in ` in million)
1. Sl. No. 1 2 3 4
2. Name of the subsidiary : Welspun Tradings Limited
Welspun Mauritius Holdings
Limited
Welspun Pipes Inc.(see note 3)
Welspun Middle East DMCC
3. The date since when subsidiary was acquired 30.03.2010 19.04.2010 16.08.2006 02.03.2011
4. Reporting period for the subsidiary concerned, if different from the holding company’s reporting period :
N.A. N.A. N.A. N.A.
5. Reporting currency and Exchange rate as on the last date of the relevant Financial year in the case of foreign subsidiaries. :
INR USD* USD* USD*
6. Share capital : 50.13 1,533.84 541.51 3.36
7. Reserves & surplus: 759.97 344.78 8,954.54 17.15
8. Total assets : 5,488.15 2,859.20 20,937.23 22.25
9. Total Liabilities : 4,678.05 980.58 11,441.18 1.74
10. Investments@ : 83.03 Nil Nil Nil
11. Turnover (including other income) 23,588.52 Nil 33,443.80 42.47
12. Profit/ (Loss) before taxation : 182.14 34.63 (320.21) (18.94)
13. Provision for taxation: 63.45 3.43 (824.98) Nil
14. Profit/ (Loss) after taxation: 118.69 31.20 504.77 (18.94)
15. Proposed Dividend: Nil Nil Nil Nil
16. % of shareholding 100.00% 89.98% 94.79% 100.00%
*USD Closing Rate USD 1= ` 65.175
Average Rate USD 1 = ` 64.447
@ Excluding investments in subsidiaries.
1. Names of subsidiaries which are yet to commence operations – Nil 2. Names of subsidiaries which have been liquidated or sold during the year – None. 3. Includes performance of step down subsidiaries viz. Welspun Tubular LLC and Welspun Global Trade LLC.
Annexure - 2

Annual Report 2017-18 Financial StatementsThe Welspun Corp Story Governance Reports
65
Part “B”: Associates and Joint Ventures Statement pursuant to Section 129 (3) of the Companies Act, 2013 related to Associate Companies and Joint Ventures: Sl. No. 1 2 3
Name of the joint ventures Welspun Middle East Pipes LLC#
Welspun Middle
East Pipes Coating
LLC#
Welspun Wasco
Coatings Private Limited
1. Latest audited Balance Sheet Date 31.03.2018 31.03.2018 31.03.2018
2. Date on which the Associate or Joint Venture was associated or Acquired 17.10.2010 17.10.2010 30.09.2015
3. Shares of Associate / Joint Ventures held by the company on the year end
- Numbers of Shares 38,031,042 16,886,189 14,755,014
- Amount of Investments 661.06 293.52 147.55
- Extend of Holding % 50.01% 50.01% 51.00%
4. Description of how there is significant influence NA NA NA
5. Reason why the associate / joint venture is not consolidated NA NA NA
6. Net worth attributable to Shareholding as per latest audited Balance Sheet
1,959.99 (668.34) 105.41
7. Profit / Loss for the year
- Considered in Consolidation (642.23) (165.45) (51.46)
- Not Considered in Consolidation (641.98) (165.38) (49.42)
Reporting currency #SAR Closing Rate SAR 1= ` 17.382 Average Rate SAR 1= ` 17.188
1. Names of associates or joint ventures which are yet to commence operations. - NA
2. Names of associates or joint ventures which have been liquidated or sold during the year. - NA
For and on behalf of the Board
Rajesh Mandawewala Vipul Mathur
Director Managing Director & CEO
DIN: 00007179 DIN : 0007990476
S.Krishnan Pradeep Joshi
Executive Director & CFO and CEO (PCMD) Company Secretary
DIN: 06829167 FCS-4959

66
To,The Members,Welspun Corp Limited
We have conducted the secretarial audit of the compliance of applicable statutory provisions and the adherence to good corporate practices by Welspun Corp Limited (hereinafter called “the Company”). Secretarial Audit was conducted in a manner that provided us a reasonable basis for evaluating the corporate conducts/statutory compliances and expressing my opinion thereon.
Based on our verification of the Company’s books, papers, minute books, forms and returns filed and other records maintained by the Company and also the information provided by the Company, its officers, agents and authorized representatives during the conduct of secretarial audit, we hereby report that in our opinion, the Company has, during the audit period covering the financial year ended on March 31, 2018 complied with the statutory provisions listed hereunder and also that the Company has proper Board-processes and compliance-mechanism in place to the extent, in the manner and subject to the reporting made hereinafter:
We have examined the books, papers, minute books, forms and returns filed and other records maintained by the Company for the financial year ended on March 31, 2018 according to the provisions of:
(i) The Companies Act, 2013 (the Act) and the rules made thereunder, as may be applicable;
(ii) The Securities Contracts (Regulation) Act, 1956 (‘SCRA’) and the rules made thereunder;
(iii) The Depositories Act, 1996 and the Regulations and Bye-laws framed thereunder;
(iv) Foreign Exchange Management Act, 1999 and the rules and regulations made thereunder to the extent of Foreign Direct Investment, Overseas Direct Investment and External Commercial Borrowings;
(v) The following Regulations and Guidelines prescribed under the Securities and Exchange Board of India Act, 1992 (‘SEBI Act’):-
(a) The Securities and Exchange Board of India (Substantial Acquisition of Shares and Takeovers) Regulations, 2011;
(b) The Securities and Exchange Board of India (Prohibition of Insider Trading) Regulations, 2015;
(c) The Securities and Exchange Board of India (Registrars to an Issue and Share Transfer Agents) Regulations, 1993 regarding the Companies Act and dealing with client;
(d) The Securities and Exchange Board of India (Issue and Listing of Debt Securities) Regulations, 2008;
(e) The Securities and Exchange Board of India (Issue of Capital and Disclosure Requirements) Regulations, 2009; and
(f) Securities and Exchange Board of India (Listing Obligations and Disclosure Requirements) Regulations, 2015.
(vi) As confirmed by the management, there are no other laws specifically applicable in relation to the business of the Company.
We have also examined compliance with the applicable clauses of the following:
(i) The Equity Listing Agreements entered into by the Company with BSE Limited and National Stock Exchange of India Limited;
(ii) The Debt Listing Agreement entered into by the Company with BSE Limited; and
(iii) Secretarial Standards issued by the Institute of Company Secretaries of India.
During the period under review the Company has complied with the provisions of the Act, Old Act, Rules, Regulations, Guidelines, Standards, etc. mentioned above.
Other statutes, Acts, laws, Rules, Regulations, Guidelines and Standards etc., as applicable to the Company are given below:
(i) Labour Laws and other incidental laws related to labour and employees appointed by the Company
FOR THE FINANCIAL YEAR ENDED MARCH 31, 2018 [Pursuant to section 204(1) of the Companies Act, 2013 and rule No.9 of the Companies
(Appointment and Remuneration of Managerial Personnel) Rules, 2014]
SECRETARIAL AUDIT REPORT Form No. MR-3 Annexure - 3

Annual Report 2017-18 Financial StatementsThe Welspun Corp Story Governance Reports
67
either on its payroll or on contractual basis as related to wages, gratuity, provident fund, ESIC, compensation etc.;
(ii) Acts as prescribed under Direct Tax and Indirect Tax;
(iii) Acts prescribed under prevention and control of pollution;
(iv) Acts prescribed under environmental protection;
(v) Land Revenues Act of respective States;
(vi) Labour Welfare Act of respective States; and
(vii) Such other Local laws etc. as may be applicable in respect of various offices of the Company.
We further report that the Board of Directors of the Company is duly constituted with proper balance of Executive Directors, Non-Executive Directors and Independent Directors. The changes in the composition of the Board of Directors that took place during the period under review were carried out in compliance with the provisions of the Act.
Adequate notice is given to all directors to schedule the Board Meetings, agenda and detailed notes on agenda were sent at least seven days in advance, and a system exists for seeking and obtaining further information and clarifications on the agenda items before the meeting and for meaningful participation at the meeting.
During the period under review, decisions were carried through unanimously and no dissenting views were observed, while reviewing the minutes.
We further report that there are adequate systems and processes in the Company commensurate with the size and operations of the Company to monitor and ensure compliance with applicable laws, rules, regulations and guidelines.
We further report that during the audit period the Company has undertaken following event/action having a major bearing on the Company’s affairs in pursuance of the above referred laws, rules, regulations, guidelines, standards, etc. referred to above:
(i) Members at the Annual General Meeting held on September 20, 2017 inter-alia approved the following:
Approved final dividend @10% per equity shares (i.e. ` 0.50 per share) of ` 5 each; and
Special Resolution to issue securities including but not limited to secured/unsecured, redeemable, Non-Convertible Debentures (NCDs) to be issued on Private Placement basis, in domestic and/or international market up to an amount not exceeding ` 700 crores (Rupees Seven Hundred crores only).
(ii) Board of Directors at their meeting held on November 6, 2017 inter alia approved availing of Rupee term loan/non-convertible debentures (NCDS) facility amounting to ` 4,500 million; and
(iii) Board of Directors at their meeting held on January 23, 2018 inter alia approved offer and issue of rated, redeemable, secured, non-convertible debentures up to ` 250 crores on private placement basis and the NCD issue & Allotment Committee at their meeting held on February 1, 2018 allotted the same.
For M Siroya and Company,Company Secretaries
Mukesh Siroya Proprietor FCS No.: 5682 CP No.: 4157 Date: May 2, 2018Place: Mumbai
Note: This report is to be read with our letter of even date which is annexed as Annexure A herewith and forms an integral part of this report.

68
To,The Members,Welspun Corp Limited
Our report of even date is to be read along with this letter.
1. Maintenance of Secretarial record is the responsibility of the management of the Company. Our responsibility is to express an opinion on these Secretarial records based on our audit.
2. We have followed the audit practices and processes as were appropriate to obtain reasonable assurance about the correctness of the contents of the Secretarial records. The verification was done on test basis to ensure that correct facts are reflected in Secretarial records. We believe that the processes and practices, we followed provide a reasonable basis for our opinion.
3. We have not verified the correctness and appropriateness of financial records and Books of Accounts of the Company.
4. Wherever required, we have obtained the Management’s representation about the compliance of laws, rules and regulations and happening of events etc.
5. The compliance of the Corporate and other applicable laws, rules, regulations, standards is the responsibility of the management. Our examination was limited to the verification of the procedures on test basis.
6. The Secretarial Audit Report is neither an assurance as to the future viability of the Company nor of the efficacy or effectiveness with which the management has conducted the affairs of the Company.
For M Siroya and Company Company Secretaries
Place: Mumbai Date: May 2, 2018
Mukesh Siroya Proprietor
FCS No.: 5682 CP No.: 4157
Annexure ‘A’

Annual Report 2017-18 Financial StatementsThe Welspun Corp Story Governance Reports
69
I. REGISTRATION AND OTHER DETAILSi. CIN :- L27100GJ1995PLC025609
ii. Registration Date : April 26, 1995
iii. Name of the Company : Welspun Corp Limited
iv. Category / Sub Category of the Company : Public Company/ Company having Share Capital and Limited by Shares
v. Address of the Registered office and contact details: Welspun City, Village Versamedi, Taluka Anjar. Dist. Kutch, Gujarat-370110. Contact: The Company Secretary, Tele.: 02836-662079; email [email protected].
vi. Whether listed company: Yes.
vii. Name, address and contact details of Registrar and Transfer Agent, if any.M/s. Link Intime India Private Limited(Formerly known as: Intime Spectrum Registry Limited)Unit : Welspun Corp LimitedC 101, 247 Park,L B S Marg, Vikhroli West,Mumbai-400 083Tel No: +91 22 49186000, Fax: +91 22 49186060Email - [email protected]; [email protected]
II. PRINCIPAL BUSINESS ACTIVITIES OF THE COMPANYAll the business activities contributing 10% or more of the total turnover of the Company are Welded Pipes (NIC code – 2431), 76.92% to Revenue from operations of the Company. Plate and Coil (NIC Code -2431) 22.90% to Revenue from operations of the Company.
III. PARTICULARS OF HOLDING, SUBSIDIARY AND ASSOCIATE COMPANIES –
Sr. No.
Name And Address Of The Company CIN / GLN Holding/ Subsidiary/ Associate
% Of Shares
Held
Applicable Section
1 Welspun Tradings Limited, India U72200GJ2001PLC039513 Subsidiary 100% 2(87)(ii)
2 Welspun Pipes Inc, U.S.A Not Applicable Subsidiary 100% 2(87)(ii)
3 Welspun Tubular LLC, U.S.A Not Applicable Subsidiary 100% 2(87)(ii)
4 Welspun Global Trade LLC, U.S.A Not Applicable Subsidiary 100% 2(87)(ii)
5 Welspun Middle East DMCC, Dubai Not Applicable Subsidiary 100% 2(87)(ii)
6 Welspun Middle East Pipes LLC, Saudi Arabia Not Applicable Subsidiary 50.01.% 2(87)(ii)
7 Welspun Middle East Pipe Coating LLC, Saudi Arabia Not Applicable Subsidiary 50.01% 2(87)(ii)
8 Welspun Mauritius Holdings Limited, Mauritius Not Applicable Subsidiary 89.98% 2(87)(ii)
9 Welspun Wasco Coatings Private Limited, India U28290GJ2015PTC084632 Subsidiary 51% 2(87)(ii)
Form No. MGT-9EXTRACT OF ANNUAL RETURN
As on the financial year ended on March 31, 2018[Pursuant to section 92(3) of the Companies Act, 2013 and rule 12(1) of the Companies
(Management and Administration) Rules, 2014]
Annexure - 4

70
IV. SHARE HOLDING PATTERN (equity share capital break-up as percentage of Total Equity).i. Category-wise share holding
Sr. No.
Category of Shareholder No. of shares held at the beginning of the year No. of shares held at the end of the year
% change during
the year
Number of shares held in
dematerialized form
Number of shares
held in Physical
form
Total number
of shares
% of total
shares
Number of shares held in
dematerialized form
Number of shares
held in Physical
form
Total number
of shares
% of total
shares
(A) Shareholding of Promoter and Promoter Group
1 Indian
(a)Individuals/ Hindu Undivided Family
342 - 342 - 342 - 342 - -
(b)Central Government/ State Government(s)
- - - - - - - - -
(c) Bodies Corporate 115,682,823 - 115,682,823 43.62 121,682,823 - 121,682,823 45.88 2.26%(d) Financial Institutions/ Banks - - - - - - - - -(e) Any Others(Specify) - - - - - - - - -
Sub Total(A)(1) 115,683,165 - 115,683,165 43.62 121,683,165 - 121,683,165 45.88 2.26%2 Foreign
(a)Individuals (Non-Residents Individuals/Foreign Individuals)
- - - - - - - - -
(b) Bodies Corporate 6,300,000 - 6,300,000 2.38 6,300,000 - 6,300,000 2.38 -(c) Other individual - - - - - - - - -(d) Qualified Foreign Investor - - - - - - - - -(e) Any Others(Specify) - - - - - - - - -
Sub Total(A)(2) 6,300,000 - 6,300,000 2.38 6,300,000 - 6,300,000 2.38 Nil
Total Shareholding of Promoter and Promoter Group (A)= (A)(1)+(A)(2)
121,983,165 - 121,983,165 46.00 127,983,165 - 127,983,165 48.25 2.25%
(B) Public shareholding
1 Institutions
(a) Mutual Funds/ UTI 3,411,491 - 3,411,491 1.29 - - - - (1.29%)
(b)Financial Institutions / Banks
21,966,594 - 21,966,594 8.28 21,124,737 - 21,124,737 7.96 (0.32%)
(c)Central Government/ State Government(s)
- - - - 129,505 - 129,505 0.05 0.05%
(d) Venture Capital Funds - - - - - - - - -
(e) Insurance Companies 270,000 - 270,000 0.10 270,000 - 270,000 0.10 -
(f)Foreign Institutional Investors
1,766,979 - 1,766,979 0.67 - - - - (0.67%)
(g)Foreign Venture Capital Investors
- - - - - - - - -
(h) Qualified Foreign Investor - - - - - - - - -
(i) Any Other (specify) - - - - - - - - -
i)Foreign Portfolio Investors 11,537,363 - 11,537,363 4.35 16,408,031 - 16,408,031 6.19 1.84%ii)Alternate Investment Funds
- - - - 708,328 - 708,328 0.27 0.27%
Sub-Total (B)(1) 38,952,427 - 38,952,427 14.69 38,640,601 - 38,640,601 14.57 (0.12)%
B 2 Non-institutions
(a) Bodies Corporate
(i) Indian 12,184,649 9,310 12,193,959 4.60 11,014,317 9,310 11,023,627 4.16 (0.44%)
(ii) Overseas 51,214,889 - 51,214,889 19.31 42,153,584 - 42,153,584 15.89 (3.42%)
(b) Individuals
IIndividual shareholders holding nominal share capital up to ` 1 lakh
15,953,444 380,391 16,333,835 6.16 19,195,764 297,534 19,493,298 7.34 1.18%

Annual Report 2017-18 Financial StatementsThe Welspun Corp Story Governance Reports
71
IIIndividual shareholders holding nominal share capital in excess of ` 1 lakh.
19,000,440 - 19,000,440 7.16 19,049,695 - 19,049,695 7.18 0.02%
(c) Qualified Foreign Investor - - - - -
(d) Any Other (specify) - - - -
(d-i) Unclaimed Shares 52,010 - 52,010 0.02 15,190 - 15,190 0.01 (0.01%)
(d-ii) Clearing member 2,617,645 - 2,617,645 0.99 676,587 - 676,587 0.26 (0.73%)
(d-iii) Non Resident Indians 534,556 53,970 588,526 0.22 4,054,919 53,970 4,108,889 1.55 1.33%
(d-iv) Hindu Undivided Family 2,289,213 - 2,289,213 0.86 2,067,780 - 2,067,780 0.78 (0.08%)
(d-v) Trust - - - - 13,693 - 13,693 0.01 0.01
(B) Sub-Total (B)(2) 103,846,846 443,671 104,290,517 39.32 98,241,529 360,814 98,602,343 37.18 (2.14%)
Total Public Shareholding (B)= (B)(1)+(B)(2)
142,799,273 443,671 143,242,944 54.00 136,882,130 360,814 137,242,944 51.75 (2.25%)
TOTAL (A)+(B) 264,782,438 443,671 265,226,109 100.00 264,865,295 360,814 265,226,109 100.00 -
(C) Shares held by Custodians and against which Depository Receipts have been issued
(1)Promoter and Promoter Group
- - - - - - - - -
(2) Public - - - - - - - - -
GRAND TOTAL (A)+(B)+(C) 264,777,373 448,736 265,226,109 100.00 264,865,295 360,814 265,226,109 100.00 -
ii. Shareholding of PromotersSl. No
Shareholder’s name Shareholding at the beginning of the year 2017 Shareholding at the end of the year 2018
No. of shares % of total shares of the
company
% of shares pledged /
encumbered to total shares
No. of Shares % of total shares of the
company
%of shares pledged /
encumbered to total shares
% change in shareholding
during the year
1 B.K.Goenka 140 0.00 Nil 140 0.00 Nil 0.00
2 R.R.Mandawewala 200 0.00 Nil 200 0.00 Nil 0.00
3 Dipali Goenka 2 0.00 Nil 2 0.00 Nil 0.00
4 B.K.Goenka Family Trust 5 0.00 Nil 5 0.00 Nil 0.00
5Welspun Investments and Commercials Ltd.
5,233,000 1.97 Nil 5,233,000 1.97 Nil 0.00
6MGN Agro Properties Private Limited
NA NA NA 6,000,000 2.26 Nil 2.26%
7 Welspun Pipes Limited 110,449,818 41.64 Nil 110,449,818 41.64 Nil 0.00
Total of Co-Promoters (A) 115,683,165 43.62 Nil 121,683,165 45.88 Nil 2.26
8 Intech Metals S. A. 6,300,000 2.38 Nil 6,300,000 2.38 Nil 0.00
Total of Co-Promoters (B) 6,300,000 2.38 Nil 6,300,000 2.38 Nil 0.00
Total of Promoters (A+B) 121,983,165 46.00 Nil 127,983,165 48.25 Nil 2.26
Sr. No.
Category of Shareholder No. of shares held at the beginning of the year No. of shares held at the end of the year
% change during
the year
Number of shares held in
dematerialized form
Number of shares
held in Physical
form
Total number
of shares
% of total
shares
Number of shares held in
dematerialized form
Number of shares
held in Physical
form
Total number
of shares
% of total
shares

72
iii. Change in Promoters’ shareholding
Sr. No
Shareholding at the beginning of the year
Cumulative shareholding during the year
No. of shares % of total shares of the company
No. of shares % of total shares of the
company
At the beginning of the year 121,983,165 46.00
Date-wise increase / decrease in promoters’ shareholding during the year specifying the reasons for increase / decrease (e.g. allotment / transfer / bonus / sweat equity etc.)
25.04.2017 acquired 6,000,000 equity shares from open
market
2.26% of then paid up share capital of the
Company
127,983,165 48.25
At the end of the year. 127,983,165 48.25
iv. Shareholding pattern of top ten shareholders (other than Directors, Promoters and Holders of GDRs and ADRs):
Sr No. Shareholding at the beginning of the year - 2017
Transactions during the year Cumulative Shareholding at the end of the year - 2018
Name & Type of TransactionNo.of
Shares Held% of
Total SharesDate of
TransactionNo. of
SharesNo of Shares Held
% of Total Shares
1 GRANELE LIMITED 28,188,889 10.63 28,188,889 10.63
Sale 25 Apr 2017 (6,411,305) 21,777,584 8.21
Sale 06 Jul 2017 (2,650,000) 19,127,584 7.21
AT THE END OF THE YEAR 19,127,584 7.21
2 INSIGHT SOLUTIONS LTD 23,026,000 8.68 - - 23,026,000 8.68
AT THE END OF THE YEAR 23,026,000 8.68
3LIFE INSURANCE CORPORATION OF INDIA
19,277,980 7.27 19,277,980 7.27
AT THE END OF THE YEAR 19,277,980 7.27
4 AKASH BHANSHALI 7,757,367 2.92 7,757,367 2.92
Purchase 05 Jan 2018 108,349 7,865,716 2.97
AT THE END OF THE YEAR 7,865,716 2.97
5 ALPANA S DANGI 4,393,412 1.66 4,393,412 1.66
Purchase 21 Apr 2017 1,498,904 5,892,316 2.22
Sale 12 Jan 2018 (464,000) 5,428,316 2.05
Sale 19 Jan 2018 (77,072) 5,351,224 2.02
AT THE END OF THE YEAR 5,351,224 2.02
6 JM FINANCIAL COMMTRADE LTD. - - - - - -
Purchase 05 Jan 2018 2,200,000 2,200,000 0.83
AT THE END OF THE YEAR 2,200,000 0.83
7 MENTOR CAPITAL LIMITED 4,348,700 1.64 4,348,700 1.64
Sale 07 Apr 2017 (259,508) 4,089,192 1.54
Purchase 21 Apr 2017 42 4,089,234 1.54
Purchase 12 May 2017 450,000 4,539,234 1.71
Purchase 19 May 2017 20,000 4,559,234 1.72
Purchase 23 Jun 2017 8,000 4,567,234 1.72
Purchase 07 Jul 2017 10,926 4,578,160 1.73
Purchase 25 Aug 2017 53,358 4,631,518 1.75
Purchase 15 Sep 2017 100,987 4,732,505 1.78
Sale 03 Nov 2017 (72,000) 4,660,955 1.76

Annual Report 2017-18 Financial StatementsThe Welspun Corp Story Governance Reports
73
Sr No. Shareholding at the beginning of the year - 2017
Transactions during the year Cumulative Shareholding at the end of the year - 2018
Name & Type of TransactionNo.of
Shares Held% of
Total SharesDate of
TransactionNo. of
SharesNo of Shares Held
% of Total Shares
Sale 15 Dec 2017 (61,400) 4,599,555 1.73
Sale 05 Jan 2018 (2,200,000) 2,399,555 0.90
Sale 12 Jan 2018 (960,000) 1,439,555 0.54
Purchase 23 Feb 2018 294,000 1,733,555 0.65
Purchase 09 Mar 2018 6,000 1,739,555 0.66
AT THE END OF THE YEAR 1,739,555 0.66
8 VANGUARD TOTAL INTERNATIONAL STOCK INDEX FUND
1,395,894 0.53 - - 1,395,894 0.53
Purchase 24 Nov 2017 99,600 1,495,494 0.56
Purchase 23 Feb 2018 42,385 1,537,879 0.58
Purchase 02 Mar 2018 132,421 1,670,300 0.63
AT THE END OF THE YEAR 1,670,300 0.63
9 VANGUARD EMERGING MARKETS STOCK INDEX FUND, A SERIES OF VANGUARD INTERNATIONAL EQUITY INDEX FUNDS
1,232,411 0.46 - - 1,232,411 0.46
Purchase 19 May 2017 35,433 1,267,844 0.48
Purchase 26 May 2017 137,998 1,405,842 0.53
Purchase 21 Jul 2017 82,106 1,487,948 0.56
Purchase 28 Jul 2017 180,283 1,668,231 0.63
AT THE END OF THE YEAR 1,668,231 0.63
10 K INDIA OPPORTUNITIES FUND LIMITED - CLASS G - - - - - -
Purchase - - 09 Jun 2017 211,449 211,449 0.08
Purchase 19 Jun 2017 86,873 298,322 0.11
Purchase 23 Jun 2017 52,458 350,780 0.13
Purchase 30 Jun 2017 50,409 401,189 0.15
Purchase 14 Jul 2017 49,138 450,327 0.17
Purchase 21 Jul 2017 450,862 901,189 0.34
Purchase 01 Sep 2017 479,315 1,380,504 0.52
Purchase 08 Sep 2017 212,685 1,593,189 0.60
AT THE END OF THE YEAR 1,593,189 0.60
v. Shareholding of Directors and Key Managerial Personnel :
S. No.
Name of the Director/KMP Shareholding at the beginning of the year
Date-wise increase / decrease in
shareholding during the year specifying
the reasons for increase / decrease
(e.g. allotment / transfer / bonus / sweat equity etc.).
Cumulative shareholding during
the year.
At the end of the year (or on the date of
separation, if separated during the year)
No. of shares
% of total shares of the
company
No. of shares
% of total shares of the
company
No. of shares
% of total shares of the
company
Directors
1 B.K.Goenka 140 0.00 - 140 0.00 140 0.00
2 Atul Desai 200 0.00 - 200 0.00 200 0.00
3 Desh Raj Dogra - - - - - - -
4 K.H.Viswanathan - - - - - - -

74
5 Mintoo Bhandari - - - - - - -
6 Rajkumar Jain - - - - - - -
7 Rajesh Mandawewala 200 0.00 - 200 0.00 200 0.00
8 Ramgopal Sharma 2,100 0.00 - 2,100 0.00 2,100 0.00
9 Revathy Ashok - - - - - - -
10 S Krishnan@ 12,000 0.00 - - - 12,000 0.00
11 Utsav Baijal - - - - - - -
12 Vipul Mathur@ 11,000 0.00 - - - 11,000 0.00
13 Lalitkumar Naik# - - - - - NA NA
Key Managerial Personnel
14 Pradeep Joshi-CS 1 0.00 - 1 0.00 1 0.00
@ appointed with effect from December 1, 2017
#Ceased to be a director with effect from November 30, 2017
V. INDEBTEDNESSIndebtedness of the Company including interest outstanding / accrued but not due for payment.
(`. in Million)
Secured loans
excluding deposits
Unsecured loans
Deposits Total indebtedness
Indebtedness at the beginning of the financial yeari. Principal Amount
ii. Interest due but not paid
iii. Interest accrued but not due
12,632.90
-
262.15
-
-
-
-
-
-
12,632.90
-
262.15
Total (i+ii+iii) 12,895.05 - - 12,895.05
change in indebtedness during the financial year.
2,500
8,209.84
-
-
-
-
2,500
8,209.84
Net change 5,709.84 - - 5,709.84
Indebtedness at the end of the financial yeari. Principal Amount
ii. Interest due but not paid
iii. Interest accrued but not due
6,960.91
-
128.89
-
-
-
-
-
-
6,960.91
-
128.89
Total (i+ii+iii) 7,089.80 - - 7,089.80
S. No.
Name of the Director/KMP Shareholding at the beginning of the year
Date-wise increase / decrease in
shareholding during the year specifying
the reasons for increase / decrease
(e.g. allotment / transfer / bonus / sweat equity etc.).
Cumulative shareholding during
the year.
At the end of the year (or on the date of
separation, if separated during the year)
No. of shares
% of total shares of the
company
No. of shares
% of total shares of the
company
No. of shares
% of total shares of the
company

Annual Report 2017-18 Financial StatementsThe Welspun Corp Story Governance Reports
75
VI. REMUNERATION OF DIRECTORS AND KEY MANAGERIAL PERSONNEL.A. Remuneration to Managing Director, Whole-Time Directors and/or Manager
(`. in Million)
Sr. No.
Particulars of RemunerationName of the
Managing Director@
Name of the Managing Director
& CEO$
Name of the Executive Director
& CFO and CEO (PCMD)#
Mr. Lalitkumar Naik Mr. Vipul Mathur Mr. S.Krishnan
1 Gross Salary
a) Salary as per provisions contained in section 17(1) of the Income Tax Act 1961.
31.02 15.00(%) 10.00(%)
b) Value of perquisites u/s. 17(2) of the Income Tax Act, 1961
Nil Nil Nil
c) Profits in lieu of salary under section 17(3) of the Income Tax Act, 1961
Nil Nil Nil
2 Stock Option Nil Nil Nil
3 Sweat equity Nil Nil Nil
4Commission
Nil Nil Nil(As % of profit)
5 Others, please specify Nil Nil Nil
Total (A) 31.02 15.00 10.00
Ceiling as per the Act. In terms of the amendment dated September 12, 2016 in the Schedule V to the Companies Act, 2013, ceiling on remuneration to the Managerial Personnel shall not apply as the Managing Director & CEO and the ED and CFO & CEO (PCMD) falls under the category of persons exempted from the limit on remuneration without seeking Central Government’s approval.
@ Managing Director & CEO up to November 30, 2017$ Managing Director & CEO with effect from December 1, 2017# Executive Director & CEO (PCMD) with effect from December 1, 2017 % Includes unpaid variable component as well
B. Remuneration to other directors(`. in Million)
Sr. No.
Particulars of RemunerationName of Directors Total amount
AD DRD KHV RKJ RGS RA
1 Independent Directors
Fee for attending board & committee meetings
0.21 0.23 0.95 0.88 0.66 0.11 3.04
Commission - - - - - - -
Others, please specify - - - - - - -
Total (1) 0.21 0.23 0.95 0.88 0.66 0.11 3.04

76
Sr. No.
Particulars of RemunerationName of Directors Total amount
UB BKG RRM MB
2Other Non-Executive Directors
Fee for attending board - committee meetings
Nil Nil Nil 0.34 0.34
Commission - 27.99* - - 27.99
Others, please specify - - - - -
Total (2) Nil 27.99 Nil 0.34 28.33
Total (B) = (1 + 2) 31.37
Total Managerial Remuneration
87.39
Overall Ceiling as per the Act.
1% of the Net profits of the Company (exclusive of any fees payable to directors for attending meetings of the Board or Committee thereof provided that the amount of such fees does not exceed Rupees One lakh per meeting of the Board or committee thereof.)
* Commission for FY 2016-17 paid during FY 2017-18.
AD – Atul Desai MB – Mintoo Bhandari
BKG – Balkrishan Goenka RKJ – Rajkumar Jain
DRD – Desh Raj Dogra RRM – Rajesh Mandawewala
KHV – K.H.Viswanathan RGS – Ramgopal Sharma
RA- Revathy Ashok UB – Utsav Baijal
C. REMUNERATION TO KEY MANAGERIAL PERSONNEL OTHER THAN MANAGING DIRECTOR / MANAGER / WHOLE-TIME DIRECTOR.
(`. In million)
Sr. No.
Particulars of Remuneration
Key Managerial Personnel
CEO*Company Secretary
CFO$ Total
1 Gross Salary
15.00 4.00 28.30 47.30a) Salary as per provisions contained in section 17(1) of the Income Tax Act, 1961
b) Value of perquisites u/s. 17(2) of the Income Tax Act, 1961
N.A 0.03 Nil 0.03
c) Profits in lieu of salary under section 17(3) of the Income Tax Act, 1961
N.A. Nil Nil Nil
2 Stock Option N.A. Nil Nil Nil
3 Sweat Equity N.A. Nil Nil Nil
4
Commission
N.A.Nil Nil Nil- As % of profit
- Others, specify (Variable pay)
5 Others, please specify (variable pay) N.A. Nil Nil Nil
Total 15.00 4.03 28.30 47.33
* The Managing Director is also the CEO of the Company. Remuneration is for the period from 01.12.2017 to 31.03.2018
$ The CFO has been elevated as the Executive Director & CFO and CEO (PCMD) with effect from December 1, 2017. The remuneration is for
the period from 01.04.2017 to 31.03.2018.

Annual Report 2017-18 Financial StatementsThe Welspun Corp Story Governance Reports
77
VII. PENALTIES / PUNISHMENT / COMPOUNDING OF OFFENCES
Type Section of the
Companies Act
Brief Description
Details of penalty /
punishment / compounding fees imposed
Authority [RD / NCLT /
COURT]
Appeal made, if any
(give details)
A. COMPANY
Penalty/ Punishment / Compounding None
B. DIRECTORS
Penalty/ Punishment / Compounding None
C. OTHER OFFICERS IN DEFAULT
Penalty/ Punishment / Compounding None

78
1. A brief outline of the Company’s CSR Policy, including overview of projects or programs proposed to be undertaken and a reference to the web-link to the CSR Policy and projects or programs.
The Company is not only committed to comply-ing with regulations relating to Corporate Social Responsibility but also aims at creating Corporate Social value. The CSR vision is enshrined in the 3E’s i.e.: (i) Education; (ii) Empowerment of women; and (iii) Environment and Health.
These 3E’s are implemented through:
Foundation for Health and Knowledge created by the group;
/ Developmental Agencies / Institutions; and
The Company’s CSR Policy is disclosed on the website of the Company, a web-link of which is as under:
Corporate Social Responsibility (CSR)
c. Manner in which the amount spent during the financial year is detailed below:(`. In lakhs)
Sr No.
CSR Project or activity identified
Sector in which the project is covered
Projects or programs (Location)
Amount Outlay
(Budget) project or
programs wise
Amount spent on the projects or programs
(Sub-heads: (1) Direct expenditure on projects or
programs (2) Overheads)
Cumulative expenditure.
up to the date reporting
period
Amount spent : Direct
or through implementing
agency
1 Infrastructure and administrative support to schools
Promoting Education
Gujarat/ District Kutch/Anjar
- 9.62 9.62 Implementing agency
2 Plantation of Trees/ Development of public garden
Ensuring environmental sustainability
Gujarat/ District Bharuch, Dahej
- 27.10 27.10 Implementing agency
3 Conducting Medical Camps
Promoting Health Care
Karnataka/ District Mandya
- 1.26 1.26 Implementing agency
4 Providing Food packets for flood relief
Disaster Relief Gujarat/ District Bharuch, Dahej
- 0.56 0.56 Implementing agency
5 Donation to various trusts
Empowerment of socially backward
Gujarat/ District Bharuch, Dahej
- 0.36 0.36 Implementing agency
Total 38.90 38.90
It is hereby confirmed by and on behalf of the Corporate Social Responsibility Committee that the implementation and monitoring of CSR Policy, is in compliance with CSR objectives and Policy of the Company.
For and on Behalf of the Board
Vipul MathurManaging Director & CEO DIN : 0007990476
Ram Gopal SharmaChairman of the CSR Committee DIN : 00026514
http://www.welspuncorp.com/system/downloads/attach-ments/000/000/075/original/WCL-CSR_Policy.pdf
2. The Composition of the CSR Committee.
The Committee comprises of 3 non-executive direc-tors as on the date of this Report, viz. 1) Mr. Ram Gopal Sharma – an Independent Director as the Chairman; 2) Mr. Balkrishan Goenka-Member; and 3) Mr. Rajesh Mandawewala-Member, Mr. Pradeep Joshi-Company Secretary acts as the Secretary to the Committee.
3. Average net profit / (loss) of the Company for last three financial years: ` 194.35 million.
4. Prescribed CSR Expenditure (two per cent of the amount as in item 3 above): `3.89 million.
5. Details of CSR spent during the financial year.
a. Total amount to be spent for the financial year: ` 3.89 million
b. Amount unspent, if any: Nil
Annexure - 5
[Pursuant to clause (o) of sub-section (3) of section 134 of the Act and Rule 9 of the Companies (Corporate Social Responsibility) Rules, 2014]

Annual Report 2017-18 Financial StatementsThe Welspun Corp Story Governance Reports
79
Form No. AOC-2 (Pursuant to clause (h) of sub-section (3) of section 134 of the Act and Rule 8(2) of the Companies
(Accounts) Rules, 2014)
Form for disclosure of particulars of contracts/arrangements entered into by the Company with related parties referred to in sub-section (1) of section 188 of the Companies Act, 2013 including certain arm’s length transactions under third proviso thereto.
1. Details of contracts or arrangements or transactions not at arm’s length basis: Not applicable
2. Details of material contracts or arrangement or transactions at arm’s length basis which are more than 10% of the total transactions of the same type:
Name(s) of the related party and nature of relationship
Duration of the contracts / arrangements/transactions
Salient terms of the contracts or arrangements or transactions including the value, if any
Date(s) of approval by
the Board
Amount paid as
advances, if any
Amount (`. Million)
1) Sale of goods
Welspun Tradings Limited Ongoing Based on transfer pricing guidelines
07.08.2014 Nil 23,733.62
Welspun Tubular LLC Ongoing Based on transfer pricing guidelines
07.08.2014 Nil 20.01
2) Interest Income
Welspun Wasco Coatings Private Limited
3 Equal installments after expiry of 3 years from end of quarter after last utilization
Based on transfer pricing guidelines
25.06.2015 Nil 35.51
3) Guarantee Commission received
Welspun Middle East Pipes LLC
5 Years Based on transfer pricing guidelines
30.06.2012 Nil 11.92
Welspun Pipes Inc. 5 Years Based on transfer pricing guidelines
25.10.2016 Nil 91.72
Welspun Wasco Coatings Private Limited
2 Years Based on transfer pricing guidelines
10.02.2017 Nil 1.89
4) Purchase of goods and services
Welspun Captive Power Generation Limited
Ongoing Based on transfer pricing guidelines
28.01.2015 Nil 592.41
5) Sale of Fixed Assets
Welspun Anjar SEZ Private Limited
One Time Based on transfer pricing guidelines
04.08.2017 Nil 35.31
6) Purchase of Fixed Assets
Welspun Tubular LLC One Time Based on transfer pricing guidelines
08.05.2017 Nil 3.38
7) Rent paid
Welspun Realty Private Limited
3 Years Based on transfer pricing guidelines
23.05.2016 Nil 53.03
8) Rent Received
Welspun Wasco Coatings Private Limited
10 Years Based on transfer pricing guidelines
21.07.2015 Nil 7.79
Annexure - 6

80
Name(s) of the related party and nature of relationship
Duration of the contracts / arrangements/transactions
Salient terms of the contracts or arrangements or transactions including the value, if any
Date(s) of approval by
the Board
Amount paid as
advances, if any
Amount (`. Million)
9) Loans, Deposits given
Welspun Wasco Coatings Private Limited
3 Equal installments after expiry of 3 years from end of quarter after last utilization
Based on transfer pricing guidelines
25.06.2015 Nil 98.04
Note : The above transactions are material as per SEBI Regulations,2015. Other transactions which are not material transactions but entered into in the ordinary course of business and on arm’s length basis are mentioned in the note no. 42 of the audited financial statements.
For and on behalf of the Board of Directors
Vipul Mathur
Managing Director & CEO
DIN : 0007990476
S. Krishnan
Date: May 2, 2018
Place: Mumbai
Executive Director & CFO and CEO (PCMD) DIN: 06829167

Annual Report 2017-18 Financial StatementsThe Welspun Corp Story Governance Reports
81
The composition and category of directors and relevant details relating to them are given below:
Name of the Director(s) CategoryBoard
Meetings Attended
during the Year
2017-18
Attendance at the Last AGM
No. of other Directorship(as last declared to the Company)
Member / Chairman in No. of Board/
Committees including other Companies (as
last declared to the Company)@
Number of Shares
in the CompanyPub. Pvt. Other Body
Corporate
1Mr. Balkrishan Goenka
NE, P 3/5 No 7 - 9 2M 140
2 Mr. Atul Desai NE, I 4/5 No 7 - - 5C, 3M 200
3 Mr. Desh Raj Dogra NE, I 4/5 No 8 4 - 3C, 3M -
4 Mr. K.H.Viswanathan NE, I 5/5 Yes 6 - - 3C, 5M -
5Mr. Mintoo Bhandari – Nominee of the Investor
NE, NI 4*/5 No - 3 - 4M -
6 Mr. Rajkumar Jain NE, I 5/5 Yes 4 1 - 2C, 2M -
7Mr. Ram Gopal Sharma
NE, I 2/5 No 7 1 - 4C, 5M 2,100
8Mr. Rajesh R. Mandawewala
NE, P 4/5 No 7 3 6 4M 200
9 Mrs. Revathy Ashok NE, I 1/5 Yes 9 2 - 2C, 5M -
10 Mr. S.Krishnan% E, NI 2/2 N.A. 1 - 4 - 12,000
11Mr. Utsav Baijal- Nominee of the Investor
NE, NI 1/5 No 1 2 - - -
12 Mr. Vipul Mathur% E, NI 2/2 N.A. 1 - 3 - 11,000
13 Mr. Lalitkumar Naik# E, NI 3/3 No 2 - 2 - -
@ Chairmanship/membership of the Audit Committee and the Share Transfer, Investors’ Grievance and Stakeholders’
Relationship Committee alone considered
# Ceased to be a director with effect from December 1, 2017
% Appointed with effect from December 1, 2017
* 1 meeting attended by the Observer.
Abbreviations:
P = Promoter, I = Independent, NI = Non Independent, E = Executive Director, NE = Non-Executive Director,
L = Lenders, C=Chairman, M=Member.
5 Meetings of the Board of Directors were held during the financial year 2017-18 on the following dates: 08.05.2017, 04.08.2017, 06.11.2017, 23.01.2018 and 08.02.2018.
I. PHILOSOPHY ON CORPORATE GOVERNANCE
The Board of Directors of the Company acts as a trustee and assumes fiduciary responsibility of protecting the interests of the Company, its members and other stakeholders. The Board supports the broad principles of Corporate Governance. In order to attain the highest-level of good Corporate Governance practice, the Board lays strong emphasis on transparency, accountability and integrity.
II. BOARD OF DIRECTORS
The Company’s Board comprises of mix of executive and non-executive directors with considerable experience and expertise across range of fields such as finance, accounts, legal and general management and business strategy. Except a nominee appointed by Insight Solutions Limited (an Investor) and the independent directors, all other directors are liable to retire by rotation as per the provisions of the Companies Act, 2013.
CORPORATE GOVERNANCE REPORT
Annexure - 7

82
In addition to the above, a meeting of the Independent Directors was held on March 26, 2018 pursuant to Section 149(8) read with Schedule V to the Companies Act, 2013 and Regulation 25(3) of the SEBI (Listing Obligations and Disclosure Requirements) Regulations, 2015. The said meeting was attended by Mr. Atul Desai, Mr. Desh Raj Dogra, Mr. K.H.Viswanathan, Mr. Rajkumar Jain, Mr. Ramgopal Sharma and Mrs. Revathy Ashok.
It is confirmed that there is no relationship between the directors inter-se.
III. AUDIT COMMITTEE
The Committee comprises of 4 non-executive directors having accounting and finance back-ground. A majority of them are independent with the Chairman being an independent director. The composition of the Committee and attendance of the members is given hereunder:
Name of the Member Member/ Chairman
Number of Meetings Attended
Mr. K.H.Viswanathan Chairman 13/13
Mr. Ram Gopal Sharma Member 11/13
Mr. Rajkumar Jain Member 13/13
Mr. Mintoo Bhandari Member 2*/13
* Appointed an observer to attend 11 meetings of the Committee.
The Company Secretary of the Company, Mr. Pradeep Joshi acts as the Secretary of the Committee.
13 Meetings of the Audit Committee were held during the financial year 2017-18 on following dates: 26.04.2017, 08.05.2017, 10.07.2017, 26.07.2017, 04.08.2017, 21.09.2017, 26.10.2017, 06.11.2017, 21.12.2017, 22.01.2018, 29.01.2018, 08.02.2018 and 29.03.2018.
None of recommendations made by the Audit Committee were rejected by the Board.
Terms of Reference: The terms of reference stipulated by the Board of Directors to the Audit Committee are as contained under Regulation 18 read with Part C of Schedule II of the SEBI (Listing Obligations and Disclosure Requirements) Regulations, 2015 and Section 177 of the Companies Act, 2013.
IV. DETAILS OF ESTABLISHMENT OF VIGIL MECHANISM FOR DIRECTORS AND EMPLOYEES.
The Company has a Whistle Blower Policy and Vigil Mechanism for its directors and employees and no personnel have been denied access to the Audit Committee Chairman.
V. NOMINATION AND REMUNERATION COMMITTEE.
The Committee comprises of 4 non-executive directors. A majority of them are independent with the Chairman being an independent director. The composition of the Committee and attendance of the members is given hereunder:
Name of the Member Member/ Chairman
Number of Meetings
Attended
Mr. Rajkumar Jain Chairman 4/4
Mr. Ram Gopal Sharma Member 4/4
Mr. K.H.Viswanathan Member 4/4
Mr. Mintoo Bhandari Member 3*/4
* Appointed an observer to attend 1 meeting of the Committee.
During the year under review, 4 meetings of the Committee were held on 26.04.2017, 23.05.2017, 26.07.2017 and 06.11.2017.
Terms of reference: To recommend appointment of, and remuneration to, Managerial Personnel and review thereof from time to time.
Composition of the Committee: The Committee comprises of 3 independent and non-executive directors and 1 non-independent and non-executive director as on date of this Report viz. Mr. Rajkumar Jain, Mr. K. H. Viswanathan, Mr. Ram Gopal Sharma and Mr. Mintoo Bhandari.
The salient features of the Nomination and Remuneration Policy (“policy”) is as under:
Appointment of Directors: The Committee identifies the person who qualifies to become directors and who may be appointed in senior management in accordance with the criteria as mentioned in the policy.

Annual Report 2017-18 Financial StatementsThe Welspun Corp Story Governance Reports
83
Remuneration of Directors, Key Managerial Personnel, senior management personnel:
The Committee shall consider top industry indicators, requirements of role, qualification and experience of candidate, expected contribution of executive to the profitability challenges specific to the Company and such other matters as the Committee may deem fit.
The Non-Executive directors shall not be eligible for any remuneration / commission, unless specifically approved by the Board of Directors on recommendation of the Nomination and Remuneration Committee and by the shareholders.
The Non- Executive Directors including independent directors may receive remuneration by way of fees for attending meetings of Board or Committee thereof.
Besides, the Committee shall take into consider-ation performance of the concerned executive as well as the Company, to the growth of business, profitability, company potentiality and critical role played / initiatives taken while considering pay hike / increment to the concerned executives.
The Policy is available on your Company’s web-site at: http://www.welspuncorp.com/system/downloads/attachments/000/000/423/orig-inal/Nomination_and_Remuneration_Policy.pdf?1524230602
VI. SHARE TRANSFER, INVESTORS’ GRIEVANCE AND STAKEHOLDERS’ RELATIONSHIP COMMITTEE.
The Share Transfer, Investors’ Grievance and Stake-holders’ Relationship Committee is in accordance with the Section 178 of the Companies Act, 2013 and the Regulation 20 of the SEBI (Listing Obli-gations and Disclosure Requirements) Regulations, 2015 to look into transfer of securities and redress investors’ complaints and to review the functioning of the investors grievance redressal system.
The Committee comprises of 4 non-executive di-rectors of which 1 is an independent director as on date of this Report viz. Mr. K.H.Viswanathan – Chair-man, Mr. B.K.Goenka, Mr. Rajesh R. Mandawewala and Mr. Mintoo Bhandari as members. The Chair-man of the Committee is an Independent Director.
Compliance Officer: Mr. Pradeep Joshi – Company Secretary.
Meetings of the Committee are planned to be held once in every fortnight or as and when required.
Number of Shareholders complaints / requests received during the year
During the financial year under review, total 7 (seven) shareholder’s complaints were received. Break-up and number of complaints received under different category is given hereunder:
Non Receipt of Share Certificate : Nil Non Receipt of Dividend : 3 Non receipt of Annual Report : 2 Others (SEBI) : 2 All the complaints/requests received during
the year under Report were resolved within the stipulated time to the satisfaction of the investors/shareholders and no complaints were pending for more than 15 days as on March 31, 2018. All the shares/debentures received for transfer/transmission were transferred / transmitted and no transfer was pending as at March 31, 2018.
VII. GENERAL BODY MEETINGS
The details of Annual General Meetings held and the special resolutions passed in the last three years are given hereunder:
1) At the 20th Annual General Meeting held on Monday, August 31, 2015 at 1:00 pm at Registered Office of the Company at Welspun City, Village Versamedi, Taluka Anjar, Dist. Kutch, Gujarat – 370110, following special resolutions were passed:
For alteration of Articles of Association to give effect to the changes warranted in the Schedule I to the Articles due to demerger of non-pipe business undertakings of the Company in to a separate company.
To borrow from time to time, by way of issue of securities including but not limited to secured/unsecured redeemable Non-convertible Debentures (NCDs) and/or Commercial Paper (CP) to be issued on Private Placement basis, in domestic and/or international market, in one or more series/tranches aggregating upto an amount not exceeding ` 500 crores during the period of 1 (one) year from the date of the Annual General Meeting.
2) At the 21st Annual General Meeting held on Thursday, September 29, 2016 at 11:30 am at Registered Office of the Company at Welspun City, Village Versamedi, Taluka Anjar, Dist. Kutch, Gujarat – 370110, following special resolutions were passed:

84
To borrow from time to time, by way of issue of securities including but not limited to secured/unsecured redeemable Non-convertible Debentures (NCDs) and/or Commercial Paper (CP) to be issued on Private Placement basis, in domestic and/or international market, in one or more series/tranches aggregating upto an amount not exceeding ` 1,500 crores ((including ̀ 500 crores approved at the Annual General Meeting held on 31.08.2015),during the period of 1 (one) year from the date of the Annual General Meeting.
For alteration of Articles of Association to increase the threshold for investment by the Investor (as defined in the Articles) from 14.99% to 19.70% approved at the Extra Ordinary General Meeting held on March 24, 2017.
3) At the 22nd Annual General Meeting held on Wednesday, September 20, 2017 at 10:00 am at Registered Office of the Company at Welspun City, Village Versamedi, Taluka Anjar, Dist. Kutch, Gujarat – 370110, following special resolutions were passed:
For appointment of Mr. Deshraj Dogra as an independent director.
To borrow from time to time, by way of issue of securities including but not limited to secured/unsecured redeemable Non-convertible Debentures (NCDs) to be issued on Private Placement basis, in domestic and/or international market, in one or more series/tranches aggregating upto an amount not exceeding ` 700 crores during the period of 1 (one) year from the date of the Annual General Meeting.
For payment of commission @1% of Net Profits of the Company as computed under Section 198 of the Companies Act, 2013 for a period of 5 years commencing from the financial year 2017-18 to Mr. Balkrishan Goenka, Non-Executive Chairman.
During the year under Report, no resolutions were passed through postal ballot.
VIII. DISCLOSUREa. Related Party Transactions For materially significant related party transactions,
refer Note No. 42 of Notes to Accounts annexed to the Financial Statement and Annexure 6 to the Directors’ Report.
The Company’s policy on dealing with Related Party Transactions as required under Regulation 23 of the SEBI (Listing Obligations and Disclosure Requirements) Regulations, 2015 is disclosed on the Company’s website and a web link thereto is as under:
http://www.welspuncorp.com/system/downloads/attachments/000/000/446/original/WCL_-_RPT_Policy_08.06.2018.pdf?1528984337
b. Disclosure Pursuant to Regulation 34(3) of the SEBI (LODR), 2015.
For disclosures pursuant to Regulation 34(3), refer Note No. 50 of Notes to the Accounts annexed to the Financial Statement.
c. Non-Compliance
There were no non-compliances by the Company and hence no penalties and strictures were imposed on the Company by the Stock Exchanges or SEBI or any statutory authority, on any matter related to capital market, during the last 3 years.
d. Policy for determining “material” subsidiaries.
The Company’s policy on determining material subsidiaries as required under Regulation 23 of the SEBI (Listing Obligations and Disclosure Requirements) Regulations, 2015 is disclosed on the Company’s website and a web link thereto is as under:
http://www.welspuncorp.com/system/downloads/attachments/000/000/144/original/WCL_-_RPT_Policy_12.03.2016.pdf?1457679267
e. Detail of compliance with mandatory requirement and adoption of the non-mandatory requirements of the Regulation 27 of the SEBI (Listing Obligations and Disclosure Requirements) Regulations, 2015.
The Company is in compliance with the mandato-ry requirements mentioned under Chapter IV of the SEBI (Listing Obligations and Disclosure Require-ments) Regulations, 2015 to the extent applicable and in addition, the Company adopted non-manda-tory requirement mentioned at (A) “The Board”, (C)

Annual Report 2017-18 Financial StatementsThe Welspun Corp Story Governance Reports
85
“Modified Opinion(s) in Audit Report”, (D) “Separate posts of chairperson and chief executive officer”; and (E) “Reporting of Internal Auditor” of Part “E” of Schedule II to the SEBI (Listing Obligations and Disclosure Re-quirements) Regulations, 2015.
f. Disclosure of commodity price risks and commodity hedging activities.
For the detail of commodity price risks and commodity hedging activities as required under Schedule V to the SEBI (Listing Obligations and Disclosure Requirements) Regulations, 2015, please refer the Management Discussion and Analysis.
IX. MEANS OF COMMUNICATION The quarterly, half-yearly and yearly financial results of the Company are sent out to the Stock Exchanges
immediately after they are approved by the Board. The Company published its un-audited/audited financial results in Kutch Mitra (Gujarati edition), and Financial Express (English Edition).
These results are simultaneously posted on the website of the Company at www.welspuncorp.com. The official press release and the presentations made to the investors or to the analysts are also available on the website of the Company.
Month Share Price at BSE (in `)
Share Price at NSE (in `)
BSE Index
(Sensex)
Closing price of Share at
BSE (`)
NSE(S&P Nifty)
Closing price of Share at
NSE (`)High Low High Low
April – 2017 89.00 81.00 89.00 80.65 29,918.40 82.45 9,304.05 82.65
May-2017 96.75 81.10 96.80 81.10 31,145.80 86.10 9,621.25 86.35
June-2017 109.90 85.70 109.70 85.55 30,921.61 107.15 9,520.90 107.65
July-2017 134.45 103.30 134.40 103.10 32,514.94 129.50 10,077.10 129.25
August-2017 140.55 104.10 141.25 105.10 31,730.49 140.05 9,917.90 140.40
September-2017 145.80 120.70 146.00 120.50 31,283.72 132.00 9,788.60 132.30
October-2017 149.20 130.05 149.00 130.40 33,213.13 145.85 10,335.30 146.50
November-2017 165.70 126.50 165.50 127.05 33,149.35 128.00 10,226.55 128.15
December-2017 155.00 124.05 152.00 124.00 34,056.83 135.40 10,530.70 135.75
January-2018 197.00 134.95 197.15 135.00 35,965.02 160.40 11,027.70 159.95
February-2018 179.00 143.25 179.00 141.00 34,184.04 175.45 10,492.85 175.70
March-2018 179.90 121.15 179.95 120.80 32,968.68 134.60 10,113.70 134.90
X. GENERAL SHAREHOLDER INFORMATION 1. Annual General Meeting shall be held on Tuesday, August 14, 2018 at 2:30 p.m. at the Registered Office of
the Company at “Welspun City”, Village Versamedi, Taluka Anjar, Dist. Kutch, Gujarat - 370110.
2. Financial Year of the Company is 1st April to 31st March.
3. Date of Book Closure: Wednesday, June 27, 2018 to Friday, June 29, 2018 (both days inclusive).
4. Dividend payment date: Starting from Tuesday, August 14, 2018 and thereafter.
5. Listing on Stock Exchanges: The Equity Shares of the Company are listed on the National Stock Exchange of India Limited (NSE) and the BSE Limited, Mumbai (BSE). The Secured Redeemable Non-convertible Debentures are listed on the BSE Limited.
6. Stock Market price data, high and low price of equity shares on the BSE Ltd., Mumbai and the National Stock Exchange of India Limited and Performance in comparison to broad-based indices i.e. BSE - Sensex and NSE- S&P Nifty are as under:

86
7. The securities of the Company were not suspended from trading by any of the stock exchanges during the year under review.
8. Registrar and Transfer Agent: The Company has appointed Registrar and Transfer Agent to handle the share /debenture transfer / transmission work and to resolve the complaints of shareholders/ debenture holders. Name, address and telephone number of Registrar and Transfer Agent is given hereunder:
M/s. Link Intime India Private Limited (Formerly known as : Intime Spectrum Registry Limited)Unit : Welspun Corp LimitedC 101, 247 Park, L B S Marg, Vikhroli West, Mumbai-400 083 Tel No: +91 22 49186000, Fax: +91 22 49186060Email - [email protected]; [email protected]
12. Distribution of Shareholding:Shareholding Pattern as on March 31, 2018
Number of Shares No. of shareholders
Percentage of Shareholders
No. of Shares Percentage of Shares held
Upto – 500 46,303 80.86 5,003,017 1.89
501-1,000 4,798 8.3793 3,982,797 1.50
1,001-2,000 3,625 6.3308 4,970,459 1.87
2,001-3,000 901 1.5735 2,205,611 0.83
3,001-4,000 427 0.7457 1,498,615 0.57
4,001-5,000 303 0.5292 1,387,432 0.52
5,001-10,000 443 0.7737 3,292,610 1.24
10,001 and above 460 0.8034 242,885,568 91.58
Total 57,260 100.00 265,226,109 100.00
9. Debentures and Debenture Trustee The Secured Non-Convertible Debentures issued by the Company are listed on BSE Ltd. with the following
identification numbers:
BSE Scrip Code ISIN No.
946799 INE191B07071
948505 INE 191B07139
957462 INE 191B07147
Debenture Trustee:IDBI Trusteeship Services Limited, Asian Building, Ground Floor,17, R. Kamani Marg, Ballard Estate,Near Custom House, Mumbai-400 001.
10. Share / Debenture Transfer System: Our Registrar and Transfer Agent registers securities sent for transfer in physical form within 15 days from the receipt of the documents, if the same are found in order. Securities under objection are returned within two weeks.
11. De-materialization of shares and liquidity: As on March 31, 2018, 99.86% equity shares have been dematerialized and have reasonable liquidity on the BSE Limited and the National Stock Exchange of India Limited.

Annual Report 2017-18 Financial StatementsThe Welspun Corp Story Governance Reports
87
13. Outstanding Employee Stock Options & GDR, conversion date and likely impact on equity share capital is as under:
There are no outstanding stock options or GDR.
14. Disclosure of Shares held in suspense account under Clause F of Schedule V to the SEBI (Listing Obligations and Disclosure Requirements) Regulations, 2015.
Refer to point No. 9 (B) to the Directors’ Report.
15. Plant locations of the Company and its subsidiariesi) Pipe and Plate & Coil Mill Plant - Village Versamedi, Tal-Anjar, Dist.-Kutch, Gujarat – 370110ii) Pipe and Coating Plant - Village Jolva and Vadadla, Near Dahej, Tal: Vagra, Dist: Bharuch, Gujarat –
392130iii) Concrete Weight Coating Plant - Village Versamedi, Tal-Anjar, Dist.-Kutch, Gujarat – 370110 (Subsidiary’s
Plant in India)iv) Pipe Plant - KIADB Industrial Area, Gejjalagere, Taluka-Maddur, Dist.- Mandya, Karnataka -571428v) Pipe Coating, Double Jointing Plant - 9301 Frazier Pike, Little Rock, Arkansas 72205 (Subsidiary’s plant
in the US)vi) Pipe and Coating Plant - Industrial City-2, Dammam-31483, Kingdom of Saudi Arabia (Subsidiary’s plant
in the KSA).
16. Address for correspondence The Company Secretary, Welspun Corp Limited5th Floor, Welspun House,Kamala Mills Compound,Senapati Bapat Marg, Lower Parel (W), Mumbai - 400 013.
Tel: +91-22-66136000; +91-22-24908000, Fax: +91-22-24908020 /21e-mail: [email protected]

88
CERTIFICATE OF PRACTICING COMPANY SECRETARY ON COMPLIANCE WITH THE CONDITIONS OF CORPORATE GOVERNANCE
[Under Regulation 34(3) read with Schedule V(E) of the Securities and Exchange Board of India (Listing Obligations and Disclosure Requirements) Regulations, 2015]
To, The MembersWelspun Corp Limited
We have examined the compliance of conditions of Corporate Governance by Welspun Corp Limited (the Company), for the year ended on March 31, 2018, as stipulated in regulations 17 to 27 and clauses (b) to (i) of regulation 46(2) and para C, D and E of Schedule V of the Securities and Exchange Board of India (Listing Obligations and Disclosure Requirements) Regulations, 2015, of the said Company. We have obtained all the information and explanations which to the best of our knowledge and belief were necessary for the purpose of certification.
The compliance of the conditions of Corporate Governance is the responsibility of Management. Our examination was limited to procedures and implementation thereof, adopted by the Company for ensuring the compliance of the conditions of Corporate Governance. It is neither an audit nor an expression of opinion on the financial statements of the Company.
In our opinion and to the best of our information and according to the explanation given to us, we certify that the Company has complied with the conditions of Corporate Governance as stipulated in the applicable provisions of Securities and Exchange Board of India (Listing Obligations and Disclosure Requirements) Regulations, 2015.
We further state that such compliance is neither an assurance as to the future viability of the Company nor the efficiency or effectiveness with which the management has conducted the affairs of the Company.
For JMJA & Associates LLP
Practising Company Secretaries
CS Mansi Damania
Designated PartnerFCS: 7447 | COP: 8120
Place: MumbaiDate: May 2, 2018

Annual Report 2017-18 Financial StatementsThe Welspun Corp Story Governance Reports
89
Business Responsibility Report
Business responsibility at WCLWelspun Corp Limited manufactures line pipes for global oil & gas giants using the steel sourced from world class manufacturers. In addition to being the leading manufacturers of large diameter line pipes, we offer a one stop piping solutions to our esteemed customers worldwide. This unique position as a connecting link in the value chain, combined with the market volatilities in steel, ocean freight and currency create a highly vulnerable operating environment for us. It is therefore imperative for us to focus on sustainability as a strategic solution for ensuring business continuity.
For us, business responsibility is the coming together of several granular aspects that subsequently create a tremendous and long lasting positive impact on our stakeholders and operations. Over the last year, we focused on customer centricity, constructive collaboration, health, safety and environment, product quality, innovation and technology and inclusive growth.
Our visionDelight our customers through innovation and technology, achieve inclusive and sustainable growth to remain eminent in all our businesses.
Our MissionWe endeavour to achieve a leadership position in each Segment/Sector of our Products/Services.
We are committed to satisfying our customers by providing quality Products and Services, which give the highest value for money.
We believe that employees are our most important asset through which we can reach the top in each category of our products and services.
Therefore, we emphasise on their all-round development through organised training and workshops. We commit ourselves to continuous growth so as to fulfill the aspirations of our Customers, Employees and Shareholders.
We endeavor to reach the leadership position in each segment/sector of Steel Pipes, Casing, Tubing and Hot Pulled Induction bends with or without Anti – Corrosion Coating
What business responsibility means to us?
Working responsiblyAcross the organization, we strive to ensure highest levels of adherence to the principles trust, transparency, accountability and responsibility.
Inspiring a committed workforceOur robust human resource policies are aligned with our strategic goals to ensure that our people learn more, grow, develop and ultimately feel empowered within the organization.
Delivering value to our customersProduct quality and innovation has always been crucial to our success and we endeavour to learn from customer experiences while designing new products and improving existing ones.
Protecting the planetWe are committed to conducting our business activities in an environmentally responsible manner and we focus on reducing our environmental footprint across the value chain.
Creating healthy communitiesOur community impact interventions are carried out through Welspun Foundation for Health and Knowledge (WFHK), which is active wherever we have a business presence.
Collaborating with stakeholdersThrough regular formal and informal engagements, we develop mutually beneficial relationships with our stakeholders.

90
Awards
WCL Anjar won the ‘Platinum Award’ in the D.L. Shah Quality Award category from QCI for the project – ‘Case study on weld-ability testing’
WCL Anjar won the ‘5th Best Quality Systems Excellence Award’ in the large category for the manufacturing sector at the FICCI Quality Systems Excellence Awards for 2017.
WCL Mandya was awarded the Sir M. Visvesvaraya Manufacturing Excellence Award – 2017 by the Government of Karnataka
Welspun Foundation for Health and Knowledge was awarded for ‘Overall Excellence in CSR’ at the National Award for Excellence in CSR & Sustainability in September 2017

Annual Report 2017-18 Financial StatementsThe Welspun Corp Story Governance Reports
91
Working responsibly
Across the organization, we strive to ensure highest levels of adherence to the principles trust, transparency, accountability and responsibility.
We build trust with our stakeholders by committing to adhere to compliance, disclosure, responsible and ethical business conduct. Our approach to business responsibility is based on the principles of transparency and accountability.
Our governance structure has facilitated a high level of integration and cohesion across the systems and processes, enhancing our ability to seize opportunities and responding to emerging challenges.
Being transparent and accountableEthics and transparency are fundamental tenets of how we operate every day. As a responsible corporate citizen, we carry out all our business activities with utmost integrity. We have several policies in place which underline our commitment to ethical conduct in everything we do.
Our employees are required to comply with the Ethics and Compliance Policy and Procedure and the Code of Conduct for the Board of Directors and Senior Management. It forms a part of the HR manual and covers corporate responsibilities to employees and associates; basic ethics and code of conduct for employees and associates; responsibilities and obligations to all stakeholders; fair compensation; fair transactions; and responsibility towards the society, as well as the country.
WCL’s Ethics and Compliance Policy and Procedure is applicable to its business partners, vendors and contractors.
Risk managementWCL recognizes that risk management is of concern to all levels of the businesses; with this objective the Company had formulated structured Risk Management Policy to effectively address risks namely, strategic, business, regulatory and operational risks.
We continuously identify and assess environmental risk and opportunities, which are also integrated into WCL’s Enterprise Risk Management (ERM) framework. All our facilities are ISO 14001 and OSHAS 18000 certified and
have a robust environment management systems in place that ensures environment friendly operations.
We also get involve with our local communities on regular basis to develop conservation initiatives in order to mitigate risk.
Upholding human rightsHuman rights aspects relevant to our operations are covered under our Code of Conduct and Ethics Policy, Prevention of Sexual Harassment (POSH) Policy, Whistle-blower Policy and Human Resource related policies and practices. These policies ensure that human rights are not violated and there is zero tolerance for human rights violations at WCL.
We do not deal with any supplier/contractor if it is in violation of local laws pertaining to human rights and we do not employ any person below the age of 18. Use of forced or compulsory labour is prohibited at any of our units and we discourage the same with our suppliers and contractors.
The above policies apply to WCL and are extended to subsidiaries and business partners. Relevant policies are shared with our suppliers and contractors and they are expected to uphold human rights.
Occupational health and safetyAt Welspun, we imbibe a culture of safety that protects our employees as well as our contractors. Our company is accredited with OHSAS 18001 that manages risk associated to safety. Being a responsible corporate, we are committed to enable an environment that minimizes operational health and safety risks, and further improves our safety performance.
Our safety management systems enable us to minimize operational health and safety risks, and further improve our safety performance. We inculcate a culture of safety through trainings, tool boxes, talks and tasks. Employees, as well as contractors are made a part of the training and awareness sessions.
We provide the necessary Personal Protective Equipment (PPE) to employees and contract workers, and ensure regular checks are carried out to confirm adherence to safety standards. The medical centres at our factories ensure necessary care and treatment of all those onsite.

92
Safety performance EmployeesContractual workforce
Near misses 116 50
Reportable injuries 0 2
Lost days 6000 6006
Fatalities 1 1
Minor injuries 1 8
First aid cases 22 35
Total Manhours 4168568 3068052
Supply chain assessmentsOur value chain is mainly focused on midstream segment of transportation for oil & gas industry & water transmission value chain. We have SAP Enterprise, a web-enabled version to deploy web-related functionalities related to advance planning and optimization (APO), customer relationship management (CRM) and supply chain management (SCM) modules. With the use of SAP we are able to fine-tune our warehouse management by way of implementing warehouse management module in SAP, and eliminate data redundancy and inconsistency. Further, production planning will be further strengthened through the implementation of APO.

Annual Report 2017-18 Financial StatementsThe Welspun Corp Story Governance Reports
93
Delivering value to our customers
Product quality and innovation has always been crucial to our success and we endeavour to learn from customer experiences while designing new products or services and improving existing ones.Our strength is in the ability to customize our products and services to detailed product requirements and specifications based on the customer needs.
Building trust amongst our customers, through transparency and reliability, is crucial toward developing lasting collaborative relationships. We work closely with our customers to understand their needs, developing products that are aligned to their unique requirements, applications and specifications. Our facilities have the capacity and flexibility to meet the diverse needs of our global customer base.
Engineering excellenceAt WCL, quality is inbred and infused through design, to deliver results beyond mere product specifications. Our pledge towards continuous improvement and engineering excellence drives us to work toward exceeding minimum standards. It ensures consistency, increases productivity, reduces costs and enhances efficiency. Our commitment to quality is unparalleled and our facilities are accredited with international certifications including - APIQR, SPECQ1, ISO-9001, ISO/TS- 29001, AD 2000 MARKBLATT, HPOIEN / ISO 3834-3, ISO-14001, OHSAS-18001 and BIS, amongst others.
Customer focus and satisfactionWe believe that customer value is driven by means of customer satisfaction and confidence. Our success is defined by the way we ensure customer satisfaction, reliability and transparency in economic performance.
Through early interactions to discuss detailed product requirements, we ensure a close connect with our valued customers right from the beginning. Our engagement with customers commences from initial design and engineering stages, extending well beyond the execution and post-commissioning. We proactively obtain feedback from customers after a project is completed. This helps us understand areas where we excelled and consequently allows us to identify aspects where we can improve our performance.
The feedback received is analysed for assessment and quantified through a Customer Satisfaction Index. We also carry out audits by external agencies at our manufacturing facilities and review our Standard Operating Procedures (SOP’s) to ensure we are always on track to meet customer requirements.
Innovation and technologyAt WCL, we believe in redefining our capabilities and staying ahead in customers’ value proposition by investing in technology.
We have successfully implemented an Automatic Pipe Dimension Measurement System (APDMS) at Anjar-LSAW plant. This will allow automated measurement of pipe dimensions without human intervention.
We have also developed a facility to do End-Inside-Machining of heavy wall pipes for a prestigious global project which is a major technological achievement. Furthermore, we upgraded Anjar-LSAW and Saudi Mill to directly integrate quality data from various machines into the SAP system. We developed and implemented a unique system called COVASIS, which is a digital interface between testing processes.
We have further strengthened our value proposition by focusing on our Pipe Bending Technology and adding Concrete Weight Coating (CWC) to our product portfolio. Through a JV with Wasco Coatings Ltd., we have successfully setup offshore concrete weight coating facility near our pipe manufacturing plant at Anjar with a capability of concrete thickness up to 150 mm and 18 m long pipe. This will enable us to strengthen our customer offerings by optimizing costs and logistics to provide enhanced solutions at one location.
We are working towards the factory of the future with end-to-end plant automation where process and product data integration will be able to generate more artificial intelligence, predictability and traceability to increase precision and quality.
Quality as a key differentiatorWCL has an established quality management system. Our Research and Development technical team is focused on identifying opportunities to embed quality into the design of our processes and products. Our facilities are accredited with APIQR, SPECQ1, ISO-9001,

94
ISO/TS-29001, AD 2000- Markblatt, HPOIEN / ISO 3834-3, ISO-14001, OHSAS-18001 and BIS among other international certifications.
The foundation of any quality improvement is to develop a “quality culture” or mindset within the organization and integrate it throughout the company. At Welspun, quality control refers to the continuous monitoring at each and every stage of the production cycle to ultimately get a premium product.
To adhere to high quality standards- Total Quality Management (TQM) is practiced at each level of the manufacturing process, including administrative process supported by SAP. Right from selection of input materials to the final finished product, exact processes and techniques are followed to create perfect
well-tested products. Highly skilled professionals with strong in-house training and world-class best practices primarily adopted from Germany, ensure the highest quality standards.
WCL material procurement goes through trusted vendors on required quality standards and in line with applicable laws and regulations. We conduct periodic reviews & engage with the vendors through meetings, phone calls and emails to resolve queries and seek feedback. We proactively collaborate with competent vendors on new product developments by providing them technical assistance.
Furthermore, each of our manufacturing facilities is audited by The American Petroleum Institute (API).

Annual Report 2017-18 Financial StatementsThe Welspun Corp Story Governance Reports
95
Our robust human resource policies are aligned with our strategic goals to ensure that our people learn more, grow, develop and ultimately feel empowered within the organization.
As an equal opportunity employer, we respect the rights of our people, celebrate our differences and believe in meritocracy. To this end we have instituted a fair and an objective system to evaluate our people’s performance, ensuring that it is aligned with our broader strategic objectives and operational goals.
We are focused on building an effective organization that aims to deliver both strategic and operational excellence.
The Human Resources team at WCL focuses on building a stable but a dynamic organisation by adopting the core values embedded in our people, processes and practices. We have transformed our employee value proposition by augmenting key HR processes, namely – talent resourcing, employee engagement, competency development, performance management and recognition.
Empowering our peopleOur HR operating model is continuously evolving to institutionalize people policies and practices with the aim of being an employer of choice to attract and retain the best talent.
During FY 2017-18, we further tried to strengthen our Human Resources Management System (HRMS) implementation with digitization of almost all HR processes in a structured and systematic manner, which includes processes such as: Succession Planning, Career Development, Learning, Analytics & Compensation
At WCL, we have leveraged the best technology solutions available to streamline our HR process. We have successfully implemented Success Factors (SF), a premier cloud based Human Resource Information System, across the entire spectrum of human resource management.
The HR transformation team is responsible for benchmarking the maturity of our HR practices as well as identifying the future roadmap to ensure we keep attracting, engaging and retaining the best talent by enhancing the employee friendliness of our HR policies.
A major highlight in the year was rolling out a new grading structure across all locations in India. The exercise, based on Hay Group’s Job Evaluation methodology, has helped Welspun Corp flatten the organizational structure from 21 levels to just 12 levels. The intent behind the exercise is to bring in more accountability into various levels through clearly defined work profiles and de-layering of decision making.
Recruitment and retentionWhile our focus on recruitment and on-boarding remains strong, the reach of our comprehensive on-boarding program has been increased to include blue collar employees as well. With an intent to bring in inclusiveness within the organisation, the workers are put through a three-day induction program consisting of Group values, mission & vision, policies and practices.
To ensure strong talent pipeline and enhanced career growth, this year we have started grooming our High Potential employees through a combined approach of job enrichment, functional and behavioural capability development. The approach includes a perfect blend of job rotations, leadership development programs and focused technical programs. On the other end of the spectrum, we are boosting our capability by strengthening our talent in-take at the bottom most levels. This will help us in self-sustaining talent pipeline in the future.
Valuing our peopleWe value the contribution of all our employees and acknowledge that the success of our business is directly linked to their efforts and performance.
We have transparent processes to evaluate the existing talent pool at WCL in a defined and scientific manner, through interventions such as the 360 feedback mechanisms and Leadership Potential Assessments. We have conducted an Employers Survey which has helped gather insights which are used to develop a roadmap towards continuous improvement. We have a rewards program with market-linked increments designed to recognize employees that make distinguished contributions.
On employee compensation and benefits, we continued our approach with market linked increments with provisions for special increments for critical talent and promotions.
Inspiring a committed workforce

96
Employee engagement and wellbeingWe understand the need for our employees to feel like they are part of something bigger and to be engaged and inspired every day when they get to work.
At WCL, we focus on maintaining a heathy work-life balance to promote employee wellbeing and include sociocultural activities like get-togethers, birthday celebrations, picnics, yoga, meditation, sports competitions, festival celebrations and community programmes.
This year we increased focus on employee connect by the senior management. There were programs such as Town Halls by the MD, Employee Connect (one on one) meetings with HR, “Chai pe Charcha” with BU Heads, Grievance Redressal meetings with the unit Heads etc. The programs drew a lot of attention from employees across levels, and the necessary corrective and preventive actions were initiated to tackle grievances and employee concerns.
Diversity and inclusionWe value diversity & aim to improve gender balance at all levels. At WCL, differences are valued and we believe that there is a lot to be gained from having a diverse workforce. As an employer, we provide equal employment opportunities for all staff regardless of race, colour, religion, gender, age, national origin or disability. The diverse knowledge, perspectives, experiences and working styles of our global workforce strengthens our business and helps us meet the needs of our consumers.
Training and developingOur approach to people management continually cultivates leadership qualities and encourages employees to learn and explore at all stages, to enable them to be the leaders of tomorrow. Learning is a vital part of our culture, and we believe that it is best achieved through observation, experimentation and reflection. At WCL, our training and development programme is aligned with the development needs of our people and our business goals
Some programme includes:
Performance through People:A programme designed to cater to the managerial needs of the first time managers. A perfect blend of Self-improvement & team-building skills, the program was widely accepted across locations.
Amongst others, this year we primarily focused on core technical training at the locations. We also undertook an entry-level skilling exercise for all the new joinees, which covered around 200 entry level employees.
Building on last years’ competency mapping and assessment, the training programs were designed and delivered across all the units during the second half of the year. The programs were formulated basis the competency gaps and training needs identified by the managers/HoDs. Also as a measure to enhance effectiveness of the training programs, the same has been part of the goal setting process for the upcoming year.

Annual Report 2017-18 Financial StatementsThe Welspun Corp Story Governance Reports
97
Energy Unit Total
Direct Energy GJ 2008170
Indirect Energy GJ 425316
GHG emissions Unit Total
Direct GHG emissionsTons of CO2 e 153040
Indirect GHG emissionsTons of CO2 e 113495
We have implemented extensive interventions to improve energy efficiency at Anjar and Dahej in FY 2017-18 cumulatively savings 3.947 GWh/year and avoided operational costs by INR 29.19 million/year.
The proactive maintenance of equipment and periodic energy audits has helped us identify and implement several energy conservation measures like installing VFDs, digital temperature controllers, retrofitting LED lights, replacing the use of furnace oil and LPG with natural gas, switching to efficient pumps, improvements in the HVAC etc.
Air emissions Unit Total
Suspended Particulate Matter
Metric tonnes 61.18
Oxides of SulphurMetric tonnes 20.08
Oxiders of NitrogenMetric tonnes 16.75
Material management, waste reduction and recyclingThrough we do not use any raw materials in the form of natural resources and most of our products are made from externally procured plates and coils, our bottom line is impacted by the dynamics of the steel market, energy prices and transportation costs. Therefore reducing waste across the value chain is crucial towards securing sustainability in the long run.
Optimization of materials and well planned wastage control & recycling measures are implemented at all facilities. There is virtually no or limited packaging used, given the nature of our products.
Protecting and conserving our environment is integral to our business philosophy and we are committed to conducting our business activities in ways that minimize our environmental footprint.
All our facilities have a robust environment management systems in place that ensures environment friendly production and we regularly engage with our local communities for developing conservation initiatives.
We believe that multiple strategic advantages can be realised by exploring initiatives to improve operational efficiency through several energy conservation and resource rationalization measures. We also conduct periodic audits and proactive maintenance of equipment to ensure that our operations maximize efficiency and minimize waste. Our environmental management protocols extend to our subsidiaries and cover our suppliers and contractors. This approach promotes continuous improvement towards sustainable production.
Furthermore, in line with the Government’s ‘Swachh Bharat Mission’, we initiated the ‘Swachh Welspun Abhiyan’ on 2nd October, 2014. The drive is our goal towards promoting better hygiene standards, waste management, environment management and sanitation systems across Welspun facilities.
Environment Management SystemsWe identify and assess environmental risk and opportunities, which are also integrated into WCL’s Enterprise Risk Management (ERM) framework.
We care about the environment and to ensure that we operate efficiently, all our facilities are ISO 14001 (Environment Management System) certified. By implementing robust management systems to track our environmental performance, we are able to identify areas for improvement across aspects such as material consumption, carbon emissions, air quality, waste use, waste and effluent discharges.
Energy management and optimizationAt WCL, we are committed to playing a role in the transition by developing more sustainable production processes, using energy more efficiently and reducing our carbon footprint.
Protecting the planet

98
Across our operations we adhere to the 3R approach (i.e. Reduce, Reuse, Recycle) and we regularly monitor the waste generated from our operations and identify areas for waste reduction, recycling and reuse. It is our constant endeavour to reduce waste generation in our operations and thereby reduce the load on landfill.
The hazardous waste generated at our Anjar unit has high calorific value and is therefore utilized for co-processing at nearby cement plant. This helps in reducing environmental risks related to waste disposal and conservation of natural resources.
At our corporate office, we have been promoting the recycling of PET bottles, which are collected and sent to Stree Mukti Sanghatana, a local women’s Self-Help Group for recycling. Additionally, we have been using recycled notepads in training centres which are made from paper waste generated from our corporate office. These initiatives are not only pro-environment but also have a social welfare approach ingrained into it.
Through targeted awareness campaigns we involve and encourage employees to reduce plastic consumption, water consumption and energy consumption through awareness.
Conserving waterWe do not have processes that are water intensive hence; our water withdrawal does not significantly impact any local water body. The water that we use in our operations is supplied from local municipalities and we regularly monitor our consumption patterns.
The offices use municipal supply water for daily consumption purposes like drinking, cleaning, flushing,
etc. The major industrial usage of water is for coating applications on line pipes. The waste water generated by our operations is reused to enable lesser consumption of fresh water.
Conserving Water Unit Total
Freshwater consumption KL 810996
Waste water generated KL 144454
While we acknowledge that our operations do not entail significant environmental impact, our investment in these initiatives reinforce our commitment to efficient utilization of natural resources wherever possible.
Environment protection and enhancementWe constantly review the environmental performance at our facilities using quality control equipment to ensure that they are well within regulatory limits. Regular monitoring reports are submitted to relevant regulatory authorities to communicate the performance of the company over set indicators.
As per the EIA studies conducted prior to the establishment of our facilities, none of the rare/ endangered / threatened flora and fauna species listed in the IUCN red list or National Conservation List were recorded around the vicinity of our plants.. Moreover there are no ecologically sensitive areas around any of our operations.
In keeping with our commitment to preserving and protecting the environment, we held plantation drives across our facilities. These drives were conducted with active participation of local community and stakeholders.

Annual Report 2017-18 Financial StatementsThe Welspun Corp Story Governance Reports
99
We strive to improve the quality of life of the communities in which we operate and our community impact interventions are carried out through Welspun Foundation for Health and Knowledge (WFHK).
Our corporate social responsibility (CSR) approach transcends the core pillars of sustainable development and is rooted in strengthening educational foundation, improving access to healthcare services, empowering people and conserving the environment.
Welspun impacts lives by working with our communities through a diverse range of social interventions that aimed at securing stable and sustainable futures. Our CSR activities are carried out through Welspun Foundation for Health and Knowledge (WFHK), which works across a diverse spectrum spanning sustainable livelihood, hygiene and sanitation, health, education and gender.
We have a corporate social responsibility (CSR) policy which is overseen by the CSR committee of the Board. In line with our CSR policy, we undertake activities that are aligned to schedule VII of Companies Act, 2013.
Social impact strategyWFHK engages with local stakeholders, through a consultative and collaborative approach to identify community needs and design programmes that engage, empower and inspire visionary futures.
Local stakeholder engagement is extremely important and in most of our project centres we have successfully managed to integrate with and develop mutually beneficial relationships with them through our social impact projects.
We take utmost care to integrate community investment considerations into decision-making and business practices and assist in local capacity building to develop mutually beneficial relationships with communities. Prior to the commencement of projects, we carry out a baseline study to assess the needs of the communities. Quantified targets are set for all projects and are monitored every quarter. Wherever necessary, midcourse corrections are carried out.
Focus areas and interventionsOur focus areas include:
Model villages:We aim to promote a modern vision for villages in India, where they are sustainable rural community that is able to generate and maintain the resources necessary to improve its level of wellbeing and happiness without depleting economic, social & environmental values. A ‘Model and Sustainable Village’ would provide communities with employment, while creating ancillary livelihood opportunities leveraging technologies and green growth opportunities. By 2020, we commit to working together with 20 villages to implement replicable smart solutions, that not only empower a better way of life, but also secure a healthier environment for residents by promoting greener living.
Women empowerment: Our focus has been on enabling women to create
alternative livelihoods and improve their earning capacities. Economic independence amongst women improves gender equality, advances their social status and increases civic participation. Vocational training and skills enhancement centers have been established to provide opportunities for women to learn and develop new skill sets such has garment making and sewing. Each training center is structured as a social enterprise and managed like a professional business with targets, quality standards and efficiency metrics.
Our project on sponsoring sportswomen across the country is one of the key focus areas under empowerment. The foundation financially supports 10 potential girls from various disciplines of sports, coming from challenging backgrounds and lends a hand in in making their dreams come true making our nation proud.
Another special project under empowerment is on women hygiene and sanitary pads. In order to empower village women by providing them with an opportunity to earn livelihood and ensuring
Creating healthy communities

100
100% usage of sanitary pads in rural communities of Gujarat, a sanitary pad making unit making 100% biodegradable napkins was set up in Vatar village near Vapi in May 2016. The unit is run by women Self-Help Group formed by Welspun named SETU. Our current reach is 4000 women in rural settings.
Many of the schools around our operations do not have modern amenities, are poorly equipped and lack infrastructure. This leads to poor teaching quality, increasing drop-out rates and sub-standard learning. Over the course of the next five years, by 2020, we plan to extend the reach of our digital education through project Gyankunj to 500 government primary schools of Gujarat. An MOU for the same is signed between Welspun Foundation and Government of Gujarat.
We are committed to promoting and protecting community health through a range of initiatives from delivering preventive healthcare services, improving community hygiene and sanitation, providing clean drinking water, awareness and blood donation drives, and improving the quality of healthcare infrastructure.
In order to curb malnutrition and anemia in 0-5 years children and reproductive age women, project Navchetna is initiated in total 15 villages of Anjar and Vapi. Through regular household visits, focused group discussions and monitoring height-weight, there has been a significant shift of the children from red belt (severely malnourished) to green belt. 130 children out of 152 (who were malnourished) are brought to green belt.
Over 5000 sanitation blocks have been constructed in Vapi and Anjar impacting more than 50 villages. A stark change in the openness towards the use of these facilities has been observed.
Recognizing concerns over climate change, we strive to reduce our environmental footprint and mitigate our emissions through tree plantation. Our tree plantation activities are designed for multiple benefits to the natural environment and our rural communities. We launched a campaign to provide villages with vegetable and fruit saplings. Residents are also encouraged to nurture saplings and plant them near their homes.
Project monitoring mechanisms Quarterly review meetings with the management includes updates on CSR initiatives, activities’ impact and strategies to achieve the target. Two Corporate Social Responsibility (CSR) Committee meetings are held in a Financial Year. A half yearly meeting of the committee is scheduled to review project progress across focus areas. A second CSR Committee meeting is called to consider the Auditor’s report of WFHK giving details of the project wise or program wise CSR eligible expenditure incurred by WFHK to ensure that the contribution being incurred is in alignment with the CSR activities as specified under Schedule VII to the Companies Act, 2013.
WFHK engages a third-party external consultant to carry out impact assessments of our corporate social responsibility projects

Annual Report 2017-18 Financial StatementsThe Welspun Corp Story Governance Reports
101
Understanding the stakeholders’ concerns and expectations is an essential part of WCL’s sustainability approach. Through regular formal and informal engagements, we develop mutually beneficial relationships with our stakeholders.
We firmly believe in an inclusive participatory approach that values the voices of our stakeholders.
Engaging with our stakeholders helps us establish and maintain an inclusive relationship with them. While the inputs from our stakeholders help us understand their needs and expectations, addressing their concerns help us to establish lasting partnerships based on trust.
Depending on the purpose of the engagement, we adopt appropriate practices to interact with them. Post the engagement, we endeavor to close the loop as we believe that this is the key to maintaining symbiotic relationships with our stakeholders.
Refer to the next page for a detailed table listing of our key stakeholder groups, modes of engagement, their key concerns and our responses.
Responsible policy advocacyWe believe that driving change and taking efforts towards effective policy development fosters industrial growth. WCL prefers to be a part of the policy
Collaborating with stakeholders
development process and hence, actively participates in all forms, but has not been lobbying on any specific issue.
We are a part of a number of associations that enable value addition to the pipe industry:
Bombay Chamber of Commerce and Industry (BCCI)
The Associated Chambers of Commerce and Industry
Engineering Export Promotion Council
Indian Merchants Chamber (IMC)
All India Management
Federation of Kutch Industries Associations (FOKIA).
Through our representation in the above mentioned bodies, we participate in relevant forums that are of interest to our industry and our stakeholders. All such engagements are done in line with our code of conduct.
As part of our stakeholder engagement process, we identified the following key stakeholder groups:
Stakeholder Group
Mode of Engagement & Activities
Key Concerns Our Responses
Investors
Quarterly investor meetings Economic value of the company
Collaborating with investors through various business forums
Presentations Sustainable wealth creation
Investor relation calls Risk management
Compliance and disclosures
Government andregulators
Engagement on a need basis ComplianceActive collaboration and participation with regulatory agencies
Participation in industry level consultation groups
Sustainable practices
Participation in forums Inclusive growth

102
Stakeholder Group
Mode of Engagement & Activities
Key Concerns Our Responses
Employees
Employee surveys Professional growth
HR initiatives to counsel, motivate and reward
employees.Committed to achieving the goal of 20% women in the
workforce by 2020
Team building workshops Diversity at the workplace
Capacity building and training
Leadership connect sessions
Annual appraisals Workplace safety
Employee newsletters Equal opportunities
Rewards and recognitions Work-life balance
Volunteering opportunities Wages and benefits
Business partners /
suppliers and contractors
Contract agreements Payment processing cycles
Technology enabled payment processing and
cloud based services
Direct interactions Business ethics
Supplier meets Transparency
Membership in industry associations
Compliance
Communities& NGO’s
Direct engagement Infrastructure development
Actively engaged by WFHK across areas such as education, healthcare, sanitation, environment
conservation and livelihoods
Dedicated CSR team Education & healthcare
CSR projects and initiatives Environmental protection
Visits and camps Employment opportunities
Community needs assessments
Human rights

Annual Report 2017-18 Financial StatementsThe Welspun Corp Story Governance Reports
103
SECTION A: GENERAL INFORMATION ABOUT THE COMPANY
Corporate
Identification Number
(CIN) of the Company
L27100GJ1995PLC025609
Name of the
CompanyWelspun Corp Limited (WCL)
Registered Address
Welspun City, Village Versamedi,
Taluka Anjar, District, Kutch, Gujarat
370 110, India
Website http://www.welspuncorp.com/
E-mail Idcompanysecretary_wcl@welspun.
com
Financial Year
reported2017-18
Sector(s) that the
Company is engaged
in
*Group Description
24311
Manufacture of tubes, pipes and hollow profiles and of tube or pipe fittings of cast-iron/cast-steel
List three key
products/services
that the Company
manufactures/
provides
1. Welded Pipes
2. Induction Bends
3. Pipe Coating Systems
Total number of locations where business activity is
undertaken by the Company
Number of
International
Locations
(Provide details of
major 5)
We have a presence across 5
locations internationally:
1. Houston, USA
2. Little Rock, USA
3. Dammam, Saudi Arabia
4. Dubai, UAE
5. Mauritius
Number of National
Locations
Our corporate office is located in
Mumbai, Liaison Office is in Delhi
and we have 3 plants in India at
Anjar, Dahej and Mandya
Markets served by
the Company - Local/
State/National/
International
National and International
SECTION B: FINANCIAL DETAILS OF THE COMPANY
1. Paid up Capital (INR) 1,326 million
2. Total Turnover (INR) 53,901 million
3.Total profit after taxes (INR)
1,258 million
4.
Total Spending on Corporate Social Responsibility (CSR) as percentage of average net profits (%)
During FY 2017-18, the Company was required under the Companies Act, 2013 to spend Rs. 3.89 million on CSR.
SECTION C: OTHER DETAILS
1. Does the Company have any Subsidiary Company/ Companies?
Yes, we have 9 subsidiaries. These include:
1. Welspun Pipes Inc.2. Welspun Tubular LCC3. Welspun Global Trade LCC4. Welspun Mauritius Holdings Limited5. Welspun Middle East Pipes LLC6. Welspun Middle East Pipes Coating LLC7. Welspun Wasco Coatings Private Limited8. Welspun Tradings Limited9. Welspun Middle East DMCC
2. Do the Subsidiary Company/Companies participate in the BR Initiatives of the parent company? If yes, then indicate the number of such subsidiary company(s)
The subsidiaries actively manage and carry out their own BR initiatives, which are in line with the policies of the Welspun Group.
3. Do any other entity/entities (e.g. suppliers, distributors etc.) that the Company does business with, participate in the BR initiatives of the Company? If yes, then indicate the percentage of such entity/entities? [ Less than 30%, 30-60%, More than 60%]
Currently, the suppliers/ vendors and distributors do not participate in our BR initiatives. However,
BRR index

104
we have shared our relevant policies with all our business partners and they are expected to adhere to them
SECTION D: BR INFORMATION
1) Details of Director/ Directors responsible for BR?
a) Details of the Director/ Directors responsible for implementation of the BR policy/policies
1. DIN Number 0007990476
2. Name Vipul Mathur
3. Designation Managing Director and CEO
b) Details of the BR head
1. DIN Number 0007990476
2. Name Vipul Mathur
3. Designation Managing Director and CEO
4. Telephone Number +91 22 6613 6000
5. Email Id [email protected]
The National Voluntary Guidelines on Social, Environment and Economic Responsibilities of Business (NVGs), released by the Ministry of Corporate Affairs, is composed of nine principles of Business Responsibility:
Principle 1Businesses shouldconduct and governthermeselves withethics, transparency and accountability
Principle 2Businesses shouldprovide goods and services that are safe and contribute to sustainability throughout their life cycle
Principle 3Businesses shouldpromote the wellbeing of all employees
Principle 4Businesses shouldrespect the interest of, and be responsive towards all stakeholders
Principle 5Businesses shouldrespect and promote human rights
Principle 6Businesses shouldrespect, protect, and make efforts to restore the environment
Principle 7Businesses, when engaged in influencing public and regulatory policy, should do so in a responsible manner
Principle 8Businesses shouldsupport inclusive growth and equitable development
Principle 9Businesses shouldengage with and provide vakye to their customers and consumers in a responsible manner

Annual Report 2017-18 Financial StatementsThe Welspun Corp Story Governance Reports
105
2) Principle-wise (as per NVGs) BR Policy/policies
No. Questions P1
P2
P3
P4
P5
P6
P7
P8
P9
1. Do you have policy/policies for#.... Y Y Y Y Y Y NA Y Y2. Has the policy being formulated in consultation with
the relevant stakeholders?Y Y Y Y Y Y NA Y Y
3. Does the policy confirm to any national/ international standards? If yes, specify?
Y Y Y Y Y Y NA Y Y
4. Has the policy being approved by the Board? If yes, has it been signed by the MD/owner/CEO/ appropriate Board Director?
Y N N N N N NA Y N
5. Does the Company have a specified committee of the Board/Director/Official to oversee the implementation of the policy?
Y N N N N N NA Y N
6.Indicate the link for the policy to be viewed online?*
All policies are shared directly with respective stakeholders. Some of our policies are available at http://www.welspuncorp.com/about#policies
7. Has the policy been formally communicated to all relevant internal and external stakeholders?
Y Y Y Y Y Y NA Y Y
8. Does the Company have in-house structure to implement the policy/policies?
Y Y Y Y Y Y NA Y Y
9. Does the Company have a grievance redressal mechanism related to the policy/policies to address stakeholders’ grievances related to the policy/ policies?
Y Y Y Y Y Y NA Y Y
10. Has the Company carried out independent audit/evaluation of the working of this policy by an internal or external agency?
N N N N N N NA N N
Notes: #WCL has the following policies covering the 9 principles: Code of Conduct and Ethics, Code of conduct for Board of Directors and Senior Management, Code of Conduct for Regulating, Monitoring and Reporting of Trading by Insider, Corporate Social Responsibility Policy, Human Resources Policy, Policy for Prevention, Prohibition and Redressal of Sexual Harassment to women at workplace, Whistle-blower Policy And Vigil Mechanism, Code of Practices and Procedures for Fair Disclosure of Unpublished Price Sensitive Information.*Our policies comply with all applicable local laws. They are also aligned with the principles of the National Voluntary Guidelines.
If answer to S. No. 1 against any principle, is ‘No’, please explain why:
No. Questions P
1
P
2
P
3
P
4
P
5
P
6
P
7
P
8
P
9
1. The Company has not understood the Principles
NA
2. The Company is not at a stage where it finds itself in
a position to formulate and implement the policies
on specified principles
3. The Company does not have financial or manpower
resources available for the task
4. It is planned to be done within next 6 months
5. It is planned to be done within the next 1 year
6. Any other reason (please specify)
3) Governance related to Business Responsibility
1. Indicate the frequency with which the Board of Directors, Committee of the Board or CEO to assess the BR performance of the Company.
The Board of Directors meets every quarter to discuss applicable BR issues and assess the BR performance of the Company.

106
2. Does the Company publish a BR or a Sustainability Report? What is the hyperlink for viewing this report? How frequently it is published?
This is our second Business Responsibility Report and we are committed to reporting on our BR activities annually.
SECTION E: PRINCIPLE-WISE PERFORMANCE
Principle 1
1. Does the policy relating to ethics, bribery and corruption cover only the company? Yes/ No. Does it extend to the Group/Joint Ventures/ Suppliers/ Contractors/NGOs / Others?
WCL’s Ethics and Compliance Policy and Procedure is applicable to its business partners, vendors and contractors.
Refer to chapter – ‘Working responsibly’
2. How many stakeholder complaints have been received in the past financial year and what percentage was satisfactorily resolved by the management?
In FY2017-18, seven complaints were received from shareholders/ investors and all of these were replied/ resolved to their satisfaction.
Also, there was no complaint reported by any Director or employee of the company under our vigil/whistle blower mechanism.
Complaints from external stakeholders like suppliers and contractors are raised directly to business teams and are addressed by them on a case by case basis.
Category
Complaints filed during the financial year
Complaints resolved during the financial year
Complaints pending as on end of the financial year
Shareholders and investors
7 7 Nil
Whistle-blower mechanism
Nil Nil Nil
Principle 2
1. List up to 3 of your products or services whose design has incorporated social or environmental concerns, risks and/or opportunities.
We do not use any raw materials in the form of natural resources and most of our products are made from externally procured plates and coils. Due to the type of product specifications and utilisation, we are bound by our customer’s guidelines on product development and therefore, it gives us limited scope for an alternative approach. However, the sustainability concerns at WCL are not just limited to being a responsible corporate, but is also considered as a business imperative. We believe that there are multiple strategic advantages that can be realised by exploring initiatives to improve operational efficiency through several energy conservation measures. We also conduct periodic audits and proactive maintenance of equipment to ensure that our operations maximize efficiency and minimize waste.
Refer to chapter – ‘Protecting the planet’
2. For each such product, provide the following details in respect of resource use (energy, water, raw material etc.) per unit of product (optional)
WCL has undertaken several initiatives for managing the amount of energy and water used across our operations.
Refer to chapter – ‘Protecting the planet’
3. Does the company have procedures in place for sustainable sourcing (including transportation)? If yes, what percentage of your inputs was sourced sustainably? Also, provide details thereof, in about 50 words or so.
WCL procures all of its materials from trusted vendors as per required quality and commercial standards in line with applicable laws and regulations. We conduct periodic reviews and audits of our vendor operations to ensure and enable the right quality standards in the materials purchased. Quality, health, safety and environment are the most significant aspects checked by us during vendor approval.
We also engage with the vendors through meetings,

Annual Report 2017-18 Financial StatementsThe Welspun Corp Story Governance Reports
107
3.Number of permanent women employees
42
4.Number of permanent employees with disabilities
9
5.
Do you have an employee association that is recognized by management?
Dahej plant has a recognized employee
union
6.
Percentage of your permanent employees is members of this recognized employee association?
100% of employees under the worker
category at the Dahej plant are members of a recognized employee
union
7.
Number of complaints relating to child labour, forced labour, involuntary labour, sexual harassment in the last financial year and pending, as on the end of the financial year
No. Category
Complaints filed
during the financial
year
Complaints pending
as on end of the
financial year
(i)Child labour/ forced labour/ involuntary labour
0 0
(ii) Sexual Harassment 0 0
(iii) Discrimination 0 0
8.Percentage of your under mentioned employees were given safety & skill up-gradation training in the last year?
Our approach to people management continually cultivates leadership qualities and encourages employees to learn and explore at all stages, to enable them to be the leaders of tomorrow. Learning is a vital part of our culture, and we believe that it is best achieved through observation, experimentation and reflection. At WCL, our training and development programme is aligned with the development needs of our people and our business goals. The total training hours for empolyees during the year was 33,156 hours.
H&S Training
CategoryTotal man-hours of safety training in
FY 2017-18
Employee 2870
Contractual labour 4688
phone calls and emails to resolve queries and seek feedback. We collaborate with competent vendors and provide them complete technical assistance for development of new products with enhanced quality parameters. We also share project requirements with our vendors in a transparent way to ensure timely delivery of products with the highest levels of quality and compliance.
4. Has the company taken any steps to procure goods and services from local & small producers, including communities surrounding their place of work? If yes, what steps have been taken to improve their capacity and capability of local and small vendors?
We acknowledge and promote local procurement for economic development of the region. However, the nature of the products sourced by us to service our international clientele leaves us with a minimal scope for local procurement. We also work with local businesses and generate productive local employment by hiring talent from near our locations to meet requirements for services like waste handling, housekeeping, logistics and machine operations.
5. Does the company have a mechanism to recycle products and waste? If yes what is the percentage of recycling of products and waste (separately as <5%, 5-10%, >10%)
While we have systems in place to recycle water, we are expanding our recycling capabilities. For waste management we adhere to the 3R and D system i.e. Reduce, Reuse, Recycle and Disposal. Across all our facilities, we regularly monitor the waste generated from our operations and identify areas for waste reduction, recycling and reuse. It is our constant endeavour to reduce waste generation in our operations and thereby reduce the load on landfill. Refer to chapter – ‘Protecting the planet’
Principle 3
1.
Total number of employees (incl .contractual)Total number of permanent employees
35462652
2.Total number of employees hired on temporary/contractual/ casual basis
894

108
Principle 6
1. Does the policy related to Principle 6 cover only the company or extends to the Group/Joint Ventures/ Suppliers/ Contractors/ NGOs/ others.
Yes. Refer chapter – ‘Protecting the planet’
Our approach to environmental management extends to our subsidiaries and covers our suppliers and contractors.
2. Does the company have strategies/ initiatives to address global environmental issues such as climate change, global warming, etc.?
Yes. Refer chapter – ‘Protecting the planet’
3. Does the company identify and assess potential environmental risks? Y/N
Yes. Environmental risk related to climate change, energy, waste & water management has been identified & necessary steps have been taken to mitigate them.
Refer chapter – ‘Protecting the planet’
4. Does the company have any project related to Clean Development Mechanism? If yes, whether any environmental compliance report is filed?
No, we do not have any projects related to Clean Development Mechanism.
5. Has the company undertaken any other initiatives on – clean technology, energy efficiency, renewable energy, etc.
Yes. We have taken several initiatives across our operations in areas related to energy efficiency, emissions management and water management.
Refer chapter – ‘Protecting the planet’
6. Are the Emissions/Waste generated by the company within the permissible limits given by CPCB/SPCB for the financial year being reported?
Yes, the emissions and waste generated were within permissible limits given by CPCB/SPCB.
7. Number of show cause/ legal notices received from CPCB/SPCB which are pending (i.e. not resolved to satisfaction) as on end of Financial Year.
Our factory in Anjar received two Show-Cause-
Principle 4 1. Has the company mapped its internal and
external stakeholders? Yes/No Yes. Refer to chapter – ‘Collaborating with
stakeholders’
2. Out of the above, has the company identified the disadvantaged, vulnerable & marginalized stakeholders?
Yes. Refer to chapter – ‘Collaborating with stakeholders’ and ‘Creating healthy communities’
3. Are there any special initiatives taken by the company to engage with the disadvantaged, vulnerable and marginalized stakeholders?
Yes. Refer to chapter– ‘Creating healthy communities’
Principle 5
1. Does the policy of the company on human rights cover only the company or extend to the Group/ JVs/ Suppliers/ Contractors/ NGOs/ Others?
Yes. Refer to chapter – ‘Working responsibly’
Our code of conduct promotes respect for human rights and we provide a free, fair and a discrimination free environment to our employees. We encourage our employees to raise any concern they may have and we have laid down procedures for addressing such concerns. Under our whistle blower policy, a fair and a transparent mechanism has been provided to report any violation to our code of conduct.
We do not deal with any supplier/contractor if it is in violation of local laws pertaining to human rights and we do not employ any person below the age of 18. Use of forced or compulsory labour is prohibited at any of our units and we discourage the same with our suppliers and contractors.
The above policies apply to WCL and are extended to subsidiaries and business partners. Relevant policies are shared with our suppliers and contractors and they are expected to uphold human rights.
2. How many stakeholder complaints have been received in the past financial year and what percent was satisfactorily resolved by the management?
There were no complaints regarding human rights in FY 2017-18.

Annual Report 2017-18 Financial StatementsThe Welspun Corp Story Governance Reports
109
Notices during the year and stand closed as on 31 March 2018
Principle 7
1. Is your company a member of any trade and chamber or association? If Yes, Name only those major ones that your business deals with.
Yes. Refer to chapter – ‘Collaborating with stakeholders’
2. Have you advocated/lobbied through above associations for the advancement or improvement of public good?
Yes. Refer to chapter – ‘Collaborating with stakeholders’
Through our representation in various bodies, we participate in relevant forums that are of interest to our industry and our stakeholders. All such engagements are done in line with our code of conduct.
Principle 8
1. Does the company have specified programmes/ initiatives/ projects in pursuit of the policy related to Principle 8? If yes, details thereof.
Yes. Refer to chapter– ‘Creating healthy communities’
2. Are the programmes/projects undertaken through in-house team/own foundation/external NGO/ government structures/any other organization?
Our social programmes are implemented through the Welspun Foundation for Health and Knowledge (WFHK), which is active wherever we have a business presence.
3. Have you done any impact assessment of your initiative?
Yes. WFHK engaged an external consultant to carry out impact assessments of our corporate social responsibility projects.
4. What is your company’s direct contribution to community development projects - Amount in INR and the details of the projects undertaken?
During FY 2017-18, WCL was required under the Companies Act, 2013 to spend Rs. 3.89 million on CSR.
5. Have you taken steps to ensure that this community development initiative is successfully adopted by the community? Please explain in 50 words, or so.
Refer to chapter– ‘Creating healthy communities’
Principle 9
1. What percentage of customer complaints/ consumer cases are pending as on the end of financial year.
There were no complaints received by the customers for FY 2017-18.
2. Does the company display product information on the product label, over and above what is mandated as per local laws? Yes/No/N.A. /Remarks (additional information)
Our industry is not governed by any regulations with respect to product labelling. Any relevant information with respect to our products and services is conveyed to the respective stakeholder.
3. Is there any case filed by any stakeholder against the company regarding unfair trade practices, irresponsible advertising and/or anti-competitive behaviour during the last five years and pending as on end of financial year?
There have been no cases filed against the company regarding unfair trade practices, irresponsible advertising and/or anti-competitive behaviour.
4. Did your company carry out any consumer survey/ consumer satisfaction trends?
Refer to ‘Delivering value to our customers’
Our engagement with customers begins from front end engineering stages and extends well beyond the execution and post-commissioning stages. We also religiously seek feedback from customers post completion of the project and carry out analysis for assessment of Customer Satisfaction Index.
Standalone Financial
Statements
28

Annual Report 2017-18 Financial StatementsThe Welspun Corp Story Governance Reports
111
Independent Auditors’ Report
To,
The Members, Welspun Corp Limited
Report on the Standalone Indian Accounting Standards (Ind AS) Financial Statements
1. We have audited the accompanying standalone financial statements of Welspun Corp Limited (the “Company”), which comprise the Balance Sheet as at March 31, 2018, the Statement of Profit and Loss (including Other Comprehensive income), the Cash Flow Statement and the Statement of Changes in Equity for the year then ended, and a summary of the significant accounting policies and other explanatory information.
Management’s Responsibility for the Standalone Ind AS Financial Statements
2. The Company’s Board of Directors is responsible for the matters stated in Section 134(5) of the Companies Act, 2013 (the “Act”) with respect to the preparation of these standalone Ind AS financial statements to give a true and fair view of the financial position, financial performance (including other comprehensive income), cash flows and changes in equity of the Company in accordance with the accounting principles generally accepted in India, including the Indian Accounting Standards specified in the Companies (Indian Accounting Standards) Rules, 2015 (as amended) under Section 133 of the Act. This responsibility also includes maintenance of adequate accounting records in accordance with the provisions of the Act for safeguarding of the assets of the Company and for preventing and detecting frauds and other irregularities; selection and application of appropriate accounting policies; making judgments and estimates that are reasonable and prudent; and design, implementation and maintenance of adequate internal financial controls, that were operating effectively for ensuring the accuracy and completeness of the accounting records, relevant to the preparation and presentation of the standalone Ind AS financial statements that give a true and fair view and are free from material misstatement, whether due to fraud or error.
Auditors’ Responsibility3. Our responsibility is to express an opinion on these
standalone Ind AS financial statements based on our audit.
4. We have taken into account the provisions of the
Act and the Rules made thereunder including the accounting and auditing standards and matters which are required to be included in the audit report under the provisions of the Act and the Rules made thereunder.
5. We conducted our audit of the standalone Ind AS financial statements in accordance with the Standards on Auditing specified under Section 143(10) of the Act and other applicable authoritative pronouncements issued by the Institute of Chartered Accountants of India. Those Standards and pronouncements require that we comply with ethical requirements and plan and perform the audit to obtain reasonable assurance about whether the standalone Ind AS financial statements are free from material misstatement.
6. An audit involves performing procedures to obtain audit evidence about the amounts and the disclosures in the standalone Ind AS financial statements. The procedures selected depend on the auditors’ judgment, including the assessment of the risks of material misstatement of the standalone Ind AS financial statements, whether due to fraud or error. In making those risk assessments, the auditor considers internal financial control relevant to the Company’s preparation of the standalone Ind AS financial statements that give a true and fair view, in order to design audit procedures that are appropriate in the circumstances. An audit also includes evaluating the appropriateness of the accounting policies used and the reasonableness of the accounting estimates made by the Company’s Directors, as well as evaluating the overall presentation of the standalone Ind AS financial statements.
7. We believe that the audit evidence we have obtained is sufficient and appropriate to provide a basis for our audit opinion on the standalone Ind AS financial statements.
Opinion8. In our opinion and to the best of our information
and according to the explanations given to us, the aforesaid standalone Ind AS financial statements give the information required by the Act in the manner so required and give a true and fair view in conformity with the accounting principles generally accepted in India, of the state of affairs of the Company as at March 31, 2018, and its total comprehensive income (comprising of profit and

112
other comprehensive income), its cash flows and changes in equity for the year ended on that date.
Report on Other Legal and Regulatory Requirements
9. As required by the Companies (Auditor’s Report) Order, 2016, issued by the Central Government of India in terms of sub-section (11) of section 143 of the Act (the “Order”), and on the basis of such checks of the books and records of the Company as we considered appropriate and according to the information and explanations given to us, we give in the Annexure B a statement on the matters specified in paragraphs 3 and 4 of the Order.
10. As required by Section 143 (3) of the Act, we report that:
(a) We have sought and obtained all the information and explanations which to the best of our knowledge and belief were necessary for the purposes of our audit.
(b) In our opinion, proper books of account as required by law have been kept by the Company so far as it appears from our examination of those books.
(c) The Balance Sheet, the Statement of Profit and Loss (including other comprehensive income), the Cash Flow Statement and the Statement of Changes in Equity dealt with by this Report are in agreement with the books of account.
(d) In our opinion, the aforesaid standalone Ind AS financial statements comply with the Indian Accounting Standards specified under Section 133 of the Act.
(e) On the basis of the written representations received from the directors as on March 31, 2018, taken on record by the Board of Directors, none of the directors is disqualified as on March 31, 2018 from being appointed as a director in terms of Section 164(2) of the Act.
(f) With respect to the adequacy of the internal financial controls with reference to financial statements of the Company and the operating effectiveness of such controls, refer to our separate Report in Annexure A.
(g) With respect to the other matters to be included in the Auditors’ Report in accordance with Rule 11 of the Companies (Audit and Auditors) Rules, 2014, in our opinion and to the best of our knowledge and belief and according to the information and explanations given to us:
i. The Company has disclosed the impact of pending litigations as at March 31, 2018 on its financial position in its standalone Ind AS financial statements – Refer Note 44.
ii. The Company has long-term contracts including derivative contracts as at March 31, 2018 for which there were no material foreseeable losses.
iii. There has been no delay in transferring amounts, required to be transferred, to the Investor Education and Protection Fund by the Company during the year ended March 31, 2018.
iv. The reporting on disclosures relating to Specified Bank Notes is not applicable to the Company for the year ended March 31, 2018.
For Price Waterhouse Chartered Accountants LLPFirm Registration No: 012754N / N500016
Mehul DesaiPartner
Membership Number : 103211Place: MumbaiDate: May 02, 2018

Annual Report 2017-18 Financial StatementsThe Welspun Corp Story Governance Reports
113
Report on the Internal Financial Controls under Clause (i) of Sub-section 3 of Section 143 of the Act1. We have audited the internal financial controls over
financial reporting of Welspun Corp Limited (the “Company”) as of March 31, 2018 in conjunction with our audit of the standalone financial statements of the Company for the year ended on that date.
Management’s Responsibility for Internal Financial Controls2. The Company’s management is responsible for
establishing and maintaining internal financial controls based on the internal control over financial reporting criteria established by the Company considering the essential components of internal control stated in the Guidance Note on Audit of Internal Financial Controls Over Financial Reporting issued by the Institute of Chartered Accountants of India (ICAI). These responsibilities include the design, implementation and maintenance of adequate internal financial controls that were operating effectively for ensuring the orderly and efficient conduct of its business, including adherence to company’s policies, the safeguarding of its assets, the prevention and detection of frauds and errors, the accuracy and completeness of the accounting records, and the timely preparation of reliable financial information, as required under the Act.
Auditors’ Responsibility3. Our responsibility is to express an opinion on the
Company’s internal financial controls over financial reporting based on our audit. We conducted our audit in accordance with the Guidance Note on Audit of Internal Financial Controls Over Financial Reporting (the “Guidance Note”) and the Standards on Auditing deemed to be prescribed under section 143(10) of the Act to the extent applicable to an audit of internal financial controls, both applicable to an audit of internal financial controls and both issued by the ICAI. Those Standards and the Guidance Note require that we comply with ethical requirements and plan and perform the audit to obtain reasonable assurance about whether adequate internal financial controls over financial reporting was established and maintained and if such controls operated effectively in all material respects.
4. Our audit involves performing procedures to obtain audit evidence about the adequacy of the internal financial controls system over financial reporting and their operating effectiveness. Our audit of internal financial controls over financial reporting included obtaining an understanding of internal financial controls over financial reporting, assessing the risk that a material weakness exists, and testing and evaluating the design and operating effectiveness of internal control based on the assessed risk. The procedures selected depend on the auditor’s judgement, including the assessment of the risks of material misstatement of the financial statements, whether due to fraud or error.
5. We believe that the audit evidence we have obtained is sufficient and appropriate to provide a basis for our audit opinion on the Company’s internal financial controls system over financial reporting.
Meaning of Internal Financial Controls Over Financial Reporting
6. A Company’s internal financial control over financial reporting is a process designed to provide reasonable assurance regarding the reliability of financial reporting and the preparation of financial statements for external purposes in accordance with generally accepted accounting principles. A Company’s internal financial control over financial reporting includes those policies and procedures that (1) pertain to the maintenance of records that, in reasonable detail, accurately and fairly reflect the transactions and dispositions of the assets of the Company; (2) provide reasonable assurance that transactions are recorded as necessary to permit preparation of financial statements in accordance with generally accepted accounting principles, and that receipts and expenditures of the Company are being made only in accordance with authorisations of management and directors of the Company; and (3) provide reasonable assurance regarding prevention or timely detection of unauthorised acquisition, use, or disposition of the company’s assets that could have a material effect on the financial statements.
Annexure A to Independent Auditors’ ReportReferred to in paragraph 10(f) of the Independent Auditors’ Report of even date to the members of Welspun Corp Limited on the standalone financial statements for the year ended March 31, 2018

114
Inherent Limitations of Internal Financial Controls Over Financial Reporting7. Because of the inherent limitations of internal
financial controls over financial reporting, including the possibility of collusion or improper management override of controls, material misstatements due to error or fraud may occur and not be detected. Also, projections of any evaluation of the internal financial controls over financial reporting to future periods are subject to the risk that the internal financial control over financial reporting may become inadequate because of changes in conditions, or that the degree of compliance with the policies or procedures may deteriorate.
Opinion8. In our opinion, the Company has, in all material
respects, an adequate internal financial controls
system over financial reporting and such internal financial controls over financial reporting were operating effectively as at March 31, 2018, based on the internal control over financial reporting criteria established by the Company considering the essential components of internal control stated in the Guidance Note on Audit of Internal Financial Controls Over Financial Reporting issued by the Institute of Chartered Accountants of India.
For Price Waterhouse Chartered Accountants LLP
Firm Registration Number: 012754N/N500016
Mehul DesaiPartner
Membership Number: 103211
MumbaiMay 02, 2018
Annexure A to Independent Auditors’ ReportReferred to in paragraph 10(f) of the Independent Auditors’ Report of even date to the members of Welspun Corp Limited on the standalone financial statements for the year ended March 31, 2018

Annual Report 2017-18 Financial StatementsThe Welspun Corp Story Governance Reports
115
Annexure B to Independent Auditors’ ReportReferred to in paragraph 9 of the Independent Auditors’ Report of even date to the members of Welspun Corp Limited on the standalone financial statements as of and for the year ended March 31, 2018
i. (a) The Company is maintaining proper records showing full particulars, including quantitative details and situation, of fixed assets.
(b) The fixed assets are physically verified by the Management according to a phased programme designed to cover all the items over a period of 3 years which, in our opinion, is reasonable having regard to the size of the Company and the nature of its assets. Pursuant to the programme, a portion of the fixed assets has been physically verified by the Management during the year and no material discrepancies have been noticed on such verification.
(c) The title deeds of immovable properties, as disclosed in Note 3 and Note 4 on fixed assets to the financial statements, are held in the name of the Company.
ii. The physical verification of inventory excluding stocks with third parties have been conducted at reasonable intervals by the Management during the year. In respect of inventory lying with third parties, these have substantially been confirmed by them. The discrepancies noticed on physical verification of inventory as compared to book records were not material.
iii. The Company has not granted any loans, secured or unsecured, to companies, firms, Limited Liability Partnerships or other parties covered in the register maintained under Section 189 of the Act. Therefore, the provisions of Clause 3(iii), (iii)(a), (iii)(b) and (iii)(c) of the said Order are not applicable to the Company.
iv. In our opinion, and according to the information and explanations given to us, the Company has complied with the provisions of Section 185 and 186 of the Companies Act, 2013 in respect of the
loans and investments made, and guarantees and security provided by it.
v. The Company has not accepted any deposits from the public within the meaning of Sections 73, 74, 75 and 76 of the Act and the Rules framed there under to the extent notified.
vi. Pursuant to the rules made by the Central Government of India, the Company is required to maintain cost records as specified under Section 148(1) of the Act in respect of its products. We have broadly reviewed the same, and are of the opinion that, prima facie, the prescribed accounts and records have been made and maintained. We have not, however, made a detailed examination of the records with a view to determine whether they are accurate or complete.
vii. (a) According to the information and explanations given to us and the records of the Company examined by us, in our opinion, the Company is generally regular in depositing undisputed statutory dues in respect of tax deducted at source, value added tax and service tax, though there has been a slight delay in a few cases, and is regular in depositing undisputed statutory dues, including provident fund, employees’ state insurance, duty of customs, duty of excise, cess, goods and service tax with effect from July 1, 2017 and other material statutory dues, as applicable, with the appropriate authorities.
(b) According to the information and explanations given to us and the records of the Company examined by us, the particulars of dues of income tax, sales tax/ value added tax, central sales tax, service tax, duty of customs, duty of excise as at March 31, 2018 which have not been deposited on account of a dispute, are as follows:

116
Annexure B to Independent Auditors’ ReportReferred to in paragraph 9 of the Independent Auditors’ Report of even date to the members of Welspun Corp Limited on the standalone financial statements as of and for the year ended March 31, 2018
Name of the statute Nature of dues
Amount (Rs. In Million)
Period to which the amount relates
Forum where the dispute is pending
Central Excise Act, 1944
Duty of Excise
0.09 FY 2003-04 High Court, Ahmedabad
254.80 FY 2005-06 to 2013-14
Custom Excise Service Tax Appellate Tribunal, Ahmedabad
93.89 FY 2013-14 Review Committee, Commissioner LTU, Mumbai
3.38 FY 2008-09 Commissioner (Appeals), Mumbai
Gujarat Sales Tax Act, 1969 and Gujarat Value Added Tax Act, 2003
Central Sales Tax
234.70 FY 2013-14 to 2015-16 Deputy Commissioner Appeals, Rajkot
5.82 FY 2008-09 t0 2012-13
Joint Commissioner of Commercial Tax Appeals, Vadodara
Gujarat Sales Tax Act, 1969 and Gujarat Value Added Tax Act, 2003
Sales Tax/ Value Added Tax
770.00 FY 2013-14 to 2015-16
Deputy Commissioner Appeals, Rajkot
122.30 FY 2006-07 to 2007-08
Deputy Commissioner Appeals, Rajkot
2.29 FY 1999-00 to 2006-07
Gujarat Commercial Tax Tribunal
64.53 FY 2007-08 to 2009-10
Joint Commissioner of Commercial Tax Appeals, Vadodara
Finance Act, 1994 Service Tax 1.12 FY 2013-14 Commissioner (Appeals) LTU, Mumbai
3.92 FY 2008-09 Commissioner Central Excise & Customs, Vadodara
0.60 FY 2013-14 Commissioner (Appeals), Surat
6.43 FY2009-10 to 2010-11
Custom Excise Service Tax Appellate Tribunal, Ahmedabad
Finance Act, 1994 Service Tax 1.18 FY 2012-13, FY 2014-15 to 2015-16
Custom Excise Service Tax Appellate Tribunal, Ahmedabad
6.13 FY 2005-06 to 2011-12
Additional Commissioner Central Excise & Customs, Vadodara
0.42 FY 2014-15 Assistant Commissioner Central Excise & Customs, Bharuch
0.11 FY 2008-09 to 2009-10
Deputy Commissioner Central Excise & Customs, Bharuch
1.09 FY 2011-12 to 2012-13
Joint Commissioner Central Excise & Customs, Vadodara
28.90 FY 2006-07 to 2010-11
Custom Excise Service Tax Appellate Tribunal, Mumbai
6.07 FY 2011-12 Commissioner of Central Excise & Service Tax, Mumbai
0.21 FY 2009-10 to 2010-11
Superintendent of Central Excise & Customs, Bharuch
1.69 FY 2015-16 Joint Commissioner LTU, Mumbai
1.74 FY 2013-14 High Court, Ahmedabad
10.57 FY 2013-14 Supreme Court, Delhi
10.27 FY 2004-05 to 2006-07
Supreme Court, Delhi
Annual Report 2017-18 Financial StatementsThe Welspun Corp Story Governance Reports
117
Name of the statute Nature of dues
Amount (Rs. In Million)
Period to which the amount relates
Forum where the dispute is pending
Custom Act, 1962 Duty of Customs
91.89 FY 2012-13 to 2013-14
Custom Excise Service Tax Appellate Tribunal, Ahmedabad
0.43 FY 2013-14 Additional Commissioner of Customs (Exports), Mumbai
Income Tax Act 1961 Income Tax 2.33 AY 2014-15 Commissioner of Income Tax (Appeals), Vadodara
6.23 AY 2010-11 to 2012-13
Income Tax Appellate Tribunal, Ahmedabad
viii. According to the records of the Company examined by us and the information and explanation given to us, the Company has not defaulted in repayment of loans or borrowings to any financial institution or bank or dues to debenture holders as at the balance sheet date. The Company does not have loans or borrowings from Government as at the balance sheet date.
ix. The Company has not raised any moneys by way of initial public offer, further public offer and term loans. In our opinion, and according to the information and explanations given to us, the moneys raised by way of debt instruments have been applied for the purposes for which they were obtained.
x. During the course of our examination of the books and records of the Company, carried out in accordance with the generally accepted auditing practices in India, and according to the information and explanations given to us, we have neither come across any instance of material fraud by the Company or on the Company by its officers or employees, noticed or reported during the year, nor have we been informed of any such case by the Management.
xi. The Company has paid/ provided for managerial remuneration in accordance with the requisite approvals mandated by the provisions of Section 197 read with Schedule V to the Act.
xii. As the Company is not a Nidhi Company and the Nidhi Rules, 2014 are not applicable to it, the provisions of Clause 3(xii) of the Order are not applicable to the Company.
xiii. The Company has entered into transactions with related parties in compliance with the provisions of Sections 177 and 188 of the Act. The details of such related party transactions have been disclosed in the financial statements as required under Indian Accounting Standard (Ind AS) 24, Related Party Disclosures specified under Section 133 of the Act.
xiv. The Company has not made any preferential allotment or private placement of shares or fully or partly convertible debentures during the year under review. Accordingly, the provisions of Clause 3(xiv) of the Order are not applicable to the Company.
xv. The Company has not entered into any non-cash transactions with its directors or persons connected with them. Accordingly, the provisions of Clause 3(xv) of the Order are not applicable to the Company.
xvi. The Company is not required to be registered under Section 45-IA of the Reserve Bank of India Act, 1934. Accordingly, the provisions of Clause 3(xvi) of the Order are not applicable to the Company.
For Price Waterhouse Chartered Accountants LLP Firm Registration Number: 012754N/N500016
Mehul DesaiMumbai PartnerMay 02, 2018 Membership Number: 103211
Annexure B to Independent Auditors’ ReportReferred to in paragraph 9 of the Independent Auditors’ Report of even date to the members of Welspun Corp Limited on the standalone financial statements as of and for the year ended March 31, 2018

118
Standalone Balance Sheetas at March 31, 2018
Notes As at March 31, 2018
As at March 31, 2017
ASSETS
Non-current assetsProperty, plant and equipment 3 21,851.34 23,627.12 Capital work-in-progress 3 121.49 242.49 Investment property 4 8.19 1.23 Intangible assets 5 118.97 71.68 Intangible assets under development 5 21.32 72.61 Equity investments in subsidiaries and joint venture 6 496.66 496.66 Financial assets Investments 7(a) 1,893.94 1,868.71 Loans 8(a) 354.11 256.07 Other financial assets 9(a) 110.86 282.09 Other non-current assets 10(a) 1,181.56 944.28
Total non-current assets 26,158.44 27,862.94
Current assetsInventories 11 10,201.56 13,270.28 Financial assets Investments 7(b) 3,283.71 5,018.64 Trade receivables 12 11,086.76 13,229.70 Cash and cash equivalents 13 1,295.27 519.03 Bank balances other than cash and cash equivalents 14 662.35 629.80 Loans 8(b) 5.62 5.98 Other financial assets 9(b) 582.08 505.42 Other current assets 10(b) 1,773.73 1,878.24 Assets classified as held for sale 15 6.00 6.00
Total current assets 28,897.08 35,063.09
Total assets 55,055.52 62,926.03
EQUITY AND LIABILITIES
EquityEquity share capital 16(a) 1,326.13 1,326.13 Other equityReserves and surplus 16(b) 17,819.83 16,671.84 Other reserves 16(c) 11.21 98.21
Total equity 19,157.17 18,096.18
LIABILITIESNon-current liabilitiesFinancial liabilities Borrowings 17(a) 6,048.46 11,725.00 Other financial liabilities 18(a) 1.49 - Provisions 19(a) 392.51 350.26 Deferred tax liabilities (net) 20 2,236.66 2,019.19 Government grants 21 3,649.58 3,653.64
Total non-current liabilities 12,328.70 17,748.09
Current liabilitiesFinancial liabilities Borrowings 17(b) 7.78 2,136.08 Trade payables 23 18,284.17 19,342.89 Other financial liabilities 18(b) 2,071.09 2,208.14 Provisions 19(b) 192.16 168.46 Government grants 21 463.35 414.66 Current tax liabilities (net) 24 1,661.32 803.64 Other current liabilities 22 889.78 2,007.89
Total current liabilities 23,569.65 27,081.76
Total liabilities 35,898.35 44,829.85
Total equity and liabilities 55,055.52 62,926.03
The above standalone balance sheet should be read in conjunction with the accompanying notes.This is the standalone balance sheet referred to in our report of even date.
For Price Waterhouse Chartered Accountants LLP For and on behalf of the Board
Firm Registration No: 012754N / N500016 Rajesh Mandawewala Vipul MathurDirector Managing Director and Chief Executive OfficerDIN: 00007179 DIN: 07990476
Mehul Desai S. Krishnan Pradeep JoshiPartner Executive Director and Company SecretaryMembership No. 103211 Chief Financial Officer and FCS-4959
CEO(PCMD)Place: Mumbai DIN: 06829167Date: May 02, 2018
(All amounts in Rupees million, unless otherwise stated)

Annual Report 2017-18 Financial StatementsThe Welspun Corp Story Governance Reports
119
(All amounts in Rupees million, unless otherwise stated)
Standalone Statement of Profit and Lossfor the year ended March 31, 2018
Notes Year ended March 31, 2018
Year ended March 31, 2017
Revenue from operations 25 50,020.10 42,628.14
Other operating revenue/ income 26 2,578.80 2,197.43
Other income 27 1,302.25 2,130.67
Total income 53,901.15 46,956.24
Expenses
Cost of materials consumed 28 40,728.63 28,453.42
Purchases of stock-in-trade 29 76.61 3,468.66
Changes in inventories of work-in progress and finished goods 30 (1,227.73) (384.90)
Excise duty 447.61 1,367.57
Employee benefit expense 31 1,799.36 1,845.19
Depreciation and amortisation expense 32 2,375.30 2,442.45
Other expenses 33 6,285.29 5,052.93
Finance costs 34 1,457.56 2,073.04
Total expenses 51,942.63 44,318.36
Profit before tax 1,958.52 2,637.88
Income tax expense 35
Current tax 1,063.00 418.10
Deferred tax (362.66) 473.77
Total income tax expense 700.34 891.87
Profit for the year (A) 1,258.18 1,746.01
Other Comprehensive Income
Items that may be reclassified to profit or loss
Deferred gains/ (losses) on cash flow hedges (net) (132.97) 71.98
Income tax relating to this item 45.97 (24.91)
(87.00) 47.07
Items that will not be reclassified to profit or loss
Remeasurements of post employment benefit obligations (16.74) (33.38)
Income tax relating to this item 5.79 11.57
(10.95) (21.81)
Other comprehensive income/(loss) for the year, net of tax (B) (97.95) 25.26
Total comprehensive income for the year (A+B) 1,160.23 1,771.27
Earnings per equity share:
Basic and diluted earnings per share (in Rupees) 52 4.74 6.58
The above standalone statement of profit and loss should be read in conjunction with the accompanying notes.
This is the standalone statement of profit and loss referred to in our report of even date.
For Price Waterhouse Chartered Accountants LLP For and on behalf of the Board
Firm Registration No: 012754N / N500016 Rajesh Mandawewala Vipul Mathur
Director Managing Director and Chief Executive Officer
DIN: 00007179 DIN: 07990476
Mehul Desai S. Krishnan Pradeep Joshi
Partner Executive Director and Company Secretary
Membership No. 103211 Chief Financial Officer and FCS-4959
CEO (PCMD)
Place: Mumbai DIN: 06829167Date: May 02, 2018

120
Standalone Statement of Cash Flow for the year ended March 31, 2018
(All amounts in Rupees million, unless otherwise stated)
Year ended March 31, 2018
Year ended March 31, 2017
A) Cash flow (used in)/ from operating activities
Profit before tax 1,958.52 2,637.88
Adjustments for:Depreciation and amortisation expense 2,375.30 2,442.45
(Gain)/ loss on disposal of property, plant and equipment (net) (27.69) 9.77
(Profit) on sale/ redemption of
Current investments (136.49) (161.36)
Non-current investments - 0.10
Fair valuation (gain)/ loss on investment (net) (26.02) 45.81
Allowance for doubtful debts (net) 1.46 (3.33)
Provision doubtful advances written back (15.38) -
Rental Expenses 21.12 21.10
Unwinding of discount on liabilities 50.12 46.90
Dividend income - (3.01)
Interest income and commission income (516.90) (816.94)
Interest expenses 906.40 1,938.25
Net exchange differences (unrealised) (183.00) 777.94
2,448.92 4,297.68
Operating profit before changes in operating assets and liabilities 4,407.44 6,935.56
Changes in operating assets and liabilitiesDecrease / (increase) in trade receivables 2,260.40 (5,046.43)
Decrease/ (increase) in inventories 3,068.72 (5,348.26)
(Increase)/ decrease in trade payables (1,084.28) 5,286.49
(Increase)/ decrease in other current liabilities (1,118.11) 162.15
Decrease in other non-current financial assets 213.05 12.45
(Increase)/ decrease in other current financial assets (90.99) 431.11
(Increase) in other non current assets (278.35) (3.26)
Decrease/ (increase) in other current assets 104.51 (380.82)
Increase/ (decrease) in other non-current financial Liabilities 1.49 (578.84)
(Decrease)/ increase in other current financial Liabilities (89.32) 707.90
Increase in provisions 49.21 53.84
Increase in government grants 44.63 98.14
Total changes in operating assets and liabilities 3,080.96 (4,605.53)
Cash flow from operations 7,488.40 2,330.03 Income taxes refund received (net of income taxes paid) 426.57 330.28
Net cash from operating activities (A) 7,914.97 2,660.31
B) Cash flow from investing activitiesPayments for property, plant and equipment (432.38) (901.98)
Proceeds from property, plant and equipment 38.34 13.87
Sale/ redemption of long-term investments in subsidiaries - 0.40
Proceeds from sale of current investments (net) 1,872.21 2,261.32
Proceeds from maturity of/ (investment in) fixed deposit (net) (53.33) 554.15
Interest and commission received 555.12 741.67
Dividend received - 3.01
Loan to joint venture, subsidiaries and other parties (98.04) (99.12)
Repayment of Loan from joint venture, subsidiaries and other parties 0.36 928.21
Net cash from investing activities (B) 1,882.28 3,501.53

Annual Report 2017-18 Financial StatementsThe Welspun Corp Story Governance Reports
121
Year ended March 31, 2018
Year ended March 31, 2017
C) Cash flow used in financing activitiesProceeds from issue of non-convertible debentures 2,500.00 -
Repurchase of non-convertible debentures (7,038.00) (3,000.00)
Repayment of long term borrowings (1,171.83) (1,243.47)
(Repayment)/ proceeds of/ from short term borrowings (net) (2,128.30) 408.20
Interest paid (1,022.41) (1,949.41)
Dividend paid (including dividend distribution tax) (160.47) (159.94)
Net cash used in financing activities (C) (9,021.01) (5,944.62)
Net increase in cash and cash equivalents (A+B+C) 776.24 217.22 Cash and cash equivalents at the beginning of the financial year 519.03 301.81
Cash and cash equivalents at the end of the year 1295.27 519.03
Net increase in cash and cash equivalents 776.24 217.22
The above standalone statement of cash flows should be read in conjunction with the accompanying notes.
This is the standalone statement of cash flows referred to in our report of even date.
For Price Waterhouse Chartered Accountants LLP For and on behalf of the Board
Firm Registration No: 012754N / N500016 Rajesh Mandawewala Vipul Mathur
Director Managing Director and Chief Executive Officer
DIN: 00007179 DIN: 07990476
Mehul Desai S. Krishnan Pradeep Joshi
Partner Executive Director and Company Secretary
Membership No. 103211 Chief Financial Officer and FCS-4959
CEO (PCMD)
Place: Mumbai DIN: 06829167Date: May 02, 2018
Standalone Statement of Cash Flow for the year ended March 31, 2018
(All amounts in Rupees million, unless otherwise stated)

122
Th
e a
bo
ve s
tan
dalo
ne s
tate
men
t o
f ch
an
ges
in e
qu
ity s
ho
uld
be r
ead
in
co
nju
ncti
on
wit
h t
he a
cco
mp
an
yin
g n
ote
s.T
his
is
the s
tan
dalo
ne s
tate
men
t o
f ch
an
ges
in e
qu
ity r
efe
rred
to
in
ou
r re
po
rt o
f even
date
.
Fo
r P
rice
Wate
rho
use
Ch
art
ere
d A
cco
un
tan
ts L
LP
Fo
r an
d o
n b
eh
alf
of
the
Bo
ard
Fir
m R
eg
istr
ati
on
No
: 0
1275
4N
/ N
50
00
16R
aje
sh M
an
daw
ew
ala
Vip
ul
Math
ur
Dir
ecto
rM
an
ag
ing
Dir
ecto
r an
d C
hie
f E
xecu
tive O
fficer
DIN
: 0
00
07
179
DIN
: 0
79
90
476
Me
hu
l D
esa
iS
. K
rish
nan
Pra
de
ep
Jo
shi
Part
ner
Execu
tive D
irecto
r an
d
Co
mp
an
y S
ecre
tary
Mem
bers
hip
No
. 10
3211
Ch
ief
Fin
an
cia
l O
fficer
an
dF
CS
-49
59
CE
O (
PC
MD
) P
lace: M
um
bai
DIN
: 06
829
167
Date
: M
ay 0
2, 20
18
A. E
qu
ity
sh
are
cap
ital
Part
icu
lars
No
tes
Am
ou
nt
Bala
nce
as
at
Ap
ril
01,
20
16 1
,32
6.1
3
Ch
an
ges
in e
qu
ity s
hare
cap
ital d
uri
ng
th
e y
ear
16(a
) -
B
ala
nce
as
at
Marc
h 3
1, 2
017
1,3
26
.13
C
han
ges
in e
qu
ity s
hare
cap
ital d
uri
ng
th
e y
ear
16(a
) -
B
ala
nce
as
at
Marc
h 3
1, 2
018
1,3
26
.13
Re
serv
es
an
d s
urp
lus
Oth
er
rese
rve
s
Se
cu
riti
es
pre
miu
m
rese
rve
De
be
ntu
re
red
em
pti
on
re
serv
e
Ge
ne
ral
rese
rve
Fo
reig
n c
urr
en
cy
mo
ne
tary
Ite
m
tran
slati
on
d
iffe
ren
ce
acco
un
t
Re
tain
ed
e
arn
ing
s
Tota
l re
serv
e a
nd
su
rplu
s
Cash
flo
w
he
dg
ing
re
serv
e
To
tal
oth
er
eq
uit
y
Bala
nce
as
at
Ap
ril
01,
20
16 7
,76
9.8
2
1,1
42
.37
5
3.0
9
(2
79
.42
) 6
,23
7.8
8
14
,92
3.7
4
51.
14
14
,974
.88
Pro
fit
for
the y
ear
-
-
-
-
1,7
46
.01
1,7
46
.01
-
1,7
46
.01
O
ther
co
mp
reh
en
sive in
co
me/(
loss
) -
-
-
-
(
21.
81)
(21.
81)
47.
07
25
.26
Tota
l co
mp
reh
en
sive
in
co
me
fo
r th
e y
ear
-
-
-
-
1,7
24
.20
1
,72
4.2
0
47.
07
1
,77
1.2
7
Mo
vem
en
t d
uri
ng
th
e y
ear
(net)
-
-
18
3.5
1 -
1
83
.51
-
18
3.5
1 M
ovem
en
t in
deb
en
ture
red
em
pti
on
rese
rve (
net)
-
50
0.7
3
-
-
(5
00
.73
) -
-
-
M
ovem
en
t in
gen
era
l re
serv
e -
-
1
74.6
0
-
(17
4.6
0)
-
-
-
Tra
nsa
cti
on
s w
ith
ow
ne
rs i
n t
he
ir c
ap
acit
y a
s o
wn
ers
:D
ivid
en
ds
paid
(in
clu
din
g d
ivid
en
d d
istr
ibu
tio
n t
ax)
-
-
-
-
(15
9.6
1) (
159
.61)
-
(15
9.6
1)
Bala
nce
as
at
Marc
h 3
1, 2
017
7,7
69
.82
1
,64
3.1
0
22
7.6
9
(9
5.9
1) 7
,12
7.14
1
6,6
71.
84
9
8.2
1 1
6,7
70
.05
Pro
fit
for
the y
ear
-
-
-
-
1,2
58
.18
1
,25
8.18
-
1
,25
8.18
Oth
er
co
mp
reh
en
sive in
co
me/(
loss
) -
-
-
-
(
10.9
5)
(10
.95
) (
87.
00
) (
97.
95
)
Tota
l co
mp
reh
en
sive
in
co
me
fo
r th
e y
ear
-
-
-
1,2
47.
23
1
,24
7.2
3
(8
7.0
0)
1,1
60
.23
M
ovem
en
t d
uri
ng
th
e y
ear
(net)
-
-
-
60
.37
-
60
.37
-
60
.37
Mo
vem
en
t in
deb
en
ture
red
em
pti
on
rese
rve (
net)
-
(1,13
7.26
) -
-
1
,137.
26
-
-
-
M
ovem
en
t in
gen
era
l re
serv
e -
-
1
25
.90
-
(
125
.90
) -
Tra
nsa
cti
on
s w
ith
ow
ne
rs i
n t
he
ir c
ap
acit
y a
s o
wn
ers
: -
-
D
ivid
en
ds
paid
(in
clu
din
g d
ivid
en
d d
istr
ibu
tio
n t
ax)
-
-
-
-
(15
9.6
1) (
159
.61)
-
(15
9.6
1)
Bala
nce
as
at
Marc
h 3
1, 2
018
7,7
69
.82
5
05
.84
3
53
.59
(
35
.54
) 9
,22
6.1
2
17,
819
.83
1
1.2
1 1
7,8
31.
04
Sta
nd
alo
ne
Sta
tem
en
t o
f C
han
ge
s in
Eq
uit
y
for
the
ye
ar
en
de
d M
arc
h 3
1, 2
018
(All
am
ou
nts
in
Ru
pees
mill
ion
, un
less
oth
erw
ise s
tate
d)

Notesannexed to and forming part of the standalone balance sheet as at March 31, 2018 and the standalone statement of profit and loss for the year ended March 31, 2018(All amounts in Rupees million, unless otherwise stated)
Annual Report 2017-18 Financial StatementsThe Welspun Corp Story Governance Reports
123
General Information Welspun Corp Limited (hereinafter referred to as “WCL” or “the Company”) is engaged in the business of Production and Coating of High Grade Submerged Arc Welded Pipes, Hot Rolled Steel Plates and Coils.
The Company is a public limited company which is listed on the Bombay Stock Exchange (BSE) and the National Stock Exchange (NSE) and is incorporated and domiciled in India. The address of its registered office is “Welspun City”, Village Versamedi, Tal. Anjar, Dist Kutch, Gujarat - 370110, India.
These financial statements were approved for issue by the board of directors on May 02, 2018.
Note 1: Significant Accounting PoliciesThis note provides a list of the significant accounting policies adopted in the preparation of these financial statements. These policies have been consistently applied to all the years presented, unless otherwise stated.
1.1 Basis of preparation of financial statements a) Compliance with Ind AS
The financial statements comply in all material aspects with Indian Accounting Standards (Ind AS) notified under Section 133 of the Companies Act, 2013 (the Act) [Companies (Indian Accounting Standards) Rules, 2015] and other relevant provisions of the Act.
b) Historical cost convention The financial statements have been prepared
on an accrual and going concern basis. The financial statements have been prepared on a historical cost basis, except for the following items:
Items Measurement basis
Certain financial assets and liabilities (including derivatives instruments)
Fair Value
Share based payment arrangements
Fair Value
Net defined benefit (asset)/ liability
Fair Value of plan assets less present value of defined benefit obligations
c) Current and non-current classification All assets and liabilities have been classified as
current or non-current as per the Company’s normal operating cycle (i.e 12 months) and other criteria set out in Schedule III (Division II) to the Act.
1.2 Foreign currency translationa) Functional and presentation currency
Items included in the financial statements of the Company are measured using the currency of the primary economic environment in which the Company operates (‘the functional currency’). The financial statements are presented in Indian rupee (INR), which is Company’s functional and presentation currency.
b) Transactions and balances Foreign currency transactions are translated
into the functional currency using the exchange rates at the dates of the transactions. Foreign exchange gains and losses resulting from the settlement of such transactions and from the translation of monetary assets and liabilities denominated in foreign currencies at year end exchange rates are generally recognised in profit or loss.
Foreign exchange differences regarded as an adjustment to borrowing costs are presented in the statement of profit and loss, within finance costs. All other foreign exchange gains and losses are presented in the statement of profit and loss on a net basis within other expenses or other income, as applicable.
Non-monetary items that are measured in terms of historical cost in a foreign currency are translated using the exchange rates at the date of initial transaction.
Non-monetary items that are measured at fair value in a foreign currency are translated using the exchange rates at the date when the fair value was determined. Translation differences on assets and liabilities carried at fair value are reported as part of the fair value gain or loss.
The Company has elected to apply the exemption from the transition date i.e. April 01, 2015 in respect of accounting policy followed

Notesannexed to and forming part of the standalone balance sheet as at March 31, 2018 and the standalone statement of profit and loss for the year ended March 31, 2018(All amounts in Rupees million, unless otherwise stated)
124
for long term foreign currency monetary items. Accordingly, long term foreign currency monetary items in the financial statement have been accounted in accordance with adopted under previous GAAP as given below:
Foreign exchange differences on account of depreciable assets are adjusted in the cost of depreciable assets and depreciated over the balance life of the assets.
In other cases, foreign exchange differences are accumulated in “Foreign Currency Monetary Item Translation Difference Account” and amortised over the balance period of such long term assets / liabilities.
1.3 Revenue recognition Revenue is measured at the fair value of the
consideration received or receivable. Amounts disclosed as revenue are inclusive of excise duty and net of returns, trade allowances, rebates, value added tax, good and service tax (GST) and amounts collected on behalf of third parties.
The Company recognizes revenue from sale of goods when:
the Company has transferred to the buyer the significant risk and reward of ownership of goods;
the Company retains neither continuing managerial involvement to the degree usually associated with the ownership nor effective control over the goods sold;
the amount of revenue can be reliably measured;
it is probable that future economic benefits associated with the transaction will flow to the Company; and
the cost incurred or to be incurred in respect of the transaction can be measured reliably.
The Company bases its estimates on historical results, taking into consideration the type of customer, the type of transaction and the specifics of each arrangement.
1.4 Segment reporting Operating segments are reported in a manner consistent
with the internal reporting provided to the chief operating decision maker. The Managing director and CEO of the Company assess the financial performance and position of the Company, and makes strategic decisions. The chief operating decision makers are Managing director and CEO of the Company (refer note 48).
1.5 Government grants Grants from the government are recognised at their
fair value where there is a reasonable assurance that the grant will be received and the Company will comply with all attached conditions.
Grants related to assets are government grants whose primary condition is that an entity qualifying for them should purchase, construct or otherwise acquire long-term assets. Grants related to income are government grants other than those related to assets.
Government grants relating to income are deferred and recognised in the profit or loss over the period necessary to match them with the costs that they are intended to compensate and presented either under “other operating revenue” or are deducted in reporting the related expense.
Government grants relating to the purchase of property, plant and equipment are included in liabilities as “Government grants” and are credited to profit or loss over the periods and in proportions in which depreciation expense on those assets is recognised.
1.6 Income tax, deferred tax and dividend distribution tax The Income tax expense or credit for the year
is the tax payable on the current year’s taxable income based on the applicable income tax rate adjusted by changes in deferred tax assets and liabilities attributable to temporary differences and to unused tax losses.
Current and deferred tax is recognised in the profit and loss except to the extent it relates to items recognised directly in equity or other comprehensive income, in which case it is recognised in equity or other comprehensive income respectively.

Notesannexed to and forming part of the standalone balance sheet as at March 31, 2018 and the standalone statement of profit and loss for the year ended March 31, 2018(All amounts in Rupees million, unless otherwise stated)
Annual Report 2017-18 Financial StatementsThe Welspun Corp Story Governance Reports
125
a) Current income tax Current tax charge is based on taxable profit
for the year. The tax rates and tax laws used to compute the amount are those that are enacted or substantively enacted, at the reporting date where the Company operates and generates taxable income. Management periodically evaluates positions taken in tax returns with respect to situations in which applicable tax regulation is subject to interpretation. It establishes provisions where appropriate on the basis of amounts expected to be paid to the tax authorities.
Current tax assets and tax liabilities are offset when there is a legally enforceable right to set off current tax assets against current tax liabilities and Company intends either to settle on a net basis, or to realise the asset and settle the liability simultaneously.
b) Deferred tax Deferred tax is provided using the liability method,
on temporary differences arising between the tax bases of assets and liabilities and their carrying amounts in the financial statements at the reporting date. Deferred tax is determined using tax rates that have been enacted or substantially enacted by the end of the reporting period and are expected to apply when the related deferred tax assets is realized or deferred tax liability is settled.
Deferred tax are recognised for all deductible temporary difference and unused tax losses only if it is probable that future taxable amounts will be available to utilise those temporary differences and losses.
Deferred income tax is not accounted for if it arises from initial recognition of an asset or liability in a transaction other than a business combination that at the time of the transaction affects neither accounting profit nor taxable profit (tax loss).
The carrying amount of deferred tax assets is reviewed at each reporting date and adjusted to reflect changes in probability that sufficient taxable profits will be available to allow all or part of the asset to be recovered.
Deferred income tax assets and liabilities are off-set against each other and the resultant net amount is presented in the Balance Sheet, if and only when, (a) the Company has a legally enforceable
right to set-off the current income tax assets and liabilities, and (b) the deferred income tax assets and liabilities relate to income tax levied by the same taxation authority.
Current and deferred tax is recognised in profit or loss, except to the extent that it relates to items recognised in other comprehensive income or directly in equity. In this case, the tax is also recognised in other comprehensive income or directly in equity, respectively
c) Dividend distribution tax Dividend distribution tax paid on the dividends
is recognised consistently with the presentation of the transaction that creates the income tax consequence. Dividend distribution tax is charged to statement of profit and loss if the dividend itself is charged to statement of profit and loss. If the dividend is recognised in equity, the presentation of dividend distribution tax is recognised in equity.
1.7 Leasesa) As a lessee Leases in which a significant portion of the risks
and rewards of ownership are not transferred to the company as lessee are classified as operating leases. Payments made under operating leases (net of any incentives received from the lessor) are charged to profit or loss on a straight-line basis over the period of the lease unless the payments are structured to increase in line with expected general inflation to compensate for the lessor’s expected inflationary cost increases.
b) As a lessor Lease income from operating leases where the
Company is a lessor is recognised in income on a straight-line basis over the lease term unless the receipts are structured to increase in line with expected general inflation to compensate for the expected inflationary cost increases. The respective leased assets are included in the balance sheet based on their nature.
1.8 Property, plant and equipment Freehold land is carried at historical cost. All other
items of property, plant and equipment are stated at historical cost less depreciation. Historical cost includes expenditure that is directly attributable to the acquisition of the items.
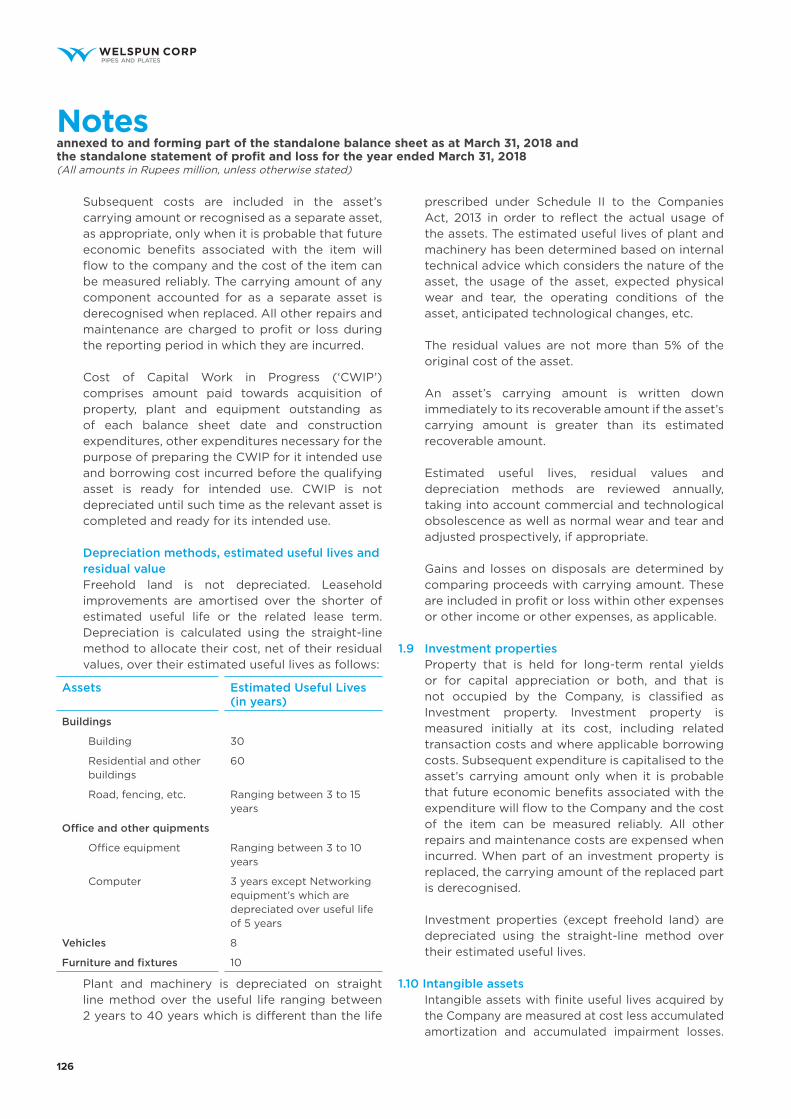
Notesannexed to and forming part of the standalone balance sheet as at March 31, 2018 and the standalone statement of profit and loss for the year ended March 31, 2018(All amounts in Rupees million, unless otherwise stated)
126
Subsequent costs are included in the asset’s carrying amount or recognised as a separate asset, as appropriate, only when it is probable that future economic benefits associated with the item will flow to the company and the cost of the item can be measured reliably. The carrying amount of any component accounted for as a separate asset is derecognised when replaced. All other repairs and maintenance are charged to profit or loss during the reporting period in which they are incurred.
Cost of Capital Work in Progress (‘CWIP’) comprises amount paid towards acquisition of property, plant and equipment outstanding as of each balance sheet date and construction expenditures, other expenditures necessary for the purpose of preparing the CWIP for it intended use and borrowing cost incurred before the qualifying asset is ready for intended use. CWIP is not depreciated until such time as the relevant asset is completed and ready for its intended use.
Depreciation methods, estimated useful lives and residual value
Freehold land is not depreciated. Leasehold improvements are amortised over the shorter of estimated useful life or the related lease term. Depreciation is calculated using the straight-line method to allocate their cost, net of their residual values, over their estimated useful lives as follows:
Assets Estimated Useful Lives (in years)
Buildings
Building 30
Residential and other buildings
60
Road, fencing, etc. Ranging between 3 to 15 years
Office and other quipments
Office equipment Ranging between 3 to 10 years
Computer 3 years except Networking equipment’s which are depreciated over useful life of 5 years
Vehicles 8
Furniture and fixtures 10
Plant and machinery is depreciated on straight line method over the useful life ranging between 2 years to 40 years which is different than the life
prescribed under Schedule II to the Companies Act, 2013 in order to reflect the actual usage of the assets. The estimated useful lives of plant and machinery has been determined based on internal technical advice which considers the nature of the asset, the usage of the asset, expected physical wear and tear, the operating conditions of the asset, anticipated technological changes, etc.
The residual values are not more than 5% of the original cost of the asset.
An asset’s carrying amount is written down immediately to its recoverable amount if the asset’s carrying amount is greater than its estimated recoverable amount.
Estimated useful lives, residual values and depreciation methods are reviewed annually, taking into account commercial and technological obsolescence as well as normal wear and tear and adjusted prospectively, if appropriate.
Gains and losses on disposals are determined by comparing proceeds with carrying amount. These are included in profit or loss within other expenses or other income or other expenses, as applicable.
1.9 Investment properties Property that is held for long-term rental yields
or for capital appreciation or both, and that is not occupied by the Company, is classified as Investment property. Investment property is measured initially at its cost, including related transaction costs and where applicable borrowing costs. Subsequent expenditure is capitalised to the asset’s carrying amount only when it is probable that future economic benefits associated with the expenditure will flow to the Company and the cost of the item can be measured reliably. All other repairs and maintenance costs are expensed when incurred. When part of an investment property is replaced, the carrying amount of the replaced part is derecognised.
Investment properties (except freehold land) are depreciated using the straight-line method over their estimated useful lives.
1.10 Intangible assets Intangible assets with finite useful lives acquired by
the Company are measured at cost less accumulated amortization and accumulated impairment losses.

Notesannexed to and forming part of the standalone balance sheet as at March 31, 2018 and the standalone statement of profit and loss for the year ended March 31, 2018(All amounts in Rupees million, unless otherwise stated)
Annual Report 2017-18 Financial StatementsThe Welspun Corp Story Governance Reports
127
Amortization is charged on a straight-line basis over the estimated useful lives. The estimated useful life and amortization method are reviewed at the end of each annual reporting period, with the effect of any changes in the estimate being accounted for on a prospective basis.
Amortisation methods and periods Intangible assets comprise of computer software
which is amortised on a straight-line basis over its expected useful life over a period of five years.
1.11 Non-current assets held for sale Non-current assets are classified as held for sale if
their carrying amount will be recovered principally through a sale transaction rather than through continuing use and a sale is considered highly probable. They are measured at the lower of their carrying amount and fair value less costs to sell, except for assets such as deferred tax assets, assets arising from employee benefits, financial assets, which are specifically exempt from this requirement.
An impairment loss is recognised for any initial or subsequent write-down of the asset to fair value less costs to sell. A gain is recognised for any subsequent increases in fair value less costs to sell of an asset, but not in excess of any cumulative impairment loss previously recognised. A gain or loss not previously recognised by the date of the sale of the non-current asset is recognised at the date of de-recognition.
Non-current assets are not depreciated or amortised while they are classified as held for sale. Non-current assets classified as held for sale are presented separately from the other assets in the balance sheet.
1.12 Impairment of assets Intangible assets that have an indefinite useful
life are not subject to amortization and are tested annually for impairment or more frequently if events or changes in circumstances indicate that they might be impaired. Other assets are tested for impairment whenever events or changes in circumstances indicate that the carrying amount may not be recoverable. An impairment loss is recognised for the amount by which the asset’s carrying amount exceeds its recoverable amount. The recoverable amount is the higher of an asset’s fair value less costs of disposal and value in use.
For the purposes of assessing impairment, assets are grouped at the lowest levels for which there are separately identifiable cash inflows which are largely independent of the cash inflows from other assets or groups of assets (cash-generating units). Non-financial assets that suffered impairment are reviewed for possible reversal of the impairment at the end of each reporting period.
1.13 Inventories Raw materials, stores and spares, work in progress, traded goods and finished goods Raw materials, stores, work in progress, traded and
finished goods are stated at the lower of cost and net realisable value. Cost of raw materials and traded goods comprises cost of purchases on moving weighted average basis. Cost of work-in progress and finished goods comprises direct materials, direct labour and an appropriate proportion of variable and fixed overhead expenditure, the latter being allocated on the basis of normal operating capacity. Cost of inventories also includes all other costs incurred in bringing the inventories to their present location and condition. Costs are assigned to individual items of inventory on moving weighted average basis. Costs of purchased inventory are determined after deducting rebates and discounts. Net realisable value is the estimated selling price in the ordinary course of business less the estimated costs of completion and the estimated costs necessary to make the sale.
1.14 Investment in subsidiaries, joint ventures and associate Investment in subsidiaries, joint ventures and
associate is carried at cost in the separate financial statements.
Company considers issuance of non-market rate redeemable preference shares by subsidiary as compound instrument comprising a loan with market terms and a capital injection and hence treat the difference between the cash paid and fair value on initial recognition as an addition to the investment in the subsidiary and presented separately as ‘Investment in equity component of preference shares’ under ‘Equity investments in subsidiaries and joint ventures’. Equity Component is not subsequent remeasured.

Notesannexed to and forming part of the standalone balance sheet as at March 31, 2018 and the standalone statement of profit and loss for the year ended March 31, 2018(All amounts in Rupees million, unless otherwise stated)
128
1.15 Financial Instruments A financial instrument is any contract that gives
rise to a financial asset of one entity and a financial liability or equity instrument of another entity.
a) Financial assets(I) Classification The Company classifies its financial assets in
the following measurement categories: .
those to be measured subsequently at fair value (either through other comprehensive income, or through profit or loss); and
those measured at amortised cost.
The classification depends on the entity’s business model for managing the financial assets and the contractual terms of the cash flows.
For assets measured at fair value, gains and losses will either be recorded in profit or loss or other comprehensive income.
For investments in debt instruments, this will depend on the business model in which the investment is held.
For investments in equity instruments, this will depend on whether the Company has made an irrevocable election at the time of initial recognition to account for the equity investment at fair value through other comprehensive income.
The Company reclassifies debt investments when and only when its business model for managing those assets changes.
(II) Measurement At initial recognition, the Company measures a
financial asset at its fair value plus, in the case of a financial asset not at fair value through profit or loss, transaction costs that are directly attributable to the acquisition of the financial asset. Transaction costs of financial assets carried at fair value through profit or loss are expensed in profit or loss.
(i) Debt instruments Subsequent measurement of debt instruments
depends on the Company’s business model for managing the asset and the cash flow characteristics of the asset. There are three measurement categories into which the Company classifies its debt instruments:
Amortised cost: Assets that are held for collection of contractual cash flows where those cash flows represent solely payments of principal and interest are measured at amortised cost. A gain or loss on a debt investment that is subsequently measured at amortised cost and is not part of a hedging relationship is recognised in profit or loss when the asset is derecognised or impaired. Interest income from these financial assets is included in other income using the effective interest rate method.
Fair value through other comprehensive income (FVOCI): Assets that are held for collection of contractual cash flows and for selling the financial assets, where the assets’ cash flows represent solely payments of principal and interest, are measured at fair value through other comprehensive income (FVOCI). Movements in the carrying amount are taken through OCI, except for the recognition of impairment gains or losses, interest income and foreign exchange gains and losses which are recognised in profit and loss. When the financial asset is derecognised, the cumulative gain or loss previously recognised in OCI is reclassified from equity to profit or loss and recognised in other income or other expenses (as applicable). Interest income from these financial assets is included in other income using the effective interest rate method.
Fair value through profit or loss: Assets that do not meet the criteria for amortised cost or FVOCI are measured at fair value through profit or loss. A gain or loss on a debt investment that is subsequently measured at fair value through profit or loss and is not part of a hedging relationship is recognised in profit or loss and presented net in the statement of profit and loss within other income or other expenses (as applicable) in the period in which it arises. Interest income from these financial assets is included in other income or other expenses, as applicable.

Notesannexed to and forming part of the standalone balance sheet as at March 31, 2018 and the standalone statement of profit and loss for the year ended March 31, 2018(All amounts in Rupees million, unless otherwise stated)
Annual Report 2017-18 Financial StatementsThe Welspun Corp Story Governance Reports
129
(ii) Equity instruments The Company subsequently measures all equity
investments at fair value. Where the Company’s management has elected to present fair value gains and losses on equity investments in other comprehensive income and there is no subsequent reclassification of fair value gains and losses to profit or loss. Dividends from such investments are recognised in profit or loss as other income when the Company’s right to receive payments is established.
Changes in the fair value of financial assets at fair value through profit or loss are recognised in other income or other expenses, as applicable in the statement of profit and loss. Impairment losses (and reversal of impairment losses) on equity investments measured at FVOCI are not reported separately from other changes in fair value.
(III) Impairment of financial assets The Company assesses on a forward looking
basis the expected credit losses associated with its assets carried at amortised cost and FVOCI debt instruments. The impairment methodology applied depends on whether there has been a significant increase in credit risk.
For trade receivables only, the Company applies the simplified approach permitted by Ind AS 109 Financial Instruments, which requires expected lifetime losses to be recognised from initial recognition of the receivables.
(IV) Derecognition of financial assets A financial asset is derecognised only when
The Company has transferred the rights to receive cash flows from the financial asset or
retains the contractual rights to receive the cash flows of the financial asset, but assumes a contractual obligation to pay the cash flows to one or more recipients.
Where the entity has transferred an asset, the Company evaluates whether it has transferred substantially all risks and rewards of ownership
of the financial asset. In such cases, the financial asset is derecognised. Where the entity has not transferred substantially all risks and rewards of ownership of the financial asset, the financial asset is not derecognised.
Where the entity has neither transferred a financial asset nor retains substantially all risks and rewards of ownership of the financial asset, the financial asset is derecognised if the Company has not retained control of the financial asset. Where the Company retains control of the financial asset, the asset is continued to be recognised to the extent of continuing involvement in the financial asset.
(V) Income recognition(i) Interest income Interest income from debt instruments
is recognised using the effective interest rate method. The effective interest rate is the rate that exactly discounts estimated future cash receipts through the expected life of the financial asset to the gross carrying amount of a financial asset. When calculating the effective interest rate, the Company estimates the expected cash flows by considering all the contractual terms of the financial instrument (for example, prepayment, extension, call and similar options) but does not consider the expected credit losses.
(ii) Dividend income Dividend income are recognised in profit
or loss only when the right to receive payment is established, it is probable that the economic benefits associated with the dividend will flow to the Company and the amount of the dividend can be measured reliably.
(iii) Export Benefits In case of sale made by the Company as
Support Manufacturer, export benefits arising from Duty Entitlement Pass Book (DEPB), Duty Drawback scheme and Merchandise Export Incentive Scheme are recognised on export of such goods in accordance with the agreed terms and conditions with customers. In case of direct exports made by the Company, export

Notesannexed to and forming part of the standalone balance sheet as at March 31, 2018 and the standalone statement of profit and loss for the year ended March 31, 2018(All amounts in Rupees million, unless otherwise stated)
130
benefits arising from DEPB, Duty Drawback scheme and Merchandise Export Incentive Scheme are recognised on shipment of direct exports.
(VI) Cash and cash equivalents Cash and cash equivalents includes cash
in hand, deposits with banks, other short term highly liquid investments with original maturities of three months or less that are readily convertible to known amounts of cash and which are subject to an insignificant risk of changes in value.
For the purpose of presentation in the statement of cash flows, cash and cash equivalents includes outstanding bank overdraft shown within current liabilities in statement of financial balance sheet and which are considered as integral part of company’s cash management policy.
(VII)Trade receivable Trade receivables are recognised initially at
their fair value and subsequently measured at amortised cost using the effective interest method, less provision for impairment.
b) Financial liabilities (I) Measurement
Financial liabilities are initially recognised at fair value, reduced by transaction costs (in case of financial liability not at fair value through profit or loss), that are directly attributable to the issue of financial liability. After initial recognition, financial liabilities are measured at amortised cost using effective interest method. The effective interest rate is the rate that exactly discounts estimated future cash outflow (including all fees paid, transaction cost, and other premiums or discounts) through the expected life of the financial liability, or, where appropriate, a shorter period, to the net carrying amount on initial recognition. At the time of initial recognition, there is no financial liability irrevocably designated as measured at fair value through profit or loss.
(II) Derecognition A financial liability is derecognised when the
obligation under the liability is discharged or cancelled or expires. When an existing financial
liability is replaced by another from the same lender on substantially different terms, or the terms of an existing liability are substantially modified, such an exchange or modification is treated as the de-recognition of the original liability and the recognition of a new liability. The difference in the respective carrying amounts is recognised in the statement of profit or loss.
(III) Borrowings Borrowings are initially recognised at fair
value, net of transaction costs incurred. Borrowings are subsequently measured at amortised cost. Any difference between the proceeds (net of transaction costs) and the redemption amount is recognised in profit or loss over the period of the borrowings using the effective interest method. Fees paid on the establishment of loan facilities are recognised as transaction costs of the loan to the extent that it is probable that some or all of the facility will be drawn down. In this case, the fee is deferred until the draw down occurs. To the extent there is no evidence that it is probable that some or all of the facility will be drawn down, the fee is capitalised as a prepayment for liquidity services and amortised over the period of the facility to which it relates.
Borrowings are removed from the balance sheet when the obligation specified in the contract is discharged, cancelled or expired. The difference between the carrying amount of a financial liability that has been extinguished or transferred to another party and the consideration paid, including any non-cash assets transferred or liabilities assumed, is recognised in profit and loss as other income or other expenses, as applicable.
Where the terms of a financial liability are renegotiated and the entity issues equity instruments to a creditor to extinguish all or part of the liability (debt for equity swap), a gain or loss is recognised in profit or loss, which is measured as the difference between the carrying amount of the financial liability and the fair value of the equity instruments issued.
Where there is a breach of a material provision of a long-term loan arrangement on or before

Notesannexed to and forming part of the standalone balance sheet as at March 31, 2018 and the standalone statement of profit and loss for the year ended March 31, 2018(All amounts in Rupees million, unless otherwise stated)
Annual Report 2017-18 Financial StatementsThe Welspun Corp Story Governance Reports
131
the end of the reporting period with the effect that the liability becomes payable on demand on the reporting date, the entity does not classify the liability as current, if the lender agreed, after the reporting period and before the approval of the financial statements for issue, not to demand payment as a consequence of the breach.
(IV) Trade and other payables These amounts represent liabilities for goods
and services provided to the Company prior to the end of financial year which are unpaid. Trade and other payables are recognised, initially at fair value, and subsequently measured at amortised cost using effective interest rate method.
c) Financial guarantee contracts Financial guarantee contracts are recognised
as a financial liability at the time the guarantee is issued. The liability is initially measured at fair value and subsequently at the higher of the amount determined in accordance with Ind AS 37 Provisions, Contingent Liabilities and Contingent Assets and the amount initially recognised less cumulative amortization, where appropriate.
d) Derivatives and hedging activities In order to hedge its exposure to foreign
exchange and interest rate, the Company enters into forward and interest rate swap contracts and other derivative financial instruments. The Company does not hold derivative financial instruments for speculative purposes.
Derivatives are initially recognised at fair value on the date a derivative contract is entered into and are subsequently re-measured to their fair value at the end of each reporting period.
The accounting for subsequent changes in fair value depends on whether the derivative is designated as a hedging instrument, and if so, the nature of the item being hedged and the type of hedge relationship designated.
The Company designates their derivatives as hedges of foreign exchange risk associated with the cash flows of highly probable forecast transactions and variable interest rate risk associated with borrowings (cash flow hedges).
The Company documents at the inception of the hedging transaction the economic relationship between hedging instruments and hedged items including whether the hedging instrument is expected to offset changes in cash flows of hedged items. The Company documents its risk management objective and strategy for undertaking various hedge transactions at the inception of each hedge relationship.
The full fair value of a hedging derivative is classified as a non-current asset or liability when the remaining maturity of the hedged item is more than 12 months; it is classified as a current asset or liability when the remaining maturity of the hedged item is less than 12 months.
(I) Cash flow hedges that qualify for hedge accounting
The effective portion of changes in the fair value of derivatives that are designated and qualify as cash flow hedges is recognised in the other comprehensive income in cash flow hedging reserve within equity, limited to the cumulative change in fair value of the hedged item on a present value basis from the inception of the hedge. The gain or loss relating to the ineffective portion is recognised immediately in profit or loss, within other income or other expenses (as applicable).
When forward contracts are used to hedge forecast transactions, the Company generally designates the full change in fair value of the forward contract (including forward points) as the hedging instrument. In such cases, the gains and losses relating to the effective portion of the change in fair value of the entire forward contract are recognised in the cash flow hedging reserve within equity.
Amounts accumulated in equity are reclassified to profit or loss in the periods when the hedged item affects profit or loss.
When the hedged forecast transaction results in the recognition of a non-financial asset the amounts accumulated in equity are transferred to profit or loss as follows:

Notesannexed to and forming part of the standalone balance sheet as at March 31, 2018 and the standalone statement of profit and loss for the year ended March 31, 2018(All amounts in Rupees million, unless otherwise stated)
132
With respect to gain or loss relating to the effective portion of the change in fair value of forward contracts, the deferred hedging gains and losses are included within the initial cost of the asset. The deferred amounts are ultimately recognised in profit or loss as the hedged item affects profit or loss.
With respect to gain or loss relating to the effective portion of the spot component of forward contracts, both the deferred hedging gains and losses and the deferred aligned forward points are included within the initial cost of the asset. The deferred amounts are ultimately recognised in profit or loss as the hedged item affects profit or loss.
When a hedging instrument expires, or is sold or terminated, or when a hedge no longer meets the criteria for hedge accounting, any cumulative deferred gain or loss in equity at that time remains in equity until the forecast transaction occurs. When the forecast transaction is no longer expected to occur, the cumulative gain or loss that was reported in equity is immediately reclassified to profit or loss within other income or other expense (as applicable). If the hedge ratio for risk management purposes is no longer optimal but the risk management objective remains unchanged and the hedge continues to qualify for hedge accounting, the hedge relationship will be rebalanced by adjusting either the volume of the hedging instrument or the volume of the hedged item so that the hedge ratio aligns with the ratio used for risk management purposes. Any hedge ineffectiveness is calculated and accounted for in statement of profit or loss at the time of the hedge relationship rebalancing.
(II) Derivatives that are not designated as hedges
The Company enters into derivative contracts to hedge risks which are not designated as hedges. Such contracts are accounted for at fair value through profit or loss and are included in other income or other expenses (as applicable).
e) Embedded Derivatives Derivatives embedded in a host contract
that is an asset within the scope of Ind AS 109 are not separated. Financial assets with
embedded derivatives are considered in their entirety when determining whether their cash flows are solely payment of principal and interest.
Derivatives embedded in all other host contract are separated only if the economic characteristics and risks of the embedded derivative are not closely related to the economic characteristics and risks of the host and are measured at fair value through profit or loss. Embedded derivatives closely related to the host contracts are not separated.
f) Embedded foreign currency derivatives Embedded foreign currency derivatives are not
separated from the host contract if they are closely related. Such embedded derivatives are closely related to the host contract, if the host contract is not leveraged, does not contain any option feature and requires payments in one of the following currencies:
the functional currency of any substantial party to that contract,
the currency in which the price of the related good or service that is acquired or delivered is routinely denominated in commercial transactions around the world, and
a currency that is commonly used in contracts to purchase or sell non-financial items in the economic environment in which the transaction takes place (i.e. relatively liquid and stable currency).
Foreign currency embedded derivatives which do not meet the above criteria are separated and the derivative is accounted for at fair value through profit and loss. The Company currently does not have any such derivatives which are not closely related.
g) Offsetting financial instruments Financial assets and liabilities are offset and
the net amount is reported in the balance sheet where there is a legally enforceable right to offset the recognised amounts and there is an intention to settle on a net basis or realise the asset and settle the liability

Notesannexed to and forming part of the standalone balance sheet as at March 31, 2018 and the standalone statement of profit and loss for the year ended March 31, 2018(All amounts in Rupees million, unless otherwise stated)
Annual Report 2017-18 Financial StatementsThe Welspun Corp Story Governance Reports
133
simultaneously. The legally enforceable right must not be contingent on future events and must be enforceable in the normal course of business and in the event of default, insolvency or bankruptcy of the Company or the counterparty.
1.16 Borrowing costs General and specific borrowing costs that
are directly attributable to the acquisition, construction or production of a qualifying asset are capitalised during the period of time that is required to complete and prepare the asset for its intended use or sale. Qualifying assets are assets that necessarily take a substantial period of time to get ready for their intended use or sale. Investment income earned on the temporary investment of specific borrowings pending their expenditure on qualifying assets is deducted from the borrowing costs eligible for capitalisation. Other borrowing costs are expensed in the period in which they are incurred.
1.17 Employee benefits a) Short-term obligations
Liabilities for wages and salaries, including non-monetary benefits that are expected to be settled wholly within 12 months after the end of the period in which the employees render the related service are recognised in respect of employees’ services up to the end of the reporting period and are measured at the amounts expected to be paid when the liabilities are settled. The liabilities are presented as current employee benefit obligations in the balance sheet.
b) Other long-term employee benefit obligations
The liabilities for earned leave are not expected to be settled wholly within 12 months after the end of the period in which the employees render the related service. They are therefore measured as the present value of expected future payments to be made in respect of services provided by employees up to the end of the reporting period using the projected unit credit method. The benefits are discounted using the market yields at the end of the reporting period that have terms approximating to the terms of the related obligation. Remeasurements as a result of
experience adjustments and changes in actuarial assumptions are recognised in profit or loss.
The obligations are presented as current liabilities in the balance sheet if the entity does not have an unconditional right to defer settlement for at least twelve months after the reporting period, regardless of when the actual settlement is expected to occur.
c) Post-employment obligations The Company operates the following post-
employment schemes:
defined benefit plans such as gratuity; and
defined contribution plans such as provident fund and superannuation fund.
(I) Defined Benefit Plans (i) Gratuity obligations
The liability or asset recognised in the balance sheet in respect of defined benefit gratuity plans is the present value of the defined benefit obligation at the end of the reporting period less the fair value of plan assets. The defined benefit obligation is calculated annually by actuaries using the projected unit credit method.
The present value of the defined benefit obligation denominated in INR is determined by discounting the estimated future cash outflows by reference to market yields at the end of the reporting period on government bonds that have terms approximating to the terms of the related obligation.
The net interest cost is calculated by applying the discount rate to the net balance of the defined benefit obligation and the fair value of plan assets. This cost is included in employee benefit expense in the statement of profit and loss.
Remeasurement gains and losses arising from experience adjustments and changes in actuarial assumptions are recognised in the period in which they occur, directly in other comprehensive income. They are included in retained earnings in the statement of changes in equity and in the balance sheet. Remeasurements are not reclassified to profit and loss in the subsequent periods.

Notesannexed to and forming part of the standalone balance sheet as at March 31, 2018 and the standalone statement of profit and loss for the year ended March 31, 2018(All amounts in Rupees million, unless otherwise stated)
134
Changes in the present value of the defined benefit obligation resulting from plan amendments or curtailments are recognised immediately in profit or loss as past service cost.
(II) Defined contribution plans (i) Provident Fund, Employee State Insurance Corporation (ESIC) and Pension Fund
The Contribution towards provident fund, ESIC and pension fund for certain employees is made to the regulatory authorities where the Company has no further obligations. Such benefits are classified as Defined Contribution Schemes as the Company does not carry any further obligations apart from the contributions made on a monthly basis.
(ii) Superannuation Fund Contribution towards superannuation fund
for certain employees is made to SBI Life Insurance Company where the Company has no further obligations. Such benefits are classified as Defined Contribution Schemes as the Company does not carry any further obligations, apart from contribution made on monthly basis.
d) Bonus Plan The Company recognises a liability and an
expense for bonus. The Company recognises a provision where contractually obliged or where there is a past practice that has created a constructive obligation.
1.18 Provisions, contingent liabilities and contingent assets a) Provisions
Provisions for legal claims are recognised when the Company has a present legal or constructive obligation as a result of past events, it is probable that an outflow of resources will be required to settle the obligation and the amount can be reliably estimated. Provisions are not recognised for future operating losses.
Where there are a number of similar obligations, the likelihood that an outflow will be required in settlement is determined by considering the class of obligations as a whole. A provision is recognised even if the likelihood of an outflow with respect to any one item included in the same class of obligations may be small. Provisions are measured at the present value of
management’s best estimate of the expenditure required to settle the present obligation at the end of the reporting period. The discount rate used to determine the present value is a pre-tax rate that reflects current market assessments of the time value of money and the risks specific to the liability. The increase in the provision due to the passage of time is recognised as interest expense.
The measurement of provision for restructuring includes only direct expenditures arising from the restructuring, which are both necessarily entailed by the restructuring and not associated with the ongoing activities of the Company.
b) Contingent liabilities Contingent liabilities are disclosed when there
is a possible obligation arising from past events the existence of which will be confirmed only by the occurrence or non-occurrence of one or more uncertain future events not wholly within the control of the company or a present obligation that arises from past events where it is either not probable that an outflow of resources will be required to settle or a reliable estimate of the amount cannot be made.
c) Contingent Assets Contingent Assets are disclosed, where an
inflow of economic benefits is probable.
1.19 Contributed Equity Equity shares are classified as equity. Incremental
costs directly attributable to the issue of new shares or options are shown in equity as a deduction, net of tax, from the proceeds.
1.20 Dividends Provision is made for the amount of any dividend
declared, being appropriately authorised and no longer at the discretion of the entity, on or before the end of the reporting period but not distributed at the end of the reporting period.
1.21 Earnings per share a) Basic earnings per share
Basic earnings per share is calculated by dividing:
the profit attributable to owners of the Company; and

Notesannexed to and forming part of the standalone balance sheet as at March 31, 2018 and the standalone statement of profit and loss for the year ended March 31, 2018(All amounts in Rupees million, unless otherwise stated)
Annual Report 2017-18 Financial StatementsThe Welspun Corp Story Governance Reports
135
by the weighted average number of equity shares outstanding during the financial year, adjusted for bonus elements in equity shares issued during the year and excluding treasury shares.
b) Diluted earnings per share Diluted earnings per share adjust the figures
used in the determination of basic earnings per share to take into account:
the after income tax effect of interest and other financing costs associated with dilutive potential equity shares; and
the weighted average number of additional equity shares that would have been outstanding assuming the conversion of all dilutive potential equity shares.
1.22 Rounding of amounts All amounts disclosed in the financial statements and
notes have been rounded off to the nearest Rupees millions (upto two decimals), unless otherwise stated as per the requirement of Schedule III (Division II).
1.23 New standards/ amendments to existing standards issued but not yet adopted Following are the amendments to existing standards
which have been issued by The Ministry of Corporate Affairs (‘MCA’) that are not effective for the reporting period and have not been early adopted by the Company:
a) Amendments to Ind AS 115, Revenue from contracts with customers:
Ind AS 115, Revenue from contracts with customers deals with revenue recognition and establishes principles for reporting useful information to users of financial statements about the nature, amount, timing and uncertainty of revenue and cash flows arising from an entity’s contracts with customers. Revenue is recognized when a customer obtains control of a promised good or service and thus has the ability to direct the use and obtain the benefits from the good or service in an amount that reflects the consideration to which the entity expects to be entitled in exchange for those goods and services. The standard replaces Ind AS 18 Revenue and related appendices.
A new five-step process must be applied before revenue can be recognised:1. identify contracts with customers2. identify the separate performance
obligation3. determine the transaction price of the
contract
4. allocate the transaction price to each of the separate performance obligations, and
5. recognise the revenue as each performance obligation is satisfied.
The Company is currently assessing the potential impact of this amendment. These amendments are mandatory for the reporting period beginning on or after April 01, 2018.
b) Amendments to Appendix B to Ind AS 21 Foreign currency transactions and advance consideration:
The MCA has notified Appendix B to Ind AS 21, foreign currency transactions and advance consideration. The appendix clarifies how to determine the date of transaction for the exchange rate to be used on initial recognition of a related asset, expense or income where an entity pays or receives consideration in advance for foreign currency-denominated contracts.
For a single payment or receipt, the date of the transaction should be the date on which the entity initially recognises the non-monetary asset or liability arising from the advance consideration (the prepayment or deferred income/contract liability). If there are multiple payments or receipts for one item, date of transaction should be determined as above for each payment or receipt.
The Company is currently assessing the potential impact of this amendment. These amendments will be applied prospectively to items in scope, for the reporting period beginning on or after April 01, 2018.
c) Amendments to Ind AS 40 Investment property - Transfers of investment property:
The amendments clarify that transfers to, or from, investment property can only be made if there has been a change in use that is supported by evidence. A change in use occurs when the property meets, or ceases to meet, the definition of investment property. A change in

Notesannexed to and forming part of the standalone balance sheet as at March 31, 2018 and the standalone statement of profit and loss for the year ended March 31, 2018(All amounts in Rupees million, unless otherwise stated)
136
intention alone is not sufficient to support a transfer. The list of evidence for a change of use in the standard was re-characterised as a non-exhaustive list of examples and scope of these examples have been expanded to include assets under construction/development and not only transfer of completed properties.
The Company is currently assessing the potential impact of this amendment.
The Company has elected to apply these amendments prospectively to changes in use that occur on or after the date of initial application i.e. April 01, 2018. On April 01, 2018, the Company shall reassess the classification of properties held at that date and, if applicable, reclassify properties to reflect the conditions that exist as at that date.
d) Amendments to Ind AS 12 Income taxes regarding recognition of deferred tax assets on unrealised losses:
The amendments clarify the accounting for deferred taxes where an asset is measured at fair value and that fair value is below the asset’s tax base. They also clarify certain other aspects of accounting for deferred tax assets set out below.
- A temporary difference exists whenever the carrying amount of an asset is less than its tax base at the end of the reporting period.
- The estimate of future taxable profit may include the recovery of some of an entity’s assets for more than its carrying amount if it is probable that the entity will achieve this. For example, when a fixed-rate debt instrument is measured at fair value, however, the entity expects to hold and collect the contractual cash flows and it is probable that the asset will be recovered for more than its carrying amount.
- Where the tax law restricts the source of taxable profits against which particular types of deferred tax assets can be recovered, the recoverability of the deferred tax assets can only be assessed in combination with other deferred tax assets of the same type.
- Tax deductions resulting from the reversal of deferred tax assets are excluded from the estimated future taxable profit that is used to evaluate the recoverability of those assets. This is to avoid double counting the deductible temporary differences in such assessment.
The Company is currently assessing the potential impact of this amendment. These amendments will be applied retrospectively, for the reporting period beginning on or after April 01, 2018.
The Company intends to adopt these amendments when it becomes effective. There are no other standards or amendments that are not yet effective and that would be expected to have a material impact on the Company in the current or future reporting periods and on foreseeable future transactions.
Note 2: Critical estimates and judgments The preparation of financial statements requires the
use of accounting estimates which, by definition, will seldom equal the actual results. Management also needs to exercise judgment in applying the Company’s accounting policies. This note provides an overview of the areas that involved a higher degree of judgment or complexity, and of items which are more likely to be materially adjusted due to estimates and assumptions turning out to be different than those originally assessed. Detailed information about each of these estimates and judgments is included in relevant notes together with information about the basis of calculation for each affected line item in the financial statements.
Critical estimates and judgmentsi) Estimation of current tax expense and deferred
tax The calculation of the Company’s tax charge
necessarily involves a degree of estimation and judgment in respect of certain items whose tax treatment cannot be finally determined until resolution has been reached with the relevant tax authority or, as appropriate, through a formal legal process. The final resolution of some of these items may give rise to material profits/losses and/or cash flows. Significant judgments are involved in determining the provision for income taxes, including amount expected to be paid/recovered for uncertain tax positions.

Notesannexed to and forming part of the standalone balance sheet as at March 31, 2018 and the standalone statement of profit and loss for the year ended March 31, 2018(All amounts in Rupees million, unless otherwise stated)
Annual Report 2017-18 Financial StatementsThe Welspun Corp Story Governance Reports
137
ii) Estimation of Provisions and Contingent Liabilities
The Company exercises judgment in measuring and recognising provisions and the exposures to contingent liabilities which is related to pending litigation or other outstanding claims. Judgement is necessary in assessing the likelihood that a pending claim will succeed, or a liability will arise, and to quantify the possible range of the financial settlement. Because of the inherent uncertainty in this evaluation process, actual liability may be different from the originally estimated as provision.
iii) Estimation of useful life of Property, Plant and Equipment
Property, Plant and Equipment represent a significant proportion of the asset base of the Company. The charge in respect of periodic depreciation is derived after determining an estimate of an asset’s expected useful life and the expected residual value at the end of its life. The useful lives and residual values of Company’s assets are determined by management at the time the asset is acquired and reviewed periodically, including at each financial year end. The lives are based on historical experience with similar assets as well as anticipation of future events, which may impact their life, such as changes in technology. For the relative size of the Company’s property, plant and equipment.
iv) Estimation of Provision for Inventory The Company writes down inventories to
net realisable value based on an estimate of the realisability of inventories. Write downs on inventories are recorded where events or changes in circumstances indicate that the balances may not realised. The identification
of write-downs requires the use of estimates of net selling prices of the down-graded inventories. Where the expectation is different from the original estimate, such difference will impact the carrying value of inventories and write-downs of inventories in the periods in which such estimate has been changed.
v) Estimation of Defined Benefit Obligation The present value of the defined benefit
obligations depends on a number of factors that are determined on an actuarial basis using a number of assumptions. The assumptions used in determining the net cost (income) for post employments plans include the discount rate. Any changes in these assumptions will impact the carrying amount of such obligations.
The Company determines the appropriate discount rate at the end of each year. This is the interest rate that should be used to determine the present value of estimated future cash outflows expected to be required to settle the defined benefit obligations. In determining the appropriate discount rate, the Company considers the interest rates of government bonds of maturity approximating the terms of the related plan liability.
vi) Estimated fair value of Financial Instruments The fair value of financial instruments that are
not traded in an active market is determined using valuation techniques. The Management uses its judgment to select a variety of methods and make assumptions that are mainly based on market conditions existing at the end of each reporting period. For details of the key assumptions used and the impact of changes to these assumptions.

138
(All
am
ou
nts
in
Ru
pees
mill
ion
, un
less
oth
erw
ise s
tate
d)
No
te: 3
P
rop
ert
y, P
lan
t an
d E
qu
ipm
en
t
Carr
yin
g A
mo
un
ts F
ree
ho
ld
lan
d
Bu
ild
ing
s P
lan
t an
d
mach
ine
ry
Offi
ce
an
d
oth
er
eq
uip
me
nts
Ve
hic
les
Fu
rnit
ure
an
d
fixtu
res
To
tal
Ye
ar
en
de
d M
arc
h 3
1, 2
017
Gro
ss c
arr
yin
g a
mo
un
t
Bala
nce
as
at
Ap
ril
01,
20
16 3
15.18
4
,710
.19
2
3,0
71.
23
7
0.9
3
23
.00
7
3.8
3
28
,26
4.3
6
Ad
dit
ion
s 1
1.0
5
23
.75
1
39
.39
2
9.16
1
.78
5
.78
2
10.9
1
Exch
an
ge d
iffe
ren
ces
(refe
r n
ote
49
) -
-
(
14.0
5)
-
-
-
(14
.05
)
Dis
po
sals
-
-
26
.31
1.9
6
3.5
8
1.0
0
32.8
5
Gro
ss c
arr
yin
g a
mo
un
t as
at
Marc
h 3
1, 2
017
32
6.2
3
4,7
33
.94
2
3,1
70
.26
9
8.1
3
21.
20
7
8.6
1 2
8,4
28
.37
Ye
ar
en
de
d M
arc
h 3
1, 2
018
Gro
ss c
arr
yin
g a
mo
un
t
Ad
dit
ion
s 1
22.8
5
2.6
0
40
9.0
7
16
.98
3
.92
2.8
3
55
8.2
5
Exch
an
ge d
iffe
ren
ces
(refe
r n
ote
49
) -
-
3
.25
-
-
-
3
.25
Dis
po
sals
3.6
9
-
13
.85
1
.75
3
.89
0
.38
2
3.5
6
Recla
ssifi
cati
on
as
invest
men
t p
rop
ert
y (
refe
r n
ote
4)
-
7.7
8
-
-
-
-
7.7
8
Gro
ss c
arr
yin
g a
mo
un
t as
at
Marc
h 3
1, 2
018
44
5.3
9
4,7
28
.76
2
3,5
68
.73
1
13.3
6
21.
23
8
1.0
6
28
,95
8.5
3
Accu
mu
late
d d
ep
recia
tio
n F
ree
ho
ld
lan
d
Bu
ild
ing
s P
lan
t an
d
mach
ine
ry
Offi
ce
an
d
oth
er
eq
uip
me
nts
V
eh
icle
s F
urn
itu
re a
nd
fi
xtu
res
To
tal
Ye
ar
en
de
d M
arc
h 3
1, 2
017
Bala
nce
as
at
Ap
ril
01,
20
16 -
2
06
.96
2
,170
.57
24
.09
5
.26
1
4.2
8
2,4
21.16
Dep
recia
tio
n c
harg
e d
uri
ng
th
e y
ear
-
20
1.6
7
2,15
3.4
9
17.
92
3.6
0
12.6
2
2,3
89
.30
Dis
po
sals
-
-
6.4
9
0.5
0
1.6
9
0.5
3
9.2
1
Accu
mu
late
d d
ep
recia
tio
n a
s at
Marc
h 3
1, 2
017
-
40
8.6
3
4,3
17.5
7
41.
51
7.1
7
26
.37
4
,80
1.2
5
Ye
ar
en
de
d M
arc
h 3
1, 2
018
Dep
recia
tio
n c
harg
e d
uri
ng
th
e y
ear
-
18
4.5
4
2,10
3.4
2
16
.69
2
.52
11.
68
2
,318
.85
Dis
po
sals
-
-
9.7
1 0
.75
1
.48
0
.15
1
2.0
9
Recla
ssifi
cati
on
as
invest
men
t p
rop
ert
y (
refe
r n
ote
4)
0.8
2
-
-
-
-
0.8
2
Accu
mu
late
d d
ep
recia
tio
n a
s at
Marc
h 3
1, 2
018
-
59
2.3
5
6,4
11.2
8
57.
45
8
.21
37.
90
7
,10
7.19
Ne
t carr
yin
g a
mo
un
t o
f p
rop
ert
y, p
lan
t an
d e
qu
ipm
en
t
As
at
Marc
h 3
1, 2
017
3
26
.23
4
,325
.31
18
,85
2.6
9
5
6.6
2
1
4.0
3
5
2.2
4
23
,627.
12
As
at
Marc
h 3
1, 2
018
4
45
.39
4,13
6.4
1
17,157.
45
55
.91
1
3.0
2
43
.16
2
1,8
51.
34
Cap
ital
wo
rk-i
n-p
rog
ress
As
at
Marc
h 3
1, 2
017
24
2.4
9A
s at
Marc
h 3
1, 2
018
1
21.
49
No
tes:
(i
) F
or
pro
pert
y, p
lan
t an
d e
qu
ipm
en
t p
led
ged
as
secu
rity
(re
fer
no
te 1
7).
(i
i) C
on
tractu
al o
blig
ati
on
s
Refe
r n
ote
46
fo
r d
isclo
sure
of
co
ntr
actu
al co
mm
itm
en
ts f
or
the a
cq
uis
itio
n o
f p
rop
ert
y, p
lan
t an
d e
qu
ipm
en
t.
Notesannexed to and forming part of the standalone balance sheet as at March 31, 2018 and the standalone statement of profit and loss for the year ended March 31, 2018

Notesannexed to and forming part of the standalone balance sheet as at March 31, 2018 and the standalone statement of profit and loss for the year ended March 31, 2018(All amounts in Rupees million, unless otherwise stated)
Annual Report 2017-18 Financial StatementsThe Welspun Corp Story Governance Reports
139
As at March 31, 2018
As at March 31, 2017
4. Investment propertyInvestment property - land 1.23 1.23
Investment property - building 6.96 -
Total investment property 8.19 1.23
Gross carrying amount
Opening balance 1.23 1.23
Transferred from property, plant and equipment (refer note 3) 7.78 -
Closing balance 9.01 1.23
Accumulated Depreciation
Transferred from property, plant and equipment (refer note 3) 0.82 -
Closing balance 0.82 -
(i) Amount recognised in statement of profit and loss for investment property
Year ended March 31, 2018
Year ended March 31, 2017
Rental Income 7.53 7.63
7.53 7.63
(ii) Leasing arrangementsThe Group has given flat on operating lease. This lease arrangement is for a term of 3 years which is non-cancellable for a period of 2 years is tabulated as below.
As at March 31, 2018
As at March 31, 2017
Within one year 2.33 -
Later than one year but not later than five years 1.40 -
3.73 -
(iii) Fair Value
As at March 31, 2018
As at March 31, 2017
Investment property - land 154.39 154.39
Investment property - building 86.74 -
241.13 154.39
Estimation of fair valueThe Company has obtained independent valuation of its freehold land located at Anjar and Flat located at Mumbai based on current prices in an active market for properties of similar nature. The fair values of investment property have been determined by an independent valuer. The main inputs used are the rental growth rates and a study of the micro market in discussion with industry experts. Resulting fair value estimate for investment property are included in level 3.

Notesannexed to and forming part of the standalone balance sheet as at March 31, 2018 and the standalone statement of profit and loss for the year ended March 31, 2018(All amounts in Rupees million, unless otherwise stated)
140
5. Intangible assets
Carrying amounts Other intangible assets (Software)
Year ended March 31, 2017
Gross carrying amount
Balance as at April 01, 2016 164.50
Additions 9.81
Disposals 0.63
Gross carrying amount as at March 31, 2017 173.68
Year ended March 31, 2018
Gross carrying amount
Additions 103.74
Disposals 22.56
Gross carrying amount as at March 31, 2018 254.86
Accumulated amortisation Other intangible assets (Software)
Year ended March 31, 2017
Balance as at April 01, 2016 49.48
Amortisation charge during the year 53.15
Disposals 0.63
Accumulated amortisation as at March 31, 2017 102.00
Year ended March 31, 2018
Amortisation charge during the year 56.45
Disposals 22.56
Accumulated amortisation as at March 31, 2018 135.89
Net carrying amount of other intangible assets
As at March 31, 2017 71.68
As at March 31, 2018 118.97
Intangible assets under development
As at March 31, 2017 72.61
As at March 31, 2018 21.32
Notes Contractual obligationsRefer note 46 for disclosure of contractual commitments.

Notesannexed to and forming part of the standalone balance sheet as at March 31, 2018 and the standalone statement of profit and loss for the year ended March 31, 2018(All amounts in Rupees million, unless otherwise stated)
Annual Report 2017-18 Financial StatementsThe Welspun Corp Story Governance Reports
141
As at March 31, 2018
As at March 31, 2017
6. Equity investments in subsidiaries and joint venture (refer note 42 and 51) (fully paid up)
Unquoted
Equity investments carried at cost
I. Investments in equity instruments of subsidiaries
i) Wholly owned subsidiaries
Welspun Pipes Inc. 0.44 0.44
1,000 (March 31, 2017: 1,000) equity shares of USD 0.0001 each
Welspun Tradings Limited 50.22 50.22
5,013,402 (March 31, 2017: 5,013,402) equity shares of Rs. 10 each
ii) Other subsidiary
Welspun Mauritius Holdings Limited 4.70 4.70
102,089 (March 31, 2017: 102,089) equity shares of USD 1 each
Total Investments in equity instruments of subsidiaries 55.36 55.36
II. Investment in equity component of preference shares
Other subsidiary
Welspun Mauritius Holdings Limited (refer note 7(II)) 293.75 293.75
Total investment in equity component of preference shares 293.75 293.75
III. Investments in equity instruments of joint venture
Welspun Wasco Coatings Private Limited 147.55 147.55
14,755,014 (March 31, 2017: 14,755,014) equity shares of Rs.10 each
Total investments in equity instruments of joint venture 147.55 147.55
Total equity investments in subsidiaries and joint venture 496.66 496.66
Aggregate amount of unquoted investments 496.66 496.66
As at March 31, 2018
As at March 31, 2017
7. Investments
7(a) Non-current investments
Unquoted (Refer note 42)
Investment carried at fair value through profit and loss (fully paid up)
I. Investment in equity instruments of other entity
Welspun Captive Power Generation Limited 150.90 135.16
5,833,499 (March 31, 2017: 5,833,499) equity shares of Rs. 10 each
Total investments in equity instruments of other entity 150.90 135.16
II. Investments in preference shares of subsidiary (Refer note 51)
Welspun Mauritius Holdings Limited (refer note 6(II)) 1,528.61 1,520.99
23,454,000 (March 31, 2017: 23,454,000) 7% optionally convertible, non- cumulative,
redeemable preference shares of USD 1 each
Total investments in preference shares of subsidiary 1,528.61 1,520.99
III. Investments in preference shares of other entity
Welspun Captive Power Generation Limited 194.52 194.52
19,443,186 (March 31, 2017: 19,443,186) 10% non-cumulative,
redeemable preference shares of Rs. 10 each
Total investments in preference shares of other entity 194.52 194.52

Notesannexed to and forming part of the standalone balance sheet as at March 31, 2018 and the standalone statement of profit and loss for the year ended March 31, 2018(All amounts in Rupees million, unless otherwise stated)
142
As at March 31, 2018
As at March 31, 2017
Quoted
Investment carried at fair value through profit and loss (fully paid up)
Investments in other entity
Standard Chartered Bank PLC Indian Depository Receipt 19.91 18.04
334,331 (March 31, 2017: 334,331) Indian Depository Receipt of Rs. 100 each
Total Investment in other entity 19.91 18.04
Total non-current investments 1,893.94 1,868.71
Aggregate amount of quoted investments and market value thereof 19.91 18.04
Aggregate amount of unquoted investments 1874.03 1,850.67
As at March 31, 2018
As at March 31, 2017
7(b) Current investments
Bonds 3,268.28 4,639.92
Mutual funds 15.43 378.72
Total current investments 3,283.71 5,018.64
QuotedInvestment carried at fair value through profit and lossI. Investments in bonds
Face value in Rupees
As at March 31, 2018 As at March 31, 2017
Units Amount Units Amount
10.40% Vijaya Bank Perpetual 1,000,000 - - 3 3.00
10.75% IDBI Bank Limited Perpetual 1,000,000 - - 60 61.20
10.90% Family Credit Ltd. 1,000,000 - - 12 13.23
11.09% IDBI Bank Perpetual 1,000,000 - - 223 228.58
11.70% UCO Bank Perpetual 1,000,000 - - 132 132.17
12.00% United Bank of India Perpetual 1,000,000 - - 250 250.00
7.39% Hudco Tax Free 1,000 - - 4,000 4.39
8.25% Reliance Capital Ltd. 1,000,000 - - 589 589.53
8.37% LIC Housing Finance Ltd. 1,000,000 - - 1 1.00
8.65% IL&FS Finance Services Ltd. 1,000 600 0.60 600 0.60
8.85% Reliance Capital Ltd. 1,000,000 - - 11 11.03
8.94% Bajaj Finance Ltd. 1,000,000 - - 1 1.03
9.10% Reliance General Insurance 1,000,000 250 251.78 117 117.59
9.25% Capital First Ltd. 1,000,000 - - 100 101.91
9.25% L&T Fincorp Ltd. 1,000,000 - - 155 157.93
9.30% Indiabulls Housing Finance Ltd. 100,000 - - 315 31.74
9.40% Industrial Finance Corporation of India Ltd. 1,000 10,000 10.01 10,000 10.00
9.50% Union Bank of India Perpetual 1,000,000 77 80.10 204 210.73
9.51% Corporation Bank Perpetual 1,000,000 19 19.57 126 125.37
9.85% DCB Bank 100,000 - - 2,200 220.00
9.90% Industrial Finance Corporation of India Ltd. 2032
25,000 - - 14 0.37
9.90% Industrial Finance Corporation of India Ltd. 2037
25,000 - - 3,250 83.25
8.75% Axis Bank Perpetual 1,000,000 - - 240 235.68

Notesannexed to and forming part of the standalone balance sheet as at March 31, 2018 and the standalone statement of profit and loss for the year ended March 31, 2018(All amounts in Rupees million, unless otherwise stated)
Annual Report 2017-18 Financial StatementsThe Welspun Corp Story Governance Reports
143
Face value in Rupees
As at March 31, 2018 As at March 31, 2017
Units Amount Units Amount
11.60% Bank of Maharashtra Perpetual 1,000,000 - - 63 63.00
8.75% Bajaj Finance Ltd. 1,000,000 - - 2 2.03
9.25% Dewan Housing Finance Corporation Ltd. 1,000 - - 58,900 58.76
10.75% Dewan Housing Finance Corporation Ltd. Perpetual
1,000,000 100 105.40 195 198.94
8.07% Energy Efficiency Services Ltd. 1,000,000 6 6.14 6 6.04
8.07% Energy Efficiency Services Ltd. 1,000,000 - - 64 64.45
9.75% Industrial Finance Corporation of India Ltd. 1,000,000 64 66.64 30 31.23
9.30% Dewan Housing Finance Corporation Ltd. 1,000 - - 63,200 63.57
10.00% Indian Overseas Bank Perpetual 1,000,000 - - 405 400.98
10.40% Magma Fincorp Ltd. 1,000,000 - - 20 20.20
7.38% National Bank For Agriculture And Rural Development
1,000,000 - - 2 2.01
9.95% Food Corporation Of India 1,000,000 - - 2 2.16
9.40% Reliance Home Finance Ltd. 1,000 217,000 224.76 334,498 346.44
9.50% Srei Equipment Finance Ltd. 1,000 - - 15,000 15.08
8.97% U.P. Power Corporation Ltd. 13-02-2026 1,000,000 - - 66 66.05
8.97% U.P. Power Corporation Ltd. 14-02-2025 1,000,000 80 84.15 1 1.00
8.97% U.P. Power Corporation Ltd. 15-02-2021 1,000,000 - - 117 117.08
8.97% U.P. Power Corporation Ltd. 15-02-2022 1,000,000 23 23.77 114 114.08
8.97% U.P. Power Corporation Ltd. 15-02-2023 1,000,000 15 15.48 6 6.00
8.97% U.P. Power Corporation Ltd. 15-02-2024 1,000,000 25 26.01 70 70.05
7.50% Water and Sanitation Pooled Fund 100,000 27 2.85 27 2.70
9.50% Yes Bank Ltd. 1,000,000 - - 190 190.00
7.59% Government of India 100 500,000 49.85 500,000 52.40
7.61% Government of India 100 - - 1,500,000 155.34
10.45% Gujarat State Petroleum Corporation Ltd. 1,000,000 298.00 334.15 - -
11.15% Allahabad Bank Perpetual 1,000,000 160.00 171.20 - -
10.99% Andhra Bank Perpetual 1,000,000 57.00 59.67 - -
10.90% Punjab & Sind Bank 1,000,000 69 69.03 - -
10.25% ECL Finance Ltd. Perpetual 1,000,000 4.00 4.00 - -
7.18% Power Finance Corporation Ltd. 1,000,000 147.00 148.45 - -
0.00% Andhra Pradesh Express way 1,000,000 56.00 104.32 - -
7.49% Gruh Finance Limited 500,000 14.00 7.13 - -
8.48% U.P. Power Corporation Ltd. 15-03-2023 1,000,000 13.00 13.31 - -
8.48% U.P. Power Corporation Ltd. 14-03-2025 1,000,000 6.00 6.16 - -
8.48% U.P. Power Corporation Ltd. 13-03-2026 1,000,000 1.00 1.02 - -
8.48% U.P. Power Corporation Ltd. 15-03-2027 1,000,000 5.00 5.15 - -
9.00% Yes Bank Perpetual Bonds 1,000,000 891.00 891.09 - -
9.20% IL&FS Transportation Network Ltd. 1,000,000 43.00 43.61 - -
9.25% The Jammu & Kashmir Bank Ltd. 1,000,000 211.00 212.32 - -
9.80% Gujarat State Petroleum Corporation Ltd. 1,000,000 159 175.59 - -
11.00% Bank of India Perpetual 1,000,000 2 2.05 - -
9.90% Industrial Finance Corporation of India Ltd. 05-11-2037
25,000 1,970 52.52
9.90% Industrial Finance Corporation of India Ltd. 05-11-2032
25,000 14 0.40 - -
Total investments in bonds 732,406 3,268.28 2,495,581 4,639.92

Notesannexed to and forming part of the standalone balance sheet as at March 31, 2018 and the standalone statement of profit and loss for the year ended March 31, 2018(All amounts in Rupees million, unless otherwise stated)
144
UnquotedInvestment carried at fair value through profit and lossInvestments in mutual funds
As at March 31, 2018 As at March 31, 2017
Units Amount Units Amount
Axis Liquid Fund - Growth - - 32,365 58.19
Reliance Liquid Fund - TP - Growth 2,547 10.75 81,065 320.53
Invesco India Liquid Fund - Growth 1,964 4.68 - -
Total investments in mutual funds 4,511 15.43 113,430 378.72
Aggregate amount of quoted investments and market value thereof 3,268.28 4,639.92
Aggregate amount of unquoted investments 15.43 378.72
3,283.71 5,018.64
As at March 31, 2018
As at March 31, 2017
8. Loans
8(a) Non-current
Unsecured, considered good
Loans to joint venture (refer note 42 and 51) 354.11 256.07
Total non-current loans 354.11 256.07
8(b) Current
Unsecured, considered good
Loans to employees 5.62 5.98
Total current loans 5.62 5.98
Total loans 359.73 262.05
As at March 31, 2018
As at March 31, 2017
9. Other financial assets 9(a) Non-current Security deposits
Related parties (refer note 42) 22.66 202.22
Others 46.40 45.79
Term deposits with maturity more than 12 months
Margin money deposits (refer note 14 (ii)) 25.40 4.62
Derivatives designated as hedges
Interest rate swap 15.32 22.30
Derivatives not designated as hedges
Coupon only swap 1.08 7.16
Total non-current other financial assets 110.86 282.09
9(b) CurrentSecurity deposits
Related parties (refer note 42) 200.39 22.62
Others 5.48 1.25
Less: Allowance for doubtful security deposits - (0.02)
205.87 23.85 Interest accrued on
Current investments 108.76 168.29 Others 4.93 4.66
113.69 172.95

Notesannexed to and forming part of the standalone balance sheet as at March 31, 2018 and the standalone statement of profit and loss for the year ended March 31, 2018(All amounts in Rupees million, unless otherwise stated)
Annual Report 2017-18 Financial StatementsThe Welspun Corp Story Governance Reports
145
As at March 31, 2018
As at March 31, 2017
Other receivables from
Related parties (refer note 42) 37.84 13.61
Others 62.78 -
100.62 13.61
Derivatives designated as hedges
Forward contracts 12.10 227.63
Interest rate swap 6.10 -
Derivatives not designated as hedges
Forward contracts 132.31 -
Option contracts 2.15 -
152.66 227.63
Receivable towards claim 9.24 67.38
Total current other financial assets 582.08 505.42
Total other financial assets 692.94 787.51
As at March 31, 2018
As at March 31, 2017
10. Other assets
10(a) Non-current
Capital advances
Related parties (refer note 42) 595.87 595.87
Others 55.67 93.78
Less: Allowance for doubtful capital advances (0.90) (3.68)
650.64 685.97
Balance with statutory authorities 724.61 406.67
Less: Allowance for doubtful balance with statutory authorities (247.84) (240.82)
476.77 165.85
Advance to suppliers 59.78 65.76
Less: Allowance for doubtful balance with vendors (8.93) -
50.85 65.76
Prepaid expenses 3.30 26.70
Total other non-current assets 1,181.56 944.28
10(b) current
Balance with statutory authorities 1,181.45 1,203.68
Less: Allowance for doubtful balance with statutory authorities - (0.13)
1,181.45 1,203.55
Advance to suppliers 123.70 115.88
Prepaid expenses 78.19 64.14
Advance to employees 2.02 2.80
Export benefit receivable 388.37 491.87
Total other current assets 1,773.73 1,878.24
Total other assets 2,955.29 2,822.52

Notesannexed to and forming part of the standalone balance sheet as at March 31, 2018 and the standalone statement of profit and loss for the year ended March 31, 2018(All amounts in Rupees million, unless otherwise stated)
146
As at March 31, 2018
As at March 31, 2017
11. InventoriesRaw materials 3,078.69 4,511.27
Goods-in-transit for raw materials 1,735.44 4,617.42
Work-in-progress 851.99 1,138.18
Finished goods 3,485.48 1,971.56
Stores and spares 1,049.96 1,031.85
Total inventories 10,201.56 13,270.28
As at March 31, 2018
As at March 31, 2017
12. Trade receivablesTrade receivables from related parties (refer note 42) 3,712.65 6,944.23
Trade receivables from others 7,434.18 6,344.08
Allowance for doubtful debts (net) (60.07) (58.61)
Total receivables 11,086.76 13,229.70
Break up of security detailsUnsecured, considered good 11,086.76 13,229.70
Doubtful 60.07 58.61
Total 11,146.83 13,288.31
Allowance for doubtful debts (net) (60.07) (58.61)
Total trade receivables 11,086.76 13,229.70
Trade receivables with a carrying amount of Rs. 11,146.83 (March 31, 2017: Rs. 13,288.31) have been pledged as security against working capital facilities.
As at March 31, 2018
As at March 31, 2017
13. Cash and cash equivalentsCash on hand 0.22 0.29
Balances with banks
In current accounts 1,245.04 518.74
Deposits with Maturity of less than three months 50.01 -
Total cash and cash equivalents 1,295.27 519.03
As at March 31, 2018
As at March 31, 2017
14. Bank balances other than cash and cash equivalentsUnclaimed dividend (refer note (i) below) 2.96 3.82
Margin money deposits (refer note (ii) below) 659.39 625.98
Total bank balances other than cash and cash equivalents 662.35 629.80
(i) There are no amounts due for payment to the Investor Education and Protection Fund under Section 125 of the Companies Act, 2013 as at the year end. This amount represents restricted cash.
(ii) Fixed deposits of Rs. 684.79 (March 31, 2017: Rs. 630.60) are earmarked towards working capital facilities (refer note 9(a)).
As at March 31, 2018
As at March 31, 2017
15. Assets classified as held for salePlant and machinery* 6.00 6.00
Total assets classified as held for sale 6.00 6.00
*It includes plant and machinery which management intends to sell.

Notesannexed to and forming part of the standalone balance sheet as at March 31, 2018 and the standalone statement of profit and loss for the year ended March 31, 2018(All amounts in Rupees million, unless otherwise stated)
Annual Report 2017-18 Financial StatementsThe Welspun Corp Story Governance Reports
147
Equity Shares Preference Shares
Number of shares
Par value AmountNumber of
sharesPar value Amount
16. Equity share capital and other equity 16 (a) Share capital
Authorised share capital
As at April 01, 2016 304,000,000 5 1,520.00 98,000,000 10 980.00
Increase/ (decrease) during the year - - - -
As at March 31, 2017 304,000,000 5 1,520.00 98,000,000 10 980.00
Increase/ (decrease) during the year - - - -
As at March 31, 2018 304,000,000 5 1,520.00 98,000,000 10 980.00
i) Movement in equity shares capital
Number of shares
Amount
Issued, subscribed and paid up capital
As at April 01, 2016 265,226,109 1,326.13
Increase/ (decrease) during the year - -
As at March 31, 2017 265,226,109 1,326.13
Increase/ (decrease) during the year - -
As at March 31, 2018 265,226,109 1,326.13
ii) Terms and rights attached to equity shares
Equity shares
The Company has only one class of equity shares having a par value of Rs. 5 per share. Each holder of equity shares is entitled to one vote per share. The dividend when proposed by the Board of Directors is subject to the approval of the shareholders in the ensuing Annual General Meeting except in case of interim dividend.
In the event of liquidation of the company the holders of the equity shares will be entitled to receive remaining assets of the Company after distribution of preferential amounts. The distribution will be in proportion to the number of equity shares held by the shareholders.
Preference shares
Preference shares does not carry any voting rights in the Company, except as provided in the Companies Act, 2013. Preference share will have priority over equity shares in the payment of dividend and repayment of capital.
iii) Details of shareholders holding more than 5% shares in the Company
As at March 31, 2018 No. of shares % holding
Equity shares held by
Welspun Pipes Limited 110,449,818 41.64%
Granele Limited 19,127,584 7.21%
Insight Solutions Limited 23,026,000 8.68%
Life Insurance Corporation of India Limited 19,277,980 7.27%
As at March 31, 2017 No. of shares % holding
Equity shares held by
Welspun Pipes Limited 110,449,818 41.64%
Granele Limited 28,188,889 10.63%
Insight Solutions Limited 23,026,000 8.68%
Life Insurance Corporation of India Limited 19,277,980 7.27%

Notesannexed to and forming part of the standalone balance sheet as at March 31, 2018 and the standalone statement of profit and loss for the year ended March 31, 2018(All amounts in Rupees million, unless otherwise stated)
148
iv) Aggregate number of shares issued for consideration other than cash
In FY 2014-15, the Company has issued 227,781 equity shares of Rs. 5 each as sweat equity in compliance with applicable laws including the Securities and Exchange Board of India (Issue of sweat equity) Regulations, 2002.
As at March 31, 2018
As at March 31, 2017
Other equity
16 (b) Reserves and surplus
(i) Securities premium reserve 7,769.82 7,769.82
(ii) Debenture redemption reserve 505.84 1,643.10
(iii) General reserve 353.59 227.69
(iv) Foreign currency monetary item translation difference account (35.54) (95.91)
(v) Retained earnings 9,226.12 7,127.14
Total reserves and surplus 17,819.83 16,671.84
As at March 31, 2018
As at March 31, 2017
(i) Securities premium reserve
Opening balance 7,769.82 7,769.82
Movement during the year - -
Closing balance 7,769.82 7,769.82
(ii) Debenture redemption reserve
Opening balance 1,643.10 1,142.37
Transfer from/ (to) retained earnings (1,137.26) 500.73
Closing balance 505.84 1,643.10
(iii) General reserve
Opening balance 227.69 53.09
Appropriations during the year 125.90 174.60
Closing balance 353.59 227.69
(iv) Foreign currency monetary item translation difference account (refer note 49)
Opening balance (95.91) (279.42)
Additions during the year (9.28) 5.21
Amortisation during the year 69.65 178.30
Closing balance (35.54) (95.91)
(v) Retained earnings
Opening balance 7,127.14 6,237.88
Profit for the year 1,258.18 1,746.01
Item of other comprehensive income recognised directly in retained earnings
Remeasurements of post employment benefit obligations, net of tax (10.95) (21.81)
Dividend on equity shares (132.61) (132.61)
Dividend distribution tax (27.00) (27.00)
Transfer from/ (to) debenture redemption reserve 1,137.26 (500.73)
Transfer to general reserve (125.90) (174.60)
Closing balance 9,226.12 7,127.14
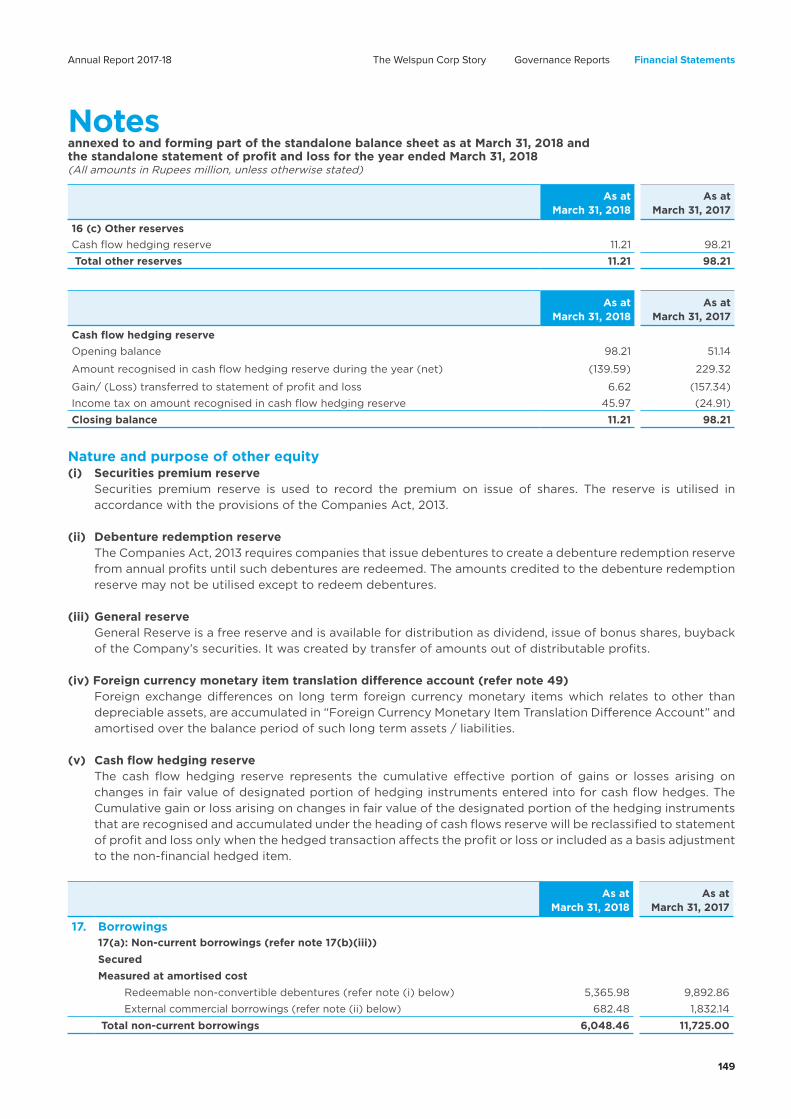
Notesannexed to and forming part of the standalone balance sheet as at March 31, 2018 and the standalone statement of profit and loss for the year ended March 31, 2018(All amounts in Rupees million, unless otherwise stated)
Annual Report 2017-18 Financial StatementsThe Welspun Corp Story Governance Reports
149
As at March 31, 2018
As at March 31, 2017
16 (c) Other reserves
Cash flow hedging reserve 11.21 98.21
Total other reserves 11.21 98.21
As at March 31, 2018
As at March 31, 2017
Cash flow hedging reserve
Opening balance 98.21 51.14
Amount recognised in cash flow hedging reserve during the year (net) (139.59) 229.32
Gain/ (Loss) transferred to statement of profit and loss 6.62 (157.34)
Income tax on amount recognised in cash flow hedging reserve 45.97 (24.91)
Closing balance 11.21 98.21
Nature and purpose of other equity(i) Securities premium reserve Securities premium reserve is used to record the premium on issue of shares. The reserve is utilised in
accordance with the provisions of the Companies Act, 2013.
(ii) Debenture redemption reserve The Companies Act, 2013 requires companies that issue debentures to create a debenture redemption reserve
from annual profits until such debentures are redeemed. The amounts credited to the debenture redemption reserve may not be utilised except to redeem debentures.
(iii) General reserve General Reserve is a free reserve and is available for distribution as dividend, issue of bonus shares, buyback
of the Company’s securities. It was created by transfer of amounts out of distributable profits.
(iv) Foreign currency monetary item translation difference account (refer note 49) Foreign exchange differences on long term foreign currency monetary items which relates to other than
depreciable assets, are accumulated in “Foreign Currency Monetary Item Translation Difference Account” and amortised over the balance period of such long term assets / liabilities.
(v) Cash flow hedging reserve The cash flow hedging reserve represents the cumulative effective portion of gains or losses arising on
changes in fair value of designated portion of hedging instruments entered into for cash flow hedges. The Cumulative gain or loss arising on changes in fair value of the designated portion of the hedging instruments that are recognised and accumulated under the heading of cash flows reserve will be reclassified to statement of profit and loss only when the hedged transaction affects the profit or loss or included as a basis adjustment to the non-financial hedged item.
As at March 31, 2018
As at March 31, 2017
17. Borrowings17(a): Non-current borrowings (refer note 17(b)(iii))
Secured
Measured at amortised cost
Redeemable non-convertible debentures (refer note (i) below) 5,365.98 9,892.86
External commercial borrowings (refer note (ii) below) 682.48 1,832.14
Total non-current borrowings 6,048.46 11,725.00

Notesannexed to and forming part of the standalone balance sheet as at March 31, 2018 and the standalone statement of profit and loss for the year ended March 31, 2018(All amounts in Rupees million, unless otherwise stated)
150
i) The debentures together with interest are secured by first charge ranking pari passu by way of mortgage/ hypothecation of entire immovable and movable property, plant and equipment of the Company both present and future.
No. of debentures Face value (Rs.)
Redemption date Rate of Interest per
annum
As at March 31, 2018
As at March 31, 2017
Nil (March 31, 2017: 5,000) 1,000,000 - - 5,000
2,000 (March 31, 2017: 2,000) 1,000,000 August 2025 9.55% 2,000 2,000
900 (March 31, 2017: 900) 1,000,000 November 2022 11.00% 900 900
Nil (March 31, 2017: 528) 1,000,000 - - 528
Nil (March 31, 2017: 1,510) 1,000,000 - - 1,510
2,500 (March 31, 2017: Nil) 1,000,000 February 2024 8.90% 2,500 -
Total* 5,400 9,938
* the above is excluding effective interest rate resulting in decrease in borrowing by Rs. 34.02 (March 31, 2017: Rs. 45.14)
ii) External commercial borrowings (ECB) of USD 24.60 million (March 31, 2017: USD 42.60 million) is secured by first charge ranking pari passu by way of mortgage/ hypothecation of entire immovable and movable property, plant and equipment of the Company both present and future. The ECB carries interest of LIBOR plus 3.60% to 4.50%.
The ECB in INR Rupees is repayable as follows
As at March 31, 2018
As at March 31, 2017
October 2017 - 907.90
April 2018 - 259.40
October 2018 912.45 907.90
April 2019 345.43 343.71
October 2019 345.43 343.71
Total* 1,603.31 2,762.62
* the above is excluding impact of effective interest rate resulting in decrease in borrowing by Rs. 8.38 (March 31, 2017: Rs. 22.58).
As at March 31, 2018
As at March 31, 2017
17(b) Current borrowingsSecured
Measured at amortised cost
Loans repayable on demand
Working capital loan from banks (refer notes (i), (ii) and (iii) below) 7.78 -
Buyers' Credit (refer notes (i), (ii) and (iii) below) - 2,136.08
Total current borrowings 7.78 2,136.08
(i) Nature of security for current borrowingsSecured by first charge ranking pari passu on hypothecation of raw materials, finished goods, work-in-progress , goods-in-transit, stores and spares and trade receivables of the Company and second charge on entire immovable and movable property, plant and equipment of the Company both present and future.

Notesannexed to and forming part of the standalone balance sheet as at March 31, 2018 and the standalone statement of profit and loss for the year ended March 31, 2018(All amounts in Rupees million, unless otherwise stated)
Annual Report 2017-18 Financial StatementsThe Welspun Corp Story Governance Reports
151
(ii) Terms of repayment and interestWorking capital loan from banks includes cash credit which are repayable on demand. Buyer’s credit is repayable upto a period of 180 days from the drawdown date and carries an interest rate of LIBOR plus maximum 50 basis points per annum.
As at March 31, 2018
As at March 31, 2017
(iii) Net debt reconciliation
Cash and cash equivalents 1,295.27 519.03
Current investments 3,283.71 5,018.64
Non-current borrowings (6,960.91) (12,632.90)
Current borrowings (7.78) (2,136.08)
(2,389.71) (9,231.31)
Financial assets Financial liabilitiesTotal
(E) = (A)+(B)-(C)-(D)
Cash and cash equivalents
(A)
Current investments
(B)
Non-current borrowings*
(C)
Current borrowings
(D)
Net debts as at April 01, 2016 301.81 7,147.63 (16,852.73) (1,865.22) (11,268.50)
Interest accrued as at April 01, 2016 - (324.27) - (324.27)
Cash flow (net) 217.22 (2,135.78) 4,243.47 (408.20) 1,916.70
Foreign exchange adjustments (net) - - (40.59) 137.34 96.75
Interest expenses - - (1,530.97) (407.28) (1,938.25)
Interest paid - - 1,542.13 407.28 1,949.41
Other non cash adjustments
Fair value adjustment - 6.79 - - 6.79
Unrealised portion of foreign exchange adjustments (net)
- -
59.85 - 59.85
Net debts as at March 31, 2017 519.03 5,018.64 (12,632.90) (2,136.08) (9,231.31)
Interest accrued as at March 31, 2017 (270.21) - (270.21)
Cash flow (net) 776.24 (1,762.09) 5,709.83 2,128.30 6,852.28
Foreign exchange adjustments (net) - - (4.53) - (4.53)
Interest expenses - - (838.17) (68.23) (906.40)
Interest paid - - 954.18 68.23 1,022.41
Other non cash adjustments
Fair value adjustment - 27.16 - - 27.16
Unrealised portion of foreign exchange adjustments (net)
- - (8.00) - (8.00)
Net debts as at March 31, 2018 1,295.27 3,283.71 (6,960.91) (7.78) (2,389.71)
Interest accrued as at March 31, 2018 - (128.89) - (128.89)
* Includes current maturities of long-term borrowings
As at March 31, 2018
As at March 31, 2017
18. Other financial liabilities
18(a) Non-current
Deposits received 1.49 -
Total other non-current financial liabilities 1.49 -

Notesannexed to and forming part of the standalone balance sheet as at March 31, 2018 and the standalone statement of profit and loss for the year ended March 31, 2018(All amounts in Rupees million, unless otherwise stated)
152
As at March 31, 2018
As at March 31, 2017
18(b) Non-current
Current maturities of long-term borrowings 912.45 907.90
Interest accrued but not due on borrowings 128.89 270.21
Interest accrued but not due on acceptances and others 108.29 68.23
Unclaimed dividend (refer note 14) 2.96 3.82
Trade deposits 14.79 14.20
Capital creditors 54.69 30.27
Liability towards claims 574.38 598.63
Other payables (refer note 42) 77.37 -
Derivatives not designated as hedges
Forward contracts 180.97 209.50
Coupon only swap - 5.63
Derivatives designated as hedges
Forward contracts 16.30 99.75
Total other current financial liabilities 2,071.09 2,208.14
Total other financial liabilities 2,072.58 2,208.14
As at March 31, 2018
As at March 31, 2017
19. Provisions
19(a) Non-current
Employee benefit obligations
Gratuity (refer note 36) 129.51 83.91
Other provisions
Provision for litigation / disputes (refer note 37) 263.00 266.35
Total non-current provisions 392.51 350.26
19(b) Current
Employee benefit obligations
Leave obligations (refer note 36) 71.59 72.41
Other provisions
Provision for claims 120.57 96.05
Total current provisions 192.16 168.46
Total provisions 584.67 518.72
As at March 31, 2018
As at March 31, 2017
20. Deferred tax liabilities (net) (refer note 38)
The balance comprises temporary differences attributable to:
Deferred tax liabilities
Property, plant and equipment 3,960.83 4,205.87
Foreign currency monetary item translation difference account 12.41 33.18
Fair valuation of investments 35.10 24.09
Effective rate of interest on borrowings 15.08 23.43
Discounting of liability - 17.26
Cash flow hedging reserve 6.01 51.98
Others 0.38 0.52
4,029.81 4,356.33

Notesannexed to and forming part of the standalone balance sheet as at March 31, 2018 and the standalone statement of profit and loss for the year ended March 31, 2018(All amounts in Rupees million, unless otherwise stated)
Annual Report 2017-18 Financial StatementsThe Welspun Corp Story Governance Reports
153
As at March 31, 2018
As at March 31, 2017
Set-off of deferred tax assets pursuant to set-off provisions
Deferred tax assets
Employee benefit obligations 70.27 66.23
Allowance for doubtful debts and advances 284.93 230.37
Government grants 1,437.22 1,407.96
Others 0.73 0.69
1,793.15 1,705.25
Tax credit (minimum alternate tax) - 631.89
Total deferred tax liabilities (net) 2,236.66 2,019.19
As at March 31, 2018
As at March 31, 2017
21. Government grants
Opening balance 4,068.30 3,970.16
Grants during the year 958.78 883.09
Less: Recognised in the statement of profit and loss (refer note 26) 914.15 784.95
Closing balance 4,112.93 4,068.30
Non Current 3,649.58 3,653.64
Current 463.35 414.66
Total government grants 4,112.93 4,068.30
Note: The Company is entitled to VAT Incentive, on its investment in the eligible property plant and equipment, on fulfillment
of the conditions stated in the scheme.
As at March 31, 2018
As at March 31, 2017
22. Other liabilities
Current
Trade advances
Related parties (refer note 42) - 1.76
Others 649.96 1,571.94
Statutory dues including provident fund and tax deducted at source 161.78 383.21
Employee dues payable 78.04 50.98
Total other current liabilities 889.78 2,007.89
As at March 31, 2018
As at March 31, 2017
23. Trade payables (refer note 43)
Current
Trade payables for acceptances 14,870.29 17,259.64
Trade payable to related parties (refer note 42) 74.75 33.95
Trade payables to others 3,339.13 2,049.30
Total trade payables 18,284.17 19,342.89

Notesannexed to and forming part of the standalone balance sheet as at March 31, 2018 and the standalone statement of profit and loss for the year ended March 31, 2018(All amounts in Rupees million, unless otherwise stated)
154
As at March 31, 2018
As at March 31, 2017
24. Current tax liabilities (net)
Opening balance 803.64 55.26
Add: Current tax payable for the year (refer note 35) 1,063.00 418.10
Add: Refund received 699.93 772.15
Less: MAT credit entitlement reversal (refer note 38) 631.89 -
Less: Taxes paid (including tax deducted at source) 273.36 441.87
Closing balance 1,661.32 803.64
As at March 31, 2018
As at March 31, 2017
25. Revenue from operations
Sale of products
Finished goods 49,942.88 38,931.67
Traded goods 77.22 3,696.47
Total revenue from operations 50,020.10 42,628.14
As at March 31, 2018
As at March 31, 2017
26. Other operating revenue/ income
Government grants
VAT income 914.15 784.95
Export benefits 656.69 600.27
Scrap sale 1,003.85 775.84
Allowance for doubtful debts (net) - 3.33
Others 4.11 33.04
Total other operating revenue/ income 2,578.80 2,197.43
As at March 31, 2018
As at March 31, 2017
27. Other income
Interest income
Loans to related party (refer note 42) 35.51 26.96
Current investments 331.37 521.10
Fixed deposits 43.05 47.80
Income tax refund 289.48 130.42
Others 87.21 191.25
Dividend income on
Current investments - 3.01
Net gain on sale/redemption of
Current investments 136.49 161.36
Other non-operating income
Rental income 22.47 22.28
Net exchange differences - 799.94
Commission income 106.97 221.08
Realised gain on settlement of derivatives 8.98 -

Notesannexed to and forming part of the standalone balance sheet as at March 31, 2018 and the standalone statement of profit and loss for the year ended March 31, 2018(All amounts in Rupees million, unless otherwise stated)
Annual Report 2017-18 Financial StatementsThe Welspun Corp Story Governance Reports
155
As at March 31, 2018
As at March 31, 2017
Provision doubtful advances written back 15.38 -
Profit on sale / discarding of tangible assets (Net) 27.69 -
Fair valuation gain on investment (net) 26.02 -
Fair value gain on derivatives 162.54 -
Miscellaneous income 9.09 5.47
Total other income 1,302.25 2,130.67
As at March 31, 2018
As at March 31, 2017
28. Cost of materials consumedRaw materials at the beginning of the year 9,128.69 4,087.93
Add: Purchases 36,414.07 33,494.18
Less : Raw materials at the end of the year 4,814.13 9,128.69
Total cost of materials consumed 40,728.63 28,453.42
As at March 31, 2018
As at March 31, 2017
29. Purchases of stock-in-tradePurchases of stock-in-trade 76.61 3,468.66
Total purchases of stock-in-trade 76.61 3,468.66
As at March 31, 2018
As at March 31, 2017
30. Changes in inventories of work-in progress and finished goodsOpening balance Work-in-progress 1,138.18 797.20
Finished goods 1,971.56 1,927.64
Total opening balance 3,109.74 2,724.84
Closing balance Work-in-progress 851.99 1,138.18
Finished goods 3,485.48 1,971.56
Total closing balance 4,337.47 3,109.74
Total changes in inventories of work-in progress and finished goods (1,227.73) (384.90)
As at March 31, 2018
As at March 31, 2017
31. Employee benefit expenseSalaries, wages and bonus 1,630.99 1,651.46
Contribution to provident and other funds (refer note below) 86.46 85.67
Gratuity expense (refer note 36) 28.86 21.08
Staff welfare expenses 53.05 86.98
Total employee benefit expense 1,799.36 1,845.19
Note:
Defined contribution plans
i. Employers' Contribution to Provident Fund and Employee’s Pension Scheme, 1995
ii. Employees' State Insurance Act, 1948
iii. Superannuation fund
During the year, the Company has recognised the following amounts in the statement of profit and loss:

Notesannexed to and forming part of the standalone balance sheet as at March 31, 2018 and the standalone statement of profit and loss for the year ended March 31, 2018(All amounts in Rupees million, unless otherwise stated)
156
As at March 31, 2018
As at March 31, 2017
Employer's Contribution to Provident Fund 72.03 70.58
Employer's Contribution to Employees State Insurance 0.84 0.82
Employer's Contribution to Employees Pension Scheme 8.01 8.37
Employer's Contribution to Superannuation fund 5.58 5.90
Total expenses recognised in the statement of profit and loss 86.46 85.67
As at March 31, 2018
As at March 31, 2017
32. Depreciation and amortisation expense (Refer notes 3 and 5)
Depreciation of property, plant and equipment 2,318.85 2,389.30
Amortisation of intangible assets 56.45 53.15
Total depreciation and amortisation expense 2,375.30 2,442.45
As at March 31, 2018
As at March 31, 2017
33. Other expenses
Consumption of stores and spares 1,510.58 1,240.46
Labour charges 212.56 177.37
Coating and other job charges 166.77 144.43
Power, fuel and water charges 1,208.41 836.99
Freight, material handling and transportation 1,675.61 1,440.19
Rental charges (refer note 47) 76.35 72.55
Rates and taxes 23.62 -
Repairs and maintenance
Plant and machinery 81.48 93.10
Buildings 25.45 97.26
Others 184.65 208.17
Travel and conveyance expenses 157.57 155.85
Communication expenses 8.25 11.34
Legal and professional fees 124.47 112.73
Insurance 83.76 83.98
Directors' sitting fees (refer note 42) 3.37 3.25
Printing and stationery 8.90 13.47
Security charges 30.92 31.79
Membership and fees 25.73 30.23
Vehicle expenses 7.83 12.12
Net exchange differences 499.85 -
Payment to auditors (refer note (i) below) 15.27 11.06
Product compensation and claims 0.76 -
Sales promotion expenses 13.29 41.47
Commission on sales to agents 72.45 43.43
Allowance for doubtful debts (net) 1.46 -
Loss on sale of non-current investments (net) - 0.10
Loss on disposal of property, plant and equipment (net) - 9.77
Expenditure towards corporate social responsibility (refer notes (ii) below and 42) 3.89 -
Fair valuation loss on investments (net) - 45.81
Fair value losses on derivatives not designated as hedges (net) - 51.79
Realised loss on settlement of derivatives - 44.01
Miscellaneous expenses 62.04 40.21
Total other expenses 6,285.29 5,052.93
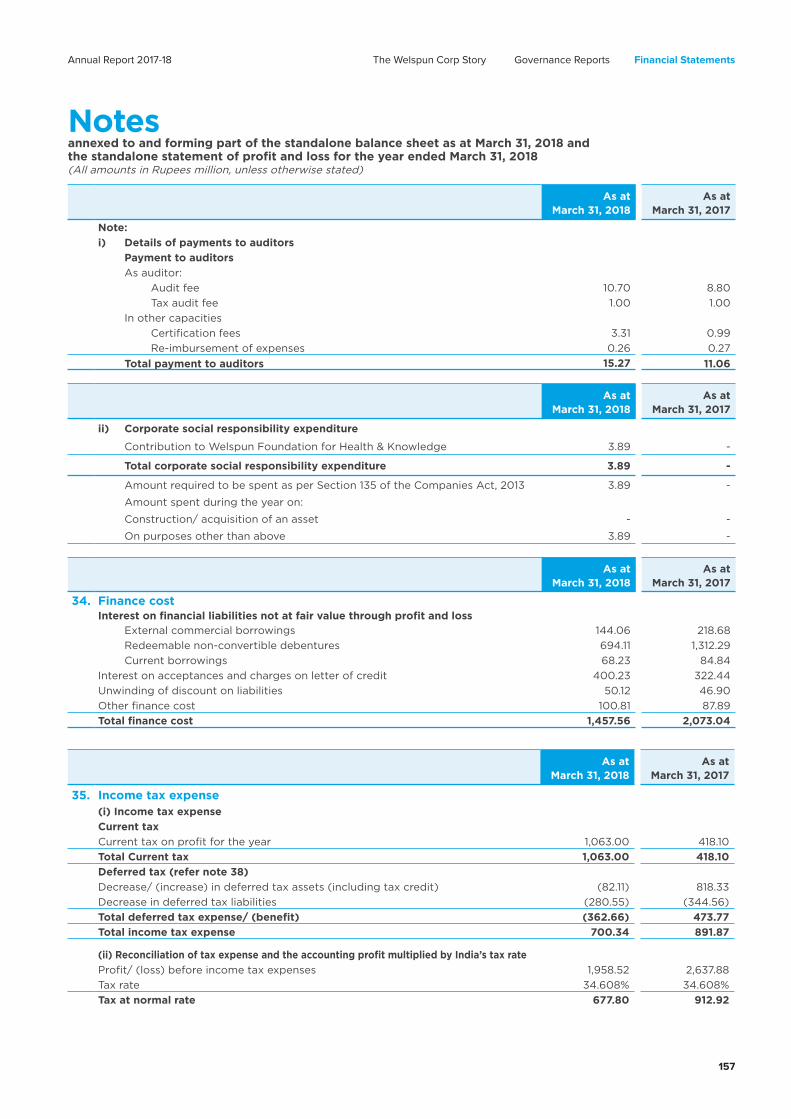
Notesannexed to and forming part of the standalone balance sheet as at March 31, 2018 and the standalone statement of profit and loss for the year ended March 31, 2018(All amounts in Rupees million, unless otherwise stated)
Annual Report 2017-18 Financial StatementsThe Welspun Corp Story Governance Reports
157
As at March 31, 2018
As at March 31, 2017
Note:
i) Details of payments to auditors
Payment to auditors
As auditor:
Audit fee 10.70 8.80
Tax audit fee 1.00 1.00
In other capacities
Certification fees 3.31 0.99
Re-imbursement of expenses 0.26 0.27
Total payment to auditors 15.27 11.06
As at March 31, 2018
As at March 31, 2017
ii) Corporate social responsibility expenditure
Contribution to Welspun Foundation for Health & Knowledge 3.89 -
Total corporate social responsibility expenditure 3.89 -
Amount required to be spent as per Section 135 of the Companies Act, 2013 3.89 -
Amount spent during the year on:
Construction/ acquisition of an asset - -
On purposes other than above 3.89 -
As at March 31, 2018
As at March 31, 2017
34. Finance costInterest on financial liabilities not at fair value through profit and loss External commercial borrowings 144.06 218.68
Redeemable non-convertible debentures 694.11 1,312.29
Current borrowings 68.23 84.84
Interest on acceptances and charges on letter of credit 400.23 322.44
Unwinding of discount on liabilities 50.12 46.90
Other finance cost 100.81 87.89
Total finance cost 1,457.56 2,073.04
As at March 31, 2018
As at March 31, 2017
35. Income tax expense(i) Income tax expense
Current tax
Current tax on profit for the year 1,063.00 418.10
Total Current tax 1,063.00 418.10
Deferred tax (refer note 38)
Decrease/ (increase) in deferred tax assets (including tax credit) (82.11) 818.33
Decrease in deferred tax liabilities (280.55) (344.56)
Total deferred tax expense/ (benefit) (362.66) 473.77
Total income tax expense 700.34 891.87
(ii) Reconciliation of tax expense and the accounting profit multiplied by India’s tax rate
Profit/ (loss) before income tax expenses 1,958.52 2,637.88
Tax rate 34.608% 34.608%
Tax at normal rate 677.80 912.92

Notesannexed to and forming part of the standalone balance sheet as at March 31, 2018 and the standalone statement of profit and loss for the year ended March 31, 2018(All amounts in Rupees million, unless otherwise stated)
158
As at March 31, 2018
As at March 31, 2017
Tax effect of amounts which are not deductible/ (taxable) in calculating taxable income
Dividend income - (1.04)
Expense/ (income) on which no deferred tax was required to be recognised (1.32) (13.43)
Items subject to differential tax rate (1.55) 4.99
Change in tax rate (basis adjustment) 25.41 -
Others - (11.57)
Total Income tax expense 700.34 891.87
(iii) There are certain income-tax related legal proceedings which are pending against the Company. Potential liabilities, if any have been adequately provided for, and the Company does not currently estimate any probable material incremental tax liabilities in respect of these matters.
36. Employee benefit obligations
(i) Leave obligationsThe leave obligations cover the Company’s liability for earned leave.
(ii) Post-employment obligations - gratuityThe Company has a defined benefit gratuity plan in India, governed by the Payment of Gratuity Act, 1972. The plan entitles an employee, who has rendered at least five years of continuous service, to gratuity at the rate of fifteen day wages for every completed year of service or part thereof in excess of six months, based on the rate of wages last drawn by the employee concerned. The gratuity plan is a funded plan and the Company makes contributions to recognised funds in India.
This defined benefit plans expose the Company to actuarial risks, such as interest rate risk and market (investment) risk.
(iii) Balance sheet amounts - gratuity The amounts recognised in the balance sheet and the movements in the net defined benefit obligations over the year are as follows:
Present value of obligations
Fair value of plan assets
Net amount
April 01, 2016 160.02 (130.57) 29.45
Current service cost 18.72 - 18.72
Interest expense/(income) 12.82 (10.46) 2.36
Total amount recognised in profit or loss 31.54 (10.46) 21.08
Remeasurements
Return on plan assets excluding amount included in interest expense - (2.09) (2.09)
Experience losses 4.98 - 4.98
Loss from change in financial assumptions 30.49 - 30.49
Total amount recognised in other comprehensive income 35.47 (2.09) 33.38
Benefit payment (24.26) 24.26 -
March 31, 2017 202.77 (118.86) 83.91

Notesannexed to and forming part of the standalone balance sheet as at March 31, 2018 and the standalone statement of profit and loss for the year ended March 31, 2018(All amounts in Rupees million, unless otherwise stated)
Annual Report 2017-18 Financial StatementsThe Welspun Corp Story Governance Reports
159
Present value of obligations
Fair value of plan assets
Net amount
April 01, 2017 202.77 (118.86) 83.91
Current service cost 22.51 - 22.51
Interest expense/(income) 15.35 (9.00) 6.35
Total amount recognised in profit or loss 37.86 (9.00) 28.86
Remeasurements
Return on plan assets excluding amount included in interest income - 4.20 4.20
Experience losses 18.68 - 18.68
Loss from change in financial assumptions (6.14) - (6.14)
Total amount recognised in other comprehensive income 12.54 4.20 16.74
Benefit payment (33.44) 33.44 -
March 31, 2018 219.73 (90.22) 129.51 The net liabilities disclosed above relating to funded plans are as follows:
As at March 31, 2018
As at March 31, 2017
Present value of funded obligations 219.73 202.77
(90.22) (118.86)
Deficit of funded plan 129.51 83.91
Non-current (refer note 19(a)) 129.51 83.91
(iv) Significant actuarial assumptions are as follows:
As at March 31, 2018
As at March 31, 2017
Discount rate 7.86% 7.57%
Salary growth rate 6.00% 6.00%
(v) Sensitivity analysisThe sensitivity of the defined benefit obligation to changes in the weighted principal assumptions is:
Assumptions Impact on defined benefit obligation
Change in assumption (%)
Increase in assumption (Rs.)
Decrease in assumption (Rs.)
As at March 31,
2018
As at March 31,
2017
As at March 31,
2018
As at March 31,
2017
As at March 31,
2018
As at March 31,
2017Discount rate 1.00% 1.00% Decrease by 22.60 21.54 Increase by 26.60 25.50
Salary growth rate 1.00% 1.00% Increase by 26.84 25.64 Decrease by 23.17 22.03
(vi) Risk exposureThrough its defined benefit plans, the Company is exposed to a number of risks, the most significant of which is asset volatility. The plan liabilities are calculated using a discount rate set with reference to bond yields; if plan assets underperform this yield, this will create a deficit. The plan assets are invested by the Group in Kotak Group Gratuity Fund and IndiaFirst Employee Benefits Plan. The Group intends to maintain these investments in the continuing years.
(vii) Defined benefit liability and employer contributionsExpected contribution to post-employment benefit plans for the year ending March 31, 2019 is Rs. 51.68 (March 31, 2018: Rs. 50.57).

Notesannexed to and forming part of the standalone balance sheet as at March 31, 2018 and the standalone statement of profit and loss for the year ended March 31, 2018(All amounts in Rupees million, unless otherwise stated)
160
The weighted average duration of the defined benefit obligation is 10 years (2017 - 10 years). The expected maturity analysis of undiscounted gratuity benefits is as follows:
Less than a year
Between 1-2 years
Between 2-5 years
Over 5 years Total
March 31, 2018Defined benefit obligations- Gratuity 16.15 5.19 35.79 123.27 180.40
March 31, 2017Defined benefit obligations- Gratuity 15.46 5.06 27.93 114.39 162.84
37. Movements in provision for litigation/ disputes (refer note 19 (a)) Movements in each class of provisions during the financial year ended March 31, 2018 are set out below:
As at March 31, 2018
Excise Duty Service TaxValue Added
TaxOther Litigation
and DisputesTotal
Opening balance as at April 01, 2017 136.22 83.18 7.93 39.02 266.35
Provided during the year - 13.08 - - 13.08
Provision reversed during the year (16.05) (0.38) (16.43)
Closing balance as at March 31, 2018 120.17 95.88 7.93 39.02 263.00
Movements in each class of provisions during the financial year ended March 31, 2017 are set out below:
As at March 31, 2017
Excise Duty Service TaxValue Added
TaxOther Litigation
and DisputesTotal
Opening balance as at April 01, 2016 136.22 88.45 7.93 39.02 271.62
Provided during the year - 0.11 - - 0.11
Provision reversed during the year - (5.38) - - (5.38)
Closing balance as at March 31, 2017 136.22 83.18 7.93 39.02 266.35
Note: There are uncertainties regarding the timing and amount of the provisions. Changes in underlying facts and circumstances for each provision could result in differences in the amounts provided for and the actual cash outflow. Therefore, long term provisions are presented on non-discounted basis.

Notesannexed to and forming part of the standalone balance sheet as at March 31, 2018 and the statement of profit and loss for the year ended March 31, 2018
Annual Report 2017-18 Financial StatementsThe Welspun Corp Story Governance Reports
161
De
ferr
ed
tax l
iab
ilit
ies
De
ferr
ed
tax a
sse
ts
Tax c
red
it
(min
imu
m
alt
ern
ate
tax)
Ne
t
de
ferr
ed
tax
liab
ilit
ies
Pro
per
ty,
pla
nt
and
equ
ipm
ent
Fo
reig
n
curr
en
cy
mo
ne
tary
ite
m
tran
slati
on
dif
fere
nce
acc
ou
nt
Fai
r
valu
atio
n o
f
inve
stm
ents
Eff
ect
ive
rate
of
inte
rest
on
bo
rro
win
gs
Dis
cou
nti
ng
of
liab
ility
Cash
flo
w
he
dg
ing
rese
rve
Oth
ers
Tota
l
de
ferr
ed
tax
liab
ilit
ies
Em
plo
yee
be
ne
fit
ob
lig
ati
on
s
All
ow
an
ce
for
do
ub
tfu
l
de
bts
an
d
ad
van
ces
Una
bso
rbed
bus
ines
s
loss
es
Go
vern
men
t
gra
nts
Oth
ers
Tota
l
de
ferr
ed
tax
asse
ts
As
at
Ap
ril
01,
20
16 4
,44
3.7
8
96
.70
3
5.9
4
38
.28
3
4.2
1 2
7.0
7
- 4
,675
.98
3
0.6
5
19
0.5
4
1,2
81.
03
1
,374
.00
4
.76
2,8
80
.98
2
62
.92
1
,53
2.0
8
Ch
arg
ed
/ (c
red
ited
) -
to p
rofi
t an
d lo
ss (
237.
91)
(6
3.5
2)
(11
.85
) (
14.8
5)
(16
.95
) -
0
.52 (
34
4.5
6)
24
.01
39
.83
(
1,28
1.0
3)
33
.96
(
4.0
7)
(1,18
7.3
0)
36
8.9
7
473
.77
to o
ther
com
pre
hen
sive
inco
me
-
-
-
-
-
24
.91
-
24
.91
11.
57
-
-
-
-
11.
57
-
13
.34
As
at
Marc
h 3
1, 2
017
4,2
05
.87
3
3.1
8
24
.09
2
3.4
3
17.
26
5
1.9
8
0.5
2 4
,35
6.3
3
66
.23
2
30
.37
-
1
,40
7.9
6
0.6
9 1
,70
5.2
5
63
1.8
9
2,0
19.1
9
Ch
arg
ed
/ (c
red
ited
)
to p
rofi
t an
d lo
ss (
24
5.0
4)
(20
.77)
11.0
1 (
8.3
5)
(17
.26
) -
(
0.14
) (
28
0.5
5)
(1.75
) 5
4.5
6
-
29
.26
0
.04
8
2.11
-
(3
62.6
6)
to o
ther
com
pre
hen
sive
inco
me
-
-
-
-
-
(4
5.9
7)
-
(4
5.9
7)
5.7
9
-
-
-
-
5.7
9
-
(5
1.76
)
MA
T c
red
it e
nti
tlem
en
t re
vers
al
-
-
-
-
-
-
-
-
-
-
-
-
(6
31.
89
) 6
31.
89
As
at
Marc
h 3
1, 2
018
3,9
60
.83
1
2.4
1 3
5.1
0
15
.08
-
6
.01
0.3
8 4
,02
9.8
1 7
0.2
7
28
4.9
3
-
1,4
37.
22
0
.73
1
,79
3.1
5
-
2,2
36
.66
(All
am
ou
nts
in
Ru
pees
mill
ion
, un
less
oth
erw
ise s
tate
d)
38
. M
ove
me
nt
in d
efe
rre
d t
ax l
iab
ilit
ies
an
d d
efe
rre
d t
ax a
sse
ts (
refe
r n
ote
20
) :

Notesannexed to and forming part of the standalone balance sheet as at March 31, 2018 and the standalone statement of profit and loss for the year ended March 31, 2018(All amounts in Rupees million, unless otherwise stated)
162
As at March 31, 2018 As at March 31, 2017
FVPL Amortised Cost FVPL Amortised Cost
Financial assets
Investments Equity instruments 150.90 - 135.16 -
Preference shares 1,723.13 - 1,715.51 -
Bonds 3,268.28 - 4,639.92 -
Mutual fund 15.43 - 378.72 -
Others 19.91 - 18.04
Loans Loans to joint venture - 354.11 - 256.07
Loans to employees - 5.62 - 5.98
Trade receivables - 11,086.76 - 13,229.70
Cash and cash equivalents - 1,295.27 - 519.03
Bank balances other than cash and cash equivalents - 662.35 - 629.80
Other financial assets Security deposits - 274.93 - 271.86 Term deposits with maturity more than 12 months
- 25.40 - 4.62
Derivatives designated as hedges Forward contracts 12.10 - 227.63 -
Interest rate swap 21.42 - 22.30 -
Derivatives not designated as hedges Forward contracts 132.31 - - -
Coupon only swap 1.08 - 7.16 -
Option contracts 2.15 - - -
Others 223.55 - 253.94
Total financial assets 5,346.71 13,927.99 7,144.44 15,171.00
Financial liabilitiesBorrowings (includes interest accrued and current maturities of long-term debt)
- 7,097.58 - 15,039.19
Trade payables - 18,284.17 - 19,342.89
Other financial liabilities
Derivatives designated as hedges Forward contracts 16.30 - 99.75 -
Derivatives not designated as hedges Forward contracts 180.97 - 209.50 -
Coupon only swap - - 5.63 -
Others - 833.97 - 715.15
Total financial liabilities 197.27 26,215.72 314.88 35,097.23
(i) Fair value hierarchy This section explains the judgements and estimates made in determining the fair values of the financial instruments that are
(a) recognised and measured at fair value and (b) measured at amortised cost and for which fair values are disclosed in the financial statements. To provide an indication about the reliability of the inputs used in determining fair value, the Company has classified its financial instruments into the three levels prescribed under the accounting standard. An explanation of each level follows underneath the table.
39. Fair value Mesurements Financial Instruments by Category

Notesannexed to and forming part of the standalone balance sheet as at March 31, 2018 and the standalone statement of profit and loss for the year ended March 31, 2018(All amounts in Rupees million, unless otherwise stated)
Annual Report 2017-18 Financial StatementsThe Welspun Corp Story Governance Reports
163
Financial assets and liabilities measured at fair value - recurring fair value measurements as at March 31, 2018
Level 1 Level 2 Level 3 Total
Financial assets
Financial Investments at FVPL
Equity instruments - - 150.90 150.90
Preference shares - - 1,723.13 1,723.13
Bonds - 3,268.28 - 3,268.28
Mutual fund 15.43 - 15.43
Others 19.91 - - 19.91
Derivatives designated as hedges
Forward contracts - 12.10 - 12.10
Interest rate swap - 21.42 - 21.42
Derivatives not designated as hedges
Forward contracts - 132.31 - 132.31
Coupon only swap - 1.08 - 1.08
Option contracts - 2.15 - 2.15
Total financial assets 19.91 3,452.77 1,874.03 5,346.71
Financial liabilities
Derivatives designated as hedges
Forward contracts - 16.30 - 16.30
Derivatives not designated as hedges
Forward contracts - 180.97 - 180.97
Total financial liabilities - 197.27 - 197.27
Assets and liabilities which are measured at amortised cost for which fair value are disclosed as at March 31, 2018
Level 1 Level 2 Level 3 Total
Financial assets
LoansLoans to joint venture - - 354.11 354.11
Loans to employees - - 5.62 5.62
Other financial assetsSecurity deposits - - 274.93 274.93
Term deposits with maturity more than 12 months
- - 25.40 25.40
Others - - 223.55 223.55
Total financial assets - - 883.61 883.61
Financial liabilitiesBorrowings - - 7,097.58 7,097.58
Other financial liabilitiesOthers - - 833.97 833.97
Total financial liabilities - - 7,931.55 7,931.55
Financial assets and liabilities measured at fair value - recurring fair value measurements as at March 31, 2017
Level 1 Level 2 Level 3 Total
Financial assets
Financial investments at FVPL
Equity instruments - - 135.16 135.16
Preference shares - - 1,715.51 1,715.51
Bonds - 4,639.92 - 4,639.92

Notesannexed to and forming part of the standalone balance sheet as at March 31, 2018 and the standalone statement of profit and loss for the year ended March 31, 2018(All amounts in Rupees million, unless otherwise stated)
164
Level 1 Level 2 Level 3 Total
Mutual fund - 378.72 - 378.72
Others 18.04 - - 18.04
Derivatives designated as hedges
Forward contracts - 227.63 - 227.63
Interest rate swap - 22.30 - 22.30
Derivatives not designated as hedges
Coupon only swap - 7.16 - 7.16
Total financial assets 18.04 5,275.73 1,850.67 7,144.44
Financial liabilities
Derivatives designed as hedges
Forward contracts - 99.75 - 99.75
Derivatives not designated as hedges
Forward contracts - 209.50 - 209.50
Coupon only swap - 5.63 - 5.63
Total financial liabilities - 314.88 - 314.88
Assets and liabilities which are measured at amortised cost for which fair value are disclosed as at March 31, 2017
Level 1 Level 2 Level 3 Total
Financial assets
Loans
Loans to joint venture - - 256.07 256.07
Loans to employees - - 5.98 5.98
Other financial assets
Security deposits - - 271.86 271.86
Term deposits with maturity more than 12 months
4.62 4.62
Others - - 253.94 253.94
Total financial assets - - 792.47 792.47
Financial liabilities
Borrowings - - 15,039.19 15,039.19
Other financial liabilities
Others - - 715.15 715.15
Total financial liabilities - - 15,754.34 15,754.34
The following table provides an analysis of financial instruments that are measured subsequent to initial recognition at fair value, grouped into Level 1 to Level 3, as described below.
Level 1: This hierarchy includes financial instruments measured using quoted prices. This includes investment in Standard Chartered Bank PLC Indian Depository Receipt.
Level 2: The fair value of financial instruments that are not traded in an active market is determined using valuation techniques which maximise the use of observable market data and rely as little as possible on entity-specific estimates. The Company has derivatives which are designated as hedges and which are not designated as hedges, bonds and mutual funds for which all significant inputs required to fair value an instrument falls under level 2.
Level 3: If one or more of the significant inputs is not based on observable market data, the instrument is included in level 3. This is the case for unlisted equity securities and unlisted preference shares.
(ii) Valuation technique used to determine fair value Specific valuation techniques used to value financial instruments include:
- investment in Standard Chartered Bank PLC Indian Depository Receipt is valued using the closing price at National Stock Exchange (NSE) at the reporting period.

Notesannexed to and forming part of the standalone balance sheet as at March 31, 2018 and the standalone statement of profit and loss for the year ended March 31, 2018(All amounts in Rupees million, unless otherwise stated)
Annual Report 2017-18 Financial StatementsThe Welspun Corp Story Governance Reports
165
- the fair value of forward contracts is determined using forward exchange rates prevailing with Authorised Dealers dealing in foreign exchange.
- the fair value of interest rate swaps, options contracts and coupon only swap is calculated as the present value of the estimated future cash flows based on observable yield curves.
- the use of Net Assets Value (‘NAV’) for valuation of mutual fund investment. NAV represents the price at which the issuer will issue further units and will redeem such units of mutual fund to and from the investors.
- the fair value of quoted bonds are derived based on the indicative quotes of price and yields prevailing in the market or latest available prices.
(iii) Fair value measurements using significant unobservable inputs (level 3)The following table presents the changes in level 3 items for the year ended March 31, 2018 and March 31, 2017:
Unlisted equity shares
Unlisted preference
shares
Total
As at April 01, 2016 120.71 1,750.29 1,871.00
Gain/ (loss) recognised in profit or loss 14.45 (34.78) (20.33)
As at March 31, 2017 135.16 1,715.51 1,850.67
Gain recognised in profit or loss 15.74 7.62 23.36
As at March 31, 2018 150.90 1,723.13 1,874.03
Unrealised gain/ (loss) recognised in profit or loss related to assets held at the end of the reporting period
Year ended March 31, 2018 15.74 7.62 23.36
Year ended March 31, 2017 14.45 (34.78) (20.33) (iv) Valuation Inputs and relationships to fair value
Fair valueSignificant
unobservable inputs*
Probability weighted average
SensitivityAs at March 31,
2018
As at March 31,
2017
As at March 31,
2018
As at March 31,
2017
Unlisted equity shares 150.90 135.16 Risk adjusted discount rate
10.62% 10.54%
The estimated fair value would increase/ (decrease) if -Discount rate were lower/
(higher)
Unlisted preference shares
194.52 194.52 Risk adjusted discount rate
10.00% 10.00%
The estimated fair value would increase/ (decrease) if -Discount rate were lower/
(higher)
Unlisted preference shares
1,528.61 1,520.99 Risk adjusted discount rate
7.00% 7.00%
The estimated fair value would increase/ (decrease) if -Discount rate were lower/
(higher)
(v) Valuation processes: The fair value of unlisted equity instruments and unlisted preference shares are determined using discounted cash flow analysis by independent valuer.

Notesannexed to and forming part of the standalone balance sheet as at March 31, 2018 and the standalone statement of profit and loss for the year ended March 31, 2018(All amounts in Rupees million, unless otherwise stated)
166
(vi) Fair value of Financial assets and liabilities measured at amortised cost
As at March 31, 2018 As at March 31, 2017
Carrying Amount
Fair Value Carrying Amount
Fair Value
Financial Assets
Loans
Loans to joint venture 354.11 354.11 256.07 256.07
Loans to employees 5.62 5.62 5.98 5.98
Other financial assets
Security deposits 274.93 274.93 271.86 271.86
Term deposits with maturity more than 12 months
25.40 25.40 4.62 4.62
Others 223.55 223.55 253.94 253.94
Total 883.61 883.61 792.47 792.47
Financial liabilities
Borrowings 7,097.58 7,097.58 15,039.19 15,039.19
Other financial liabilities
Others 833.97 833.97 715.15 715.15
Total 7,931.55 7,931.55 15,754.34 15,754.34 a) The carrying amount of trade receivables, cash and cash equivalents, bank balances other than cash and cash equivalents,
loans, other financial assets, borrowings, trade payables and other financial liabilities are considered to be the same as their value, due to their short-term nature.
b) The fair values and carrying value of loans, term deposits with maturity period more than 12 months, security deposits, borrowings and other financial liabilities (other than those covered in above note (a)) are materially the same.
40. Financial risk management The Company’s activities expose it to market risk, liquidity risk and credit risk. In order to minimise any adverse effects on the financial performance of the Company, derivative financial instruments, such as foreign exchange forward contracts are entered to hedge certain foreign currency risk exposures and interest rate swaps to hedge variable interest rate exposures. Derivatives are used exclusively for hedging purposes and not as trading or speculative instruments.
This note explains the sources of risk which the Company is exposed to and how the Company manages the risk and the impact of hedge accounting in the financial statements.
Risk Exposure arising from Measurement Management
Credit risk Trade receivables and other financial assets
Ageing analysis Diversification of bank deposits, credit limits and letters of credit
Liquidity risk Borrowings and other financial liabilities
Borrowings maturity and cash flow forecasts
Availability of committed credit lines and borrowing facilities
Market risk – foreign currency risk
Recognised financial assets and liabilities not denominated in Rupees
Sensitivity analysis Forward foreign exchange contracts
Market risk – interest rate risk
Borrowings Sensitivity analysis Interest rate swaps
Market risk – security prices risk
Investments in bonds and mutual funds
Sensitivity analysis Portfolio diversification
The Company’s risk management is carried out by treasury department under policies approved by the board of directors. Treasury department identifies, evaluates and hedges financial risks. The board provides written principles for overall risk management, as well as policies covering specific areas, such as foreign exchange risk, interest rate risk, credit risk, use of derivative financial instruments and non-derivative financial instruments and investment of excess liquidity. There is no change in objectives, policies and process for managing the risk and methods used to measure the risk as compared to previous year.

Notesannexed to and forming part of the standalone balance sheet as at March 31, 2018 and the standalone statement of profit and loss for the year ended March 31, 2018(All amounts in Rupees million, unless otherwise stated)
Annual Report 2017-18 Financial StatementsThe Welspun Corp Story Governance Reports
167
(I) Credit riskCredit risk is the risk that counterparty will not meet its obligation under a financial instrument or customer contract, leading to a financial loss. The Company is exposed to credit risk from its operating activities (primarily trade receivables) and from its financing activities, including deposits with bank and financial institution, foreign exchange transactions and other financial instruments. The Company considers the probability of default upon initial recognition of asset and whether there has been a significant increase in credit risk on an ongoing basis throughout each reporting period. To assess whether there is a significant increase in credit risk the Company compares the risk of a default occurring on the asset as at the reporting date with the risk of default as at the date of initial recognition.
a) Trade receivables Trade receivables are typically unsecured and are derived from revenue earned from customers. Credit risk has
been managed by the Company through credit approvals, establishing credit limits and continuously monitoring the creditworthiness of customers to which the Company grants credit terms in the normal course of business. On account of adoption of Ind AS 109, the Company uses expected credit loss model to assess the impairment loss or gain. Top three customer contributes 61.02% (March, 31 2017: 51.4%) of total revenue. Trade receivables are regularly monitored and shipment to major customer are generally covered by letter of credit.
Past exposure suggest a low/ minimum credit risk or allowances of debtors. Exposures of trade receivable (net of allowance) broken into ageing bucket is given below:
0-120 Days More than 120 Days
Total
March 31, 2018 10,496.93 589.83 11,086.76
March 31, 2017 12,456.11 773.59 13,229.70
b) Other financial assets The Company maintains exposure in cash and cash equivalents, term deposits with banks, derivative financial
instruments, investments in government securities and bonds and investments in mutual funds. The Company has diversified portfolio of investment with various number of counterparties which have good credit ratings, good reputation and hence the risk is reduced. Individual risk limits are set for each counterparty based on financial position, credit rating and past experience. Credit limits and concentration of exposures are actively monitored by the Company.
(II) Liquidity risk Liquidity risk is the risk that the Company will not be able to meet its financial obligations as they become due. The Company
manages liquidity risk by maintaining adequate reserves, banking facilities and reserve borrowing facilities (comprising the undrawn borrowing facilities below), by continuously monitoring forecast and actual cash flows and matching the maturity profiles of financial assets and liabilities.
a) Financing arrangements The Company had access to the following undrawn borrowing facilities for working capital at the end of the reporting
period:
As at March 31, 2018
As at March 31, 2017
Floating rate
Expiring within one year 3,772.22 1,864.60
Total 3,772.22 1,864.60
b) Maturities of financial liabilities The tables below analyse the Company’s financial liabilities into relevant maturity groupings based on their contractual
maturities for:
All non-derivative financial liabilities, and

Notesannexed to and forming part of the standalone balance sheet as at March 31, 2018 and the standalone statement of profit and loss for the year ended March 31, 2018(All amounts in Rupees million, unless otherwise stated)
168
Derivative financial instruments for which the contractual maturities are essential for an understanding of the timing of the cash flows.
The amounts disclosed in the table are the contractual undiscounted cash flows. Balances due within 12 months equal their carrying balances as the impact of discounting is not material.
As at March 31, 2018
Contractual maturities of financial liabilities
< 1 Year 1 - 3 years 3 - 5 years > 5 years Total Carrying value
Non-derivatives
Borrowings (includes interest accrued and current maturities of long-term debt)
1,532.16 3,763.37 3,020.87 1,539.14 9,855.54 7,097.58
Trade payables 18,284.17 - - - 18,284.17 18,284.17
Other financial liabilities 832.27 1.70 - - 833.97 833.76
Total non-derivative liabilities 20,648.60 3,765.07 3,020.87 1,539.14 28,973.68 26,215.51
Derivatives
Forward contracts 197.27 - - - 197.27 197.27
Total derivative liabilities 197.27 - - - 197.27 197.27
As at March 31, 2017
Contractual maturities of financial liabilities
< 1 Year 1 - 3 years 3 - 5 years > 5 years Total Carrying value
Non-derivatives
Borrowings (includes interest accrued and current maturities of long-term debt)
4,459.78 6,500.33 2,598.15 7,038.71 20,596.97 15,039.19
Trade payables 19,342.89 - - - 19,342.89 19,342.89
Other financial liabilities 715.15 - - - 715.15 715.15
Total non-derivative liabilities 24,517.82 6,500.33 2,598.15 7,038.71 40,655.01 35,097.23
Derivatives
Forward contracts 309.25 - - - 309.25 309.25
Coupon only swap 5.30 - - - 5.30 5.63
Total derivative liabilities 314.55 - - - 314.55 314.88
(III) Market risk - foreign currency risk The Company undertakes transactions denominated in foreign currencies; consequently, exposures to exchange rate
fluctuations arise. Exchange rate exposures are managed within approved policy parameters utilising forward foreign exchange contracts.
The Company uses foreign currency forward contracts to hedge its risks associated with foreign currency fluctuations relating to certain firm commitments, highly probable forecast transactions and foreign currency required at the settlement date of certain receivables/payables. The use of foreign currency forward contracts is governed by the Company’s strategy approved by the board of directors, which provide principles on the use of such forward contracts consistent with the Company’s risk management policy and procedures.

Notesannexed to and forming part of the standalone balance sheet as at March 31, 2018 and the standalone statement of profit and loss for the year ended March 31, 2018(All amounts in Rupees million, unless otherwise stated)
Annual Report 2017-18 Financial StatementsThe Welspun Corp Story Governance Reports
169
a) Foreign currency risk exposure The Company’s exposure to foreign currency risk at the end of the reporting period expressed in equivalent in INR Rupees is as follows:
As at March 31, 2018 As at March 31, 2017
USD EUR Others USD EUR Others
Financial assets
Investment in preference share 1,528.61 - - 1,520.99 - -
Trade receivables 351.12 2,057.15 - 366.32 3,605.51 -
Other financial assets 37.84 - - - - -
Derivatives not designated as hedges
Forward contracts - (1,817.59) - - - -
Derivatives designated as hedges
Forward contracts (1,372.20) - - (686.48) (6,410.64) -
Net exposure to foreign currency risk (assets)
545.37 239.56 - 1,200.83 (2,805.13) -
Financial liabilities
Borrowing 1,594.93 - - 4,876.12 - -
Trade payables 12,094.94 3,267.17 12.58 12,542.18 4,503.34 4.09
Other financial liabilities 804.66 3.91 - 728.73 4.73 -
Derivatives not designated as hedges
Forward contracts (10,531.18) (3,916.79) - (3,840.42) (834.19) -
Option contracts (654.15) - - - - -
Derivatives designated as hedges
Forward contracts (1,681.21) - - (1,411.62) (2,289.91) -
Net exposure to foreign currency risk (liabilities)
1,627.99 (645.71) 12.58 12,894.99 1,383.97 4.09
Total Net exposure to foreign currency risk
(1,391.63) 885.27 (12.58) (12,419.30)
(68.37) (4.09)
Net Derivatives designated as hedges 309.01 - - 725.14 (4,120.73) -
b) As at the balance sheet date, following foreign currency exposure (including non financial assets and liabilities) is not hedged by a derivative instrument or otherwise:
Amount in Rupees Equivalent amount in USD (in millions)
As at March 31, 2018
As at March 31, 2017
As at March 31, 2018
As at March 31, 2017
Assets
Investment in equity share 5.14 5.14 0.11 0.11
Investment in preference share 1,528.61 1,520.99 23.45 23.45
Investment in equity component of preference shares
293.75 293.75 5.56 5.56
Trade receivables 2,408.27 3,971.83 36.95 61.25
Other financial assets 37.84 - 0.58 -
Advance to suppliers 35.15 47.69 0.54 0.74
4,308.76 5,839.40 67.19 91.11

Notesannexed to and forming part of the standalone balance sheet as at March 31, 2018 and the standalone statement of profit and loss for the year ended March 31, 2018(All amounts in Rupees million, unless otherwise stated)
170
Amount in Rupees Equivalent amount in USD (in millions)
As at March 31, 2018
As at March 31, 2017
As at March 31, 2018
As at March 31, 2017
Liabilities
Borrowing 1,594.93 4,876.12 24.47 75.19
Trade payables 15,374.69 17,049.61 235.90 262.91
Other financial liabilities 808.57 733.46 12.41 11.31
Trade advances 13.69 966.92 0.21 14.91
17,791.88 23,626.11 272.99 364.32
Less: Forward contracts (USD-INR) (10,531.18) (3,840.42) (161.58) (59.22)
Less: Forward contracts (EURO-INR) (1,908.50) (152.15) (29.28) (2.35)
Less: Option contracts (USD-INR) (654.15) - (10.04) -
Net unhedge foreign currency exposure* 389.29 13,794.14 4.90 211.64
*Cross currency forward contract of EURO - USD is not considered as hedges aggregating to Rs. 3,825.88 (March 31, 2017 Rs. 682.04)
c) Foreign currency sensitivity The sensitivity of profit or loss to changes in the exchange rates arises mainly from foreign currency denominated financial
instruments and impact on other components of equity arises from foreign forward exchange contracts, designated as cash flow hedges.
Net impact on profit before tax Net impact on other reserve
As at March 31, 2018
As at March 31, 2017
As at March 31, 2018
As at March 31, 2017
USD sensitivity
INR/USD - Increase by 1% (March 31, 2017 - 1%)* (13.92) (124.19) 3.09 7.25
INR/USD - Decrease by 1% (March 31, 2017 - 1%)* 13.92 124.19 (3.09) (7.25)
EURO sensitivity
INR/EURO - Increase by 1% (March 31, 2017 - 1%)* 8.85 (0.68) - (41.21)
INR/EURO - Decrease by 1% (March 31, 2017 - 1%)* (8.85) 0.68 - 41.21
* Holding all other variables constant (IV) Market risk - interest rate risk
(IV) Market risk - interest rate risk The Company had borrowed funds at both fixed and floating interest rates. The Company’s interest rate risk arises from
long-term borrowings with variable rates, which exposes the Company to cash flow interest rate risk. Company policy is to maintain most of its borrowings at fixed rate using interest rate swaps to achieve this when necessary. During March 31, 2018 and March 31, 2017, the Company’s borrowings at variable rate were denominated in USD.
The Company’s fixed rate borrowings are carried at amortised cost. They are therefore not subject to interest rate risk as defined in Ind AS 107, since neither the carrying amount nor the future cash flows will fluctuate because of a change in market interest rates.
The Company manages its cash flow interest rate risk by using floating-to-fixed interest rate swaps. Under these swaps, the Company agrees with other parties to exchange the difference between fixed contract rates and floating rate interest amounts calculated by reference to the agreed notional principal amounts.

Notesannexed to and forming part of the standalone balance sheet as at March 31, 2018 and the standalone statement of profit and loss for the year ended March 31, 2018(All amounts in Rupees million, unless otherwise stated)
Annual Report 2017-18 Financial StatementsThe Welspun Corp Story Governance Reports
171
a) Interest rate risk exposure
The exposure of the Company’s borrowing to interest rate changes at the end of the reporting period are as follows:
As at March 31, 2018
As at March 31, 2017
Fixed rate borrowings 5,365.98 12,028.94
Floating rate borrowings 1,602.71 2,740.04
Total borrowings 6,968.69 14,768.98
As at the end of the reporting period, the Company had the following variable rate borrowings and interest rate swap contracts outstanding:
As at March 31, 2018
As at March 31, 2017
Floating rate borrowings 1,602.71 2,740.04
Interest rate swaps (notional principal amount) (1,603.31) (2,762.61)
Net exposure to cash flow interest rate risk (0.60) (22.57)
b) Sensitivity Profit or loss is sensitive to higher/ lower interest expense from borrowings as a result of changes in interest rates. Other components of equity change as a result of an increase/ decrease in the fair value of the cash flow hedges related to borrowings.
Net impact on profit before tax Net impact on other reserve
As at March 31, 2018
As at March 31, 2017
As at March 31, 2018
As at March 31, 2017
Interest Rate Increase by 10 basis points (March 31, 2017 - 10 basis points)*
- (0.02) (0.02) (0.02)
Interest Rate Decrease by 10 basis points (March 31, 2017 - 10 basis points)*
- 0.02 0.02 0.02
* Holding all other variables constant
# Amount is below the rounding norms adopted by the Company
(V) Market risk – security prices
a) Exposure The Company is mainly exposed to the price risk due to its investment in mutual funds and bonds. The price risk arises
due to uncertainties about the future market values of these investments.
In order to manage its price risk arising from investments in mutual funds, the Company diversifies its portfolio in accordance with the limits set by the risk management policies.
b) Sensitivity The table below summarises the impact of increases/decreases of 1% increase in price of bonds and mutual funds.
Impact on profit before tax
As at March 31, 2018
As at March 31, 2017
Increase in rate 1% (March 31, 2017 - 1% ) 32.84 50.19
Decrease in rate 1% (March 31, 2017 - 1% ) (32.84) (50.19)

Notesannexed to and forming part of the standalone balance sheet as at March 31, 2018 and the standalone statement of profit and loss for the year ended March 31, 2018(All amounts in Rupees million, unless otherwise stated)
172
(VI) Impact of hedging activities The Company undertakes transactions denominated in foreign currencies; consequently, exposures to exchange rate
fluctuations arise. Exchange rate exposures are managed within approved policy parameters utilising forward contracts.
a) Disclosure of effects of hedge accounting on financial position:
As at March 31, 2018
Type of hedge and risks Nominal valueCarrying amount of hedging instrument
Maturity date Hedge ratio
Assets Liabilities Assets Liabilities
Cash flow hedge
Foreign exchange risk
Forward contract 1,880.07 1,173.33 12.10 16.30 Apr 18 - Mar 19 1:1
Interest rate risk
Interest rate swap 1,603.31 - 21.42 - Apr 18 - Oct 19 1:1
As at March 31, 2017
Type of hedge and risksNominal value
Carrying amount of hedging instrument
Maturity date Hedge ratio
Assets Liabilities Assets Liabilities
Cash flow hedge
Foreign exchange risk
Forward contract 5,278.18 5,520.46 227.63 99.75 Apr 17 - Mar 18 1:1
Interest rate risk
Interest rate swap 2,762.61 - 22.30 - Apr 17 - Oct 19 1:1
The Company uses forward contracts to hedge its risks associated with foreign currency fluctuations relating to certain firm commitments, highly probable forecast transactions and foreign currency required at the settlement date of certain receivables/payables. The use of forward contracts is governed by the Company’s strategy approved by the board of directors, which provide principles on the use of such forward contracts consistent with the Company’s risk management policy.
The Company’s hedging policy only allows for effective hedge relationships to be established. Hedge effectiveness is determined at the inception of the hedge relationship, and through periodic prospective effectiveness assessments to ensure that an economic relationship exists between the hedged item and hedging instrument. The Company enters into hedge relationships where the critical terms of the hedging instrument match exactly with the terms of the hedged item, and so a qualitative assessment of effectiveness is performed. If changes in circumstances affect the terms of the hedged item such that the critical terms no longer match exactly with the critical terms of the hedging instrument, the Company uses the hypothetical derivative method to assess effectiveness. Ineffectiveness is recognised on a cash flow hedge and net investment hedge where the cumulative change in the designated component value of the hedging instrument exceeds on an absolute basis the change in value of the hedged item attributable to the hedged risk. In hedges of foreign currency forecast sale and purchase transactions, hedges of interest rate risk and hedges of net investment this may arise if:
(i) The critical terms of the hedging instrument and the hedged item differ (i.e. nominal amounts, timing of the forecast transaction, interest resets changes from what was originally estimated), or
(ii) Differences arise between the credit risk inherent within the hedged item and the hedging instrument. There were no ineffectiveness recognised in the statement of profit and loss during March 31, 2018 and March 31, 2017.

Notesannexed to and forming part of the standalone balance sheet as at March 31, 2018 and the standalone statement of profit and loss for the year ended March 31, 2018(All amounts in Rupees million, unless otherwise stated)
Annual Report 2017-18 Financial StatementsThe Welspun Corp Story Governance Reports
173
b) Movements in cash flow hedging reserve
Risk category Foreign currency risk
Interest rate risk
Total
Derivative instruments Forward contracts
Interest rate swap
(i) Cash flow hedging reserve
As at April 01, 2016 61.05 (9.91) 51.14
Gain recognised in cash flow hedging reserve during the year (net)
Changes in fair value of forward contracts 189.74 - 189.74
Changes in fair value of interest rate swaps - 39.58 39.58
Gain/ (loss) transferred to statement of profit and loss (155.22) (2.12) (157.34)
Income tax on amount recognised in hedging reserve (11.95) (12.96) (24.91)
As at March 31, 2017 83.62 14.59 98.21
Gain/ (loss) recognised in cash flow hedging reserve during the year (net)
Changes in fair value of forward contracts (145.66) - (145.66)
Changes in fair value of interest rate swaps - 6.07 6.07
Gain/ (loss) transferred to statement of profit and loss 13.57 (6.95) 6.62
Income tax on amount recognised in hedging reserve 45.73 0.24 45.97
As at March 31, 2018 (2.74) 13.95 11.21 41. Capital management
(I) Risk management The company’s objectives when managing capital are to safeguard the company’s ability to continue as a going concern in
order to provide returns for shareholders and benefits for other stakeholders and to maintain an optimal capital structure to reduce the cost of capital. In order to maintain or adjust the capital structure, the company may adjust the amount of dividends paid to shareholders, return capital to shareholders, issue new shares or sell assets to reduce debt.
The Company monitors capital on the basis of the following gearing ratio:
As at March 31, 2018
As at March 31, 2017
Net debt (total borrowings net of cash and cash equivalents, other bank balances and current investments)
1,727.36 8,601.51
Total equity 19,157.17 18,096.18
Net debt to equity ratio 0.09 0.48
Loan covenants The Company has complied with all the loan covenants applicable, mainly debt service coverage ratio, debt equity ratio and fixed assets coverage ratio attached to the borrowings.
(II) Dividend
As at March 31, 2018
As at March 31, 2017
Equity share
Final dividend for the year ended March 31, 2017 of Rs. 0.50 (March 31, 2016 - Rs. 0.50) per fully paid shares 132.61 132.61
Dividend not recognised at the end of the reporting period
Directors have recommended the payment of a final dividend of Rs. 0.50 per fully paid equity share (March 31, 2017 - Rs. 0.50). This proposed dividend is subject to the approval of shareholders in the ensuring annual general meeting.
132.61 132.61

Notesannexed to and forming part of the standalone balance sheet as at March 31, 2018 and the standalone statement of profit and loss for the year ended March 31, 2018(All amounts in Rupees million, unless otherwise stated)
174
42. Related party transactions
a) List of related parties:
Relationships Principal place of business
Effective proportion of ownership interest (%)
As at March 31, 2018
As at March 31, 2017
Subsidiaries
Welspun Pipes Inc. USA 94.79% 90.01%
Welspun Tradings Limited India 100.00% 100.00%
Welspun Mauritius Holdings Limited Mauritius 89.98% 89.98%
Welspun Middle East DMCC Dubai 100.00% 100.00%
Welspun Tubular LLC USA 100.00% 100.00%
Welspun Global Trade LLC USA 100.00% 100.00%
Joint ventures
Welspun Wasco Coatings Private Limited India 51.00% 51.00%
Welspun Middle East Pipes LLC Kingdom of Saudi Arabia 50.01% 50.01%
Welspun Middle East Pipes Coating LLC Kingdom of Saudi Arabia 50.01% 50.01%
b) Key management personnel
Name Nature of relationship
Mr. Balkrishan Goenka Chairman
Mr. Rajesh Mandawewala Director
Mr. Vipul MathurManaging Director & Chief Executive Officer (w.e.f December 01, 2017)
Mr. Lalitkumar NaikManaging Director & Chief Executive Officer (w.e.f January 01, 2017 till November 30, 2017)
Mr. Braja Mishra Managing Director (till December 31, 2016)
Mr. S. KrishnanChief Financial Officer. Executive Director & Chief Executive Officer of Plate & Coil Mill Division (w.e.f December 01, 2017)
Mr. K.H.Viswanathan Director
Mr. Rajkumar Jain Director
Mr. Ram Gopal Sharma Director
Mr. Mintoo Bhandari Director
Mr. Utsav Baijal Director
Mr. Atul Desai Director
Mrs. Revathy Ashok Director
Mr. Desh Raj Dogra Director (w.e.f. February 10, 2017)
Mr. Mukul Sarkar Director (till January 25, 2017)
Mr. Nirmal Gangwal Director (till August 24, 2016)
Mr. Pradeep Joshi Company Secretary
c) List of Others over which key management personnel or relatives of such personnel exercise significant influence
or control and with whom transaction have taken place during the year:
Welspun India Limited
Welspun Steel Limited
RMG Alloy Steel Limited (erstwhile Remi Metal Gujarat Limited)
Welspun Foundation for Health and Knowledge

Notesannexed to and forming part of the standalone balance sheet as at March 31, 2018 and the standalone statement of profit and loss for the year ended March 31, 2018(All amounts in Rupees million, unless otherwise stated)
Annual Report 2017-18 Financial StatementsThe Welspun Corp Story Governance Reports
175
Welspun Realty Private Limited
Welspun Global Brands Limited
Welspun Captive Power Generation Limited
Welspun Enterprises Limited
Welspun Anjar SEZ Limited
Welspun Group Master Trust
AYM Syntex Limited (erstwhile Welspun Syntex Limited)
Adani Welpsun Exploration Limited
d) Disclosure in respect of significant transactions with related parties during the year:
Transactions
Year ended March 31, 2018
Year ended March 31, 2017
1) Sale of goods
Welspun Tradings Limited 23,733.62 14,761.42
Welspun Tubular LLC 20.01 2,340.68
Others 1,298.59 1,559.90
Total sale of goods 25,052.22 18,662.00
2) Other income
Welspun Pipes Inc. 91.72 6.73
Welspun Middle East Pipes LLC 11.92 12.23
Welspun Tradings Limited - 8.13
Welspun Wasco Coatings Private Limited 45.20 29.03
Others 2.20 2.45
Total other income 151.04 58.57
3) Purchase of goods and expenses incurred
Welspun Captive Power Generation Limited 592.41 327.41
Welspun Realty Private Limited 53.03 45.23
Others 72.64 51.61
Total purchase of goods and expenses incurred 718.08 424.25
4) Purchase of property, plant and equipment
Welspun Steel Limited - 6.29
Welspun Tubular LLC 3.38 -
Total of purchase of property, plant and equipment 3.38 6.29
5) Sale of property, plant and equipment
Welspun Anjar SEZ Private Limited 35.31 -
Welspun Wasco Coatings Private Limited - 0.05
Total sale of property, plant and equipment 35.31 0.05
6) Sale of investments
Welspun Group Master Trust - 0.40
Total sale of investments - 0.40
7) Reimbursement of expenses (paid)/ recovered
Welspun Tubular LLC 7.54 2.04
Welspun Tradings Limited (0.01) (3.48)
Welspun Middle East Pipes LLC 0.57 4.63
Welspun Wasco Coatings Private Limited 38.34 33.04
Welspun Global Brands Limited - (3.63)

Notesannexed to and forming part of the standalone balance sheet as at March 31, 2018 and the standalone statement of profit and loss for the year ended March 31, 2018(All amounts in Rupees million, unless otherwise stated)
176
Transactions
Year ended March 31, 2018
Year ended March 31, 2017
Welspun Captive Power Generation Limited 1.23 0.89
Welspun India Limited (14.71) (21.16)
Welspun Steel Limited 0.49 0.21
Others 0.31 1.07
Total reimbursement of expenses (paid)/ recovered 33.76 13.61
8) Loans and deposit given
Welspun Wasco Coatings Private Limited 98.04 99.12
Total loans and deposit given 98.04 99.12
9) Loans and deposit received back
Welspun Pipes Inc. - 927.57
Welspun Realty Private Limited 22.62 22.62
Others - 0.20
Total loans and deposit received back 22.62 950.39
10) Advances and deposit repaid
Welspun Tradings Limited - 2.00
Total advances and deposit repaid - 2.00
11) Addition of corporate guarantee
Welspun Pipes Inc. 6,424.50 -
Welspun Wasco Coatings Private Limited 54.25 54.25
Total addition of corporate guarantee 6,478.75 54.25
12) Release of corporate guarantee
Welspun Tradings Limited - 993.83
Total release of corporate guarantee - 993.83
13) Key management personnel compensation
Mr. Balkrishan Goenka
Short-term employee benefit 18.95 27.99
Mr. Vipul Mathur
Short-term employee benefit 14.65 -
Mr. Braja Mishra
Short-term employee benefit - 45.19
Mr. Lalitkumar Naik
Short-term employee benefit 32.12 9.41
Mr. S. Krishnan
Short-term employee benefit 28.49 24.72
Mr. Pradeep Joshi
Short-term employee benefit 4.00 3.91
Total key management personnel compensation 98.21 111.22
14) Directors' sitting fees
Mr. K.H.Viswanathan 0.95 0.78
Mr. Rajkumar Jain 0.88 0.83
Mr. Ram Gopal Sharma 0.66 0.83
Mr. Mintoo Bhandari 0.34 0.20
Mr. Utsav Baijal - 0.07
Mr. Atul Desai 0.21 0.14
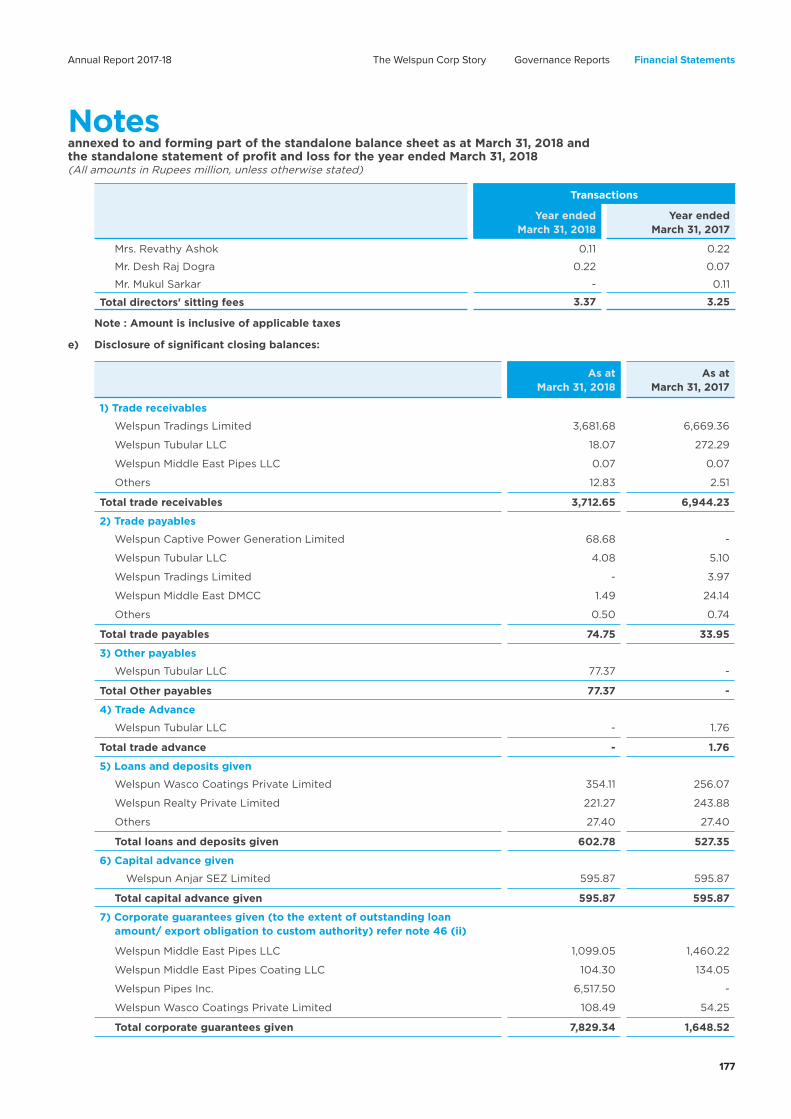
Notesannexed to and forming part of the standalone balance sheet as at March 31, 2018 and the standalone statement of profit and loss for the year ended March 31, 2018(All amounts in Rupees million, unless otherwise stated)
Annual Report 2017-18 Financial StatementsThe Welspun Corp Story Governance Reports
177
Transactions
Year ended March 31, 2018
Year ended March 31, 2017
Mrs. Revathy Ashok 0.11 0.22
Mr. Desh Raj Dogra 0.22 0.07
Mr. Mukul Sarkar - 0.11
Total directors' sitting fees 3.37 3.25
Note : Amount is inclusive of applicable taxes
e) Disclosure of significant closing balances:
As at March 31, 2018
As at March 31, 2017
1) Trade receivables
Welspun Tradings Limited 3,681.68 6,669.36
Welspun Tubular LLC 18.07 272.29
Welspun Middle East Pipes LLC 0.07 0.07
Others 12.83 2.51
Total trade receivables 3,712.65 6,944.23
2) Trade payables
Welspun Captive Power Generation Limited 68.68 -
Welspun Tubular LLC 4.08 5.10
Welspun Tradings Limited - 3.97
Welspun Middle East DMCC 1.49 24.14
Others 0.50 0.74
Total trade payables 74.75 33.95
3) Other payables
Welspun Tubular LLC 77.37 -
Total Other payables 77.37 -
4) Trade Advance
Welspun Tubular LLC - 1.76
Total trade advance - 1.76
5) Loans and deposits given
Welspun Wasco Coatings Private Limited 354.11 256.07
Welspun Realty Private Limited 221.27 243.88
Others 27.40 27.40
Total loans and deposits given 602.78 527.35
6) Capital advance given
Welspun Anjar SEZ Limited 595.87 595.87
Total capital advance given 595.87 595.87
7) Corporate guarantees given (to the extent of outstanding loan amount/ export obligation to custom authority) refer note 46 (ii)
Welspun Middle East Pipes LLC 1,099.05 1,460.22
Welspun Middle East Pipes Coating LLC 104.30 134.05
Welspun Pipes Inc. 6,517.50 -
Welspun Wasco Coatings Private Limited 108.49 54.25
Total corporate guarantees given 7,829.34 1,648.52

Notesannexed to and forming part of the standalone balance sheet as at March 31, 2018 and the standalone statement of profit and loss for the year ended March 31, 2018(All amounts in Rupees million, unless otherwise stated)
178
As at March 31, 2018
As at March 31, 2017
8) Other current liabilities
Mr. Balkrishan Goenka 18.95 27.99
Mr. Vipul Mathur 4.28 -
Mr. S. Krishnan 2.97 -
Total other current liabilities 26.20 27.99
9) Equity investments in subsidiaries and joint venture
Welspun Mauritius Holdings Limited (Investments in equity instruments) 4.70 4.70
Welspun Mauritius Holdings Limited (Investment in equity component of preference shares)
293.75 293.75
Welspun Tradings Limited (Investments in equity instruments of subsidiaries)
50.22 50.22
Welspun Wasco Coatings Private Limited (Investments in equity instruments of joint ventures)
147.55 147.55
Others 0.44 0.44
Total equity investments 496.66 496.66
10) Non-current investments
Welspun Mauritius Holdings Limited 1,528.61 1,528.85
Welspun Captive Power Generation Limited 345.42 329.68
Total non-current investments 1,874.03 1,858.53
11) Other receivables
Welspun Pipes Inc. 24.98 -
Welspun Middle East Pipes Coating LLC 9.85 8.14
Welspun Middle East Pipes LLC 3.00 3.39
Welspun Wasco Coatings Private Limited - 2.08
Others 0.01 -
Total other receivables 37.84 13.61
(f) Terms and conditions All transactions were made on normal commercial terms and conditions and at market rates. All outstanding balances are unsecured and are payable in cash.
43. Micro, Small and Medium Enterprises Development Act, 2016 Disclosure of amount due to suppliers under “The Micro, Small and Medium Enterprises Development Act, 2006 (MSMED Act)” is as under:
As at March 31, 2018
As at March 31, 2017
Principal amount due to suppliers under MSMED Act 6.78 3.18
Interest accrued and due to suppliers under MSMED Act, on the above amount 0.03 0.04
6.81 3.22
Payment made to suppliers (other than interest) beyond the appointed day, during the year
154.91 48.27
Interest due and payable to suppliers under MSMED Act, for payments already made
0.83 0.37
Interest accrued and remaining unpaid at the end of the year to suppliers under MSMED Act
4.17 3.32

Notesannexed to and forming part of the standalone balance sheet as at March 31, 2018 and the standalone statement of profit and loss for the year ended March 31, 2018(All amounts in Rupees million, unless otherwise stated)
Annual Report 2017-18 Financial StatementsThe Welspun Corp Story Governance Reports
179
44. Contingent liabilities The Company has contingent liabilities as at the year end in respect of:
As at March 31, 2018
As at March 31, 2017
Claims against the Company not acknowledged as debts 119.82 114.37
Disputed direct taxes 92.88 295.28
Disputed indirect taxes 1,907.48 1,413.94
It is not practicable for the Company to estimate the timings of cash outflows, if any, in respect of above pending resolution of the respective proceedings.
The Company does not expect any re-imbursements in respect of the above contingent liabilities.
45. Specified bank notesi) The reporting on disclosures relating to Specified Bank Notes is not applicable to the Company for the
year ended March 31, 2018.
ii) Following are the details of holdings as well as dealings in Specified Bank Notes for the previous year ended March 31, 2017.
SBNs Other denomination
notes
Total
Closing cash in hand as on November 8, 2016 1.53 0.06 1.59
Add: Permitted receipts - 1.00 1.00
Less: Amount deposited in banks 1.53 0.83 2.36
Closing cash in hand as on December 30, 2016 - 0.23 0.23
46. Capital and other commitments i) Capital commitments
Capital expenditure contracted for at the end of the reporting period but not recognised as liabilities is as follows:
As at March 31, 2018
As at March 31, 2017
Property, plant and equipment 82.29 27.90
Intangible assets under development 2.74 31.35
ii) Other commitments
As at March 31, 2018
As at March 31, 2017
Corporate guarantees given by the company for loans of subsidiaries and joint ventures. Loan/ liabilities outstanding against these guarantees aggregate to Rs. 7,829.34 (March 31, 2017: Rs. 1,648.52) (refer note 42)
16,541.77 9,618.12
Outstanding letters of credit (net) 7,987.62 5,699.53
Custom duty liabilities on duty free import of raw materials (export obligations) 207.54 1,854.52
iii) The Company has committed to provide continued need based financial support to its subsidiaries and joint ventures.

Notesannexed to and forming part of the standalone balance sheet as at March 31, 2018 and the standalone statement of profit and loss for the year ended March 31, 2018(All amounts in Rupees million, unless otherwise stated)
180
47. Operating lease The Company has operating leases for premises and equipments. These lease arrangements range for a
period within one year to five years. The leases have varying terms, escalation clauses and renewal rights. On renewal, the terms of the leases are renegotiated.
i) Rent expense with respect to all operating leases:
As at March 31, 2018
As at March 31, 2017
Lease payment recognised in the statement of profit and loss during the year 76.35 72.55
ii) With respect to non-cancellable operating leases, the future minimum lease payments are as follows:
As at March 31, 2018
As at March 31, 2017
Not later than one year 6.48 6.18
Later than one year but not later than five years 2.76 9.24
48. Segment information In accordance with the paragraph 4 of Ind AS 108 “Operating segments”, the Company has presented
segmental information only in the consolidated financial statements (refer note 48 of the Consolidated financial statements).
49. Exchange differences on long term foreign currency monetary items outstanding “In accordance with para D13AA of Ind AS 101 First time adoption of Indian Accounting Standards and the option available in the Companies (Accounting Standards) (Second Amendment) Rules, 2011, vide notification dated December 29, 2011 issued by the Ministry of Corporate Affairs, the Company has adjusted the exchange rate difference arising on long term foreign currency monetary items, in so far as they relate to the acquisition of a depreciable capital asset, to the cost of the asset. In other cases, foreign exchange differences are accumulated in “Foreign Currency Monetary Item Translation Difference Account” and amortised over the balance period of such long term assets/ liabilities. Accordingly, the Company has adjusted exchange loss of Rs. 3.25 (March 31, 2017: gain of Rs. 14.05) to the cost of property, plant and equipment as the long term monetary items relate to depreciable capital asset. Exchange loss of Rs. 9.28 (March 31, 2017: gain of Rs. 5.21) has been transferred to “Foreign Currency Monetary Item Translation Difference Account (FCMITDA)” to be amortised over the balance period of such long term liabilities. Out of the FCMITDA, loss of Rs. 69.65 (March 31, 2017: loss of Rs. 178.30) has been adjusted in the current year and balance loss of Rs. 35.54 (March 31, 2017: loss of Rs 95.91) has been carried over and included in reserves and surplus.”
50. Disclosure pursuant to section 186 of the Companies Act, 2013 for loans and guarantees given (refer note 42):
Maximum amount outstanding during the year
As at March 31, 2018
As at March 31, 2017
As at March 31, 2018
As at March 31, 2017
Loans and advances in the nature of loans to joint venture and subsidiary:
Welspun Wasco Coating Private Limited (joint venture)
354.11 256.07 354.11 256.07

Notesannexed to and forming part of the standalone balance sheet as at March 31, 2018 and the standalone statement of profit and loss for the year ended March 31, 2018(All amounts in Rupees million, unless otherwise stated)
Annual Report 2017-18 Financial StatementsThe Welspun Corp Story Governance Reports
181
51. Disclosure pursuant to section 186 of the Companies Act, 2013 for loans and guarantees given (refer note 42):
Nature of the transaction (loans and guarantees given)
Purpose for which the loans and guarantees is given
As at March 31, 2018
As at March 31, 2017
i) Loans given (refer note 8(a)):
Welspun Wasco Coatings Private LimitedWorking capital and project funding of joint venture
354.11 256.07
354.11 256.07
ii) Guarantees:
Welspun Middle East Pipes LLCCorporate guarantee given for joint venture's debt
1,099.05 1,460.22
Welspun Middle East Pipes Coating LLCCorporate guarantee given for joint venture's debt
104.30 134.05
Welspun Wasco Coatings Private LimitedCorporate guarantee given to custom authorities for joint venture
108.49 54.25
Welspun Pipes Inc. Corporate guarantee given for subsidiary's debt 6,517.50 -
7,829.34 1,648.52
52. Earnings per share
Year ended March 31, 2018
Year ended March 31, 2017
Profit after tax attributable to the equity holders of the Company 1,258.18 1,746.01
Weighted average number of equity shares 265,226,109 265,226,109
Basic and diluted earnings per share (Rs.) 4.74 6.58
Nominal value of an equity share 5.00 5.00
As per our attached report of even date.
For Price Waterhouse Chartered Accountants LLP For and on behalf of the Board
Firm Registration No: 012754N / N500016
Mehul Desai Rajesh Mandawewala Vipul Mathur
Partner Director Managing Director
Membership No. 103211 DIN: 00007179 and Chief Executive Officer
DIN: 07990476
Place: Mumbai S. Krishnan Pradeep Joshi
Date: May 02, 2018 Executive Director and Company Secretary
Chief Financial Officer and FCS-4959
CEO (PCMD)
DIN: 06829167

Consolidated Financial
Statements
29

Annual Report 2017-18 Financial StatementsThe Welspun Corp Story Governance Reports
183
Independent Auditor’s Report
To,The Members,Welspun Corp Limited
Report on the Consolidated Indian Accounting Standards (Ind AS) Financial Statements1. We have audited the accompanying consolidated Ind AS financial statements of Welspun Corp Limited
(hereinafter referred to as the “Holding Company”) and its subsidiaries (the Holding Company and its subsidiaries together referred to as the “Group”) and its joint ventures; (refer Note 44 to the attached consolidated financial statements), comprising of the consolidated Balance Sheet as at March 31, 2018, the consolidated Statement of Profit and Loss (including Other Comprehensive Income), the consolidated Cash Flow Statement for the year then ended and the consolidated Statement of Changes in Equity for the year then ended, and a summary of significant accounting policies and other explanatory information prepared based on the relevant records (hereinafter referred to as “the Consolidated Ind AS Financial Statements”).
Management’s Responsibility for the Consolidated Ind AS Financial Statements2. The Holding Company’s Board of Directors is responsible for the preparation of these consolidated Ind AS
financial statements in terms of the requirements of the Companies Act, 2013 (hereinafter referred to as the “Act”) that give a true and fair view of the consolidated financial position, consolidated financial performance, consolidated cash flows and consolidated changes in equity of the Group including its joint ventures in accordance with accounting principles generally accepted in India including the Indian Accounting Standards specified in the Companies (Indian Accounting Standards) Rules, 2015 (as amended) under Section 133 of the Act. The Holding Company’s Board of Directors is also responsible for ensuring accuracy of records including financial information considered necessary for the preparation of consolidated Ind AS financial statements. The respective Board of Directors of the companies included in the Group and of its joint ventures are responsible for maintenance of adequate accounting records in accordance with the provisions of the Act for safeguarding the assets of the Group and its joint ventures respectively and for preventing and detecting frauds and other irregularities; the selection and application of appropriate accounting policies; making judgements and estimates that are reasonable and prudent; and the design, implementation and maintenance of adequate internal financial controls, that were operating effectively for ensuring the accuracy and completeness of the accounting records, relevant to the preparation and presentation of the financial statements that give a true and fair view and are free from material misstatement, whether due to fraud or error, which has been used for the purpose of preparation of the consolidated Ind AS financial statements by the Directors of the Holding Company, as aforesaid.
Auditors’ Responsibility3. Our responsibility is to express an opinion on these consolidated Ind AS financial statements based on our
audit. While conducting the audit, we have taken into account the provisions of the Act and the Rules made thereunder including the accounting standards and matters which are required to be included in the audit report.
4. We conducted our audit of the consolidated Ind AS financial statements in accordance with the Standards on Auditing specified under Section 143(10) of the Act and other applicable authoritative pronouncements issued by the Institute of Chartered Accountants of India. Those Standards and pronouncements require that we comply with ethical requirements and plan and perform the audit to obtain reasonable assurance about whether the consolidated Ind AS financial statements are free from material misstatement.
5. An audit involves performing procedures to obtain audit evidence about the amounts and disclosures in the consolidated Ind AS financial statements. The procedures selected depend on the auditors’ judgement, including the assessment of the risks of material misstatement of the consolidated Ind AS financial statements, whether due to fraud or error. In making those risk assessments, the auditor considers internal financial control relevant to the Holding Company’s preparation of the consolidated Ind AS financial statements that give a true and fair view, in order to design audit procedures that are appropriate in the circumstances. An audit

184
also includes evaluating the appropriateness of the accounting policies used and the reasonableness of the accounting estimates made by the Holding Company’s Board of Directors, as well as evaluating the overall presentation of the consolidated Ind AS financial statements.
6. We believe that the audit evidence obtained by us and the audit evidence obtained by the other auditors in terms of their reports referred to in sub-paragraphs 8 and 9 of the Other Matters paragraph below, is sufficient and appropriate to provide a basis for our audit opinion on the consolidated Ind AS financial statements.
Opinion7. In our opinion and to the best of our information
and according to the explanations given to us, the aforesaid consolidated Ind AS financial statements give the information required by the Act in the manner so required and give a true and fair view in conformity with the accounting principles generally accepted in India of the consolidated state of affairs of the Group and its joint ventures as at March 31, 2018, and their consolidated total comprehensive income (comprising of consolidated profit and consolidated other comprehensive income), their consolidated cash flows and consolidated changes in equity for the year ended on that date.
Other Matters8. We did not audit the financial information of 3
subsidiaries located outside India whose financial information reflect total assets of Rs. 19,073.40 million and net assets of Rs. 7,674.74 million as at March 31, 2018, total revenue of Rs. 33,347.50 million, total comprehensive income (comprising of profit and other comprehensive income) of Rs. 504.77 million and net cash inflows amounting to Rs. 3,327.41 million for the year ended on that date, as considered in the consolidated Ind AS financial statements. The consolidated Ind AS financial statements also include the Group’s share of net loss of Rs. 807.68 million for the year ended March 31, 2018 as considered in the consolidated Ind AS financial statements, in respect of 2 joint ventures located outside India whose financial information have not been audited by us. These financial information in respect of the aforesaid subsidiaries and 2 joint ventures have been audited by other auditors, and our opinion on the consolidated Ind AS financial statements insofar as it relates to the amounts and disclosures included in respect of the
subsidiaries and joint ventures is based solely on the reports of the other auditors.
9. The financial statements of 2 subsidiaries located outside India, included in the consolidated financial statements, which constitute total assets of Rs. 3,185.36 million and net assets of Rs. 2,926.09 million as at March 31, 2018, total revenue of Rs. Nil, net profit of Rs. 12.26 million and net cash outflows amounting to Rs. 33.30 million for the year then ended, have been prepared in accordance with accounting principles generally accepted in their respective countries and have been audited by other auditors under generally accepted auditing standards applicable in their respective countries. The Holding Company’s management has converted the financial statements of such subsidiaries located outside India from the accounting principles generally accepted in their respective countries to the accounting principles generally accepted in India. We have audited these conversion adjustments made by the Holding Company’s management. Our opinion in so far as it relates to the balances and affairs of such subsidiaries located outside India is based on the report of other auditors and the conversion adjustments prepared by the management of the Holding Company and audited by us.
Our opinion on the consolidated Ind AS financial statements and our report on Other Legal and Regulatory Requirements below, is not modified in respect of the above matters with respect to our reliance on the work done and the reports of the other auditors and the financial statements certified by the Management.
Report on Other Legal and Regulatory Requirements10. As required by Section 143(3) of the Act, we report,
to the extent applicable, that:
(a) We have sought and obtained all the information and explanations which to the best of our knowledge and belief were necessary for the purposes of our audit of the aforesaid consolidated Ind AS financial statements.
(b) In our opinion, proper books of account as required by law maintained by the Holding Company, its subsidiary incorporated in India and its joint venture incorporated in India including relevant

Annual Report 2017-18 Financial StatementsThe Welspun Corp Story Governance Reports
185
records relating to preparation of the aforesaid consolidated Ind AS financial statements have been kept so far as it appears from our examination of those books and records of the Holding Company, its subsidiary incorporated in India and its joint venture incorporated in India.
(c) The Consolidated Balance Sheet, the Consolidated Statement of Profit and Loss (including other comprehensive income), Consolidated Cash Flow Statement and the Consolidated Statement of Changes in Equity dealt with by this Report are in agreement with the relevant books of account maintained by the Holding Company, its subsidiary incorporated in India and its joint venture incorporated in India including relevant records relating to the preparation of the consolidated Ind AS financial statements.
(d) In our opinion, the aforesaid consolidated Ind AS financial statements comply with the Indian Accounting Standards specified under Section 133 of the Act.
(e) On the basis of the written representations received from the directors of the Holding Company as on March 31, 2018 taken on record by the Board of Directors of the Holding Company and the reports of the statutory auditors of its subsidiary company incorporated in India, and its joint venture incorporated in India, none of the directors of the Holding Company and its subsidiary incorporated in India and its joint venture incorporated in India is disqualified as on March 31, 2018 from being appointed as a director in terms of Section 164 (2) of the Act.
(f) With respect to the adequacy of the internal financial controls with reference to financial statements of the Holding Company, its subsidiary company incorporated in India, and its joint venture incorporated in India and the operating effectiveness of such controls, refer to our separate Report in Annexure A.
(g) With respect to the other matters to be included in the Auditors’ Report in accordance with Rule 11 of the Companies (Audit and Auditors) Rules, 2014, in our opinion and to the best of our information and according to the explanations given to us:
i. The consolidated Ind AS financial statements disclose the impact, if any, of pending litigations as at March 31, 2018 on the consolidated financial position of the Group and its joint ventures – Refer Note 45 to the consolidated Ind AS financial statements.
ii. The Group and its joint ventures had long-term contracts including derivative contracts as at March 31, 2018 for which there were no material foreseeable losses.
iii. There has been no delay in transferring amounts, required to be transferred, to the Investor Education and Protection Fund by the Holding Company, its subsidiary company incorporated in India and its joint venture incorporated in India during the year ended March 31, 2018.
iv. The reporting on disclosures relating to Specified Bank Notes is not applicable to the Holding Company, its subsidiary company incorporated in India and its joint venture incorporated in India for the year ended March 31, 2018.
For Price Waterhouse Chartered Accountants LLPFirm Registration Number: 012754N/N500016
Mehul DesaiPartner
Membership Number : 103211MumbaiMay 02, 2018

186
Report on the Internal Financial Controls under Clause (i) of Sub-section 3 of Section 143 of the Act1. In conjunction with our audit of the consolidated
financial statements of the Company as of and for the year ended March 31, 2018, we have audited the internal financial controls over financial reporting of Welspun Corp Limited (hereinafter referred to as the “Holding Company”) and its subsidiary company and joint venture, which are companies incorporated in India, as of that date.
Management’s Responsibility for Internal Financial Controls2. The respective Board of Directors of the Holding
company, its subsidiary company and its joint venture, which are companies incorporated in India, are responsible for establishing and maintaining internal financial controls based on internal control over financial reporting criteria established by the Company considering the essential components of internal control stated in the Guidance Note on Audit of Internal Financial Controls Over Financial Reporting issued by the Institute of Chartered Accountants of India (ICAI). These responsibilities include the design, implementation and maintenance of adequate internal financial controls that were operating effectively for ensuring the orderly and efficient conduct of its business, including adherence to company’s policies, the safeguarding of its assets, the prevention and detection of frauds and errors, the accuracy and completeness of the accounting records, and the timely preparation of reliable financial information, as required under the Act.
Auditors’ Responsibility3. Our responsibility is to express an opinion on the
Company’s internal financial controls over financial reporting based on our audit. We conducted our audit in accordance with the Guidance Note on Audit of Internal Financial Controls Over Financial Reporting (the “Guidance Note”) and the Standards on Auditing deemed to be prescribed under section 143(10) of the Act to the extent applicable to an audit of internal financial controls, both applicable to an audit of internal financial controls and both issued by the ICAI. Those Standards and the Guidance Note require that we comply with ethical requirements and plan and perform the audit to obtain reasonable assurance about whether adequate internal financial controls over financial
reporting was established and maintained and if such controls operated effectively in all material respects.
4. Our audit involves performing procedures to obtain audit evidence about the adequacy of the internal financial controls system over financial reporting and their operating effectiveness. Our audit of internal financial controls over financial reporting included obtaining an understanding of internal financial controls over financial reporting, assessing the risk that a material weakness exists, and testing and evaluating the design and operating effectiveness of internal control based on the assessed risk. The procedures selected depend on the auditor’s judgement, including the assessment of the risks of material misstatement of the financial statements, whether due to fraud or error.
5. We believe that the audit evidence we have obtained is sufficient and appropriate to provide a basis for our audit opinion on the Company’s internal financial controls system over financial reporting.
Meaning of Internal Financial Controls Over Financial Reporting6. A Company’s internal financial control over
financial reporting is a process designed to provide reasonable assurance regarding the reliability of financial reporting and the preparation of financial statements for external purposes in accordance with generally accepted accounting principles. A company’s internal financial control over financial reporting includes those policies and procedures that (1) pertain to the maintenance of records that, in reasonable detail, accurately and fairly reflect the transactions and dispositions of the assets of the company; (2) provide reasonable assurance that transactions are recorded as necessary to permit preparation of financial statements in accordance with generally accepted accounting principles, and that receipts and expenditures of the company are being made only in accordance with authorisations of management and directors of the company; and (3) provide reasonable assurance regarding prevention or timely detection of unauthorised acquisition, use, or disposition of the company’s assets that could have a material effect on the financial statements.
Annexure A to Independent Auditors’ ReportReferred to in paragraph 10(f) of the Independent Auditors’ Report of even date to the members of Welspun Corp Limited on the consolidated financial statements for the year ended March 31, 2018

Annual Report 2017-18 Financial StatementsThe Welspun Corp Story Governance Reports
187
Inherent Limitations of Internal Financial Controls Over Financial Reporting7. Because of the inherent limitations of internal
financial controls over financial reporting, including the possibility of collusion or improper management override of controls, material misstatements due to error or fraud may occur and not be detected. Also, projections of any evaluation of the internal financial controls over financial reporting to future periods are subject to the risk that the internal financial control over financial reporting may become inadequate because of changes in conditions, or that the degree of compliance with the policies or procedures may deteriorate.
Opinion8. In our opinion, the Holding Company, its subsidiary
company and its joint venture, which are companies incorporated in India, have, in all material respects, an adequate internal financial controls system
over financial reporting and such internal financial controls over financial reporting were operating effectively as at March 31, 2018, based on the internal control over financial reporting criteria established by the Company considering the essential components of internal control stated in the Guidance Note on Audit of Internal Financial Controls Over Financial Reporting issued by the Institute of Chartered Accountants of India.
For Price Waterhouse Chartered Accountants LLP
Firm Registration Number: 012754N/N500016
Mehul Desai
Partner Membership Number : 103211
MumbaiMay 02, 2018
Annexure A to Independent Auditors’ ReportReferred to in paragraph 10(f) of the Independent Auditors’ Report of even date to the members of Welspun Corp Limited on the standalone financial statements as of and for the year ended March 31, 2018

188
Consolidated Balance Sheetas at March 31, 2018
Notes As atMarch 31, 2018
As atMarch 31, 2017
ASSETSNon-current assetsProperty, plant and equipment 3 30,326.13 33,481.28 Capital work-in-progress 3 144.36 249.71 Investment property 4 8.19 1.23 Goodwill on consolidation 4.68 4.68 Other intangible assets 5 118.97 71.75 Intangible assets under development 5 21.32 72.61 Investments accounted for using the equity method 6 1,144.11 1,836.38 Financial assets Investments 7(a) 365.33 347.72 Loans 8(a) 2,238.09 2,095.23
9(a) 149.47 320.51 Deferred tax assets (net) 10 4.00 - Other non-current assets 11(a) 1,184.60 1,028.33 Total non-current assets 35,709.25 39,509.43 Current assetsInventories 12 15,118.57 17,646.59 Financial assets Investments 7(b) 3,366.75 5,068.65 Trade receivables 13 13,198.61 14,651.93 Cash and cash equivalents 14 5,526.29 1,479.53 Bank balances other than cash and cash equivalents 15 755.64 816.62 Loans 8(b) 5.89 6.63
9(b) 590.23 573.81 Current tax assets (net) 16 204.95 1.43 Other current assets 11(b) 2,450.99 2,708.71
17 6.00 6.00
Total current assets 41,223.92 42,959.90 Total assets 76,933.17 82,469.33
EQUITY AND LIABILITIESEquityEquity share capital 18(a) 1,326.13 1,326.13 Other equityReserves and surplus 18(b) 27,094.80 26,517.62 Other reserves 18(c) 119.38 250.62 Equity attributable to owners of Welspun Corp Limited 28,540.31 28,094.37 Non-controlling interests 44(b) 566.12 1,135.39 Total equity 29,106.43 29,229.76 LIABILITIESNon-current liabilitiesFinancial liabilities Borrowings 19(a) 12,717.29 15,214.53
20(a) 1.49 - Provisions 21(a) 392.91 350.92 Deferred tax liabilities (net) 22 3,437.48 3,805.10 Government grants 23 3,649.58 3,653.64 Total non-current liabilities 20,198.75 23,024.19 Current liabilitiesFinancial liabilities Borrowings 19(b) 125.67 2,203.27 Trade payables 25 21,340.16 21,931.02
20(b) 2,436.68 2,485.73 Provisions 21(b) 195.12 172.87 Government grants 23 463.35 414.66 Current tax liabilities (net) 26 1,798.73 803.90 Other current liabilities 24 1,268.28 2,203.93
Total current liabilities 27,627.99 30,215.38
Total liabilities 47,826.74 53,239.57
Total equity and liabilities 76,933.17 82,469.33
The above consolidated Balance Sheet should be read in conjunction with the accompanying notes.This is the consolidated Balance Sheet referred to in our report of even date.
For Price Waterhouse Chartered Accountants LLP For and on behalf of the BoardFirm Registration No: 012754N / N500016 Rajesh Mandawewala Vipul Mathur
DirectorDIN: 00007179 DIN: 07990476
Mehul Desai S. Krishnan Pradeep JoshiPartner Executive Director and Company SecretaryMembership No. 103211 FCS-4959
and CEO(PCMD) Place: Mumbai DIN: 06829167Date: May 02, 2018
(All amounts in Rupees million, unless otherwise stated)

Annual Report 2017-18 Financial StatementsThe Welspun Corp Story Governance Reports
189
(All amounts in Rupees million, unless otherwise stated)
Consolidated Statement of Profit and Lossfor the year ended March 31, 2018
Notes Year ended March 31, 2018
Year ended March 31, 2017
Revenue from operations 27 72,847.66 57,634.07 Other operating revenue / income 28 3,025.57 2,720.58
Other revenue 29 1,312.11 2,246.00
Total income 77,185.34 62,600.65
Expenses Cost of materials consumed 30 52,370.06 36,277.16
Purchases of stock-in-trade 31 270.89 5,850.47
32 236.75 (1,725.58)
Excise duty 447.61 1,367.57
33 4,296.49 4,305.48
Depreciation and amortisation expense 34 3,793.05 3,860.80
Other expenses 35 11,416.09 9,155.41
Finance costs 36 1,853.28 2,357.14
Total expenses 74,684.22 61,448.45 Profit before share of loss of joint ventures accounted for using the equity method and tax
2,501.12 1,152.20
Share of net loss of joint ventures accounted for using the equity method 44(b) (859.14) (793.01)
Profit before tax 1,641.98 359.19
Income tax expense 37
Current tax 1,050.14 472.21
Deferred Tax (938.25) (214.17)
Total income tax expense 111.89 258.04
Profit for the year (A) 1,530.09 101.15
Other comprehensive income
Items that may be reclassified to profit or loss (189.40) 158.01
Income tax relating to these items 65.50 (54.69) Exchange differences on translation of foreign operations
(including non-controlling interests) (10.62) (282.08)
(134.52) (178.76)Items that will not be reclassified to profit or loss
(16.76) (34.18)
Income tax relating to this item 5.80 11.83
(10.96) (22.35)
Other comprehensive income/ (loss) for the year, net of tax (B) (145.48) (201.11)
Total comprehensive income/ (loss) for the year (A+B) 1,384.61 (99.96)
Profit is attributable to:Owners of Welspun Corp Limited 1,583.03 264.25 Non-controlling interests (52.94) (163.10)
1,530.09 101.15 Other comprehensive income/ (loss) is attributable to:Owners of Welspun Corp Limited (142.20) (182.71)Non-controlling interests (3.28) (18.40)
(145.48) (201.11)
Total comprehensive income/ (loss) is attributable to:Owners of Welspun Corp Limited 1,440.83 81.54 Non-controlling interests (56.22) (181.50)
1,384.61 (99.96)Earnings per equity share attributable toowners of Welspun Corp Limited:Basic and diluted earnings per share (in Rupees) 53 5.97 1.00
For Price Waterhouse Chartered Accountants LLP For and on behalf of the BoardFirm Registration No: 012754N / N500016 Rajesh Mandawewala Vipul Mathur
DirectorDIN: 00007179 DIN: 07990476
Mehul Desai S. Krishnan Pradeep JoshiPartner Executive Director and Company SecretaryMembership No. 103211 FCS-4959
and CEO (PCMD) Place: Mumbai DIN: 06829167Date: May 02, 2018

190
Year ended March 31, 2018
Year ended March 31, 2017
A) Cash flow from operating activities Profit before tax 1,641.98 359.19 Adjustments for :Depreciation and amortisation expense 3,793.05 3,860.80
Current investments (153.14) (168.30) Non-current investment - 0.02 (Gain)/ loss on disposal of property, plant and equipment (net) (25.71) 12.07 Share of net loss of joint ventures accounted for using the equity method 859.14 793.01 Fair valuation gain/ (loss) on investments (net) (18.85) 11.03 Allowance for doubtful debts (net) 1.58 9.47 Provision for doubtful advances written back (15.38) - Bad debts written off 2.23 - Rental expenses 21.12 21.10 Unwinding of discount on liabilities 50.12 46.90 Dividend income - (3.01)Interest income and commission income (516.37) (1,059.41)Interest expenses 1,248.37 1,790.79 Net exchange differences (unrealised) (87.74) 469.58 Operating profit before changes in operating assets and liabilities 6,800.40 6,143.24 Changes in operating assets and liabilitiesDecrease/ (increase) in trade receivables 1,568.44 (582.65)Decrease/ (increase) in inventories 2,528.02 (4,714.67)(Decrease)/ increase in trade payables (619.70) 5,248.15 (Decrease) in other non-current liabilities - (876.00)(Decrease) in other current liabilities (935.65) (1,755.65)
178.76 38.57 (186.12) 375.34
(Increase)/ decrease in other non-current assets (176.22) 92.24 Decrease/ (increase) in other current assets 236.60 (734.86)
1.49 (578.84) (34.61) 763.99
Increase in provisions 47.48 50.40 Increase in government grants 44.63 98.14 Total changes in operating assets and liabilities 2,653.12 (2,575.84)Cash flow from operations 9,453.52 3,567.40 Income taxes refund received (net of income taxes paid) 360.08 457.82
Net cash from operating activities (A) 9,813.60 4,025.22
B) Cash flow from investing activitiesPayments for property, plant and equipment (544.27) (815.51)Proceeds from property, plant and equipment 57.57 13.82 Sale of current investments (net) 1,856.28 2,398.47
41.06 3,700.40 Interest and commission received 554.66 1,198.41 Dividend received - 3.01 Loan to joint venture and other parties (142.86) (308.54)Repayment of loan from other parties 0.74 - Net cash from investing activities (B) 1,823.18 6,190.06
Consolidated Statement of Cash Flow for the year ended March 31, 2018

Annual Report 2017-18 Financial StatementsThe Welspun Corp Story Governance Reports
191
Consolidated Statement of Cash Flow for the year ended March 31, 2018
Year ended March 31, 2018
Year ended March 31, 2017
C) Cash flow used in financing activitiesTransactions with non-controlling interests (1,408.70) -
Proceeds from long term borrowings 3,119.78 3,818.20
Repurchase of non-convertible debentures (7,038.00) (3,000.00)
Proceeds from issue of non-convertible debentures 2,500.00 -
Repayment of long term borrowings (1,171.83) (5,298.68)
Proceeds from/ (repayment) of short term borrowings (net) (2,077.60) (3,339.85)
Interest paid (1,371.93) (1,807.00)
Dividend paid (including dividend distribution tax and unclaimed dividend) (160.47) (159.61)
Net cash used in financing activities (C) (7,608.75) (9,786.94)
Net increase/ (decrease) in cash and cash equivalents (A+B+C) 4,028.03 428.34 1,479.53 1,060.30
Gain/ (loss) on exchange rate changes on cash and cash equivalents 18.73 (9.11)
Cash and cash equivalents at the end of year 5,526.29 1,479.53 Net increase/ (decrease) in cash and cash equivalents 4,046.76 419.23
The above consolidated statement of Cash Flow should be read in conjunction with the accompanying notes.This is the consolidated statement of Cash Flow referred to in our report of even date.
For Price Waterhouse Chartered Accountants LLP For and on behalf of the BoardFirm Registration No: 012754N / N500016 Rajesh Mandawewala Vipul Mathur
DirectorDIN: 00007179 DIN: 07990476
Mehul Desai S. Krishnan Pradeep JoshiPartner Executive Director and Company SecretaryMembership No. 103211 FCS-4959
and CEO (PCMD) Place: Mumbai DIN: 06829167Date: May 02, 2018
(All amounts in Rupees million, unless otherwise stated)

192
B.
Oth
er
eq
uit
yA
ttri
bu
tab
le t
o o
wn
ers
of
We
lsp
un
Co
rp L
imit
ed
Re
serv
es
an
d s
urp
lus
Oth
er
rese
rve
s
Cap
ital
re
serv
e
Sec
uri
ties
p
rem
ium
re
serv
e
Deb
entu
re
red
emp
tio
n
rese
rve
Gen
eral
re
serv
e
Fo
reig
n c
urr
ency
m
on
etar
y It
em
tran
slat
ion
dif
fere
nce
ac
cou
nt
Ret
ain
ed
earn
ing
s
Cas
h fl
ow
h
edg
ing
re
serv
e
Fo
reig
n
curr
ency
tr
ansl
atio
n
rese
rve
To
tal
oth
er
equ
ity
No
n-
con
tro
llin
g
inte
rest
s T
ota
l
Bala
nce
as
at
Ap
ril 0
1, 2
016
15
2.9
2
7,7
69
.82
1
,14
2.3
7
53
.09
(
279
.42
) 1
7,4
13.0
4
31.
79
3
79
.19
2
6,6
62
.80
1
,316
.89
2
7,9
79
.69
-
-
-
-
-
2
64
.25
-
-
2
64
.25
(
163
.10
) 1
01.
15
Oth
er
co
mp
reh
en
sive in
co
me/
(lo
ss)
-
-
-
-
-
(22.3
5)
10
3.3
2
(26
3.6
8)
(18
2.7
1) (
18.4
0)
(20
1.11
)
Tota
l co
mp
reh
en
sive
in
com
e/
(lo
ss)
for
the
ye
ar
-
-
-
-
-
24
1.9
0
10
3.3
2
(26
3.6
8)
81.
54
(
181.
50
) (
99
.96
)
Mo
vem
en
t d
uri
ng
th
e y
ear
(net)
-
-
-
-
18
3.5
1 -
-
-
1
83
.51
-
18
3.5
1
Mo
vem
en
t in
deb
en
ture
red
em
pti
on
rese
rve (
net)
-
-
50
0.7
3
-
-
(5
00
.73
) -
-
-
-
-
Mo
vem
en
t in
gen
era
l rese
rve
-
-
-
174
.60
-
(
174
.60
) -
-
-
-
-
Tra
nsa
ctio
ns
wit
h o
wn
ers
in
th
eir
cap
aci
ty a
s o
wn
ers
:D
ivid
en
ds
paid
(in
clu
din
g d
ivid
en
d d
istr
ibu
tio
n t
ax)
-
-
-
-
-
(15
9.6
1) -
-
(
159
.61)
-
(15
9.6
1)
Bala
nce
as
at
Marc
h 3
1, 2
017
15
2.9
2
7,7
69
.82
1
,64
3.1
0
22
7.6
9
(9
5.9
1) 1
6,8
20
.00
1
35
.11
115
.51
26
,76
8.2
4
1,1
35
.39
2
7,9
03
.63
-
-
-
-
-
1
,58
3.0
3
-
-
1,5
83
.03
(
52.9
4)
1,5
30
.09
Oth
er
co
mp
reh
en
sive in
co
me/
(lo
ss)
-
-
-
-
-
(10
.96
) (
123
.90
) (
7.3
4)
(14
2.2
0)
(3
.28
) (
145
.48
)
Tota
l co
mp
reh
en
sive
in
com
e/
(lo
ss)
for
the
ye
ar
-
-
-
-
-
1,5
72.0
7
(12
3.9
0)
(7.3
4)
1,4
40
.83
(
56
.22)
1,3
84
.61
Mo
vem
en
t d
uri
ng
th
e y
ear
(net)
-
-
-
-
60
.37
-
-
60
.37
-
60
.37
Mo
vem
en
t in
deb
en
ture
red
em
pti
on
rese
rve (
net)
-
-
(1,
137.2
6)
-
-
1,1
37.2
6
-
-
-
-
-
Mo
vem
en
t in
gen
era
l rese
rve
-
-
-
125
.90
-
(
125
.90
) -
-
-
-
-
Tra
nsa
ctio
ns
wit
h o
wn
ers
in
th
eir
cap
aci
ty a
s o
wn
ers
:P
rem
ium
on
red
em
pti
on
of
NC
I's s
hare
-
-
-
-
-
(8
95
.65
) -
-
(
89
5.6
5)
(5
13.0
5)
(1,
40
8.7
0)
Div
iden
ds
paid
(in
clu
din
g d
ivid
en
d d
istr
ibu
tio
n t
ax)
-
-
-
-
-
(15
9.6
1) -
-
(
159
.61)
-
(15
9.6
1)
Bala
nce
as
at
Marc
h 3
1, 2
018
15
2.9
2
7,7
69
.82
5
05
.84
3
53
.59
(
35
.54
) 1
8,3
48
.17
1
1.2
1 1
08
.17
2
7,2
14.1
8
56
6.1
2
27,
78
0.3
0
A.
Eq
uit
y s
hare
cap
ital
Part
icu
lars
No
tes
Am
ou
nt
Bala
nce
as
at
Ap
ril 0
1, 2
016
1,3
26
.13
C
han
ges
in e
qu
ity s
hare
cap
ital d
uri
ng
th
e y
ear
18(a
) -
Bala
nce a
s at
Marc
h 3
1, 2
017
1
,32
6.1
3
Ch
an
ges
in e
qu
ity s
hare
cap
ital d
uri
ng
th
e y
ear
18(a
)
-
Bala
nce
as
at
Marc
h 3
1, 2
018
1
,32
6.1
3
Th
e a
bo
ve c
on
solid
ate
d s
tate
men
t o
f ch
an
ges
in e
qu
ity s
ho
uld
be r
ead
in
co
nju
ncti
on
wit
h t
he a
cco
mp
an
yin
g n
ote
s.T
his
is
the c
on
solid
ate
d s
tate
men
t o
f ch
an
ges
in e
qu
ity r
efe
rred
to
in
ou
r re
po
rt o
f even
date
.
Fo
r P
rice
Wate
rho
use
Ch
art
ere
d A
cco
un
tan
ts L
LP
Fo
r an
d o
n b
eh
alf
of
the
Bo
ard
Fir
m R
eg
istr
ati
on
No
: 0
1275
4N
/ N
50
00
16R
aje
sh M
an
daw
ew
ala
Vip
ul
Math
ur
Dir
ecto
rD
IN: 0
00
0717
9D
IN: 0
79
90
476
Me
hu
l D
esa
iS
. K
rish
nan
Pra
de
ep
Jo
shi
Part
ner
Execu
tive D
irecto
r an
d
Co
mp
an
y S
ecre
tary
Mem
bers
hip
No
. 10
3211
FC
S-4
95
9an
d C
EO
(P
CM
D)
P
lace: M
um
bai
DIN
: 06
829
167
Date
: M
ay 0
2, 20
18
Co
nso
lid
ate
d s
tate
men
t o
f ch
an
ges
in e
qu
ity
for
the
ye
ar
en
de
d M
arc
h 3
1, 2
018
(All
am
ou
nts
in
Ru
pees
mill
ion
, un
less
oth
erw
ise s
tate
d)

Notesannexed to and forming part of the consolidated balance sheet as at March 31, 2018 and the consolidated statement of profit and loss for the year ended March 31, 2018(All amounts in Rupees million, unless otherwise stated)
Annual Report 2017-18 Financial StatementsThe Welspun Corp Story Governance Reports
193
General InformationWelspun Corp Limited (hereinafter referred to as “WCL” or the “Company”) and its subsidiaries (hereinafter referred to as the “Group”) are engaged in the business of Production and Coating of High Grade Submerged Arc Welded Pipes, Hot Rolled Steel Plates and Coils.
The Company is a public limited company which is listed on the Bombay Stock Exchange (BSE) and the National Stock Exchange (NSE) and is incorporated and domiciled in India. The address of its registered
Dist Kutch, Gujarat - 370110, India.
for issue by the board of directors on May 02, 2018.
Note 1: Significant Accounting Policies
policies adopted in the preparation of these
been consistently applied to all the years presented,
are for the Group consisting of the Company and its subsidiaries and joint ventures.
1.1 Basis of preparation of financial statements a) Compliance with Ind AS
in all material aspects with Indian Accounting
133 of the Companies Act, 2013 (the Act) [Companies (Indian Accounting Standards) Rules, 2015] and other relevant provisions of the Act.
b) Historical cost convention
on the accrual and going concern basis. The
historical cost basis, except for the following items:
Items Measurement basis
and liabilities (including derivatives instruments)
Share based payment arrangements
(asset)/ liability assets less present
obligations
c) Current and non-current classification
current or non-current as per the Group’s normal operating cycle (i.e. 12 months) and other criteria set out in Schedule III (Division II) to the Act.
1.2 Principles of consolidation a) Subsidiaries
Subsidiaries are all entities over which the group has control. The group controls an entity when the group is exposed to, or has rights to, variable returns from its involvement with the entity and has the ability to affect those returns through its power to direct the relevant activities of the entity. In assessing control, potential voting rights that currently are exercisable are taken into account. The Company re-assesses whether or not it controls an investee if facts and circumstances indicate that there are changes to one or more of the three elements of control.
Subsidiaries are fully consolidated from the date on which control is transferred to the group. They are deconsolidated from the date that control ceases.
The acquisition method of accounting is used to account for business combinations by the group.
of the parent and its subsidiaries line by line adding together like items of assets, liabilities, equity, income and expenses. Intercompany transactions, balances and unrealised gains on transactions between group companies are eliminated. Unrealised losses are also eliminated unless the transaction provides evidence of an impairment of the transferred asset. Accounting policies of subsidiaries have been changed where necessary to ensure consistency with the policies adopted by the group.
Non-controlling interests in the results and equity of subsidiaries are shown separately in
consolidated statement of changes in equity and balance sheet respectively.
used in consolidation are drawn up to the same reporting date as that of the Company.

Notesannexed to and forming part of the consolidated balance sheet as at March 31, 2018 and the consolidated statement of profit and loss for the year ended March 31, 2018(All amounts in Rupees million, unless otherwise stated)
194
For list of subsidiaries consolidated, refer table below:
Name of the Subsidiaries Country of Incorporation Extent of Holding
As at March 31, 2018
As at March 31, 2017
Direct Subsidiaries
Welspun Pipes Inc. USA 94.79% 90.01%
Welspun Tradings Limited India 100% 100%
Welspun Mauritius Holdings Limited Mauritius 89.98% 89.98%
Indirect Subsidiaries
Held through Welspun Pipes Inc.
Welspun Tubular LLC USA 100% 100%
Welspun Global Trade LLC USA 100% 100%
Held through Welspun Tradings Limited
Welspun Middle East DMCC Dubai, UAE 100% 100%
b) Joint arrangements
investor, rather than the legal structure of the joint arrangement. The Company has three joint ventures.
For list of Joint ventures consolidated, refer table below:
Name of the Joint ventures Country of Incorporation Extent of Holding
As at March 31, 2018
As at March 31, 2017
Welspun Wasco Coatings Private Limited India 51% 51%
Welspun Middle East Pipes Company LLC Kingdom of Saudi Arabia 50.01% 50.01%
Welspun Middle East Pipes Coatings Company LLC
Kingdom of Saudi Arabia50.01% 50.01%
i) Joint ventures A joint venture is a type of joint arrangement
whereby the parties that have joint control of the arrangement have rights to the net assets of the joint venture. Joint control is the contractually agreed sharing of control of an arrangement, which exists only when decisions about the relevant activities require unanimous consent of the parties sharing
venture are prepared for the same reporting period as the Group.
Interests in joint ventures are accounted for using the equity method (refer below), after initially being recognised at cost in the consolidated balance sheet.
c) Equity method Under the equity method of accounting, the
investments are initially recognised at cost
and adjusted thereafter to recognise the
and the group’s share of other comprehensive income of the investee in other comprehensive income. Dividends received or receivable from joint ventures are recognised as a reduction in the carrying amount of the investment.
When the group’s share of losses in an equity-accounted investment equals or exceeds its interest in the entity, including any other unsecured long-term receivables, the group does not recognise further losses, unless it has incurred obligations or made payments on behalf of the other entity.
Group’s share of the results of operations of the joint venture. Any change in OCI of those investees is presented as part of the Group’s

Notesannexed to and forming part of the consolidated balance sheet as at March 31, 2018 and the consolidated statement of profit and loss for the year ended March 31, 2018(All amounts in Rupees million, unless otherwise stated)
Annual Report 2017-18 Financial StatementsThe Welspun Corp Story Governance Reports
195
OCI. In addition, when there has been a change recognised directly in the equity of the joint venture, the Group recognises its share of any changes, when applicable, in the statement of changes in equity.
Unrealised gains on transactions between the group and its joint ventures are eliminated to the extent of the group’s interest in these entities. Unrealised losses are also eliminated unless the transaction provides evidence of an impairment of the asset transferred. Accounting policies of equity accounted investees have been changed where necessary to ensure consistency with the policies adopted by the group.
The carrying amounts of equity accounted investments are tested for impairment.
d) Change in Ownership Interest The group treats transactions with non-
controlling interests that do not result in a loss of control as transactions with equity owners of the group. A change in ownership interest results in an adjustment between the carrying amounts of the controlling and non-controlling
the subsidiary. Any difference between the amount of the adjustment to non-controlling interests and any consideration paid or received is recognised within equity.
When the group ceases to consolidate or equity account for an investment because of a loss of control, joint control, and any retained interest in the entity is remeasured to its fair value with the change in carrying amount
becomes the initial carrying amount for the purposes of subsequently accounting for the
asset. In addition, any amounts previously recognised in other comprehensive income in respect of that entity are accounted for as if the group had directly disposed of the related assets or liabilities. This may mean that amounts previously recognised in other
If the ownership interest in a joint venture
is reduced but joint control is retained, only a proportionate share of the amounts previously recognised in other comprehensive
appropriate.
1.3 Foreign currency translations a) Functional and presentation currency
of each of the group’s entities are measured using the currency of the primary economic environment in which the entity operates (the “Functional currency’). The consolidated
rupee (INR), which is Group’s functional and presentation currency.
b) Transactions and balances Foreign currency transactions are translated
into the functional currency using the exchange rates at the dates of the transactions. Foreign exchange gains and losses resulting from the settlement of such transactions and from the translation of monetary assets and liabilities denominated in foreign currencies at year end exchange rates are generally recognised in
Foreign exchange differences regarded as an adjustment to borrowing costs are presented
and losses are presented in the statement
expenses or other income, as applicable.
Non-monetary items that are measured in terms of historical cost in a foreign currency are translated using the exchange rates at the date of initial transaction.
Non-monetary items that are measured at fair value in a foreign currency are translated using the exchange rates at the date when the fair value was determined. Translation differences on assets and liabilities carried at fair value are reported as part of the fair value gain or loss.
Translation differences on assets and liabilities carried at fair value are reported as part of the fair value gain or loss. For example: translation differences on non-monetary assets and liabilities such as equity instruments held at

Notesannexed to and forming part of the consolidated balance sheet as at March 31, 2018 and the consolidated statement of profit and loss for the year ended March 31, 2018(All amounts in Rupees million, unless otherwise stated)
196
or loss and translation differences on non-monetary assets such as equity investments
comprehensive income.
The Group has elected to apply the exemption from the transition date i.e. April 01, 2015 in respect of accounting policy followed for long term foreign currency monetary items. Accordingly, long term foreign currency
to the year ended March 31, 2016 have been accounted in accordance with the policy adopted under previous GAAP as given below:
Foreign exchange differences on account of depreciable assets are adjusted in the cost of depreciable assets and depreciated over the balance life of the assets.
In other cases, foreign exchange differences are accumulated in “Foreign Currency Monetary Item Translation Difference Account” and amortised over the balance period of such long term assets/ liabilities.
c) Group companies
operations that have a functional currency different from the presentation currency are translated into the presentation currency as follows:
assets and liabilities are translated at the closing rate at the date of that balance sheet;
income and expenses are translated at average exchange rates; and
All resulting exchange differences are recognised in other comprehensive income under head Foreign currency translation reserve (FCTR).
1.4 Revenue recognition Revenue is measured at the fair value of the
consideration received or receivable. Amounts
disclosed as revenue are inclusive of excise duty and net of returns, trade allowances, rebates, value added tax, good and service tax (GST) applicable taxes within jurisdiction and amounts collected on behalf of third parties.
The group recognises revenue when the group has transferred to the buyer the
goods;
the group retains neither continuing managerial involvement to the degree usually associated with the ownership nor effective control over the goods sold;
the amount of revenue can be reliably measured;
group; and
the cost incurred or to be incurred in respect of the transaction can be measured reliably.
The group bases its estimates on historical results, taking into consideration the type of customer,
arrangement.
1.5 Segment reporting Operating segments are reported in a manner
consistent with the internal reporting provided to the chief operating decision maker. The chief operating decision maker is Managing director and CEO of the Group. The Managing director and
and position of the Group, and makes strategic decisions.
1.6 Government grants Grants from the government are recognised at their
fair value where there is a reasonable assurance that the grant will be received and the group will comply with all attached conditions.
Grants related to assets are government grants whose primary condition is that an entity qualifying for them should purchase, construct or otherwise acquire long-term assets. Grants related to income are government grants other than those related to assets.

Notesannexed to and forming part of the consolidated balance sheet as at March 31, 2018 and the consolidated statement of profit and loss for the year ended March 31, 2018(All amounts in Rupees million, unless otherwise stated)
Annual Report 2017-18 Financial StatementsThe Welspun Corp Story Governance Reports
197
Government grants relating to income are deferred
necessary to match them with the costs that they are intended to compensate and presented either under “other operating revenue” or are deducted in reporting the related expense. The presentation approach is applied consistently to all similar grants.
Government grants relating to the purchase of property, plant and equipment are included in liabilities as “Government grants” and are credited
in which depreciation expense on those assets is recognised.
1.7 Income tax, deferred tax and dividend distribution tax
The income tax expense or credit for the year is the tax payable on the current year’s taxable income based on the applicable income tax rate for each jurisdiction adjusted by changes in deferred tax assets and liabilities attributable to temporary differences and to unused tax losses.
Current and deferred tax is recognised in the
it relates to items recognised directly in equity or other comprehensive income, in which case it is recognised in equity or other comprehensive income respectively.
a) Current income tax
for the year. The tax rates and tax laws used to compute the amount are those that are enacted or substantively enacted, at the reporting date in the countries where the Group operates and generates taxable income. Management periodically evaluates positions taken in tax returns with respect to situations in which applicable tax regulation is subject to interpretation. It establishes provisions where appropriate on the basis of amounts expected to be paid to the tax authorities.
Current tax assets and tax liabilities are offset when there is a legally enforceable right to set off current tax assets against current tax liabilities and group intends either to settle on a net basis, or to realise the asset and settle the liability simultaneously.
b) Deferred tax Deferred tax is provided using the liability
method on temporary differences arising between the tax bases of assets and liabilities and their carrying amounts in the consolidated
Such deferred tax assets and liabilities are computed separately for each taxable entity and for each taxable jurisdiction. Deferred tax is determined using tax rates that have been enacted or substantially enacted by the end of the reporting period and are expected to apply when the related deferred tax assets is realized or deferred tax liability is settled.
Deferred tax are recognised for all deductible temporary difference and unused tax losses only if it is probable that future taxable amounts will be available to utilise those temporary differences and losses.
Deferred income tax is not accounted for if it arises from initial recognition of an asset or liability in a transaction other than a business combination that at the time of the transaction
Deferred tax liabilities are recognised for taxable temporary differences arising on investments in subsidiaries and interests in jointly controlled entities, except where the Company is able to control the reversal of the temporary difference and it is probable that the temporary difference will not reverse in the foreseeable future.
Deferred tax assets are not recognised for temporary differences between the carrying amount and tax bases of investments in subsidiaries and associates and interest in joint arrangements where it is not probable that the differences will reverse in the foreseeable
against which the temporary difference can be utilised.
The carrying amount of deferred tax assets is reviewed at each reporting date and adjusted
part of the asset to be recovered.

Notesannexed to and forming part of the consolidated balance sheet as at March 31, 2018 and the consolidated statement of profit and loss for the year ended March 31, 2018(All amounts in Rupees million, unless otherwise stated)
198
Deferred income tax assets and liabilities are off-set against each other and the resultant net amount is presented in the Balance Sheet, if and only when, (a) the Group has a legally enforceable right to set-off the current income tax assets and liabilities, and (b) the Deferred income tax assets and liabilities relate to income tax levied by the same taxation authority.
or loss, except to the extent that it relates to items reconised in other comprehensive income or directly in equity. In this case, the tax is also recognised in other comprehensive income or directly in equity, respectively
c) Dividend distribution tax Dividend distribution tax paid on the
dividends is recognised consistently with the presentation of the transaction that creates the income tax consequence. Dividend distribution tax is charged to Statement of
is recognised in equity, the presentation of dividend distribution tax is recognised in equity.
1.8 Leases a) As a lessee
the risks and rewards of ownership are not transferred to the group as lessee are
under operating leases (net of any incentives received from the lessor) are charged to
period of the lease unless the payments are structured to increase in line with expected
b) As a lessor Lease income from operating leases where the
group is a lessor is recognised in income on a straight-line basis over the lease term unless the receipts are structured to increase in line
The respective leased assets are included in the balance sheet based on their nature.
1.9 Property, Plant and equipment Freehold land is carried at historical cost. All other
items of property, plant and equipment are stated at historical cost less depreciation. Historical cost includes expenditure that is directly attributable to the acquisition of the items.
Subsequent costs are included in the asset’s carrying amount or recognised as a separate asset, as appropriate, only when it is probable that
be measured reliably. The carrying amount of any component accounted for as a separate asset is derecognised when replaced. All other repairs and
the reporting period in which they are incurred.
Cost of Capital Work-in-Progress (‘CWIP’) comprises amount paid towards acquisition of property, plant and equipment outstanding as of each balance sheet date and construction expenditures, other expenditures necessary for the purpose of preparing the CWIP for it intended use and borrowing cost incurred before the qualifying asset is ready for intended use. CWIP is not depreciated until such time as the relevant asset is completed and ready for its intended use.
Depreciation methods, estimated useful lives and residual value
Freehold land is not depreciated. Leasehold improvements are amortised over the shorter of estimated useful life or the related lease term. Depreciation is calculated using the straight-line method to allocate their cost, net of their residual values, over their estimated useful lives as follows:
Assets Estimated Useful Lives (in years)
BuildingsBuilding 30
Residential and other buildings
60
Road, fencing, etc. Ranging between 3 to 15 years
Office and other equipments
Ranging between 3 to 10 years
Computer 3 years except Networking equipment’s which are depreciated over useful life of 5 years
Vehicles 8
Furniture and fixtures
10

Notesannexed to and forming part of the consolidated balance sheet as at March 31, 2018 and the consolidated statement of profit and loss for the year ended March 31, 2018(All amounts in Rupees million, unless otherwise stated)
Annual Report 2017-18 Financial StatementsThe Welspun Corp Story Governance Reports
199
Plant and machinery is depreciated on straight line method over the useful life ranging between 2 years to 40 years which is different than the life prescribed under Schedule II to the Companies
the assets. The estimated useful lives of plant and machinery has been determined based on internal technical advice which considers the nature of the asset, the usage of the asset, expected physical wear and tear, the operating conditions of the asset, anticipated technological changes, etc.
The residual values are not more than 5% of the original cost of the asset.
An asset’s carrying amount is written down immediately to its recoverable amount if the asset’s carrying amount is greater than its estimated recoverable amount.
Estimated useful lives, residual values and depreciation methods are reviewed annually, taking into account commercial and technological obsolescence as well as normal wear and tear and adjusted prospectively, if appropriate.
Gains and losses on disposals are determined by comparing proceeds with carrying amount. These
other expenses, as applicable.
1.10 Investment properties Property that is held for long-term rental yields
or for capital appreciation or both, and that is not
property. Investment property is measured initially at its cost, including related transaction costs and where applicable borrowing costs. Subsequent expenditure is capitalised to the asset’s carrying amount only when it is probable
of the item can be measured reliably. All other repairs and maintenance costs are expensed when incurred. When part of an investment property is replaced, the carrying amount of the replaced part is derecognised.
Investment properties (except freehold land) are depreciated using the straight-line method over their estimated useful lives.
1.11 Intangible assets a) Goodwill on consolidation:
Goodwill on acquisitions of subsidiaries is shown separately. Goodwill is not amortised but it is tested for impairment annually, or more frequently if events or changes in circumstances indicate that it might be impaired, and is carried at cost less accumulated impairment losses. Gains and losses on the disposal of an entity include the carrying amount of goodwill relating to the entity sold.
Goodwill is allocated to cash-generating units for the purpose of impairment testing. The allocation is made to those cash-generating units or groups of cash-generating units that
combination in which the goodwill arise. The
lowest level at which goodwill is monitored for internal management purposes, which in our case are the operating segments.
b) Other intangible assets
lives acquired by the group are measured at cost less accumulated amortisation and accumulated impairment losses. Amortisation is charged on a straight-line basis over the estimated useful lives. The estimated useful life and amortisation method are reviewed at the end of each annual reporting period, with the effect of any changes in the estimate being accounted for on a prospective basis.
c) Amortisation methods and periods Other intangible assets comprise of computer
software which is amortised on a straight-line basis over its expected useful life over a
Intangible Asset under Development comprises amount paid towards acquisition/development of Intangible Assets outstanding as of each balance sheet date and acquisition expenditures, other expenditures necessary for the purpose of preparing the Intangible Asset for it intended use. Intangible Assets under Development is not amortised until such time as the relevant asset is completed and ready for its intended use.

Notesannexed to and forming part of the consolidated balance sheet as at March 31, 2018 and the consolidated statement of profit and loss for the year ended March 31, 2018(All amounts in Rupees million, unless otherwise stated)
200
1.12 Non-current assets held for sale
their carrying amount will be recovered principally through a sale transaction rather than through continuing use and a sale is considered highly probable. They are measured at the lower of their carrying amount and fair value less costs to sell, except for assets such as deferred tax assets,
requirement.
An impairment loss is recognised for any initial or subsequent write-down of the asset to fair value less costs to sell. A gain is recognised for any subsequent increases in fair value less costs to sell of an asset, but not in excess of any cumulative impairment loss previously recognised. A gain or loss not previously recognised by the date of the sale of the non-current asset is recognised at the date of de-recognition.
Non-current assets are not depreciated or
presented separately in the balance sheet.
1.13 Impairment of assets Goodwill and intangible assets that have an
and are tested annually for impairment, or more frequently if events or changes in circumstances indicate that they might be impaired. Other assets are tested for impairment whenever events or changes in circumstances indicate that the carrying amount may not be recoverable. An impairment loss is recognised for the amount by which the asset’s carrying amount exceeds its recoverable amount. The recoverable amount is the higher of an asset’s fair value less costs of disposal and value in use. For the purposes of assessing impairment, assets are grouped at the lowest levels for which there
assets or groups of assets (cash-generating units).
suffered an impairment are reviewed for possible reversal of the impairment at the end of each reporting period.
1.14 Inventories Raw materials, stores and spares, work in
progress, traded goods and finished goods
Raw materials, stores and spares, work in progress,
the lower of cost and net realisable value. Cost of raw materials and traded goods comprises cost of purchases on moving weighted average
comprises direct materials, direct labour and
overhead expenditure, the latter being allocated on the basis of normal operating capacity. Cost of inventories also includes all other costs incurred in bringing the inventories to their present location and condition. Costs are assigned to individual items of inventory moving weighted average basis. Costs of purchased inventory are determined after deducting rebates and discounts. Net realisable value is the estimated selling price in the ordinary course of business less the estimated costs of completion and the estimated costs necessary to make the sale.
1.15 Investment in joint ventures Investment in joint ventures is carried at cost in the
1.16 Financial Instruments
liability or equity instrument of another entity.
a) Financial Assets (I) Classification
the following measurement categories:
those to be measured subsequently at fair value (either through other
or loss); and
those measured at amortised cost.
assets and the contractual terms of the cash
For assets measured at fair value, gains and
or other comprehensive income.
For investments in debt instruments, this will depend on the business model in which the investment is held.

Notesannexed to and forming part of the consolidated balance sheet as at March 31, 2018 and the consolidated statement of profit and loss for the year ended March 31, 2018(All amounts in Rupees million, unless otherwise stated)
Annual Report 2017-18 Financial StatementsThe Welspun Corp Story Governance Reports
201
For investments in equity instruments, this will depend on whether the group has made an irrevocable election at the time of initial recognition to account for the equity investment at fair value through other comprehensive income.
when and only when its business model for managing those assets changes.
(II) Measurement At initial recognition, the group measures
costs that are directly attributable to
(i) Debt instruments Subsequent measurement of debt
instruments depends on the group’s business model for managing the asset
asset. There are three measurement
its debt instruments:
Amortised cost: Assets that are held
payments of principal and interest are measured at amortised cost. A gain or loss on a debt investment that is subsequently measured at amortised cost and is not part of a hedging relationship
the asset is derecognised or impaired.
the effective interest rate method.
Fair value through other comprehensive Assets that are held
payments of principal and interest, are measured at fair value through
Movements in the carrying amount are taken through OCI, except for the recognition of impairment gains or losses, interest income and foreign exchange gains and losses which are recognised in
is derecognised, the cumulative gain or loss previously recognised in OCI is
and recognised in other gains/ (losses).
assets is included in other income using the effective interest rate method.
Assets that do not meet the criteria for amortised
a debt investment that is subsequently
or loss and is not part of a hedging
loss and presented net in the statement
or other expenses (as applicable) in the period in which it arises. Interest income
other income.
(ii) Equity instruments The Group subsequently measures
all equity investments at fair value. Where the Group’s management has elected to present fair value gains and losses on equity investments in other comprehensive income, there is no
from such investments are recognised
the group’s right to receive payments is established.
loss are recognised in the statement of
reversal of impairment losses) on equity
reported separately from other changes in fair value.

Notesannexed to and forming part of the consolidated balance sheet as at March 31, 2018 and the consolidated statement of profit and loss for the year ended March 31, 2018(All amounts in Rupees million, unless otherwise stated)
202
(III) Impairment of financial assets The group assesses on a forward looking
basis the expected credit losses associated with its assets carried at amortised
The impairment methodology applied depends on whether there has been a
For trade receivables only, the group
by Ind AS 109 Financial Instruments, which requires expected lifetime losses to be recognised from initial recognition of the receivables.
(IV) Derecognition of financial assets
when
The group has transferred the rights to
or
retains the contractual rights to receive
assumes a contractual obligation to pay
Where the entity has transferred an asset, the group evaluates whether it has transferred substantially all risks and
is derecognised. Where the entity has not transferred substantially all risks and rewards of ownership of the
derecognised.
Where the entity has neither transferred
all risks and rewards of ownership of
is derecognised if the group has not
Where the group retains control of the
be recognised to the extent of continuing
(V) Income recognition (i) Interest income
Interest income from debt instruments is recognised using the effective interest
rate method. The effective interest rate is the rate that exactly discounts estimated future cash receipts through the expected
calculating the effective interest rate, the
by considering all the contractual terms
prepayment, extension, call and similar options) but does not consider the expected credit losses.
(ii) Dividend income
or loss only when the right to receive payment is established, it is probable
and the amount of the dividend can be measured reliably.
(iii) Export Benefits In case of sale made by the Company as
arising from Duty Entitlement Pass Book (DEPB), Duty Drawback scheme and Merchandise Export Incentive Scheme (MEIS) are recognised on export of such goods in accordance with the agreed terms and conditions with customers. In case of direct exports made by the
DEPB, Duty Drawback scheme and Merchandise Export Incentive Scheme are recognised on shipment of direct exports.
(VI) Cash and cash equivalents Cash and cash equivalents includes cash
in hand, deposits held at call with banks, other short term highly liquid investments with original maturities of three months or less that are readily convertible to known amounts of cash and which are subject to
For the purpose of presentation in
cash equivalents includes outstanding bank overdraft shown within current liabilities in balance sheet and which are considered as integral part of Company’s cash management policy.

Notesannexed to and forming part of the consolidated balance sheet as at March 31, 2018 and the consolidated statement of profit and loss for the year ended March 31, 2018(All amounts in Rupees million, unless otherwise stated)
Annual Report 2017-18 Financial StatementsThe Welspun Corp Story Governance Reports
203
(VII) Trade receivables Trade receivables are recognised initially
at their fair value and subsequently measured at amortised cost using the effective interest method, less provision for impairment.
b) Financial liabilities (I) Measurement
Financial liabilities are initially recognised at fair value, reduced by transaction (in
liabilities are measured at amortised cost using effective interest method. The effective interest rate is the rate that exactly discounts estimated future
transaction cost, and other premiums or discounts) through the expected
appropriate, a shorter period, to the net carrying amount on initial recognition. At the time of initial recognition, there is no
agreements are measured at the lower of fair value of the leased asset or present value of minimum lease payments.
(II) Derecognition
when the obligation under the liability is discharged or cancelled or expires.
replaced by another from the same lender on substantially different terms, or the terms of an existing liability are
recognition of the original liability and the recognition of a new liability. The difference in the respective carrying amounts is recognised in the statement
(III) Borrowings Borrowings are initially recognised at fair
value, net of transaction costs incurred. Borrowings are subsequently measured at amortised cost. Any difference between
the proceeds (net of transaction costs) and the redemption amount is recognised
borrowings using the effective interest method. Fees paid on the establishment of loan facilities are recognised as transaction costs of the loan to the extent that it is probable that some or all of the facility will be drawn down. In this case, the fee is deferred until the draw down occurs. To the extent there is no evidence that it is probable that some or all of the facility will be drawn down, the fee is capitalised as a prepayment for liquidity services and amortised over the period of the facility to which it relates.
Borrowings are removed from the balance
the contract is discharged, cancelled or expired. The difference between the
has been extinguished or transferred to another party and the consideration paid, including any non-cash assets transferred or liabilities assumed, is recognised in Statement of income or other expenses (as applicable).
renegotiated and the entity issues equity instruments to a creditor to extinguish all or part of the liability (debt for equity swap), a gain or loss is recognised in
difference between the carrying amount
of the equity instruments issued.
Where there is a breach of a material provision of a long-term loan arrangement on or before the end of the reporting period with the effect that the liability becomes payable on demand on the reporting date, the entity does not classify the liability as current, if the lender agreed, after the reporting period
statements for issue, not to demand payment as a consequence of the breach.
(IV) Trade and other payables These amounts represent liabilities for
goods and services provided to the group

Notesannexed to and forming part of the consolidated balance sheet as at March 31, 2018 and the consolidated statement of profit and loss for the year ended March 31, 2018(All amounts in Rupees million, unless otherwise stated)
204
are unpaid. Trade and other payables are recognised initially at, their fair value, and subsequently measured at amortised cost using effective interest rate method.
c) Financial guarantee contracts Financial guarantee contracts are recognised
is issued. The liability is initially measured at fair value and subsequently at the higher of the amount determined in accordance with Ind AS 37 Provisions, Contingent Liabilities and Contingent Assets and the amount initially recognised less cumulative amortisation, where appropriate.
d) Derivatives and hedging activities In order to hedge its exposure to foreign
exchange and interest rate, the Group enters into forward and interest rate swap contracts
instruments for speculative purposes.
Derivatives are initially recognised at fair value on the date a derivative contract is entered into and are subsequently re-measured to their fair value at the end of each reporting period.
The accounting for subsequent changes in fair value depends on whether the derivative is designated as a hedging instrument, and if so, the nature of the item being hedged and the type of hedge relationship designated.
The group designates their derivatives as hedges of foreign exchange risk associated
forecast transactions and variable interest rate risk associated with borrowings (cash
The group documents at the inception of the hedging transaction the economic relationship between hedging instruments and hedged items including whether the hedging instrument is expected to offset changes
documents its risk management objective and strategy for undertaking various hedge transactions at the inception of each hedge relationship.
The full fair value of a hedging derivative is
when the remaining maturity of the hedged
a current asset or liability when the remaining maturity of the hedged item is less than 12 months.
(I) Cash flow hedges that qualify for hedge accounting
The effective portion of changes in the fair value of derivatives that are designated
recognised in the other comprehensive
within equity, limited to the cumulative change in fair value of the hedged item on a present value basis from the inception of the hedge. The gain or loss relating to the ineffective portion is recognised
income or other expenses (as applicable).
When forward contracts are used to hedge forecast transactions, the group generally designates the full change in fair value of the forward contract (including forward points) as the hedging instrument. In such cases, the gains and losses relating to the effective portion of the change in fair value of the entire forward contract are recognised in the
Amounts accumulated in equity are
loss.
When the hedged forecast transaction results in the recognition of a non-
as follows:
With respect to gain or loss relating to the effective portion of the change in fair value of forward contracts, the deferred hedging gains and losses are included within the initial cost of the asset. The deferred amounts are ultimately
Notesannexed to and forming part of the consolidated balance sheet as at March 31, 2018 and the consolidated statement of profit and loss for the year ended March 31, 2018(All amounts in Rupees million, unless otherwise stated)
Annual Report 2017-18 Financial StatementsThe Welspun Corp Story Governance Reports
205
With respect to gain or loss relating to the effective portion of the spot component of forward contracts, both the deferred hedging gains and losses and the deferred aligned forward points are included within the initial cost of the asset. The deferred amounts are ultimately recognised in
When a hedging instrument expires, or is sold or terminated, or when a hedge no longer meets the criteria for hedge accounting, any cumulative deferred gain or loss in equity at that time remains in equity until the forecast transaction occurs. When the forecast transaction is no longer expected to occur, the cumulative gain or loss that was reported
expenses (as applicable). If the hedge ratio for risk management purposes is no longer optimal but the risk management objective remains unchanged and the hedge continues to qualify for hedge accounting, the hedge relationship will be rebalanced by adjusting either the volume of the hedging instrument or the volume of the hedged item so that the hedge ratio aligns with the ratio used for risk management purposes. Any hedge ineffectiveness is calculated and
of the hedge relationship rebalancing.
(II) Derivatives that are not designated as hedges
The Group enters into certain derivative contracts to hedge risks which are not designated as hedges. Such contracts are
or loss and are included in other income or other expenses (as applicable).
e) Embedded Derivatives Derivatives embedded in a host contract
that is an asset within the scope of Ind AS 109 are not separated. Financial assets with embedded derivatives are considered in their entirety when determining whether their cash
interest.
Derivatives embedded in all other host contract are separated only if the economic characteristics and risks of the embedded derivative are not closely related to the economic characteristics and risks of the host
or loss. Embedded derivatives closely related to the host contracts are not separated.
f) Embedded foreign currency derivatives Embedded foreign currency derivatives
are not separated from the host contract if they are closely related. Such embedded derivatives are closely related to the host contract, if the host contract is not leveraged, does not contain any option feature and requires payments in one of the following currencies:
the functional currency of any substantial party to that contract;
the currency in which the price of the related good or service that is acquired or delivered is routinely denominated in commercial transactions around the world; and
a currency that is commonly used in
items in the economic environment in which the transaction takes place (i.e. relatively liquid and stable currency)
Foreign currency embedded derivatives which do not meet the above criteria are separated and the derivative is accounted for at fair value
does not have any such derivatives which are not closely related.
1.17 Borrowing costs
directly attributable to the acquisition, construction or production of a qualifying asset are capitalised during the period of time that is required to complete and prepare the asset for its intended use or sale. Qualifying assets are assets that necessarily take a substantial period of time to get ready for their intended use or sale. Investment income earned on the temporary investment of
qualifying assets is deducted from the borrowing costs eligible for capitalisation. Other borrowing

Notesannexed to and forming part of the consolidated balance sheet as at March 31, 2018 and the consolidated statement of profit and loss for the year ended March 31, 2018(All amounts in Rupees million, unless otherwise stated)
206
costs are expensed in the period in which they are incurred.
1.18 Employee benefits a) Short-term obligations
Liabilities for wages and salaries, including
to be settled wholly within 12 months after the end of the period in which the employees render the related service are recognised in respect of employees’ services up to the end of the reporting period and are measured at the amounts expected to be paid when the liabilities are settled. The liabilities are
obligations in the balance sheet.
b) Other long-term employee benefit obligations
The liabilities for earned leave are not expected to be settled wholly within 12 months after the end of the period in which the employees render the related service. They are therefore measured as the present value of expected future payments to be made in respect of services provided by employees up to the end of the reporting period using the
are discounted using the market yields at the end of the reporting period that have terms approximating to the terms of the related obligation. Remeasurements as a result of experience adjustments and changes in
or loss.
The obligations are presented as current liabilities in the balance sheet if the entity does not have an unconditional right to defer settlement for at least twelve months after the reporting period, regardless of when the actual settlement is expected to occur.
c) Post-employment obligations The Group operates the following post-
employment schemes:
provident fund and superannuation fund.
(I) Defined Benefit Plans (i) Gratuity obligations
The liability or asset recognised in the
end of the reporting period less the fair
obligation is calculated annually by actuaries using the projected unit credit method.
obligation denominated in INR is determined by discounting the estimated
market yields at the end of the reporting period on government bonds that have terms approximating to the terms of the related obligation.
The net interest cost is calculated by applying the discount rate to the net
and the fair value of plan assets. This cost
Remeasurement gains and losses arising from experience adjustments and changes in actuarial assumptions are recognised in the period in which they occur, directly in other comprehensive income. They are included in retained earnings in the statement of changes in equity and in the balance sheet. Remeasurements are
subsequent periods.
Changes in the present value of the
plan amendments or curtailments are
as past service cost.
(II) Defined contribution plans (i) Provident Fund, Employee State Insurance Corporation (ESIC), Pension Fund and other Social Security Funds
The Contribution towards provident fund, ESIC, Pension fund and other Social Security Funds for certain employees is made to the regulatory authorities where the Group has

Notesannexed to and forming part of the consolidated balance sheet as at March 31, 2018 and the consolidated statement of profit and loss for the year ended March 31, 2018(All amounts in Rupees million, unless otherwise stated)
Annual Report 2017-18 Financial StatementsThe Welspun Corp Story Governance Reports
207
as the Group does not carry any further obligations apart from the contributions made on a monthly basis.
(ii) Superannuation Fund Contribution towards superannuation
fund for certain employees is made to SBI Life Insurance Company where the Group
Schemes as the Group does not carry any further obligations, apart from contribution made on monthly basis.
d) Bonus Plan The Group recognises a liability and an
expense for bonuses. The Group recognises a provision where contractually obliged or where there is a past practice that has created a constructive obligation.
1.19 Provisions, contingent liabilities and contingent assets
a) Provisions Provisions for legal claims are recognised when
the Group has a present legal or constructive obligation as a result of past events, it is
be required to settle the obligation and the amount can be reliably estimated. Provisions are not recognised for future operating losses.
Where there are a number of similar
be required in settlement is determined by considering the class of obligations as a whole. A provision is recognised even if the likelihood
included in the same class of obligations may be small. Provisions are measured at the present value of management’s best estimate of the expenditure required to settle the present obligation at the end of the reporting period. The discount rate used to determine
current market assessments of the time
liability. The increase in the provision due to the passage of time is recognised as interest expense.
The measurement of provision for restructuring includes only direct expenditures
arising from the restructuring, which are both necessarily entailed by the restructuring and not associated with the ongoing activities of the Group.
b) Contingent liabilities Contingent liabilities are disclosed when there
is a possible obligation arising from past events
by the occurrence or non-occurrence of one or more uncertain future events not wholly within the control of the Group or a present obligation that arises from past events where
resources will be required to settle or a reliable estimate of the amount cannot be made.
c) Contingent assets Contingent assets are disclosed, where an
1.20 Contributed equity
costs directly attributable to the issue of new shares or options are shown in equity as a deduction, net of tax, from the proceeds.
1.21 Dividends Provision is made for the amount of any dividend
declared, being appropriately authorised and no longer at the discretion of the entity, on or before the end of the reporting period but not distributed at the end of the reporting period.
1.22 Earnings per share a) Basic earnings per share
Basic earnings per share is calculated by dividing:
group; and
by the weighted average number of equity
year, adjusted for bonus elements in equity shares issued during the year and excluding treasury shares.
b) Diluted earnings per share
used in the determination of basic earnings per share to take into account:

Notesannexed to and forming part of the consolidated balance sheet as at March 31, 2018 and the consolidated statement of profit and loss for the year ended March 31, 2018(All amounts in Rupees million, unless otherwise stated)
208
the after income tax effect of interest
dilutive potential equity shares; and
the weighted average number of additional equity shares that would have been outstanding assuming the conversion of all dilutive potential equity shares.
1.23 Rounding of amounts
and notes have been rounded off to the nearest Rupees millions (upto two decimals), unless otherwise stated as per the requirement of Schedule III (Division II).
1.24 New standards/ amendments to existing standards issued but not yet adopted
Following are the amendments to existing standards which have been issued by The Ministry of Corporate Affairs (‘MCA’) that are not effective for the reporting period and have not been early adopted by the Group:
a) Amendments to Ind AS 115, Revenue from contracts with customers:
Ind AS 115, Revenue from contracts with customers deals with revenue recognition and establishes principles for reporting useful
about the nature, amount, timing and
from an entity’s contracts with customers. Revenue is recognized when a customer obtains control of a promised good or service and thus has the ability to direct the use and
to which the entity expects to be entitled in exchange for those goods and services. The standard replaces Ind AS 18 Revenue and related appendices.
before revenue can be recognised:
1. identify contracts with customers2. identify the separate performance
obligation3. determine the transaction price of the
contract
4. allocate the transaction price to each of the separate performance obligations, and
5. recognise the revenue as each
The Group is currently assessing the potential impact of this amendment. These amendments are mandatory for the reporting period beginning on or after April 01, 2018.
b) Amendments to Appendix B to Ind AS 21 Foreign currency transactions and advance consideration:
21, Foreign currency transactions and advance
determine the date of transaction for the exchange rate to be used on initial recognition of a related asset, expense or income where an entity pays or receives consideration in advance for foreign currency-denominated contracts.
For a single payment or receipt, the date of the transaction should be the date on which the entity initially recognises the non-monetary asset or liability arising from the advance consideration (the prepayment or deferred income/contract liability). If there are multiple payments or receipts for one item, date of transaction should be determined as above for each payment or receipt.
The Group is currently assessing the potential impact of this amendment. These amendments will be applied prospectively to items in scope, for the reporting period beginning on or after April 01, 2018.
c) Amendments to Ind AS 40 Investment property - Transfers of investment property:
The amendments clarify that transfers to, or from, investment property can only be made if there has been a change in use that is supported by evidence. A change in use occurs when the property meets, or
property. A change in intention alone is not
evidence for a change of use in the standard was re-characterised as a non-exhaustive list

Notesannexed to and forming part of the consolidated balance sheet as at March 31, 2018 and the consolidated statement of profit and loss for the year ended March 31, 2018(All amounts in Rupees million, unless otherwise stated)
Annual Report 2017-18 Financial StatementsThe Welspun Corp Story Governance Reports
209
of examples and scope of these examples have been expanded to include assets under construction/development and not only transfer of completed properties.
The Group is currently assessing the potential impact of this amendment.
The Group has elected to apply these amendments prospectively to changes in use that occur on or after the date of initial application i.e. April 01, 2018. On April 01, 2018,
properties held at that date and, if applicable,
that exist as at that date.
d) Amendments to Ind AS 12 Income taxes regarding recognition of deferred tax assets on unrealised losses:
The amendments clarify the accounting for deferred taxes where an asset is measured at fair value and that fair value is below the asset’s tax base. They also clarify certain other aspects of accounting for deferred tax assets set out below.
A temporary difference exists whenever the carrying amount of an asset is less than its tax base at the end of the reporting period.
include the recovery of some of an entity’s assets for more than its carrying amount if it is probable that the entity will achieve
instrument is measured at fair value, however, the entity expects to hold and
probable that the asset will be recovered for more than its carrying amount.
Where the tax law restricts the source of
types of deferred tax assets can be recovered, the recoverability of the deferred tax assets can only be assessed in combination with other deferred tax assets of the same type.
Tax deductions resulting from the reversal of deferred tax assets are excluded from
is used to evaluate the recoverability of those assets. This is to avoid double counting the deductible temporary differences in such assessment.
The Group is currently assessing the potential impact of this amendment.
These amendments will be applied retrospectively, for the reporting period beginning on or after April 01, 2018.
The Group intends to adopt these amendments when it becomes effective. There are no other standards or amendments that are not yet effective and that would be expected to have a material impact on the Group in the current or future reporting periods and on foreseeable future transactions.
Note 2: Critical estimates and judgments
seldom equal the actual results. Management also needs to exercise judgment in applying the Group’s accounting policies. This note provides an overview of the areas that involved a higher degree of judgment or complexity, and of items which are more likely to be materially adjusted due to estimates and assumptions turning out to be different than those originally assessed. Detailed information about each of these estimates and judgments is included in relevant notes together with information about the basis of calculation
Critical estimates and judgmentsi) Estimation of current tax expense and deferred tax The calculation of the Group’s tax charge necessarily
involves a degree of estimation and judgment in respect of certain items whose tax treatment
been reached with the relevant tax authority or, as appropriate, through a formal legal process. The

Notesannexed to and forming part of the consolidated balance sheet as at March 31, 2018 and the consolidated statement of profit and loss for the year ended March 31, 2018(All amounts in Rupees million, unless otherwise stated)
210
the provision for income taxes, including amount expected to be paid/recovered for uncertain tax positions.
ii) Estimation of Provisions and Contingent Liabilities The Group exercises judgment in measuring and
recognising provisions and the exposures to contingent liabilities which is related to pending litigation or other outstanding claims. Judgement is necessary in assessing the likelihood that a pending claim will succeed, or a liability will arise,
settlement. Because of the inherent uncertainty in this evaluation process, actual liability may be different from the originally estimated as provision.
iii) Estimation of useful life of Property, Plant and Equipment Property, plant and equipment represent a
the Group. The charge in respect of periodic depreciation is derived after determining an estimate of an asset’s expected useful life and the expected residual value at the end of its life. The useful lives and residual values of Group’s assets are determined by management at the time the asset is acquired and reviewed periodically,
based on historical experience with similar assets as well as anticipation of future events, which may impact their life, such as changes in technology.
iv) Estimation of Provision for Inventory The Group writes down inventories to net realisable
value based on an estimate of the realisability of inventories. Write downs on inventories are recorded where events or changes in circumstances indicate that the balances may not realised. The
estimates of net selling prices of the down-graded inventories. Where the expectation is different from the original estimate, such difference will impact the carrying value of inventories and write-downs of inventories in the periods in which such estimate has been changed.
v) Estimation of Defined Benefit Obligation
depends on a number of factors that are determined on an actuarial basis using a number of assumptions. The assumptions used in determining the net cost (income) for post employments plans include the discount rate. Any changes in these assumptions will impact the carrying amount of such obligations.
The Group determines the appropriate discount rate at the end of each year. This is the interest rate that should be used to determine the present value
In determining the appropriate discount rate, the Group considers the interest rates of government bonds of maturity approximating the terms of the related plan liability.
vi) Estimated fair value of Financial Instruments
traded in an active market is determined using valuation techniques. The Management uses its judgment to select a variety of methods and make assumptions that are mainly based on market conditions existing at the end of each reporting period.

Notesannexed to and forming part of the consolidated balance sheet as at March 31, 2018 and the consolidated statement of profit and loss for the year ended March 31, 2018
Annual Report 2017-18 Financial StatementsThe Welspun Corp Story Governance Reports
211
(All
am
ou
nts
in
Ru
pees
mill
ion
, un
less
oth
erw
ise s
tate
d)
3. P
rop
ert
y, p
lan
t an
d e
qu
ipm
en
t
Carr
yin
g a
mo
un
ts F
ree
ho
ld
lan
d
Lan
d
Imp
rove
me
nts
Bu
ild
ing
s P
lan
t an
d
mach
ine
ry
Offi
ce
an
d o
the
r
eq
uip
me
nts
Ve
hic
les
Fu
rnit
ure
an
d
fixtu
res
To
tal
Ye
ar
en
de
d M
arc
h 3
1, 2
017
Gro
ss c
arr
yin
g a
mo
un
t
Bala
nce a
s at
Ap
ril 0
1, 2
016
63
2.0
2
1,3
32.6
9
8,4
33
.40
3
0,0
19.6
2
46
0.3
9
33
.56
8
3.7
4
40
,99
5.4
2
Ad
dit
ion
s 1
1.0
5
-
39
.39
2
66
.41
46
.54
2
.76
5
.78
3
71.
93
Exch
an
ge d
iffe
ren
ces
(refe
r n
ote
46
) -
-
-
(
14.0
5)
-
-
-
(14
.05
)
Exch
an
ge d
iffe
ren
ces
on
tra
nsl
ati
on
of
fore
ign
op
era
tio
ns
(6
.72)
(28
.26
) (
78
.95
) (
134
.46
) (
8.9
3)
(0
.17)
(0
.21)
(25
7.7
0)
Dis
po
sals
-
-
-
26
.37
6.0
4
3.5
8
1.0
0
36
.99
Gro
ss c
arr
yin
g a
mo
un
t as
at
Marc
h 3
1, 2
017
63
6.3
5
1,3
04
.43
8
,39
3.8
4
30
,111
.15
4
91.
96
3
2.5
7
88
.31
41,
05
8.6
1
Ye
ar
en
de
d M
arc
h 3
1, 2
018
Gro
ss c
arr
yin
g a
mo
un
t
Ad
dit
ion
s 1
22.8
5
4.3
6
9.6
9
414
.23
2
2.6
8
6.9
1 2
.83
5
83
.55
Exch
an
ge d
iffe
ren
ces
(refe
r n
ote
46
) -
-
-
3
.25
-
-
-
3
.25
Exch
an
ge d
iffe
ren
ces
on
tra
nsl
ati
on
of
fore
ign
op
era
tio
ns
1.5
5
6.5
4
18
.34
3
5.0
7
2.1
2
0.0
4
0.0
4
63
.70
Dis
po
sals
3.6
9
-
-
23
.73
2
1.5
8
3.8
9
2.1
1 5
5.0
0
no
te 4
) -
-
7
.78
-
-
-
-
7
.78
Gro
ss c
arr
yin
g a
mo
un
t as
at
Marc
h 3
1, 2
018
757.
06
1
,315
.33
8
,414
.09
3
0,5
39
.97
4
95
.18
3
5.6
3
89
.07
4
1,6
46
.33
Bala
nce a
s at
Ap
ril 0
1, 2
016
-
111
.67
312
.16
3
,25
7.4
2
10
3.3
4
7.9
4
18
.10
3
,810
.63
Dep
recia
tio
n c
harg
e d
uri
ng
th
e y
ear
-
119
.35
3
05
.56
3
,270
.63
9
1.5
5
6.1
3
14
.38
3
,80
7.6
0
Dis
po
sals
-
-
-
6.5
3
2.3
5
1.6
9
0.5
3
11.
10
Exch
an
ge d
iffe
ren
ces
on
tra
nsl
ati
on
of
fore
ign
op
era
tio
ns
-
(2.3
7)
(2.2
3)
(23
.37)
(1.
69
) (
0.0
6)
(0
.08
) (
29
.80
)
Accu
mu
late
d d
ep
recia
tio
n a
s at
Marc
h 3
1, 2
017
-
22
8.6
5
615
.49
6
,49
8.1
5
19
0.8
5
12
.32
3
1.8
7
7,5
77.
33

Notesannexed to and forming part of the consolidated balance sheet as at March 31, 2018 and the consolidated statement of profit and loss for the year ended March 31, 2018
212
(All
am
ou
nts
in
Ru
pees
mill
ion
, un
less
oth
erw
ise s
tate
d)
3. P
rop
ert
y, p
lan
t an
d e
qu
ipm
en
t
Accu
mu
late
d d
ep
recia
tio
n F
ree
ho
ld
lan
d
Lan
d
Imp
rove
me
nts
Bu
ild
ing
s P
lan
t an
d
mach
ine
ry
Offi
ce
an
d o
the
r
eq
uip
me
nts
Ve
hic
les
Fu
rnit
ure
an
d
fixtu
res
To
tal
Ye
ar
en
de
d M
arc
h 3
1, 2
017
Ye
ar
en
de
d M
arc
h 3
1, 2
018
Dep
recia
tio
n c
harg
e d
uri
ng
th
e y
ear
-
118
.61
28
8.0
8
3,2
24
.21
87.6
4
5.2
9
12.7
7
3,7
36
.60
Dis
po
sals
-
-
-
14
.81
5.5
5
1.4
8
1.3
0
23
.14
Exch
an
ge d
iffe
ren
ces
on
tra
nsl
ati
on
of
fore
ign
op
era
tio
ns
-
2.4
9
2.2
1 2
3.9
1 1
.54
0
.05
0
.03
3
0.2
3
(refe
r n
ote
4)
-
-
0.8
2
-
-
-
-
0.8
2
Accu
mu
late
d d
ep
recia
tio
n a
s at
Marc
h 3
1, 2
018
-
34
9.7
5
90
4.9
6
9,7
31.
46
2
74.4
8
16
.18
4
3.3
7
11,
32
0.2
0
Ne
t carr
yin
g a
mo
un
t o
f p
rop
ert
y, p
lan
t an
d e
qu
ipm
en
tA
s at
Marc
h 3
1, 2
017
63
6.3
5 1
,075
.78
7
,778
.35
2
3,6
13.0
0
30
1.11
2
0.2
5
56
.44
3
3,4
81.
28
As
at
Marc
h 3
1, 2
018
75
7.0
6 9
65
.58
7
,50
9.1
3
20
,80
8.5
1 2
20
.70
1
9.4
5
45
.70
3
0,3
26
.13
Cap
ital
wo
rk-i
n-p
rog
ress
As
at
Marc
h 3
1, 2
017
24
9.7
1
As
at
Marc
h 3
1, 2
018
14
4.3
6
No
tes:
(i
) F
or
pro
pe
rty,
pla
nt
an
d e
qu
ipm
en
t p
led
ge
d a
s se
cu
rity
(re
fer
no
te 1
9).
(i
i) C
on
tractu
al
ob
lig
ati
on
s
R
efe
r n
ote
47 f
or
dis
clo
sure
of
co
ntr
actu
al co
mm
itm
en
ts f
or
the a
cq
uis
itio
n o
f p
rop
ert
y, p
lan
t an
d e
qu
ipm
en
t.

Notesannexed to and forming part of the consolidated balance sheet as at March 31, 2018 and the consolidated statement of profit and loss for the year ended March 31, 2018(All amounts in Rupees million, unless otherwise stated)
Annual Report 2017-18 Financial StatementsThe Welspun Corp Story Governance Reports
213
As at March 31, 2018
As at March 31, 2017
4. Investment propertyInvestment property - land 1.23 1.23
Investment property - building 6.96 -
Total investment property 8.19 1.23
Gross carrying amountOpening balance 1.23 1.23
Transferred from property, plant and equipment (refer note 3) 7.78 -
Closing balance 9.01 1.23
Accumulated Depreciation
Transferred from property, plant and equipment (refer note 3) 0.82 -
Closing balance 0.82 -
(i) Amount recognised in statement of profit and loss for investment property
Year ended March 31, 2018
Year ended March 31, 2017
Rental Income 7.53 7.63
7.53 7.63
(ii) Leasing arrangements
for a period of 2 years is tabulated as below.
As at March 31, 2018
As at March 31, 2017
Within one year 2.33 -
1.40 -
3.73 -
(iii) Fair Value
As at March 31, 2018
As at March 31, 2017
Investment property - land 154.39 154.39
Investment property - building 86.74 -
241.13 154.39
Estimation of fair valueThe Group has obtained independent valuation of its freehold land located at Anjar and Flat located at Mumbai based on current prices in an active market for properties of similar nature. The fair values of investment property have been determined by an independent valuer. The main inputs used are the rental growth rates and a study of the micro market in discussion with industry experts. Resulting fair value estimate for investment property are included in level 3.

Notesannexed to and forming part of the consolidated balance sheet as at March 31, 2018 and the consolidated statement of profit and loss for the year ended March 31, 2018(All amounts in Rupees million, unless otherwise stated)
214
5. Other intangible assets
Carrying amounts Other intangible assets (Software)
Year ended March 31, 2017
Gross carrying amount
Balance as at April 01, 2016 164.64
Additions 9.81
Disposals 0.64
Gross carrying amount as at March 31, 2017 173.81
Year ended March 31, 2018
Gross carrying amount
Balance as at April 01, 2016
Additions 103.74
Disposals 22.69
Gross carrying amount as at March 31, 2018 254.86
Accumulated amortisation Other intangible assets (Software)
Year ended March 31, 2017
Balance as at April 01, 2016 49.50
Amortisation charge during the year 53.20
Disposals 0.64
Accumulated amortisation as at March 31, 2017 102.06
Year ended March 31, 2018
Amortisation charge during the year 56.45
Disposals 22.62
Accumulated amortisation as at March 31, 2018 135.89
Net carrying amount of other intangible assets
As at March 31, 2017 71.75
As at March 31, 2018 118.97
Intangible assets under development
As at March 31, 2017 72.61
As at March 31, 2018 21.32
Notes Contractual obligationsRefer note 47 for disclosure of contractual commitments.

Notesannexed to and forming part of the consolidated balance sheet as at March 31, 2018 and the consolidated statement of profit and loss for the year ended March 31, 2018(All amounts in Rupees million, unless otherwise stated)
Annual Report 2017-18 Financial StatementsThe Welspun Corp Story Governance Reports
215
As at March 31, 2018
As at March 31, 2017
6. Investments accounted for using the equity method (refer note 44 (d))
Unquoted
Investments in equity instruments of joint ventures (fully paid up) (refer note 50)
Welspun Wasco Coatings Private Limited
14,755,014 (March 31, 2017: 14,755,014) equity shares of Rs.10 each 53.94 105.40
Welspun Middle East Pipes Company LLC 1,090.17 1,730.98
38,031,042 (March 31, 2017: 38,031,042) equity shares of SAR 1 each
Welspun Middle East Pipes Coatings Company LLC* 16,886,189 (March 31, 2017: 16,886,189) equity shares of SAR 1 each
- -
* Refer note 20(b)
Total investments accounted for using the equity method 1,144.11 1,836.38
As at March 31, 2018
As at March 31, 2017
7. Investments
7(a) Non-current investments
Unquoted (refer note 50)
Investment carried at fair value through profit and loss (fully paid up)
I. Investment in equity instruments of other entity
Welspun Captive Power Generation Limited
5,833,499 (March 31, 2017: 5,833,499) equity shares of Rs. 10 each 150.90 135.16
Total investment in equity instruments of other entity 150.90 135.16
II. Investment in preference shares of other entity
Welspun Captive Power Generation Limited
19,443,186 (March 31, 2017: 19,443,186) 10% non-cumulative, redeemable preference shares of Rs. 10 each
194.52 194.52
Total investment in preference shares of other entity 194.52 194.52
Quoted
Investment carried at fair value through profit or loss (fully paid up)
Investment in other entity
Standard Chartered Bank PLC Indian Depository Receipt
334,331 (March 31, 2017: 334,331) Indian Depository Receipt of Rs. 100 each 19.91 18.04
Total investment in other entity 19.91 18.04
Total non-current investments 365.33 347.72
Aggregate amount of quoted investments and market value thereof 19.91 18.04
Aggregate amount of unquoted investments 345.42 329.68

Notesannexed to and forming part of the consolidated balance sheet as at March 31, 2018 and the consolidated statement of profit and loss for the year ended March 31, 2018(All amounts in Rupees million, unless otherwise stated)
216
As at March 31, 2018
As at March 31, 2017
7(b) Current investmentsBonds 3,268.28 4,639.92
Mutual funds 98.47 428.73
Total current investments 3,366.75 5,068.65
QuotedInvestment carried at fair value through profit and loss Investments in bonds
Face value in Rupees
As at March 31, 2018 As at March 31, 2017
Units Amount Units Amount
1,000,000 - - 3 3.00
10.75% IDBI Bank Limited Perpetual 1,000,000 - - 60 61.20
10.90% Family Credit Ltd. 1,000,000 - - 12 13.23
11.09% IDBI Bank Perpetual 1,000,000 - - 223 228.58
11.70% UCO Bank Perpetual 1,000,000 - - 132 132.17
12.00% United Bank of India Perpetual 1,000,000 - - 250 250.00
7.39% Hudco Tax Free 1,000 - - 4,000 4.39
8.25% Reliance Capital Ltd. 1,000,000 - - 589 589.53
8.37% LIC Housing Finance Ltd. 1,000,000 - - 1 1.00
8.65% IL&FS Finance Services Ltd. 1,000 600 0.60 600 0.60
8.85% Reliance Capital Ltd. 1,000,000 - - 11 11.03
8.94% Bajaj Finance Ltd. 1,000,000 - - 1 1.03
9.10% Reliance General Insurance 1,000,000 250 251.78 117 117.59
9.25% Capital First Ltd. 1,000,000 - - 100 101.91
9.25% L&T Fincorp Ltd. 1,000,000 - - 155 157.93
9.30% Indiabulls Housing Finance Ltd. 100,000 - - 315 31.74
9.40% Industrial Finance Corporation of India Ltd. 1,000 10,000 10.01 10,000 10.00
9.50% Union Bank of India Perpetual 1,000,000 77 80.10 204 210.73
9.51% Corporation Bank Perpetual 1,000,000 19 19.57 126 125.37
9.85% DCB Bank 100,000 - - 2,200 220.00
9.90% Industrial Finance Corporation of India Ltd. 2032
25,000 - - 14 0.37
9.90% Industrial Finance Corporation of India Ltd. 2037
25,000 - - 3,250 83.25
8.75% Axis Bank Perpetual 1,000,000 - - 240 235.68
11.60% Bank of Maharashtra Perpetual 1,000,000 - - 63 63.00
8.75% Bajaj Finance Ltd. 1,000,000 - - 2 2.03
9.25% Dewan Housing Finance Corporation Ltd. 1,000 - - 58,900 58.76
10.75% Dewan Housing Finance Corporation Ltd. Perpetual
1,000,000 100 105.40 195 198.94
1,000,000 6 6.14 6 6.04
1,000,000 - - 64 64.45
9.75% Industrial Finance Corporation of India Ltd. 1,000,000 64 66.64 30 31.23
9.30% Dewan Housing Finance Corporation Ltd.
1,000 - - 63,200 63.57
10.00% Indian Overseas Bank Perpetual 1,000,000 - - 405 400.98
10.40% Magma Fincorp Ltd. 1,000,000 - - 20 20.20
7.38% National Bank For Agriculture And Rural Development
1,000,000 - - 2 2.01
9.95% Food Corporation Of India 1,000,000 - - 2 2.16
9.40% Reliance Home Finance Ltd. 1,000 217,000 224.76 334,498 346.44
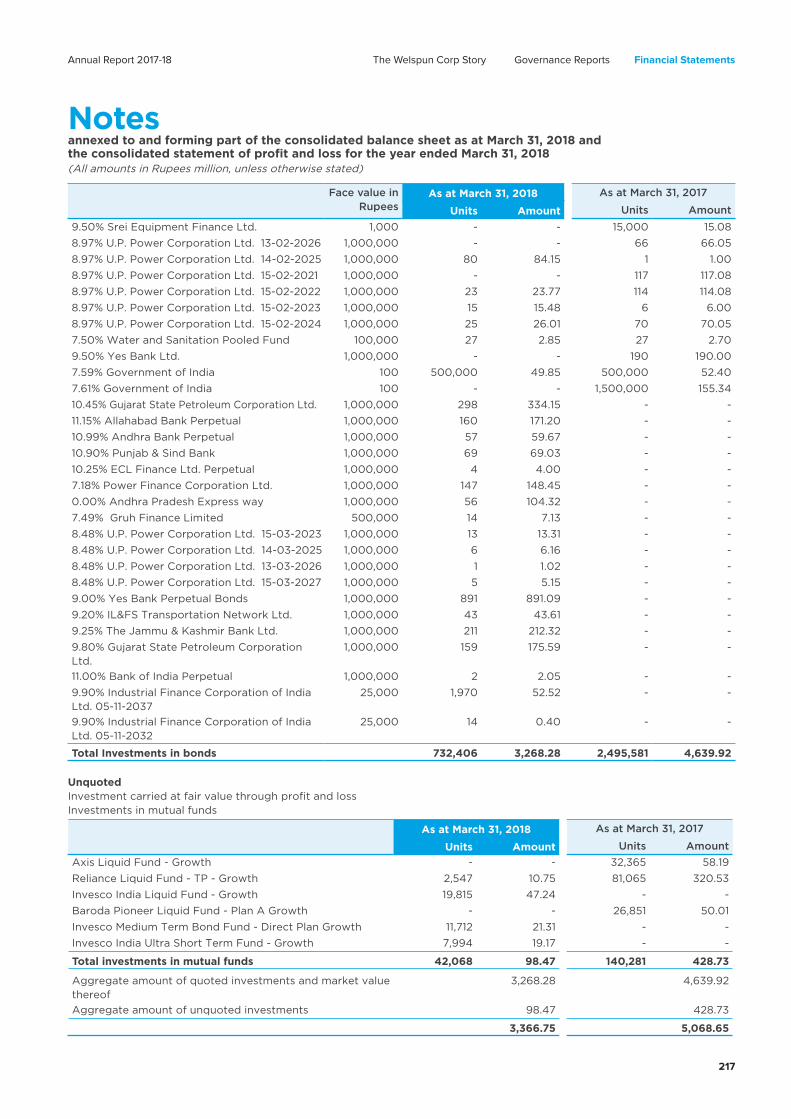
Notesannexed to and forming part of the consolidated balance sheet as at March 31, 2018 and the consolidated statement of profit and loss for the year ended March 31, 2018(All amounts in Rupees million, unless otherwise stated)
Annual Report 2017-18 Financial StatementsThe Welspun Corp Story Governance Reports
217
Face value in Rupees
As at March 31, 2018 As at March 31, 2017
Units Amount Units Amount
9.50% Srei Equipment Finance Ltd. 1,000 - - 15,000 15.08
8.97% U.P. Power Corporation Ltd. 13-02-2026 1,000,000 - - 66 66.05
8.97% U.P. Power Corporation Ltd. 14-02-2025 1,000,000 80 84.15 1 1.00
8.97% U.P. Power Corporation Ltd. 15-02-2021 1,000,000 - - 117 117.08
8.97% U.P. Power Corporation Ltd. 15-02-2022 1,000,000 23 23.77 114 114.08
8.97% U.P. Power Corporation Ltd. 15-02-2023 1,000,000 15 15.48 6 6.00
8.97% U.P. Power Corporation Ltd. 15-02-2024 1,000,000 25 26.01 70 70.05
7.50% Water and Sanitation Pooled Fund 100,000 27 2.85 27 2.70
9.50% Yes Bank Ltd. 1,000,000 - - 190 190.00
7.59% Government of India 100 500,000 49.85 500,000 52.40
7.61% Government of India 100 - - 1,500,000 155.34
10.45% Gujarat State Petroleum Corporation Ltd. 1,000,000 298 334.15 - -
11.15% Allahabad Bank Perpetual 1,000,000 160 171.20 - -
10.99% Andhra Bank Perpetual 1,000,000 57 59.67 - -
10.90% Punjab & Sind Bank 1,000,000 69 69.03 - -
10.25% ECL Finance Ltd. Perpetual 1,000,000 4 4.00 - -
7.18% Power Finance Corporation Ltd. 1,000,000 147 148.45 - -
0.00% Andhra Pradesh Express way 1,000,000 56 104.32 - -
7.49% Gruh Finance Limited 500,000 14 7.13 - -
8.48% U.P. Power Corporation Ltd. 15-03-2023 1,000,000 13 13.31 - -
8.48% U.P. Power Corporation Ltd. 14-03-2025 1,000,000 6 6.16 - -
8.48% U.P. Power Corporation Ltd. 13-03-2026 1,000,000 1 1.02 - -
8.48% U.P. Power Corporation Ltd. 15-03-2027 1,000,000 5 5.15 - -
9.00% Yes Bank Perpetual Bonds 1,000,000 891 891.09 - -
9.20% IL&FS Transportation Network Ltd. 1,000,000 43 43.61 - -
9.25% The Jammu & Kashmir Bank Ltd. 1,000,000 211 212.32 - -
9.80% Gujarat State Petroleum Corporation Ltd.
1,000,000 159 175.59 - -
11.00% Bank of India Perpetual 1,000,000 2 2.05 - -
9.90% Industrial Finance Corporation of India Ltd. 05-11-2037
25,000 1,970 52.52 - -
9.90% Industrial Finance Corporation of India Ltd. 05-11-2032
25,000 14 0.40 - -
Total Investments in bonds 732,406 3,268.28 2,495,581 4,639.92
Unquoted
Investments in mutual funds
As at March 31, 2018 As at March 31, 2017
Units Amount Units Amount
Axis Liquid Fund - Growth - - 32,365 58.19
Reliance Liquid Fund - TP - Growth 2,547 10.75 81,065 320.53
Invesco India Liquid Fund - Growth 19,815 47.24 - -
Baroda Pioneer Liquid Fund - Plan A Growth - - 26,851 50.01
Invesco Medium Term Bond Fund - Direct Plan Growth 11,712 21.31 - -
Invesco India Ultra Short Term Fund - Growth 7,994 19.17 - -
Total investments in mutual funds 42,068 98.47 140,281 428.73
Aggregate amount of quoted investments and market value thereof
3,268.28 4,639.92
Aggregate amount of unquoted investments 98.47 428.73
3,366.75 5,068.65

Notesannexed to and forming part of the consolidated balance sheet as at March 31, 2018 and the consolidated statement of profit and loss for the year ended March 31, 2018(All amounts in Rupees million, unless otherwise stated)
218
As at March 31, 2018
As at March 31, 2017
8. Loans8(a) Non-current Unsecured, considered good
Loans to joint venture (refer note 50) 2,238.09 2,095.23
Total non-current loans 2,238.09 2,095.23
8(b) Current Unsecured, considered good
Loans to employees 5.89 6.63
Total current loans 5.89 6.63
Total loans 2,243.98 2,101.86
As at March 31, 2018
As at March 31, 2017
9. Other financial assets 9(a) Non-current Security deposits
Related parties (refer note 50) 22.67 202.22
Other parties 85.00 84.21
Term deposits with more than 12 months maturity
Margin money deposits (refer note 15 (b)) 25.40 4.62
Derivatives designated as hedges
Interest rate swap 15.32 22.30
Derivatives not designated as hedges
Coupon only swap 1.08 7.16
Total non-current other financial assets 149.47 320.51
9(b) Current Security deposits
Related parties (refer note 50) 200.39 22.62
Other parties 5.48 1.25
Less: Allowance for doubtful security deposits - (0.02)
205.87 23.85 Interest accrued on
Loan to joint venture (refer note 50) 11.88 11.95
Current investments 108.76 168.29
Others 4.93 4.66
125.57 184.90 Other receivables from
Related parties (refer note 50) 12.86 13.61
Other parties 62.78 -
75.64 13.61 Derivatives designated as hedges
Forward contracts 12.10 284.07
Interest rate swap 6.10 -
Derivatives not designated as hedges
Forward contracts 132.31 -
Option contracts 2.15 -
152.66 284.07 Receivable towards claim 30.49 67.38
Total current other financial assets 590.23 573.81
Total other financial assets 739.70 894.32

Notesannexed to and forming part of the consolidated balance sheet as at March 31, 2018 and the consolidated statement of profit and loss for the year ended March 31, 2018(All amounts in Rupees million, unless otherwise stated)
Annual Report 2017-18 Financial StatementsThe Welspun Corp Story Governance Reports
219
As at March 31, 2018
As at March 31, 2017
10. Deferred tax assets (net) (refer note 38)
The balance comprises temporary differences attributable to:
Deferred tax asset
1.72 -
Allowance for doubtful debts and advances 2.35 -
Property, plant and equipment 0.09 -
4.16 -
Set-off of deferred tax liabilities pursuant to set-off provisions
Deferred tax liability
Fair valuation on investment 0.16 -
0.16 -
Total deferred tax assets (net) 4.00 -
As at March 31, 2018
As at March 31, 2017
11. Other assets
11(a) Non-current
Capital advances
Related parties (refer note 50) 595.87 595.87
Other parties 55.67 93.78
Less: Allowance for doubtful capital advances (0.90) (3.68)
650.64 685.97
Balance with statutory authorities 734.27 490.72
Less: Allowance for doubtful balance with statutory authorities (254.46) (240.82)
479.81 249.90
Advance to suppliers 59.78 65.76
Less: Allowance for doubtful balance with vendors (8.93) -
50.85 65.76
Prepaid expenses 3.30 26.70
Total other non-current assets 1,184.60 1,028.33
11(b) Current
Balance with statutory authorities 1,505.89 1,956.85
Less: Allowance for doubtful balance with statutory authorities - (6.75)
1,505.89 1,950.10
Advance to suppliers 441.71 180.37
Prepaid expenses 112.21 82.12
Advance to employees 2.81 4.25
388.37 491.87
Total other current assets 2,450.99 2,708.71
Total other assets 3,635.59 3,737.04

Notesannexed to and forming part of the consolidated balance sheet as at March 31, 2018 and the consolidated statement of profit and loss for the year ended March 31, 2018(All amounts in Rupees million, unless otherwise stated)
220
As at March 31, 2018
As at March 31, 2017
12. Inventories (refer note below) Raw materials 3,462.13 5,116.34
Goods-in-transit for raw materials 3,998.88 4,617.42
Work-in-progress 862.62 1,197.76
Finished goods 4,802.64 4,704.25
Stores and spares 1,992.30 2,010.82
Total inventories 15,118.57 17,646.59
Inventory with a carrying amount of Rs. 4,554.63 (March 31, 2017: Rs. 4,661.01) have been pledged as security against certain bank borrowings of the Group.
As at March 31, 2018
As at March 31, 2017
13. Trade receivables (refer note below) Trade receivables from related parties (refer note 50) 22.17 7.16
Trade receivables from others 13,236.67 14,703.42
Allowance for doubtful debts (net) (60.23) (58.65)
Total trade receivables 13,198.61 14,651.93
Break-up of security details
Unsecured, considered good 13,198.61 14,651.93
Doubtful 60.23 58.65
Total 13,258.84 14,710.58
Allowance for doubtful debts (net) (60.23) (58.65)
Total trade receivables 13,198.61 14,651.93
Trade receivables (before intercompany eliminations) with a carrying amount of Rs. 13,013.00 (March 31, 2017: Rs. 20,602.51) have been pledged as security against working capital facilities of the Company and the subsidiary of the Company.
As at March 31, 2018
As at March 31, 2017
14. Cash and cash equivalents Cash on hand 0.22 0.72
Balances with banks
In current accounts 5,476.06 998.36
Deposits with maturity of less than three months 50.01 480.45
Total cash and cash equivalents 5,526.29 1,479.53
15. Bank balances other than cash and cash equivalents Unclaimed dividend (refer note (a) below) 2.96 3.82
Margin money deposits (refer note (b) below) 752.68 812.80
Total bank balances other than cash and cash equivalents 755.64 816.62
(a) There are no amounts due for payment to the Investor Education and Protection Fund under Section 125 of the Companies Act, 2013 as at the year end. This amount represents restricted cash.
(b) Fixed deposits of Rs. 684.79 (March 31, 2017 : Rs. 630.60) are earmarked towards working capital facilities of the Company (refer note 9(a)).

Notesannexed to and forming part of the consolidated balance sheet as at March 31, 2018 and the consolidated statement of profit and loss for the year ended March 31, 2018(All amounts in Rupees million, unless otherwise stated)
Annual Report 2017-18 Financial StatementsThe Welspun Corp Story Governance Reports
221
As at March 31, 2018
As at March 31, 2017
16. Current tax assets (net) Opening balance 1.43 192.66
Less: Current tax payable for the year (63.43) (50.66)
Less: Refund received during the year - (194.05)
Add: Refund receivable from net operating losses carryback 203.89 -
Add: Taxes paid (including tax deducted at source) 63.06 62.97
204.95 10.92
Transferred from current tax liability (refer note 26) - (9.49)
Closing balance 204.95 1.43
As at March 31, 2018
As at March 31, 2017
17. Assets classified as held for sale Plant and machinery* 6.00 6.00
Total assets classified as held for sale 6.00 6.00
*It includes plant and machinery which management intends to sell.
18. Equity share capital and other equity
Equity Shares Preference Shares
Number of shares
Par value AmountNumber of
sharesPar value Amount
18 (a) Share capital
Authorised share capital
As at April 01, 2016 304,000,000 5 1,520.00 98,000,000 10 980.00
Increase/ (decrease) during the year - - - -
As at March 31, 2017 304,000,000 5 1,520.00 98,000,000 10 980.00
Increase/ (decrease) during the year - - - -
As at March 31, 2018 304,000,000 5 1,520.00 98,000,000 10 980.00
i) Movement in equity shares capital
Number of shares
Amount
Issued, subscribed and paid up capital
As at April 01, 2016 265,226,109 1,326.13
Increase/ (decrease) during the year - -
As at March 31, 2017 265,226,109 1,326.13
Increase/ (decrease) during the year - -
As at March 31, 2018 265,226,109 1,326.13
ii) Terms and rights attached to equity shares Equity shares
The Company has only one class of equity shares having a par value of Rs. 5 per share. Each holder of equity shares is entitled to one vote per share. The dividend when proposed by the board of directors is subject to the approval of the shareholders in the ensuing annual general meeting except in case of interim dividend.

Notesannexed to and forming part of the consolidated balance sheet as at March 31, 2018 and the consolidated statement of profit and loss for the year ended March 31, 2018(All amounts in Rupees million, unless otherwise stated)
222
In the event of liquidation of the company the holders of the equity shares will be entitled to receive remaining assets of the company after distribution of preferential amounts. The distribution will be in proportion to the number of equity shares held by the shareholders.
Preference shares Preference shares does not carry any voting rights in the company, except as provided in the Companies
Act, 2013. Preference share will have priority over equity shares in the payment of dividend and repayment of capital.
iii) Details of shareholders holding more than 5% shares in the Company
As at March 31, 2018 No. of shares % holding
Equity shares held by
Welspun Pipes Limited 110,449,818 41.64%
Granele Limited 19,127,584 7.21%
Insight Solutions Limited 23,026,000 8.68%
Life Insurance Corporation of India Limited 19,277,980 7.27%
As at March 31, 2017 No. of shares % holding
Equity shares held by
Welspun Pipes Limited 110,449,818 41.64%
Granele Limited 28,188,889 10.63%
Insight Solutions Limited 23,026,000 8.68%
Life Insurance Corporation of India Limited 19,277,980 7.27%
iv) Aggregate number of shares issued for consideration other than cash In FY 2014-15, the Company issued 227,781 equity shares of Rs. 5 each as sweat equity in compliance with applicable laws including the Securities and Exchange Board of India (issue of sweat equity) Regulations, 2002.
As at March 31, 2018
As at March 31, 2017
Other equity
18 (b) Reserves and surplus
(i) Capital reserve on consolidation 152.92 152.92
(ii) Securities premium reserve 7,769.82 7,769.82
(iii) Debenture redemption reserve 505.84 1,643.10
(iv) General reserve 353.59 227.69
(v) Foreign currency monetary item translation difference account (35.54) (95.91)
(vi) Retained earnings 18,348.17 16,820.00
Total reserves and surplus 27,094.80 26,517.62
As at March 31, 2018
As at March 31, 2017
(i) Capital reserve on consolidation
Opening balance 152.92 152.92
Movement during the year - -
Closing balance 152.92 152.92
(ii) Securities premium reserve
Opening balance 7,769.82 7,769.82
Movement during the year - -
Closing balance 7,769.82 7,769.82
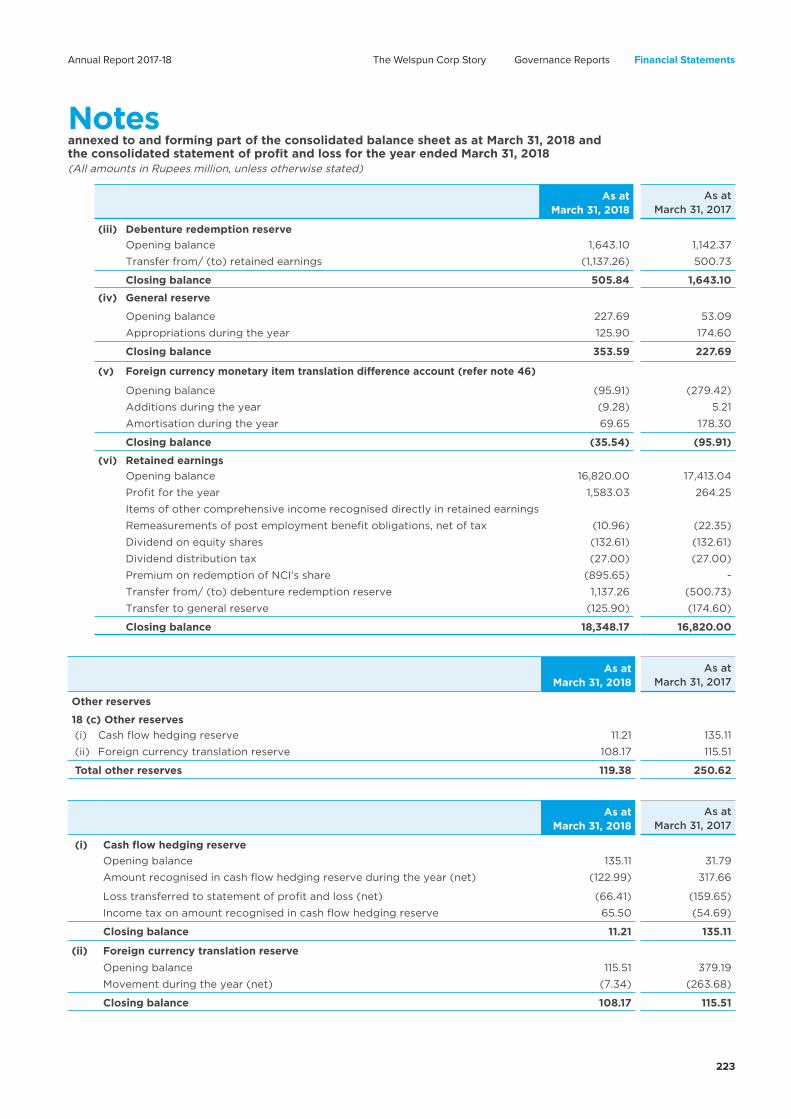
Notesannexed to and forming part of the consolidated balance sheet as at March 31, 2018 and the consolidated statement of profit and loss for the year ended March 31, 2018(All amounts in Rupees million, unless otherwise stated)
Annual Report 2017-18 Financial StatementsThe Welspun Corp Story Governance Reports
223
As at March 31, 2018
As at March 31, 2017
(iii) Debenture redemption reserve
Opening balance 1,643.10 1,142.37
Transfer from/ (to) retained earnings (1,137.26) 500.73
Closing balance 505.84 1,643.10
(iv) General reserve
Opening balance 227.69 53.09
Appropriations during the year 125.90 174.60
Closing balance 353.59 227.69
(v) Foreign currency monetary item translation difference account (refer note 46)
Opening balance (95.91) (279.42)
Additions during the year (9.28) 5.21
Amortisation during the year 69.65 178.30
Closing balance (35.54) (95.91)
(vi) Retained earnings
Opening balance 16,820.00 17,413.04
1,583.03 264.25
Items of other comprehensive income recognised directly in retained earnings
(10.96) (22.35)
Dividend on equity shares (132.61) (132.61)
Dividend distribution tax (27.00) (27.00)
Premium on redemption of NCI's share (895.65) -
Transfer from/ (to) debenture redemption reserve 1,137.26 (500.73)
Transfer to general reserve (125.90) (174.60)
Closing balance 18,348.17 16,820.00
As at March 31, 2018
As at March 31, 2017
Other reserves
18 (c) Other reserves
11.21 135.11
(ii) Foreign currency translation reserve 108.17 115.51
Total other reserves 119.38 250.62
As at March 31, 2018
As at March 31, 2017
(i) Cash flow hedging reserve
Opening balance 135.11 31.79
(122.99) 317.66
(66.41) (159.65)
65.50 (54.69)
Closing balance 11.21 135.11
(ii) Foreign currency translation reserve
Opening balance 115.51 379.19
Movement during the year (net) (7.34) (263.68)
Closing balance 108.17 115.51

Notesannexed to and forming part of the consolidated balance sheet as at March 31, 2018 and the consolidated statement of profit and loss for the year ended March 31, 2018(All amounts in Rupees million, unless otherwise stated)
224
Nature and purpose of other equity(i) Capital reserve on consolidation Capital reserve will be utilised in accordance with the provisions of the Companies Act, 2013.
(ii) Securities premium reserveSecurities premium reserve is used to record the premium on issue of shares. The reserve is utilised in accordance with the provisions of the Companies Act, 2013.
(iii) Debenture redemption reserveThe Companies Act, 2013 requires companies that issue debentures to create a debenture redemption reserve
reserve may not be utilised except to redeem debentures.
(iv) General reserveGeneral Reserve is a free reserve and is available for distribution as dividend, issue of bonus shares, buyback of
(v) Foreign currency monetary item translation difference account (refer note 46)Foreign exchange differences on long term foreign currency monetary items which relates to other than depreciable assets, are accumulated in “Foreign Currency Monetary Item Translation Difference Account” and amortised over the balance period of such long term assets / liabilities.
(vi) Cash flow hedging reserve
loss arising on changes in the fair value of the designated portion of hedging instruments that are recognised and
item.
(vii) Foreign Currency Translation ReserveExchange differences arising on translation of the foreign operations are recognised in other comprehensive income as described in accounting policy and accumulated in a separate reserve within equity. The cumulative
As at March 31, 2018
As at March 31, 2017
19. Borrowings19 (a) Non-current borrowings (refer note 19(b) (iii))
Secured
Measured at amortised cost
Redeemable non-convertible debentures [refer note (i) below] 5,365.98 9,892.86
Non-convertible bonds - City of Little Rock, Arkansas, Series 2007A [refer note (ii) below] 149.17 354.66
External commercial borrowings [refer note (iii) below] 682.48 1,832.14
Term loan from a bank, net of bond issuance costs [refer note (iv) below] 6,519.66 3,134.87
Total non-current borrowings 12,717.29 15,214.53
(i) Redeemable non-convertible debentures:
hypothecation of entire immovable and movable property, plant and equipment of the Company both present and future.

Notesannexed to and forming part of the consolidated balance sheet as at March 31, 2018 and the consolidated statement of profit and loss for the year ended March 31, 2018(All amounts in Rupees million, unless otherwise stated)
Annual Report 2017-18 Financial StatementsThe Welspun Corp Story Governance Reports
225
No. of debentures Face value (Rs.)
Redemption date Rate of Interest per annum
As at March 31, 2018
As at March 31, 2017
Nil (March 31, 2017: 5,000) 1,000,000 - - 5,000
2,000 (March 31, 2017: 2,000) 1,000,000 August 2025 9.55% 2,000 2,000
900 (March 31, 2017: 900) 1,000,000 November 2022 11.00% 900 900
Nil (March 31, 2017: 528) 1,000,000 - - 528
Nil (March 31, 2017: 1,510) 1,000,000 - - 1,510
2500 (March 31, 2017: Nil) 1,000,000 February 2024 8.90% 2,500 -
Total* 5,400 9,938
* the above is excluding effective interest rate resulting in decrease in borrowing by Rs. 34.02 (March 31, 2017: Rs. 45.14)
(ii) Non-convertible bonds - City of Little Rock, Arkansas, Series 2007A: Guaranteed by the Arkansas Development Finance Authority and the Arkansas Economic Development Commission are due through August 2027; payable monthly which carry interest at 5.75%, secured against property, plant and equipment of a subsidiary of the Company.
(iii) External commercial borrowings (ECB) of USD 24.60 million (March 31, 2017: USD 42.60 million) is
and movable property, plant and equipment of the Company both present and future. The ECB carries interest of LIBOR plus 3.60% to 4.50%.
The ECB in INR Rupees is repayable as follows
Repayment schedule As at March 31, 2018
As at March 31, 2017
October 2017 - 907.90
April 2018 - 259.40
October 2018 912.45 907.90
April 2019 345.43 343.71
October 2019 345.43 343.71
Total 1,603.31 2,762.62
* the above is excluding impact of effective interest rate resulting in decrease in borrowing by Rs. 8.38 (March 31, 2017: Rs. 22.58).
(iv) Term loan Term loans from Banks are secured against property, plant and equipment of a subsidiary of the
Company. The loan carries interest at LIBOR + 325 basic point. The loan is repayable from February 2020 to February 2022.
As at March 31, 2018
As at March 31, 2017
19 (b) Current borrowings
Secured
Measured at amortised cost
Loans repayable on demand
Working capital loan from banks (refer note (i) and (ii) below) 125.67 67.19
Buyers' Credit (refer note (i) and (ii) below) - 2,136.08
Total current borrowings 125.67 2,203.27

Notesannexed to and forming part of the consolidated balance sheet as at March 31, 2018 and the consolidated statement of profit and loss for the year ended March 31, 2018(All amounts in Rupees million, unless otherwise stated)
226
(i) Nature of security for current borrowings
progress, goods-in-transit, stores and spares and trade receivables of the Company and a subsidiary of the Company and second charge on entire immovable and movable property, plant and equipment of the Company, both present and future.
(ii) Terms of repayment and interest Working capital loan from banks include cash credit loan which are repayable on demand.
Buyer’s credit is repayable upto a period of 180 days from the drawdown date and carries an interest rate of LIBOR plus maximum 50 basis points per annum.
As at March 31, 2018
As at March 31, 2017
(iii) Net debt reconciliation
Cash and cash equivalents 5,526.29 1,479.53
Current investments 3,366.75 5,068.65
Non-current borrowings* (13,738.62) (16,226.51)
Current borrowings (125.67) (2,203.27)
(4,971.25) (11,881.60)
Financial assets Financial liabilitiesTotal
(E) = (A)+(B)-(C)-(D)
Cash and cash equivalents
(A)
Current investments
(B)
Non-current borrowings*
(C)
Current borrowings
(D)
Net debts as at April 01, 2016 1,060.30 7,327.87 (20,756.70) (5,680.46) (18,048.99)
Interest accrued as at April 01, 2016 - (336.87) - (336.87)
419.23 (2,266.01) 4,480.00 3,340.33 5,973.55
Foreign exchange adjustments (net) - - (40.11) 136.86 96.75
Interest expenses - - (1,697.65) (93.14) (1,790.79)
Interest paid - - 1,713.86 93.14 1,807.00
Other non cash adjustments
Fair value adjustment - 6.79 - - 6.79
Unrealised portion of foreign exchange adjustments (net)
- - 133.20 - 133.20
Net debts as at March 31, 2017 1,479.53 5,068.65 (16,226.51) (2,203.27) (11,881.60)
Interest accrued as at March 31, 2017 (277.76) - (277.76) 4,046.76 (1,729.06) 2,590.05 2,077.60 6,985.35
Foreign exchange adjustments (net) - - (4.53) - (4.53)
Interest expenses - - (1,168.41) (79.96) (1,248.37)
Interest paid - - 1,291.97 79.96 1,371.93
Other non cash adjustments
Fair value adjustment - 27.16 - - 27.16
Unrealised portion of foreign exchange adjustments (net)
- - (72.32) - (72.32)
Net debts as at March 31, 2018 5,526.29 3,366.75 (13,738.62) (125.67) (4,971.25)
Interest accrued as at March 31, 2018 - - (128.89) - (128.89)
* Includes current maturities of long-term borrowings

Notesannexed to and forming part of the consolidated balance sheet as at March 31, 2018 and the consolidated statement of profit and loss for the year ended March 31, 2018(All amounts in Rupees million, unless otherwise stated)
Annual Report 2017-18 Financial StatementsThe Welspun Corp Story Governance Reports
227
As at March 31, 2018
As at March 31, 2017
20. Other financial liabilities
20(a) Non-current
Deposits received 1.49 -
Total other non-current financial liabilities 1.49 -
20(b) Current
Current maturities of long-term borrowings 1,021.33 1,011.98
Interest accrued but not due on borrowings 128.89 277.76
Interest accrued but not due on acceptances and others 108.29 68.23
Unclaimed dividend (refer note 15) 2.96 3.82
Trade deposits 14.79 14.23
Capital creditors 54.69 30.27
Liability towards claims 574.38 598.63
Derivatives not designated as hedges
Forward contracts 180.97 209.50
Coupon only swap - 5.63
Derivatives designated as hedges
Forward contracts 16.30 99.75
Share of loss of joint venture (refer note 6, 50 and note 44(d)) 334.08 165.93
Total other current financial liabilities 2,436.68 2,485.73
Total other financial liabilities 2,438.17 2,485.73
As at March 31, 2018
As at March 31, 2017
21. Provisions
21 (a) Non-current
Employee benefit obligations
Gratuity (refer note 39) 129.91 84.57
Other provisions
Provision for litigation/ disputes (refer note 40) 263.00 266.35
Total non-current provisions 392.91 350.92
21(b) Current
Employee benefit obligations
Gratuity (refer note 39) - 0.08
Leave obligations (refer note 39) 74.55 76.74
Other provisions
Provision for claims 120.57 96.05
Total current provisions 195.12 172.87
Total provisions 588.03 523.79

Notesannexed to and forming part of the consolidated balance sheet as at March 31, 2018 and the consolidated statement of profit and loss for the year ended March 31, 2018(All amounts in Rupees million, unless otherwise stated)
228
As at March 31, 2018
As at March 31, 2017
22. Deferred tax liabilities (net) (refer note 38)
The balance comprises temporary differences attributable to
Deferred tax liabilities
Property, plant and equipment 5,233.34 6,375.03
Foreign currency monetary item translation difference account 12.41 33.18
Fair valuation of investments 35.10 24.09
Effective rate of interest on borrowings 15.08 23.43
Discounting of liability - 17.26
6.01 51.98
27.55 74.12
Others 0.38 124.43
5,329.87 6,723.52
Set-off of deferred tax assets pursuant to set-off provisions
Deferred tax asset
70.27 67.67
Allowance for doubtful debts and advances 284.93 232.65
Unabsorbed business losses 90.23 274.88
Government grants 1,437.22 1,407.96
9.00 230.03
Others 0.74 73.34
1,892.39 2,286.53
Tax credit (minimum alternate tax) - 631.89
Total deferred tax liabilities (net) 3,437.48 3,805.10
As at March 31, 2018
As at March 31, 2017
23. Government grants
Opening balance 4,068.30 3,970.16
Grants during the year 958.78 883.09
914.15 784.95
Closing balance 4,112.93 4,068.30
Non Current 3,649.58 3,653.64
Current 463.35 414.66
Total government grants 4,112.93 4,068.30
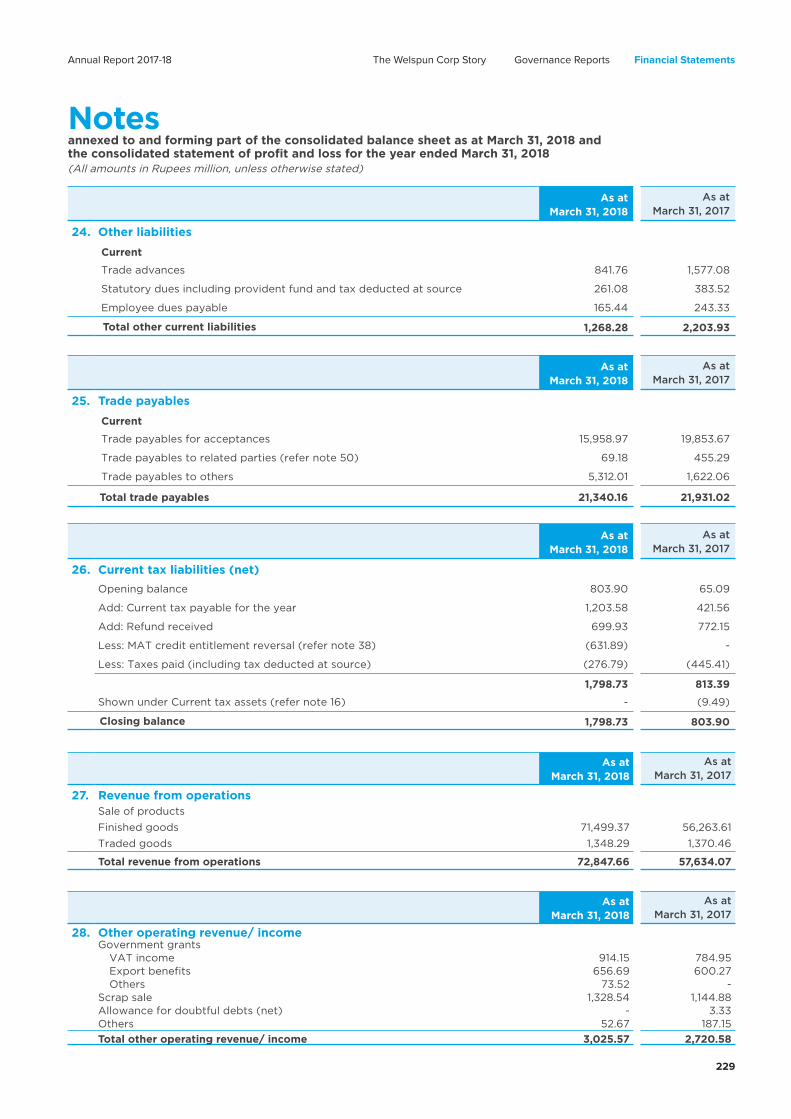
Notesannexed to and forming part of the consolidated balance sheet as at March 31, 2018 and the consolidated statement of profit and loss for the year ended March 31, 2018(All amounts in Rupees million, unless otherwise stated)
Annual Report 2017-18 Financial StatementsThe Welspun Corp Story Governance Reports
229
As at March 31, 2018
As at March 31, 2017
24. Other liabilities
Current
Trade advances 841.76 1,577.08
Statutory dues including provident fund and tax deducted at source 261.08 383.52
Employee dues payable 165.44 243.33
Total other current liabilities 1,268.28 2,203.93
As at March 31, 2018
As at March 31, 2017
25. Trade payables
Current
Trade payables for acceptances 15,958.97 19,853.67
Trade payables to related parties (refer note 50) 69.18 455.29
Trade payables to others 5,312.01 1,622.06
Total trade payables 21,340.16 21,931.02
As at March 31, 2018
As at March 31, 2017
26. Current tax liabilities (net)
Opening balance 803.90 65.09
Add: Current tax payable for the year 1,203.58 421.56
Add: Refund received 699.93 772.15
Less: MAT credit entitlement reversal (refer note 38) (631.89) -
Less: Taxes paid (including tax deducted at source) (276.79) (445.41)
1,798.73 813.39
Shown under Current tax assets (refer note 16) - (9.49)
Closing balance 1,798.73 803.90
As at March 31, 2018
As at March 31, 2017
27. Revenue from operationsSale of products
Finished goods 71,499.37 56,263.61
Traded goods 1,348.29 1,370.46
Total revenue from operations 72,847.66 57,634.07
As at March 31, 2018
As at March 31, 2017
28. Other operating revenue/ incomeGovernment grants
914.15 784.95 656.69 600.27
Others 73.52 - Scrap sale 1,328.54 1,144.88 Allowance for doubtful debts (net) - 3.33 Others 52.67 187.15
Total other operating revenue/ income 3,025.57 2,720.58

Notesannexed to and forming part of the consolidated balance sheet as at March 31, 2018 and the consolidated statement of profit and loss for the year ended March 31, 2018(All amounts in Rupees million, unless otherwise stated)
230
As at March 31, 2018
As at March 31, 2017
29. Other incomeInterest income
Loan to related party (refer note 50) 118.22 106.50
Current investments 331.37 521.10
Fixed deposits 51.52 210.73
Income tax refund 289.48 130.42
Others 87.21 198.53
Dividend income on
Current investments - 3.01
Net gain on sale/ redemption of
Non-current investments - 0.02
Current investments 153.14 168.30
Other non-operating income
Rental income 22.47 22.28
Net exchange differences - 654.07
Commission income 15.26 221.08
Fair value gain on investment (net) 18.85 -
Realised gain on settlement of derivatives 8.98 -
Fair value gain on derivatives (net) 162.54 -
27.69 -
Provision for doubtful advances written back 15.38 -
Miscellaneous income 10.00 9.96
Total other income 1,312.11 2,246.00
As at March 31, 2018
As at March 31, 2017
30. Cost of materials consumedRaw materials at the beginning of the year 9,733.76 6,616.71
Add: Purchases 50,097.31 39,394.21
Less: Raw materials at the end of the year 7,461.01 9,733.76
Total cost of materials consumed 52,370.06 36,277.16
As at March 31, 2018
As at March 31, 2017
31. Purchase of stock-in-trade Purchase of stock-in-trade 270.89 5,850.47
Total purchase of stock-in-trade 270.89 5,850.47
As at March 31, 2018
As at March 31, 2017
32. Changes in inventories of work-in progress and finished goodsOpening Balance
Work-in-progress 1,197.76 1,195.46
Finished goods 4,704.25 2,980.97
Total opening balance 5,902.01 4,176.43
Closing Balance
Work-in-progress 862.62 1,197.76
Finished goods 4,802.64 4,704.25
Total closing balance 5,665.26 5,902.01
Total changes in inventories of work-in progress and finished goods 236.75 (1,725.58)

Notesannexed to and forming part of the consolidated balance sheet as at March 31, 2018 and the consolidated statement of profit and loss for the year ended March 31, 2018(All amounts in Rupees million, unless otherwise stated)
Annual Report 2017-18 Financial StatementsThe Welspun Corp Story Governance Reports
231
As at March 31, 2018
As at March 31, 2017
33. Employee benefit expenseSalaries, wages and bonus 3,927.67 3,862.50
Contribution to provident and other funds (refer note below) 277.61 308.07
Gratuity expense (refer note 39) 29.70 21.69
Staff welfare expenses 61.51 113.22
Total employee benefit expense 4,296.49 4,305.48
Note
Defined contribution plansi. Employers' contribution to Provident Fund and Employee’s Pension Scheme, 1995ii. Employees' State Insurance Act, 1948
iii. Superannuation fund
iv. Others
During the year, the Group has recognised the following amounts in the statement
Employer's contribution to Provident Fund 75.26 73.49
Employer's contribution to Employees State Insurance 0.84 0.82
Employer's contribution to Employees Pension Scheme 8.01 8.37
Employer's contribution to Superannuation Fund 5.78 6.24
Other schemes 187.72 219.16
Total expenses recognised in the statement of profit and loss 277.61 308.07
As at March 31, 2018
As at March 31, 2017
34. Depreciation and amortisation expense (refer notes 3 and 4)Depreciation of property, plant and equipment 3,736.60 3,807.60
Amortisation of intangible assets 56.45 53.20
Total depreciation and amortisation expense 3,793.05 3,860.80
As at March 31, 2018
As at March 31, 2017
35. Other expensesConsumption of stores and spares 2,168.05 1,758.89
Labour charges 547.25 304.88
Coating and other job charges 178.01 201.46
Power, fuel and water charges 1,438.11 1,062.64
Freight, material handling and transportation 4,788.41 3,901.77
Rental charges (refer note 49) 214.00 184.50
Rates and taxes 94.34 76.65
Repairs and maintenance
Plant and machinery 124.30 133.59
Buildings 25.46 97.26
Others 310.38 271.28
Travelling and conveyance expenses 228.83 251.34
Communication expenses 25.99 34.24
Legal and professional fees 279.08 282.08
Insurance 124.80 131.84
Directors' sitting fees 4.57 4.43
Printing and stationery 32.18 35.53
Security charges 41.41 47.79
Membership and subscription 35.47 43.30
7.83 12.12

Notesannexed to and forming part of the consolidated balance sheet as at March 31, 2018 and the consolidated statement of profit and loss for the year ended March 31, 2018(All amounts in Rupees million, unless otherwise stated)
232
As at March 31, 2018
As at March 31, 2017
Net exchange differences 474.01 -
Payment to auditors 17.97 13.59
Product compensation and claims 0.76 -
Sales promotion expenses 15.35 46.47
Commission on sales to agents 92.86 42.28
Allowance for doubtful debts (net) 1.58 12.80
Bad debts written off 2.23 -
Loss on disposal of property, plant and equipment (net) 1.98 12.07
Expenditure towards corporate social responsibility (refer note below and 50) 6.41 2.33
Fair valuation loss on investments (net) - 11.03
Fair value losses on derivatives not designated as hedges (net) - 51.79
Realised loss on settlement of derivatives - 44.01
Miscellaneous expenses 134.47 83.45
Total other expenses 11,416.09 9,155.41
Note : Corporate social responsibility expenditureContribution to Welspun Foundation for Health and Knowledge 6.41 2.33
Total 6.41 2.33
Amount required to be spent as per section 135 of the Act
Amount spent during the year on:
Construction/ acquisition of any asset - -
On purposes other than above 6.41 2.33
As at March 31, 2018
As at March 31, 2017
36. Finance cost
Interest on financial liabilities not at fair value through profit and loss
Term borrowings 330.24 166.68
External commercial borrowings 144.06 218.68
Redeemable non-convertible debentures 694.11 1,312.29
Current borrowings 79.96 93.14
Interest on acceptances and charges on letter of credit 412.28 339.06
Unwinding of discount on liabilities 50.12 46.90
142.51 180.39
Total finance cost 1,853.28 2,357.14
As at March 31, 2018
As at March 31, 2017
37. Income tax expense
(i) Income tax expenses
Current tax
1,050.14 472.21
Total current tax 1,050.14 472.21
Deferred tax (refer note 38)
Decrease/ (increase) in deferred tax assets (including tax credit) 395.87 459.28
Decrease in deferred tax liabilities (1,334.12) (673.45)
Total deferred tax benefit (938.25) (214.17)
Total income tax expense 111.89 258.04

Notesannexed to and forming part of the consolidated balance sheet as at March 31, 2018 and the consolidated statement of profit and loss for the year ended March 31, 2018(All amounts in Rupees million, unless otherwise stated)
Annual Report 2017-18 Financial StatementsThe Welspun Corp Story Governance Reports
233
(ii) Reconciliation of tax expense and the accounting profit multiplied by India’s tax rate
1,641.98 359.19
Tax rate 34.608% 34.608%
Tax at normal rate 568.26 124.31
Tax effect of amounts which are not deductible/ (taxable) in calculating taxable income
Dividend income - (1.04)
Expense/ (income) on which no deferred tax was required to be recognised (0.67) (13.43)
Eligible donation @ 50% allowed under section 80G of income tax act, 1961 0.44 0.40
Items subject to differential tax rate (10.04) 5.00
Share of loss of joint ventures accounted for using the equity method 297.33 274.44
Change in tax rate (basis adjustment) 33.37 -
Weighted deduction on eligible expenditure in Welspun Pipes Inc. (subsidiary) (13.73) 28.25
Tax on undistributed earning relating to investment in joint venture (51.38) (50.06)
Tax rate change - US Tax Reform (700.29) -
Difference in overseas tax rates (26.52) (98.37)
Others 15.12 (11.46)
Total income tax expense 111.89 258.04
(iii) There are certain income-tax related legal proceedings which are pending against the Group. Potential liabilities, if any have been adequately provided for, and the Group does not currently estimate any probable material incremental tax liabilities in respect of these matters.
(iv) One of subsidiary of the Company is incorporated in Mauritius and under current laws and regulations it is liable to pay income tax on its net income at a rate of 15%. The subsidiary is, however, entitled to a tax credit equivalent to the higher of actual foreign tax suffered and 80% of Mauritius tax payable in respect of its foreign source income tax thus reducing its maximum effective tax rate to 3%.

Notesannexed to and forming part of the consolidated balance sheet as at March 31, 2018 and the consolidated statement of profit and loss for the year ended March 31, 2018
234
Defe
rred
tax li
ab
iliti
es
Defe
rred
tax a
ssets
Prop
erty
, pl
ant
and
equi
pmen
t
Fore
ign
curr
ency
m
onet
ary
item
tr
ansl
atio
n di
ffer
ence
ac
coun
t
Fair
val
ue o
f in
vest
men
ts
Effe
ctiv
e ra
te
of in
tere
st
on
borr
owin
gs
Dis
coun
ting
of
Lia
bilit
y
Cas
h flo
w
hedg
ing
rese
rve
Und
istr
ibut
ed
profi
t /
(los
s) o
f jo
int
vent
ure
Oth
ers
Tota
l D
efer
red
tax
liabi
litie
s
Empl
oyee
be
nefit
s ob
ligat
ions
Allo
wan
ce
for
dou
btfu
l de
bts
and
adva
nces
Una
bsor
bed
busi
ness
lo
sses
Gov
ernm
ent
gran
ts
Unr
ealis
ed
Profi
t on
St
ock
Res
erve
Oth
ers
Tota
l D
efer
red
tax
asse
ts
Tax
cred
it
(min
imum
al
tern
ate
tax)
Net
Def
erre
d ta
x lia
bilit
ies
As
at A
pri
l 0
1, 2
016
7,0
34
.95
9
6.7
0
35
.94
3
8.2
8
34
.21
27.
07
1
24
.18
4
.22
7
,39
5.5
5
30
.93
1
20
.42
1
,36
6.7
0
1,3
74.0
0
47.
55
16
6.7
8
3,1
06
.38
2
62
.92
4
,02
6.2
5
Ch
arg
ed
/ (C
red
ited
)
loss
(60
6.6
5)
(6
3.5
2)
(11
.85
) (
14.8
5)
(16
.95
) (
29
.78
) (
50
.06
) 1
20
.21
(6
73
.45
) 2
4.9
1 1
12.2
3
(1,0
91.
82)
33
.96
1
82.4
8 (9
0.0
1) (
828
.25
) 3
68
.97
(214
.17)
to o
ther
co
mp
reh
en
sive
inco
me
-
-
-
-
-
54
.69
-
-
5
4.6
9
11.
83
-
-
-
-
1
1.8
3
-
42.8
6
Exch
an
ge
dif
fere
nce
(5
3.2
7)
-
-
-
-
-
-
-
(5
3.2
7)
-
-
-
-
-
(3
.43
) (
3.4
3)
-
(4
9.8
4)
As
at M
arch
31,
20
17 6
,375
.03
3
3.1
8
24
.09
2
3.4
3
17.
26
5
1.9
8
74
.12
1
24
.43
6
,72
3.5
2
67.
67
2
32
.65
2
74.8
8
1,4
07.
96
2
30
.03
7
3.3
4
2,2
86
.53
6
31.
89
3
,80
5.1
0
Ch
arg
ed
/ (C
red
ited
)
loss
(1,1
43
.01)
(20
.77)
11.
17
(8
.35
) (
17.2
6)
19
.53
(
51.
38
)(1
24
.05
) (
1,3
34
.12)
(1.
48
) 5
4.6
3
(18
4.6
5)
29
.26
(
221.
03
) (
72.6
0)
(3
95
.87)
-
(9
38
.25
)
to o
ther
co
mp
reh
en
sive
inco
me
-
-
-
-
- (
65
.50
) -
-
(
65
.50
) 5
.80
-
-
-
-
-
5
.80
-
(
71.
30
)
Exch
an
ge
dif
fere
nce
1.2
3
-
-
-
-
-
4.8
1 -
6
.04
-
-
-
-
-
-
-
-
6
.04
MA
T c
red
it
en
titl
em
en
t re
vers
al
-
(6
31.
89
) 6
31.
89
As
at M
arch
31,
20
18 5
,23
3.2
5
12
.41
35
.26
1
5.0
8
- 6
.01
27.
55
0
.38
5
,32
9.9
4
71.
99
2
87.
28
9
0.2
3
1,4
37.2
2
9.0
0
0.7
4
1,8
96
.46
-
3
,43
3.4
8
(All
am
ou
nts
in
Ru
pees
mill
ion
, un
less
oth
erw
ise s
tate
d)
38
. M
ove
me
nt
in d
efe
rre
d t
ax l
iab
ilit
ies
an
d d
efe
rre
d t
ax a
sse
ts (
refe
r n
ote
s 10
an
d 2
2)

Notesannexed to and forming part of the consolidated balance sheet as at March 31, 2018 and the consolidated statement of profit and loss for the year ended March 31, 2018(All amounts in Rupees million, unless otherwise stated)
Annual Report 2017-18 Financial StatementsThe Welspun Corp Story Governance Reports
235
39. Employee benefits obligations
(i) Leave obligations The leave obligations cover the Group’s liability for earned leave.
(ii) Post-employment obligations - gratuity
day wages for every completed year of service or part thereof in excess of six months, based on the rate of wages last drawn by the employee concerned. The gratuity plan is a funded plan and the Group makes contributions to recognised funds in India.
(iii) Balance sheet amounts - gratuity
follows:
Present value of obligations
Fair value of plan assets
Net amount
April 01, 2016 163.83 (135.05) 28.78 Current service cost 19.38 - 19.38
Interest expense/ (income) 13.12 (10.81) 2.31
Total amount recognised in profit or loss 32.50 (10.81) 21.69
RemeasurementsReturn on plan assets excluding amount included in interest expense - (2.09) (2.09)
Experience losses/ (gains) 5.55 (0.07) 5.48
30.79 - 30.79
Total amount recognised in other comprehensive income 36.34 (2.16) 34.18
(24.43) 24.43 -
March 31, 2017 208.24 (123.59) 84.65
Present value of obligations
Fair value of plan assets
Net amount
April 01, 2017 208.24 (123.59) 84.65 Current service cost 23.29 - 23.29
Interest expense/ (income) 15.76 (9.35) 6.41
Total amount recognised in profit or loss 39.05 (9.35) 29.70
RemeasurementsReturn on plan assets excluding amount included in interest income - 4.20 4.20
Experience losses 18.63 0.06 18.69
(6.13) - (6.13)
Total amount recognised in other comprehensive income 12.50 4.26 16.76
Employer's contribution - (1.20) (1.20)
(34.64) 34.64 -
March 31, 2018 225.15 (95.24) 129.91
The net liability disclosed above relating to funded and unfunded plans are as follows
As at March 31, 2018
As at March 31, 2017
Present value of funded obligations 225.15 208.24
Fair value of plan assets (95.24) (123.59)
129.91 84.65
Non-current provision (refer note 21(a)) 129.91 84.57
Current provision (refer note 21(b)) - 0.08

Notesannexed to and forming part of the consolidated balance sheet as at March 31, 2018 and the consolidated statement of profit and loss for the year ended March 31, 2018(All amounts in Rupees million, unless otherwise stated)
236
(iv) Significant actuarial assumptions are as follows:
As at March 31, 2018
As at March 31, 2017
Discount rate 7.86% 7.57%
Salary growth rate 6.00% 6.00%
(v) Sensitivity analysis
Assumptions Impact on defined benefit obligation
Change in assumption (%) Increase in assumption (Rs.) Decrease in assumption (Rs.)March 31, 2018 March 31, 2017 March 31, 2018 March 31, 2017 March 31, 2018 March 31, 2017
Discount rate 1.00% 1.00% Decrease by 22.66 21.54 Increase by 22.66 25.50
Salary growth rate 1.00% 1.00% Increase by 26.88 25.64 Decrease by 23.22 22.03
(vi) Risk exposure
volatility. The plan liabilities are calculated using a discount rate set with reference to bond yields; if plan assets
Company Ltd. The Group intends to maintain this investment in the continuing years.
(vii) Defined benefit liability and employer contributions
2018: Rs. 50.57).
ParticularsLess than a
yearBetween 1-2 years
Between 2-5 years Over 5 years Total
March 31, 2018
16.28 5.35 36.37 123.27 181.27
March 31, 2017
15.46 5.06 27.93 114.39 162.84
40. Movements in provision for litigation/ disputes (refer note 21 (a))
As at March 31, 2018
Excise Duty Service TaxOther Litigation
and DisputesTotal
Opening balance as at April 01, 2016 136.22 83.18 7.93 39.02 266.35 Provided during the year - 13.08 - - 13.08 Provision reversed during the year (16.05) (0.38) - - (16.43)
Closing balance as at March 31, 2017 120.17 95.88 7.93 39.02 263.00
As at March 31, 2017
Excise Duty Service TaxOther Litigation
and DisputesTotal
Opening balance as at April 01, 2016 136.22 88.45 7.93 39.02 271.62 Provided during the year - 0.11 - - 0.11 Provision reversed during the year - (5.38) - - (5.38)
Closing balance as at March 31, 2017 136.22 83.18 7.93 39.02 266.35
Note: There are uncertainties regarding the timing and amount of the provisions. Changes in underlying facts and circumstances for each provision could result in differences in the amounts provided for and the actual

Notesannexed to and forming part of the consolidated balance sheet as at March 31, 2018 and the consolidated statement of profit and loss for the year ended March 31, 2018(All amounts in Rupees million, unless otherwise stated)
Annual Report 2017-18 Financial StatementsThe Welspun Corp Story Governance Reports
237
41. Fair Vaiue Measurements Financial instruments by category
As at March 31, 2018 As at March 31, 2017
FVPL Amortised Cost FVPL Amortised Cost
Financial assets
Investments
Equity instruments 150.90 - 135.16 -
Preference shares 194.52 - 194.52 -
Bonds 3,268.28 - 4,639.92 -
Mutual funds 98.47 - 428.73 -
Others 19.91 - 18.04 -
Loans
Loans to joint venture - 2,238.09 - 2,095.23
Loans to employees - 5.89 - 6.63
Trade Receivables - 13,198.61 - 14,651.93
Cash and cash equivalents - 5,526.29 - 1,479.53
Bank balances other than cash and cash equivalents - 755.64 - 816.62
Other financial assets
Security deposits - 313.54 - 310.28
Term deposits with maturity more than 12 months
- 25.40 - 4.62
Derivatives designated as hedge
Forward contracts 12.10 - 284.07 -
Interest rate swaps 21.42 - 22.30 -
Derivatives not designated as hedge
Forward contracts 132.31 - - -
Coupon only swap and option contracts 3.23 - 7.16 -
Others - 231.70 - 265.89
Total financial assets 3,901.14 22,295.16 5,729.90 19,630.73
Financial liabilities
Borrowings (includes interest accrued and current maturities of long-term debt)
- 13,993.18 - 18,707.54
Trade payables - 21,340.16 - 21,931.02
Other financial liabilities
Deposits received - 1.49 - -
Derivatives designated as hedge
Forward contracts 16.30 - 99.75 -
Derivatives not designated as hedge
Forward contracts 180.97 - 209.50 -
Coupon only swap - - 5.63 -
Others - 1,089.19 - 881.11
Total financial liabilities 197.27 36,424.02 314.88 41,519.67
(i) Fair value hierarchy
(a) recognised and measured at fair value and (b) measured at amortised cost and for which fair values are disclosed in the
follows underneath the table.

Notesannexed to and forming part of the consolidated balance sheet as at March 31, 2018 and the consolidated statement of profit and loss for the year ended March 31, 2018(All amounts in Rupees million, unless otherwise stated)
238
Financial assets and liabilities measured at fair value - recurring fair value measurements as at March 31, 2018
Level 1 Level 2 Level 3 Total
Financial assets
Financial Investments at FVPL
Equity instruments - - 150.90 150.90
Preference shares - - 194.52 194.52
Bonds - 3,268.28 - 3,268.28
Mutual fund - 98.47 - 98.47
Others 19.91 - - 19.91
Derivatives designated as hedges
Forward contracts - 12.10 - 12.10
Interest rate swap - 21.42 - 21.42
Derivatives not designated as hedges
Forward contracts - 132.31 - 132.31
Coupon only swap and option contracts - 3.23 - 3.23
Total financial assets 19.91 3,535.81 345.42 3,901.14
Financial liabilities
Derivatives designated as hedges
Forward contracts - 16.30 - 16.30
Derivatives designated not as hedges
Forward contracts - 180.97 - 180.97
Coupon only swap - - - -
Total financial liabilities - 197.27 - 197.27
Assets and liabilities which are measured at amortised cost for which fair value are disclosed as at March 31, 2018
Level 1 Level 2 Level 3 Total
Financial assets
Loans
Loans to joint venture - - 2,238.09 2,238.09
Loans to employees - - 5.89 5.89
Other financial assets
Security deposits - - 313.54 313.54
Term deposits with maturity more than 12 months
- - 25.40 25.40
Others - - 231.70 231.70
Total financial assets - - 2,814.62 2,814.62
Financial liabilities
Borrowings (includes interest accrued and current maturities of long-term debt)
- - 13,993.18 13,993.18
Other financial liabilities
Others - - 1,090.68 1,090.68
Total financial liabilities - - 15,083.86 15,083.86

Notesannexed to and forming part of the consolidated balance sheet as at March 31, 2018 and the consolidated statement of profit and loss for the year ended March 31, 2018(All amounts in Rupees million, unless otherwise stated)
Annual Report 2017-18 Financial StatementsThe Welspun Corp Story Governance Reports
239
Financial assets and liabilities measured at fair value - recurring fair value measurements as at March 31, 2017
Level 1 Level 2 Level 3 Total
Financial assets
Financial Investments at FVPL
Equity instruments - - 135.16 135.16
Preference Shares - - 194.52 194.52
Bonds - 4,639.92 - 4,639.92
Mutual Fund - 428.73 - 428.73
Others 18.04 - - 18.04
Derivatives designed as hedges -
Forward contracts - 284.07 - 284.07
Interest rate swap - 22.30 - 22.30
Derivatives not designated as hedges
Coupon only swap - 7.16 - 7.16
Total financial assets 18.04 5,382.18 329.68 5,729.90
Financial liabilities
Derivatives designed as hedges
Forward contracts - 99.75 - 99.75
Derivatives not designated as hedges
Forward contracts - 209.50 - 209.50
Coupon only swap - 5.63 - 5.63
Total financial liabilities - 314.88 - 314.88
Assets and Liabilities which are measured at amortised cost for which fair value are disclosed at March 31, 2017
Level 1 Level 2 Level 3 Total
Financial assets
Loans
Loans to joint venture - - 2,095.23 2,095.23
Loans to employees - - 6.63 6.63
Other financial assets
Security deposits - - 310.28 310.28
Term deposits with maturity more than 12 months
- - 4.62 4.62
Others - - 265.89 265.89
Total financial assets - - 2,682.65 2,682.65
Financial liabilities
Borrowings (includes interest accrued and current maturities of long-term debt)
- - 18,707.54 18,707.54
Other financial liabilities
Others - - 881.11 881.11
Total financial liabilities - - 19,588.65 19,588.65
value, grouped into Level 1 to Level 3, as described below.
Chartered Bank PLC Indian Depository Receipt.

Notesannexed to and forming part of the consolidated balance sheet as at March 31, 2018 and the consolidated statement of profit and loss for the year ended March 31, 2018(All amounts in Rupees million, unless otherwise stated)
240
derivatives which are designated as hedges and which are not designated as hedges, bonds and mutual funds for which all
This is the case for unlisted equity securities and unlisted preference shares.
(ii) Valuation techniques used to determine fair value
- Investment in Standard Chartered Bank PLC Indian Depository Receipt is valued using the closing price at National Stock Exchange (NSE) at the reporting period. - the fair value of forward contracts is determined using forward exchange rates prevailing with Authorised Dealers dealing in foreign exchange. - the fair value of interest rate swaps, option contracts and coupon only swap is calculated as the present value of
issuer will issue further units and will redeem such units of mutual fund to and from the investors. - the fair value of quoted bonds are derived based on the indicative quotes of price and yields prevailing in the market or latest available prices.
(iii) Fair value measurements using significant unobservable inputs (level 3)
The following table presents the changes in level 3 items for the year ended March 31, 2018 and March 31, 2017:
Unlisted equity shares
Unlisted preference
shares
Total
As at April 01, 2016 120.71 194.52 315.23
14.45 - 14.45
As at March 31, 2017 135.16 194.52 329.68
15.74 - 15.74
As at March 31, 2018 150.90 194.52 345.42
the end of the reporting period
Year ended March 31, 2018 15.74 - 15.74
Year ended March 31, 2017 14.45 - 14.45
(iv) Valuation inputs and relationships to fair value
Fair value Significant unobservable
inputs
Probability weighted average
SensitivityAs at March 31, 2018
As at March 31, 2017
As at March 31, 2018
As at March 31, 2017
Unlisted equity shares 150.90 135.16 Risk adjusted discount rate
10.62% 10.54% The estimated fair value would increase/ (decrease) if -Discount rate were lower/ (higher)
Unlisted preference shares
194.52 194.52 Risk adjusted discount rate
10.00% 10.00% The estimated fair value would increase/ (decrease) if -Discount rate were lower/ (higher)

Notesannexed to and forming part of the consolidated balance sheet as at March 31, 2018 and the consolidated statement of profit and loss for the year ended March 31, 2018(All amounts in Rupees million, unless otherwise stated)
Annual Report 2017-18 Financial StatementsThe Welspun Corp Story Governance Reports
241
(v) Valuation processes
analysis by independent valuer.
(vi) Fair value of Financial assets and liabilities measured at amortised cost
As at March 31, 2018 As at March 31, 2017
Carrying Amount
Fair Value Carrying Amount
Fair Value
Financial assets
Loans
Loans to joint venture 2,238.09 2,238.09 2,095.23 2,095.23
Loans to employees 5.89 5.89 6.63 6.63
Other financial assets
Security deposits 313.54 313.54 310.28 310.28
Term deposits with maturity more than 12 months
25.40 25.40 4.62 4.62
Others 231.70 231.70 265.89 265.89
Total 2,814.62 2,814.62 2,682.65 2,682.65
Financial liabilities
Borrowings (includes interest accrued and current maturities of long-term debt)
13,993.18 13,993.18 18,707.54 18,707.54
Other financial liabilities
Others 1,090.68 1,090.68 881.11 881.11
Total 15,083.86 15,083.86 19,588.65 19,588.65
a) The carrying amount of trade receivables, cash and cash equivalents, bank balances other than cash and cash
the same as their fair value, due to their short-term nature.
b) The fair values and carrying value of loans, term deposits with maturity period more than 12 months, security deposits,
materially the same.
42. Financial risk management
The group’s activities expose it to market risk, liquidity risk and credit risk. In order to minimise any adverse effects on the
entered to hedge certain foreign currency risk exposures and interest rate swaps to hedge variable interest rate exposures. Derivatives are used exclusively for hedging purposes and not as trading or speculative instruments.
This note explains the sources of risk which the entity is exposed to and how the entity manages the risk and the impact of
Risk Exposure arising from Measurement Management
Credit risk Trade receivables and other Ageing analysiscredit limits and letters of credit
Liquidity riskliabilities
Borrowings maturity and Availability of committed credit lines and borrowing facilities
Market risk – foreign currency risk and liabilities not denominated
in Rupees
Sensitivity analysis Forward foreign exchange contracts
Market risk – interest rate risk
Borrowings Sensitivity analysis Interest rate swaps
Market risk – security prices risk
Investments in bonds and mutual funds
Sensitivity analysis

Notesannexed to and forming part of the consolidated balance sheet as at March 31, 2018 and the consolidated statement of profit and loss for the year ended March 31, 2018(All amounts in Rupees million, unless otherwise stated)
242
The Group’s risk management is carried out by treasury department under policies approved by the board
investment of excess liquidity. There is no change in objectives, policies and process for managing the risk and methods used to measure the risk as compared to previous year.
(I) Credit risk
compares the risk of a default occurring on the asset as at the reporting date with the risk of default as at the date of initial recognition.
a) Trade receivables
Trade receivables are typically unsecured and are derived from revenue earned from customers. Credit risk has been managed by the Group through credit approvals, establishing credit limits and continuously monitoring the creditworthiness of customers to which the Group grants credit terms in the normal course of business. On account of adoption of Ind AS 109, the Group uses expected credit loss model to assess the impairment loss or gain.
Past exposure suggest a low/ minimum credit risk or allowances of debtors. Exposures of trade receivable (net of allowance) broken into ageing bucket is given below:
0-120 Days More than 120 Days
Total
March 31, 2018 12,359.81 838.80 13,198.61
March 31, 2017 13,866.92 785.01 14,651.93
b) Other financial assets
instruments, investments in government securities and bonds and investments in mutual funds. The Group has
position, credit rating and past experience. Credit limits and concentration of exposures are actively monitored by the Group.
(II) Liquidity risk
Group manages liquidity risk by maintaining adequate reserves, banking facilities and reserve borrowing facilities

Notesannexed to and forming part of the consolidated balance sheet as at March 31, 2018 and the consolidated statement of profit and loss for the year ended March 31, 2018(All amounts in Rupees million, unless otherwise stated)
Annual Report 2017-18 Financial StatementsThe Welspun Corp Story Governance Reports
243
(a) Financing arrangementsThe Group had access to the following undrawn borrowing facilities for working capital at the end of the reporting period
Asat March 31, 2018
As at March 31, 2017
Floating rate
Expiring within one year 3,772.22 1,864.60
Expiring beyond one year - 3,242.50
Total 3,772.22 5,107.10
(b) Maturities of financial liabilities
contractual maturities for:
months equal their carrying balances as the impact of discounting is not material.
As at March 31, 2018
Contractual maturities of financial liabilities
< 1 Year 1 - 3 years 3 - 5 years > 5 years Total Carrying value
Non-derivativesBorrowings (includes interest accrued and current maturities of long-term debt)
1,650.04 7,152.72 6,300.35 1,539.14 16,642.25 13,993.18
Trade payables 21,340.16 - - - 21,340.16 21,340.16
1,088.98 1.70 - - 1,090.68 1,089.19
Total non-derivative liabilities 24,079.18 7,154.42 6,300.35 1,539.14 39,073.09 36,422.53DerivativesForward contracts 197.27 - - - 197.27 197.27
Total derivative liabilities 197.27 - - - 197.27 197.27
As at March 31, 2017
Contractual maturities of financial liabilities
< 1 Year 1 - 3 years 3 - 5 years > 5 years Total Carrying value
Non-derivativesBorrowings (includes interest accrued and current maturities of long-term debt)
4,526.98 8,348.94 4,239.06 7,038.71 24,153.68 18,707.54
Trade payables 21,931.02 - - - 21,931.02 21,931.02 881.11 - - - 881.11 881.11
Total non-derivative liabilities 27,339.11 8,348.94 4,239.06 7,038.71 46,965.81 41,519.67DerivativesForward contracts 309.25 - - - 309.25 309.25Coupon only swap 5.30 - - - 5.30 5.63Total derivative liabilities 314.55 - - - 314.55 314.88

Notesannexed to and forming part of the consolidated balance sheet as at March 31, 2018 and the consolidated statement of profit and loss for the year ended March 31, 2018(All amounts in Rupees million, unless otherwise stated)
244
(III) Market risk - foreign currency riskThe Group undertakes transactions denominated in foreign currencies; consequently, exposures to exchange rate
foreign exchange contracts.
settlement date of certain receivables/payables. The use of foreign currency forward contracts is governed by the Group’s strategy approved by the board of directors, which provide principles on the use of such forward contracts consistent with the Group’s risk management policy and procedures.
a) Foreign currency risk exposureThe Group’s exposure to foreign currency risk (excluding inter-company eliminations) at the end of the reporting period expressed in equivalent in INR Rupees is as follows:
As at March 31, 2018 As at March 31, 2017
USD EUR Others USD EUR Others
Financial Assets
Trade receivables 644.61 2,057.15 - 1,304.23 3,605.51 -
37.84 - - - - -
Derivatives not designated as hedges
Forward contracts - (1,817.59) - - - -
Derivatives designated as hedges
Forward contracts (1,372.20) - - (1,654.64) (6,410.64) -
Net exposure to foreign currency risk (assets)
(689.75) 239.56 - (350.41) (2,805.13) -
Financial liabilities
Borrowing 1,594.93 - - 4,876.12 - -
Trade payables 12,262.38 3,267.78 23.44 6,687.81 4,505.65 42.52
804.66 3.91 - 728.73 4.73 -
Derivatives not designated as hedges
Forward contracts (10,531.18) (3,916.79) - (3,840.42) (834.19) -
Option contracts (654.15) - - - - -
Derivatives designated as hedges
Forward contracts (1,681.21) - - (1,411.62) (2,289.91) -
Net exposure to foreign currency risk (liabilities)
1,795.43 (645.10) 23.44 7,040.62 1,386.28 42.52
Total Net exposure to foreign currency risk (2,794.19) 884.66 (23.44) (7,148.01) (70.68) (42.52)
Net Derivatives designated as hedges 309.01 - - (243.02) (4,120.73) -

Notesannexed to and forming part of the consolidated balance sheet as at March 31, 2018 and the consolidated statement of profit and loss for the year ended March 31, 2018(All amounts in Rupees million, unless otherwise stated)
Annual Report 2017-18 Financial StatementsThe Welspun Corp Story Governance Reports
245
b) Foreign currency sensitivity
Net impact on profit before tax Net impact on other reserve
As at March 31, 2018
As at March 31, 2017
As at March 31, 2018
As at March 31, 2017
USD sensitivity
INR/USD - Increase by 1% (March 31, 2017 - 1%)* (27.94) (71.48) 3.09 (2.43)
INR/USD - Decrease by 1% (March 31, 2017 - 1%)* 27.94 71.48 (3.09) 2.43
EURO sensitivity
INR/EURO - Increase by 1% (March 31, 2017 - 1%)* 8.85 (0.71) - (41.21)
INR/EURO - Decrease by 1% (March 31, 2017 - 1%)* (8.85) 0.71 - 41.21
* Holding all other variables constant
(IV) Interest rate risk
During March 31, 2018 and March 31, 2017, the Group’s borrowings at variable rate were denominated in USD.
a change in market interest rates.
rate interest amounts calculated by reference to the agreed notional principal amounts. a) Interest rate risk exposure
The exposure of the Group’s borrowing to interest rate changes at the end of the reporting period are as follows:
As at March 31, 2018
As at March 31, 2017
Fixed rate borrowings 5,722.42 12,487.68
Floating rate borrowings 8,141.87 5,942.10
Total borrowings 13,864.29 18,429.78
As at the end of the reporting period, the Group had the following variable rate borrowings and interest rate swap contracts outstanding:
As at March 31, 2018
As at March 31, 2017
Floating rate borrowings 8,141.87 5,942.10
Interest rate swaps (notional principal amount) (1,603.31) (2,762.61)
Net exposure to cash flow interest rate risk 6,538.56 3,179.49

Notesannexed to and forming part of the consolidated balance sheet as at March 31, 2018 and the consolidated statement of profit and loss for the year ended March 31, 2018(All amounts in Rupees million, unless otherwise stated)
246
b) Sensitivity
related to borrowings.
impact on profit before tax Net impact on other reserve
As at March 31,
2018
As at March 31,
2017
As at March 31,
2018
As at March 31,
2017
Increase by 10 basis points (March 31, 2017 - 10 basis points)* 6.54 3.18 (0.02) (0.02)
Decrease by 10 basis points (March 31, 2017 - 10 basis points)* (6.54) (3.18) 0.02 0.02
*Holding all other variables constant
(V) Investment risk a) Exposure The Group is mainly exposed to the price risk due to its investment in mutual funds and bonds. The price risk arises due to uncertainties about the future market values of these investments.
accordance with the limits set by the risk management policies.
b) SensitivityThe table below summarises the impact of increase/ decrease of 1% increase in price of bonds and mutual funds
Impact on profit before tax
As at March 31, 2018
As at March 31, 2017
Increase in rate 1% (March 31, 2017 - 1% ) 33.67 50.69
Decrease in rate 1% (March 31, 2017 - 1% ) (33.67) (50.69)
(VI) Impact of hedging activities The Group undertakes transactions denominated in foreign currencies; consequently, exposures to exchange rate
contracts.
a) Disclosure of effects of hedge accounting on financial position
As at March 31, 2018
Type of hedge and risksNominal value
Carrying amount of hedging instrument
Maturity date Hedge ratio
Assets Liabilities Assets Liabilities
Cash flow hedge
Foreign exchange risk
Forward contract 1,880.07 1,173.33 12.10 16.30 Apr 18 - Mar 19 1:1
Interest rate risk
Interest rate swap 1,603.31 - 21.42 - Apr 18 - Oct 19 1:1

Notesannexed to and forming part of the consolidated balance sheet as at March 31, 2018 and the consolidated statement of profit and loss for the year ended March 31, 2018(All amounts in Rupees million, unless otherwise stated)
Annual Report 2017-18 Financial StatementsThe Welspun Corp Story Governance Reports
247
As at March 31, 2017
Type of hedge and risksNominal value
Carrying amount of hedging instrument
Maturity date Hedge ratio
Assets Liabilities Assets Liabilities
Cash flow hedge
Foreign exchange risk
Forward contract 6,246.33 5,520.46 284.07 99.75 Apr 17 - Mar 18 1:1
Interest rate risk
Interest rate swap 2,762.61 - 22.30 - Apr 17 - Oct 19 1:1
date of certain receivables/payables. The use of forward contracts is governed by the Group’s strategy approved by the board of directors, which provide principles on the use of such forward contracts consistent with the Group’s risk management policy. The Group’s hedging policy only allows for effective hedge relationships to be established. Hedge effectiveness is determined at the inception of the hedge relationship, and through periodic prospective effectiveness assessments to ensure that an economic relationship exists between the hedged item and hedging instrument. The Group enters into hedge relationships where the critical terms of the hedging instrument match exactly with the terms of the hedged item, and so a qualitative assessment of effectiveness is performed. If changes in circumstances affect the terms of the hedged item such that the critical terms no longer match exactly with the critical terms of the hedging instrument, the group uses the hypothetical derivative method to assess effectiveness. Ineffectiveness
component value of the hedging instrument exceeds on an absolute basis the change in value of the hedged item attributable to the hedged risk. In hedges of foreign currency forecast sale and purchase transactions, hedges of interest rate risk and hedges of net investment this may arise if: (i) The critical terms of the hedging instrument and the hedged item differ (i.e. nominal amounts, timing of the
forecast transaction, interest resets changes from what was originally estimated), or (ii) Differences arise between the credit risk inherent within the hedged item and the hedging instrument.”
b) Movement in cash flow hedging reserve
Risk category Foreign currency risk
Interest rate risk
Total
Derivative instruments Forward contracts
Interest rate swap
Cash flow hedging reserve
As at April 01, 2016 41.70 (9.91) 31.79
Changes in fair value of forward contracts 278.08 - 278.08
Changes in fair value of interest rate swaps - 39.58 39.58
(157.53) (2.12) (159.65)
Income tax on amount recognised in hedging reserve (41.73) (12.96) (54.69)
As at March 31, 2017 120.52 14.59 135.11
Changes in fair value of forward contracts (129.06) - (129.06)
Changes in fair value of interest rate swaps - 6.07 6.07
(59.46) (6.95) (66.41)
Income tax on amount recognised in hedging reserve 65.26 0.24 65.50
As at March 31, 2018 (2.74) 13.95 11.21

Notesannexed to and forming part of the consolidated balance sheet as at March 31, 2018 and the consolidated statement of profit and loss for the year ended March 31, 2018(All amounts in Rupees million, unless otherwise stated)
248
43. Capital management(I) Risk management
The Group’s objectives when managing capital are to safeguard the company’s ability to continue as
to maintain an optimal capital structure to reduce the cost of capital. In order to maintain or adjust the capital structure, the Group may adjust the amount of dividends paid to shareholders, return capital to shareholders, issue new shares or sell assets to reduce debt.The Group monitors capital on the basis of the following gearing ratio:
As at March 31, 2018
As at March 31, 2017
Net debt (total borrowings net of cash and cash equivalents, other bank balances and current investments)
4,215.61 11,064.98
Total equity (including non-controlling interests) 29,106.43 29,229.76
Net debt to equity ratio 0.14 0.38
Loan covenants The Group has complied with all the loan covenants applicable, mainly debt service coverage ratio, debt
(II) Dividend
As at March 31, 2018 As at March 31, 2017
Equity share
Final dividend for the year ended March 31, 2017 of Rs. 0.50 (March 31, 2016 - Rs. 0.50) per fully paid shares
132.61 132.61
Dividend not recognised at the end of the reporting period
of Rs. 0.50 per fully paid equity share (March 31, 2017 - Rs. 0.50). This proposed dividend is subject to the approval of shareholders in the ensuing annual general meeting.
132.61 132.61
44. Interests in other entities (a) Subsidiaries
The group’s subsidiaries at March 31, 2018 are set out below. Unless otherwise stated, they have share capital consisting of equity shares that are held directly by the group, and the proportion of ownership interests held equals the voting rights held by the group. The country of incorporation or registration is also their principal place of business.
Name of entity Place of business/ country of incorporation
Ownership interest held by the group
Ownership interest held by non-controlling interests
Principal activities
As at March 31, 2018
As at March 31, 2017
As at March 31, 2018
As at March 31, 2017
% % % %
Welspun Pipes Inc. USA 94.79 90.01 5.21 9.99 Manufacturing of steel pipes
Welspun Tradings Limited
India 100.00 100.00 - - Trading in steel pipes
Welspun Mauritius Holdings Limited
Mauritius 89.98 89.98 10.02 10.02 Investment Holding Company

Notesannexed to and forming part of the consolidated balance sheet as at March 31, 2018 and the consolidated statement of profit and loss for the year ended March 31, 2018(All amounts in Rupees million, unless otherwise stated)
Annual Report 2017-18 Financial StatementsThe Welspun Corp Story Governance Reports
249
(b) Non-controlling interests (NCI)
that are material to the group. The amounts disclosed for each subsidiary are before inter-company eliminations.
Summarised balance sheet Welspun Mauritius Holdings Limited Welspun Pipes Inc.
As at March 31, 2018
As at March 31, 2017
As at March 31, 2018
As at March 31, 2017
Current Assets 20.75 24.64 12,359.44 13,566.16
Current liabilities 978.41 973.40 3,590.08 7,725.58
Net current assets (957.66) (948.76) 8,769.36 5,840.58
Non-current Assets 2,731.78 3,454.56 8,577.79 9,952.53
Non-current Liabilities 1,528.61 1,520.73 7,851.10 5,415.62
Net non-current assets 1,203.17 1,933.83 726.69 4,536.91
Net assets 245.51 985.07 9,496.05 10,377.49
Accumulated NCI 24.60 98.68 541.52 1,036.71
As at March 31, 2018
As at March 31, 2017
Accumulated NCI 566.12 1,135.39
Summarised statement of profit and loss Welspun Mauritius Holdings Limited Welspun Pipes Inc.
As at March 31, 2018
As at March 31, 2017
As at March 31, 2018
As at March 31, 2017
Revenue - - 33,443.80 21,724.95
(725.11) (708.56) 504.77 (922.05)
Total comprehensive income (725.11) (708.56) 504.77 (922.05)
(72.64) (70.99) 19.70 (92.11)
Dividends paid to NCI - - - -
As at March 31, 2018
As at March 31, 2017
Profit allocated to NCI (52.94) (163.10)
Summarised Cash Flow Welspun Mauritius Holdings Limited Welspun Pipes Inc.
As at March 31, 2018
As at March 31, 2017
As at March 31, 2018
As at March 31, 2017
(3.12) (2.70) 1,424.29 2,956.12
- - 43.99 (236.19)
(1.21) (1.09) 1,857.11 (3,009.10)
Net increase/ (decrease) in cash and cash equivalents
(4.33) (3.79) 3,325.39 (289.17)

Notesannexed to and forming part of the consolidated balance sheet as at March 31, 2018 and the consolidated statement of profit and loss for the year ended March 31, 2018(All amounts in Rupees million, unless otherwise stated)
250
(c) Transactions with non-controlling interests During the year 2017-18, the Group has buy back non-controlling interest share in Welspun Pipes Inc resulting increase in stake from 90.01% to 94.79%. There were no transactions with non-controlling interests during the year ended March 31, 2017.
(d) Interest in joint ventures Set out below are the joint ventures of the group as at March 31, 2018 which, in the opinion of the directors, are material to the group. The entities listed below have share capital consisting solely of equity shares, which are held directly by the group. The country of incorporation or registration is also their principal place of business, and the proportion of ownership interest is the same as the proportion of voting rights held.
Name of entity Place of business
% of ownership interest
Relationship Accounting method
Carrying amount
As atMarch 31, 2018
As at March 31, 2017
Welpsun Wasco Coatings Private Limited
India 51% Joint Equity 53.94 105.40
Welspun Middle East Pipes Company LLC
Kingdom of Saudi Arabia
50.01% Joint Equity 1,090.17 1,730.98
Welspun Middle East Pipes Coatings Company LLC
Kingdom of Saudi Arabia
50.01% Joint Equity (334.08) (165.93)
Total equity accounted investments
810.03 1,670.45
Summarised financial information for joint ventures
by the entity when using the equity method, including fair value adjustments made at the time of acquisition and

Notesannexed to and forming part of the consolidated balance sheet as at March 31, 2018 and the consolidated statement of profit and loss for the year ended March 31, 2018(All amounts in Rupees million, unless otherwise stated)
Annual Report 2017-18 Financial StatementsThe Welspun Corp Story Governance Reports
251
Su
mm
ari
sed
bala
nce
sh
ee
tW
elp
sun
Wasc
o C
oati
ng
s P
rivate
L
imit
ed
W
els
pu
n M
idd
le E
ast
Pip
es
Co
mp
an
y L
LC
We
lsp
un
Mid
dle
East
Pip
es
Co
ati
ng
s C
om
pan
y L
LC
Marc
h 3
1, 2
018
Marc
h 3
1, 2
017
Marc
h 3
1, 2
018
Marc
h 3
1, 2
017
Marc
h 3
1, 2
018
Marc
h 3
1, 2
017
Cu
rren
t ass
ets
Cash
an
d c
ash
eq
uiv
ale
nts
34
8.0
0
273
.81
1,0
28
.89
7
34
.75
3
2.0
3
6.4
9
Oth
er
ass
ets
52.3
3
37.1
5
2,4
99
.98
2
,69
3.2
2
374
.70
1
15.4
3
Tota
l cu
rre
nt
ass
ets
40
0.3
3
310
.96
3
,52
8.8
7
3,4
27.
97
4
06
.73
1
21.
92
Tota
l n
on
-cu
rre
nt
ass
ets
68
6.5
9
64
4.2
6
4,4
59
.13
4
,89
0.3
4
1,6
80
.32
1
,82
5.5
3
Cu
rren
t lia
bili
ties
Fin
an
cia
l lia
bili
ties
(exclu
din
g t
rad
e
payab
les)
20
8.1
1 2
44
.95
4
79
.83
5
18.1
5
56
2.8
7
611
.54
Oth
er
liab
iliti
es
13
.97
14
.06
1
,89
3.5
1 2
19.8
4
577.4
5
13
3.5
9
Tota
l cu
rre
nt
liab
ilit
ies
22
2.0
8
25
9.0
1 2
,373
.34
7
37.
99
1
,14
0.3
2
74
5.1
3
No
n-c
urr
en
t lia
bili
ties
Fin
an
cia
l lia
bili
ties
(exclu
din
g t
rad
e
payab
les)
68
4.5
4
48
9.5
4
3,5
61.
90
4
,23
7.3
0
1,5
86
.52
1,5
12.0
6
Oth
er
liab
iliti
es
74
.89
-
1
13.5
3
91.
44
2
8.5
5
22.0
5
Tota
l n
on
-cu
rre
nt
liab
ilit
ies
75
9.4
3
48
9.5
4
3,6
75
.43
4
,32
8.7
4
1,6
15.0
7
1,5
34
.11
Ne
t ass
ets
/ (l
iab
ilit
ies)
10
5.4
1 2
06
.67
1
,93
9.2
3
3,2
51.
58
(
66
8.3
4)
(3
31.
79
)
Re
co
ncil
iati
on
to
carr
yin
g a
mo
un
ts
We
lpsu
n W
asc
o C
oati
ng
s P
rivate
L
imit
ed
W
els
pu
n M
idd
le E
ast
Pip
es
Co
mp
an
y L
LC
We
lsp
un
Mid
dle
East
Pip
es
Co
ati
ng
s C
om
pan
y L
LC
Marc
h 3
1, 2
018
Marc
h 3
1, 2
017
Marc
h 3
1, 2
018
Marc
h 3
1, 2
017
Marc
h 3
1, 2
018
Marc
h 3
1, 2
017
Op
en
ing
net
ass
ets
/ (l
iab
iliti
es)
20
6.6
7
28
9.4
1 3
,25
1.5
8
4,6
41.
74
(
33
1.79
) (
54
.32)
Invest
men
t d
uri
ng
th
e y
ear
-
-
-
-
-
-
(10
0.8
8)
(8
2.7
4)
(1,
317
.99
) (
1,3
36
.42)
(3
30
.83
) (
28
8.4
9)
Oth
er
co
mp
reh
en
sive in
co
me
(0
.38
) -
3
.83
-
(
0.3
8)
-
Div
iden
ds
paid
-
-
-
-
-
-
Exch
an
ge d
iffe
ren
ces
(net)
-
-
1.8
1 (
53
.74
) (
5.3
4)
11.
02
Clo
sin
g n
et
ass
ets
10
5.4
1 2
06
.67
1
,93
9.2
3
3,2
51.
58
(
66
8.3
4)
(3
31.
79
)
Gro
up
’s s
hare
in
%5
1.0
0%
51.
00
%5
0.0
1%5
0.0
1%5
0.0
1%5
0.0
1%
Gro
up
’s s
hare
53
.94
1
05
.40
9
69
.81
1,6
26
.12
(3
34
.08
) (
165
.93
)
Sh
are
of
tax n
ot
ap
plic
ab
le t
o t
he g
rou
p
as
per
ap
plic
ab
le law
s -
-
1
20
.36
1
04
.86
-
-
Inte
r-co
mp
an
y e
limin
ati
on
s -
-
-
-
-
-
Carr
yin
g a
mo
un
t 5
3.9
4
10
5.4
0
1,0
90
.17
1
,73
0.9
8
(3
34
.08
) (
165
.93
)

Notesannexed to and forming part of the consolidated balance sheet as at March 31, 2018 and the consolidated statement of profit and loss for the year ended March 31, 2018(All amounts in Rupees million, unless otherwise stated)
252
Summarised statement of profit and loss
Welpsun Wasco Coatings Private Limited
Welspun Middle East Pipes Company LLC
Welspun Middle East Pipes Coatings Company LLC
March 31, 2018
March 31, 2017
March 31, 2018
March 31, 2017
March 31, 2018
March 31, 2017
Revenue 1,314.11 2.70 4,736.85 5,640.89 593.53 855.39
Interest income 15.33 13.67 2.35 2.01 - -
Depreciation and amortisation
50.93 7.84 448.54 523.30 146.48 156.32
Interest expense 50.98 28.37 197.43 202.61 71.32 74.47
Income tax expense - - 33.78 42.27 - -
continuing operations (100.88) (82.74) (1,317.99) (1,336.42) (330.83) (288.49)
operations - - - - - -
Profit/ (loss) for the year (100.88) (82.74) (1,317.99) (1,336.42) (330.83) (288.49)
Other comprehensive income
(0.38) - 3.83 - (0.38) -
Total comprehensive income
(101.26) (82.74) (1,314.16) (1,336.42) (331.21) (288.49)
Dividends received - - - - - -
As at March 31, 2018 As at March 31, 2017
Share of loss from joint ventures (874.49) (854.81)
Inter company elimination - 40.64
Exchange differences 15.35 21.16
Total share of losses from joint ventures (859.14) (793.01)
45. Contingent liabilities not provided forThe group had contingent liabilities as at the year end in respect of :
As at March 31, 2018 As at March 31, 2017
Claims against the Group not acknowledged as debts 119.82 114.37
Disputed direct taxes 92.88 295.28
Disputed indirect taxes 1,907.48 1,415.50
resolution of the respective proceedings.
The Group does not expect any reimbursements in respect of the above contingent liabilities.
46. Exchange differences on long term foreign currency monetary items outstanding
In accordance with para D13AA of Ind AS 101 First time adoption of Indian Accounting Standards and the option
December 29, 2011 issued by the Ministry of Corporate Affairs, the Company has adjusted the exchange rate difference arising on long term foreign currency monetary items, in so far as they relate to the acquisition of a depreciable capital asset, to the cost of the asset. In other cases, foreign exchange differences are accumulated in “Foreign Currency Monetary Item Translation Difference Account” and amortised over the balance period of such long term assets/ liabilities.

Notesannexed to and forming part of the consolidated balance sheet as at March 31, 2018 and the consolidated statement of profit and loss for the year ended March 31, 2018(All amounts in Rupees million, unless otherwise stated)
Annual Report 2017-18 Financial StatementsThe Welspun Corp Story Governance Reports
253
Accordingly, the Company has adjusted exchange loss of Rs. 3.25 (March 31, 2017: gain of Rs. 14.05) to the cost of property, plant and equipment as the long term monetary items relate to depreciable capital asset.
Exchange loss of Rs. 9.28 (March 31, 2017: gain of Rs. 5.21) has been transferred to ”Foreign Currency Monetary Item Translation Difference Account (FCMITDA)” to be amortised over the balance period of such long term liabilities. Out of the FCMITDA, loss of Rs. 69.65 (March 31, 2017: loss of Rs. 178.30) has been adjusted in the current year and balance loss of Rs. 35.54 (March 31, 2017: loss of Rs 95.91) has been carried over and included in reserves and surplus.
47. Capital and other commitments i) Capital commitments
Capital expenditure contracted for at the end of the reporting period but not recognised as liabilities is as follows
As at March 31, 2018 As at March 31, 2017
Estimated amount of contracts remaining to be executed on capital account (net of advances)
54.27 4.19
Property, plant and equipment 82.29 27.90
Intangible assets under development 2.74 31.35
ii) Other commitments
As at March 31, 2018 As at March 31, 2017
Corporate guarantees given by the group for loans to joint ventures and others. Loan/ liability outstanding against these guarantees aggregate to Rs. 1,311.84 (March 31, 2017: Rs. 1,648.52) (refer note 50)
2,964.25 2,789.65
Outstanding letters of credit (net) 9,076.28 5,842.07
Custom duty liabilities on duty free import of raw materials (export obligations)
207.54 1,854.52
joint ventures.
48. Segment reporting(i) Description of segments and principle activities
of the Company who examines the Group’s performance only from the product perspective and has
internal management report to assess the performance of the operating segment which is measured
(iii) Revenue from major external customers is as follows:
For the year ended Number of customers
Amount % to revenue from operations
March 31, 2018 4 23,991.98 32.93%
March 31, 2017 2 13,186.43 22.88%

Notesannexed to and forming part of the consolidated balance sheet as at March 31, 2018 and the consolidated statement of profit and loss for the year ended March 31, 2018(All amounts in Rupees million, unless otherwise stated)
254
(iv) The Group is domiciled in India. The amount of its revenue and other operating revenue from external customers broken down by location of the customers is shown in the table below:
Revenue and other operating revenue from external customers Year endedMarch 31, 2018
Year endedMarch 31, 2017
Outside India 45,305.64 42,198.41
Within India 28,870.56 16,580.54
Total revenue from external customers 74,176.20 58,778.95
method and deferred tax assets, broken down by location of the assets, is shown below:
Year endedMarch 31, 2018
Year endedMarch 31, 2017
Outside India 8,539.27 9,915.83
Within India 23,268.98 24,993.76
Total non-current assets 31,808.25 34,909.59
49. Operating lease As a lessee
The Company and subsidiaries of the Company have operating leases for premises and equipments. These lease arrangements range for a period within eleven months to ten years which includes cancellable and non-cancellable leases. The leases have varying terms, escalation clauses and renewal rights. On renewal, the terms of the leases are renegotiated. Further, a subsidiary of the Company has entered into a sub-lease and such sub-lease is for a period of 1 year which is cancellable with an option of renewal on mutually agreeable terms.
a) With respect to all operating leases
Year endedMarch 31, 2018
Year endedMarch 31, 2017
214.00 184.50
b) With respect to non-cancellable operating leases, the future minimum lease payments are as follows
Year endedMarch 31, 2018
Year endedMarch 31, 2017
Not later than one year 61.29 65.01
120.17 113.39
7.15 -
50. Related party disclosuresa) List of Related parties
Name of Joint Venture As at March 31, 2018
As at March 31, 2017
Welspun Wasco Coatings Private Limited 51.00% 51.00%
Welspun Middle East Pipes Company LLC 50.01% 50.01%
Welspun Middle East Pipes Coating Company LLC 50.01% 50.01%
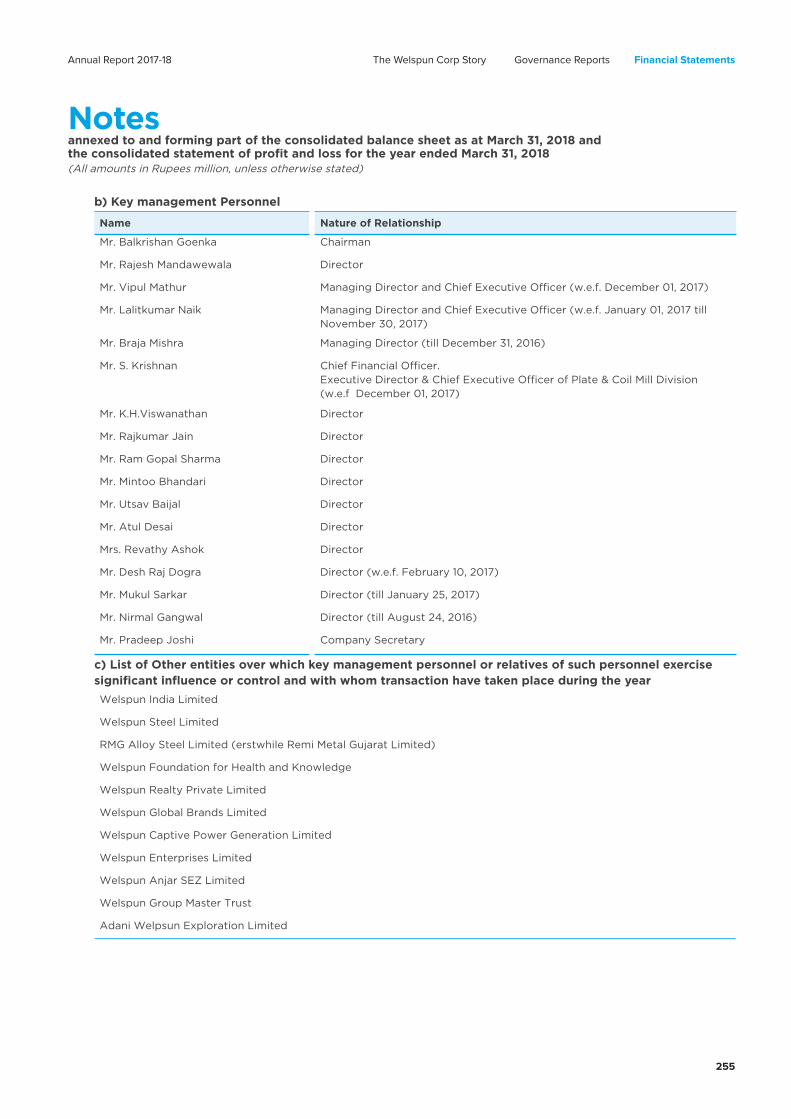
Notesannexed to and forming part of the consolidated balance sheet as at March 31, 2018 and the consolidated statement of profit and loss for the year ended March 31, 2018(All amounts in Rupees million, unless otherwise stated)
Annual Report 2017-18 Financial StatementsThe Welspun Corp Story Governance Reports
255
b) Key management Personnel
Name Nature of Relationship
Mr. Balkrishan Goenka Chairman
Mr. Rajesh Mandawewala Director
Mr. Lalitkumar NaikNovember 30, 2017)
Mr. Braja Mishra Managing Director (till December 31, 2016)
Mr. S. Krishnan
(w.e.f December 01, 2017)
Director
Mr. Rajkumar Jain Director
Mr. Ram Gopal Sharma Director
Mr. Mintoo Bhandari Director
Mr. Utsav Baijal Director
Mr. Atul Desai Director
Mrs. Revathy Ashok Director
Mr. Desh Raj Dogra Director (w.e.f. February 10, 2017)
Mr. Mukul Sarkar Director (till January 25, 2017)
Mr. Nirmal Gangwal Director (till August 24, 2016)
Mr. Pradeep Joshi Company Secretary
c) List of Other entities over which key management personnel or relatives of such personnel exercise significant influence or control and with whom transaction have taken place during the year
Welspun India Limited
Welspun Steel Limited
RMG Alloy Steel Limited (erstwhile Remi Metal Gujarat Limited)
Welspun Foundation for Health and Knowledge
Welspun Realty Private Limited
Welspun Global Brands Limited
Welspun Captive Power Generation Limited
Welspun Enterprises Limited
Welspun Anjar SEZ Limited
Welspun Group Master Trust
Adani Welpsun Exploration Limited

Notesannexed to and forming part of the consolidated balance sheet as at March 31, 2018 and the consolidated statement of profit and loss for the year ended March 31, 2018(All amounts in Rupees million, unless otherwise stated)
256
d) Disclosure in respect of significant transactions with related parties during the year
Transactions
Year ended March 31, 2018
Year ended March 31, 2017
1) Sale of product
Welspun Middle East Pipes Company LLC - 1,433.62
Welspun India Limited 24.83 95.31
Welspun Steel Limited 28.04 2.33
Welspun Captive Power Generation Limited 60.42 2.64
Welspun Wasco Coatings Private Limited - 11.82
Others 9.28 14.18
Total sale of product 122.57 1,559.90
2) Other income
Welspun Middle East Pipes Coating Company LLC 36.93 38.43
Welspun Middle East Pipes Company LLC 59.43 61.85
Welspun Wasco Coatings Private Limited 45.20 29.03
Welspun Captive Power Generation Limited - 0.03
Others 0.47 0.66
Total other income 142.03 129.98
3) Purchase of property, plant and equipment
Welspun Steel Limited - 6.29
Total of purchase of property, plant and equipment - 6.29
4) Purchase of goods and expenses incurred
Welspun Middle East Pipes Company LLC - 4,710.15
Welspun Captive Power Generation Limited 592.41 327.41
Welspun Realty Private Limited 57.60 49.72
Welspun Steel Limited 0.21 0.15
Welspun Wasco Coatings Private Limited 194.28 3.50
Others 37.14 6.96
Total purchase of goods and expenses incurred 881.64 5,097.89
5) Sale of property, plant and equipment
Welspun Wasco Coating Private Limited - 0.05
Welspun Anjar SEZ Limited 35.31 -
Total sale of property, plant and equipment 35.31 0.05
6) Corporate social responsibility expenses
Welspun Foundation for Health and Knowledge 6.41 2.33
Total corporate social responsibility expenses 6.41 2.33

Notesannexed to and forming part of the consolidated balance sheet as at March 31, 2018 and the consolidated statement of profit and loss for the year ended March 31, 2018(All amounts in Rupees million, unless otherwise stated)
Annual Report 2017-18 Financial StatementsThe Welspun Corp Story Governance Reports
257
Transactions
Year ended March 31, 2018
Year ended March 31, 2017
7) Sale of investment
Welspun Group Master Trust - 0.40
Total sale of investment - 0.40
8) Reimbursement of expenses (paid)/ recovered
Welspun Middle East Pipes Company LLC 0.57 4.63
Welspun Wasco Coating Private Limited 38.34 33.04
Welspun Global Brands Limited - (4.46)
Welspun Captive Power Generation Limited 1.23 0.89
Welspun India Limited (14.71) (21.16)
Welspun Steel Limited 0.49 0.21
Welspun Enterprises Limited - 0.14
Others 0.31 1.02
Total reimbursement of expenses (paid) / recovered 26.23 14.31
9) Loans and deposits given
Welspun Wasco Coating Private Limited 98.04 99.12
Total loans and deposit given 98.04 99.12
10) Loans and deposit received back
Welspun Realty Private Limited 22.62 22.62
Others - 0.20
Total loan and deposit repaid 22.62 22.82
11) Addition of corporate guarantee
Welspun Wasco Coatings Private Limited 54.25 54.25
Total addition of corporate guarantee 54.25 54.25
12) Key management personnel compensation
Mr. Balkrishan Goenka
18.95 27.99
Mr. Braja Mishra
- 45.19
Mr. Lalitkumar Naik
32.12 9.41
Mr. S. Krishnan
28.49 24.72
14.65 -
Mr. Pradeep Joshi
4.00 3.91
Total key management personnel compensation 98.21 111.22

Notesannexed to and forming part of the consolidated balance sheet as at March 31, 2018 and the consolidated statement of profit and loss for the year ended March 31, 2018(All amounts in Rupees million, unless otherwise stated)
258
Transactions
Year ended March 31, 2018
Year ended March 31, 2017
13) Directors' sitting fees
0.95 0.78
Mr. Rajkumar Jain 0.88 0.83
Mr. Ram Gopal Sharma 0.66 0.83
Mr. Mintoo Bhandari 0.34 0.20
Mr. Utsav Baijal - 0.07
Mr. Atul Desai 0.21 0.14
Mrs. Revathy Ashok 0.11 0.22
Mr. Desh Raj Dogra 0.22 0.07
Mr. Mukul Sarkar - 0.11
Total directors' sitting fees 3.37 3.25
Note : Amount is inclusive of applicable taxes
e) Disclosure of significant closing balances with related parties
As at March 31, 2018
As at March 31, 2017
1) Trade receivables
Welspun Steel Limited 9.93 -
Welspun Middle East Pipes Company LLC 0.07 0.07
Welspun Middle East Pipe Coatings Company LLC - 0.12
Welspun Wasco Coatings Private Limited - 2.40
Welspun Global Brands Limited 9.27 4.57
Others 2.90 -
Total trade receivables 22.17 7.16
2) Trade payables
Welspun Captive Power Generation Limited 68.68 -
Welspun Middle East Pipes Company LLC - 455.29
Others 0.50 -
Total trade payables 69.18 455.29
3) Loans, advances and deposits given (including accrued interest)
Welspun Middle East Pipes Company LLC 932.25 927.73
Welspun Middle East Pipes Coating Company LLC 963.61 923.38
Welpsun Wasco Coatings Private Limited 354.11 256.07
Welspun Realty Private Limited 221.27 243.88
Others 27.40 27.40
Total loans, advances and deposits given 2,498.64 2,378.46
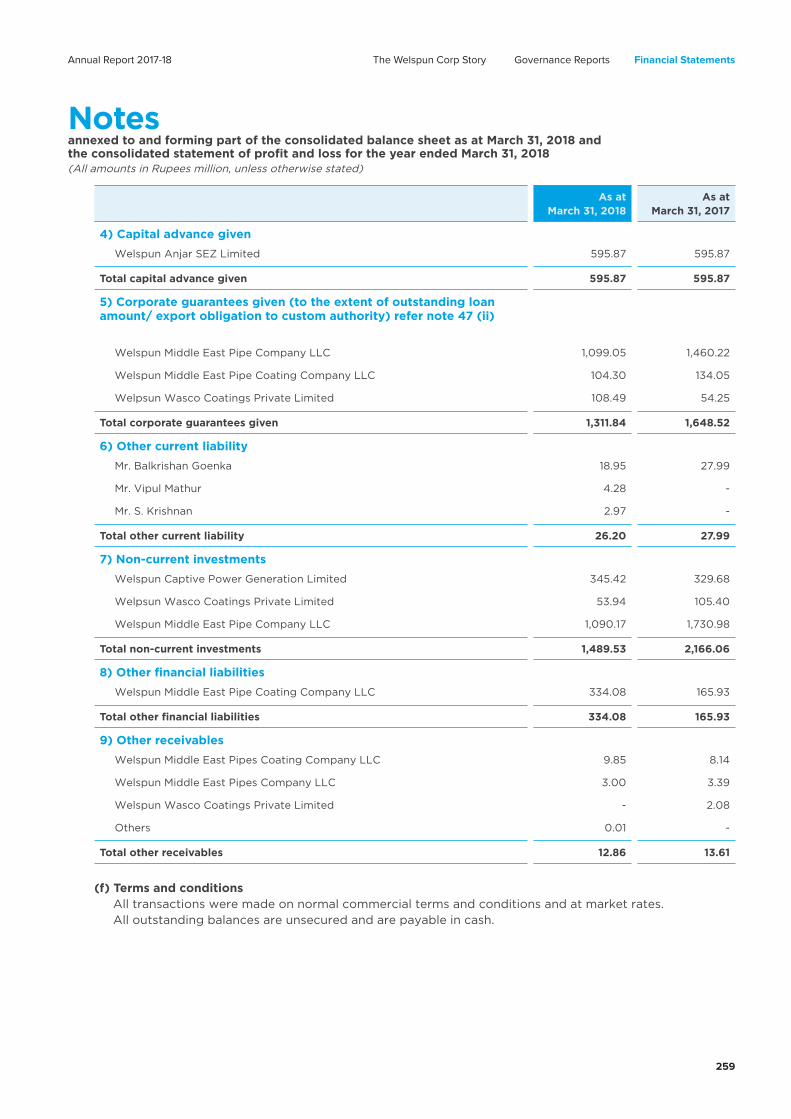
Notesannexed to and forming part of the consolidated balance sheet as at March 31, 2018 and the consolidated statement of profit and loss for the year ended March 31, 2018(All amounts in Rupees million, unless otherwise stated)
Annual Report 2017-18 Financial StatementsThe Welspun Corp Story Governance Reports
259
As at March 31, 2018
As at March 31, 2017
4) Capital advance given
Welspun Anjar SEZ Limited 595.87 595.87
Total capital advance given 595.87 595.87
5) Corporate guarantees given (to the extent of outstanding loan amount/ export obligation to custom authority) refer note 47 (ii)
Welspun Middle East Pipe Company LLC 1,099.05 1,460.22
Welspun Middle East Pipe Coating Company LLC 104.30 134.05
Welpsun Wasco Coatings Private Limited 108.49 54.25
Total corporate guarantees given 1,311.84 1,648.52
6) Other current liability
Mr. Balkrishan Goenka 18.95 27.99
4.28 -
Mr. S. Krishnan 2.97 -
Total other current liability 26.20 27.99
7) Non-current investments
Welspun Captive Power Generation Limited 345.42 329.68
Welpsun Wasco Coatings Private Limited 53.94 105.40
Welspun Middle East Pipe Company LLC 1,090.17 1,730.98
Total non-current investments 1,489.53 2,166.06
8) Other financial liabilities
Welspun Middle East Pipe Coating Company LLC 334.08 165.93
Total other financial liabilities 334.08 165.93
9) Other receivables
Welspun Middle East Pipes Coating Company LLC 9.85 8.14
Welspun Middle East Pipes Company LLC 3.00 3.39
Welspun Wasco Coatings Private Limited - 2.08
Others 0.01 -
Total other receivables 12.86 13.61
(f) Terms and conditions All transactions were made on normal commercial terms and conditions and at market rates.All outstanding balances are unsecured and are payable in cash.

Notesannexed to and forming part of the consolidated balance sheet as at March 31, 2018 and the consolidated statement of profit and loss for the year ended March 31, 2018(All amounts in Rupees million, unless otherwise stated)
260
51.
A
dd
itio
nal
info
rmati
on
re
qu
ire
d b
y S
ch
ed
ule
III
Nam
e o
f th
e e
nti
ty i
n t
he
gro
up
Ne
t ass
ets
(t
ota
l ass
ets
min
us
tota
l li
ab
ilit
ies)
Sh
are
in
pro
fit
or
(lo
ss)
Sh
are
in
oth
er
co
mp
reh
en
sive
in
co
me
Sh
are
in
to
tal
co
mp
reh
en
sive
in
co
me
As
% o
f co
nso
lid
ate
d
ne
t ass
ets
(%
)
Am
ou
nt
As
% o
f co
nso
lid
ate
d
pro
fit
or
(lo
ss)
(%)
Am
ou
nt
A
s %
of
co
nso
lid
ate
d o
the
r co
mp
reh
en
sive
in
co
me
(%
)
Am
ou
nt
A
s %
of
co
nso
lid
ate
d o
the
r co
mp
reh
en
sive
in
co
me
(%
)
Am
ou
nt
Pare
nt
We
lsp
un
Co
rp L
imit
ed
Marc
h 3
1, 2
018
65
.82
19
,15
7.1
7
82.2
3
1,2
58
.18
6
7.3
3
(9
7.9
5)
83
.79
1
,16
0.2
3
Marc
h 3
1, 2
017
61.
91
18
,09
6.1
8
1,7
26
.16
1
,74
6.0
1 1
27.7
0
(25
6.8
2)
(1,
48
9.7
9)
1,4
89
.19
Su
bsi
dia
rie
s (g
rou
p's
sh
are
)
Ind
ian
We
lsp
un
Tra
din
gs
Lim
ite
dM
arc
h 3
1, 2
018
2.7
8
810
.10
7
.76
1
18.6
9
25
.31
(3
6.8
2)
5.9
1 8
1.8
7
Marc
h 3
1, 2
017
2.4
9
728
.32
88
.80
8
9.8
2 (
27.7
0)
55
.71
(14
5.5
9)
14
5.5
3
We
lsp
un
Pip
es
Lim
ite
dM
arc
h 3
1, 2
017
(ti
ll M
arc
h 1
7, 20
17)
-
-
0.1
2
0.1
2
-
-
(0
.12)
0.1
2
Fo
reig
n
We
lsp
un
Mau
riti
us
Ho
ldin
gs
Lim
ite
dM
arc
h 3
1, 2
018
6.4
5
1,8
76
.61
2.0
4
31.
20
6
.11
(8
.89
) 1
.61
22.3
1
Marc
h 3
1, 2
017
6.4
9
1,8
97.0
7
32.4
2
32.7
9
-
-
(3
2.8
0)
32.7
9
We
lsp
un
Pip
es
Inc.
Marc
h 3
1, 2
018
32.6
3
9,4
96
.05
3
2.9
9
50
4.7
7
1.2
5
(1.
82)
36
.32
50
2.9
5
Marc
h 3
1, 2
017
35
.52
10
,38
3.5
0
(9
11.5
9)
(9
22.0
7)
-
-
922.4
4
(9
22.0
7)
We
lsp
un
Mid
dle
East
DM
CC
(I
nve
stm
en
t th
rou
gh
We
lsp
un
Tra
din
gs
Lim
ite
d)
Marc
h 3
1, 2
018
0.0
7
20
.51
(1.
24
) (
18.9
4)
-
-
(1.
37)
(18
.94
)
Marc
h 3
1, 2
017
0.1
4
39
.47
111
.04
1
12.3
2
-
-
(11
2.3
6)
112
.32

Notesannexed to and forming part of the consolidated balance sheet as at March 31, 2018 and the consolidated statement of profit and loss for the year ended March 31, 2018(All amounts in Rupees million, unless otherwise stated)
Annual Report 2017-18 Financial StatementsThe Welspun Corp Story Governance Reports
261
Nam
e o
f th
e e
nti
ty i
n t
he
gro
up
Ne
t ass
ets
(t
ota
l ass
ets
min
us
tota
l li
ab
ilit
ies)
Sh
are
in
pro
fit
or
(lo
ss)
Sh
are
in
oth
er
co
mp
reh
en
sive
in
co
me
Sh
are
in
to
tal
co
mp
reh
en
sive
in
co
me
As
% o
f co
nso
lid
ate
d
ne
t ass
ets
(%
)
Am
ou
nt
As
% o
f co
nso
lid
ate
d
pro
fit
or
(lo
ss)
(%)
Am
ou
nt
A
s %
of
co
nso
lid
ate
d o
the
r co
mp
reh
en
sive
in
co
me
(%
)
Am
ou
nt
A
s %
of
co
nso
lid
ate
d o
the
r co
mp
reh
en
sive
in
co
me
(%
)
Am
ou
nt
No
n-c
on
tro
llin
g i
nte
rest
s in
all
su
bsi
dia
rie
s
Marc
h 3
1, 2
018
-
56
6.1
2
-
(5
2.9
4)
-
(3
.28
) -
(
56
.22)
Marc
h 3
1, 2
017
-
1,1
35
.39
-
(
163
.10
) -
(
18.4
0)
-
(18
1.5
0)
Jo
int
ve
ntu
res
(In
ve
stm
en
t as
pe
r e
qu
ity
me
tho
d)
Ind
ian
We
lsp
un
Wasc
o C
oati
ng
s P
rivate
L
imit
ed
Marc
h 3
1, 2
018
(0
.18
) (
51.
46
) (
3.3
6)
(5
1.4
6)
-
-
(3
.72)
(5
1.4
6)
Marc
h 3
1, 2
017
(0
.14
) (
42.2
0)
(4
1.72)
(4
2.2
0)
-
-
42.2
2
(4
2.2
0)
Fo
reig
n
We
lsp
un
Mid
dle
East
Pip
es
Co
mp
an
y L
LC
(In
ve
stm
en
t th
rou
gh
W
els
pu
n M
au
riti
us
Ho
ldin
gs
Lim
ite
d)
Marc
h 3
1, 2
018
1.3
5
39
4.2
3
(3
8.6
2)
(5
90
.85
) -
-
(
42.6
7)
(5
90
.85
)
Marc
h 3
1, 2
017
3.6
3
1,0
61.
08
(
59
0.0
8)
(5
96
.87)
-
-
59
7.1
1 (
59
6.8
7)
We
lsp
un
Mid
dle
East
Pip
es
Co
ati
ng
C
om
pan
y L
LC
(In
ve
stm
en
t th
rou
gh
W
els
pu
n M
au
riti
us
Ho
ldin
gs
Lim
ite
d)
Marc
h 3
1, 2
018
(2.1
2)
(6
15.9
8)
(10
.81)
(16
5.4
5)
-
-
(11
.95
) (
165
.45
)
Marc
h 3
1, 2
017
(1.
55
) (
45
2.7
4)
(14
2.8
3)
(14
4.4
7)
-
-
14
4.5
3
(14
4.4
7)
Inte
r-co
mp
an
y e
lim
inati
on
s an
d
co
nso
lid
ati
on
ad
just
me
nts
Marc
h 3
1, 2
018
(6
.81)
(1,9
80
.80
) 2
9.0
1 4
43
.95
-
-
3
2.0
6
44
3.9
5
Marc
h 3
1, 2
017
(8
.49
)(2
,48
0.9
2)
(17
2.3
2)
(17
4.3
0)
-
-
174
.37
(17
4.3
0)
Tota
l
Marc
h 3
1, 2
018
10
0.0
0
29
,10
6.4
3
10
0.0
0
1,5
30
.09
1
00
.00
(
145
.48
) 1
00
.00
1
,38
4.6
1
Marc
h 3
1, 2
017
10
0.0
0
29
,22
9.7
6
10
0.0
0
10
1.15
1
00
.00
(
20
1.11
) 1
00
.00
(
99
.96
)

Notesannexed to and forming part of the consolidated balance sheet as at March 31, 2018 and the consolidated statement of profit and loss for the year ended March 31, 2018(All amounts in Rupees million, unless otherwise stated)
262
SBNsOther
denomination notes
Total
52. Specified bank notes(i)
not applicable to the Company for the year ended March 31, 2018.
(ii) Following are the details of holdings as well as dealings in
Closing cash in hand as on November 8, 2016 1.53 0.06 1.59
Add: Permitted receipts - 1.00 1.00
Less: Amount deposited in banks 1.53 0.83 2.36
Closing cash in hand as on December 30, 2016 - 0.23 0.23
Year ended March 31, 2018
Year ended March 31, 2017
53. Earnings per share (EPS) 1,583.03 264.25
Weighted average number of equity shares 265,226,109 265,226,109
Basic and diluted earnings per share (Rs.) 5.97 1.00
Nominal value of an equity share 5.00 5.00
As per our attached report of even date.
For Price Waterhouse Chartered Accountants LLP For and on behalf of the Board
Firm Registration No: 012754N / N500016
Mehul Desai Rajesh Mandawewala Vipul Mathur Partner Director Managing Director
Membership No. 103211 DIN: 00007179
DIN: 07990476
Place: Mumbai S. Krishnan Pradeep Joshi
Date: May 02, 2018 Executive Director and Company Secretary
FCS-4959
CEO (PCMD)
DIN: 06829167

Notes

264
Notes

Corporate InformationCompany Identification Number: L27100GJ1995PLC025609
Date of Incorporation: 26th April, 1995
Date of Being Listed on Stock Exchange:
BSE: 27th March, 1997
NSE: 4th December, 2003
Type of Business: Manufacturing of Steel Pipes, Plates, Coils and Coating
Registered Capital: ` 2,500 million
Paid-up Capital: ` 1,326.13 million divided into 265,226,109 equity shares of ` 5/- each fully paid-up
Par Value/Share: ` 5/- each
Securities Registrar & Transfer Agent: Link Intime India Private Ltd. C-101 247 Park, LBS Marg, Vikhroli (West), Mumbai - 400 083
Registered Office ‘Welspun City’ Village Versamedi, Tal. Anjar, Dist. Kutch, Gujarat – 370 110, India Tel: +91 – 2836 - 662079 Fax: +91 – 2836 – 279060
Corporate Office Welspun House, 5th Floor, Kamala Mills Compound, Senapati Bapat Marg, Lower Parel, Mumbai – 400 013, India Tel: +91 – 22 – 6613 6000/2490 8000 Fax: +91 – 22 – 2490 8020/21 E-mail: [email protected] Website: www.welspuncorp.com
Manufacturing Units of the Company & its subsidiariesVillage Jolva & Vadadla, Near Dahej, Taluka : Vagra, Dist. Bharuch, Gujarat – 370 110.Village Versamedi, Tal. – Anjar, Dist. – Kutch, Gujarat – 370 110.KIADB Industrial Area, Gejjalagere, Taluka Maddur, Dist. Mandya, Karnataka – 571 428
Manufacturing Units of the Subsidiaries 9301, Frazier Pike, Little Rock, Arkansas 72205, USA2nd Ind City Dammam, Kingdom of Saudi Arabia, P.O. Box 12943, Postal Code 31483. Village Versamedi, Tal. - Anjar, Dist. - Kutch, Gujarat – 370 110.
Stock exchanges where the Company’s securities are listed BSE Ltd. Phiroze Jeejeebhoy Towers, Dalal Steet, Mumbai – 400 001
The National Stock Exchange of India Ltd.Exchange Plaza, Bandra-Kurla Complex, Bandra (E), Mumbai - 400 001.
Bankers Andhra Bank Bank of Baroda Bank of India Canara Bank Corporation Bank ICICI Bank Limited IDBI Bank Ltd. Oriental Bank of Commerce Punjab National Bank Standard Chartered Bank State Bank of India Union Bank of India
Board of Directors Mr. Balkrishan Goenka Chairman, Non-Executive
Mr. Vipul Mathur Managing Director & CEO
Mr. S. Krishnan Executive Director & CEO (PCMD)
Mr. Atul Desai Director
Mr. Deshraj Dogra Director
Mr. K. H. Viswanathan Director
Mr. Mintoo Bhandari Nominee Director of Insight Solutions Ltd.
Mr. Rajesh R. Mandawewala Director
Mr. Raj Kumar Jain Director
Mr. Ram Gopal Sharma Director
Mrs. Revathy Ashok Director
Mr. Utsav Baijal Nominee Director of Insight Solutions Ltd.
Chief Financial Officer Mr.Percy Birdy
Company Secretary Mr. Pradeep Joshi
Auditors Price Waterhouse Chartered Accountants LLP
Key Management Team Mr. Rajesh R. Mandawewala Group Managing Director
Mr. Vipul Mathur Managing Director & CEO
Mr. Akhil Jindal Director, Group Finance & Strategy
Mr. Godfrey John BU Head, India & APAC
Mr. T. S. Kathayat President - Head QA & TS, India & KSA
Mr. Rajeev Yadav Sr. Vice President and CHRO

Welspun Corp Limited Welspun House, Kamala Mills Compound, SenapatiBapat Marg, Lower Parel, Mumbai 400 013, IndiaTel: +91 22 66136000/24908000 Fax: +91 22 24908020/24908021www.welspuncorp.comMember of Welspun Group | www.welspun.com

1
NOTICE is hereby given that the 23rd Annual General Meeting of Welspun Corp Limited will be held on Tuesday, August 14, 2018 at the Registered Office of the Company at Welspun City, Village Versamedi, Taluka- Anjar, Dist. Kutch, Gujarat – 370 110 at 2:30 pm to transact the following businesses:
ORDINARY BUSINESS:1) To receive, consider and adopt the financial
statements for the financial year ended March 31, 2018 and the reports of the Board of Directors and the Auditors thereon.
2) To consider declaration of dividend on Equity Shares.
3) To appoint a director in place of Mr. Balkrishan Goenka (DIN: 00270175), who retires by rotation, and being eligible, offers himself for re-appointment.
4) To appoint a director in place of Mr. Rajesh Mandawewala (DIN: 00007179), who retires by rotation, and being eligible, offers himself for re-appointment.
5) To consider and, if thought fit, to pass the following resolution as an Ordinary Resolution.
“RESOLVED THAT subject to the provisions of Section 139 and other applicable provisions, if any, of the Companies Act, 2013, read with Rule 3(7) of the Companies (Audit and Auditors) Rules, 2014 (including any statutory modification(s) or re-enactment thereof for the time being in force), the Company hereby ratifies the appointment of M/s. Price Waterhouse Chartered Accountants LLP, Chartered Accountants (Firm Registration Number with the Institute of Chartered Accountants of India - 012754N/N500016), as the Statutory Auditors of the Company to hold office from the conclusion of this Annual General Meeting until the conclusion of the next Annual General Meeting to be held for the financial year 2018-19 on such remuneration as may be determined by the Board of Directors.”
SPECIAL BUSINESS:6) To consider and, if thought fit, to pass the
following resolution as an Ordinary Resolution:
“RESOLVED THAT pursuant to the provisions of Section 152, 161 and any other applicable provisions of the Companies Act, 2013 and the rules made thereunder, Mr. Vipul Mathur (holding DIN
0007990476), who was appointed as an Additional Director of the Company by the Board of Directors at its meeting held on November 6, 2011 and who holds office up to the date of this Annual General Meeting and in respect of whom the Company has received a notice in writing from a member proposing the candidature of Mr. Mathur for the office of the Director of the Company, be and is hereby elected and appointed as a Director, whose period of office shall be liable to determination by retirement of directors by rotation.
RESOLVED FURTHER THAT the Board, be and is hereby authorized to do all such acts, deeds, matters and things as may be considered necessary, desirable, or expedient for the purpose of giving effect to this Resolution.”
7) To consider and, if thought fit, to pass the following resolution as a Special Resolution:
“RESOLVED THAT pursuant to the provisions of Sections 196, 197, 198, Schedule V and all other applicable provisions of the Companies Act, 2013 and the Companies (Appointment and Remuneration of Managerial Personnel) Rules, 2014, including any statutory modification(s) or re-enactment(s) thereof for the time being in force, the relevant provisions of the Articles of Association of the Company and all applicable guidelines issued by the Central Government from time to time and subject to such other approvals, consents, sanctions as may be required under the Act or otherwise and based on the recommendation of the Nomination and Remuneration Committee, approval of the members be and is hereby accorded for appointment of Mr. Vipul Mathur (holding DIN 0007990476) as the Managing Director & Chief Executive Officer of the Company on the terms and conditions given below:
• Tenure: December 1, 2017 to November 30, 2022. Either party may terminate the appointment by giving one month’s notice in writing to the other. Shall be liable to retire by rotation.
• Remuneration: Fixed for a period of three years, subject to annual revision as may be recommended by the Nomination and Remuneration Committee and approved by and the Board commensurate to the Financial performance of the Company and benchmarking as per market practices:
NOTICECIN : L27100GJ1995PLC025609
Registered Office : Welspun City, Village Versamedi, Taluka Anjar, Dist. Kutch, Gujarat, Pin – 370110, India.
Board No.: +91 2836 662079, Fax No. + 91 2836 279060.
Email : [email protected] Website: www.welspuncorp.com
Corporate Office : Welspun House, 7th Floor, Kamala City, Senapati Bapat Marg, Lower Parel (West),
Mumbai – 400013. Board : +91 -22-66136000 Fax: +91-22-2490 8020

2
Fixed: Rs. 400 lacs Variable: Rs. 50 lacs Other Benefits: As per the Company’s policy.
The above remuneration is subject to provisions of applicable tax laws.
RESOLVED FURTHER THAT the aforesaid remuneration shall be payable irrespective of whether the Company has adequate profits or not.
RESOLVED FURTHER THAT the Board of Directors (hereinafter referred to as “the Board” which term shall be deemed to include any Committee, including the Nomination and Remuneration Committee which may exercise its powers, including the powers, conferred by this resolution) be and is hereby authorized to vary, alter, increase, enhance or widen the scope of the remuneration including payment of annual increment as they may deem fit in the interest of the Company.
RESOLVED FURTHER THAT the Board be and is hereby authorized to enter into an agreement /issue a letter for increase in remuneration and to do all such acts, deeds, matters and things as may be considered necessary, desirable or expedient for the purpose of giving effect to this Resolution.”
8) To consider and, if thought fit, to pass the following resolution as an Ordinary Resolution:
“RESOLVED THAT pursuant to the provisions of Section 152, 161 and any other applicable provisions of the Companies Act, 2013 and the rules made thereunder, Mr. S.Krishnan (holding DIN 06829167), who was appointed as an Additional Director of the Company by the Board of Directors at its meeting held on November 6, 2011 and who holds office up to the date of this Annual General Meeting and in respect of whom the Company has received a notice in writing from a member proposing the candidature of Mr. Krishnan for the office of the Director of the Company, be and is hereby elected and appointed as a Director, whose period of office shall be liable to determination by retirement of directors by rotation.
RESOLVED FURTHER THAT the Board, be and is hereby authorized to do all such acts, deeds, matters and things as may be considered necessary, desirable, or expedient for the purpose of giving effect to this Resolution.”
9) To consider and, if thought fit, to pass the following resolution as a Special Resolution:
“RESOLVED THAT pursuant to the provisions of Sections 196, 197, 198, Schedule V and all other applicable provisions of the Companies Act, 2013 and the Companies (Appointment and Remuneration of Managerial Personnel) Rules, 2014, including any statutory modification(s) or re-enactment(s) thereof for the time being in force, the relevant provisions of the Articles of Association of the Company and all applicable guidelines issued by the Central Government from time to time and subject to such other approvals, consents, sanctions as may be required under the Act or otherwise and based on the recommendation of the Nomination and Remuneration Committee, approval of the members be and is hereby accorded for appointment of Mr. S. Krishnan (holding DIN 06829167), as the Executive Director & Chief Executive Officer (Plate and Coil Mill Division) of the Company on the terms and conditions given below:
• Tenure: December 1, 2017 to November 30, 2022. Either party may terminate the appointment by giving one month’s notice in writing to the other. Shall be liable to retire by rotation.
• Remuneration: Fixed for a period of three years, subject to annual revision as may be recommended by the Nomination and Remuneration Committee and approved by and the Board commensurate to the Financial performance of the Company and benchmarking as per market practices:
Fixed: Rs. 275 lacs Variable: Rs. 25 lacs Other Benefits: As per the Company’s policy.
The above remuneration is subject to provisions of applicable tax laws.
RESOLVED FURTHER THAT the aforesaid remuneration shall be payable irrespective of whether the Company has adequate profits or not.
RESOLVED FURTHER THAT the Board of Directors (hereinafter referred to as “the Board” which term shall be deemed to include any Committee, including the Nomination and Remuneration Committee which may exercise its powers,

3
including the powers, conferred by this resolution) be and is hereby authorized to vary, alter, increase, enhance or widen the scope of the remuneration including payment of annual increment as they may deem fit in the interest of the Company.
RESOLVED FURTHER THAT the Board be and is hereby authorized to enter into an agreement /issue a letter for increase in remuneration and to do all such acts, deeds, matters and things as may be considered necessary, desirable or expedient for the purpose of giving effect to this Resolution.”
10) To consider and, if thought fit, to pass the following resolution as an Ordinary Resolution:
“RESOLVED THAT pursuant to Section 148 of the Companies Act, 2013 read with Rule 14 of the Companies (Audit and Auditors) Rules, 2014, the Company hereby ratifies remuneration of Rs. 7.00 lac (Rupees Seven Lac Only) per annum and such travelling and out-of-pocket expenses as may be approved by the Board to M/s. Kiran J. Mehta & Co., Cost Accountants for conducting audit of cost accounting records maintained by the Company for the financial year commencing on April 1, 2018.
RESOLVED FURTHER THAT the Board of Directors of the Company be and is hereby authorized to do all acts and take all such steps as may be necessary, proper or expedient to give effect to this resolution.”
11) To consider and, if thought fit, to pass the following resolution as a Special Resolution:
“RESOLVED THAT pursuant to the provisions of Sections 42 and 71 of the Companies Act, 2013 (“the Act”) read with the Companies (Prospectus and Allotment of Securities) Rules, 2014 and all other applicable provisions of the Act and the Rules framed thereunder, as may be applicable, and other applicable guidelines and regulations issued by the Securities and Exchange Board of India (“SEBI”) or any other law for the time being
in force (including any statutory modification(s) or amendment thereto or re-enactment thereof for the time being in force) and in terms of the Articles of Association of the Company, approval of the members of the Company be accorded to the Board of Directors of the Company (hereinafter referred to as “the Board” which term shall be deemed to include any Committee thereof) to borrow from time to time, by way of issuing securities including but not limited to secured/unsecured, redeemable, Non-Convertible Debentures (NCDs) / and/or Commercial Papers (CPs) to be issued on Private Placement basis, in domestic and/or international market, in one or more series/tranches aggregating up to an amount not exceeding Rs. 700 crores (Rupees Seven Hundred crores only) issuable / redeemable at discount / par/ premium, under one or more shelf disclosure documents, during the period of 1 (one) year from the date of this Annual General Meeting, on such terms and conditions as the Board may, from time to time, determine and consider proper and most beneficial to the Company including as to when the said NCDs / CPs be issued, the consideration for the issue, utilization of the issue proceeds and all matters connected with or incidental thereto; provided that the said borrowing shall be within the overall borrowing limits of the Company.
RESOLVED FURTHER THAT approval of the members be accorded to the Board of the Company to do all such acts, deeds, matters and things and to take all such steps as may be required in this connection including seeking all necessary approvals to give effect to this Resolution and to settle any questions, difficulties or doubts that may arise in this regard.
By Order of the Board
Place:Mumbai Date: June 8, 2018
Pradeep Joshi Company Secretary FCS-4959

4
1. Item No. 3 - Re-appointment of Mr. Balkrishan Goenka.
Mr. Goenka being one of the promoters of the Company is also a Chairman of Welspun Group from its inception. He is a prime architect of the Welspun Group. For over 30 years, Mr. Goenka with his strong business acumen and risk-taking abilities is credited to have successfully steered the Welspun Group in many high-growth sectors. He has a vision to make Welspun one of the most respected Groups in the world by creating world-class companies that consistently sets industry benchmarks.
Details of directorship /membership of the Committees of the Board of other bodies corporate:He is also a director in following bodies corporate - Welspun India Limited, Welspun Enterprises Limited, Welspun Steel Limited, Welspun Wasco Coatings Private Limited, Welspun Logistics Limited, Welspun Global Brands Limited, Adani Welspun Exploration Limited, Rank Marketing LLP, Welspun Pipes Inc., Welspun Tubular LLC, Welspun Global Trade LLC, Welspun Middle East Pipe Coatings Company LLC, Welspun Middle East Pipe Company LLC and Welspun Home Textiles UK Limited.
He is a member / chairman in the following Committees: 1) Welspun Corp Limited : Corporate Social Responsibility Committee – Member, Finance and Administration Committee – Member, International Trade Practices & Governance Committee – Chairman, Budget Committee – Chairman, Share Transfer & Investor Grievance & Stakeholders Committee – Member; (2) Welspun India Limited : Finance and Administration Committee – Chairman, Share Transfer & Investor Grievance & Stakeholders Committee – Member; (3) Welspun Steel Limited : Finance Committee – Member, CSR Committee – Member; and (4) Welspun Enterprises Limited : Nomination and Remuneration Committee – Member, Finance and Administration Committee – Member, and Budget Committee – Chairman.
He is holding 140 equity shares in the Company.
Except Mr. Goenka, being the appointee herein and his spouse Mrs. Dipali Goenka who is also a member in the Company, none of the key managerial personnel or directors of the Company or their relatives may be
deemed to be concerned or interested, financially or otherwise, in this resolution.
Members’ approval is sought by way of ordinary resolution proposed under Item no. 3 of the accompanying Notice.
2. Item No. 4 - Re-appointment of Mr. Rajesh Mandawewala.
Mr. Rajesh R. Mandawewala as a key business leader at the Welspun Group has enabled the organization’s expansion and global reach. A Chartered Accountant by profession, Mr. Mandawewala has a rich experience of over 30 years in industries varying from textiles to SAW pipes. He strongly believes in driving innovation through continuous research and product developments, catering to the current and future needs of customers.
Details of directorship /membership of the Committees of the Board of other bodies corporateHe is also a director in following bodies corporate - Welspun India Limited, AYM Syntex Limited, Welspun Enterprises Limited, Welspun Global Brands Limited, Welspun Steel Limited, Alspun Infrastructure Limited, Mandawewala Enterprises Limited, Angel Power and Steel Private Limited, Connective Infrastructure Private Limited, RRM Reality Trader Private Limited, Rank Marketing LLP, Welspun Pipes Inc., Welspun Tubular LLC, Welspun Global Trade LLC and Welspun Holdings Private Limited.
He is a member / chairman in the following Committees:1) Welspun Corp Limited : Corporate Social Responsibility Committee – Member, Finance and Administration Committee – Member, International Trade Practices & Governance Committee – Member, Budget Committee – Member, Share Transfer & Investor Grievance & Stakeholders Committee – Member (2) Welspun India Limited : Finance and Administration Committee – Member, Share Transfer & Investor Grievance & Stakeholders Committee – Member, Corporate Social Responsibility Committee – Member (3) W e l s p u n Enterprises Limited: Finance and Administration Committee – Member, Budget Committee – Member, Corporate Social Responsibility Committee – Member, International Trade Practices & Governance Committee – Member (4) AYM Syntex Limited: Corporate
EXPLANATORY STATEMENT AS REQUIRED UNDER SECTION 102 OF THE COMPANIES ACT, 2013 AND THE INFORMATION AS REQUIRED PURSUANT TO THE SEBI (LISTING OBLIGATIONS AND
DISCLOSURE REQUIREMENTS) REGULATIONS, 2015.

5
Social Responsibility Committee – Member, Share Transfer & Investor Grievance & Stakeholders – Member, Nomination & Remuneration Committee – Member, Finance and Administration Committee – Chairman (5) Welspun Steel Limited: Corporate Social Responsibility – Member, Nomination and Remuneration Committee - Chairman and (6) Welspun Global Brands Limited: Finance and Administration Committee – Member, Corporate Social Responsibility Committee – Member.
He is holding 200 equity shares in the Company.
Except Mr. Mandawewala, being the appointee herein, none of the key managerial personnel or directors of the Company or their relatives may be deemed to be concerned or interested, financially or otherwise, in this resolution.
Members’ approval is sought by way of ordinary resolution proposed under Item no. 4 of the accompanying Notice.
3. Item No. 6 & 7 – Appointment of Mr. Vipul Mathur
The Board of Directors of the Company at its meeting held on November 6, 2017 (based on a recommendation of the Nomination and Remuneration Committee) has appointed Mr. Vipul Mathur (holding DIN 0007990476) as the Managing Director and Chief Executive Officer of the Company w.e.f. December 1, 2017 to November 30, 2022 at a remuneration mentioned in the resolution No. 7, subject to necessary approvals as required under the Act or otherwise.
Relevant Details pursuant to Regulation 36(3) of SEBI (Listing Obligations and Disclosure Requirements) Regulations, 2015.
Name Mr. Vipul Mathur
Date of Birth 21.03.1970
Date of Appointment 01.12.2017
Qualifications Science Graduate, Post Graduate (MBA-Marketing)
Nature of his expertise in specific functional areas
Rich experience in the field of marketing of heavy engineering, pipes & plates in Oil & Gas segment. Apart from that, excellent managerial experience in varied functions like: - product development, inventory management, contract & tendering, HR, commercial, legal & procurement.
Disclosure of relationships with other Directors and Key Managerial Personnel
None
Names of companies in which the person also holds the directorship
Non-Executive Director in : Welspun Middle East, DMCC@
Welspun Middle East Pipes LLC*, Welspun Middle East Pipes Coating LLC*, Whole-time Director (not drawing any remuneration) in : Welspun Wasco Coatings Private Limited#
Chairman/Member of the Committee of the Board of directors
None
Names of companies and committees, of its Boards, in which the person holds membership
None
No. of shares held in the Company 11,000
No. of Board meetings attended Two. Only Two meetings held since his appointment.
@ subsidiary of the Company in United Arab Emirates
*subsidiary of the Company in Kingdom of Saudi Arabia.
# subsidiary of the Company in India.

6
Relevant details pursuant to the Companies Act, 2013.
Sr. Particulars
I. General Information
(1) Nature of Industry Manufacturing of Steel Plates and Coils, Pipes and Coating of pipes.
(2) Date of commencement of business of the Company
May 12, 1995
(3) Financial performance of the Company based on given indicators (Standalone)
Rs. in million except EPS
Particulars 2018* 2017* 2016 2015Total Income 53,901.15 46,956.24 39,138.07 50,963.75
Profit /(Loss) After Tax 1,258.18 1,746.01 (933.62) (157.06)
Equity Share Capital 1,326.13 1,326.13 1,326.13 1,315.88
Reserves and Surplus 17,819.83 16,671.84 17,028.51 17,378.73
Earning/ Per Equity Share (EPS) (Basic) Rs.
4.74 6.58 (3.54) (0.60)
* as per IND-AS(4) Foreign Investment or
collaborations
The Company is a listed company and as on March 31, 2018 the foreign equity share holdings in the Company were 68,970,504 (26%). The Company has made investment in the subsidiaries, joint-ventures in United States of America, Kingdom of Saudi Arabia, United Arab Emirates and Mauritius. The value of total investments as per the latest audited financial statements as at March 31, 2018 is Rs. 1,827.51 million.
II. Information about the Appointee
(1) Background details Mr. Mathur has rich industry experience and excellent managerial skills, leadership quality. Before joining the Company, he has worked for over 11 years as marketing executive with various corporate groups operating in the field of heavy electrical equipment, manufacturing of pipes, Oil & gas etc.
(2) Past Remuneration Rs. 39.34 million
(3) Recognition / Awards -
(4) Job profile and his suitability
Mr. Mathur has rich experience and excellent managerial skills, leadership quality, etc. this makes him suitable for spearheading the Company’s business.
(5) Remuneration proposed As mentioned in the text of the resolution no. 7
(6) Comparative remuneration profile with respect to industry, size of the Company, profile of the position and person (in case of expatriates the relevant details would be with respect to the country of his origin)
Considering the size of the Company’s turnover, the remuneration proposed is comparable with the similar position in the industry.
(7) Pecuniary relationship directly or indirectly with the Company, or relationship with the managerial personnel, if any.
No
III (1)Reason for loss or inadequate profit
Not Applicable
(2)Steps taken or proposed to be taken for improvement
Not Applicable
(3) Expected increase in productivity and profits in measurable terms
Not Applicable

7
Except Mr. Mathur, being the appointee herein, none of the key managerial personnel or directors of the Company or their relatives may be deemed to be concerned or interested, financially or otherwise, in the resolutions at Item Nos. 6 & 7.
Members’ approval is sought by way of ordinary resolution proposed under Item no. 6 and special resolution proposed under Item No. 7 of the accompanying Notice.
4. Item No. 8 & 9 – Appointment of Mr. S.Krishnan
The Board of Directors of the Company at its meeting
held on November 6, 2017 (based on a recommendation of the Nomination and Remuneration Committee) has appointed Mr. S.Krishnan (holding DIN 06829167)- CFO of the Company, as the Executive Director and Chief Executive Officer (Plate and Coil Mill Division) of the Company w.e.f. December 1, 2017 to November 30, 2022 at a remuneration mentioned in the resolution No. 9, subject to necessary approvals as required under the Act or otherwise.
Mr. Krishnan stepped down from the position of the Chief Financial Officer with effect from June 11, 2018 retaining position of the Executive Director and Chief Executive Officer (PCMD) only.
Relevant Details pursuant to Regulation 36(3) of SEBI (Listing Obligations and Disclosure Requirements) Regulations, 2015.
Name Mr. S.Krishnan
Date of Birth 17.07.1962
Date of Appointment 01.12.2017
Qualifications M.Com, A.C.A, A.C.S, A.I.C.W.A, LL. B. – Part 1
Nature of his expertise in specific functional areas
Mr. Krishnan has experience in global finance function, global investor relation and business development. In addition, he has expertise in internal control, auditing, project management, mergers & acquisitions, contract manufacturing, product supply & marketing.
Disclosure of relationships with other Directors and Key Managerial Personnel
None
Names of companies in which the person also holds the directorship
Non-Executive Director in : Welspun Middle East, DMCC@
Welspun Mauritius Holdings Limited$
Welspun Middle East Pipes LLC*, Welspun Middle East Pipes Coating LLC* Whole-time Director (not drawing any remuneration) in : Welspun Tradings Limited#
Chairman/Member of the Committee of the Board of directors
None
Names of companies and committees, of its Boards, in which the person holds membership
None
No. of shares held in the Company 12,000
No. of Board meetings attended Two. Only two meetings held since his appointment.
@ subsidiary of the Company in United Arab Emirates
$ subsidiary of the Company in Mauritius
*subsidiary of the Company in Kingdom of Saudi Arabia.
# subsidiary of the Company in India.

8
Relevant details pursuant to the Companies Act, 2013.
Sr. Particulars
I. General Information
(1) Nature of Industry Manufacturing of Steel Plates and Coils, Pipes and Coating of pipes.
(2) Date of commencement of business of the Company May 12, 1995
(3) Financial performance of the Company based on given indicators (Standalone)
Rs. in million except EPS
Particulars 2018* 2017* 2016 2015
Total Income 53,901.15 46,956.24 39,138.07 50,963.75
Profit /(Loss) After Tax 1,258.18 1,746.01 (933.62) (157.06)
Equity Share Capital 1,326.13 1,326.13 1,326.13 1,315.88
Reserves and Surplus 17,819.83 16,671.84 17,028.51 17,378.73
Earning/ Per Equity Share (EPS) (Basic) Rs.
4.74 6.58 (3.54) (0.60)
* as per IND-AS(4) Foreign Investment or
collaborationsThe Company is a listed company and as on March 31, 2018 the foreign equity share holdings in the Company were 68,970,504 (26%). The Company has made investment in the subsidiaries, joint-ventures in United States of America, Kingdom of Saudi Arabia, United Arab Emirates and Mauritius. The value of total investments as per the latest audited financial statements as at March 31, 2018 is Rs. 1,827.51 million.
II. Information about the Appointee
(1) Background details Mr. Krishnan has ~ 34 years of experience.Before joining the Company, he has worked for over 29 years holding various key positions such as Chief Financial Officer, Whole Time Director, Managing Director with various corporate groups operating in the field of engineering, biotech and chemicals, etc.
(2) Past Remuneration Rs. 27.14 million
(3) Recognition / Awards -
(4) Job profile and his suitability
Joined the Company in 2013 as the CFO, Mr. Krishnan was entrusted with additional responsibilities of leading the Plate & Coil Mill Division of the Company, owing to his excellent track record and business acumen. With 3 decades of experience in the finance domain under his belt, Mr. Krishnan has led various financial & other restructuring in the Company, including reduction of debts, overseas fund raising, streamlining various processes, revamping Plate & Coil Mill Division operations etcMr. Krishnan has undertaken several initiatives to increase the efficiency in terms of decision making, bringing in transparency, up-gradation of systems, compliances, internal financial controls, risk mitigation measures, disclosures and relationship with Bank and Rating agencies. He has enabled to create an institution with a culture of stakeholder-centricity, innovation, collaboration, inclusive growth & an ability to take risk. The above experience and qualities makes him suitable for the position of the Executive Director & CEO (Plate & Coil Mill Division).
(5) Remuneration proposed As mentioned in the text of the resolution no. 9.
(6) Comparative remuneration profile with respect to industry, size of the Company, profile of the position and person (in case of expatriates the relevant details would be with respect to the country of his origin)
Considering the size of the Company’s turnover, the remuneration proposed is comparable with the similar position in the industry.
(7) Pecuniary relationship directly or indirectly with the Company, or relationship with the managerial personnel, if any.
No
III (1) Reason for loss or inadequate profit
Not Applicable

9
Except Mr. Krishnan, being the appointee herein, none of the key managerial personnel or directors of the Company or their relatives may be deemed to be concerned or interested, financially or otherwise, in the resolutions at Item Nos. 8 & 9.
Members’ approval is sought by way of ordinary resolution proposed under Item no. 8 and special resolution proposed under Item No. 9 of the accompanying Notice.
5. Item No. 10 – Ratification of payment of remuneration to the Cost Auditors
Members are hereby informed that pursuant to the recommendation of the Audit Committee, the Board of Directors appointed M/s. Kiran J. Mehta & Co., Cost Accountants as cost auditors of the Company for the financial year ending March 31, 2019, for conduct of the Cost Audit of the Company in terms of the requirements under applicable laws at a remuneration as mentioned in the resolution No. 10 of the Notice.
Pursuant to Rule 14 of the Companies (Audit and Auditors) Rules, 2014, the remuneration proposed to be paid to the Cost Auditor is required to be ratified by the members.
None of the key managerial personnel or directors of the Company or their relatives may be deemed to be concerned or interested, financially or otherwise, in the resolution at Item No. 10.
Members’ approval is sought by way of ordinary resolution proposed under Item no. 10 of the accompanying Notice.
6. Item No. 11 – Private Placement of Securities.In terms of section 42 of the Companies Act, 2013 read with Rule 14 of the Companies (Prospectus and Allotment of Securities) Rules, 2014 (the Rules), a Company shall not make Private Placement of its Securities unless the proposed offer of Securities or invitation to subscribe to Securities has been previously approved by the members of the Company by a Special Resolution. In case of an offer or invitation for offer of Non-Convertible Debentures (NCDs) and/or Commercial Papers (CPs) the Company can pass a Special Resolution once in a year for all the offers or invitations to be made for such NCDs / CPs during the year.
Sr. Particulars
(2) Steps taken or proposed to be taken for improvement
Not Applicable
(3) Expected increase in productivity and profits in measurable terms
Not Applicable
In order to recoup the high cost debt prepaid by the Company, to support any project specific requirements of the Company and for meeting long term working capital requirements of the Company, the Company may offer or invite subscription for securities including but not limited to secured/unsecured redeemable, Non-Convertible Debentures, Commercial Papers in one or more series/ tranches on private placement, issuable/redeemable at discount/par/premium.
The Company seeks to pass an enabling resolution to borrow funds from time to time by offer of securities including but not limited to Non-Convertible Debentures / Commercial Papers for an amount not exceeding Rs. 700 crores (Rupees Seven Hundred Crores only), at a discount or at par or at a premium and at such interest as may be appropriate considering the prevailing money market conditions at the time of the borrowing.The borrowing limit (apart from temporary loans obtained from the Company’s bankers in the ordinary course of business) approved by the members vide the resolution dated September 11, 2014 is “Paid-up capital and free reserves plus Rs.2,500 Crore (Rupees Two Thousand Five Hundred Crore Only).” As on March 31, 2018, the aggregate of the paid-up capital and free reserves of the Company stood at Rs. 1,731.40 crores and the Company had outstanding long term borrowings of Rs. 696.09 crores. Hence, the approval sought for offer of securities including but not limited to Non-Convertible Debentures/Commercial Paper, shall be within the overall borrowing limits of the Company.
None of the key managerial personnel or directors of the Company or their relatives may be deemed to be concerned or interested, financially or otherwise, in the resolution at Item No. 11.
Members’ approval is sought by way of special resolution proposed under Item no. 11 of the accompanying Notice.
By Order of the Board
Place: Mumbai Date: June 8, 2018
Pradeep Joshi Company Secretary FCS-4959

10
NOTES1. A MEMBER ENTITLED TO ATTEND AND VOTE IS
ENTITLED TO APPOINT ONE OR MORE PROXIES TO ATTEND AND VOTE INSTEAD OF HIMSELF AND A PROXY NEED NOT BE A MEMBER OF THE COMPANY. Proxies, in order to be effective, should be duly stamped, completed, signed and deposited at the Registered Office of the Company not less than 48 hours before the Meeting.
2. Proxy shall not have the right to speak and shall not be entitled to vote except on a poll.
3. A proxy can act on behalf of such number of member or members not exceeding 50 and holding in aggregate not more than 10% of the total share capital of the Company. Provided that a member holding more than 10%, of the total share capital of the Company carrying voting rights may appoint a single person as proxy and such person shall not act as proxy for any other person or member.
4. The Register of Members and Share Transfer Books of the Company will remain closed from Wednesday, June 27, 2018 to Friday, June 29, 2018 (both days inclusive) for the purpose of determination of members entitled to dividend for the year ended March 31, 2018.
5. All the correspondence pertaining to shareholding, transfer of shares, transmission etc. should be lodged at the Company’s Share Registrar and Transfer Agent : Link Intime India Private Ltd., Unit: Welspun Corp Limited, C 101, 247 Park, L B S Marg, Vikhroli (West) Mumbai-400 083. Tel No: +91 22 49186000, Fax: +91 22 49186060, [email protected];
6. Members are requested to immediately inform about their change of address, change of e-mail address or consolidation of folios, if any, to the Company’s Share Registrar and Transfer Agent.
7. As a part of the Green Initiatives by the Ministry of Corporate Affairs, the Notice and Annual Report of the Company is being sent to the members at their respective e-mail addresses registered with the Company. Those members who have not got their email address registered or wish to update a fresh email address may do so by submitting the attached E-mail Registration-Cum Consent Form to the Company or the Registrar and Transfer
Agent of the Company consenting to send the Annual Report and other documents in electronic form at the said e-mail address.
However, members requiring a physical copy of the Annual Report and Notice may write to the Company at the Corporate Office at 5th Floor, Welspun House, Kamala Mills Compound, Senapati Bapat Marg, Lower Parel, Mumbai - 400 013. The Annual Report along with the Notice of the Annual General Meeting is available on the website of the Company, www.welspuncorp.com.
8. The physical copies of the Annual Report and other documents referred to in the Notice will be available at the Company’s Registered Office for inspection during normal business hours on working days till the date of the meeting and during the meeting and copies thereof shall also be available at the Corporate Office of the Company.
9. The members who wish to nominate, any person to whom his securities shall vest in the event of his death may do so by submitting the attached nomination Form to the Company or the Registrar and Transfer Agent of the Company. A nomination may be cancelled, or varied by nominating any other person in place of the present nominee, by the holder of securities who has made the nomination, by giving a notice of such cancellation or variation.
10. Voting through electronic means I. In compliance with provisions of Section 108
of the Companies Act, 2013, Rule 20 of the Companies (Management and Administration) Rules, 2014 as amended from time to time and Regulation 44 of the SEBI (Listing Obligations and Disclosure Requirements) Regulations, 2015, the Company is pleased to provide to the members, a facility to exercise their right to vote on resolutions proposed to be considered at the General Meeting by electronic means and the business may be transacted through e-Voting Services. The facility of casting the votes by the members using an electronic voting system from a place other than venue of the General Meeting (“remote e-voting”) will be provided by National Securities Depository Limited (NSDL).
II. The facility for voting through ballot paper shall be made available at the General Meeting and
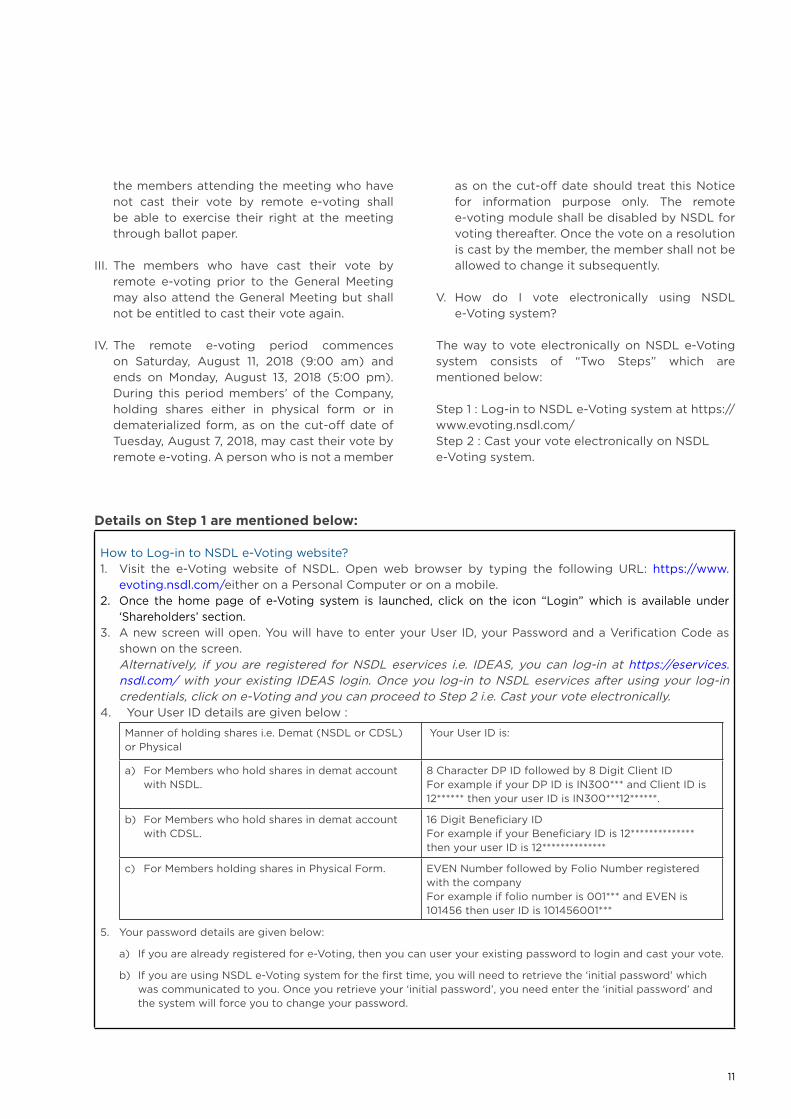
11
the members attending the meeting who have not cast their vote by remote e-voting shall be able to exercise their right at the meeting through ballot paper.
III. The members who have cast their vote by remote e-voting prior to the General Meeting may also attend the General Meeting but shall not be entitled to cast their vote again.
IV. The remote e-voting period commences on Saturday, August 11, 2018 (9:00 am) and ends on Monday, August 13, 2018 (5:00 pm). During this period members’ of the Company, holding shares either in physical form or in dematerialized form, as on the cut-off date of Tuesday, August 7, 2018, may cast their vote by remote e-voting. A person who is not a member
as on the cut-off date should treat this Notice for information purpose only. The remote e-voting module shall be disabled by NSDL for voting thereafter. Once the vote on a resolution is cast by the member, the member shall not be allowed to change it subsequently.
V. How do I vote electronically using NSDL e-Voting system?
The way to vote electronically on NSDL e-Voting system consists of “Two Steps” which are mentioned below:
Step 1 : Log-in to NSDL e-Voting system at https://www.evoting.nsdl.com/ Step 2 : Cast your vote electronically on NSDL e-Voting system.
Details on Step 1 are mentioned below:
How to Log-in to NSDL e-Voting website?1. Visit the e-Voting website of NSDL. Open web browser by typing the following URL: https://www.
evoting.nsdl.com/either on a Personal Computer or on a mobile.2. Once the home page of e-Voting system is launched, click on the icon “Login” which is available under
‘Shareholders’ section.3. A new screen will open. You will have to enter your User ID, your Password and a Verification Code as
shown on the screen. Alternatively, if you are registered for NSDL eservices i.e. IDEAS, you can log-in at https://eservices.
nsdl.com/ with your existing IDEAS login. Once you log-in to NSDL eservices after using your log-in credentials, click on e-Voting and you can proceed to Step 2 i.e. Cast your vote electronically.
4. Your User ID details are given below :
Manner of holding shares i.e. Demat (NSDL or CDSL) or Physical
Your User ID is:
a) For Members who hold shares in demat account with NSDL.
8 Character DP ID followed by 8 Digit Client ID For example if your DP ID is IN300*** and Client ID is 12****** then your user ID is IN300***12******.
b) For Members who hold shares in demat account with CDSL.
16 Digit Beneficiary ID For example if your Beneficiary ID is 12************** then your user ID is 12**************
c) For Members holding shares in Physical Form. EVEN Number followed by Folio Number registered with the company For example if folio number is 001*** and EVEN is 101456 then user ID is 101456001***
5. Your password details are given below:
a) If you are already registered for e-Voting, then you can user your existing password to login and cast your vote.
b) If you are using NSDL e-Voting system for the first time, you will need to retrieve the ‘initial password’ which was communicated to you. Once you retrieve your ‘initial password’, you need enter the ‘initial password’ and the system will force you to change your password.

12
General Guidelines for shareholders1 Institutional shareholders (i.e. other than
individuals, HUF, NRI etc.) are required to send scanned copy (PDF/JPG Format) of the relevant Board Resolution/ Authority letter etc. with attested specimen signature of the duly authorized signatory(ies) who are authorized to vote, to the Scrutinizer by e-mail to [email protected] with a copy marked to [email protected].
2. It is strongly recommended not to share your password with any other person and take utmost care to keep your password confidential. Login to the e-voting website will be disabled upon five unsuccessful attempts to key in the correct password. In such an event, you will need to go through the “Forgot User Details/Password?” or “Physical User Reset Password?” option available on www.evoting.nsdl.com to reset the password.
3. In case of any queries, you may refer the Frequently Asked Questions (FAQs) for Shareholders and e-voting user manual for Shareholders available at the download section of www.evoting.nsdl.com or call on toll free no.: 1800-222-990 or send a request at [email protected]
VI. You can also update your mobile number and e-mail id in the user profile details of the folio which may be used for sending future communication(s).
VII. The voting rights of members shall be in proportion to their shares of the paid up equity share capital
c) How to retrieve your ‘initial password’?
i) If your email ID is registered in your demat account or with the Company, your ‘initial password’ is communicated to you on your email ID. Trace the email sent to you from NSDL from your mailbox. Open the email and open the attachment i.e. a .pdf file. Open the .pdf file. The password to open the .pdf file is your 8 digit client ID for NSDL account, last 8 digits of client ID for CDSL account or folio number for shares held in physical form. The .pdf file contains your ‘User ID’ and your ‘initial password’.
ii) If your email ID is not registered, your ‘initial password’ is communicated to you on your postal address.
6. If you are unable to retrieve or have not received the “ initial password” or have forgotten your password:
a). Click on “Forgot User Details/Password?”(If you are holding shares in your demat account with NSDL or CDSL) option available on www.evoting.nsdl.com.
b). Physical User Reset Password?” (If you are holding shares in physical mode) option available on www.evoting.nsdl. com.
c). If you are still unable to get the password by aforesaid two options, you can send a request at [email protected] mentioning your demat account number/folio number, your PAN,your name and your registered address.
7. After entering your password, tick on Agree to “Terms and Conditions” by selecting on the check box.
8. Now, you will have to click on “Login” button.
9. After you click on the “Login” button, Home page of e-Voting will open.
Details on Step 2 is given below: How to cast your vote electronically on
NSDL e-Voting system?1. After successful login at Step 1, you will be able to
see the Home page of e-Voting. Click on e-Voting. Then, click on Active Voting Cycles.
2. After click on Active Voting Cycles, you will be able to see all the companies “EVEN” in which you are holding shares and whose voting cycle is in active status.
3. Select “EVEN” of the company for which you wish to cast your vote.
4. Now you are ready for e-Voting as the Voting page opens.
5. Cast your vote by selecting appropriate options i.e. assent or dissent, verify/modify the number of shares for which you wish to cast your vote and click on “Submit” and also “Confirm” when prompted.
6. Upon confirmation, the message “Vote cast successfully” will be displayed.
7. You can also take the printout of the votes cast by you by clicking on the print option on the confirmation page.
8. Once you confirm your vote on the resolution, you will not be allowed to modify your vote.

13
XII. The Chairman shall, at the General Meeting, at the end of discussion on the resolutions on which voting is to be held, allow voting with the assistance of scrutinizer, by use of “Ballot Paper” for all those members who are present at the General Meeting but have not cast their votes by availing the remote e-voting facility.
XIII. The Scrutinizer shall after the conclusion of voting at the general meeting, will first count the votes cast at the meeting and thereafter unblock the votes cast through remote e-voting in the presence of at least two witnesses not in the employment of the Company and shall make, not later than three days of the conclusion of the General Meeting, a consolidated scrutinizer’s report of the total votes cast in favour or against, if any, to the Chairman or a person authorized by him in writing, who shall countersign the same and declare the result of the voting forthwith.
XIV. The Results declared along with the report of the Scrutinizer shall be placed on the website of the Company www.welspuncorp.com, notice board of the Company at the registered office as well as the corporate office and on the website of NSDL immediately after the declaration of result by the Chairman or a person authorized by him in writing. The results shall also be immediately forwarded to the stock exchanges at which the shares of the Company are listed.
By Order of the Board
Place:Mumbai Date: June 8, 2018
Pradeep Joshi Company Secretary
of the Company as on the cut-off date of Tuesday, August 7, 2018.
VIII. Any person, who acquires shares of the Company and become member of the Company after dispatch of the notice and holding shares as of the cut-off date i.e. Tuesday, August 7, 2018, may obtain the login ID and password by sending a request at [email protected] or Issuer/RTA.
However, if you are already registered with NSDL for remote e-voting then you can use your existing user ID and password for casting your vote.
IX. Members who have opened 3-in-1 account with ICICI Group i.e. bank account and demat account with ICICI Bank Limited and trading account with ICICI Securities Limited, can access e-voting website of NSDL through their website viz.; www.icicidirect.com for the purpose of casting their votes electronically by using their existing user ID and password used for accessing the website www.icicidirect.com. In case any member is not able to login through the ICICI direct website, can access the e-voting system of NSDL by using their existing user ID and password for the e-voting system of NSDL.
X. A person, whose name is recorded in the register of members or in the register of beneficial owners maintained by the depositories as on the cut-off date only shall be entitled to avail the facility of remote e-voting as well as voting at the General Meeting through ballot paper.
XI. Mr. Mihen Halani of M/s. Mihen Halani & Associates, Company Secretaries, has been appointed as the Scrutinizer to scrutinize the voting and remote e-voting process in a fair and transparent manner.

14
This spac
e is In
tent
iona
lly k
ept B
lank

15
PROXY FORM(Pursuant to Section 105(6) of the Companies Act, 2013 and Rule 19(3) of the Companies
(Management and Administration) Rules, 2014CIN : L27100GJ1995PLC025609
Name of the Company: WELSPUN CORP LIMITED
Registered Office : Welspun City, Village Versamedi, Taluka Anjar, Dist. Kutch, Gujarat, Pin – 370110, India. Board No.: +91 2836 662079, Fax No. + 91 2836 279060, Email : [email protected] Website: www.welspuncorp.com
Corporate Office : Welspun House, 5th Floor, Kamala City, Senapati Bapat Marg, Lower Parel (West), Mumbai – 400013. Board : +91 -22-66136000 Fax: +91-22-2490 8020
Name of the member (s) :__________________________________________________
Registered Address :_______________________________________________________
E-mail Id:_________________________________________________________________
Folio No / Client ID
DP ID
I/ We ________________________________ being the member(s) of Equity Shares of the above named company, hereby appoint :
1. Name :_____________________________________________________________
Address : ______________________________________________________________
E-mail Id:______________________________________________________________
Signature : _____________________________________________________________; or failing him
2. Name :_____________________________________________________________
Address : ______________________________________________________________
E-mail Id:______________________________________________________________
Signature : _____________________________________________________________; or failing him
3. Name :_____________________________________________________________
Address : ______________________________________________________________
E-mail Id:______________________________________________________________
Signature : ____________________________________________________________
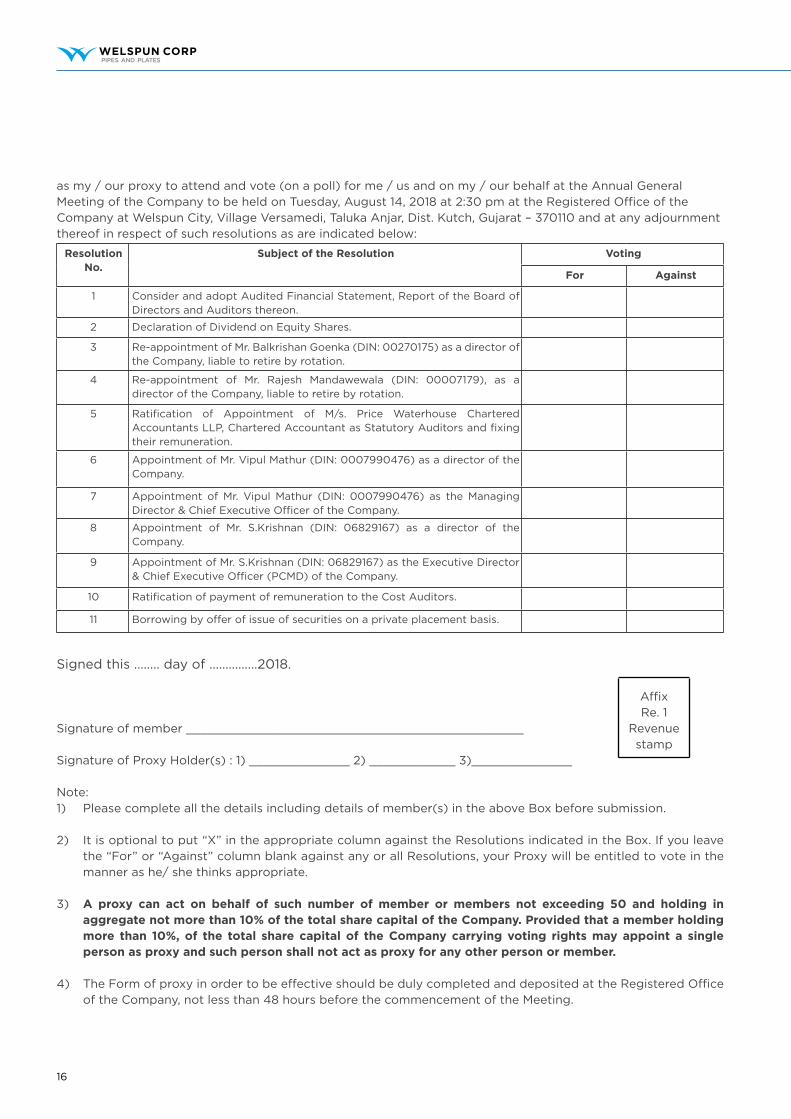
16
as my / our proxy to attend and vote (on a poll) for me / us and on my / our behalf at the Annual General Meeting of the Company to be held on Tuesday, August 14, 2018 at 2:30 pm at the Registered Office of the Company at Welspun City, Village Versamedi, Taluka Anjar, Dist. Kutch, Gujarat – 370110 and at any adjournment thereof in respect of such resolutions as are indicated below:
Resolution No.
Subject of the Resolution Voting
For Against
1 Consider and adopt Audited Financial Statement, Report of the Board of Directors and Auditors thereon.
2 Declaration of Dividend on Equity Shares.
3 Re-appointment of Mr. Balkrishan Goenka (DIN: 00270175) as a director of the Company, liable to retire by rotation.
4 Re-appointment of Mr. Rajesh Mandawewala (DIN: 00007179), as a director of the Company, liable to retire by rotation.
5 Ratification of Appointment of M/s. Price Waterhouse Chartered Accountants LLP, Chartered Accountant as Statutory Auditors and fixing their remuneration.
6 Appointment of Mr. Vipul Mathur (DIN: 0007990476) as a director of the Company.
7 Appointment of Mr. Vipul Mathur (DIN: 0007990476) as the Managing Director & Chief Executive Officer of the Company.
8 Appointment of Mr. S.Krishnan (DIN: 06829167) as a director of the Company.
9 Appointment of Mr. S.Krishnan (DIN: 06829167) as the Executive Director & Chief Executive Officer (PCMD) of the Company.
10 Ratification of payment of remuneration to the Cost Auditors.
11 Borrowing by offer of issue of securities on a private placement basis.
Signed this …….. day of ……………2018.
Signature of member _______________________________________________
Signature of Proxy Holder(s) : 1) ______________ 2) ____________ 3)______________
Note:1) Please complete all the details including details of member(s) in the above Box before submission.
2) It is optional to put “X” in the appropriate column against the Resolutions indicated in the Box. If you leave the “For” or “Against” column blank against any or all Resolutions, your Proxy will be entitled to vote in the manner as he/ she thinks appropriate.
3) A proxy can act on behalf of such number of member or members not exceeding 50 and holding in aggregate not more than 10% of the total share capital of the Company. Provided that a member holding more than 10%, of the total share capital of the Company carrying voting rights may appoint a single person as proxy and such person shall not act as proxy for any other person or member.
4) The Form of proxy in order to be effective should be duly completed and deposited at the Registered Office of the Company, not less than 48 hours before the commencement of the Meeting.
AffixRe. 1
Revenue stamp

17
WELSPUN CORP LIMITEDCIN : L27100GJ1995PLC025609
Registered Office : Welspun City, Village Versamedi, Taluka Anjar, Dist. Kutch, Gujarat, Pin – 370110, India.
Board No.: +91 2836 662079, Fax No. + 91 2836 279060.
Email : [email protected] Website: www.welspuncorp.com
Corporate Office : Welspun House, 7th Floor, Kamala City, Senapati Bapat Marg, Lower Parel (West),
Mumbai – 400013. Board : +91 -22-66136000 Fax: +91-22-2490 8020
E-mail Registration-Cum-Consent Form
To, The Company Secretary, Welspun Corp Limited, Welspun City, Village Versamedi, Taluka Anjar, Dist. Kutch, Gujarat, Pin – 370110
I/ we the member(s) of the Company do hereby request you to kindly register/ update my e-mail address with the Company. I/ We, do hereby agree and authorize the Company to send me/ us all the communications in electronic mode at the e-mail address mentioned below. Please register the below mentioned e-mail address / mobile number for sending communication through e-mail/ mobile.
Folio No. : DP – ID : Client ID :
Name of the Registered Holder (1st) :
Name of the joint holder(s) :
:
Registered Address:
Pin:
Mobile Nos. (to be registered) :
E-mail Id (to be registered) :
______________________________________________________ Signature of the member(s)*
* Signature of all the members is required in case of joint holding.

18
Form No. SH-13
Nomination Form(Pursuant to Section 72 of the Companies Act, 2013 and Rule 19(1) of the Companies
(Share Capital and Debentures) Rules 2014)
To, The Company Secretary, Welspun Corp Limited Welspun City, Village Versamedi, Taluka Anjar, Dist. Kutch, Gujarat, Pin – 370110.
I/ We_________________________________________ the holder(s) of the securities particulars of which are given hereunder wish to make nomination and do hereby nominate the following persons in whom shall vest, all the rights in respect of such securities in the event of my/our death.
1. PARTICULARS OF THE SECURITIES (in respect of which nomination is being made)
Nature of securities
Folio No. No. of Securities Certificate No. Distinctive No.
2. PARTICULARS OF NOMINEE/S (a) Name:
(b) Date of Birth: (c) Father’s/Mother’s/Spouse’s name: (d) Occupation: (e) Nationality: (f) Address: (g) E-mail id: (h) Relationship with the security holder:
3. IN CASE NOMINEE IS A MINOR (a) Date of birth:
(b) Date of attaining majority (c) Name of guardian: (d) Address of guardian:
Name:______________________________________________________
Address: ____________________________________________________
Name of the Security Holder(s)_________________________________________
Signatures:__________________________________________________________
Witness with name and address:________________________________________

19
Instructions:1. Please read the instructions given below very carefully and follow the same to the letter. If the form is not
filled as per instructions, the same will be rejected.
2. The nomination can be made by individuals only. Non individuals including society, trust, body corporate, partnership firm, Karta of Hindu Undivided Family, holder of power of attorney cannot nominate. If the Shares are held jointly all joint holders shall sign (as per the specimen registered with the Company) the nomination form.
3. A minor can be nominated by a holder of Shares and in that event the name and address of the Guardian shall be given by the holder.
4. The nominee shall not be a trust, society, body corporate, partnership firm, Karta of Hindu Undivided Family, or a power of attorney holder. A non-resident Indian can be a nominee on re-patriable basis.
5. Transfer of Shares in favour of a nominee shall be a valid discharge by a Company against the legal heir(s).
6. Only one person can be nominated for a given folio.
7. Details of all holders in a folio need to be filled; else the request will be rejected.
8. The nomination will be registered only when it is complete in all respects including the signature of (a) all registered holders (as per specimen lodged with the Company) and (b) the nominee.
9. Whenever the Shares in the given folio are entirely transferred or dematerialised, then this nomination will stand rescinded.
10. Upon receipt of a duly executed nomination form, the Registrars & Transfer Agent of the Company will register the form and allot a registration number. The registration number and folio no. should be quoted by the nominee in all future correspondence.
11. The nomination can be varied or cancelled by executing fresh nomination form.
12. The Company will not entertain any claims other than those of a registered nominee, unless so directed by a Court.
13. The intimation regarding nomination / nomination form shall be filed in duplicate with the Registrars & Transfer Agents of the Company who will return one copy thereof to the members.
14. For shares held in dematerialised mode nomination is required to be filed with the Depository Participant in their prescribed form.

20
Route Map-Anjar Station to Welspun
Route Map-Gandhidham Station to Welspun

Namnam(in b
Nam(in b
RegID N *Apdem Num
I hethe 2:30
Sign
Not
- - - The
The(5:0 Pleathe
Regi
Corporate
me and Registemed member block letters)
me(s) of Joint hblock letters)
gistered Folio No.)*
pplicable to mmaterialized for
mber of shares
ereby record myRegistered Off0 pm.
nature of the M
te: Members ar
- - - - - - - - - -
e electronic EV
(E-voting Ev
10
e remote e-voti00 pm). The e-V
ase read the insvote. These de
istered Office : W
Email : e Office : Welspu
ered address o
holder(s) if any
No. / (DP ID
members holdinrm
held
y presence at tffice of the Com
Member / Proxy
re requested to
- - - - - - - - - -
voting partVEN vent Numbe
08768
ing period comVoting module
structions anneetail and instruc
WELSPC
Welspun City, ViBoard No
CompanySecretun House, 5th Flo
Board
of sole / first
y
No./ Client
g Shares in
he 23rd Annualmpany at Wels
y present
fill up the Atte
- - - - - - - - -
ticulars are s
er)
mmences on Sae shall be disab
exed to the Notctions forms in
PUN COCIN : L27100G
illage Versamedio.: +91 2836 66207tary_WCL@welspoor, Kamala City,d : +91 -22-661360
ATTENDA
:
:
:
:
l General Meetpun City, Villa
endance Slip an
- - - - Tear h
set out belowUse
aturday, Augubled by NSDL
tice dated Junentegral part of t
ORP LIGJ1995PLC025
i, Taluka Anjar, D79, Fax No. + 91 2pun.com Websit, Senapati Bapat 000 Fax: +91-22-2
ANCE SLIP
ting of the Comage Versamedi
nd hand it over
here - - - - -
w: er ID
ust 11, 2018 (9for voting ther
e 8, 2018 of thethe said Notice
IMITED5609 Dist. Kutch, Guja2836 279060,
te: www.welspun Marg, Lower Pa2490 8020
P
mpany to be hei, Taluka Anjar
r at the venue o
- - - - - - - - -
9:00 am) and ereafter.
e 23rd Annuale.
D arat, Pin – 370110
ncorp.com arel (West), Mum
eld on Tuesdayr, Dist. Kutch,
of the meeting
- - - - - - - - -
Passwo
ends on Monda
General Meeti
0, India.
mbai – 400013.
y, August 14, 2 Gujarat – 370
.
- - - - - - - - -
ord / PIN
ay, August 13
ing before exer
2018 at 0110 at
- -- -
, 2018
rcising
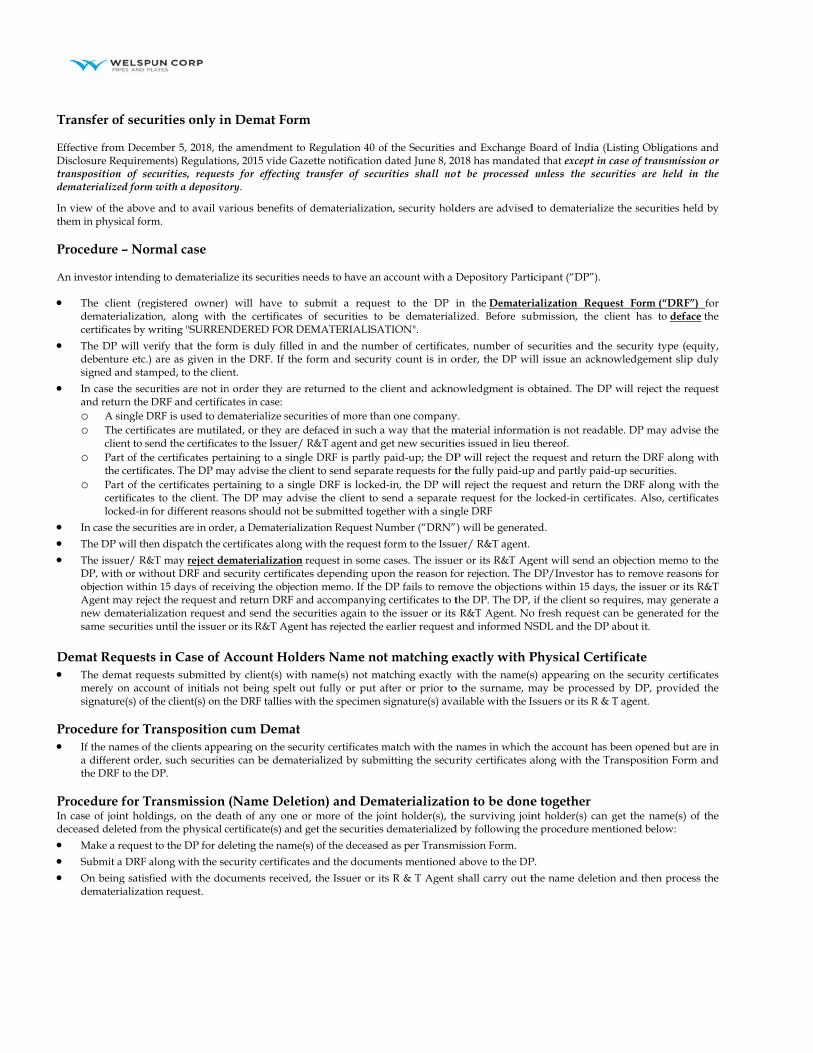
Tra EffecDisctrandem
In vithem Pro An i
Dem
Pro
ProIn cadece
ansfer of secu
ctive from Decemclosure Requiremnsposition of seaterialized form
iew of the abovem in physical form
ocedure – Nor
investor intendin
The client (regdematerializatiocertificates by w
The DP will vedebenture etc.) signed and stam
In case the secuand return the Do A single Do The certifi
client to seo Part of the
the certifico Part of the
certificateslocked-in f
In case the secu
The DP will the
The issuer/ R&DP, with or witobjection withinAgent may rejenew dematerialsame securities
mat RequestsThe demat requmerely on accosignature(s) of t
ocedure for TrIf the names of a different ordethe DRF to the D
ocedure for Trase of joint holdeased deleted fro
Make a request
Submit a DRF a
On being satisfdematerializatio
urities only in
mber 5, 2018, thements) Regulation
curities, requestm with a deposito
e and to avail vam.
rmal case
ng to demateriali
gistered owner) on, along with
writing "SURREN
erify that the for are as given in
mped, to the clien
urities are not inDRF and certifica
DRF is used to deicates are mutilatend the certificatee certificates pertcates. The DP mae certificates pers to the client. Tfor different reas
urities are in orde
en dispatch the ce
&T may reject dethout DRF and sn 15 days of rece
ect the request anlization request
s until the issuer
s in Case of Auests submitted ount of initials nthe client(s) on th
ransposition the clients appeaer, such securitieDP.
ransmission dings, on the deaom the physical c
t to the DP for de
along with the se
fied with the docon request.
n Demat Form
e amendment tons, 2015 vide Gazts for effecting ory.
arious benefits of
ize its securities n
will have to the certificates
NDERED FOR D
rm is duly filled the DRF. If the nt.
n order they are ates in case:
ematerialize secuted, or they are des to the Issuer/ taining to a sing
ay advise the cliertaining to a singThe DP may advsons should not b
er, a Dematerializ
ertificates along
ematerialization ecurity certificateiving the objectind return DRF anand send the secor its R&T Agen
Account Holdby client(s) with
not being spelt ohe DRF tallies wi
cum Demat aring on the secues can be demate
(Name Deletath of any one ocertificate(s) and
eleting the name(
ecurity certificate
cuments received
m
o Regulation 40 ozette notificationtransfer of secu
f dematerializati
needs to have an
submit a reque of securities toEMATERIALISA
in and the num form and securi
returned to the
urities of more thadefaced in such a R&T agent and
gle DRF is partlyent to send separagle DRF is lockedise the client to be submitted tog
zation Request N
with the request
request in sometes depending upion memo. If thend accompanyincurities again to
nt has rejected the
ders Name noh name(s) not mout fully or put ith the specimen
urity certificates erialized by subm
tion) and Demor more of the jo get the securities
(s) of the decease
es and the docum
d, the Issuer or i
of the Securities n dated June 8, 20urities shall no
ion, security hold
n account with a D
est to the DP io be dematerialATION".
mber of certificatity count is in o
client and ackno
an one companya way that the mget new securitie paid-up; the DPate requests for td-in, the DP wilsend a separate
gether with a sing
Number (“DRN”)
t form to the Issu
cases. The issuepon the reason foe DP fails to remg certificates to t the issuer or its e earlier request
ot matching ematching exactly w
after or prior ton signature(s) ava
match with the nmitting the secur
materializatiooint holder(s), ths dematerialized
ed as per Transm
ments mentioned
its R & T Agent
and Exchange B018 has mandatet be processed
ders are advised
Depository Parti
in the Dematerilized. Before su
tes, number of seorder, the DP wi
owledgment is o
y. material informates issued in lieu P will reject the rthe fully paid-upll reject the reque request for the gle DRF
) will be generat
uer/ R&T agent.
er or its R&T Agor rejection. The
move the objectionthe DP. The DP, R&T Agent. Noand informed N
exactly with Pwith the name(s
o the surname, mailable with the I
names in which rity certificates a
on to be donehe surviving join
d by following th
mission Form.
above to the DP
shall carry out t
Board of India (Led that except in
unless the secu
d to dematerializ
icipant (“DP”).
ialization Requubmission, the c
ecurities and theill issue an ackno
obtained. The DP
tion is not reada thereof. request and retu
p and partly paiduest and return t locked-in certifi
ted.
gent will send an DP/Investor hans within 15 day if the client so reo fresh request ca
NSDL and the DP
Physical Certs) appearing on may be processeIssuers or its R &
the account has along with the T
e together nt holder(s) can
he procedure men
P.
the name deletio
Listing Obligatio case of transmisurities are held
ze the securities h
uest Form (“DRFclient has to def
e security type (owledgement sli
P will reject the r
able. DP may adv
urn the DRF alond-up securities. the DRF along wicates. Also, cert
n objection memos to remove reas
ys, the issuer or iequires, may genan be generated
P about it.
tificate the security certd by DP, provid
& T agent.
been opened buTransposition For
get the name(s)ntioned below:
on and then proc
ons and ssion or in the
held by
F”) for face the
(equity, ip duly
request
vise the
ng with
with the tificates
o to the sons for its R&T nerate a for the
tificates ded the
ut are in rm and
) of the
cess the