IZA DP No. 5470 DISCUSSION PAPER SERIESrepec.iza.org/dp5470.pdf · Task-Biased Changes of...
36
DISCUSSION PAPER SERIES Forschungsinstitut zur Zukunft der Arbeit Institute for the Study of Labor Task-Biased Changes of Employment and Remuneration: The Case of Occupations IZA DP No. 5470 January 2011 Stephan Kampelmann François Rycx
Transcript of IZA DP No. 5470 DISCUSSION PAPER SERIESrepec.iza.org/dp5470.pdf · Task-Biased Changes of...
DI
SC
US
SI
ON
P
AP
ER
S
ER
IE
S
Forschungsinstitut zur Zukunft der ArbeitInstitute for the Study of Labor
Task-Biased Changes of Employment and Remuneration: The Case of Occupations
IZA DP No. 5470
January 2011
Stephan KampelmannFrançois Rycx
Task-Biased Changes of
Employment and Remuneration: The Case of Occupations
Stephan Kampelmann Université Lille 1, CLERSE and DULBEA
François Rycx
Université Libre de Bruxelles, SBS-EM (CEB and DULBEA) and IZA
Discussion Paper No. 5470 January 2011
IZA
P.O. Box 7240 53072 Bonn
Germany
Phone: +49-228-3894-0 Fax: +49-228-3894-180
E-mail: [email protected]
Any opinions expressed here are those of the author(s) and not those of IZA. Research published in this series may include views on policy, but the institute itself takes no institutional policy positions. The Institute for the Study of Labor (IZA) in Bonn is a local and virtual international research center and a place of communication between science, politics and business. IZA is an independent nonprofit organization supported by Deutsche Post Foundation. The center is associated with the University of Bonn and offers a stimulating research environment through its international network, workshops and conferences, data service, project support, research visits and doctoral program. IZA engages in (i) original and internationally competitive research in all fields of labor economics, (ii) development of policy concepts, and (iii) dissemination of research results and concepts to the interested public. IZA Discussion Papers often represent preliminary work and are circulated to encourage discussion. Citation of such a paper should account for its provisional character. A revised version may be available directly from the author.
IZA Discussion Paper No. 5470 January 2011
ABSTRACT
Task-Biased Changes of Employment and Remuneration: The Case of Occupations
Different empirical studies suggest that the structure of employment in the U.S. and Great Britain tends to polarise into “good” and “bad” jobs. We provide updated evidence that polarisation also occurred in Germany since the mid-1980s until 2008. Using representative panel data, we show that this trend corresponds to a task bias in employment changes: routine jobs have lost relative employment, especially in predominantly manual occupations. We further provide the first direct test for whether task-biased technological change affects employment and remuneration in the same direction and conclude that there is no consistent task bias in the evolution of pay rules. By contrast, compositional changes like the proportion of union members are clearly associated with long-term changes in the remuneration of occupations. JEL Classification: J21, J24, J31 Keywords: polarisation, technological change, pay rules, occupations, inequality, tasks Corresponding author: François Rycx SBS-EM (CEB and DULBEA) Université Libre de Bruxelles 42 Avenue F. Roosevelt (CP 114/02) B-1050 Brussels Belgium E-mail: [email protected]
2
1 Introduction
A consensus reigns among labour economists that recent decades have brought profound
changes in the occupational structure of employment. On the supply side, many high-income
economies experience the simultaneous effects of an ageing and more feminine labour force,
combined with increasing supplies of higher-education credentials and immigrant workers. On the
demand side, economists have paid considerable attention to the employment effects of
technological change, trade and a growing demand for personal services.
The conventional wisdom as to the effect of technological change has been that better
trained workers benefit more from new technologies than those with less training, thereby creating a
"skill-bias" in the evolution and remuneration of labour (Katz and Autor, 1999). More recent
research suggests that the relationships between education, new technologies and changes in
employment or wages are not as straightforward as previously thought (Card and DiNardo, 2002;
Lemieux, 2008). While the hypothesis of skill-biased technological change appears to be successful
in accounting for the growth of high-skilled employment in the upper tail of the earnings structure,
we see mounting evidence that some low-wage occupations are also expanding in the U.S., Britain
and a range of European countries (see Goos et al., 2009; CEDEFOP, 2010). In a much-cited article
on recent employment changes, Goos and Manning (2007) refer to this phenomenon as job
polarisation.
An accurate understanding of changes in occupational employment and earnings is vital for
sound economic policy, especially for correctly anticipating future skill needs and job opportunities.
In order to refine the analysis of occupational trends, there has been a shift in the literature and
among data providers towards a task-based analysis of the evolution of labour demand and supply
(witness, for instance, the U.S. Department of Labor's O*NET system for monitoring changing skill
needs within occupations). The rationale for looking at task compositions is that this approach
allows to better grasp what occupations actually do, i.e. to differentiate jobs according to the
specific labour services they perform and the types of technologies they use.
Focusing on the case of Germany, this paper contributes to the existing literature on changes
in the employment and remuneration of occupations in three complementary ways. First, after
clarifying the main concepts and a review of the literature (Section 2), we document with
individual-level panel data the extent to which the German employment structure has been marked
by polarisation (Section 3). Existing evidence on polarisation in Germany has concentrated on the
1980s and 1990s (see Spitz-Oener, 2006; Dustmann et al., 2009), and more recent studies cover
only short periods (Antonczyk et al. (2009) analyse wage polarisation between 1999 and 2006) or
3
exclude the years after 2004 (Antonczyk et al., 2010). However, as of 2003 the German labour
market underwent significant institutional modifications under the banner of the so-called Hartz
reforms (see Wunsch, 2005; Jacobi and Kluve, 2006), so that it is worthwhile to verify whether
occupational polarisation continues to be observable in more recent data. Our sample suggests that
the German occupational employment structure has polarised during the period 1985-2008, but also
that changes in occupational remuneration are not in line with observed employment trends. This
contrasts with standard labour market models predicting that a positive demand shock increases
both employment and earnings.
Second, we use the framework of task-biased technological change developed by Autor et al.
(2003) to account for the evolution of occupational employment and remuneration (Section 4). In
particular, we show that a significant proportion of long-term employment changes in Germany can
be accounted for by distinguishing occupations according to a typology of tasks: occupations that
carried out routine tasks in 1985 have lost relative employment shares until 2008, especially in
predominantly manual occupations. By contrast, the relative increase in lower-tail employment
cannot be accounted for by the dichotomies of manual/non-manual and routine/non routine tasks
and appears to be more specific to a group of low-paid service occupations.
Third, our study also contributes to the wider literature on occupational changes since we
provide the first direct test for whether task-biased technological change affects employment and
pay rules in the same direction. In contrast to the evolution of employment, estimates of a model
that controls for intra-occupational changes in the labour composition suggest that the initial task
content of an occupation does not have a consistent long-term effect on wages. However,
compositional changes like the proportion of union members are clearly associated with changes in
occupational remuneration.
2. Polarisation and task-biased technological change
The phenomenon of job polarisation appears under different names in the literature. In the
widest sense, it refers to relative employment increases in "good" and "bad" jobs relative to
"middling" jobs. However, there is no consensus on how to define "good" and "bad" jobs and
alternative criteria are used by different authors. For instance, Doeringer and Piore (1985) predict a
polarisation of the labour force into well-paid and stable jobs on internal labour markets and low-
paid unstable jobs on the external labour market. Other polarisation studies retain current
(Acemoglu, 2001) or initial earnings (Levy and Murnane, 1992; Goos and Manning, 2007) as the
criteria for job quality. Other authors define wage polarisation in terms of changes in the wage

4
distribution, for instance as a rise in the ratio between the 80th percentile and the median, combined
with a decrease in the ratio of the median and the 20th percentile (Antonczyk et al., 2010). Yet
others analyse polarisation in terms of initial skill levels and operationalize skills through average
years of schooling (Autor et al., 2006) or by proxying skills through wage premia (Spitz-Oener,
2006). In general, the issue of what constitutes "job quality" appears to be particularly thorny for the
case of service jobs (Meisenheimer, 1998; OECD, 2001). In this paper we define polarisation as
follows. If we rank all occupations according to their median wage at date t-1, then employment
(wage) polarisation between t-1 and t means that the employment share (median wage) of
occupations situated in the middle of the ranking has decreased relative to occupations at the top
and bottom of the wage ranking in t-1.
The theoretical literature on polarisation focuses on three demand mechanisms that could
account for such a trend. First, the propensity to offshore labour services is not the same in all
occupations, with many production jobs in the middle of the wage distribution being presumably
easier to relocate to low- or middle-income countries than service occupations (see Hijzen, 2007;
Blinder, 2009). Second, overall income inequality may increase the demand for certain low-paid
service jobs: as more income goes to the top earners, the demand (and employment) for low-skill
service workers might increase (Gadrey, 1996; Manning, 2004; Autor and Dorn, 2009). Both of
these factors undoubtedly affect specific occupations: certain blue-collar manufacturing jobs in the
U.S. and Europe have indeed been relocated to emerging economies in Asia or Latin America, and
the demand for some service occupations, e.g. in personal care, may be positively linked to wage
inequality. However, empirical studies conclude that these factors play a subordinate role for the
overall evolution of the occupational employment structure as a whole (see Freeman, 2004; Goos et
al., 2009).
By contrast, the hypothesis developed by Autor et al. (2003) (hereafter referred to as ALM)
has been more successful in accounting for polarisation: ALM argue that the way that occupations
are affected by new technologies depends to a large extent on the tasks that they perform ("task-
biased technological change"1). The basic idea is that firms substitute routine tasks for technology, a
process driven by the well-known fact that the costs for routine operations have decreased
dramatically over time (Nordhaus, 2007). Such capital-labour substitutions result in two
complementary, but nevertheless distinguishable effects: first, they may lead to job losses (gains) in
occupations carrying out routine (non-routine) tasks; and second, they may modify the composition
of job tasks within occupations by increasing the incidence of non-routine relative to routine tasks.
1 Goos and Manning (2007) and Goos et al. (2009) also refer to this process as "routinisation". This term might lend to confusion since it also evokes the phenomenon of standardization or de-complexification of jobs.
5
In this paper we will focus on the first effect, i.e. on between-occupation differences in
rationalisation propensity as a consequence of differences in initial task content. For evidence on
the evolution of tasks within occupations over time see, for instance, ALM or Spitz-Oener (2006).
The introduction of new technologies affects occupations differently according to the type of
tasks that are predominantly carried out by a given occupation. Historically, manual routine tasks
were the first to be substituted for machines: this has been a "thrust of technological change in the
Industrial Revolution" (ALM, p. 1284). Despite the prominence of this classic form of capital-
labour substitution in Economic History and economic textbooks, the routinisation propensity of
manual routine jobs is not clear-cut. Whereas manual routine jobs in industrial production (e.g.
assemblers, machine operators) can arguably be relatively easily rationalised through technological
innovations, it is more difficult to replace occupations like cleaners or truck drivers with cleaning or
driving robots. The impact of technological change on manual routine jobs may therefore depend on
the sector of activity (e.g. industrial production versus services).
Next, the massive diffusion of personal computers at the work place has created substitution
possibilities for non-manual routine jobs that typically carry out tasks involving repetitive forms of
information-processing. As a consequence, occupations hired for predominantly non-manual routine
tasks are considered by ALM to be substitutes for computers: clerical occupations such as telephone
switchboard operators or typists are hypothesised to see their share in total employment decreasing
as a result of technological change.
By contrast, the spread of the same technologies is thought to increase employment shares in
high-paid occupations with non-manual non-routine tasks requiring creative problem-solving.
Examples of occupations with predominantly non-manual non-routine tasks are judges,
psychologists, lawyers or medical doctors. According to the ALM hypothesis, these occupations are
not only difficult to replace with machines, but technologies like personal computers are even
considered to play a complementary role.
Finally, occupations with predominantly manual non-routine tasks include occupations such
as nurses, cabinet makers or plumbers. The ALM framework does not make predictions concerning
the impact of technological change for this category. Indeed, at least two factors limit the
rationalisation propensity of manual non-routine jobs. First, since these occupations are not
associated with cognitive tasks, they are not directly affected by the spread of personal computers
(they are neither substitutes nor complements). Second, many manual non-routine occupations in
services are resilient to other forms of rationalisation like the replacement by robots or
organisational streamlining ("Baumol's Disease"). This has been attributed to the complex eye-hand
coordination they require, but also to the idiosyncratic nature of the relationship between producer
6
and client in many service occupations (Gadrey, 2003). In a nutshell, the ALM hypothesis of task-
biased technological change predicts increasing employment and earnings for jobs with non-routine
non-manual tasks and decreasing employment and earnings for routine jobs. Whether non-routine
manual jobs fare better or worse depends on the impact of technological change on the labour
supply as displaced labour might shift from routine to non-routine manual jobs.
On the empirical side, ALM present evidence for the occurrence of task-biased technological
change in the U.S. They show that even if occupations remain nominally identical, sizeable changes
in their task content have been recorded by the Department of Labor Statistics. These within-
occupation changes follow a pattern that is in line with the ALM hypothesis: a decline in the usage
of routine skills is shown to be correlated with the level of computer adoption at the occupation and
industry level.
Goos and Manning (2007) expand on the ALM model and look at the relation between the
median wage of occupations and their task content. They show that in the U.S., routine jobs are
predominantly found in the middle, non-routine non-manual jobs in the top, and non-routine manual
jobs in the bottom of the earnings distribution. This middling location of routine jobs allows Goos
and Manning to establish a link between the substitution of routine tasks and job polarisation. They
further find evidence for polarisation of occupational employment in Great Britain for the period
1979-1999. However, the evolution of occupational pay rules and employment does not seem to go
hand in hand in their data: lower-tail earnings deteriorate despite the observed growth in
employment (Goos and Manning, 2007, p. 131). This may be due to the above-mentioned supply-
side effects (displaced routine workers turn to the 'lousy' but growing occupations with manual non-
routine tasks), but Goos and Manning also cite institutional factors such a falling unionisation and
lower minimum wages to account for this phenomenon.
Next, Autor et al. (2006) find that while labour demand shifts in the U.S. have been
monotonic in the 1980s, changes in the 1990s have shown polarisation with routine occupations
loosing ground relative to non-routine jobs. Contrary to the British experience, employment and
wages appear to co-vary in the U.S. during the 1990s.
Goos et al. (2009) analyse the relationship between initial wages and the evolution of
employment shares for a panel of European countries. Looking at ISCO 88 two-digit occupations
between 1993 and 2006, they find evidence for job polarisation in Europe as a whole: the four
lowest-paying and the eight highest-paying occupations increase their employment share, while the
nine middling occupations loose jobs. This is also the case for individual countries like Belgium,
Germany, Greece, the Netherlands, Norway, Spain, Sweden and the U.K., but not for Austria,
Denmark, Finland, France, Ireland, Italy, Luxembourg, Portugal (see also CEDEFOP (2010) for
7
European evidence on job polarisation covering the period 2000-2010 and a forecast for 2010-
2020). Goos et al.'s model accounts for job polarisation with the task content of occupations and
distinguishes between three types of tasks: abstract (intense in non-routine cognitive skills), service
(intense in non-routine non-cognitive skills), and routine (intense in both cognitive and non-
cognitive routine skills). In a cross-country regression controlling for the off-shoreability and
educational composition of occupations, they find that employment between 1993 and 2006 is
positively correlated with the importance of abstract and service tasks, but negatively correlated
with routine tasks.
As for Germany, Spitz-Oener (2006) presents evidence for job polarisation to have occurred
during the period 1979-1998/1999: occupations situated around the third decile of the skill
distribution in 1979 lost relative employment, while the lowest decile as well as the upper three
deciles have gained employment shares. Dustmann et al. (2009) corroborate this result for the 1980s
and 1990s: occupations with high initial levels of formal education have seen their employment
share increasing, while occupations with middling education lost relative employment. As for the
bottom of the occupational structure, Dustmann et al. find small employment gains for the lowest
wage percentiles in the 1980s, and modest employment losses in the 1990s.2 Antonczyk et al.
(2009) exploit updates of the datasets used by Spitz-Oener (2006) to test whether the observed
increase in wage inequality between 1999 and 2006 can be attributed to changes in task content.
Contrary to the U.S. evidence of Autor et al. (2006), Antonczyk et al. "conclude that the task-based
approach can not explain the recent increase in wage inequality among male employees in
Germany". Finally, Antonczyk et al. (2010) use the the German IAB employment subsample on
which the analysis in Dustmann et al. (2009) is based and compare the German polarisation with
data from the U.S. Current Population Survey. Antonczyk et al. (2010), whose analysis is restricted
to male full-time workers who are between 25 and 55 years old, find evidence for employment
polarisation to have occurred in Germany during the periods 1989-2004 and 1994-2004, while the
wage distribution seems not to have polarised.
Hence, previous research on the German evolution of employment found sizeable job gains
at the top, losses in the middle, and stagnant employment at the bottom of the occupational
structure. However, unlike the U.S. experience during the 1990s, the German employment
polarisation seems not to be accompanied by a corresponding evolution of wages. To our
knowledge, none of the existing studies on Germany tests directly whether the initial task content of
occupations is related to long-term changes in employment and wages.
2 See also Burkhauser and Rovba (2006) for evidence that the German income distribution hollowed out during the 1990s.
8
While extant studies therefore suggest that employment has polarised in different countries
(including Germany), at least three points remain unclear. First, empirical evidence on polarisation
in Germany is only available until 2004. However, as of 2003 the German labour market underwent
significant institutional transformations through the implementation of the Hartz reforms, so that it
is interesting to verify whether the polarisation trend observed until 2004 continues in more recent
data. Second, we lack a direct test whether the long-term evolution of occupations in Germany is
task-biased, i.e. due to their propensity to be rationalised according to the pattern hypothesised by
ALM. Third, it is not clear whether task-biased technological change affects employment and wages
in the same direction. Existing evidence suggests that in the 1990s U.S. wages and employment
covary, while the remuneration of "lousy jobs" in the U.K. and Germany seems to have deteriorated
despite positive demand shocks. This raises the question whether the hypothesised demand shifts
away from routine (and towards non-routine) occupations have a corresponding downward
(upward) effect on pay rules. The remainder of this paper addresses these questions empirically by
elucidating the relationships between job types, employment and pay rules for the case of Germany.
3. Changes in employment and remuneration of occupations
3.1. Data source
The data used in this paper stems from the Scientific Use Sample of the German Socio-
Economic Panel (SOEP), an extensive and representative household panel provided by the German
Institute for Economic Research (DIW). The first wave of the panel was collected in 1984, the latest
available in 2008. The length of the observation period is a key advantage of the SOEP over other
data sources, given that technological change is arguably a long-term phenomenon that might take
several decades to affect earnings and employment. Among other variables, the SOEP contains
longitudinal information on household composition, occupational biographies, employment, and
earnings. A detailed presentation of the SOEP and its evolution can be found in Wagner et al.
(2007). Although the data is compiled annually and available for all years from 1984 until 2008
(except for 1992), information on tasks was only collected in 1985, 1987, 1989, 1995 and 2001:
only during these years all surveyed employees have been asked a set of additional questions on the
type of work they carry out (see Section 4.2 below).
Several filters have been applied to the raw SOEP data. First, since we focus on the
evolution of employment and wages, all individuals that are not employed at the time of the
interview have been dropped. This step eliminates around 50 percent of all surveyed individuals,
9
mainly children, people in retirement, and working-age individuals that are either unemployed or
not active on the labour market. Second, we also dropped all observations for which information on
the occupational variable is missing (this concerns around 5 percent of the remaining individuals).
Thirdly, given that we want to trace changes in employment and earnings over several decades, we
only retain observations in the SOEP for which the region of residence is West Germany and
thereby circumvent the problem of the considerable differences in employment structure and
remuneration between the old and new Bundesländer. In fact, the earnings differential between the
two regions continues to be so stark that a regression including the entire SOEP sample would
resemble a cross-country estimation juxtaposing two different wage distributions. The sample used
in the regression analysis contains 24,416 individual-year observations. Detailed information on
specific SOEP variables will be provided below.
3.2. The evolution of employment
We first examine the evidence for polarisation by analysing the evolution of occupational
employment. Unless otherwise mentioned, throughout this paper occupations are categorized
according to the ISCO-88 three-digit nomenclature (see ILO, 1990). All earnings data used in this
paper refer to current gross hourly wages deflated by the 2005 Consumer Price Index. Since the
corresponding SOEP variable provides current gross monthly labour income, we computed hourly
wages by first converting the monthly into weekly income and then dividing this figure by the
actual weekly working hours (including overtime).
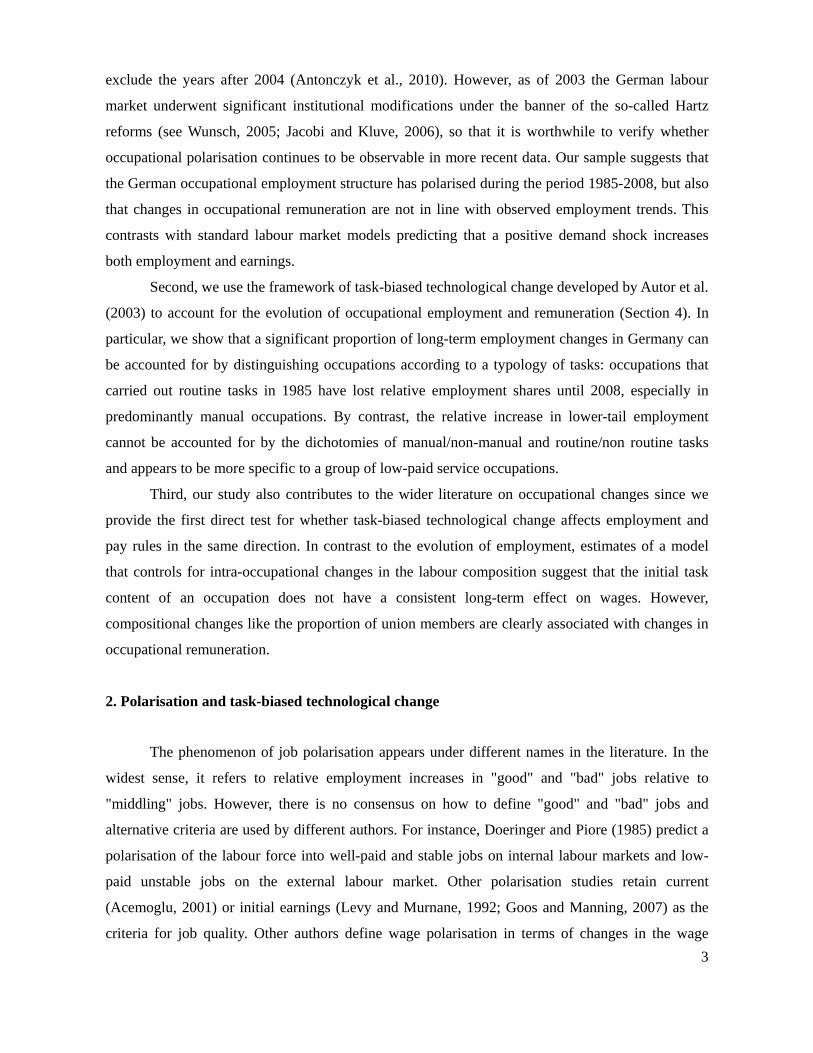
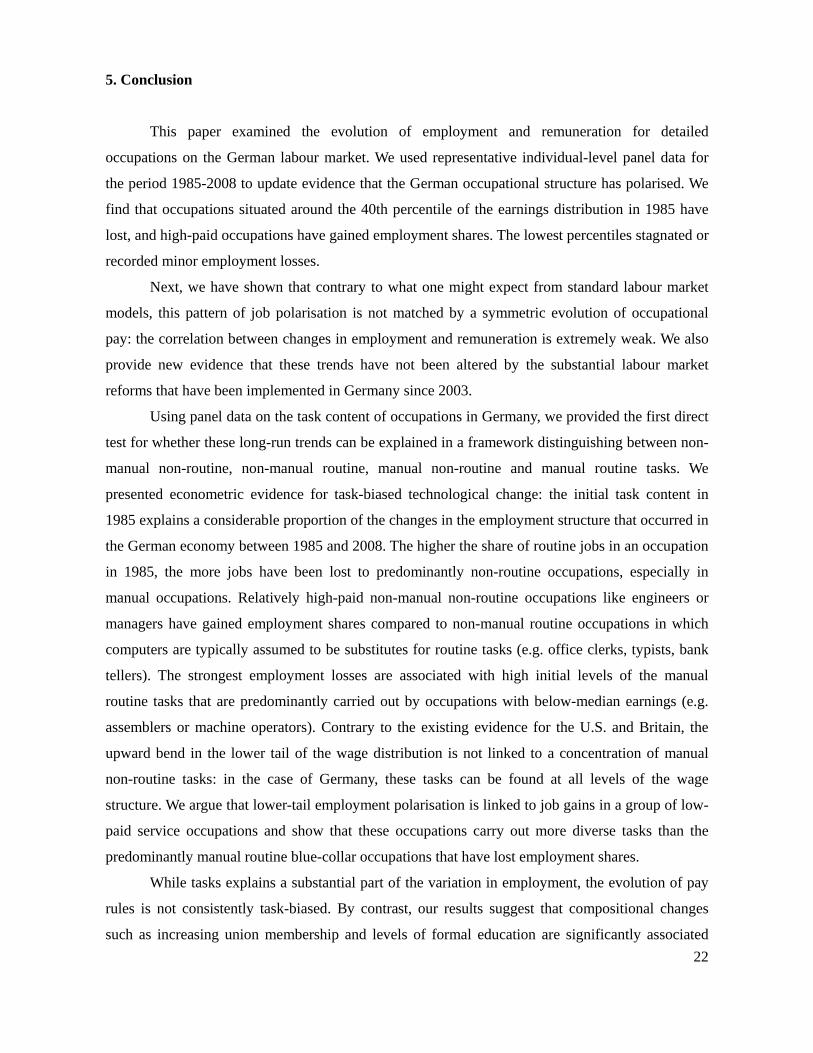
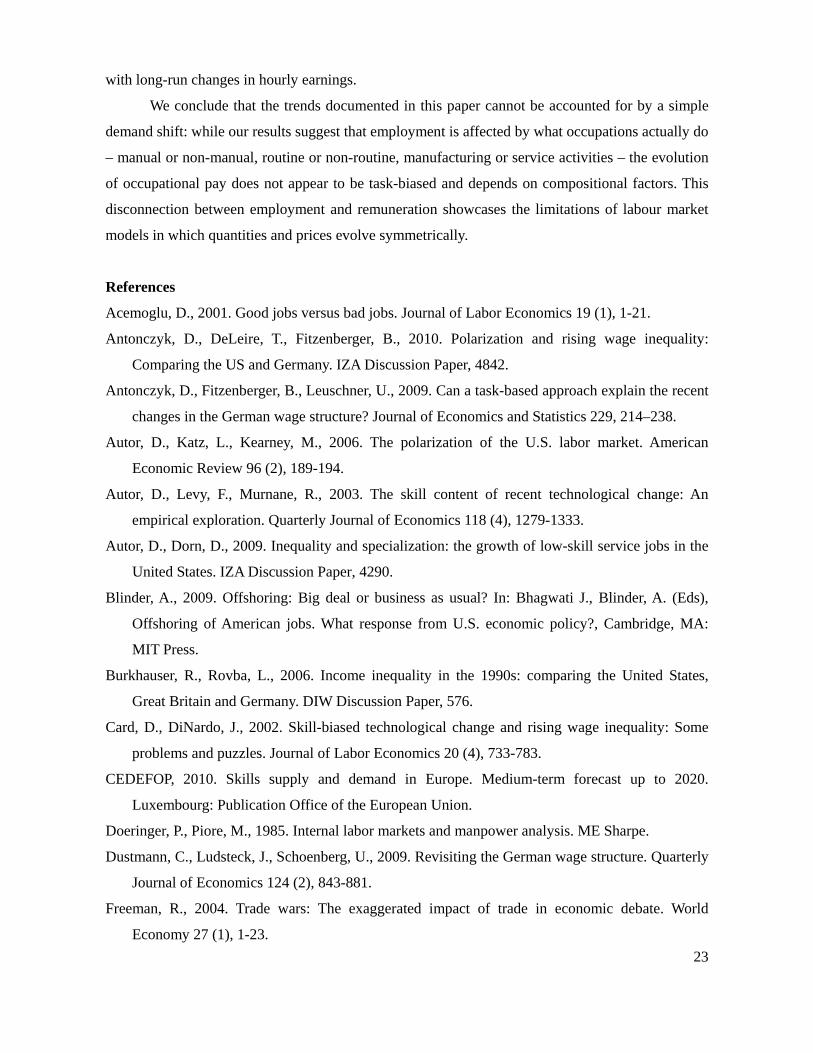
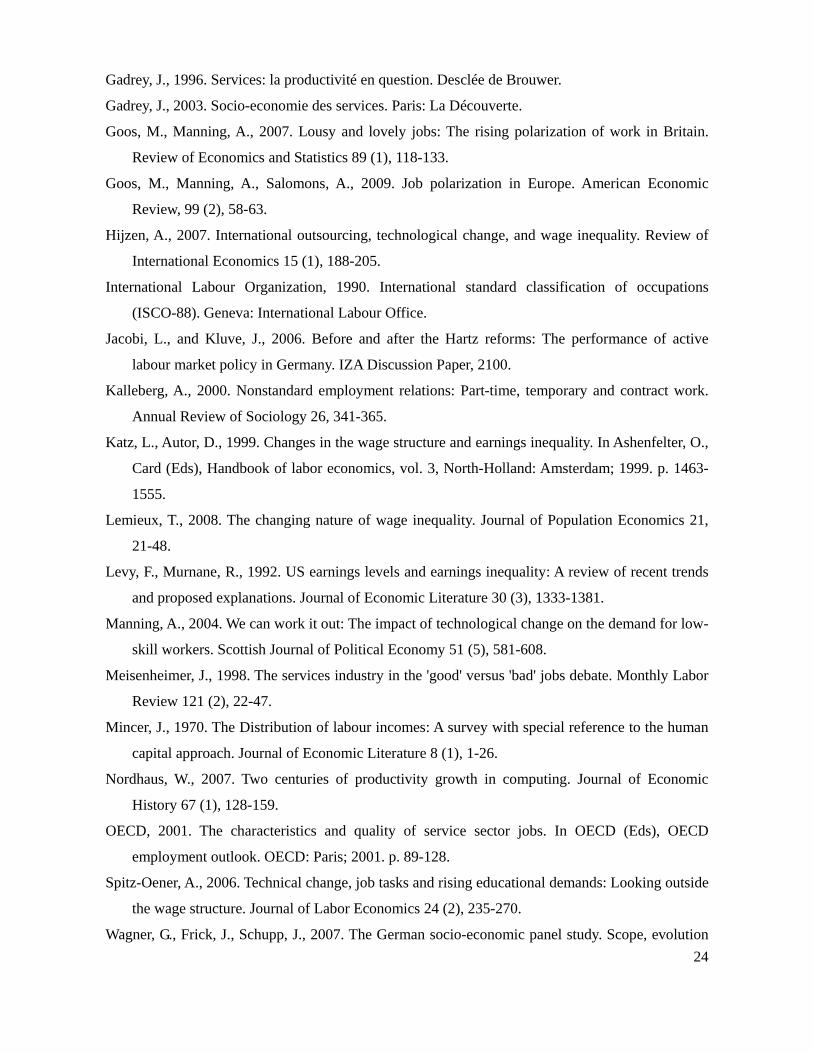
[Insert Figure 1]
A graphical method to detect job polarisation is to rank percentage point changes in
occupational employment shares between period t-1 and t according to the respective earnings in t-
1. If the occupational structure has polarised, one should see increasing employment shares at the
lower and/or upper tail of the earnings distribution relative to middle-income occupations. Panel (a)
in Figure 1 is the corresponding graph for the evolution of German employment between 1985 and
2008. Earnings in Figure 1 are logarithms of hourly median earnings in each occupation in 1985.
Employment shares are measured in terms of head counts in each three-digit occupation.3 The
employment changes in Germany clearly reflect a polarisation pattern with considerable increases
3 The shape of the graphs does not change substantially if actual hours worked are used as employment measure.
10
for high-wage, similarly large losses in the middle-wage and small or no increases in some low-
wage occupations.
Another way of illustrating the evolution of occupational trends is to chart changes in
employment shares against the percentiles of the initial earnings distribution as proposed by
Dustmann et al. (2009). The resulting graph (panel (b) in Figure 1) reveals a similar pattern of
polarisation than the one found by Dustmann et al. for the 1980s and 1990s, with top-income
occupations enjoying considerable employment gains and a hollowing out of middling occupations.
The biggest losses in employment shares appear to be situated around the 40th percentile of the
initial earnings distributions. Overall, the shape of the employment changes in the SOEP data
corroborates and updates other studies with German data and suggests that polarisation is a robust
and continuing process in Germany.
To test more formally for polarisation, Goos and Manning (2007) proposed a straightforward
method based on the following equation:
(1)
where Δ(EMPLOYMENT_SHARE)i,t is the change in the employment share of occupation i between
t and t-1, log(MEDIAN_WAGE)i,t-1 is the logarithm of the median wage of occupation i in t-1, and
log(MEDIAN_WAGE)²i,t-1 the square of the initial median wage. Polarisation of the employment
structure implies that the linear term is negative and the quadratic term positive, thereby giving rise
to a U-shaped curve of employment changes.
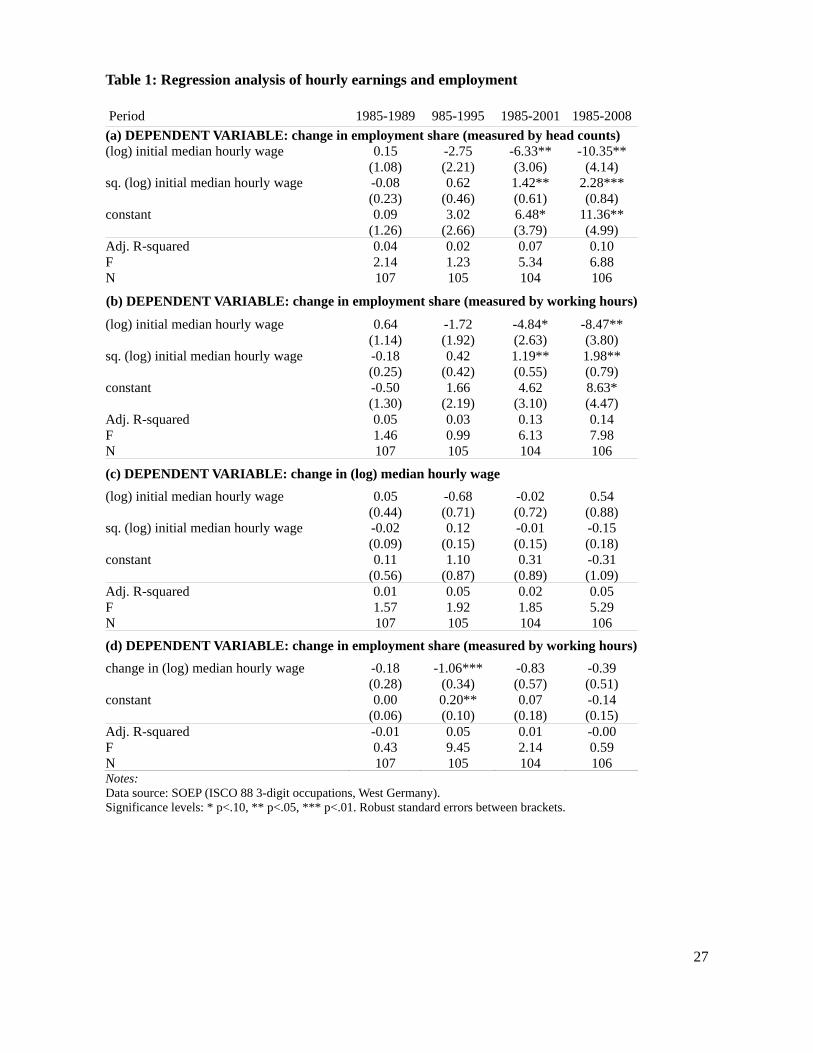
[Insert Table 1]
We estimated Equation (1) by weighting each occupation by its initial employment share in
1985 (see Goos and Manning, 2007). Table 1 presents the results with employment measured per
capita (panel (a)) and in terms of hours worked (panel (b)) for four time periods: 1985-1989, 1985-
1995, 1985-2001 and 1985-2008. All regression coeffients have the expected sign and increase in
magnitude the further we move away from the initial date. For the longest period (1985-2008), the
U-shape of the relationship between initial earnings and employment changes is strongly
significant. This result is robust to whether we measure employment shares in terms of head counts
or in terms of hours worked, thereby suggesting that the polarisation trends observed for U.S. and
Britain by Goos and Manning (2007) and Autor et al. (2006) occurred also in Germany since the
titi
titi
WAGEMEDIAN
WAGEMEDIANSHAREEMPLOYMENT
,2
1,2
1,10,
_log
_log_
11
mid-1980s until 2008.
3.3. The evolution of pay rules
We now turn to the evolution of occupational earnings. Standard models of the labour
market predict that a given demand shock pulls quantities and prices in the same direction: if the
observed trends in occupational employment are caused by shifts in demand – e.g. due to task-
biased technological change – then, ceteris paribus, we would expect that changes in quantities and
prices are positively correlated.
How did occupational pay rules in Germany develop since the mid-1980s? We estimated the
same quadratic model with which we detected a U-shaped evolution of employment shares. If the
trends in occupational remuneration match the evolution of employment, we would expect a similar
pattern to emerge for the case of occupational pay rules. As can be seen in Table 1 (panel (c)), we do
not find strong evidence for this. Most of the coeffients do not have the expected sign and the
relationships between initial earnings and changes in earnings is insignificant.
To test directly for whether changes in occupational employment match changes in pay
rules, we have computed the corresponding correlation coeffients (panel (d) in Table 1). In contrast
to the existing evidence for the U.S., our results suggest that the link between changes in
employment shares and changes in (log) median earnings is extremely weak in Germany.4 This is
far from the predictions of standard labour market theory in which demand shifts affect quantities
and prices symmetrically. The next section provides further evidence that if occupational trends are
caused by demand shifts, the impact of these shifts is much more visible on the quantity side than in
observed changes of occupational pay rules.
4. Task-based analysis of occupational changes
4.1. Model
In order to test formally whether observed changes in occupational employment and
remuneration can be accounted for by task-biased technological change, we formulate the following
model:
4 This contrasts somewhat with Dustmann et al. (2009), who find a weakly positive relation between changes in
employment and changes in wages for Germany for the 1980s and 1990s in the upper part of the wage distribution.
12
3
1
7
1,,,1,,,
k ltitilltikkti XTASKSEMPLOYMENT (2)
3
1
7
1
*,,,
*1,,
**,_log
k ltitilltikkti XTASKSWAGEMEDIAN (3)
The dependent variable in Equation (2) is the change in the share of occupation i in total
employment between t-1 and t. Equation (3) explains the change in the logarithm of the median
hourly wage of occupation i for the same period. The main explanatory variables in both equations
is the proportion of task type k in occupation i at t-1. The variable TASKSk are therefore the
proportions of non-manual non-routine, non-manual routine, manual non-routine and manual
routine jobs in each occupation. If technological change affects the evolution of employment and
remuneration of occupations differently according to their respective task content, we would expect
that the initial share of manual and non-manual routine tasks at t-1 has a negative, and the share of
non-manual non-routine tasks a positive impact on relative employment and wage changes.
It should be noted that a change in occupational employment can either be the result of
demand shifts (e.g. technological change, trade) or supply shifts (e.g. expansion of formal
education, female labour force participation, increasing average seniority). To identify the impact of
initial task content, it is therefore crucial to control for changes in the composition of occupations.
This is the rationale for including the change in a vector of control variables, X , in the model. The
change in X captures an array of compositional changes that occurred in occupation i between t and
t-1 (see below).
4.2. Operationalisation of task categories
The evidence on tasks in both ALM and Goos and Manning (2007) is based on the same
source, namely the task definitions in the U.S. Dictionary of Occupational Titles (DOT). This
dataset is compiled by examiners of the Department of Labor who evaluate more than 12,000
different occupations and their characteristics according to standardized evaluation guidelines,
namely the Handbook for Analyzing Jobs.
In this paper, we use an alternative method to measure the task content of occupations,
namely subjective evaluations of jobs by incumbent employees. In particular, the Scientific Use
Sample of the SOEP in 1985, 1987, 1989, 1995 and 2001 contains 14 questions collecting
information on job characteristics and working conditions such as tasks, supervision, and health
hazard of the job. Out of the 14 questions, three can be linked directly to task types.

13
ALM define routine tasks as those that follow clear rules and procedures that can be
"specified in computer code and executed by machines" (p.1283). Our operationalisation of routine
tasks is based on whether a work post is characterised by diversity and monotony of procedures,
arguing that the less diversified and the more monotone a job is, the more it is possible to identify
the underlying rules and procedures and, in fine, replace them with technology. In particular,
individuals in the SOEP were asked whether they (a) fully, (b) partially, or (c) not at all agree with
the questions "Do you carry out diverse tasks?" and "Does your work allow you to constantly learn
new things that are useful for your professional development?". We defined routine jobs as those
whose incumbents answered (b) or (c) to both questions, i.e. they did not fully agree that their tasks
were diversified and that work experience was useful in their current job.
To distinguish between manual and non-manual jobs, we used the question "Do you have to
perform physically demanding work in your job?". While this operationalisation deviates from the
exact semantic content of the notion "manual" – a watchmaker might very well work mainly with
her hands but not find her job physically demanding –, the distinction between physical and non-
physical work appears to be most pertinent for our question. A difference in the rationalisation
propensity between jobs is likely to be linked to their respective degree of physical effort: the more
physical a job is, the more it is likely to involve complex eye-hand coordination absent in non-
physical jobs whose tasks mainly consist of symbolic rather than physical transformations.
Both strategies to measure the task content of occupations have advantages and
disadvantages. The administrative evaluation of jobs in the U.S. DOT has the advantage of being
based on objective criteria spelt out in the Handbook for Analyzing Jobs. All examiners are
supposed to apply identical criteria to all occupations, whereas individual survey data such as the
one we use in this paper arguably contains more variation in the interpretation of the different
aspects of routine or non-routine work. For instance, whether an individual finds her professional
activity diversifed may depend on her personal experience in other jobs, something that is by
definition unequally distributed among respondents.5 However, the higher subjectivity of the SOEP
measures is also an advantage since the information on task content is collected from people who
know very well the jobs under evaluation, namely the people working in them on a day-to-day
basis. The survey data allows therefore to tap into in-depth knowledge on task content and is likely
to reflect more accurately the diversity of tasks within a given occupation. Finally, a clear
disadvantage of the DOT for econometric work is the lower frequency in which the former has been
updated: the Fourth Edition of the DOT was published in 1977 and the Revised Fourth Edition in
5 This problem would be less salient for the longitudinal variation of tasks within occupations given that the same
individuals are interrogated in subsequent years.
14
1991, whereas the SOEP updates information on job characteristics roughly every five years for the
period under study. Given these differences between the two sources, it appears to be worthwhile to
investigate whether survey-based task content is significantly correlated with the evolution of
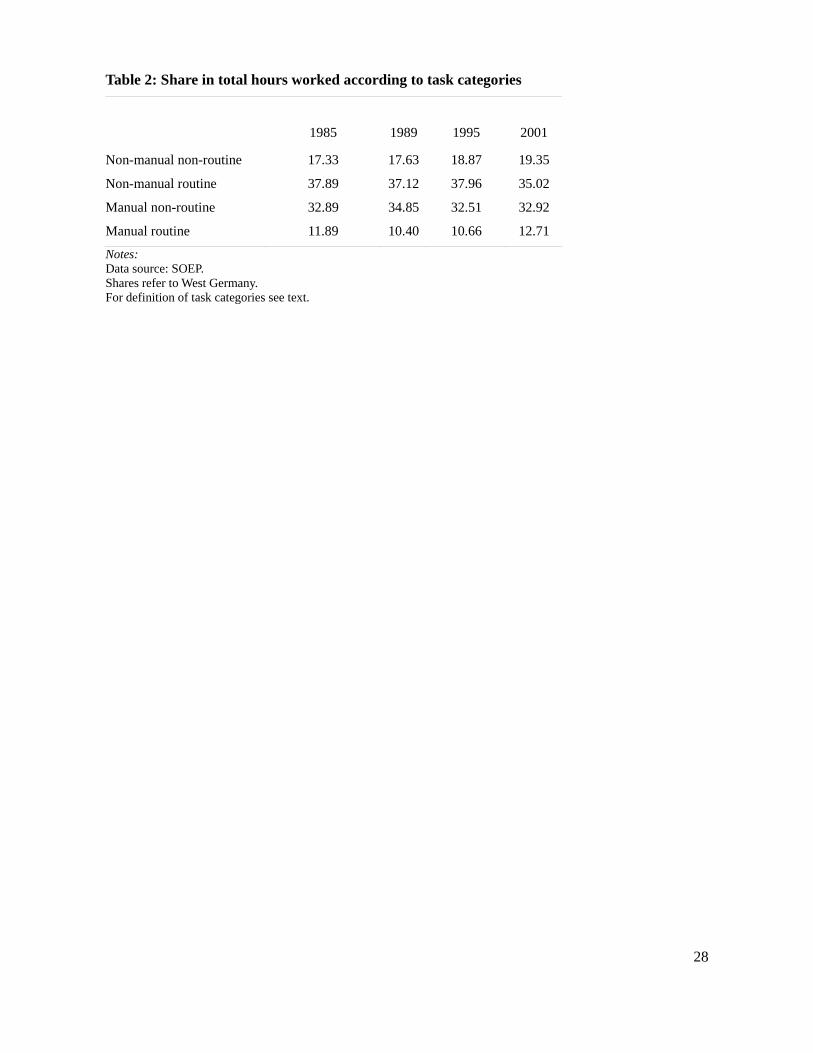
occupations as has been found in the DOT data. Table 2 presents the evolution of employment
shares for the different task categories in our final sample of individuals. All observed trends are in
line with the ALM hypothesis: non-manual non-routine jobs display constantly increasing
employment shares between 1985 and 2001. By contrast, the category of non-manual routine jobs
has lost employment shares while the proportion of manual routine jobs has remained roughly
constant (increased by less than 1 percentage point).
[Insert Table 2]
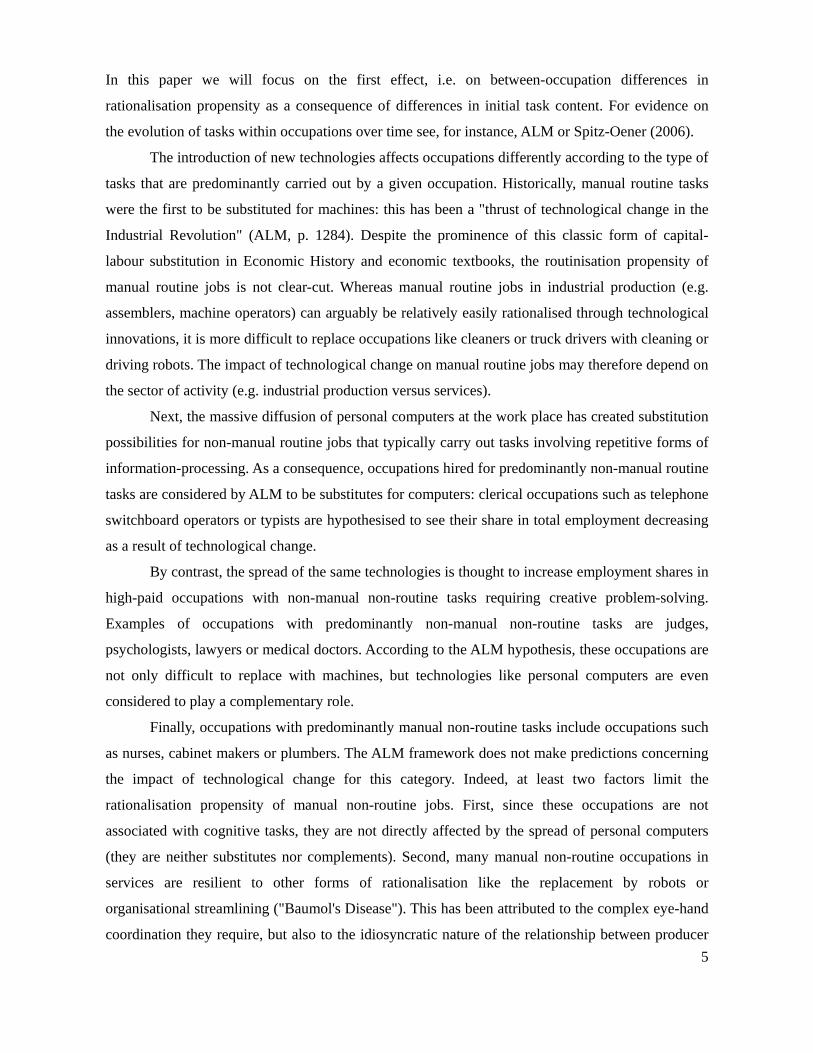
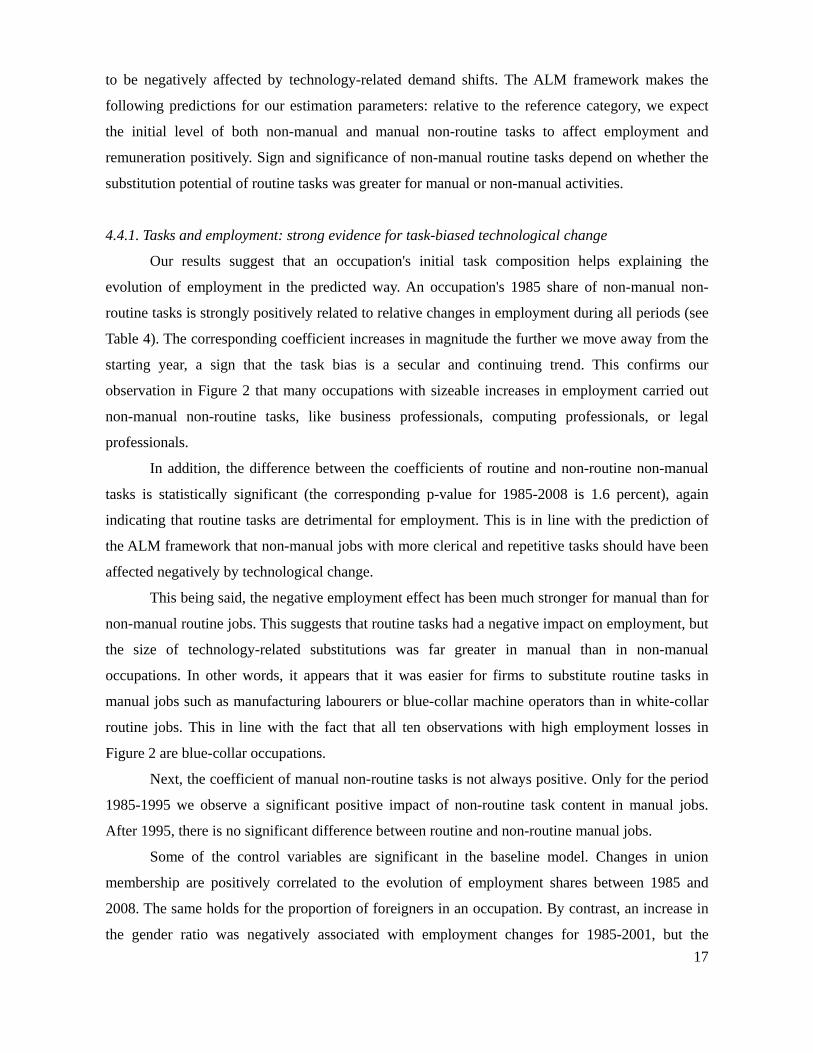
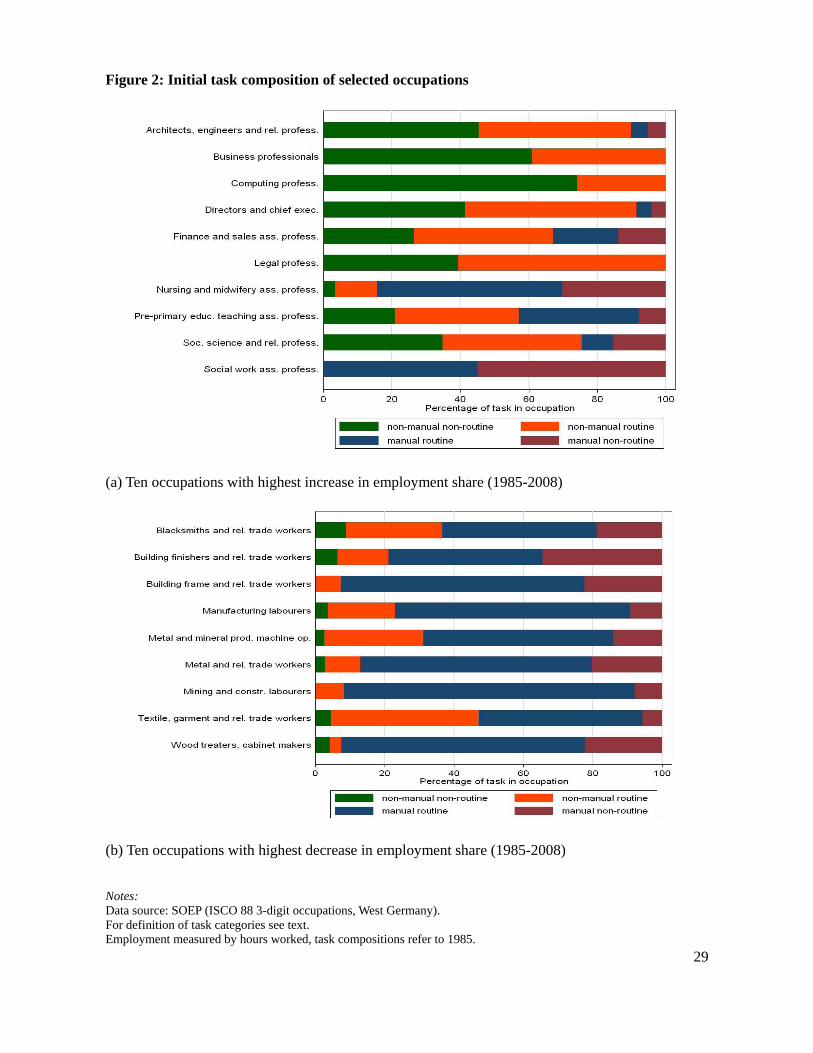
To illustrate the richness of the data, Figure 2 shows the initial task composition of the ten
occupations with the highest increase (panel (a)) and highest decrease (panel b)) in employment
shares between 1985 and 2008. The figure clearly shows that the occupations that gained
employment carry out predominantly non-manual tasks, and most of them have more than 20
percent of non-manual non-routine tasks. By contrast, the occupations that lost employment over
the same period had high initial levels of manual routine tasks. Although manual non-routine tasks
are predominantly found in the occupations with decreasing employment, some of the occupations
in panel (a) also carry out such tasks (e.g. nursing and midwifery associate professionals, social
worker associate professionals). Figure 2 also shows that there is considerable diversity within
identical occupational categories, even if measured at the detailed ISCO-88 three-digit level. None
of the occupations can be associated with a single type of task, which is why it would be
misleading, for instance, to refer to an occupation as being exclusively non-manual non-routine or
exclusively manual routine: in practice, all task types can be found in each occupation.
[Insert Figure 2]
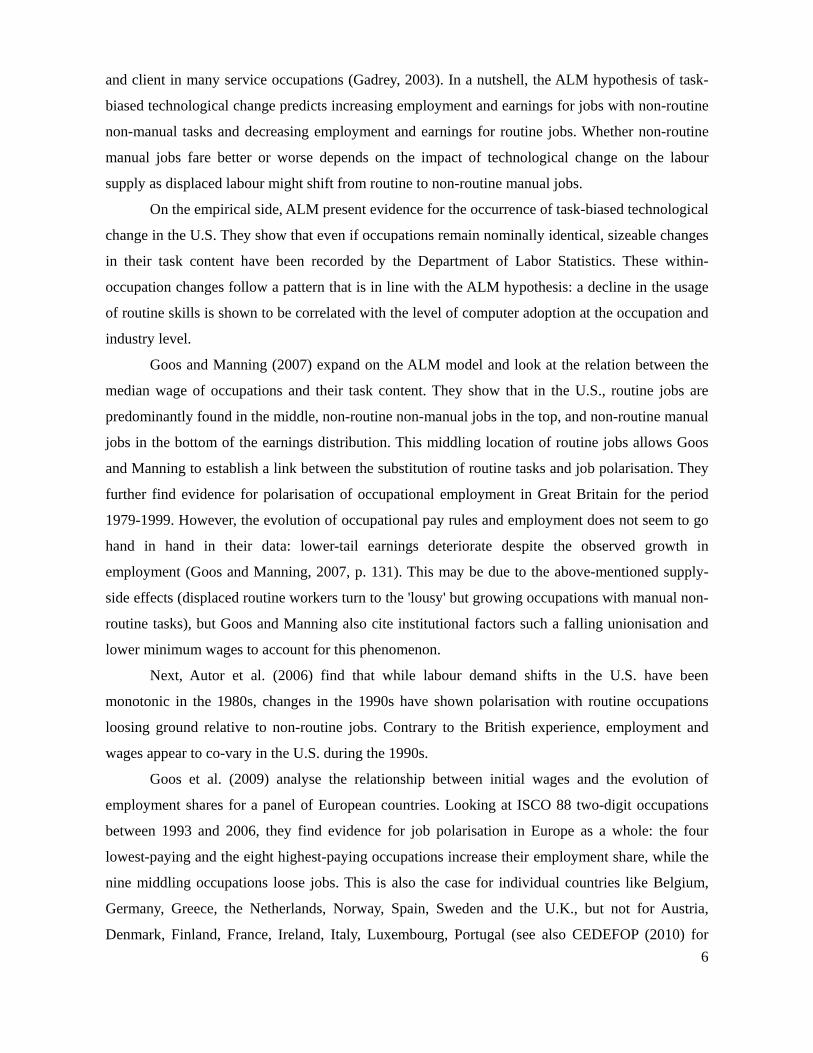
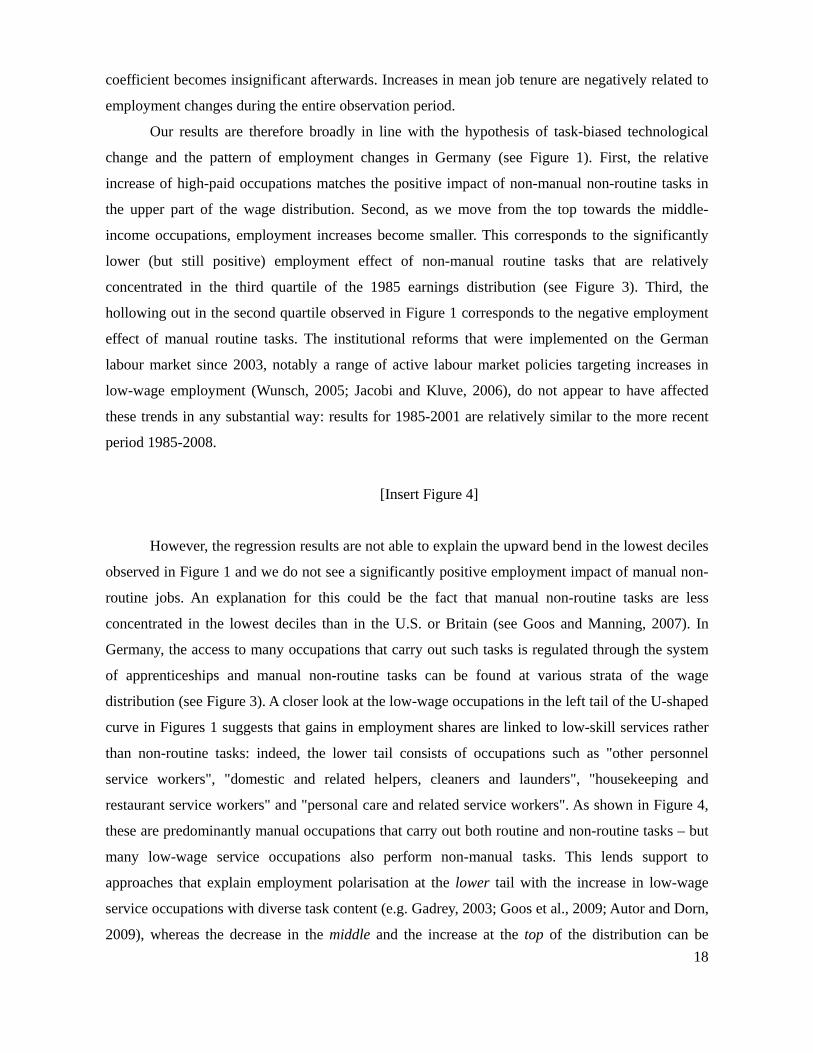
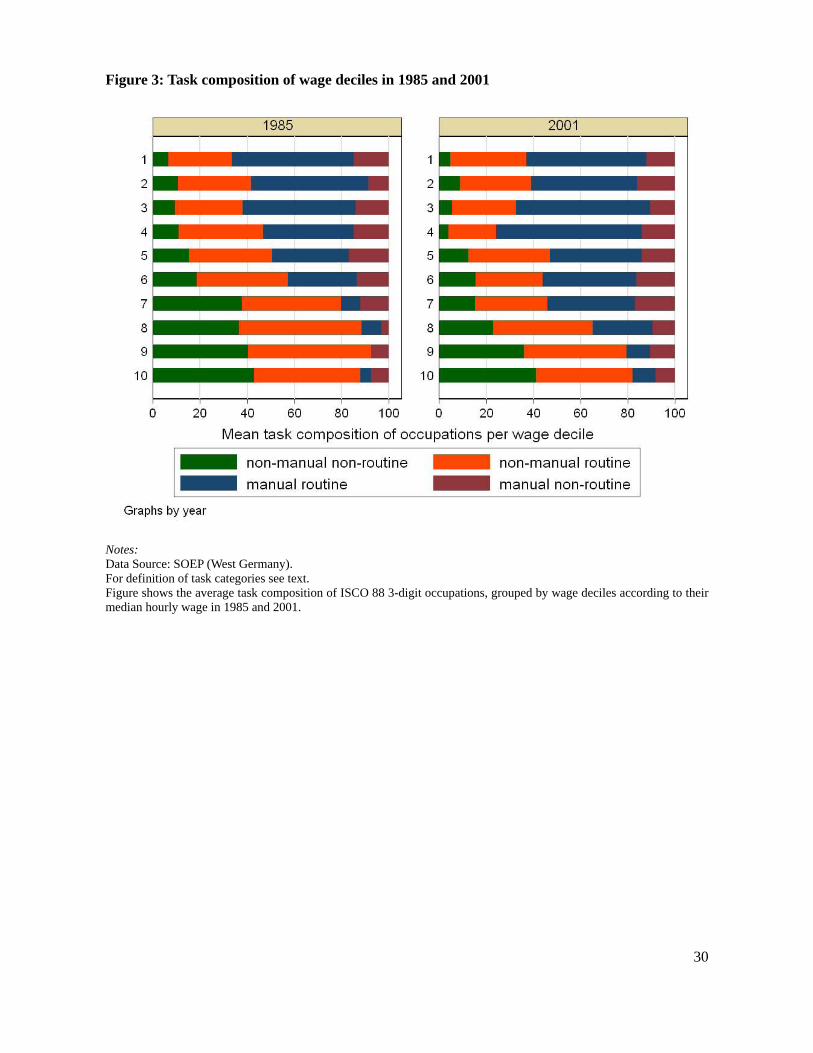
The link between job polarisation, on the one hand, and task-biased technological change,
on the other hand, hinges on the fact that the different task categories are unevenly distributed
across the initial wage structure. To verify that this is the case in our data, we have calculated the
task composition of occupations at different wage levels in 1985 and 2001, respectively. Figure 3
shows the respective task composition of wage deciles according to the median wage of three-digit
occupations. As can be seen, most of the task types are indeed distributed unevenly across the wage
15
distributions. Occupations in the upper deciles are predominantly non-manual. In particular, the
share of non-manual non-routine tasks in occupations belonging to the highest two deciles in 1985
was higher than 40 percent. By contrast, the proportion of manual routine tasks is higher in
occupations whose median wage is situated in the lower deciles. Interestingly, the proportion of
manual non-routine tasks appears to be more broadly distributed, with a proportion of around 10
percent in most deciles. This peculiar distribution of manual non-routine tasks is similar to the
findings by Goos and Manning (2007) for the US, where as much as 33 percent of occupations in
the upper tercile require manual non-routine skills.
[Insert Figure 3]
4.3. Model specification and descriptive statistics
Besides an occupation's task content, employment shares and hourly wages, the estimation
of Equations (2) and (3) requires the measurement of a range of additional variables that control for
changes in the occupation's labour composition. In our specification, the vector of control variables
X contains the following information: the proportion of temporary employment contracts
(TEMPORARY_CONTRACTSi,t); the proportion of trade union members6 (UNION_MEMBERSi,t);
the proportion of women (GENDER_RATIOi,t); the proportion of foreigners, where foreigners are
defined as workers with a non-German nationality (FOREIGNERSi,t); the average job tenure in the
occupation (TENUREi,t); and the educational composition of the occupation, measured in three
levels using the ISCED classification of educational attainment (EDUCATIONr,i,t): low = ISCED
level 0, 1 and 2; medium = ISCED level 3 and 4; high = ISCED level 5 and 6 (see CEDEFOP,
2010).
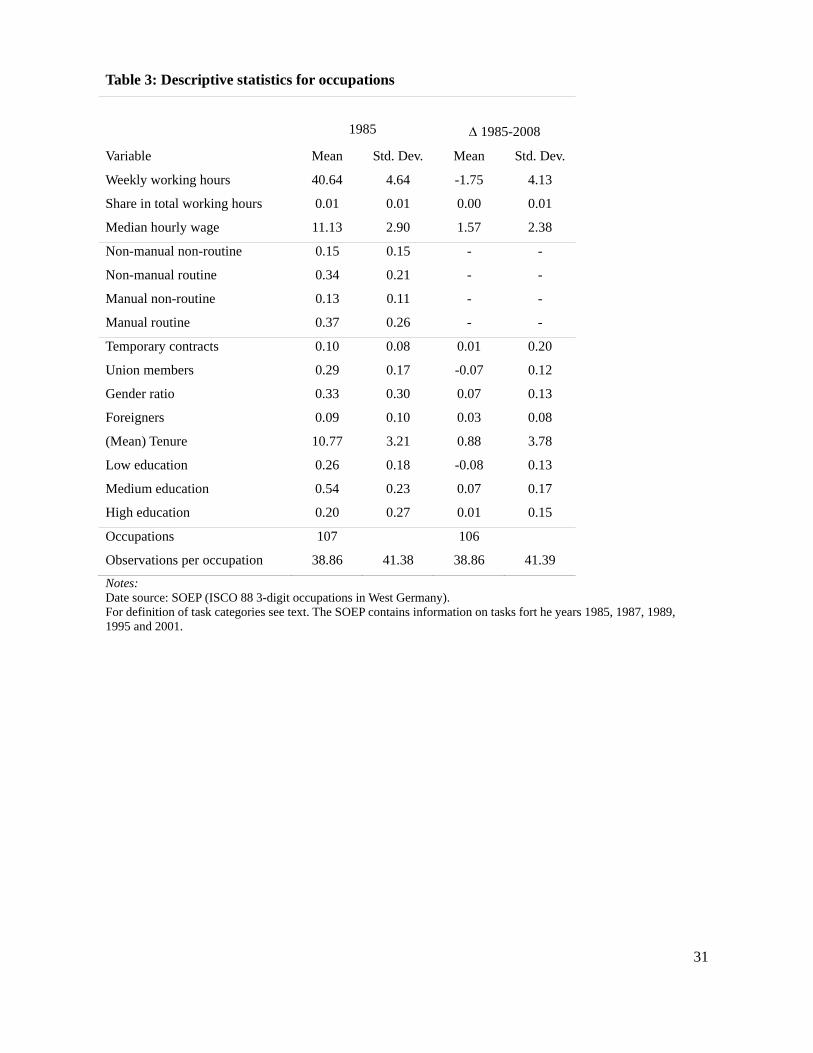
[Insert Table 3]
Descriptive statistics for all variables are presented in Table 3. The levels in the table
correspond to the 107 occupations observed in 1985, changes refer to the 106 occupations that
remained in the sample in 2008. The average number of individual observations in each occupation
was around 39 in both years.
The secular trends evidenced in the literature appear also in our data: on average, union
6 There is no information on union membership in the SOEP for the year 1995. The figures have been proxied with
union membership in 1993.
16
membership is declining at the occupational level by 7 percentage points; the proportion of women
and foreigners within occupations have increased by 7 and 3 percentage points, respectively; the
ageing of the work force led to an increase in average job tenure of 0.88 years; and, finally, medium
and high levels of education increased to the expense of low-level education. The share of
temporary contracts within occupations increased slightly from 10 to 11 percent.7 All descriptive
statistics suggest that our sample is representative for the German labour market, and in particular
for the compositional changes that occurred during recent decades.
4.4. Estimation results
Our baseline model includes the initial level of task shares in 1985 and the changes that
occurred in the dependent and control variables during the periods 1985-1995, 1985-2001, and
1985-2008 (see Table 4). Employment shares are measured in terms of actual working hours (an
alternative per capita measure is included among the robustness tests in Section 4.5). All standard
errors are robust to autocorrelation and heteroskedasticity. Like in Goos and Manning (2007), all
observations are weighted by initial employment shares. This procedure ensures that the regression
results are not biased by compositional changes in small occupations. Given that the variables used
in our model are computed from a sample of employee-level observations, the weighting of
occupations by employment shares also takes into account that average values are measured more
precisely in occupations with many observations.
[Insert Table 4]
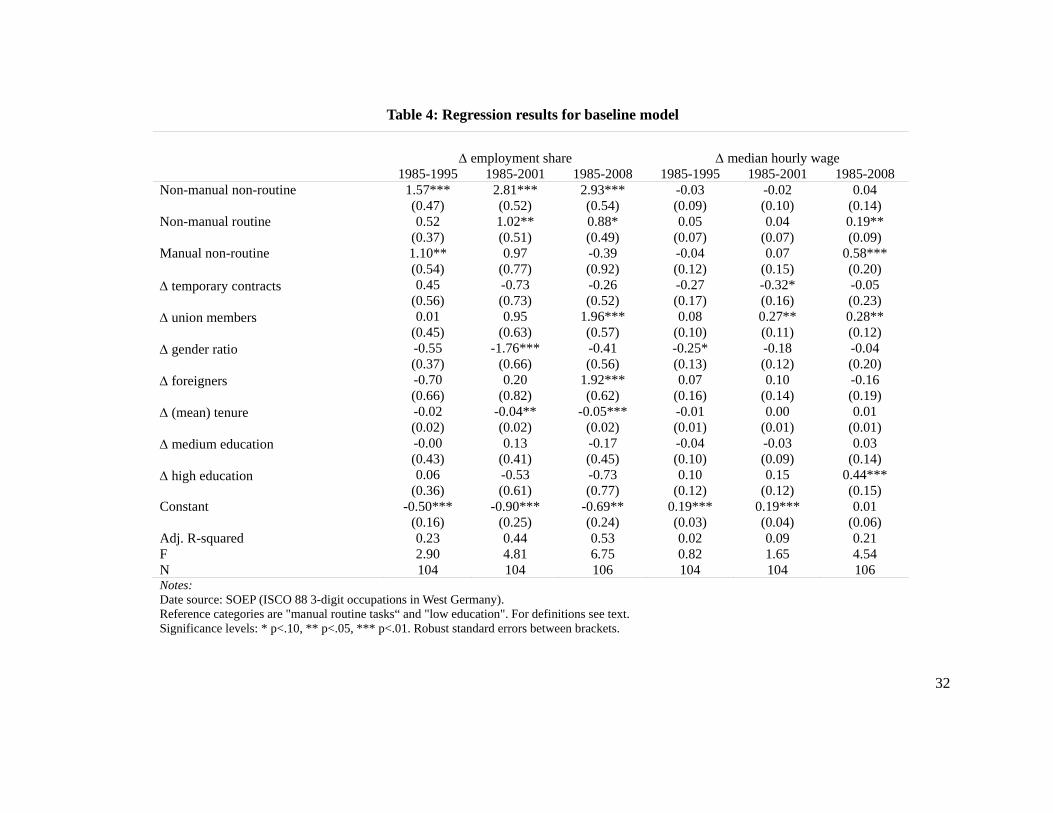
Columns 2 through 4 in Table 4 show the regression results for the change in occupational
employment shares (Equation (2)), columns 5 through 7 present the corresponding results for
changes in (log) median hourly earnings as dependent variable (Equation (3)). All estimated models
have a reasonably good fit and the adjusted coefficients of determination increase with the length of
the observation period (for 1985-2008, the R-squared of Equations (2) and (3) are 0.53 and 0.21,
respectively).
In all regressions, the reference category are the manual routine tasks that ALM hypothesise
7 As for the composition of the workforce in terms of industries, during the period at hand the German economy has
been marked by a shift from manufacturing- to service-sector employment. The share of the former in total employment has decreased from 36.14 % in 1989 to 26.39 % in 2001, while wholesale and retail trade (NACE code G) has increased by 3.12; real estate, renting and business activities (NACE code K) by 4.01; and health and social work (NACE code N) by 2.64 percentage points between 1985 and 2001.
17
to be negatively affected by technology-related demand shifts. The ALM framework makes the
following predictions for our estimation parameters: relative to the reference category, we expect
the initial level of both non-manual and manual non-routine tasks to affect employment and
remuneration positively. Sign and significance of non-manual routine tasks depend on whether the
substitution potential of routine tasks was greater for manual or non-manual activities.
4.4.1. Tasks and employment: strong evidence for task-biased technological change
Our results suggest that an occupation's initial task composition helps explaining the
evolution of employment in the predicted way. An occupation's 1985 share of non-manual non-
routine tasks is strongly positively related to relative changes in employment during all periods (see
Table 4). The corresponding coefficient increases in magnitude the further we move away from the
starting year, a sign that the task bias is a secular and continuing trend. This confirms our
observation in Figure 2 that many occupations with sizeable increases in employment carried out
non-manual non-routine tasks, like business professionals, computing professionals, or legal
professionals.
In addition, the difference between the coefficients of routine and non-routine non-manual
tasks is statistically significant (the corresponding p-value for 1985-2008 is 1.6 percent), again
indicating that routine tasks are detrimental for employment. This is in line with the prediction of
the ALM framework that non-manual jobs with more clerical and repetitive tasks should have been
affected negatively by technological change.
This being said, the negative employment effect has been much stronger for manual than for
non-manual routine jobs. This suggests that routine tasks had a negative impact on employment, but
the size of technology-related substitutions was far greater in manual than in non-manual
occupations. In other words, it appears that it was easier for firms to substitute routine tasks in
manual jobs such as manufacturing labourers or blue-collar machine operators than in white-collar
routine jobs. This in line with the fact that all ten observations with high employment losses in
Figure 2 are blue-collar occupations.
Next, the coefficient of manual non-routine tasks is not always positive. Only for the period
1985-1995 we observe a significant positive impact of non-routine task content in manual jobs.
After 1995, there is no significant difference between routine and non-routine manual jobs.
Some of the control variables are significant in the baseline model. Changes in union
membership are positively correlated to the evolution of employment shares between 1985 and
2008. The same holds for the proportion of foreigners in an occupation. By contrast, an increase in
the gender ratio was negatively associated with employment changes for 1985-2001, but the
18
coefficient becomes insignificant afterwards. Increases in mean job tenure are negatively related to
employment changes during the entire observation period.
Our results are therefore broadly in line with the hypothesis of task-biased technological
change and the pattern of employment changes in Germany (see Figure 1). First, the relative
increase of high-paid occupations matches the positive impact of non-manual non-routine tasks in
the upper part of the wage distribution. Second, as we move from the top towards the middle-
income occupations, employment increases become smaller. This corresponds to the significantly
lower (but still positive) employment effect of non-manual routine tasks that are relatively
concentrated in the third quartile of the 1985 earnings distribution (see Figure 3). Third, the
hollowing out in the second quartile observed in Figure 1 corresponds to the negative employment
effect of manual routine tasks. The institutional reforms that were implemented on the German
labour market since 2003, notably a range of active labour market policies targeting increases in
low-wage employment (Wunsch, 2005; Jacobi and Kluve, 2006), do not appear to have affected
these trends in any substantial way: results for 1985-2001 are relatively similar to the more recent
period 1985-2008.
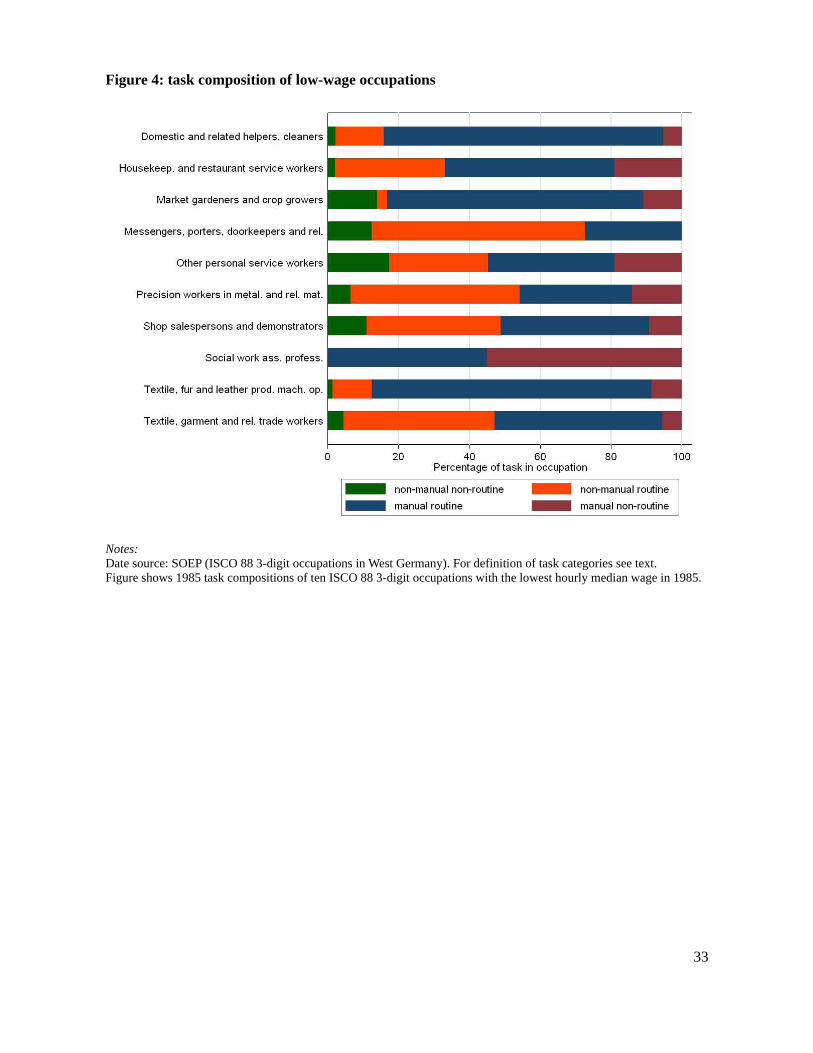
[Insert Figure 4]
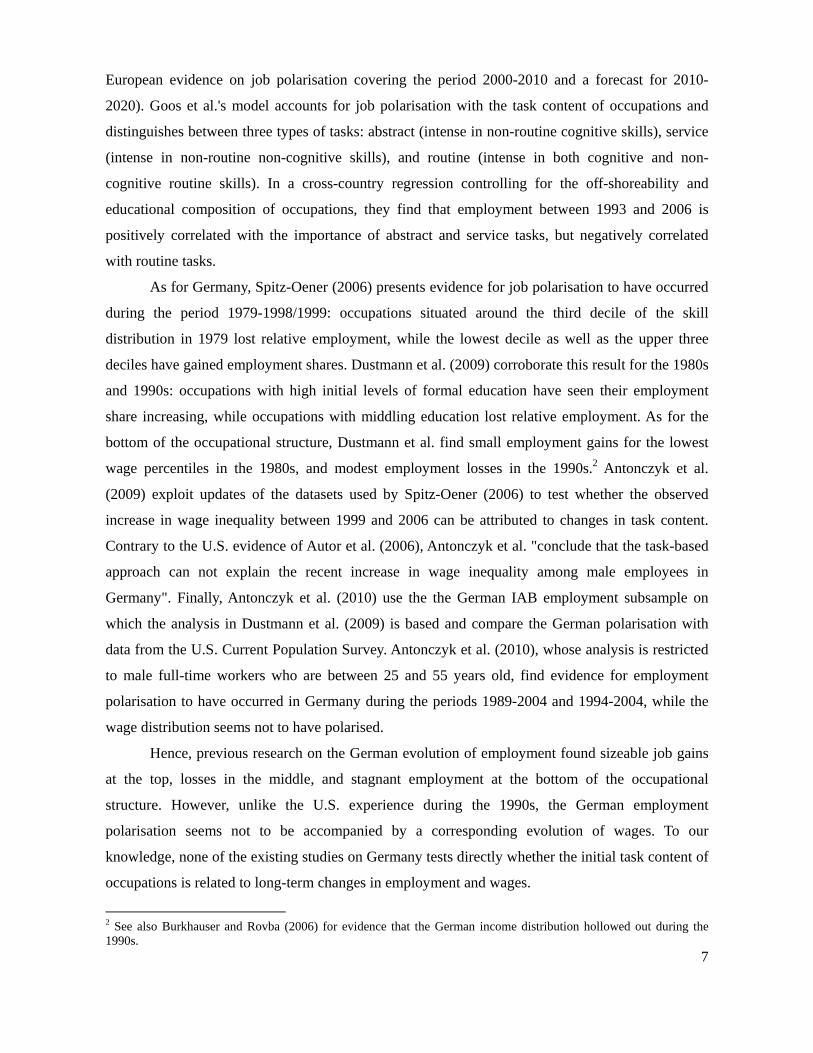
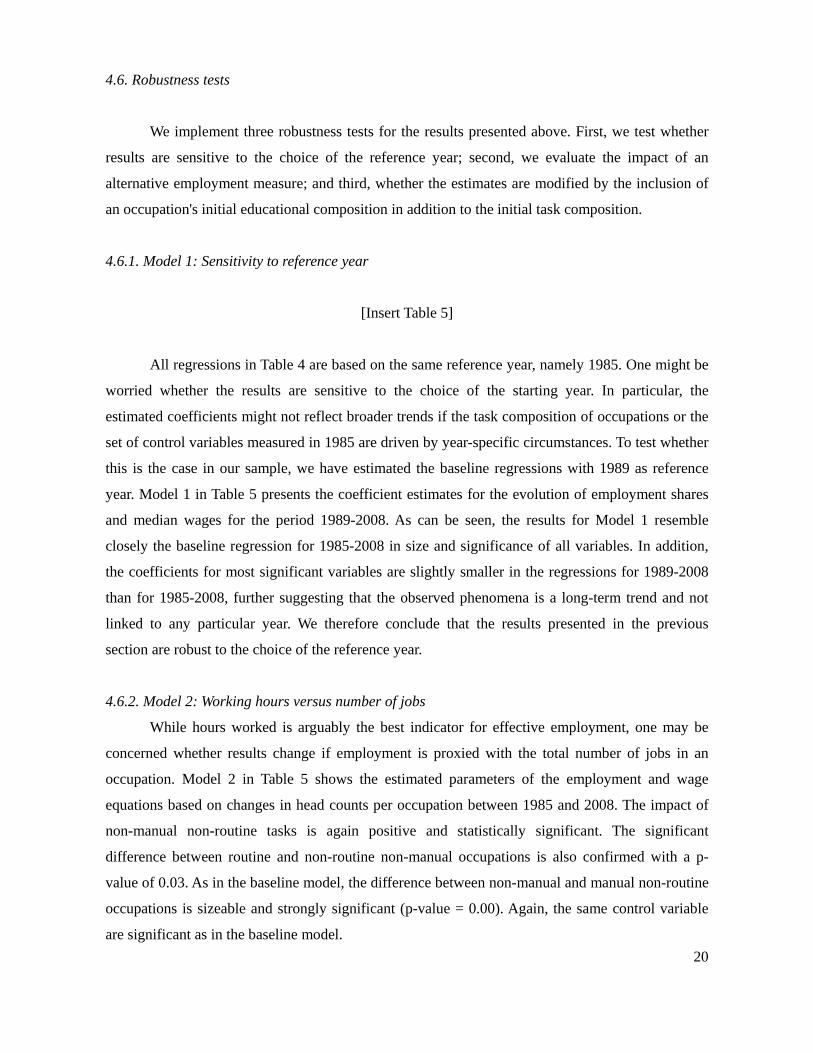
However, the regression results are not able to explain the upward bend in the lowest deciles
observed in Figure 1 and we do not see a significantly positive employment impact of manual non-
routine jobs. An explanation for this could be the fact that manual non-routine tasks are less
concentrated in the lowest deciles than in the U.S. or Britain (see Goos and Manning, 2007). In
Germany, the access to many occupations that carry out such tasks is regulated through the system
of apprenticeships and manual non-routine tasks can be found at various strata of the wage
distribution (see Figure 3). A closer look at the low-wage occupations in the left tail of the U-shaped
curve in Figures 1 suggests that gains in employment shares are linked to low-skill services rather
than non-routine tasks: indeed, the lower tail consists of occupations such as "other personnel
service workers", "domestic and related helpers, cleaners and launders", "housekeeping and
restaurant service workers" and "personal care and related service workers". As shown in Figure 4,
these are predominantly manual occupations that carry out both routine and non-routine tasks – but
many low-wage service occupations also perform non-manual tasks. This lends support to
approaches that explain employment polarisation at the lower tail with the increase in low-wage
service occupations with diverse task content (e.g. Gadrey, 2003; Goos et al., 2009; Autor and Dorn,
2009), whereas the decrease in the middle and the increase at the top of the distribution can be

19
associated with the task dichotomies manual/non-manual and routine/non-routine.
4.4.2. Evolution of pay rules: compositional changes matter, but no consistent task bias
The model of changes in median hourly earnings unveils a different set of factors (see
columns 5-7 of Table 4). Most importantly, the initial task composition is not consistently
associated with the evolution of occupational pay rules. The only significant task coeffients
correspond to non-manual routine and manual non-routine tasks in the regressions covering the
period 1985-2008. Note that the positive wage effect of manual non-routine occupations is not
matched by simultaneous employment gains for this category. This suggests that any positive
demand effect for this task category would have translated into higher wages rather than a rise in
employment. The biggest problem for an explanation of occupational pay rules with a technology-
related demand effect is the consistently insignicant coefficient for non-manual non-routine tasks, a
category that experienced strong employment increases over the period at hand.
However, Table 4 also shows that the compositional changes that occurred in an occupation
are often significantly related with the evolution of pay. First, we observe negative coeffients for the
share of temporary contracts and union membership. An increasing share of temporary contracts
depressed median earnings significantly over the period 1985-2001. The corresponding coefficients
are also negative for the other periods, although statistically insignificantly different from zero. By
contrast, changes in union membership are significantly and positively correlated with variations in
wages. This suggests that institutional factors continue to play an important role for the evolution of
occupational pay rules.
Gender and nationality appear to be only weakly related to changes in occupational
remuneration. An increase in the share of women in an occupation depresses hourly earnings for all
periods, but is only significant for 1985-1995. This could be interpreted as evidence for gender-
based pay discrimination, although the negative regression coefficient could also be driven by self-
selection or asymmetric sorting of women into low-pay occupations. There appears to be no pay
penalty associated with an increase in the share of workers with a foreign nationality.
Finally, the coefficient for the proportion of highly educated workers in an occupation has
the sign one would expect from human capital theory: an increase in high educational credentials
increases occupational pay relative to low levels of education. The size of this effect increases
through time and becomes significant for the period 1985-2008.
20
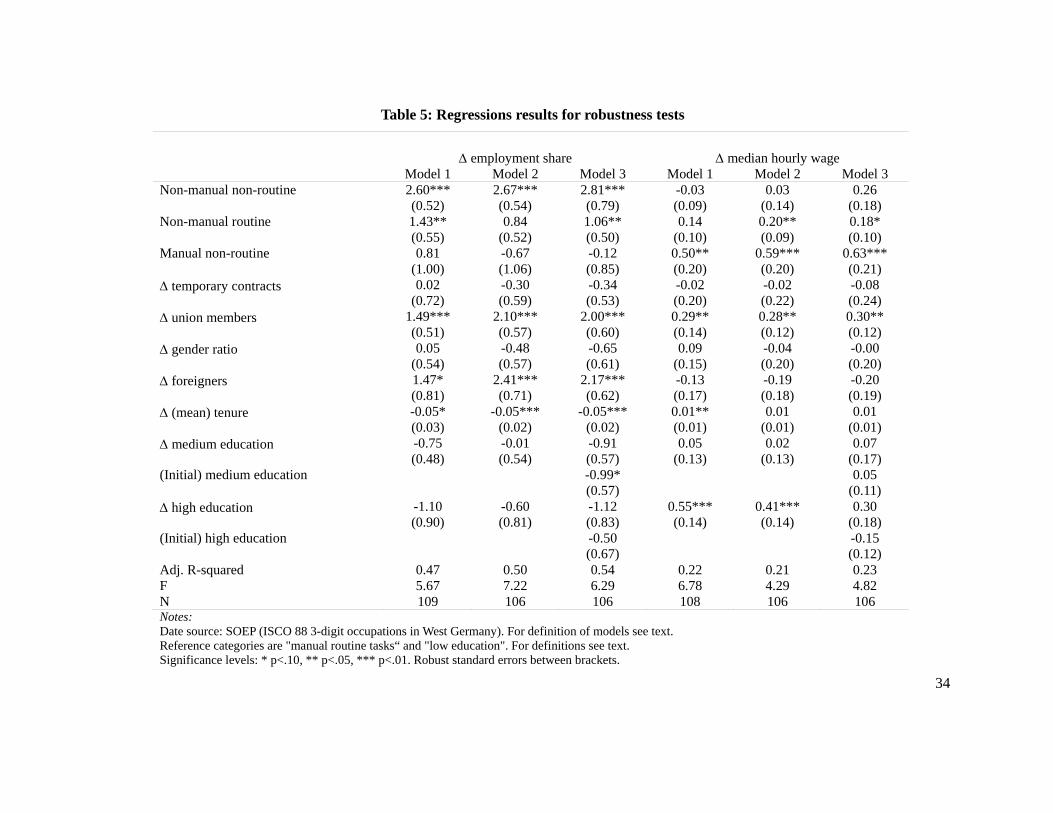
4.6. Robustness tests
We implement three robustness tests for the results presented above. First, we test whether
results are sensitive to the choice of the reference year; second, we evaluate the impact of an
alternative employment measure; and third, whether the estimates are modified by the inclusion of
an occupation's initial educational composition in addition to the initial task composition.
4.6.1. Model 1: Sensitivity to reference year
[Insert Table 5]
All regressions in Table 4 are based on the same reference year, namely 1985. One might be
worried whether the results are sensitive to the choice of the starting year. In particular, the
estimated coefficients might not reflect broader trends if the task composition of occupations or the
set of control variables measured in 1985 are driven by year-specific circumstances. To test whether
this is the case in our sample, we have estimated the baseline regressions with 1989 as reference
year. Model 1 in Table 5 presents the coefficient estimates for the evolution of employment shares
and median wages for the period 1989-2008. As can be seen, the results for Model 1 resemble
closely the baseline regression for 1985-2008 in size and significance of all variables. In addition,
the coefficients for most significant variables are slightly smaller in the regressions for 1989-2008
than for 1985-2008, further suggesting that the observed phenomena is a long-term trend and not
linked to any particular year. We therefore conclude that the results presented in the previous
section are robust to the choice of the reference year.
4.6.2. Model 2: Working hours versus number of jobs
While hours worked is arguably the best indicator for effective employment, one may be
concerned whether results change if employment is proxied with the total number of jobs in an
occupation. Model 2 in Table 5 shows the estimated parameters of the employment and wage
equations based on changes in head counts per occupation between 1985 and 2008. The impact of
non-manual non-routine tasks is again positive and statistically significant. The significant
difference between routine and non-routine non-manual occupations is also confirmed with a p-
value of 0.03. As in the baseline model, the difference between non-manual and manual non-routine
occupations is sizeable and strongly significant (p-value = 0.00). Again, the same control variable
are significant as in the baseline model.
21
The only notable difference between the two alternative employment measures is that we do
not find a significant difference between non-manual and manual routine tasks when shares are
based on head counts instead of hours worked. This indicates that during our observation period,
rationalisations affected the working hours of routine occupations stronger than the number of jobs.
An explanation for this could be that working hours are easier to adjust in response to technological
changes than the number of employees. We conclude that our results are fairly insensitive to the
choice of the employment measure.
4.6.3. Model 3: Task bias versus education bias
Finally, we test the sensitivity of our results to the inclusion of additional human capital
variables. This test is motivated by three factors. First, tasks and levels of formal education are
correlated so that it is relevant to investigate whether the observed task-bias is genuine or simply
reflecting a spurious correlation with education. Second, changes in the educational composition
within an occupation might be related to initial levels, so that the exclusion of the latter could lead
to an omitted variable bias. Third, including both the initial level of tasks and education allows to
measure directly whether employment and wage changes are task-biased and/or education-biased.
Model 3 in Table 5 shows the regression output with the initial composition of educational
attainment in the regression. Only the initial level of medium education is found to be significantly
related to changes in employment, albeit with a negative coefficient. Moreover, in the augmented
wage equation, neither initial levels nor changes in educational composition are significant. These
results are not in line with the skill-biased technological change hypothesis. Indeed, the latter
suggests that employment and wages should rise (decline) in occupations where the initial level of
education is high (low) and/or increasing (decreasing).
By contrast, the inclusion of initial levels of education hardly affects the coefficients of the
task variables. In addition, the adjusted determination coefficients do not increase much (e.g. 54 %
compared to 53 %, without the initial educational composition, in the employment regression). In
other words, our robustness test suggests that the evolution of employment is the result of a task
bias rather than an education bias. The impact of education is, therefore, far from being as
determinant as one might expect from the literature on skill-biased technological change. In all, we
conclude that our estimations stand up to the series of robustness tests presented in this section.
22
5. Conclusion
This paper examined the evolution of employment and remuneration for detailed
occupations on the German labour market. We used representative individual-level panel data for
the period 1985-2008 to update evidence that the German occupational structure has polarised. We
find that occupations situated around the 40th percentile of the earnings distribution in 1985 have
lost, and high-paid occupations have gained employment shares. The lowest percentiles stagnated or
recorded minor employment losses.
Next, we have shown that contrary to what one might expect from standard labour market
models, this pattern of job polarisation is not matched by a symmetric evolution of occupational
pay: the correlation between changes in employment and remuneration is extremely weak. We also
provide new evidence that these trends have not been altered by the substantial labour market
reforms that have been implemented in Germany since 2003.
Using panel data on the task content of occupations in Germany, we provided the first direct
test for whether these long-run trends can be explained in a framework distinguishing between non-
manual non-routine, non-manual routine, manual non-routine and manual routine tasks. We
presented econometric evidence for task-biased technological change: the initial task content in
1985 explains a considerable proportion of the changes in the employment structure that occurred in
the German economy between 1985 and 2008. The higher the share of routine jobs in an occupation
in 1985, the more jobs have been lost to predominantly non-routine occupations, especially in
manual occupations. Relatively high-paid non-manual non-routine occupations like engineers or
managers have gained employment shares compared to non-manual routine occupations in which
computers are typically assumed to be substitutes for routine tasks (e.g. office clerks, typists, bank
tellers). The strongest employment losses are associated with high initial levels of the manual
routine tasks that are predominantly carried out by occupations with below-median earnings (e.g.
assemblers or machine operators). Contrary to the existing evidence for the U.S. and Britain, the
upward bend in the lower tail of the wage distribution is not linked to a concentration of manual
non-routine tasks: in the case of Germany, these tasks can be found at all levels of the wage
structure. We argue that lower-tail employment polarisation is linked to job gains in a group of low-
paid service occupations and show that these occupations carry out more diverse tasks than the
predominantly manual routine blue-collar occupations that have lost employment shares.
While tasks explains a substantial part of the variation in employment, the evolution of pay
rules is not consistently task-biased. By contrast, our results suggest that compositional changes
such as increasing union membership and levels of formal education are significantly associated
23
with long-run changes in hourly earnings.
We conclude that the trends documented in this paper cannot be accounted for by a simple
demand shift: while our results suggest that employment is affected by what occupations actually do
– manual or non-manual, routine or non-routine, manufacturing or service activities – the evolution
of occupational pay does not appear to be task-biased and depends on compositional factors. This
disconnection between employment and remuneration showcases the limitations of labour market
models in which quantities and prices evolve symmetrically.
References
Acemoglu, D., 2001. Good jobs versus bad jobs. Journal of Labor Economics 19 (1), 1-21.
Antonczyk, D., DeLeire, T., Fitzenberger, B., 2010. Polarization and rising wage inequality:
Comparing the US and Germany. IZA Discussion Paper, 4842.
Antonczyk, D., Fitzenberger, B., Leuschner, U., 2009. Can a task-based approach explain the recent
changes in the German wage structure? Journal of Economics and Statistics 229, 214–238.
Autor, D., Katz, L., Kearney, M., 2006. The polarization of the U.S. labor market. American
Economic Review 96 (2), 189-194.
Autor, D., Levy, F., Murnane, R., 2003. The skill content of recent technological change: An
empirical exploration. Quarterly Journal of Economics 118 (4), 1279-1333.
Autor, D., Dorn, D., 2009. Inequality and specialization: the growth of low-skill service jobs in the
United States. IZA Discussion Paper, 4290.
Blinder, A., 2009. Offshoring: Big deal or business as usual? In: Bhagwati J., Blinder, A. (Eds),
Offshoring of American jobs. What response from U.S. economic policy?, Cambridge, MA:
MIT Press.
Burkhauser, R., Rovba, L., 2006. Income inequality in the 1990s: comparing the United States,
Great Britain and Germany. DIW Discussion Paper, 576.
Card, D., DiNardo, J., 2002. Skill-biased technological change and rising wage inequality: Some
problems and puzzles. Journal of Labor Economics 20 (4), 733-783.
CEDEFOP, 2010. Skills supply and demand in Europe. Medium-term forecast up to 2020.
Luxembourg: Publication Office of the European Union.
Doeringer, P., Piore, M., 1985. Internal labor markets and manpower analysis. ME Sharpe.
Dustmann, C., Ludsteck, J., Schoenberg, U., 2009. Revisiting the German wage structure. Quarterly
Journal of Economics 124 (2), 843-881.
Freeman, R., 2004. Trade wars: The exaggerated impact of trade in economic debate. World
Economy 27 (1), 1-23.
24
Gadrey, J., 1996. Services: la productivité en question. Desclée de Brouwer.
Gadrey, J., 2003. Socio-economie des services. Paris: La Découverte.
Goos, M., Manning, A., 2007. Lousy and lovely jobs: The rising polarization of work in Britain.
Review of Economics and Statistics 89 (1), 118-133.
Goos, M., Manning, A., Salomons, A., 2009. Job polarization in Europe. American Economic
Review, 99 (2), 58-63.
Hijzen, A., 2007. International outsourcing, technological change, and wage inequality. Review of
International Economics 15 (1), 188-205.
International Labour Organization, 1990. International standard classification of occupations
(ISCO-88). Geneva: International Labour Office.
Jacobi, L., and Kluve, J., 2006. Before and after the Hartz reforms: The performance of active
labour market policy in Germany. IZA Discussion Paper, 2100.
Kalleberg, A., 2000. Nonstandard employment relations: Part-time, temporary and contract work.
Annual Review of Sociology 26, 341-365.
Katz, L., Autor, D., 1999. Changes in the wage structure and earnings inequality. In Ashenfelter, O.,
Card (Eds), Handbook of labor economics, vol. 3, North-Holland: Amsterdam; 1999. p. 1463-
1555.
Lemieux, T., 2008. The changing nature of wage inequality. Journal of Population Economics 21,
21-48.
Levy, F., Murnane, R., 1992. US earnings levels and earnings inequality: A review of recent trends
and proposed explanations. Journal of Economic Literature 30 (3), 1333-1381.
Manning, A., 2004. We can work it out: The impact of technological change on the demand for low-
skill workers. Scottish Journal of Political Economy 51 (5), 581-608.
Meisenheimer, J., 1998. The services industry in the 'good' versus 'bad' jobs debate. Monthly Labor
Review 121 (2), 22-47.
Mincer, J., 1970. The Distribution of labour incomes: A survey with special reference to the human
capital approach. Journal of Economic Literature 8 (1), 1-26.
Nordhaus, W., 2007. Two centuries of productivity growth in computing. Journal of Economic
History 67 (1), 128-159.
OECD, 2001. The characteristics and quality of service sector jobs. In OECD (Eds), OECD
employment outlook. OECD: Paris; 2001. p. 89-128.
Spitz-Oener, A., 2006. Technical change, job tasks and rising educational demands: Looking outside
the wage structure. Journal of Labor Economics 24 (2), 235-270.
Wagner, G., Frick, J., Schupp, J., 2007. The German socio-economic panel study. Scope, evolution

25
and enhancements. Journal of Applied Social Science Studies 127 (1), 139-169.
Wunsch, C., 2005. Labour market policy in Germany: Institutions, iInstruments and reforms since
Unification. Discussion Paper Univsertät Sankt Gallen, 2005-06.
26
Figure 1: Evolution of employment shares in West Germany (1985-2008), occupations
ranked by initial median hourly wage
(a) Scatter plot and prediction curve of occupations weighted by 1985 employment shares
(b) Occupations grouped in percentiles
Notes:
Data source: SOEP (ISCO 88 3-digit occupations), earnings are CPI-deflated. Shares based on hours worked in occupations. Each circle in panel (a) represents an ISCO 88 3-digit occupation, curves are quadratic prediction plots and 95% confidence intervals. The curve in panel (b) is a locally weighted non-parametric smoothing regression (bandwith = 0.8).
27
Table 1: Regression analysis of hourly earnings and employment Period
1985-1989
985-1995
1985-2001
1985-2008
(a) DEPENDENT VARIABLE: change in employment share (measured by head counts) (log) initial median hourly wage 0.15
(1.08)-2.75 (2.21)
-6.33** (3.06)
-10.35** (4.14)
sq. (log) initial median hourly wage -0.08 (0.23)
0.62 (0.46)
1.42** (0.61)
2.28*** (0.84)
constant 0.09 (1.26)
3.02 (2.66)
6.48* (3.79)
11.36** (4.99)
Adj. R-squared 0.04 0.02 0.07 0.10 F 2.14 1.23 5.34 6.88 N 107 105 104 106
(b) DEPENDENT VARIABLE: change in employment share (measured by working hours)
(log) initial median hourly wage 0.64 (1.14)
-1.72 (1.92)
-4.84* (2.63)
-8.47** (3.80)
sq. (log) initial median hourly wage -0.18 (0.25)
0.42 (0.42)
1.19** (0.55)
1.98** (0.79)
constant -0.50 (1.30)
1.66 (2.19)
4.62 (3.10)
8.63* (4.47)
Adj. R-squared 0.05 0.03 0.13 0.14 F 1.46 0.99 6.13 7.98 N 107 105 104 106
(c) DEPENDENT VARIABLE: change in (log) median hourly wage
(log) initial median hourly wage 0.05 (0.44)
-0.68 (0.71)
-0.02 (0.72)
0.54 (0.88)
sq. (log) initial median hourly wage -0.02 (0.09)
0.12 (0.15)
-0.01 (0.15)
-0.15 (0.18)
constant 0.11 (0.56)
1.10 (0.87)
0.31 (0.89)
-0.31 (1.09)
Adj. R-squared 0.01 0.05 0.02 0.05 F 1.57 1.92 1.85 5.29 N 107 105 104 106
(d) DEPENDENT VARIABLE: change in employment share (measured by working hours)
change in (log) median hourly wage -0.18 (0.28)
-1.06*** (0.34)
-0.83 (0.57)
-0.39 (0.51)
constant 0.00 (0.06)
0.20** (0.10)
0.07 (0.18)
-0.14 (0.15)
Adj. R-squared -0.01 0.05 0.01 -0.00 F 0.43 9.45 2.14 0.59 N 107 105 104 106 Notes:
Data source: SOEP (ISCO 88 3-digit occupations, West Germany). Significance levels: * p<.10, ** p<.05, *** p<.01. Robust standard errors between brackets.
28
Table 2: Share in total hours worked according to task categories
1985
1989
1995
2001
Non-manual non-routine 17.33 17.63 18.87 19.35
Non-manual routine 37.89 37.12 37.96 35.02
Manual non-routine 32.89 34.85 32.51 32.92
Manual routine 11.89 10.40 10.66 12.71
Notes: Data source: SOEP. Shares refer to West Germany. For definition of task categories see text.
29
Figure 2: Initial task composition of selected occupations
(a) Ten occupations with highest increase in employment share (1985-2008)
(b) Ten occupations with highest decrease in employment share (1985-2008)
Notes: Data source: SOEP (ISCO 88 3-digit occupations, West Germany). For definition of task categories see text. Employment measured by hours worked, task compositions refer to 1985.
30
Figure 3: Task composition of wage deciles in 1985 and 2001
Notes: Data Source: SOEP (West Germany). For definition of task categories see text. Figure shows the average task composition of ISCO 88 3-digit occupations, grouped by wage deciles according to their median hourly wage in 1985 and 2001.
31
Table 3: Descriptive statistics for occupations
1985
1985-2008
Variable Mean Std. Dev. Mean Std. Dev.
Weekly working hours 40.64 4.64 -1.75 4.13
Share in total working hours 0.01 0.01 0.00 0.01
Median hourly wage 11.13 2.90 1.57 2.38
Non-manual non-routine 0.15 0.15 - -
Non-manual routine 0.34 0.21 - -
Manual non-routine 0.13 0.11 - -
Manual routine 0.37 0.26 - -
Temporary contracts 0.10 0.08 0.01 0.20
Union members 0.29 0.17 -0.07 0.12
Gender ratio 0.33 0.30 0.07 0.13
Foreigners 0.09 0.10 0.03 0.08
(Mean) Tenure 10.77 3.21 0.88 3.78
Low education 0.26 0.18 -0.08 0.13
Medium education 0.54 0.23 0.07 0.17
High education 0.20 0.27 0.01 0.15
Occupations 107 106
Observations per occupation 38.86 41.38 38.86 41.39
Notes: Date source: SOEP (ISCO 88 3-digit occupations in West Germany). For definition of task categories see text. The SOEP contains information on tasks fort he years 1985, 1987, 1989, 1995 and 2001.
32
Table 4: Regression results for baseline model
employment share
median hourly wage
1985-1995 1985-2001 1985-2008 1985-1995 1985-2001 1985-2008 Non-manual non-routine 1.57***
(0.47) 2.81*** (0.52)
2.93*** (0.54)
-0.03 (0.09)
-0.02 (0.10)
0.04 (0.14)
Non-manual routine 0.52 (0.37)
1.02** (0.51)
0.88* (0.49)
0.05 (0.07)
0.04 (0.07)
0.19** (0.09)
Manual non-routine 1.10** (0.54)
0.97 (0.77)
-0.39 (0.92)
-0.04 (0.12)
0.07 (0.15)
0.58*** (0.20)
temporary contracts 0.45 (0.56)
-0.73 (0.73)
-0.26 (0.52)
-0.27 (0.17)
-0.32* (0.16)
-0.05 (0.23)
union members 0.01 (0.45)
0.95 (0.63)
1.96*** (0.57)
0.08 (0.10)
0.27** (0.11)
0.28** (0.12)
gender ratio -0.55 (0.37)
-1.76*** (0.66)
-0.41 (0.56)
-0.25* (0.13)
-0.18 (0.12)
-0.04 (0.20)
foreigners -0.70 (0.66)
0.20 (0.82)
1.92*** (0.62)
0.07 (0.16)
0.10 (0.14)
-0.16 (0.19)
(mean) tenure -0.02 (0.02)
-0.04** (0.02)
-0.05*** (0.02)
-0.01 (0.01)
0.00 (0.01)
0.01 (0.01)
medium education -0.00 (0.43)
0.13 (0.41)
-0.17 (0.45)
-0.04 (0.10)
-0.03 (0.09)
0.03 (0.14)
high education 0.06 (0.36)
-0.53 (0.61)
-0.73 (0.77)
0.10 (0.12)
0.15 (0.12)
0.44*** (0.15)
Constant -0.50*** (0.16)
-0.90*** (0.25)
-0.69** (0.24)
0.19*** (0.03)
0.19*** (0.04)
0.01 (0.06)
Adj. R-squared 0.23 0.44 0.53 0.02 0.09 0.21 F 2.90 4.81 6.75 0.82 1.65 4.54 N 104 104 106 104 104 106 Notes: Date source: SOEP (ISCO 88 3-digit occupations in West Germany). Reference categories are "manual routine tasks“ and "low education". For definitions see text. Significance levels: * p<.10, ** p<.05, *** p<.01. Robust standard errors between brackets.
33
Figure 4: task composition of low-wage occupations
Notes: Date source: SOEP (ISCO 88 3-digit occupations in West Germany). For definition of task categories see text. Figure shows 1985 task compositions of ten ISCO 88 3-digit occupations with the lowest hourly median wage in 1985.
34
Table 5: Regressions results for robustness tests
employment share
median hourly wage
Model 1 Model 2 Model 3 Model 1 Model 2 Model 3 Non-manual non-routine 2.60***
(0.52) 2.67*** (0.54)
2.81*** (0.79)
-0.03 (0.09)
0.03 (0.14)
0.26 (0.18)
Non-manual routine 1.43** (0.55)
0.84 (0.52)
1.06** (0.50)
0.14 (0.10)
0.20** (0.09)
0.18* (0.10)
Manual non-routine 0.81 (1.00)
-0.67 (1.06)
-0.12 (0.85)
0.50** (0.20)
0.59*** (0.20)
0.63*** (0.21)
temporary contracts 0.02 (0.72)
-0.30 (0.59)
-0.34 (0.53)
-0.02 (0.20)
-0.02 (0.22)
-0.08 (0.24)
union members 1.49*** (0.51)
2.10*** (0.57)
2.00*** (0.60)
0.29** (0.14)
0.28** (0.12)
0.30** (0.12)
gender ratio 0.05 (0.54)
-0.48 (0.57)
-0.65 (0.61)
0.09 (0.15)
-0.04 (0.20)
-0.00 (0.20)
foreigners 1.47* (0.81)
2.41*** (0.71)
2.17*** (0.62)
-0.13 (0.17)
-0.19 (0.18)
-0.20 (0.19)
(mean) tenure -0.05* (0.03)
-0.05*** (0.02)
-0.05*** (0.02)
0.01** (0.01)
0.01 (0.01)
0.01 (0.01)
medium education -0.75 (0.48)
-0.01 (0.54)
-0.91 (0.57)
0.05 (0.13)
0.02 (0.13)
0.07 (0.17)
(Initial) medium education
-0.99* (0.57)
0.05 (0.11)
high education -1.10 (0.90)
-0.60 (0.81)
-1.12 (0.83)
0.55*** (0.14)
0.41*** (0.14)
0.30 (0.18)
(Initial) high education
-0.50 (0.67)
-0.15 (0.12)
Adj. R-squared 0.47 0.50 0.54 0.22 0.21 0.23 F 5.67 7.22 6.29 6.78 4.29 4.82 N 109 106 106 108 106 106Notes: Date source: SOEP (ISCO 88 3-digit occupations in West Germany). For definition of models see text. Reference categories are "manual routine tasks“ and "low education". For definitions see text. Significance levels: * p<.10, ** p<.05, *** p<.01. Robust standard errors between brackets.