IXEN-AR-2020 Consolidated Audited Annual Report
28
Consolidated Annual Report 2020 1 Translation from Estonian CONSOLIDATED ANNUAL REPORT beginning of financial year: 01.01.2020 end of financial year: 31.12.2020 business name: Ixellion AS registry code: 14044225 street name, house and office number: Mõisa 4–2 city: Tallinn county: Harju County postal code: 13522 e-mail address: [email protected] website: www.ixellion.eu
Transcript of IXEN-AR-2020 Consolidated Audited Annual Report
Consolidated Annual Report 2020
1
Translation from Estonian
CONSOLIDATED ANNUAL REPORT
beginning of financial year: 01.01.2020
end of financial year: 31.12.2020
business name: Ixellion AS
registry code: 14044225
street name, house and office number: Mõisa 4–2
city: Tallinn
county: Harju County
postal code: 13522
e-mail address: [email protected]
website: www.ixellion.eu
Consolidated Annual Report 2020
2
Table of Contents Management Report ............................................................................................................................................................................................... 3 Financial Statements .............................................................................................................................................................................................. 5
Consolidated Balance Sheet ...................................................................................................................................................................... 5 Consolidated Income Statement ................................................................................................................................................................ 6 Consolidated Cash Flow Statement ........................................................................................................................................................... 7 Consolidated Statement of Comprehensive Income ................................................................................................................................ 8 Consolidated Statement of Changes in Equity ......................................................................................................................................... 9 Notes to Financial Statements ................................................................................................................................................................. 10
Note 1 Accounting Policies ...................................................................................................................................................... 10 Note 2 Short-term Financial Investments ............................................................................................................................... 14 Note 3 Receivables and Prepayments .................................................................................................................................... 15 Note 4 Inventories ..................................................................................................................................................................... 16 Note 5 Shares of Subsidiaries ................................................................................................................................................. 16 Note 6 Loans Payable ............................................................................................................................................................... 17 Note 7 Payables and Prepayments .......................................................................................................................................... 17 Note 8 Sales Revenue ............................................................................................................................................................... 18 Note 9 Other Operating Revenue ............................................................................................................................................. 18 Note 10 Goods, Raw Materials and Services ............................................................................................................................ 18 Note 11 Staff Costs ..................................................................................................................................................................... 18 Note 12 Profit (Loss) from Financial Investments ................................................................................................................... 19 Note 13 Other Financial Income and Expenses ....................................................................................................................... 19 Note 14 Related Parties .............................................................................................................................................................. 19 Note 15 Events after Reporting Date ......................................................................................................................................... 21 Note 16 Unconsolidated Balance Sheet .................................................................................................................................... 21 Note 17 Unconsolidated Income Statement ............................................................................................................................. 23 Note 18 Unconsolidated Cash Flow Statement ........................................................................................................................ 24 Note 19 Unconsolidated Statement of Changes in Equity ...................................................................................................... 25 Note 20 Non-monetary Transactions in Cash Flow Statement ............................................................................................... 25 Note 21 Impact of Coronavirus .................................................................................................................................................. 26
Signatures to Annual Report ....................................................................................................................................................................... 26
Sworn Auditor’s Report ............................................................................................................................................................................... 26
Consolidated Annual Report 2020
3
Management Report Ixellion AS (www.ixellion.eu) is a holding company that forms a group along with parent company G.U.S Investments OÜ (www.gus-
investments.ee) and subsidiaries Ixellion Technologies Ltd and X Technologies Ltd. The group has been founded for the purpose of
research and development activities and innovative industrial applications in the field of science and engineering. The group primarily
focuses on the fields of aeronautics, green energy (high-efficiency engines and generators) and energy recovery and innovative
technological manufacturing methods.
In 2020 the reorganisation of the asset structure of the group continued. The objective of the group is to acquire special raw materials, know-how, technologies, industrial methods and intellectual properties to commence industrial manufacturing by applying the properties
in operating companies via acquisition thereof. The group has sufficient inventories of nickel wire with a high degree of purity, which are
necessary for industrial application of technologies acquired. The inventories of the group are audited by the German Institute for Rare
Earths and Strategic Metals (ISE). Due to the COVID-19 pandemic, travelling and organisation of meetings in different countries are
complicated and, thus, several activities, including launch of industrial projects, have been delayed.
Ixellion AS as a technological holding company is the main group company mostly because the company is a collector of major part of
the technologies of the entire group. In 2020, the separate result of parent company Ixellion AS comprised a loss of EUR 45.9 million. The
financial information about parent company Ixellion AS has been provided in the notes to the consolidated report (Notes 16–19). The
group earned a profit of EUR 840.7 million during the financial year.
In 2019 G.U.S. INVESTMENTS OÜ, the parent company, decided to list the shares of Ixellion AS by way of the Direct Listing Process on
the Munich Stock Exchange (m:Access OTC Regulated Market). The corresponding resolution was adopted in January 2020. In order to
start the listing process, the company had to be transformed into a public limited company. In 2020 Ixellion OÜ was transformed into a
public limited company. The sole objective of the transformation was to change the legal form of the company into a public limited company.
The primary purpose of raising funds from the stock exchange is to launch industrial projects. Listing on the stock exchange also enables the transfer and exchange of shares between other securities depositories, such as Clearstream and Euroclear, which renders it possible
to engage new shareholders from different countries. Upon listing shares, it is also possible to use the shares in swaps in order to acquire
strategic companies necessary for launching the industrial projects.
The main activities in 2020 were related to the arrangement of the group asset structure and preparations for listing. In 2021, the group will continue, through the acquisition of existing organisations, to advance technologies and use patented technologies of Ixellion AS in
selected fields of activity.
As the transactions of the group are concluded in various currencies and the functional currency of some of the group companies is the
British pound, the group is exposed to a significant risk arising from changes in exchange rates.
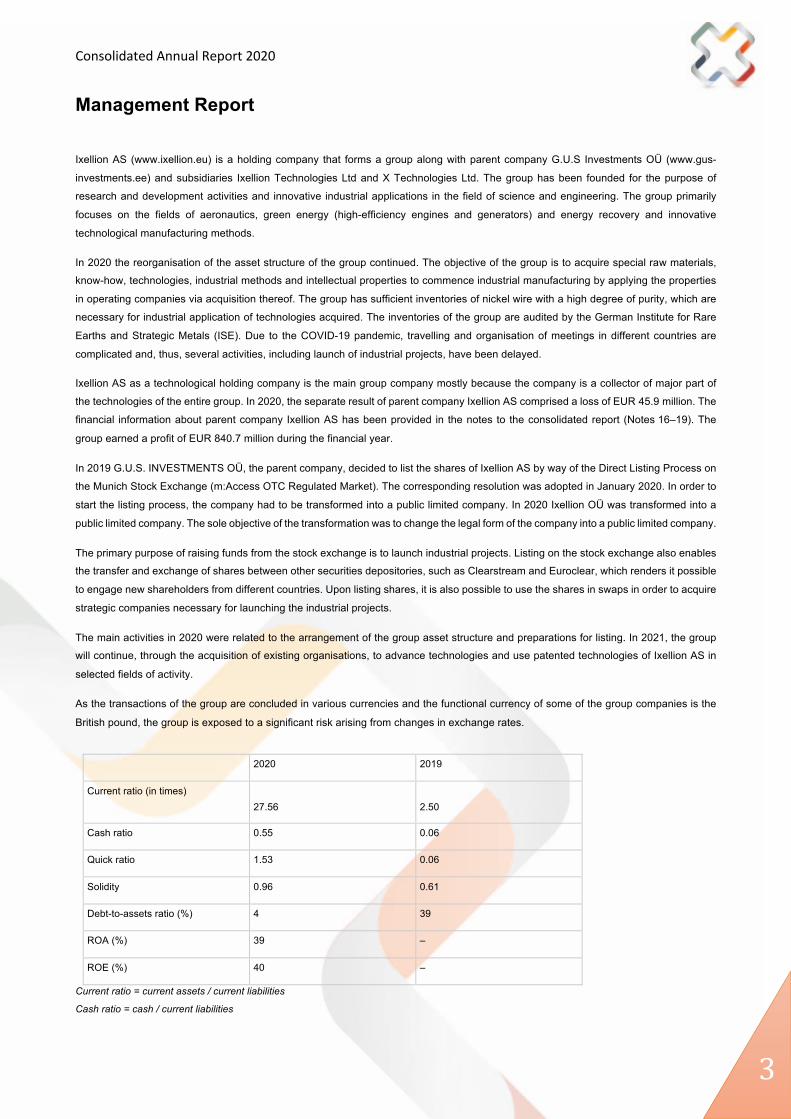
2020 2019
Current ratio (in times)
27.56
2.50
Cash ratio 0.55 0.06
Quick ratio 1.53 0.06
Solidity 0.96 0.61
Debt-to-assets ratio (%) 4 39
ROA (%) 39 –
ROE (%) 40 –
Current ratio = current assets / current liabilities
Cash ratio = cash / current liabilities

Consolidated Annual Report 2020
4
Quick ratio = (current assets – inventories) / current liabilities
Solidity = equity / (total liabilities + equity)
Debt-to-assets ratio = total liabilities / assets x 100%
ROA = net profit / total assets x 100%
ROE = net profit / equity x 100%
Consolidated Annual Report 2020
5
Financial Statements
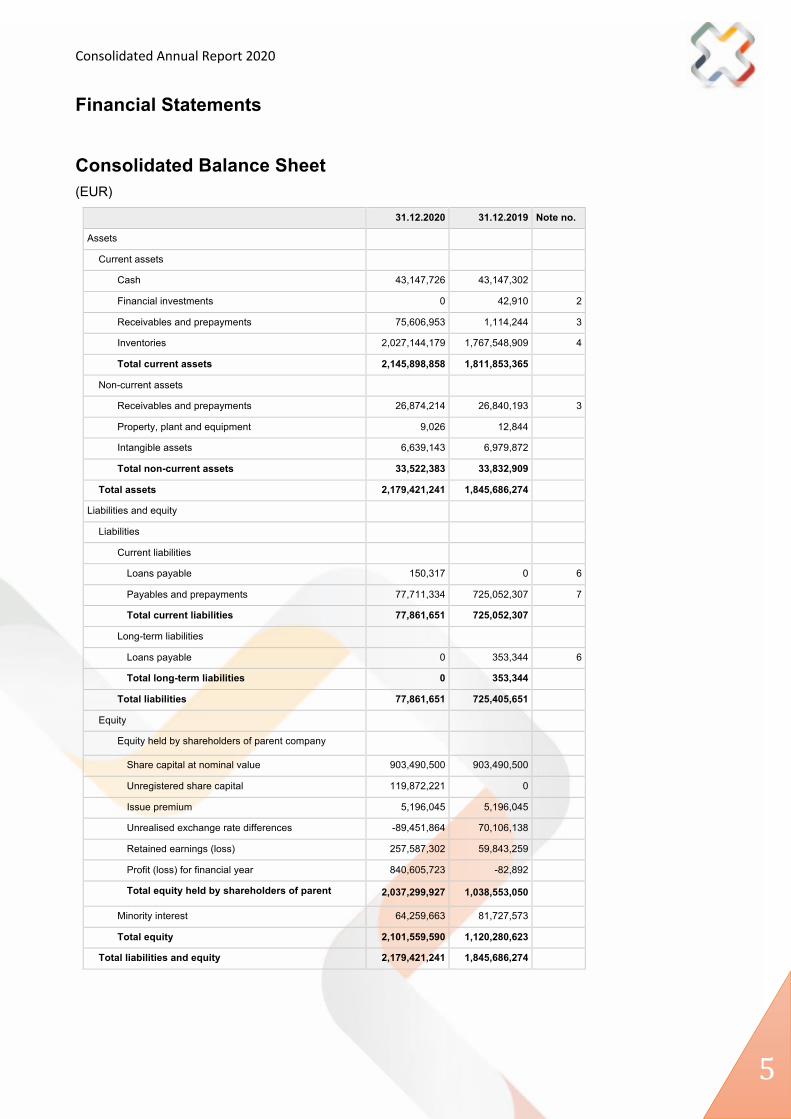
Consolidated Balance Sheet (EUR)
31.12.2020 31.12.2019 Note no.
Assets Current assets
Cash 43,147,726 43,147,302 Financial investments 0 42,910 2
Receivables and prepayments 75,606,953 1,114,244 3
Inventories 2,027,144,179 1,767,548,909 4
Total current assets 2,145,898,858 1,811,853,365 Non-current assets
Receivables and prepayments 26,874,214 26,840,193 3
Property, plant and equipment 9,026 12,844 Intangible assets 6,639,143 6,979,872 Total non-current assets 33,522,383 33,832,909
Total assets 2,179,421,241 1,845,686,274 Liabilities and equity
Liabilities Current liabilities
Loans payable 150,317 0 6
Payables and prepayments 77,711,334 725,052,307 7
Total current liabilities 77,861,651 725,052,307 Long-term liabilities
Loans payable 0 353,344 6
Total long-term liabilities 0 353,344 Total liabilities 77,861,651 725,405,651
Equity Equity held by shareholders of parent company
Share capital at nominal value 903,490,500 903,490,500 Unregistered share capital 119,872,221 0 Issue premium 5,196,045 5,196,045 Unrealised exchange rate differences -89,451,864 70,106,138 Retained earnings (loss) 257,587,302 59,843,259 Profit (loss) for financial year 840,605,723 -82,892 Total equity held by shareholders of parent company
2,037,299,927 1,038,553,050 Minority interest 64,259,663 81,727,573 Total equity 2,101,559,590 1,120,280,623
Total liabilities and equity 2,179,421,241 1,845,686,274
Consolidated Annual Report 2020
6
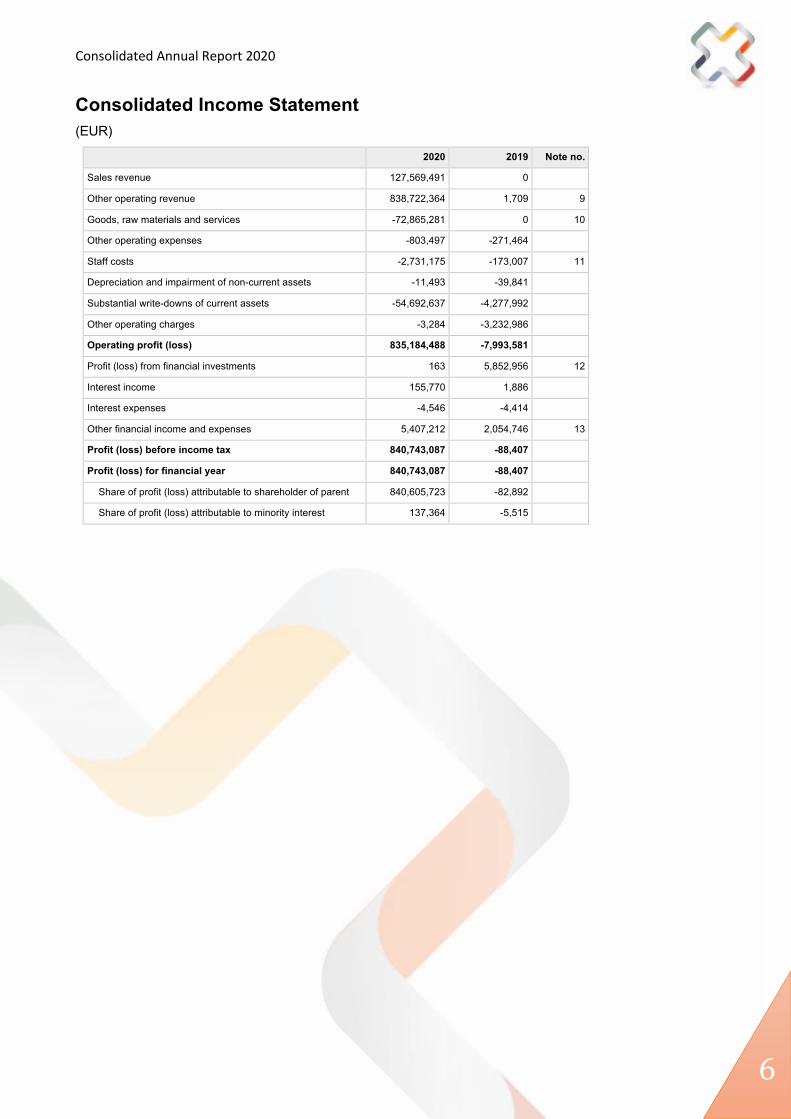
Consolidated Income Statement (EUR)
2020 2019 Note no.
Sales revenue 127,569,491 0 Other operating revenue 838,722,364 1,709 9
Goods, raw materials and services -72,865,281 0 10
Other operating expenses -803,497 -271,464 Staff costs -2,731,175 -173,007 11
Depreciation and impairment of non-current assets -11,493 -39,841 Substantial write-downs of current assets -54,692,637 -4,277,992 Other operating charges -3,284 -3,232,986 Operating profit (loss) 835,184,488 -7,993,581 Profit (loss) from financial investments 163 5,852,956 12
Interest income 155,770 1,886 Interest expenses -4,546 -4,414 Other financial income and expenses 5,407,212 2,054,746 13
Profit (loss) before income tax 840,743,087 -88,407 Profit (loss) for financial year 840,743,087 -88,407
Share of profit (loss) attributable to shareholder of parent
company
840,605,723 -82,892 Share of profit (loss) attributable to minority interest 137,364 -5,515
Consolidated Annual Report 2020
7
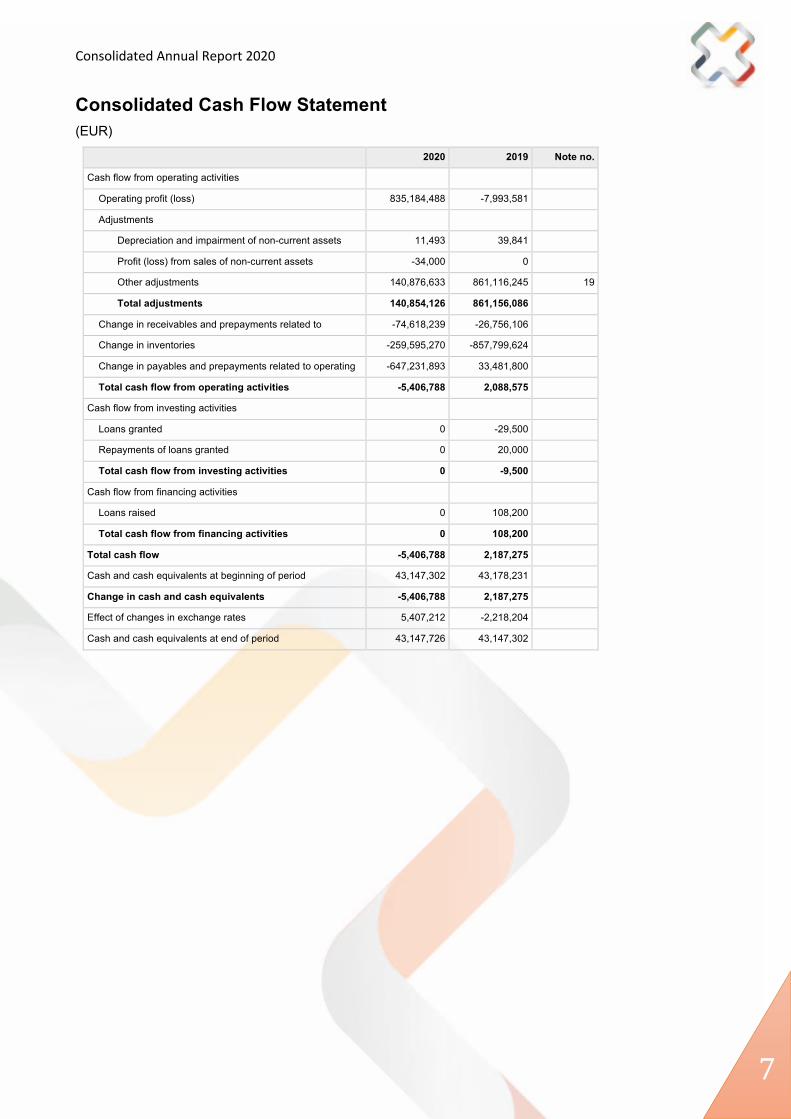
Consolidated Cash Flow Statement (EUR)
2020 2019 Note no.
Cash flow from operating activities Operating profit (loss) 835,184,488 -7,993,581 Adjustments
Depreciation and impairment of non-current assets 11,493 39,841 Profit (loss) from sales of non-current assets -34,000 0 Other adjustments 140,876,633 861,116,245 19
Total adjustments 140,854,126 861,156,086 Change in receivables and prepayments related to
operating activities
-74,618,239 -26,756,106 Change in inventories -259,595,270 -857,799,624 Change in payables and prepayments related to operating
activities
-647,231,893 33,481,800 Total cash flow from operating activities -5,406,788 2,088,575
Cash flow from investing activities Loans granted 0 -29,500 Repayments of loans granted 0 20,000 Total cash flow from investing activities 0 -9,500
Cash flow from financing activities Loans raised 0 108,200 Total cash flow from financing activities 0 108,200
Total cash flow -5,406,788 2,187,275 Cash and cash equivalents at beginning of period 43,147,302 43,178,231 Change in cash and cash equivalents -5,406,788 2,187,275 Effect of changes in exchange rates 5,407,212 -2,218,204 Cash and cash equivalents at end of period 43,147,726 43,147,302

Consolidated Annual Report 2020
8
Consolidated Statement of Comprehensive Income (EUR)
2020 2019
Profit (loss) for financial year 840,743,087 -88,407
Other comprehensive income (loss): Unrealised exchange rate differences -89,451,864 70,106,138
Total other comprehensive income (loss) -89,451,864 70,106,138
Comprehensive income (loss) for financial year 751,291,223 70,017,731
incl. share of comprehensive income (loss) attributable to shareholder of parent
company 751,153,859 70,023,246
incl. share of comprehensive income (loss) attributable to minority interest 137,364 -5,515
Consolidated Annual Report 2020
9
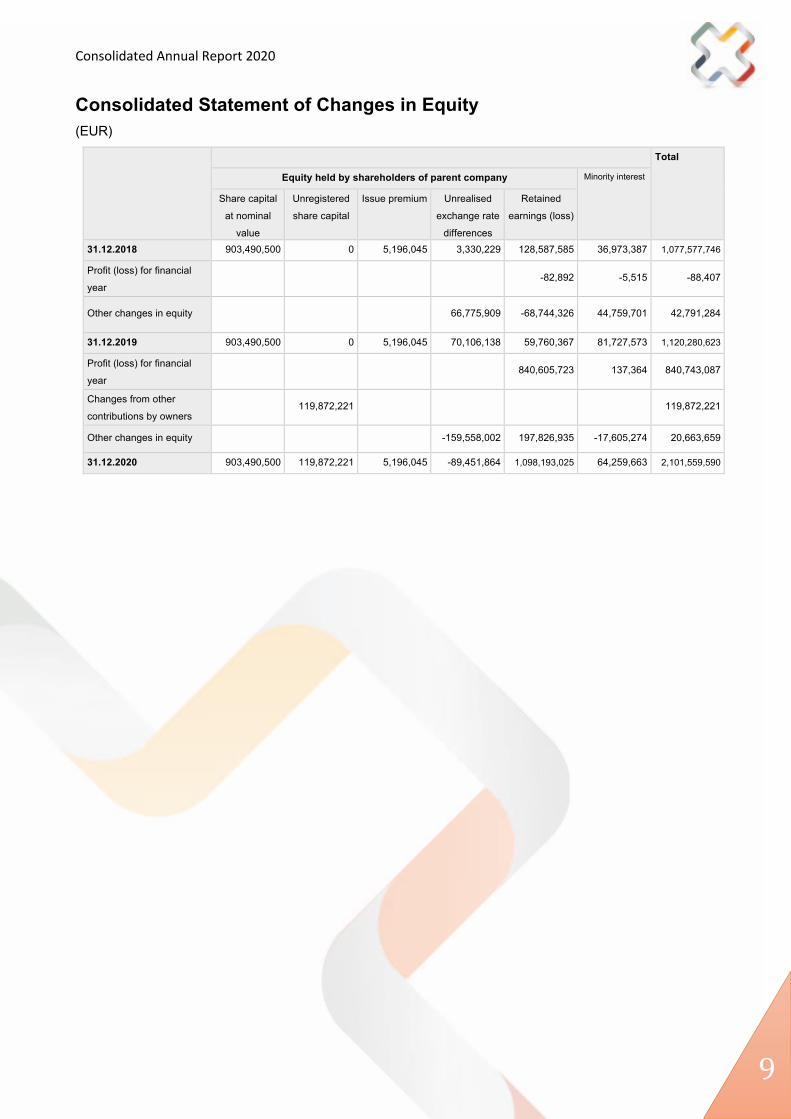
Consolidated Statement of Changes in Equity
(EUR)
Total
Equity held by shareholders of parent company Minority interest
Share capital
at nominal
value
Unregistered
share capital
Issue premium Unrealised
exchange rate
differences
Retained
earnings (loss)
31.12.2018 903,490,500 0 5,196,045 3,330,229 128,587,585 36,973,387 1,077,577,746
Profit (loss) for financial
year -82,892 -5,515 -88,407
Other changes in equity 66,775,909 -68,744,326 44,759,701 42,791,284
31.12.2019 903,490,500 0 5,196,045 70,106,138 59,760,367 81,727,573 1,120,280,623
Profit (loss) for financial
year 840,605,723 137,364 840,743,087
Changes from other
contributions by owners 119,872,221 119,872,221
Other changes in equity -159,558,002 197,826,935 -17,605,274 20,663,659
31.12.2020 903,490,500 119,872,221 5,196,045 -89,451,864 1,098,193,025 64,259,663 2,101,559,590
Consolidated Annual Report 2020
10
Notes to Financial Statements
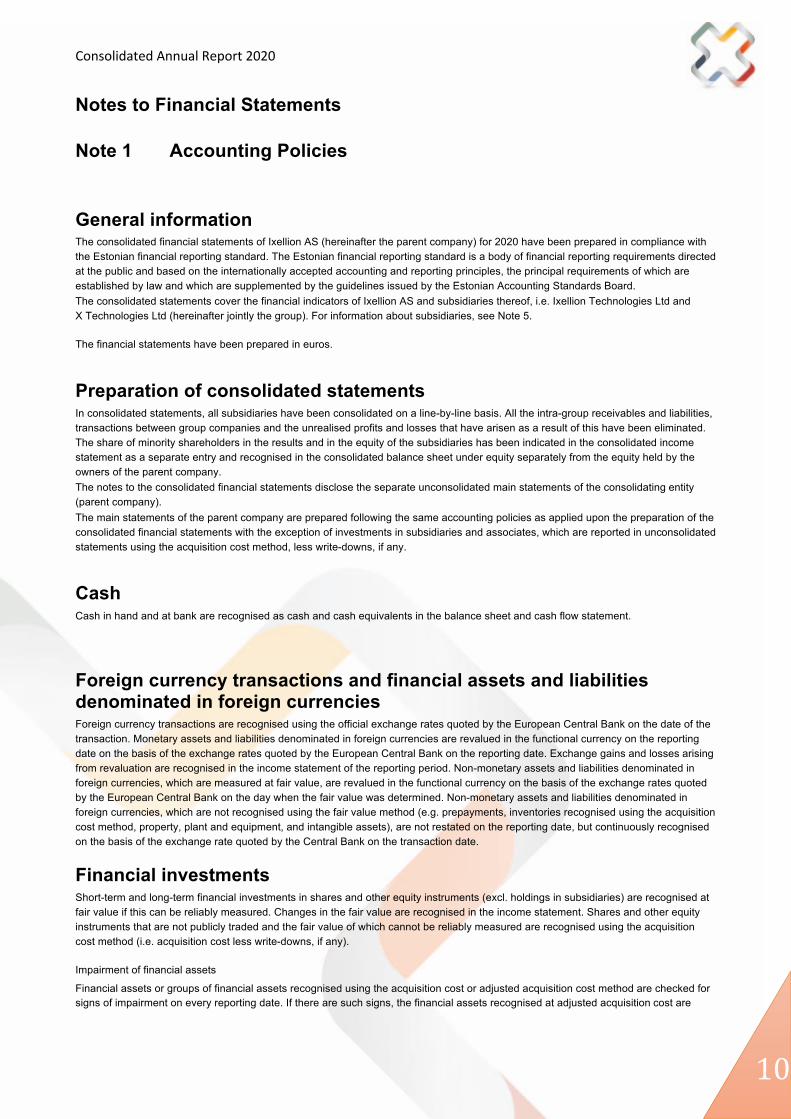
Note 1 Accounting Policies
General information The consolidated financial statements of Ixellion AS (hereinafter the parent company) for 2020 have been prepared in compliance with the Estonian financial reporting standard. The Estonian financial reporting standard is a body of financial reporting requirements directed at the public and based on the internationally accepted accounting and reporting principles, the principal requirements of which are established by law and which are supplemented by the guidelines issued by the Estonian Accounting Standards Board. The consolidated statements cover the financial indicators of Ixellion AS and subsidiaries thereof, i.e. Ixellion Technologies Ltd and X Technologies Ltd (hereinafter jointly the group). For information about subsidiaries, see Note 5. The financial statements have been prepared in euros.
Preparation of consolidated statements In consolidated statements, all subsidiaries have been consolidated on a line-by-line basis. All the intra-group receivables and liabilities, transactions between group companies and the unrealised profits and losses that have arisen as a result of this have been eliminated. The share of minority shareholders in the results and in the equity of the subsidiaries has been indicated in the consolidated income statement as a separate entry and recognised in the consolidated balance sheet under equity separately from the equity held by the owners of the parent company. The notes to the consolidated financial statements disclose the separate unconsolidated main statements of the consolidating entity (parent company). The main statements of the parent company are prepared following the same accounting policies as applied upon the preparation of the consolidated financial statements with the exception of investments in subsidiaries and associates, which are reported in unconsolidated statements using the acquisition cost method, less write-downs, if any.
Cash Cash in hand and at bank are recognised as cash and cash equivalents in the balance sheet and cash flow statement.
Foreign currency transactions and financial assets and liabilities denominated in foreign currencies Foreign currency transactions are recognised using the official exchange rates quoted by the European Central Bank on the date of the transaction. Monetary assets and liabilities denominated in foreign currencies are revalued in the functional currency on the reporting date on the basis of the exchange rates quoted by the European Central Bank on the reporting date. Exchange gains and losses arising from revaluation are recognised in the income statement of the reporting period. Non-monetary assets and liabilities denominated in foreign currencies, which are measured at fair value, are revalued in the functional currency on the basis of the exchange rates quoted by the European Central Bank on the day when the fair value was determined. Non-monetary assets and liabilities denominated in foreign currencies, which are not recognised using the fair value method (e.g. prepayments, inventories recognised using the acquisition cost method, property, plant and equipment, and intangible assets), are not restated on the reporting date, but continuously recognised on the basis of the exchange rate quoted by the Central Bank on the transaction date.
Financial investments Short-term and long-term financial investments in shares and other equity instruments (excl. holdings in subsidiaries) are recognised at fair value if this can be reliably measured. Changes in the fair value are recognised in the income statement. Shares and other equity instruments that are not publicly traded and the fair value of which cannot be reliably measured are recognised using the acquisition cost method (i.e. acquisition cost less write-downs, if any). Impairment of financial assets
Financial assets or groups of financial assets recognised using the acquisition cost or adjusted acquisition cost method are checked for signs of impairment on every reporting date. If there are such signs, the financial assets recognised at adjusted acquisition cost are

Consolidated Annual Report 2020
11
written down to the present value of the expected future payments to be received from the financial assets (as discounted using the effective interest rate fixed upon the first recognition of the financial asset), and financial assets recognised at acquisition cost are written down to the amount reasonably receivable if the financial asset were to be sold as of the reporting date. Write-downs arising from the impairment are recognised in the income statement as expenses.
Shares of subsidiaries and associates A subsidiary is deemed to be any company that is under the dominant influence of another company (parent company). Dominant influence is presumed if the parent company holds, either directly or through subsidiaries, more than 50% of the voting rights of the subsidiary, except for the exceptional cases where it is possible to clearly prove that the voting rights do not entail dominant influence. Dominant influence also exists if the parent company holds 50% or less of the voting rights in the subsidiary.

Consolidated Annual Report 2020
12
Investments in subsidiaries are recognised pursuant to the acquisition cost method.
An investment is initially recognised at its acquisition cost, which is the fair value of the consideration payable and expenses directly attributable to acquisition. Pursuant to the acquisition cost method, the initial acquisition cost is adjusted in subsequent periods with the write-downs arising from the impairment of the investment, if necessary. Assessments are performed on every balance sheet date to ascertain whether there are any indications that the recoverable amount of an investment may have fallen to below its book value.
Receivables and prepayments All the receivables, incl. trade receivables, accrued income, loans receivable, deposits and other short-term and long-term receivables are recognised at the adjusted acquisition cost. The adjusted acquisition cost of short-term receivables is generally equal to their nominal value (less any possible write-downs), due to which short-term receivables are recognised in the balance sheet in the amounts that are likely to be received.
Inventories Inventories are initially recognised at their acquisition cost, which consists of purchase costs, production costs and other costs incurred in bringing the inventories to their present location and condition. Inventories are expensed using the FIFO method.
Inventories are recognised in the balance sheet at the lower of their acquisition cost or net realisable value. Net realisable value is the estimated selling price of a product in the course of ordinary business activities less the estimated costs incurred in preparing the product for sales and completing the sales.
Property, plant and equipment and intangible assets Property, plant and equipment are initially registered at their acquisition cost, which consists of the purchase price and expenses directly attributable to acquisition incurred in bringing the assets to their operating condition and location. Property, plant and equipment are recognised in the balance sheet at their acquisition cost less accumulated depreciation and write-downs resulting from impairment, if any. Depreciation is calculated using the straight-line method. Depreciation rates are established separately for each item of non-current assets on the basis of their useful lives.
Intangible assets are initially registered at their acquisition cost, which consists of the purchase price and expenses directly attributable to acquisition. Intangible assets are recognised in the balance sheet at their acquisition cost less accumulated depreciation and write-downs resulting from impairment, if any. Depreciation is calculated using the unit of production method. Depreciation rates are established separately for each item of intangible assets on the basis of its useful life. If the useful life of the intangible assets cannot be reliably determined, it is presumed that the useful life is 10 years. Threshold for recognition of non-current assets EUR 1,000
Useful life by non-current asset groups (in years)
Name of group of non-current assets Useful life
Means of transport 3 years
Computers and computer systems 2 years
Other property, plant and equipment 2 years
Financial liabilities
All financial liabilities (trade creditors, loans raised, accrued expenses, bonds issued and other current and long-term payables, except for derivatives) are recognised at the adjusted acquisition cost. The adjusted acquisition cost of short-term financial liabilities is generally equal to their nominal value, due to which short-term financial liabilities are recognised in the balance sheet in the amounts subject to payment. In order to calculate the adjusted acquisition cost of long-term financial liabilities, they are initially recognised at the fair value of the amounts received (less any transaction costs), considering the interest expenses to be incurred on the liabilities in future periods, using the effective interest method. A financial liability is classified as short-term if its term of payment is within twelve months of the reporting date, or if the company does not have the unconditional right to defer the payment by more than twelve months after the reporting date, or if the lender had the right to recall the financial liability as of the reporting date due to violation of the conditions provided in the loan agreement.

Consolidated Annual Report 2020
13
Revenue Revenue is recognised at the fair value of the amounts received or to be received, considering the discounts prescribed in an agreement.
Revenue from sales of goods is recognised when all the essential risks relating to the ownership have passed from the seller to the purchaser, the sales revenue and the expenses relating to the transaction can be reliably established and the proceeds arising from the transaction are likely to be collected.
Consolidated Annual Report 2020
14
Taxation
In accordance with the Income Tax Act in force in Estonia, corporate earnings are not subject to tax in Estonia. Income tax is paid on dividends, fringe benefits, gifts, donations, reception costs, disbursements not attributable to business and adjustments of transfer prices. The tax rate applied to profit distributed as dividends from 1 January 2015 is 20/80 of the net amount to be paid out. In accordance with subsection 4 (5) and section 501 of the Income Tax Act, from 1 January 2019 regularly payable dividends are subject to a lower tax rate of 14%, i.e. 14/86 of the net amount of dividends. Therefore, upon paying income tax on dividends, a resident company can apply a lower tax rate of 14/86 and the standard rate of 20/80. Companies located in Great Britain and foreign companies with a branch or permanent establishment in the UK must pay corporate income tax on taxable income. Taxable income comprises profit from principal activity, investments and sales of assets. A UK limited liability company (i.e. Limited Company, Limited or Ltd, and, in the event of publicly listed shares, public limited company or PLC) pays corporate income tax on profit in the UK and abroad. A foreign company that has a permanent establishment or branch in the UK pays corporate income tax on its activities carried out in the UK.
Related parties A related party is a person or a company that is related to the group to such an extent that the transactions between them might not be concluded under market conditions. A person or a close family member of such a person (i.e. a family member in the event of whom significant influence may be assumed, e.g. spouse, cohabiting partner or child) is related to the group if the person: (a) is a member of the management board of the group or of its parent company (i.e. a person who is authorised to plan and manage the activities of the company and who is responsible for this); or (b) exercises dominant or partial influence over the group. The group is related to another company if one or several of the following conditions applies/apply: (a) the other company and the group are under joint dominant influence (i.e. they are either members of the same group or controlled by the same person (or a close family member of the person)); (b) one company is under the dominant influence of a company of a third party (that may be both a company or an individual) and the other company is under the significant influence of this third party (or the individual or their close family member if the third party is an individual); (c) the other company has dominant or significant influence over the group; (d) the other company is under the dominant or significant influence of the group; (e) other companies that are under the dominant or significant influence of a member of the management of the group’s parent company (or their close family members); (f) other companies whose management includes persons (or their close family members) who have dominant or significant influence over the group.
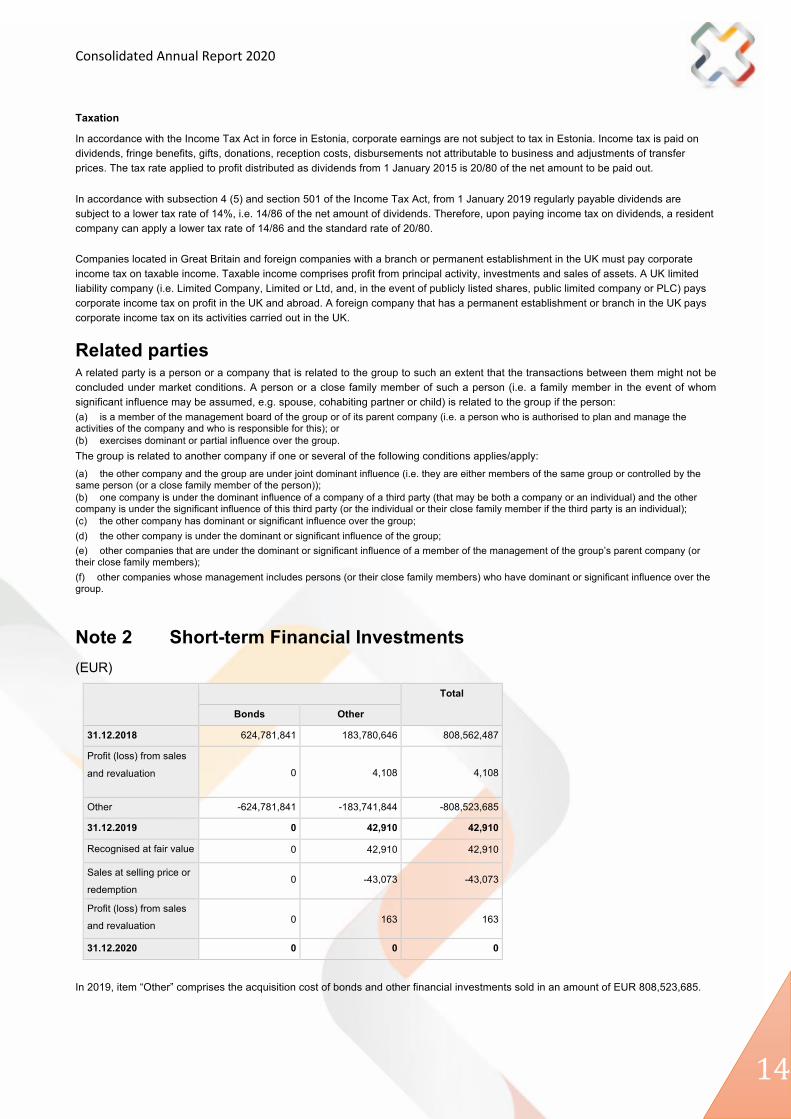
Note 2 Short-term Financial Investments (EUR)
Total
Bonds Other
31.12.2018 624,781,841 183,780,646 808,562,487
Profit (loss) from sales
and revaluation 0 4,108 4,108
Other -624,781,841 -183,741,844 -808,523,685
31.12.2019 0 42,910 42,910
Recognised at fair value 0 42,910 42,910
Sales at selling price or
redemption 0 -43,073 -43,073
Profit (loss) from sales
and revaluation 0 163 163
31.12.2020 0 0 0
In 2019, item “Other” comprises the acquisition cost of bonds and other financial investments sold in an amount of EUR 808,523,685.
Consolidated Annual Report 2020
15
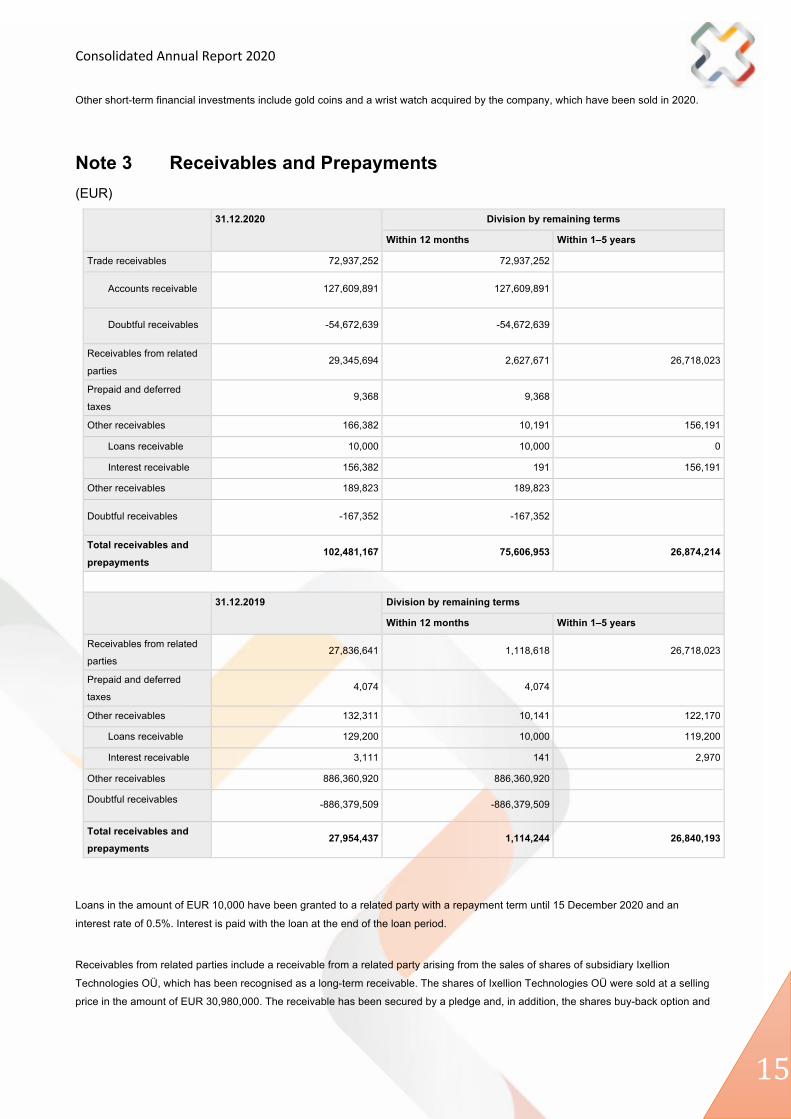
Other short-term financial investments include gold coins and a wrist watch acquired by the company, which have been sold in 2020.
Note 3 Receivables and Prepayments (EUR)
31.12.2020 Division by remaining terms
Within 12 months Within 1–5 years
Trade receivables 72,937,252 72,937,252
Accounts receivable 127,609,891 127,609,891
Doubtful receivables -54,672,639 -54,672,639
Receivables from related
parties 29,345,694 2,627,671 26,718,023
Prepaid and deferred
taxes 9,368 9,368
Other receivables 166,382 10,191 156,191
Loans receivable 10,000 10,000 0
Interest receivable 156,382 191 156,191
Other receivables 189,823 189,823
Doubtful receivables -167,352 -167,352
Total receivables and prepayments
102,481,167 75,606,953 26,874,214
31.12.2019 Division by remaining terms
Within 12 months Within 1–5 years
Receivables from related
parties 27,836,641 1,118,618 26,718,023
Prepaid and deferred
taxes 4,074 4,074
Other receivables 132,311 10,141 122,170
Loans receivable 129,200 10,000 119,200
Interest receivable 3,111 141 2,970
Other receivables 886,360,920 886,360,920 Doubtful receivables -886,379,509 -886,379,509
Total receivables and prepayments
27,954,437 1,114,244 26,840,193
Loans in the amount of EUR 10,000 have been granted to a related party with a repayment term until 15 December 2020 and an
interest rate of 0.5%. Interest is paid with the loan at the end of the loan period.
Receivables from related parties include a receivable from a related party arising from the sales of shares of subsidiary Ixellion
Technologies OÜ, which has been recognised as a long-term receivable. The shares of Ixellion Technologies OÜ were sold at a selling
price in the amount of EUR 30,980,000. The receivable has been secured by a pledge and, in addition, the shares buy-back option and

Consolidated Annual Report 2020
16
personal liability agreement in an amount of EUR 30,980,000 has been entered into with the related party. The pledged object consists
of all the shares of Ixellion Technologies OÜ held by the related party after the sales transaction. A receivable from the related party has
been written down in the balance sheet in the write-down amount of the value of the pledged object of EUR 4,261,977. The receivable
from the related party has been recognised in the balance sheet in the amount of EUR 26,719,314. The deadline of the receivable is
28 June 2022 and the interest rate is 0.5% a year.
Pledge terms:
- the pledge is valid until the full receipt of the receivable;
- Ixellion AS has the right to receive dividends paid by Ixellion Technologies OÜ. The receivable is reduced by the amount of dividends paid;
- Ixellion AS has the right to recover the shares of Ixellion Technologies OÜ if the receivable is not received.
Note 4 Inventories (EUR)
31.12.2020 31.12.2019
Goods for resale 2,027,144,179 1,767,548,909
Total inventories 2,027,144,179 1,767,548,909
Goods for resale consist of nickel wire with a purity of 99.82% and average constant diameter of 0.025 mm.
Note 5 Shares of Subsidiaries (EUR)
Shares of subsidiaries, general information
Registry code of subsidiary
Name of subsidiary Country of incorporation
Principal activity Holding (%)
31.12.2019 31.12.2020
9322496 Ixellion Technologies Ltd Great Britain Manufacture of electrical
and electronic equipment 93.76 93.76
10709759 X Technologies Ltd Great Britain Manufacture of electrical
and electronic equipment 100 100
Shares of subsidiaries, detailed information
Name of subsidiary 31.12.2019 Other changes 31.12.2020
Ixellion Technologies Ltd 906,603,197 -43,180,897 863,422,300
X Technologies Ltd 741,733,250 -30,125,790 711,607,460
Total shares of subsidiaries, at the end of last period 1,648,336,447 -73,306,687 1,575,029,760

Consolidated Annual Report 2020
17
Note 6 Loans Payable
(EUR)
31.12.2020 Division by remaining terms Interest rate Underlying currency
Maturity
Within 12 months
Within 1–5 years
Over 5 years
Long-term loans G.U.S. INVESTMENTS
OÜ 150,317 150,317 0 1.5% EUR 31.12.2021
Total long-term loans 150,317 150,317 0
Total loans payable 150,317 150,317 0 31.12.2019 Division by remaining terms Interest rate Underlying
currency
Maturity
Within 12 months
Within 1–5 years
Over 5 years
Long-term loans G.U.S. INVESTMENTS
OÜ 353,344 0 353,344 1.50% EUR 31.12.2021
Total long-term loans 353,344 0 353,344
Total loans payable 353,344 0 353,344
Note 7 Payables and Prepayments (EUR)
31.12.2020 Within 12 months
Trade creditors 115,831 115,831
Employee-related liabilities 195,784 195,784
Taxes payable 17,473 17,473
Other payables 9,395 9,395
Interest payable 9,395 9,395
Payables to related parties 75,413,117 75,413,117
Other payables 1,959,734 1,959,734
Total payables and prepayments 77,711,334 77,711,334
31.12.2019 Within 12 months
Trade creditors 16,386 16,386
Employee-related liabilities 39,145 39,145
Taxes payable 1,767,970 1,767,970
Other payables 4,848 4,848
Interest payable 4,848 4,848
Payables to related parties 722,985,824 722,985,824
Consolidated Annual Report 2020
18
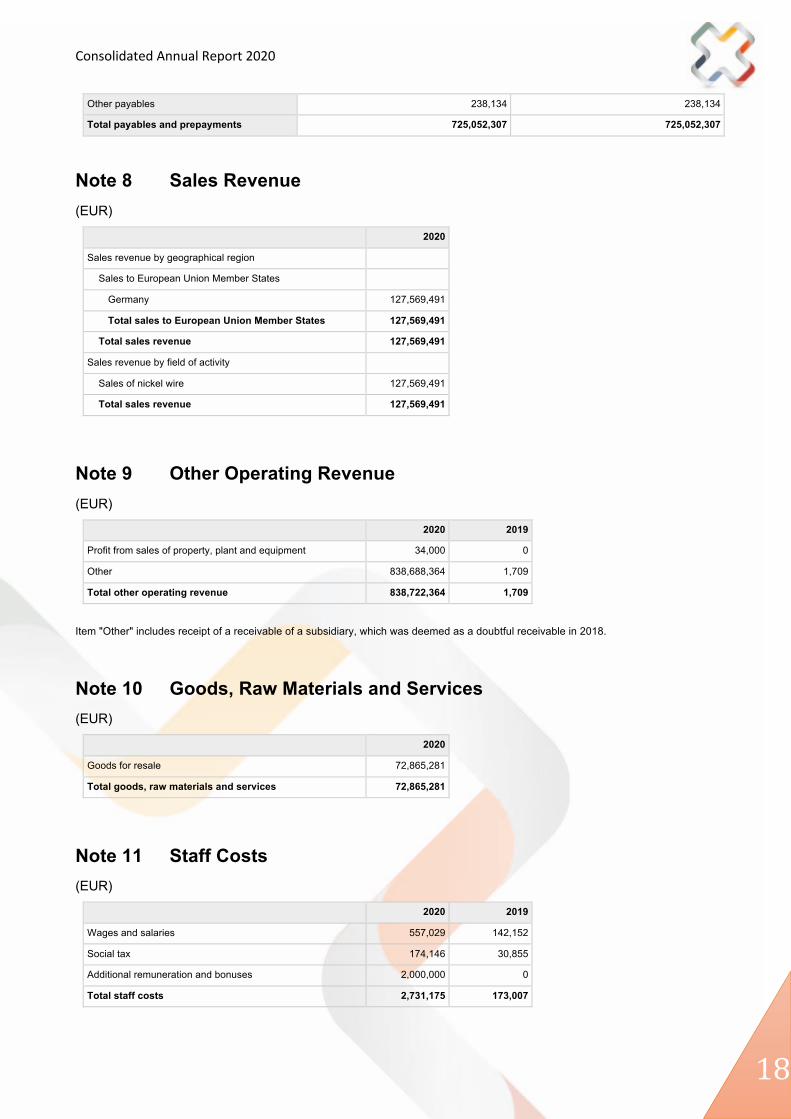
Other payables 238,134 238,134
Total payables and prepayments 725,052,307 725,052,307
Note 8 Sales Revenue (EUR)
2020
Sales revenue by geographical region Sales to European Union Member States
Germany 127,569,491
Total sales to European Union Member States 127,569,491
Total sales revenue 127,569,491
Sales revenue by field of activity Sales of nickel wire 127,569,491
Total sales revenue 127,569,491
Note 9 Other Operating Revenue (EUR)
2020 2019
Profit from sales of property, plant and equipment 34,000 0
Other 838,688,364 1,709
Total other operating revenue 838,722,364 1,709
Item "Other" includes receipt of a receivable of a subsidiary, which was deemed as a doubtful receivable in 2018.
Note 10 Goods, Raw Materials and Services (EUR)
2020
Goods for resale 72,865,281
Total goods, raw materials and services 72,865,281
Note 11 Staff Costs (EUR)
2020 2019
Wages and salaries 557,029 142,152
Social tax 174,146 30,855
Additional remuneration and bonuses 2,000,000 0
Total staff costs 2,731,175 173,007

Consolidated Annual Report 2020
19
Average number of employees in full-time equivalent units 5 3
Average number of employees by types of labour Member of managing or controlling body of legal person 5
3
Note 12 Profit (Loss) from Financial Investments (EUR)
2020 2019
Profit on sales of financial investment 163 0
Valuation of long-term financial investments 0 4,352,956
Profit from sales of long-term financial investment 0 1,500,000
Total profit (loss) from financial investments 163 5,852,956
Note 13 Other Financial Income and Expenses (EUR)
2020 2019
Profit (loss) from exchange rate movements 5,407,212 -2,207,231
Profit from sales of subsidiary 0 4,261,977
Total other financial income and expenses 5,407,212 2,054,746
Note 14 Related Parties (EUR)
Name of accounting entity’s parent company G.U.S. INVESTMENTS OÜ
Country where accounting entity’s parent company has been
registered
Estonia
Balances with related parties by group
31.12.2020 31.12.2019
Receivables Liabilities Receivables Liabilities
Parent company 675,977 18,394,195
Executive and senior management
and major shareholders being
private individuals and companies
under their dominant or significant
influence
32,308,926 73,393,326 32,230,929 703,449,821
Loans
2020 Repayments of loans granted
Interest received
Repayments of loans raised
Interest rate Underlying currency
Maturity

Consolidated Annual Report 2020
20
Parent company G.U.S. INVESTMENTS OÜ 203,027 1.5% EUR 31.12.2021
Executive and senior management and
major shareholders being private
individuals and companies under their
dominant or significant influence
Cristhal Consulting OÜ 19,200 349 0.5% EUR 15.03.2022
Cristhal Consulting OÜ 100,000 1,778 0.5% EUR 15.12.2021
2019 Loans raised Interest rate Underlying currency
Maturity
Parent company G.U.S. INVESTMENTS OÜ 108,200 1.5% EUR 31.12.2021
Purchases and sales of goods and services
2020 2019
Purchases of goods and services
Sales of goods and services
Purchases of goods and services
Sales of goods and services
Parent company 4,546 43,073 4,414 Executive and senior management
and major shareholders being
private individuals and companies
under their dominant or significant
influence
72,896,852 155,398 646
Purchases and sales of non-current assets
2020
Non-current assets sold
Executive and senior
management and major
shareholders being private
individuals and companies
under their dominant or
significant influence
32,000
Remuneration and other significant benefits for executive and senior management
2020 2019
Remuneration calculated 731,175 173,007
Bonus 2,000,000 0
The remuneration calculated for the management has been indicated with social tax.
The company has purchased goods for EUR 72,896,852 and financial services for EUR 4,546 from related parties.
Goods for EUR 43,073, financial services for EUR 155,398 and non-current assets for EUR 32,000 have been sold to related parties
during the financial year.
Consolidated Annual Report 2020
21
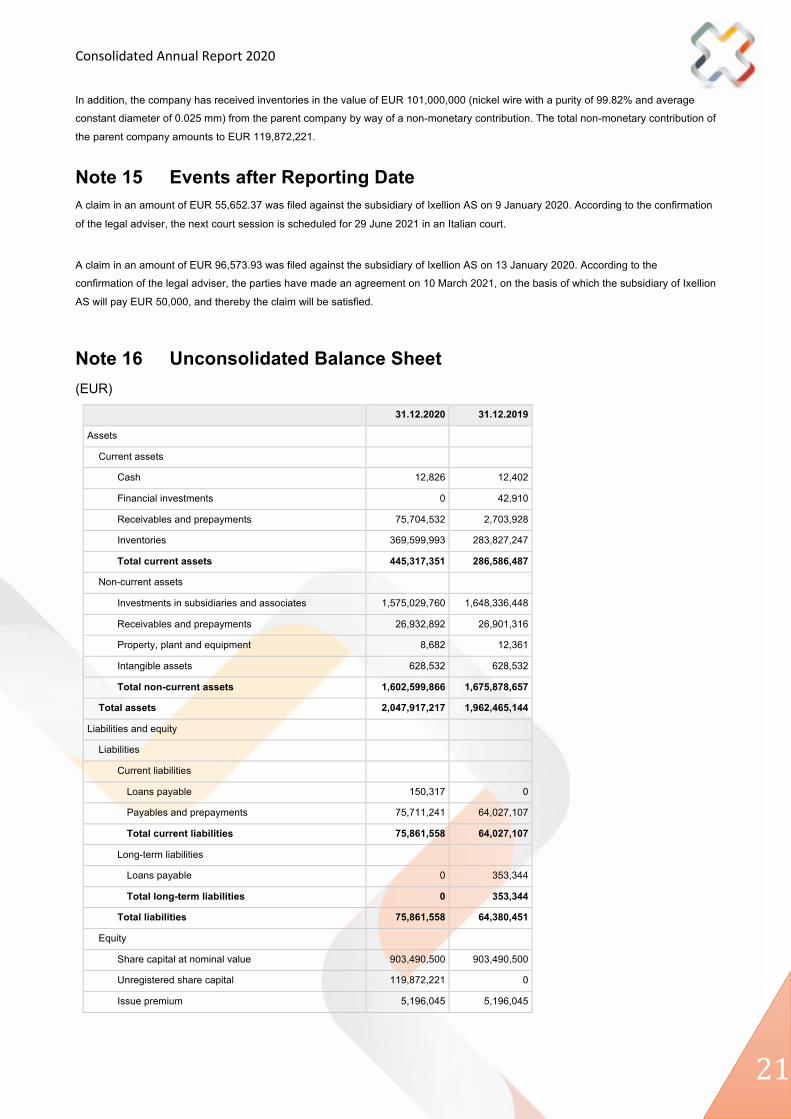
In addition, the company has received inventories in the value of EUR 101,000,000 (nickel wire with a purity of 99.82% and average
constant diameter of 0.025 mm) from the parent company by way of a non-monetary contribution. The total non-monetary contribution of
the parent company amounts to EUR 119,872,221.
Note 15 Events after Reporting Date A claim in an amount of EUR 55,652.37 was filed against the subsidiary of Ixellion AS on 9 January 2020. According to the confirmation
of the legal adviser, the next court session is scheduled for 29 June 2021 in an Italian court.
A claim in an amount of EUR 96,573.93 was filed against the subsidiary of Ixellion AS on 13 January 2020. According to the
confirmation of the legal adviser, the parties have made an agreement on 10 March 2021, on the basis of which the subsidiary of Ixellion
AS will pay EUR 50,000, and thereby the claim will be satisfied.
Note 16 Unconsolidated Balance Sheet (EUR)
31.12.2020 31.12.2019
Assets Current assets
Cash 12,826 12,402
Financial investments 0 42,910
Receivables and prepayments 75,704,532 2,703,928
Inventories 369,599,993 283,827,247
Total current assets 445,317,351 286,586,487
Non-current assets Investments in subsidiaries and associates 1,575,029,760 1,648,336,448
Receivables and prepayments 26,932,892 26,901,316
Property, plant and equipment 8,682 12,361
Intangible assets 628,532 628,532
Total non-current assets 1,602,599,866 1,675,878,657
Total assets 2,047,917,217 1,962,465,144
Liabilities and equity Liabilities
Current liabilities Loans payable 150,317 0
Payables and prepayments 75,711,241 64,027,107
Total current liabilities 75,861,558 64,027,107
Long-term liabilities Loans payable 0 353,344
Total long-term liabilities 0 353,344
Total liabilities 75,861,558 64,380,451
Equity Share capital at nominal value 903,490,500 903,490,500
Unregistered share capital 119,872,221 0
Issue premium 5,196,045 5,196,045

Consolidated Annual Report 2020
22
Retained earnings (loss) 989,398,148 921,462,268
Profit (loss) for financial year -45,901,255 67,935,880
Total equity 1,972,055,659 1,898,084,693
Total liabilities and equity 2,047,917,217 1,962,465,144

Consolidated Annual Report 2020
23
Note 17 Unconsolidated Income Statement (EUR)
2020 2019
Sales revenue 127,569,491 0
Other operating revenue 30,589,893 1,709
Goods, raw materials and services -72,865,281 0
Other operating expenses -617,372 -172,305
Staff costs -2,713,360 -124,355
Depreciation and impairment of non-current assets -11,379 -39,680
Substantial write-downs of current assets -54,692,637 -4,277,992
Other operating charges -2,867 -3,229,819
Total operating profit (loss) 27,256,488 -7,842,442
Profit (loss) from subsidiaries -73,306,688 74,276,034
Profit (loss) from financial investments 163 1,500,000
Interest income 156,609 2,595
Interest expenses -4,546 -4,414
Other financial income and expenses -3,281 4,107
Profit (loss) before income tax -45,901,255 67,935,880
Profit (loss) for financial year -45,901,255 67,935,880
Consolidated Annual Report 2020
24
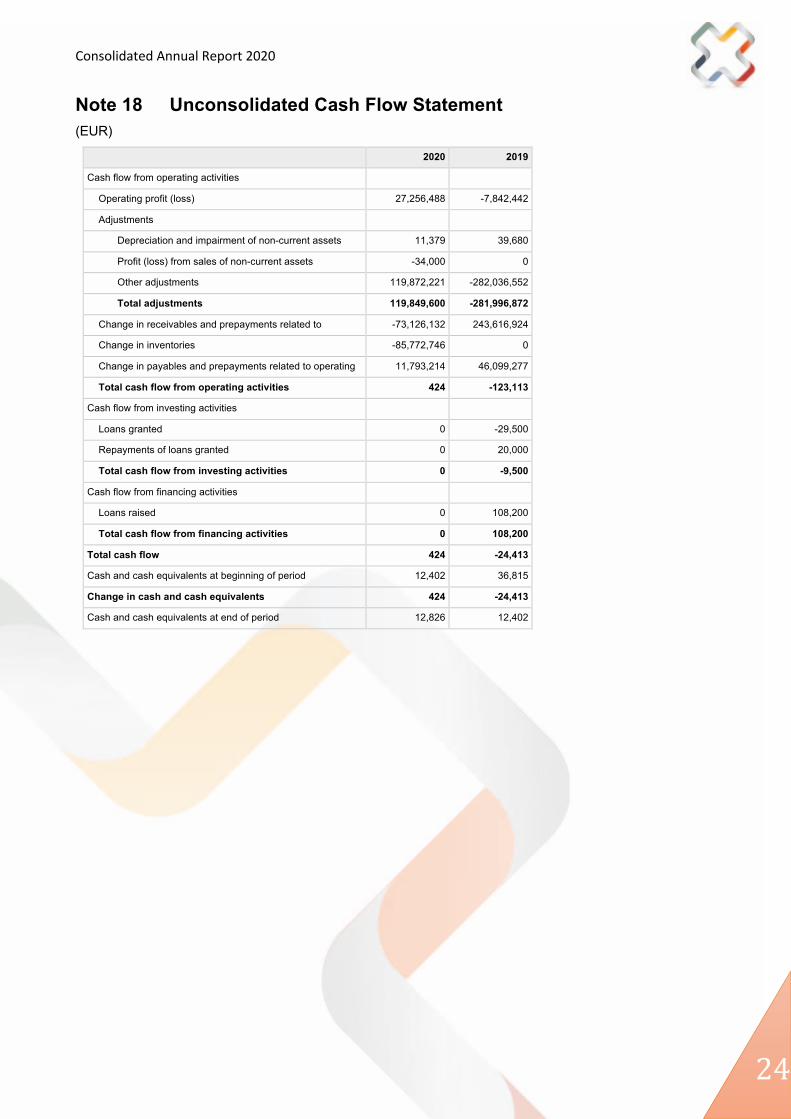
Note 18 Unconsolidated Cash Flow Statement (EUR)
2020 2019
Cash flow from operating activities Operating profit (loss) 27,256,488 -7,842,442
Adjustments Depreciation and impairment of non-current assets 11,379 39,680
Profit (loss) from sales of non-current assets -34,000 0
Other adjustments 119,872,221 -282,036,552
Total adjustments 119,849,600 -281,996,872
Change in receivables and prepayments related to
operating activities
-73,126,132 243,616,924
Change in inventories -85,772,746 0
Change in payables and prepayments related to operating
activities
11,793,214 46,099,277
Total cash flow from operating activities 424 -123,113
Cash flow from investing activities Loans granted 0 -29,500
Repayments of loans granted 0 20,000
Total cash flow from investing activities 0 -9,500
Cash flow from financing activities Loans raised 0 108,200
Total cash flow from financing activities 0 108,200
Total cash flow 424 -24,413
Cash and cash equivalents at beginning of period 12,402 36,815
Change in cash and cash equivalents 424 -24,413
Cash and cash equivalents at end of period 12,826 12,402

Consolidated Annual Report 2020
25
Note 19 Unconsolidated Statement of Changes in Equity (EUR)
Total
Share capital at
nominal value
Unregistered share
capital
Issue premium Retained earnings
(loss)
31.12.2018 903,490,500 0 5,196,045 921,462,268 1,830,148,813
Profit (loss) for financial
year 67,935,880 67,935,880
31.12.2019 903,490,500 0 5,196,045 989,398,148 1,898,084,693
Book value of holdings
under dominant and
significant influence
-1,648,336,448 -1,648,336,448
Value of holdings under
dominant and significant
influence calculated by the
equity method
870,532,378 870,532,378
Adjusted unconsolidated equity as of 31.12.2019
903,490,500 0 5,196,045 211,594,078 1,120,280,623
Profit (loss) for financial
year -45,901,255 -45,901,255
Changes from other
contributions by owners 119,872,221 119,872,221
31.12.2020 903,490,500 119,872,221 5,196,045 943,496,893 1,972,055,659
Book value of holdings
under dominant and
significant influence
-1,575,029,760 -1,575,029,760
Value of holdings under
dominant and significant
influence calculated by the
equity method
1,704,533,691 1,704,533,691
Adjusted unconsolidated equity as of 31.12.2020
903,490,500 119,872,221 5,196,045 1,073,000,824 2,101,559,590
Note 20 Non-monetary Transactions in Cash Flow Statement The following non-monetary transactions (EUR) have been reported under other adjustments in the cash flow statement.
2020 Amount
Non-monetary contribution to share capital 119,872,221
Exchange rate differences in share capital of subsidiaries -159,558,002
Exchange rate movements 198,167,689
Minority interest -17,605,275
TOTAL 140,876,633

Consolidated Annual Report 2020
26
2019 Amount
Sales of other financial investment 808,523,685
Sales of subsidiary 4,261,977
Adjustment of loan receivable of subsidiary sold -10,000
Exchange rate movements, incl. opening balances 42,491,735
Valuation of financial investment 4,348,848
Profit from sales of other financial investment 1,500,000
TOTAL 861,116,245
Note 21 Impact of Coronavirus We have assessed the current impact of the coronavirus (COVID-19) pandemic on the company. We have considered the impact of the
pandemic upon determining the values of assets and liabilities in the financial statements.
We have also evaluated the potential future impact thereof on the company and, where relevant, disclosed the respective information in
the financial statements that describe the effects recorded by the date of the financial statements and our estimate of the future impact
thereof on the company, including on its financial performance after the balance sheet date.
To sum up, the company’s ability to quickly adapt to the situation and provide a flexible response is of crucial importance. The company
is constantly monitoring the changing threat assessments and is engaged in the analysis of the effects of the virus on an ongoing basis.
The management of the company assesses that the economic changes arising from the virus do not have a considerable impact on the
going-concern basis of the company.
Consolidated Annual Report 2020
27
INDEPENDENT SWORN AUDITOR’S REPORT To the shareholders of Ixellion AS
Opinion
We have audited the consolidated financial statements of Ixellion AS and its subsidiaries (the Group), which comprise the consolidated balance sheet as of 31 December 2020, and the consolidated income statement, consolidated cash flow statement and consolidated statement of changes in equity for the year then ended, and notes to the consolidated financial statements, including a summary of significant accounting policies.
In our opinion, the accompanying consolidated financial statements present fairly, in all material respects, the consolidated financial position of the Group as of 31 December 2020, and its consolidated financial performance and its consolidated cash flow for the year then ended in accordance with the Estonian financial reporting standard.
Basis for Opinion
We conducted our audit in accordance with International Standards on Auditing (Estonia). Our responsibilities under those standards are further described in the Sworn Auditor’s Responsibilities for the Audit of the Consolidated Financial Statements section of our report. We are independent of the Group in accordance with Code of Ethics for Professional Accountants (Estonia) (including Independence Standards), and we have fulfilled our other ethical responsibilities in accordance with these requirements. We believe that the audit evidence we have obtained is sufficient and appropriate to provide a basis for our opinion.
Other Information
The management is responsible for the other information. The other information comprises the management report, but does not include the consolidated financial statements and our sworn auditor’s report thereon.
Our opinion on the consolidated financial statements does not cover the other information and we do not express any form of assurance conclusion thereon.
In connection with our audit of the consolidated financial statements, our responsibility is to read the other information and, in doing so, consider whether the other information is materially inconsistent with the consolidated financial statements or our knowledge obtained in the audit or otherwise appears to be materially misstated.
If, based on the work we have performed, we conclude that there is a material misstatement of this other information, we are required to report that fact. We have nothing to report in this regard.
Responsibilities of the Management and Those Charged with Governance for the Consolidated Financial Statements
The management is responsible for the preparation and fair presentation of the consolidated financial statements in accordance with Estonian financial reporting standard, and for such internal control as management determines is necessary to enable the preparation of consolidated financial statements that are free from material misstatement, whether due to fraud or error.
In preparing the consolidated financial statements, the management is responsible for assessing the Group’s ability to continue as a going concern, disclosing, as applicable, matters related to going concern and using the going concern basis of accounting unless the management either intends to liquidate the Group or to cease operations, or has no realistic alternative but to do so.
Those charged with governance are responsible for overseeing the Group’s financial reporting process.
Sworn Auditor’s Responsibilities for the Audit of the Consolidated Financial Statements
Our objectives are to obtain reasonable assurance about whether the consolidated financial statements as a whole are free from material misstatement, whether due to fraud or error, and to issue a sworn auditor’s report that includes our opinion. Reasonable assurance is a high level of assurance, but is not a guarantee that an audit conducted in accordance with International Standards on Auditing (Estonia) will always detect a material misstatement when it exists. Misstatements can arise from fraud or error and are considered material if, individually or in the aggregate, they could reasonably be expected to influence the economic decisions of users taken on the basis of these consolidated financial statements.
As part of an audit in accordance with International Standards on Auditing (Estonia), we exercise professional judgment and maintain professional scepticism throughout the audit. We also:
- identify and assess the risks of material misstatement of the consolidated financial statements, whether due to fraud or error, design and perform audit procedures responsive to those risks, and obtain audit evidence that is sufficient and appropriate to provide a basis for our opinion. The risk of not detecting a material misstatement resulting from fraud is higher than for one resulting from error, as fraud may involve collusion, forgery, intentional omissions, misrepresentations, or the override of internal control; - obtain an understanding of internal control relevant to the audit in order to design audit procedures that are appropriate in the circumstances, but not for the purpose of expressing an opinion on the effectiveness of the Group’s internal control; - evaluate the appropriateness of accounting policies used and the reasonableness of accounting estimates and related disclosures made by the management;

Consolidated Annual Report 2020
28
- conclude on the appropriateness of management’s use of the going concern basis of accounting and, based on the audit evidence obtained, whether a material uncertainty exists related to events or conditions that may cast significant doubt on the Group’s ability to continue as a going concern. If we conclude that a material uncertainty exists, we are required to draw attention in our sworn auditor’s report to the related disclosures in the consolidated financial statements or, if such disclosures are inadequate, to modify our opinion. Our conclusions are based on the audit evidence obtained up to the date of our sworn auditor’s report. However, future events or conditions may cause the Group to cease to continue as a going concern; - evaluate the overall presentation, structure and content of the consolidated financial statements, including the disclosures, and whether the consolidated financial statements represent the underlying transactions and events in a manner that achieves fair presentation; - obtain sufficient appropriate audit evidence regarding the financial information of the entities or business activities within the Group to express an opinion on the consolidated financial statements. We are responsible for the direction, supervision and performance of the group audit. We remain solely responsible for our audit opinion.
We communicate with those charged with governance regarding, among other matters, the planned scope and timing of the audit and significant audit findings, including any significant deficiencies in internal control that we identify during our audit.
/digitally signed/ Krista Vainola Sworn Auditor number 444 Audiitorkontroll OÜ Audit firm’s activity licence number 274 Mõisa 4-2, Tallinn, Harju County, 13522 12 May 2021