i.W. Hunt, R.Y. ito, A. 7irI:er, L:.A. Birch, D.L. Norton ... · PDF fileEnvironmental Factors...
173
HAWAU T-19 008 C3 CCOPE.R+TlYE GRw T| ARJP, PPQ~L ' ~ Environmental Factors Affe ting I;he Growth Pate uf Grac~laria bursa astoris ogo! and GracIIaria curonoa: fo i >a 1 imur.--~ufo! i.W. Hunt, R.Y. ito, A. 7irI:er, L:.A. Birch, D.L. Norton, S.F. Gernler, A.A. Feg'~ey, S.K. Wirlop, " .d E. Ernce WORI'BING Plier.P, I'lo. 49 university o~ Haggai I S.A G! A~"If CO' LEGS PROC;.".8 Honolulu, I-i=~vaii
Transcript of i.W. Hunt, R.Y. ito, A. 7irI:er, L:.A. Birch, D.L. Norton ... · PDF fileEnvironmental Factors...

HAWAU � T-19 � 008 C3
CCOPE.R+TlYE GRw T| ARJP, PPQ~L ' ~
Environmental Factors Affe ting I;he Growth Pate ufGrac~laria bursa astoris ogo! and GracIIaria
curonoa: fo i >a 1 imu r.--~ufo!
i.W. Hunt, R.Y. ito, A. 7irI:er, L:.A. Birch,D.L. Norton, S.F. Gernler, A.A. Feg'~ey,
S.K. Wirlop, " .d E. Ernce
WORI'BING Plier.P, I'lo. 49
university o~ Haggai IS.A G! A~"If CO' LEGS PROC;.".8
Honolulu, I-i=~vaii

COOPERATIVE GRACILARIA PROJECT
Environmental Factors Affecting the Growth Rate ofGracilar' b t s ogo! and Gracilaria
limu manauea!
by
J.W. Hunt, R.Y. Ito, A. Zirker, E.A. Birch,D. L. Norton, S. F. Ger nl er, A. A, Fegl ey,
S.K. Warlop, and 'E. Ernce
Marine Ski 1'1 ReportMarine Option Program
Windward Community College
WORKING PAPER NO. 49
Originally published inJune 1979
Reprinted by theUn i vers i ty o f Hawa i i
Sea Grant College Program inApril 1982
Thi" hark, a product of theproject ET/E'-2!, vas sponsor ed bySea Grant College Pvogram under04-7-258-442Z9 from NOAA Office ofCommer'ce.
"Marine Option Program"the University of HawaiiZnsiitutional Geant No.Sea Grant-, Department of


ABSTRACT
Cause-effect relationships between environmental factors and
ogoj and Gracilariathe growth rates of Gracilaria
p 11/ 2 d
three month period for the North Reef of Coconut Island, He'eiaFishpond and the Kahuku Seafood Plantation Purge Pond and EffluentDitch. Algal biomass was also monitored on North Reef, a marine
2., 2/2 / d. ~b
at the experimentaland from 2.0 to 7.8X/day for G.
sites. Highest growth rates were obtained in environments with moderateto high water motion, low turbidity and stable substrata. Temperature,salinity and nutrients did not appear to limit growth. It appears thatit is biologically possible but not economically feasible to operate a
seaweed farm growing Gracilaria in Hawaii.


PREFACE
This report has been made possible by the efforts of eleven
freshmen and sophomore students enrolled in the Marine Option Program
of Windward Community College. The students participated in the experi-
mental field studies, the analysis of the data collected and the drafting
of the finished report. Those students that completed all required
aspects of the project have finished the "marine skill" requirements of
the Marine Option Program at Windward Community College. Their contribution
to this report is an exemplary undertaking and indicative of the high
quality of work of which Marine Option Program students are capable. The
students who participated in the study are listed below.
Re ort Wri tin Parti ci antsField Work Partici ants
1. Alizon 2i rker studentcoordinator!
Z. Elizabeth Birch2. Russell Ito student coordinatorof biomass study!
June 1979Jeffrey W. Hunt
Faculty Advisor!
1. El izabeth Bi rch student coordinatorof growth study!
3. David Chri sty
4. Eddie Ernce
5. Ann Fegley
6. Siliala Gernler
7. Angie Mielke
8. Dennis Norton
9. Sharon Warlop
10. Alizon 2irker
3. Eddie Ernce
4. Anne Fegley
5. Siliala Gernler
6. Russell I to
7. Angie Mielke
8. Dennis Norton
9. Brion St, James
10. Sharon Warlop


ACKNOWLEOGEMENTS
The Cooperative Gracilaria Project was funded by Sea Grant NOAA
Sea Grant Contract Number 04-7- 158-44129!. the University of Hawaii
Mari ne Opti on Program and the Windward Communi ty Col 1 ege Marine Dpti on
Program. The students involved in the project would like to express
their thanks and appreciation to Dr. Maxwell S. Doty principal investigator!,
John Mcl'iahon UHI't MOP! and Jeff Hunt WCC MOP! for making the project
possible and providing us with an opportunity to learn a marine skill.
We would like to give special thanks to all those who gave us
access to our test sites, including HIMB f' or the use of the North
Reef at Coconut Island, Bishop Estate and Mr, Kaneali 'i for the use
of He'eia Fishpond, and Kahuku Seafood Plantation for the use of their
purge pond and effluent ditch. We would also like to thank Ted Walsh
of the Analytical Services Lab of HIMB. Or, Kent Bridges of the College
of Tropical Agriculture and Dr. Gertrudes Santos and Joan Kirtley of the
Department of Botany, UHM for their easy availability and assistance and
advice during the project. The cover photographs are by William Magruder,
courtesy of Limu Mana of Hawaii.
At WCC we would like to extend our thanks to Dave Palmer and
Jeanette Matsunaga of the Media Production Center for their technical
assistance for graphics for this report and to Diana Oeluca of the English
Department for proof reading part of the manuscript . Lea Ann Hill,
Doreen Marugame arid Karen Hunt spent many hours typing and retyping our
drafts, Finally, without the administrative support and encouragement

of Provost LeRoy King, Dean Gerald St, James and Administrative Director
Keiji Kukino, we would not have been able to start, let alone complete,
such an ambitious project such as this.
Ae hope our report will contribute to the development of
mariculture in Hawaii by providing information which may be valuable to
local aquafarmers and pond owners who may wi sh to cultivate seaweed on
a larger scale.

TABLE OF CONTENTS
INTRODUCTION.
MATERIALS AND METHODS
40
Appendix A.Appendix B.
4 F
103
115Appendix C.Appendix D.
LIST OF FIGURES
Figure
Locations of Experimental Sites
Envi r onmental Factors Monitoring Stati on.
Methods of Attaching or Anchoring Test Tha'lli 12
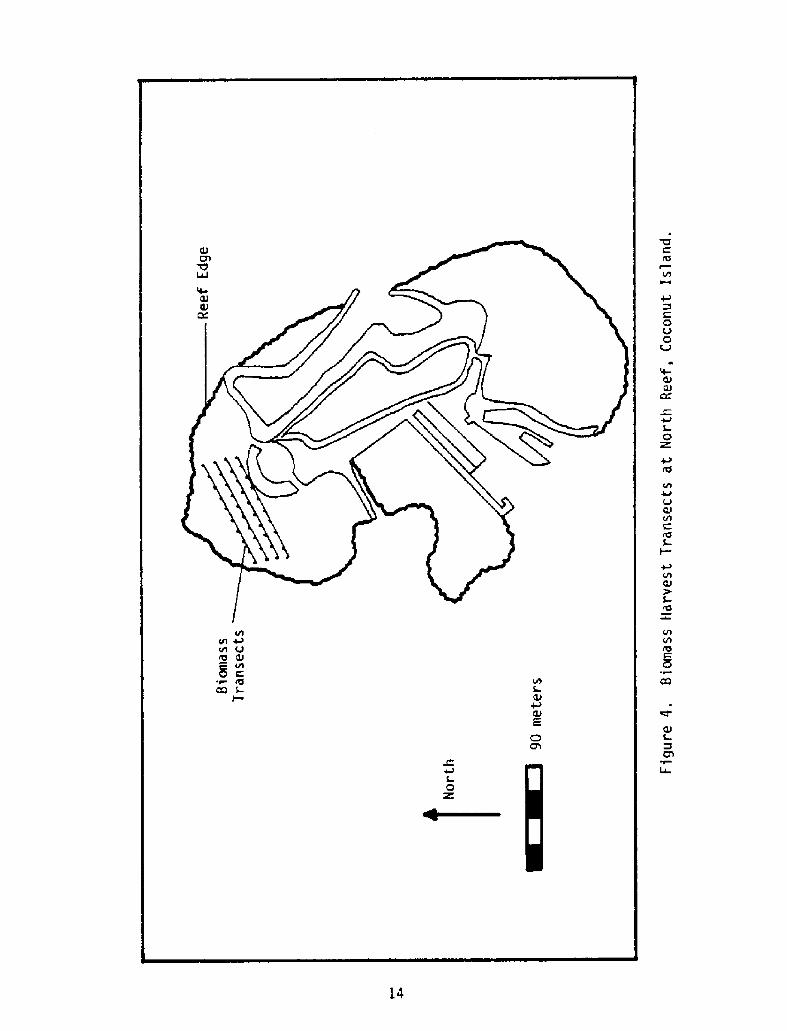
Biomass Harvest Transects at North Reef,Coconut Is! and . 14
Temperature Measurements at North Reef,Coconut Island .
Salinity Measurements at North Reef,Coconut Island . 5i
Diffusion Index Factor of Water Motion at NorthReef, Coconut Island .
Nutrient Content of Water at North Reef,Coconut Island 55
Drift Measurements at North Reef, Coconut Island. 57
10 Growth of G.Pots at
and G.
conut Island
G.~i Ion L~nes at North Reef, Coconut Island
RESULTS
DISCUSSION.
REFERENCES,
APPENDICES,
Laboratory and Field Equipment and SuppliesEnvironmental Factors and Growth Rate
In f o rma t i on.
Biomass InformationWeekly Growth Measurements.

LIST OF FIGURES cant'd
Figure
Temperature Measurements at He'eia Fishpond
Sal ini ty Measurement at He ' ei a Fishpond13 67
Diffusion Index Factor of Rater Motion at He'eiaFi shpond . 69
15 Nutrient Content of Water at He'eia Fishpond. 71
G Td. ~i G.Attached to Rocks an Bottom af He'eiaFi shpond,
16
17 GG.~TMonofilament Nets at He'eia Fishpond . 77
Temperature Measurements at Kahuku Purge Pond .
Sal ini ty Measurements at Kahuku Purge Pond.
79
19
20 Di ffusion Index Factor of Water Motion at KahukuPurge Pond 83
Nutrient Content of Water at Kahuku Purge Pond.21 85
88
23 d G. 'f 1'
an Monofilament Nets at Kahuku Purge Pond. 91
Temperature Measurement at Kahuku Effluent Ditch.
Salinity Measurements at Kahuku Effluent Ditch.
24 93
26 Diffusion Index Factor of Water Motion at KahukuEffluent Di tch 97
Nutrient Content of Water at Kahuku Effluent Ditch.27 99
28
on Rocks on Bottom of Kahuku Effluent Ditch. 102
29 Total Wet and Dry Weights Obtained from All Algaefrom Biomass Harvests, 104
G D 1 G ~DObtained from Biomass Harvests 105
1 1 dDT id«d.~Obtained f'rom Biomass Harvests
31
Growth of G.
an Rocksand G.
Kahuku

LIST OF TABLES
Table
Summary of Environmental Factors and Growth Ratesat Experimental Sites. 24
One-May Analysis of Variance ANOVA! of' Environ-mental Factors at Experimental Sites
Means and Standard Deviations from ANQVA ofEnvironmental Factors at Experimental Sites. 26
One-May Analysis of Variance ANOVA! of GrowthRates at Experimental Sites. 27
Means and Standard Deviations from ANOVA of GrowthRates at Experimental Sites. 28
Comparison of Growth Rates and Attachment Methodsat Experimental Sites by T-TEST and F-TEST . 29
Summary of Biomass Harvests 31
Temperature Measurements at North Reef, CoconutIsland, 48
Salinity Measurement at North Reef, Coconut Island.10
Diffusion Index Factor of Water Motion at North Reef,Coconut Island . 52
12 Nutrient Content of Mater at North Reef, CoconutIsland .
Drift Measurements at North Reef, Coconut Island.13 56
14 Growth of Gracilaria b
North Reef, Coconut Is 1 andin Pots at
58
15 Growth of GracilariaNorth Reef, Coco
in Pots at
R North Reef, Coconut Island1661
G i1 i ~ifliNorth Reef, Coconut Island
1762
Comparison of Number of Positive Growth Measurementsand Attachment Methods at Experimental Sitesby T-TEST and F-TEST . . . . . . . . , , . . . , . . . 30

LIST OF TABLES cont'd
Table
Temperature Measurement at He'eia Fishpond.
Salinity Measurement at He'eia Fishpond .
64
6619
Diffusion Index Factor of Water Motion atHe'eia Fishpond.
2068
Nutrient Content of Water at He'eia Fishpond. 7021
2272
G G G ff f ~ii «dRocks on Bottom of He ' ei a Fi shpond . 73
on Monotilament
on Nonofilament2576
78Temperature Measurement at Kahuku Purge Pond.
Salinity Measurement at Kahuku Purge Pond .
26
8027
Diffusion Index Factor of Water Notion atKahuku Purge Pond. 82
Nutrient Content of Water at Kahuku Purge Pond.29
on Rocks at3086
3187
on Nonofilament
3390
Temperature Measurement at Kahuku Effluent Ditch.
Salinity Measurement at, Kahuku Eff1uent Ditch .
34 92
35 94
36 Diffusion Index Factor of Water Notion at KahukuEffluent Ditch . 96
37 Nutrient Content of Water at Kahuku Effluent Ditch. 98
Growth of Graci lariaRocks on Bottom
fNets at He'eia Fishpond.
Growth of GracilariaNets at He eia F
Growth of GracilariaBottom of Kahuku
f Bottom of Kahuku Purge Pond.Growth of
Nets
G f GNets at Kahuku Purge Pond.
Attached topond

LIST Of TABLES cont'd
Table
G 6
Bottom of Kahuku Eff1uent Ditch.38
100
39 G Bottom of Kahuku Effluent Ditch. 101
40 107
41 108
109
110
44 111
112
46 113
47 114
Number of' Ring Tosses June 10, 1978 .
Biomass Data June 10, 1978.
Number of Ring Tosses June 24, 1978 .
Biomass Data June 24, 1978.
Number of Ring Tosses July 22, 1978 .
Biomass Data July 22, 1978.
Number of Ring Tosses August 17, 1978
Biomass Data August 19, 1978.

INTRODUCTION
The "Cooperative Gracilaria Project" was conducted during the
summer af 1978 June, July and August! by Marine Option Program students
of Windward Community College. The objecti ve of the project was to
investigate the cause-effect relationships between environmental
factors and the growth rates of two economically important species of
limu manauea!. ogo! and G.Gracilaria, G.
Through an understanding of these relationships, the feasibility of
mariculture of ogo and limu manauea as a cowercial crop in Hawai~
could be better determined. Recommendations for the implementation
of farming systems could also be developed.
source and as a source of the carbohydrate phycocolloid known as
"agar" used by many industries. In Hawaii, both species of Graci laria
are the main ingredient in many Hawaiian and Japanese dishes Abbott
and Williamson, 1974; Fortner, 1979!. Nutritionally, species af
Gracilaria provide small amounts of protein and fat, Hoyle, 1975! and
probably are also a good source of inorganic salts and vitamins.
Madlener 1977! claims that ago identi fied as Graci laria verrucosa!
contai ns very high manganese, hi gh zinc, protein, starch, sugar, fat,
vitamin A, vitamin 8>, sodium, phosphorus, soluble nitrogen, sulfur,
iodine, potassi um, calcium , i ron, chloride, silicon and trace elements,
but gives no nutritional values for these contents. The use of other
limu as well as Graci laria in the diet of Hawaiians provided variety
to an otherwise monotonous diet of fish and poi; together, the three

components fish, poi and limu! furnished the necessary protein,
carbohydrates and minerals for adequate nutrition Abbott and Nil liamson,
1974!.
It is estimated that 41,867 kg 92,300 lbs! of limu were sold as
food for $58,922 in 1977 with ogo comprising most of the sales Fish
and Game statistics!. These totals reflect, only voluntary reports of
harvesters and are probably only a portion of the total actually
harvested, There is probably sufficient local demand to utilize an
additional 143,338 kg �16,00 lbs! of ogo per year Aquaculture
Planning Program, 1978!. If the projected amount of 143,338 kg is
added to the 41,867 kg reported sold in 1977, it appears that there
is a market for a least 185,205 kg �08,299 lbs! of ogo to be sold per
year. Currently, ogo retails for approximate'Iy $2.87 to $3.97/kg
�1.30 to 31.80/11! Aquaculture Planning Program, 1978 . At theseretail princes for ogo, the total retail value could range from $531,538
to $135,263 for 185,205 kg. There is no data for sales of limu manauea,
but it is probable that limu manauea sales are included in total reported
retail sales of ogo.
The most valuable use found for seaweeds, however, has been the
use of extracts of phycocolloi ds agar, carrageenans, and algi ns! in
industry . Phycocolloids are used mainly as stabilizing, suspending,
emulsifying or thickening agents and are used extensively in food ice
cream, salad dressings, beer, candy!, pharmaceuticals drug capsules,
surgical ointments, jellies!, textiles pri nt pastes, si zing compounds!,
paper products and paints Edwardsa 1977; Naylor, 1976!.
The world demand of phycocolloids far exceeds the available
supply Edwards, 1977; Naylor, 1976!, and in 1974 the worldwide producti on

of marine phycocolloids was 29,685 metric tons, worth approximately
$300 million, with agar comprising 6,808 metric tons worth $86.25 million
Aquaculture Planning Program, 1978!. Agarophytes have been valued as
high as $1,000 per ton Hoyle, 1975!.
Because of the steadily increasi ng demand for seaweeds, "wild
harvest" techniques can no longer provide the worldwide volume needed
by industry or use as food. Local fringing reefs are now being
overharvested and are often picked bare, primarily because of the
growing population of 0'ahu and its demand for edible seaweed but also
because of those ~nd~viduals harvesting ogo and limu manauea for a
part or fullt me livelihood.
In order to meet the worldwide and local demand, suitable locations
to grow seaweeds need to be determined and cultivation started. New
techniques for volume production must also be developed. Not surprisingly,
there has been a growing interest in Hawaii recently to develop seaweed
farming in ancinet Hawaiian fishponds as well as cultivation in new types
of mariculture systems. A seaweed farming industry would add greatly to
the diversification of Hawaii's economy.
The biologica'I potential of farming Gracilaria in Hawaii is good,
There are two basic seaweed cultivation techni ques both of which are
suitable for Hawaii. The first technique, the "closed system," is used
mainly in Taiwan where seaweed is raised inside f'ishponds, 0'ahu alone
had about 100 fishponds in 1900, about 700 in 1930, and about 6 or 7
remain today Kelly, 1975! . However, 67 ponds throughout the state have
recently been identified and assessed for usefulness for mullet and

milkfish culture gladden and Paulsen, 1977! and mariculture of limu could
be part of polycul ture operations in these ponds.
In the second method, the "open system," seaweed is cultivated in
an area not cut off from the open sea. Generally, seaweed thai li are
affixed to rocks, netting, or stakes and harvested after suitable growth
pe ri ods Edwa rds, 1977! .
There are a number of areas throughout Hawaii that correspond to
both the closed and open systems. Four sites which correspond to
open and closed systems and wh1ch were investigated in th1s study were
the North Reef of Coconut Island, He'eia Fishpond, and the Kahuku
Seafood Plantation Purge Pond and Effluent Uitch.
Ex erimental Sites
The North Reef at Coconut Island Figure 1! served as one
experimental growth site. In additi on to growth experiments, biomass
samplings of the wild crop of Grac11aria were conducted at this site.
Coconut Island is located off Windward 0'ahu in Kaneohe Bay and is the
site of the Hawaii Institute of Marine Biology HIMB!. The North Reef
has been designated as a marine preserve and no harvesting of limu or
other organisms is permitted, The reef 1s five hectares 12.S acres!
in size, with an underlying carbonate base covered by generalIy white
sand and occasional carbonate rocks. The depth of the water over the
reef varies 1 m due to tides. The site is representative of an open
system and provided information on growth and biomass in a non-harvestable
area.
He'eia Fishpond was chosen as the second experimental site
Figure ],!. He'eia Fishpond is extremely important historically in
Hawaii. The pond measure 35.2 hectares 88 acres! and the pond wall

<J
D C!
OVCL C
«LI
$4-N 4
Vl ~ 0 4J
0 0 /!
Vl V
CP Q rt$
CE O ~ ~o-
V C7L-O CmuOJM O O Oa aoo!C ~4< <UJM vl C$ ra
OJ~0! UQ Lr Vl C/!
OM
nfl MCV «U0
O 8 4 nlVXXV R
ammu@

which once completely enclosed the pond is 1500 m {500 ft! long
{Kelly, 1975!. The average depth at the experimental site was 1-1.5 m
at, high tide. The bottom of the pond at the experimental site was
a mixture of large rocks and dark, muddy sediment about 0.5 m or more
thick. He'eia Fishpond was chosen as an example of a closed system.
Land use mauka of the pond has always affected the degree of sedimentat~on
in the pond. It has been used in a variety of ways from 1840 to 1940
including taro cultivation, cattle grazing, sugarcane, rice, and pineapple
cultivation {Kelly, 1975!. Recently, sediment runoff has increased
due to housing development in the area. The pond wall is in need of
repair and makahas to promote flushing acti on .
Kahuku Purge Pond, located at Kahuku Seafood Plantation Figure 1!,
was the third experimental site. The pond measures four hectares 10 acres!
and has an average depth of 1-2 m {3-6 ft! and serves as the purging area
for wastewater from the oyster raceways of the operation. The effluent
ditch site 4! empties into the purge pond. The purge pond was interpreted
as a closed system.
The fourth experimental site was the effluent ditch at Kahuku Seafood
Plantation in Kahuku Figure 1!. The ditch has a varying depth but gen-
erally runs between 0.5-1 m in depth. The ditch carries the effluent from
oyster raceways to the purge pond site 3!. The ditch was the shallowest
area that test thalli were grown in. The bottom of the ditch was clean,
white sand with intermittent rocks. The effluent ditch was interpreted
as an open system as it was flushed periodically.

The following hypotheses were formulated in order to investigate
the cause-effect relationships of environmental factors on the growth
G. ~b«i 411 1 lt I I�I "" -~ Psites.
P 4 I: Ihave t e highest percent per day growth ratesat the North Reef at Coconut Island.
Hypothesis 3: The variation in percent per day growth rates of
experimental si tes wi1 1 be due to di f ferentinteractions of environmental factors.
4: 11 11 lt «I.~l1 ~ii I» I I «Isummer months.

MATERIALS AND METHODS
Changes in weight of the test thalli of Gracilaria
and Gracilaria were monitored weekly to determine percent
per day growth rates at the experimental growth sites. Causal environmen-
tal factors inf1uencing the growth of test thalli at the experimental
growth sites were also monitored on a weekly schedule. Physica1 envi ron-
mental factors measured were temperature and water motion. In addition,
the drift across North Reef, the only site for biomass collection, was
also measured. Chemica'l environmental factors measured were salinity
and nutrient content of the water. Monthly biomass collections were also
done on North Reef. The materials and methods for measuring each envi ron-
mental factor, determining the percent per day growth rates of test thalli,
and conducting the biomass collection are described below, Detailed
equipment lists for each area of the project are gi ven in Appendi x A.
A, Physical Environmental Factors
1. Temperature C!
2. Water Motion DIF values!
Water motion was measured at each of the experimental growth sites
A maximum-minimum thermometer was anchored to a hollow tile brick
Figure 2! or rock at each experimental growth site. Whenever the experi-
mental growth sites were visited at least weekly!, the max~mum and
minimum temperatures since the previous observation and the ambient temper-
ature or temperature at the time of recording of the maximum and minimum
temperatures! were recorded.

O Ji'

by using cold cards Doty, 197la!. Clod cards were taped to small,
solid concrete bricks and anchored or a 24 hour period next to a hollow
ti1e brick Figure 2!. Two cards were taped to the brick on a north-
south orientation and two cards were placed on an east-west orientation.
The change in dry weight of the clod cards in a 24 hour period was
di vided f~ rst by four to obtain the average change in wei ght. This
average was then divided by a factor of 0.27 to calibrate the diffusion
measurement. The resulting figure, a OIF value, was an indication
of water motion at the experimental sites.
3. Drift {m/minutes; degrees!
In order to determine the di rection and velocity of the prevailing
current at North Reef, Coconut Island, a cork was dropped into the surface
of the water. The distance traveled in one minute and the di rection the
cork drifted was observed and recorded. These observations were repeated
three times. A compass was used to determine the di rection in which the
drift occurred.
B. Chemical Environmental Factors
1. Salinity /oo!
Salinity was measured each time the experimental growth si tes
were visited at least weekly! with a portable refractometer. Samples
of seawater were taken from the area around the Gracilaria test thal1i.
2, Nutrient Content of the Rater p.gat/1!
Nutrient analysis of water samples collected at, the five
experimental growth sites was done by the Analytical Services Laboratory
of the Hawaii Institute of Marine Hiology HI% !, Analysis was accomp1ished
through the use of an auto-analyzer,
10

Water samples were co11ected during each weekly v~sit to theexperimental growth sites. Water samples were either collected in brownpolypropylene bottles and brought immediately to HIM8 for filtrationand freezing, or the samp'les were filtered through a syringe filterapparatus in the field and then frozen.
C. Growth Measurements %/day!
Test thalli of the two species of Gracilaria were weighed on a weekly
When cleaned, the thalli were weighed by placing them onweighing.
the weighing platform of an Ohaus triple-beam balance and the weight
recorded. During the weighing process, the thalli were inspected for
11
basis and the percent per day growth rate was later determined usinga Wang 700 Series Advanced Programming Calculator at the Departmentof Botanical Sciences, UHM. Only positive growth rates were used inthe calculations as negative growth rates the loss of algal biomass!could be due to grazing or breakage from water movement or handlingin weighing. Statistical analysis consisting of T-TESTs, F-TESTs andOne-Way Analys~s of Variance ANOVA! of environmental factors andgrowth rates was accomplished using a computer terminal at the ComputerBased Education Center of Windward Community Co1lege.
To determine the weights of the test thalli in the field, all thalliwere first carefully retrieved from the rocks, cement nursery pots, linesor netting they had been placed in or attached to the week before Figure 3!.
innertubes with' attached plywood bottoms were used to float the testthalli to the weighing station on shore and back to the experimental sitesafter weighing, Once on shore, the thalli were transferred to a bucket
of seawater, uniformly cleaned of epiphytes and debris and prepared for

C 0 ClCcC
CJ!'I
EJrl5 P O 0 0
wPMQ
CJ CP <U C
O O V UIO % 4
C+>WW
0 4!K Wcuua
CJ
Cl
12
O Q0. W
OP M
E
C W4l 0
In 8
r
I Rw c0 CJ
0 ~
m aV C0 O

damage or breakage. Thalli were replaced or reweighed according to the
severity of breakage or epiphytic growth. The new weights of replacement
thai li were recorded as thalli were replaced, It was found that in
windy conditions, the scales had to be placed in a plywood box and
covered with a plastic sheet to assure accurate weighing. Leveling of
the box was done through the use of a 15 cm pocket level.
D. Biomass Collection {grams/m !
A monthly biomass collection Doty, 1971b! was done at the North
Rect of Coconut Island Figure 4!. This was done to determine the amount
of har vestable wild crop of Gracilaria duri ng the duration of the inves-
tigation. The biomass of other algae occurring on the reef was also
determined.
Four sampling teams composed of two samplers each were used for
the biomass collection; team one was closest to the shoreline and team
four was closest to the reef edge. Each team used a 45 cm diameter
stainless steel ri ng, ten numbered bags with plastic tags, an innertube
float and a clipboard with a plastic writing slate. The four teams were
spaced 20 m apart on the reef and sampled 10 sites approximately 20 m
apart across the reef { Figure 4!. The fi rst sampling day, Rune 10, was
an exception to this procedure as only six to seven sampling sites per
transect line were done. Ring samp'les were obtained by randomly throwing
the ring behind the sampler's back until a harvestable quantity of biomass
was obtained. The number of times the ring was thrown to obtain algae
in the ring was recorded. All algae within the ring was then collected
and placed in a numbered plastic bag; each ring sample was placed in a
separate bag, When the biomass collection was done, all samples were
13
O
O4J
$O
C!v!
S-

placed in a cooler for transport to the lab to be sorted, identified
and weighed.
In the laboratory the col1ected biomass was given a quick freshwater
rinse and all attached debris and epiphytes were removed. The wet weight
was obti aned for each speci es within a harvest site by weighing the algal
biomass on an aluminum foil "boat" on a mettler balance. The foil was
used to hold the biomass as it was dryed. After drying, the dry
weight of the biomass for each species was determined. The algal
biomass was dryed in a seaweed dryer provided by the Department of
Botanical Sciences, UHM.

RESULTS
The results of the monitoring of environmental factors and growth
rates are summarized below for each site and in Table 1. Additional
information detailing environmental factors and growth measurements
may be found in Appendices 8 and D. 8iomass harvest results are also
summarized below and in Table 8. Additional biomass harvest information
may be found in Appendix C.
North Reef Coconut Island
Mater temperature at North Reef, ranged from a minimum of
23 C to a maxi mum of 29 C and was consistently between 25 C to 28 C
for all three months the initial reading of 34 C was due to incorrectly
reading the thermometer out of the water!. Salinity was consistently
between 34-35 joo. The Diffusion Index Factor DIF! was higher in0
June �2.8! than in July �4.5! or August �3.9! indicating somewhat
higher water motions during the early summer. DIFs at North Reef were
higher than at all other sites. The drift across the reef averaged
16.5 m per minute to an average 228 S'A for all three months. Nutrients0
ranged from 0.02 to 0.77~gat/1 for P04, from 0.27 to 1.40pgat/1 for
N03, and from 0.35 to 12.34pgat/1 for NH4. Average nutrient contentsat North Reef appear to be at the lower end of the range for P04, N03
and NH4.
Test thalli on the North Reef had the highest percent per day growth
.!!/// ! ! . / I! !/ ',~b
and 7,8'%%d/day lines! and 3.6%%d/day pots! for G. Except
«! !.!l/!y ! .~ii ! . g

were the highest obtained at the experimental sites.
Oue to the heavily-sedimented bottom and turbid water, measure-
ments of environmental factors were di fficult to obtain at this location.
A number of times the thermometer, clod cards or test thalli were lost
and as a result some data is lacking. However, from what was recorded,
temperature ranged from 22.5 C to 32.0 C and salinity ranged from 24 /oo0 0
to 35 /oo. OIFs averaged 1l.B at He'eia Fishpond, the lowest of all
the sites. Nutrients ranged from 0.07 to .038~gat/1 for P04, from
0.03 to 2.14pgat/1 for N03, and 1,07 to 17.60+gat/1 for NH4. Averagenutrient contents at ke'eia Fishpond appear to be at the lower end of
the range for P04 and N03 but higher than North Reef for NH4,Due to the turbid water and heavy, muddy sediment, problems were
also encountered in collecting and weighing the test thalli which were
originally attached to rocks on the bottom. In August, the test thalli
were switched from plantings on rocks to plantings on a monofiliment
net about 1 m above the bottom and at a depth of 50 cm at low tide. G.
2./i/ y / / / « ./I/
//1 t . G.~ill / .'/ «d
rocks on the bottom and 2.0;4/day on the monofilament net. These low
growth rates, lowest for all the sites, coincided with the observation
that most of the test thalli usually died in one to two week's time
whether planted on the bottom or on nets.
17

Kahuku Pur. e Pond
At this location temperature ranged from 22,6 C to 32,0 C. Salinity
had a narrow range from 24.5 /oo to 26 /oo, DIFs averaged 19.7 for the0 0
bottom site and 20,1 for the monofilament net site. As in ke'eia, some
thermometers, clod cards and test thalli were lost in the heavy sediment
a few times making the data incomplete. Nutrients ranged from 0.04 to 1. 14
begat/1 for PO<, from 0.10 to 8.32pgat/1 f' or N03, and from 5.39 to 24.65begat/I for NH4. These high nutrient levels were expected due to the factthat the purge pond recei ves the waste water from oyster raceways,
There were also problems at the purge pond site as other seaweeds
notably Ul vaI grew on the test tha'lli and attaching lines. In the last
half of August the test Challi were therefore moved and attached to a
monofilament net at a different site.
Growth rates while attached to the rocks on the heavily-sedimented
|. i/bottom were 4.2X/day for G.
and 5.8%/day for G. corgrowth rates were 3.0//day for G. b
Test Chal! i on the nets were again covered by much growth of other algae
Kahuku Effluent Ditch
Temperature ranged from 24.0 C to 29.0 C, Salinity ranged from0 0
24 /oo to 26.0 /oo. Some clod cards were lost but the data collected
indicate an average of DIFs of 24.4, Nutrients ranged from 0.33 to 1.87
begat/1 for PO<, from 5.70 to 16.30!begat/1 for NO3, and from 4.44 to 24.50begat/1 for Nk<. These nutrient values were the highest obtained at thefour experimental sites. The effluent ditch carries wastewater from
oyster raceways to the purging pond, At this site is was also observedthat the test tha'Ili were quite brittle, This might be due to the addition
18
For the three week period the test thalli were grown on monofilament nets, the

of silicates to the water in phytoplankton growing tanks in which
diatoms and other unicells are raised to feed the oysters.
averaged 6.64 day on rocks on the clean,
whitish sediaent of the ditch while G. averaged 6.5~/day.
Statistical Anal sis of Site Information
Environmental factors and growth rates at the four experimental
sites were compared through One-Way Analysis of Variance ANOYA!; the
results are surmarized in Tables 2, 3, 4, and 5. Growth rates and
attachment methods were also compared through T-TESTs and F-TESTs Tables 6
and 7!.
ANOYA of maxi mum, minimum and ambient temperatures at the four
experimental sites revealed no significant differences in temperatures
Tables 2 and 3!.
ANOYA of salinity measurements at the experimental sites revealed
significant differences in salinity. Kahuku Effluent Ditch and Kahuku
Purge Pond had lower salinity levels than either He'eia Fishpo~d or
North Reef Tables 2 and 3!.
ANOYA of nutrients at the experimental si tes revealed no si gni-
ficant differences in P04 levels. The significant differences in
NO and NH4 levels were due to extremely high levels of NO and NH4 at3
both Kahuku Purge Pond and Kahuku Effluent Ditch Tables 2 and 3!.
ANOVA of water motion at the experimental sites showed that
the water motion at each site differed significantly from the other
Tables 2 and 3! .
ANOYA of growth rates at the experimental sites revealed signifi-
cant differences in growth rates Tables 4 and 5!. In the analysis of
growth rates, measurements from pots and ~ocks were grouped together and

measurements from lines and nets were grouped together. These attach-
ment treatments were felt to be similar enough Co permit this grouping
without affecting the accuracy of the analys~s. The highest growth rates
occurred at North Reef and Kahuku Effluent l3itch while He'eia Fishpond
and Kahuku Purge Pond had the lowes. growth rates Table 1!.
Significant differences in growth rates at the sites may have
been attributable to either environmental factors or the attachment
method. However, the significant differences in growth rates appear to
be due to environmental factors rather than the attachment method
Tables 6 and 7!. The only significant difference in growth rates
due to the attachment method occurred with G
lines and pots at North Reef Table6!. The only significant difference
in the variances of growth rates of the test thalli occurred with G.
~li l R f � . II t i f
growth measurements at each site a.iso showed that breakage which occurred
was largely randomized and not attributable to attachment methods Table 7!.
Biomass Harvests
The biomass study monitored the amount of seaweed on North
Reef. Biomass harvests covering an area of approx~mately 10,800 m2
Figure 4! were done on four days, June 10, June 24, July 22 and
August 19, 1978. Ring tosses directly sampled 5.36 m of this area each2
of the four harvests. The harvest provided information of the wet and
dry biomass of all algae including the wet and dry weights of G.
Tab l e 8! .and G,
The tota! wet standing crop of all frondose algae averaged 384 wet
g/m and varied from 326 to 509 wet g/m f' or the four harvests. The2 2
20

I -~i / 2
0.3 to 19 wet g/m for the four harvests. The standing crop of2
g / I 2« tl «g/2 2
the four harvests. These figures are somewhat higher than actual asnot all rings thrown encountered biomass. Hoyle �976! has reported
G.~i d2lg g/ d2
75 wet g/m for 14 months �972-1973! on the reef at Sand Island. North2
Reef had a smaller amount of Gracilaria due to a reduced amount of stablesubstrata. The average amount of GraciI aria biomass could conceivablyincrease if a year long or longer study were conducted.
The total wet biomass of all algae remained relatively constantfor the four biomass samples, Total wet biomass ranged from 2,200.4 gon July 22 to 3,237.8 on June 24. The total dry weight of all harvesteda1gae paralleled the changes in total wet weights, ranging from 236 gon July 22 to 387.8 g on June 24. The wet weight to dry weight ratio was9:1 for the total biomass collected for the four harvested.
I/ tg G. ~lt I g 2. g d tl
to 119.1 on July 22 and totaIed 151.7 g for all four biomass harvests.
Dry weights paralleled these changes in wet weights ranging form 0.4 gon June 10 to 14.9 g on July 22 and totaled 19 g for all four biomass
ranged from 117.8 g on August 19Met weights for G.
to 285.6 g on June 10 and totaled 687.6 g for all four biomass harvests.
Dry weight paralleled these changes in wet weights ranging from 13.9 gon August 19 to 33.2 g on June 10 and totaled 86.9 g for all four biomass
I ly II« ~: G.~f't
I . dy gl«:I/ G.~l

The total number of tosses thrown by each team each harvest
varied for the four days of sampling. The total of ring tosses needed
by each team to collect biomass was 38 f' or team 1; 56 for team 2; 57 for
team 3; and, 69 for team 4. The actual total of ring tosses which
contained biomass was 36 for team 1; and, 37 for teams 2, 3 and 4. Algal
biomass was greatest toward the shoreline and least at the reef edge.
This was due to the occurrence of more rocks stable substrata! along
h . y
dh d h"
stable coral rubble or consolidated 'limestone associated with shallow
sand deposits for occurrence.
lh d«ll«pp y h
p d p h «h G. ~fl h h
Reef pots!, He'eia Fishpond nets!, Kahuku Purge Pond rocks!
had higher perand Kahuku Eff'Iuent Ditch rocks!. G.
f �
He'eia Fishpond rocks! and Kahuku Purge Pond nets!.
pp yp I l l. G. ~h
hhhpl hlph
22
Coconut Island.
The data co'Ilected support Hypothesis 3, There appeared to
be difterent interactions of causal environmental factors at each of the
four experimental sites, Envi ronmental factors most affecting the growth
of Gracilaria appeared to be water motion, turbidity and bottom type.

The data collected do not support Hypothesis 4. There was
8i G. ~t«i i «pa
a decrease in biomass of G.
decreased markedly in August.
23
over the three month period.

0ll0
DI AI
I A0
IV I
C 0
a
0
IV
ClC
Al ACISICl
OIAI O O
ISIOIVO
DD A.
IVVI
O AC~ V
O IC
0
AI Al
O IA0I
CIVl
8
IS0
Tl0
C
rt
0
C'Jh
IC
Z
a
C
a AlA
fv
aa
AI.0 a
'0v gL' 0Ov0 tIA0 Cj 0
v 0C 0
0000 00V0 0
0 vI C
V0 ~L 0
V 00
U
AhA.0 C0Z I
AI IA
RK
AI D
V VCZ
0VLV
v
r g0 0V I
0CV
0S
0
C 0V D

m XIJJ
QJ
U V 0 0.4
Cf4J 4V 40 V
O- VC0 -aS-OL!
a QL
CC Itg
!
S-0
QI MQICL +7
aO+JI0 CZII
CL 4
0 0
0 5-
QP
E+JrOI$-gj X
E OP
CE
'IC'I
~ I-5- O
CLOK X
C
C-I
J3 II0
C35-0
4 ~ ~
QI<n O
0
0~ ~ ~ II
E OJ CL
~ I X 0 OJS-0. CCL rt5 0Cl M CL
~ A OJ g
CL IJ-Ch
C$
QI ~ ILI
QI7 3 K
QIIf
C OJ
0
4 S-
0 QIrtl W/~ I OL
C -I-tA
J5 gI-
ZD QlCLX
5 Qf
0
re
fLLa+X C LJ OJ
S-0 QI3 4+J 4
I
r
QI ~
CB'I
OJ

t3 0
R
NIOIDNOIOeCQCOP eN Nee
~~eIJI rnIoo~ epeeCh Mct NHCOo p! o o
Acre~ ANOIcI NOO>IOQcl Ol e&COO N>COFl
rwo H&ooooo ooze e4QP
CO CRoco~ewOem crwcOO
MNeN wP-%w ctcOCOOOOO+ OONN <4N<
IO IO IX! COI~AOQO
Pl P! CV
CO O r QI N O CJI e g ~ O ecoN'oN +0 44 ep 5lcII
O QO co IJl e vn e 4Q vN<NN PiNNN NNCVN
CO COCO& «OCO CON COCO COW NIO IJ1IAe co m cOO4lCOr aIJlCOr Or OCON
I
Su
QJF
QIR
6 QJ
C 0
0
QJ0
E E CX: R
e
VI
C 0 R QJC!
D WA-C, OM
II- OO.QJ aQJ M QJ CCX III �I QI+4 Dcu 44-
R CO~ OWZ: QIA
QJMMRR
< 0QI Cl.QJ C4 Vl
R0 mZ QI
QI
0 wC 0 ClO-QJ CPl QJ
4 vc5 4J
RRhC
IIJZ7 PC '~OOOQJQI QJ
4 cD 4J
hC
CIJ- 0QJ aQJ MOCJ 4
R0
QJQI
4 III Sl QI~ ~C 4W 4Oc OW
QJ ~Ql J
bC
VO C.r
0 CI0 O
QI 0.QJ M4 IJI CJI QI~ ~~ 4.
O0 '~X
QJMMR
R
EJ0C0 O
OOQJ 4QI M QJ CCJI QJM 4 O 4
R 4-0 0- V LLJ
QJ ~QJ X XR
M chC
V'0 u0 CI
0 4QI AQJX QI
IJI OI QJ
O 40~ D4JK QJA
QJ C 4RhC N
X
CJ CC OCI0 4
QJ 0QJ J QICL IJI PI QJM 4 4 III R0
QI AQI K JCT R

a4
+
5C5 4W 0
30
CB
4 0
Ce S.0- i< O
6
C 00 0
0 S-
O VlQt
'I 'P
�
cL C
WESQta
C XO 4J
! O
I
04-'I
I0
0 0 o C 0 0 U
IgA
QI
0O. "Vt C
Vl Qt0 VIA V
oC I
QIQI Itt ~ a L. QtVl ~ UM W E
CO M QI VI
Vl Qt 2 w CQt M M r Q!
QJIl Ol&
Ql Vl C. D Qt I D 0 CL
O t � M5aQJ ~~ ~ Qt
Ol ~ -ZW Via SCC<n~ CHO0 C! W % D % 0r CL' O MM Qt
a oEM 5-4 QP I IE~ " 4 <'U o
av ca ~ e cX ~ Qt 6 QtOW Qto II M 0
CCM M Ua W W vl Qtax~ -aw l-~C V VlW 0 QP't
3QI 0 0 Ql C
05 Vl ~ rg
Cn Vl It ~ e ~1m"V ! O C
c au 0C S-Ol EWC UK 0 C vl
Q I' 'r Qt S QtQJ
A VI Vl C C ~ O. QlQt'm O Qt Vl X 4-
C CWa V e4-I r 'r
QI c5 t5 0 O~ VI ~Mm3
" Qlo 4
C~ 8 QlCL0 % QlM 0
> CY Z Qt 4 cC eI II ~ Ol Ql
4O'a seaQI M t ~ % 0C ~ M
CJl 5- CL rO 4 Qt +JOK% $- C C
O Qltt
II '~ VI W QI VlCC',m Vive 4-! W m W 0 +J +II- W
QIG ~ C ~ Ow om cwv>wm c
~ e0
27

0rdt3C .~rtl T
CCI COK PIFl ~ ICl Ch O92
W'cf NI0ID CII &
ACICA CV ~OFl
+ROCZIIO IO WWFl Fl Fl IO
0' + ICl LAN N W ICl~ Pl MICI
57 O ~
0
0 T CI O<V~OF! Fl
CO
cC
V92 Vl VlVIVUM~ tJ~LLB
QlIll Vl Vl~ 4! IV
C
Vl Vl VIVl 0 0OOOOL S
VlCJ Vl Vl
4l IV
vl D
M ~ IC Ii!
L VlCl0 XLC
28
C O
'I CCI! tD
C0 0
4 0CLIllOJ M Gl
VI Ol
CLl0
Ill JCQDID
D 0'~0 OC0
4 0 QClIll M Ill CCY Vl OI Ill
LN Li
CL 44
0 ~ 0'Z
SCXY Nil7
C4824I 0.OJM CJCC, 'VI C7I
ICi
L ICI0
Z
IJ'0 W
'0C 0C5
4 OCLQJ M IllCC ah Ch CV
+J CL 4rg
0 w NLJ4P ~QJ M MICl
hC N

O
O O O
UJII�
N Al t0 Ltt
N O
P! tt0I WNOIA O
05 ~
w m
W QCCI ~N N IA ~
Qe m
OO ct' Pl
VlCJ Itl0
0d
4J vl0 0
Q. 0 4!0
tJ0L 0
le0 I-I0 III
0
0 0IC05 44I
KLU
29
0 0 IOI Ittttt4JI/l
0Itt0
04I
4
CtN NN
IV
EJII>
Ill

0
~IVl
II0 CJK
VlIJJI
rO
~ J IIV
JJ
V IOaeNOPP EA
P IO
VrprIO
P PlOOOO
OOrO IJl
OO OOPt
VIoO IS
VlO
VlV pr0 rS
o
VIIJ0 ISL g
IS VIC~ ao JJ
oo
VIL.
G rpI
IJIS4
IO oOI 4IS Vl
45 o
30
J I�W cn3 M0 I�
I pr
QJ MC
~ P CT5
~ I IVl0 W0- I�
I
0
OJVl
6 QPP
4-0 ~
C W0 C
Cl
rl50. CLIE 0-0M UJ
IS DISI C
orO DCLhC 4
o
rS rSl-IS V! IJ
rSo 4IJ VIrS
IO vlrSrSVI Or
OClJ EJ DIJ C'Q O rOrS IJl
0WC J+JG
tlr Vl IS
rO CJV92
o mIO VI gCTrS I VlC VlO IJJrO5~"IP- M
o pVl rOL I
Vl
rOVr IV/MAL
o p-LW OCh aJ VI JrOI 3p Jr
O I
IJ Irgv Lw
VI 4.Vl OL 4VlrS ra0
0c oVl IS OI Ol
IJJ $ IJI D rS Ql
er 4a

CD
fO+J0I�
Q JlCO
N
illC7l
N
Ch CaO
QNN
N
NN
QN Ch
QN N
N

DI SCUS' I ON
Growth Ex eriments
Although there was an interaction of environmental factors,
the following observations may be made of the cause-effect relationships
between the monitored environmental factors and the percent per day
growth rates of G,
sites.
at the experimentaland G.
Water temperature was not a "imiting factor at the four experimental
sites as it varieo little from site to site, The largest difference
in average temperature of the four sites was only 0.9 C Table 1!. These
small changes in temperature should not produce a difference in growth
of the two species of Gracilaria at the experimental sites, ANOVA of
the temperature at each experimental site also revealed no significant
differences in temperatures Tables 2 and 3!.
Salinity did not appear to be a limiting factor at the four exper-
imental sites. The salinity at the four sites ranged from a low of 24 !oo0
to a high of 35 /oo Table 1!, High growth rates occurred at experimentalsites with either high i.e., North Reef! or low i.e., Kahuku Effluent
Ditch! sa'linities even though there were significant differences in
salinities at the experimental sites Tables 2 and 4!. Species of
Gracilaria are known to tolerate salinity changes of 10-20 /oo with0
optima ranging from 24 to 39 joo and suffer no detrimental effects if0
the exposure interval is short Hoyle, 1975!.
Although nutrient concentrations varied greatly, the high, low,
and average values suggest that nutrients were not limiting to growth,
32

This is also supported by ANOVA of nutrient levels at the four experimental
sites which revealed no significant difference in PO< levels, The signi-
ficant differences for NO and NH levels occurred because of variances3
in the values of the higher levels and not the lower levels recorded
Tables 2 and 3!. Interestingly, the high growth rates recorded at
North Reef' occurred in water with the lowest average amount of nutrients
while high growth rates also occurred at Kahuku Effluent Ditch which had
the most nutrient-rich water Table 1!.
Water motion and water turbidity appeared to affect the growth
of Gracilaria the most at the experimental sites. The highest growth
rates occurred at experimental sites with intermediate to high water
motion and low turbidities. The lowest growth rates occurred at
experimental sites with the least amount of water motion and highest
turbidity Table 1!. ANOVA of water motion at the four experimental
sites revealed significant differences among all four sites ranging
from low water motion at He'eia Fishpond and Kahuku Purge Pond to
intermediate water motion at Kahuku Effluent Ditch and high water motion
at North Reef Tables 2 and 3!. Water motion is important to algae as
it increases diffusion of raw materials needed in photosynthesis and
other metabolic processes into the thallus, as wel l as increasing removal
of waste products out of the thallus. Enhancement of diffusion by water
motion appears to be the most important environmenta! factor influencing
growth of Gracilaria in this study. Increased water motion also lowered
turbidity and maintained clean bottoms at North Reef and Kahuku Effluent
Ditch.
33

From information obtained from a 12-16 month investigation on
leeward Hawaiian reefs, Hoyle 1976! has offered the following optimal
growth conditions for mariculture of Cracilaria "water
1-2 m deep; consolidated reef complex ar coral rubble substrata; low water
those of this study for North Reef Table 1!, the site of greatest growth.
Environmental conditions at Kahuku Effluent Ditch are also similar but
the nutrient levels are considerably higher. Environmental conditions
at He'eia Fishpond and Kahuku Purge Pond differ markedly in water motion,
bottom-type and some nutrients, and, as would be predicted by Hoyle's
observations, growth was law.
In another year long study of seasonal algal growth at Hauula Reef,
an environment similar to North Reef, Santelices 1977! found that the
increased during the winter and had nobiomass of G,
relationship with either temperature or salinity. Santelices also
1 «1 « .~if11 11 1 1
movement and negatively correlated to high intensity, although both
correlations were not significant P'P0.10!.
Other factors that might have affected growth rates of the two
species of Graci'laria were epiphytes, handling of the test thalli, grazing
by herbivores, breakage from normaI and storm waves, turbidity, and
sedimentati on on the thalli.
Epiphytes were a problem common to all experimental sites except
He'eia Fishpond. Growth of epiphytes, notably Centroceras clavalutum and
Ceramium sp., may have affected growth rates by adding to the increase
in weight of the test thalli. Alternatively, epiphytic growth may have
34
motion OF = 30-35!, 0.8-0.9 ug-at. N03-Nj'I; 0.5 ug-at. PQ4-P/1; 22-30 loo S;
24-28 Celsius." These environmental conditions are remarkably similar to

caused breakage of test thalli by increas~ng stress on branches which
were then broken by wave action or handling. Epiphytes would undoubtedly
present problems to commercial operations by increasing labor costs
due to maintenance of lines, nets and rocks or pots and cleaning of
harvested weed.
Hreakage of test thalli due to handling, grazing by herbivores,
normal or storm waves and epiphytes was common with many of the test
thalli recording a loss in weight eachweek Appendix D!. These losses
were not included in the statistical analysis as they would represent
"negative growth". It was impossible to determine if loss in weight was
due to grazing, waves or handling. On the other hand, increases in weight may
have been large enough to remain positive even after loss of' biomass due
to breakage. Deterioration of the health of test thalli due to poor
growing conditions resulting in breakage was observed only at He'eia
Fishpond and Kahuku Purge Pond.
Although both species of Gracilaria appeared to be somewhat delicate
wi th a number of test thai li breaking each week, in all but one comparison
of growth rates the attachment method did not appear to contribute to
lower growth rates Table 6!. The number of positive growth measurements
recorded also showed that breakage appeared to be random in occurrence
Table 7!. These analyzes as well as the observations of the field-work
participants! suggest that breakage of test thalli most probably occurred
due to handling in transportation, wei ghi ng and cleaning rather than due
to attachment methods. Santelices 1977! has also observed that G.
~ills 1 d
intense water movement. t:omrercial operations may solve some of these
problems by using tying materials wider than monofilament thereby spreading

attachment stresses over a larger area of the thallus and by setting up
containment barriers to catch broken pieces floating away. However,
use of larger-sized tying material would increase epiphytic populations
due to an increase in co! onizable surface area.
F-TESTs also indicated that in all but one comparison, the
variances in growth rates were also not affected by the attachment method
Table 6! . Commercial operators may thus expect fairly uni form ranges
in growth rates.
Sedimentation on the test thai'i was only a problem at He'eia
Fishpond and Kahuku Purge Pond, the experimental sites with the lowest
water motions and highest turbidi ties. Increased turbidity decreases
available sunlight thereby decreasing photosynthesis and growth. Suspended
materials in the turbid waters of He eia Fishpond and Kahuku Purge Pond
also settled on the test thalli sometimes completely coating them with
a clinging film. With low water motion this film remained on the test
thalli contributing to lower growth rates. Low water motion also contri-
buted to poor circulation with suspended materials accumulating on the
bottom, becoming thick anaerobic mud as observed at He'eia Fishpond and
Kahuku Purge Pond.
In summary, the two open systems investigated at North Reef and
Kahuku Effluent Ditch proved to be more environmentally suited to
growi ng Graci 1 aria than the two closed systems investigated at. He ' cia
Fishpond and Kahuku Purge Pond.
Based upon our experimental field growth data, growth rates of
4-8"/day or higher! in nature are not unrealistic. Hoyle �976! reports

that i f harvesters would leave 10$ of the biomass of a thallus attached
by its holdfast, a mean growth rate of 12'5/day would replenish a crop in
about 20 days. Even at these higher growth rates, however, there probably
is not enough growth to replenish the amounts collected by limu pickers on
unprotected reefs which have much larger standing crops of Graci laria than
North Reef. Limu pickers would also be harvesting more often than every
20 days. They would surely have completely harvested the availab1e Grace"laria
on North Reef in the three month period if it were unprotected.
Repeated and improper harvesting also removes seed stock preventing re-
growth, reproduction and recolonization. Interestingly, the collecting
pressure for the test thalli for the four experimental sites was observed
to substantially lower the biomass in the seed stock area of North Reef.
Collecting material for test thalli became increasingly difficult to
obtain as the study continued. On other reefs known to have once supported
large stands of Graci laria and which are currently being overharvested,
biomass is now much reduced. Currently, supplies of fresh ogo and manauea
in fishmarkets are lower than in previous years personal communications,
fishmarket owners!.
Economic Feasibilit
While this study was primarily concerned with the investigation
P i !y .~ I!.,~i1, !
information gained may assist in an assessment of the economic feasibil sty
of growing Gracilaria in Hawaii.
Hy comparison, mariculture of Eucheuma has proven to be marginally
profitable with growth rates of 1.5 to 5.5'X/day on farms in the Philippines
D . !9!!: ! ! ! li«! G. ~l
37

4-SK� il
entire year. Hoyle �976! has reported that G. grows
of North Reef. It thus appears that these two species of Graci laria are
biologically productive enough to support mariculture operati ons .
However, Eucheuma, which contains carrageenan, commands a higher
price from industry than Gracil aria, whi ch contains agar. In addition,
overhead costs especially labor'! in Hawaii are considerably higher than
those i n the Philippines. The state-of-the-art of r eef and pond mari culture
is presently labor intensive and the labor cost alone would probably
prove prohibitive to a successful large-scale farming operation designed
to supply industrial needs.
Another factor toconsider in Hawaii is that the prime natural
growing environments for Graci laria appear to be on reef flats and in
well-maintained fishponds. Competition for these areas is keen as they
are important to recreation, tourism and fishing and some areas are also
historically important. The cost and time involved in obtaining permits
for the use of specified areas of reef flats and fishponds tiiay also be
prohibitive to large-scale operations. Growing Gracilaria in tanks on
land would certainly require higher development costs than an reef flats
or in ponds. Perhaps Graci lari a mari culture may prove to be profitable
only for "backyard reef mariculturists" growing Graci lari a for human
consumption rather than industrial use and who can minimize overhead
and legal e.g., permit, zoning, shoreline management! costs.
38
7.5',!/day in laboratory conditions, 15.7'/day in 1800 1 tanks under field
conditions and may grow conceivab1y even faster '.n its natural habitat. Hoyle's
estimates are probably higher due to 'less breakage occurring in leeward reef
environments and tanks as contrasted to the rougher windward reef environment

In summary, it appears that it is biologically possible but not
economically feasible to operate a seaweed farm growing Gracilaria
in Hawaii. However, it may be feasible to grow Gracilaria as part of
polyculture operations or in backyard reef mariculture. In consideration
of both the present overharvesting of Gracilaria and the lack of enforced
conservation measures, these may well be the only reliable future sources
of ogo and limu manauea in Hawaii.
Recommendations
This investigation was conducted for only a three month period
during the summer months of June, July and August. To obtain more complete
informat'.on of causal environmental factors, growth rates and biomass,
a year long investigation should be undertaken. If seasonal changes in
nutrients, water motion, temperature or salinity produce changes in growth,
these changes cannot be determined from this study. However, projections
for corrmrcial operati ons may cautious ly use the information in this
report as representative of the maximum growth rates under field conditions.
Further investi gation of environments similar to North Reef and
Kahuku Effluent l3itch would yield results of growth in what appears to
be optimal growing envi ronments. Qn the other hand, sites similar to
We'eia Fishpond and Kahuku Purge Pond may prove to be adequate for
growth if different techniques are used. Research for a continuous
year should be continued at these and other sites using various techniques.
Finally, an economic and marketing analysis of mariculture of
Gracilaria, beyond the scope of this investigation, should be undertaken.
39

REFEREN "ES
Abbott, I. A. and E. H. Williamson. 1974. Limu: An ethnobotanica1 studyof some edible Hawaiian seaweeds. The Bu'lletin. Pacific TropicalBotanical Garden 4�!: 1-21.
Doty, M. S. 1971a. Measurement of water movement in reference to benthicalgal growth. Botanica Marina 14: 32-35.
197lb. Antecedent event inf'luence on benthic marine a1galstanding crops in Hawaii. Journal of Experimental Marine Biologyand Ecology 6: 161-166.
1973. Farming the red seaweed, Eucheuma, for carrageerans.Micronesica 9�!: 59-73.
Edwards, P. 1977. Seaweeds farms: An integral part of rural developmentin Aisa, with special reference to Thailand, in the InternationalConf nce R al D 1 t Techno
~n ech
Fortner, H. J. The limu eater: A cookbook of Hawaiian seaweeds, UNIHI-SEA GRANT-MR-79-01. Sea Grant Program, University of' Hawaii,Honol ul u. 108 pp.
Hawaii State!. 1978, Aquaculture development for Hawaii: Assessmentsand recommendations. Aquaculture Planning Program, Department ofPlanning and Economic tjevelopmenta Honolulu. 222 pp,
Hoyle, M. D. 1975. The literature pertinent to the red al gal genusGracilaria in Hawaii. Technical Report No. 3, Marine AgronomyProgram, University of Hawaii. 340 pp.
�. «» g i i ~llimu manauea Gracil aria coronogitoli a in Hawaii with special
~ « PhD. Di sse rtati on. Uni vers i ty o f Hawaii� . 418 pp.
Kelly, M. 1975. Loko I'a He'eia: He'eia f'ishpond. Department ofAnthropology, Bernice Pauahi Bishop Museum, Honolulu, Hawaii. 61 pp.
Madden, W. D. and C. L. Paulsen. 1977. The potential for mullet andmilkfish culture in Hawaiian fishponds. Department of Planning andEconomic Development, Honolu/u. 54 pp.
Madlener, J. C, 1977. The seavegeatable book. Cl arkson H. Potter, Inc.,Pub1ishers. New York. 288 pp.
Sante< ices, B. 1977. Water movement and seasonal algal growth in Hawaii.Marine Biology 43: 225-235.
Naylor, J, 1976. Production, trade and utilization of seaweeds and seaweedproducts. FAG Fisheries Technical Paper No. 159. 73 pp.

APPENOICES


APPENDIX A
LABORATORY AND FIELD EQUIPMENT AND SUPPLIES
43

LPBORA'O~Y,A'li'3 FIEI 2 i'",UIPME'lT ~f4& SUP-LIES
Equipment Used to Monitor Fnvironmental Factors
A, Temperature: maximum-minimum thermometers with attaching lines
tie them to bri ks or rocks.
8. Rater motion: clod cards which were taped to solid bricks with
masking tape,
C. Drift measuren3ent. a large cork pai nted i nternationa 1 orange for
easy sighting, a compass, a stopwatch and a iQO m plastic <ape meas u re .
Nutrients analysis: numbered polypropv!ene bottles, svringes,
filters, forceps, holders and holder wrench . A11 equipment exce pt
bottles and filters were kept in a jar of 10% HC1 acid in order to
prevent contamination of water samples. Filters were precombusted to
prevent decontami~at~on of water samples. A cooler with ice wa: use.i
to preserve water samples until placed in a Freezer,
E. Salinity: a portable temperature compensated American optical
refractometer.
II, Equipment Used in Growth Measuremerts
A, Field Equipment
1. Qhaus triple-beam balance.
2. Plywood box with plastic cover and pocket level.
3. Monofilament to tie test thalli to rocks, lines or nettinn or ",o
tie plastic labeling tags tz test thalli.
4 . Huckets to place test thai'li in while ri eaning� .
Inner tubes with plywood bottoms to float test thalli fr<~
experimental growth sites to we',q",i:.g station and '~ack to
perimental growth sites.

6. Clipboards with plastic writing slates and pencils attached
by lines.
III. Equipment Used for the Hiomass Col1ection
A. Field Equipment
Large plastic bags with numbered plastic tags inserted in them,
corresponding to the numbers written on the bags.
2. Four 45 cm stainless steel rings.
3 . Cli pboards wi th plastic writing slates and attached pencils� .
4. Inner tube floats consisting of an inner tube to which a plywood
board bottom was lashed in order to float the plastic bags with
biomass.
5. A large mesh bag and styrofoam cooler to carry all plastic bags
with biomass after the collection.
B. Laboratory Equipment
1. A Nettler balance from which weights of the algal biomass to the
nearest, tenth of a gram could be determined.
2. Pre-cut a1uminum foil with the tared weight recorded on the
pieces for use in holding the algal species as they were weighed,
dryed and reweighed.
3. Felt pens with waterproof ink.
4. Drying boxes to hold the biomass in as it was dryed in a seaweed
dryer.


APPENDIX B
Pa<acSite
North Reef, Coconut Island
He'eia Fishpond
Kahuku Purge Pond
Kahuku Effluent Ditch
50
66
80
94
47
ENVIRONMENTAL FACTORS AND GROWTH RATE INFORMATION

Tab', 9. »nperature Measuremer,ts at North Reef, Coconut island.
Temperature ', C!
JAmbient-'T 1'!e MaxizuniDate M0 iihmum
June
Ju1y
AugUst
indicates temperature at time of measurement.1/ ambient
2/ "TB" indicates broken thermometer.
3/ NR i fldi c ates not recorded
48
101'l
I7I8
23
2430
7 8151621222930
12IG
18
1926
no. Zm
08:2511:30I;:3009:00
09:00IQ:35
IQ '508:30
08:353NR+hRNR
08: 3508: 30IQ 30
08:3709:30
!NR
NRU8;4509:05
Start34 0
TB26. 529. 0
27.028.0
26.028.028 028. 026. 027. 0Z7 028. 027. G
28. 5
27 027. 528.0
29.028.0
fl 0
":e23.023.0
Z5. 0
24. 0
24 Q?5.026.026.025. 025. 0
25,025. 025. 0
25. 0
25. 0Zr, 5'6. 0
26. 024 0
3].Qp
TB � '26.526.0
26.026.0
26. 026,527. 0Z7.025. '-'
A
26. ~
Z6.026.0
27. 026. "..26.5
27. 027.026.0

CV a V O~ 92
QJCJ
C>
CI
C
I E
49

Table 10. Salinity Measurement at North Reef, Coconut Island.
'l imeOate
June
July
August
1/ 'NR" indicates temperature not recorded.
50
10
17232430
71521
2229
5121826
09:201l:3009:OQ
09:00I II: 35
08:30
NR~~08:3508:30
08:3809:3010:1509:05
35.035.035.034.535.0
35,035.035.035,0
34,0
34.034.035.0
35.0

C>
0e o
0IOVl
CO
Vl
«U cC
CFlP4
ICl
O
O 6!S-O

Date
60.4
48,1
44. 4
49.4
July
40.7
43.8
49.8
August
39.0
48.5
jl "DIF" indicates "diffusion index facto,."
52
Table 1 j.. Diffusion IndexCoconut Island.
10ll
2324
3001
0708
1516
2223
2930
0506
1213
18
19
2627
Factor of Mater Potion at North Reef.,

O O
0 O
CJ0
53
0>Ce oC V
Clll
Cl
>C
U C C O
C5

Table 12, Nutrient Content of Water at North Reef, Coconut Island.
NUTRIENT RESULTS-
June
71521
2229
0.38
0.340.310.500.02
0. 75
1. 40't.20
1.210.45
0.35
4.428,11
12,346.76
July
5121826
0.130.140.200,13
0,420.660.640.45
4.671.121.130,93
August
1/ in begat/1.
Date P04= N03
10 0,22 1.0515 0.30 0,3315 0.25 0.3015 0.28 0.2715 0.28 0.3023 0.31 1,1423 0.34 1,2030 0.77 0.5730 0.50 0.51
NH4+8,030.530.560.630.56
3,474.132.505.30

55

Table 13. Drift Measurements at North Reef, Coconut Island.
Distance-/Time DirectionDate
June
722
11: 0009:30
July 20.517.1
09:10August 14.9
1/ in meters/minute; average of three values.
2/ one measurement only.
56
10
2430
09:45
09:301'I: 05
16.02/16.514.2
210o SW210o SW200o SW
205o SW270o SW
270o SW

IIICJI
C4h4 O OA
4-<U<D
OC
0
4P
4-
Vl gl4J
eachW 4J Cp 4

M
m Clan
anaD
r
Cl
CQChar!
caaCla
a
an~ Faa 03
lnCl
I
aC4ICOCl
aD
ClaCI
a 'cP
a~ 4'I
a
O 4 4J5 ~
4C AIOVl C
58
4 CV~3O~LI
4OL
4P0 I
L 4p ~O.a
IOVX
H O4p~Ol X
L 4l
V ~g,e
IL C4PO Ia
O
~ I r Ir ~

Pl
CI
P!C4
ClOl
CI
0
0 Cl
CI
CI
ChCIOJ
CI
I0
CICV
00
ClIO
LA
P!
CIC7
CICII
CIIClC!
ChCl
CV
C4Cl
30 5
L 0 I NI
59
C
mj
4J ~
III M~ rMV
0O III4M
~I
L. C
8 0
0
Cl
III wt7 ~
sSIO 4J0 Ct4Vl 0
~ ~ ~
lJ mIII ~
Cl0 Wm 0

C Vl4 wt0
C3: aO V$0
60

P4CO
aCalC!
FaaCJICD
COC!
CalP!IA
CaCOall
CalCIClr
aA
41I4Cl
aClC!
LOCO
Cal
oCO
Cal
O
IClaACi
CalialCl
4l
1Cl,~
4W M
I0L4a
Ca4l I
4VA
C4l0 Ia-
0
Ol44 0 'Cl
4a 4aan In4 4Jl 4
Ol K
4l44 '0
61
Ol CV I
C
0~j e
I441 X
p aa-~ 00 anCLW
4P
~I
0 41 ~Id+JC
tJ Iam 0
~ . ~ . CC
anC
I I
I4 g
c0 0

~ ~
03
IOID
N m
CON
ImCh
ChCO
4JC
4J ~CII II'tQ ~EQ
Ia
62
ei o
ca! o
Cn N! a
r l O03
CIN! PJ
Nl pl
In/ O
o/ o
C CV~
Cl K% V O
om
gl ~CLw
0
SC7Ii% O
O 4J ~lO
IO V
C IOM 0

O
O
O
~ ~ ~ ~ ~ ' e ~ ~ ~ ~
O O
63

Table 18. Temperature measurement at He'eia Fishpond.
Temper ature C!
Minimum Ambi ent+l3a te Time Maximum
Ju1y
5 14:3012 13:20
August 19 11:3026 10:00
NR
NR26,024.5
26. 0NR
31.026.0
NR
29. 5
ambient indicates temperature at time of measurement.
2/ "NR" indicates not recorded.
3j "TL" indicates lost thermometer.
64
2
8 915162029
12:0012:0014:0014:0013:3513:35
NR
NR
Start30.029.530.0
TLTLTLTL
Start24. 022. 523. 0
TLTLTLTL
28. 022NR
28. 028.0
TLTL
27.0

CF1Vl
OQ.
U
C!L
h$tV 0R.2 4JI
CI 0u
E g mI I
'I QJ
O 4cu
4JE <V
V!
K ItjQJ
LII�

Table j9. Salinity Measurement at He'eia Fishpond.
TimeDate
July
1/ "NR" indicates salinity not recorded.
66
1
81520
29
512
August 1926
12:0002:0013:3511:5712:50
14:3213:2011:1510: 00
32.533.0
32. 033.0
24. 0
31. 035.0
32.0

OC O
OVl
67

DIF-"Date
0102 8.6
0809 CCL2/
Juiy12.6
20
21 14.4
2930
0506 CCL2/
August 1213 14.9
1920 CCL2/
26
27 12.8
1/ "DIF" indicates "diffusion index factor."
2/ "CCL" indicates that clod cards were lost.
68
Tab1e 20. Diffusion Index Factor of Water i'!otion at ke'eia Fishpond.

O O
5 O CJrd
X<D
O'P
4-
C3
C'O >C IaA 4J OD l7 H4 C EJ
LLCl
69

Table 21. Nutrient Content of Hater at He'eia Fishpond.
Nutrient Results- 1/
Date P04
July
5
August 1219
0.180.140.07
0.38 1.600.24 1.420.54 7.05
lj in begat/1.
70
1 0.388 0.34
15 0.3820 0.2929 0.09
N03 NH4+
0,48 2.221, 15 8.940.65 15.062.14 17.600.03 1.07

OJ
O6J
ZJ
0
I
C
71
Icv 4IO 4
a.0
Qn
0CL
'I
rl5
CU

0 0CL
'P
ttf
cQtt-0
cQ
CD
CD
V C GJOJ
rg
Col
C0 00-
3 30
0 W~
refn5
0rg
rg ttlCf! WQ Ch
e > CD] OIgCf
0 wj I�
4P MPV 4-
0
0 O V
O C
K rg
O I�5 rg
rDCh V-Ig 0
X
0
rlfS- K
rg
0
0
LI'I
O r
Iff~ w
~ w tt-0
O V

PJ'S
0 QJ
30
j0 C7l~
4!Dl
CJChQJ L2C ~
3 01 S-Q
<UCU
v! > r5Q
nsCl
Ch SIlP ~
r5 P
3 rO~5
OJ~4
O5-QJ ~
X
W .r
Q! s4
U
~ ~ O ~0
C4 CC
zVl
Q! reE <u
U U QJ3 o
pO4
C0 0

4-o
E O C!Q3
~ I ~ I ~
CO
74

O
a Q
QJ6
O
O
CDC!
C>
C0
4
CQ
O ~
Vi X
C
4
4J .rC r
~ r tgCJ N
4lO 4-
0
a N I r
~ ~r
Or
CJI r
4J M!
O
O ri>
I 4PS-Cl
~I
O'I
'I
Q
4
4Q
C4
0
~ I ~ ~ ~ I

COC3
CV
w .r~ e3 3
0L0
gjJl0 ~M
t5
C5 M
nf C~
0 ~j rOl ~
QJ K
0
0 thCLW
dJ
QJv!
~R
0 ~t5
CPM
COJ
C$ O5
!C
C0
C, P
cn 0
~ ~
C ~QJ ~
~ s tJ
C
O WO 0

~ ~ I I
D
a
W .r3 QP0-S- <U4 II! C R 5J a 0
77
OJCi
QJ ~ C530 5-
Ll M CL
OC0 4
C0
O
CP
fQ
0
O
0
Q]C4- r0 LI

Tabl e 26. Temperature Measurement at Kahuku Purge Pond.
Temperatur e C j
Minimum Ambi en' 1 /MaximumTimeDate
10:24 28.0 25.0
jl ambient indicates temperature at time of measurement.
j2 "NR" indicates not recorded. '
78
8 913l42027
33
August 1018
10: 5010: 5009: 50
NR08:3408:30
12:4316:1512:1515: 00
Start28. 032. 0
NR28.028.0
27. 5Nit
29. 029. 0
Start24. 023.0
NR23. 022. 5
24. 0NR
24. 024. 0
25.025.0
23.5
23.023.5
26.029.025.027.0

79

Table 27. Salinity measurement at Kahuku Purge Pond.
TimeGate
July
August
25.010:2424
80
813
2027
3
310
18
10:5009:5008:3408:35
13:0516:1512:15
14:30
25. 0
25.025.024.5
25.025.025.026.0

Q VlCJL
o I racr>
C!CV
e 00
tgI/l
81

OIF � ~Date
0809 8.2
13l4 23.9July
2021 28.1
2728
03
04
18. 6
CCL-"
August 10ll 20.1
1819 CCL2~
24ZS CCLZ'
lj "DIF" indicates "diffusion index factor."
Zj "CCL" indicate's that clod cards were lost.
82
Table 28. Diffusion Index Factor of Mater Motion at Kahuku Purge Pond,

O
O
CO
O
C4C>
CICtPJ
0~ acO
VI 12 4J
LL
Ch
CO
IllDl
O <LICh
CL
rG
S-
0 t5X QJO
O

Table 29. Nutrient Content of Water at Kahuku Purge Pond.
Nutrient Results�
Date P04 NO3 NH4+
July
1/ i nougat/1,
8 0.65 1.5513 0.79 4.7120 0,26 2.9827 0.55 5,66
3 1.14 8.32August 3 0.00 0.13
10' 0.22 0.1018 0.04 0.22
24.6509. 'l824. 4011. 80
05,3907,7709.1410. 70

85

CD
Ch
Pl
0
OJ g
~ yam O
E~~$0 I
xm
O
cjl 2
COfcn&4 O4J ~
XCDm
86
0
E'
hr
O 8
0 8CD}

I t I I
89.
00
C!
CbVC OS
P Pl CO
8oJ a
OJ
C
II5Ol X
vw0
a vQ. 44
0o I
5-<U
4! ~
YgClg
Vl 0

CV<J0
O 0hl Q
~ ~ I ~ ~ ~e ~ ~ I ~
OCL.
~ U
O 0
O~S- rOCg M
PJ

Item
August
10 18
i2.016.0 12.39.0
4.284.48 0.27 3.01
2. 614.07 0.26
0.85 0.97
89
gable 32. Growth of Gracilariaat Kahuku Purge Pond.
Number of positive growthmeasurements of thai ii n!
Average X growth per day x! of n thai 1 i
Standard deviation s!of n thalli
Coefficient of error c! of n thai li
on MonofHament Nets

Date
August
10
Number of positive growthmeasurements of tha11i n! 7.0 6.0 9.315.0
Average I growth per day x! of n thalli 5.7 5.842.539.3
Standard deviation s!of n thalli 5.7 9.9 1.26
Coefficient of error c! of n thalli 1.0 0.50
I' bl II. 9 " h 9 i1 "i ~if 1iat Kahuku Purge Pond.

Vl
C'
~ Q3
S4-Q CL
Q N
CQ M
CV
O'<M n5IQ Cl ~ C5
3e Os-
QJCi COO
91
O Ol CCI N Q ID N R R ~ CI
UE �
O
O
0
I
O CLO O O CJ

Table 34. Temperature Measurement at Kahuku Effluent Ditch.
'c!
Ambient+
Temperature
MinimumMaximumDate Time
Ju1y
3 12:43 27.5August 10 14 00 29 0
18 15:40 29.0
24. 025.023.0
26.027.027.0
24 11.34 29.0 25.0 28. 0
ambient indicates temperature at time of measurement.
Q2 "NR" indicates npt recprded.
8 913142027
NR-
NR09:50
NR09:4409:45
StartNR.
27. 5NR
27. 029.0
Start
NR24.0
NR24.026.0
NR � ~25.025-. 5
NR24. 526.0

93

Table 35. Salinity Measurement at Kahuku Effluent Ditch.
TimeDate
July
24.011:34
94
8
132027
3
August 1018
ll:0009:5009:4509:45
13:5714:0016;00
26.026.025.0
24.0
25.025.024.0

Q!
OPl C3
95
0 Q0ICI
CC3 'P
r
V!
S
CO I/l
QJ
'I
it/

DIF�Date
33.10809
13
14Ju1y
17.1
2728 25.0
0304 CCL2~
August 1011 26.9
18
19 CCL2~
2425 CCL2~
3 j "DIF" indicates "diffusion index factor."
2/ "CCL" indicates that clod cards were 1ost.
96
Table 36. Diffusion Index Factor of Hater Motion atKahuku Eff1uent Ditch.

0~ ~ X
QJ 02 'U H
4-cv
~ ~ 4C!
97

Table 37. Nutrient Content of Rater at Kahuku Effluent Ditch.
Nutrient Results 1/
Date
July
09.06
07. 5404. 4407.19
3
August 1018
1.650.330.95
1/ in begat/1.
98
813
2027
P04=-
].871.561.211.28
N03=
15.5909.3905.7016.30
NH4+
15.8111,2224,5C20.30

99

CI
0»IKv
C 0»»
T%IId
'0 C C0»»»Vl 0
g»I 0Ol KV
C0OI%% 0I~ j~II
0 C C C0 OOaa0,»»
C EP A»»0
W OWcJ 0
'D»O'00 O»I»I »I »ICl K@I
Wwlv v%l
»l5 Q 0F l o
L ~0»»0 0V Ol»I 00 C. N w58K
OJI0
04Ol I IIIII I
t»l m Clee IO IIO I0
IO I Cl
I0Q
hl Q
OIV! t ICe 0
0OVOI 0VISgO
»I g
QCI g
0
aorsVI4»kl 5»I 0 0»I C0 00 0iS0
C e»0
4e4» gRg CV
C0
CI~C7
0~ » 0»I~ I»I »»0VI4J8 4t7 kl
000OI0 IVi Ol
i
40Vl Vl 0
Vl Ih
RRw~g
4I C JX0~ I »I »I

Ih g
0I
af a
aCI
0R~
iR
C 0 lI'4 lip4 C C4J %Ml 0
4J
LCIC4PCCII@i 1
L 0D~C~
4
C 4 u c V COWV 0
4IC ay
Ill e I IIII
CIeI 0 0 le Ill01 M lil ~
CV g IOa
Ill Al a
4O V4III4O 4
44 4IIu aC
44 4 III~ t 4V 4J'A 44b
00 ~ IL 4I0

102

APPENDIX C
BIOMASS INFORMATION
103

CDCDCD
CD
C!
104
C3~ 8
4J
ClCD

EO ICd
C J
O
105

106

Table 40. Number of Ring Tosses June 10, 1978.
COGPERATIVE GRACILARIA PROJECT BIOMASS SAMPLING NC~ 1
DATE i l0-V I-7S
NUMBER QF RING TOSSES AT EACH SAMPLINC SITE
107

Tab1e 41. Hiomass l3ata June 10, 1978
S1TE: ~~1 gad
OATE; 1O-Vr-7aTGTAL 1!ET AND DRY AEIl~i TS i~Y SPECIE5 y]
108

Table 42. Number of Ring Tosses June 24, 1978
NUNBER QF RING TOSSES AT EACH SAMPLING SITE
CQOPERAT! VE GRACIUR IA PRO JECT
109
BICVXSS SAb;PLING NG~ 2
DATE i 24-V I-78

Table 43. Biomass Data June 24, 1978.
SITE:~~~1 and
DATE: 24- V I- 78TOTAL WET Al'ID DRY WEiGHTS UY SPECIES
110

Table 44. Number of Ring Tosses July 22, 1978.
NUMBER OF RING TOSSES AT EACH SANPLING SITZ
COOPERATIVE GRACILARIA PROJECT BIGKASS SAYiPLING iNQ > 3
DATE t 22-V t I-78

Table 45. Hiomass Oat;a July 22, 1978.
SIT E:~~ peg'
DnvE, 22-V !I-78TDTAL WET AND DRY WELGitTS PY SPEClES
112

Table 46. Number of Ring Tosses August 17, 1978.
COGPKRATTVE CRACILARIA PROJECT
NUMBER OP RISC TOSS
113
BIORLSS SAiliPLING "lUi 4
DATE r 3 9-VI I '-78

Table 47. Biomass Ha+a August 19, 1978.
TOTAL MET AAO ORY WEIGHTS BY SPECIES
314

APPENDIX D
WEEKLY GROWTH MEASUREMENTS
~Pa e
118
Si te
137
153
115
North Reef, Coconut Island
He'eia Fishpond
Kahuku Purge Pond
Kahuku Effluent Ditch

GRACILARIA GRG~'Th CATA Q, ~rsapastarl s Pots!
',growth;.',9 raw t' ,.growth'.grawtt NewNew
Oata I30-V I30-V I?3-V I-V
78.77I11, 70283,44.2930
02 -26.73 13.97
56. 7 60
43. 57. 3580.1 131.6
40.6 I LOST -5, 7149,960. 1
65.6 LOST 33.1 46.5 4. 97 36.2
-1. 93 35 920. 5
L ST
LOST 46. 536.1 53. 9 2.19
114. 1 199, 7 9.7 409. 6 10. 80 97,
20. 7 LOST 40.641.1 -5. 79?3.5
20.1 LOST
26.1 I 18.5 -5.57
27.5 14. >869.6
27. 3 36.7 4.31
14
8.696. 94
2.99 6.15
0.730.43C
gl 1978
116
COOPERATIVE GRACILARIA RROJECT
40.0 ' 33.6 -2,86
37. 3 LOST
12. 5 -8, 06
35.7 -2.3
29.4 LOST
17. 5 LOST
SITE~re R f Coconut Island

SITE I land
',.'g rowt ,'.growth,u g rowt;.groxti
!late JI 15-V I15-V [I7-V I I7-VI I
-2. 5664.078.77
79.536. 0513. 0 152. 6
32. 0 1.91-1. 95 27. 503 166.2 142. 0
51. 7L0576. 6995.6
147 ' 0 22.33 23.0-4. 829. 343.5
O50.549.9
-2.130 ' 436.2
35.9 59.0 6.4 39.5
54.6 76.1 4.2
4 4 9
9 85.7
7 9 7.5 4.49 57.0103.
289. 35,55
3 7 6. 1163.
35.7 1.741. I 44. -0. 02
71 6
49.36.7 77.0 9.7
34,3 7.461.0
13h
8.038.35
9.939.405
1.241.13
21 1978
117
COOP E RAT I VE G RAC I L RR I A P RO 8 E CT
GRACILAR!A GROWTH DATA G gpgzpzrp<>p/p Pope!
V!
cCI
0. 17
67.5 -2.02 17.0
54.5 0.96
43.5 4.58
59.0 5,14
54.0 -4.20
58. -2.57 39.0
48. -0.15

COOPERATIVE GRAC I LAR I A P ROJ E CT Island
GRACILARIA GAG'w'Tjl CATA G. tursapastoris Pots!
';gr owtl",.'grow tt"..c row t
Oa to 29-VI I29-V I I-V IT 21- V I I
.513 -.97360.2
-4.87 4.7616. 102
32.0 37.6 2.72 25.7 71.5 13.65
33 0 40. 6
11.46 31.0 14.39 48.790.9
-1.39 31.2
-15.82
25. 2
24.8 2.10
. 62843. 0
95,9 11. 10 46. 7
74 83
-1.3357.0 5Z.6 53 9
44,5 90 8
39.0 24. j, 7 71
69.6
28,330.9 1.45
4. 075.16X
5. 314.20
1. 300.8I
1978
CLLalCg
64. 9 65.1
17.0 12.6
23. 0 44. 1
54 40
43.5 40. 0
59.0 21.0
54.0 69.0
41.9 47.2
289. 5 279. 4
63. 8 108
4.17 40.9
2.00 41.3

SITE North Reef - Co on andCOOP ERAT I VE GRAC I L AR I A P ROJ E CT
GRACILARIA GROWTH OATA G. hrrsapastorf s Pots!
Jj 1978
119

R f Coconut IslandCOOP'ERAT IVE "RAC;L !RIA PROJECT SITE
GRAC!LARiA CRDWTI' DATA C ~rsapastprgs Pots!
:gr owth..gr owtf'.! grow C'�qrowttBP
Date 12-V I I 26-VII18-V I I 18-VIII 26-V I I I
95.3 -.986 125.5 4.27 109. 4
85.0 1, 8673.2 17.01
158.8 12.0
35.1 33,5 -.144
24.1 4.Z3 26.3
34.2 4 4 3 4
62.5 115.1 10.71 108.0 27 .9
107.1 103.5 1 .4 48 40 0
120.1 33. 3 19. 25
51.1 57.8 2.07
69,9 132.8 11.29 33.1
29.3 39.8 5.24 789 8 3
32.3 32.4 70 5
23.3 24.4 LOST
250. 1 65.8
33.2 23.2 -5.80 105.8 42.9 -10.67 61.8
28.2 7. 78
30.2 34.4 2.19 29.1 -2.07 107.2
12
5.035.34
2.453.98
.487. 713
gl 1978
120
A ! CI
224.1
P3 91.6
,772 10.7
-6.62 17.8

GRACILARIA GROAT~ .'ATA G. bursapastorgs jfnes!
121
COOPERATI VE GRACILARIA PROJECT
21 j978
SITE North ReefCoconut Island

SITE North ReefCOOPERATIVE GRAClLARIA PROJECT
Coconut Island
GRACIl ARIA GROWTH OATA 8 bgr~~p4sgor]~ l ines}
j] ' 1978
122

SITE, North Reef
GRAC l LARIA GROWTH "ATA g ggg ~ ~ //or[ $ ] peg !
COOPERATIVE GRACILARIA PROJECT
1978
l23
Coconut !sland

BOITE North ReefCOOPERATIVE GRACILARIA PROJECT
Cocanut Island
GRACILARIA GROWTR -"ATA G. bursapastorfs lines !
gl f978
1Z4

SITE North ReefCOOPERATIVE GRACILARI A PROJECT
gl 1978
125
Coconut Island
GRAC! LARI A GROW, I-I .'ATA G. bvrsapastor$s 1 Ines!

5 ITECOOPERATIVE GRACILARIA I'ROJECT
GRACILARIA GROwTH DATA G coro~Dpi fo] $4 potp!
",.qrowtINEW l',grow t.«arowtNEW
Date� I
37.6 40.1 0.921 9433. 5
0 1.31
32. 3 -2.48
24.7 7.9615.6 LOST
21. 5
14. 7
33.4 LOST Z6.9 34.0 3.45
21.9 c.4019,0 LOST
ST
34 7
73. 9:.3660. 6 IZ5.3 7 83
18.9 LOST 24.7 0 T
49. 4
62.6
11.012.0
5. 942. 52
2. 97
0. 500.78
JI 1978
126
C!
?'.
02 183, 5
03 142.2
102.9 -9.19
143 0.94
24.0 '.85
16.1 1. 53
43. 7 -2. 02
75.2 3,10
193, 7 9,45
58. 7 -11. 94
34. 5 5. 32
26.1 7,14
6. 8 -23. 3
58. 5 -3. 5

GRAC!LARIA GROWTH OAYA G tp~�pp! fpf$g pptg!
COOPERAYI'!E GRACILARIA PROJECT
Jl 1978
S ITE

GRACILARIIA GRO<H 'ATA G. caroriop<to I fa I'pots!
COOPERATIVE GRACILARIA PRO<'ECT
JI 1978
128
SITE ~Is 1 a nd

SITE North Reef coconut IslandCOOPERATIVE GRAC!LARIA PROJECT
GRACILARIA GRO'4TH OATA G, coronopffol fa Pots!
»9rowt NEfl»9rowt NE'!l
IA-V II I
1.47 67.4
3.73 139.2
'..52 5&.7
-6. 78 108. 9
,672 42.8
.454 53.1
Oate I 12-VII!
46. 4
235. 5
27.7
50. 6
33. 2
29.6
30.4
105. 5
50.2
99.6
24. 7
19. 5
36. 7
160 5
72.9
57. 7
37.2
30.1
47. 4
jl 1978
IQ-VI I
45. 2
?93,4
92.0
53.1
32. 4
32.4
122. 2
103.5
21.0
20. 3
36. 8
67. 8
78.6
30. I
28.4
72 5
t 3
-.436
22. 15
-2. 71
,532
i.'. 48
-:.'. 32
.642
-2.67
-1. 20
5. 29
3 49
-. 964
12. 0
3. 99
1.53
53.5
39.8
129
»gl OW't
26- VI I I
7.9
50,8
164.8
96.3
57. 9
LOST
37,6
' LOST
119. 8
22. 7
124,0
59. 7
58.4
88 0
37. 2
36. 2
-27.91
2. 13
.572
1. 09
-4.79
-.320
2.28
4.25
1.20
4 68
3 31
2.68
3. IO
12;0
2.39
1. 27
.531
6-V I I!
4 1
37.?
104. 7
101. 2
;.gr owth

GRACILARIA GRGATH GATA G. coronopifo1fa �$nes!
COOPERATIVE GRACIl.ARIA PROJECT
gl 1978
130
SITE North ReefCoconut EsIand

5ETE North Reef
GRACIL~RLA GRG'~T:.I "./ET@ G. coronopffolfa lfnes!
CWPERATIVE ERACiLARIA PROJECT
131
Coconut Es1and

COOP E RAT I 'i E GRAC I EAR I A P RC J E CT SITE North ReefCoconut Is av
GRACILARIA GROl~'TH DATA G. coronaplfolfa I <nes}
9 l978
132

COOPERAT I VE GRAC I LAR I A PROD'E CT
GRACI LARIA GROw'TH 0ATA Q. coronop1fol ha � Ines!
",',gr awti ".grcwt."~rowtt
CL Datel/ 29-VII I 5-VII 5-VI I 12-VI I 2-VIII
32.2 9.37
-.48311,6
03 12.5e I l9,0 10.1 -8;14 10.114.9 lost5.9e 8.5
17,9e 28.8 4,7830. 5
18.2 25,3 33,04.82 22.0 5.96
13. 9e 3.04
25.0 29.7 17,4 -7.04
lost -1.209.9
6.9 6. 30 10. 524.5 13.9 8.7
8.0 5.0n =
6.23 6.73
4.14 3.145
0.67
gl 1978
133
IQ
04
23.1 23,6
02 17,1e 15.4
,306 17,2
48 12.0
6.16 'l8.3
'4.15 10,8
7.03 22.0
8.62 9.0
2.49 29,0
North Reef
Coconut Island

COOPERATIVE GRACiLAR! ' PRO'EC, SITE
GRACILARL A GRQWTiI QATA 6, comnophfolha � 1nes!
21 1978
134

SITE
GRACILARIA GRQWTt-I CATA G. bursapastorfs
,.growtt New,',growth.vgrowtt
Oate15-VII8-VII 15-VI I
-6. 7617.8 16,0
16.9I -0.817.002 14. 1
9.2 LOST 6.7 . 6576.403
11. 1 LOST 8.4 16.6 10. 22
-6. 8717.0 18.6 1.3 11.3
ZO. 2 LOST 9 3
10. 2 LOST 12.5 8.4
LOST10. 5 8.8 5.3
15,3 LOST 9.0 14.2 6.73
13.9 -0.114.0 20. 4C' ~
7.6 -10.917.0 5.913.1 LOST 6.3 LOST
11.5 LOST 9.3 -5.636.2
9.8 13. 5 4.7
22. 8 1.9
5.9 -11.15
20. 0 16. 0LOST
LOST2.0 1. 311.0
-6.4511,6L.618.516,6
17.4 15.2 - l.9 13. Z
7.810.0 LOST 9.3
:l. 9 4.46
1.42 3.74
0.75 0.84
f1 1978
135
COOPERATIVE GRACILARIA PROJECT
"'Orowtt Net
8-VI I
-5, 52
-6. 99

COOP E RAT I Yf GRAC I I.ARI A PROJECT
GRACILARiA GRC'"TH GATA g ~p~pggt;gy jg
gl 1978
136

SITECOOPERATIVE GRAC ILARI A PROJECT
GRACILARIA GRCMTTT OATA G. bursapastori s
19-V I I I "�,g row t Hew 9m» tb'growt .,growth
Oate1 5 VIII IZ-V I I I12-V! II 19-VI! I 19-VI II
17 4
9.1
16. 7 2.3414.2
! '1911.69.9
14,6 -2,035. 2620.9 18. 1
5.0 17'7 11. 2
18. 7 22.3 2 87
".2812 o 10. 9 -3. 61
17.7 6,23-!>. 7116.9
26. 5 t 59
31.3 Z. 46
14.4 ,3143 Tl.h 12. 7 -1. 78
19.1 24.1 ='. 38 21.1 . 188
18.5 1.7416. 4
18,114,3 13.3,42
26.0 1. 21 25.9 -,55023,9
20.1 .50819. 4 13.6 -5.43
0812.4 TB.S
20. 9 21.6 . 47
3.39 6.23x
3. 88 0. 00S
'I. I5 0. 00
jl 1978
137
02 15,4
03 15. 1
20,7
26.4
18.5 2.65
13.0 -2.12
87
-4, 97
10. 0 -7. 06
9.9 -2.24
1' 1. 9 14. 28
21.7 - .704
23.3 -1.82
25.2 -3.0S
17.6 - .710
7. 8 -7. 34
13.7 -4.20
13,9 -6.10

CQOPf RAT IVf GRACILPRIA r'iQ~f Ci
GRAC ILARI A GROW'T:-I GRATA G. bursapastorf s
21 1978

GRACILARIA GROWTH CATA G. coronopIfolIa
COOPERATIVE Gvac,'I Anl PRCJECT
1978
139
SITE Heefa 41

CQGPERAT1VE ~RAClLARIA PROJECT SITE Heeia ¹I
GRACI LARIAT "oRQNTII L'A 3 r ~~yqop! f01 f y
1978

SITE Heeia f2
Fish net si te
GRACILARIA GRDWTjl DATA G. coronop ifoli a
jl ow, I',~" row t,,growtl
12-VI I I 19-V I I I 19-V>I
-2.46 13.3 12. 1 -1, 34
13.2 -1.24
-2.21 14.7 9.7
.422 13.1 lost 19.2
13.7 19,28.2
28 8 28.3
1.77 31.6
7.14. 13 6.0
~ 4. 89 12.0 10.6
2.36
14.2.585 12.8 S.D
.817 20.024. 4
7.212.0
13. 3 - 5.66~ 3. 25
2.06.0
3,9851.9
1.3 3.06
0.7750.69
ji 1978
141
COOPERRT I VE GREC iLnRN PROJECT
- .769 26,0
-6.46 13.5
2.21 18.9
2,05 9.5
-4.00 11.9
2.61 15,3
29.5 I.B2
13.3 - ,213
28.7 6.15
6.8 -4.66
8.4 ,-7.68
16.4 1-5.95
-7. 07
- .250
-16.67
- 4.77
- 2.17
-12,57
- 1.49
,B6
- 3.41

COOP E RAT I 't:. u RAC I LA rt I A P 9 O J E C T
GRACILARIA GRO'2TH CATA G g!~p!!ppffpI
1978
142

g rowtI NE'A'.,',growth HEM s', grow t.' ,.'growthIH ITIA
Oate 20-V I I 20-VI13-V I I8-VI I
-4.6423. I 14.5 -8.89
6,17 20.202
5.0.80703
-8. 50 5.5 -9.54
-3.40 13.5 3.52
-6. 75 25. 9
-1,94 -5.319.928.2 26.5 -1,23 32.0 2,73 5,4
-3. 46 -5.339.2 7.6-5.97 -2,2511. 6
10. 3 LOST
-9. 71 7.8
16.5 10.9 -7.96 18. 222.2 9, 7 15.26 10.0 . 436
-4. 69 LOST
-3.03 -1. 12
-3.46 12.6 l. 31
-3.079.0 7.7 -3. 975.8
3. 394. 86
2. 302. 70
O. 68Q. 56
gl 1978
143
COOP'ERATI VE GRACILARIA PROJEC.
GRACILARIA GRGWTH DATA G grgepggtprgg
25.8 34.8
5.7 8.4
l7 3 11.1
13.0 10.6
9.5 6.7
16. 0 14. 5
16.1 13.5
18.5 13,6
11.3 LOST
18.0 10.8
10. 3 8,1
7.7 6. 6
9,7 11,5
21 I 28 7
SITE Kahuku: Pur e Pond Itl
-7.48
-7.14

SITE Kabuki: Pu e Porl4 k'1COOPERATIVE GRACILARIA PROJECT
G. tursapastorksuiViCi LARIAT GROWTH DATA
D«~ 1 0-VI I 27-VI I
-8.5610.8
-11.37
36. 2
7.6
10. 4
15. 7
7.7
7 7
9.1
16. 8 -10.60
15. 9
gl 1973
02
03
13
20. 2
5.0
5.5
13.5
25.9
5.4
11.6
7.8
10.0
LOST
6,1
12.6
5.8
36,7
5
7.0
,<Ir Oi;t.j
4. 92
.258
90
-3. 71
4.58
4.42
5 5
-1. 34
.901
4. Bl
4. 37
0. 91
27-VI I
27.7
17,2
27.3
24,3
12,0
16. 7
18.7
6.1
14. 6
15.4
61. 1
18. 2
144
»OVQlvti
3-V I I I
LOST
11. 7
13. 5
LOST
19. 9
LOST
I4,9
LOST
20.4
LOST
8.9
5.9
LOST
LOST
6.0
70.7
20.5
.I 1'u'.v 'i. I
-17. 70
-8. 19
-6.75
2.90
-10.06
-. 475
-15.34
-13. 68
2.
1.72
3. 54
3,58
1. 01

COOPERATIYE GRACILARfA PROSPECT SITE
llew " rowtn'jew,".grow l '9 rowtt.,grow tI
Oate 1 18-V11I10-V I I 18-V I I0-
0,0116.516.2 23.3 5.33
lost5.702
12.103 6 1 12.0 -1.4311.22 3.5
15.7 26.4
15. 9 28.5
7.71 0,0216. 3
15.88.70 18. 5 0. 20
12.0 23.2
12.8 14.9
7.1 -0.1016. 7
-0. 5218. 9 12. 3 8.62 2
E IQ5-
25.0 45.6
13.5 1G.5
16.
7.3 11.4 O. 574. 60
19.3 34.3
40.0 lost
13.3 14.9
7.2 13.8
8.6 17.8
-0. 67 29.18.56 32.5
-0.9710. 6 4,7 3.9
0.16 8.5
0.97 9.1 16.44.4
1.10 9.6 -0.74 9.2
10.8 l7.6
10.4 15.3
14. 90. 73 20. 5 0.41
0.57 9.7 4.6 23. 7-0.89
11.5 14,9 15.3-1.025.4 O. 03
11.3 lost 11.8 0.54
16.2 27.7 O.GO 14.4 -O.OG f2.6
C!
Ch
7.8 9.1 0.22 -0,23
16
0. 274. 48
O. 264.07
0.970.85
1978
145
GRACILARIA GRC'2TH OATA G- bursapastor1 s

gr owtt"9rowtt ;.' grow t t New �,gr ow
Date I 24-VII18-VIII 18-VIII 24-V I I I
12.6 -4. 3916. 5
28. 5 37.9 4.8702
4. 3 3.49
16. 6
7.1 L OST
8.6 12.6 6.5712.3
16. 220.1
11.4
32.5 29. 1C' ~
4.4 16.4 24.5 6.92
9.6 9.2 9.8 1.06
20.5
4.6 23,7
15.3
18. 0
13. 5 12.6
12. 0
4.28X
2,61S
. 610
jI 1978
146
COOPERATIVE GRAC!LARI ' PROJECT
GRACIL»R-'A GRD'ATl! DATA G. bursapastori s
Ill
C
rd
SITE~~ e Pond 42
7.3 12.80
20.0 1.31
24.2 6.92
9.6 i -2.82
31.4 1.28
3.0 -4.28
9.9 2.57
20.0 -.411
38.4 8.38
21.2 5.59
9.8 -9.64

COOPERATI VE GRACIEARIA PROJECT
GRACILARLA GROWT';I CATA g. u>ronopifol fa
9 row tI.,', rowtI ".growth
Oate � 8-VII120-YII13-Y!I 13-VII ZO-VII
13.8 -15.136.3 . 43.502
03 -,88-4 06
.09
-8 77
36. 0
17.6
28.128.08.1 17.1 -6.80
8.1 5.0 -9.2 3.2 -6.1
14.7 LOST7.8 LOST
13.6 13. 7 15.1 1.40
10.3 -22,51 8.7 -2.318.117.8 .33 5.8 -15.
6 9.016.9 -5.90 16.3 -.5122.9
-1.44IO.
1.9
10. 58 0. 72
0.381.33
JI 1978
C!
H
41.6 2. 93
28.5 10.12
11. 7 -4.46
6.8 -Z. 7
SITE Kahvku Pur e Pond
5,4 -7. 04
8 -6 27
20,6 -9.55
12. 3 -11. 31
4 6 -6.01
3. 7 -13. 96

COOPERRTI VE GRACILARIA PROJECT
GRACILARI A GRO'w'T9 .GRATA G, gprr!happ I fp I Iz
1/ 1978
148

SITE
GRACILARIA GRG4iTx CA A G. ooronopffo1fa
�growti , gr uw tel,. 9row t, ';9r owtNew
Cate1 3-VI! I 10-VIII 10-V I! I 18-VII! 18-VII
30. 5 -1. 46-. 16534,334. 7
48. 71ost-'1 .0346.550.002
57.813.09.0 2.9003
-. 28217.526.621 .3
-3. 32'12.916.916.4
18.86.16 18.223.715.6
3. 3019.2'15.3
23. 0'1.7224.021.3
15,9049.515.2 I. 33
12. 9 15.6 -4. 94
lost28.3 28.2 30.8
11.7 3.189 4 22.2 27.49 27. 0
25.5 42. 4 7.53 20. 3 -8.80LLJ
16. 2 15.6 . 538 -1. 7913.5
-1.6812.714.3 8.8 -4.48
'18. 55 1ost6.2
28. 9 36.3 3.31 4.72
13.5 44.2 ", 8.46
35.0 35 8
5.7 9.3
5.7 9.9
C = 1.0
1/ 1978
149
COOPERATIVE GRACILARI' PROJECT
ID
~ C
5,39 46.0
3. 23 17. 9
-6.62 24.4
- ,531

COOPERATE'iE GtRACILARtA PROJECT
GRACtLARtA G HG'~TH GA A Q pppppppffpffp
gl l978

COOPERATiVE GRACILAR'A PROJEC SiTE Kahuku Ditch
GRACLLARIA GRGWTH DATA G. bursapas tor1s

COGPERAT I'lE GRACILARIA PROJECT Kahuku Dftch
GRACILARIA GROHH DA A G. bur:apastorls


COOPEPATI YE GRACII ARIA PROJEC
GIMCI I ARIA GRGl~'Ti .ATA G. bunapastoris
gl 1978
1S4

GRACILARIA GROWTH OATA G. coronopkfol la
COOPERATIVE GRACILARIA PROJECT
gl 197S
155
SITE Kahuku Oftch

COOPE RAT I YE GRACI LARI A 8 RQvE CT
GRACILARIA GROWTH OATA G gprpppp1fp11g
JI 197G

CGOPERAT! VE GRACILARIA PROJECT SITE
".qrpwt! "growt growthDate 1 3-VIII 18-VII!10-V! I! 0-VIII
18. 77.0 LOST02
30. 6 2. 71
25.9 26.2 . 164
30.3 -4.62
32. 1 3.33
27 0 -1.23
24.7
42.2 29.8
4,6 -8.99
25,2 -2.32
11.6 12.5 . 93829. 7 31.5 2.82
7.3 11. 0 6.03 10. 1 -1. 06
34. 9 -2. 91
9.8 -2.38
7. 5 -11. 54
35. 7 5. 16
42.9 53. 5 5.49
13.1 -2.4011.6 15. 9
17.7 2.8625.1 8.6 -16.30
ZZ.S 30.6 4.29
15.7 1.86
23.5 36.1 5,51
15,1 -.485
33.8 2.7328.0 45,1 3.67
2 5 -3.22 21. 7 LOST 18.0
1. 7833.4 37.8 36.7 -. 36
44,6 41.3 -1.09
17.1 -2.2148.6 2. 06
20,0 12.6
9.0 9;0
- 3,02 2.06
1.98 3.27S
1.59.656
JI ' 1978
157
GRAC! LAR IA GROWTH DATA G oorppopf fp11a

GRACILARIA GROWTH DATA G. caranopffol fa
COOPERATIYE GRACILARIA PROJECT
I j 1978
158
SITE


![D` VVI@ VI MI[/VI@ O,I.W OMM I · 2019. 5. 21. · d` vvi@ vi mi[/vi@ o,i.w omm i # uji nt i #b n_i 'h ogow 0i f*7r ogow 0i # iq k@ a xw@ ] tpmi # iq viow^v # xw@ fi2wmi -rm \ionvii](https://static.fdocuments.in/doc/165x107/6118540de02b0538cd2db6eb/d-vvi-vi-mivi-oiw-omm-i-2019-5-21-d-vvi-vi-mivi-oiw-omm-i-uji.jpg)