IV A- WORLD TRADE SCENARIOS - Welcome to APEDAapeda.in/agriexchange/Market...
45
1 INTRODUCTION Agriculture, including crop and animal husbandry, fisheries, forestry and agro processing constitutes the very basis of socio economic lives of India. It is one of the world’s largest agrarian economies, as the agriculture sector contributed about 18% of the country’s GDP (during 2006-07), 10.7% of the total export in 2006-07 and also provides employment to around 58% of the total work force. Agriculture also plays a critical role as it is essential to meet not only the food and nutritional security to the people and provide livelihood and income in the rural areas, but also to meet the requirement of raw material / inputs for the agro based industries in the domestic front. The total geographic area of the country is 328.7 m ha. extended over a large range of vertical and horizontal coordinates makes it to witness a wide variability in climatic conditions and varied range of soil characteristics. The diversified climatic and soil characteristics have helped the country in producing various types of fruits and vegetables, spices and other agricultural crops based on their suitability to the specific environment. This also gives the country opportunities to produce a wide range of varieties of a particular crop with specific characteristics and taste. India is the second largest producer of fruits and vegetables. Maximum production of ginger, turmeric and sesame takes place in India. India is also second largest producer of cotton in the world. However, India is still lagging behind in the productivity of many crops compared to the global scenario. A lot of effort is required for increasing the productivity, developing allied activities and building appropriate infrastructure in rural areas to be self-reliant in food and agricultural products as well as to generate surplus to facilitate more returns through export. Government is giving lot of emphasis on agriculture sector for increasing the production and productivity of agriculture commodities for achieving an impressive growth in the agriculture front in the GDP. A number of new initiatives like Technology Mission for Integrated Development of Horticulture in the North Eastern States (TMNE), National Horticulture Mission (NHM), National Food Security Mission (NFSM), Macro management in Agriculture (MMA), Rashtriya Krishi Vikash Yojana (RKVY), National Project on Organic Farming (NPOF), National Project on Management of Soil Health and Fertility (NPMSHF) etc. indicate the intensive approach in this direction. The success of these programmes will definitely lead to significant rise in agriculture production at the end of XI plan. The surplus production after meeting the domestic requirement will help to promote export and will have a great impact on Indian economy. In a World Bank report submitted to the Agriculture Ministry, it has been highlighted that despite leading producer of fruits & vegetables in the world, India’s export is poor due to high delivery costs, fragmented supply chain and poor logistics with poor quality standards. India’s share in global export of vegetables remained at 1.7% and that of fruits at 0.5%. The inability to compete abroad presently may lead to the inability to compete at home in future as the
Transcript of IV A- WORLD TRADE SCENARIOS - Welcome to APEDAapeda.in/agriexchange/Market...
1
INTRODUCTION
Agriculture, including crop and animal husbandry, fisheries, forestry and agro processing constitutes the very basis of socio economic lives of India. It is one of the world’s largest agrarian economies, as the agriculture sector contributed about 18% of the country’s GDP (during 2006-07), 10.7% of the total export in 2006-07 and also provides employment to around 58% of the total work force. Agriculture also plays a critical role as it is essential to meet not only the food and nutritional security to the people and provide livelihood and income in the rural areas, but also to meet the requirement of raw material / inputs for the agro based industries in the domestic front.
The total geographic area of the country is 328.7 m ha. extended over a large range of vertical and horizontal coordinates makes it to witness a wide variability in climatic conditions and varied range of soil characteristics. The diversified climatic and soil characteristics have helped the country in producing various types of fruits and vegetables, spices and other agricultural crops based on their suitability to the specific environment. This also gives the country opportunities to produce a wide range of varieties of a particular crop with specific characteristics and taste. India is the second largest producer of fruits and vegetables. Maximum production of ginger, turmeric and sesame takes place in India. India is also second largest producer of cotton in the world. However, India is still lagging behind in the productivity of many crops compared to the global scenario. A lot of effort is required for increasing the productivity, developing allied activities and building appropriate infrastructure in rural areas to be self-reliant in food and agricultural products as well as to generate surplus to facilitate more returns through export.
Government is giving lot of emphasis on agriculture sector for increasing the production and productivity of agriculture commodities for achieving an impressive growth in the agriculture front in the GDP. A number of new initiatives like Technology Mission for Integrated Development of Horticulture in the North Eastern States (TMNE), National Horticulture Mission (NHM), National Food Security Mission (NFSM), Macro management in Agriculture (MMA), Rashtriya Krishi Vikash Yojana (RKVY), National Project on Organic Farming (NPOF), National Project on Management of Soil Health and Fertility (NPMSHF) etc. indicate the intensive approach in this direction. The success of these programmes will definitely lead to significant rise in agriculture production at the end of XI plan. The surplus production after meeting the domestic requirement will help to promote export and will have a great impact on Indian economy.
In a World Bank report submitted to the Agriculture Ministry, it has been highlighted that despite leading producer of fruits & vegetables in the world, India’s export is poor due to high delivery costs, fragmented supply chain and poor logistics with poor quality standards. India’s share in global export of vegetables remained at 1.7% and that of fruits at 0.5%. The inability to compete abroad presently may lead to the inability to compete at home in future as the

2
multinational companies will be dominating the domestic market availing quality products at competitive prices from other countries.
Country is also lacking in appropriate technology & infrastructure in many aspects of modern storage and shipping methods, post harvest handling, value addition etc. The situation is further restricted due to complicated export regulations and procedures. An exporter faces enormous difficulties to equip himself on various parameters of export like regulatory, quality standards, global export opportunities, tariffs on exports, production scenario & availability, present export trend etc. for developing gainful strategic approach in a competitive mode.
In view of above, Government of India, Ministry of Agriculture (Trade Division), sanctioned a project to NAFED entitled “Market Intelligence study of selected crops having export potential” at a total cost of 82.0 lakhs. The crops for the present study have been identified on the basis of trade volumes and importance of the commodity in relation to production. The selected crops are mango, grapes, pomegranates, litchi, pineapple, banana and aonla among fruits; tomato, green chillies, okra and onion among vegetables; ginger and turmeric among spices; and sesame, soyameal and cotton among commercial crops/products.
At present, India's export volumes of fruits and vegetables in general and other selected crops are 74, 69,086 tons (2006-07). The value of these exports in US dollar terms comes to 2.85 billion compared to 113.94 billion US dollars of world exports. This constitutes only 2.5% of world export value, whereas India's production is 10.9% of total world production for these specific crops.
The emphasis in this study has been given on the compilation of information on quality standards, permissible residue limits for various pesticides and fungicides in crops being studied, information on packing requirements, present exports trends, competing countries, opportunities existing for exports, present strengths, availability of infrastructure etc. This information at one place will help in promoting export in the countries / markets of GCC, EU, ASEAN, Australia, etc.
The ultimate objective is to establish a National database which can pool information from promotional agencies associated with export and import activities in selected countries/ markets for the access of different user agencies. A URL namely marketagri.com has been created which is providing relevant information to the producer and exporter so as to design the production programme in an appropriate manner.
3
Looking into the large set of information/content generated and to place it in a presentable form for the easy access of the user agencies, the report of the study “Market Intelligence study of selected crops having export potential” has been split in to four volumes namely Vol. I- Main report; Vol. II- Domestic Market Research; Vol. III – International Market Research- Opportunities, Analysis, etc. and Vol. IV – International Market Research – Trade Scenario and Specifications. The details of information presented in Volume IV are given below:
For undertaking export of any product/commodity, the exporter has to apprise himself about world trends in trade, tariff duties of importing countries and a number of other export related issues like consumer preferences, legislative and non-legislative requirements of importing countries. These requirements are quite exhaustive and include quality standards, maximum residue levels, hygiene of food, etc., among legislative requirements and good agricultural practices (GAP), traceability, social and environmental aspects among non-legislative requirements.
The information on above mentioned aspects pertaining to importing countries is not easily available and thus international consultants were engaged in studying the foreign markets. The data and information thus collected and additional information downloaded from concerned websites, has been compiled in volume IV of International Market Research – Trade Scenario and Specifications. The information thus generated has been further split into five sections for easy access of user agencies. The details of different sections of volume IV are given below:
Volume IV A – Covering World Trade Scenario of fruits, vegetables, ginger, turmeric, sesame
seeds, soyameal and cotton.
Volume IV B – Containing information on tariff duties in importing countries comprising CIS
countries, GCC, ASEAN, Australia, South Korea, China, Japan and USA.
Volume IV C (i) – Non tariff protocols of EU, ASEAN and Australia.
Volume IV C (ii) - Non tariff protocols of USA for fresh fruits and vegetables.
Volume IV C (iii) - Non tariff protocols of USA for miscellaneous and processed products.

4
WORLD TRADE SCENARIOS
1. FRUITS AND NUTS
Total import of all fruits in the world market recorded at US$ 60.1 billion in 2006. The
world’s top ten importers and their import share are USA (12.2%), Germany (11.4%), UK
(7.8%), France (6%), Netherlands (5.8%), Belgium (5.4%), Russian Fed (4.9%), Canada (4.3%),
Italy (4%), and Japan (3.7%).
The world import market value for all kinds of fruit increased by 13% annually between
2002 and 2006. However, the annual growth in value between 2005 and 2006 recorded at 9%.
India imported 1.37% of total world import in 2006 (Table II).
The world producers and suppliers exported US$ 52.4 billion worth of all types of fruits
to the various markets. Major suppliers of fruits to the world markets are USA (13%), Spain
(11%), Italy (5.6%), Belgium (5.5%), Netherlands (5.2%), Turkey (4.3%), Chile (4.3%), France
(3.5%), Mexico (3%) and Iran (2.9%) (Table III). The world markets for Bananas, Pineapples,
mangoes and grapes are presented in tables IV to XI).
Table II: All types of fruits imported in 2006
Trade Indicators
Importers Value
imported in 2006, in USD
thousand
Trade balance in
2006 in USD thousand
Annual growth in
value between
2002-2006, %
Annual growth in
value between
2005-2006, %
Share in world
imports, %
World 60129410 -7734524 13 9 100
USA 7307133 -467730 10 9 12.15
Germany 6836458 -5497948 11 8 11.37
UK 4680704 -4432950 13 8 7.78
France 3612608 -1765377 11 0 6.01
Netherlands 3469788 -763139 20 17 5.77
Belgium 3262837 -399670 14 7 5.43
Russian Fed. 2968667 -2864683 38 39 4.94
Canada 2576836 -2145287 13 11 4.29
Italy 2387468 556501 13 0 3.97
Japan 2223233 -2154611 3 -3 3.7
Spain 1638178 4171180 17 1 2.72
Hong Kong 1058839 -707153 0 11 1.76
Poland 931727 -307900 18 9 1.55
Sweden 866151 -750015 13 9 1.44
India 824240 54211 23 4 1.37
Switzerland 804885 -795077 10 -1 1.34

5
China 738562 545251 18 12 1.23
UAE 716612 -660634 9 32 1.19
Austria 707246 -538651 13 7 1.18
Mexico 687358 912661 8 17 1.14
About 220 countries are importing fruits and 200 countries export fruits to the world markets.
Table III: All types of fruits exported to the world market in 2006
Trade Indicators
Exporters
Value exported
in 2006, in USD
thousand
Trade balance in
2006 in USD
thousand
Annual growth in
value between 2002-2006, %
Annual growth in
value between
2005-2006, %
Share in world
exports, %
World 52394890 -7734524 14 6 100
USA 6839403 -467730 13 7 13.05
Spain 5809358 4171180 8 7 11.09
Italy 2943969 556501 9 4 5.62
Belgium 2863167 -399670 15 -1 5.46
Netherlands 2706649 -763139 23 10 5.17
Turkey 2256385 2090536 21 -10 4.31
Chile 2254889 2186430 12 15 4.3
France 1847231 -1765377 5 3 3.53
Mexico 1600019 912661 19 9 3.05
Iran IR of 1493580 1393950 23 19 2.85
Germany 1338510 -5497948 25 20 2.55
Ecuador 1292309 1238867 5 13 2.47
China 1283813 545251 22 20 2.45
Costa Rica 1197462 1160044 12 29 2.29
South Africa 1172778 1110110 19 -6 2.24
India 878451 54211 13 3 1.68
Argentina 848765 766527 19 8 1.62
New Zealand 778862 607147 13 -5 1.49
Brazil 700019 412195 17 3 1.34
Philippines 639605 565184 7 11 1.22
Poland 623827 -307900 16 8 1.19
Greece 574753 233221 9 1 1.1
Colombia 565097 477159 7 4 1.08

6
Table IV: Bananas imported in the world market in 2006
Trade Indicators
Importers
Value imported in 2006, in USD
thousand
Trade balance
in 2006 in USD
thousand
Quantity imported in 2006 in
Tons
Unit value (USD/unit)
Annual growth in value between
2002-2006, %
Annual growth
in quantity between
2002-2006, %
Annual growth in value between
2005-2006, %
Share in world
imports, %
World 9089414 -2692778 16736890 543 9 3 3 100
USA 1471337 -1231267 4087720 360 0 0 7 16.19
Belgium 1319784 -188524 1206037 1094 21 6 20 14.52
Germany 871664 -465649 1311142 665 5 2 -9 9.59
UK 607659 -597397 946639 642 6 2 -3 6.69
Japan 564562 -564552 1043959 541 2 3 -4 6.21
Russian Fed. 480681 -473364 895416 537 25 7 6 5.29
Italy 416259 -314366 649950 640 7 1 -11 4.58
France 289484 -174757 422578 685 14 3 -2 3.18
Canada 223115 -223112 328710 679 8 -6 10 2.45
Netherlands 205973 -93203 297955 691 13 22 44 2.27
Sweden 192711 -147544 191168 1008 1 -3 -4 2.12
Poland 167002 -147724 246614 677 13 0 6 1.84
Republic of Korea 144695 -144337 280245 516 16 10 26 1.59
Austria 118162 -104021 129440 913 17 11 1 1.3
China 116248 -109020 387828 300 10 0 17 1.28
Saudi Arabia 113621 -112117 235284 483 23 7 22 1.25
Spain 104067 -72588 166454 625 29 22 12 1.14
Denmark 93139 -81551 102743 907 12 4 -3 1.02
Czech Republic 91182 -72470 117534 776 24 7 -38 1
Portugal 91106 -70773 152127 599 3 -3 -27 1
Iran (Islamic Republic of) 90467 -89390 294080 308 18 20 -33 1
Switzerland 84823 -84772 74068 1145 4 0 4 0.93
Greece 75984 -73537 96940 784 10 7 -8 0.84
Romania 74979 -74958 154323 486 34 25 14 0.82
Finland 74746 -74687 62453 1197 7 0 -11 0.82

7
Table V: Bananas exported to the world market in 2006
Trade Indicators
Exporters
Value exported in 2006, in USD
thousand
Trade balance
in 2006 in USD
thousand
Quantity exported in 2006 in
Tons
Unit value (USD/unit)
Annual growth in value between
2002-2006, %
Annual growth
in quantity between
2002-2006, %
Annual growth in value between
2005-2006, %
Share in world
exports, %
World 6396636 -2692778 17765570 360 9 4 7 100
Ecuador 1213576 1213576 4958301 245 4 3 12 18.97
Belgium 1131260 -188524 1095881 1032 15 5 2 17.69
Costa Rica 645152 644492 2195584 294 5 3 32 10.09
Colombia 525458 522744 1697411 310 5 3 3 8.21
Germany 406015 -465649 429446 945 29 21 30 6.35
Philippines 405444 405425 2311592 175 6 8 12 6.34
USA 240070 -1231267 444307 540 8 2 10 3.75
Guatemala 233032 232487 1140581 204 0 3 -11 3.64
Dominican Republic 174974 174970 215404 812 18 12 21 2.74
Honduras 131526 129261 516156 255 6 4 -3 2.06
Ghana 118946 118797 57538 2067 452 246 10243 1.86
Côte d'Ivoire 115626 115626 286397 404 23 1.81
France 114727 -174757 173233 662 1 -6 -23 1.79
Netherlands 112770 -93203 144683 779 28 23 141 1.76
Panama 109798 109798 432971 254 -1 -2 13 1.72
Italy 101893 -314366 129209 789 4 -2 -8 1.59
Cameroon 64653 64653 256625 252 6 0 -5 1.01
Sweden 45167 -147544 40898 1104 5 -1 -9 0.71
Brazil 38555 38539 194349 198 4 -5 17 0.6
Spain 31479 -72588 35062 898 2 -9 30 0.49
Mexico 30651 30649 66599 460 22 -12 26 0.48
Saint Lucia 30410 30410 37584 809 -2 -7 32 0.48
Suriname 28374 28374 56080 506 202 31 0.44
Peru 27047 27047 57150 473 47 35 53 0.42
Belize 25296 25296 72698 348 6 2 18 0.4
Portugal 20333 -70773 25373 801 12 4 -59 0.32
Poland 19278 -147724 31917 604 80 65 -77 0.3
Czech Rep. 18712 -72470 21973 852 109 82 -74 0.29
Taiwan, Province of China 15541 15485 16327 952 -3 -15 49 0.24

8
Table VI: Pineapples imported in the world market in 2006
Trade Indicators
Importers
Value imported in 2006, in USD
thousand
Trade balance
in 2006 in USD
thousand
Quantity imported in 2006 in
Tons
Unit value
(USD/unit)
Annual growth in value between
2002-2006, %
Annual growth
in quantity between
2002-2006, %
Annual growth in value between
2005-2006, %
Share in world
imports, %
World 1870925 -536867 2264934 826 18 14 25 100
USA 502304 -413614 634239 792 19 12 64 26.85
Belgium 204220 30206 250805 814 18 26 -21 10.92
Netherlands 164754 -9939 200454 822 48 54 159 8.81
Germany 153165 -119233 155635 984 23 22 26 8.19
Italy 121983 -101377 133464 914 10 14 12 6.52
UK 104977 -96136 104672 1003 39 29 33 5.61
France 96617 -57965 113013 855 -1 -8 -8 5.16
Canada 90048 -90036 80069 1125 24 12 14 4.81
Japan 85933 -85933 152498 564 10 7 -3 4.59
Spain 84615 -70083 97384 869 11 14 17 4.52
Republic of Korea 42946 -42946 59429 723 39 16 23 2.3
Portugal 36919 -25368 42098 877 0 7 -6 1.97
Switzerland 22970 -22645 17409 1319 8 14 11 1.23
Russian Fed. 18502 -18361 26133 708 24 8 36 0.99
Austria 16955 -15652 13679 1239 16 17 33 0.91
Denmark 13661 -13210 12232 1117 36 31 62 0.73
Czech Rep. 8822 -7150 10847 813 49 48 35 0.47
Sweden 7838 -7646 6849 1144 34 30 79 0.42
Poland 7569 -5329 6750 1121 51 35 35 0.4
Norway 7070 -7070 6125 1154 22 23 13 0.38
New Zealand 6553 -6542 8313 788 33 25 15 0.35
Singapore 4749 -4735 18589 255 8 1 4 0.25
Ireland 4535 -4358 3489 1300 30 32 31 0.24
Hong Kong 4415 -4382 8057 548 20 14 21 0.24
Chile 4217 -4204 10521 401 40 41 0.23
Ukraine 3866 -3866 6255 618 178 238 58 0.21
Luxembourg 3800 -2801 2412 1575 6 -1 -7 0.2
Greece 2945 -2530 3004 980 15 19 39 0.16
Slovenia 2803 -2482 2296 1221 28 26 39 0.15
Slovakia 2640 -2308 2340 1128 46 32 15 0.14
Saudi Arabia 2638 -2442 3581 737 11 2 45 0.14
9
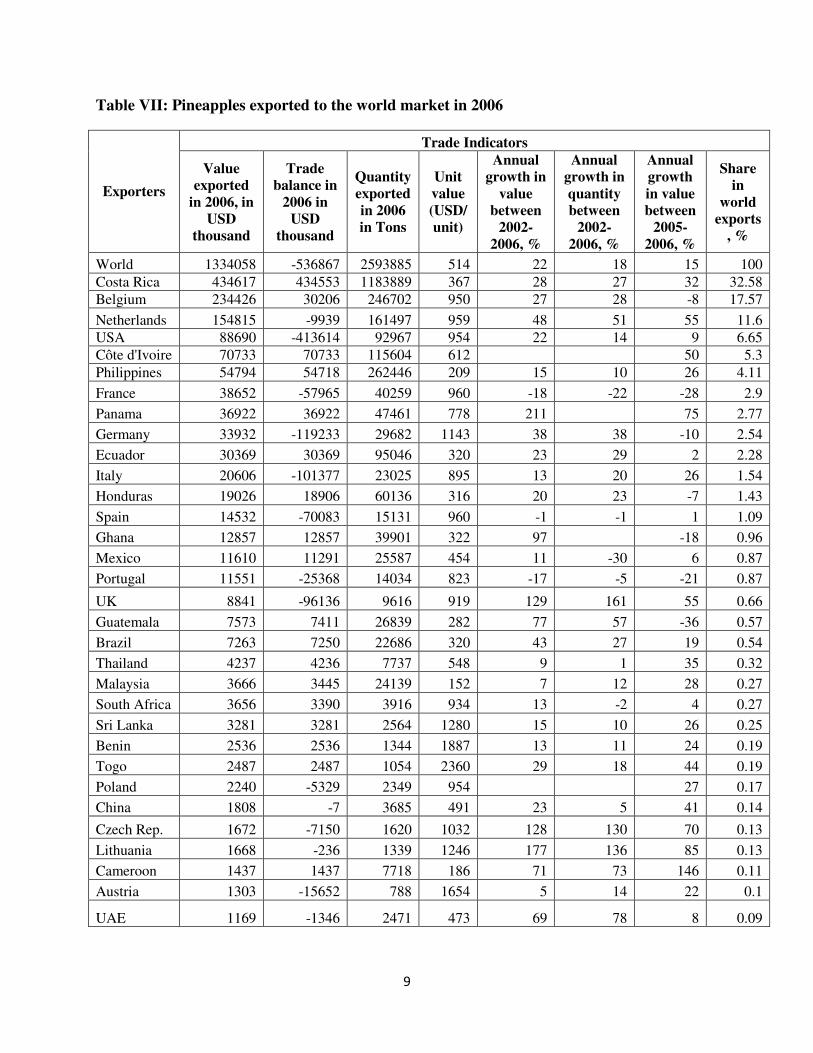
Table VII: Pineapples exported to the world market in 2006
Trade Indicators
Exporters
Value exported
in 2006, in USD
thousand
Trade balance in
2006 in USD
thousand
Quantity exported in 2006 in Tons
Unit value (USD/unit)
Annual growth in
value between
2002-2006, %
Annual growth in quantity between
2002-2006, %
Annual growth in value between
2005-2006, %
Share in
world exports
, %
World 1334058 -536867 2593885 514 22 18 15 100
Costa Rica 434617 434553 1183889 367 28 27 32 32.58
Belgium 234426 30206 246702 950 27 28 -8 17.57
Netherlands 154815 -9939 161497 959 48 51 55 11.6
USA 88690 -413614 92967 954 22 14 9 6.65
Côte d'Ivoire 70733 70733 115604 612 50 5.3
Philippines 54794 54718 262446 209 15 10 26 4.11
France 38652 -57965 40259 960 -18 -22 -28 2.9
Panama 36922 36922 47461 778 211 75 2.77
Germany 33932 -119233 29682 1143 38 38 -10 2.54
Ecuador 30369 30369 95046 320 23 29 2 2.28
Italy 20606 -101377 23025 895 13 20 26 1.54
Honduras 19026 18906 60136 316 20 23 -7 1.43
Spain 14532 -70083 15131 960 -1 -1 1 1.09
Ghana 12857 12857 39901 322 97 -18 0.96
Mexico 11610 11291 25587 454 11 -30 6 0.87
Portugal 11551 -25368 14034 823 -17 -5 -21 0.87
UK 8841 -96136 9616 919 129 161 55 0.66
Guatemala 7573 7411 26839 282 77 57 -36 0.57
Brazil 7263 7250 22686 320 43 27 19 0.54
Thailand 4237 4236 7737 548 9 1 35 0.32
Malaysia 3666 3445 24139 152 7 12 28 0.27
South Africa 3656 3390 3916 934 13 -2 4 0.27
Sri Lanka 3281 3281 2564 1280 15 10 26 0.25
Benin 2536 2536 1344 1887 13 11 24 0.19
Togo 2487 2487 1054 2360 29 18 44 0.19
Poland 2240 -5329 2349 954 27 0.17
China 1808 -7 3685 491 23 5 41 0.14
Czech Rep. 1672 -7150 1620 1032 128 130 70 0.13
Lithuania 1668 -236 1339 1246 177 136 85 0.13
Cameroon 1437 1437 7718 186 71 73 146 0.11
Austria 1303 -15652 788 1654 5 14 22 0.1
UAE 1169 -1346 2471 473 69 78 8 0.09

10
Table VIII: Mangoes imported in the world market in 2006
Trade Indicators
Importers
Value imported in 2006, in USD
thousand
Trade balance
in 2006 in USD
thousand
Quantity imported in 2006 in
Tons
Unit value (USD/unit)
Annual growth in value between
2002-2006, %
Annual growth
in quantity between
2002-2006, %
Annual growth in value between
2005-2006, %
Share in world
imports, %
World 1025852 -221409 1013503 1012 13 6 8 100
USA 269321 -252678 298088 903 8 2 17 26.25
Netherlands 114448 -38851 92817 1233 18 14 20 11.16
UK 82605 -79140 54676 1511 32 22 30 8.05
France 75728 -45605 35297 2145 24 7 -11 7.38
Germany 57235 -48705 38709 1479 17 8 5 5.58
Canada 44539 -44521 42161 1056 16 6 7 4.34
Japan 43911 -43822 12586 3489 14 9 1 4.28
Hong Kong 40472 -24711 42422 954 -6 -7 2 3.95
UAE 32890 -29218 63506 518 17 8 -13 3.21
China 29922 -27812 23763 1259 23 6 -31 2.92
Belgium 28986 -8088 24533 1182 23 20 80 2.83
Saudi Arabia 27634 -27328 48330 572 6 9 -5 2.69
Portugal 24664 -24335 15081 1635 12 -3 1 2.4
Spain 20934 -10532 17040 1229 11 12 23 2.04
Singapore 14110 -13832 16027 880 1 -12 14 1.38
Switzerland 13966 -13805 5624 2483 17 8 6 1.36
Bangladesh 9320 -9310 44493 209 23 24 28 0.91
Italy 7165 -5969 4686 1529 22 18 3 0.7
Kuwait 6072 -6072 8900 682 34 26 18 0.59
Sweden 5392 -5074 3624 1488 28 20 8 0.53
Austria 5352 -4626 3408 1570 10 -3 4 0.52
Oman 5249 -5241 16438 319 -5 -1 -21 0.51
Norway 4665 -4653 2298 2030 24 16 26 0.45
Malaysia 4062 -2094 23521 173 -7 -2 -1 0.4
R.of Korea 3786 -3786 1235 3066 19 13 70 0.37
New Zealand 3357 -3353 2264 1483 25 8 1 0.33
Russian Fed. 3244 -3234 3254 997 36 16 53 0.32
Denmark 3113 -2986 2123 1466 20 10 18 0.3
Nepal 2650 -2650 10032 264 107 89 27 0.26
Czech Rep. 2637 -2192 3064 861 37 39 -14 0.26
Mexico 2280 97067 2004 1138 6 9 24 0.22
Australia 2257 8008 810 2786 49 44 8 0.22
11
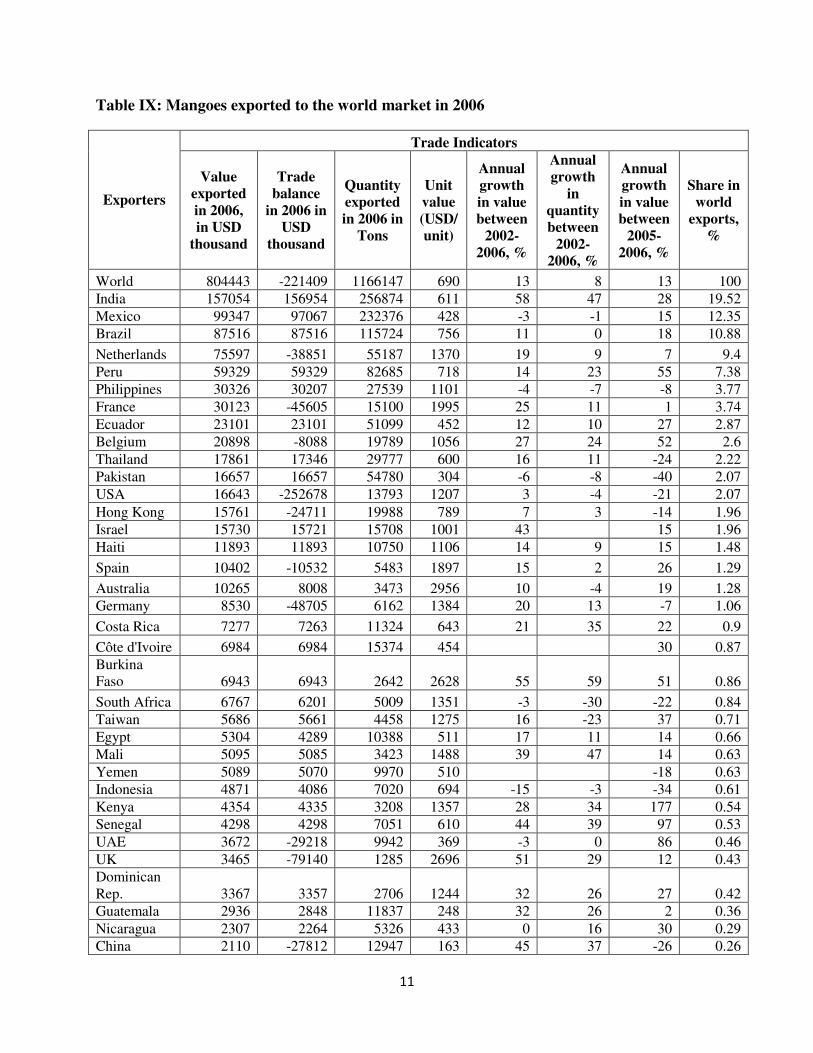
Table IX: Mangoes exported to the world market in 2006
Trade Indicators
Exporters
Value exported in 2006, in USD
thousand
Trade balance
in 2006 in USD
thousand
Quantity exported in 2006 in
Tons
Unit value (USD/unit)
Annual growth in value between
2002-2006, %
Annual growth
in quantity between
2002-2006, %
Annual growth in value between
2005-2006, %
Share in world
exports, %
World 804443 -221409 1166147 690 13 8 13 100
India 157054 156954 256874 611 58 47 28 19.52
Mexico 99347 97067 232376 428 -3 -1 15 12.35
Brazil 87516 87516 115724 756 11 0 18 10.88
Netherlands 75597 -38851 55187 1370 19 9 7 9.4
Peru 59329 59329 82685 718 14 23 55 7.38
Philippines 30326 30207 27539 1101 -4 -7 -8 3.77
France 30123 -45605 15100 1995 25 11 1 3.74
Ecuador 23101 23101 51099 452 12 10 27 2.87
Belgium 20898 -8088 19789 1056 27 24 52 2.6
Thailand 17861 17346 29777 600 16 11 -24 2.22
Pakistan 16657 16657 54780 304 -6 -8 -40 2.07
USA 16643 -252678 13793 1207 3 -4 -21 2.07
Hong Kong 15761 -24711 19988 789 7 3 -14 1.96
Israel 15730 15721 15708 1001 43 15 1.96
Haiti 11893 11893 10750 1106 14 9 15 1.48
Spain 10402 -10532 5483 1897 15 2 26 1.29
Australia 10265 8008 3473 2956 10 -4 19 1.28
Germany 8530 -48705 6162 1384 20 13 -7 1.06
Costa Rica 7277 7263 11324 643 21 35 22 0.9
Côte d'Ivoire 6984 6984 15374 454 30 0.87
Burkina Faso 6943 6943 2642 2628 55 59 51 0.86
South Africa 6767 6201 5009 1351 -3 -30 -22 0.84
Taiwan 5686 5661 4458 1275 16 -23 37 0.71
Egypt 5304 4289 10388 511 17 11 14 0.66
Mali 5095 5085 3423 1488 39 47 14 0.63
Yemen 5089 5070 9970 510 -18 0.63
Indonesia 4871 4086 7020 694 -15 -3 -34 0.61
Kenya 4354 4335 3208 1357 28 34 177 0.54
Senegal 4298 4298 7051 610 44 39 97 0.53
UAE 3672 -29218 9942 369 -3 0 86 0.46
UK 3465 -79140 1285 2696 51 29 12 0.43
Dominican Rep. 3367 3357 2706 1244 32 26 27 0.42
Guatemala 2936 2848 11837 248 32 26 2 0.36
Nicaragua 2307 2264 5326 433 0 16 30 0.29
China 2110 -27812 12947 163 45 37 -26 0.26

12
Malaysia 1968 -2094 8647 228 -17 -1 -20 0.24
Viet Nam 1824 526 3448 529 -16 -19 54 0.23
Italy 1196 -5969 408 2931 50 27 -27 0.15
Jamaica 1132 1124 622 1820 15 11 29 0.14
Venezuela 919 919 1821 505 -7 0 -21 0.11
Gambia 767 767 766 1001 119 62 376 0.1

13
Table X: Grapes imported in the world market in 2006
Trade Indicators
Importers
Value imported in 2006, in USD
thousand
Trade balance
in 2006 in USD
thousand
Quantity imported in 2006 in
Tons
Unit value (USD/unit)
Annual growth in value between
2002-2006, %
Annual growth
in quantity between
2002-2006, %
Annual growth in value between
2005-2006, %
Share in world
imports, %
World 5251302 -1079014 3463785 1516 14 8 7 100
USA 1102061 -437611 603218 1827 9 4 -1 20.99
UK 554657 -519975 273096 2031 14 9 12 10.56
Germany 546125 -450160 351914 1552 13 5 -1 10.4
Netherlands 469422 -140154 260170 1804 31 22 11 8.94
Russian Fed 342716 -342511 320677 1069 64 34 63 6.53
Canada 321549 -319900 174773 1840 11 2 7 6.12
France 179074 -148147 141100 1269 7 1 -12 3.41
Belgium 170108 -52876 93736 1815 5 -1 8 3.24
Hong Kong 148289 -94551 91517 1620 -1 -4 6 2.82
Poland 113952 -107919 74640 1527 23 4 6 2.17
Mexico 106897 2306 77230 1384 0 -7 11 2.04
China 69659 -50425 46021 1514 25 -3 -15 1.33
Norway 63986 -63218 25592 2500 18 5 6 1.22
Sweden 59773 -58852 28755 2079 24 12 15 1.14
Switzerland 58330 -58051 32961 1770 6 -1 -3 1.11
Czech Rep. 56845 -52808 51957 1094 17 5 14 1.08
Austria 52673 -48109 36939 1426 14 5 7 1
Spain 47535 144178 31586 1505 11 6 -8 0.91
Denmark 46121 -44158 26685 1728 21 10 8 0.88
Indonesia 43638 -43604 26366 1655 25 17 42 0.83
Italy 39224 459817 21245 1846 17 10 4 0.75
Portugal 37141 -34845 28217 1316 9 -1 -1 0.71
Finland 33323 -33260 14121 2360 24 10 16 0.63
R. of Korea 32600 -31646 17291 1885 29 23 38 0.62
Taiwan, 29438 -29161 22379 1315 16 9 -22 0.56
Singapore 27875 -20865 12166 2291 7 0 8 0.53
Ireland 26556 -24781 9465 2806 11 4 19 0.51
Thailand 26173 -26131 16818 1556 32 34 48 0.5
UAE 25031 -22446 21239 1179 13 2 24 0.48
NewZealand 19442 -18907 10582 1837 22 15 -11 0.37
Australia 19005 68719 4759 3993 82 57 9 0.36
Lithuania 18505 -10389 14114 1311 31 21 36 0.35
Ukraine 17593 -17587 55166 319 459 522 163 0.34
Japan 17178 -14605 9949 1727 -2 -5 -13 0.33
Slovakia 16870 -14197 15847 1065 36 14 -20 0.32
Saudi Arabia 16776 -13225 31853 527 1 -3 -6 0.32

14
Table XI: Grapes exported to the world market in 2006
Trade Indicators
Exporters
Value exported
in 2006, in USD
thousand
Trade balance in
2006 in USD
thousand
Quantity exported in 2006 in Tons
Unit value (USD/unit)
Annual growth in
value between
2002-2006, %
Annual growth
in quantity between
2002-2006, %
Annual growth in value between
2005-2006, %
Share in
world exports, %
World 4172288 -1079014 3496847 1193 13 8 3 100
Chile 772564 772499 823198 938 7 17 18.52
USA 664450 -437611 372358 1784 9 2 -4 15.93
Italy 499041 459817 417200 1196 4 -3 -13 11.96
Netherlands 329268 -140154 164571 2001 26 18 -4 7.89
South Africa 257604 254611 284903 904 21 8 -13 6.17
Spain 191713 144178 126282 1518 11 0 20 4.59
Uzbekistan 141883 141883 142712 994 92 66 84 3.4
Greece 138005 135816 88732 1555 19 12 3 3.31
Brazil 118535 107305 62297 1903 36 22 10 2.84
Belgium 117232 -52876 57660 2033 6 -1 -5 2.81
Mexico 109203 2306 112319 972 -2 -6 -31 2.62
Germany 95965 -450160 47164 2035 64 54 13 2.3
Australia 87724 68719 48070 1825 6 -1 7 2.1
Turkey 80840 80477 145979 554 27 19 -12 1.94
Argentina 73328 72444 72736 1008 20 18 51 1.76
India 66308 64065 85563 775 34 37 37 1.59
Egypt 63728 63548 41077 1551 42 43 8 1.53
Hong Kong 53738 -94551 46868 1147 -4 -8 -15 1.29
Peru 49466 49000 27879 1774 23 24 41 1.19
UK 34682 -519975 16065 2159 27 21 -17 0.83
France 30927 -148147 18119 1707 15 7 -15 0.74
Namibia 29453 28705 23946 1230 53 35 17 0.71
China 19234 -50425 34293 561 62 49 93 0.46
Morocco 16973 16832 10856 1563 64 55 21 0.41
Israel 15407 14733 11933 1291 21 -5 0.37
Tajikistan 10364 10276 10620 976 49 26 195 0.25
Afghanistan 8344 8310 61688 135 15 171 97 0.2
Lithuania 8116 -10389 6120 1326 95 74 222 0.19
Singapore 7010 -20865 4122 1701 13 16 22 0.17
Poland 6033 -107919 4672 1291 229 92 0.14
Iran 5761 5761 14423 399 63 45 75 0.14
Lebanon 5125 5044 17202 298 -15 -10 -2 0.12
Austria 4564 -48109 3136 1455 3 -8 28 0.11
Syrian 4187 4126 3243 1291 -28 -34 20 0.1
Turkmenistan 4179 4179 3699 1130 191 197 273 0.1
Czech Rep. 4037 -52808 3457 1168 125 132 32 0.1
Saudi Arabia 3551 -13225 2659 1335 21 5 -32 0.09

15
2. VEGETABLES
Total import of vegetables in the world market recorded at US$ 39.7 billion in 2006. The
world’s top ten importers and their import share are USA (13.25%), Germany (12.24%), UK
(9.27%), France (6.16%), Japan (4.85%), Canada (4.5%), Netherlands (4.3%), Belgium (3.4%),
Italy (3.4%), Spain (2.8%) and India (2.54%) (Table XII). The world import market value for
vegetables increased by 12% annually between 2002 and 2006. However, the annual growth in
value between 2005 and 2006 recorded at 13%. India imported 2.54% of total world import in
2006.
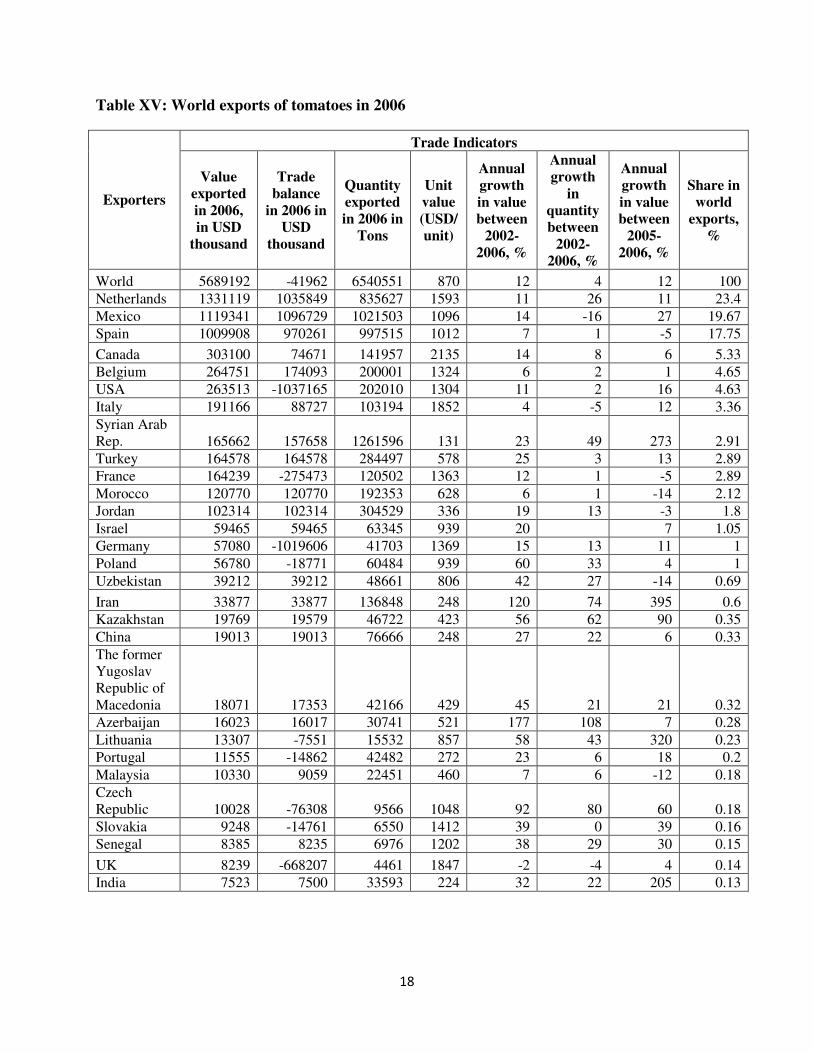
The world producers and suppliers exported US$ 38.1 billion worth of fruits to the various
markets. Major suppliers of fruits to the world markets are Netherlands (13.3%), Spain (11.6%),
China (9.8%), Mexico (9.1%), USA (7.1%), France (5.2%), Belgium (5.2%), Canada (5.0%),
Italy (3.1%), Germany (2.2%), Thailand (1.8%), Turkey (1.7%), and India (1.6%) (Table XIII).
The world trades of tomatoes, onions and peppers/chillies are presented in tables XIV to XIX.
Table XII: Vegetables imported by the world in 2006
Trade Indicators
Importers Value
imported in 2006, in USD
thousand
Trade balance in
2006 in USD thousand
Annual growth in value
between 2002-2006, %
Annual growth in
value between 2005-2006, %
Share in world imports, %
World 39728400 -1633268 12 13 100
USA 5264333 -2583745 10 11 13.25
Germany 4861190 -4009557 10 11 12.24
UK 3681592 -3300606 12 4 9.27
France 2448367 -457527 10 4 6.16
Japan 1925093 -1893983 4 1 4.85
Canada 1788683 121033 9 11 4.5
Netherlands 1702287 3374023 10 14 4.28
Belgium 1361134 620986 11 18 3.43
Italy 1331894 -146230 10 1 3.35
Spain 1102066 3307482 18 9 2.77
India 1009961 -387613 11 58 2.54
Russian Fed 930415 -861937 37 29 2.34
China 755534 2959193 42 44 1.9
Sweden 584811 -512835 13 13 1.47
Switzerland 508174 -504780 7 8 1.28
Austria 470295 -366391 13 8 1.18
Malaysia 451284 -345994 14 12 1.14
Denmark 427421 -314876 17 20 1.08
Czech Rep 389678 -307657 24 31 0.98
UAE 369288 -340846 21 50 0.93
Iraq 328342 -327918 87 154 0.83
R. of Korea 325290 -246349 22 20 0.82

16
Poland 318783 352694 26 20 0.8
Portugal 311018 -159472 11 16 0.78
Mexico 300347 3178409 7 33 0.76
Pakistan 289767 -245907 54 43 0.73
Ireland 288631 -108949 11 20 0.73
Norway 262376 -260932 15 14 0.66
Bangladesh 251577 -234464 16 17 0.63
Table XIII: Vegetables exported by the world in 2006
Trade Indicators
Exporters Value
exported in 2006, in USD
thousand
Trade balance in
2006 in USD thousand
Annual growth in
value between 2002-2006, %
Annual growth in
value between 2005-2006, %
Share in world exports, %
World 38095130 -1633268 12 13 100
Netherlands 5076310 3374023 10 19 13.33
Spain 4409548 3307482 9 2 11.58
China 3714727 2959193 18 22 9.75
Mexico 3478756 3178409 11 11 9.13
USA 2680588 -2583745 9 11 7.04
France 1990840 -457527 9 10 5.23
Belgium 1982120 620986 9 10 5.2
Canada 1909716 121033 15 11 5.01
Italy 1185664 -146230 8 9 3.11
Germany 851633 -4009557 13 16 2.24
Thailand 673175 578066 19 30 1.77
Poland 671477 352694 25 8 1.76
Turkey 643302 565108 16 21 1.69
India 622348 -387613 27 9 1.63
Myanmar 603845 598985 18 73 1.59
Australia 449906 288941 6 39 1.18
Israel 402994 350483 24 14 1.06
Syrian Arab Rep 387716 353380 33 186 1.02
UK 380986 -3300606 8 6 1
Egypt 374470 176023 21 11 0.98
Peru 299966 279710 18 16 0.79
Morocco 293024 253475 9 -5 0.77
Argentina 288389 279171 12 20 0.76
Iran 260058 240733 22 106 0.68
New Zealand 245407 186762 4 -3 0.64
Kenya 243528 222607 13 17 0.64

17
Table XIV: World imports of tomatoes in 2006
Trade Indicators
Importers
Value imported in 2006, in
USD thousand
Trade balance in
2006 in USD
thousand
Quantity imported in 2006 in
Tons
Unit value (USD/unit)
Annual growth in value between
2002-2006, %
Annual growth
in quantity between
2002-2006, %
Annual growth in value between
2005-2006, %
Share in world
imports, %
World 5731154 -41962 5623838 1019 11 8 8 100
USA 1300678 -1037165 992337 1311 8 3 16 22.69
Germany 1076686 -1019606 717712 1500 9 2 7 18.79
UK 676446 -668207 442432 1529 11 9 -1 11.8
France 439712 -275473 464814 946 7 4 -4 7.67
Russian Fed 298395 -298385 413594 721 49 25 38 5.21
Netherlands 295270 1035849 256576 1151 6 43 2 5.15
Canada 228429 74671 186561 1224 11 3 13 3.99
Sweden 141285 -138648 85309 1656 16 9 6 2.47
Italy 102439 88727 89073 1150 14 11 -22 1.79
Belgium 90658 174093 63284 1433 6 0 -11 1.58
Czech Rep. 86336 -76308 88710 973 25 7 22 1.51
Poland 75551 -18771 74104 1020 27 16 5 1.32
Austria 67698 -61083 50429 1342 15 8 -1 1.18
Switzerland 65993 -65932 41194 1602 8 0 0 1.15
Iraq 56832 -56832 252826 225 258 156 155 0.99
Denmark 55522 -53948 38133 1456 18 17 8 0.97
Ireland 45461 -39254 25252 1800 14 6 13 0.79
Norway 44528 -44481 20401 2183 15 7 1 0.78
UAE 42430 -41531 125803 337 14 8 20 0.74
Saudi Arabia 40621 -39488 210199 193 -14 -4 46 0.71
Spain 39647 970261 82966 478 34 19 -3 0.69
18
Table XV: World exports of tomatoes in 2006
Trade Indicators
Exporters
Value exported in 2006, in USD
thousand
Trade balance
in 2006 in USD
thousand
Quantity exported in 2006 in
Tons
Unit value (USD/unit)
Annual growth in value between
2002-2006, %
Annual growth
in quantity between
2002-2006, %
Annual growth in value between
2005-2006, %
Share in world
exports, %
World 5689192 -41962 6540551 870 12 4 12 100
Netherlands 1331119 1035849 835627 1593 11 26 11 23.4
Mexico 1119341 1096729 1021503 1096 14 -16 27 19.67
Spain 1009908 970261 997515 1012 7 1 -5 17.75
Canada 303100 74671 141957 2135 14 8 6 5.33
Belgium 264751 174093 200001 1324 6 2 1 4.65
USA 263513 -1037165 202010 1304 11 2 16 4.63
Italy 191166 88727 103194 1852 4 -5 12 3.36
Syrian Arab Rep. 165662 157658 1261596 131 23 49 273 2.91
Turkey 164578 164578 284497 578 25 3 13 2.89
France 164239 -275473 120502 1363 12 1 -5 2.89
Morocco 120770 120770 192353 628 6 1 -14 2.12
Jordan 102314 102314 304529 336 19 13 -3 1.8
Israel 59465 59465 63345 939 20 7 1.05
Germany 57080 -1019606 41703 1369 15 13 11 1
Poland 56780 -18771 60484 939 60 33 4 1
Uzbekistan 39212 39212 48661 806 42 27 -14 0.69
Iran 33877 33877 136848 248 120 74 395 0.6
Kazakhstan 19769 19579 46722 423 56 62 90 0.35
China 19013 19013 76666 248 27 22 6 0.33
The former Yugoslav Republic of Macedonia 18071 17353 42166 429 45 21 21 0.32
Azerbaijan 16023 16017 30741 521 177 108 7 0.28
Lithuania 13307 -7551 15532 857 58 43 320 0.23
Portugal 11555 -14862 42482 272 23 6 18 0.2
Malaysia 10330 9059 22451 460 7 6 -12 0.18
Czech Republic 10028 -76308 9566 1048 92 80 60 0.18
Slovakia 9248 -14761 6550 1412 39 0 39 0.16
Senegal 8385 8235 6976 1202 38 29 30 0.15
UK 8239 -668207 4461 1847 -2 -4 4 0.14
India 7523 7500 33593 224 32 22 205 0.13

19
Table XVI: World imports of onions in 2006
Trade Indicators
Importers
Value imported in 2006, in USD
thousand
Trade balance
in 2006 in USD
thousand
Quantity imported in 2006 in
Tons
Unit value (USD/unit)
Annual growth in value between
2002-2006, %
Annual growth
in quantity between
2002-2006, %
Annual growth in value between
2005-2006, %
Share in world
imports, %
World 1917459 -29065 6080335 315 13 8 22 100
USA 203372 -32025 291753 697 8 2 -19 10.61
UK 167711 -162118 316723 530 12 4 28 8.75
Germany 143449 -113499 276587 519 6 -3 35 7.48
Russian Fed 135255 -135202 539146 251 22 3 19 7.05
Japan 110819 -110806 291574 380 25 18 10 5.78
Malaysia 108045 -87987 470552 230 14 13 7 5.63
Canada 83917 -49030 211773 396 7 5 5 4.38
Belgium 71549 -48310 152427 469 7 0 40 3.73
Bangladesh 69122 -69112 403636 171 51 42 12 3.6
France 54041 8508 105659 511 2 -5 29 2.82
UAE 50158 -43862 254264 197 18 4 123 2.62
Netherlands 44897 263154 103357 434 4 -1 65 2.34
Mexico 38277 184536 81076 472 15 1 148 2
Indonesia 37468 -30327 99690 376 28 21 69 1.95
Saudi Arabia 35581 -33260 233992 152 9 9 -18 1.86
Brazil 31190 -30785 198783 157 23 12 37 1.63
Pakistan 27979 -26770 166029 169 280 153 152 1.46
Italy 26514 14244 59187 448 2 -2 53 1.38
Sri Lanka 26092 -25957 136683 191 12 2 32 1.36
Ireland 25303 -17235 40512 625 16 7 23 1.32
Sweden 25012 -24082 29606 845 17 5 31 1.3
Czech Rep. 16240 -14238 54893 296 17 12 201 0.85
Spain 16118 92827 37489 430 5 0 70 0.84
R. of Korea 15208 -15010 40780 373 131 124 170 0.79
Singapore 14790 -13196 43887 337 8 0 10 0.77
Iraq 14362 -14362 145037 99 176 120 551 0.75
Portugal 12965 -12447 45533 285 0 0 112 0.68
Senegal 12244 -12221 89802 136 7 19 -9 0.64
Austria 11719 31 15425 760 9 1 28 0.61

20
Table XVII: World exports of onions in 2006
Trade Indicators
Exporters
Value exported in 2006, in USD
thousand
Trade balance
in 2006 in USD
thousand
Quantity exported in 2006 in
Tons
Unit value (USD/unit)
Annual growth in value between
2002-2006, %
Annual growth
in quantity between
2002-2006, %
Annual growth in value between
2005-2006, %
Share in world
exports, %
World 1888394 -29065 6123640 308 13 2 23 100
Netherlands 308051 263154 913673 337 10 7 42 16.31
India 257113 257113 1381515 186 29 20 60 13.62
Mexico 222813 184536 295720 753 11 -26 -22 11.8
USA 171347 -32025 326015 526 11 1 18 9.07
China 153747 153360 569498 270 32 20 31 8.14
Spain 108945 92827 273197 399 10 0 50 5.77
France 62549 8508 73407 852 12 -1 39 3.31
New Zealand 52228 51624 154317 338 -1 -9 19 2.77
Egypt 50433 50146 228055 221 20 10 7 2.67
Poland 49415 38995 165474 299 26 11 33 2.62
Argentina 40831 40817 243871 167 17 10 35 2.16
Italy 40758 14244 43165 944 -1 -10 14 2.16
Canada 34887 -49030 63224 552 7 3 43 1.85
Germany 29950 -113499 66832 448 7 2 45 1.59
Belgium 23239 -48310 51117 455 -4 -8 -6 1.23
Malaysia 20058 -87987 84430 238 18 23 -23 1.06
Turkey 17862 17862 121030 148 -4 -11 157 0.95
Peru 17159 17159 52072 330 10 7 -1 0.91
Australia 16686 12080 45627 366 1 -16 2 0.88
Uzbekistan 16349 16349 61161 267 17 -2 -23 0.87
Thailand 14481 5465 60549 239 40 37 23 0.77
Iran 13898 13839 139057 100 4 3 323 0.74
Chile 12979 11749 41016 316 4 -18 0.69
Austria 11750 31 42696 275 0 -1 96 0.62
Kazakhstan 9570 9328 66313 144 12 -5 21 0.51
Tajikistan 9278 9278 35275 263 20 1 29 0.49
South Africa 8314 7935 32406 257 13 -1 51 0.44
Ireland 8068 -17235 6724 1200 99 92 68 0.43

21
Table XVIII: World imports of chillies / peppers in 2006
Trade Indicators
Importers
Value imported in 2006, in USD
thousand
Trade balance
in 2006 in USD
thousand
Quantity imported in 2006 in
Tons
Unit value (USD/unit)
Annual growth in value between
2002-2006, %
Annual growth
in quantity between
2002-2006, %
Annual growth in value between
2005-2006, %
Share in world
imports, %
World 3137204 -277930 1995934 1572 13 7 9 100
USA 818526 -686669 555536 1473 11 8 9 26.09
Germany 610903 -581906 308513 1980 10 2 9 19.47
UK 316662 -313991 140341 2256 16 13 12 10.09
France 188070 -122442 140013 1343 14 5 1 5.99
Netherlands 172084 751933 108243 1590 20 14 26 5.49
Canada 149996 9294 57743 2598 10 -8 0 4.78
Japan 88562 -88555 23302 3801 6 1 -3 2.82
Italy 83318 -66040 68602 1215 8 3 -6 2.66
Sweden 74043 -73564 34677 2135 15 6 18 2.36
Russian Fed. 68098 -68072 71108 958 59 25 81 2.17
Czech Rep. 59186 -54027 52854 1120 20 5 13 1.89
Austria 51559 -49777 33362 1545 12 6 18 1.64
Denmark 50659 -49747 24650 2055 23 12 18 1.61
Switzerland 47817 -47806 23010 2078 10 3 10 1.52
Poland 39768 -27017 22286 1784 7 1 14 1.27
Belgium 39418 -5031 21371 1844 13 6 12 1.26
Norway 33947 -33947 12486 2719 14 7 20 1.08
Finland 23033 -23008 10301 2236 11 4 13 0.73
Spain 21317 560582 18777 1135 35 24 23 0.68
Ireland 20351 -17243 9794 2078 7 1 8 0.65
Hungary 16541 14984 12685 1304 45 25 -1 0.53
Slovakia 14440 -10018 11972 1206 43 19 39 0.46
UAE 12563 -11969 30455 413 27 26 32 0.4
Singapore 12232 -11486 13255 923 14 5 15 0.39
Greece 11069 6342 11568 957 4 -6 11 0.35
Malaysia 9313 -3342 32427 287 17 10 -55 0.3

22
Table XIX: World exports of chillies / peppers in 2006
Trade Indicators
Exporters
Value exported in 2006, in USD
thousand
Trade balance
in 2006 in USD
thousand
Quantity exported in 2006 in
Tons
Unit value (USD/unit)
Annual growth in value between
2002-2006, %
Annual growth
in quantity between
2002-2006, %
Annual growth in value between
2005-2006, %
Share in world
exports, %
World 2859274 -277930 1954212 1463 12 -8 6 100
Netherlands 924017 751933 370411 2495 11 13 18 32.32
Mexico 583504 581517 512473 1139 15 -22 -3 20.41
Spain 581899 560582 483295 1204 5 0 -1 20.35
Canada 159290 9294 65319 2439 20 11 31 5.57
USA 131857 -686669 94091 1401 10 2 -1 4.61
France 65628 -122442 40128 1635 15 8 -9 2.3
Turkey 48511 48511 52031 932 20 4 -16 1.7
R.of Korea 48280 48224 15149 3187 12 4 -15 1.69
Belgium 34387 -5031 16834 2043 9 6 -7 1.2
Hungary 31525 14984 29135 1082 4 -7 13 1.1
Germany 28997 -581906 13619 2129 38 26 1 1.01
New Zealand 20838 17387 6738 3093 17 15 22 0.73
Morocco 18309 18309 29913 612 23 17 -17 0.64
Greece 17411 6342 12004 1450 11 11 5 0.61
Italy 17278 -66040 11236 1538 9 4 7 0.6
Jordan 15954 15908 25930 615 18 5 10 0.56
Poland 12751 -27017 8110 1572 88 36 292 0.45
China 8862 8861 26322 337 11 -1 -13 0.31
Egypt 8380 8370 6631 1264 70 61 32 0.29
Dominican Republic 7946 7934 4879 1629 13 -1 91 0.28
Uzbekistan 6925 6925 8081 857 58 24 49 0.24
Malaysia 5971 -3342 8222 726 5 -4 -2 0.21
India 5558 5558 19138 290 26 50 40 0.19
Czech Rep. 5159 -54027 3710 1391 155 133 36 0.18
Lithuania 4883 -983 3145 1553 194 163 911 0.17
Slovakia 4422 -10018 2009 2201 5 -36 -29 0.15
Portugal 4345 -4635 2248 1933 17 8 32 0.15

23
3. SPICES AND AROMATIC PRODUCTS
The major spices and aromatic products traded in the world markets are Pepper, capsicum,
vanilla, cinnamon, cloves, nutmeg, mace, cardamoms, anise seeds, fennel, coriander, cumin,
ginger, saffron turmeric, etc. Total volume of export as well as import of these items in 2006
recorded at USD 3.4 billion representing an increase of import value by 11.6 per cent between
the year 2003 and 2006. The data revealed that the world’s export value in this four-year period
increased by 19.5 %.
The world market growth rates for ginger, turmeric and saffron are higher than those of peppers,
cinnamons, corianders, cumin and anise. The world market slackened for vanilla, cloves,
nutmegs, mace and cardamoms. (Table XX). The prices of majority of spices are increasing in
the world market. Import growth rates in terms of value are higher than those of in terms of
quantity. For example annual import growth rates of gingers and turmeric in terms of value were
18 and 15% respectively whereas growth rates of gingers and turmeric in terms of volume were 6
and 9 % respectively.
The world trades of ginger and turmeric for the year 2006 are presented in Tables XXI to XIV.
Table XX: World trade of major spices in 2006
World's exports to the world World's imports from world
Product Code
Product Label Value
in 2003 in USD
000
Value in 2006,
USD 000
Annual growth in
value between
2002-2006, %,
p.a.
Value in 2003 in
USD 000
Value in 2006,
USD 000
Annual growth in
value between
2002-2006, %,
p.a. 0904 Pepper, peppers &
capsicum 987400 1398046 11
1078587 1367823 9
0905 Vanilla 474144 114337 -28 537869 122422 -28
0906 Cinnamon/cinnamon-tree flowers
109386 167119 9 127362
181719 8
0907 Cloves 129596 135586 -3 115531 129924 -2
0908 Nutmeg, mace cardamom
217728 239597 0 254326
245823 -2
0909 Seeds of anise, badian, fennel, coriander, cumin, etc.
235648 403671 9 219758
357569 8
0910 Ginger,saffron,turmeric,thyme, bay leaves & curry
701061 954288 13 720717
1003033 14
Total 2854963 3412644 3054150 3408313
Growth 2003 to 2006 19.50% 11.60%

24
Table XXI: World imports of ginger in 2006
Trade Indicators
Importers
Value imported in 2006, in USD
thousand
Trade balance
in 2006 in USD
thousand
Quantity imported in 2006 in
Tons
Unit value (USD/unit)
Annual growth in value between
2002-2006, %
Annual growth
in quantity between
2002-2006, %
Annual growth in value between
2005-2006, %
Share in world
imports, %
World 270339 -13764 387294 698 18 6 -17 100
Japan 74269 -74030 88465 840 8 -4 -28 27.47
USA 27906 -25943 32553 857 19 11 -26 10.32
Pakistan 25579 -25525 54352 471 36 15 -1 9.46
U K 16789 -15990 15982 1050 22 10 -2 6.21
Netherlands 13709 -278 13204 1038 26 13 -3 5.07
Malaysia 10078 -9696 25233 399 29 19 -34 3.73
Germany 9919 -6751 4364 2273 27 13 -10 3.67
UAE 9012 -8564 16857 535 33 11 -33 3.33
India 8914 1626 32684 273 25 10 -21 3.3
Saudi Arabia 6848 -6678 16978 403 13 13 25 2.53
Singapore 6732 -5426 8683 775 13 2 -23 2.49
Canada 6594 -6412 8360 789 18 25 -23 2.44
Bangladesh 6421 -6421 17380 369 55 16 -22 2.38
Morocco 3569 -3546 3820 934 19 12 123 1.32
France 3271 -2597 2666 1227 24 15 -11 1.21
R. of Korea 2239 -2194 5739 390 -4 -17 -56 0.83
Yemen 2176 -2140 3061 711 97 0.8
New Zealand 2018 -2000 1081 1867 12 10 -14 0.75
Denmark 1762 -1649 1049 1680 7 -6 40 0.65
Spain 1720 -975 1407 1222 55 40 2 0.64
Australia 1657 -1051 869 1907 19 0 27 0.61
Belgium 1628 -571 836 1947 33 12 16 0.6
Sudan 1550 -1550 1670 928 153 164 15400 0.57
South Africa 1542 -1434 1357 1136 40 18 40 0.57
Italy 1287 -1145 1008 1277 14 4 -4 0.48
Austria 1197 -930 508 2356 21 12 6 0.44
Thailand 1179 7819 4322 273 135 138 27 0.44
Egypt 1141 -1096 1047 1090 63 40 113 0.42
Sweden 1134 -766 466 2433 33 11 -3 0.42
Ethiopia 1058 4380 1183 894 181 0.39
Switzerland 951 -905 516 1843 17 10 -1 0.35
Oman 882 -882 1535 575 -9 -17 -37 0.33
Viet Nam 843 507 1536 549 64 10 41 0.31

25
Table XXII: World exports of ginger in 2006
Trade Indicators
Exporters
Value exported in 2006, in USD
thousand
Trade balance in
2006 in USD
thousand
Quantity exported in 2006 in
Tons
Unit value (USD/unit)
Annual growth in
value between
2002-2006, %
Annual growth in quantity between
2002-2006, %
Annual growth in value between
2005-2006, %
Share in
world exports
, %
World 256575 -13764 387138 663 26 7 -20 100
China 168155 168003 280368 600 31 8 -23 65.54
Netherlands 13431 -278 7640 1758 33 20 7 5.23
India 10540 1626 9663 1091 27 12 1 4.11
Thailand 8998 7819 16753 537 3 -15 -14 3.51
Nigeria 7848 7796 6629 1184 63 32 -33 3.06
Nepal 6004 5712 29800 201 22 10 56 2.34
Ethiopia 5438 4380 6320 860 81 45 -34 2.12
Brazil 5417 5279 7078 765 17 10 -19 2.11
Taiwan 5213 4660 2247 2320 -1 -3 1 2.03
Fiji 3286 3134 1191 2759 3 9 -16 1.28
Germany 3168 -6751 906 3497 43 33 -4 1.23
USA 1963 -25943 882 2226 13 0 -31 0.77
Indonesia 1898 1349 1712 1109 -18 -30 -13 0.74
Viet Nam 1350 507 1504 898 35 13 55 0.53
Singapore 1306 -5426 1588 822 7 -2 -37 0.51
Costa Rica 1167 1137 1780 656 4 -1 -30 0.45
Belgium 1057 -571 522 2025 29 9 3 0.41
UK 799 -15990 302 2646 2 -8 -32 0.31
Spain 745 -975 526 1416 53 47 185 0.29
Myanmar 722 722 615 1174 11 -5 -58 0.28
France 674 -2597 368 1832 11 11 74 0.26
Togo 619 487 476 1300 53 43 145 0.24
Australia 606 -1051 185 3276 17 1 -11 0.24
UAE 448 -8564 709 632 -27 -28 -78 0.17
Benin 387 387 389 995 66 0.15
Malaysia 382 -9696 1432 267 18 39 -48 0.15
Sweden 368 -766 53 6943 26 -6 15 0.14
Saint Vincent and Grenadines 367 367 705 521 9 9 34 0.14
Lao PDR 313 274 1443 217 282 0.12
Sri Lanka 288 -8 60 4800 34 -10 0.11
Austria 267 -930 24 11125 38 -2 41 0.1
Jamaica 251 69 58 4328 40 65 83 0.1
Japan 239 -74030 130 1838 -4 -5 0 0.09
Hong Kong 203 -186 143 1420 14 10 -82 0.08

26
Table XXIII: World imports of turmeric in 2006
Trade Indicators
Importers
Value imported in 2006, in USD
thousand
Trade balance
in 2006 in USD
thousand
Quantity imported in 2006 in
Tons
Unit value (USD/unit)
Annual growth in value between
2002-2006, %
Annual growth
in quantity between
2002-2006, %
Annual growth in value between
2005-2006, %
Share in world
imports, %
World 57824 -3702 67713 854 15 9 0 100
USA 6215 -5732 2877 2160 20 6 4 10.75
Japan 5886 -5853 4491 1311 11 1 3 10.18
India 5553 32554 6992 794 72 43 37 9.6
UAE 4712 -4622 8314 567 9 12 -2 8.15
UK 2970 -2300 2481 1197 8 1 1 5.14
Malaysia 2830 -2690 3868 732 17 11 -3 4.89
Germany 2422 -1804 1557 1556 16 5 42 4.19
Bangladesh 2200 -2060 4168 528 37 26 -25 3.8
South Africa 1805 -1771 2238 807 16 9 -3 3.12
Sri Lanka 1620 -1561 3946 411 12 19 15 2.8
Netherlands 1618 52 1681 963 5 2 4 2.8
Iran 1562 -1538 3402 459 -12 -13 -55 2.7
Saudi Arabia 1365 -1351 2305 592 22 20 3 2.36
Egypt 1286 -1286 2057 625 26 27 95 2.22
France 1062 -998 881 1205 12 4 -7 1.84
Canada 859 -799 467 1839 14 5 6 1.49
Singapore 829 -162 1151 720 -9 -18 12 1.43
Brazil 616 114 527 1169 36 30 24 1.07
Poland 598 -454 497 1203 24 13 7 1.03
Tunisia 541 -541 833 649 26 25 -50 0.94
Belgium 514 -13 316 1627 13 9 -5 0.89
Morocco 497 -492 725 686 11 6 -42 0.86
Australia 493 -488 473 1042 10 6 18 0.85
Spain 405 -331 445 910 31 28 -44 0.7
Yemen 374 -374 894 418 3 0.65
Viet Nam 360 2939 1387 260 154 0.62
Israel 353 -353 293 1205 8 11 0.61
Russian Fed. 328 -326 422 777 39 29 -24 0.57
Republic of Korea 321 -321 337 953 15 7 4 0.56
Qatar 303 -303 450 673 87 87 52 0.52
Kuwait 297 -297 347 856 32 24 -35 0.51
Libyan Arab Jamahiriya 294 -294 469 627 50 465 0.51
Turkey 281 -281 271 1037 30 7 160 0.49
Switzerland 275 -265 137 2007 7 0 0 0.48
Côte d'Ivoire 263 -234 129 2039 31 0.45

27
Trinidad and Tobago 262 -262 223 1175 17 14 60 0.45
Argentina 247 -146 183 1350 4 -3 10 0.43
Oman 243 -243 284 856 9 9 -14 0.42
Denmark 242 -227 164 1476 14 1 -4 0.42
Fiji 223 -13 216 1032 14 8 39 0.39
Mauritius 202 -154 257 786 9 3 -33 0.35

28
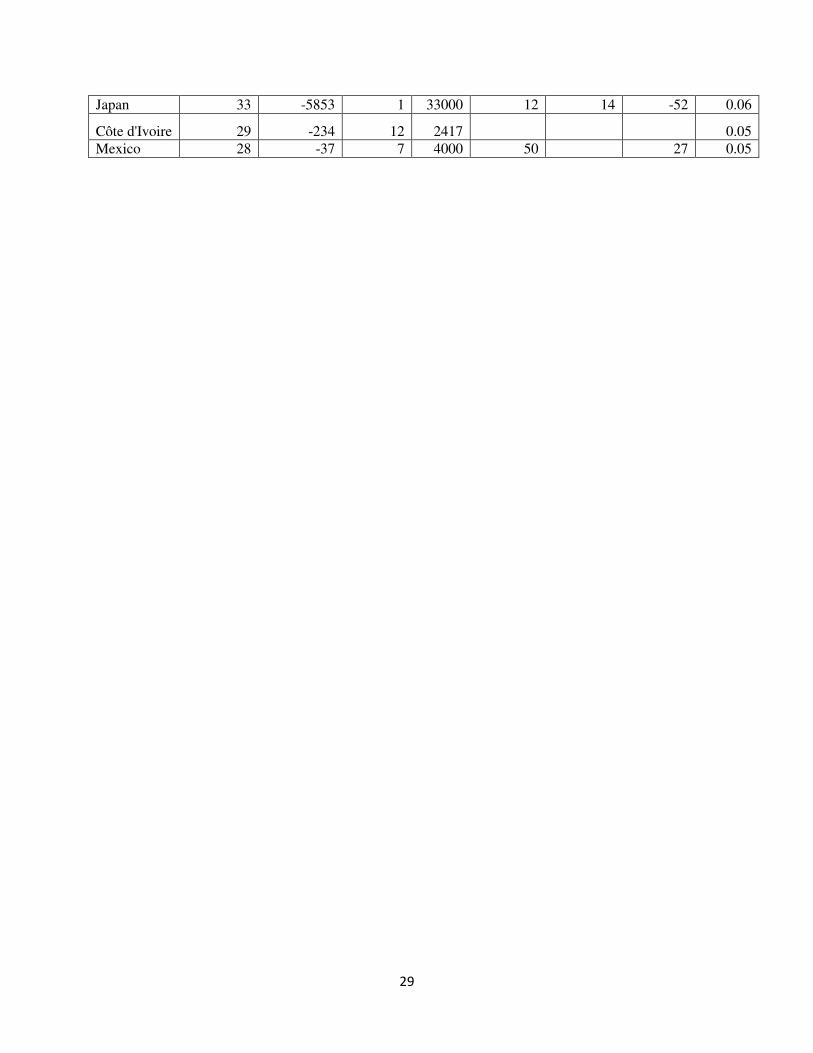
Table XXIV: World exports of turmeric in 2006
Trade Indicators
Exporters
Value exported in 2006, in USD
thousand
Trade balance in
2006 in USD
thousand
Quantity
exported in
2006 in tons
Unit value (USD/unit)
Annual growth in
value between
2002-2006, %
Annual growth in quantity between
2002-2006, %
Annual growth in value between
2005-2006, %
Share in
world exports
, %
World 54122 -3702 70413 769 15 14 0 100
India 38107 32554 54816 695 16 15 2 70.41
Viet Nam 3299 2939 3727 885 93 87 32 6.1
Netherlands 1670 52 881 1896 12 2 8 3.09
Indonesia 1255 1235 2647 474 83 189 15 2.32
Myanmar 1170 1170 2295 510 -3 -10 1 2.16
China 1092 1091 785 1391 8 -5 -28 2.02
Brazil 730 114 299 2441 489 288 1.35
UK 670 -2300 261 2567 19 15 2 1.24
Singapore 667 -162 656 1017 -11 -23 -4 1.23
Germany 618 -1804 295 2095 7 4 16 1.14
Peru 560 560 526 1065 4 1 6 1.03
Nigeria 529 525 546 969 79 0.98
Belgium 501 -13 255 1965 45 47 -13 0.93
USA 483 -5732 149 3242 0 -8 186 0.89
Cambodia 325 325 280 1161 0.6
Pakistan 315 216 398 791 116 176 363 0.58
Fiji 210 -13 90 2333 9 5 98 0.39
Poland 144 -454 145 993 22 0.27
Malaysia 140 -2690 133 1053 3 -4 150 0.26
Bangladesh 140 -2060 149 940 56 27 -15 0.26
Djibouti 130 127 320 406 0.24
Sweden 120 -76 13 9231 53 52 -14 0.22
Argentina 101 -146 9 11222 170 4950 0.19
Dominican Republic 97 -11 45 2156 7 7 76 0.18
UAE 90 -4622 91 989 -45 14 -97 0.17
Austria 75 -113 21 3571 40 26 4 0.14
Spain 74 -331 49 1510 31 33 64 0.14
France 64 -998 34 1882 -6 -9 -29 0.12
Jamaica 62 -36 54 1148 -2 6 11 0.11
Canada 60 -799 8 7500 56 -2 253 0.11
Sri Lanka 59 -1561 9 6556 31 -12 0.11
El Salvador 56 33 39 1436 -3 3 37 0.1
Thailand 54 -68 21 2571 -10 -20 -35 0.1
Mauritius 48 -154 16 3000 145 -20 0.09
Ethiopia 39 39 82 476 -18 -24 -89 0.07
Togo 35 35 36 972 106 0.06
South Africa 34 -1771 19 1789 35 34 183 0.06
29
Japan 33 -5853 1 33000 12 14 -52 0.06
Côte d'Ivoire 29 -234 12 2417 0.05
Mexico 28 -37 7 4000 50 27 0.05

30
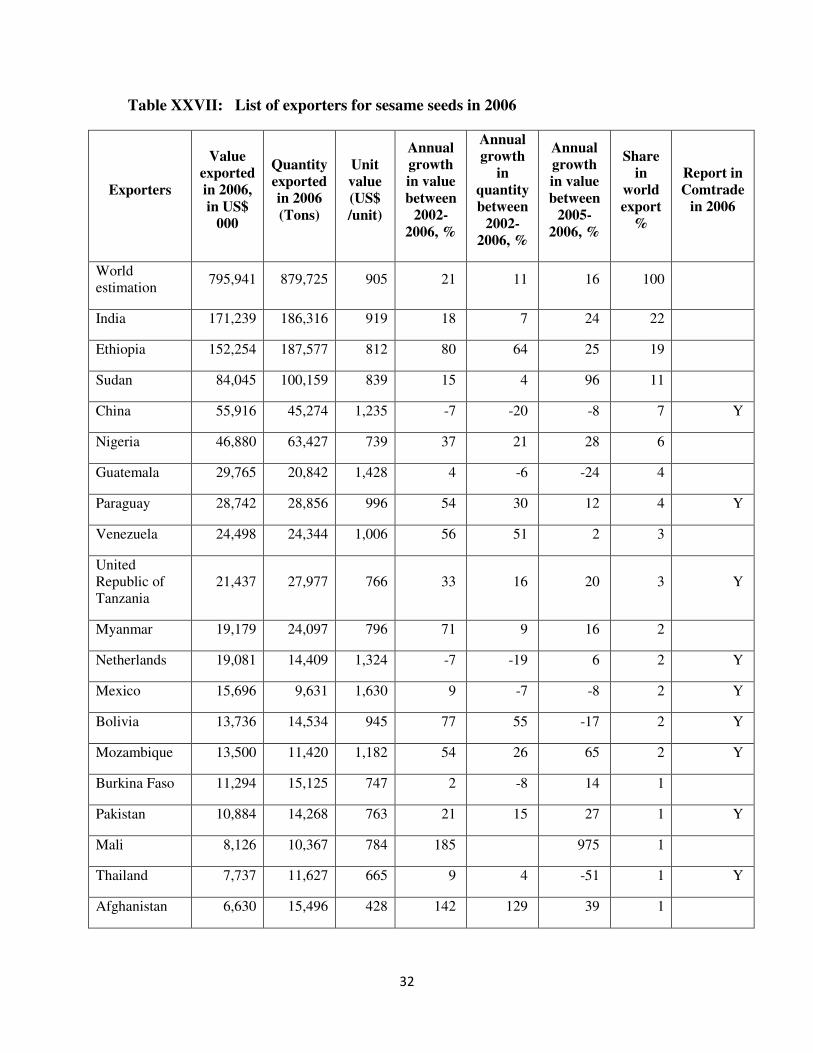
4. SESAME SEEDS
Global imports of sesame seeds topped over the one billion dollar mark in 2006, reaching USD
1,001,163,000 equating to 1.4 million tons. The market has shown strong demand in recent years
with 22% annual average growth over the last five years, influenced strongly by massive demand
in China where imports have consistently grown by some 150% per annum. China’s imports
currently represent one fifth of the world imports. China has in fact shifted from being a net
exporter to a major importer. Currently China remains the 5th largest exporter. India is by far the
largest exporter, having almost a quarter market share of the world market, followed by Ethiopia,
Sudan and Nigeria. Whilst India is keeping up with world growth trends Ethiopia is gaining
market share with growth rates double the global rate.
Table XXV: World sesamum imports, 2006
Trade Indicators
Importers
Value imported in 2006, in USD
thousand
Quantity imported in 2006 (Tons)
Unit value (USD/unit)
Annual growth in
value between
2002-2006, %
Annual growth in quantity between
2002-2006, %
Share in world
imports, %
World 1001163 1138530 879 22 12 100
China 210873 263587 800 184 152 21.06
Japan 148415 159110 933 13 2 14.82
Rep. of Korea 83143 85567 972 13 2 8.3
Turkey 67176 92663 725 20 9 6.71
USA 54208 43316 1251 9 0 5.41
Egypt 36688 48796 752 12 7 3.66
Israel 32188 25702 1252 17 3.22
Syrian Arab Republic 31905 43810 728 22 11 3.19
Germany 30361 26139 1162 20 9 3.03
Greece 23743 24571 966 13 3 2.37
Saudi Arabia 23097 28626 807 32 19 2.31
Source: Calculations from Comtrade

31
Table XXVI: World sesamum exports, 2006
Trade Indicators
Exporters
Value exported
in 2006, in USD
thousand
Quantity exported in 2006 (Tons)
Unit value (USD/unit)
Annual growth in
value between
2002-2006, %
Annual growth in quantity between
2002-2006, %
Share in world
exports, %
World 900536 1056898 852 22 12 100
India 207269 233345 888 23 15 23.02
Ethiopia 160619 189515 848 58 37 17.84
Sudan 143712 194215 740 19 9 15.96
Nigeria 64184 88426 726 39 24 7.13
China 55916 45274 1235 -7 -20 6.21
Paraguay 28742 28856 996 54 30 3.19
Myanmar 21748 28765 756 57 10 2.42
United Republic of Tanzania 21437 27977 766 33 16 2.38
Netherlands 19081 14409 1324 -7 -19 2.12
Guatemala 16207 14682 1104 0 -8 1.8
Mexico 15696 9631 1630 9 -7 1.74
Bolivia 13736 14534 945 77 55 1.53
Source: Calculations from Comtrade
32
Table XXVII: List of exporters for sesame seeds in 2006
Exporters
Value exported in 2006, in US$
000
Quantity exported in 2006 (Tons)
Unit value (US$ /unit)
Annual growth in value between
2002-2006, %
Annual growth
in quantity between
2002-2006, %
Annual growth in value between
2005-2006, %
Share in
world export
%
Report in Comtrade
in 2006
World estimation
795,941 879,725 905 21 11 16 100
India 171,239 186,316 919 18 7 24 22
Ethiopia 152,254 187,577 812 80 64 25 19
Sudan 84,045 100,159 839 15 4 96 11
China 55,916 45,274 1,235 -7 -20 -8 7 Y
Nigeria 46,880 63,427 739 37 21 28 6
Guatemala 29,765 20,842 1,428 4 -6 -24 4
Paraguay 28,742 28,856 996 54 30 12 4 Y
Venezuela 24,498 24,344 1,006 56 51 2 3
United Republic of Tanzania
21,437 27,977 766 33 16 20 3 Y
Myanmar 19,179 24,097 796 71 9 16 2
Netherlands 19,081 14,409 1,324 -7 -19 6 2 Y
Mexico 15,696 9,631 1,630 9 -7 -8 2 Y
Bolivia 13,736 14,534 945 77 55 -17 2 Y
Mozambique 13,500 11,420 1,182 54 26 65 2 Y
Burkina Faso 11,294 15,125 747 2 -8 14 1
Pakistan 10,884 14,268 763 21 15 27 1 Y
Mali 8,126 10,367 784 185 975 1
Thailand 7,737 11,627 665 9 4 -51 1 Y
Afghanistan 6,630 15,496 428 142 129 39 1

33
Turkey 6,519 4,207 1,550 11 2 -6 1 Y
Uganda 4,547 7,566 601 91 73 -5 1 Y
Nicaragua 4,076 3,056 1,334 45 41 -32 1
Germany 3,963 2,800 1,415 13 3 6 0 Y
Egypt 3,132 3,717 843 49 48 13 0
Greece 3,091 1,949 1,586 39 24 5 0 Y
Uzbekistan 2,706 4,231 640 83 65 -34 0
USA 2,504 1,782 1,405 16 14 -10 0 Y
UK 1,751 1,072 1,633 26 19 -32 0 Y
Singapore 1,713 2,046 837 -2 -9 19 0 Y
Belgium 1,523 1,124 1,355 28 15 -24 0 Y
Honduras 1,492 1,002 1,489 10 3 -15 0 Y
Sweden 1,276 514 2,482 25 20 45 0 Y
Lao People's Democratic Republic
1,126 2,135 527 145 78 65 0
Kenya 990 1,324 748 29 1 0
Somalia 975 1,512 645 45 -21 0
Djibouti 935 1,954 479 0
Lebanon 886 504 1,758 9 -3 15 0
Hong Kong 885 715 1,238 3 -4 3 0 Y
El Salvador 794 574 1,383 -18 -19 -46 0
Source: ITC calculations based on COMTRADE statistics

34
Table XXVIII: List of importers for sesmame seeds in 2006
Importers
Value imported in 2006, in US$
000
Quantity imported in 2006
(Tons)
Unit value (US$ /unit)
Annual growth in value between
2002-2006, %
Annual growth
in quantity between
2002-2006, %
Annual growth in value between
2005-2006, %
Share in
world import
%
Report in Comtrade
in 2006
World estimation
803,236 891,566 901 21 12 15 100
China 210,873 263,587 800 184 152 69 26 Y
Japan 148,415 159,110 933 13 2 -3 18 Y
R. of Korea 83,143 85,567 972 13 2 58 10 Y
Turkey 67,176 92,663 725 20 9 4 8 Y
USA 54,208 43,316 1,251 9 0 -4 7 Y
Germany 28,846 25,231 1,143 19 8 -8 4 Y
Greece 23,743 24,571 966 13 3 6 3 Y
Netherlands 17,929 17,995 996 -4 -15 -15 2 Y
Mexico 17,255 20,715 833 25 15 -6 2 Y
Jordan 14,818 17,560 844 20 6 9 2 Y
France 10,729 7,544 1,422 21 12 -2 1 Y
United Kingdom
10,562 7,998 1,321 16 7 1 1 Y
Poland 10,357 8,270 1,252 20 4 -5 1 Y
Canada 8,041 6,151 1,307 7 -2 -2 1 Y
Australia 7,598 6,604 1,151 10 1 -7 1 Y
Taiwan, Province of China
6,353 10,607 599 8 2 -13 1
Italy 5,730 5,619 1,020 15 4 -3 1 Y
Yemen 5,404 10,038 538 -15 1 Y
Malaysia 5,045 8,636 584 9 4 -8 1 Y

35
Singapore 4,704 6,466 727 0 -8 -5 1 Y
Russian Federation
4,394 5,071 866 18 17 64 1 Y
Austria 4,285 3,447 1,243 21 11 16 1 Y
Belgium 3,375 2,518 1,340 27 17 -29 0 Y
Sweden 3,155 2,447 1,289 9 1 1 0 Y
United Arab Emirates
2,968 3,262 910 60 27 0
Spain 2,796 1,842 1,518 -1 -8 17 0
Denmark 2,258 1,478 1,528 14 3 -9 0 Y
Morocco 2,004 2,858 701 23 14 34 0 Y
Cyprus 1,948 1,920 1,015 14 1 -6 0 Y
Paraguay 1,916 2,279 841 128 9984 0 Y
Hong Kong 1,914 1,651 1,159 2 -8 -10 0 Y
Brazil 1,905 1,631 1,168 1 -13 -28 0 Y
Serbia 1,769 1,627 1,087 7 0 Y
Romania 1,739 1,640 1,060 66 36 30 0 Y
India 1,629 1,836 887 110 84 53 0
Thailand 1,576 2,911 541 42 44 -73 0 Y
Switzerland 1,549 1,154 1,342 20 9 5 0 Y
Indonesia 1,535 3,413 450 -5 -7 29 0 Y
South Africa 1,474 1,402 1,051 26 12 -16 0 Y
Source: ITC calculations based on COMTRADE statistics

36

37
38
39
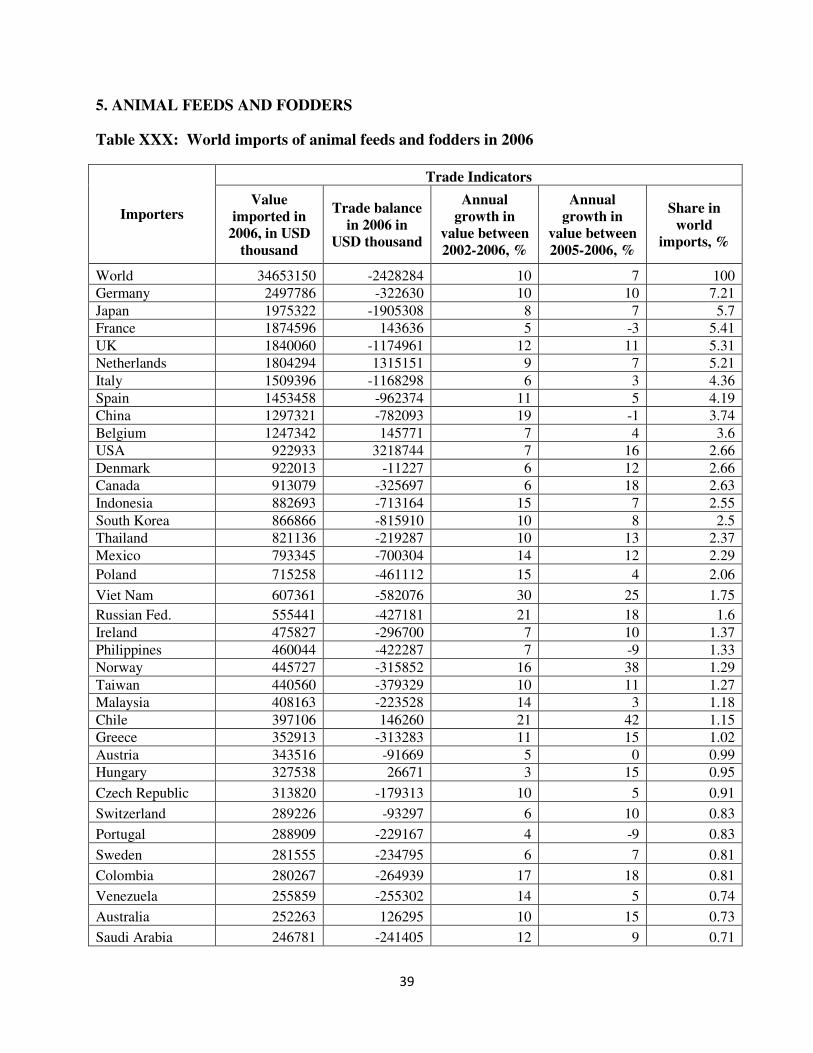
5. ANIMAL FEEDS AND FODDERS
Table XXX: World imports of animal feeds and fodders in 2006
Trade Indicators
Importers Value
imported in 2006, in USD
thousand
Trade balance in 2006 in
USD thousand
Annual growth in
value between 2002-2006, %
Annual growth in
value between 2005-2006, %
Share in world
imports, %
World 34653150 -2428284 10 7 100
Germany 2497786 -322630 10 10 7.21
Japan 1975322 -1905308 8 7 5.7
France 1874596 143636 5 -3 5.41
UK 1840060 -1174961 12 11 5.31
Netherlands 1804294 1315151 9 7 5.21
Italy 1509396 -1168298 6 3 4.36
Spain 1453458 -962374 11 5 4.19
China 1297321 -782093 19 -1 3.74
Belgium 1247342 145771 7 4 3.6
USA 922933 3218744 7 16 2.66
Denmark 922013 -11227 6 12 2.66
Canada 913079 -325697 6 18 2.63
Indonesia 882693 -713164 15 7 2.55
South Korea 866866 -815910 10 8 2.5
Thailand 821136 -219287 10 13 2.37
Mexico 793345 -700304 14 12 2.29
Poland 715258 -461112 15 4 2.06
Viet Nam 607361 -582076 30 25 1.75
Russian Fed. 555441 -427181 21 18 1.6
Ireland 475827 -296700 7 10 1.37
Philippines 460044 -422287 7 -9 1.33
Norway 445727 -315852 16 38 1.29
Taiwan 440560 -379329 10 11 1.27
Malaysia 408163 -223528 14 3 1.18
Chile 397106 146260 21 42 1.15
Greece 352913 -313283 11 15 1.02
Austria 343516 -91669 5 0 0.99
Hungary 327538 26671 3 15 0.95
Czech Republic 313820 -179313 10 5 0.91
Switzerland 289226 -93297 6 10 0.83
Portugal 288909 -229167 4 -9 0.83
Sweden 281555 -234795 6 7 0.81
Colombia 280267 -264939 17 18 0.81
Venezuela 255859 -255302 14 5 0.74
Australia 252263 126295 10 15 0.73
Saudi Arabia 246781 -241405 12 9 0.71
40
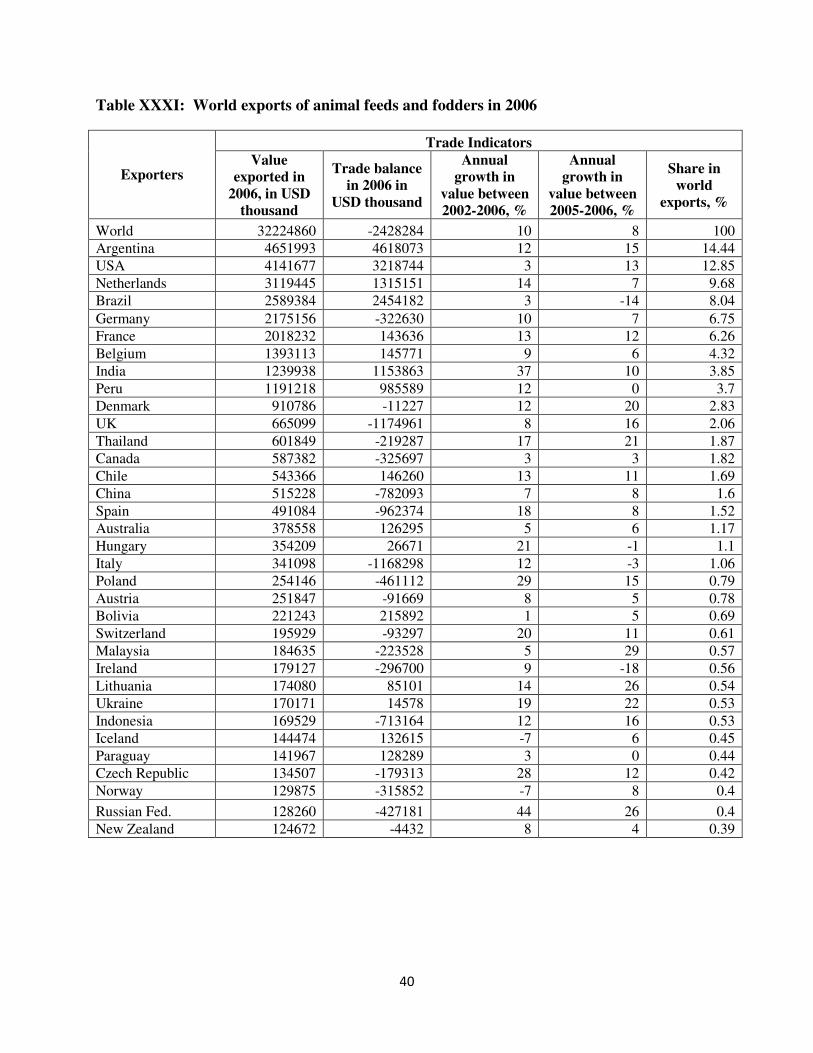
Table XXXI: World exports of animal feeds and fodders in 2006
Trade Indicators
Exporters Value
exported in 2006, in USD
thousand
Trade balance in 2006 in
USD thousand
Annual growth in
value between 2002-2006, %
Annual growth in
value between 2005-2006, %
Share in world
exports, %
World 32224860 -2428284 10 8 100
Argentina 4651993 4618073 12 15 14.44
USA 4141677 3218744 3 13 12.85
Netherlands 3119445 1315151 14 7 9.68
Brazil 2589384 2454182 3 -14 8.04
Germany 2175156 -322630 10 7 6.75
France 2018232 143636 13 12 6.26
Belgium 1393113 145771 9 6 4.32
India 1239938 1153863 37 10 3.85
Peru 1191218 985589 12 0 3.7
Denmark 910786 -11227 12 20 2.83
UK 665099 -1174961 8 16 2.06
Thailand 601849 -219287 17 21 1.87
Canada 587382 -325697 3 3 1.82
Chile 543366 146260 13 11 1.69
China 515228 -782093 7 8 1.6
Spain 491084 -962374 18 8 1.52
Australia 378558 126295 5 6 1.17
Hungary 354209 26671 21 -1 1.1
Italy 341098 -1168298 12 -3 1.06
Poland 254146 -461112 29 15 0.79
Austria 251847 -91669 8 5 0.78
Bolivia 221243 215892 1 5 0.69
Switzerland 195929 -93297 20 11 0.61
Malaysia 184635 -223528 5 29 0.57
Ireland 179127 -296700 9 -18 0.56
Lithuania 174080 85101 14 26 0.54
Ukraine 170171 14578 19 22 0.53
Indonesia 169529 -713164 12 16 0.53
Iceland 144474 132615 -7 6 0.45
Paraguay 141967 128289 3 0 0.44
Czech Republic 134507 -179313 28 12 0.42
Norway 129875 -315852 -7 8 0.4
Russian Fed. 128260 -427181 44 26 0.4
New Zealand 124672 -4432 8 4 0.39
41
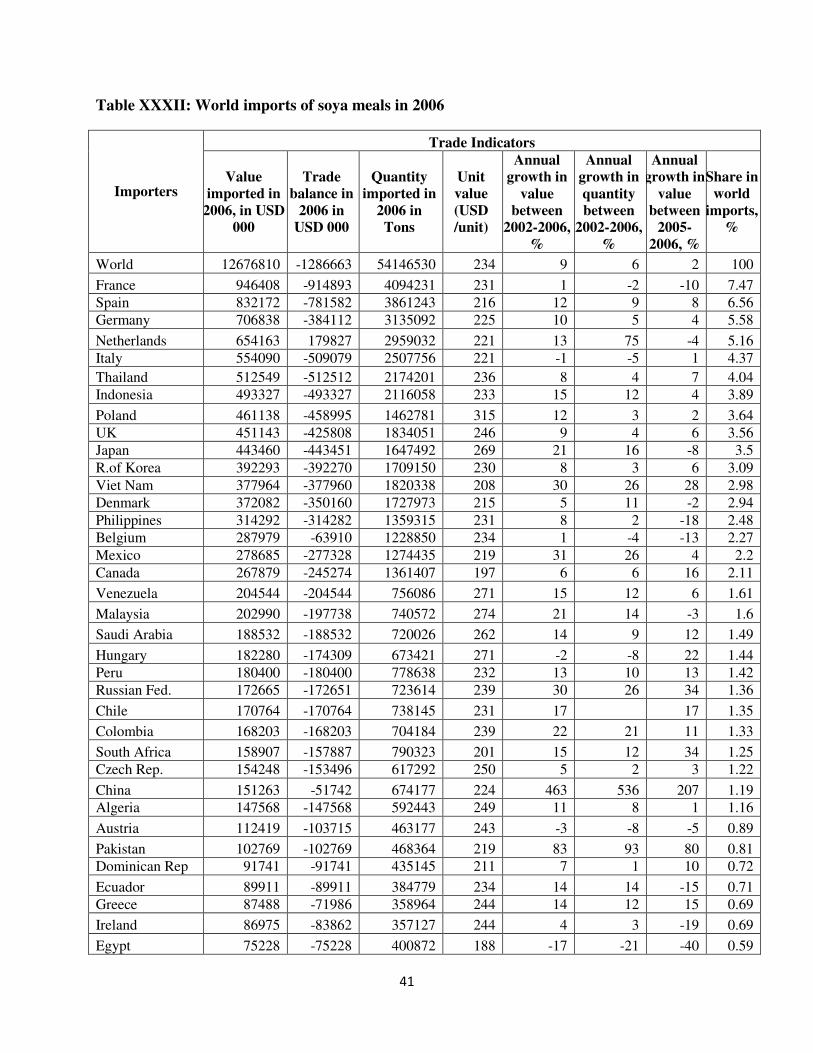
Table XXXII: World imports of soya meals in 2006
Trade Indicators
Importers Value
imported in 2006, in USD
000
Trade balance in
2006 in USD 000
Quantity imported in
2006 in Tons
Unit value (USD /unit)
Annual growth in
value between
2002-2006, %
Annual growth in quantity between
2002-2006, %
Annual growth in
value between
2005-2006, %
Share in world
imports, %
World 12676810 -1286663 54146530 234 9 6 2 100
France 946408 -914893 4094231 231 1 -2 -10 7.47
Spain 832172 -781582 3861243 216 12 9 8 6.56
Germany 706838 -384112 3135092 225 10 5 4 5.58
Netherlands 654163 179827 2959032 221 13 75 -4 5.16
Italy 554090 -509079 2507756 221 -1 -5 1 4.37
Thailand 512549 -512512 2174201 236 8 4 7 4.04
Indonesia 493327 -493327 2116058 233 15 12 4 3.89
Poland 461138 -458995 1462781 315 12 3 2 3.64
UK 451143 -425808 1834051 246 9 4 6 3.56
Japan 443460 -443451 1647492 269 21 16 -8 3.5
R.of Korea 392293 -392270 1709150 230 8 3 6 3.09
Viet Nam 377964 -377960 1820338 208 30 26 28 2.98
Denmark 372082 -350160 1727973 215 5 11 -2 2.94
Philippines 314292 -314282 1359315 231 8 2 -18 2.48
Belgium 287979 -63910 1228850 234 1 -4 -13 2.27
Mexico 278685 -277328 1274435 219 31 26 4 2.2
Canada 267879 -245274 1361407 197 6 6 16 2.11
Venezuela 204544 -204544 756086 271 15 12 6 1.61
Malaysia 202990 -197738 740572 274 21 14 -3 1.6
Saudi Arabia 188532 -188532 720026 262 14 9 12 1.49
Hungary 182280 -174309 673421 271 -2 -8 22 1.44
Peru 180400 -180400 778638 232 13 10 13 1.42
Russian Fed. 172665 -172651 723614 239 30 26 34 1.36
Chile 170764 -170764 738145 231 17 17 1.35
Colombia 168203 -168203 704184 239 22 21 11 1.33
South Africa 158907 -157887 790323 201 15 12 34 1.25
Czech Rep. 154248 -153496 617292 250 5 2 3 1.22
China 151263 -51742 674177 224 463 536 207 1.19
Algeria 147568 -147568 592443 249 11 8 1 1.16
Austria 112419 -103715 463177 243 -3 -8 -5 0.89
Pakistan 102769 -102769 468364 219 83 93 80 0.81
Dominican Rep 91741 -91741 435145 211 7 1 10 0.72
Ecuador 89911 -89911 384779 234 14 14 -15 0.71
Greece 87488 -71986 358964 244 14 12 15 0.69
Ireland 86975 -83862 357127 244 4 3 -19 0.69
Egypt 75228 -75228 400872 188 -17 -21 -40 0.59

42
Table XXXIII: World exports of soya meals in 2006
Trade Indicators
Exporters
Value exported in 2006, in USD
000
Trade balance in 2006 in USD
000
Quantity exported in 2006 in Tons
Unit value (USD/unit)
Annual growth in
value between
2002-2006, %
Annual growth in quantity between
2002-2006, %
Annual growth in
value between
2005-2006, %
Share in
world exports,
%
World 11390150 -1286663 56667110 201 8 6 1 100
Argentina 4357476 4357276 23941690 182 13 9 15 38.26
Brazil 2419188 2393757 12332350 196 3 0 -16 21.24
USA 1289212 1267008 5975584 216 1 -1 14 11.32
India 1001975 1001732 4601833 218 35 33 3 8.8
Netherlands 833990 179827 3429242 243 19 43 -8 7.32
Germany 322726 -384112 1343735 240 -1 -4 -9 2.83
Belgium 224069 -63910 876752 256 -7 -12 -2 1.97
Bolivia 211446 211446 1112987 190 0 1 4 1.86
Paraguay 134014 134014 782133 171 3 0 0 1.18
China 99521 -51742 381543 261 -14 -20 -34 0.87
Slovenia 64066 -8215 273180 235 706 512 8 0.56
Spain 50590 -781582 214195 236 21 16 0 0.44
UAE 50461 45625 188025 268 86 -33 0.44
Italy 45011 -509079 165591 272 -7 -11 3 0.4
Norway 39287 8537 160306 245 11 6 -4 0.34
Portugal 36637 9194 154822 237 -7 -10 75 0.32
France 31515 -914893 92155 342 -4 -11 51 0.28
UK 25335 -425808 87079 291 39 38 335 0.22
Canada 22605 -245274 112083 202 4 5 0 0.2
Denmark 21922 -350160 56324 389 16 7 15 0.19
Greece 15502 -71986 62726 247 6 3 -8 0.14
Latvia 9254 -8469 34016 272 189 0.08
Austria 8704 -103715 24543 355 -8 -28 -12 0.08
Hungary 7971 -174309 29966 266 97 98 30 0.07
British Virgin Islands 6157 6157 26036 236 -42 0.05
Taiwan 6118 -12336 10097 606 294 299 97 0.05
Croatia 5316 -34202 17303 307 -20 -25 188 0.05
Malaysia 5252 -197738 20052 262 -18 -22 5 0.05
Bosnia and Herzegovina 4120 -15013 13631 302 244 0.04
Turkey 3839 -48898 14014 274 -1 -5 -26 0.03

43
6. COTTON – NOT CARDED AND COMBED
The world market imported 8.6 million tons of raw cotton valued at USD 11.2 billion in 2006.
Annual average growth rate in value between 2002 and 2006 was 15% whereas growth rate in
terms of volume during the same period was 11% only. China is the major market for raw cotton
representing almost 43% of total world’s import. China has the highest annual average import
growth in terms of value that is 114 per cent. Other major importing markets are Turkey
(8.46%), Indonesia (5.53%), Thailand (5.08%), Mexico (4.37%), Pakistan (3.57%), and Taiwan
(2.87%) (Table XXXIII)
The USA is the largest supplier of raw cotton representing 41.5% in total supply. India is the
second largest supplier of cotton to the world market. India share in world export of cotton
recorded at 12.27% in 2006. Uzbekistan, Australia, Greece, and Brazil are the other major
suppliers of cotton (Table XXXIV).
Table XXXIII: World importers of cotton- not carded and combed in 2006
Trade Indicators
Importers Value
imported in 2006, in USD 000
Trade balance in 2006 in USD
000
Quantity imported in 2006 in
Tons
Unit value (USD/unit)
Annual growth in value between
2002-2006, %
Annual growth
in quantity between
2002-2006, %
Annual growth in value between 2005-2006,
%
Share in
world imports
, %
World 11216070 -366159 8580109 1307 15 11 16 100
China 4866554 -4842828 3641417 1336 114 105 53 43.39
Turkey 948341 -893810 737734 1285 18 10 4 8.46
Indonesia 619895 -616724 463205 1338 -4 -7 8 5.53
Thailand 569935 -569315 422042 1350 6 2 -7 5.08
Mexico 489639 -435860 388213 1261 1 -5 7 4.37
Pakistan 400439 -341788 351659 1139 8 15 -17 3.57
Taiwan 321590 -320346 263213 1222 0 -3 5 2.87
R.of Korea 298694 -298584 216268 1381 -5 -10 -16 2.66
Russian Fed 265650 -265269 295966 898 4 0 -1 2.37
Italy 213594 -201723 139504 1531 -12 -15 -17 1.9
Japan 196911 -196829 135574 1452 -6 -11 -12 1.76
India 141607 1189805 61299 2310 -17 -31 -9 1.26
Viet Nam 137920 -137809 119021 1159 39 74 50 1.23
Bangladesh 136400 -135677 110733 1232 0 24 -6 1.22
Egypt 123363 87673 102649 1202 53 38 30 1.1
Hong Kong 119266 -92446 100778 1183 7 0 41 1.06
Brazil 100550 237674 81583 1232 -3 -7 144 0.9
Germany 90106 -63750 62470 1442 -10 -16 -2 0.8
Portugal 84862 -83713 61536 1379 -13 -16 -2 0.76
Colombia 79426 -78137 61904 1283 -1 -6 66 0.71
Argentina 54448 -52584 44937 1212 7 1 129 0.49

44
South Africa 52126 -45180 44971 1159 -4 -6 -22 0.46
Peru 51042 -44147 37990 1344 1 -1 -21 0.46
Kazakhstan 50403 129156 50141 1005 715 88 0.45
Czech R 49362 -47523 35862 1376 -10 -14 -14 0.44
Morocco 47841 -47789 35465 1349 4 -1 16 0.43
France 47166 -38267 37010 1274 -15 -19 -20 0.42
Malaysia 44408 -43993 31470 1411 0 -8 -43 0.4
Canada 42960 -42923 33841 1269 -16 -14 -24 0.38
Belgium 39722 -25750 29481 1347 -9 -15 -19 0.35
Mauritius 34549 -34548 27223 1269 29 31 46 0.31
Poland 33051 -32694 21483 1538 -13 -18 -31 0.29
Free Zones 29845 -12651 24954 1196 26 22 42 0.27
El Salvador 29595 -29595 21580 1371 2 0 9 0.26
Philippines 28360 -27957 21870 1297 -7 -13 -23 0.25
Austria 26152 -23964 17739 1474 -6 -11 -21 0.23
Bulgaria 24060 -24031 17875 1346 4 0 2 0.21

45
Table XXXIV: World exporters of cotton- not carded and combed in 2006
Trade Indicators
Exporters
Value exported in 2006, in USD
000
Trade balance
in 2006 in USD 000
Quantity exported in 2006 in
Tons
Unit value (USD/unit)
Annual growth in value between
2002-2006, %
Annual growth
in quantity between
2002-2006, %
Annual growth in value between
2005-2006, %
Share in
world exports,
%
World 10849910 -366159 8652766 1254 17 24 12 100
USA 4502638 4488450 3508041 1284 19 235 15 41.5
India 1331412 1189805 1143863 1164 206 188 108 12.27
Uzbekistan 776976 776920 629176 1235 13 6 16 7.16
Australia 764312 764311 578110 1322 5 0 -1 7.04
Greece 398203 392383 332592 1197 12 8 22 3.67
Brazil 338224 237674 304504 1111 41 33 -25 3.12
Burkina Faso 259499 259499 196890 1318 34 45 10 2.39
Egypt 211036 87673 82964 2544 0 -6 -16 1.95
Mali 209702 208825 163307 1284 12 10 11 1.93
Syrian Arab Republic 184549 184549 138219 1335 2 -9 4 1.7
Kazakhstan 179559 129156 183796 977 14 9 10 1.65
Tajikistan 137926 137926 121821 1132 10 4 1 1.27
Benin 117605 117605 91381 1287 6 3 -29 1.08
Côte d'Ivoire 113046 112994 96402 1173 -19 1.04
Zimbabwe 109622 109588 84262 1301 8 1 -23 1.01
Cameroon 103742 103640 83292 1246 4 -1 -22 0.96
Spain 92937 83314 75357 1233 45 36 44 0.86
Turkmenistan 89034 89034 68650 1297 16 9 22 0.82
Chad 71693 71456 55143 1300 7 8 22 0.66
Sudan 71117 71117 54456 1306 5 -6 -31 0.66
Zambia 61705 58822 53294 1158 41 43 8 0.57
Pakistan 58651 -341788 53481 1097 4 6 -27 0.54
Turkey 54531 -893810 40279 1354 -3 -7 3 0.5
Mexico 53779 -435860 48943 1099 40 33 -4 0.5
Tanzania 45931 45931 46512 988 18 14 -33 0.42
Israel 42764 42438 30058 1423 12 0 0.39
Paraguay 41615 39760 38077 1093 6 -1 -48 0.38
Azerbaijan 39083 39061 44983 869 31 29 -3 0.36
Mozambique 36841 36841 25895 1423 45 48 96 0.34
Kyrgyzstan 35542 35155 45248 785 -5 -4 -11 0.33
Togo 34586 34557 26946 1284 -8 -13 -48 0.32
Hong Kong 26820 -92446 23226 1155 30 47 77 0.25
Nigeria 26510 26496 23453 1130 37 26 -3 0.24
Germany 26356 -63750 13441 1961 10 1 -17 0.24
Senegal 24440 24434 19400 1260 59 49 24 0.23
China 23726 -4842828 12956 1831 -49 -55 200 0.22