I~uI~ - apps.dtic.mil · I FOREWORD 1 IThis report is submitted to the Naval Air Development...
141
I~uI~ LEVEL t ITI DMBO MARTINEN MAAET )RLANDOd AEROSPA celae Dsr tionUliie 81S 12LEC8T FE85" ft,>
Transcript of I~uI~ - apps.dtic.mil · I FOREWORD 1 IThis report is submitted to the Naval Air Development...

I~uI~ LEVEL t
ITI
DMBO MARTINEN MAAET)RLANDOd AEROSPA celaeDsr tionUliie
81S 12LEC8TFE85" ft,>

I c~~' LEVEL Z
DTI
I .13
i~. Prepared for:Naval Air Development Center
In Response to!Contract N62269-80-C-
0 346
Data Requirement AO12
HELICOPTER NIGHT VISION SYSTEMSIMULATION EVALUATION pPrepared by:
PHASE III FINAL REPORT Mri ret oprto
Orlando AerospaceOR 1,55t DECOER 981Post Office Box 5837
OR 1,551 DECFOER 961Orlando, l'loridd 328559
Apvtoyod for Public release IDistribution UnlimitedJ

I FOREWORD 1
IThis report is submitted to the Naval Air Development Centers
* Warmninster, Pennsylvania, 18974, by Martin Marietta Corporation, OrlandoAerospace, in response to CDRL A012 of Contract N62269-80-C-0346.
I~c io o_wrSGT
ITc A
by----
Dit ISP&
ITI
C 5POT C isI K L,

1.0 Introduct~on CONTENTS:::: : I1.2 Scope ........ . . . . . ... . . . II...
*2.0 Simulation Hardware and Software Development . . . . . . . . . . 32. o k i
2.2 Aerodynamic and Flight Control Model . . . ...... 3I2.3 Controls and Displays . . . . . . . . # . . . . . . . . . . 3U2.4 Simulation . .. .. . .. . . . . . . . . 14
2.5 Systems Checkout . .. .. . . . . ... . . . 15
*3. Generaly Decription . . . . . . . . . . . .. . . . . . . . 17
* 3.2 Simulation Facility Limitations ......... . . . . . 18
*4.0 Experimental Design .. .. . ... . . . . . . . *.. .. . .21
44.2 Approach and Landing Synbology, valuation I ' .. . , 214.3 Approach and Landing FOV Evaluation. .. .. . ... ... 23
*4.4 Approanh and Landing PtD-H4D Evaluation .. .. . ..... 234.5 Enrouts PMD-HMD and CDU Evaluation .. .. . .. . . .. .. 234.6 Virtual HUD Evaluation .. ... . .. .... . ... .... 23I4.7 Side Studies .. ... . ... ... . ... .... . ... 25
5.0 Experimental Procedures. .. .. .... . ... ... . .... 27
5.1 Preliminary Briefings . . . . . . . . . .. .. ... 275.2 Training .. ..... . ................ 275.3 Data Collettion . .. .. .. .. .. .. .. . ., . 28
*U6.0 Pilot Performance Results . . . . . . . .. .. .. .. .. .31
6.1 Approach and Landing Symbology Evaluation . . . . .. 32z I 6.2 Approach and Landing FOY Evaluation .. .. . ..... .. 39
6.3 Approach and Landing PMD-HMD Evaluation . . . . . .. .. 546.4 Enroute PMD-HND-CDU Evaluation .. .. .. .. .. .. .626.5 Appvoach and Landing Virtual HUD Evaluation , . .,. 66
4t IS .,.64 I
-~A -A N 121M* -

6.6 Enroute Virtual HUD Evaluation .............. . . . .. 706.7 Summary . . . . .... . . . . . . .. . 726.8 Subject Pilots .7.. . . . . . . . . .. . 4 i
7.0 Pilot Opinion Results . . . . . . . . . . . . . . . ... 77
7.2 Approach and Landing Symbology valuation . . . . 737.3 Approach and Landing FOV Evaluation . . .. . . 887.4 Approach and Landing PMD-IOD Evaluation . . . .. 887.5 Enroute PMD-HMD-CDU Evaluation . .. . . . . . . 977.6 Approach and Landing Virtual HUD Evaluation # . • 103
7. Enrouts Virtual HUD Evaluation . . . .. . 1037.8 Side Studias . . . ..................... . . . 1,27.9 Modified Cooper-Harper Ratings ......... .. 1147.10 Sumuary . . . . . . . . . . . . . . . . . . . . . 114
8.0 Conclusion. . . . . . . . . . . . . . . . . . . . . . . . . . .. 119 ii9.0 Recommendations . .. . 123
9.1 Recoimended HNVS Configuration ............... 123 H9.2 Symbology . . . ..................... 1239.3 Controls and Displays .................... 1239.4 Crew Tasking . . . . . . . . . . . . . . . . 124
Appendix A GFE List . . . . . . . . . . . . . . . . . . . . .. 125
References . . . . . . . . . . . . . . . . . . . . . . . . . . . . . 127
Abbreviations . . . . . . . . . . . . . . . . . . . . . . . . . . . . 129
iijJ
,' vi
i
I
ILLUSTRATIONS
1-1 HNVS System Concept...... .... ... ... . . . . . 2
2-1 Cockpit on Motion Base . . . . . . . 4
i 2-2 Instrument Panel . . . 42-3 Center Console . . .. . . . . . . . . . . . . . .. . 5
2-4 HNVS Control Panel .. ........ ..... 5 2-5 IRDS Control Panel . . . . . . . 6
I 2-6 HIS Fail Panel . .............. . . 6
2-7 NAY/EADI Panel . . . . . . . . . . . . . . . . . 6
2-8 Cyclic Control. .... .... ... .... ... .... 7
2-9 Collective Control. ............. . . ....... 7
2-10 Flight Symbology Format ,. . . . . . . . . . . 9
2-11 Hover/Transition Symbology Format ... . .. .. 92-12 Window Box Symbology Format ., . . . ............ 10
I 2-13 Hover Meter Symbolmgy Format . . . . . ........... 10
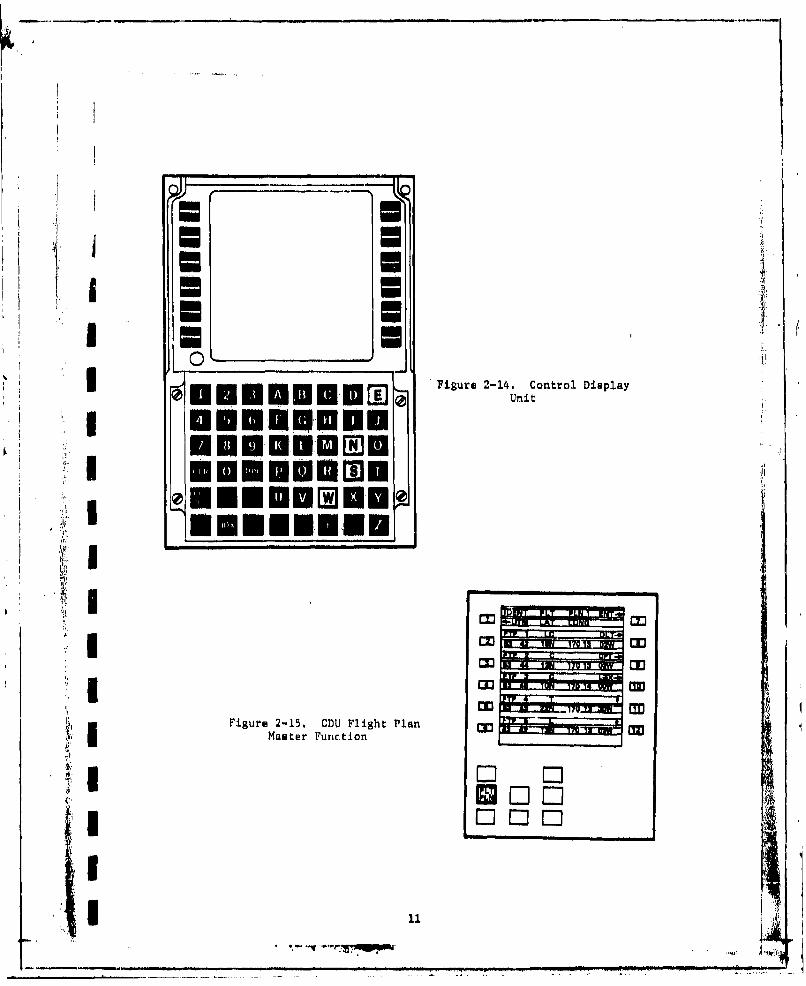
2-14 Control Display Unit . .... .............. 11I 2-15 CDU Flight Plan Master Function .............. 11 ,+
2-16 CDU Tactical Map Display . . . . . . . . . . . . . ...... 12
2-17 IHADSS System Diagram . ....... ... .. .. ... ..... 13'I i2-18 IHADSS Control Panel ...... .... ... . . . .. . . . 14
2-19 Terrain Model ............ .......... . . . 15
2-20 Unimproved Landing Zone ....... ....... ....... 15
2-21 Slightly Improved Landing Zone . . . . . . . ........ 16
2-22 Embassy Landing Zone . . . . . . . . . . . . ... .... 16
* 4-1 Experimental Matrix for Approach and Landing SymbologyEvaluation . . . . . . . . . . . . . . . . . . . . . . . . . . . 22
4-2 Experimental Matrix for Approach and Landing YOV Evaluation . , . 24
4-3 Experimental Matrix for Approach and Landing PMD-HMD Evaluation 244-4 Experimental Matrix for Approach and Landing PMD-MIH-CDU
iii
Evaluation .......................... 24
I vii
6-1 Pitch Angle during Landing Phase . .... . . . . ... . 37
6-2 Radar Altitude during Landing Phase ... . . . . . . . . 37
6-3 Groundspeed during Landing Phase . ..... ..... . .. 38
6-4 Mean Sensor Actuations Per Run . . . . . . , . . . , . .. . 40
6-5 Sensor Azimuth Gimbal Angle Distribution: Very Small LZ . . . 40
6-6 Sensor Azimuth Gimbal Angle Distribution: Small LZ . . ..... 41
6-7 Sensor Azimuth Gimbal Angle Distribution: Medium UZ . ..... 41 ]6-8 Sensor Asimuth Gimbal Angle Distribution: Large LZ . . .. ... 42
6-9 Sensor Elevation Gimbal Angle Distribution: Very Small 1Z, . . 42
6-10 Sensor Elevation Gimbal Angle Distribution: Small LZ , 43
6-11 Sensor Elevation Gimbal Angle Distribution: Medium LZ . . . . 44
6-12 Sensor Elevation Gimbal Angle Distribution: Large LZ . . . . . 44
6-13 Radar Altitude during Landing Phase by YOV Only .... 48
6-14 Radar Altitude during Landing Phase by LZ Only ...... . . . 48
6-15 Rate of Descent during Landing Phase by LZ Only . . . . . . . 49
6-16 Percentage of Torque Applied during Landing Phase by LZ Only . 51
6-17 Mean Number of Sensor Actuations per Run .. ....... ...... 53
6-18 Sensor Azimuth Gimbal Angle Distributions by YOV . .... .. . 55
6-19 Sensor Elevation Gimbal Angle Distributions by NOV . . . . . 56
6-20 Radar Altitude during Landing Phase .... ... . 60
6-21 Pitch Angle during Landing Phase: Small LZ ... . 60 16-22 Pitch Angle during Landing Phase: Large LZ . . . . ..... 61
6-23 PMD Sensor Elevation Gimbal Angle Distributions . . . . . . . . . 63 I6-24 PHD Sensor Azimuth Gimbal Angle Distributions . . . . . . . . . . 63
7-1 Ease of Actual Mission: All 240:1 Eva ,ations Combined . . . 84
7-2 Safety of Actual Mission: All 240:1 Evaluations Combined 84
7-3 Ease of Approach to LZ ... ......... 85 i7-4 Safety of Approach to LZ . . . . . . . . . .. 85
7-5 Ease of Landing ........ ...... . . ..... . 86
7-6 Safety of Landing . . . . .......... . . . . 86
7-7 Ease of Takeoff ........ ...... . . . 87
7-8 Safety of Takeoff ....... .... ...... .. 87
7-9 Ease of Approach to LZ ......... . 89
7-10 Safety of Approach to LZ .... .... . . ......... 89 1
viii
.. .

7-11 Ease of Landing. .. ... ........ ....... ..... 907-12 Safety of Landing... .. .. .... . . . . .. . .. 90
7-13 Bass of Takeoff. .. ........ .. .. .. .. .. .917-14 Safety of Takeoff .. .. ...... ........ ........ 91
*~I7-15 Safety of Approach to L .. ... ... . .a. .a.. . . a... 92
7-16 Ease of Approach to LZ . . . ... . .I. . . .. .. . .. 92
7-17 Base of Landing .......... .. .. .. .. . . 93
7-18 Safety of Landing. .. ,. , . . . . . .93
*7-19 Ease of Takeoff .. .. ........ . . . . . . . . . . . . . 94
7-20 Safety of Takeof f.. . ...... ........ 94
*7-21 East of Actual Mission at 60 to 80 Knots and 100 to 150Feat AL .. ...... .. .. a . . . . . . . . . . 98
*7-22 Safety of Actual Mission at;60 to 80 Knots and 100 to 150Feet AGL . . . . . . . . . . .. .. .. .. 98
7-23 Saoe of LZ Identification ...... . . . . . .a . . 99
7-24 Ease of Checkpoint Identification ... .. ....... ..... 99
7-25 Ease of Navigation .. .. .. ... . . . . . . . . . . 100
17-26 Eaof TerraFloingoiw g.., . . . . .10
7-28 Ease of Actual Mission at 60 to 80 Knots and 100 to 150Faet AL ... ....... ....... ... . . . ... .102
I ,~1-29 Task Ease with and without Coy~res Change .aa a....a a102
7-30 Ease of Approach to U a aaa*a 104
j7-31 Safety of Approach to 12 .. .... ........ ...... 104
7-32 Ease of Landing .. .. ..... a a a a a a. 105
7-33 Safety of Landing. .. ... ........ ....... ..... 1057-34 Ease of Takeoff .. .. . .. . . .. .. .. .. .. .. . . 106
7-35 Safety of Takeoff . . . a a a . . a .. .. .. .. .. 106
*7-36 Ease of Terrain Following .. .. .... . a.a. .. a a . 107
7-37 Base of Navigation .a a . aa . .. . a. . a a a . 1083 7-38 Ease of Checkpoint Identification . . a. a a. . . 108
7-39 Ease of LZ Identification . . a . a a a a a . . a a a . . . 109
U 7-40 Safety of Terrain volloving . . a a . . . 1097-41 Ease of Actual Mission at 60 to 80 Knots and 100 to 150
Peet AOL . .. .. .. .. .. .. .. ... . a. a., a 110
1 ±3

7-42 Safety of Actual Mission at 60 to 80 Knots and 100 to 150Foot A.GL . . . . .. , 110
7-43 Igoe of Actual Mimmian at 60 to 80 Knots and 100 to 150Feet AGL . . . . . .* . . . .. s.. .. .. .. .. .. .. 113
7-44 Task Base with and without Enroute Course Change . . . . . . . . 113
7-45 Modified Cooper-Harper Rating Scale . . . . .. .. .. .. .. 115 >
TI
x1
I
TAiLES
I 6-1 Pilot Performance Measuren for Approach and. LandingEvaluation (240:1 Scale) .............. . . .
n 6-!1 Pilot Performance Measures for Inroute Evaluationsi(1200:1 Scale) . . . . . . . . . . . . . .. . . . .. 32
6-I1 Pilot Performance In Symbology Evaluation Touchdown . . . . 33
6-IV Significant Symbology Evaluation Touchdown Data . . . . . . . 33 ,
6-V Symbology Evaluation Relative Rankings of TouchdownI Data . . . . . . . , . . . . . . . . 35
6-VT Criterion Values for Poor Landings and Crashes . . . . . . . 38
6-VII Pilot Performance in ,OV Evaluation Touchdown and 46Approach . . . . . . . . . . . . . . . . . .46
6-VtII Significant FOY Evaluation Touchdown Data . ......... 47
6-IX Relative Rankings of Significant FOV Touchdown Data , . , .47]I6-X Field of View Evaluation: Percentage of Total Data Route
Attempts That Resulted in Completed Runs and Landing* .... 51;; 6-X1I ~ x hcpit.. ... ............. . . . .. 55.6-Z Field of View Evaluation: Technical Poor Landings ..... 52S, " 6-XII Percentage of Time in Narrow rOV . . .. .. .... 52
6-XIII Field of View Evaluation: Sensor Seving Distance to thext Checkpoint . . . . . . . . ................. 55
6-XIV Pilot Performance in HMD-PMD %valuation: Touchdown andApproach . . . . . ...... .................. 56
* 6-XV HID-PMD Evaluation: Touchdown Performance Trends . . . 58
6-XVI HMD-PMD &valuation: Relative Rankings of Touchdown Trends. 58
6-XVII HMD-?MD Evaluation: Approach Performance Trends , 59
I- l 6-XVIII I4D, -PD Relative Rankings of Approach Trends , . . 594 6-XIX ND-PMD Evaluation. Average Altitude fnroute ...... 64
6-XX H4D-.PMD Evaluation: Average Groundspeed Enroute... ... 64
i 6-XX! Line Key, Errors during Route Changes ....... 67
x4
I
I Elk

6-XXII Master Punction Key Errors during Route Changs . ...... 67
6-XXII! Pilot Performance in Virtual HUD Evaluation: Touchdown andApproach . ... . . . . . . . . . . . . . . . . . . . 68
6-XXIV Virtual HUD Evaluation: Significant Touchdown and ApproachPerformance . . . . . . . . .. . . . . . . . . . . . . 69
6-XXV Virtual HUD Evaluation: Relative Rankings of TouchdownPerformance Data .. .. . .. . . . . . . . . . . . . 69
6-XXVI Virtual HUD Evaluation: Relative Rankings of ApproachPerformance Data ... .................. 69
6-XXVII Pilot Performance in Virtual HUD Evaluation: Inroute . . .. 71
6-XXVIII Virtual HUD Evaluation: Average Altitude Inroute . . . 71
6-XXIX Virtual HUD Evaluation: Average Groundepeed Enroute . . .. 71
6-XXX Master Function Key Errors during Route Changes ... .. 73
6-XXXI Line Key Errors during Route Changes . ........ . 73
6-XXXI Relative Rankings of Crews Based on Average Altitude(240-,1) . . . . . . . . . . . . . . . . . . . ... 75 I
6-XXXIII Relative Rankingsof Crews Based on Average Altitude(1200:1) . . . . . . . . . . . . . . . . . . . . . . . . . . 76 I
7-I Cockpit Instrument Lighting Groups . . . . . . . 80
7-I Recommended Task Allocations . . . . . . . . . . .. . 82
7-I1 Minimum Safe Altitude at 60 to 80 Knots and Maximum SafeSpeed at 50 to 100 Feet AGL . . . . . . . . . . . 96
7-IV Minimum Safe Altitude at 60 to 80 Knots and Maximum SafeSpeed at 100 to 150 Feet AGL ............. . . . . .101
7-V Minimum Safe Altitude at 60 to 80 Knots and Maximum SafeSpeed at 50 to 100 Feest AGL .... ................ .107
7-VI Minimum Safe Altitude at 60 to 80 Knots and Maximum SafeSpeed at 100 to 150 Feet AGL b. ....... ..... 111
7-VI Cooper-Harper Rating: Enroute FOV . . . . . . . . . . 116
7-VIZI Cooper-Harper Rating: Enroute Display/CDU . . . . . 116
7-IX Cooper-Harper Rating: Enroute Virtual HUD/CDU . . . ... 116
7-X Cooper-Harper Rating: Approach and Landing . . . . 116
I
xl1
iW

Ii
II
1.0 INTRODUCTION
The United States Marine Corps is presently developing and evaluatingdesign requirements for a Helicopter Night Vision System (HNVS) effort to;improve transport helicopter low-level night and reduced visibility capa-bilities. State of the art forward looking infrared (FLIR) systems make itpossible for transport helicopters to conduct missions under conditionsthat would normally preclude operations.
I The transport mission requires the transport helicopter to fly atextremely low altitudes at the highest speed possible. Pilots must also
* approach and land in unimproved landing zones. Personnel and equipmentmust be quickly off-loaded because the aircraft must depart to permit land-ing of the remainder of the formation. The mission must be accomplishedday and night and in adverse weather conditions.
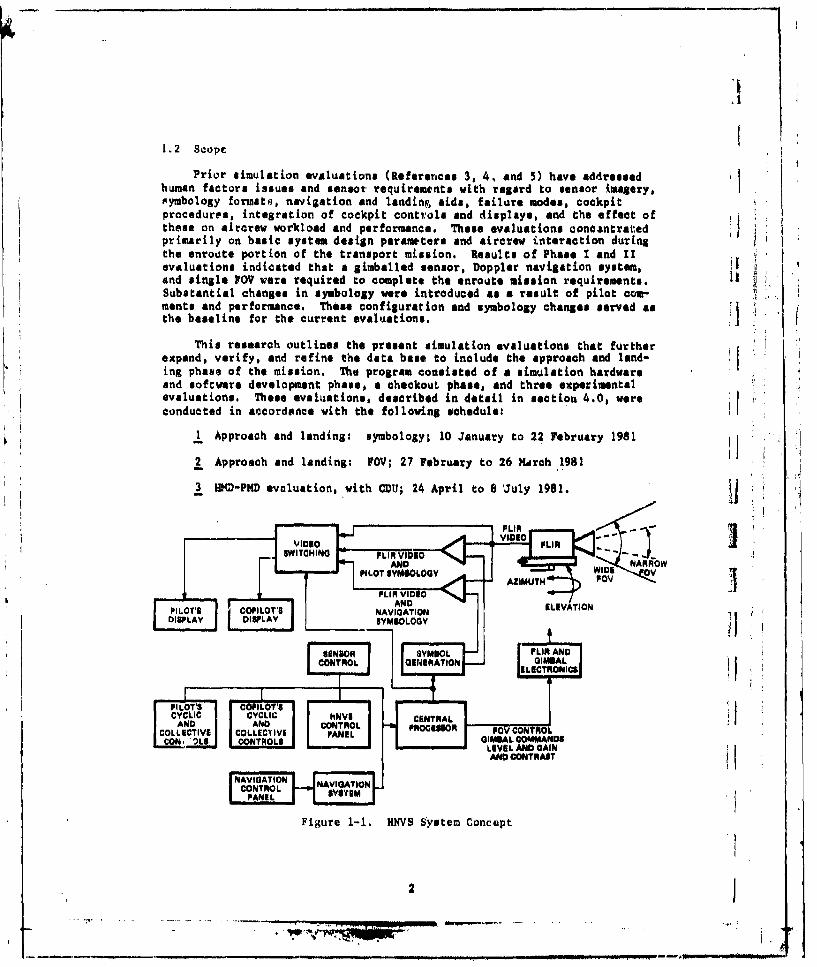
The HNVS concept, as shown in Figure 1-1, is centered on a FLIRmounted on the forward section of the assault helicopter. The FLIR imagery
* is provided at panel mounted displays (PMDs) or helmet mounted displaysI, (lIDs) for the pilot and copilot. The total system will be designed to
enable the mission to be performed safely with a minimal workload for thepilot and copilot. The FLIR will permit the pilot to operate under condi-tions of total darkness. Flight symbology is super-imposed on the FLIRI imagery to minimise the pilot's and copilot's scan patterns. In addition,support avionics such as a self-contained navigation system, radar alti-meter, aircraft transducers, central computer, and control panels are alsorequired.
Preliminary system analysis and definitLion was completed prior toinitiation of this simulation effort and was presented in OR-0930-AW,"Operational Requirements, Helicopter Night Vision Sybtems," dated 12 April
1977, and "Operational Effectiveness Analysis for the Helicopter Night* Vision System," dated 30 September 1978. Phases I and 11 of the CH-53
Night Vision System Simulation were completed, and thq results are reportedin References 3, 4, and 5.
1.1 objective
a The current evaluation, Phase III, was conducted in accordance withthe plans described in the HNVS Simulation Test Plan Task Report (Reference
" U 7). The objective of this evaluation was to conduct a simulation programto obtain human factors data relating to the conduct of low-level Marine
I transport helicopter operations using night vision sensors. These data areto be used as inputs for the design of a candidate HNVS and to formulate adata base for additional definition and verification of the HNVS concepti i through planned flight tests.
i IsI 1
A
1.2 Scope
Prior simulation evaluation* (References 3, 4, and 5) have addressedhuman factors issues and sensor requirements with regard to sensor (magery,mymbology formats, navigation end landin&~ aids, failure modes, cockpitprocedures, integration of cockpit controls and displays, and the effect ofthese on aircoew workload and performance. These evaluations coneantratedprimarily on basic system design parameters and aircrew interaction duringthe enroote portion of the transport mission. Results of Phase I and 11evaluations indicated that a gimballed sensor, Doppler navigation system, Iand single FOY were required to complete the enrolate mission requirements.Substantial changes in symbology werie introduced as a result of pilot comn-ments and performance. These configuration and symbology changes served asthe baseline for the current evaluations. i
This research outlines the present simulation evaluations that furtherexpand, verify, and refine the data base to include the approach and land-ing phase of the mission. The program consisted of a simulation hardwareand software development phase, a checkout phase, and throe experimentalevaluations, These evaluations, described in datail in section 4.0, were
K conducted in accordsoce with the following schedule:
1Approach and landingi symbology; 10 January to 22 February 1981
2Approach and landing: FOV; 27 February to 26 MArch 1981
3 HKD-PMD evaluation, with CDI;; 24 April to 8 'July 1981.
AZIMUTH FO
PILOT'S rCOPILOT'S NAVIGATION[LVTODISPLAY DISPLAYS SYMBOLOGY
PIOS CPLOT'SCYCLIC YCI N5CENTRALION' P ') ONRL I ) I
Figur P-ROCHN SSOte CoCTRO
2 JCIVCO, )S GIBA COMAND

2.0 SIMULATION HARDWARE AND SOFTWARE DEVELOPMENT
A number of developments in simulation hardware and software wererequired to accomodate the evaluation requirements. Each of the develop-ments is discussed separately below.2.1 Cockpit
The C1I-53D cockpit constructed under contrtct W62269-79-0-0317 wasused for this simulation. The complete Government furnished equipment(GTE) list is shown in Appendix A. The exterior view of the cockpit isshown in Figure 2-1, which depicts the mounting of the cockpit on the six-degree-of-freedom motion base. The instrument panel, shown in Figure 2-2,was configured in accordance with NADC drawing T821733-3. 71he cockpitlighting is in accordance with MADO cockpit lighting m mo of 28 August1980. The center console wes configured as shown in Figure 2-3. A helmetmounted display and sight system, described in section 2.3.4, was installedin the cockpit. Additional cockpit wiring was installed to accomodate thenew cockpit configuration.
2.2 Aerodynamic and Flight Control Model
The special purpose rotorcraft pimulator (SPURS) is a full force andmoment simulation of the CR-53D helicopter valid over the speed range from
approximetely 30 knots rearward flight to forward airspeeds in excess of160 knots. The automatic flight control system (AFCS) is modelled onanalog computers and contains the stability augmentation system (SAB) andouter loop attitude and heading hold modes.
2.3 Controls and Displays
2.3.1 Controls
Significant changes from the Phase I and II cockpit configuration were
made in the center console control functions. The HMVS and Infrared Detec-tion System (IRDS) control panels available during Phase It were replacedwith new units. A Helicopter Integration System (HIS) Fail panel and twoNavigation/tlectronic Attitude Director Indicator (NAV/NADI) panels wereadded. These new panels are presented in Figures 2-4 through 2-7 and inthe center console (Figure 2-3). The cyclic end collective controls areidentical for pilot and copilot operation and are shown in Figures 2-8 and
2-9. All switch functions are as labeled on these drawings and theirinteraction in the simtlator was specified in the NADC document (Reference1) ea-ept for the "Rover Position" switch on the cyclic stick grip (Figure2-6 . This svitch is used to enable and update the hover position symbol(number 14A in Figure 2-11).
+.3

Figure 2-1. Cockpit an M4otion bassI
AL
Fiue22 nsrmn ae
4H

y:
HIS PAIL RADAR BRACON
NAV/1ADIICONTROL SIMULATIONCOPILOT CONTROL N~Mb
PILOTf
INDCONTROL IMoADI F
Figure 2-3. center Console COrNTA01 APS
-CONTROL PMNRO
JI
44
j LOVL HNVSABRS
ire 2-, S C/CrlPae
'Al r 4NW.V

SENIOR,. OV
RMIlNTER ILICT
SLEW081EMAP L CONTROL
0 0iP INTO
MARKIR
0 0. IKFigure 2-5. IRDS Control Panel
NAV FAIL M-
FiRure 2-6. HIS Fail Panel
I
-NAVEAD CONTROLNA V/STERING .- ,4
rmOOI-j O
UMON
VIDO OPIV AT SMLL
Figure 2-7. NAVEADI Panel
'7-

SYMBOLOGY s6PRTII ~ ~~MODE $111LECT &PRTI
1ZERO FORCE 14 VailCYCLIC TRIM POSITION
I Figure 2-8. Cyclic Control
SELECT
ILE
UU
SPOTLIGHT1 IRD)SELICT i HYDRAULICL-J&.Jj CONTROL
RICINTIRCOLLICTIVE TRIM
IFigure 2-9. Collective Control

2.3.2 Sumbology
The symbol generator for the Electronic Attitude Director Indicator(EAD!) provided the primary source of flight and sensor data presented tothe pilot on the PMDs. The NAD! provided the aircrew with piloting infor-mation as w61l as sensor data. Independently controlled PMDo were providedfor the pilot and copilot. Mode control for these displays was provided bythe pilot and copilot NAV/1AD! control units. The interface requirementsfor the symbol generator software and related NADI display parameters werespecified in Reference 1.J
Figures 2-10 throgh 2-13 show ymbology formats on tha pilot and
copilot PMI),
2.3.3 Control Display Unit (CDU)
The CDU (Figure 2-14) used in the simulation was the primary man-machine interface for navigation initialisatLon and mode control. The CDUconsists of a CR? display, master function switches, line keys, and analphanumeric keyset, The CDU enabled the copilot to view either the ii 2results of alphanumeric functional inputs or a tactical plot showing fly-
to-point data, reference points, and aircraft position along a projectedcourse. The flight plan, as shown in Figure 2-15, contains two pages offive fly-to-points (FTPa) each and one page of reference points. The linekeys of the flight plan inelude functions to capture and delete an FTP orlanding sone, entry of new points, or designation of a new landing zone.The CDU tactical map (Figure 2-16) is configured according to the FTP andreference point coordinates in the flight plan file. The display scalerange can be decreased or increased by the operator. A helicopter symbolmarks the helicopter position and travels from point to point with refer-ence to the flight corridors. The display of the direct-to navigationfunction is similar to the flight-plan (Figure 2-15) with the message"DIRICT TO" on the bottom of the screen. This function provides guidancewhen deviating from the preprogramed flight plan.
2.3.4 Helmet Mounted Display (HMiD) 1
A I141 system was installed in the cockpit. The Integrated Helmet andDisplay Sight System (IHADSBI) is shown in Figure 2-17, The sight deter-mi{ned the pointing directions of the pilot line of eight (LOS), and the W'tDprovided the pilot and copilot with the collimated video displays. The
IPADSS wan used to slave the HNV8 sensor to the pilot LOS and display theHNVS imagery to both pilot and copilot H11D*. Figure 2-18 shows the IHADS1control panel.
To provide the pilot with teeded aircraft reference during sensor Ioperation using the 1H11, the sensor pointing symbol represented the nose ofthe aircraft r'elLi vi to the pilot's LOS. This was used only on the HMDand thm wymbul moved relative to the pilot's head movements. Remainingsymbology, from that available on the PMDs, was unchanged.
l I,e l ! i i l !I ! l i ii l l l l i l l ) ) . . .. . r~ iN ... *1 : :

k00
I
r 6.0 3 3 -
06 0
YIMBOL NAME S1 1AINC1RAP SYMBOLAl2 I4ORIZON/PITCH BARI
43 MADAN ALTITUDE (ANALOG) 2'?'4 RADAR ALTITUDE (DIGITALI
I OROUNOSPSEDAIEED is
9 AIRICRAFT HEADING
'10 NAVIGAT'ION STEERING I11ALTITUDE REFER~ENCE BAIRL
13 VERTICAL SPEED ..UW.As 015 TIME TOO 00' NO
15 CORRIDOR SAFI-
* Figure 2-10. Flight Symbology Format
SYMBOL NAME I
* I AIRCRAFTESYMBOL2 H4ORIZON BARNE3 RADAR ALTITUDE (ANALOG)4 MADAM ALTITUDE (DIGITAL)
TORQUE\vI GROUNDSPEEO/AIRSPE1I00 AIRCRAFT H4EADING-10 NAVIGAT ION STINING
IDISTANCE TO 00OU 12 POSIT IONUBONK113 VERTICAL SPEED
Is TIME TO GO ~wpIs AIRSPEED INDICATION 00 'V" 1 POINT OP INTER EST E <.S , 0
IS HOVER VELOCITY ell,''41S HOVER ACCELERATION )
I :Figure 2-11. Hover/Tranaition Sywnbology Povrmat
. ,...

T 6003 "0'0 L---.~ P W
SVMSOL NAME
I AIRCRAFT SYMBOLHORIZON/PITCH SAI
3 RADAR ALTITUDE 1ANALOG) 34 RADAR ALTITUDE IDIGITAL)0 VELOCITY VICgTOR 8 D* IR BENSOR7 T O I! U E I-
oGROUNDSPEDIAIRSPEED ,* AIRCRAFT HEADING10 NAVIGATION STEERING
is NAVTOLAND WINDOW
!10 DIITANCETOG .1. -,
15 VERTICAL SPID , 41I TIME TO GO 0 aI6 AIMSPEED INDICATION I d417 POINT OF INTERESTIS WINDOW BOXREERENCE s L
Figure 2-12. Window Box Symbology Format fl
00,1 -® 203= ,
' IYM1OI. NAME
I AIRCRAFT SYMBOL %. 2 32 RADAM ALTITUDE (ANALOGI I
4 RADAR ALTITUDE IDIGITAL) @" {
I SENSORI 0"OUNDSPEED/ARSPIRD i1 AIRCRAFT HIADING (10 NAVIGATION ITIEING11 DISTANCE TO 00 f.13 VERTICAL SPEED %1S TIME TO GO1S AIRSPEED INDICATION17 POINT OF INTEREST 011 HOVER DRIP IF?13 HOVER VELOCITY
Flgure 2-13. Hover Mater Symbology Format
10
Unit
* UWNI
0, nl uuLu
*m U- -
I nU u____ u
Figure 2g15. 2L4 Clntrt Diplny
I ,EIu , "",T,
* inum.-.u...uIai9..in
Masnter Fun~ction
I EULOUl1

.12
ST-~

I''I
II
*1 AlI _ 'liiiI
iiI.
I* IImm
I
I
V.-~ iI~ : U! p4 .4
I
I~dI III
~ II-
1 '3

IHADSS CONTROLCOPILOT PILOT
VID TINT, ,SR5I
!AB BRU VMIS
IYM IRT DIM T Sym URT
t-LOGIC--, r.-M - II
COP LOT CO PILOT gnu IMAMBilT/*r BT Comm iBITITIIST ON ON
8lL
Figure 2-18, IHADSS Control Panel 22.4 Simulation
All simulation work was performed at the Simulation and Test Labora-tory (STL) Man-in-the-Loop facility. This facility is fully described in"Final Cockpit and Software Preparation Task Report," OR 15,647-2, datedMarch 1981 (Reference 2).
The terrain model, as shown in Figure 2-19, was modified with remov-able overlays to facilitate the approach and landing studies. Definitivelanding zones and appropriate enroute sections of the terrain board werereconfigured from a 1200i1 to a,240i1 scaling factor to provide for lowerflight levels, sensor usage data, and precise maneuvering capability inconfined landing areas. This improvement allowed realistic visual presen-tations down to approximately 25 feet above ground level. The highlydetailed scale required a higher pilot workload to precisely maneuver theaircraft than has been experienced in previous simulations. This higherworkload was experienced in the pilot's requirement for increased attentionto piloting tasks. The confined landing cones required exact pilotingmaneuvers to land on the prebriefed touchdown point. The additional real-ism forced the subject pilots to increase their airspeed attention as com-pared to previous simulations.
14
mm mm wm~w N. -.... . .

The landing sones shown in Figures 2-20 through 2-22 represented anunimproved landing area, a slightly improved area, and an embassy compound.Additionsl landing areas included open fields and mall forest clearings atthe 2401 scale.
2.5 Systems Checkout
The systems checkout activity validated the simulation. Test pilotsfrom the Niaval Air Test Center flev simulated miseions and evaluated simu-lator operation and fidality. This checkout served as inputs for simula-1 1 tion modifications.
I1.
I Figure 2-19. Terrain Model
Figure 2-20. Unimproved Landing Zone
15
Il

Itmure 2-21. Slightly Improved Landing Zone
Figure 2-22. Embaamy Landing Zone,
16

1..
3.0 FACILITY DESCRIPTION
3.1 General Description
The Man-in-.the-Loop simulation system facility supported the CH-53D
1 Hybrid computing system
1 2 Motion base system
3 Translational system optical probeI -
4 Television system
Programmable display generator (PDG)
;untrol loading system.
3.1.1 Hybrid Computing System
The simulation was controlled by a hybrid computing system, consisting
of two Sigma 5 digital computers, three EA1 231-RV analog computers and
appropriate instrumentation, and interface and peripheral equipment. Thecomputer arrangement controlled the aerodynamics, processed position com-
S I minds to the sensor probe end TV, handled operational mode logic and* switching functions, generated commands to position symbology on the visual
displays, and stored performance data.
The simulation program used the SPURS developed by Paragon Pacific,Inc. This unit was designed to model, helicopter aerodynamics and was con-
figured to simulate a CH-53D aircraft. The pilot's controls were input to
i a primary flight control model and augmented with SAS and AFCS models.
nTese were input as the swash plate commands for the main rotor, the col-
lective pitch of the tail rotor, and engine controls.
3.1.2 Motion Base System
The motion base system provided a means to move the cockpit in six
i degrees of freedom as commanded by the pilot-actuated flight controls. It,
in turn, provided acceleration cues to the pilot as the aircraft was flown.The motion base drive equations were modelled on two analog computers.
17
*.l "IWI'l

3.1.3 Tranelational and Optical Probe Systems
The three-dimensional terrain model and its motion relative to the Foptical probe system provided the pilot with visual translational cues via.cockpit displays. The model was moved along a rail system perpendicular toand under a vertically actuated beam providing the longitudinal and verti- flcal movement of the aircraft. A carriage supporting the optical probe wasmoved across the beam to provide the lateral aircraft movement. The opti-cal probe, in turn, provided the three angular degrees of freedom of air-craft movement. The translations, velocities, and accelerations werescaled according to the terrain model scale of 1200:1 with a minim. scaledaltitude of approximately 125 feet or 240:1 with a minimum scaled altitudeof approximately 25 feet.
3.1.4 Television System
A 525 line high resolution, monochrome camera system was used with theoptical probe to provide the pilot with a view of the terrain aS the air-craft was controlled. It provided two FOVs, 50 and 25 degrees. lhite hotIR imagery was generated by reversal of the normal video signal.
3.1.5 Programmable Display Generator (PD)
A PDG was used to generate symbology for the cockpit displays. The
were then mixed with the 525 line television signal containing the scenevideo. The symbology was available in either a white or black format, andthe intensity was controlled from the cockpit. The PDG was interfaced to,and controlled by, the Sigma 5 digital computer for dynamic movement of thesymbology as the pilot commanded the aircraft.
3.1,6 Control Loading System
The conttnl loading system reproduced the pilot's flight control
forces ior the simulator cyclic stick and pedals. This system was a three-axis unit providing pitch and roll cyclic stick and rudder pedal forces.The trim system permitted either beeper trim or trim release from thecyclic controls. The pedals were outfitted with pedal switches for inter-action with an AFCS heading hold function.
3.2 Simulation Facility Limitations IiThe simulation facility visual perception attitude limitation of
approximately 125 feet at the 1200:1 scaling factor was improved after com-pletion of the Phase IT experiment. This 1200:1 scaling factor providedmountainous terrain to traverse during Phase I data runs and was adequatefor fast moving, higher flying, fixed wing simulations. At slower heli-copter speeds and at much lower altitudes, however, the 1200:1 scale factorprovided less detailed terrain relief and less obstacle avoidance feedbackrequirements because of the heavily concentrated forested areas than would
11

be expected in a real world mountainous and forested contour flight envi-ronment, This visual perception altitude limitation was improved by remap-
I in the terrain model surface and incorporating enroute highly detailed240: 1 model overlays and landing zones. This scaling factor was designedspecifically for helicopter simulations and provides a realistic, imw alti-tuds, highly detailed flying environment. The visual perception altAtudelimitation was reduced to approximately 25 feet above ground level (AGOL),the heavily concentrated forested areas were replaced with strategicallyplaeced individually detailed trees (averaging approximately 80 feet in;height$, and high workload, realistic landing zones were developed,
I
I ,
I "
i l
I
| 19

1~
i}
iiI,, 11~
ft I- . 1!
F'I- . '. U] }*
INh
11
BLANK PAGE20
A> Ji~AtI/\%~zi~:, ~ A
* in sAl4

4.0 EXPERIMENTAL DESIGN
4.1 Introduction
Prior simulations addressed basic system configuration issues. In thePhase I evaluation, it Was determined that a self-contained (Doppler) navi-gation system was a requirement for the mission, and several refinements
were made in display symbology (References 3 and 5). In the Phase I oval-uation, recommendations were made regarding the need for a $imballed sensorand a aingle FOV (References 4 and 5). Other recommendations were madewith regard to symbology changes, display changes, and crew training
adjustments. These findings are reported in detail in the final reportI (Reference 5).
The simulation data conditions required the person sitting in the
right seat of the cockpit to always bn the pilot in control of flying theaircraft. The person in the left seat was always the copilot/navigator.In discussions of the procedures and research results, this condition mustbe considered. All of the participants were operational Fleet Marinepilots, but crews were comprised of designated pilot and copilots with allparticipants having equal participation in both roles,
4.2 Approach and Landing Symbology Evaluation
To determine the effects of symbology on crew performance duringapproach and landing, four symbol sets were used. The flight symbology setdeveloped during Phases I and I1 and modified for the flight test aircraftwas used ts a baseline symbology format; the hover/transition symbology(hover) set including hover veloco.ty vector and acceleration cue; the win-dow box symbology set; and a cross hair symbology (hover meter) set simi-lar, except for sensing reversal, to current hover indicators used onDoppler-configured Navy helicopters. These symbology sets are shown inFigures 2-10 through 2-13 in section 2.3.2. Each symbology set was eval-usted in landing zones with four levels of difficulty based on cone dia-meter. The largest landing sone (level 4) equalled 4.5 rotor diameters ormore, the level three none was 3.5 to 4.4 diameters, level two was 2.5 to3.4 diameters, and the smallest landing sone (level 1) was 2 to 2.4 dla-meters. The evaluation consisted of a 4 by 4 study or 16 treatment combi-nations. To reduce variance and increase sensitivity, a repeated measuresdesign was used. Variables were examined with 12 Fleet Marine pilots assubjects.
A Greco Latin Square design allowed order effects to be evenly dis-tributed across all subjects and treatments. Treatment combinationsresulted from the data matrix in Figure 4-1.
2| 21

k1
LANDING ZONE SIZE (DIFFICULTY LEVEL)1 4
FLIGHT
HOVER
SYMBOLOGY SET--[
WINDOW BOX
HOVER METER
Figure 4-1. Experimental Matrix for Approach and Landing
Symbology Evaluation
22

4.3 Approach and Landing Field of View Evaluation
I Three treatment FOV conditions were used to determine their effect onperformance during approaches and landings. The FOV treatments were: wide
tI (50 degrees), narrow (25 degrees), and duel (50 degrees and 25 degreesunder pilot control). Each POV was evaluated in landing mOnes with the
same four difficulty levels. The symbology set found moat effective in thesymbolo y evaluation was used throughout this portion of the study. Theevaluatlon required a 3 by 4 study or 12 treatment combinatios. Again, aSmpeated measures design wa, used. Eight Pleet Marine pilots were used inthis evaluation. The data matrix for the JOV evaluation is shown in Figure ;,
4-2.
4.4 Approach and Landing PMD-HMD Evaluation
1 To determine the effects of display combinations on crew performanceI during approach and landing, three treatment conditions were tested: pilot
and copilot using PIM, pilot Using an H14D and copilot using PHD, and pilot
Sand copilot using HMDs. each combination was evaluated in landing sonesI. with two difficulty levels. The lerge sone was 3.5 rotor diameters (dif- 4.
ficulty level 2) or more and the small landing zone was 3.4 rotor dia-meters or loss (difficulty level 1). The evaluation required a 3 by 2study or 6 treatment conditions. Twelve Fleet Morine pilots participatedin this phase.
3 The data matrix for this evaluation is shown in Figure 4-3. Again,; treatment combinations were counterbalanced through a Greco Latin Square.
4.5 Envoute PHM-IDfD and CDU Evaluation !t
The enrouts evaluation was conducted at the 1200:1 scale in an effortto determine the effects of display combinations on performance during lowlevel flight on longer routes requiring substantial navigation workload. j
K An enroute course change was added as a variable to examine the difficultyof inserting a change in the route midway in a mission. Two route changes
I were included (hard: mountainous terrain; and easy: flat terrain). Thisevaluation required a 3 by 2 by 2 study, and Figure 4-4 contains the datamatrix. The 12 pilots used in the approach and landing MMD/PMD evaluationparticipated in this evaluation. Rendom conditions were used such that
I pilots could not predict course changes. Order effects were controlledit through use of a Greco Latin Square.
3 4.6 Virtual Head Up Display (HUD) Evaluation
It was anticipated that copilots might find It objectionable or bsoomedisoriented with the HMD continually presenting the sensor imagery as thecopilot scanned instruments inside the cockpit. Consequently, a virtualHUD presentation was included. As the copilot turned his helmet away from
30 by 40 inch window located straight ahead, the image moved off of theHMD as if he were looking at a stationar HUD. The experimental desianswere idintcal to those in sections 4,47(pproach and landing) and 4.5(unroute) with the treatmvent conditions being pilot MD and copilot PHD,
I pilot HMD and copilot lHD, and pilot HOKD and copilot MMD with virtual MUD.This evaluation used four Fleet Marine pilots.
* 23
,, 0

LANDING ZONE SIZE (DIFFICULTY LEVEL)
3L 4
NARROW
11110DO11 ViEW WIDE
,' TR A MINT$
DUAL-
Figure 4-2. Experimental Matrix for Approachand Landing FOV Evaluation
LANDING ZONE SiS101IPPICULTY LEVIL)
PMD-PM0
Figure 4-3. Experimental MatrixCONFIGURATION HMDPM for Approach and Landing PMD-HKD~Evaluation
HMP.NMO
RlOUTE
PtmD.PMD
DISPLAY HMD.PMDCONPIGURATiON
NMDHMO
OUTE NO ROUTECHANGE CHANGE
Figure 4-4, Experimental Matrix for Approach and
Landing PMD-HMD-CDU Evaluation
24'I . . . , !'I,.,. . . . . .

4.7 Side Studies
Time permitted examination of several HNVS issues in addition to theprimary research. These studies did not warrant full scale factorialtreatment.
4.7.1 Radar Altitude Analog Scale
Several pilots in the previous phase had indicated a desire forchanges in the radar altitude analog scale and digital readout at low alti-tudes, The purpose of this study was to determine the usefulness of remov-ing the analog scale while using the hover symbology, and moving the digi-tal readout to the midsection of the right hand side of the displa. Thedigital readout was in unit@ of I foot below 25 feet. Four Fleet arinepilots evaluated these changes.
4.7.2 Landing without Simulated Crew Chief
On actual operational missions, especially night landings, pilots are
assisted by their crew chief in positioning the aircraft in the landingsone. Crew chiefs verbally advise the pilot to move forward, backward,left, and right until rotors and tail are clear of obstructions and landingmay be safely completed. In the approach and landing studies, the experi-menter used a separate display to determine aircraft position in the land-in& zone. With this information, the experimenter was able to provide theubject pilots with the same verbal cues as those available from crewheafs in an actual mission.
It was theorized that the simulated crew chief would reduce pilot~I reliance on symbology during landing. Therefore, pilots were fouced to
land in the smaller landing sone without the aid of the simulated crew.. chief, using only the gimballed sensor and symbolic information. These' ilandings were observed to define the extent of sensor feedback given andU- the effects of symbology on landing. Four Fleet Marine pilots were used in
this evaluation.
i 4.7.3 Symbology Attitude Sized to the 50 Degree Field of View Imagery
The purpose of this study was to determine what effects, if any, si-ing the symbolic horizon and pitch ladders to the wide FOV would have onpilot ability to perform the mission scenario. The pitch ladders repre-sented 5 degrees and 10 degrees, and the horizon indicator was pliced on
V I the infinity horison of the image. Again, four Fleet Marine pilots parti-cipated.
1 4.7.4 Partial Ground Stabilised Sensor versus Aircraft Stabilised Sensor
It was theorized that stabilising the sensor relative to the groundwould reduce crew disorientation, especially during the final landing:*approach. The sensor for the ground stabilized mode was decoupled in
U 25.? .. ....

pitch but remained with the aircraft in roll and yaw. The pilot or copilotcould command the sensor mode when the sensor was at the desired pitchangel by depressing the atabilisation switch on the HNVS control panel(Figure 2-4). Four Fleet Marine pilote were used in this study.
*- I
[1
, 4II '
i ii
II
26.

5.0 EXPERIM1ENTAL PROCEDURES
5.1 Frelinina.y Briefin&u
PiLots vare jivau an STW orientation, a system briefing, and an'aulties * iiforvrAticn, simulation background, and ex~perimental procedures
;j ~ and roqu1.ermnts. Addit tenrl inforinAtioii included cockpit coutrol, func-tionm and synnbolo~y defini-tions dnd uses., Aft tr the briefings,-pilotsI re~oived a fdcilities tour and handi-on instruccion.-In the cockpit regard-ing controls and symbology,
Th3 5.2 r:4~,i pilotma ware required t aio aeaVroq ttyo
* highly. tmohilical inform~ation.' Tboe training yas deeligned so: that the pilotsobttiinad information in su 11ll amounte and were then allowed ,to practicethi's infoe'mation until, they obtairted. 0 foutidation t6 faciilitat. further
*learning. Preliminary training progressed in this manner until a1l necea-s~ry iinformation tiad been briefed and practiced.
5.2.1 Controls and Oymbolog ~
U The conference r'ooni briefing included a handout of the control loa-tions and functions plus symbology descriptions and functions. Pilot
* ground school was provided to facilitate learning prior to the cockpit* familiarization phase. The hands-on cockpit familiarization allowed time
to go over the handoutu with the actual instrumentation. Each pilot wasgiven anproxinately 20 minutes to manipulate the control, and see theappropriate symbology fuinctions.
5.2.2 Integrated Helmet and Display Sight System (IHADSS)
I Ground school for the IHADSS included a description of the background,purpose, system configuration, and boresight method. This description was
* given after the STL tour and cockpit familiariaationr Pilots war^ giveninstructions on how to bao'esight the IHADSS and cautions regarding handlingthe HDU.
*A representative from Honeywell fit each pilot with helmet liners. A~, Iproperly fitting helmet is essential to the IOID, and this was accomplished
prior to flight training. The experlisentor assisted each pilot on Liitia-Ilization of the system prior to the first flight.
27

5.2.3 Control and Display Unit (CDU)
Pilots were given general CDU information as well as a step-by-stepprocedure for enrouto course changes when applicable. The direct-to (DIR)master function key was described in detail and pilots reviewed the proce-dures handout prior to the first initialization. The CDU functions aredescribed in section 2.3.3.
5.2.4 Flight Training
In all evaluations, pilots were given training routes to fly whichused sections of the terrain model not used during data acquisition. Thisminimized memorisation of terrain features in areas of date flights. The Ipilot groups progressed through fixed and motion-base familiarizationflights and finally to training flight configurations which mirrored thedata acquisition procedures. All experimental conditions in each evalue- 11tion were counterbalanced throughout the training sessions to prevent sepa-rate learning curves. Pilot learning was closely monitored to ensuretrainee understanding.
The pilots reached a point in training when they stopped learning con-trol functions, simulator operation, mission requirements, definitions ofsymbology, and other characteristics of the system. At this point theirlearning curve began to level off and performance improvements were a func-tion of practice rather than additional learning. Crash rates due toerratic flight and misunderstanding of symbology and controls decreased,and flight altitudes and speeds became consistent. Touchdown information |on drift and time also indicated improved performance. When all pilots inthe group approached their learning asymptote, as evidenced in their per-formance, data collection commenced. This judgement was made by theexperimenter and test conductor.
5.3 Data Collection
5.3.1 Briefings
Before each session of runs, pilots were briefed on the missionscenarios, Pilots were given area terrain maps in the order they were tofly them. The maps indicated routes with the checkpoints and landing zonesidentified. Additionally, 8 by LO inch black and white reconnaissancephotos of the landing zones with the inbound and outbound headings depictedwere provided. Pilots were given time to study the routes prior toflight.
5.3.2 Procedures
The approach and landing studios emphasized the terminal phase of themission and used the 240:il scale. Each data run began 2 to 3 rnt from thelanding zone. Pilots were Instructed to remain below 100 feet above groundlevel (AGL) 90 percent of the time and fly at the fastest forward safespeed. They navigated using two checkpoints, made an approach and landedat the prebriefed location, lifted off and departed on an outbound heading.The simulated crew chief assisted in the landing phase only after a pilotverbal request and within 0.1 nmii from the landing point.
28
. .. ... . ... . .. .... ... . . ... " - . . . .... .. .. ... ... .. . . ...

The enroute studies emphasized the navigation phase of the mission andused the 1200:1 scale. Each data run began approximately 15 nmi from thelanding zone. Instructions were the same as in the approach and landingstudies regarding staying below 100 feet AGL 90 percent of the time at thefastest safe speed, Pilots navigated using three checkpoints, made anapproach and hovered over the designated landing point, and departed on anoutbound heading. On preaselected date runs, pilots were instructed (with-out warning) to divert to an alternate route.
'I 5.3.3 Debriefings
The pilots participated in informal defriefing sessions at the con-clusion of data run sets and completed extensive debrief questionnairesupon conclusion of the data sessions for all evaluations. The informal
j debriefing sessions and questionnaires were designed to obtain subjectiveinformation from the participants on relevant HNVS issues.
I29
Ii
I . 1

BLANK PAGE30

6.0 PILOT PERFORMACE RESULTS
The crew performance measures are showi in Table 6-1 for approach andlanding and Table 6-11 for the enroute phase. The approach and landingphase to concerned with the terminal portion of the mission and the enroiatophase with navigation performance. The data discussed io this section
refers to the performance measures established in those tables.
TABLE 6-1
Pilot Performance Measures for Approach and* Landing Evaluation (240:1 Scale)
UMEASURE INDEX
ALTITUDE IAOL) MEAN* I.E TQ 0.0 NMI DISTRIBUTION 0I0 FOOT INTERVALS)
FROM LANDING ZONE 0 TO 3110 FEET
41GROUND SPEND MEANIS0 TO 0OS NMI DISTRIBUTION 010 KNOT INTERVALS)FROM LANDING ZONE 0 TO 130 KNOTS
SE NSON F ILD OF REROAR D MEAN AZIMUTH AND ELEVATION1.5 TO 0.4 NMI DISTRIBUTION 1S DEGREE INTERVALS)
6NMI To TOUCHDOWNLIFTOFF TO 1.0 NMI
FIELD OF VIEW PERCENT OF TIME NARROW AND WIDE
IS TO 0,8 NMI PERCENT OF PI LOT OR COPILOT CONTROL0.S NMI To TOUCHDOWNLIFTOFF TO 1.0 NMI
NARROW FOV COMMANDS MEAN DISTANCE1.5 NMI TO TOUCHDOWN DISTRIBUTION A0. NMI iNTERAVALSI
SWITCH ACtIVATIONqt ACTIVATION TIME (SECONDS)NADIAL LANDING [KROH DISTANCE IN FEET FPOM SPECIFIED LANDING
SPOT, PEF4C&NT OF MAX ALLOWABLE ERRORBETDOWN RATES VELOCITIES AT IFTDOWN IN FT/S
X (LONGITUDINAL AIRCRAFT AXIS DA1IFT1V ILATERAL AIRCRAF r AXIA DRIFT)Z IViARTICAL AIRCRAFT AXI3 DRIFT)
NUMBER OF CRASHES GROUND IMPACTTREES OR 099TPIUCTIONS
LANDING TIME 'rime (SECONDS) BETWEEN 0.6 MILE ANDTOUCHDOWN
AIRCRAFT STATUS STATUS AT 0.1 NM) INTERVALS(DISTANCE STARTING AT 1.0 NMI INBOUNDDISTRINUTILINI ENDING AT 1.0 NMI OUTBOUND
OROUNDSPEED IKNOTSIVERTICAL SPEED IFTIMINIRADAR ALTITUDE IFEET)FITCH IDIOREESI11Time ISCONDS)WpCoLLECTIVE (PERCENT OF TOROU11
AIRCRAFT STATUS STATUS AT 2 SECOND INTERVALSITIME DISTRIBUTION) I AST MINUTE BEFORE TO.JCH.DOWN
I'IRST MINUTE IFTER LIFTOFF
"ROUNOSPUS9D
MNOTSIH ADAR ALTITUDE (FEI:'P ITCH fIGNAEBSDISTANCE to TO POINT (FEET)
- -- COLLECTIVE (PERICVNT OF TOROU1)
'3I
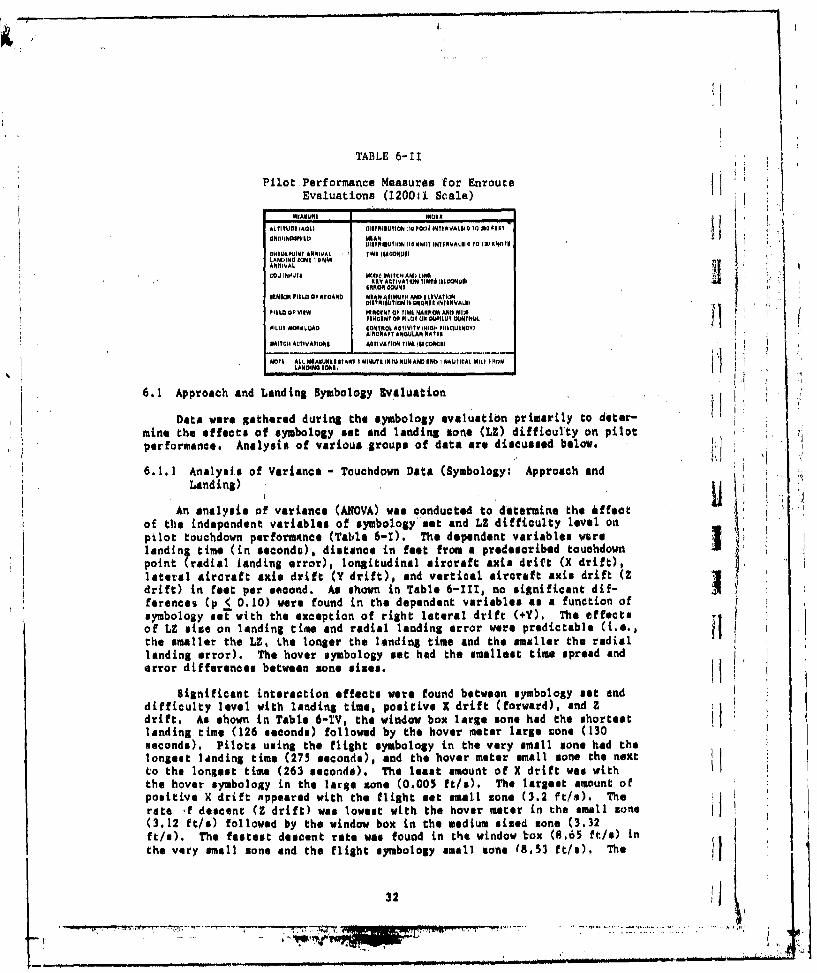
TABLE 6-11
Pil.ot-Performance Measures for EnrouteEvaluations (1200:1 Scale)
ALITUFLOW IA DirW I111 110on CI INflftVA1,I 10 SOl aONITONItAhND~iLL MIAN
DINTRINtIN OONjiit INI IN VALIII a TO 13OKND I1CHICiKPINT ARRIVAL IM IMI 6CON11#ILANIII NO ION4 10 NMIANTTVA,COU iNVIUTS MAUWi 611tT ANO LINO
KAY ACTIVA t RN tIONO mOONdoiI9FIFIOI COUNT
19NION FfOII MONS ANAN AdIMU1H AN A ELEVAtIONPIkLO OF 0114K I CNN? 0 TIMk NAKIIII ANDI NOWJ
PkIICANT 00P ILT UPN 00011.01? IhWTPIL -
PILOT NONkLOAD CONTROL ACTIVItY MG 14161 IIIUINIOI
SNITCH ACtIVATIONE AttIVATION tIM4 18EECOGOEI
MOhALL AEA1UH9EEIIAAT I MIMUTk INWL IEUMANTI END I NAWtICAI. MILO ROOIM
6.1 Approach arnd Landing Symbology Ivaluation
Data were gathered during the symbology evaluation primarily to dater-* mine the effects of symbology set and landing sone WL) difficulty on pilot
performance. Analysis of various groups of data are discussed below.
* 6.1.1 Analysis of Variance - Touchdown Data (Symbology: Approach and I
An analysis of variance (ANOVA) was conducted to determine the affectof the independmnt variables of symbology'set and LZ difficulty level onpilot touchdown performanee (Table 6-. The dependent variables were3landint time (in seconds), distance in feet from a predescribed touchdownpoint (radial landing error), longitudinal aircraft axis drift (X drift),lateral aircraft axis drift (Y drift), and vertical aircraft axis drift (Zdrift) in feet per second. As shown in Table 6-111, no significant dif-ferences (p < 0.10) were found in the dependent variables as a function ofsymbology set with the exception of right lateral drift (e.Y). The effectsof LZ size on landing time and radial landing error were predictable (i.e.,the smaller the LZ, the longer the landing time and the smaller the radiallanding error). The hover symbology set had the smallest time spread anderror differences between none sizes.
Significant interaction effectis were found between symbology met anddifficulty level with landing time, positive X drift (forward)b and Zdrift. As shown in Table 6-XV, the window box large sones had the shortestlanding time (126 seconds) followed by the hover meter large cons (130
seod) Pilots using the flight symbology in the very small sone had thelongest lAnding time (275 seconds), and the hover meter small none the nextto the longest time (263 seconds). The least amount of X drift was withthe hover symbology in the large none (0.005 ft/s). The largest amount ofpositive X drift Atppeared with the flight met small son* (3.2 ft/s). Therate f descent (Z drift) was lowest with the hover meter in Lhe Small zone I(3.12 ft/s) followed by the window box in the medium simed cone (3.32We/). The fastest descent rate was found in the window box (8.65 ft/rn) inthe very small zone and the flight symbology small sone (8,53 ft/s). The
_____ ___32

I- - -
I ~- - -
I
Iii
Im -
U'LI I
'U ~EU ~L _
* ~MMktmII ~uuuM& Eu U
U
I R~ept ~~
~ -ii! II U'I ii ii I I ha;;
I __________ ii I ~~ ~
U II ~ i$1 II mm II I1 33
~ -
______ ___ _ .,--______________ _______ - . ~ -

radial landing error was the smallest when using the hover symbology in the
smallest LZ (22.7 foot), and the largest with the hover meter in the medium
aimed LZ (70.6 feet). Negative Y drift (leftward) was not affected by LZ
size. and was the smallest with the hover symbology st (0.89 ft/a). Gen-
oralsy, difficulty of the LZ size aifects pilot performanne at touchdown
more than the hover symbology set. The smaller the L, the more workload
requirement on the pilot to land safely. The test conductor (actin& as
simulated crew chief), available on call by the pilots, helped direct them
into the LZ taereby reducing pilot reliance on symbology.
Although no symbology set consistently exhibited the best performance
on all measures, certain patterns are discernible. Table 6-V contains the
relative performance ranking between symbology sets. The hover symbology
set had the shortest landing time across LZ sines, the lowest X drift f.across LZ sizes, the smallest landing error, the lowest rate of descent (Z
drift), and the smallest Y drift. in the overall rankings, the hover sym-
bology ranked number one in performance and the window box second. Rover
symbology ranked highest because it provides the pilot with more informs-
tion with which to control aircraft horizontal postion th a hover. Flightsymbology ranked third in performance because the trilot had only Doppler
speed and the display imagery to indicate the 4rif. rate.
In summary, the hover symbology 'ad thi best landing performance over- I.
all, followed by the window box symbology. I
6.1.2 Smoothness of Approach and Lnding (Symbologyt Approach ond
Landing) 1.1
During each approach and landing data run, aircraft performance varia-bles were recorded every other second during the 60 seconds prior to touch-
down as well as every 0.1 nmi within 1.0 mi of touchdown. To assess thepilot's visual interpretation of the different graphical presentations of
hover symbology sets .nd his ability to transfer this interpretation to
controlling the aircraft during the approach and landing phase, time and Idistance distributions for smoothness of approach and touchdown were pro-
jected. The performance variables in these distributions were: radar
altitude, rate of descent, groundspeed, pitch anti, and collective appli-
cation in percent torque. These distributions are defined under aircraft
status in Table 6-1. A second order polynomial was fitted to the data
because a perfectly smooth approach and landing would follow a second order
polynomial curve. The residual mean square for the second degree poly- flnomial was used as an indication of diffences in smoothness between actual
and ideal approaches as indicated by the experimental variables. In a
second order polynomial equation, the independent variable is raised to the
second power. This second order indicates that there Ls a single bend in
the rearession curve. We would not expect the pilots to fly straight into
the ,Z due to the terrain obstacles. The ideal flight path is a smooth
approach with one bond to got over the trees that are around the L.
Analysis of variance was performed on the distributions to examine any dif-ferences in approach smoothness or consistency. The probability limit for
significance was p i 0.10.
Significant differences in smoothness of approach were found in two
distributions. First, the flight symbology (no hover met) had the most
consistent pitch angle in the distance distribution during approach.
34

N NIr j ~
YNNI N V N
~ j@NN~
N
N
I
I I2. S1-4
1II I-"
Ii - I tU* I---"
IN..NV'I II.NM
U ,~ I ~* .~ I
S iNN..
IIi,..""
I N V N
II I::::iii
I ~ill~II 3,
- ~ ~ --.. ---.-,,.~.

Figure 6-1 indicates the pitch angle of the four symbology sets from 1.0nm to touchdown. The LZ si.s did not significantly affect pitch angleand were combined across symbology sets. The hover syimbology had the next*soothest pitch angle followed by the hover meter and the window boxrespectively. Second, the LZ difficulty affected the radar altitude as aiunction of the distance distribution. The radar altitude approach glidepath was sore stable for the small Us than for the larger sones (Figure6-2). Pilots were required to have their altitude and airspeed under con- Htrol to safely enter the small zones. The symbology sets did not aignifi- I1contly affect the radar altitude and were combined across Us. Additionalapproach trends, although not statistically significant, show the hovermeter to have the smoothest approach with respect to descent rate, speed,and percent torque. Oroundspeed trends arm shown in ligure 6-3. The set-down results showed the smoothest pitch anille, speed, and radar altitude to..be with the window box. Additionally, the hover symbology set showed asmooth descent rate. The inconsistent symbology trends in aircraft alti- 1
tude during the last low seconds (time distribution) and nautical mile(distance distributio,,) before touchdown indicate that the various hoversymbology sets have little effect on smoothness of approach. This might be
explained by the information comon to all symbology sets (ie., ground-speed, rate of descent, radar altitude, and torque) giving necessary land-in& data, as well as the simulated crew chief available on call by thepilot for additional landing information.
6.1,3 Crash Rates (Symbologyt Approach and Landing)J
Chi-square analysis was performed on the number of noncrash landingsbased on total attempts to land. This analysis showed no significant fre-quency differences as a function of symbology set or difficulty level.
There were very few landings that would not be classified as poor ortechnical crashes by the criterion established in the test plan and shown Iin Table 6-VI. The rate of descent was the most frequent cause for poorlandings across all experimental conditions followed by pitch angle andrearward drift respectively. The most frequent cause of technical crashesexceeding the established criterion was pitch angle followed by rate ofdescent. There were very few poor landings or crashes caused by left andright roll or forward drift. No landings exceeded the criteria for sidedrift (Y). The frequencies and types of poor landings and crashes werefairly evenly dispersed across all treatment conditions.
6.1.4 Discrete Activities (Symbology, Approach and Landing)
6.1.4.1 Percent Time Narrow Field of View Gommanded
Only the pilot in command (the pilot at the controls) made the FOVcommands for this group of subjects. There were no YOV comands in theapproach phase and very few in the landing and takeoff phases. There wasminimal variability in percentages of time in the narrow YOV as a functionof LZ sine and virtually no variability due to symbology set. This waspredictable since all of the hover symbology sets are only used during
36t
" TT

SYMNOLOGY-eFLIOI4T
00-: HOVERe.N.M4 WINDOW BOX
7 6C 0a HOVER METRa
PITCH ANGLE *NO1 UP
LADN II I IIII
6- I ALL
lEA 0-O1 MEDIUM
140
RADARio-00ALTITUIIIN
70 0.!1 0.1 014 011
DIETANCEI To TOUCHDOWN - NMI iFiguro 6-2, Radar Altitude during Landing Phase
I 37
IL Ml' 7- -- ig -,---

i~~~I -. F, -. ,- LIGHT
Wo - W ,,.., INDOW box4,9.0-ll HOVER MITIR
5.0-
DRO9~$~ S17 0 -RONIPKID 30O0~NOTI :,
10
0 O,06 0,1 0,4 0,1 0
DIITANCE TO TOUCHDOWN - NMI
F gur* 6-3. Groundspeed during Landing Phase
TABLE 6-VI .
Critorion Values for PoorLandings and Crashes
CRASH LANDINGORNATIR 011A011
PLANS THAN THAN
VIRTIOAL, I (T/8) t0.U 3,33
SIDEWAYS, Y (PT15 + -IS + -10
PORWARO, X (KNOTI) 10 1RIARWARO, X IKNOTS) - -S
ROLL RIOHT (OOR9) 10 3
ROLL LIFT (S0RIS8 10 S
PITCH NOlS UP 11 10111 --- t - --
NOTEM ORITE RION VALUEI PROVIDI 0BY NATOTIT PILOTS DURING PHAN I STUDY
38I

landing. In the landing phase, the largest percentage of time spent innarrow FOV was 0.41 percent in the large site LZ, and the least amount oftime was 0.089 percent in the medium csle landing sone.
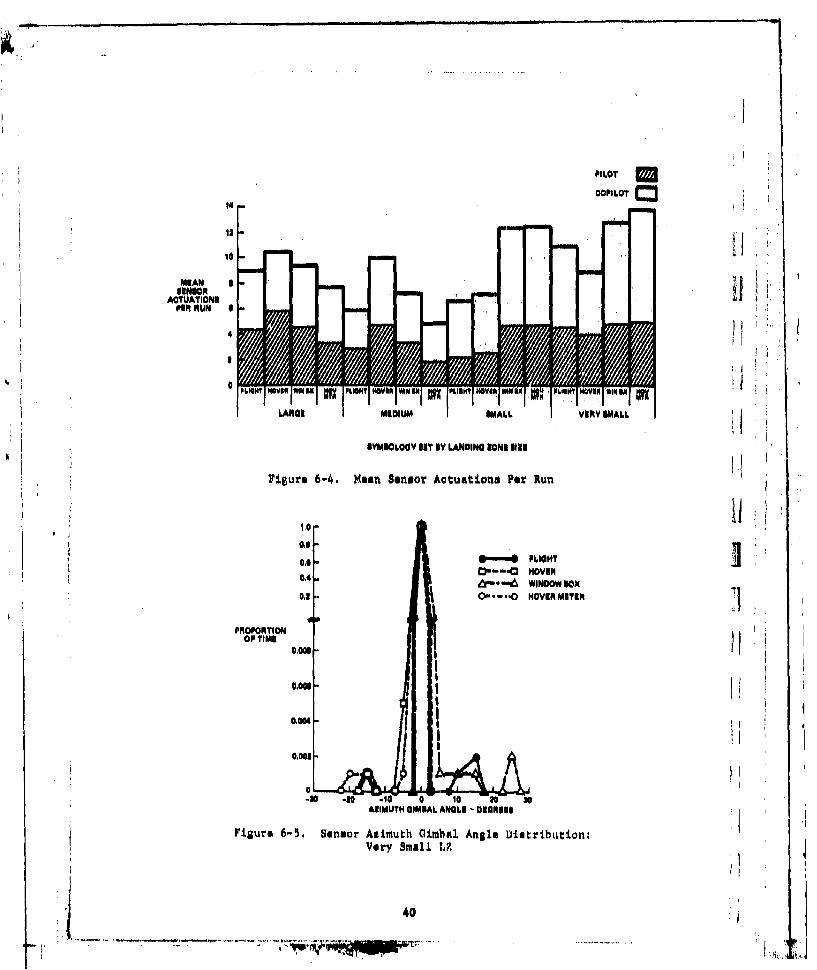
6.1.4.2 Sensor Actuations per Run
Sensor Blawing was shared by pilot and copilot. As shown in Figure6-4, there was a large variability in senior usage between experimental
conditions and between pilot in command and copilot. Overall, the copilotslws the eancor more than the pilot especially in the small and very smallLZ. The pilot and copilot frequency differences were lees pronounced inI the large and viedium tones, One explanation of this difference would bethe necessity for increased pilot attention to flying the aircraft when
* landing in the amaller' sones, The trend of more sensor sleving in thesmaller zones woold indicate a need to examine the emall landing area forobstacles with the copilot in control of the sensor, thereby freeing thepilot in command for the actual landing requirements, The frequency of
d sensor clawing is important since the data runs were of relatively shortm duration (approximately 3 miles tong). The craw used the gLmballed sensor
during these short flights proportionally more often than observed during3 Ithe longer enroute date runs of previous simulations (Reference 5),
6.1.4.3 Sensor Aeimuth and Elevation
.1 Sensor azimuth and elevation data during the approach portion of thesymbology evaluation data runs indicated little difference due to experi-mentol conditions. This was expected since the flight symbology was usedduring the entire approach portion of the mission, During the transitionand landing portions of the data runs, the differences were small as afunction of experimental condition.
Figure. 6-5 through 6-8 display the percent of time spent at eachasimuth gimbal angle for the experimental conditions of symbology formatsand LZ size. The sensor was not slowed more than 30 degrees to the left or45 degrees to the eight, and remained centered 99 percent of the time. The
-ii spurious peaks at several azimuth angles were not consistent by LZ size orsymbology set and are probably due to chance. The very small Bona resultedin the most variability in elevation (Figure 6-9). The sensor remainedcentered in elevation the least amount of time with the flight symbology(64 percent) followed by the haver (79 percent), hover meter (83 percent),and window box (89 percent). The sensor wa never slowed up and was slawed
443 the farthest down with the hover mater (50 degrees down). Aside from thesmall LZ, the remaining LZ sils* show very little sensor slawing in eloea-tion (Figures 6-10 through 6-12).
6.2 Approach and Landing FOV %valuation
Data were lathered during the POV evaluation primarily to determineI rthe effects of FOV and LZ difficulty on pilot performance (Table 6-1).After two pilot groups (eight pilots) had completed the FOV evaluation, &I
I
m i39
"Room.-. .
PILOT
COPILOT D314
10
MEAN IACTUATIONS
FIR RUN 0
4 H
0 LM H~NWIS USHYMON WNI PUSH? NOV15 lullM I I dIId I
LARG MEDIUM SMALL VIY SMALL
SYVMOLOOY Sit Iy LANDINo IONI 111
Fig±ure 6-4. Mean Sensor Actuations Per Run
oi e- FLIGHT
i.4 Dp-a NOVIM
WINDOWBOX
P'ROPORTIONIOF TilI
0.000
0.00I
0,00
CAN -n
-0 -10 -10 a 10 to sAZIMUTH GIMBAL ANGLE 1DE0EE1
Figure 6-5. Sensor Azimuth Gimbal Angle Distribution;Very Small I,?.
40,. - , - - - "- --J .-

1.0 0 FLIGHT
.0, A - r.- WINDOW BOX0--0~ HOVER METER
* PROPORTION3 ~OF TIME 000
I0.009 /t0,004
0.001
AZIMUTH 0GIUL ANGLE II111
Fi±gure 6-6. Sensor Atimuth Gimbal Angle DiatributiontSmall LZ
U,, *.-6 PLIGHT
a. D" HOVER
0.4 * ww6 WINDOW BOX
PROPORTIONHOEMTR
0.004
Ad 1 -.40 -830 -10 0 16 20 a 6 E
AZIMUTH GIMBIAL ANd@LK 0EOREER
Figure 6-1, Sensor Asimuth Gimbal Angle U-istributioni
Miediumi LZ
B 41

1.0 F--** LIGHT
PRtOPORTIONOF TIME 1.i
0,008 A
%0
.40 -30 . 10 2(1 B 40
AZIMUTH GIMBAL ANGLE DICEGNES
Figure 6-8. -Sensor Azimuth Gimbal AngleDistribution: Large LZ
0.1
USFLIGHT
0 c~---aHOVERpsiPO~ IO . WINDOW BOX
OF TIME Ii /I OVIR METER
0,004 I0.004
0
410 -6O 0 -30 -80 -10 10
ILEVATION GIMBAL ANGLE - 01001118
Figure 6-9. Sensor Elevation Gimbal AngleDistributioli Very Small LZ
42

1.0 - FLIGHT0.8 - -4 HOVER
~ WINDOW BOX
I0.6- 0- 0 HOVER METER
0.4-
1 0.2-
PROPORTION0.0OF TIME
0.004-
0.002-
-.30 -20 -0 0 10 20 30ELEVATION GIMBAL ANGLE -DEGREES
IFigure 6-10. Sensor Elevation Gimbal Angie Dirtributiont Small LZ
Ii 43

0---* FLIGHT 10D-- -a] HOV| 41
1,0A a-- WINDOW BOX0..-0HOVERMITSR
POPORTIO lOF TIME
0,00
0.0024
-10 .20 IELEVATION GIMBAL ANOLE - DEGREES
Figure 6-11. Sensor Elevation Gimbal AngleDistribution: Medium LZ
110 m-4 FLIGHT0., D,---U HOVER
0.6 6--"& WINOOW BOX
0.4 O---O HOVER MTR
0.2 4it0.006 11
0,I / I Figure 6-12. Sensor Elevation I0,006 - Gimbal Angle Distribution:
Large LZ
0.004 /I1).002
-30 -20 -10 0 10 20ELEVATION GIMB L ANGLE - DEOREIIS
44 .

I
program review was held to discuss the FOV preliminary data results. Theconsensus reached at that program review was that the data generated bythese two pilot groups were sufficient to evaluate POV effects on pilotperformance and that the remaining pilot group event would be rescheduledfor incorporating the Honeywell 1HADIS hardware into the cockpit for thecopilot virtual IUD evaluation. Therefore, the data discussed for the POVevaluation is based on eight pilots rather than the standard three pilotI groups of four pilots for a total of twelve used throughout the rest of
this simulation experiment.
6.2.1 Touchdomn and ,nroute Data (,Oy: Approach and Landing)L Touchdown performance was analyzed on five dependent variables: land-
ing time, radial landing error, X drift, Y drift, and Z drift during land-
Sing; and throe approach variables-average alttitude, average groundepeed,
and percet of time under 100 feet during the approach portion of the datarun. The independent variables were POV and LZ difficulty. Table 6-V11shows no significant touchdown performance effects due to FOV or LZ sins.Although not significantly different, wide and dual FOVo tend to result inbetter performance, on most variables, than did the narrow FOV. There is asinificant interaction effect between POV and LZ difficulty level withreerenco torate of descent (Z drift). Wide FOV, in the large soneresulted in'ihe smallest drift &I'owed by wide POV in the medium sone.Tables 6-VI11 and 6-1k show that tue wide TOV resulted in the smallest rateof descent, followed by the dual POV.
6.2.2 Smoothness of Approach and Landing (FOV: Approach and Landing)
jj. ' Rogression analyses were run on time and distance distributions ofperformance variables as in section 6.1.2. The differences in residualsfor radar altitude over distance were significant by LZ size and POV con-figuration. Figure 6-13 shows the average radar altitude In the terminallanding phaso for wide, narrow, and dual FOV (across all sons sizes). Thisfigure shows that altitude control using the wide POV is less variable whencompared to a more erratic approach profile using the narrow FOV. Regard-less of the FOV configuration, the pilots tend to approach well above thetrees (average 80 foot tree height) and lot down vertically. The radaraltitude for LZ approach was significantly smoother in wide rOV than innarrow. The approach radar altitude for the two small Zs combined wassignificantly smoother than for the two larger LZs combined (Figure 6-14).This would indicate a more controlled altitude approach for the difficultlanding zones than for the easier zones. There were no significant inter-action effects between LZ site and FOV.
The vertical rate of descent across distance was significantlysmoother for the smaller two LZs than for the larger two. This again indi-cated the necessity for a smooth approach into the smaller sones. Figure6-15 indicates m rapid descent rate at 0.5 nmi in the smll landing and
then a climb to clear the trees. Approach into larger zones ha4 an erratic
II45
m (lil! N M nqli p~mmlNil ~ll~ljl 45

K
-
~ I _________
I,
~U
iB~ I'U
H~
:1.
IilliEliI
I]~ II iiI IQ 11111
- mm-
ii
~6

VER
TIW ARLE MEIUM ML ML
WIPEfia~ 1.97'R 3.02atio9Toucdow aTa
NARO 3.1 2,'32- BYL .0N8ZN SZ
DUA 443, 4.10 32.02 2.89
NARRO 3.1 2,3 2.0C4.1
ITABLE 6-IX
[ Rmlativii Rankings of SignificantFUV Touchdown Data
II - LANDING ZONE SIZE
F FFL~rO V'VERY OVERALLFIELDOF VIEW LARGE MEDIUM SMALL SMALL RANK
WIDE 1 1 3 2
iiNARROW 3 2 1 3 3~*
IDUAL 2 3 2 1 2
.111 01 - BEST RANKING- -
~ i ~ ~ . . ..~47Id

xmmmmN NARROW FOV
140 WIDE POV* ZDUAL POV
2001
ADAA
RDALTITUDES so
soI
Figure 6-13. Radar Altitude during Landing Phase oy LZV Only
ISO-
* Ida-
140 ,-

a.. LUl
* LT30
00 0 4
I I
11 I 9

descent rate. Rats of decent was not affected by FOV. Collective applica-tion as indicated by the variation in torque across time was also signi-ficantly more stable for small sons than for larger tones (Figure 6-16).Nonsignificant trends in the approach distributions indicate an incon-sistent speed for narrow bOV. This is perhaps due to miajudgement of air-craft distance to the zones when in narrow FOV. Generally, the distribu-tion again indicates that difficulty level affects performance more thanFOY.
6.2.3 Crash Rates (FOV: Approach and Landing)
Chi-square analysis of the number of total attempts resulting in land-ings showed that the frequency differences were probably not duo to chance(p - 0.0035), i.e., difficulty level combined with FOY affects the rate ofsuccessful landing attempts (Table 6-X). The narrow FOV had the smallestpercentage of landings per attempts (46 percent) in the medium ,Z. Thehighest landing rate pet attempts (100 percent) was with the wide POV invery small LZ. Ixamination of FOV and difficulty level independently didnot result in significant differences.
The technical poor landings were due to pitch angle, rate of descent,and rearward drift with equal frequencies. The narrow POV had the mostpoor landings followed by dual and wide respectively, However, the dif-ferences in frequencies were not statistically significant (Table 6-XI).There were no technical crashes in the FOV evaluation.6.2.4 Discrete Activities (FOV Approach and Landing)
6.2.4,1 Percent Time Narrow FOV Comanded
The pilot at the controls of the aircraft in the FOV evaluation madethe majority of FOY selections. Table 6-XI shows the percentage of timespent in narrow FOY by the flight phase and LZ difficulty level. Thepilots were briefed before each data run set and encouraged to use theirdual FOY capability. However, the largest mount of time spent in the nar-row rOV by the pilot was only 2.09 percent during approach to the smallestLU. The amount of time in narrow FOY decreas d markedly during landing andtakeoff. Without continued encouragement, the pilote tnded to not use thenarrow fb. The pilots apparently felt the wide tV presented sufficientvisual feedback to accomplish the approach, landing, and takeoff phases ofthe mission.
6.2.4.2 Sensor Actuations per Run
Figure 6-17 indicates a large variability in the number of sensor Iactuations per data run. Sensor slewing was shared by the pilot andcopilot; however, the copilot slews the sensor more often than the pilot atthe controls of the aircraft and more frequently in the smaller ULs, rain
forcing the need for a center console sensor control capability. The larg- Let frequency of sensor actuations occured in the very snail tne in narrowTOV. This would indicate a necejaity to look around to overcome the
30
-. .WV?~SSEA

a SoSMALL ZON mU LARGER ZONE -.-.-.-
70
TOROUN 40
to
10-
1!0 .01. Oil 0.7 0.5 0. 4 03 &1 0.1 0 r
DISTANETdOS7 TOUCHDOWN -NMI
Figure 6-16. Percentage of Torque Applied duringLanding Phase by LZ Only
t. Field TABLE 6-X
Fedof View EvaluationtPercentaga of Total Data
Routs Attempts Th.at Resultedin Completed Runs and Landing
* LANDING ZONE WIE&
FEDOP VIWLARMEDIU IMALL SMALL
WIDE 73 7 57 1O0
I.NARROW is 46 W 7DUAL U 75 Edj SO
4

TABLE 6i-XI
Field of View Evaluatton: Technical Poor Landings
LANDING ZONE SIZE AND NUMBER OF ERRORS BY TYPE
FIELD OF VIEW LARGE MEDIUM SMALL VERY SMALL TAm- 0 i
WIDE I (-X DRIPT) 2 (-X DRIFT) I O+XDRIFT) I (-X DR IFT)1 (Z DRIFT) I (Z DR IFT) 4 (ZODRIFT) 2 (Z DRIFT)
I (PITCH) 2 (PITCH) 1 (PITCH) 17
NARWI (-X DRIFT) I (-X DRIFT) I (Z DRIFT) 2 (-X DRIFT) -
4 (ZDRIFT) I (+X DRIFT) 5 (Z DRIFT)2 (PITCH) I (Z DR IFT) 2 (PITCH)I (ROLL 2 (PITCH) 23
RIGHT)
1UL (-X DRIFT) 3 J-X DRIFT) I (-X DRIFT) 2 (-X URI FT)1 (Z DRIFT) 3 (ZODRIFT) 2 (Z DRIFT) 2 (Z DRIFT)I (PITCH) I (FITCH) I (ROLL LEFT) i WFITCH)
I(ROLL 20HRIGHT)
TABE E-XII
Percentage of Time in Narrow FOV
PERCENT OF TIMELANDING IN NARROW FOV
ZONEFLIGHT PHASE SIZE PILOT COPILOT
APPflOACH VERY SMALL 2.0 0SMALL 1.10 1.460MEDIUM '1.28 0LARGE 0,735 1.043
LANDING VERY SMALL 0.197 0SMALL 0.136 0MEDIUM 0.621 0LARGE 0.616 0.179
TAKEOFF VERY SMALL 0 0SMALL 0.093 1.013MEDIUM 0C
__________ LARGE 0.360
52

II
II .01 II
ii
i~IiVIii
U..0 ii
i~ *1
jm LI [F H
II. ~
iiliii
V
II 53.......................................................................................................

reduced imagery iaso of the narrow FOV. For &mall sones, the wide FOVrequired the least number of sensor actuations. 7he mean data shown hereincludes all phases of the flight, but the approach phase taken separatelyis coneistent (i.e., generally morm enso? actuations per run for theforced narrow FOV). The mean distance to the next checkpoint at .iich sen-sor sewing occured was 0.32 nm and was not affected by experimental con-dition (Table 6-XII). Since the average distatwoe between checkpoints wasapproximately 0.75 nil a mean sensor seowing distance of 0.32 nol indi-cates that pilots siewed the sensor throughout each le for terrain avoid-anoe as opposed to looking for checkpoints at the end of 'e.s Overall,the pilot groups used the gimballed sensor proportionally more often thanobserved during the longer enroute data runs of previous situations(Reference 5).6.2.4.3 Sensor Azimuth and Elevation
During the approach (1.5 to 0.6 nmo from touchdwn) and takeoff(touchdown to 1.0 nin out) phases, the sensor remained centered 90 percentof the time and remained within 25 degrees of center all of the time. Thenarruw FOV had slightly more sensor actuations than dual end wide. Figures6-16 and 6-19 show the asimuch and elevation gimbal anplee for the landinphase. The crews used a 14rger field of regard tange Ln the narrow FOV$preauma:4y to compensate for the reduced rOY4 In all FOVes the sensor was.ever seowed up and was slewed down when entering the LZ to compensate forthe high aircraft nose up attitude during deceleration,
The landing phase required more slmwvns of the sensor. During land-
in&, the sensor remained centered 90 percent of the time and within 60degrees of center all of the time in #cimuth, In elevation, the sensorremained level 50 to 65 percent of the time, was never sieved up, and wasslved down 60 degrees less than 0.01 percent of the time. t
6.3 Approach and Landing PD-HKD Evaluation
During the third study, cr ew performance data were sathered wih thepilot and copilot using three combinations of the H14D and PMD. The com-binations tnder study were: pilot and copilot using a PMD; pilot using anHMD and copilot using a PKO; pilot and copilot using a HMD. Analysis ofperformance data appear belov.
6.3.1 Touchdown and Enroute Data
The touchdown performance data ware analysed on five dependent vart-ables (lending time, radial landing error, X drift, Y drift, and Z drift)and three approach variables (percent under 100 feet, average altitude, andaverage groundspeed). The independent variables were three display con-figurations: PKD-PMD, PHD-MD, and IOID-H0. Table 6-XIV shows the levelsof significance resulting from this analysis. The significant differencein landing error was expected as a function of sone e s. Although no dis-play combinations resulted in significant performance differences, trends
54'
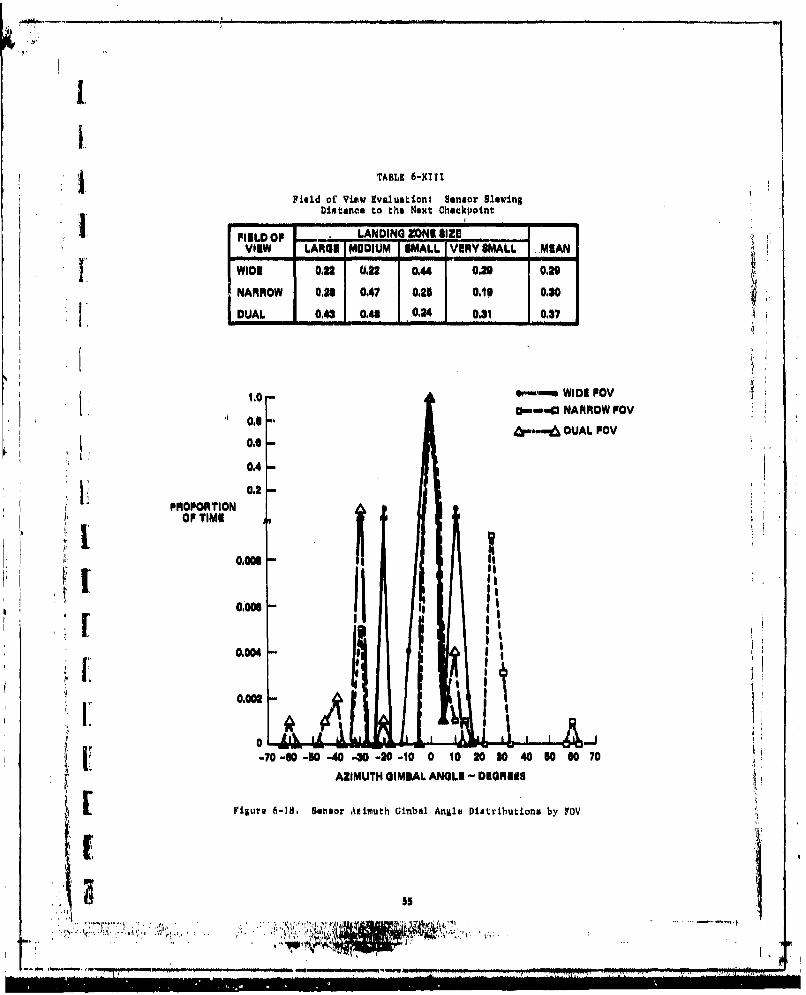
TABLE 6-XIII
Field of View Evaluations Sensor SlevingDistance to the Next Checkpoint
PIELDOP - LANDIN ZONE SIZE MEANvIew LARGE MEDIUM 0MALL VERYEMAI, ..MOAN
WIDE 0.22 0.22 0.44 0.2 0.29
NARROW 0.6 0.47 0.25 0.19 0.20
DUAL 0.43 0,41 0,24 0,131 0.37J
1,0 - WIDE POV0- - NARROW POV
0.-~ ,~D DUAL POV
0.2 II~PROPORTIONOF TIME
I0.006 8I
0,002
j it '{0.0m1 -
AZIMUTH GIMBAL ANGLE - DIGREAS
Figure 6-18, Sensor Aimuth Gimbal Angle Pitributions by FOV
' 'I 5T

0~-43 NARRowFovPROPORTION EAU0 6-0- DUAL FOVYj
OF TIM&
0,006
al"s
-10410 40 .40-30 -20 -10 15-10
ELEVATION GIMIAL ANGLE -DEGREES
Figure 6-19. Sensor Evaluation Gimbal Angle 'Distributions by FCV
TABLE 6-XIV
Pilot Performance in 1*1D-PHD Evaluation:
Toucdownand Approach
INDEPENDENT VARiABLES
STANDARb DIOLAY DIFFICULTYDEPENDENT VARIAILEE OVEN4ALL MEAN DEVIATION CONFIGURATION LEVEL INTENACTION
YOUCHDOWNI
LANDING TIME 234,2 Wolf007 No" NI No
RADIAL LANDING IERROR 31.67 PT 34,41 mep 0.046 No
-X DRIFT -1,SI FT#i 1'U NE No No+X DRIFT 2.4IFT/A 2.11 NI NO No
-y DRIFT -1.8U PWI 1.E No NO No
+V DRIFT 1.24 FT/I 1." No NE NI
IEDRIFT 4A4 FT/I a." NO NO NO
APPROACK
PERICENT UNDER 100 FEET 11.611% 22.11 NoAVERGE ROUDSPID 1111 NN 2.3 No LANDING SONII DOES NOTAVERGE ROUNIPED US? M 113 NE AFFECT APPROACH VAAIANLIS
AVERAGE ALTITUDO 119-4 FT U.0N
56 -
in favor of the ID combinations do appear. HMD-PMD had the greatest timeunder 100 feet, the lowest mean radar altitude, the only mean altitudeunder 100 feet, and the least amount of Z drift. Tables 6-XV through6-XV11 show the touchdown and approach results and relative rankings ofthese results between display configurations. The H4D-HMD combination hadthe shortest landing time and the best overall ranking on touchdown per-formanct. These results indicate that it is the pilot's display thataffects performance, and the performance is better with the H1D.
6.3.2 Smoothness of Approach and Landing (IHID/PMD; Approach and Landing)
Regression analysee were run on the distributions as detailed in see-tion 6.1.2. The radar altitude for the last nautical mile before touchdownwas significantly (p w 0.10) smoother for the HND-PHD configuration thanfor PHD-PD. Figure 6-20 shows the radar altitudes approaching the LZ aslower and smoother for the HMD-PHD configuration. Significant differencesin distance distributions were also found in pitch angle. The pitch anglefor the HMD-HND was significantly (p - 0,0028) smoother than PHD-PMD, anddifficulty level I (small LZ) was significantly smoother than level 2(large LZ). This is shown in Iriures 6-21 and 6-22. Examination of thetime distribution indicated the rate of descent to be more consistent forthe larger LZs. The display combination trends, although not statisticallysignificant, show the PHD-PHD combination to be more erratic icross all
* variables than both configurations in which the pilot uses the HMD.
6.3.3 Crash Rates (HH,/PHD: Approach and Landing)
An examination (by chi-square analysis) of the frequency of noncrashlandings per attempts showed no significant differences due to display con-
* figuration or LZ else. Any frequency differences were deemed due to chanceand not experimental conditions.
6.3.4 Discrete Activities (W0/PD: Approach and Landing)
6.3.4.1 Percent Time Narrow FOV Commanded
The pilot at the controls of the aircraft in this evaluation performedthe majority of by selections, These selections were made mostly in theapproach and touchdown phases. In these phases, ND-PHD had the largit
percentage of time in narrow FOV (25 percent) followed by WtD-l1M (2.1 per-cent) eand PMD-PD (0.8 prcent) o
6.3.4.2 Sensor Actuations per Run
~The mean number of sensor actuations per run could only be calculated
for the PKD-PMD runs using the manual sensor slew controls. Sensor usagedata were not recorded while the sensor was controlled through thu pilot's
I: head movements. The frequency differences between pilot, copilot, and LZdifficulty were not significant. The overall number of sensor actuationsper run wao 4.8 at a mean checkpoint distance of 0.35 nmi.
57
I'e
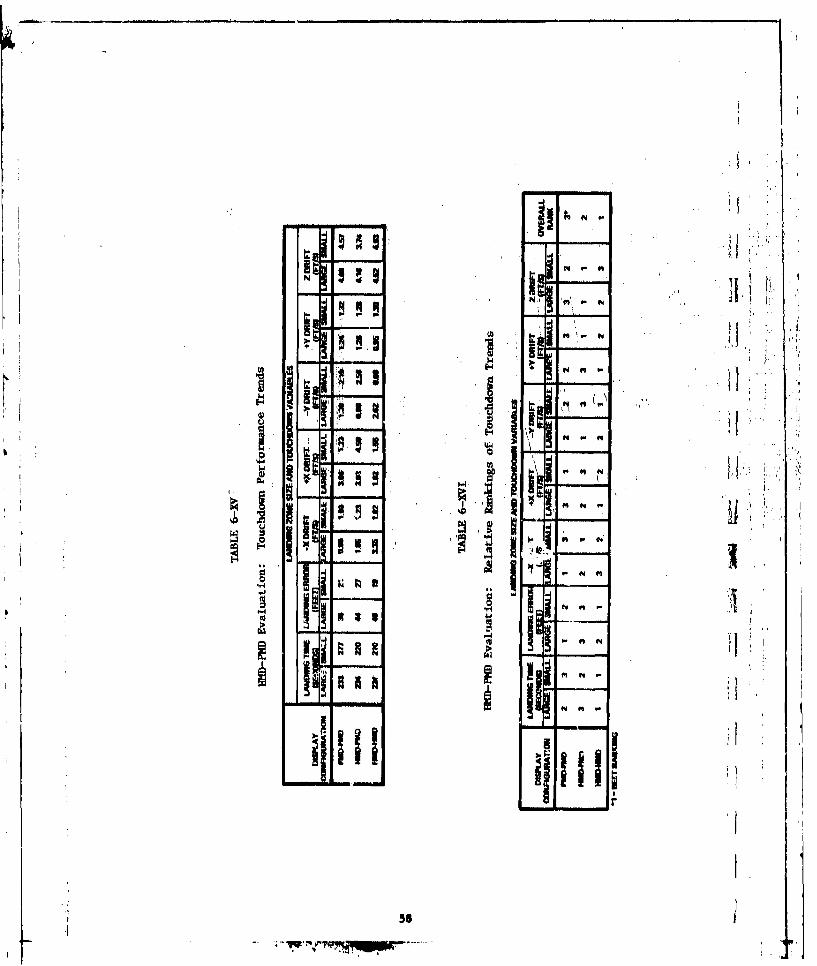
* N ~ N Al
0 SI'- N <I- '
O m-~~um I-.K ~ I * N M Hb ~ ~ 5 ~ ~ i~ ::i U~
N N H'-4 ~
~ .~
NN"
00 hiN 00
P1N 'H,i
NN
11111
'a-
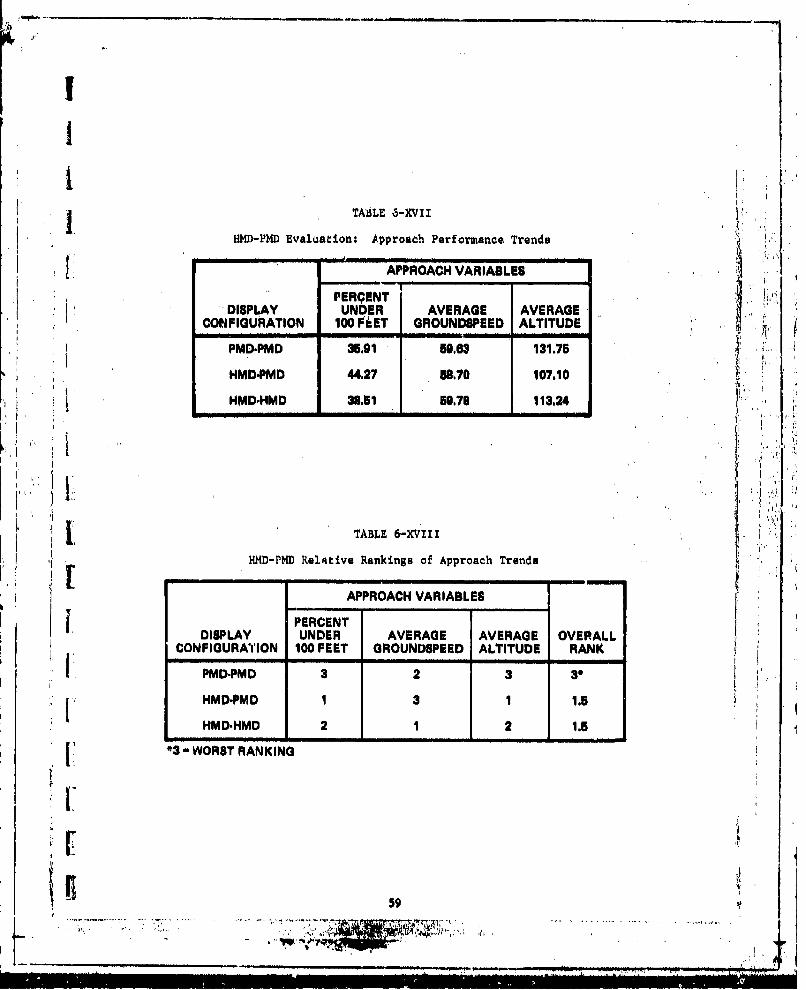
I -. - . -XVII
APPROACHVARIABLE
PERCENTDISPLAY UNDER AVERAGE AVERAGE
CONFIGURATION 100 FEET GROUNDSPEED ALTITUDEK
PMD.PMD 35,91 5.3131.75
HMD.PMD 44.27 58710 107.10
HMD.HMD 38.51 59.79 113.24
TABLE 6-XVIII
HMD-PMD Relative Rankings of Approach Trends -
APPROACH VARIABLES
j PERCENT
CONFIGURATION 100 FEET GROUNDSPEED ALTITUDE RANK
PMD-PMD 3 2 3 S
HMD.PMD 1 3 1 1.5
HMD.HMD 2 1 2 1.5
59
JI F7l . 11.- .. - 4

160 lpoww XX-*Xob~
0-4 HMD#*ID140 O--GO 14M0*HMD
ALTITUDE I 1-FijiF
60
1.0 0.6 0.6 0.4 0.2
80 Figu~o 6-20. Rbdux Altitude duringi Lndi~g P1hau4
* 6.0A - - - HM D'hOM D-xx MD*HMD
PITCH ANGLE, INOSE UP 4. A '
DEGREES ,SnalZ
1.0
110 0,6 0.6 0.4 02 0
DISTANCE TO TOUCHDaOWN, D1Pr1C~iLTY LEVIL 1 - NMI
Figure 6-21. Pitch Angie during Landingr Phast SalL
~ __0

7.0 -1~~mlmHO,,HO
0.0.
8.0 - PPPb9
A 8.0
I2.0.0
DITAC TOS UPCDON DIFCUT 4,0L2- M
Ii Pigure 6-22. Pitch Angle d~uring Landln3 Phase: Large LZ
6.3.4.3 Sensor Asimuth and Elevation
The oreww in the INO-PWD evaluation tended Lo spend more time with thesensor slewed off center than in the pre-ious evaluations. This wouldtevult from the eass vith which the pilot could elew the sensor while usin&the 1HD. After sensor operation using tha MED, the pilot became accustomedto yiewin the terrain on4 thus slowed the sensor more often manually when~~using the ?MD. Vigure 6-2 zhowa that the cowsv remained within 50 degrees ~of the center all of the time and remained centered 55 percent of the timein elevation. Figure 6-24 shows that they remabed wfthin 40 degrees ofcenter al of the tie, and rdained pontered 90percent of the time in it {.Raimuth.
6.4 Inroue M-PMD-CDU valqtion
Crew perfoman.e meaaur. wr , .obtained on 'longer routes at the 12001scale mphsiein, low level navigtinn with the-three combinations of dis-play units as well as CDU'dperation, D u to facilities difficulties duringtwo pilot groups, data *vo collected on only four pilots a the 120011Ocala, One of these pilots hod to be eliminated for poor performance(ie., enroute radar altitudes of ovev 1300 faet). Thus, stisticalanlyAisis eliminated becauli of the sample *s*, Trends and indicationsdiscu'seed below mddi be quallfied by the sample aim,
6.4.1 Enroute heformanqe (ID-PMGDCD: Snroute)
N4o touchdown data were colleocted durin$'this phase since enroute per-formance was the flight. Section under study. Table 6-XIX indicates loweraltitudes for a higher percentage of time with the H1D-H display configu-ration. Table -XX show a teadency for hither speeds with the 10D-PHDfollowed by the dual PHD. The easier (flat) routes resulted in loweraltitudes and higher mpeeds than the difficult (mountainous) routes,Routes involving a course change had hither altitudes and higher speedsthen routes witli no chapses. Tho pilot did not have the verbal aid of thecopilot ,hile he was inoerting a route change in the CDU. Thus, there wasa tendency to fly higher over unfamiliar terrain. However, this alsoallowed higher groundspeed* on these longer routes.
6.4.2 CrAsh Rates ('0D-PHD-CDU: Enroute)
Chi-square analysis of the total attempts which resulted in successfulruns showed the difference to be highly significant (p w 0.0000). i.e., thenumber of succes3ful runs is due to display configuration combined withroute difficulty. E amination of the independent variable (route dif-ficulty) alone also resultid in significant difforences in success fro-quencies. For the hard routes (mountainous terrain), tOED-1DW had the larg-est percentage of successful runs (50 percent), and PID-PHD the smallest(25 percent). For easy routes (flat terrain), PHD-PMD had the largest per-centage of successful runs (lOU percent), and MD-PMD the smallest (43
62

I 0.4
0.0
04w
I 0."
.01002
I40--0 -40 .20-10 0 10 30
IJINSON ELEVATION ANOLE 01GREE8
'1.
PRg 1OPRIN
Figure 6-24. PMD Sensor Azimuth CAN U
Gimbal Angle Distributions
0,. 004
0-60 -W -40 -30 -20 -10 010120 04060600
IIINBOR AZIMUTH ANGLE - DIGARKEEI
II 63

TABLE 6-XIX
*M4-PM Evaluation: Average Altitude Enroute
DIFFICULT ROUYE -. ASY ROUYN INO No OVERALL f
ROUTE CHANOR ROUYE CHANGE ROUTE CHANGE ROUTE qHANG1 MEAN
PMDP4qO 16711 16W 117.8101) 191.87S (1W) '176.111%) 17210
HMO'PMD 1417.00111% 143.91110%) MAIMS(32 214.41 111W 10.70 IH4MO-HMO 16641 2%) 170.16012W 146,4911% 144.06121%) 1111,27
PEROE1111NTACIE OP TIME UNDER 100 FEET
TABLE 6-XX1*M-PMD Evaluation:Average Groundspeed,Enroute (Knots) 1
DIFFICULT ROUTE EASY ROUTE
No NOCHANGE CHANGE CHANGEI CHANCE MEAN
PMO.PMD N BE6 E
NMDPMO is 70 64 76 57I
HMO-HMO a 64 of 67 $3.5
64

I
5 percent). Examination of display configuration alone resulced in no signi-ficant differences. When pilot workload is increased (i.e., mountainousterrain). the HMD for the pilot has a higher success rate.
6.4.3 Discrete Activities (HO4-PMD-CDU: Unroute)
, ; 6.4.3.1 Percent Time Narrow FOr Commanded
* • The crews made very few FOV seleetions in this evaluation. Selectionswere evenly divided between pilot and copilot, clustered in the PHD-PHDJ configuration and in the no route change conditions. The largest percent-age of time in narrow FOV was less than 1,0 percent in the PIID-PMI)combination. The enroute evaluation crews apparently found little or no[ need for the narrow FOV regardless of the display configuration.
6.4.3.2 Sensor Actuations per Run
The mean number of sensor actuations per run was calculated for thePHD-PMD configuration. Th. pilots slowed the setteor (21.5 per run) signi-fieantly more than the copilot. (2.54 per run) and tended to slew moreoften in the flights with a route change. This group of pilots performed
Itheir 1200:1 runs firot, and learned to operate the PX0 and*HMD displaycombinations simultaneously. Therefore, the crews became accustomed to
I |having the pilot in control of the sensor. The mean sensor slewingI. distance to the next checkpoint was 2.14 nmi and did not vary by expri
mental conditon, again indicating that senior slewing occurs primarily forterrain avoidance as opposed to checkpoint identification, It should be
L noted that this group of subject pilots slewed the sensor overall more thanpilots from previous phases in comparable routes. The HNV8 Final Report(Reference 5) indicates an overall slew rate of 12 times per run, thisj evaluation shows 19 times per run for the pilots.
6.4.3.3 Sensor Auimuth and Elevation
3, The crews tended to slew the sensor less frequently enroute than inapproach and landing. In saimuth they remained centered more in the dif-ficult routes than the easy routes. in difficult routes, they remainedcentered 94 percent of the time with no route change and 84 percent of thetime with a change. In easy routes they remained centered with a routechange 76 percent of the time and 72 percent with no route change. The
$ 3 pattern in elevation is the same for difficult routes but they remainedcentered 97 percent in easy routes with a change and 88 percent without.
3 16.4.3.4 CDU Operation
All enroute data run,, required the copilot to manually capture theLZ. This required a specific three key operation of the flight plan master
-function key (MFK) and line keyes 9 and 6. Mont runs had an addendum tothis sequence of several scale changes (line keys 11 and 12). Discretedata were examined to determine actual sequences. There were 2 errors out
I
65 iI

of 17 operations in the performance of this sequence, both involving paral-lax problems with line key 9. One copilot used key 8 instead of 9 and oneused 10.
The experimental variable of route change also involved a specificsequence of events to properly execute the new route and capture check-points in the old. The display configuration of PMD-PXD had the fewest CDUerrors (6), followed by IMD-HID (7) and HMD-PMD (11). There were 11 linekey errors and 13 total MIK errors encountered during route changes.Tables 6-XXI and 6-XXII display the type of errors that occured. Thesetables show consistent problems of parallax and misunderstanding of key iifunctions. They depressed ,line keys several times in succession in aneffort to obtain a response or to correct an error. The copilots did 'notcue in on the ODV feedback (for example, the asterisk which appears withthe capture function). V
6.5 Approach and Landing Virtual HUD tvaluation
The cockpit was equipped with a display combination of the copilot onvirtual HUD and the pilot at the controls of the alrcraft on HMD. Theanalysis for virtual MUD evaluation was limited to one pilot group of fourpilots, This resulted in 24 runs each for the 240,1 and 1200:1 scales.The statistical analysis was affected by small sample sises. The sisni-ficant effects found must b. qualified with the small sample ms and itseffects on the statistical sensitivity.
6.5.1 Touchdown Data (Virtual HUD: Approach and Lending)
The results in Table 6-XXIZI indicate the only significant differences Uto be fn the X drift (positive) as a function of LZ asie and in the enroutevariables of percent of time under 100 feet, and the average radar alti-
tude, Tables 6-XXIV through 6-XXVI show how these differences are distri-buted within the experimental conditions. Ixamination of display configu-rations alone without zone &lis shows the virtual HUD configurationresulted in the highest percentage cf time under 100 feet and the lowestradar altitude followed by the common video and HMD-PMD combinationsrespectively. The common IMD video resulted in the fastest groundspeed.The WHD-PMD combination had the beat overall ranking on touchdown perform-ance trends, fdllowed closely by the common led video. During the approach !phase, both HlO configurations performed better than the HMD-PMD configu-ration.
6.5.2 Smoothness of Approach and Landing (Virtual RUD Approach andLanding)
The regression analyses resulted in no significant differences in theresidual mean square@ between the display combinations. The trends in theapproach distributions show the HMD-HMD common video condition to have thesmoothest approach across time and distance in rate of descent and radaraltitude. The remaining variables were not consistent for both time anddftance.

TABLE 6-XXI
Line Key Errors during Route Changes
[ FREQU.ENCYV ERROR SEUENCE4 4 EPRESEDLINEKEV INTEADOF
I DEPRESSED LINE KEY S INSTEAD OF 32 DEPRESSED LINE KEY 14 INSTEAD OF 9
2 DEPRESSED LINE KEY 10 INSTEAD OF 3
12 SEVERAL LINE KEY ENGAGES AFTER ONE MFK,1 SEVERAL PAGE CHANGES AFTER ONE DIR
TABLE 6-XXII
t,. Maxtor Function Key Errors during
Route Changes
IFREQUENCY ERROR SEQUENCE
PE N a DEPRESSED FTL/PLN INSTEAD OF DIRA
12 DEPRESSED MARK INSTEAD OF FTL/PLN
3 DEPRESSED STAT INSTEAD OF DIR
12 DEPRESSED PROG INSTEAD OF DIR
2 DEPRESSED MARK INSTEAD OF DIRj
1 DEPRESSED MAP/RTN INSTEAD OF FLT/PLN I
I6
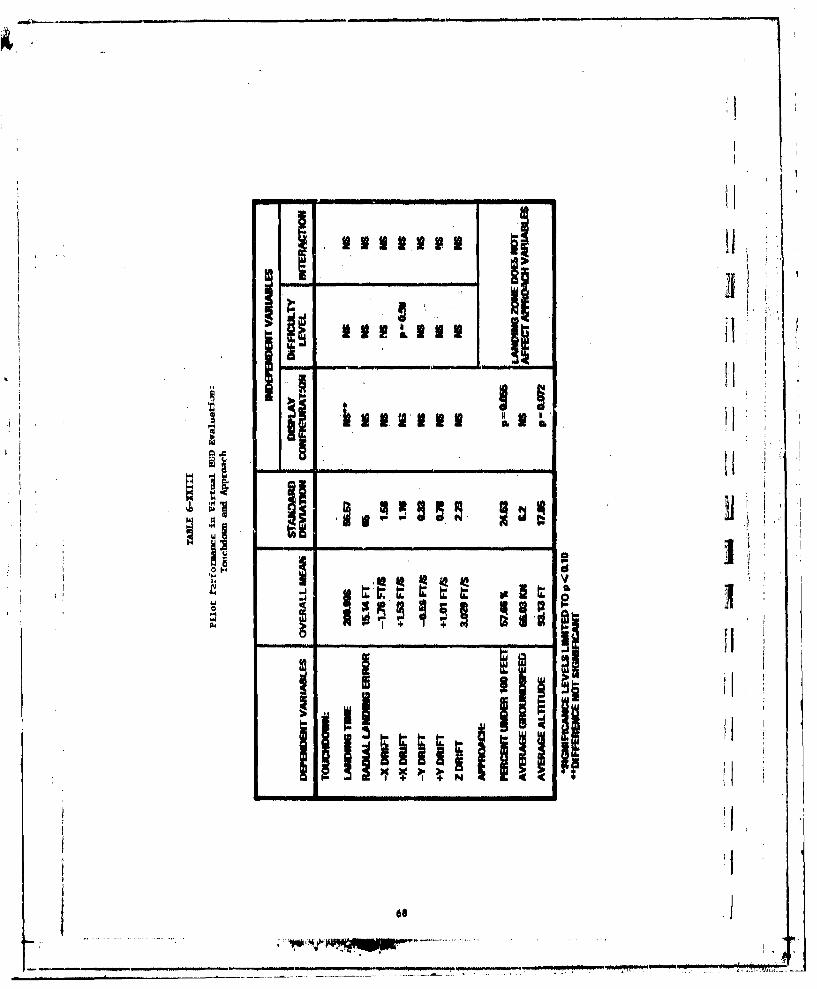
II
i~I il!,I II"I -J
.. ...
I II
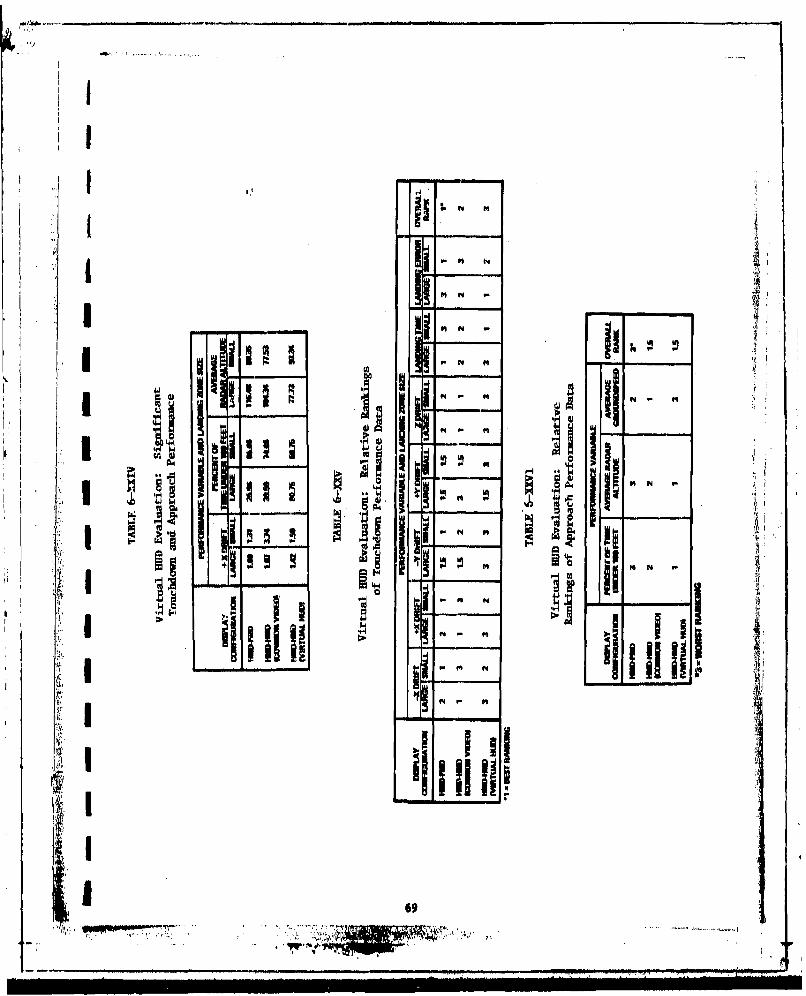
I'
II
I Ia N a
* -. __
*1 i ,'J4
I III
I ~ N I-
IU IipN
N iI~- N
I i~ ~ N
h II L ~ ~ g N - N iiI ~ II N N ~
i~ I ~N ~
NflI ~14
* C ~ I- - - - N -I ~ j
- - N N
N 1 N IB I-~51 1*
* *iii - -~-I III II!
II -
1 69
-'I
6.5.3 Crash Rates
Chi-square results indicated a significantly (p w 0.004) larger per-centage of crashes per attempts for the HMD-PID configuration, (55-percent)than the common H1D video (30 percent) or the virtual HUD (27 percent) con-figurations. The frequency of technical poor landings was three for eachdisplay configuration with the majority due to rate of descent (Z drift),There were no technical crashes.
6.5.4 Discrete Activities (Virtual HUD: Approach and Lending)
6.5.4.1 Percent Time Narrow FOV Commanded .4
The crews used the FOV cosmand in only one condition (WD-PMD, largelending none). This resulted in a rate of less than I percent in the nar-row FOV for pilot and copilot.
6.6 Inroute Virtual HUD Evaluation
The statistical analysis for this phase was again based on 24 runs atthe 1200:1 scale. The small sample sue resulted in greater statisticalimpact during the enroute phase due to the additional variable under study,i.e., fewer data runs in each treatment condition.6.6.1 Enroute Performance (Virtual HUD gnroute)
The ANOVA results shown in Table 6-XXVII indicate that the variable ofroute change has a signifioant effect on percentage of time under 100 feetand average groundspeed. Runs without route changes had a higher percent-age under 100 feet with the virtual HUD configuration (73.5 percent) fol-lowed by common HMD video (57.5 percent) (Table 6-XXVIII). In runs with aroute change, the HMD-PMD configuration had the highest percentage of timeunder I00 feet (56 percent). Overall, the HMD configuration with the vir-tual MUD had the lowest average radar altitude. However, the variabilitybetween display combinations is small, i.e., only It feet.
Runs with a route change had faster average groundspeeds than thosewithout (Table 6-XXIX). This was predictable since the altitudes ofchanged routes tended to be higher, allowing faster average groundipeeds.The virtual MUD had the fastest groundspeed in runs with changes and thelowest in rune without. Overall, the common HMD video had the fastestaverage groundspeed.
6.6.2 Crash Rates (Virtual HUD: Enroute)
The Chi-square results indicate significant frequency differancea inthe percentage of crashes per total attempts. In all display configura-tions, the hard routes contained the highest (p < 0.05) percentage ofcrashes (HMD-PMD 75 percent, common 104D video 50 percent, dnd virtual HUD60 percent). The route change conditions contained the highest percentage
70
. . ... : ......... . .... ........ .. .. ... . .. : :.:::: U r .1 - ,... . .. ..

TABLE 6-XXVII
Pilot Perform~ance in Virtual HIUD Evaluation: IEnroute*
I - ~ -INDEPENDENT VARIABLES
STANDARD DISPLAY ROUTE ROUTEDEPNDENT VA0IA6LES OVERALL MIIAN DEVIATION CONFIGURATION DIFFICULTY CHANGE INTERACTION
PERCENT UNDER 100 PENT U5.34% 14.42 NO" NO P - 0,01 N
AVMRAGE GROUNIPEED 19,10N 16.01 NO NE .2 N
AVERAGE ALTITUIDE 104.0 PT 1?15 No NB NE NI4INIAC LIVIL LITID TO 90-10 ___
TABLE 6-XXVIII
Virtual HUD Evaluttion: Average Altitude:1 Enroute
IDIP PIOULT ROUTE EASY ROUTE
DISPA NO NO OVERALLCOMINATION ROUTE C0HANDE ROUTE CHANGE ROUTE CHANGE ROUTE CHANGE MEAN
HMOD.f 120.1111 141% 101.w6 (66) 6.0412%) 121.0 (27.5%11 111.40 l
H MO-HMO 03.30(2%) 111,18(46%) 112,45576%) IN.0 01 511%) 107.51(COMMON VIOEO)
HMD.HMID 94.06 173.11) 113.00(47%) $3,111)73,9%) I01104(27 B6) 100.76I (VIRTUAL NUD).- t~SPPRCINT OTIEUDR100PET
I TABLE 6-XXIX
Virtual HUD Evaluation: Average Groundspeed Enroute
DIFFICULT ROUTE EASY ROUTE
DISPLAY NO NO OVERALLCONIBINATION ROUTE CHANGE RIOUTE CHANGE ROUTE CHANGE ROUTE CHANGE MEANI IMO.PM0 01141 67.00 61.4 81.90 6.77
IINOIMmD 7118 07 73.01 004111 7263(COMMON VIDEO)
14MO.HMO 821 0.94 61.14 500 60111
II 71

of crashes per attempts within difficulty levels with the exception of theHMD-PMD hard route. The virtual HUD configuration had a higher percentageof good runs per attempts (40 percent) than the common video (46 percent)or HMD-PMD (46 percent) conditions.
6.6.3 Discrete Activities (Virtual HUD: Enroute)
6.6.3.1 Pe'rcert Time Narrow FOY Commanded
The pilots made all of the FVY commands and enabled the narrow FOVmore times in routes with changes than without and more often in difficultroutes than easy. The largest percentage of time was 9.2 percent with.common W video, difficult route with change. No pilot used the narrow
h oOV while the copilot had a P D display. The mean distance to the nextcheckpoint was 1.73 nmi.
6.6.3.2 CDU Operation
Discrete actions were examined to evaluate the sequence of key actua-tions used to manually capture the LZ on all runs, The sequence errorswere dispersed between the display combinations, but clustered in the routechange conditions. Tho most common error was depressing Line key S insteadof 6 foloved by more than one line key depression after a function key.
Review of the CDU route change keysequence requiremnts revealed the imajority of errurs (seven) to \e in the IWD-P"P configitation on a diffi-cult route foll.oed by HMV vlr~u4i HUD on an namy routs (thrae) and HO)--PHD, easy route (two).. The como NM0,video end virtual HUD difficultroutes had no errors, Tsblss,6-XX and, XXXl'fndicwt4 the 6*quence and typeof errors encounthreO durins route thanjes., These tablesreval parallaxproblems and hey function mlsunderston4ing.
6.7 ou*A&uy
Tht sii of chn landln* sones affected pilot performance tore connis-tently and predictably than any other factor. The slsller zones requiredmore precise amneuverina that resulted in longer land times, higher radaralditudes during approach, smeller radial error, etc. To land in theceon? the pitct must have the helicopter under control, requiring precipe
inforlvwLion ptoeossing.
6he syshology phase results indicated the hover symbo)l6y 4et to bethe mwst consistent in its recults. The flight symbology was needed up toappruximately 0.3 nml (coo the touchdown point, the transition symb.3logyuntLil 0.05 to G.03 nal from touchdown, and the hover symbology 0.03 nmi totouchdown. The transition symbology gave the pilots the extra informationneeded rat precise landings.
Trie narrow FOV resuls in inconsistent pilot performance whenApprosching the landing s ies a. compared to the wido and dual FOV. Pilots
72
I
.. ... .... - . - . - v / ,

'kABLE 6-XX
I Master Function Keay Errors dui±ng R96Ue 0a19G
FREQUENCY RROR SEQUENCE
I DEPRESSED DIR INSTEAD OF FLT/PLN]
3_ __ _ _ _ _ _ _ __DEPRESSED PLT/PLN INSTEAD OF DIR
TABLE 6-XXXIJ1
- Line Key Errors during Route Changes
FREQUENCY ERROR SEQUENCE
3 SEVERAL LINE KEY ENGAGES AFTER ONEI FUNCTION KEY
1 DEPRESSED LINE KEY 11 BEFORE DIR
I1 DEPRESSED LINE KEY 4 INSTEAD OF 51 DEPRESSED LINE KEY 4 INSTEAD OF 9
I2 GENERAL CONFUSION OF KEY FUNCTIONS
~~73

isi
were unable to smoothly approach the zone when forced to use the narrowFOV. The dual FOV capability resulted in a minimal amount of time in nar-row FOV. The appare, t low usage rate could indicate that for this specificlow level navigation mission, pilots did not find the information providedby the narrow FOV helpful in performing the specific casks required of thepilots as evidenced in performance differences. The narrow POV reqaired ahigher sensor usage rate to compensate for the lack of information. n
The pilots in the HMD-PD evaluation generally performed'better usingthe RkD. The ease of slowing the sensor allowed the pilots to-exkmine tar-rain features and maintain low attitude with comparative ease. The pilots'landing approach and touchdown was smoother when using the OD. During thee nroutoe portion, khe crew performance in flatter torrain was slightly.better'whi. the pilot used the PMD, but performance in mountainous terrainwal better with the pilot on the SM .
During low level landing aone approach, the copilot display has aninconsistent effect on performance measures. His workload during thisphase is critical to navigation, terrain avoidance, and general pilotassistance. During the enroute phase he can perform well with the HIND andthe P D. It appears to be the pilot's display that has the greater impacton performance measures.
The virtual HUD evaluation varied the copilot display combinationsfrom PMD, HKD, and MMD virtual HUD while the pilot remained on the HMD.During critical approech to landing, the copilot tends to perform betterwith the HMD. During touchdown the copilot performs better with the PKD.During the enrouts phase, crew performance was best with the ID for thecopilot with or without the virtual MUD. The differences between the threedisplay combinations are slight and indicate that the task pressures feltby the copilot may be the critical factor.
During landinSo the sensor remained centered 90 percent of the timein asimuth and 55 percent of the time in elevation. Maximum sensor gimbalangle used during the evaluation was 60 degrees in asimuth and 60 degreesdown in elevation. The sensor was never sleved up in elevation.
The copilots' operation of the CDU indicated that it is a workablepart of the system, without overburdening the copilot. The errors indicatea necessity for correction of the display alignment and CDU feedback when afunction key is initLalised.
6.8 Subject Pilots
Tables 6-XXXII and 6-XXXIII contain the overall performance altitudesfor the pilots participating in the research. They have been ranked fromthe lowest attitude (best performance) to the highest (worst performance).Their performance was correlated with their actual flight hours. There isno correlation between simulation performance and flight hours.
7'

I TABLE 6-XXXII
Rel.ative Rank ingm of Crown Based onAverage Altitude (240 :1)I TIUD[AVIAGE FLIHT
RANK ALTITUDII HOURS
2 Is) 7660 51 2(V 77.42 450
4 12) Bill so
S (NH" 42.11 610 A.~
0 S V ) 1 0 3 1 6 2 7 1
7. 444) 17465 620
2044 18.16 440f
2( 46 160 123022 ($1 10 400
261)11.1 0Is I) 111.96 30Is 4)4 1lu3 467
20 IFI "lob, 5II144 10241 s
I 24 ) 41 1162 420is IF)1 24250 470
20 IV 104M 440
24 :0 04 0211 I 19.0 go
n IF 11014 e

TABLE 6-XXXIII
Relabive Rankings of Crews Based onAverage Altitude (1200:1) ii
ALTITUDE AVERAGE FLIGHT ifRANK ALTITUDE HOURS
I (V)* 91.61 440
2 (V) 03.54 481 =
3 (V) 118.28 865
4 (V) 122.82 450
5 (H)* 142.86 487.7
8 (H) 167.48 310 H7 (H) 170.63 320
8 (H) 234.78 40 II*V a VIRTUAL HUDHe HMO/PMD/CDU
All of the pilots had to learn the new system and develop new crewinteractions and scan patterns. Their attitudes and learning abilities hadmore performance effect# than anything else.
it
i
V___ 76 1F
FOR1

7.0 PILOT OPINION RESULTS
SI ' I
All research participants responded to extensive questionnaires deal-ing with the simulation facilities, concepts under study, and recomuendedchanges to the HNVS configuration. V
I 7.1.1 Simulator Orientation
I The majority of pilots (82 to 91 percent) felt the briefing upon arri-val was adequate, as were the cockpit checkout and mission briefing mate-rials. Ten hours of cockpit training were recommended.7.1.2 Simulator Realism
The cockpit, aero model, force feel, and motion base received gene-rally average ratings on their individual components. The terrain modelhad high ratings on its realism and cultural features. The overall simula-tion rating was 4.2 with 5 being the highest rating possible, GeneralSimulation coments made by four or more of the 35 pilots were as follows:
I Needs better ventilation (gets hot)
2 Didn't notice any wind effects
3 The only time the motion base seemed to simulate actual flight wasduring turbulence; it could use engine noise and vibration
overall, the simulator and terrain model were excellent except forthe few minor environmental problems listed previously.
7.1.3 Symbols
The digital heading display was helpful to 78 percent of the pilots,
and 22 percent has a neutral reaction to it. General symbology comentsindicated by four or more pilots were an follows:
I Legibility was good
2 Size was good
-3 Contrast was adequate to good
4 Movement was good
I-_ _ _77
Wets -

5 Sensitivity to flight coitrol was good
6 Digital readout change rate was good.
Pilot comments specific to the symbology formats were as follows:
SFlightt
a Analog Scale-Increase thickness, limit to 200 feet AOL, moveto the left of screen, box altitude like the digital heading
Need turn and slip indicator in bottom center of screen (mostpilots)
ic Need angle of bank indicator
/ d Corridor line riot necessary
a Optional altitude bar distracting and not used
Torque Indicator-Analog not necessary, digital readout givesenough feedback
Increase groundepeed size
h Put 100 foot hash marks on rate of climb.
2 Hover:
Add turn and slip indicator
b Add hash marks in center of screen to indiate airspeed rele-
tive to length of hover velocity vector. I7.1.4 Controls
Sixty-six percent of the pilots would not like to move any of the con-trol panels. Sixty-two percent would not move any control locations.Regarding control operations, 64 percent would not make any changes infunctions, 80 percent would not change control movements, and 67 percentwould not change the sensitivity. Control labels would not be changed by97 percent, and the present design was acceptable to 86 percent. The com-ments made by four or more pilots regarding controls are as follows:
1 Recommend changing the location of the FOV select and Hover Posi-- tion select: FOV to the collective, Hover Position to the YOV
select position, or just exchange location of FOV and position box
2 Change sensing of sensor control switch; forward should slow sensordot'n, back should slew sensor up
3 Collective is slow to respond. '1
7$

15General comeuts mde by four or more pilots were:
I Familiarixation with the terrain makes navigation easier (10pilots)
2 Familiarilation with the terrain equals real world briefing witua-tions (six pilots)
3 3 Aural warning signal to indicate low altitude would make missioneasier and eater
I 4 Need extensive training
5 External visual coes should be used: in an actual mission youwould be able to see outside to some degre. to help you fly.
7.1.6 Instrument Monitoring, Importance and Lighting
All pilots monitored the PMD continuously and considered it veryimportant. Fifty-nine percent of the pilots monitored the ODU occasionallyand considered it important. The majority of pilots monitored the remain-ing instruments only occasionally or not at all and considered them onlymoderately important.
3 Sixty-seven percent of the copilots monitored the PHD continuously andthe remainder of copilot# only frequently. They considered it important tovery important. All of the copilots monitored the CDU frequently to con-ti nuously and considered it to be very important. The remaining panel
* instruments were monitored occasionally or never by a majority of thecopilots. These instruments were considered to be of only moderate
, importance.
* IThe cockpit instruments were grouped into lighted groups (Table 7-1)that could be dimmed or turned off. Of the pilots and copilot@ saessing
r only PMD conditions, about 35 percent turned off lighting group I and about* 30 percent turned off lighting group 2. Most felt the electromechanical
instruments were not necessary with the PMD and CDU. Most pilots (92 per-cent) turned off lighting group 2 while using the HMD. This group ofpilots also dimmed the CDU. The copilots wearing the HHD dimmed lightinggroup 1 (67 percent) and group 2 (73 percent). Overall, copilot. tended todim cockpit light. rather than turn them off more then pilots. It was partof the copilot', task allocations to perform functions in the cockpit
, requiring some level of lighting.
Comments made by four or more pilots regarding instrumentation were:
I Only required PHD information and so little lighting as posible
I PMD red filter: no effect (half), helpful (half) 4
1 79 '
T 77

TABLE7-
Cockpit Instrument Lightingp Groups
GROUP I GROUP2HAIRSPEED TRIPLE TACH
TURN AND SLIP TORQUEMETER
BARO ALTITUDE RADAR ALTITUDEW
CLOCK ALTITUDE
EDHI
CDU
so

I
i 3 Dimmed lights to reduce diutraction but still able to use as backup
i 4 All lighlts had to be off or very low when using the H
5 P1D should have emergency inputs when needed so no instruments arvneeded
6 Exchange locations of the bearing distance heading indicator andthe Radar ALT for both pilot and copilot
I 7 Put HRVS control on instrument panel below PHD
8 Delete CORR and ALT ON
9 Had to scan the turn and bank indicator to supplement the P14D
10 Put barrier on copilot's PMD so light does not distract pilot onHID
11 Have emergency information and engine information available on PHT)
- or CDU so no additional instruments are needed.
7.1.7 Task Allocations and Orew Techniques
misjority of pilot* participating. Additions and changes indicated were as
j follows:
Copilot monitor airspeed and aircraft trends
I 2 Copilot monitor vertical speed indicator and altitude during hoverand landing
- 3Copilot has to navigate.
Opinions on sharing sensor field of view and slewing varied with eachpilot group. Several crews allowed only the pilot to slew the sensor, thecopilot had to request the pilot to slew when necessary. Other crewsallowed the copilot to slew the sensor only if he warned the pilot butnever during a hover. A few crews allowed the copilot total sensor controland the pilot would request slowing. Individuul flight crows quicklydeveloped their own techniques. Most crews had the pilot control field ofview; however, this function was rarely uaed.
i The participants felt the pilot's primary duty was to fly the air-craft. Extensive information was transferred verbally from the copilot tothe pilot. The result was a constant dialogue between them regarding allflight information.
~4I
I 4
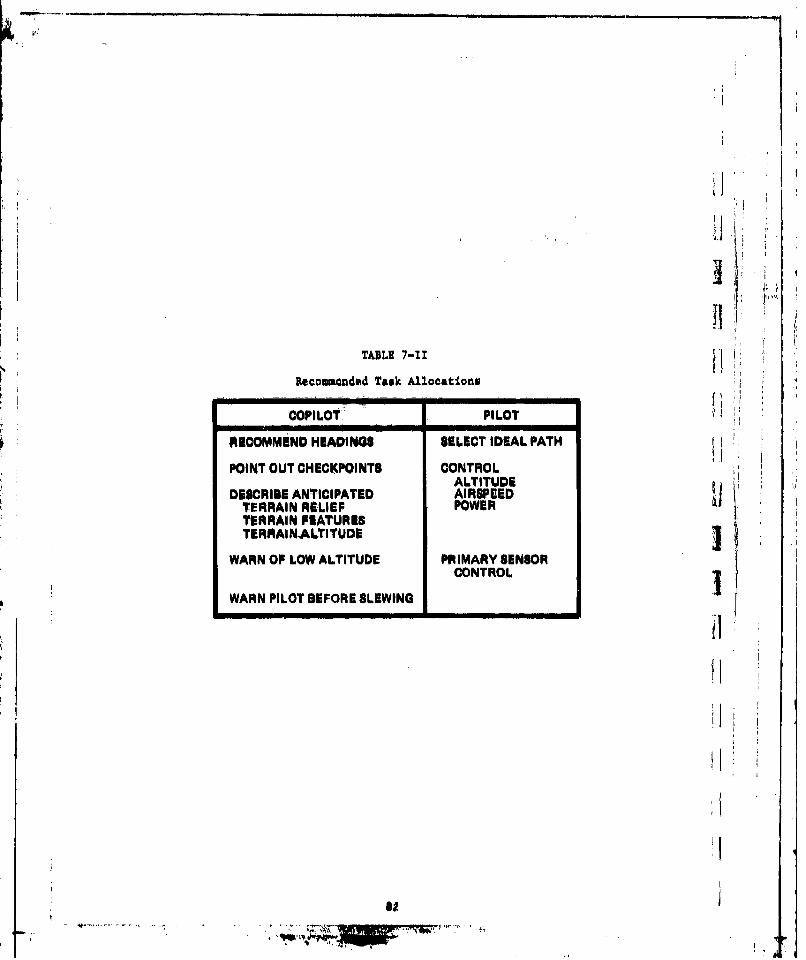
*IT
TABLE 7-Il fRecomended Task Allocations
tCOPILOT PILOT
RECOMMEND HEADINGS SELECT IDEAL PATHH
POINT OUT CHECKPOINTS CONTROL
DESCRIBE ANTICIPATED AIRSPEEDTERRAIN RELIEF POWERTERRAIN FEATURESTERMAIN-ALTITUDE
WARN OF LOW ALTITUDE PRIMARY SENSORCONTROL
WARN PILOT BEFORE SLEWING

I7.1.8 Overall Mission Ratings
All participants in the 240;1 scale evaluations rated the mission easeI and safety in three terrain types. The results were predictable missions
were significantly (p < 0.05) safer and easier in flat terrian followed byrolling hills and mountainous terrain (Figures 7-1 and 7-2).
I7.2 Approach and Landing Symbology Evaluation
According to 82 percent of the pilots, sufficient time was spenttraining for approach and landing with the four symbology sets. Ceveralp,ilots requested more initial training on hovering and landing.
Filots were asked to rate the ease and safety of approaches, landings,and takeoffs with each of the four symbology sets. These ratings are shownin Figures 7-3 through 7-8. The ease and safety of the flight symbology in Al
* the approach phase was predictable since it imparts necessary enrouteinformation. The transition symbology also gives desired enroute feedback.The ratings were tested for significant differences by using a T-test forsignificant differences between the means. Significant differencesp < 0.05) were found between the hover and ight and between the hover
meter and flight symbology for safety and ease of landing in small and verysmall cones. Examination of symbology ratings alone indicated the hover tobe the easiest and safest at landing followed by the hover mater, the win-dow box, and flight symbology sets %p < 0.05). The significant (p < 0.05)rating trends at takeoff were essentially the same, the exception being a
* i slightly higher rating for the flight symbology over the window box.
Comments by four or more pilots in this symbology evaluation phasewere a follows:
1 Sensor aleving during landings tends to disorient
2 Copilot should keep track of airspeed
3 Only pilot performed senoor sl.wing (five crews)
4 Only copilot performed sensor atewinS (five crews)
5 Yield-of-regard adequate for transport mission: good
6 Field-of-view change left up to pilot in command
i 7 Copilot slewing sensor without warning causes pilot vertigo
8 Panel mounted display location good (eight crews)
9 Display size good
83
! *,.*r. -,.', Y

ZKYREMELY
EASY
VARY
lAEMPOI141LI
FLATOUL ROLIN
HILLS MOUTAINOUS
TERRAIN TYPE
Figure 7-1. Ease of Actual MissioniAll 240:1 Evaluations Combined
EXTAEMELY fSAFI
VERY GAPESAFE
SAFETYMEDIUM
DANGEROUS
VERYDANGEROUS
EXTREMELYDANGEROUS
SAFETY ROLLING ANU
SAFETY HILLS MOUNTANU
TEIRRAIN TYPE
Figure 7-2. Safety of Actual Mission: All240:1 Evaluations Combined
=-77, "
Ali
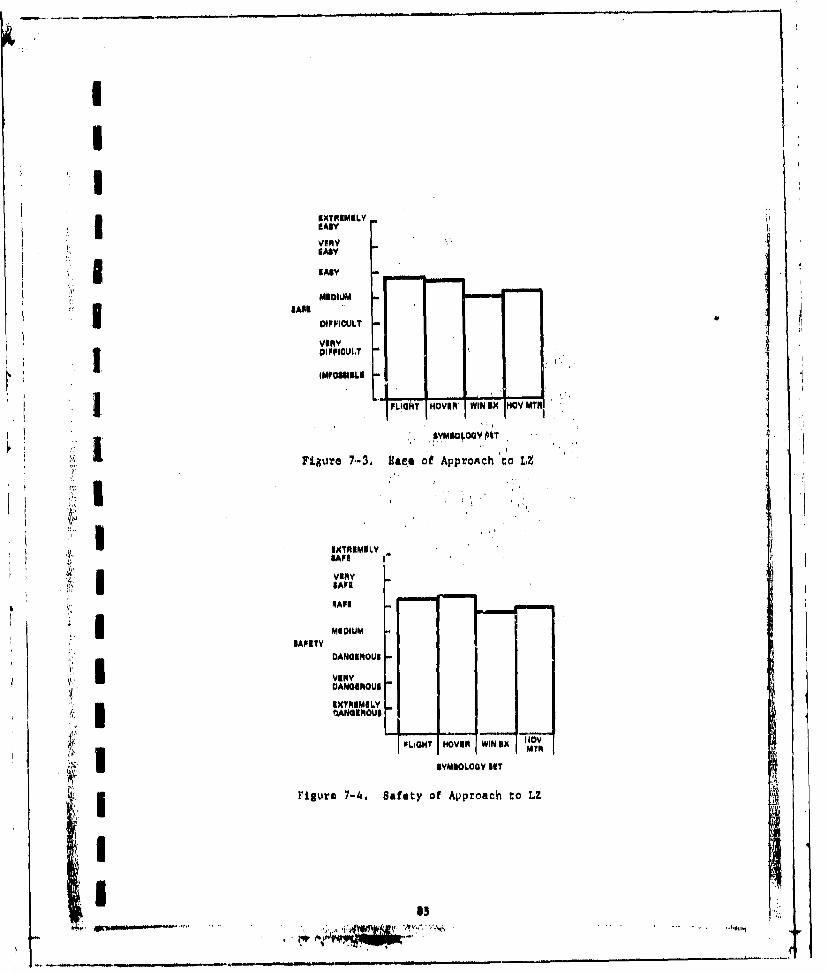
K)(1NIMILY
VERY
EASY
IIMII DIFF~ICULT
VERY
IMPOMhILI
I PLGH~140VINWIN ox NMOV MTAM
F~gU~G YMSOIOGY 04T
Figre -3,gaee of Appronch'to LZ
EJ(TAIMILY ,
SAPE
s 4API
I MEDIUMlAFlY
DANGEROUS
VINYDANGIROUB
NXTRIMILYOANGIROUl
PLiONT HOVIR WIN 'X 'TM
SlYMIOLOOY INT
rigvre 7-4, Safety of Approach to LZ
I L
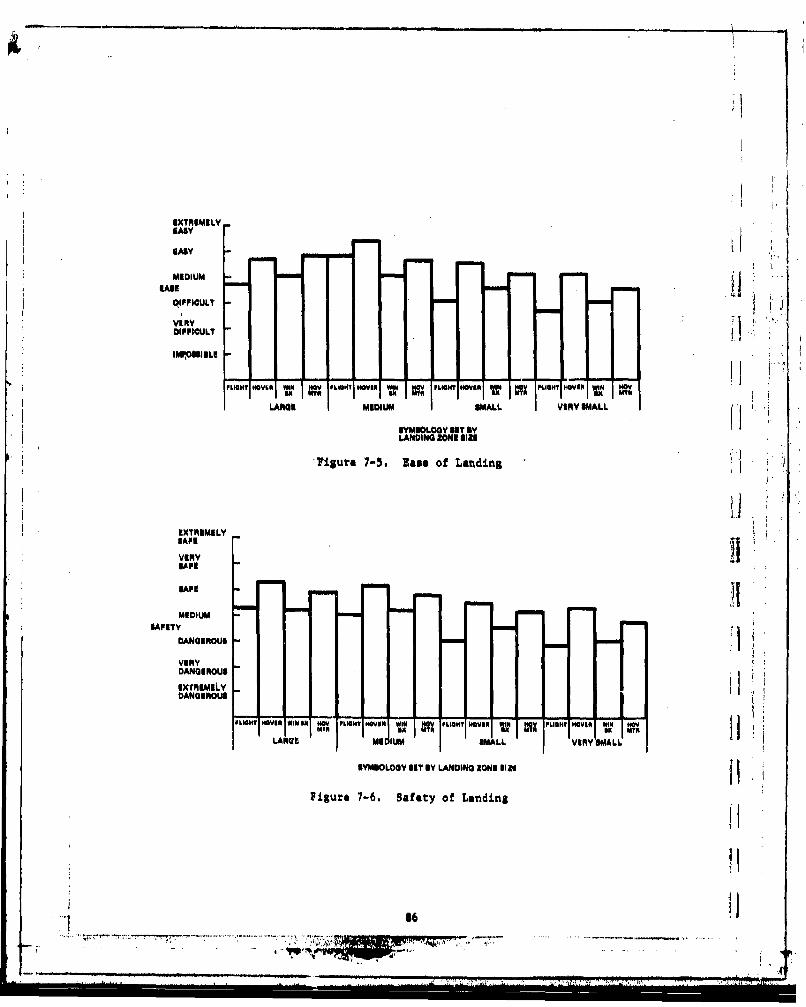
MEDIUM
PI FFICULT
IMPOSSI ELI
PL viG n H VL I lay LO M 1104 HOVER WINN ~ PGHVR 1 LIH OE I O
LAG EIMSMALL VINY SMALL
SYMOLOGY SIT byLADING ZONE SIE
F igure 7-5. late of Landing
IKYPIEMILYSAFE
VIRYSAFI
SAFE
MEDIUMSAFETY
DANGEROUS
VERYDANOEROUS
DANGEROUS
P1.16119XOIRV IVEN P.1GM? MER WI.. P I OX PLIGNT HOveR WIN mIv
LANGI ME WU MALVRY SMALL
SYMUOLOGY SET BY LANDING ZONE 1I1 Ad
Figure 7-6. Safety of Landing
86t

III
-i iii
I I-I
Ii F ~- sF111 :7
~ iii U-
IH I)L ~a4
I r ii~
IL
=I~~iI
I I
ii 87
hi

10 Display redolution fussy, needs contrast (six crews), good (threecrews)
11 Color and lighting for display and instruments fine
12 Smnsor: elevation sensing backward.
7.3 Approach and Landing Field of View Evaluation IJAll pilots (N-B) in this evaluation felt enough time was spent on
approaches and landings with the different fields of view. ]The pilot ratings of ease and snfety of the fields of view in
approaches, landings, and takeoffs are shown in Figures 7-9 through 7-14.In approaches to the landing sons, the narrow field of view was consideredsignificantly more dangerous and difficult than wide and dual field ofview.1.
In the landing phase, pilots preferred the wide and dual fields ofview consistently over the rarrow. The pilots in this evaluation did notrate any field of view as easy, or safe, ratings were generally lower thanin the symbology evaluation. The preference trends were the seme in thetakeoff phase. This phase was considered slightly easier and safer thanthe landing or approach phases .j
Comments made by three or four pilots in the field of view evaluationphase were as follows:
I Copilot did sensor sleving
2 Helmet mounted display ginballed sensor would simplify task J3 Field of view controlled by pilot
4 No instrument tights turned off I5 Panel mounted display location good
Display size good.
7.4 Approach and Landing HMD-PMD Evaluation
Eighty-three percent of the participants felt enough time was spenttraining on the display configurations. The majo ity of pilots using the00 felt that the field of regard was adequate for the transport mission.fl
Th pilots rated ease and safety of display configurations duringapproaches, landings, and takeoffs (Figures ?-15 through 7-20). There waslittle response variability; however, consistent trends were apparent. TheRHO for the pilot I. rated safer and easter than dual PMDe in all phases.
.4 86I.. -
~ I

*~ EXTREMELYEASY
VERY
ASYEASY
EASE MEDIUM
DIFFICULT
VERYDIFFICULT
IMPOSSIBLE
NARROW1 WIDE DUAL
FIELD OF VIEW
Figure 7-9. Ease of Approach to LZ
HXTREME LVSAFE
VERYSAFE
SAFE
MEDIUM
SAFETYDANGEROUS
VERYDANGEROUS
EXTIRSMELY
DANGEROUS
NARROW1 WIDE DUAL
FIELD OF VIEW
Figure 7-10. Safety of Approach to LZ
89

EXTREMELYEASY
EASY
MEDIUM
DIFFICULT
IMPOSSIELI
NAROW IDE DUAL INARROW1 WD DJUAL NARNROW WIE DUAL
LARG IIILANDING 'ZONE SIZE1
Piguro 7-11. Ease of Landing I
EXTREMELY 1
SAFE
VERY
SAFE
MEDIUM *
SAFETY
DANGEROUS
VERYDANGEROUS
DNEOSNARROWJ WIDE IDUAL NARW WIDE DUAL NARROW1 WIDE DA
LARGE MEDIUM SMALL
FIELD OF VIEW mY LANDING ZON6 SIZE
Figure 7-12. Safety of Landing
901
*T -1*
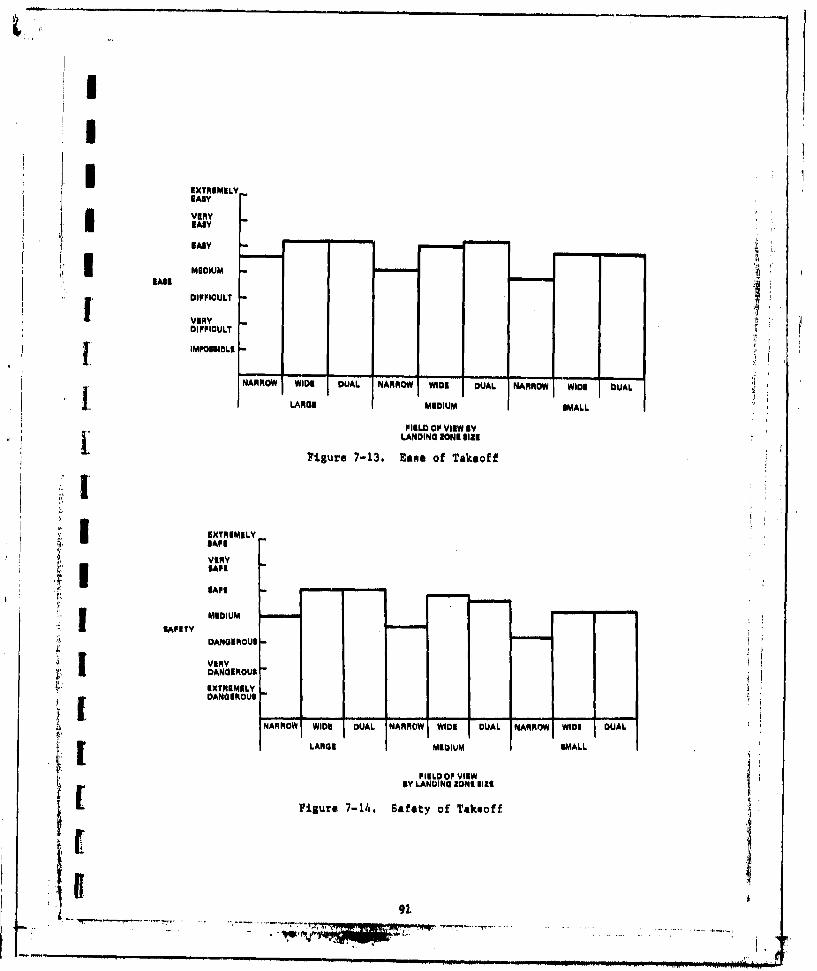
EASY
VERY
EASY
EAS SYBIU
DIIULT
VERYDIPFICULT
NARROW WIDE DUAL NARROW WIDEI DUAL NARROW WIDE DUAL
f LARGE MEDIUMSAL
FIELD OF VIEW IVLANDING BONE SIZE
Figure 7-13. Eaxe of Takeoff
SAFE
SAME
SAFE
SAFETY MDUDANGEROUS -
VERYDANGEROUS
EXTREMELY
NARROW1 WIDE UA NRRWi WIDE DUAL NARROW WIDE DUAL
LARGE MEDIUM WMALL
FIELD OF VIEW
By LANUING ZONE EillE
Figure 7-14. Safety of Takeoff

90111R1MILY
SAFE
SAFE
MEDIUM
SAFETY DAEOU
DISPAY ONFGURTIO
XTREMLY
DISPLA COFGRTO
VERY
MDIIUT
IMFONIBLE
FPMDM HMODFMD HMD.HMD
DISPLAY CONFIGURATION
Figure 7-16. Ease of Approach to LZ
92

IXTRRMSLY
EASY
EASY
KAKMEDIUM
DIFFICULT
VERYI)IFFICULT
IAPIBaSILK
PMO.FMD HMP.FMD 14M0.HMD FMD.FMD HMDFMD HMD.M
LARGE SMALL 6.-mDDISPLAY CONFIGURATION BY LANDING ZONE SIE
Figure 7-17. Base of Landing
SAFWAYE
II SAFESAFK
MEDIUM
DANGERPOUSSAFETY
VERYDANGEROUS
EXTREMELYDANGEROUS
PMO*Mb HMO4'MO HMO-HMO FMD.PMD HMD.FMO HDIM
LARGESMALL
DISPLAY CONFIGURATION lY LANDING ZONE SIE
Figure 7-18. Safety of Landing
I~ ~ 93

EASY
MEDIUM
EAAYDIFFICULT
IMPOSSIBLE
PMD41MO HMD.PMO HMO-HMO FNO.PMO 14M0.PMO I4MD.I4MD
LARGE 1Z1NE SMALL WIN
DISPLAY CONFIGURATION BYLANDING ZONE 1IZE
Figure 7-19. Ease of Takeoff I :
VETRIY
SAFE
MEIUMSAAEE
DANGEROUS
VERYDANGEROUS
CANCEROUS
FMD.FMD HMO.FMD HMD.NMD PMD.PMO 14Mb.FMo HMD.HMD,
LAMREZONE SMALL ZONE iDISPLAY GONFIGURATION lY
LANDING ZONE SIZE
Figure 7-20. Safety of Takeoff

I
For landing in small zones, the HMD-PMD is rated significantly (p < 0.10)safer than the dual PMDs. The HMD-PMD also is rated significantly (p <
1 0.05) safer than the P1HD-PHD combination during takeoff from the largecone. There was very little rating difference between HMD-PMD and HHD-HI4D.
I However, the trend indicated a preference for the HMD-PMD Kor safety andthe HMD-HMD for ease. This reflects the preference for having the copilot
relatively free inside the cockpit in case of an emergency.
Participants were asked to indicate the minimum safe target altitude
at 60 to 80 knots and the maximum safe target groundspeed at 50 to 100 feetAOL, which was attainable on an actual night mission. Table 7-111 containsthe responses according to display configuration and terrain type. BothHKD combinations had faster groundspeed ratings than the dual PI4Ds. Thealtitude ratings are more variable with the 14MD-PMD tending to be slightlylower.
Coimments made by three or more pilots in the approach and landing
HMD-PMD evaluation phase were as follows:
I Feel more comfortable as copilot on PMD than IIMD (more visual cues)
2 Copilot controls PHD sensor slowing on approach and landings
3 PMD location acceptable
4 PMD size acceptable
5 HMD display size should be larger.
Additional questions addressed the issue of possible visual problemsdue to the cockpit lights and displays. Fifty percent of pilots flyingwith the HMD experienced visual problems with individual comments regardingthe HID as follows:
I Tend to fixate on red panel lights (instrument panel lights dimmed)
2 Vertigo caused by moving too fast
3 Need finer brightness control
4 Put HDU on inboard eye to facilitate looking out window.
As copilot, 42 percent experienced visal problems. Individual com-I. ments regarding the HXD were as follows:
I Hard to navigate with the IDD while functioning as copilot (twocopilot comments)
2 Need dual sensors.
A[
95
.7. .. .. .i .

TABLE 7-111 iMinimum Safe Altitude at 60 to 80 Xnots andMaximum Safe Speed at 50 to 100 Feet AGL
RADAR ALTITUDE (PT) AND SPEED (KN) BY DISPLAY CONFIGURATION
PMD-PMD HMD.PMD HMD-HMDTERRAIN ALTITUDE SPEED ALTITUDE SPEED ALTITUDE SPEED
FLAT 68.54 87.5 66.45 90.83 68.95 87.06ROLLING HILLS 98.84 73.33 101.04 74.16 105.41 71.251
MOUNTAINOUS 120.22 52.08 103.88 55.0 115.68 62.91
OVERALL MEAN 95.76 70.97 90.45 73.33 96.68 73.75-
96

,II
For effectiveness and &afety, 67 percent preferred the HMD-PMD con-I figuration and 33 percent the dual PMD*.
7.5 Enroute HKD-PMD-CDU Evaluation
m Seventy-five percent of the pilots felt enough time was spent training
on the display combinations. The majority of the pilots felt the field ofI |regard was adequate for the transport mission. Regarding the field ofj view, 38 percent felt it was okay for terrain following, 50 percent indi-
cated it was okay for navigation, and 63 percent said it was okay forcheckpoint and landing tons identification. Twenty-five percent indicatedthey rarely or never use the narrow field of view. The wide field of viewwas acceptable for terrain following (63 percent), navigation (75 percent),checkpoint identification (75 percent), and LZ identification (75 percent).ITwenty-five percent preferred the wide field of view in all situations.
In rating the ease and safety of the display configurations, the HHD-PMD was consistently safer and easier than either the IMD-HMO or PMD-PMD.Although the variability is small, Figures 7-21 through 7-27 show the
pilots' preference for HMD-PMD followed by HMD-HHD. The pilots' OID dis-play is apparently the critical, preferred feature.
ITable 7-IV shows the pilot ratings of actual mission altitudes andspeeds. They prefer the HMD-PMD (75 percent) for ease and safety, andbelieve lower altitudes and higher speeds are attainable with the pilot
using the HtD.
Thirty-eight percent had contrast problems but were able to overcome
j them. Sixty-three percent expressed visual problems as pilot, such asresolution of the 1D4D, focusing inadequacy of the HHs, and limited cockpitvision with the HMD. Fifty percent of the copilots expressed problems of
I navigation and map reading while using the lOD. Eighty-eight percent con-sidered the IH1D-HMD combination to be Lhe least effective and safe. Theyfelt the HMD for the copilot was too restrictive and disorienting.
tIn evaluating the CDU, 62.5 percent of the pilots felt they receivedenough training. The CDU would have no effect on maintaining a low alti-tude according to 62.5 percent, while 75 percent responded that it would
I have no effect on groundspeed. The keyboard configuration resulted inproblems for 62.5 percent. All the pilots (N14) thought that the map dis-play was an effective navigation tool. In the operation of the CDU modes,87.5 percent had no problems. Thirty-eight percent expressed alignmentproblems with the line keys. Design changes expressed included a clearfunction for unwanted line keys, more precise line key to display align-ment, and an option to initialize more than one directed point at a time
I while using the DIR MFK. Generally, the copilot was able to operate theCDU with little interruption in other copilot functions except verbal feed-back and flight updates to the pilot. Figure 7-28 indicates the mission
[ was rated significantly (p < 0.05) easier with the CDU. Figure 7-29 showsI that using 'the CDU to change course would not increase the difficulty of
the mission.
97
7L
U ,,r

EASY
VERYEASY
EASY
MEDIUM
EA D.IP'PICULT'i
VERY
DIFFICULT
IMPOSSIBLE
PMD.PMD 14M0.PMO I4M0.4M0 PMD.PMO HMO-P?4 HMO4MD PMD4PMD HM04PMD bIMDMDM
FLAT ROLLING H4ILLS MOUNTAINdUE
DISPLAY CONFIGURATION BY TERRAIN TYPE
Figure 7-21. Ease of Actual Mission at 60 to 80 Knots and100 to 150 Feet AOL
EXTREMELY1SAFE
VERY jSAFI
MEDIUM IDANGEROUS
DANGEROUJS
EX(TREMELYOAkiGEROUI
PM0.PUD NMOPUD 14N0MD PMO.FMD HUD.FMD HMO.NMD PME)4bMb HMO.P*ID HMO-NM
F~LAT ROLLING WILLI MOUNTAINOUS
DISPLAY CONFIGURATION MY TERRAIN TYPEi
Figure 7-22. Safety of Actual Mission at 60 to 80 Knots and100 to 150 Feet AGL
96

EXTREMELYII EASY
VERYEARY *
EASYj
EASE I UDIFFPICULT
VERYDIFFICULT '
IMPOSSIBLE
PUM04*MD IMb.PMD W10MMOHD
DISPLAY CONPIOURATION
IFigure 7-23. Ease of LZ Identification
EXTRIMELY
VERYEANY
[ EASY
EAEDIFFICULT
VWAYDIFFICULT
IMPMSINLE
PMD.PMD NMD.PMD HMONHMD
DISPLAY CONFIGURATIONi
I.Figure 7-24. Ease of CheckpointIdentificationHi
49

KAII
EXTREMELYEE
VERYEAIY
EASY IMEDIUM
DIFPIOULT
DIPFICULT
IMPOSUILE
PDPDHMD.PMD NMDI4MID
DISPLAY CONPIGURATION
Figure 7-25. Ease of Navigation
|EXTRKMILY
EA8Y
VERYEASY
MEDIUM
EASEIDIFFICULT
VERYDIPPICULT
IMPONILE
PMD-PMD HMD.PMD HMD.HMD P D.PMD HMDPMD HMDHMD PMDPMOD HMO.PMD HMO.HMD
PLAT ROLLING HILL. MOUNTAINOUS
DISPLAY CONPIGURATION NYTERRAIN TYPE
Figure 7-26. Base of Terrain Following
100

SAFE[ VERYSAFE
SAFE
SAEY DANGEROUS
VEAYDANGEROUS
PM44AFO NMD.PMD HIMD FN#D NM.PWD MD44MCF.PI HMD41MO HMO-HMO
FLAT ROLLING HILL$ MOUNTAINOUS1DISPLAY qONPIGURATION BY
TERRAIN TYPE
Figure 7-27. Safety of Terrain Following
TABLJE 7-1V
Minimum Safe Altitude at 60 to 80 Knots andMaximum Safe Speed at 130 to 150 Teat AGL
RADAR ALTITUDE (PT) AND SPEED IKN) BY DISPLAY CONFIGURATION
FMD.FND NMD-FMD HMD~hMDTERRAIN ALTITUDE SPERD ALTITUDE APID ALTITUDE SPEED
FLAT 61111 104166 04.06 1 1194 64.1 107.1161
ROLLING HILL$ 66.63 111.N 90.00 531 03.6 86.67MOUNTAINOUS 141" 62.16 lIO" 56.43 13.14 6U."
IOVERIALL MEANT 100.81 84.02 64.4 0196 61 SE
101*1jlW .. ,,-,;,..

EKTREMKLVEASY
MEDIUM
DIFFICULT
VEY
IMPOSSIBLE
WITH CDU WITHOUT 00th
Figu~re 7-28, Base of Actual Mission at 60 to 80Knot and100 to 150 Post AGL
S KT NRN LYEASY
VENY
MEDIUMEA1E
DIFFiCULT
DIFFICULT IIMPOSFIBLII
NAVIGATION CHECKPOINT LANCING ZONE NAVIGATION CHECKPOINT LANDING ZONI 010 ID
NO ROUTE CHANGE ROUTE CHANGE 1TASK USING COU
Figure 7-29. Task Base with and without Course Change
102

IIj 7.6 Approach apd Landing Virtual HUD Evaluation
All pilots (N=4) felt they obtained enough time training on the dis-play combinations. Figures 7-30 through 7-35 show a significant (p < 0.05)preference for the I0-PMD configuration followed by the HO common video
all aspects of the mission. Table 7-V indicates that pilots believeor altitudes and higher speeds are attainable with the HMD-PHD con-f figuration.
All pilots felt the HMD-PMD combination was the most effective andsafe because it froes the copilot for other duties and allows easy pilotsensor slowing. No pilot expressed display contrast problems, although twosaid the 1MD caused eye strain and vertigo.
7.7 Znroute Virtual HUD Evaluation
Seventy-five percent of the participants believed enough training time
was given. The pilots indicated the field of regard was adequate. Themajority of pilots felt the wide field of view was adequate for the tasksrequired. Fifty percent felt the narrow field of view was too small forthe transport mission.
Figures 7-36 through 7-42 show a consistent preference for the 11D-PMDconfiguration across all aspects of mission ease and safety. The HMD-HKDvirtual HUD was considered the most dangerous and difficult display con-figuration. Table 7-VI indicates that the IMD-PMD configuration wouldresult in lower altitudes and higher speeds than the dual HKD configura-tions. The pilots expressed a preference for the copilot PHD for the pur-poses of map reading and navigation. They felt the virtual HUD made itdifficult to maneuver the head and use the CDU and that the time requiredto regain the display created a dangerous situation. All pilots felt theI HMD-PMD was the most effective and safe configuration and the 1MD- HMDvirtual HUD the least effactive and safe.
[Additional comments by one or more pilots included:1 The virtual MUD induced vertigo and did not allow a smooth scan
No contrast problems were experienced with the display combinations
3 A separate sensor is needed for the copilot
4 Panel mounted display location is perfect
Ii 5 The PHD does not restrict copilot head movements
6 Relocate HMD and communication wiring so as not to interfere with- movements
1 7 The HMD is adequate, safe, and ideal for low light missions but PMDpreferred.
I 10
.. .. 1 . ... 1,03. ]: , . ... .

EAY
SSSY
DIFFICULT
DIFFICULT
IMPOEINLE
MMDPMi 4M.M MD* .D
DISPLAY CONIGURATION
Figure 7-30. Rave of Approach to LZ
F SAFE
SAFEI
WAFTY MEDIU
DANGEROUS
DANOEROUS
"MM 0 H4MO-HO MD -NMD1M
DISPLAY CONFIGURATION
Figure 7-31. Safety of Approach to LZ
104f

EXTREMELY* EASY
MEDIUM
DIFFICULT
IMPOSSIBLE
NMD.FMD HMO-14MD HMO-HMO HMB'FPiO HMD.HMO NMD.NMb1COMMON HUD COMMON HUD
DISPLAY CONFIGURATION BY LANDING ZONE SIZI
Figuve 7-32. Bass of Landing
I SAFE
VERtYSAFI
I SAFE
I SAFETY
DAGRU[
M HMONHMD 14MD44M0 HMiB o HMOMO HMD MMMOCOMMON HUD COMMON MUD
LARGE WMALLDIBPLAY CONFIGURATION BY LANDING ZONE IIIZE
I Figure 7-33. Safety of Landing
Lo

MEDIUM IEAIE
DIFFPICULT
HMD44ADI HMD.MMD MD-HMD MD.PM HMD.MD HMI),HMOCOMMON UDCOMMON I UD
LARGE WMALL
DISPLAY CONFIGURATION BYLANDING ZONE SIZE
Figure 7-34. Same of Takeoff
SAFE
MEDIUM fSAP TY
DANGEROUS-
VIRY
DIANGEROUG
HMO.FM NMD.NMD HmO4MD NMO.PMO HMD.NMD INMD.NMCOMMON MUD COMMON M UD
LARGE SMALL
DIhSPLAY CONFIGURATION BYLANDING ZONE SIE
Figure 7-35. Safety of Takooff
I tI

* I TABLE 7-V
Minimum Safe Altitude at 60 to 80 Knots attdMaximum Safe Speed at 50 to 100 Feet AOL
RADAR ALTITUDE (PTI AND Pilo INN) BY DISLAY CONFIGURATION
CO MO A tUD HM.~ COMMON) MD M COMMND)U
I. LTROLLING HILLS MOUNTAINOU71171211S2376 442
IVRLMA 1I0P1A0 OOF1RTO 77911116 26, 10
VERANRYP[ Fgue Eni ofTerai Flloin
EAS07

IXTRIMII*
IAIY
NAPY
EASY
EAY
MIUM I
DIFFICULT
IMPOIIULI '
-. -.. ol.-oMOPD I4MD.MD MMDMd
COMMON MUDDIEPLAY CONFIGURATION
Figure 7-37. Base of Navigation
UEXTRIMILY
VERYEASY IAII
BABY I
MIDIUM
EASEDIFFICULT IVERYDIFFICULT
,..,..L .MO.NMD H il
COMMON M I IDISPLAY CONFPIGURATION
Figure 7-38. Ease of Checkpoint Identification
108

EXTREMBLY
.2 EASY
EASY
MEDIUM
EAEDIFFICULT
VERYI DIFFICULT
NM MPU 4 .IMD
DISPLAY CONtFIGURATION
Figure 7-39. Ease of LZ Identification
I SAFI
SAFE
I MEDIUMSAPlTY
DANGENOUS6
DANGEROW1
HMD.PMD IHMD.NC~H-MO IMD.I4MD NMDFMD HMD-HMD HMDI4D MDMD NMDIH MD.$MDI
COMMON MUD COMMON HUD COMMON UIFLAT ROLLING HILLS MOUNTAINOUSDISPLAY CONFIGURATION BY
TERRAIN TYPE
IFigure 7-40. Safety of Terrain Following
109

EASY
VWAY
EASY
EASY
ERSE MEDIUM
DIFFICULT
VERYDIFFICULT
HMMO04 P DIMD , M MO.M HMD-PMD HMO-NMI) MMD-MMD MMHMO HMD-M MMD-MCOMMON HU COMMON MUD CMO U
FLAT ROLLING MILLS MOUNTAINOUS
DIPLAY CONFIGUIRATION IV TERRAIN TYPE
Figure 7-41. Base of Actual Mission at 60 to 80 Knotsand 100 to 150 Feet AOL
SAFI
VERY 1SAFI
RAIYMDIUM
DANOEROU11
WHRYDANGEROUS
HMD.PMD ~ ~ HW MM.M MDIMD MD HMOMI)MDMD M.M M.MDMOICOMMON HMUD COMMON HMDHM D-DHOHbHOH
DISPLAY CONFIGURATION BY TERRAIN TYPE
Figure 7-42. Safety of Actual Mission at 60 to 80 Knotsand 100 to 150 Feet AOL
110

TAL 7V
TERRAIN M112.u__Safe Altitudeat 60 to 80Knots and COIURIN
-- LIUESEDATTD SPEED ALTITUDE SPEED
FLAT11.13 825 187785
* ROLLING HILLS 120 71.25 138.75 65 147.5 81.25
MOUNTAINOUS 142.5 63.75 165 55 176.25 51.25
OVERALL MEAN 125 75 14.6 67.5 154.16 63.76

The actual mission was rated significantly (p < 0.05) easier with theCDU than without (Figure 7-43). hien using the CDU, route changes do notmake the mission tasks more difficult (Figure 7-44).
All the pilots felt they obtained enough CDU training. Seventy-fivepercent felt the CDU helped to maintain a low altitude, and 50 percent feltit helped to increase groundspeed. These respondents felt it mased naviga-tion duties and increased orientation, which allowed more time for concen-
tration on flight tasks. The majority of pilots experienced no keyboardproblems or initialisation problems with the different modes. The linekeys did not cause great difficulty for most of the CDIU users, once theysolved their parallax problems. The copilots felt the tactical map display fiwas useful. Initialization of the DIR function required the copilot toleave his flight scan, and the pilot workload increased momentarily.
7.8 Side Studies
Available time allowed the conduct of side studies in the major IIresearch schedule. However, these studies did not warrant full scale fac- -torial designs, nor was there enough data to conduct any objective analy-sis. The followin: subjectsve summarles are based on four pilots for eachevaluation.I'
7.8.1 Radar Analog Scale
The pilot opinion was mixed on the effects of removal of the radaranalog scale during hover. Half of the pilots believed it cleaned up thescreen and improved hover performance and half believed it degraded per-formance and required more scan. Pilot opinion in favor of the changes Iincluded improved midecreen scan for basic maneuvering, There was agree-ment ou a preference for the radar altimeter readout in digital 1 footincrements below 25 feet.
7.8.2 Landing without the Simulated Crew Chief
Reaction was mixed on the requirement to land unaided by the crewchief. Half of the pilots felt that not having a crew chief had a moder-ately to greatly deteriorating effect on their ability to hover and land.The remaining pilots felt no effect, relying more heavily on symbology and Iskill of controlling the hover. Halt believed that the sensor providedenough information to land easily and safely. These pilots relied more onslewing down than left or right. The other half felt the sensor landingcreated a dangerous and difficult condition. Scan patterns and crew inter-action was not changed by not having a crew chief. I
i
112;
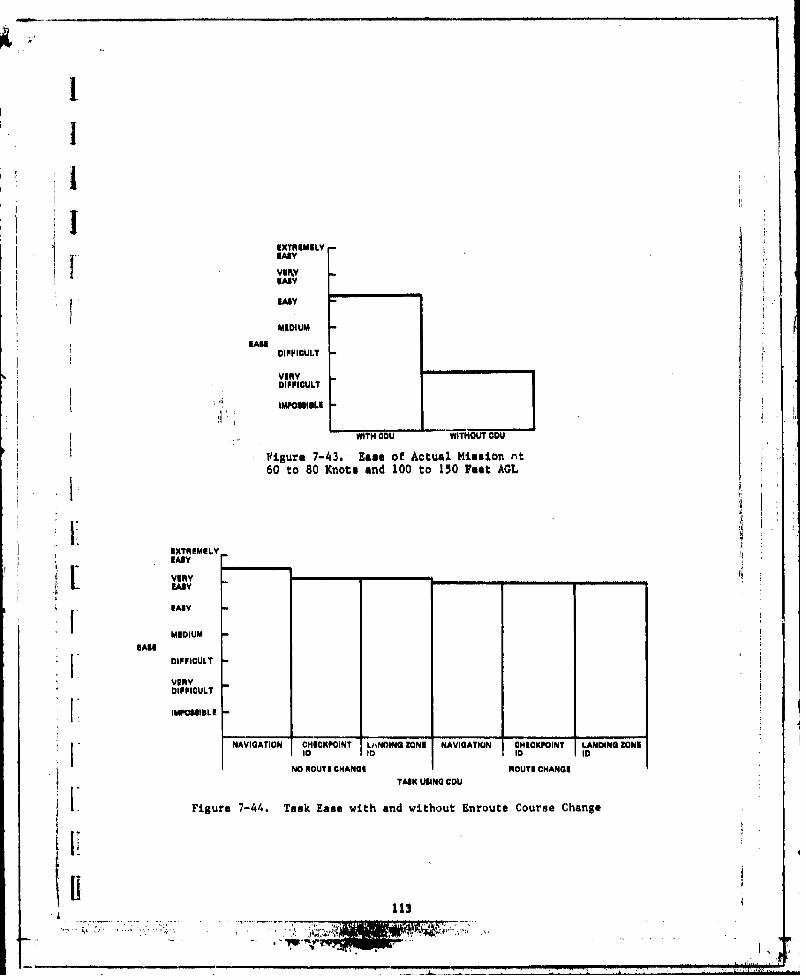
ii~kEBAEEY
EASY
MEDIUM
DIFFICULT
VERY -r -- ,DIFFICULT
IMPOSSIBLE
WITH ODU WITHOUT CDU
V~igure 7-43. Ease of Actual. Mission rt60 to 80 Knots and 100 to 150 Peet AGL
EXTREMELY
I ESY ~VERY - _______r EASY
MEDIUM
I DIFFICULTVERYDIFFICULT
IIMPOSSIBLENAVIGATION CHECKPOINT Lo\NDING ZONE NAVIGATION CHECKPOINT LANDING ZONES
to to ID ID I
NO ROUTE CHANGE ROUTE CHANGE
TASK WINO CDU
Figure 7-44. Task Ease with end without Enroute Course Change
IT

7.8.3 Symbology Attitude Sized to the Wide Field of View
During flight, the. pilots expressed some confusion regarding exactlywhat changes had been made. All pilots were'favorable on their comments onthe changes, but uncertain an to what those changes were. All the pilotsfelt that their performance improved greatly and that the visual feedbackwas much more realistic. They were able to fly with a more sensitive reac-
tion to the terrain and symbology, at a lower altitude and faster speed.The actual flight differences were lose than the subjective differences.The average altitude was 67 feet for simed symbology and 66 for theunchanged. The average groundepeed was 76 knots for the sited symbologyand 69 knots for the unchanged. I7.8.4 Partial Oround Stabilised Sensor versus Aircraft Stabilized Sensor
Seventy-five percent of the pilots preferred the ground stabilisedsensor for the final landing phase to provide a constant view of the none.
The pilots indicated a slight preference for the pilot using an NMD, fol-lowed by ground stabilized PHD sensor, and aircraft stabilized, respee-tively. This group of pilots learned to fly with the HMD and were thusmore familiar with this system. They were not accustomed ,to the manualslew and equated the ground stabilised mode to the HD (i.e., the pilotkeeps his head fixed on the landing sane).
7.9 Modified Cooper-Harper Ratings
The modified Cooper-Harper (C-H) rating scale was desiSned to assign a
numerical value to the pilot's Judgement of overall field of view and HVS
acceptability. Figure 7-45 represents the staling codes. 1Table 7-VT! indicates the mean field of view ratings. The narrow
field of view io significantly (p < 0.05) les acceptable then the wide ordual.
Table 7-VIiI contains the mean display acceptability ratings with andwithout the CDU. The HHD-PND configurations with the COU is the mostacceptable configuration for enroute mission compatability. The pilots
felt the helicopter with this configuration could be flown below 100 feetat greater than 60 knots with a moderate workload. II
Table 7-IX indicates pilot ratings of the virtual HUD evaluation con-figurations. Again the HMD-PID with a CDU received the best rating. BothHMD pilot groups (Tables 7.,VIII and 7-X) considered the MD-PHD confilura-tion to be the most acceptoble configuration with and without the CDU. InTable 7-X, the pilots indicated a higher acceptability rating for approachand landing with the HMD-PMD.
7.10 Summary
Pilot opinions were generally favorable toward sLulation facilities. IThe participants quickly learned the requirements and the operation of the
114, .. ,. , ' -," . . . :. .' ."" . . .. . : - .. .. . . ". . .

I
I " * 1
II _
Ii--II 11111}5,,ii
II
i '"'---"
I
I
I: ~~11tIi'I: . ' . ,I . , <' ' "

TAiBLE 7-VII
Cooper-Hiarper Ratin$:Inrout. FOV
FIELD OP VIEW' MEAN RATING
NARROW 6.41 IWIDE 3.41
DUAL 42 4
TABLE 7-VZU ICopper-Harper Rating:Surcuts OLoplaylIODU
- MEAN RATING IDISLAY WITH CD WITHOUT COU0MOM 3.43 6.5
HMO.PmO 3.00 6.25
ILHMO-HMO &00 7.00 FTABLE ?-.%X
Copper-4Iaitat tnstEnrout. Vitual HUD/OblI
MEA RTINg
DISPLAY WITH OU WITHOUT CDU
,DSP A - -TFHMO.PMD 3 4.25
*HMD'HMD 4 5.25(COMMON VIDEO) 70
(VIRTUAL HUD)
TABLE 7-X
Copper-Harper RatingiApproach and Landins
DISPLAY MEAN RATING
HMD.PMD 2.E
IIHMD 4.0
(COMMON VIDEO)
IVIRTUAL HUD) _____
4,'4

I
simulator. Pilots with more CH-53 experience had a more difficult timelearing to fly the simulator than those with less CH-53 experience.'
Most pilots found all the necessary flight information on the PMD andused the instrument panel as occasional backup. The turn and slip indi-cator was frequently the instrument the pilots desired on the PND. They
'tI had difficulty learning the use of the velocity vector because they wereusing it at first only as a turn and slip indicator.
3 All pilot groups believed the training packages and procedures wereadvantageouc. Several groups requested learning to hover and land priorto learning the flight symbology. The pilots felt it would be benefic ialto learn to control the simulator in a hover prior to learning the flightrequirements.
The symbology evaluation was generally favorable to the flight sym-
bology set during approach and takeoff. For landings, trends indicate apreference for the hover symbology set followed by the hover meter.
The wide and dual fields of view were preferred over the narrow. Wide
and dual resulted in little subjective variability.
The HID-PMD evaluation resulted in a definite preference for the pilotto have a helmet display. The copilot preferred an iMD for mission easeand a PKD for mision safety. The enroute evaluation indicates a con-sistent preference for the 4HMD-PMD configuration.
The copilot felt that the virtual HUD configuration was more difficultand dangerous then the common HMD video or 1U4D-PMD configurations. Again,the HMD-flPD was the preferred display configuration,
The CDU was found to be an extremely useful navigation tool. itenables the copilot to accurately assess present position, desired posi-tion, and overall mission. The HHD increased the copilots task loading,but operation of the CDU we still possible.
I The related studios indicated that the symbology attitude should besized to the wide field of view with the pitch ladders set at 5 and 10degrees. The pilots still desire some changes in the radar altitude con-figuration but not necessarily the ones examined. If the PMID is used forthe pilots display, then the ground-stabilised option is benefical,
POP7

BLANK PAG
Lisi
tI

I
T e!Mutation experim nte kawrdemonstrated the ability of the pilott+'And copilot to fly a night m.asiOn at low altitudes, ranging from 50 to 150 ,
feet AOL, in a 00-53D siol on with the night yvlodca equipment packs$* /
indicated that enrouto flight profiles over the simulator's rolling terrainc an be accomplished at airspeed* ranging from 60 to 80 knots with clearance•lattitudes averagingf 100 feet. This study was conducted with a revised ter-rain model with improved altitude feedback cuss that prodtioad higher clear-•&no* altitudes and somewhat lower airspeed# than the prior simulations.
iTh ct€ual speeds and altitudes will be verified in the pl~nned'HNW figLht
• touts. The simulation confirmd the minimum system requirement of a Site~balled FUR with a navigation system and with ancillary hardware such as a1sybol Saswrer,
Although this experiment requred no data be generated on dead reckon-|nd versus naigtion system rsquirements, bath p lo t performance and opin-
i Aon data reiterated the rot. od crew saihon worload withDoppler commanddterid Inifouetslon. QeW norrsiation of the navigation cpability of
incth d that'~l *nsrefl.htn further reducing the navigation orklod.r
c Data did reaiff rm sripinteraction and ex6ensiv trn as crtcal.
to mis on succera. rew sking is not well defined forh aisexpert-imen as dn Phases I and It.Ptes d and c data showed the p o at the
aceontrol of the airraft to be the primary senior operation when uin thePD. e ach pilot group for this wxperiment was briefed recom ending thePhases I and T I tsking procedure The mnu ty of the pilot groups duringthese phases found their bet performance with the pilot in onro of ahe
ansors. A few toups experimented dth crew akend, honver, and allowed
the copilot total sensor control with the pilot required to request sensorn usage. Alaio t ame cryws qlloued the opil oto lot the sensor anroute
after warni the pilot but never allowed Cho copilot to slow in a hover.In edsencer the night cranpore mision appears wo be a two pilot task with
a t consant verbal fxchine beween pilos The bost performing p rtcroups appeared to be those ahere ndhe at o wed the ilrcrft a tls o the primary sensor operaeor.
The hover ymbology se resulted in the most stable pproach profileand successful landing results. The bolory evaluaton indicated thefthlht symboloy provided sufficient pilotn thnfomailon to mainofin ir-craft contro total e cntrol witingh hne .a c pilo i prdtoues chose to
brant up he trnition bover almbology at pproxilmatety 35 knis end 0.3nl from the touchdown pmnr. The horizontal presentation of he transi-tion hover symbology provided additional informaton for ontinued aircraft
T7.7
craftII' I coto durin11 g Ih initl aprahphs.1stplt coet

deceleration in preparation for establishing a hover. Most pilots chose tobring the aircraft to almost a h ter (approximately 5.0 knots) beforebringing up the hover symbology. The increased gains and hover positionsymbol available with hover symbology allowed the pilots to preciselyestablish a hover and to mark their intended point of touchdown prior tolanding.
The pilots did not find the 25 degree narrow TOV more useful for gone-rating additional information on checkpoint identification or accessing thelanding sone then the visual information provided by the 50 degree wideFOV. Although continually encouraged by the experimental team to use thenarrow POV, the pilots indicated a clear preference to the wide TOV. Thesingle, wide POV appears to provide suffihient information for the night Ittransport mission.
The majority of pilots preferred flying the night transport missionwith the IUD over the PHD regardless of which display oonfiguration thecopilot was using. The precise slowing of the sensor with the H1D as o t-manded by the pilot's natural:head movements allowed control of the sensorwithout changing hand position on the collective during critical flightmaneuvers as required when operating the sensor manually on the PHD. Addi-tionally, the one-to-one visual presentation available with the HND pro-vided increased visual feedback over the minification present on the P0D.
The majority of copilots preferred using. the PHD over MD, They foundthe constant moving imagery somewhat dietracting when performing the CDUline key and master function tasks.
The copilot group evaluating the virtual HUD mode of IHADBS did not
find this mode useful. Of particular concern was the copilot's loss ofsymbolic aircraft attitude and altitude information and loss of imagerywhile performing cockpit tasks using the virtual HUD.
The preferred cockpit display configuration wee with the pilot usingthe IHMO and the copilot using the PMD. The HKO provides the pilot withprecise sewing control over the sensor and more visual feedback informs- Ition than available with the PHD. The PHD provides the copilot with suf-ficient aircraft position and attitude and altitude information, yet allowsease of cockpit workload casks without visual interference while doing thei*D or complete loss of aircraft information while using virtual HUD.
The copilots found the CDU to be a useful navigational aid in reducingthe navigation workload tosk. The present keyboard inputs required for ]enroute changes, however, are somewhat cumbersome because of the nonaliln-ment of the ODU symbology and the appropriate line keys. This resulted incopilot confusion and numerous copilot input errors, The lack of an indi-cation for positive CDU line key actuation also resulted in numerous lcopilot line key input errors.
On longer enroute navigation legs, the copilots were required to con-tinually change the CDU tActical map display scale, or to manually recenterthe scale to prevent the helicopter symbol from disappearing off the edge
120
l4..." : : - ..... : : V, ' ., ,. .. . . . ....... .. .....
I
Iof the ODU display. Conbideration should be given to providing an auto-matic scale change or recentering capability of the CDU map mode.
• /The CDU keyboard lighting function is presently coupled to the non-flight instruments rheostat. When the nonflight instruments were dimmedto low intensity levels and were still readable by the copilot, the CDUkeyboard lighting vanished. Also, the CDU keyboard lighting is white,
I whereas all other cockpit instrument lighting is red. Consideration shouldbe given to providing a separate lightingrheostat for the CDU keyboard andto changing all lighting in the cockpit to the same color.
Pilots tended to slew the sensor more frequently In asimuth and eleva-tion than observed during Phases I and It. When using the PM4D the majority
I of usage in esimuth was within 15 degrees of centered line of sight.tnfrequent usage was observed in azimuth to 60 degrees of centered line ofmight, The majority of usage in elevation wse to look down within 35
i degrees of centered line of eight. Infrequent usage was observed in eleva-tion to look down to 60 degrees of centered line of sight. The pilotsnever intentionally slewed the sensor up while using the PHD. Sensor usageincreased when the pilots returned to using the PMD after learning to slew3 the sensor with the HMD. Ieaffirming the sensor usage observed during
IPhases I and II, it appears a minimum of 45 degree sensor field of regardin asimuth and 15 degrees up end 40 degrees down in elevation should beadequate for the entire enroute, approach, and landing phases of the night
Itransport mission.
The pilots indicated that siting the symbology to the wide FOV aidedin more precise pitch attitude control of the aircraft.
The pilots indicated that the corridor line and altitude reference barwas not useful for the night transport mission.
The majority of the pilots indicated the digital presentation of tor-que was sufficient for power management and the graphical presentation of
I torque was not required.
The pilots indicated that the digital presentation of radar altitudewould be more useful for low altitude control if presented in units below25 feet AOL.
The pilots found the point of interest marker to be extremely usefulas a communication tool.
Several pilots indicated the need for an aural low altitude warningsystem below 50 feet AOL.
The pilots indicated a requirement for a sideslip (ball) symbolicindication to minimise yaw angles while maneuvering.
The pilots seldom used the backup instruments since this experimentincorporated no failure analysis of symbology. Consideration should begiven, however, to the proper arrangement of backup instruments and properlighting intensity control,
121

The side study pilot group evaluating the partial ground stabilizedsensor indicated a reduction in workload required to keep the landing sonein sight while maneuvering the aircraft during the approach phase. This I Kdata group was too small to make a positive judgement on the total value ofthe partial ground stabilised sensor to the night transport misslon. Thisrequirement should be evaluated during flight test.
Several pilots indicated the manual sensor slew control sensing was Lbackward. The majority of pilots, however, preferred the existing configu-ration in which upward movement of the control seoew the sensor upward. I
U
ful,
II
I'
III
122t

II
I
9.0 RECOMI4NMDATIONS
3 9.1 Recommended HNVS Configuration
The recommended minimum HHVS configuration for flight test evaluationis a Doppler navigation systems gimballed sensor (+45 degrees azimuth, and15 degrees up and 40 deoreeo down elevation), dispraC configuration withpilot on HMD and copilot on PMD, end a single 50 degree FOV. Since thenight transport mission is envisioned to be of long duration, the cockpitdisplay configuration will require both pilot seats to be equipped withMDs and PMD. to allow an exchange of pilot/copilot duties and to reduce
crew station fatigue.
" 9.2 Symbology
9. The folloing changes in symbology are recommended prior to flight
teat:
1 Incorporate the hover symbology set including the transition hover'I symbology
2 Do not incorporate the virtual HUD mode in the IHADSS
3 Sit# the symbology (attitude) to the wide 50 degree FOY
m4 Eliminate the corridor line
5 Eliminate the altitude reference bar
I E uliminate the graphical presentation of torque
7 Present the digital radar altitude presentation in units below 25feet AOL
1 Incorporate a aymbolic sideslip (ball) presentation.
9.3 Controls and Displays
The following changes in controls and displays are recommended priorto flight test:
I Realign the CDU symbology with the appropriate line keys r
[ 2 Provide a positive indication for CDU key actuation
3 Provide a separate rheostat for the CDU keyboard lighting functlon
1123

4 Evaluate an automatic scale change or recenterinS capability forthe CDU map mode during flight tests
5 Provide CDU keyboard lighting of the same color as the remainingokpt instruments
6 Provide a low altitude warning system below 50 feat AGL
7 Provide cockpit backup instruments with consistent lighting inten-sity control
8 Evaluate the partial ground stabilized sensor requirement during- flight teat
9 Evaluate the manual sensor slew control sensing activity during Iflight test.
9,4 Crew Tasking HEvaluate the crew tasking allocations during flight test to determine
minimum crew station workload. 1
it
1241
iII
iI 1I '
1
....24.. . .. . .+ .'

I
APPENDIX ACH-53 HNVS SIMULATION f
oFE LIST
Item No. Quantity Descriation
1 1 Complete CH-53 Simulation Cockpit, Drawing Number
51579000, Rev. A
2 2 Slew Controller with Centering Switch, Model No. 485
3 1 HNVS Control Panel
4 2 SADT Control Panels
5 1 HIS Fail Panel
6 1 Control and Display Unit (CDU) Part No. 622-2698-001
Ii7 Hlelmet Sisht and Display System (IHAJ}S8) Consistingl~~ofl i
1 Display Electronics Unit (DZU) Part No, B0I113AAO1,S/N Q7
I Sight Electronic Unit (87U) Part No. B01142AA01,SIN Qi
1 Display Adjust Panel (DAP) Part No. CGIO82AAOI,SIN Q14
I Boresight Reticle Unit (BRU) Part No. JQ1099AAOI,SIN R14
2 Sensor Survey Unih (88U) Part No, LOI27AA01, SIN q26,
Q29
1- 1 Helmet Display Unit (HDU) Part No. HGIO41AA02, S/N R14
2 Integrated Helmet Unit (ONU)
tn12• ,A ,':,.,-.,,,:

ii li
JI,ii ~liii
K
~J:IL1<IfI :IIIlKIBLANK PAGE 4
126 II~-------- --

REFERENCES
1. NADC Document "Helicopter Integration System Functional Description,SSoftware," Revision A, 15 July 1980.
2. "Final Cockpit and Software Preparation Task Report," OR 15,647-2,March 1981.
* 3. "Helicopter Night Vision System Simulation Evaluation Phase I FinalReport," OR 15,986, July 1980.
4, "Helicopter Night Vision Systeto Simulation Evaluation Phase 11 FinalReport," OR 16,015, July 1980.
3 . "Helicopter ight Vision Sstn Fnal Rport," OR 16,026,
July 1980. Sa
1 6. Dixon, W.J. & Brown, M.S. (Eds.). "BMDP-79, Biomedical Computer
Programs, P-Series," lerkeleyt University of California Press, 1979.
7. "Helicopter Night Vision System Simulation Test Plan Task Report",OR 16,147, October 1980.
I
I
127 .-i ~ ~ 7 . .. . _ rv .... ......... . .. .
liei

ABBREVIATIONS
AMC automatic flight conrol system
AOL above ground level
ANOVA analysis of variance
B 31W biomedical data package
C-H Cooper-Harper
CDII control display unit
FDIR direct-to
FUIR forward looking infrared
TTL/PIN flight plan
FTP fly-to-point
Foy field of view
*HDU helmet display unit
HIS helicopter integration system
I IBIDhelmet mounted display
HNV8 Helicopter Night Vision System
HUDW head up display
IIHADSS Integrated Helmet and Display Bight System
IRDS infrared detection system
[LOS line of might
LZ landing sone
IIWit7 master function key
NAV/EADI Navigation/Electronic Attitude Director Indicator
129
' il mw mwllwN~ m ,,.a ~ m m m , m , , u •,v,
PDG programmable display generator
* PM!) panel mounted display
SAS stability augmsentation system
SPURS Special Purpose Rotororaft Simulator
STL Simulation and Test Laboratory
1304