ity of Pataskala Utility epartment 2017 Annual Report ... · was productive and successful in our...
13
City of Pataskala Utility Department 2017 Annual Report “Safety, Excellence, and Reliability!” Nathan W. Coey Utility Director “We think of our land and water and human resources not as static and sterile possessions but as life-giving assets to be directed by wise provisions for future days.” Franklin D. Roosevelt
Transcript of ity of Pataskala Utility epartment 2017 Annual Report ... · was productive and successful in our...

City of Pataskala Utility Department
2017 Annual Report “Safety, Excellence, and Reliability!”
Nathan W. Coey Utility Director
“We think of our land and water and human resources not as static and sterile possessions but as life-giving assets to be directed by wise provisions for future days.” Franklin D. Roosevelt

Dear Mayor, Council, Administrator, and Directors,
I am pleased to share with you the 2017 Annual Report for the City of Pataskala’s
Utility Department. The goal of this report is to condense all of our progress, pro-jects, challenges, and accomplishments during the 2017 calendar year. 2017 was a very successful year in the overall mission of the Utility Department in our pur-
suit of, “Safety, Excellence, and Reliability!”
I would like to introduce you to all employees that contribute daily to the success of the Utility Department. Our staff is on the environmental front line, to ensure public health, and to “Protect and Conserve”.
Utility Department Staff
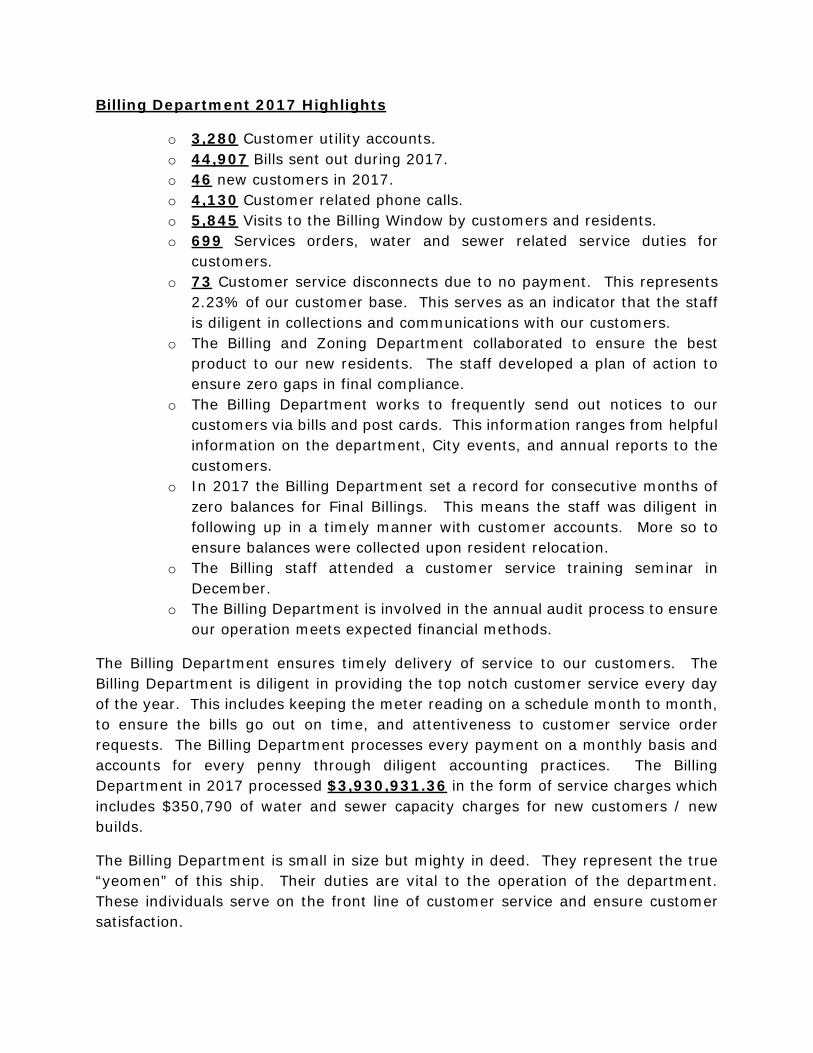
Billing Department 2017 Highlights
o 3,280 Customer utility accounts. o 44,907 Bills sent out during 2017. o 46 new customers in 2017. o 4,130 Customer related phone calls. o 5,845 Visits to the Billing Window by customers and residents. o 699 Services orders, water and sewer related service duties for
customers. o 73 Customer service disconnects due to no payment. This represents
2.23% of our customer base. This serves as an indicator that the staff is diligent in collections and communications with our customers.
o The Billing and Zoning Department collaborated to ensure the best product to our new residents. The staff developed a plan of action to ensure zero gaps in final compliance.
o The Billing Department works to frequently send out notices to our customers via bills and post cards. This information ranges from helpful information on the department, City events, and annual reports to the customers.
o In 2017 the Billing Department set a record for consecutive months of zero balances for Final Billings. This means the staff was diligent in following up in a timely manner with customer accounts. More so to ensure balances were collected upon resident relocation.
o The Billing staff attended a customer service training seminar in December.
o The Billing Department is involved in the annual audit process to ensure our operation meets expected financial methods.
The Billing Department ensures timely delivery of service to our customers. The Billing Department is diligent in providing the top notch customer service every day of the year. This includes keeping the meter reading on a schedule month to month, to ensure the bills go out on time, and attentiveness to customer service order requests. The Billing Department processes every payment on a monthly basis and accounts for every penny through diligent accounting practices. The Billing Department in 2017 processed $3,930,931.36 in the form of service charges which includes $350,790 of water and sewer capacity charges for new customers / new builds.
The Billing Department is small in size but mighty in deed. They represent the true “yeomen” of this ship. Their duties are vital to the operation of the department. These individuals serve on the front line of customer service and ensure customer satisfaction.
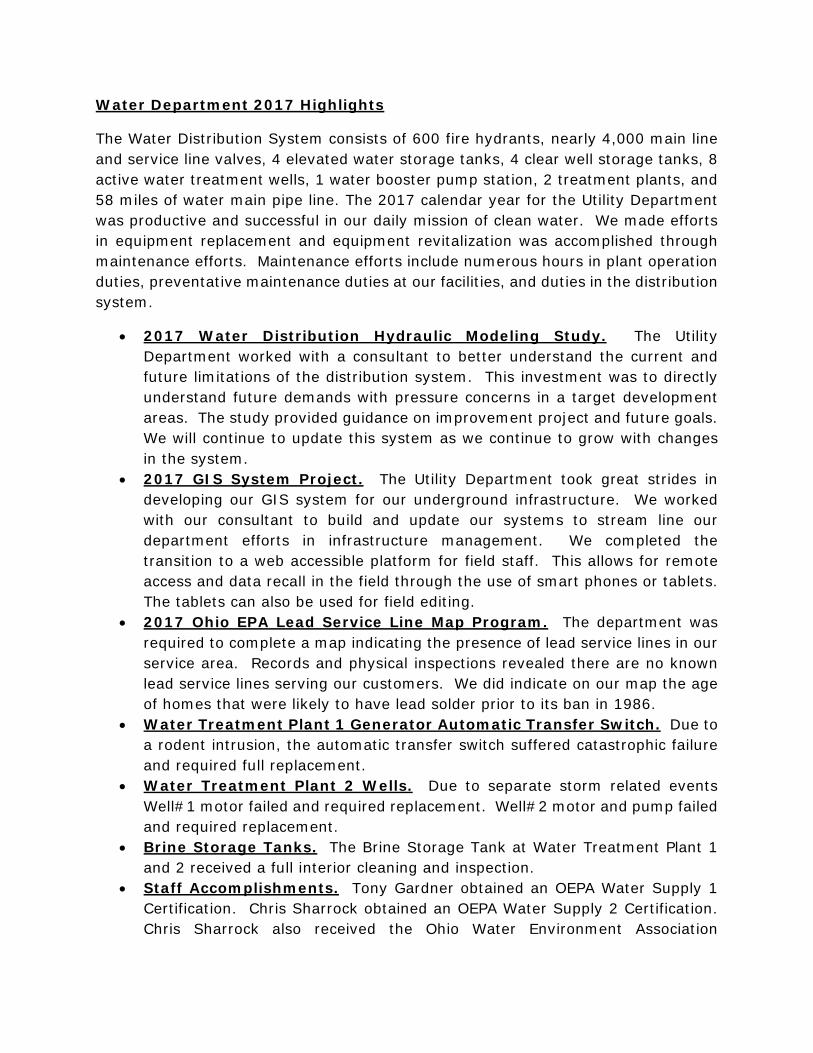
Water Department 2017 Highlights
The Water Distribution System consists of 600 fire hydrants, nearly 4,000 main line and service line valves, 4 elevated water storage tanks, 4 clear well storage tanks, 8 active water treatment wells, 1 water booster pump station, 2 treatment plants, and 58 miles of water main pipe line. The 2017 calendar year for the Utility Department was productive and successful in our daily mission of clean water. We made efforts in equipment replacement and equipment revitalization was accomplished through maintenance efforts. Maintenance efforts include numerous hours in plant operation duties, preventative maintenance duties at our facilities, and duties in the distribution system.
• 2017 Water Distribution Hydraulic Modeling Study. The Utility Department worked with a consultant to better understand the current and future limitations of the distribution system. This investment was to directly understand future demands with pressure concerns in a target development areas. The study provided guidance on improvement project and future goals. We will continue to update this system as we continue to grow with changes in the system.
• 2017 GIS System Project. The Utility Department took great strides in developing our GIS system for our underground infrastructure. We worked with our consultant to build and update our systems to stream line our department efforts in infrastructure management. We completed the transition to a web accessible platform for field staff. This allows for remote access and data recall in the field through the use of smart phones or tablets. The tablets can also be used for field editing.
• 2017 Ohio EPA Lead Service Line Map Program. The department was required to complete a map indicating the presence of lead service lines in our service area. Records and physical inspections revealed there are no known lead service lines serving our customers. We did indicate on our map the age of homes that were likely to have lead solder prior to its ban in 1986.
• Water Treatment Plant 1 Generator Automatic Transfer Switch. Due to a rodent intrusion, the automatic transfer switch suffered catastrophic failure and required full replacement.
• Water Treatment Plant 2 Wells. Due to separate storm related events Well#1 motor failed and required replacement. Well#2 motor and pump failed and required replacement.
• Brine Storage Tanks. The Brine Storage Tank at Water Treatment Plant 1 and 2 received a full interior cleaning and inspection.
• Staff Accomplishments. Tony Gardner obtained an OEPA Water Supply 1 Certification. Chris Sharrock obtained an OEPA Water Supply 2 Certification. Chris Sharrock also received the Ohio Water Environment Association

“Awesome Operator Award” for his accomplishments and free registration to the annual conference to receive his award.
• Public Education Efforts. We provided educational information to the customers regarding “Drinking Water Quality Advisories” and our procedures for implementation and notification of the public. An informational video on the water treatment process was shared with our customers. The “Adopt-a-Hydrant” program was also shared with the public. We are active in providing information to our customer’s regarding the services provided. The “Hyper Reach” notification system was implemented to provide information quickly to our customers via phone and text messages.
• Emergency Plan Update. Due to new regulatory requirements we have continued to update our emergency operation plan. We continue to build on this to create a comprehensive emergency operation manual.
• Other notable accomplishments. o 11 Water main and/or valve repair jobs. o 26 Service line repair jobs. o 2 Hydrants replaced. o 9 Hydrants repaired. o 19 Service valves repaired. o All hydrants flushed annually during the unilateral flushing program. o Over 4,000 laboratory tests to ensure OEPA compliance. o 60 post excavation restoration jobs. o 2,144 OUPS locate requests fulfilled by the staff. o All water towers were cleaned and inspected for future maintenance
consideration.
• Treatment Process Information
Water Treatment Plant #1 (WTP1) has the maximum treatment capacity of 1.3 million gallons per day (or 900 GPM) while Water Treatment Plant #2 (WTP2) has the treatment capacity of 864,000 gallons per day (or 600 GPM), with a combined production capacity of 2.164 MGD. The Water Distribution System consists of 4 Water Towers, 1 Booster Station, and over 58 miles of main line pipe work.
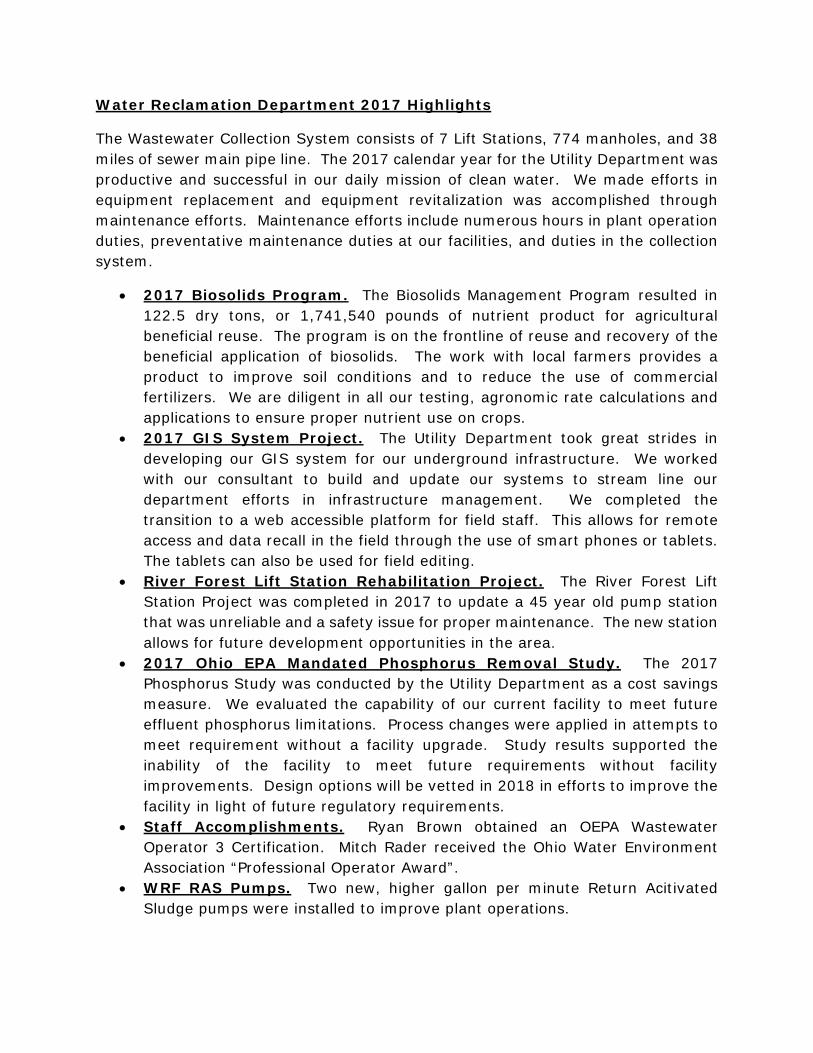
In 2017, Water Treatment Plant #1 produced a total of 110.26 Million Gallons (MG) and Water Treatment Plant #2 produced 196.68 MG; the total combined production for the year was 306.94 MG with an average daily production of .841 Million Gallons.
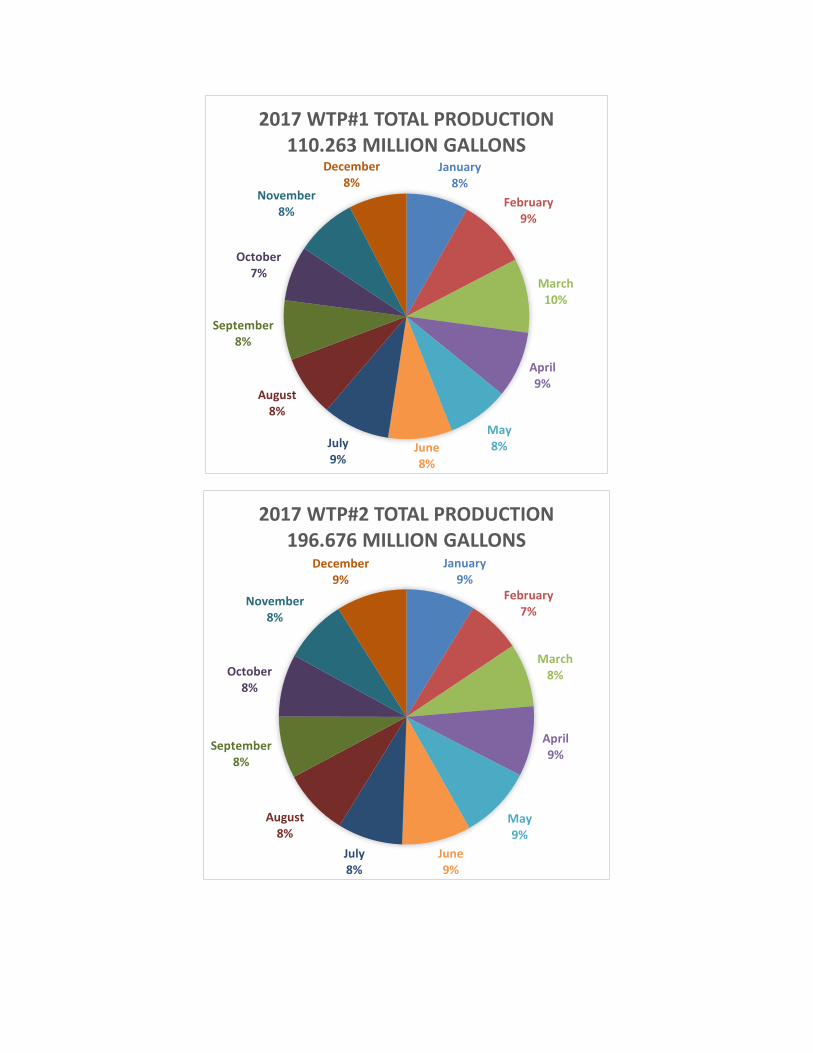
January8%
February9%
March10%
April9%
May8%June
8%July9%
August8%
September8%
October7%
November8%
December8%
2017 WTP#1 TOTAL PRODUCTION 110.263 MILLION GALLONS
January9%
February7%
March8%
April9%
May9%
June9%
July8%
August8%
September8%
October8%
November8%
December9%
2017 WTP#2 TOTAL PRODUCTION196.676 MILLION GALLONS

• Production vs. Water Sales
In 2017, our yearly water loss percentage average (production versus water usage billed) was 10%. This is the best average we have had since my time with the department. The water loss calculation is a method to determine system efficiency on a supply and demand basis. The loss percentage or unaccounted water use is a direct result of water loss in water main breaks, failed water meters, service leaks, and system flushing operations. Unfortunately, this also includes potential leaks that have not surfaced.
Future efforts can be made to better determine our actual water loss calculation by the installing of direct metering points in the distribution grid on main lines. A conservatively calculated average of 22% represents our daily water production that is used to pressurize the grid. The 22% specifically is produced for grid pressurization and storage in the system via the Southeast Tower to provide a sufficient static pressure when the production is at rest. The data is confirmed in our hydraulic modeling study and the fact that we do not have a single transmission main to provide all produced water directly to the tower. The unnecessary production is compounded with no dedicated delivery point to the grid. Understanding this concept, the amount of water unaccounted for is 10% annually.
36%
64%
2017 Total Production 306.94 MG
WTP#2 196.68 MG
WTP#1 110.26 MG

In efforts to ensure the best pressure possible in the historic village area (also the suction point for the booster station) we have to carry the Southeast Tower at a near over flow elevation with no more than a 4 feet operating level. Calculated, this provides a theoretical amount of unconsumed water in the tower near 380,000 gallons, which varies in the vessel based on production and demand. The ideal operating range or consumption span of the tower should be 20 feet. If we operated with that “fill and drain” principal we would receive daily calls for low or no water pressure.
I consider our water loss percentage to be manageable understanding the age of the infrastructure in historic Pataskala Village areas and system inefficiencies. We will continue in 2018 to reduce our water loss percentage by locating non-surfacing water leaks, respond to water leaks quickly, and stay on a healthy schedule of replacing aged water meters.
Please see the below information regarding the past 5 years relative to the production and sale of water with our growth rate. The information is interesting. There are some data oddities, such as producing and billing for more in 2012 compared to 2017 given our growth. Most interesting is the comparison of 2016 and 2017. We produced and billed less in 2017 than 2016. Producing less and billing for less is not strange until you compare it to additional customers. At this point I can only take from this we are beginning to see the implementation of low flow water use fixtures. This is good for customers and great for the environment, but it does propose an interesting question for evaluation over the next few years.
Year MGD Produced MGD Billed New Customers 2012 310.93 214.46 48 2013 279.39 208.57 51 2014 278.52 203.39 34 2015 286.79 205.29 48 2016 311.88 213.45 51 2017 306.94 208.22 46 Total 1774.45 1253.38 278
Average 295.74 208.90 46.33
Water Reclamation Department 2017 Highlights
The Wastewater Collection System consists of 7 Lift Stations, 774 manholes, and 38 miles of sewer main pipe line. The 2017 calendar year for the Utility Department was productive and successful in our daily mission of clean water. We made efforts in equipment replacement and equipment revitalization was accomplished through maintenance efforts. Maintenance efforts include numerous hours in plant operation duties, preventative maintenance duties at our facilities, and duties in the collection system.
• 2017 Biosolids Program. The Biosolids Management Program resulted in 122.5 dry tons, or 1,741,540 pounds of nutrient product for agricultural beneficial reuse. The program is on the frontline of reuse and recovery of the beneficial application of biosolids. The work with local farmers provides a product to improve soil conditions and to reduce the use of commercial fertilizers. We are diligent in all our testing, agronomic rate calculations and applications to ensure proper nutrient use on crops.
• 2017 GIS System Project. The Utility Department took great strides in developing our GIS system for our underground infrastructure. We worked with our consultant to build and update our systems to stream line our department efforts in infrastructure management. We completed the transition to a web accessible platform for field staff. This allows for remote access and data recall in the field through the use of smart phones or tablets. The tablets can also be used for field editing.
• River Forest Lift Station Rehabilitation Project. The River Forest Lift Station Project was completed in 2017 to update a 45 year old pump station that was unreliable and a safety issue for proper maintenance. The new station allows for future development opportunities in the area.
• 2017 Ohio EPA Mandated Phosphorus Removal Study. The 2017 Phosphorus Study was conducted by the Utility Department as a cost savings measure. We evaluated the capability of our current facility to meet future effluent phosphorus limitations. Process changes were applied in attempts to meet requirement without a facility upgrade. Study results supported the inability of the facility to meet future requirements without facility improvements. Design options will be vetted in 2018 in efforts to improve the facility in light of future regulatory requirements.
• Staff Accomplishments. Ryan Brown obtained an OEPA Wastewater Operator 3 Certification. Mitch Rader received the Ohio Water Environment Association “Professional Operator Award”.
• WRF RAS Pumps. Two new, higher gallon per minute Return Acitivated Sludge pumps were installed to improve plant operations.
• Biosolids Improvements. Mitch Rader took great strides in the improvement of the finished biosolids product. Process changes were implemented to greatly decrease the odor potential of the product specifically during hauling and application operations. A dry feeder was installed in the pressed product conveyor to better dry the solids and provide an odor buffer. The transportation dump truck was equipped with a cab operated spray system to mist the truck bed with an essential oil odor control additive. We received zero odor complaints during the hauling and application process.
o A portable conveyor was purchased to maximize finished product storage in the building.
• Polishing Lagoon Aerators. Aerators were installed under the phosphorus study in efforts to achieve additional phosphorus removal. While this did not achieve the goal intended the overall appearance and health of one of the 4 acre lagoons is greatly improved.
• West Licking Fire Department Training. The WRF was a site of training for the fire department in the event of a tank rescue. We also provided tours of the facility to familiarize the fire department with the hazards at our facility.
• Other notable accomplishments. o Preventively cleaning of 10,000 feet of sewer main line. 2017 was a
year to focus on maintenance areas that require frequent attention with a focus on budget reduction in operational costs. A more aggressive cleaning and televising schedule will occur in 2018 with a focus on the most aged portions of our system.
o Nearly 3,000 laboratory tests to ensure OEPA compliance. o 122.5 dry tons of produced and beneficially reused biosolids. o Only 1 Sanitary Sewer Overflow was encountered in 2017. Due to the
heavy rains in the 2017 flood a brief overflow occurred at the Creek Road Pump Station. It is important to note the efforts of Mitch Rader to locate a bypass connection point at the station that greatly reduced the overflow amount by utilizing our back up emergency pump.
o
The Shawnee Water Reclamation Facility (WRF1) has the maximum treatment capacity of 1.1 million gallons per day (MGD). The WRF treats all of the wastewater generated by customers in Pataskala service area.
• The Ohio EPA requires that our WRF1 meet the following requirements under treatment standards that CBOD (Carbonaceous Biological Oxygen Demand) and TSS (Total Suspended Solids) meet an 85% removal from influent levels to final treatment levels. The 2017 removal average for CBOD was 99.02% and TSS is 98.54%. The Nitrogen, Ammonia removal rate was 98.75%. We
are currently exceeding the expectations of our treatment level under the OEPA’s current standards. Future limitations for effluent phosphorus will be 1 mg/l our 2017 average was 2.18 mg/l with a removal rate of 43.73%.
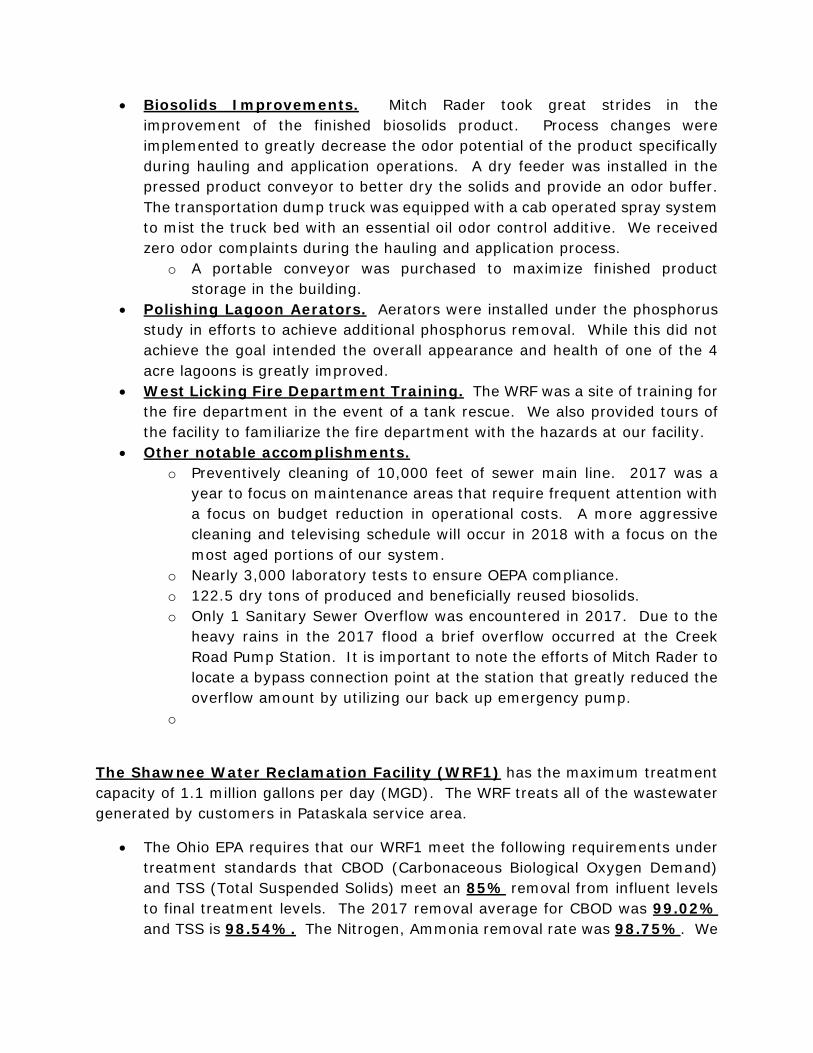
• WRF1 treated a total of 280.38 million gallons during the course of 2017 with an average daily flow of .7697 million gallons per day.
Inflow and Infiltration: Based on the available information, the Pataskala Water Reclamation Facility 1 and Collection System is under considerable surface and/or ground water infiltration. The treatment facility sanitary collection system indicates an annual water meter usage of 163 million gallons. This number represents the “in town” water customers that receive sewer service from Pataskala. Based on annual treatment facility and flow data it can be calculated that nearly 41% of our annual treatment flow is directly related surface / ground water infiltration. Our treatment plant, for an annual average, treats .7697 million gallons per day. Our in town water usage rates indicates a daily usage of .45 million gallons per day, based on annual averages. Based on available data an inch of precipitation can contribute an additional 1.86 million gallons to the treatment facility. The Westside Tributary Area (historic village) represents the largest and oldest portion of the system with a total of 98,920 feet (18.8 miles) of main line infrastructure. The aged infrastructure is the source of
9%
7%
10%
10%
10%7%
11%
7%
6%
6%
9%8%
2017 WRF #1 Flow Data 280.38 Million Gallons
January
February
March
April
May
June
July
August
September
October
November
December

our inflow and infiltration. System inflow and infiltration will need to be addressed as we seek to grow and utilize the full capacity of our system and treatment facility.
The Refugee Water Reclamation Facility (Wastewater Treatment Facility for WTP#2) (WRF2) has the daily design flow capacity of .084 MGD. The WRF2 treats the wastewater generated by the WTP#2 operational processes consisting of iron filter and softener back wash discharge. The Refugee WRF2 treated a total of 10.77 MG with an average daily flow of .029 MGD. Notice the increased discharge levels starting in September through December. This is an effort to apply additional dilution water to achieve the new OEPA Strontium discharge requirements for this facility. While we are meeting limits it does result in an additional 30 to 40,000 gallons of treated drinking water.
4% 4%6%
7%
6%
5%
6%5%
7%19%
15%
16%
2017 WRF#2 Flow Data10.77 Million Gallons Total
January
February
March
April
May
June
July
August
September
October
November
December

The mission of the Utility Department includes a healthy dose of challenge. In the pursuit of our mission of clean water, challenges must be converted to solutions and achievements. This report is intended to share some of our critical data points and completion of annual goals. Our success and progress is attributed to the fine people that work together with a common goal, to provide the best water and best service possible to our residents and utility customers. Our goal, and resolve in 2018 is to “Protect and Conserve” our finite resource, water. We will continue to strive for “continual growth and progress” as we seek to do our very best in every task. We will continue to make strides to maintain our water and wastewater infrastructure in a responsible and respectable manner. We appreciate your support as we meet every challenge with a resolve for solution.
Highest Regards,
Nathan W. Coey
City of Pataskala Utility Director
Protect and Conserve
“Without continual growth and progress, such words as improvement, achievement, and success have no meaning.” Benjamin Franklin