
RS1-G5, RS3-G5, RS4-G5 RS4-G5 FM (1-Way System) RS7-G5 FM ...

ITS-G5 Channel Models for High SpeedTrain-to-Train Communication
Paul Unterhuber, Mohammad Soliman, and Andreas Lehner
German Aerospace Center (DLR), Institute of Communications and Navigation,Oberpfaffenhofen, 82234, Wessling, Germany
Abstract. Train-to-train communication will be the key technology forfuture railway operation. An increase of safety and efficiency can beachieved by exchanging data between trains via ad hoc networks. Forvehicle-to-vehicle communication the European standard is intelligenttransport systems (ITS-G5). The usage of this standard for railways ishardly investigated. We investigate the performance of ITS-G5 for train-to-train communication at high speed conditions. ITS-G5 units were in-stalled on two high speed trains and train-to-train (T2T) measurementswere performed between Naples and Rome during four nights to coverdifferent maneuvers. We present the analysis of the measurements dataand resulting path loss models for tunnel and open field environments.
Keywords: T2T, electronic coupling, ITS-G5, channel model, NGT
1 Introduction
On the path towards autonomous driving trains, electronic coupling is seen as thedoor opener application. Electronic coupled trains are connected with a wirelesscommunication link, but without a mechanical coupler [?]. For this application,different T2T communication links are envisaged. We use three categories: short,mid and long range communication links. On short range of several hundredmeters, ultra reliability and low latency are required to support precise distancecontrol of the trains over wireless train control management system. For midrange communication between two trains, e.g. up to 2 km, a robust data linkneeds to be established which allows for a safe approach. Therefore, safety relatedinformation like movement information need to be exchanged with medium datarates under certain delay and error constraints. For long distances a terrestrialtrunked radio (TETRA) based system could be used to ensure links up to a fewtens of kilometers with low data rates as proposed in [?].
So far T2T is hardly investigated compared to train-to-ground communica-tions. T2T channel models covering high speed scenarios and frequencies above1 GHz are not discussed in literature. The necessity of investigations on shortand mid range T2T links and related channel models is pointed out in [?]. Atechnology transfer from vehicular applications developed for road traffic likeITS-G5 to high speed trains in the railway domain needs to be verified.

Based on previous measurements with commuter trains at speeds up to140 km/h as presented in [?], we have set up an ITS-G5 system in two high speedtrains (HSTs). This measurement campaign was performed in Italy in 2016 andis described in detail in [?]. In this paper we present an extended evaluation ofthe ITS-G5 link measurements in high speed railway (HSR) environments andderiving path loss channel models for certain railway environments.
2 Measurement Campaign
A comprehensive four days measurement campaign was planned and performedon the 220 km long HSR track between Naples and Rome in Italy. One nightwas used for intra-consist communication measurements (published in [?]) withone Trenitalia Frecciarossa ETR 500 HST [?] as shown in Figure 1. In the fol-lowing three nights, different T2T measurements with two of those HSTs wereperformed. Different measurement systems were installed. Next to an ITS-G5communication link, a TETRA based communication system was installed andtested under high speed conditions as presented in [?]. The DLR RUSK channelsounder was used for intra-consist and T2T measurements at 5.2 GHz. For themovement tracking of both trains, global navigation satellite system (GNSS)receivers and inertial measurement units (IMUs) were mounted in the trains.More details on the campaign and the installed equipment can be found in [?].
2.1 ITS-G5 Equipment and Setup
Both HSTs were equipped with ITS-G5 Cohda Wireless MK-5 modules. The onboard unit of Train 07 was set up as transmitter (Tx) and the unit of Train28 as receiver (Rx). The general settings are listed in Table 1. The settingswere chosen to ensure the most robust link. The radios were set up for thecontrol channel 180 at 5.9 GHz with a bandwidth of 10 MHz. The output powerof the Tx ITS-G5 module was set to the maximum of 23 dBm. On the Tx side,an additional amplifier was used to achieve in combination with the installedantenna an equivalent isotropically radiated power (EIRP) of 31 dBm. The datarate was set to 3 Mbit/s with BPSK modulation at a coding rate of 1/2. Thepacket length was 400 Byte with a repetition rate of 100 Hz.
To fulfill the safety regulations for railways, railway certified antennas wereused. Huber+Suhner SWA-0859/360/4/0/DFRX30 2 omni-directional antennaswere installed on the first coach after the locomotive of each train. These anten-nas support multiple bands up to 6 GHz and offer an integrated GNSS antenna.
The Cohda MK-5 modules offer a dual transceiver radio. For these measure-ments, only radio A was activated and connected to the measurement antenna.The internal GNSS receiver was used to log the train positions for each receivedsignal strength indication (RSSI) measurement.
The Tx data included a header with a sequential packet number, the move-ment information of the Train 07 and dummy payload data. The movementinformation of Train 07 and Train 28 and the RSSI measurements were storedtogether with the GPS time stamp on the Cohda module at Train 28.

Table 1: Cohda MK5 radio settings
Channel 180
Carrier frequency 5.9 GHz
Bandwidth 10 MHz
EIRP 31 dBm
Data rate 3 Mbit/s
Modulation BPSK
Coding rate 1/2
Packet length 400 Byte
Repetition rate 100 Hz
Table 2: Measurement scenarios
Slow Fast
(Sub-) Urban x
Rural x x
Tunnel x
2.2 Environment and Scenarios
The measurement campaign was performed at night from midnight to 5 am out ofscheduled operation time in spring 2016. The environment along the track variesfrom urban and suburban areas around Naples to rural areas before arriving inRome. A map of the HSR track is plotted in Figure 2 and marked in red. Openfield, forest, hilly sections and tunnels alternate in the rural area.
Nowadays, typical HST maneuvers include mainly crossing and and some-times overtaking. An overtake maneuver is comparable with an approachingmaneuver for electronic coupling. Therefore, the overtaking maneuver was spe-cially performed in all characteristic environments for different speeds. The lowspeed measurements were performed at 50 km/h and the high speed at 250 km/haverage absolute velocity. The combination of environments and maneuvers withdifferent velocities lead to the measurement scenarios listed in Table 2. For allmeasurements, the trains were driving on different parallel tracks.
For the analysis in Section 3 we are focusing on open field and tunnels athigh speed. We present one overtake maneuver for each environment.

Fig. 1: Trenitalia Frecciarossa ETR 500 HST.
Fig. 2: HSR track Naples-Rome. Image by Google, Map Data 2016 NOAA, U.S.Navy, NGA, GEBCO Image Landsat (2015).

3 Data Analysis
3.1 Path Loss Models
Two path loss models were chosen to estimate the losses in different environ-ments. The free-space path loss equation
FSPL(d) = 20 · log10(4πd · fc
) (1)
was used as reference. d represents the distance between Tx and Rx antenna,f the carrier frequency and c the speed of light.
The log-distance path loss model was used to model line of sight (LOS) andnon LOS conditions. In addition to a reference path loss at a distance d0 = 1 m,a relation of the actual distance d and d0 times a path loss exponent n is added.The power variations due to shadowing and multi path effects are modeled asnormal distributed vector χσ ∼ N (0, σ).
PL(d) = FSPL(d0) + 10 · n · log10(d
d0) + χσ (2)
3.2 Scenarios
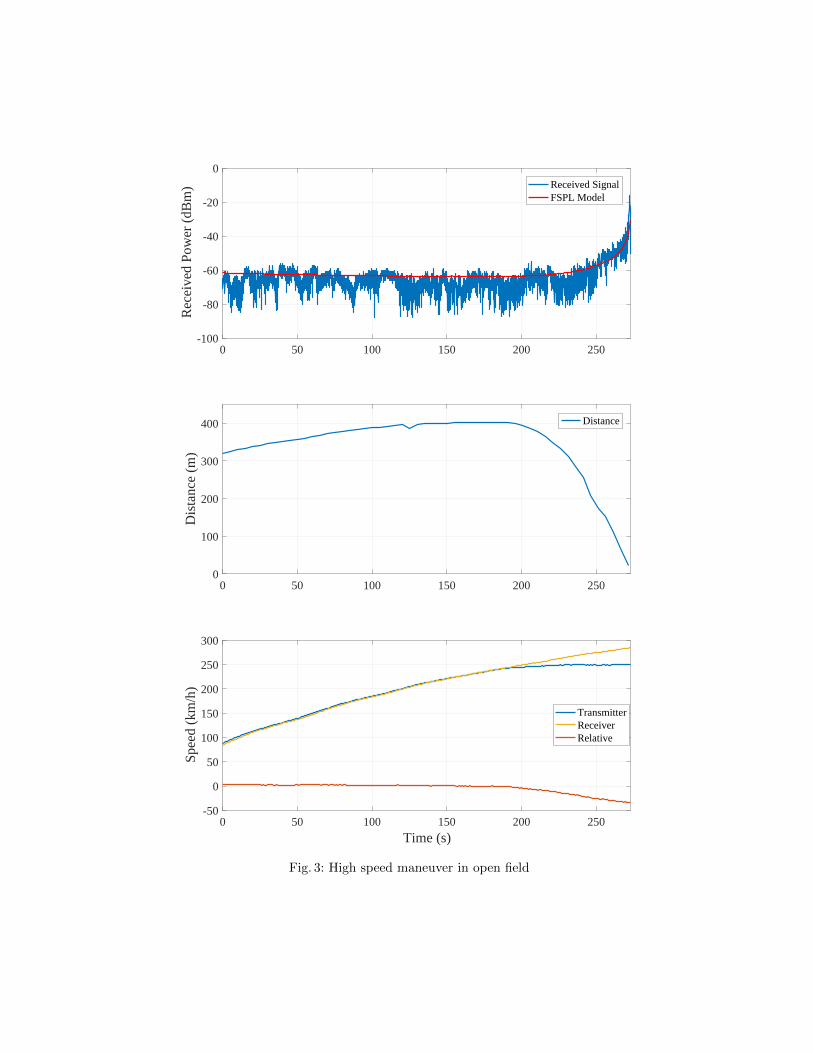
Figures 3 to 9 show the measurement analysis in open field and tunnel environ-ment. In general, the received power, the distance and speed of the trains overtime are plotted in Figures 3 and 7. The received power and the fitted path lossof the log-distance model are plotted in Figures 4 and 8. Figures 5 and 9 showthe probability density of the fading effects in case of the log-distance model.
Open Field: First, we present an approaching maneuver in a rural environment.As shown in Figure 3, the Tx Train 07 is between 300 m and 400 m in front of theRx Train 28. Both trains are accelerating from 100 km/h to 250 km/h. In thisphase of the maneuver both trains could be seen as one electronically coupledconsist. Up from 200 sec the Rx is accelerating up to 300 km/h and reducing thegap, finally overtaking the Tx train. Out of the top chart of Figure 3 we canderive, that fades are less related to the speed than to the distance between Txand Rx.
In Figure 4 the measured received power is plotted over distance in green.The related FSPL model and log-distance model are plotted in red and black.As already mentioned before, up from a distance of 200 m deeper fades can beobserved; this is caused by a higher probability of non LOS components. Evenin open field environment, catenary, pylons or the signaling system can causemulti path components (MPCs). More information on multi paths in railwayenvironments can be found in [?] and [?]. As expected for open field there ishigh probability for LOS. Therefore, FSPL model fits quite well to the measuredreceived power. At higher distances the log-distance model with a path lossexponent of n = 2.1 fits better than the FSPL model.
The shadowing was analyzed as well and fitted to a normal distribution asshown in Figure 5. The log-distance model parameters are listed in Table 3.
0 50 100 150 200 250-100
-80
-60
-40
-20
0
Rec
eive
d Po
wer
(dB
m) Received Signal
FSPL Model
0 50 100 150 200 2500
100
200
300
400
Dis
tanc
e (m
)
Distance
0 50 100 150 200 250
Time (s)
-50
0
50
100
150
200
250
300
Spee
d (k
m/h
)
TransmitterReceiverRelative
Fig. 3: High speed maneuver in open field

0 50 100 150 200 250 300 350 400 450Distance (m)
-100
-80
-60
-40
-20
0R
ecei
ved
Pow
er (
dBm
)Received SignalFSPL ModelLog-Distance Model
Fig. 4: Path loss model for open field
-20 -15 -10 -5 0 5 10 15 20Shadow fading (dB)
0
0.05
0.1
0.15
Prob
abili
ty d
ensi
ty
Measured signalNormal distribution fitting
Fig. 5: Probability density of shadow fading for open field

Fig. 6: Track for tunnel section, blue indicates tunnels. Image by Google, MapData 2016 NOAA, U.S. Navy, GEBCO Image Landsat (2015).
Tunnels: The second maneuver is a departure and approaching in a hilly envi-ronment with several consecutive tunnels. In Figure 6 the tunnels are marked inblue; the trains are driving from right to left side of the figure. Hence, at leastone train was always in a tunnel and several times, Tx and Rx were in the sametunnel or in two consecutive tunnels. This is illustrated with colored bars in thetop chart of Figure 7.
The analysis of the maneuver starts at 0 sec when Rx is overtaking Tx witha speed of 140 km/h and accelerates to 200 km/h. Rx runs ahead till 165 sec upto a maximum distance of 2.1 km. Tx is accelerating from 50 km/h to 270 km/hand catching up to Rx at 275 sec.
While both trains were driving through the longest tunnel marked in orange,the distance was above 2 km. Up from around 250 sec, both trains were in asame tunnel again (brown tunnel). For both events, the received power was18 dB above the FSPL model. This gain is caused by a wave guiding effect insidethe tunnels. Around 50 sec and 70 sec similar effects can be observed with a gainof 15 dB. In these sections the trains were in different, but very close tunnels.
For constellations with large areas of open field between different tunnels (e.g.90−120 sec or 210−240 sec), only one train was inside a tunnel. In these sectionsthe received power is 15−20 dB beneath the FSPL model, because diffraction atthe tunnel entry causes extra loss [?].
Figure 8 shows the received power over distance for two cases. At the firstand general case at least on train is in a tunnel (marked in green). This case ismodeled by the free-space path loss (FSPL) model in red. Second case markedwith blue dots, both trains are in the same or very close tunnels. This case ismodeled by the log-distance model in black. For both cases, strong wave guidingeffects can be observed for distances beneath 500 m and above 2000 m. If at leastone train is in a tunnel, deep fades can be observed for distances above 500 m.

0 50 100 150 200 250-100
-80
-60
-40
-20
0Rx
TxR
ecei
ved
Pow
er (
dBm
)
Received Signal FSPL Model
0 50 100 150 200 2500
500
1000
1500
2000
2500
Dis
tanc
e (m
)
Distance
0 50 100 150 200 250Time (s)
-100
0
100
200
300
Spee
d (k
m/h
)
Transmitter Receiver Relative
Fig. 7: High speed maneuver in tunnels

0 200 400 600 800 1000 1200 1400 1600 1800 2000 2200Distance (m)
-100
-80
-60
-40
-20
0R
ecei
ved
Pow
er (
dBm
)
at least one train in a tunnelboth trains in the tunnel FSPL Model Log-Distance Model
Fig. 8: Path loss model for tunnel environment
-20 -15 -10 -5 0 5 10 15 20Shadow fading (dB)
0
0.02
0.04
0.06
0.08
0.1
Prob
abili
ty d
ensi
ty
Measured signalNormal distribution fitting
Fig. 9: Probability density of shadow fading for both trains in a tunnel

The probability density of the shadowing is plotted in blue in Figure 9 forthe case where both trains are inside a tunnel. A normal distribution is fitted tothe measured signal with the parameters listed in Table 3.
Table 3: Log-Distance Model parameters
PL(d0) n σ
dBm dB
Open field 47.8 2.1 4.72
Tunnels 47.8 1.72 6.93
4 Conclusion
In this paper we presented an analysis of ITS-G5 as T2T link under HSR condi-tions. The performance at open field environment and tunnels at high speed wereinvestigated in detail. For both environments, the received power was measuredwhile performing overtaking maneuvers with two HSTs.
In detail, deep fades can be observed for link distances above 200 m in openfield and above 500 m in tunnels. If Tx and Rx are in the same tunnel or closetunnels, a wave guide effect with a maximum gain of 18 dB can be observed. Formixed environments with tunnels and open field, alternating strong fading effectsand shadowing affect the link significantly. Nevertheless, stable links could beachieved for distances up to 2 km. The high speed (≥ 200 km/h) has no significanteffect on the data transmission.
For both environments, log-distance models were derived and the parameterspresented. In comparison to car-to-car communication, larger communicationranges can be achieved by similar data rates. Furthermore, the dynamic of trainsis smaller than for road vehicles. As already presented in [?] the update delayis sufficient for electronic coupling application. Hence, the ITS-G5 standard issuitable for mid range communication for electronic coupling applications.
Acknowledgement
The authors are thankful for the support of the European Commission throughthe Roll2Rail project [?], one of the lighthouse projects of Shift2Rail [?] withinthe Horizon 2020 program. The Roll2Rail project has received funding from theEuropean Unions Horizon 2020 research and innovation program under GrantAgreement no. 636032.

References
1. Joachim Winter, Andreas Lehner, and Eugen Polisky. Electronic Coupling of NextGeneration Trains. In 3rd International Conference on Railway Technology: Re-search, Development and Maintenance, Cagliari, 2016. Civil-Comp Press.
2. Andreas Lehner, Cristina Rico Garcıa, and Thomas Strang. On the performanceof TETRA DMO short data service in railway VANETs. Wireless Personal Com-munications, 69(4):1647–1669, 2013.
3. Paul Unterhuber, Stephan Pfletschinger, Stephan Sand, Mohammad Soliman,Thomas Jost, Aitor Arriola, Inaki Val, Cristina Cruces, Juan Moreno, Juan PabloGarcıa-Nieto, Carlos Rodrıguez, Marion Berbineau, Eneko Echeverrıa, and ImanolBaz. A Survey of Channel Measurements and Models for Current and FutureRailway Communication Systems. Mobile Information Systems, 2016:1–14, 2016.
4. Paul Unterhuber, Andreas Lehner, and Fabian de Ponte Muller. Measurement andAnalysis of ITS-G5 in Railway Environments. In Communication Technologies forVehicles, pages 62–73, San Sebastian, 2016.
5. Paul Unterhuber, Mohammad Soliman, and Damini Gera. Wide Band Propagationin Train-to-Train Scenarios - Measurement Campaign and First Results. In 11thEuropean Conference on Antennas and Propagation, Paris, 2017. IEEE.
6. Mohammad Soliman, Paul Unterhuber, and Damini Gera. First Analysis of InsideTrain Communication with ITS-G5 Measurement Data. In Thirteenth Interna-tional Symposium on Wireless Communication Systems, Poznan, 2016. IEEE.
7. Trenitalia ETR 500. www.trenitalia.it, 2017.8. Andreas Lehner, Thomas Strang, and Paul Unterhuber. Train-to-Train at 450
MHz. In 11th European Conference on Antennas and Propagation, Paris, 2017.IEEE.
9. Roll2Rrail. www.roll2rail.eu, 2017.10. Shift2Rail. www.shift2rail.org, 2017.