Its america climate panel
14
Climate and Transportation: Pulling Out the Stops Deron Lovaas Federal Transportation Policy Director Natural Resources Defense Council ITS America Houston, Texas May 4, 2010
-
Upload
guest94e84d -
Category
Education
-
view
167 -
download
0
Transcript of Its america climate panel

Climate and Transportation:
Pulling Out the Stops
Deron LovaasFederal Transportation Policy Director
Natural Resources Defense Council
ITS America
Houston, Texas
May 4, 2010

Slide
Moving America Beyond Oil
“ We have a serious problem. America is
addicted to oil.”
President George W. Bush,
2006 State of the Union

Slide
2008 EPA Emissions Inventory
Economy-wide
Transportation = 27%*
Transportation
Passenger Vehicles = 58%
3
* End use only. If production and refining of petroleum is included, then transportation share would increase to roughly 1/3rd.
Source: 2010 EPA GHG Emission Inventory

Slide
Travel Activity and Oil Imports
4
5,000
10,000
15,000
20,000
25,000
30,000
0
1,000,000
2,000,000
3,000,000
4,000,000
5,000,000
1970 1980 1990 2000
Tra
nsit
Bo
ard
ing
s (
in m
illio
ns)
Veh
icle
Miles T
rav
ele
d (
millio
ns)
an
d O
il I
mp
ort
s (
tho
usan
d b
arr
els
)
Year
Vehicle Miles Traveled Oil Imports Transit Boardings

Slide
Fuel Economy: Jump, then Stall
5

Slide
Vehicle and Fuel Improvements:
Cornerstone, but Not the Building
6
325 MMT
570 MMT
750 MMT
Assumes fixed efficiency baseline.
LDV CO2 and CAFE Stds plus RFS2
Reduction Targets(from 2005 baseline)
2020 = 17%2030 = 38%2050 = 80%
Source: NRDC analysis
U.S. Transportation Sector Emissions
Slide
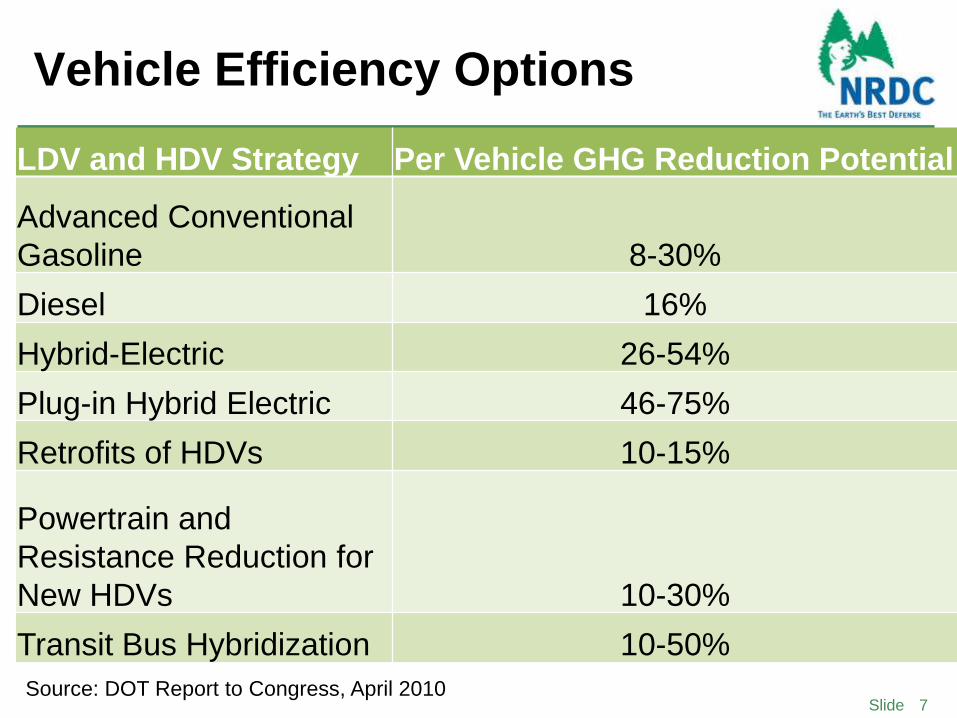
Vehicle Efficiency Options
7
LDV and HDV Strategy Per Vehicle GHG Reduction Potential
Advanced Conventional
Gasoline 8-30%
Diesel 16%
Hybrid-Electric 26-54%
Plug-in Hybrid Electric 46-75%
Retrofits of HDVs 10-15%
Powertrain and
Resistance Reduction for
New HDVs 10-30%
Transit Bus Hybridization 10-50%
Source: DOT Report to Congress, April 2010

Slide
Low-Carbon Fuel Strategies
8
Strategy
GHG Reduction
Effectiveness Net Included Cost per Tonne Cobenefits
Ethanol n/a n/a n/a
Biodiesel n/a n/a n/a
CNG 0.3-0.6% Net savings Positive
LPG <0.1% Not calculated Positive
Synthetics Uncertain/varies Uncertain/varies Positive
Alternative
Aviation
Fuels Uncertain/varies Uncertain/varies Positive
Hydrogen FC
2.3-3.2% (2030);
18-22% (2050) Net savings
Positive and
Negative
BEV
2.2-2.5% (2030);
26-30% (2050) Net savings
Positive and
Negative
Source: DOT Report to Congress, April 2010

Slide
System Efficiency + Reducing
Carbon-Intensive Activities• Combined 2.9-6.1% Reduction Potential from:
– Highway and Truck Operations and Management
– Freight Rail and Marine Operations
– Air Traffic Operations
– Infrastructure Construction and Maintenance
• Combined 4.9-17% (2030) and 6.4-21% (2050) Reduction
Potential from:
– Pricing
– Transit, Nonmotorized and Intermodal Travel
– Land Use and Parking
– Commute Travel Reduction
– Public Information Campaigns9Source: DOT Report to Congress, April 2010

Slide
Sea Change for CAFE, What Next?
• And now, AAM
says: “The
national [fuel
economy and
GHG] program
announced today
makes sense for
consumers, for
government
policymakers and
for automakers.”
10
Year Vote Senate Bill
1990 42-57Break Filibuster against bill to
boost CAFE by 40% by 2000
199137
SponsorsBill to boost CAFE by 2001
1994-
2000
CAFE
Freeze
Provision added by Congress in
FY06 budget
1999 40-55Non-binding resolution to unfreeze
CAFE
2002 44-56Amendment to freeze CAFE for
pick-up trucks
2003 32-65Amendment to increase CAFE to
40 mpg by 2015
2005 28-67Amendment to increase CAFE to
40 mpg by 2015

Slide 11Source: CBO, 2007

Slide
VMT Growth:
Already Trending Downward
12Source: Pisarski and Cambridge Systematics

Slide
“The Market Wants this Stuff”
Is there adequate supply of alternative development in existing
housing and new construction?
0.00%
20.00%
40.00%
60.00%
80.00%
100.00%
Nort
heast
Gre
at
Pla
ins a
nd
Mid
west
South
-
Centr
al
Answering "Not enough"
Source: Jonathan Levine, Zoned Out: Regulations, Markets and
Choices in Transportation and Metropolitan Land-Use, 2006.

Slide 14
Thank You!
202-289-2384
For more information regarding NRDC’s Energy Program
http://www.nrdc.org/energy/