
ITP Industrial Distributed Energy: National Account Energy ... · PDF fileelectrical energy...
48
ORNL/TM- 2007/101 National Account Energy Alliance Final Report for the Field Scale Test and Verification of a PureComfort® 240M Combined Heat and Power System at the Ritz Carlton, San Francisco August 2007 Prepared by T. Wagner T. Rosfjord A. Morrow
Transcript of ITP Industrial Distributed Energy: National Account Energy ... · PDF fileelectrical energy...

ORNL/TM- 2007/101
National Account Energy Alliance Final Report for the Field Scale Test and Verification of a PureComfort® 240M Combined Heat and Power System at the Ritz Carlton, San Francisco
August 2007
Prepared by T. Wagner T. Rosfjord A. Morrow

DOCUMENT AVAILABILITY
Reports produced after January 1, 1996, are generally available free via the U.S. Department of
Energy (DOE) Information Bridge.
Web site http://www.osti.gov/bridge
Reports are available to DOE employees, DOE contractors, Energy Technology Data Exchange
(ETDE) representatives, and International Nuclear Information System (INIS) representatives from
the following source.
Office of Scientific and Technical Information
P.O. Box 62
Oak Ridge, TN 37831
Telephone 865-576-8401
Fax 865-576-5728
E-mail [email protected]
Web site http://www.osti.gov/contact.html
This report was prepared as an account of work sponsored by an
agency of the United States Government. Neither the United States
Government nor any agency thereof, nor any of their employees,
makes any warranty, express or implied, or assumes any legal
liability or responsibility for the accuracy, completeness, or
usefulness of any information, apparatus, product, or process
disclosed, or represents that its use would not infringe privately
owned rights. Reference herein to any specific commercial product,
process, or service by trade name, trademark, manufacturer, or
otherwise, does not necessarily constitute or imply its endorsement,
recommendation, or favoring by the United States Government or
any agency thereof. The views and opinions of authors expressed
herein do not necessarily state or reflect those of the United States
Government or any agency thereof.
This report was prepared by EXERGY Partners Corp. as an account
of work sponsored by Gas Technology Institute (GTI) and Oak Ridge
National Laboratory. Neither GTI, members of GTI, Oak Ridge
National Laboratory nor any person acting on behalf of all or any of
them:
a. Makes any warranty or representation, express or implied with
respect to the accuracy, completeness, or usefulness of the
information contained in this report, or that the use of any
information, apparatus, method, or process disclosed in this report
may not infringe privately-owned rights, or
b. Assumes any liability with respect to the use of, or for any and all
damages resulting from the use of, any information, apparatus,
method, or process disclosed in this report.
ORNL/TM-2007/101 ORNL/SUB/07-4000034520/2
Engineering Science and Technology Division
NATIONAL ACCOUNT ENERGY ALLIANCE FINAL REPORT FOR THE FIELD SCALE TEST AND VERIFICATION OF A PURECOMFORT® 240M COMBINED HEAT AND
POWER SYSTEM AT THE RITZ CARLTON, SAN FRANCISCO
T. Wagner T. Rosfjord A. Morrow
of UTC Power
South Windsor, CT 06074
Under Subcontract No. KI32195 between EXERGY Partners Corp. and the Gas Technology Institute
Technical Monitor: Neil Leslie
And Subcontract No. 4000034520 (GTI subcontract #KI31894) between the Gas Technology Institute and Oak Ridge National Laboratory
Technical Monitor: Therese Stovall
Date Published: August 2007
Prepared by OAK RIDGE NATIONAL LABORATORY
Oak Ridge, Tennessee 37831-6283 managed by
UT-BATTELLE, LLC for the
U.S. DEPARTMENT OF ENERGY under contract DE-AC05-00OR22725


Table of Contents List of Figures .......................................................................................................................iii List of Tables ....................................................................................................................... iv 1. Introduction .................................................................................................................... 1 2. CHP System and Project Site Integration....................................................................... 4
2.1 PureComfort® 240M CHP System ............................................................................ 4 2.2 Project Site and CHP System Integration ................................................................. 5
3. CHP System Installation ................................................................................................ 9 3.1 Installation in an Urban Environment ........................................................................ 9 3.2 Interconnecting with a Network Utility Grid ............................................................. 12
4. CHP System Operation and Performance.................................................................... 16 4.1 Operating Hours and Delivered Power ................................................................... 16 4.2 CHP Efficiency and Operating Economics.............................................................. 24 4.3 Interactions with Ritz-Carlton Energy Infrastructure................................................ 28 4.4 Discussion of Integration Issues ............................................................................ 33
5. Summary of Lessons Learned ..................................................................................... 35 5.1 Installation and Integration Issues ......................................................................... 35 5.2 Equipment Design Issues ...................................................................................... 36
References ......................................................................................................................... 38
ii

List of Figures
Figure 1 CHP System Delivers Electrical and Thermal Energy .............................................1
Figure 21 Electrical Power and Chilling in January 2006.....................................................23 Figure 22 Electrical Power and Chilling in June 2006..........................................................23
Figure 2 CHP System Potential by Building Type (Ref. 2 data) .............................................3 Figure 3 PureComfort® 240M CHP System...........................................................................5 Figure 4 Ritz-Carlton, San Francisco Hotel ...........................................................................6 Figure 5 Electrical Power Demand ........................................................................................7 Figure 6a CHP Mode ............................................................................................................8 Figure 6b Simultaneous Mode ..............................................................................................8 Figure 6c Electric Chiller Only Mode .....................................................................................8 Figure 7 Rooftop View Before and After CHP System Installation .........................................9 Figure 8 CHP System Layout on Ritz-Carlton Rooftop ........................................................10 Figure 9 View of Two of the Microturbines and the Exhaust Manifold..................................10 Figure 10 Installed Absorption Chiller with Enclosure..........................................................11 Figure 11 Hoisting the Chiller ..............................................................................................12 Figure 12 Radial and Network Electrical Supplies ...............................................................13 Figure 13 Network Protector Opens with Fault on Parallel Feeder ......................................14 Figure 14 Exporting Onsite Power Could Trip a Network Protector .....................................15 Figure 15 Additional Equipment for Network Interconnection ..............................................15 Figure 16 CHP System Operation (January-June 2006) .....................................................18 Figure 17 CHP System Operation (July-December 2006) ...................................................18 Figure 18 Electrical Power and Chilling (January-June 2006) .............................................20 Figure 19 Electrical Power and Chilling (July-December 2006) ...........................................20 Figure 20 Microturbine Power De-rate (January-June 2006) ...............................................21
Figure 23 Energy Delivered and Consumed (January-June 2006) ......................................25 Figure 24 Energy Delivered and Consumed (July-December 2006)....................................25 Figure 25 Electrical and CHP Efficiency (January–June 2006)............................................27 Figure 26 Electrical and CHP Efficiency (July-December 2006) ..........................................27 Figure 27 CHP System Chilled Water Flow Rate in July .....................................................28 Figure 28 CHP Mode with 4 Microturbines ..........................................................................30 Figure 29 CHP and Simultaneous Modes with 4 Microturbines ...........................................31 Figure 30 CHP and Simultaneous Modes with 2 Microturbines ...........................................32
iii

List of Tables
Table 1 PureComfort® 240M CHP System Performance Specifications ................................ 5 Table 2 Measured and Calculated Performance Parameters in RMS Data Records........... 17 Table 3 CHP System Operation in 2006 ............................................................................. 17 Table 4 2006 CHP System Energy in 2006......................................................................... 24 Table 5 CHP System Operating Economics for 2006.......................................................... 26
iv

Executive Summary
install and operate a PureComfort® 240M Cooling, Heating and Power (CHP) System at the Ritz-Carlton, San Francisco. This packaged CHP System integrated four microturbines, a double-effect absorption chiller, two fuel gas boosters, and the control hardware and software to ensure that the system operated predictably, reliably, and safely. The chiller, directly energized by the recycled hot exhaust from the microturbines, could be configured to provide either chilled or hot water. As installed, the system was capable of providing up to 227 kW of net electrical power and 142 Refrigeration Tons (RT) of chilled water at a 15C (59F) ambient temperature. The total installed cost for the system without incentives was $1,040,000. The customer is satisfied with the system and has ordered two more systems for another location.
The CHP System installation overcame special challenges associated with the Ritz-Carlton urban environment. The system was configured to fit in the limited space, and heavy components were safely hoisted despite the narrow alley, and highly sloped access. Proper interactions with neighbors, such as an adjacent school, facilitated obtaining permits and permissions. A safe, reliable approach to a network grid interconnection was devised and accepted by the electric utility, but with additional equipment and cost.
The CHP System operated for 8,231 hours in 2006 or 94% of all available time; 90% of these hours were at full power. A careful
analysis of two fuel gas booster failures that occurred during the first year of operation has resulted in the specification of more durable motors within these system elements. The electrical energy capability of the CHP System was fully demanded by the hotel. Instantaneous CHP efficiency often exceeded 70% during June-October. However, the hotel chilling demand was limited by the low demand during cooler months and nighttime hours, and by the interaction with a parallel, pre-existing electric chiller. This interaction
Under collaboration between the Department of Energy, the Gas Technology Institute, and Oak Ridge National Laboratory, UTC Power partnered with Host Hotels and Resorts to
suppressed CHP chilling because of a high minimum electric chiller output. For brief periods when only two microturbines operated, the higher proportional use of the available CHP chilling resulted in a CHP efficiency averaging over 80% with frequent instances exceeding 90%. Over the entire test period, the reduced use of the available CHP thermal energy limited the CHP output to 52% of its capability. Within this limitation, the system delivered 1.74 GWh(e) (5,940 MMBtu) of electrical energy and 1.96 GWh(th) (6,700 MMBtu) of chilling energy, while consuming 235,000 therms (23,500 MMBtu) of natural gas fuel energy. For the year, the CHP efficiency was 53.7%.
v

Due to the lower than anticipated thermal usage, the annual savings during the demonstration period were only $74,000. Electric rate increases since that time have increased the savings to $120,000/year. Based on lessons learned and recent product enhancements, a future installation under similar conditions would be configured to provide simultaneous heating and cooling rather than cooling alone; this would increase the thermal utilization and provide additional savings by offsetting expensive steam heating. The projected savings for such a system would be $250,000/year, resulting in a 4.2 year payback without incentives.
The significant Lessons Learned from this research test and verification project were: 1. A site owner will be pleased with a reliable, low-emissions CHP system even if its
utilization is less than optimal. 2. Energy demands, particularly the thermal energy demands, are not easily predicted for a
real building but are critical to achieving the highest CHP benefit. 3. The challenges of CHP installations in urban environments, particularly retrofit
installations, can be overcome with proper planning and communication. 4. CHP network interconnection requires equipment and cost beyond that for radial
interconnection, indicating that practices should be standardized and simplified. 5. Optimal integration of a CHP system into a building energy infrastructure requires the
consideration of all operating modes imposed by the site energy demands and pre-existing equipment.
vi

1. Introduction
The National Accounts Energy Alliance is a collaborative partnership that aims to increase awareness and facilitate adoption of cost-effective advanced energy technologies by national accounts and large commercial customers. A national account is identified as an agency with a large number of similar buildings spread across the United States, such as a hotel chain or a national retail company or a group of affiliated health care installations. The Alliance is managed by the Gas Technology Institute with support from the U.S. Department of Energy and the American Gas Association. The project described in this report was developed within the Alliance in response to a solicitation issued by the Oak Ridge National Laboratory on behalf of the U.S. Department of Energy.
Annually, the United States economy consumes about 97 Quadsa of energy in satisfying the demands of residential, commercial, and transportation users (Ref. 1). Of this total, approximately 40% is directed to produce electrical power for buildings – residential, commercial, institutional, and industrial. Unfortunately, only 31% of this input energy is converted to electrical energy. Nearly 70% of this input energy is wasted by central power plants that produce hot exhaust which is not used.
The US Department of Energy has been developing technologies that can mitigate inefficient use of energy for electric power production. In particular, the Distributed Energy Program (a part of the Office of Energy Efficiency and Renewable Energy until October 2005) led efforts to develop Integrated Energy Systems that combine a power generation device to produce electrical energy and a thermally-activated device that captures the hot generator exhaust to produce thermal energy in a form useful to a customer. Such systems are also known as CHP
systems, where CHP designates either “combined heating and power” or “cooling, heating, and power”, depending on the system manufacturer. Either interpretation reflects an Integrated Energy System that has at least two useful energy outputs for the fuel energy input required by the power generator. That is, an additional useful energy stream, in the form of thermal energy, is produced from the exhaust energy that would otherwise be wasted as shown schematically in Figure 1.
Figure 1 CHP System Delivers Electrical and Thermal Energy
Often the thermal stream contains as much or more useful energy as the generator’s electrical energy, at least doubling the fuel utilization (total useful energy output/fuel energy input) for the CHP system. In the example shown in Figure 1, the fuel utilization, also termed the CHP Efficiency, increases from 30% for electrical energy only to 80% for CHP. Further, since the
a 8A Quad = quadrillion Btu; 1 Quad = 3 x 10 MWh
1
thermal energy stream is produced from recycled generator exhaust and without additional fuel consumption, pollutants that would have been emitted by devices to directly deliver this thermal energy are avoided. Hence, the CHP system emits much less CO2, CO, hydrocarbons, NOx, SOx, and particulates than conventional devices using a combination of grid-supplied electricity and local boilers to deliver the same total energy.
It is not envisioned that CHP systems replace all central power plants for electrical energy production. Rather the CHP systems are targeted to be smaller systems, often capable of less than 1 MW of electrical power, that are located at or near the end-user. This latter feature is important as it is neither easy nor economical to transport thermal energy over large distances. By locating the CHP system near the user, both the electrical and thermal energy can be affordably integrated into the user’s energy infrastructure. Indeed, the wasteful nature of central power plants arises because they cannot affordably provide a thermal energy stream to distant users. (A district energy system located in a city, however, represents a central power plant that could affordably embrace CHP principles.) Smaller systems, often less than 1 MW, are often a better match to the typical electrical demand of sites such as hotels and hospitals.
Locating the CHP system at or near the end-user can provide other benefits. CHP systems can be configured to operate both parallel to the electrical grid and independent of the electrical grid. In the first mode, the CHP system reduces the electrical energy demanded from the grid. This feature can be especially beneficial to both the end-user and the electrical utility during peak power demand periods. The end-user may avoid importing very expensive electricity, and the utility may avoid imposing a “brown-out” in a congested region. In the second mode of operation, the CHP system provides secure power by ensuring that, at least, critical end-user electrical demands are met even when natural or man-made power outages occur. This feature becomes more resilient when the CHP system can operate on multiple types of fuel.
CHP systems integrate an electrical power generator, a thermally activated device for thermal energy, and control system software/hardware. Current systems use microturbines, small gas turbines, and reciprocating engines as the power generator. Thermally activated devices include: (1) heat exchangers to produce hot water, steam, or hot air for space conditioning or industrial process energy, (2) absorption chillers (either directly or indirectly energized by generator exhaust) to produce chilled water for air conditioning, and (3) desiccant dehumidification. DOE/industry partnerships developed several packaged CHP systems – that is, integrated systems rather than a collection of components that have to be engineered on site - that were ready for evaluation at real end-user sites.
DOE sponsored a market study published in September 2002 (Ref. 2) to assess the potential successful applications of CHP systems in buildings, including identifying the most desirable types of buildings. The study concluded that significant CHP system adoption was possible – over 35 GW of power generation in buildings by 2020 – based on “achievable economics” as supported by system payback often less than four years. The study recognized that current CHP systems were concentrated in education and health care buildings, but that significant potential existed in many other building segments as depicted in Figure 2.
These results and those of other studies (Ref. 3 and 4) of national account sectors, which are business categories that contain one or more entities that construct and operate numerous, nearly identical buildings across a geographical region, led DOE to concentrate on four building
2

classes: healthcare, education, hotels, and supermarkets. These buildings had two important common characteristics.
0
2,000
4,000
6,000
8,000
10,000
12,000
Po
ten
tia
l (M
W)
Office School Supermarket Hospital Apartment Hotel Retail Restaurant College Military
Figure 2 CHP System Potential by Building Type (Ref. 2 data)
First, each class demands significant, coincident electrical and thermal energy. Since a CHP system simultaneously produces electrical and thermal energy, the desired site demands both, and for a large portion of every day of the year. If the two loads are neither significant nor consistent, then the CHP system energy efficiency and pollution benefits diminish. The efficiency benefit is particularly important to the end-user as this feature reduces total energy cost to offset the initial investment in the CHP equipment. The target building classes offered greater potential in this characteristic. For example, while the largest apparent potential was for office buildings, this class stands out mostly because it is the largest size class of US buildings. However, the duty cycle for office buildings results in very “peaky” loads during normal working hours greatly reducing the utilization of the CHP system.
Second, each building class represents an opportunity for replicability. In some cases (e.g. hotels), this arises through a national account, while in other cases (e.g. education) it arises because of the numerous nation-wide opportunities such as large secondary schools and colleges/universities of all sizes. High replicability will advance CHP standardization and increase sales volume, thereby enhancing reliability and affordability.
In 2003, Oak Ridge National Laboratory, on behalf of the U.S. Department of Energy, issued a solicitation for projects that installed, operated, and monitored a packaged CHP system in one of the target building classes. UTC Power partnered with Host Hotels and Resorts to propose the installation and operation of a PureComfort® 240M CHP System at the Ritz-Carlton, San Francisco, as one project in the National Accounts package submitted by the Gas Technology Institute. This report provides a summary of the data obtained and lessons learned during the installation and operation of the CHP system. Subsequent sections of this report describe:
• CHP System and Project Site Integration • CHP System Installation • CHP System Operation and Performance • Summary of Lessons Learned
3

2. CHP System and Project Site Integration
2.1 PureComfort® 240M CHP System
The PureComfort® 240M CHP System is an integrated system that delivers electrical power and either hot water or chilled water. Technology for the system was collaboratively developed by the U.S. Department of Energy, UTC Power, United Technologies Research Center, and Oak Ridge National Laboratory. The system performance was documented at specified operating conditions at the United Technologies Research Center CHP Laboratory which contains load banks to simulate a wide range of thermal loads in accordance with Air-Conditioning and Refrigeration Institute (ARI) methodology. The PureComfort® product is the only commercially available, small-scale packaged CHP system that produces electricity and air conditioning.
The PureComfort® 240M CHP System is one of three offerings in the UTC Power PureComfort®
M product line (Figure 3). This system contains four microturbines that are manufactured by the Capstone Turbine Corporation and rated at 60 kW of electrical power at a 59F, sea level condition. Each microturbine uses advanced natural gas combustion technology to constrain NOx emissions < 9 ppm @ 15% exhaust oxygen; it is CARB 2003b certified. The exhaust from each microturbine is manifolded together and delivered as the input energy to a double-effect absorption chiller. This chiller is produced by Carrier, and is an adaptation of a direct-fired chiller that increases the heat transfer area of the first stage generator to compensate for the lower temperature inlet energy. Because it is a double-effect device, the chiller effectively converts the input thermal energy to chilled water and achieves a COP ~ 1.3. The double-effect feature also permits a manual change-over of the chiller to operate as either a chiller or heater. In this manner, the CHP system becomes a “four seasons” product that can provide either space chilling or space heating. The control system includes a diverter valve in the duct between the microturbines and the chiller. If the chilling demand is zero, this valve diverts the microturbine exhaust to atmosphere. If a chilling demand exists, the diverter is positioned to deliver the energy required for the chiller to meet the demand. The ability to isolate the chiller under no load situations is important to avoid excessive concentrations within the chiller and possible solution crystallization. The diverter valve is designed, and was tested, to ensure this capability.
Also shown in the figure are the fuel gas boosters (FGB) produced by Copeland that elevate the pressure of the natural gas fuel supplied by the gas utility to the level required by the microturbine. Each PureComfort® CHP System uses one FGB for a pair of microturbines. The FGB is powered by the DC power produced within one of the microturbine pair and therefore that microturbine experiences a parasitic electrical load that diminishes its AC output. The other microturbine of the pair does not have this output reduction.
Table 1 details the performance specifications of the PureComfort® 240M product for both the standard ARI hot day at 35C (95F) and International Standards Organization (ISO) day at 15C (59F). The net power levels include power for the two FGB. As indicated, the combined electrical and chilling capability of the 240M results in CHP efficiency greater than 80%. To achieve this level in an application, the full system output capacity must by used productively by the building.
b California Air Resources Board
4

Two Fuel Diverter Valve with
Double Effect
Absorption Chiller
bypass Gas Boosters
Four 60 kW Microturbines
Figure 3 PureComfort® 240M CHP System
Table 1 PureComfort® 240M CHP System Performance Specifications
Hot Day - ARI 35C (95F)
Net Power kW 193
Cooling RT 124
CHP Efficiency % 80
ISO Day at 15C (59F)
Net Power kW 227
Cooling RT 142
CHP Efficiency % 91
2.2 Project Site and CHP System Integration
The CHP System was installed at the Ritz-Carlton, San Francisco. This hotel is owned by Host Hotels and Resorts, a real estate investment trust, which operates with a vision of being the premier lodging real estate company. Host owns properties with prestigious names such as Ritz-Carlton, Marriott, Sheraton, Hyatt, Fairmont, and Four Seasons. Host’s portfolio includes over 100 properties in 26 states including large holdings in California, Florida, and near the
5

cities of Atlanta, Boston, New York, and Washington DC. There is a potential for a high level of replicability within Host Hotels and Resorts.
The Ritz-Carlton, San Francisco, is the only Mobil Five-Star, AAA Five Diamond hotel in the city. This Nob Hill landmark recently completed a $12.5M renovation and features 336 guestrooms. Host and Ritz-Carlton desired to add a CHP system to their energy infrastructure because of its alignment with a corporate vision for environmental stewardship and potential for energy cost savings.
Figure 4 Ritz-Carlton, San Francisco Hotel
Based on historical data and analyses, the Ritz-Carlton demand averages 670 kW of electrical power and 1,200 kW of combined thermal energy use and power. Figure 5 is a trace of instantaneous electrical power demand for a year beginning in November 2002. The electrical demand rarely dropped below 500 kW.
Because of the high level of activity in the hotel, these loads are relatively flat throughout the year. The hotel has a 300 RT electric chiller to provide space cooling. The air conditioning load has a maximum of ~150 RT or 530 kWth. If this thermal kW load was met by an electrical chiller with COP = 4, the corresponding maximum electrical demand would be 130 kW. If the CHP system chilling output displaced the electric chiller at the absorber maximum output of ~130 RT (a value interpolated from Table 1 for an 29C (85F) ambient), the hotel electrical load would decrease by ~110 kW and on average still exceed 560 kW. At this ambient temperature, the
6

maximum CHP System net electrical power capability would be 200 kW, only 36% of the demand. Hence, all of the CHP system electrical output would be consumed.
Figure 5 Electrical Power Demand
Because of the significant and persistent air conditioning demand, the CHP System was integrated only with the chilled water loop of the hotel energy infrastructure. That is, while the system could have been configured, with a manual seasonal change over, to provide either space heating or space cooling, it was decided to permit only the latter.
Figure 6 depicts the integration of the absorption chiller into the Ritz-Carlton chilled water loop that contained two, 300 RT electric chillers (a primary unit and a spare). As indicated, the absorption and electric chillers were in parallel. Additionally, a parallel by-pass loop was required to balance pressure loss because the chilled water flow rate was much higher for the electric chiller than for the absorber. Motorized isolation valves were used to achieve this condition for the three operating modes shown in the figure.
In the absorption chiller mode, or “CHP Mode”, (Figure 6a), the motorized valves were positioned to allow returning chilled water to flow through the absorber and the bypass loop. The chilled water flow rate set-point through the absorber was 270 GPM; a flow meter at the absorber exit measured this flow rate. The bypass had a similar flow rate.
In the “Simultaneous Chiller” mode (Figure 6b) valve settings allowed flow through both chillers but not through the bypass. When this occurred, the lower flow resistance of the electric chiller reduced the chilled water flow through the absorber to ~170 GPM.
Figure 6c reflects the chilled water flow path prior to installing the CHP System, including the valve position to isolate the absorption chiller.
7

Motorized
bypass valve is open to
bypass loop when absorber
can meet building demand
Electric
Chiller 2
Electric
Chiller 1 Absorption
Chiller
Chilled Water
Return
Chilled Water
Pumps
Chilled Water
Supply
Motorized
isolation valve
open when
absorber is
operating
Figure 6a CHP Mode
Motorized
bypass valve open to electric
chillers when absorber cannot
Electric
Chiller 2
Electric
Chiller 1 Absorption
Chiller
Chilled Water
Return
Chilled Water
Pumps
Chilled Water
Supply
meet building demand
or
Motorized
isolation valve
open when
absorber is
operating
Figure 6b Simultaneous Mode
Motorized
bypass valve open to electric
chillers when absorber cannot
Electric
Chiller 2
Electric
Chiller 1 Absorption
Chiller
Chilled Water
Return
Chilled Water
Pumps
Chilled Water
Supply
meet building demand
or
Motorized
isolation valve
closed when
absorber is not
operating
Figure 6c Electric Chiller Only Mode
8

3. CHP System Installation
The installation of the CHP System at the Ritz-Carlton, San Francisco, occurred during the second half of 2005. A ribbon cutting event occurred at the site in October 2005 and the system was fully functional in December. Two installation issues deserve attention: installation in an urban environment and interconnecting with a network utility grid.
3.1 Installation in an Urban Environment
The CHP System was installed at the Ritz-Carlton on a small rooftop location (enclosed in white walls) four stories above grade as shown in Figure 7. The space was directly above the hotel mechanical room, but was long and narrow, and adjacent to an outdoor courtyard. The proximity to the mechanical room minimized plumbing integration challenges with the chilled water loop, but the closeness to the courtyard required that the system be very quiet. Additionally, the ground level space adjacent to the hotel available for hoisting the equipment was a narrow alley with some private access issues. Each of these issues was resolved.
Figure 7 Rooftop View Before and After CHP System Installation
Figure 8 is a schematic layout of the system that complied with the available rooftop space. The CHP System ducting and FGB locations were modified from the standard package and the components were positioned to leave the existing back-up generator and cooling tower in their original locations. Figures 9 and 10 show the equipment after installation.
9

Figure 8 CHP System Layout on Ritz-Carlton Rooftop
Figure 9 View of Two of the Microturbines and the Exhaust Manifold
10

Figure 10 Installed Absorption Chiller with Enclosure
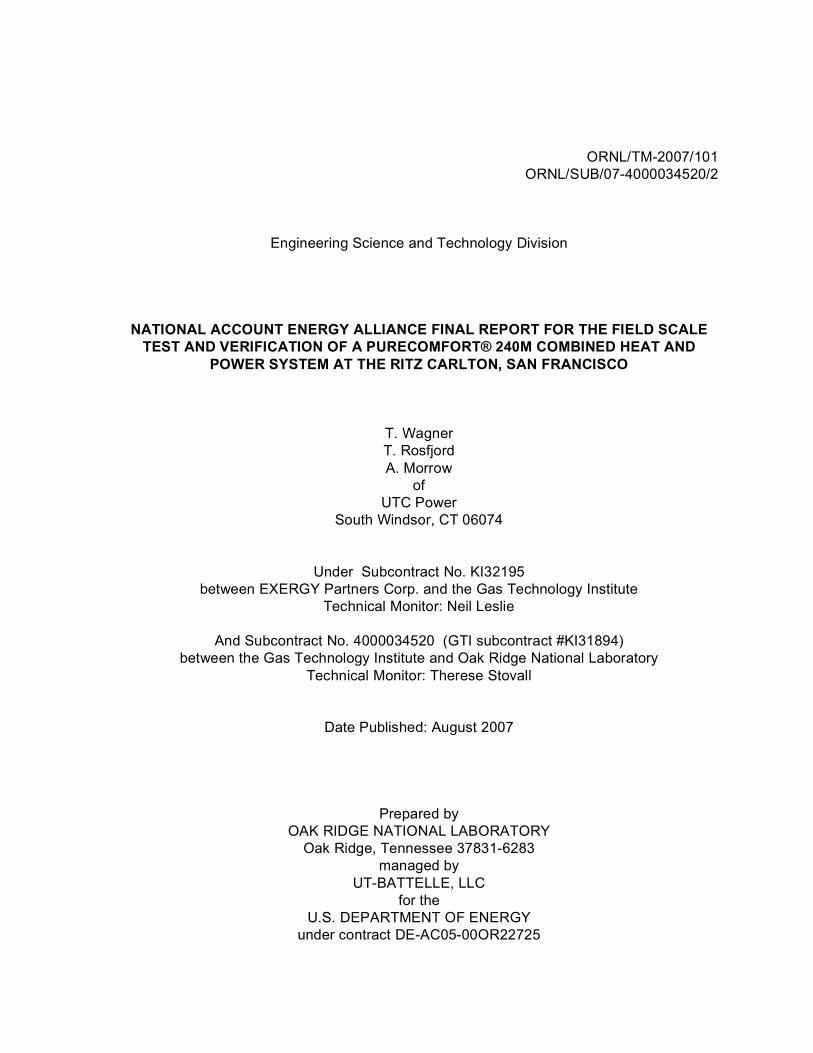
There were significant challenges to getting this equipment onto the rooftop location, however, because of the limited hoist access. While each microturbine weighs only 770 kg (1,700 lb), the absorption chiller weighs 8400 kg (18,500 lb). An initial crane hoist lifted the microturbines and FGB. A second lift for the chiller was delayed a month to establish crane space requirements, city permits, and access to the private alley adjacent to the Ritz-Carlton. Figure 11 depicts the chiller lift in progress within the narrow alley.
Another consideration for an urban installation is the special permits and approvals that might be required. One such situation was encountered in this project. While it was expected that an air permit would be required from the Bay Area Air Quality Management District, an additional step to this process was required for the Ritz-Carlton location because of a neighboring school. In this case, a public notice and a 30-day comment period were required. This process was lengthened to properly communicate with the Asian population; translations into multiple languages were required.
Overall, the challenges of the urban installation were well managed and overcome. The CHP System layout was modified to fit the available space on the rooftop location. The equipment hoists were executed safely, and while alley access was neither adequately anticipated nor clearly communicated, the settlement with the owner was amicable. Code approvals were acquired. When operated, the CHP system noise signature (these microturbines are rated at 65 dBa at 10 m) did not disturb the hotel guests in the adjacent outdoor courtyard.
11
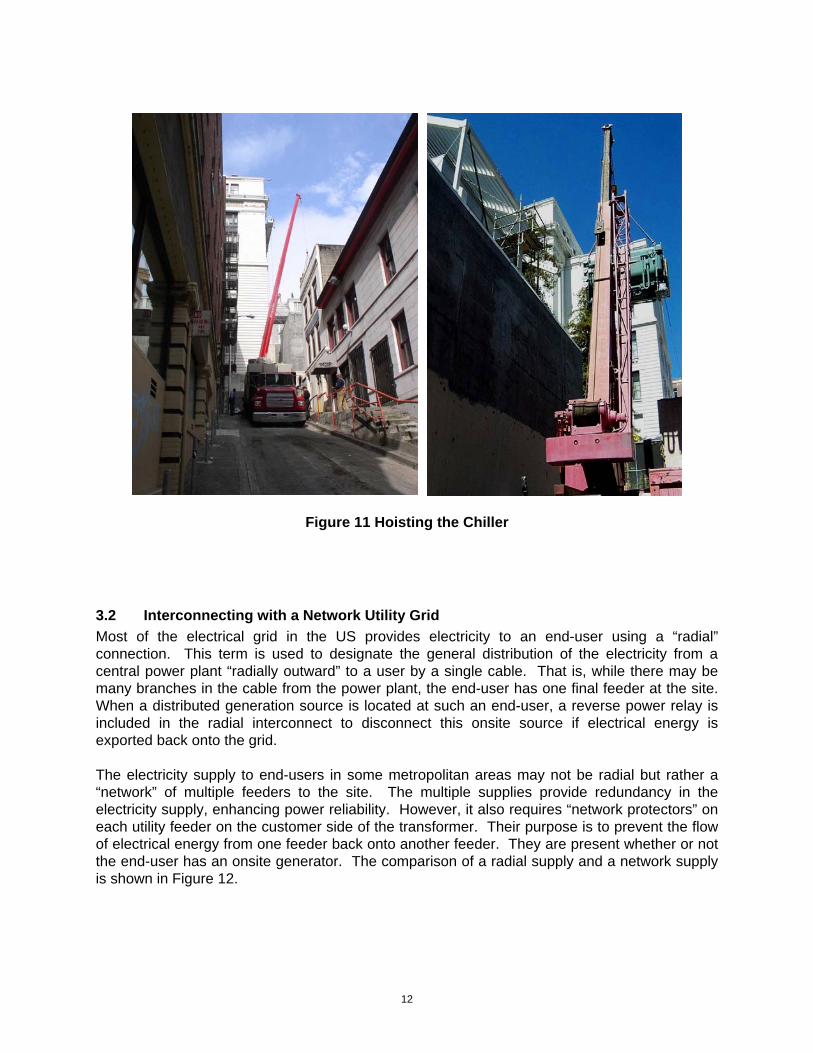
Figure 11 Hoisting the Chiller
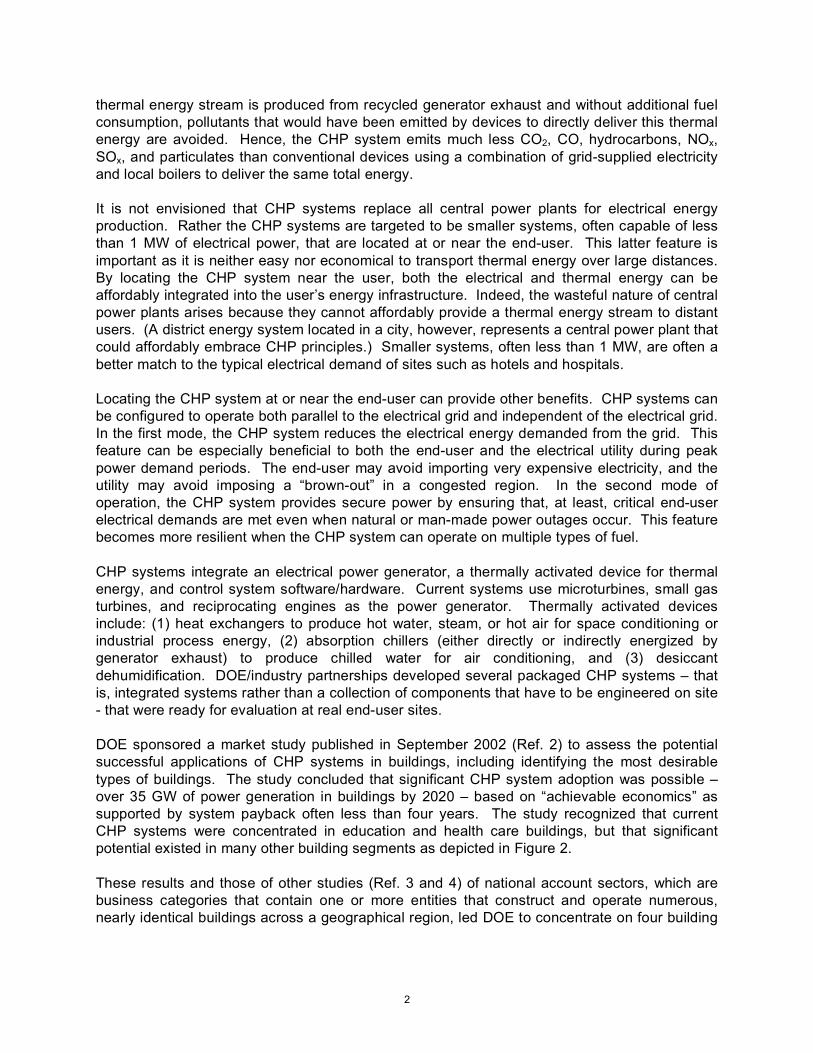
3.2 Interconnecting with a Network Utility Grid Most of the electrical grid in the US provides electricity to an end-user using a “radial” connection. This term is used to designate the general distribution of the electricity from a central power plant “radially outward” to a user by a single cable. That is, while there may be many branches in the cable from the power plant, the end-user has one final feeder at the site. When a distributed generation source is located at such an end-user, a reverse power relay is included in the radial interconnect to disconnect this onsite source if electrical energy is exported back onto the grid.
The electricity supply to end-users in some metropolitan areas may not be radial but rather a “network” of multiple feeders to the site. The multiple supplies provide redundancy in the electricity supply, enhancing power reliability. However, it also requires “network protectors” on each utility feeder on the customer side of the transformer. Their purpose is to prevent the flow of electrical energy from one feeder back onto another feeder. They are present whether or not the end-user has an onsite generator. The comparison of a radial supply and a network supply is shown in Figure 12.
12

Radial SupplyRadial Supply
UTILITY
DISTRIBUTION
SYSTEM
HOTELHOTEL
Network ProtectorsNetwork Protectors• On each utility source• On each utility source
HOTEL
• Customer side of transformer
• Breaker and Reverse Current
Protection Relay
Network Supply
HOTEL
• Customer side of transformer
• Breaker and Reverse Current
Protection Relay
Network Supply
UTILITY
DISTRIBUTION
SYSTEM
Figure 12 Radial and Network Electrical Supplies
A network protector is a combination of a breaker and a reverse current protection relay to prevent the reverse flow of current onto a feeder that experiences a fault (Figure 13). The protectors are set to instantaneously detect the reversal and open the contactor, but that opening takes 5-25 seconds. A network protector is owned by the utility and kept in an underground vault near the site; it requires a manual reset.
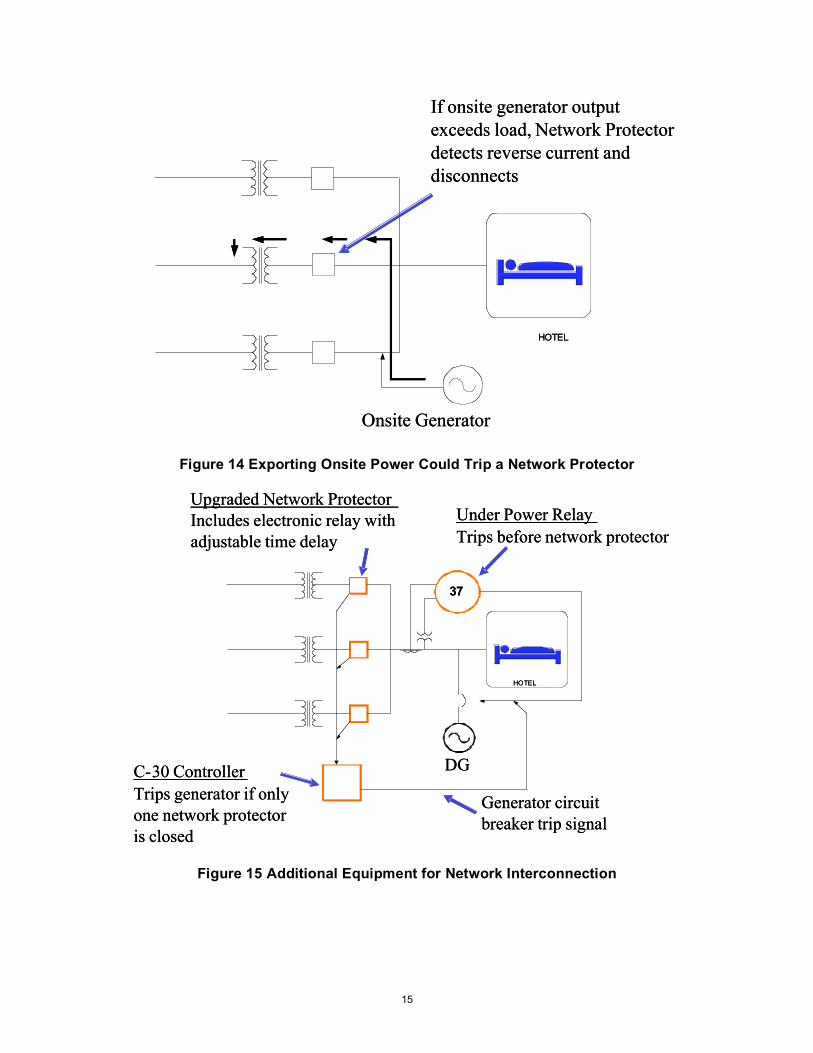
When onsite power generation is installed at a site with a network supply, it could be possible for the site load to momentarily drop below the generator output resulting in an export of electricity unless other preventive devices are used. This possibility is minimized by requiring a buffer between the generator and the normal load. However, this measure does not guarantee that an export will never occur. If an export does occur, the network protector senses a reverse current and instantaneously begins to open. This is depicted in Figure 14. It could be possible that all network detectors sense the reversal and begin to open; rendering the site without any grid-supplied electrical power and requiring time and cost to reset them.
The Ritz-Carlton is a site with a network electric utility connection and an onsite generator. This situation required special studies and electrical upgrades, and consequently additional cost, to achieve a grid interconnection for the CHP System that was safe and reliable. The final interconnection configuration is depicted in Figure 15. The network protectors were upgraded with an adjustable time delay to avoid the instantaneous response and an under-power relay that opens if the net demand for grid electricity drops below a threshold of 25 kW. Additionally,
13
a C30c controller isolates the onsite generator if it senses that any one network protector has opened – either because of a feeder fault or power export - adding redundant protection to prevent reverse electricity flow to any feeder. The cost of the interconnect upgrades required by PG&E totaled approximately $140,000.
Network Protector Detects ReverseNetwork Protector Detects Reverse
Current and DisconnectsCurrent and Disconnects
HOTEL
FAULT!!
FAULTCURRENT
HOTEL
FAULT!!
FAULTCURRENT
• Fault current flows from paralleled feeders to the faulted fee der.• Fault current flows from paralleled feeders to the faulted fee der.
• D• irection of current flow is reversed from normalDirection of current flow is reversed from normal
• Network Protector set to instantaneously detect reversed current flow• Network Protector set to instantaneously detect reversed current flow
Figure 13 Network Protector Opens with Fault on Parallel Feeder
UTC Power believes this was not an optimal solution for interconnecting a CHP system with a network, and more affordable and equally safe methods are possible. In particular, UTC Power desired to interconnect the CHP System to a sub-panel that had a minimum 240 kW load, and put a reverse power relay on that sub-panel. Such a configuration would treat the sub-panel as the point of common coupling just as for a radial network. If power was exported from that sub-panel to even the rest of the building, the reverse power relay would shut down the CHP System. Since the rest of the hotel would always be importing, it would provide an additional buffer between the CHP System and the network grid. This approach would avoid the costs to upgrade the network protectors and install the C-30 controller.
The utility experience on a network interconnection with a CHP System was just developing at the time of this project. Among the utility’s concerns was network protector cycling if the import became too low. That is, if the difference between the feed voltages was low, one feed could back-feed another one and cause a network protector to cycle closed and open too often. Further, the UTC Power solution was different from a recently composed network interconnection procedure. For both these reasons, it was recognized that the PG&E favored network interconnection was the most time expedient for this project.
A C30 is a digital controller with programmable logic that forms a part of a protection and control
system.
14
c
If onsite generator outputIf onsite generator output
exceeds load, Network Protectorexceeds load, Network Protector
detects reverse current anddetects reverse current and
disconnectsdisconnects
HOTEHO LTEL
Onsite GeneratorOnsite Generator
Figure 14 Exporting Onsite Power Could Trip a Network Protector
Upgraded Network ProtectorUpgraded Network ProtectorUnder Power RelayUnder Power RelayIncludes electronic relay withIncludes electronic relay with Trips before network protectorTrips before network protectoradjustable time delayadjustable time delay
3737
HOTELHOTEL
DGDGC-30 ControllerC-30 Controller
Trips generator if onlyTrips generator if only Generator circuitGenerator circuit
one network protectorone network protectorbreaker trip signalbreaker trip signal
is closedis closed
Figure 15 Additional Equipment for Network Interconnection
15

4. CHP System Operation and Performance
The operation and performance of the CHP System at the Ritz-Carlton, San Francisco, was based on data acquired by the UTC Power Remote Monitoring System (RMS). Data were acquired from the standard measurements made on each microturbine and the chiller, and from additional instrumentation for this installation. Important parameters from each microturbine included the net electrical power and ambient temperature. The additional instrumentation measured the total flow rate of the natural gas fuel, and the flow rate, return temperature, and leaving temperature of the chilled water at the absorption chiller.
The RMS system acquired data every six minutes. Each of these data points actually consisted of three data records – one for the chiller, one for the four microturbines, and one for measurements important to efficiency monitoring (referred to as the Efficiency Monitoring record), including total fuel flow rate and chilled water flow rate (it also duplicated chilled water temperatures). Table 2 provides a subset of the recorded or calculated performance parameters for each of these data records. Each of these records had a date/time stamp. When all aspects of RMS were operating properly, the three records had the same day/time stamp. However there were instances of “communication errors” or other indicators of unreliable data in one or more of the three records; in some cases one of the records did not include data recorded for the day/time of another record. Therefore it was important to review the data records to understand where data gaps existed and to assure that data records were synchronized to the same date/time stamp when multiple records were required to assess a system feature. For example, electrical power was contained in the microturbine record. Therefore, assessments of microturbine output, run-time and total delivered electrical energy required only the Microturbine record. Chilled water flow rate, return and leaving temperatures were contained in the Efficiency Monitoring record, allowing determination of the chiller output from this record alone. However, a determination of electrical or CHP efficiency required both the Microturbine and Efficiency Monitoring records to combine electrical, chilling and fuel flow rate data.
The following sections provide assessments for • Operating Hours and Delivered Power • CHP Efficiency and Operating Economics • Interactions with Ritz-Carlton Energy Infrastructure
4.1 Operating Hours and Delivered Power
The CHP System operated for 8,231 hours or 94% of the 8,760 hours available in 2006. This assessment was based on the system producing at least 60 kW of net electrical power and the assumption that if a sequence of missing or invalid Microturbine records was less than 1 hour in duration, and if the system was producing at least 60 kW immediately prior and following the sequence, the system was operating during that sequence. A sequence greater than 1 hr was considered a “data gap” and the system was considered non-operational. For 2006, data gaps represented 2.8% of the available run hours. Additionally, the system was documented not to be producing power for another 3.3% of the available hours. The monthly breakdown of operating, non-operating, and data gap hours is presented in Table 3.
16

Table 2 Measured and Calculated Performance Parameters in RMS Data Records
Chiller Record
Date/Time
Run Mode Chilling or Heating Always chilling
Run Status Off, Standby, Running
CHW_IN F Chilled water return
CHW_OUT F Chilled water leaving
Microturbine Record (items for each microturbine)
Date/Time
Run Time Hr
CMPINT F Inlet air temp at compressor
TET F Turbine exit temperature
ENG_SPEED RPM Engine shaft speed
OUTPOWER kW Net output power
Efficiency Monitoring Record
PRFFLOW MBtu/h Fuel energy from flow meter
ELEC_PWR kW Sum of microturbine OUTPOWER
PRI_FLOW GPM Chilled water flow rate from meter
PRI_T_IN F Chilled water return
PRI_T_OUT F Chilled water leaving
PRCOOLPW MBtu/h Calculated chilling rate
ELEC_EFF % Calculated electrical efficiency
INST_EFF % Calculated CHP efficiency
TOT_PRIF MMBtu Calculated cumulative fuel energy
ELEC_EY MWh Calculated cumulative electrical energy
PRCOOLEY MMBtu Calculated cumulative chilling energy
TAMB F Calculated from microturbine CMPINT
Table 3 CHP System Operation in 2006
Max Operating Non-Operating Data Gap
Hr Hr % Hr % Hr %
January 744 718 96.5% 26 3.5% 0 0.0% February 672 633 94.3% 25 3.8% 11 1.7%
March 744 601 80.8% 113 15.2% 30 4.0% April 720 510 70.8% 109 15.1% 101 14.1% May 744 648 87.0% 0 0.0% 92 12.3% June 720 717 99.6% 0 0.0% 3 0.4% July 744 742 99.7% 0 0.1% 1 0.1%
August 744 744 100.0% 0 0.0% 0 0.0% September 720 717 99.6% 3 0.4% 0 0.0%
October 744 741 99.6% 0 0.0% 3 0.4% November 720 718 99.7% 2 0.2% 0 0.0% December 744 742 99.8% 0 0.0% 2 0.2%
Total 8760 8231 94.0% 277 3.2% 243 2.8%
17

Figures 16 and 17 depict the accumulation of operating hours, and show the date and magnitude of the data gaps for the first half and second half of 2006, respectively.
Figure 16 CHP System Operation (January-June 2006)
Figure 17 CHP System Operation (July-December 2006)
18

Close examination of Figure 16 finds four discernable periods when the microturbines were not producing power – approximately 20 hours each on January 20, February 22, and March 20, and a 200 hr period beginning March 28. Together, these four periods represent 94% of the non-operating time for the year. The first three were minor maintenance periods including instances when the system was turned off to investigate chiller issues or system integration with the hotel chilling loop. The longest period was to repair the diverter valve in late March.
Most of the January-June data gap issues (each gap is denoted by a diamond symbol on the figure) occurred during late April and were due to communication interruptions between the site and the data server. Most of these occurred for a full day; one lasted slightly longer. This issue was resolved; no significant gaps occurred in the second half of the year.
In contrast with the first half of the year, periods of non-operation and data gaps were almost non-existent during the second half of the year. Electrical energy was delivered to the Ritz-Carlton for over 99.7% of these months.
Figures 18 and 19 depict the instantaneous net electrical power and chilling delivered to the Ritz-Carlton for the first and second half of 2006, respectively. The net electrical power includes the parasitic load of the two FGB. Aside from the outage to repair the diverter valve in late March, the microturbines delivered full power throughout the first half of the year, with three periods of half power observed during the second half - starting July 4, September 18, and November 13. In each case, the reduced power was due to a failure of one FGB which took two microturbines off line. The July event occurred for the FGB supporting microturbines #3 and #4 while the September event was for the FGB supporting microturbines #1 and #2. In both cases, the time to replace the FGB was excessive (13 days and 20 days, respectively). Root cause analyses indicated that “black powder” in the natural gas, a mix of particulates the size of talcum powder including ferrous material, shorted the FGB motor. Alternative motor winding coatings were investigated to prevent future occurrences but before being implemented, another FGB event occurred in November of 2006. In this case the FGB was replaced within two days. An intermediate solution now uses a higher temperature rated motor. The associated enhanced wire insulation has prevented any subsequent FGB failure. A motor redesign to isolate it from the natural gas is being considered but has not been implemented.
Throughout the year, the net output power responded to the daily variation of ambient temperature with higher power during the cooler nighttime and lower power during the warmer daytime. This behavior reflected the expected response of turbine engine power de-rate as ambient temperature increases as illustrated in Figure 20 for the first half of 2006. (The limited indications of high power at higher ambient – upper right of Figure 20 – are spurious data originating from the “flat” power regions shown in Figure 18 for late February and early March.) Microturbines #2 and #3 did not power a FGB. At lower ambient temperatures they delivered 60 kW, with an expected fall off beginning near 21C (70F). Microturbines #1 and #4 powered a FGB. The net power from each was reduced at all temperatures because of the parasitic load, and de-rates immediately because of the FGB power characteristic. The average total power decreased in the first half of 2006, particularly over the April-June period, as the ambient temperature was increasing again in accordance with normal turbine engine power de-rate.
19

Figure 18 Electrical Power and Chilling (January-June 2006)
Figure 19 Electrical Power and Chilling (July-December 2006)
20
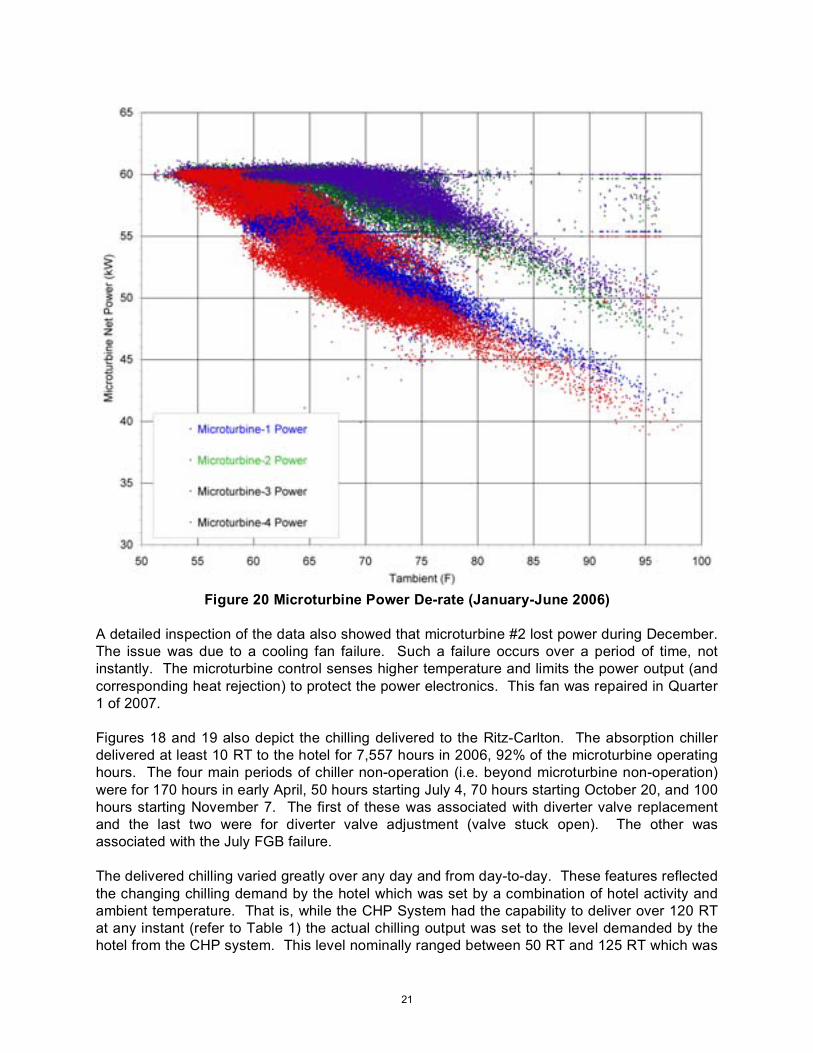
Figure 20 Microturbine Power De-rate (January-June 2006)
A detailed inspection of the data also showed that microturbine #2 lost power during December. The issue was due to a cooling fan failure. Such a failure occurs over a period of time, not instantly. The microturbine control senses higher temperature and limits the power output (and corresponding heat rejection) to protect the power electronics. This fan was repaired in Quarter 1 of 2007.
Figures 18 and 19 also depict the chilling delivered to the Ritz-Carlton. The absorption chiller delivered at least 10 RT to the hotel for 7,557 hours in 2006, 92% of the microturbine operating hours. The four main periods of chiller non-operation (i.e. beyond microturbine non-operation) were for 170 hours in early April, 50 hours starting July 4, 70 hours starting October 20, and 100 hours starting November 7. The first of these was associated with diverter valve replacement and the last two were for diverter valve adjustment (valve stuck open). The other was associated with the July FGB failure.
The delivered chilling varied greatly over any day and from day-to-day. These features reflected the changing chilling demand by the hotel which was set by a combination of hotel activity and ambient temperature. That is, while the CHP System had the capability to deliver over 120 RT at any instant (refer to Table 1) the actual chilling output was set to the level demanded by the hotel from the CHP system. This level nominally ranged between 50 RT and 125 RT which was
21
achieved, for nearly constant full-power electrical output, by modulating the diverter valve to deliver only the input energy required to match the chilling demand.
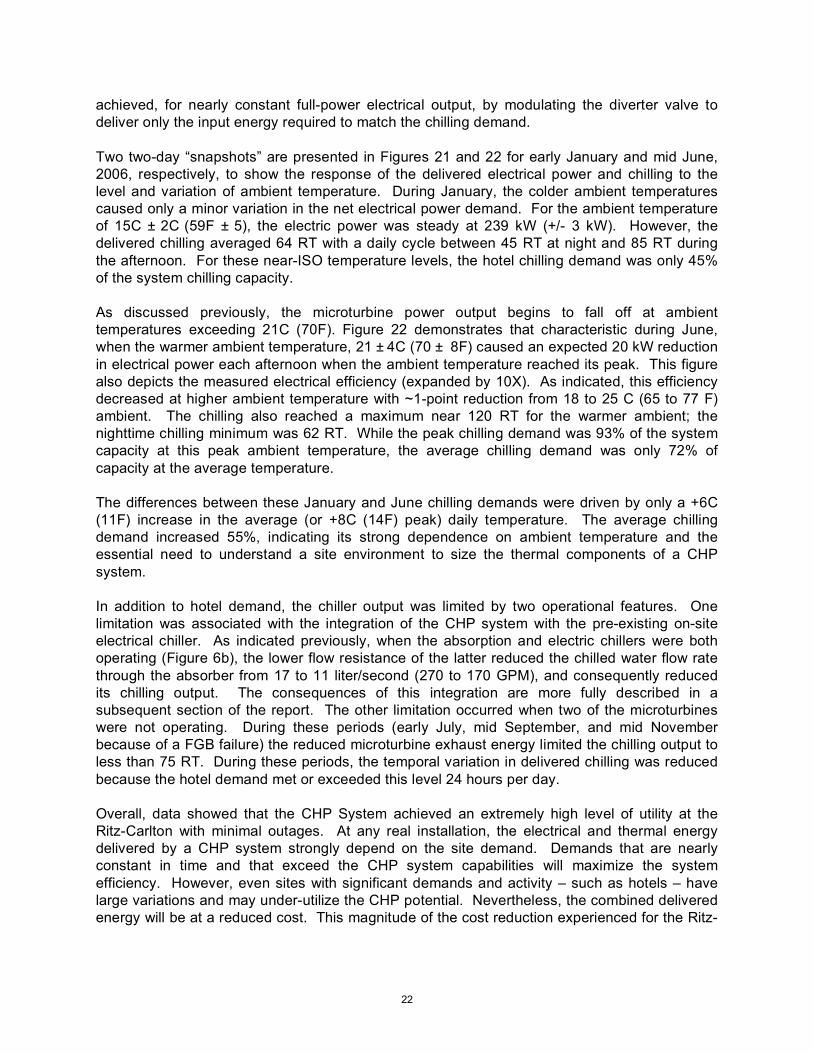
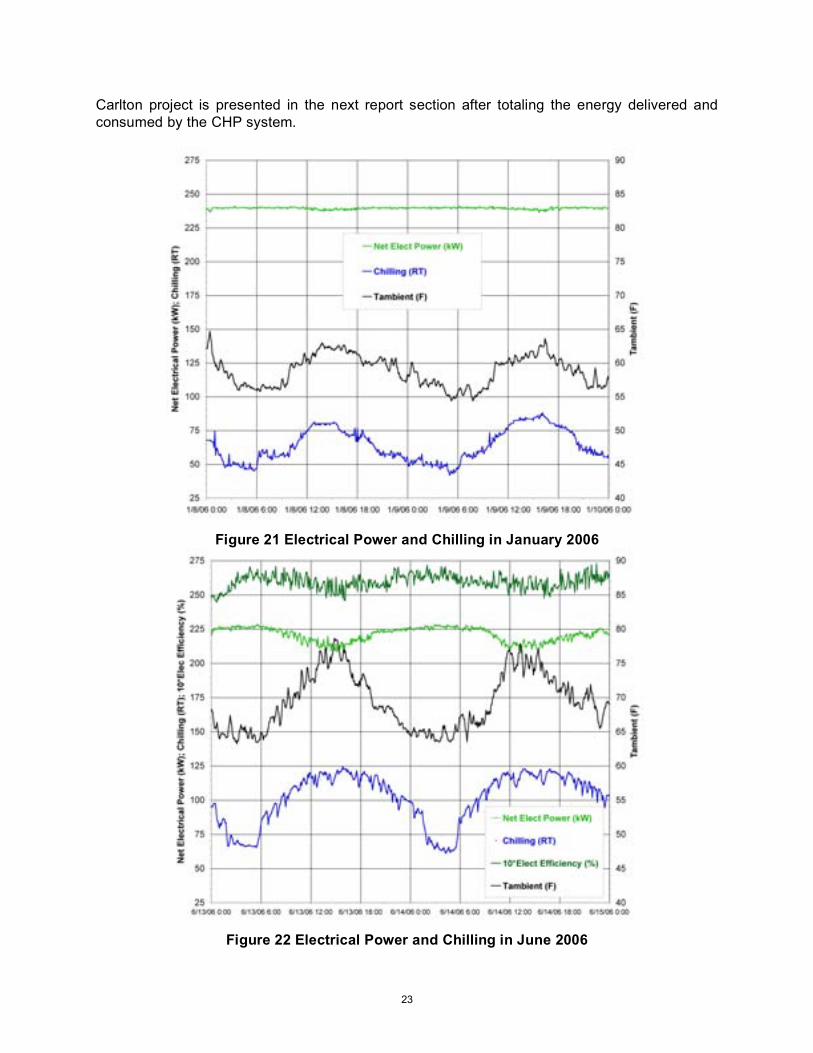
Two two-day “snapshots” are presented in Figures 21 and 22 for early January and mid June, 2006, respectively, to show the response of the delivered electrical power and chilling to the level and variation of ambient temperature. During January, the colder ambient temperatures caused only a minor variation in the net electrical power demand. For the ambient temperature of 15C ± 2C (59F ± 5), the electric power was steady at 239 kW (+/- 3 kW). However, the delivered chilling averaged 64 RT with a daily cycle between 45 RT at night and 85 RT during the afternoon. For these near-ISO temperature levels, the hotel chilling demand was only 45% of the system chilling capacity.
As discussed previously, the microturbine power output begins to fall off at ambient temperatures exceeding 21C (70F). Figure 22 demonstrates that characteristic during June, when the warmer ambient temperature, 21 ± 4C (70 ± 8F) caused an expected 20 kW reduction in electrical power each afternoon when the ambient temperature reached its peak. This figure also depicts the measured electrical efficiency (expanded by 10X). As indicated, this efficiency decreased at higher ambient temperature with ~1-point reduction from 18 to 25 C (65 to 77 F) ambient. The chilling also reached a maximum near 120 RT for the warmer ambient; the nighttime chilling minimum was 62 RT. While the peak chilling demand was 93% of the system capacity at this peak ambient temperature, the average chilling demand was only 72% of capacity at the average temperature.
The differences between these January and June chilling demands were driven by only a +6C (11F) increase in the average (or +8C (14F) peak) daily temperature. The average chilling demand increased 55%, indicating its strong dependence on ambient temperature and the essential need to understand a site environment to size the thermal components of a CHP system.
In addition to hotel demand, the chiller output was limited by two operational features. One limitation was associated with the integration of the CHP system with the pre-existing on-site electrical chiller. As indicated previously, when the absorption and electric chillers were both operating (Figure 6b), the lower flow resistance of the latter reduced the chilled water flow rate through the absorber from 17 to 11 liter/second (270 to 170 GPM), and consequently reduced its chilling output. The consequences of this integration are more fully described in a subsequent section of the report. The other limitation occurred when two of the microturbines were not operating. During these periods (early July, mid September, and mid November because of a FGB failure) the reduced microturbine exhaust energy limited the chilling output to less than 75 RT. During these periods, the temporal variation in delivered chilling was reduced because the hotel demand met or exceeded this level 24 hours per day.
Overall, data showed that the CHP System achieved an extremely high level of utility at the Ritz-Carlton with minimal outages. At any real installation, the electrical and thermal energy delivered by a CHP system strongly depend on the site demand. Demands that are nearly constant in time and that exceed the CHP system capabilities will maximize the system efficiency. However, even sites with significant demands and activity – such as hotels – have large variations and may under-utilize the CHP potential. Nevertheless, the combined delivered energy will be at a reduced cost. This magnitude of the cost reduction experienced for the Ritz
22
Carlton project is presented in the next report section after totaling the energy delivered and consumed by the CHP system.
Figure 21 Electrical Power and Chilling in January 2006
Figure 22 Electrical Power and Chilling in June 2006
23

4.2 CHP Efficiency and Operating Economics
The energy efficiency of the CHP System was determined from the total energy delivered by the system and the fuel energy consumed to operate it. The electrical and chilling energy were determined by piecewise integrating the outputs presented previously over each time-step for which valid data existed. The fuel energy was similarly determined from the integration of the measured natural gas flow rate and applying a constant heating value of 891 Btu/SCF. However, Efficiency Monitoring data were not reliably acquired until late May. Hence, for prior months, the fuel energy rate was conservatively estimated as the quotient of the measured net electrical power and a constant value of electrical efficiency specified at 24.6%, the average of the instantaneous determinations during June.
Table 4 displays the values of delivered and consumed energy for each month of 2006, and the calculated level of electrical and CHP efficiency (defined as the sum of electrical and chilling energy divided by the fuel energy). The specified electrical efficiency for Jan-May was lower than for any other period and hence slightly conservative; the variation in this efficiency was minimal. The CHP efficiency was highest during the third quarter because of the greatest demand for chilling. Figures 23 and 24 depict the cumulative electrical and chilling energy delivered to the Ritz-Carlton and the fuel energy consumed for the first and second half of 2006, respectively.
Table 4 2006 CHP System Energy in 2006
Energy (MMBtu) Efficiency (%)
Fuel Electrical Chilling Electrical CHP
January 2,371 582 586 24.6% 49.3%
February 2,061 506 566 24.6% 52.0%
March 1,966 483 326 24.6% 41.1%
April 1,628 400 322 24.6% 44.3%
May 2,011 494 562 24.6% 52.5%
June 2,071 531 750 25.7% 61.9%
July 1,703 430 613 25.2% 61.2%
August 2,152 546 611 25.4% 53.8%
September 1,307 350 608 26.8% 73.3%
October 2,145 550 677 25.7% 57.2%
November 2,004 519 486 25.9% 50.1%
December 2,129 547 597 25.7% 53.7%
Total 23,547 5,937 6,703 25.2% 53.7%
The yearly average electrical power, determined by dividing the total electrical energy by the total microturbine operating hours, was 211 kW. The analogous average chilling rate was 74 RT. While both values were slightly reduced because of the periods when only two microturbines were operating, the electrical power was within 7% of the system ISO rating affirming that full power output was typically demanded by the hotel and delivered by the system. In contrast, the average chilling was only 52% of the system potential because of the lower average demand on the CHP system and its strong day-to-night variation.
24

Figure 23 Energy Delivered and Consumed (January-June 2006)
Figure 24 Energy Delivered and Consumed (July-December 2006)
25

The instantaneous electrical and CHP efficiency, and ambient temperature, for the first half and second half of 2006, are displayed in Figures 25 and 26, respectively. Whenever the “red” CHP symbols mask the “green” Elect symbols, the microturbines were operating but the chiller was not. The prescribed electrical efficiency for much of January through May is evident, with daily variations in response to ambient temperature at other times. This efficiency was highest when only two microturbines operated in July and September. The corresponding CHP efficiency and its variation were due to the delivered chilling. From May through mid-December, instantaneous CHP efficiency routinely exceeded 60%. During the periods when only two microturbines were operating and the available chiller output fully utilized, the CHP efficiency averaged above 80% and exceeded 90% daily.
Table 5 presents the 2006 operating economics for the CHP System based on delivered energy and utility bills. A constant monthly maintenance cost was also included. For the year, the CHP System reduced energy costs by $73,560. The hotel chilling demand limited the CHP chiller output to a yearly average of 73 RT or 52% of its capacity. If the chiller utilization was 50% higher (i.e., averaged 110 RT or 78% of capacity), the energy savings would be $108,000. (Even without this improvement, electric rate increases that occurred after the demonstration time period have increased the savings to about $120,000/year.) The total installed cost of the system was $1,040,000.
Table 5 CHP System Operating Economics for 2006d
Electrical
Energy
Delivered
Chilling
Energy
Delivered
Elect
Offset by
Chilling
Avoided
Utility
Elect
Electricity
Savings
Fuel Cost and
Maintenance
Energy
Savings
MMBtu MWh MMBtu MWh MWh MWh $ $ $
January 582 171 586 172 43 213 29,886 $ (26,296) $ 3,589 $
February 506 148 566 166 41 190 26,556 $ (23,239) $ 3,317 $
March 483 141 326 95 24 165 23,136 $ (17,978) $ 5,158 $
April 400 117 322 94 24 141 19,696 $ (17,831) $ 1,865 $
May 494 145 562 165 41 186 26,020 $ (20,903) $ 5,117 $
June 531 156 750 220 55 211 29,484 $ (20,166) $ 9,318 $
July 430 126 613 179 45 171 23,903 $ (16,869) $ 7,034 $
August 546 160 611 179 45 205 28,672 $ (20,854) $ 7,818 $
September 350 103 608 178 45 147 20,597 $ (14,123) $ 6,474 $
October 550 161 677 198 50 211 29,516 $ (17,777) $ $ 11,739
November 519 152 486 142 36 188 26,269 $ (21,952) $ 4,317 $
December 547 160 597 175 44 204 28,545 $ (20,732) $ 7,813 $
Total 5,937 1,740 6,703 1,964 491 2,231 $ 312,280 (238,720) $ $ 73,560
d The electricity offset by chilling is based upon an assumed electric chiller COP of 4.0.
26

Figure 25 Electrical and CHP Efficiency (January–June 2006)
Figure 26 Electrical and CHP Efficiency (July-December 2006)
27

4.3 Interactions with Ritz-Carlton Energy Infrastructure
The CHP System was installed with the chiller in the hotel chilled water loop and parallel to existing electric chillers as described previously and shown in Figure 6. It was observed that the output from the absorption chiller was very interactive with the electric chiller, particularly from May through mid November. This interaction resulted in a shift between the CHP Mode (Figure 6a) and the Simultaneous Mode (Figure 6b) for approximately half of the days during this period as evidenced by a high absorber chilled water flow rate for CHP Mode and a lower flow rate to the absorption chiller for Simultaneous Mode. This binary situation is shown in Figure 27 for July, with a reduced flow rate once every day from July 6 through July 18.
Figure 27 CHP System Chilled Water Flow Rate in July
The switch from CHP Mode to Simultaneous Mode occurred whenever the absorber output alone could not satisfy the hotel demand for chilling. In this case, the absorber capacity could not suppress the chilled water temperature returning from the hotel (“returning temperature”) to the desired set point for the chilled water temperature required to cool the hotel. The chilled water temperature leaving the absorber (“leaving temperature”) could be used for mode control if a parallel chiller was not present. However, the with electric chiller, the returning temperature was a proper indicator that the absorber was not keeping up with the demand and that Simultaneous Mode should be initiated.
28

The general sequence when switching from CHP Mode to Simultaneous Mode was: 1. The absorption chiller output satisfied the hotel demand as indicated by stable and
acceptably low returning temperature. 2. As the hotel demand grew, the diverter valve closed to deliver increasing energy to the
absorber and try to maintain absorber leaving temperature. However both return and leaving temperatures increased.
3. When the returning temperature exceeded a “high” set point, the motorized valves of Figure 6 activated and the electric chiller started to achieve the Simultaneous Mode.
4. The absorber chilled water flow rate dropped suddenly by 100 GPM. The lower demand on the absorber required the diverter valve to open to bypass in order to maintain the absorber leaving temperature set point even though the return temperature was high.
5. The hotel demand was not satisfied until the electric chiller output and the reduced absorber output stabilized the return temperature.
6. CHP Mode was re-established only after the hotel demand reduced sufficiently to allow the returning temperature to drop below a “low” set point (5F lower than the “high” set point to reduce mode cycling).
Figures 28, 29, and 30 present two-day “snapshots” that illustrate these control features. They correspond to the following situations:
Figure Microturbines Mode(s) Days 28 4 CHP Mode only October 3-4 29 4 CHP Mode & Simultaneous Mode July 28-30 30 2 CHP Mode & Simultaneous Mode Sept 10-12
Each figure includes data for the Ambient Temperature [Tambient (F)], Net Electrical Power (kW), Chilling (RT), CHP Efficiency (%), Chilling Flow Rate [CHW Flow Rate (GPM)], Chilling Water Returning Temperature [CHW Return (F)], and Chilling Water Leaving Temperature [CHW Leaving (F)] over a two-day period.
29

Figure 28 CHP Mode with 4 Microturbines
Figure 28 is a two-day data snapshot for October 3 and 4 when all four microturbines were operating and the system remained in CHP Mode. 1. The electrical power was near 225 kW, reducing slightly during the afternoon when a peak
ambient temperature of 73F was experienced. 2. The returning temperature rose to 54F as the ambient temperature increased. 3. The chilled water flow rate remained at 265 GPM for this period; the electrical chiller did not
operate. 4. The leaving temperature was maintained at 43F. 5. On October 3, the chiller output was 65 RT at night and increased to 115 RT to satisfy the
hotel load at peak ambient temperature. The load was slightly lower on October 4. 6. With the combined electrical power and chilling outputs, the system achieved a CHP
efficiency of at least 50% at night, rising to 72% at peak temperature on October 3.
30

Figure 29 CHP and Simultaneous Modes with 4 Microturbines
Figure 29 is a two-day data snap-shot for July 28 and 29 when all four microturbines were operating and the system switched between CHP Mode and Simultaneous Mode. 1. The electrical power was near 220 kW, reducing slightly during the afternoon when a peak
ambient temperature of 75F was experienced. 2. The returning temperature rose to 57F as the ambient temperature increased causing the
system to switch to Simultaneous Mode in early afternoon of July 28. 3. The chilled water flow rate dropped by 100 GPM to 165 GPM. 4. The leaving temperature which was also rising in CHP Mode dropped when the mode
switched and was maintained at 43F. 5. The chiller output increased to 115 RT before the mode switch, and then dropped to 80 RT
because of the reduced chilled water flow rate. 6. Prior to switching to Simultaneous Mode, the combined outputs resulted in a maximum CHP
efficiency of 72% which immediately dropped to 55%. 7. Simultaneous Mode was sustained for ~12 hours. During this mode, the return temperature
continued to decrease because of the electric chiller output and the decreasing ambient temperature. The associated reducing hotel load decreased both absorber output and CHP efficiency.
8. When the returning temperature dropped below 52F, the system returned to CHP Mode. The chilled water flow rate to the absorber chiller increased back to 265 GPM and the absorber output rose to meet the current hotel demand. The leaving and return temperatures increased in response to the rising ambient temperature.
9. The switch to Simultaneous Mode was repeated starting in late morning of July 29.
31
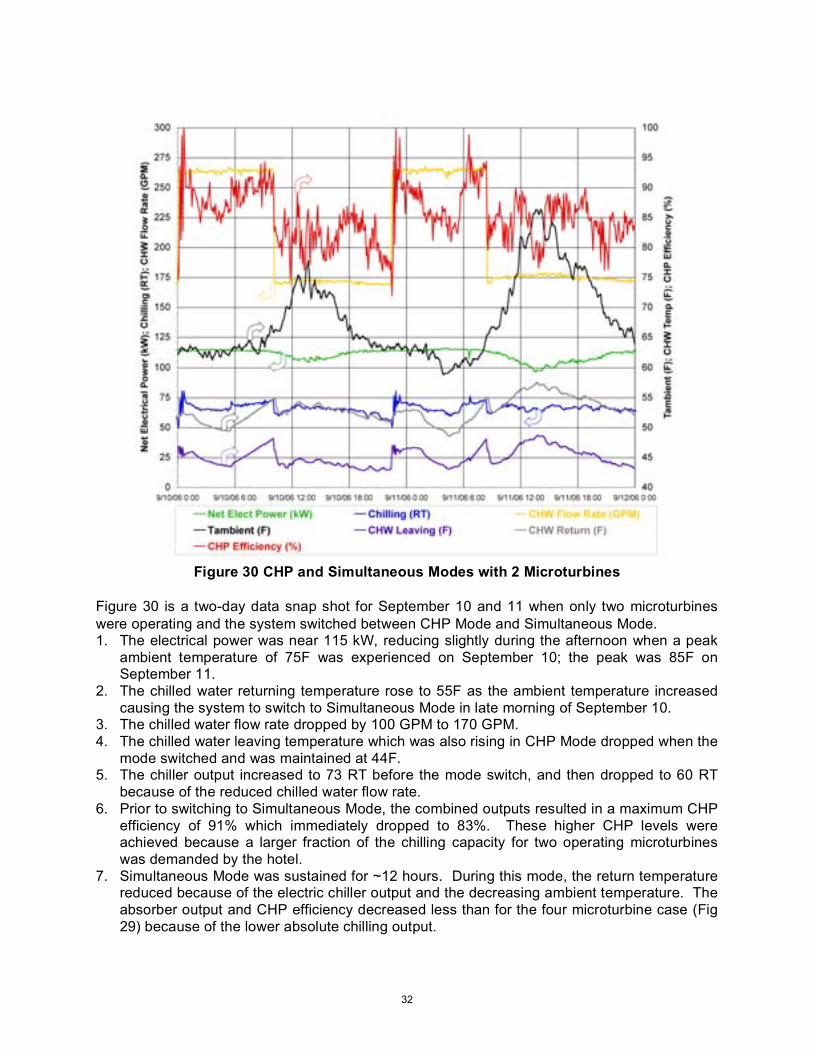
Figure 30 CHP and Simultaneous Modes with 2 Microturbines
Figure 30 is a two-day data snap shot for September 10 and 11 when only two microturbines were operating and the system switched between CHP Mode and Simultaneous Mode. 1. The electrical power was near 115 kW, reducing slightly during the afternoon when a peak
ambient temperature of 75F was experienced on September 10; the peak was 85F on September 11.
2. The chilled water returning temperature rose to 55F as the ambient temperature increased causing the system to switch to Simultaneous Mode in late morning of September 10.
3. The chilled water flow rate dropped by 100 GPM to 170 GPM. 4. The chilled water leaving temperature which was also rising in CHP Mode dropped when the
mode switched and was maintained at 44F. 5. The chiller output increased to 73 RT before the mode switch, and then dropped to 60 RT
because of the reduced chilled water flow rate. 6. Prior to switching to Simultaneous Mode, the combined outputs resulted in a maximum CHP
efficiency of 91% which immediately dropped to 83%. These higher CHP levels were achieved because a larger fraction of the chilling capacity for two operating microturbines was demanded by the hotel.
7. Simultaneous Mode was sustained for ~12 hours. During this mode, the return temperature reduced because of the electric chiller output and the decreasing ambient temperature. The absorber output and CHP efficiency decreased less than for the four microturbine case (Fig 29) because of the lower absolute chilling output.
32

8. When the returning temperature dropped below 52F, the system returned to CHP Mode. The chilled water flow rate to the absorption chiller increased back to 260 GPM and the absorber output rose to meet the current hotel demand.
9. The sequence was repeated starting in mid-morning of September 11. While the peak temperature for this day was higher, the mode switch occurred at a lower ambient temperature (67F) indicating that other factors also influence the chilling load such as hotel activity and temperature history.
4.4 Discussion of Integration Issues
Detailed examination of the energy data from the Ritz-Carlton led to two general conclusions regarding the integration of the CHP System with the existing energy infrastructure and the performance of the integrated solution:
1. The integration solution was non-optimal and prohibited maximizing energy savings.
The integration of the CHP System with the Ritz-Carlton energy infrastructure was successful in ensuring that the energy demands of the hotel were met. However, the integration of the CHP and electric chillers resulted in reduced utilization of the CHP System. When the electric chiller started, it did not “shave” the chilling peak demand. Instead, it suppressed the absorber output to below what it had been delivering, reducing the use of “free” CHP chilling.
The absorber output suppression occurred because the electric chiller did not have the ability to continuously turn-down to zero RT. No large chiller has this capability; the lowest operating condition is typically ~25% of full capacity. Applying this guideline to the current situation indicated that 75 RT were minimally delivered by the electric chiller when Simultaneous Mode initiated. Therefore, for the data snap shot of Figure 29, the total chilling stepped from 115 RT for the absorber alone to 155 RT (80 RT + 75 RT) with both chillers operating. This was sufficient output to begin to suppress the returning chilled water temperature; electric chiller output data were not available to track the total output chilling.
2. High levels of CHP efficiency were achieved at the Ritz-Carlton but the ambient temperature window for this condition was narrow.
The CHP efficiency for the July-September period averaged over 60% and many instances exceeded 70%. Usually this coincided with increasing ambient temperatures, however, and the total hotel chilling demand rose so that the integrated solution switched from CHP Mode to Simultaneous Mode. In the Simultaneous Mode, the minimum load on the electric chiller resulted in a reduced load on the CHP chiller and therefore the CHP efficiency dropped. This was illustrated in the data snap-shot of Figure 29. (Higher CHP efficiency levels were obtained when only two microturbines were operating, but again dropped when the mode switched.)
The mode switch was driven by the hotel chilling demand as represented by an increasing chilled water returning temperature. While hotel chilling demand is driven by several factors, a primary one is ambient temperature. It appeared that an ambient temperature greater than 70F was required to achieve 70% CHP efficiency, but that the mode switch occurred when the ambient rose above 75F. As reflected in the chilled water flow rate of Figure 27, mode switching was not observed after mid-November when the ambient temperature rarely
33
rose above 70F (see Figure 26). Similarly, mode switching was not observed prior to May when the ambient temperature also was typically less than 70F (see Figure 25). Unfortunately, at these lower ambient temperatures from November to April, the hotel chilling demand was also lower, limiting the CHP efficiency realized.
These conclusions lead to the following alternatives to achieve higher CHP efficiency and hence more favorable operating economics:
1. Alter the integration of the CHP System and the electric chiller to ensure greater use of the CHP system.
This might be accomplished by altering the controls of the existing electric chiller to permit it to operate at a lower initial output. This tactic may be acceptable because two 300 RT electric chillers exist but the hotel chilling demand clearly appears to be less than 200 RT.
Alternatively, add, or replace one of the two 300 RT units with a smaller electric chiller so that its impact on the CHP system would be less. Again, the presence of two chillers should provide sufficient redundancy to assure the hotel demand will always be met.
2. Expand the use of the CHP system thermal energy to support other space conditioning.
A primary alternative would be to employ a newer feature of the PureComfort® M product line that permits simultaneous chilling and heating, not the either/or choice of the unit initially developed and currently installed at the Ritz-Carlton. The simultaneous chilling/heating device delivers either or both chilling and heating with linear independent turndown of each from full capacity to near zero. This CHP system could meet a space heating demand, or a combination of a low chilling demand and a heating demand any time of the year.
An alternative simultaneous chilling and heating capability is now available from the PureComfort® R product. This newer product is based on a natural gas reciprocating engine. Because such engines reject waste heat nearly equally in both the hot exhaust and hot jacket water, a hybrid chiller was developed for this product. The hybrid chiller separately accepts input energy as either hot gas or hot water and uses it in the appropriate stage of an absorption chiller. This architecture yields a simultaneous chilling and heating CHP system by allowing one energy stream to drive the chiller while the other provides heating. This solution may not be preferred for the Ritz-Carlton because the emissions from the reciprocating engine are not as low as for the microturbine and hence would not be permitted at this location.
34

5. Summary of Lessons Learned
5.1 Installation and Integration Issues
There were five significant Lessons Learned based on the installation, integration, and one-year operation of a CHP System at the Ritz-Carlton, San Francisco.
1. A site owner will be pleased with a reliable, low-emissions CHP system even if its
utilization is less than optimal.
The CHP System delivered valuable electrical and chilling energy to the Ritz-Carlton, San Francisco for 94% of the possible hours of 2006; the system delivered energy for more than 99.7% of the hours in the second half of the year. There was only one significant period when no electrical power was produced (during the diverter valve repair). As discussed in the body of this report and in subsequent Lessons Learned, the chilling energy was only 53% of the CHP system capability because of hotel demand and energy infrastructure integration limitations. However, the total energy savings approached $75,000 and while recognizing that its output was not optimal, the hotel owner and operator were pleased with the CHP system, as evidenced by their orders for two more systems. They were pleased with the reliability of operation, the energy cost saving achieved, and with the environmental pollution avoided. While not monetized, the latter was consistent with Host’s commitment to environmental stewardship. Moreover, at today’s greater electric rates, the annual savings have increased to $120,000/year, reducing the payback without incentives to 4.2 years.
2. Energy demands, particularly the thermal energy demands, are not easily predicted for a real building but are critical to achieve the highest CHP benefit.
The installed CHP System was not able to achieve its maximum benefit because of limitations imposed by the hotel chilling demand. Part of the limitation was because of the chilling loop integration, and part was because the chilling demand was less than anticipated; this Lesson focuses on the latter.
The anticipated chilling level was based on both predictions and experience, and concluded that high levels of chilling were required every hour of the year. While electrical load was easily determined from utility electricity bills, it was not as easy to determine thermal loads, particularly chilling loads. Heating loads relate directly to fuel usage for boilers, but the chilling load is hidden in the electricity bill. Further, a direct determination of chilling demand, such as by measuring flow rate and temperature measurements, is rarely performed. If such data were available for the Ritz-Carlton, the seasonal and temporal deficiencies would have been discerned and another use of the thermal output, such as space heating, would likely have been pursued.
3. The challenges of CHP installations in urban environments, particularly retrofit
installations, can be overcome with proper planning and communication.
Urban environments present special challenges for the installation of a CHP System. Often the available equipment space is limited and not located in easily accessible locations. As experienced at the Ritz-Carlton, the footprint available for cranes to hoist equipment was narrow and not flat. Proper coordination with traffic control authorities and alley owners alleviated these challenges. Similarly, other neighbors imposed special requirements such as the multi-lingual public hearing and comment period because of proximity to a local school. Proper communication and diligence addressed this and other issues.
35

4. CHP network interconnection requires equipment and cost beyond that for radial interconnection, indicating that practices should be standardized and simplified.
The network interconnection at the Ritz-Carlton was different than the interconnection most often encountered. However, working with the electrical utility, a configuration was devised to permit CHP operation while protecting the concerns of the utility. Unfortunately, the solution did not come quickly, and added equipment and cost to the project. The accepted solution followed traditional principles. While simpler and less costly ideas and approaches were formulated, it was impractical to study and test them to the satisfaction of all parties. The IEEE 1547 interconnect standard does not apply to network situations. A standard ought to be formulated that describes the best network interconnection solution.
5. Optimal integration of a CHP System into a building energy infrastructure requires the
consideration of all operating modes imposed by the site energy demands and
existing equipment.
Usually a CHP System is installed to meet some portion of the total electrical and thermal demand of a building, recognizing that brief “peak” demands will occur that must be otherwise met. The systems are usually installed in a grid-parallel configuration. In this case, the CHP System offsets imported electricity, with the grid providing the balance; it also is a backup electricity source if the CHP system is not operating.
However, with the exception of locations that provide steam, there is no utility-provided thermal energy. Buildings therefore require other onsite equipment to provide the thermal energy that complements the CHP output and meets the site demand; this equipment must also provide a backup capability. For retrofit situations, existing equipment is used for this purpose.
The lesson from this project was to be mindful of the operating characteristics of such equipment to ensure it does not compromise the CHP System performance. The existing parallel chiller was large enough to provide backup capability. However, its size and turndown characteristic resulted in a minimum output that was larger than desired, instantly suppressing the CHP chiller demand. That is, the electric chiller did not “shave” the chilling demand but instantly took over a significant part of it. Remedies for this situation were formulated that included alternative equipment and/or alternative use for the thermal energy to achieve a higher utilization of this “free” energy.
5.2 Equipment Design Issues
1. Add heating flexibility
The overall efficiency of the CHP system was limited because the chilling application did not use all the available heat. A system designed to allow multiple uses of the heat stream, including coincident water heating, etc., would improve the overall CHP system efficiency. Such a system has been designed and is now commercially available.
2. Fuel Gas Booster Improvements
There were two fuel gas booster failures during the first year of operation. In both cases, root cause analyses indicated that “black powder” in the natural gas, a mix of particulates
36

the size of talcum powder including ferrous material, shorted the FGB motor. An intermediate solution now uses a higher temperature rated motor. The associated enhanced wire insulation has prevented any subsequent FGB failure. An FGB redesign to isolate the motor from the natural gas is being considered but has not been implemented.
37

References
1. US Energy Flow Trends – 2002, G.V. Kaiper, Lawrence Livermore National Laboratory, UCRL-ID-129990-02, June 2004 (https://eed.llnl.gov/flow/pdf/ucrl-tr-129990-02.pdf)
2. Integrated Energy Systems (IES) for Buildings: A Market Assessment, Resource Dynamics Corporation, August 2002 (http://www.eere.energy.gov/de/pdfs/ies_market_assessment.pdf)
3. Market Potential for Advanced Thermally Activated BCHP in Five National Account Sectors, Energy and Environmental Analysis, Inc., May 2003 (http://www.eere.energy.gov/de/pdfs/bchp_market_potential.pdf)
4. Task 2.1 Report: National Account Sector Energy Profiles, Energy and Environmental Analysis, Inc., April 2003 (http://www.eere.energy.gov/de/pdfs/national_account_energy_profiles.pdf)
38