
ITP Chemicals: Final Report: Evaluation of Alternative ... · Final Report: Evaluation of...
140
-
Upload
truongtuong -
Category
Documents
-
view
214 -
download
0
Transcript of ITP Chemicals: Final Report: Evaluation of Alternative ... · Final Report: Evaluation of...


Final Report: Evaluation of Alternative Technologies for Ethylene, Caustic-Chlorine, Ethylene Oxide, Ammonia, and Terephthalic Acid
Prepared for: The Department of Energy Office of Industrial Technologies By JVP International, Inc. Staten Island, NY 10314 and By Psage Research Macungie, PA 18062 December 4, 2007

Preface The Industrial Technologies Program (ITP) in the US Department of Energy Office of Energy Efficiency and Renewable Energy (DOE/EERE) works with US industry to reduce energy use and carbon emissions associated with industrial processes. Its mission is to improve national energy security, protect the environment, and ensure US economic competitiveness by enhancing the energy efficiency and productivity of US manufacturing. Its work includes sponsoring high-risk, high-return research and development (R & D) in energy-saving technologies, as well as engaging in industry outreach to promote best practice energy management in US facilities. In order to evaluate research opportunities in energy efficiency, ITP sponsors various analytic studies assessing energy consumption trends and prospects for energy reduction in different industries. This study evaluates alternative technologies for chemicals manufacturing which may present energy efficiency improvements compared to existing technologies. It is an extension of a previous “Chemical Bandwidth Study,” which evaluated energy and exergy losses in the US chemicals industry. Both the bandwidth study and current study were initiated by Dr. Dickson Ozokwelu, Technology Manager of the Chemicals Subprogram in ITP, and overseen by Dr. Ozokwelu and Jo Rogers of the American Institute of Chemical Engineers (AIChE). The analysis was carried out by JVP International, Inc, and Psage Research, LLC. Questions regarding this study or the Chemical Bandwidth Study that led to this report can be directed to the following authors: Dickson Ozokwelu U.S. Department of Energy Industrial Technologies Program 1000 Independence Ave, S.W. Washington, DC 20585 Phone: 202-586-8501 [email protected]
Joseph Porcelli JVP International, Incorporated 102 Lincoln Street Staten Island, NY 10314 Phone : 917-912-9804 [email protected]
Peter Akinjiola Psage Research, LLC 234 Village Walk Drive Macungie, PA 10314 Phone: 610-966-7106 [email protected]
Disclaimer This report was prepared as an account of work sponsored by an Agency of the United States Government. Neither the United States Government nor any Agency thereof, nor any of their employees, makes any warranty, expressed or implied, or assumes any legal liability or responsibility for the accuracy, completeness, or usefulness of any information, apparatus, product, or process disclosed, or represents that its use would not infringe privately owned rights. Reference herein to any specific commercial product, process, or service by trade name, trademark, manufacturer, or otherwise does not necessarily constitute or imply its endorsement, recommendation, or favoring by the United States Government or any Agency thereof. The views and opinions expressed by the authors herein do not necessarily state or reflect those of the United States Government or any Agency thereof.

Table of Contents Executive Summary............................................................................................................................. 1 Introduction.......................................................................................................................................... 5 Details .................................................................................................................................................. 6
1. Ethylene ................................................................................................................................... 6 2. Chlorine - Caustic .................................................................................................................... 9 3. Ethylene Oxide ...................................................................................................................... 11 4. Ammonia ............................................................................................................................... 14 5. Terephthalic Acid .................................................................................................................. 17
Conclusions and Recommendations .................................................................................................. 20 1. Ethylene ................................................................................................................................. 20 2. Chlorine – Caustic ................................................................................................................. 21 3. Ethylene Oxide ...................................................................................................................... 21 4. Ammonia ............................................................................................................................... 22 5. Terephthalic Acid .................................................................................................................. 22
6. Final Conclusions .................................................................................................................. 23 Appendix 1 – Ethylene ...................................................................................................................... 25 Appendix 2 – Chlorine-Caustic Soda ................................................................................................ 49 Appendix 3 – Ethylene Oxide............................................................................................................ 71 Appendix 4 – Ammonia..................................................................................................................... 93 Appendix 5 – Purified Terephthalic Acid (PTA) ............................................................................ 103 Appendix 6—Fuel and Feedstock Prices used for CPAT ............................................................... 135

Page 1 of 135
Executive Summary The DOE ITP “Chemical Bandwidth Study1” identified five technologies - Ethylene, Caustic-Chlorine, Ethylene Oxide, Ammonia and Terephthalic Acid - having the highest total exergy losses on an annualized basis (annual volume of chemical production multiplied by Total Exergy Loss per pound). 1 These five technologies were singled out for further study to identify and evaluate possible process improvements. This report summarizes the findings of this work. It suggests alternative process concepts, evaluates improvements in energy/exergy utilization, and assesses each alternative technology’s commercialization potential. For each of the selected technologies, concepts for process changes that would likely yield substantial reductions in total exergy losses were developed and evaluated. After conceptual designs for alternative processes were developed, Aspen simulations and Exergy Analyses of the designs were conducted and the results utilized to estimate capital cost and energy consumptions for each concept. Those ideas which yielded favorable results were then evaluated using DOE/ITP’s CPAT software2, which uses capital and operating cost estimates to asses the potential market penetration of new technologies. CPAT simulations were used to gauge whether the conceptual designs were economical, and, if so, the degree to which, and rate at which, the novel concepts could be deployed throughout the US chemical industry. The CPAT results allowed projections to be made of total potential U.S. energy savings that could be realized by each of the alternative technologies and these are summarized in the following Table.
Process Annual Energy Savings by
2020 (TBtu/yr.)
Annual Energy Savings by 2030
(TBtu/yr.)
Ethylene 3.94 7.88 Caustic-Chlorine
2.44 4.87
Ethylene Oxide
0.64 5.13
Ammonia 0.21 0.21 Terephthalic Acid
6.96 19.5
TOTAL 14.19 37.59 Note: Based on energy and feedstock costs in mid 2006 (See Appendix 6). The potential energy savings summarized above illustrate the point that even though a technology may be old and well-developed, there can still be room for substantial improvements that can be justified economically. The Chemicals ITP program provides a unique avenue for encouraging creative ways to improve the energy efficiency of the U.S. chemical industry and it is hoped that the
1 US DOE 2006, Chemical Bandwidth Study. Exergy Analysis: A Powerful Tool for Identifying Process Inefficiencies in the US Chemical Industry. http://www1.eere.energy.gov/industry/chemicals/bandwidth.html, 2 https://cpat.chemicals.govtools.us/

Page 2 of 135
Bandwidth Studies and this report on Alternative Process Technologies will provide a valuable spring-board for this effort. Ethylene: The technology evaluated involved altering the cracking equilibrium by removing hydrogen as it was formed so that higher per pass conversion could be attained. Commercial implementation would be possible if a viable separation technology, such as a ceramic or other high-temperature material membrane, could be deployed for less than about $60 million in a grass-roots ethane to ethylene plant of about 1.7 billion lbs/year capacity. A retrofit would save energy but probably would not be economical at an installed capital cost of $60 million. Chlorine – Caustic: Developing alternative routes to produce chlorine is a difficult challenge. The conversion of the diaphragm cell process to higher efficiency membrane cells was evaluated as the alternative technology because there are still a number of U.S. plants using either mercury cell or diaphragm cell technology. Energy savings can clearly be achieved by a conversion to membrane technology, and the cost of conversion is paid off reasonably rapidly, particularly in an escalating energy cost environment. It is not certain that a “break-through” cell concept with substantial energy savings in comparison to membrane cells is possible – no evidence of research work in this direction has been detected.
Ethylene Oxide: Increasing the ethylene oxide (EO) concentration in the reactor effluent gases of this low conversion/pass process would have a large beneficial effect on process economics and energy intensity. The use of a micro-channel reactor design would allow operation with the reactor feed gases within the flammable envelope leading to increased reaction rate and higher outlet concentrations of EO at lower ethylene conversions, resulting in higher selectivity and EO yield and
Other Comments: The only commercialized alternative technology to produce chlorine that has been found in the patent and technical literature is the conversion of HCl to chlorine, but since HCl is itself a product of the use of chlorine, this is not a “breakthrough”. In fact, it is possible to use HCl and oxygen as a substitute for chlorine in certain reactions, such as oxychlorination. A great deal of chlorine is utilized in chemical reactions but often little or none is found in the final product. This leads to a large consumption of chlorine in the US, essentially downgrading it to HCl or a salt by-product (or waste product). The objectives of future research in this area ought to be based not only on seeking a more energy-efficient way to produce chlorine from brine, preferably without a co-product, but also to seek process innovations that either use chlorine the moment it is formed, to eliminate the hazardous storage and shipment of chlorine, or even better, to find alternative ways to produce those products not containing chlorine, and alternative products to replace chlorine-containing products (most notably PVC).
Other Comments: Avenues of potential research are: (a) replacement of the pyrolysis reaction by a lower-temperature reaction not requiring quenching for ethane dehydrogenation; (b) oxydehydrogenation of ethane to ethylene and propane to propylene; (c) applying some of the novel separation technologies to the distillation section of olefin crackers. Research work in these areas has been funded in recent years by DOE. Use of other feedstocks (e.g. methanol or ethanol) to produce ethylene is actively being commercialized at this time (although ethanol to ethylene has been practiced in Brazil and India for many years).
Page 3 of 135
lowered costs of EO recovery and purification. There has been some work on using fluidized bed reactors in the past, but there are issues of catalyst attrition (silver losses) and adverse effects of back mixing. Both these problems can be averted by use of micro-channel reactor designs (the alternative technology evaluated in this report), and some efforts are underway in this direction. There are issues that need to be solved in terms of reaction system design and scale up, and in safely feeding oxygen uniformly into the individual micro-channels but this approach has great merit. Ammonia: In the conventional process to produce ammonia the product concentration is limited by equilibrium, and thus reducing the amount of ammonia in the recycle stream is important in order to maximize per pass conversion and reduce recycle flow. This has traditionally been accomplished in two stages of product recovery via condensation/refrigeration which is costly and still results incomplete removal of ammonia. The approach evaluated focused on fully removing product ammonia from the recycle gases, but the barrier to success was found to be the capital and utility costs of achieving this. Water absorption was studied and rejected as being uneconomical. The use of a PSA-type adsorption-desorption system appeared to be theoretically feasible, although inadequate thermodynamic data, as well as adsorption isotherms for ammonia in candidate adsorbents, made it impossible to quantify the costs of this alternative process. Nonetheless, it was illustrated that below a certain cost, such a system would be economically viable. It is known that PSA routes are being studied but there is a serious issue regarding the physical and chemical properties of potential adsorbents particularly if they are required to operate under very wide swings in pressure and if high temperatures are required for adequate desorption. Despite these factors this route bears watching. Terephthalic Acid: The conventional technology to produce terephthalic acid from p-xylene oxidation is a half a century old, but economical improvements have been made through the years. The alternative process studied in this report recognizes that (a) the production of p-xylene should rightly be integrated with the production of PTA, as the only real use of the former is to produce the latter; (b) the separation of p-xylene from mixed xylene streams from refineries and crackers is a very energy-intensive step, and (c) the production of isophthalic acid from m-xylene utilizes
Other Comments: Promising avenues of research that could lead to a new, more energy-efficient production of EO include (a) use of novel separation schemes that could reduce the energy consumption associated with processing a lean reaction effluent gas, (b) performing the oxidation (epoxidation) in the liquid phase using a hydroperoxide (or hydrogen peroxide, if its cost of production could be sufficiently reduced), and (c) seeking a biocatalytic route although current bio routes produce even more dilute product streams than does the conventional process.
Other Comments: Much work had been expended through the years in improving the equipment and the catalysts associated with ammonia synthesis but the relatively poor growth prospects in the U.S. have not justified research on alternative technology concepts. Today, given the increase in biotechnology being applied to chemical production, it is intriguing to remember that nitrogen-fixing is accomplished in nature, and one wonders whether there could be a biocatalytic route to ammonia from nitrogen in the air that is awaiting invention.

Page 4 of 135
essentially the same processing steps, with the major differences being in the solubility of the product in water and in acetic acid as a function of temperature. The present study was based on a mixed xylenes feedstock, followed by a first cut to remove o-xylene, then feeding the mixed m- and p-xylene stream to oxidation, and separating the mixed isophthalic acid and PTA product by fractional crystallization. Quantitative solubility information of the two products was not available, but the patent literature suggests that the two products differ in their solubilities versus temperature, so the backend of the process was modeled using three stages of crystallization with appropriate recycling (two stages are used in the classical PTA process). It is believed that work is going forward on such a scheme by one organization at least, but no published work has been found. The third xylene isomer, o-xylene, is used exclusively to produce phthalic anhydride, but by a vapor-phase catalytic oxidation. There is no evidence that the other phthalic acids could be produced by vapor phase oxidation. It is more, but not very likely, that a liquid phase oxidation of o-Xylene would be possible.
Other Comments: Fruitful areas for research would include novel separations to replace the energy-intensive crystallization steps for PTA recovery and a search for an alternative oxidation chemistry that would not require halides and acetic acid solvent. Obviously, a better way to isolation p-xylene from the mixed xylene stream would also be beneficial.

Page 5 of 135
Introduction In 2004 the Department of Energy Industrial Technologies Program (DOE ITP) initiated a “Chemical Bandwidth Study” to evaluate energy and exergy usages and losses in the U.S. chemical industry. Over 50 processes in commercial practice in the U.S. were studied and the results published in a final report3 to DOE. The bandwidth study identified five technologies having the highest total exergy losses on an annualized basis (annual volume of chemical production multiplied by Total Exergy Loss per pound). These five technologies (Ethylene, Caustic-Chlorine, Ethylene Oxide, Ammonia and Terephthalic Acid) were singled out for further study to identify possible process improvements. This report summarizes the findings of this work. It suggests alternative process concepts, evaluates improvements in energy/exergy utilization, and assesses each alternative technology’s commercialization potential. For each of the selected technologies, concepts for process changes that would likely yield substantial reductions in total exergy losses were developed and evaluated by JVP International, Inc. After conceptual designs for alternative processes were developed, Aspen simulations and Exergy Analyses of the designs were run by Psage Research. The results were utilized by JVP International, Inc., to estimate capital cost and energy consumptions for each concept. Those ideas which yielded favorable results were then evaluated using DOE/ITP’s CPAT software, 4 which uses capital and operating cost estimates to asses the potential market penetration of new technologies. CPAT simulations were used to gauge whether the concepts were economical, and if so, the degree to which, and rate at which, the novel concepts could be deployed throughout the US chemical industry. The CPAT results facilitated projections of total potential U.S. energy savings enabled by each technology. This report includes the material balances, stream compositions and conditions, and flow sheets for both the base case and the alternative case for each of the five technologies studied. The base case flow sheets correspond to those used in the Chemical Bandwidth Study, with one exception. During the course of this study it was discovered that the base case originally used for Ethylene Oxide was a very poor representation of this technology, and an improved base case was therefore developed. For each alternative process described in this report, the results from both energy/exergy balances and CPAT simulations are discussed. CPAT simulations are based on typical fuel and feedstock costs in 2006 (Appendix 6). Results are evaluated and recommendations are provided for topics warranting further research.
3 US DOE 2006, Chemical Bandwidth Study. Exergy Analysis: A Powerful Tool for Identifying Process Inefficiencies in the US Chemical Industry. http://www1.eere.energy.gov/industry/chemicals/bandwidth.html, 4 https://cpat.chemicals.govtools.us/

Page 6 of 135
Details
1. Ethylene
A. Introduction In the Bandwidth Studies, three processes to produce ethylene were studied, all based on pyrolysis of hydrocarbon feeds. The three processes differed primarily in the choice of feedstock – ethane, propane and naphtha – and while the processes increased in complexity in that order, areas of high energy intensity were similar. The ethane to ethylene process was chosen to illustrate the improvements that might be made to all three. In the Exergy Analysis performed on the Ethane to Ethylene Process, the three sub-sections of the process that contributed the greatest energy losses and total exergy losses are Cracking, Compression and Refrigeration. The sections of the process dealing with product separation and purification did not contribute much directly, but the high refrigeration load reflects the net reboiler load of the distillation columns, which all operate at low temperature and utilize cascades of refrigerants (ethylene and propylene) to drive the various reboilers and for much of the condensation and intercooling as well. Improving energy consumption in the distillation columns by use of vapor recompression was not considered for this study since many ethylene plants have already implemented such schemes. A more fruitful “break-through” concept was based on the recognition that there is a large ethane recycle flow from product separation back to the cracking section because the conversion of ethane to ethylene is equilibrium-limited. Therefore, a design based on removing hydrogen as it is formed by means of a high temperature membrane separation device, in order to drive the cracking to a higher conversion per pass was chosen for evaluation. This concept has been considered by the industry but not yet implemented, in large measure due to the difficulty in engineering and fabricating high temperature membrane systems. Some work has been performed on a laboratory scale, and a patent (US 5,202,517) was found describing such work, the data from which guided our development of a material balance around the cracking section for the alternative technology case. If an adequate membrane device could be fabricated, it would ideally be located in the tubes of the cracker, so that hydrogen could be removed as formed, maximizing the driving force of the cracking reaction. Alternatively, two cracking furnaces might operate in series, with hydrogen separation taking place between the two. For purposes of modeling, the data from the above-mentioned patent were employed along with some judgments regarding separation factors for species not included in the patent case. The cracking reaction was modeled such that the permeate left at lower pressure but at reaction temperature, while the remaining cracker outlet was at chemical equilibrium. The permeate was fed to its own transfer line exchanger, after which the cooled stream joined the main reactor effluent after its transfer line exchanger.

Page 7 of 135
B. Results of Aspen Simulation/Exergy Analysis
Figures 1A and 1B below indicate the flows of energy and exergy into and out of the base case and alternative case processes. The figures in black are energy flows and the figures in red are exergy flows, with the exception that the figure in red for QW equaling the useful work entering or leaving the process is the same for both energy and exergy. This useful work represents the energy either absorbed (endothermic) or exported (exothermic) by the reaction(s) modeled. An arrow leaving the process represents work done by the reaction (endothermic).
As part of the output from the analysis, the energy and exergy balance around every process unit was calculated. The results of these calculations for each process unit modeled are tabulated in Table 1A in Appendix 1 - Ethylene. The figures are also totaled for each Process Section and
QLOSS = INTERNAL + EXTERNAL EXERGY LOSSES = RECOVERABLE ENERGY
Figure 1B: Energy and Exergy Losses in Base Ethylene Process (Btu/lb of Ethylene)
QIN Input = 9,125 = 6,411
QREJECT=2,714 PROCESS
Effluents = 229 (External Exergy Losses)
Irreversibility = 3,184 (Internal Exergy Losses)
Energy
Exergy QW, Useful
Work= 2,998
QIN Input = 7,055 = 5,017
QREJECT=2,032 PROCESS
Effluents = 181 (External Exergy Losses)
Irreversibility = 2,255 (Internal Exergy Losses)
Energy
Exergy QW, Useful
Work= 2,581
QLOSS = INTERNAL + EXTERNAL EXERGY LOSSES = RECOVERABLE ENERGY
Figure 1A: Energy and Exergy Losses in Alternative Ethylene Process Technology (Btu/lb of Ethylene)

Page 8 of 135
presented below in Table 1A for the Modified Ethylene Process and 1B for the Base Ethylene Process. Table 1A: Losses of Energy and Exergy: Alternative Ethylene Process Technology
Energy Loss =
Btu/lb
Exergy Loss =
Btu/lb
Process Sub-Section
Total =
2,799 %
Total External
= 181
Total Internal
= 2,255
Total =
2,436 % Cracking 395 14 22 919 941 39 Compression 1,059 37 115 328 443 18 Refrigeration 1,340 45 32 427 459 19 Demethanization 0 3 12 189 200 8 Deethanization 4 0 0 51 51 2
Table 1B: Losses of Energy and Exergy: Base Ethylene Process
Energy Loss =
Btu/lb
Exergy Loss =
Btu/lb
Process Sub-Section
Total =
3,630 %
Total External =
229
Total Internal =
3,184
Total =
3,413 % Cracking 494 14 40 1,601 1,640 48 Compression 1,244 34 121 338 459 13 Refrigeration 1,888 52 68 890 957 28 Demethanization 0 0 0 102 102 3 Deethanization 4 0 0 101 101 3 Product Purification 0 0 0 152 152 4
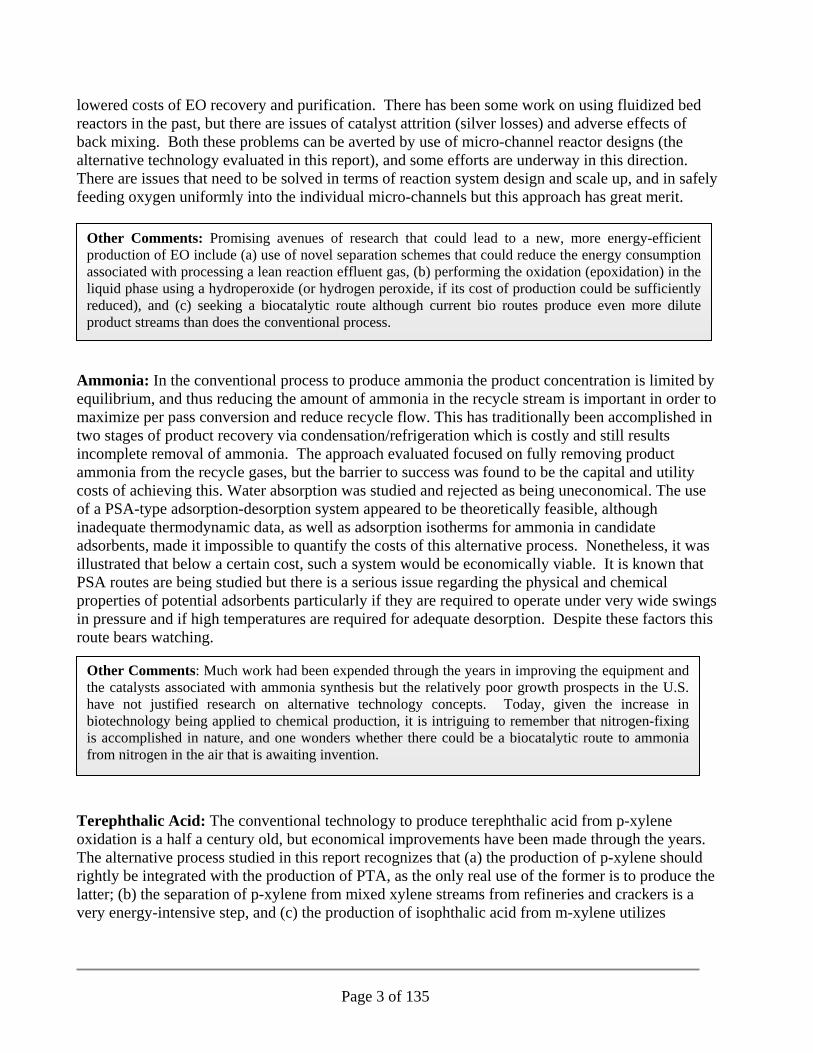
The results suggest that the proposed alternative process technology would lead to a significant mass and energy utilization improvement in producing ethylene from ethane since the lower ethane recycle translates to lower cracking load, and lower compression and refrigeration duties. Other outputs from the Aspen simulations are a listing of process conditions and compositions of each stream shown in Table 1B in Appendix 1, and flow sheets of the process as simulated, shown as Figure 1A, 1B, 1C, 1D, and 1E in Appendix 1. Figures 1F, 1G, 1H, 1I and 1J are flowsheets for the Base Ethylene case, originally developed in the Bandwidth Study. C. Results of CPAT Simulation and Conclusions The simulation of the alternative case gave flow rates around the process from which the capital cost was estimated, by proration from the base case. The one missing item was the cost for the membrane separation system. That cost was parameterized, by running CPAT at different membrane system costs and choosing that which just allowed market penetration. That figure was in the range of $60 to $80 million dollars for an ethane to ethylene plant costing $400 million dollars with a capacity of 1,764 million lbs/year (800 thousand tonnes/yr) of ethylene. At a cost of $60 million, CPAT projected one unit deployed by 2020 and two units by 2030, with total annual U.S. energy savings of 3.94 TBtu/yr and 7.88 TBtu/yr respectively.

Page 9 of 135
2. Chlorine - Caustic
A. Introduction The Bandwidth Study included an analysis of the production of chlorine and caustic soda utilizing a diaphragm cell in the electrolysis section. This technology has generally replaced the original mercury cell process, but is also being slowly replaced by the more efficient membrane technology. Estimated costs and results for conversion of a diaphragm cell plant to utilize membrane cells were obtained by review of various literature sources dealing with each of the technologies as well as different approaches to converting or retrofitting one type of cell to another. The alternative process selected for this study was the retrofitting of a diaphragm cell plant with membranes.
B. Results of Aspen Simulation/Exergy Analysis
Figures 2A and 2B below indicate the flows of energy and exergy into and out of each of the two processes.
QW, Useful Work= 3,970 (Chemical Conversion)
QLOSS = INTERNAL + EXTERNAL EXERGY LOSSES = RECOVERABLE ENERGY
Figure 2B: Energy and Exergy Losses- Base Chlorine-Caustic Diaphragm Cell Process (Btu/lb of Cl2)
QIN Input = 11,730 = 11,032
QREJECT= 698 PROCESS
Effluents = 38 (External Exergy Losses)
Irreversibility = 7,024 (Internal Exergy Losses)
Energy
Exergy
QW, Useful Work= 4,350
QLOSS = INTERNAL + EXTERNAL EXERGY LOSSES = RECOVERABLE ENERGY
Figure 2A: Summary of Energy and Exergy Losses in Alternative Chlorine-Caustic Technology (Membrane Retrofit of Diaphragm Process Btu/lb of Cl2)
QIN Input = 12,213
QREJECT=2,541 PROCESS
Effluents = 116 (External Exergy
Irreversibility = 6,257 (Internal Exergy
Energy
Exergy

Page 10 of 135
The results of the calculation of the energy and exergy balance around every process unit modeled are tabulated in Table 2A in Appendix 2 – Chlorine – Caustic Soda. The figures are also totaled for each Process Section and presented in Table 2A for the Modified Chlorine-Caustic Process and 2B for the Base Chlorine-Caustic Process.
Table 2A: Losses of Energy and Exergy in Alternative Chlorine Process Technology Energy Loss
= Btu/lb
Exergy Loss =
Btu/lb
Process Sub-Section
Total =
1,505 %
Total External =
124
Total Internal =
6,243
Total =
6,367 % Brine 868 58 43 24 67 1 Electrolysis 408 27 63 6058 6122 96 Gas Treatment 229 15 17 161 178 3
Table 2B: Losses of Energy and Exergy in Base Chlorine Process
Energy Loss =
Btu/lb
Total Exergy Loss
= Btu/lb
Process Sub-Section
Total =
969 %
Total External =
38 Btu/lb
Total Internal =
7,024
Total =
7,062 % Brine 664 68 24 39 63 1 Electrolysis 0 0 0 6,395 6,395 91 Gas Treatment 228 24 14 231 245 3 Liquor 76 8 0 359 359 5
The energy/exergy input and loses in the two processes are comparable according to the analyses. The energy/exergy demand of the membrane process electrolytic cell is slightly lower because unreacted NaCl exists in the recycled brine solution but in the diaphragm process unreacted NaCl must be crystallized out of the liquor before it can be recycled. However, unlike the diaphragm process, the membrane requires stream heating to separate the desorbed chlorine from the product sodium hydroxide and compressor duty is required to compress the released chlorine to the pressure of the main chlorine product stream. In addition, the recycled brine solution is at about 160 oF and some of its heat content could be recovered for process heat by heat integration with other process streams. One distinct advantage of the membrane process is that no sodium chloride passes to the catholyte, which offers the prospect of high purity sodium hydroxide product. It must be noted that the model analyses (the base and the alternative cases), were not able to account for over-voltage losses, anodic or other electrolytic losses. These loses are dependent on the type of cell. In practice, membrane cells are more efficient but such details are not captured in the analyses.

Page 11 of 135
Other outputs from the Aspen simulations are a listing of process conditions and compositions of each stream shown in Table 2B in Appendix 2 – Chlorine – Caustic Soda, and flow sheets of the process as simulated, shown as Figure 2A, 2B, 2C, and 2D in Appendix 2. Figures 2E, 2F, 2G, 2H, 2I and 2J are flow sheets for the Base Chlorine-Caustic Soda case, originally developed in the Bandwidth Study.
C. Results of CPAT Simulation and Conclusions For a plant producing 287 million lb/year of chlorine, with the associated production of caustic soda and hydrogen, it was estimated that the retrofit cost was about 17% of the total investment cost, and that there was about a 10% savings in electrical power and a 50% savings in steam. The exergy analysis also indicated reductions in energy and exergy losses, but it was not possible to model the electrolytic cell itself in Aspen. CPAT was run with figures developed from the above information, and the result was a forecast of a deployment of two retrofits by 2020 and a total of 4 retrofits by 2030. The corresponding energy savings were 2.44 TBtu/yr by 2020 and 4.87 TBtu/yr by 2030.
3. Ethylene Oxide
A. Introduction The Bandwidth Study utilized an Ethylene Oxide (EO) flowsheet that produced 50% of its product as purified EO and the other 50% as an aqueous EO stream, intended to be fed to a downstream ethylene glycol (EG) unit (not included in the simulation). This caused a distortion (increase) in the energy and exergy losses as compared to those that would have been computed were only purified EO produced, but in fact, producing EO and EG at the same plant site is the norm. The reactor performance in conventional EO production is limited by the flammability limit of oxygen in the hydrocarbon-rich reactor feed gas. Microchannel reaction technology has been recognized as allowing operation within the flammability envelope, provided the oxygen is mixed with the hydrocarbon within the microchannel assembly. The alternative technology studied in this work included the use of such a reaction system, with higher ethylene and oxygen concentrations fed into the reactor and a higher concentration of ethylene oxide in the reactor effluent. In the course of running an Aspen simulation and exergy analysis of this alternative technology, it was discovered that the original base case simulation of the ethylene oxide flowsheet was seriously flawed. Therefore, a new base case was developed for EO for comparison against the alternative case employing microchannel reactor technology.

Page 12 of 135
B. Results of Aspen Simulation/Exergy Analysis
Figures 3A and 3B below indicate the flows of energy and exergy into and out of each of the two processes.
The results of the calculation of the energy and exergy balance around every process unit modeled are tabulated in Appendix 3. The figures are totaled for each process section and presented in Table 3A for the alternative case and 3B for the new base case.
QLOSS = INTERNAL + EXTERNAL EXERGY LOSSES = RECOVERABLE ENERGY
Figure 3A: Energy and Exergy Losses in Alternative Ethylene Oxide Process Technology utilizing Microchannel Reaction System (Btu/lb of EO)
QIN Input = 5,191 = 3,134
QREJECT=2,057 PROCESS
Effluents = 1,064 (External Exergy Losses)
Irreversibility = 5,290 (Internal Exergy Losses)
Energy
Exergy QW, Useful
Work= 3,220
QLOSS = INTERNAL + EXTERNAL EXERGY LOSSES = RECOVERABLE ENERGY
Figure 3B: Energy and Exergy Losses in NEW Base Ethylene Oxide Process (Btu/lb of EO)
QIN Input = 6,432 = 3,526
QREJECT=2,906 PROCESS
Effluents = 1,175 (External Exergy Losses)
Irreversibility = 5,772 (Internal Exergy Losses)
Energy
Exergy QW, Useful
Work= 3,421

Page 13 of 135
Table 3A: Losses of Energy and Exergy: Alternative EO Process Technology Energy Loss
= Btu/lb
Exergy Loss =
Btu/lb
Process Sub-Section
Total =
7,125 %
Total External =
1,064
Total Internal =
5,290
Total =
6,355 % Feed Pre-treat 0 0 0 148 148 2 CO2 -Recovery 1,784 25 307 1,027 1,334 21 Exothermic Reactor 751 11 184 2,598 2,782 44 EO Absorber 1,844 26 302 1,262 1,564 25 EO Stripper 2,589 36 263 242 505 8 EO Purification 157 2 9 13 22 0
Table 3B: Losses of Energy and Exergy: NEW Base EO Process
Total Energy Loss =
Btu/lb
Total Exergy Loss =
Btu/lb
Process Sub-Section Total= 8,345 %
Total External =
1,175
Total Internal =
5,772
Total =
6,947 % Feed Pre-treat 0 0 0 203 203 3 CO2 –Recovery 1,524 18 197 1,142 1,339 19 Exothermic Reactor 1,186 14 252 2,733 2,986 43 EO Absorber 1,937 23 324 1,382 1,707 25 EO Stripper 3,549 43 394 297 691 10 EO Purification 149 2 7 14 21 0
As shown in Figures 3A and 3B (also Tables 3A and 3B), the differences in energy/exergy input and losses between the two models are indicative of the enhanced efficiency of the alternative case which allows for higher reactant oxygen and ethylene concentration and lower reactor stream recycle rate. The improvement is most significant in the energy losses in the reactor and the EO stripper sections. However, since operating temperatures are relatively low, the savings in exergy losses are low. Details of the energy/exergy losses in each section are shown in Tables 3A for the alternative EO case and 3B for the new base case. Other outputs from the Aspen simulations are a listing of process conditions and compositions of each stream shown in Table 3A for the alternative case and 3B for the new base case in Appendix 3 – Ethylene Oxide, and flow sheets of the process as simulated, shown as Figure 3A and 3B for the alternative case, and Figures 3C and 2D for the new base case, all in Appendix 3.
C. Results of CPAT Simulation and Conclusions The higher ethylene oxide concentration in the EO reactor exit, caused by the higher ethylene and oxygen concentrations permitted by use of the microchannel reactor concept, results in a reduction of the total reactor and recycle gases, with accompanying savings in capital cost in the front end of the plant, and some recovery savings. The microchannel reaction assembly was assumed to also

Page 14 of 135
integrate the large gas-gas exchangers and reaction effluent cooler-steam generators as well as the boiling water cooling of the reactor itself, with this adding to the capital cost savings. Capital cost and utilities savings were estimated based on the energy and exergy analyses of the two cases, with the only major question mark being the cost of a large microreaction assembly (modular construction). It is estimated that the total cost of the reaction section will be lower by 10%, since the large heat exchangers and steam generators in the conventional reaction loop are integrated into the microchannel reactor assembly. The cost of an industrial scale microchannel reactor system, of the complexity assumed here, is an important unknown, but as mentioned, it is assumed to replace many large pieces of equipment as well as the base case shell-and-tube reactor. The results of this analysis were run in CPAT and resulted in expected deployment of the new technology with one plant by 2020 and a total of 8 plants by 2030, with an energy savings in 2030 of 5.13 TBtu/yr.
4. Ammonia
A. Introduction All conventional ammonia technologies are recycle processes, with product ammonia removed in two stages of cooling/refrigeration, but with about 10% of the ammonia in the reactor effluent remaining in the gas to be recycled to the synthesis reactor. The ammonia synthesis is an equilibrium reaction, so that the maximum concentration of ammonia in the reactor effluent is related to the concentrations of unconverted hydrogen and unconverted nitrogen in the reactor effluent. Thus, any ammonia recycled to the inlet of the reactor reduces the conversion per pass of the syngas components, and therefore increases the recycle flow. The energy saving concept in this study was to find a way to remove ammonia from the reaction system effluent gases down to very low levels, thereby reducing the size of the recycle stream and therefore the size of all of the equipment in the synthesis loop this would also result in proportionate energy savings. The first concept attempted was to scrub the remaining ammonia from the reactor effluent (after one or two stages of cooling) with water at synthesis reaction pressure, and stripping the ammonia out of the water at close to atmospheric pressure. Based on physical data for the ammonia-water system, an absorber-stripper system was designed, but the estimated energy savings in the synthesis loop were not as great as the additional energy required by the new ammonia stripper. A second approach was to use PSA (pressure swing adsorption) to remove the ammonia. Thermodynamic data was not readily available for ammonia-adsorbent systems, but the required process equipment, based on extrapolation from other adsorption systems, appeared quite large. The energy savings appeared to be real, however, so CPAT was used to back-calculate how much capital could be spent on an adsorption system while still having superior economics leading to deployment of the new concept. An Aspen simulation and exergy analysis were run for the case

Page 15 of 135
where all of the ammonia in the reactor effluent, after normal ammonia removal, was assumed to be removed in a PSA system.
B. Results of Aspen Simulation/Exergy Analysis
Figures 4A and 4B below indicate the flows of energy and exergy into and out of each of the two processes.
The results of the calculation of the energy and exergy balance around every process unit modeled are tabulated in Table 4A in Appendix 4 - Ammonia. The figures are also totaled for each process section and presented in Table 4A for the alternative case and 4B for the base case.
QLOSS = INTERNAL + EXTERNAL EXERGY LOSSES = RECOVERABLE ENERGY
Figure 4b: Energy and Exergy Losses- Base Ammonia Process (Btu/lb ofAmmonia)
QIN Input = 4,596 = 3,543
QREJECT= 1,053 PROCESS
Effluents = 1,170 (External Exergy Losses)
Irreversibility = 2,724 (Internal Exergy Losses)
Energy
Exergy QW, Useful Work= 351 (Chemical Conversion)
QLOSS = INTERNAL + EXTERNAL EXERGY LOSSES = RECOVERABLE ENERGY
Figure 4A: Summary of Energy and Exergy Losses for Alternative Ammonia Process Technology with PSA Elimination of Recycle NH3 (Btu/lb of NH3)
QIN Input = 5,755 = 3,748
QREJECT=845 PROCESS
Effluents = 1,353 (External Exergy Losses)
Irreversibility = 2,734 (Internal Exergy Losses)
Energy
Exergy
QW, Useful Work= 349

Page 16 of 135
Table 4A: Losses of Energy and Exergy in Modified (Absorption/Stripping) Ammonia Process Energy Loss
= Btu/lb
Exergy Loss =
Btu/lb
Process Sub-Section
Total =
5,725 %
Total External =
1,353
Total Internal =
2,734
Total =
4,087 % Preheating/Reforming 561 10 169 1,311 1,480 36 Shift 19 0 8 158 165 4 Gas Upgrading 2,507 44 590 175 765 19 Ammonia Synthesis 1,708 30 272 1,048 1,319 32 Residual NH3 Removal 673 12 236 18 254 6 Heat Recovery 257 4 79 25 104 3
Table 4B: Losses of Energy and Exergy in Base Ammonia Process Energy Loss
= Btu/lb
Exergy Loss =
Btu/lb
Process Sub-Section
Total =
5,324 %
Total External =
1,170 Btu/lb
Total Internal =
2,724 Btu/lb
Total =
3,893 % Preheating/Reforming 556 10 206 1272 1,478 38 Shift 0 0 0 164 164 4 Gas Upgrading 2,608 49 614 182 796 20 Ammonia Synthesis 1,897 36 269 1081 1,350 35 Heat Recovery 263 5 81 25 106 3
The alternative process produces a higher ammonia yield per pass because of the more favorable equilibrium conditions provided by the reduced ammonia in the reactants. However, the first alternative process tried was more energy intensive than the base case because of the adsorption/stripping section that was first modeled to remove the residual ammonia in the recycle stream. The high energy demand in the new section was due to the high solubility of ammonia in water making it energetically expensive to recover the ammonia from the water absorbent. Another fluid with less ammonia solubility would be preferable. The alternative flowsheet finally chosen, as explained above, used PSA to remove the ammonia. Unfortunately, this cyclical process could not be modeled using Aspen nor could its exergy balance be computed. As an estimate of the results of the use of PSA, the line in Table 4A above named “Residual NH3 Removal” can be deleted, and new totals computed resulting in a Total Energy Loss of 5,052 Btu/lb of ammonia and a Total Exergy Loss of 3,833 Btu/lb of ammonia, both figures slightly lower than the respective figures in the base case. Other outputs from the Aspen simulations are a listing of process conditions and compositions of each stream shown in Table 4B in Appendix 4 – Ammonia, and flow sheets of the process as simulated, shown as Figure 4A and 4B, also in Appendix 4. Figure 4C is a flowsheet for the base case.

Page 17 of 135
C. Results of CPAT Simulation and Conclusions For a 2.2 billion lbs/year ammonia plant, it was estimated that the capital cost would be reduced by $9 million (out of an ISBL of $330 million including the syngas plant). The energy savings were calculated to be surprisingly modest – about a 6% reduction in electric power and a 2% reduction in steam. At these savings, it was computed utilizing CPAT that one could afford to spend $5 million on the PSA system and get an adequate return to begin to penetrate the market. It is unlikely that this capital would be adequate, but the concept merits further review, with real adsorption data. For the case as run, one new ammonia plant was forecast by 2020 but no others by 2030, and the energy savings was a modest 0.21 TBtu/yr in each of those years.
5. Terephthalic Acid A. Introduction The Bandwidth study simulated a technology similar to the BP Amoco Mid-Century Process, with pure p-xylene being oxidized in the liquid phase to produce purified terephthalic acid, via crystallization. There is a similar process for producing isophthalic acid by liquid phase oxidation of m-xylene, also utilizing crystallization, and there are patents teaching a difference in solubility versus temperature for the two acids in acetic acid and in water. Conventionally, p-xylene is obtained by feeding a mixed xylenes stream to a UOP Parex-Isomar system, or its equivalent, which converts the other xylenes to p-xylene and recovers pure p-xylene via adsorption. The mixed xylene stream itself is a co-product of using Sulfolane or another extraction process to recovery benzene from reformate. The three xylene isomers in the mixed xylene stream are at equilibrium, containing about 25% each of p-xylene and o-xylene, and about 50% of m-xylene. Since the other xylenes are recycled to extinction, there are no substantial by-products for either the p-x production or the PTA production. The alternative technology was conceived as being fed the same mixed xylene stream to a xylenes splitter (a part of the Parex-Isomar system), which takes primarily p-x and m-x overhead, leaving o-xylene as a bottoms co-product stream. The overhead p-x/m-x mixture is fed directly to an oxidation reactor where the xylenes are converted to a mixture of terephthalic acid and isophthalic acid. Then, through a series of crystallizations at lower and lower temperatures a product stream of each acid can be separated from the other.

Page 18 of 135
B. Results of Aspen Simulation/Exergy Analysis
Figures 5A and 5B below indicate the flows of energy and exergy into and out of each of the two processes.
The results of the calculation of the energy and exergy balance around every process unit modeled are tabulated in Table 5A in Appendix 5 – Terephthalic Acid. The figures are also totaled for each process section and presented below in Table 5A for the alternative case (combined PTA/IPA process) and 5B for the base case.
QW, Useful Work= 3,970 (Chemical Conversion)
QLOSS = INTERNAL + EXTERNAL EXERGY LOSSES = RECOVERABLE ENERGY
Figure 5b: Energy and Exergy Losses- Base PTA (Purified Terephthalic Acid Process (Btu/lb of PTA)
QIN Input = 1,919 = 1,157
QREJECT= 698 PROCESS
Effluents = 1,440 (External Exergy Losses)
Irreversibility = 4,447 (Internal Exergy Losses)
Energy
Exergy
QLOSS = INTERNAL + EXTERNAL EXERGY LOSSES = RECOVERABLE ENERGY
Figure 5A: Summary of Energy and Exergy Losses for Alternative Terephthalic/Isophthalic Process Technology (Btu/lb of PTA+IPA)
QIN Input = 4,033 = 1,804
QREJECT=2,541 PROCESS
Effluents = 2,222 (External Exergy Losses)
Irreversibility = 2,997 (Internal Exergy Losses)
Energy
Exergy QW, Useful Work= 3,416 (Chemical Conversion)

Page 19 of 135
Table 5A: Losses of Energy and Exergy in Alternative PTA/IPA Process Technology Energy Loss
= Btu/lb PTA+IPA
Exergy Loss =
Btu/lb PTA+IPA
Process Sub-Section
Total =
9,551 %
Total External =
2, 337
Total Internal =
2,999
Total =
5,336 % Feed Prep 1976 21 547 85 632 12 Oxidation 1808 19 642 1882 2524 47 CTA Crystallizer 2068 22 306 324 631 12 Hydrogenation 60 1 17 456 473 9 PTA/IPA Purification 1493 16 413 4 417 8 Product Purification 2145 22 412 248 659 12
Table 5B: Losses of Energy and Exergy in Base PTA Process
Energy Loss =
Btu/lb
Exergy Loss =
Btu/lb
Process Sub-Section
Total =
5,374 %
Total External =
1,440 Btu/lb
Total Internal =
4,447 Btu/lb
Total =
5,887 % Feed Prep 0 0 0 0 0 0 Oxidation 1,943 36 657 3,635 4,292 73 CTA Crystallizer 1,766 33 288 273 561 10 Hydrogenation 49 1 11 435 446 8 PTA 1,616 30 484 104 588 10 Product Purification 0 0 0 0 0 0
Unlike the almost pure p-xylene feedstock in the base case, the alternative case feed is a commercial cut which contains light and heavy ends in addition to the equilibrium mixture of xylenes. The alternative process also differs because it produces isophthalic acid (IPA) simultaneously with PTA. The differences in the feed and products account for the variations in energy/exergy utilization in both processes. In the front end, the alternative case requires extra energy/exergy to remove the light ends and the o-xylene (and the heavy ends); o-xylene removal from the feed is particularly energy intensive as shown by the Table 5A and Table 5B. Furthermore, there are two aspects to the relative energy/exergy utilization between the two processes in the back end as shown by Table 5A and Table 5B. Oxidation of m-xylene to IPA is less exothermic than p-xylene to PTA and the potential energy/exergy from the alternative case reactor is therefore less than the base case. On the down side, the product purification in the alternative process requires more energy/exergy input because the process requires two series of crystallizations - the first series produces crude PTA/IPA slurry and the next stage involves slurry dissolution/and re-crystallization to produce pure PTA and IPA.

Page 20 of 135
Finally, it should be recognized that the alternative case avoids the production of p-x from mixed xylenes, and there should be energy and exergy credits applied to the figures in Table 5A. These credits were not obtainable from the original Aspen simulation of mixed xylene to p-x in the Bandwidth study, as that simulation covered only a portion of the process. Other outputs from the Aspen simulations are a listing of process conditions and compositions of each stream shown in Table 5B in Appendix 2 – Alternative PTA/IPA, and flow sheets of the process as simulated, shown as Figure 5A, 5B and 5C.also in Appendix 5. Figures 5D, 5E and 5F are flow sheets for the base case.
C. Results of CPAT Simulation and Conclusions
Because the alternative process separates the o-xylene as a co-product, the mixed xylene stream is substantially larger than that to produce the same amount of PTA via the conventional p-X and PTA combined processes. Also, the capital cost of the PTA/IPA process, for the same total acid make, is slightly larger than the conventional due to the need for at least one extra stage of crystallization. CPAT was run to compare the base case (the combined p-X/PTA processes) against the alternative case consisting of a xylene splitter followed by the oxidation of the p-X and m-X to PTA/IPA, with o-Xylene as a co-product. The results of the run indicate deployment of the new technology with five plants by 2020 and a total of 14 plants by 2030, with an energy savings in 2030 of 19.5 TBtu/yr. Conclusions and Recommendations
1. Ethylene This case illustrated that a process scheme in which the cracking equilibrium was pushed to higher conversion per pass by removing hydrogen as it is formed would give a substantial energy intensity advantage. This seems to represent a fruitful avenue for future research. Commercial implementation would be possible if a viable separation technology, such as a ceramic or other high-temperature material membrane, could be deployed for less than about $60 million in a grass-roots ethane to ethylene plant of about 1.7 billion lbs/year capacity; in addition such a grass roots facility would also save substantial capital due to the lower recycle flow of ethane. A retrofit would save energy but probably would not be economical at an installed capital cost of $60 million. The Bandwidth Study on ethylene from propane, naphtha and ethane contained other avenues of potentially valuable research, such as replacement of the pyrolysis reaction by a lower-temperature reaction not requiring quenching (ethane dehydrogenation and oxydehydrogenation are obvious possibilities for ethane to ethylene and propane to propylene, but it is unclear what might transpire if one would attempt such a step on naphtha feedstock). Applying some of the novel separation technologies to the distillation section of olefin crackers is another obvious choice. Research work

Page 21 of 135
in all of the above areas has been funded in recent years by DOE, with the exception of the hydrogen-separation proposal studied here. Using other feedstocks to produce ethylene such as methanol or ethanol was also noted in the Bandwidth Study, and both are actively being commercialized at this time (although ethanol to ethylene has been practiced in Brazil and India for many years).
2. Chlorine – Caustic Developing alternative routes to produce chlorine is a difficult challenge. The conversion of the diaphragm cell to higher efficiency membrane cells was evaluated as the alternative technology because there are still a number of U.S. plants using either mercury cell or diaphragm cell technology. Energy savings can clearly be achieved by a conversion to membrane technology, and the cost of conversion is paid off reasonably rapidly, particularly in these recent years with escalating energy costs. It is not certain that a “break-through” cell concept with substantial energy savings in comparison to membrane cells is possible – no evidence of research work in this direction has been detected. The only commercialized alternative technology to produce chlorine that has been found in the patent and technical literature is the conversion of HCl to chlorine, but since HCl is itself a product of the use of chlorine, this is not a “breakthrough”. In fact, it is possible to use HCl and oxygen as a substitute for chlorine in certain reactions, such as oxychlorination. In the Bandwidth Study, it was noted that a great deal of chlorine is utilized in chemical reactions but often little or none is found in the final product. This leads to a large consumption of chlorine in the US, essentially downgrading it to HCl or a salt by-product (or waste product). The objectives of future research in this area ought to be based not only on seeking a more energy-efficient way to produce chlorine from brine, preferably without a co-product, but also to seek process innovations that either use chlorine the moment it is formed, to eliminate the hazardous storage and shipment of chlorine, or even better, to find alternative ways to produce those products not containing chlorine, and alternative products to replace chlorine-containing products (most notably PVC).
3. Ethylene Oxide This case illustrates that finding a way to increase the ethylene oxide concentration in the reactor effluent gases of this low conversion/pass process can have a large beneficial effect on process economics and energy intensity. The use of a microchannel reactor design or a fluidized bed reactor allows operating with the reactor feed gases within the flammable envelope, which increases reaction rate and allows higher outlet concentrations of EO at lower ethylene conversions, resulting in higher selectivity and EO yield and lowered costs of EO recovery and purification. There has been some work on using fluidized bed reactors in the past, but there are issues of catalyst attrition (silver losses) and adverse effects of back mixing. Both these problems can be averted by use of

Page 22 of 135
microchannel reactor designs, and some efforts are underway in this direction. There are different issues that need to be solved – mechanical ones in terms of reaction system design and scale up, and in safely feeding oxygen uniformly into the individual microchannels but this approach has great merit. Other promising avenues of research that could lead to a new, more energy-efficient production of EO including use of novel separation schemes that could reduce the energy consumption associated with the lean reaction gases, by performing the oxidation (epoxidation) in the liquid phase using a hydroperoxide (or hydrogen peroxide, if its cost of production could be sufficiently reduced). Finally, there has been work in the past seeking a biocatalytic route to produce EO – this is an idea that is still worth pursuing, although current bio routes produce even more dilute product streams than does the conventional process.
4. Ammonia The conventional process to produce ammonia is another case where the product concentration is limited by equilibrium, and the reduction of recycle ammonia has traditionally been accomplished in two stages of product recovery by condensation, the second under substantial refrigeration. The current study has illustrated the benefit to process economics and energy-efficiency of being able to fully remove product ammonia from the recycle gases, but the barrier to success is the capital and utility costs of alternative ways to remove ammonia. In this study, water absorption was studied and rejected, and the use of a PSA-type adsorption-desorption system appeared to be theoretically feasible, although inadequate thermodynamic data, as well as adsorption isotherms for ammonia in candidate adsorbents, made it impossible to quantify the costs of the alternative process. Rather, it was illustrated that below a certain cost, such a system would be economically viable. It is known that PSA routes are being studied but there is a serious issue regarding the physical and chemical properties of potential adsorbents particularly if they are required to operate under very high swings in pressure and if high temperatures are required for adequate desorption. Despite these factors this route bears watching. The Bandwidth Study recognized that much work had been expended through the years in improving the equipment and the catalysts associated with ammonia synthesis, and that the relatively poor growth prospects in the U.S. did not justify high levels of expenditure to research improved or alternative technology concepts. Nonetheless, given the growth in biotechnology being applied to chemical production, it is intriguing to remember that nitrogen-fixing is accomplished in nature, and one wonders whether there could be a biocatalytic route to ammonia from nitrogen in the air that is awaiting invention.
5. Terephthalic Acid The conventional technology to produce terephthalic acid from p-xylene oxidation is a half a century old, but economical improvements have been made through the years, some of which have

Page 23 of 135
reduced its energy intensity as well. The alternative process studied in this report recognizes that the production of p-xylene should rightly be integrated with the production of PTA, as the only real use of the former is to produce the latter. It further recognizes that the separation of p-xylene from mixed xylene streams from refineries and crackers is a very energy-intensive step in its own right. Finally, it was recognized that the production of isophthalic acid from m-xylene utilizes essentially the same processing steps, with the major differences being in the solubility of the product in water and in acetic acid as a function of temperature. The present study therefore started with mixed xylenes, made a first cut removing o-xylene, and then feeds the mixed m- and p-xylene stream to oxidation, and separates the isophthalic acid and PTA product by fractional crystallization. Quantitative solubility information of the two products was not available, but the patent literature suggests that the two products differ in their solubilities versus temperature, so the flowsheet evaluated used three stages of crystallization with appropriate recycling of streams versus two in the classical PTA process. It is believed that work is going forward on such a scheme by one organization at least, but no published work has been found. The third xylene isomer, o-xylene, is used exclusively to produce phthalic anhydride, but by a vapor-phase catalytic oxidation. There is no evidence that the other phthalic acids could be produced by vapor phase oxidation. It is more probable that a liquid phase oxidation of o-Xylene could be used, though this scenario is also unlikely. The Bandwidth Study suggested novel separations to replace the energy-intensive crystallization steps for PTA recovery and a search for an alternative oxidation chemistry that would not require halides and acetic acid solvent. Obviously, a better way to isolation p-xylene from the mixed xylene stream would also be beneficial.
6. Final Conclusions The cases studied illustrate that even though a technology may be old and well-developed, there can still be room for economically justifiable energy efficiency improvements. Based on commercialization assessments conducted with DOE’s CPAT software, the alternative technologies discussed in this report have the potential to compete with and improve on prevailing technologies in US industry. These technologies may become increasingly viable if fuel and feedstock prices continue increasing (calculations in this study were based on 2006 fuel/feedstock prices, as shown in Appendix 6). The important message is that researchers and process developers must be well-acquainted with current technologies and their short-comings and with the continuing series of emerging technological concepts coming out of innovative organizations. They must also be capable of developing conceptual economics around new process concepts in order to establish technical and economic hurdles that new concepts must clear in order for commercialization to be a reality. It is important for process developers to continuously revisit the old, and to see whether lessons learned in one area might have application in another. The DOE ITP program provides a unique opportunity for researchers to do just that, and it is hoped that the Bandwidth Studies and this report on Alternative Process Technologies can help achieve that goal.

Page 24 of 135

Page 25 of 135
Appendix 1 – Ethylene Table 1A: Alternative Ethylene from Ethane Production Process Technology – Energy and Exergy Loss Profile
Energy Loss Exergy Loss = =
Unit OP Type Btu/lb Btu/lb
Total Total
External Total
Internal Total = = = =
2,799 % 181 2,255 2,436 %
CRACKING CRACKING..F-101-9 Cracking Furnace 0 0 0 484 484 19.86
CRACKING..E-115 Steam Generator 0 0 0 1 1 0.03
CRACKING..M-2 Mixer 0 0 0 2 2 0.1
CRACKING..M-3 Mixer 0 0 0 32 32 1.31
CRACKING..E-114 Steam Generator 0 0 0 0 0 -0.01
CRACKING..M-5 Mixer 0 0 0 0 0 0.01
CRACKING..M-6 Mixer 0 0 0 11 11 0.44
CRACKING..E-113-1 Process Exchanger 0 0 0 10 10 0.4
CRACKING..P-101 Pump 0 0 0 0 0 0
CRACKING..E-101-9 Transfer Line Exchanger 0 0 0 201 201 8.24
CRACKING..SEP-10 Separator 0 0 0 -1 -1 -0.05
CRACKING..V-SEP2 Separator 0 0 0 0 0 0
CRACKING..SPL-OIL Flow Splitter 0 0 0 0 0 0
CRACKING..C-102 Dissolved Gas Splitter 0 0 0 3 3 0.13
CRACKING..FSP-11 Flow Splitter 0 0 0 0 0 0
CRACKING..E-110A Water Cooler 387 13.82 22 24 46 1.9
CRACKING..C-101 Gasoline Fractionator 0 0 0 48 48 1.95
CRACKING..MIX-OIL Mixer 0 0 0 0 0 0
CRACKING..ZE-EFF1 Cooler 1 0.04 0 0 0 0.01
CRACKING..ZE-EFF3 Cooler 7 0.25 0 1 1 0.06
CRACKING..E-BFW BFW Heater 0 0 0 104 104 4.26
CRACKING..MIX-10 Mixer 0 0 0 62 62 2.56
CRACKING..E-BFW2 BFW Heater 0 0 0 38 38 1.56
CRACKING..E-101-9B Boiler 0 0 0 72 72 2.95
COMPRESSION
COMPRESS..E-201 Heater 0 0 0 13 13 0.55
COMPRESS..R-201A Acetylene Hydrogenator 53 1.9 21 21 42 1.71
COMPRESS..E-202-3 Water Cooler 403 14.41 38 54 92 3.76
COMPRESS..E-204 Water Cooler 172 6.16 20 10 30 1.22
COMPRESS..V-204 Flash Drum 0 0 0 0 0 0
COMPRESS..E-205 Water Cooler 192 6.85 10 19 29 1.18

Page 26 of 135
Table 1A: Alternative Ethylene from Ethane Production Process Technology – Energy and Exergy Loss Profile (Cont’d)
Energy Loss Exergy Loss = =
Unit OP Type Btu/lb Btu/lb
Total % Total
External Total
Internal Total % COMPRESS..M-1 Mixer 0 0 0 0 0 0.02
COMPRESS..M-2 Mixer 0 0 0 0 0 0.01
COMPRESS..V-206 Separator 0 0 0 0 0 0.01
COMPRESS..C-202-4 Dehydrator 5 0.19 0 0 0 0
COMPRESS..V-203 Separator 0 0 0 0 0 0.01
COMPRESS..V-201 Separator 0 0.02 0 0 0 -0.01
COMPRESS..V-207 Knock-Out Drum 2 0.06 0 0 0 -0.02
COMPRESS..V-202 COMPRESS..K-204 4th Stage Comp. 127 4.55 3 34 37 1.51
COMPRESS..K-202A 2nd STAGE COMP 38 1.37 10 34 44 1.82
COMPRESS..K-203A 3rd Stage Comp 52 1.87 13 32 45 1.85
COMPRESS..C-201 Caustic Wash Column 0 0 0 0 0 0.02
COMPRESS..K-201 1st Stage Compressor 0 0 0 31 31 1.27
COMPRESS..ZE-EFF5 Cooler 13 0.47 0 0 0 0.01
COMPRESS..ZE-EFF6 Cooler 0 0 0 0 0 0
REFRIGER REFRIGER..E-312 Process Exchanger 0 0 0 9 9 0.39
REFRIGER..M-1 Mixer 0 0 0 0 0 0
REFRIGER..E-309-11 Process Exchanger 0 0 0 7 7 0.27
REFRIGER..M-2 Mixer 0 0 0 0 0 0
REFRIGER..M-3 Mixer 0 0 0 0 0 0
REFRIGER..S-1 Flow-Splitter 0 0 0 0 0 0
REFRIGER..E-306-8 Process Exchanger 0 0 0 32 32 1.31
REFRIGER..S-2 Flow-Splitter 0 0 0 0 0 0
REFRIGER..M-4 Mixer 0 0 0 0 0 0
REFRIGER..M-5 Mixer 0 0 0 8 8 0.33
REFRIGER..V-1 Valve 0 0 0 16 16 0.64
REFRIGER..V-2 Valve 0 0 0 3 3 0.11
REFRIGER..V-3 Valve 0 0 0 28 28 1.15
REFRIGER..E-320-2 Process Exchanger 0 0 0 10 10 0.41
REFRIGER..E-317 Process Exchanger 0 0 0 0 0 0.01
REFRIGER..E-207 Process Exchanger 0 0 0 1 1 0.02
REFRIGER..M-7 Mixer 0 0 0 0 0 0
REFRIGER..M-8 Mixer 0 0 0 0 0 0
REFRIGER..M-9 Mixer 0 0 0 0 0 0

Page 27 of 135
Table 1A: Alternative Ethylene from Ethane Production Process Technology – Energy and Exergy Loss Profile (Cont’d)
Energy Loss Exergy Loss = =
Unit OP Type Btu/lb Btu/lb
Total % Total
External Total
Internal Total % REFRIGER..S-3 Flow-Splitter 0 0 0 0 0 0
REFRIGER..S-4 Flow-Splitter 0 0 0 0 0 0
REFRIGER..S-5 Flow-Splitter 0 0 0 0 0 0
REFRIGER..E-404-10 Process Exchanger 1205 43.06 29 48 77 3.16
REFRIGER..V-7 Valve 0 0 0 12 12 0.48
REFRIGER..V-6 Valve 0 0 0 14 14 0.56
REFRIGER..S-6 Flow-Splitter 0 0 0 0 0 0
REFRIGER..V-5 Valve 0 0 0 23 23 0.95
REFRIGER..M-10 Mixer 0 0 0 7 7 0.27
REFRIGER..V-4 Valve 0 0 0 19 19 0.8
REFRIGER..M-11 Mixer 0 0 0 8 8 0.32
REFRIGER..V-401 Flash Drum 0 0 0 0 0 0
REFRIGER..V-402 Flash Drum 0 0 0 0 0 0.01
REFRIGER..V-403 Flash Drum 0 0 0 0 0 0
REFRIGER..V-404 Flash Drum 0 0 0 0 0 0
REFRIGER..V-405 Flash Drum 0 0 0 0 0 0
REFRIGER..V-406 Flash Drum 0 0 0 0 0 0
REFRIGER..M-15 Mixer 0 0 0 0 0 0
REFRIGER..E-402-3A Process Exchanger 0 0 0 69 69 2.82
REFRIGER..E-401A Process Exchanger 0 0 0 20 20 0.82
REFRIGER..K-401A Methane Comp 0 0 0 15 15 0.62
REFRIGER..K-402A Ethylene Comp 0 0 0 12 12 0.5
REFRIGER..K-403A Ethylene Comp 46 1.63 3 67 70 2.89
REFRIGER..K-404A Propylene Comp 0 0 0 78 78 3.19
REFRIGER..K-405A Propylene Comp 25 0.9 2 98 100 4.11
REFRIGER..K-406A Propylene Comp 64 2.29 10 53 63 2.59
DEMETHANIZATION PURIFICA..C-301 Demethanizer 0 0 0 36 36 1.47
PURIFICA..E-301A Process Exchanger 0 0 0 1 1 0.06
PURIFICA..V-301 Knock-Out Drum 0 0 0 0 0 0
PURIFICA..V-302 Knock-Out Drum 0 0 0 0 0 0
PURIFICA..M-1 Mixer 0 0 0 1 1 0.04
DEETHANIZER PURIFICA..C-302 De-ethanizer 0 0 0 50 50 2.07
PURIFICA..E-319 Process Exchanger 4 0.15 0 0 1 0.02
PURIFICA..E-314-16 Process Exchanger 0 0 0 0 0 0
PURIFICA..DRUM Knock-Out Drum 0 0 0 0 0 0
PRODUCT PURIFICATION PURIFICA..C-303 Ethylene Column 0 0 0 170 170 6.97

Page 28 of 135
Table 1B: Alternative Ethylene from Ethane Production Process Technology – Stream Tables
Stream ID COMPRES
S.->10 COMPRES
S.->10A COMPRES
S.->10B COMPRES
S.->14 COMPRES
S.->14A COMPRES
S.->14B COMPRES
S.->14C COMPRES
S.->14D Temperature F 125.76 243.30 428.00 109.00 105.00 109.88 157.68 -459.67
Pressure psi 18.00 44.00 44.00 44.00 219.00 98.00 98.00 44.00
Vapor Frac 0.98 1.00 1.00 0.05 0.00 0.05 0.00 0.00 MoleFlow lbmol/hr 5956. 5956. 5956. 389. 198. 389. 170. 0. MassFlow lb/hr 101838. 101838. 101838. 7531. 3571. 7531. 3065. 0.
H2 4573. 4573. 4573. 1. 0. 1. 0. 0.
METHA-01 4109. 4109. 4109. 8. 0. 8. 0. 0.
ACETY-01 269. 269. 269. 0. 0. 0. 0. 0.
ETHYL-01 65352. 65352. 65352. 208. 0. 208. 0. 0.
ETHAN-01 10721. 10721. 10721. 60. 0. 60. 0. 0.
PROPY-01 1885. 1885. 1885. 26. 0. 26. 0. 0.
PROPA-01 539. 539. 539. 17. 0. 17. 0. 0.
1-BUT-01 1895. 1895. 1895. 202. 0. 202. 0. 0.
2-MET-01 1177. 1177. 1177. 373. 0. 373. 0. 0.
OIL 0. 0. 0. 0. 0. 0. 0. 0.
WATER 11317. 11317. 11317. 6636. 3571. 6636. 3065. 0.
SODIU-01 0. 0. 0. 0. 0. 0. 0. 0. VolFlow cuft/hr 2036564.42 1018993.14 1289296.13 2861.98 58.47 1270.15 51.73 0.00 Enthalpy MMBtu/hr -33.58 -24.64 -12.68 -45.79 -24.51 -45.79 -20.86 0.00
Stream ID COMPRES
S.->15 COMPRES
S.->16 COMPRES
S.->17 COMPRES
S.->20 COMPRES
S.->20A COMPRES
S.->20B COMPRES
S.->20C COMPRES
S.->20D Temperature F 109.00 109.00 109.00 148.62 428.00 133.00 263.00 147.00
Pressure psi 44.00 44.00 44.00 44.00 44.00 44.00 98.00 98.00
Vapor Frac 0.75 0.72 0.00 1.00 1.00 0.94 1.00 0.96 MoleFlow lbmol/hr 14. 9. 366. 5672. 5908. 5908. 5672. 5672. MassFlow lb/hr 393. 523. 6615. 97581. 101838. 101838. 97581. 97581.
H2 0. 1. 0. 4453. 4453. 4453. 4453. 4453.
METHA-01 0. 8. 0. 4288. 4288. 4288. 4288. 4288.
ACETY-01 0. 0. 0. 0. 0. 0. 0. 0.
ETHYL-01 187. 19. 2. 64283. 64283. 64283. 64283. 64283.
ETHAN-01 59. 1. 0. 12179. 12179. 12179. 12179. 12179.
PROPY-01 0. 0. 26. 1853. 1853. 1853. 1853. 1853.
PROPA-01 0. 0. 17. 572. 572. 572. 572. 572.
1-BUT-01 81. 121. 0. 2520. 2520. 2520. 2520. 2520.
2-MET-01 0. 373. 0. 373. 373. 373. 373. 373.
OIL 0. 0. 0. 0. 0. 0. 0. 0.
WATER 66. 0. 6570. 7060. 11317. 11317. 7060. 7060.
SODIU-01 0. 0. 0. 0. 0. 0. 0. 0. VolFlow cuft/hr 1400.57 851.75 254.80 838276.08 1278756.20 796459.76 447374.34 359434.93 Enthalpy MMBtu/hr -0.37 -0.36 -45.08 -9.07 -16.07 -41.78 -2.64 -13.64

Page 29 of 135
Table 1B: Alternative Ethylene from Ethane Production Process Technology – Stream Tables – Cont’d
Stream ID COMPRES
S.->20E COMPRES
S.->20F COMPRES
S.->20G COMPRES
S.->21 COMPRES
S.->21A COMPRES
S.->21C COMPRES
S.->21D COMPRES
S.->22 Temperature F 157.68 254.80 105.00 96.41 105.00 90.00 60.00 100.00
Pressure psi 98.00 219.00 219.00 219.00 219.00 505.00 505.00 219.00
Vapor Frac 1.00 1.00 0.96 1.00 1.00 1.00 1.00 0.00 MoleFlow lbmol/hr 5502. 5502. 5502. 5298. 5303. 5298. 5298. 94. MassFlow lb/hr 94516. 94516. 94516. 90844. 90945. 90844. 90844. 1900.
H2 4453. 4453. 4453. 4453. 4453. 4453. 4453. 0.
METHA-01 4288. 4288. 4288. 4288. 4288. 4288. 4288. 0.
ACETY-01 0. 0. 0. 0. 0. 0. 0. 0.
ETHYL-01 64282. 64282. 64282. 64282. 64282. 64282. 64282. 0.
ETHAN-01 12179. 12179. 12179. 12179. 12179. 12179. 12179. 0.
PROPY-01 1853. 1853. 1853. 1853. 1853. 1853. 1853. 0.
PROPA-01 572. 572. 572. 572. 572. 572. 572. 0.
1-BUT-01 2520. 2520. 2520. 2520. 2520. 2520. 2520. 0.
2-MET-01 373. 373. 373. 373. 373. 373. 373. 0.
OIL 0. 0. 0. 0. 0. 0. 0. 0.
WATER 3994. 3994. 3994. 323. 423. 323. 323. 1520.
SODIU-01 0. 0. 0. 0. 0. 0. 0. 380. VolFlow cuft/hr 369462.62 191500.83 144162.92 141584.65 144104.46 59043.12 55117.34 29.43 Enthalpy MMBtu/hr 8.89 14.13 1.90 26.56 26.41 25.33 23.93 -11.91
Stream ID COMPRES
S.->22A COMPRES
S.->23A COMPRES
S.->24 COMPRES
S.->25 COMPRES
S.->26 COMPRES
S.->27 COMPRES
S.->27A COMPRESS.->DRAIN
Temperature F 104.97 85.00 60.00 60.00 -459.67 60.00 60.00 105.53
Pressure psi 219.00 219.00 505.00 505.00 0.00 505.00 505.00 14.70
Vapor Frac 0.00 0.00 1.00 0.06 0.00 1.00 0.00 0.00 MoleFlow lbmol/hr 1421. 1321. 5278. 20. 0. 5260. 18. 1421. MassFlow lb/hr 25801. 23800. 89950. 894. 0. 89627. 323. 25800.
H2 0. 0. 4452. 1. 0. 4452. 0. 0.
METHA-01 0. 0. 4280. 8. 0. 4280. 0. 0.
ACETY-01 0. 0. 0. 0. 0. 0. 0. 0.
ETHYL-01 0. 0. 64074. 208. 0. 64074. 0. 0.
ETHAN-01 0. 0. 12119. 60. 0. 12119. 0. 0.
PROPY-01 0. 0. 1827. 26. 0. 1827. 0. 0.
PROPA-01 0. 0. 555. 17. 0. 555. 0. 0.
1-BUT-01 0. 0. 2319. 202. 0. 2319. 0. 0.
2-MET-01 0. 0. 0. 373. 0. 0. 0. 0.
OIL 0. 0. 0. 0. 0. 0. 0. 0.
WATER 25420. 23800. 323. 0. 0. 0. 323. 25420.
SODIU-01 380. 0. 0. 0. 0. 0. 0. 380. VolFlow cuft/hr 419.17 385.39 54966.57 38.80 0.00 54844.91 5.16 419.28 Enthalpy MMBtu/hr -175.99 -163.93 24.23 -0.42 0.00 26.12 -2.23 -175.99

Page 30 of 135
Table 1B: Alternative Ethylene from Ethane Production Process Technology – Stream Tables – Cont’d
Stream ID
COMPRESS.->DRAIN-
EF COMPRESS.->VENT
COMPRESS.->VENT-
EFF COMPRES
S.->WASTE CRACKIN
G.->1 CRACKIN
G.->2 CRACKIN
G.->2A CRACKIN
G.->3
Temperature F 77.00 105.53 77.00 148.62 50.00 17.29 247.44 60.00
Pressure psi 14.70 14.70 14.70 44.00 80.00 270.00 270.00 80.00
Vapor Frac 0.00 1.00 0.96 0.00 1.00 0.57 1.00 0.00 MoleFlow lbmol/hr 1421. 0. 0. 236. 2609. 420. 420. 197.
MassFlow lb/hr 25800. 0. 0. 4257. 78595. 12851. 12851. 3554.
H2 0. 0. 0. 0. 0. 0. 0. 0.
METHA-01 0. 0. 0. 0. 0. 0. 0. 0.
ACETY-01 0. 0. 0. 0. 0. 0. 0. 0.
ETHYL-01 0. 0. 0. 0. 584. 64. 64. 0.
ETHAN-01 0. 0. 0. 0. 77400. 12056. 12056. 0.
PROPY-01 0. 0. 0. 0. 611. 638. 638. 0.
PROPA-01 0. 0. 0. 0. 0. 94. 94. 0.
1-BUT-01 0. 0. 0. 0. 0. 0. 0. 0.
2-MET-01 0. 0. 0. 0. 0. 0. 0. 0.
OIL 0. 0. 0. 0. 0. 0. 0. 0.
WATER 25420. 0. 0. 4257. 0. 0. 0. 3554.
SODIU-01 380. 0. 0. 0. 0. 0. 0. 0.
VolFlow cuft/hr 413.46 6.61 6.04 71.47 169455.07 3601.21 11121.00 56.79 Enthalpy MMBtu/hr -176.83 0.00 0.00 -29.01 -93.42 -15.78 -13.48 -24.59
Stream ID CRACKING
.->4 CRACKING
.->4A CRACKING
.->4B CRACKING
.->5 CRACKIN
G.->6 CRACKIN
G.->6A CRACKIN
G.->7-IN CRACKIN
G.->7-OUT
Temperature F 314.09 227.69 227.28 314.09 186.71 78.13 500.00 500.00
Pressure psi 80.00 80.00 18.00 80.00 80.00 80.00 23.00 23.00
Vapor Frac 1.00 0.00 0.00 0.66 0.89 1.00 1.00 1.00 MoleFlow lbmol/hr 573. 573. 573. 770. 3800. 3030. 3634. 3634.
MassFlow lb/hr 10318. 10318. 10318. 13872. 105319. 91447. 90010. 90010.
H2 0. 0. 0. 0. 0. 0. 482. 482.
METHA-01 0. 0. 0. 0. 0. 0. 2055. 2055.
ACETY-01 0. 0. 0. 0. 0. 0. 269. 269.
ETHYL-01 0. 0. 0. 0. 648. 648. 61335. 61335.
ETHAN-01 0. 0. 0. 0. 89456. 89456. 5331. 5331.
PROPY-01 0. 0. 0. 0. 1249. 1249. 1885. 1885.
PROPA-01 0. 0. 0. 0. 94. 94. 539. 539.
1-BUT-01 0. 0. 0. 0. 0. 0. 1815. 1815.
2-MET-01 0. 0. 0. 0. 0. 0. 2428. 2428.
OIL 0. 0. 0. 0. 0. 0. 0. 0.
WATER 10318. 10318. 10318. 13872. 13872. 0. 13872. 13872.
SODIU-01 0. 0. 0. 0. 0. 0. 0. 0.
VolFlow cuft/hr 57564.27 181.90 181.85 51447.81 284343.67 209283.40 1625086.0
8 1625086.0
8 Enthalpy MMBtu/hr -58.52 -69.37 -69.37 -83.10 -190.01 -106.91 -24.00 -24.00

Page 31 of 135
Table 1B: Alternative Ethylene from Ethane Production Process Technology – Stream Tables – Cont’d
Stream ID CRACKIN
G.->7A CRACKIN
G.->7A1 CRACKIN
G.->7A2 CRACKING.->7A2-1
CRACKING.->8B
CRACKING.->9-OUT
CRACKING.->9C
CRACKING.->9F
Temperature F 1512.00 1512.00 1512.00 500.00 490.71 295.21 276.99 257.00
Pressure psi 23.00 23.00 18.00 18.00 600.00 18.00 18.00 18.00
Vapor Frac 1.00 1.00 1.00 1.00 1.00 0.00 0.00 0.00 MoleFlow lbmol/hr 6106. 3634. 2472. 2472. 4725. 1167. 1167. 1167.
MassFlow lb/hr 105319. 90010. 15309. 15309. 85126. 285855. 285855. 285855.
H2 4573. 482. 4092. 4092. 0. 0. 0. 0.
METHA-01 4109. 2055. 2055. 2055. 0. 2. 2. 2.
ACETY-01 269. 269. 0. 0. 0. 1. 1. 1.
ETHYL-01 65167. 61335. 3832. 3832. 0. 136. 136. 136.
ETHAN-01 10662. 5331. 5331. 5331. 0. 15. 15. 15.
PROPY-01 1885. 1885. 0. 0. 0. 11. 11. 11.
PROPA-01 539. 539. 0. 0. 0. 3. 3. 3.
1-BUT-01 1815. 1815. 0. 0. 0. 22. 22. 22.
2-MET-01 2428. 2428. 0. 0. 0. 56. 56. 56.
OIL 0. 0. 0. 0. 0. 285236. 285236. 285236.
WATER 13872. 13872. 0. 0. 85126. 373. 373. 373.
SODIU-01 0. 0. 0. 0. 0. 0. 0. 0.
VolFlow cuft/hr 5619481.4
5 3344514.5
6 2906186.4
4 1414910.1
1 68991.52 4722.55 4679.22 4633.12 Enthalpy MMBtu/hr 66.57 41.53 25.03 1.07 -479.14 -376.34 -378.64 -381.12
Stream ID CRACKIN
G.->10
CRACKING.->10-
OUT CRACKIN
G.->10Z CRACKING.->11ZZ
CRACKING.->12
CRACKING.->15
CRACKING.->16
CRACKING.->17
Temperature F 125.76 109.95 109.95 124.41 90.00 109.00 109.00 109.00
Pressure psi 18.00 18.00 18.00 18.00 18.00 44.00 44.00 44.00
Vapor Frac 0.98 0.87 0.03 0.00 0.00 0.75 0.72 0.00 MoleFlow lbmol/hr 5956. 3485. 646. 144. 3. 14. 9. 366.
MassFlow lb/hr 101838. 86529. 12597. 2601. 800. 393. 523. 6615.
H2 4573. 482. 0. 0. 0. 0. 1. 0.
METHA-01 4109. 2055. 0. 0. 0. 0. 8. 0.
ACETY-01 269. 269. 0. 0. 0. 0. 0. 0.
ETHYL-01 65352. 61521. 0. 0. 0. 187. 19. 2.
ETHAN-01 10721. 5390. 0. 0. 0. 59. 1. 0.
PROPY-01 1885. 1885. 0. 0. 0. 0. 0. 26.
PROPA-01 539. 539. 0. 0. 0. 0. 0. 17.
1-BUT-01 1895. 1895. 0. 0. 0. 81. 121. 0.
2-MET-01 1177. 1177. 1249. 0. 0. 0. 373. 0.
OIL 0. 0. 28. 0. 800. 0. 0. 0.
WATER 11317. 11317. 11320. 2601. 0. 66. 0. 6570.
SODIU-01 0. 0. 0. 0. 0. 0. 0. 0.
VolFlow cuft/hr 2036564.4
2 1021554.4
6 6203.55 43.06 12.00 1400.57 851.75 254.80 Enthalpy MMBtu/hr -33.58 -34.66 -78.80 -17.80 -1.12 -0.37 -0.36 -45.08

Page 32 of 135
Table 1B: Alternative Ethylene from Ethane Production Process Technology – Stream Tables – Cont’d
Stream ID CRACKIN
G.->18
CRACKING.-
>COND-IN
CRACKING.-
>COND-OUT
CRACKING.->EF-
VAP CRACKIN
G.->LIQ CRACKING.->LIQ11
CRACKING.-
>LIQ13A
CRACKING.->LO-
EFF
Temperature F 76.66 270.23 270.24 77.00 295.21 124.41 124.41 77.00
Pressure psi 18.00 39.70 39.70 14.70 18.00 18.00 18.00 14.70
Vapor Frac 0.38 0.00 0.20 0.05 0.00 0.00 0.00 0.00 MoleFlow lbmol/hr 27. 700. 700. 22. 1171. 628. 18. 3.
MassFlow lb/hr 1810. 12618. 12618. 418. 286655. 11310. 1287. 800.
H2 1. 0. 0. 0. 0. 0. 0. 0.
METHA-01 8. 0. 0. 0. 2. 0. 0. 0.
ACETY-01 0. 0. 0. 0. 1. 0. 0. 0.
ETHYL-01 19. 0. 0. 2. 137. 0. 0. 0.
ETHAN-01 1. 0. 0. 0. 15. 0. 0. 0.
PROPY-01 0. 0. 0. 26. 11. 0. 0. 0.
PROPA-01 0. 0. 0. 17. 3. 0. 0. 0.
1-BUT-01 121. 0. 0. 0. 22. 0. 0. 0.
2-MET-01 1622. 0. 0. 0. 56. 0. 1249. 0.
OIL 28. 0. 0. 0. 286035. 0. 28. 798.
WATER 10. 12618. 12618. 373. 374. 11310. 10. 1.
SODIU-01 0. 0. 0. 0. 0. 0. 0. 0.
VolFlow cuft/hr 3187.57 228.97 27246.82 430.96 4735.77 187.20 34.45 11.96 Enthalpy MMBtu/hr -1.77 -84.20 -81.73 -2.59 -377.40 -77.39 -1.40 -1.12
Stream ID
CRACKING.->LOST-
OIL CRACKIN
G.->OIL CRACKING.->OIL2
CRACKING.->STM
CRACKING.->STM-
OUT2 CRACKING.->VAP
CRACKING.->VAP10
CRACKING.->VP10C
Temperature F 295.21 256.57 256.57 300.15 491.55 224.71 183.55 110.00
Pressure psi 18.00 18.00 18.00 64.70 600.00 18.00 18.00 18.00
Vapor Frac 0.00 0.00 0.00 1.00 1.00 1.00 1.00 0.74 MoleFlow lbmol/hr 3. 1170. 1171. 84. 1726. 22. 4117. 4117.
MassFlow lb/hr 800. 286670. 286655. 1520. 31100. 418. 98733. 98733.
H2 0. 0. 0. 0. 0. 0. 482. 482.
METHA-01 0. 2. 2. 0. 0. 0. 2055. 2055.
ACETY-01 0. 1. 1. 0. 0. 0. 269. 269.
ETHYL-01 0. 136. 136. 0. 0. 2. 61334. 61334.
ETHAN-01 0. 15. 15. 0. 0. 0. 5331. 5331.
PROPY-01 0. 11. 11. 0. 0. 26. 1885. 1885.
PROPA-01 0. 3. 3. 0. 0. 17. 539. 539.
1-BUT-01 0. 21. 22. 0. 0. 0. 1814. 1814.
2-MET-01 0. 54. 56. 0. 0. 0. 2426. 2426.
OIL 798. 286063. 286036. 0. 0. 0. 28. 28.
WATER 1. 364. 373. 1520. 31100. 373. 22571. 22571.
SODIU-01 0. 0. 0. 0. 0. 0. 0. 0.
VolFlow cuft/hr 13.22 4645.24 4645.08 10348.50 25241.43 8807.90 1570015.9
7 1024440.8
5 Enthalpy MMBtu/hr -1.05 -382.22 -382.24 -8.63 -175.04 -2.14 -88.41 -113.09

Page 33 of 135
Table 1B: Alternative Ethylene from Ethane Production Process Technology – Stream Tables – Cont’d
Stream ID CRACKING
.->W1 CRACKING
.->WA-IN CRACKING
.->WA-IN2 CRACKING.->WA-OUT
CRACKING.->WA-OUT2
PURIFICA.->2
PURIFICA.->2A
PURIFICA.->2B
Temperature F 124.41 90.00 90.00 484.04 484.04 17.29 15.66 17.81
Pressure psi 18.00 600.00 600.00 600.00 600.00 270.00 270.00 270.00
Vapor Frac 0.00 0.00 0.00 0.00 0.00 0.57 0.00 0.67 MoleFlow lbmol/hr 483. 4725. 1726. 4725. 1726. 420. 420. 420.
MassFlow lb/hr 8709. 85126. 31100. 85126. 31100. 12851. 12851. 12851.
H2 0. 0. 0. 0. 0. 0. 0. 0.
METHA-01 0. 0. 0. 0. 0. 0. 0. 0.
ACETY-01 0. 0. 0. 0. 0. 0. 0. 0.
ETHYL-01 0. 0. 0. 0. 0. 64. 64. 64.
ETHAN-01 0. 0. 0. 0. 0. 12056. 12056. 12056.
PROPY-01 0. 0. 0. 0. 0. 638. 638. 638.
PROPA-01 0. 0. 0. 0. 0. 94. 94. 94.
1-BUT-01 0. 0. 0. 0. 0. 0. 0. 0.
2-MET-01 0. 0. 0. 0. 0. 0. 0. 0.
OIL 0. 0. 0. 0. 0. 0. 0. 0.
WATER 8709. 85126. 31100. 85126. 31100. 0. 0. 0.
SODIU-01 0. 0. 0. 0. 0. 0. 0. 0.
VolFlow cuft/hr 144.15 1382.22 504.99 1863.30 680.75 3601.21 480.49 4197.47 Enthalpy MMBtu/hr -59.59 -585.75 -214.00 -544.67 -198.99 -15.78 -16.84 -15.58
Stream ID PURIFICA.-
>3OD PURIFICA.-
>27 PURIFICA.-
>27A PURIFICA.-
>27B PURIFICA.-
>27C PURIFICA
.->28 PURIFICA
.->28A PURIFICA
.->28B
Temperature F 12.29 60.00 -25.00 -90.00 35.80 -101.58 -147.50 -147.50
Pressure psi 390.00 505.00 505.00 505.00 505.00 465.00 465.00 465.00
Vapor Frac 1.00 1.00 0.92 0.54 1.00 1.00 0.86 1.00 MoleFlow lbmol/hr 3217. 5260. 5260. 5260. 5260. 3133. 3133. 2685.
MassFlow lb/hr 91554. 89627. 89627. 89627. 89627. 25341. 25341. 13613.
H2 0. 4452. 4452. 4452. 4452. 4472. 4472. 4459.
METHA-01 136. 4280. 4280. 4280. 4280. 6401. 6401. 5523.
ACETY-01 0. 0. 0. 0. 0. 0. 0. 0.
ETHYL-01 75179. 64074. 64074. 64074. 64074. 14468. 14468. 3632.
ETHAN-01 15026. 12119. 12119. 12119. 12119. 0. 0. 0.
PROPY-01 1035. 1827. 1827. 1827. 1827. 0. 0. 0.
PROPA-01 176. 555. 555. 555. 555. 0. 0. 0.
1-BUT-01 1. 2319. 2319. 2319. 2319. 0. 0. 0.
2-MET-01 0. 0. 0. 0. 0. 0. 0. 0.
OIL 0. 0. 0. 0. 0. 0. 0. 0.
WATER 0. 0. 0. 0. 0. 0. 0. 0.
SODIU-01 0. 0. 0. 0. 0. 0. 0. 0.
VolFlow cuft/hr 28863.16 54844.91 40795.31 24273.22 51569.21 25337.56 19672.02 19318.37 Enthalpy MMBtu/hr 37.27 26.12 19.79 7.54 24.85 -5.59 -8.84 -12.51

Page 34 of 135
Table 1B: Alternative Ethylene from Ethane Production Process Technology – Stream Tables – Cont’d
Stream ID PURIFICA.
->28C PURIFICA.
->28D PURIFICA.
->28E PURIFICA.
->28F PURIFICA.
->29 PURIFICA.
->30 PURIFICA.-
>30A PURIFICA.-
>30B
Temperature F -214.00 -214.00 -214.00 -147.50 20.48 7.43 8.48 7.47
Pressure psi 465.00 465.00 465.00 465.00 465.00 390.00 390.00 390.00
Vapor Frac 0.92 1.00 0.00 0.00 0.00 1.00 1.00 1.00 MoleFlow lbmol/hr 2685. 2474. 211. 447. 2785. 2697. 3217. 2706.
MassFlow lb/hr 13613. 8802. 4811. 11728. 80825. 76623. 91554. 76866.
H2 4459. 4452. 6. 13. 0. 0. 0. 0.
METHA-01 5523. 4151. 1372. 878. 129. 129. 136. 129.
ACETY-01 0. 0. 0. 0. 0. 0. 0. 0.
ETHYL-01 3632. 199. 3433. 10837. 63876. 63705. 75179. 63876.
ETHAN-01 0. 0. 0. 0. 12119. 12056. 15026. 12119.
PROPY-01 0. 0. 0. 0. 1827. 638. 1035. 639.
PROPA-01 0. 0. 0. 0. 555. 94. 176. 102.
1-BUT-01 0. 0. 0. 0. 2319. 0. 1. 0.
2-MET-01 0. 0. 0. 0. 0. 0. 0. 0.
OIL 0. 0. 0. 0. 0. 0. 0. 0.
WATER 0. 0. 0. 0. 0. 0. 0. 0.
SODIU-01 0. 0. 0. 0. 0. 0. 0. 0.
VolFlow cuft/hr 14128.64 13981.56 147.07 353.65 3253.48 23484.05 28115.11 23560.12 Enthalpy MMBtu/hr -14.77 -13.22 -1.55 3.67 22.89 32.22 37.07 32.27
Stream ID PURIFICA.
->30C PURIFICA.
->31 PURIFICA.
->31A PURIFICA.
->32 PURIFICA.
->RFXA PURIFICA.
->RFXB1 REFRIGER.
->24G REFRIGER.
->33
Temperature F 7.47 100.00 196.10 -25.42 7.47 -168.40 -146.23 -214.35
Pressure psi 390.00 390.00 390.00 270.00 390.00 465.00 19.00 76.00
Vapor Frac 0.84 0.00 0.00 1.00 0.00 0.00 0.13 1.00 MoleFlow lbmol/hr 3217. 80. 80. 2277. 511. 659. 1650. 1427.
MassFlow lb/hr 91554. 3959. 3959. 63771. 14688. 16539. 46300. 22900.
H2 0. 0. 0. 0. 0. 20. 0. 0.
METHA-01 136. 0. 0. 129. 7. 2250. 0. 22900.
ACETY-01 0. 0. 0. 0. 0. 0. 0. 0.
ETHYL-01 75179. 0. 0. 63641. 11303. 14270. 46300. 0.
ETHAN-01 15026. 0. 0. 0. 2908. 0. 0. 0.
PROPY-01 1035. 1187. 1187. 0. 396. 0. 0. 0.
PROPA-01 176. 454. 454. 0. 74. 0. 0. 0.
1-BUT-01 1. 2318. 2318. 0. 1. 0. 0. 0.
2-MET-01 0. 0. 0. 0. 0. 0. 0. 0.
OIL 0. 0. 0. 0. 0. 0. 0. 0.
WATER 0. 0. 0. 0. 0. 0. 0. 0.
SODIU-01 0. 0. 0. 0. 0. 0. 0. 0.
VolFlow cuft/hr 24130.69 118.68 145.57 29619.78 570.57 502.98 38269.09 44195.00 Enthalpy MMBtu/hr 35.23 -0.82 -0.54 47.30 2.97 2.12 25.51 -49.30

Page 35 of 135
Table 1B: Alternative Ethylene from Ethane Production Process Technology – Stream Tables – Cont’d
Stream ID REFRIGER
.->33A REFRIGER
.->33B REFRIGER
.->33C REFRIGER
.->33D REFRIGER
.->33E REFRIGER
.->33F REFRIGER
.->34 REFRIGER
.->34A
Temperature F -214.35 -214.35 -214.35 -214.35 -130.00 29.88 -147.96 -147.96
Pressure psi 76.00 76.00 76.00 76.00 600.00 600.00 18.00 18.00
Vapor Frac 0.00 1.00 1.00 0.51 0.00 1.00 0.97 0.96 MoleFlow lbmol/hr 700. 700. 727. 1427. 1427. 1427. 1650. 1426.
MassFlow lb/hr 11231. 11231. 11669. 22900. 22900. 22900. 46300. 39999.
H2 0. 0. 0. 0. 0. 0. 0. 0.
METHA-01 11231. 11231. 11669. 22900. 22900. 22900. 0. 0.
ACETY-01 0. 0. 0. 0. 0. 0. 0. 0.
ETHYL-01 0. 0. 0. 0. 0. 0. 46300. 39999.
ETHAN-01 0. 0. 0. 0. 0. 0. 0. 0.
PROPY-01 0. 0. 0. 0. 0. 0. 0. 0.
PROPA-01 0. 0. 0. 0. 0. 0. 0. 0.
1-BUT-01 0. 0. 0. 0. 0. 0. 0. 0.
2-MET-01 0. 0. 0. 0. 0. 0. 0. 0.
OIL 0. 0. 0. 0. 0. 0. 0. 0.
WATER 0. 0. 0. 0. 0. 0. 0. 0.
SODIU-01 0. 0. 0. 0. 0. 0. 0. 0.
VolFlow cuft/hr 471.30 21672.93 22522.06 22993.37 1540.04 11299.22 286696.24 246356.55 Enthalpy MMBtu/hr -26.43 -24.18 -25.12 -51.56 -51.56 -46.81 33.50 28.90
Stream ID REFRIGER
.->34B REFRIGER
.->34C REFRIGER
.->34D REFRIGER
.->34E REFRIGER
.->34F REFRIGER
.->34H REFRIGER
.->34J REFRIGER
.->35A
Temperature F -147.96 -147.96 -147.96 -147.96 -147.96 -1.24 -147.96 -100.23
Pressure psi 18.00 18.00 18.00 18.00 18.00 80.00 18.00 65.00
Vapor Frac 0.97 1.00 0.00 0.00 0.00 1.00 0.96 0.00 MoleFlow lbmol/hr 575. 225. 575. 851. 1426. 1650. 851. 1650.
MassFlow lb/hr 16120. 6301. 16120. 23880. 39999. 46300. 23880. 46300.
H2 0. 0. 0. 0. 0. 0. 0. 0.
METHA-01 0. 0. 0. 0. 0. 0. 0. 0.
ACETY-01 0. 0. 0. 0. 0. 0. 0. 0.
ETHYL-01 16120. 6301. 16120. 23880. 39999. 46300. 23880. 46300.
ETHAN-01 0. 0. 0. 0. 0. 0. 0. 0.
PROPY-01 0. 0. 0. 0. 0. 0. 0. 0.
PROPA-01 0. 0. 0. 0. 0. 0. 0. 0.
1-BUT-01 0. 0. 0. 0. 0. 0. 0. 0.
2-MET-01 0. 0. 0. 0. 0. 0. 0. 0.
OIL 0. 0. 0. 0. 0. 0. 0. 0.
WATER 0. 0. 0. 0. 0. 0. 0. 0.
SODIU-01 0. 0. 0. 0. 0. 0. 0. 0.
VolFlow cuft/hr 100136.34 40339.69 453.45 671.73 1125.17 96155.52 146220.21 1422.76 Enthalpy MMBtu/hr 11.67 4.60 8.43 12.48 20.91 35.77 17.22 25.51

Page 36 of 135
Table 1B: Alternative Ethylene from Ethane Production Process Technology – Stream Tables – Cont’d
Stream ID REFRIGER
.->35B REFRIGER
.->35C REFRIGER
.->35D REFRIGER
.->35E REFRIGER
.->35F REFRIGER
.->35G REFRIGER
.->35H REFRIGER
.->35I
Temperature F -100.23 -100.23 -100.23 -100.23 -100.23 -18.00 -100.23 -71.99
Pressure psi 65.00 65.00 65.00 65.00 65.00 310.00 65.00 65.00
Vapor Frac 0.00 1.00 1.00 1.00 0.00 0.00 0.31 1.00 MoleFlow lbmol/hr 2305. 2305. 1748. 4053. 3955. 5703. 5703. 5703.
MassFlow lb/hr 64661. 64661. 49039. 113700. 110961. 160000. 160000. 160000.
H2 0. 0. 0. 0. 0. 0. 0. 0.
METHA-01 0. 0. 0. 0. 0. 0. 0. 0.
ACETY-01 0. 0. 0. 0. 0. 0. 0. 0.
ETHYL-01 64661. 64661. 49039. 113700. 110961. 160000. 160000. 160000.
ETHAN-01 0. 0. 0. 0. 0. 0. 0. 0.
PROPY-01 0. 0. 0. 0. 0. 0. 0. 0.
PROPA-01 0. 0. 0. 0. 0. 0. 0. 0.
1-BUT-01 0. 0. 0. 0. 0. 0. 0. 0.
2-MET-01 0. 0. 0. 0. 0. 0. 0. 0.
OIL 0. 0. 0. 0. 0. 0. 0. 0.
WATER 0. 0. 0. 0. 0. 0. 0. 0.
SODIU-01 0. 0. 0. 0. 0. 0. 0. 0.
VolFlow cuft/hr 1986.99 124823.76 94695.95 219519.72 3409.75 6292.99 98107.88 339575.42 Enthalpy MMBtu/hr 35.62 47.87 36.31 84.18 61.13 97.44 97.44 119.95
Stream ID REFRIGER
.->35J REFRIGER
.->36A REFRIGER
.->36B REFRIGER
.->36D REFRIGER
.->36F REFRIGER
.->36G REFRIGER
.->36H REFRIGER
.->36I
Temperature F 120.00 -38.68 -47.60 -47.60 -47.60 -47.60 -40.95 -40.47
Pressure psi 310.00 17.00 17.00 17.00 17.00 17.00 17.00 17.00
Vapor Frac 1.00 1.00 1.00 0.00 0.00 0.00 1.00 1.00 MoleFlow lbmol/hr 5703. 3921. 1768. 5780. 9701. 3921. 11470. 5780.
MassFlow lb/hr 160000. 165000. 74412. 243238. 408238. 165000. 482650. 243238.
H2 0. 0. 0. 0. 0. 0. 0. 0.
METHA-01 0. 0. 0. 0. 0. 0. 0. 0.
ACETY-01 0. 0. 0. 0. 0. 0. 0. 0.
ETHYL-01 160000. 0. 0. 0. 0. 0. 0. 0.
ETHAN-01 0. 0. 0. 0. 0. 0. 0. 0.
PROPY-01 0. 165000. 74412. 243238. 408238. 165000. 482650. 243238.
PROPA-01 0. 0. 0. 0. 0. 0. 0. 0.
1-BUT-01 0. 0. 0. 0. 0. 0. 0. 0.
2-MET-01 0. 0. 0. 0. 0. 0. 0. 0.
OIL 0. 0. 0. 0. 0. 0. 0. 0.
WATER 0. 0. 0. 0. 0. 0. 0. 0.
SODIU-01 0. 0. 0. 0. 0. 0. 0. 0.
VolFlow cuft/hr 102996.51 1008819.3
0 444426.97 6353.31 10663.07 4309.76 2933559.6
1 1480254.7
0 Enthalpy MMBtu/hr 129.13 26.51 11.75 -7.64 -12.82 -5.18 77.21 38.95

Page 37 of 135
Table 1B: Alternative Ethylene from Ethane Production Process Technology – Stream Tables – Cont’d
Stream ID REFRIGER
.->36K REFRIGER
.->36L REFRIGER
.->36M REFRIGER
.->36Z REFRIGER
.->37A REFRIGER
.->37B REFRIGER
.->37C REFRIGER
.->37D
Temperature F -47.60 6.27 66.62 -47.60 6.27 6.27 6.27 6.27
Pressure psi 17.00 54.00 54.00 17.00 54.00 54.00 54.00 54.00
Vapor Frac 0.15 0.00 1.00 0.11 0.00 0.36 1.00 0.00 MoleFlow lbmol/hr 11470. 11470. 11470. 5780. 773. 773. 3772. 12242.
MassFlow lb/hr 482650. 482650. 482650. 243238. 32522. 32522. 158747. 515172.
H2 0. 0. 0. 0. 0. 0. 0. 0.
METHA-01 0. 0. 0. 0. 0. 0. 0. 0.
ACETY-01 0. 0. 0. 0. 0. 0. 0. 0.
ETHYL-01 0. 0. 0. 0. 0. 0. 0. 0.
ETHAN-01 0. 0. 0. 0. 0. 0. 0. 0.
PROPY-01 482650. 482650. 482650. 243238. 32522. 32522. 158747. 515172.
PROPA-01 0. 0. 0. 0. 0. 0. 0. 0.
1-BUT-01 0. 0. 0. 0. 0. 0. 0. 0.
2-MET-01 0. 0. 0. 0. 0. 0. 0. 0.
OIL 0. 0. 0. 0. 0. 0. 0. 0.
WATER 0. 0. 0. 0. 0. 0. 0. 0.
SODIU-01 0. 0. 0. 0. 0. 0. 0. 0.
VolFlow cuft/hr 455100.24 13644.65 1132657.9
9 165521.71 919.39 24257.94 321240.72 14564.05 Enthalpy MMBtu/hr -1.07 -1.07 93.45 -2.57 -0.07 1.96 27.28 -1.14
Stream ID REFRIGER
.->37E REFRIGER
.->37F REFRIGER
.->37G REFRIGER
.->37H REFRIGER
.->37K REFRIGER
.->37KB REFRIGER
.->37N REFRIGER
.->37O
Temperature F 6.27 35.14 120.00 120.00 57.72 57.72 6.27 6.27
Pressure psi 54.00 54.00 128.00 128.00 128.00 128.00 54.00 54.00
Vapor Frac 0.89 1.00 1.00 1.00 0.14 0.31 0.31 0.18 MoleFlow lbmol/hr 4545. 16015. 16015. 7129. 7129. 7129. 7129. 8886.
MassFlow lb/hr 191269. 673919. 673919. 300000. 300000. 300000. 300000. 373919.
H2 0. 0. 0. 0. 0. 0. 0. 0.
METHA-01 0. 0. 0. 0. 0. 0. 0. 0.
ACETY-01 0. 0. 0. 0. 0. 0. 0. 0.
ETHYL-01 0. 0. 0. 0. 0. 0. 0. 0.
ETHAN-01 0. 0. 0. 0. 0. 0. 0. 0.
PROPY-01 191269. 673919. 673919. 300000. 300000. 300000. 300000. 373919.
PROPA-01 0. 0. 0. 0. 0. 0. 0. 0.
1-BUT-01 0. 0. 0. 0. 0. 0. 0. 0.
2-MET-01 0. 0. 0. 0. 0. 0. 0. 0.
OIL 0. 0. 0. 0. 0. 0. 0. 0.
WATER 0. 0. 0. 0. 0. 0. 0. 0.
SODIU-01 0. 0. 0. 0. 0. 0. 0. 0.
VolFlow cuft/hr 345498.65 1469033.6
0 697709.90 310590.64 45923.78 87484.91 192196.05 143608.67 Enthalpy MMBtu/hr 29.24 122.70 140.96 62.75 15.36 23.00 15.36 10.78

Page 38 of 135
Table 1B: Alternative Ethylene from Ethane Production Process Technology – Stream Tables – Cont’d
Stream ID REFRIGER
.->37P REFRIGER
.->38A REFRIGER
.->38B REFRIGER
.->38C REFRIGER
.->38D REFRIGER
.->38E REFRIGER
.->38F REFRIGER
.->38G
Temperature F 6.27 120.00 84.36 150.00 90.00 57.72 57.72 57.72
Pressure psi 54.00 128.00 128.00 270.00 270.00 128.00 128.00 128.00
Vapor Frac 0.24 1.00 1.00 1.00 0.00 0.14 0.00 1.00 MoleFlow lbmol/hr 16015. 8886. 11335. 11335. 11335. 11335. 9772. 1564.
MassFlow lb/hr 673919. 373919. 477000. 477000. 477000. 477000. 411192. 65808.
H2 0. 0. 0. 0. 0. 0. 0. 0.
METHA-01 0. 0. 0. 0. 0. 0. 0. 0.
ACETY-01 0. 0. 0. 0. 0. 0. 0. 0.
ETHYL-01 0. 0. 0. 0. 0. 0. 0. 0.
ETHAN-01 0. 0. 0. 0. 0. 0. 0. 0.
PROPY-01 673919. 373919. 477000. 477000. 477000. 477000. 411192. 65808.
PROPA-01 0. 0. 0. 0. 0. 0. 0. 0.
1-BUT-01 0. 0. 0. 0. 0. 0. 0. 0.
2-MET-01 0. 0. 0. 0. 0. 0. 0. 0.
OIL 0. 0. 0. 0. 0. 0. 0. 0.
WATER 0. 0. 0. 0. 0. 0. 0. 0.
SODIU-01 0. 0. 0. 0. 0. 0. 0. 0.
VolFlow cuft/hr 335804.76 387119.14 450913.58 218822.51 16062.68 70414.37 12847.60 57566.78 Enthalpy MMBtu/hr 26.14 78.21 92.78 100.81 23.95 23.95 11.85 12.10
Stream ID REFRIGER
.->38H REFRIGER
.->38J REFRIGER
.->38K REFRIGER
.->38L
Temperature F 57.72 57.72 57.72 57.72
Pressure psi 128.00 128.00 128.00 128.00
Vapor Frac 0.73 0.00 0.24 0.00 MoleFlow lbmol/hr 2450. 886. 886. 8886.
MassFlow lb/hr 103081. 37273. 37273. 373919.
H2 0. 0. 0. 0.
METHA-01 0. 0. 0. 0.
ACETY-01 0. 0. 0. 0.
ETHYL-01 0. 0. 0. 0.
ETHAN-01 0. 0. 0. 0.
PROPY-01 103081. 37273. 37273. 373919.
PROPA-01 0. 0. 0. 0.
1-BUT-01 0. 0. 0. 0.
2-MET-01 0. 0. 0. 0.
OIL 0. 0. 0. 0.
WATER 0. 0. 0. 0.
SODIU-01 0. 0. 0. 0.
VolFlow cuft/hr 66358.13 1164.59 8791.35 11683.01 Enthalpy MMBtu/hr 14.57 1.07 2.48 10.78

Page 39 of 135
Figure 1A – Alternative Ethylene – part 1
HIERARCHY
COMPRESS
HIERARCHY
CRACKING
HIERARCHY
PURIFICA
HIERARCHY
REFRIGER
1015
16
17
27
207
2
306-8309-11312 302-5
320-2323317
313

Page 40 of 135
Figure 1B – Alternative Ethylene – part 2
17
17(IN)
16
16(IN)
1515(IN)
2
2(IN)
10
10(OUT)
6
7A
4A
4
3
5
6A
9C
9F
STM2LIQ13A
18
1
2A
E-113
9-OUT
4B
WA-OUT
7A1 7-OUT
8B
VP10C10Z
10-OUT
LIQ11
LIQ
LOST-OIL
11ZZ
STM
VAP
W1
VAP10
7-IN
OIL
12
OIL2
LO-EFF
EF-VAP
WA-IN
COND-IN
COND-OUT
7A2
7A2-1
WA-OUT2 STM-OUT2 WA-IN2
F-101-9
E-115
E-114
E-113-1
E-113-2
P-101
E-101-9
SEP-10
V-SEP2
SPL-OIL
C-102
FSP-11
E-110A
C-101
MIX-OIL
ZE-EFF1
ZE-EFF3
E-BFW
E-LPSTM
R-101SEP
MIX-10
E-101-9BE-BFW2
F-101-9T hermal Cracking Furnance
E-101-109T ransfer Furnace
C-101Gasoline Fract ionat or
C-102Dissolved Gas St ripper
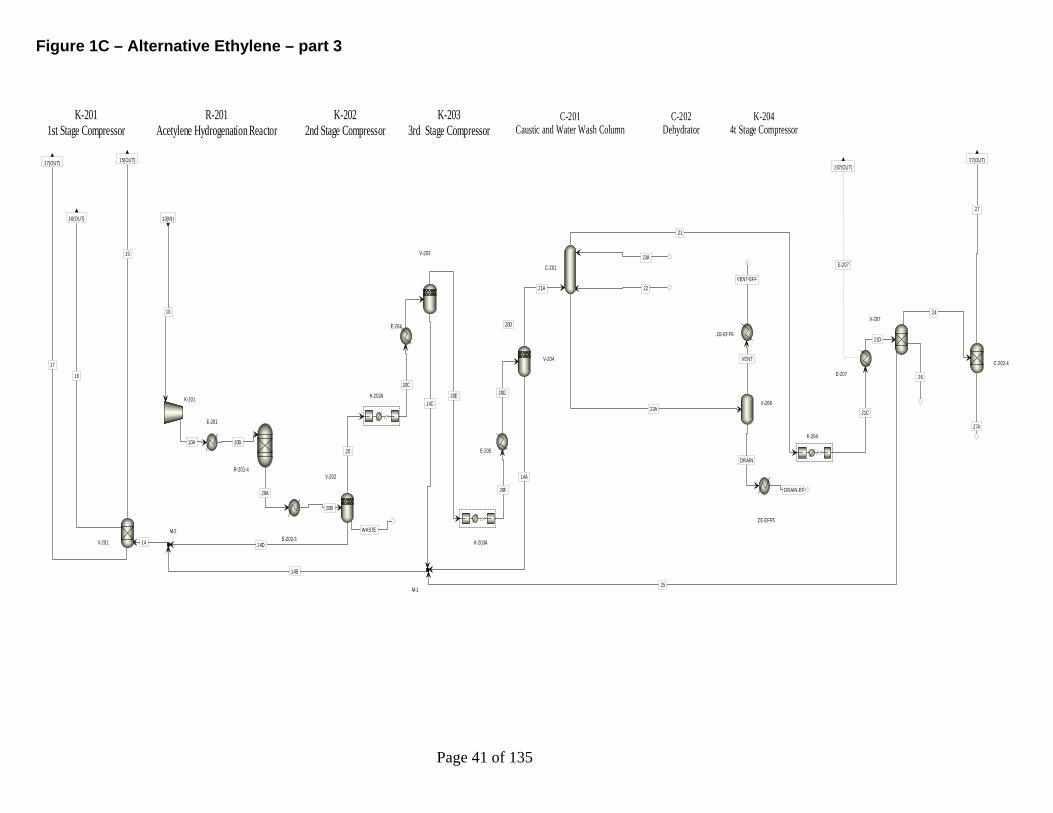
Page 41 of 135
Figure 1C – Alternative Ethylene – part 3
10
10(IN)
15
15(OUT)
16
16(OUT)
17
17(OUT)
27
27(OUT)
E-207
207(OUT)
10A 10B
20A
20B
20C
20D
20G
14A
21A
20F
14C
25
14B
14D14
22A
VENT
DRAIN
21C
21D
24
27A
20E
26
20
WASTE
21
23A
22
DRAIN-EF
VENT-EFF
E-201
R-201-4
E-202-3
E-204
V-204
E-205
M-1
M-2
V-206
E-207
C-202-4
V-203
V-201
V-207
V-202
K-204
K-202A
K-203A
C-201
K-201
ZE-EFF5
ZE-EFF6
K-2011st Stage Compressor
R-201Acetylene Hydrogenation Reactor
K-2022nd Stage Compressor
K-2033rd Stage Compressor
C-201Caustic and Water Wash Column
C-202Dehydrator
K-2044t Stage Compressor

Page 42 of 135
Figure 1D – Alternative Ethylene – part 4
2727(IN)
E-306-8
306-8(OUT)
E-309-11
309-11(OUT)
E-312
312(OUT)
E-302-5
302-5(OUT)
E-320-2
320-2(OUT)
E-323
323(OUT)
E-317
317(OUT)
2 2(OUT)
E-313
313(OUT)
27C
27A
27B
RFXB1
29
28
RFXA
31A
30A
30
32
2A
31
28A
28B
28F
28C
28D
28E
3
30C
2B
30B
E-302-5
E-306-8
C-301
C-302
C-303
E-319
V-301
V-302
E-309-11
E-312
M-1
E-317
E-314-16
E-301A
DRUM
C-301Demethanator
C-302Dethanator
C-303Ethylene Column

Page 43 of 135
Figure 1E – Alternative Ethylene – part 5
E-306-8
306-8(IN)
E-312
312(IN)
E-309-11
309-11(IN)
E-302-5
302-5(IN)
E-320-2
320-2(IN)
E-317
317(IN)
E-207
207(IN)
E-313
313(IN)
E-323
323(IN)
33A
33B
33C
33
34D
34B
34J
34A 34C
34
34F34E
35B
35C
35F35A
35D
35E
34H
35I
33E
33D
24G
35G
35H
36D
36Z
37A
37B
38J
38K
37H
37KB
36B
36A
36I
36H
37C
37E
38G
38H
36F
36G
37D
36L
38F38L
38C
38D
38E
37O
37G
38A
37K
37N
38B
36K
36M37F
37P
35J
33F
E-312
M-1
E-309-11
M-2M-3
S-1
E-306-8
S-2
M-4
M-5
V-1V-2
V-3
E-320-2
E-317
E-207
E-313
M-7 M-8M-9
S-3
S-4
S-5
E-404-10
V-7V-6
S-6
V-5
M-10
V-4
M-11
V-401
V-402V-403
V-404 V-405V-406
M-15
E-402-3B
E-402-3A
E-401A
E-401B
K-401A
K-403A
K-404A
K-405A
K-406A
E-320-2B
E-313B
K-402A

Page 44 of 135
Figure 1F – Base Case Ethylene – part 1
HIERARCHY
COMPRESS
HIERARCHY
CRACKING
HIERARCHY
PURIFICA
HIERARCHY
REFRIGER
1015
16
17
27
207
2
306-8309-11 312 302-5
320-2323317
313

Page 45 of 135
Figure 1G – Base Case Ethylene – part 2
17
17( IN)
16( IN)
1515( IN)
2
2(IN)
10
10(OUT)
6
7A
4A
4
3
5
6A
9F
LIQ13A
18
1
2A
E-113
9-OUT
4B
WA-OUT
7-OUT
8B
VP10C
10Z
LIQ11
LIQ
11ZZ
STM
VAP
W1
VAP10
7-IN
OIL
12
OIL2
LO-EFF
EF-VAP
WA-IN
COND-IN
COND-OUT
F-101-9
E-115
E-114
E-113-1
E-113-2
P-101
E-101-9
SEP-10
V-SEP2
SPL-OIL
C-102
FSP-11
E-110A
C-101
MIX-OIL
ZE-EFF1
ZE-EFF3
E-BFW
E-LPSTM
F-101-9Thermal Cracking Furnance
E-101-109Transfer Furnace
C-101Gasoline Fract ionator
C-102Disso lved Gas St ripper

Page 46 of 135
Figure 1H – Base Case Ethylene – part 3
10
10(IN)
15
15(OUT)
16
16(OUT)
17
17(OUT)
27
27(OUT)
E-207
207(OUT)
10B
20B
20C20G
14A
21A
20F
14C
25
14B
14D14
22A
VENT
DRAIN
21C
24
27A
20E
26
20
WASTE
21
23A
22
DRAIN-EF
VENT- EFF
E-201
R-201-4
E-202-3
E-204
V-204
E-205
M-1
M-2
V-206
E-207C-202-4
V-203
V-201
V-207
V-202
K-204
K-202A
K-203A
C-201
K-201
ZE-EFF5
ZE-EFF6
K-2011st Stage Compressor
R-201Acetylene Hydrogenation Reactor
K-2022nd Stage Compressor
K-2033rd Stage Comp ressor
C-201Caustic and Water Wash Column
C-202Dehydrator
K-2044t Stage Compressor

Page 47 of 135
Figure 1I – Base Case Ethylene – part 4
2727(I N)
E-306-8
306-8(OUT)
E-309-11
309-11(OUT)
E-312
312(OUT)
E-302-5
302-5(OUT)
E-320-2
320-2(OUT)
E-323
323(OUT)
E-317
317(OUT)
2 2(OUT)
E-313
313(OUT)
27C
27A
27B
RFXB
29
28
RFXA
31A
30A 30
32
2A
31
28A
28B
28F
28C 28D
28E
RFXB1
3
30C
2B
30B
E-302-5
E-306-8
C-301
C-302
C-303
E-319
V-301
V-302
E-309-11
E-312
M-1
E-317
E-314-16
E-301A
DRUM
C-301Demethanator
C-302Dethanator
C-303Ethylene Column

Page 48 of 135
Figure 1J – Base Case Ethylene – part 5
E-306-8
306-8( IN)
E-312
312( IN)
E-309-11
309-11( IN)
E-302-5
302-5( IN)
E-320-2
320-2( IN)
E-317
317( IN)
E-207
207( IN)
E-313
313( IN)
E-323
323( IN)
33A
33B
33C
33
34D
34B
34J
34A 34C
34
34F34E
35C
35F35A
35D
35E
34H
35I
33E
33D
35G
35H
36D
36Z
37A
37B
38J
38K
37H
37KB
36B
36A
36I
36H
37C
37E
38G
38H
36F
36G
37D
36L
38F38L
38C
38D
38E
37O
37G
38A
37K
37N
38B
36K
36M37F
37P
35J
33F
E-312
M-1
E-309-11
M-2 M-3
S-1
E-306-8
S-2
M-4
M-5
V-1V-2
V-3
E-320-2
E-317
E-207
E-313
M-7M-8
M-9
S-3
S-4
S-5
E-404-10
V-7V-6
S-6
V-5
M-10
V-4
M-11
V-401
V-402
V-403
V-404 V-405V-406
M-15
E-402-3B
E-402-3A
E-401A
E-401B
K-401A
K-403A
K-404A
K-405A
K-406A
E-320-2B
E-313B
K-402A
K-401Methane Compressor
K-402Ethylene Compres sor
K-403Ethylene Compres sor
K-404Propylene Compressor
K-205Proplene Compres sor
K-406Propylene Compressor

Page 49 of 135
Appendix 2 – Chlorine-Caustic Soda Table 2A: Alternative Chlorine-Caustic Production Process Technology – Energy and Exergy Loss Profile
Energy Loss Exergy Loss = =
Unit OP Type Btu/lb Btu/lb
Total Total
External Total
Internal Total = = = =
1,505 % 124 6,243 6,367 %
BRINE BRINE..M-2-4 Salt Washer 0 0 0 0 0 -0.01 BRINE..S-1 Reactor Settler 1 0.06 0 1 1 0.02 BRINE..S-2 Mud Separator 0 0 0 0 0 0 BRINE..E-1 Water Heater 0 0 0 1 1 0.01 BRINE..M-6A Dissolver2 0 0 0 0 0 0 BRINE..DISSOLVE Dissolve1 0 0.02 0 0 0 0 BRINE..MIX4 Mixer 0 0 0 19 19 0.29 BRINE..M-6 Dissolver 867 57.6 43 3 46 0.72
BRINE..T-9 Ph Adjusting Tank 0 0 0 2 2 0.03
ELECTROLYSIS ELECTROL..E-201 Heater 0 0 0 0 0 0 ELECTROL..NACL-H2O
Electrolysis Cell #1 0 0 0 557 557 8.74
ELECTROL..C-PROD
Electrolysis Cell #1 0 0 0 5,306 5,306 83.33
ELECTROL..SEP-N Separator 408 27.09 63 0 63 1 ELECTROL..V-201 Flash Drum 0 0 0 34 34 0.54 ELECTROL..S-V202 Flash Drum 0 0 0 0 0 0 ELECTROL..K-201 Compressor 0 0 0 30 30 0.47 ELECTROL..MIX-24 Mixer 0 0 0 1 1 0.01 ELECTROL..MIX-22 Mixer 0 0 0 27 27 0.43 ELECTROL..S-301 Separator 0 0 0 77 77 1.21 ELECTROL..S-302 Separator 0 0 0 0 0 0 ELECTROL..E-S301 Heater 0 -0.01 0 1 1 0.01 ELECTROL..E-S302 Heater 0 0 0 0 0 0 ELECTROL..E-302 Heater 0 0 0 21 21 0.33 ELECTROL..MIX-17 Mixer 0 -0.01 0 0 0 0 ELECTROL..P-20 Pump 0 0 0 5 5 0.08 ELECTROL..E-STEAM Heater 0 0 0 0 0 0

Page 50 of 135
Table 2A: Alternative Chlorine-Caustic Production Process Technology – Energy and Exergy Loss Profile (Cont’d)
Energy Loss Exergy Loss = =
Unit OP Type Btu/lb Btu/lb
Total Total
External Total
Internal Total = = = =
1,505 % 124 6,243 6,367 %
GAS TREATMENT GASTREAT..C-5 Drying Column 5 0.32 0 0 1 0.01
GASTREAT..K-1 Chlorine Compressor 0 0 0 6 6 0.09
GASTREAT..C-6 Washing Column 0 0 0 1 1 0.01
GASTREAT..E-9 Refrigerated Condenser 191 12.71 12 33 45 0.71
GASTREAT..V-4 Flash Drum 0 0 0 0 0 0 GASTREAT..S-1 Mixer 0 0 0 0 0 0 GASTREAT..C-4 Drying Column 2 0.16 0 0 0 0 GASTREAT..C-2 Cooling Column 0 0.01 0 104 104 1.64
GASTREAT..C-3
Chlorine Stripping Column 0 0 0 6 6 0.09
GASTREAT..K-3 Compressor 0 0 0 0 0 0 GASTREAT..C-7A Absorption 0 0 0 4 4 0.06 GASTREAT..C-1 Cooling Column 0 0 0 6 6 0.1 GASTREAT..E-23-1 E-23-1 29 1.95 5 0 5 0.08 GASTREAT..K-2 K-2 1 0.07 0 0 0 0.01

Page 51 of 135
Table 2B: Alternative Chlorine-Caustic Production Process Technology – Stream Tables
Stream ID BRINE.-
>1 BRINE.-
>2 BRINE.-
>3 BRINE.-
>4 BRINE.-
>4A BRINE.-
>5-1 BRINE.-
>5-2 BRINE.-
>5-3
Temperature F 65.00 65.00 64.99 64.99 146.77 65.00 65.00 65.00
Pressure psi 14.70 14.70 14.70 14.70 14.70 14.70 14.70 14.70
Vapor Frac 0.00 0.00 0.00 0.00 0.00 0.00 0.00 0.00 MoleFlow lbmol/hr 354. 50. 45. 359. 6375. 6369. 6370. 6379.
MassFlow lb/hr 18738. 900. 897. 18741. 139342. 139086. 139086. 139342.
H2O 954. 900. 800. 1054. 103161. 103011. 103011. 103161.
NACL 0. 0. 0. 0. 0. 0. 0. 0.
CASO4 0. 0. 0. 0. 0. 0. 0. 0.
MGSO4 0. 0. 0. 0. 0. 0. 0. 0.
NAOH 0. 0. 0. 0. 0. 0. 0. 0.
NA2CO3 0. 0. 0. 0. 0. 0. 0. 0.
MGOH2 0. 0. 0. 0. 0. 0. 0. 0.
CACO3 0. 0. 0. 0. 0. 0. 0. 0.
HCL 0. 0. 0. 0. 0. 0. 0. 0.
CO2 0. 0. 0. 0. 0. 0. 0. 0.
H2 0. 0. 0. 0. 0. 0. 0. 0.
CL2 0. 0. 0. 0. 0. 0. 0. 0.
H2SO4 0. 0. 0. 0. 0. 0. 0. 0.
MG++ 0. 0. 0. 0. 0. 0. 2. 0.
CA++ 0. 0. 0. 0. 0. 0. 5. 0.
NA+ 8. 0. 0. 8. 816. 910. 910. 910.
H+ 0. 0. 0. 0. 0. 0. 0. 0.
MGOH+ 0. 0. 0. 0. 0. 0. 0. 0.
NASO4(S) 285. 0. 70. 215. 430. 430. 430. 430.
MGSO4(S) 38. 0. 27. 11. 11. 11. 0. 11.
CASO4(S) 73. 0. 0. 73. 73. 17. 0. 73.
NACL(S) 17368. 0. 0. 17368. 33594. 33304. 33304. 33354.
CACO3(S) 0. 0. 0. 0. 0. 0. 0. 0.
NA2CO(S) 0. 0. 0. 0. 0. 0. 0. 0.
MGOH2(S) 0. 0. 0. 0. 0. 0. 0. 0.
CL- 12. 0. 0. 12. 1198. 1344. 1344. 1344.
SO4-- 0. 0. 0. 0. 21. 21. 42. 21.
CO3-- 0. 0. 0. 0. 38. 38. 38. 38.
OH- 0. 0. 0. 0. 0. 0. 0. 0.
N2 0. 0. 0. 0. 0. 0. 0. 0.
O2 0. 0. 0. 0. 0. 0. 0. 0.
VolFlow cuft/hr 15.40 14.44 12.83 17.00 1693.51 1662.66 1662.67 1665.07 Enthalpy MMBtu/hr -126.64 -6.15 -6.13 -126.79 -931.28 -939.43 -939.35 -941.17

Page 52 of 135
Table 2B: Alternative Chlorine-Caustic Production Process Technology – Stream Tables - Cont’d
Stream ID BRINE.-
>6 BRINE.-
>7 BRINE.-
>8 BRINE.-
>8-1 BRINE.-
>9 BRINE.-
>9-2 BRINE.-
>27A BRINE.-
>29
Temperature F 65.00 65.00 65.00 65.00 65.10 65.00 176.00 65.00
Pressure psi 14.70 14.70 14.70 14.70 14.70 14.70 14.70 14.70
Vapor Frac 0.00 0.00 0.00 0.00 0.00 0.00 0.00 0.00 MoleFlow lbmol/hr 45. 3. 7. 6413. 6420. 6416. 4462. 1555.
MassFlow lb/hr 880. 72. 120. 139893. 140013. 139966. 92594. 28007.
H2O 800. 45. 74. 103766. 103840. 103811. 74100. 28007.
NACL 0. 0. 0. 0. 0. 0. 0. 0.
CASO4 0. 0. 0. 0. 0. 0. 0. 0.
MGSO4 0. 0. 0. 0. 0. 0. 0. 0.
NAOH 0. 0. 0. 0. 0. 0. 0. 0.
NA2CO3 0. 0. 0. 0. 0. 0. 0. 0.
MGOH2 0. 0. 0. 0. 0. 0. 0. 0.
CACO3 0. 0. 0. 0. 0. 0. 0. 0.
HCL 0. 0. 0. 0. 0. 0. 0. 0.
CO2 0. 0. 0. 0. 0. 0. 0. 0.
H2 0. 0. 0. 0. 0. 0. 0. 0.
CL2 0. 0. 0. 0. 0. 0. 0. 0.
H2SO4 0. 0. 0. 0. 0. 0. 0. 0.
MG++ 0. 0. 0. 2. 2. 2. 0. 0.
CA++ 0. 0. 0. 0. 0. 0. 0. 0.
NA+ 0. 0. 0. 945. 945. 945. 808. 0.
H+ 0. 0. 1. 0. 1. 0. 0. 0.
MGOH+ 0. 0. 0. 0. 0. 0. 0. 0.
NASO4(S) 0. 0. 0. 430. 430. 430. 215. 0.
MGSO4(S) 0. 0. 0. 0. 0. 0. 0. 0.
CASO4(S) 0. 0. 0. 0. 0. 0. 0. 0.
NACL(S) 0. 15. 0. 33289. 33289. 33304. 16227. 0.
CACO3(S) 0. 12. 0. 0. 0. 12. 0. 0.
NA2CO(S) 80. 0. 0. 0. 0. 0. 0. 0.
MGOH2(S) 0. 0. 0. 0. 0. 0. 0. 0.
CL- 0. 0. 45. 1344. 1388. 1344. 1186. 0.
SO4-- 0. 0. 0. 42. 42. 42. 21. 0.
CO3-- 0. 0. 0. 76. 76. 76. 38. 0.
OH- 0. 0. 0. 0. 0. 0. 0. 0.
N2 0. 0. 0. 0. 0. 0. 0. 0.
O2 0. 0. 0. 0. 0. 0. 0. 0.
VolFlow cuft/hr 12.83 0.72 1.68 1674.78 1676.39 1675.50 1231.10 449.23 Enthalpy MMBtu/hr -6.02 -0.50 -0.59 -944.70 -945.21 -945.19 -613.77 -191.49

Page 53 of 135
Table 2B: Alternative Chlorine-Caustic Production Process Technology – Stream Tables - Cont’d
Stream ID BRINE.-
>29-1 BRINE.-
>31 ELECTROL.-
>9 ELECTROL.-
>13B ELECTROL.-
>13C ELECTROL.-
>13D ELECTROL.-
>13D-2 ELECTROL.-
>13E
Temperature F 80.00 65.00 65.10 90.32 158.90 159.08 176.00 194.00
Pressure psi 14.70 14.70 14.70 14.70 14.70 14.70 14.70 14.70
Vapor Frac 0.00 0.00 0.00 0.00 0.00 0.00 0.00 0.00 MoleFlow lbmol/hr 1555. 10. 6420. 6420. 6420. 6420. 6420. 8102.
MassFlow lb/hr 28007. 256. 140013. 140013. 140013. 140013. 140013. 159693.
H2O 28007. 150. 103840. 103840. 103840. 103840. 103840. 118169.
NACL 0. 0. 0. 0. 0. 0. 0. 0.
CASO4 0. 0. 0. 0. 0. 0. 0. 0.
MGSO4 0. 0. 0. 0. 0. 0. 0. 0.
NAOH 0. 0. 0. 0. 0. 0. 0. 0.
NA2CO3 0. 0. 0. 0. 0. 0. 0. 0.
MGOH2 0. 0. 0. 0. 0. 0. 0. 0.
CACO3 0. 0. 0. 0. 0. 0. 0. 0.
HCL 0. 0. 0. 0. 0. 0. 0. 0.
CO2 0. 0. 0. 0. 0. 0. 0. 0.
H2 0. 0. 0. 0. 0. 0. 0. 0.
CL2 0. 0. 0. 0. 0. 0. 0. 0.
H2SO4 0. 0. 0. 0. 0. 0. 0. 0.
MG++ 0. 0. 2. 2. 2. 2. 2. 2.
CA++ 0. 0. 0. 0. 0. 0. 0. 0.
NA+ 0. 0. 945. 945. 945. 945. 945. 7669.
H+ 0. 0. 1. 1. 1. 1. 1. 300.
MGOH+ 0. 0. 0. 0. 0. 0. 0. 0.
NASO4(S) 0. 0. 430. 430. 430. 430. 430. 430.
MGSO4(S) 0. 0. 0. 0. 0. 0. 0. 0.
CASO4(S) 0. 56. 0. 0. 0. 0. 0. 0.
NACL(S) 0. 50. 33289. 33289. 33289. 33289. 33289. 16195.
CACO3(S) 0. 0. 0. 0. 0. 0. 0. 0.
NA2CO(S) 0. 0. 0. 0. 0. 0. 0. 0.
MGOH2(S) 0. 0. 0. 0. 0. 0. 0. 0.
CL- 0. 0. 1388. 1388. 1388. 1388. 1388. 11758.
SO4-- 0. 0. 42. 42. 42. 42. 42. 42.
CO3-- 0. 0. 76. 76. 76. 76. 76. 76.
OH- 0. 0. 0. 0. 0. 0. 0. 5051.
N2 0. 0. 0. 0. 0. 0. 0. 0.
O2 0. 0. 0. 0. 0. 0. 0. 0.
VolFlow cuft/hr 450.10 2.41 1676.39 1682.53 1712.82 1712.92 1722.94 2088.56 Enthalpy MMBtu/hr -191.07 -1.75 -945.21 -941.79 -932.49 -932.46 -930.16 -984.77

Page 54 of 135
Table 2B: Alternative Chlorine-Caustic Production Process Technology – Stream Tables - Cont’d
Stream ID ELECTROL.-
>13F ELECTROL.-
>14A ELECTROL.-
>15A ELECTROL.-
>17-OLD ELECTROL.-
>17G1 ELECTROL.-
>17G2 ELECTROL.-
>17N ELECTROL.-
>20
Temperature F 194.00 176.00 194.00 202.45 119.30 123.17 194.00 226.57
Pressure psi 14.70 14.70 14.70 14.70 1.21 1.28 14.70 14.70
Vapor Frac 0.12 0.00 1.00 0.71 1.00 1.00 0.00 0.25 MoleFlow lbmol/hr 7507. 1092. 198. 1213. 675. 116. 1635. 1635.
MassFlow lb/hr 159693. 19680. 1188. 29739. 12165. 2092. 35984. 35984.
H2O 118169. 19680. 887. 19165. 12165. 2092. 24105. 24105.
NACL 0. 0. 0. 0. 0. 0. 0. 0.
CASO4 0. 0. 0. 0. 0. 0. 0. 0.
MGSO4 0. 0. 0. 0. 0. 0. 0. 0.
NAOH 11879. 0. 0. 0. 0. 0. 11879. 11879.
NA2CO3 0. 0. 0. 0. 0. 0. 0. 0.
MGOH2 0. 0. 0. 0. 0. 0. 0. 0.
CACO3 0. 0. 0. 0. 0. 0. 0. 0.
HCL 0. 0. 0. 0. 0. 0. 0. 0.
CO2 0. 0. 0. 0. 0. 0. 0. 0.
H2 301. 0. 301. 0. 0. 0. 0. 0.
CL2 10574. 0. 0. 10574. 0. 0. 0. 0.
H2SO4 0. 0. 0. 0. 0. 0. 0. 0.
MG++ 2. 0. 0. 0. 0. 0. 0. 0.
CA++ 0. 0. 0. 0. 0. 0. 0. 0.
NA+ 841. 0. 0. 0. 0. 0. 0. 0.
H+ 0. 0. 0. 0. 0. 0. 0. 0.
MGOH+ 0. 0. 0. 0. 0. 0. 0. 0.
NASO4(S) 430. 0. 0. 0. 0. 0. 0. 0.
MGSO4(S) 0. 0. 0. 0. 0. 0. 0. 0.
CASO4(S) 0. 0. 0. 0. 0. 0. 0. 0.
NACL(S) 16195. 0. 0. 0. 0. 0. 0. 0.
CACO3(S) 0. 0. 0. 0. 0. 0. 0. 0.
NA2CO(S) 0. 0. 0. 0. 0. 0. 0. 0.
MGOH2(S) 0. 0. 0. 0. 0. 0. 0. 0.
CL- 1184. 0. 0. 0. 0. 0. 0. 0.
SO4-- 42. 0. 0. 0. 0. 0. 0. 0.
CO3-- 76. 0. 0. 0. 0. 0. 0. 0.
OH- 0. 0. 0. 0. 0. 0. 0. 0.
N2 0. 0. 0. 0. 0. 0. 0. 0.
O2 0. 0. 0. 0. 0. 0. 0. 0.
VolFlow cuft/hr 408578.37 324.44 94663.83 412091.31 3475316.42 566922.71 773.65 207710.36 Enthalpy MMBtu/hr -884.71 -132.38 -4.96 -115.73 -70.02 -12.04 -164.93 -156.75

Page 55 of 135
Table 2B: Alternative Chlorine-Caustic Production Process Technology – Stream Tables - Cont’d
Stream ID ELECTROL.->20-1
ELECTROL.->20-2
ELECTROL.->20-3
ELECTROL.->20A
ELECTROL.->21
ELECTROL.->21-1
ELECTROL.->22
ELECTROL.->23
Temperature F 119.30 119.30 123.17 194.03 120.02 123.17 194.00 194.00
Pressure psi 1.21 1.28 1.28 14.70 0.71 1.28 14.70 14.70
Vapor Frac 0.00 0.00 0.11 0.00 0.47 0.00 1.00 0.07 MoleFlow lbmol/hr 1076. 1076. 1076. 1635. 960. 960. 72. 5601.
MassFlow lb/hr 25912. 25912. 25912. 35984. 23820. 23820. 3379. 119143.
H2O 14033. 14033. 14033. 24105. 11940. 11940. 590. 92587.
NACL 0. 0. 0. 0. 0. 0. 0. 0.
CASO4 0. 0. 0. 0. 0. 0. 0. 0.
MGSO4 0. 0. 0. 0. 0. 0. 0. 0.
NAOH 11879. 11879. 11879. 11879. 11879. 11879. 0. 0.
NA2CO3 0. 0. 0. 0. 0. 0. 0. 0.
MGOH2 0. 0. 0. 0. 0. 0. 0. 0.
CACO3 0. 0. 0. 0. 0. 0. 0. 0.
HCL 0. 0. 0. 0. 0. 0. 0. 0.
CO2 0. 0. 0. 0. 0. 0. 0. 0.
H2 0. 0. 0. 0. 0. 0. 0. 0.
CL2 0. 0. 0. 0. 0. 0. 2789. 7785.
H2SO4 0. 0. 0. 0. 0. 0. 0. 0.
MG++ 0. 0. 0. 0. 0. 0. 0. 2.
CA++ 0. 0. 0. 0. 0. 0. 0. 0.
NA+ 0. 0. 0. 0. 0. 0. 0. 841.
H+ 0. 0. 0. 0. 0. 0. 0. 0.
MGOH+ 0. 0. 0. 0. 0. 0. 0. 0.
NASO4(S) 0. 0. 0. 0. 0. 0. 0. 430.
MGSO4(S) 0. 0. 0. 0. 0. 0. 0. 0.
CASO4(S) 0. 0. 0. 0. 0. 0. 0. 0.
NACL(S) 0. 0. 0. 0. 0. 0. 0. 16195.
CACO3(S) 0. 0. 0. 0. 0. 0. 0. 0.
NA2CO(S) 0. 0. 0. 0. 0. 0. 0. 0.
MGOH2(S) 0. 0. 0. 0. 0. 0. 0. 0.
CL- 0. 0. 0. 0. 0. 0. 0. 1184.
SO4-- 0. 0. 0. 0. 0. 0. 0. 42.
CO3-- 0. 0. 0. 0. 0. 0. 0. 76.
OH- 0. 0. 0. 0. 0. 0. 0. 0.
N2 0. 0. 0. 0. 0. 0. 0. 0.
O2 0. 0. 0. 0. 0. 0. 0. 0.
VolFlow cuft/hr 596.08 596.08 567491.04 773.66 3925879.70 562.62 34160.99 166455.85 Enthalpy MMBtu/hr -98.77 -98.77 -96.55 -164.93 -76.26 -84.51 -3.34 -724.71

Page 56 of 135
Table 2B: Alternative Chlorine-Caustic Production Process Technology – Stream Tables - Cont’d
Stream ID ELECTROL.->24
ELECTROL.->24-2
ELECTROL.->24-3
ELECTROL.->25
ELECTROL.->27-2
ELECTROL.->28
GASTREAT.->15
GASTREAT.->16
Temperature F 194.00 194.00 169.59 194.00 194.00 219.64 194.00 90.00
Pressure psi 7.00 14.70 7.00 14.70 14.70 19.91 14.70 14.70
Vapor Frac 1.00 0.01 0.64 0.00 0.00 0.68 1.00 0.00 MoleFlow lbmol/hr 710. 431. 1141. 4891. 4460. 1141. 198. 8326.
MassFlow lb/hr 18549. 7811. 26360. 100593. 92783. 26360. 1188. 150000.
H2O 10838. 7737. 18575. 81750. 74013. 18575. 887. 150000.
NACL 0. 0. 0. 0. 0. 0. 0. 0.
CASO4 0. 0. 0. 0. 0. 0. 0. 0.
MGSO4 0. 0. 0. 0. 0. 0. 0. 0.
NAOH 0. 0. 0. 0. 0. 0. 0. 0.
NA2CO3 0. 0. 0. 0. 0. 0. 0. 0.
MGOH2 0. 0. 0. 0. 0. 0. 0. 0.
CACO3 0. 0. 0. 0. 0. 0. 0. 0.
HCL 0. 0. 0. 0. 0. 0. 0. 0.
CO2 0. 0. 0. 0. 0. 0. 0. 0.
H2 0. 0. 0. 0. 0. 0. 301. 0.
CL2 7712. 74. 7785. 74. 0. 7785. 0. 0.
H2SO4 0. 0. 0. 0. 0. 0. 0. 0.
MG++ 0. 0. 0. 2. 2. 0. 0. 0.
CA++ 0. 0. 0. 0. 0. 0. 0. 0.
NA+ 0. 0. 0. 841. 841. 0. 0. 0.
H+ 0. 0. 0. 0. 0. 0. 0. 0.
MGOH+ 0. 0. 0. 0. 0. 0. 0. 0.
NASO4(S) 0. 0. 0. 430. 430. 0. 0. 0.
MGSO4(S) 0. 0. 0. 0. 0. 0. 0. 0.
CASO4(S) 0. 0. 0. 0. 0. 0. 0. 0.
NACL(S) 0. 0. 0. 16195. 16195. 0. 0. 0.
CACO3(S) 0. 0. 0. 0. 0. 0. 0. 0.
NA2CO(S) 0. 0. 0. 0. 0. 0. 0. 0.
MGOH2(S) 0. 0. 0. 0. 0. 0. 0. 0.
CL- 0. 0. 0. 1184. 1184. 0. 0. 0.
SO4-- 0. 0. 0. 42. 42. 0. 0. 0.
CO3-- 0. 0. 0. 76. 76. 0. 0. 0.
OH- 0. 0. 0. 0. 0. 0. 0. 0.
N2 0. 0. 0. 0. 0. 0. 0. 0.
O2 0. 0. 0. 0. 0. 0. 0. 0.
VolFlow cuft/hr 709296.21 1719.81 703584.71 2716.88 1237.99 280930.87 94663.83 2436.77 Enthalpy MMBtu/hr -61.92 -51.86 -113.78 -665.09 -613.18 -112.39 -4.96 -1028.55

Page 57 of 135
Table 2B: Alternative Chlorine-Caustic Production Process Technology – Stream Tables - Cont’d
Stream ID GASTREAT.->17
GASTREAT.->18
GASTREAT.->18A
GASTREAT.->19
GASTREAT.->21
GASTREAT.->22A
GASTREAT.->22R
GASTREAT.->23
Temperature F 202.45 95.03 94.99 218.69 95.12 112.44 114.73 100.88
Pressure psi 14.70 39.70 39.70 15.70 14.70 14.70 14.70 14.70
Vapor Frac 0.71 0.00 0.00 1.00 1.00 0.00 0.00 1.00 MoleFlow lbmol/hr 1213. 8342. 8341. 67. 172. 14. 11. 165.
MassFlow lb/hr 29739. 151141. 151040. 1200. 11731. 848. 789. 11557.
H2O 19165. 149998. 149998. 1200. 146. 107. 65. 59.
NACL 0. 0. 0. 0. 0. 0. 0. 0.
CASO4 0. 0. 0. 0. 0. 0. 0. 0.
MGSO4 0. 0. 0. 0. 0. 0. 0. 0.
NAOH 0. 0. 0. 0. 0. 0. 0. 0.
NA2CO3 0. 0. 0. 0. 0. 0. 0. 0.
MGOH2 0. 0. 0. 0. 0. 0. 0. 0.
CACO3 0. 0. 0. 0. 0. 0. 0. 0.
HCL 0. 0. 0. 0. 0. 0. 0. 0.
CO2 0. 0. 1. 0. 1. 0. 0. 1.
H2 0. 0. 0. 0. 0. 0. 0. 0.
CL2 10574. 1143. 1041. 0. 11584. 86. 69. 11498.
H2SO4 0. 0. 0. 0. 0. 655. 655. 0.
MG++ 0. 0. 0. 0. 0. 0. 0. 0.
CA++ 0. 0. 0. 0. 0. 0. 0. 0.
NA+ 0. 0. 0. 0. 0. 0. 0. 0.
H+ 0. 0. 0. 0. 0. 0. 0. 0.
MGOH+ 0. 0. 0. 0. 0. 0. 0. 0.
NASO4(S) 0. 0. 0. 0. 0. 0. 0. 0.
MGSO4(S) 0. 0. 0. 0. 0. 0. 0. 0.
CASO4(S) 0. 0. 0. 0. 0. 0. 0. 0.
NACL(S) 0. 0. 0. 0. 0. 0. 0. 0.
CACO3(S) 0. 0. 0. 0. 0. 0. 0. 0.
NA2CO(S) 0. 0. 0. 0. 0. 0. 0. 0.
MGOH2(S) 0. 0. 0. 0. 0. 0. 0. 0.
CL- 0. 0. 0. 0. 0. 0. 0. 0.
SO4-- 0. 0. 0. 0. 0. 0. 0. 0.
CO3-- 0. 0. 0. 0. 0. 0. 0. 0.
OH- 0. 0. 0. 0. 0. 0. 0. 0.
N2 0. 0. 0. 0. 0. 0. 0. 0.
O2 0. 0. 0. 0. 0. 0. 0. 0.
VolFlow cuft/hr 412091.31 2454.78 3031.51 30614.16 68687.82 8.92 7.96 67028.64 Enthalpy MMBtu/hr -115.73 -1032.56 -1027.68 -6.86 -0.83 -3.08 -2.79 -0.32

Page 58 of 135
Table 2B: Alternative Chlorine-Caustic Production Process Technology – Stream Tables - Cont’d
Stream ID GASTREAT.->23-1
GASTREAT.->23-1A
GASTREAT.->23-2
GASTREAT.->24
GASTREAT.->26
GASTREAT.->26-2
GASTREAT.->26-5
GASTREAT.->26A
Temperature F 93.17 309.31 99.15 50.00 65.00 15.80 90.00 78.60
Pressure psi 39.70 39.70 39.70 14.70 14.70 39.70 39.70 39.70
Vapor Frac 1.00 1.00 0.00 0.00 1.00 1.00 1.00 1.00 MoleFlow lbmol/hr 165. 165. 3. 8. 8. 16. 8. 170.
MassFlow lb/hr 11557. 11557. 89. 675. 232. 1143. 232. 11968.
H2O 59. 59. 35. 20. 0. 0. 0. 25.
NACL 0. 0. 0. 0. 0. 0. 0. 0.
CASO4 0. 0. 0. 0. 0. 0. 0. 0.
MGSO4 0. 0. 0. 0. 0. 0. 0. 0.
NAOH 0. 0. 0. 0. 0. 0. 0. 0.
NA2CO3 0. 0. 0. 0. 0. 0. 0. 0.
MGOH2 0. 0. 0. 0. 0. 0. 0. 0.
CACO3 0. 0. 0. 0. 0. 0. 0. 0.
HCL 0. 0. 0. 0. 0. 0. 0. 0.
CO2 1. 1. 0. 0. 0. 0. 0. 1.
H2 0. 0. 0. 0. 0. 0. 0. 0.
CL2 11498. 11498. 54. 0. 0. 1143. 0. 11943.
H2SO4 0. 0. 0. 655. 0. 0. 0. 0.
MG++ 0. 0. 0. 0. 0. 0. 0. 0.
CA++ 0. 0. 0. 0. 0. 0. 0. 0.
NA+ 0. 0. 0. 0. 0. 0. 0. 0.
H+ 0. 0. 0. 0. 0. 0. 0. 0.
MGOH+ 0. 0. 0. 0. 0. 0. 0. 0.
NASO4(S) 0. 0. 0. 0. 0. 0. 0. 0.
MGSO4(S) 0. 0. 0. 0. 0. 0. 0. 0.
CASO4(S) 0. 0. 0. 0. 0. 0. 0. 0.
NACL(S) 0. 0. 0. 0. 0. 0. 0. 0.
CACO3(S) 0. 0. 0. 0. 0. 0. 0. 0.
NA2CO(S) 0. 0. 0. 0. 0. 0. 0. 0.
MGOH2(S) 0. 0. 0. 0. 0. 0. 0. 0.
CL- 0. 0. 0. 0. 0. 0. 0. 0.
SO4-- 0. 0. 0. 0. 0. 0. 0. 0.
CO3-- 0. 0. 0. 0. 0. 0. 0. 0.
OH- 0. 0. 0. 0. 0. 0. 0. 0.
N2 0. 0. 0. 0. 178. 0. 178. 0.
O2 0. 0. 0. 0. 54. 0. 54. 0.
VolFlow cuft/hr 23952.27 33956.31 1.21 6.06 3079.02 1977.87 1193.46 23935.18 Enthalpy MMBtu/hr -0.34 -0.03 -0.25 -2.50 0.00 -0.01 0.00 -0.16

Page 59 of 135
Table 2B: Alternative Chlorine-Caustic Production Process Technology – Stream Tables - Cont’d
Stream ID GASTREAT.->26B
GASTREAT.->27A
GASTREAT.->28A
GASTREAT.->30
GASTREAT.->32-1
GASTREAT.->LIQUID
GASTREAT.->RFX
GASTREAT.->TOSEP
Temperature F 15.80 95.00 95.00 15.80 90.00 180.08 15.80 15.80
Pressure psi 39.70 39.70 39.70 39.70 14.70 14.70 39.70 39.70
Vapor Frac 0.10 1.00 0.00 0.00 1.00 0.00 0.00 0.00 MoleFlow lbmol/hr 170. 8. 8326. 147. 155. 9394. 7. 154.
MassFlow lb/hr 11968. 235. 150000. 10325. 412. 169410. 500. 10825.
H2O 25. 2. 150000. 23. 111. 169178. 1. 25.
NACL 0. 0. 0. 0. 0. 0. 0. 0.
CASO4 0. 0. 0. 0. 0. 0. 0. 0.
MGSO4 0. 0. 0. 0. 0. 0. 0. 0.
NAOH 0. 0. 0. 0. 0. 0. 0. 0.
NA2CO3 0. 0. 0. 0. 0. 0. 0. 0.
MGOH2 0. 0. 0. 0. 0. 0. 0. 0.
CACO3 0. 0. 0. 0. 0. 0. 0. 0.
HCL 0. 0. 0. 0. 0. 0. 0. 0.
CO2 1. 0. 0. 0. 0. 0. 0. 0.
H2 0. 0. 0. 0. 301. 0. 0. 0.
CL2 11943. 0. 0. 10301. 0. 232. 499. 10800.
H2SO4 0. 0. 0. 0. 0. 0. 0. 0.
MG++ 0. 0. 0. 0. 0. 0. 0. 0.
CA++ 0. 0. 0. 0. 0. 0. 0. 0.
NA+ 0. 0. 0. 0. 0. 0. 0. 0.
H+ 0. 0. 0. 0. 0. 0. 0. 0.
MGOH+ 0. 0. 0. 0. 0. 0. 0. 0.
NASO4(S) 0. 0. 0. 0. 0. 0. 0. 0.
MGSO4(S) 0. 0. 0. 0. 0. 0. 0. 0.
CASO4(S) 0. 0. 0. 0. 0. 0. 0. 0.
NACL(S) 0. 0. 0. 0. 0. 0. 0. 0.
CACO3(S) 0. 0. 0. 0. 0. 0. 0. 0.
NA2CO(S) 0. 0. 0. 0. 0. 0. 0. 0.
MGOH2(S) 0. 0. 0. 0. 0. 0. 0. 0.
CL- 0. 0. 0. 0. 0. 0. 0. 0.
SO4-- 0. 0. 0. 0. 0. 0. 0. 0.
CO3-- 0. 0. 0. 0. 0. 0. 0. 0.
OH- 0. 0. 0. 0. 0. 0. 0. 0.
N2 0. 178. 0. 0. 0. 0. 0. 0.
O2 0. 54. 0. 0. 0. 0. 0. 0.
VolFlow cuft/hr 2093.65 1226.13 2443.47 110.44 62354.47 2897.76 5.35 115.78 Enthalpy MMBtu/hr -1.51 -0.01 -1032.56 -1.43 -0.63 -1143.50 -0.07 -1.49

Page 60 of 135
Table 2B: Alternative Chlorine-Caustic Production Process Technology – Stream Tables - Cont’d
Stream ID GASTREAT.->VAPOR
GASTREAT.->VAPORB
GASTREAT.->VPR
GASTREAT.->WASTE
GASTREAT.->WASTE22
Temperature F 179.37 109.84 293.76 96.08 185.99
Pressure psi 8.89 14.70 14.70 14.70 8.89
Vapor Frac 1.00 1.00 1.00 0.00 0.00 MoleFlow lbmol/hr 12. 169. 12. 8369. 9449.
MassFlow lb/hr 362. 11671. 362. 150776. 170248.
H2O 162. 104. 162. 150776. 170216.
NACL 0. 0. 0. 0. 0.
CASO4 0. 0. 0. 0. 0.
MGSO4 0. 0. 0. 0. 0.
NAOH 0. 0. 0. 0. 0.
NA2CO3 0. 0. 0. 0. 0.
MGOH2 0. 0. 0. 0. 0.
CACO3 0. 0. 0. 0. 0.
HCL 0. 0. 0. 0. 0.
CO2 0. 1. 0. 0. 0.
H2 0. 0. 0. 0. 0.
CL2 200. 11566. 200. 0. 32.
H2SO4 0. 0. 0. 0. 0.
MG++ 0. 0. 0. 0. 0.
CA++ 0. 0. 0. 0. 0.
NA+ 0. 0. 0. 0. 0.
H+ 0. 0. 0. 0. 0.
MGOH+ 0. 0. 0. 0. 0.
NASO4(S) 0. 0. 0. 0. 0.
MGSO4(S) 0. 0. 0. 0. 0.
CASO4(S) 0. 0. 0. 0. 0.
NACL(S) 0. 0. 0. 0. 0.
CACO3(S) 0. 0. 0. 0. 0.
NA2CO(S) 0. 0. 0. 0. 0.
MGOH2(S) 0. 0. 0. 0. 0.
CL- 0. 0. 0. 0. 0.
SO4-- 0. 0. 0. 0. 0.
CO3-- 0. 0. 0. 0. 0.
OH- 0. 0. 0. 0. 0.
N2 0. 0. 0. 0. 0.
O2 0. 0. 0. 0. 0.
VolFlow cuft/hr 9041.88 69555.85 6450.13 2457.57 2923.99 Enthalpy MMBtu/hr -0.92 -0.56 -0.91 -1032.88 -1149.44

Page 61 of 135
Figure 2A – Alternative Chlorine – Caustic Soda – part 1
HIERARCHY
BRINE
HIERARCHY
ELECTROL
HIERARCHY
GASTREAT
9
17
15
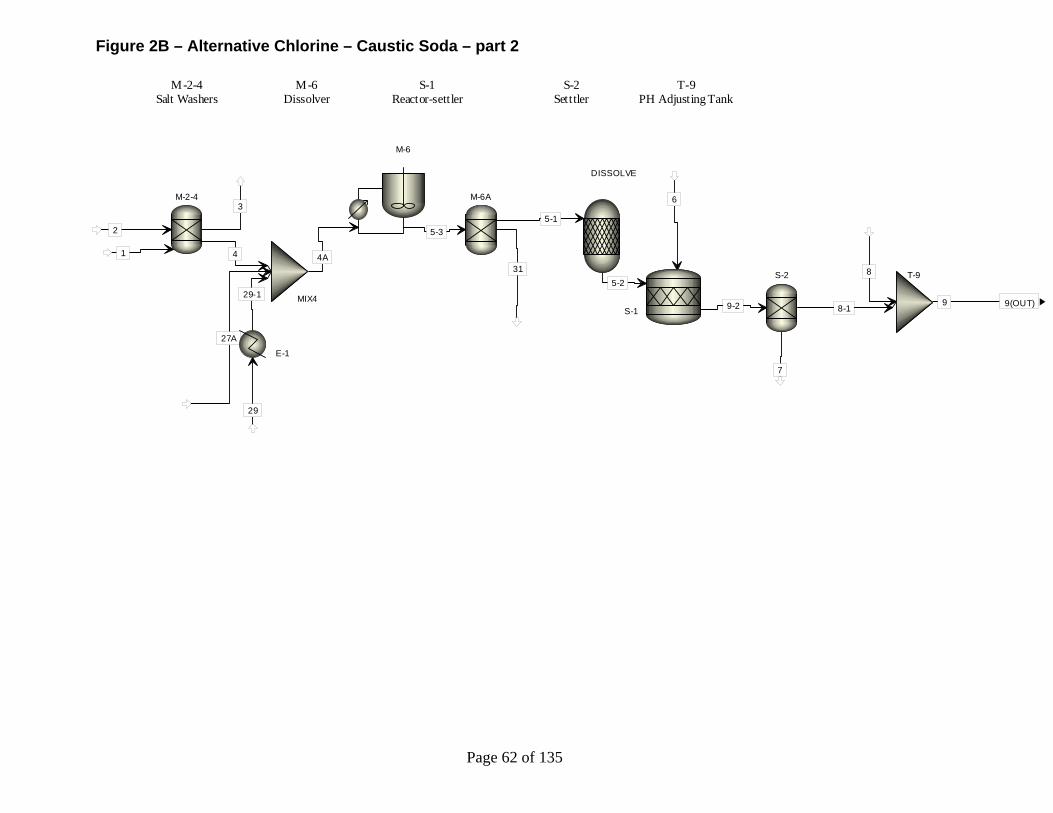
Page 62 of 135
Figure 2B – Alternative Chlorine – Caustic Soda – part 2
9 9(OUT)
1
2
4
3
6
5-2
9-2 8-1
7
29
29-1
5-3
31
5-1
27A
4A8
M-2-4
S-1
S-2
E-1
M-6A
DISSOLVE
MIX4
M-6
T-9
M-2-4Salt Washers
S-1Reactor-settler
T-9PH Adjusting Tank
M-6Dissolver
S-2Setttler
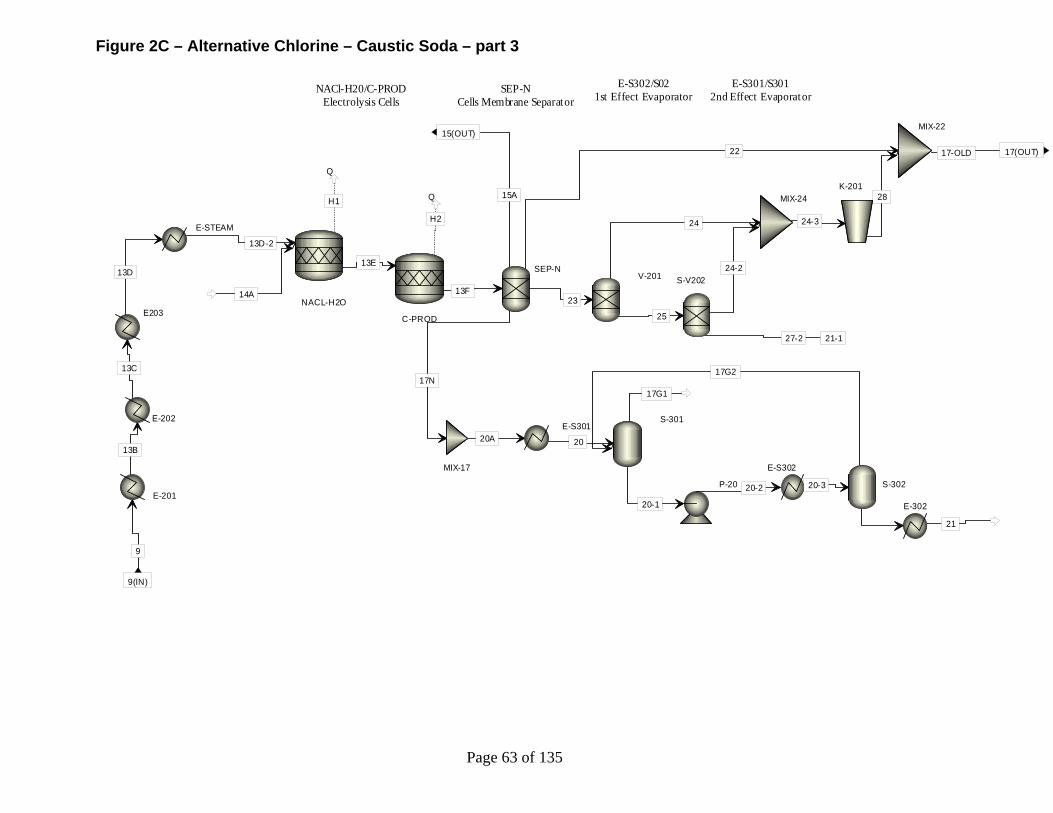
Page 63 of 135
Figure 2C – Alternative Chlorine – Caustic Soda – part 3
9
9(IN)
17-OLD 17(OUT)
15A
15(OUT)
13B
13C
13D
14A
13D-2
13E
H1
Q
13F
H2
Q
22
17N
23
24
25
24-2
27-2
24-3
28
20
17G2
17G1
20-1
20-3
21-1
20A
20-2
21
E-201
E-202
E203NACL-H2O
C-PROD
SEP-NV-201 S-V202
K-201MIX-24
MIX-22
S-301
S-302
E-S301
E-S302
E-302
MIX-17
P-20
E-STEAM
NACl-H20/C-PRODElectrolysis Cells
SEP-NCells Membrane Separator
E-S301/S3012nd Effect Evaporator
E-S302/S021st Effect Evaporator

Page 64 of 135
Figure 2D – Alternative Chlorine – Caustic Soda – part 4
15
15(IN)
17
17(IN)
24
VAPORB
23
22R
23-1A
RFX23-1
23-2
26A
26B
26-2
TOSEP
30
21
22A
VPR18A
LIQUID
19
VAPOR
WASTE22
28A
26-5
18
27A
16
32-1
WASTE
26
C-5
K-1
C-6
E-9
V-4
F S P L I T
S-1
C-4
C-2
C-3
K-3
C-7A
C-1
E-23-1
K-2
C-1Cooling Column
C-2Cooling Column
C-3Chlorine Water
Stripping ColumnC-4
Drying ColumnC-5
Drying ColumnK-1
Chlorine CompressorC-6
Washing ColumnC-7
Absorption Column

Page 65 of 135
Figure 2E – Base Case Chlorine – Caustic Soda – part 1
HIERARCHY
BRINE
HIERARCHY
ELECTROL
HIERARCHY
GASTREAT
HIERARCHY
LIQUOR
9
10
15 17

Page 66 of 135
Figure 2F – Base Case Chlorine – Caustic Soda – part 2
9 9(OUT)
1
2
4
3
6
5
5-2
9-2 8-1
7
29
29-1
5-3
31
5-1
4A
8
M-2-4
S-1
S-2
E-1
M-6A
DISSOLVE
MIX4
M-6
T-9
M-2-4Salt Washers
S-1Reactor-settler
T-9PH Adjusting Tank
M-6Dissolver
S-2Setttler

Page 67 of 135
Figure 2G – Base Case Chlorine – Caustic Soda – part 3
HIERARCHY
CELLS
9 9(IN)
10
10(OUT)
15 15(OUT)
17 17(OUT)
10A
9-1
E-2
R-1Electrolysis Cells

Page 68 of 135
Figure 2H – Base Case Chlorine – Caustic Soda – part 4
9-19-1(IN)
15 15(OUT)
17 17(OUT)
10A
10A(OUT)
9-2
9-3
C-PROD
S-1
NACL-H2O
NACL-H2OIonization
C-PRODProduct Formation
S-1Product Separation

Page 69 of 135
Figure 2I – Base Case Chlorine – Caustic Soda – part 5
15
15(IN)
17
17(IN)
24
VAPORB
23
22R
23-1A
RFX23-1
23-2
26A
26B
26-2
T OSEP
30
21
22A
VPR18A
LIQUID
19
VAPOR
WAST E22
28A
26-5
18
27A
16
32-1
WAST E
26
C-5
K-1
C-6
E-9
V-4
F S P L I T
S-1
C-4
C-2
C-3
K-3
C-7A
C-1
E-23-1
K-2
C-1Cooling Column
C-2Cooling Column
C-3Chlorine Water
Stripping ColumnC-4
Drying ColumnC-5
Drying ColumnK-1
Chlorine CompressorC-6
Washing ColumnC-7
Absorption Column

Page 70 of 135
Figure 2J – Base Case Chlorine – Caustic Soda – part 6
10
10(IN)
10-2B10-14
10-8
MSD-10-4
10-10
10-16
10-6
10-7
10-12
10-20A
10-20
10-18
12
11-1
13
5
11
10-22
10-3 10-3B
Q-E5 Q
10-5
10-5B
Q-E4 Q
10-2
10-16A
10-12B
10-1
ST15PSIG
STM-OUT
Q-E3Q
QE
14A14
WATER-IN
WA-OUT
S-5S-6
V-1S-7
S-9
S-8
E-4A
E-3A
P10-2
P10-16
P10-12
E-5E-3
E-4
S-7A
E-H 3A
E-6
P14
ZE-6WA
E-H3AEvaporator Heater
S-7Settler
S-7ACrystallizer
V-1Fashing Vessel E-3 thru 5
Evaporator
S-6Settler
S-5Settler
S-9Filter
S-8Filter

Page 71 of 135
Appendix 3 – Ethylene Oxide Table 3A: Alternative Ethylene Oxide Production Process Technology – Energy and Exergy Loss Profile
Energy Loss Exergy Loss = =
Unit OP Type Btu/lb Btu/lb
Total Total
External Total
Internal Total = = = =
7,125 % 1,064 5,290 6,355 %
FEED PRETREATMENT ..K-101 Compressor 0 0 0 46 46 0.72
..FSP-7 Flow Splitter 0 0 0 0 0 0
..MIX-7 Mixer 0 0 0 101 101 1.59
..MIX11 Mixer 0 0 0 1 1 0.01
EXOTHERMIC REACTOR ..R-101 Reactor 0 0 0 2,400 2,400 37.77
..FSP5 Flow Splitter 0 0 0 0 0 0
..E-102 Cooler 751 10.54 184 2 186 2.92
..E-101C Process Exchanger 0 0 0 196 196 3.09
EO ABSORBER ..MIX-4 Mixer 0 0 0 90 90 1.41
..C-101 Absorber 0 0 0 381 381 5.99
..VLV1 Valve 0 0 0 427 427 6.72
..V-101A Separator 563 7.9 32 0 32 0.5
..K-102 Compressor 688 9.65 147 339 486 7.64
..E-103 Cooler 594 8.33 123 4 127 1.99
..P-5 Pump 0 0 0 22 22 0.34
EO STRIPPER H-200..P8 Pump 0 0 0 1 1 0.02
H-200..E-202 Process Exchanger 802 11.25 133 15 147 2.32
H-200..C-201 Stripping Column 51 0.71 11 15 26 0.4
H-200..E-201C Cooler 0 0 0 185 185 2.91 H-200..R202V201 EG Reactor 0 0 0 12 12 0.19
H-200..P11 Pump 0 0 0 3 3 0.05
H-200..E-206 Cooler 1,365 19.16 108 6 114 1.79
H-200..FSP-11 Flow Splitter 0 0 0 0 0 0
H-200..V-202 Flash Drum 0 0 0 0 0 0
H-200..V-203 Flash Drum 0 0 0 0 0 0
H-200..E-203A Cooler 297 4.16 8 0 8 0.12
H-200..E-204 Cooler 67 0.95 3 1 4 0.06
H-200..C-202 Rectifying Column 7 0.1 0 2 2 0.03
H-200..K-201 Compressor 0 0 0 0 0 0
H-200..MIX-12 Mixer 0 0 0 3 3 0.04
H-200..P12 Pump 0 0 0 0 0 0

Page 72 of 135
Table 3A: Alternative Ethylene Oxide Production Process Technology – Energy and Exergy Loss Profile (Cont’d)
Energy Loss Exergy Loss = =
Unit OP Type Btu/lb Btu/lb
Total Total
External Total Internal Total = = = =
7,125 % 1,064 5,290 6,355 %
CO2 RECOVERY H-300..C-301 Absorber 0 0 0 157 157 2.48 H-300..VLV-301 Valve 0 0 0 531 531 8.36
H-300..MIX15 Mixer 0 0 0 146 146 2.3
H-300..K-201 Compressor 0 0 0 152 152 2.4
H-300..V-301 Flash Drum 0 0 0 0 0 0
H-300..E-301 Ovd Condenser 549 7.71 99 7 106 1.67
H-300..P-C301 Pump 0 0 0 0 0 0
H-300..C-302 Compressor 0 0 0 0 0 0
H-300..MIX-17 Mixer 0 0 0 2 2 0.03
H-300..K-302 Compressor 0 0 0 0 0 0 H-300..E-302C
Process Exchanger 0 0 0 21 21 0.32
H-300..C-303 Desorber 809 11.36 112 0 112 1.77 H-300..E-302B Heater 0 0 0 0 0 0
H-300..MIX-16 Mixer 0 0 0 0 0 0
H-300..P16 Pump 0 0 0 6 6 0.1
H-300..P15-6 Pump 0 0 0 0 0 0 H-300..E-301A Heater 0 0 0 4 4 0.06
H-300..V-302 Flash Drum 425 5.97 96 0 96 1.5
EO PURIFICATION H-400..C-401 EO Column 157 2.2 9 10 18 0.29
H-400..E-403 Cooler 0 0 0 0 0 0
H-400..V-401 Flash Drum 0 0 0 0 0 0 H-400..FSPT-22
Flow Splitter 0 0 0 0 0 0
H-400..E-401C
Process Exchanger 0 0 0 3 3 0.05

Page 73 of 135
Table 3B: Alternative Ethylene Oxide Production Process Technology – Stream Tables Stream ID .->1 .->2 .->3-1 .->3-2 .->3-3 .->3-4 .->4 .->4-1 Temperature F 230.00 230.00 329.35 329.18 480.00 308.11 200.00 175.22 Pressure psi 310.00 310.00 310.00 310.00 310.00 310.00 310.00 310.00 Vapor Frac 1.00 1.00 1.00 1.00 1.00 1.00 1.00 1.00 MoleFlow lbmol/hr 748. 651. 16566. 16575. 16294. 16294. 16294. 21014. MassFlow lb/hr 21113. 20975. 480370. 480533. 480370. 480370. 480370. 622660. ETHYLENE 19111. 0. 185697. 185696. 167108. 167108. 167108. 247076. OXYGEN 0. 20327. 58248. 58255. 38019. 38019. 38019. 39391. CO2 0. 0. 50980. 50967. 61467. 61467. 61467. 89561. ARGON 0. 647. 107260. 107297. 107260. 107260. 107260. 110973. METHANE 0. 0. 57039. 57270. 56990. 56990. 56990. 61302. ETHANE 2002. 0. 20054. 20054. 20054. 20054. 20054. 44723. EO 0. 0. 1. 1. 23912. 23912. 23912. 24008. ACET 0. 0. 0. 0. 29. 29. 29. 29. FORMAL 0. 0. 17. 23. 107. 107. 107. 107. WATER 0. 0. 1075. 970. 5422. 5422. 5422. 5490. EG 0. 0. 0. 0. 0. 0. 0. 0. EDC 0. 0. 0. 0. 0. 0. 0. 0. K+ 0. 0. 0. 0. 0. 0. 0. 0. HCO3- 0. 0. 0. 0. 0. 0. 0. 0. CO3-- 0. 0. 0. 0. 0. 0. 0. 0. VolFlow cuft/hr 17853.85 15553.37 452472.12 452634.05 530021.81 433064.68 372087.53 461839.78 Enthalpy MMBtu/hr 14.30 0.70 -150.36 -150.19 -215.27 -246.96 -264.92 -346.06 Stream ID .->5 .->5-OUT .->5A .->6 .->6-1 .->7 .->8 .->8-1 Temperature F 100.79 100.82 100.00 101.23 101.23 132.64 116.23 134.25 Pressure psi 260.00 260.00 60.00 260.00 260.00 310.00 15.00 260.00 Vapor Frac 0.00 0.00 0.00 1.00 1.00 1.00 0.00 0.00 MoleFlow lbmol/hr 38464. 38469. 38469. 39. 15431. 12912. 39287. 44007. MassFlow lb/hr 719983. 719998. 719998. 1127. 449748. 376327. 749471. 891762. ETHYLENE 0. 0. 0. 417. 166539. 139265. 150. 80117. OXYGEN 0. 0. 0. 95. 37897. 31707. 27. 1399. CO2 0. 0. 0. 152. 60750. 50906. 564. 28658. ARGON 0. 0. 0. 268. 106897. 89455. 94. 3808. METHANE 0. 0. 0. 142. 56786. 47525. 62. 4374. ETHANE 0. 0. 0. 50. 19943. 16678. 60. 24729. EO 0. 0. 0. 0. 0. 0. 23912. 24008. ACET 0. 0. 0. 0. 0. 0. 29. 29. FORMAL 151. 81. 81. 0. 24. 20. 234. 234. WATER 681804. 681955. 681955. 2. 912. 771. 686310. 686379. EG 38025. 37959. 37959. 0. 0. 0. 38025. 38025. EDC 3. 3. 3. 0. 0. 0. 3. 3. K+ 0. 0. 0. 0. 0. 0. 0. 0. HCO3- 0. 0. 0. 0. 0. 0. 0. 0. CO3-- 0. 0. 0. 0. 0. 0. 0. 0. VolFlow cuft/hr 11692.11 11692.23 11686.93 895.37 357251.53 264743.47 12313.22 16421.86 Enthalpy MMBtu/hr -4754.11 -4754.79 -4755.33 -0.60 -238.85 -196.62 -4793.86 -4860.73

Page 74 of 135
Table 3B: Alternative Ethylene Oxide Production Process Technology – Stream Tables – Cont’d Stream ID .->8-4 .->8-5 .->8C .->8D .->12-0 .->12-1 .->14 .->14-2 Temperature F 350.00 100.00 116.23 116.23 62.60 62.60 586.58 713.72 Pressure psi 310.00 310.00 15.00 15.00 25.00 25.00 260.00 260.00 Vapor Frac 1.00 1.00 0.12 1.00 0.00 0.00 1.00 1.00 MoleFlow lbmol/hr 4720. 4720. 44007. 4720. 1853. 1853. 13. 9. MassFlow lb/hr 142291. 142291. 891762. 142291. 47411. 47411. 404. 261. ETHYLENE 79967. 79967. 80117. 79967. 125. 125. 46. 25. OXYGEN 1372. 1372. 1399. 1372. 3. 3. 30. 24. CO2 28094. 28094. 28658. 28094. 492. 492. 142. 72. ARGON 3713. 3713. 3808. 3713. 11. 11. 106. 84. METHANE 4311. 4311. 4374. 4311. 15. 15. 62. 48. ETHANE 24669. 24669. 24729. 24669. 59. 59. 6. 1. EO 95. 95. 24008. 95. 22982. 22982. 0. 0. ACET 0. 0. 29. 0. 29. 29. 0. 0. FORMAL 0. 0. 234. 0. 150. 150. 0. 0. WATER 69. 69. 686379. 69. 23546. 23546. 10. 7. EG 0. 0. 38025. 0. 0. 0. 0. 0. EDC 0. 0. 3. 0. 0. 0. 0. 0. K+ 0. 0. 0. 0. 0. 0. 0. 0. HCO3- 0. 0. 0. 0. 0. 0. 0. 0. CO3-- 0. 0. 0. 0. 0. 0. 0. 0. VolFlow cuft/hr 132289.70 91442.91 2213406.79 1944627.34 794.38 794.35 567.31 425.22 Enthalpy MMBtu/hr -66.94 -81.14 -4860.73 -80.32 -180.36 -180.36 -0.64 -0.34 Stream ID .->14A6 .->15 .->15-2 .->17 .->21 .->22 .->A-3 .->BFW Temperature F 101.67 132.64 132.64 114.34 122.12 122.79 135.70 100.00 Pressure psi 260.00 310.00 310.00 310.00 60.00 60.00 310.00 214.70 Vapor Frac 1.00 1.00 1.00 1.00 0.00 0.00 1.00 0.00 MoleFlow lbmol/hr 15444. 2533. 15444. 2264. 1571. 252. 16575. 3089. MassFlow lb/hr 450152. 73825. 450152. 62118. 35204. 11003. 480533. 55648. ETHYLENE 166585. 27320. 166585. 27320. 18. 3. 185696. 0. OXYGEN 37927. 6220. 37927. 6220. 0. 0. 58255. 0. CO2 60892. 9986. 60892. 61. 69. 11. 50967. 0. ARGON 107004. 17549. 107004. 17195. 0. 0. 107297. 0. METHANE 56848. 9323. 56848. 9745. 1. 0. 57270. 0. ETHANE 19949. 3272. 19949. 1375. 13. 2. 20054. 0. EO 0. 0. 0. 1. 11491. 10909. 1. 0. ACET 0. 0. 0. 0. 17. 12. 0. 0. FORMAL 24. 4. 24. 2. 97. 20. 23. 0. WATER 922. 151. 922. 199. 23498. 47. 970. 55648. EG 0. 0. 0. 0. 0. 0. 0. 0. EDC 0. 0. 0. 0. 0. 0. 0. 0. K+ 0. 0. 0. 0. 0. 0. 0. 0. HCO3- 0. 0. 0. 0. 0. 0. 0. 0. CO3-- 0. 0. 0. 0. 0. 0. 0. 0. VolFlow cuft/hr 357837.17 51935.32 316678.79 42653.82 601.95 214.05 341617.20 908.56 Enthalpy MMBtu/hr -239.48 -38.57 -235.20 -0.26 -167.86 -8.38 -181.89 -378.20

Page 75 of 135
Table 3B: Alternative Ethylene Oxide Production Process Technology – Stream Tables – Cont’d Stream ID .->C-101-OV .->STEAM1 H-200.->5-2 H-200.->8 H-200.->8-A H-200.->8B H-200.->9 H-200.->10 Temperature F 101.23 387.91 147.93 116.23 222.64 116.27 100.00 258.83 Pressure psi 260.00 214.70 60.00 15.00 25.00 25.00 25.00 34.70 Vapor Frac 1.00 1.00 0.00 0.00 0.03 0.00 0.00 1.00 MoleFlow lbmol/hr 15470. 3089. 38469. 39287. 39287. 39287. 2181. 28. MassFlow lb/hr 450876. 55648. 719998. 749471. 749471. 749471. 39286. 508. ETHYLENE 166956. 0. 0. 150. 150. 150. 0. 0. OXYGEN 37992. 0. 0. 27. 27. 27. 0. 0. CO2 60902. 0. 0. 564. 564. 564. 0. 0. ARGON 107165. 0. 0. 94. 94. 94. 0. 0. METHANE 56928. 0. 0. 62. 62. 62. 0. 0. ETHANE 19993. 0. 0. 60. 60. 60. 0. 0. EO 0. 0. 0. 23912. 23912. 23912. 0. 0. ACET 0. 0. 0. 29. 29. 29. 0. 0. FORMAL 24. 0. 81. 234. 234. 234. 0. 0. WATER 914. 55648. 681955. 686310. 686310. 686310. 39286. 508. EG 0. 0. 37959. 38025. 38025. 38025. 0. 0. EDC 0. 0. 3. 3. 3. 3. 0. 0. K+ 0. 0. 0. 0. 0. 0. 0. 0. HCO3- 0. 0. 0. 0. 0. 0. 0. 0. CO3-- 0. 0. 0. 0. 0. 0. 0. 0. VolFlow cuft/hr 358146.90 130865.21 12010.94 12313.22 354338.03 12313.51 641.42 6265.35 Enthalpy MMBtu/hr -239.44 -313.29 -4722.68 -4793.86 -4698.37 -4793.83 -267.00 -2.89
Stream ID H-200.->11 H-200.->11-1 H-200.->11-2 H-200.->11-3 H-200.->11-3A H-200.->12 H-200.->12-1 H-200.->12-2
Temperature F 147.93 239.26 239.39 270.00 147.93 62.60 150.00 62.60 Pressure psi 60.00 25.00 60.00 60.00 60.00 25.00 25.00 25.00 Vapor Frac 0.00 0.00 0.00 0.00 0.00 0.00 1.00 0.03 MoleFlow lbmol/hr 1395. 39885. 39885. 39864. 39864. 1853. 592. 1911. MassFlow lb/hr 26118. 746115. 746115. 746115. 746115. 47411. 23594. 49751. ETHYLENE 0. 0. 0. 0. 0. 125. 146. 206. OXYGEN 0. 0. 0. 0. 0. 3. 27. 28. CO2 0. 0. 0. 0. 0. 492. 552. 783. ARGON 0. 0. 0. 0. 0. 11. 94. 99. METHANE 0. 0. 0. 0. 0. 15. 62. 68. ETHANE 0. 0. 0. 0. 0. 59. 58. 82. EO 0. 931. 931. 0. 0. 22982. 20982. 24744. ACET 0. 0. 0. 0. 0. 29. 27. 30. FORMAL 3. 84. 84. 84. 84. 150. 124. 156. WATER 24738. 707073. 707073. 706693. 706693. 23546. 1522. 23555. EG 1377. 38025. 38025. 39336. 39336. 0. 0. 0. EDC 0. 3. 3. 3. 3. 0. 0. 0. K+ 0. 0. 0. 0. 0. 0. 0. 0. HCO3- 0. 0. 0. 0. 0. 0. 0. 0. CO3-- 0. 0. 0. 0. 0. 0. 0. 0. VolFlow cuft/hr 435.69 13183.45 13184.60 13458.98 12446.63 794.35 154991.68 13643.67 Enthalpy MMBtu/hr -171.31 -4823.11 -4823.00 -4798.54 -4894.00 -180.36 -21.50 -182.53

Page 76 of 135
Table 3B: Alternative Ethylene Oxide Production Process Technology – Stream Tables – Cont’d Stream ID H-200.->12-3 H-200.->12-4 H-200.->12-5 H-200.->12-6 H-200.->12-7 H-200.->12-8 H-200.->13 H-200.->A-5 Temperature F 150.00 60.00 62.60 77.85 125.36 77.91 95.00 100.00 Pressure psi 25.00 25.00 25.00 17.00 25.00 25.00 25.00 60.00 Vapor Frac 0.00 0.00 1.00 0.00 0.28 0.00 0.00 0.00 MoleFlow lbmol/hr 1019. 1019. 57. 1318. 1911. 1318. 251. 38469. MassFlow lb/hr 19556. 19556. 2340. 26157. 49751. 26157. 4522. 719998. ETHYLENE 3. 3. 81. 60. 206. 60. 0. 0. OXYGEN 0. 0. 25. 1. 28. 1. 0. 0. CO2 12. 12. 290. 231. 783. 231. 0. 0. ARGON 0. 0. 88. 4. 99. 4. 0. 0. METHANE 0. 0. 53. 6. 68. 6. 0. 0. ETHANE 2. 2. 23. 24. 82. 24. 0. 0. EO 2000. 2000. 1762. 3762. 24744. 3762. 0. 0. ACET 3. 3. 1. 4. 30. 4. 0. 0. FORMAL 25. 25. 7. 32. 156. 32. 0. 81. WATER 17509. 17509. 9. 22033. 23555. 22033. 4522. 681955. EG 0. 0. 0. 0. 0. 0. 0. 37959. EDC 0. 0. 0. 0. 0. 0. 0. 3. K+ 0. 0. 0. 0. 0. 0. 0. 0. HCO3- 0. 0. 0. 0. 0. 0. 0. 0. CO3-- 0. 0. 0. 0. 0. 0. 0. 0. VolFlow cuft/hr 331.98 314.70 12849.30 427.04 136427.86 427.05 73.63 11686.93 Enthalpy MMBtu/hr -119.63 -121.24 -2.16 -153.94 -175.43 -153.94 -30.75 -4755.33
Stream ID H-200.->A-14 H-200.->A-14-1
H-200.->C201-OVH
H-200.->C201OVH1 H-300.->15-2 H-300.->15-3 H-300.->15-4
H-300.->15-4-1
Temperature F 713.72 93.04 217.96 150.00 595.38 285.31 228.42 232.50 Pressure psi 260.00 17.00 25.00 25.00 310.00 310.00 45.00 45.00 Vapor Frac 1.00 1.00 1.00 0.37 1.00 0.00 0.13 0.14 MoleFlow lbmol/hr 9. 9. 1611. 1611. 5675. 40959. 40959. 40959. MassFlow lb/hr 261. 261. 43150. 43150. 136669. 883926. 883926. 883926. ETHYLENE 25. 25. 150. 150. 94053. 94053. 94053. 94053. OXYGEN 24. 24. 27. 27. 976. 976. 976. 976. CO2 72. 72. 564. 564. 0. 0. 0. 0. ARGON 84. 84. 94. 94. 1956. 2445. 2445. 2445. METHANE 48. 48. 62. 62. 5913. 5913. 5913. 5913. ETHANE 1. 1. 60. 60. 0. 5376. 5376. 5376. EO 0. 0. 22982. 22982. 0. 3. 3. 3. ACET 0. 0. 29. 29. 0. 0. 0. 0. FORMAL 0. 0. 150. 150. 13. 18. 18. 18. WATER 7. 7. 19031. 19031. 33758. 600822. 600822. 600822. EG 0. 0. 0. 0. 0. 1. 1. 1. EDC 0. 0. 0. 0. 0. 0. 0. 0. K+ 0. 0. 0. 0. 0. 81594. 81594. 81594. HCO3- 0. 0. 0. 0. 0. 59237. 59237. 59237. CO3-- 0. 0. 0. 0. 0. 33489. 33489. 33489. VolFlow cuft/hr 425.22 3063.34 468587.54 155323.57 203229.62 19286.14 893151.43 959282.75 Enthalpy MMBtu/hr -0.34 -0.39 -121.96 -141.13 -97.91 -4575.12 -4575.12 -4566.88

Page 77 of 135
Table 3B: Alternative Ethylene Oxide Production Process Technology – Stream Tables – Cont’d Stream ID H-300.->15-5 H-300.->15-6 H-300.->15-7 H-300.->15-8 H-300.->16 H-300.->16-0 H-300.->16-1 H-300.->16-3 Temperature F 232.50 232.50 477.84 232.50 203.07 167.66 167.66 168.32 Pressure psi 45.00 45.00 310.00 45.00 310.00 17.00 17.00 310.00 Vapor Frac 1.00 0.00 1.00 0.00 0.00 0.00 0.00 0.00 MoleFlow lbmol/hr 5675. 35284. 8208. 35284. 35492. 35489. 35489. 35489. MassFlow lb/hr 136669. 747257. 210494. 747257. 735291. 735341. 735341. 735341. ETHYLENE 94053. 0. 121373. 0. 0. 0. 0. 0. OXYGEN 976. 0. 7196. 0. 0. 0. 0. 0. CO2 0. 0. 9986. 0. 11376. 11546. 11546. 11546. ARGON 1956. 489. 19504. 489. 27. 26. 26. 26. METHANE 5913. 0. 15236. 0. 422. 426. 426. 426. ETHANE 0. 5376. 3272. 5376. 3450. 3467. 3467. 3467. EO 0. 3. 0. 3. 4. 2. 2. 2. ACET 0. 0. 0. 0. 0. 0. 0. 0. FORMAL 13. 5. 17. 5. 3. 4. 4. 4. WATER 33758. 567063. 33910. 567063. 575795. 575656. 575656. 575656. EG 0. 1. 0. 1. 1. 1. 1. 1. EDC 0. 0. 0. 0. 0. 0. 0. 0. K+ 0. 81594. 0. 81594. 81594. 81594. 81594. 81594. HCO3- 0. 59237. 0. 59237. 0. 0. 0. 0. CO3-- 0. 33489. 0. 33489. 62618. 62618. 62618. 62618. VolFlow cuft/hr 926292.90 10766.97 260560.23 10766.97 10607.14 10491.22 10491.22 10484.59 Enthalpy MMBtu/hr -122.38 -4454.67 -136.48 -4454.67 -4425.20 -4443.47 -4443.47 -4442.75 Stream ID H-300.->16-5 H-300.->16-7 H-300.->17 H-300.->17-1 H-300.->17-2 H-300.->17-3 H-300.->17-4 H-300.->17-5 Temperature F 110.15 110.19 744.78 288.30 110.15 110.15 228.64 227.74 Pressure psi 310.00 312.00 310.00 310.00 310.00 310.00 45.00 45.00 Vapor Frac 0.00 0.00 1.00 1.00 0.77 1.00 1.00 0.00 MoleFlow lbmol/hr 663. 663. 8. 2919. 2919. 2256. 8. 35521. MassFlow lb/hr 13631. 13631. 259. 75490. 75490. 61859. 259. 748233. ETHYLENE 4016. 4016. 0. 31336. 31336. 27320. 0. 0. OXYGEN 142. 142. 0. 6362. 6362. 6220. 0. 0. CO2 0. 0. 61. 0. 0. 0. 61. 7355. ARGON 352. 352. 108. 17439. 17439. 17087. 108. 381. METHANE 860. 860. 0. 10605. 10605. 9745. 0. 1234. ETHANE 244. 244. 29. 1589. 1589. 1346. 29. 5347. EO 0. 0. 0. 1. 1. 1. 0. 3. ACET 0. 0. 0. 0. 0. 0. 0. 0. FORMAL 1. 1. 0. 4. 4. 2. 0. 5. WATER 8015. 8015. 60. 8154. 8154. 139. 60. 570039. EG 0. 0. 0. 0. 0. 0. 0. 1. EDC 0. 0. 0. 0. 0. 0. 0. 0. K+ 0. 0. 0. 0. 0. 0. 0. 81594. HCO3- 0. 0. 0. 0. 0. 0. 0. 38671. CO3-- 0. 0. 0. 0. 0. 0. 0. 43602. VolFlow cuft/hr 550.43 550.43 347.49 73225.27 42739.55 42189.11 1368.60 11001.94 Enthalpy MMBtu/hr -53.11 -53.11 -0.57 -39.68 -52.80 0.31 -0.61 -4456.52

Page 78 of 135
Table 3B: Alternative Ethylene Oxide Production Process Technology – Stream Tables – Cont’d Stream ID H-300.->17-6 H-300.->17-T H-300.->18 H-300.->19 H-300.->20 H-300.->20-1 H-300.->A-16 H-300.->A15 Temperature F 209.11 114.34 100.00 266.86 186.00 162.01 188.30 132.64 Pressure psi 45.00 310.00 310.00 39.70 17.00 17.00 310.00 310.00 Vapor Frac 0.00 1.00 1.00 1.00 1.00 1.00 0.00 1.00 MoleFlow lbmol/hr 35521. 2264. 77. 109. 458. 458. 35489. 2533. MassFlow lb/hr 748233. 62118. 1234. 1967. 14859. 14859. 735341. 73825. ETHYLENE 0. 27320. 0. 0. 0. 0. 0. 27320. OXYGEN 0. 6220. 0. 0. 0. 0. 0. 6220. CO2 7355. 61. 0. 0. 9756. 9756. 11546. 9986. ARGON 381. 17195. 0. 0. 355. 355. 26. 17549. METHANE 1234. 9745. 1234. 0. 808. 808. 426. 9323. ETHANE 5347. 1375. 0. 0. 1880. 1880. 3467. 3272. EO 3. 1. 0. 0. 1. 1. 2. 0. ACET 0. 0. 0. 0. 0. 0. 0. 0. FORMAL 5. 2. 0. 0. 1. 1. 4. 4. WATER 570039. 199. 0. 1967. 2059. 2059. 575656. 151. EG 1. 0. 0. 0. 0. 0. 1. 0. EDC 0. 0. 0. 0. 0. 0. 0. 0. K+ 81594. 0. 0. 0. 0. 0. 81594. 0. HCO3- 38671. 0. 0. 0. 0. 0. 0. 0. CO3-- 43602. 0. 0. 0. 0. 0. 62618. 0. VolFlow cuft/hr 10921.05 42653.82 1441.51 21110.83 185763.74 178768.73 10555.38 51935.32 Enthalpy MMBtu/hr -4466.72 -0.26 -2.46 -11.19 -52.79 -52.90 -4432.55 -38.57 Stream ID H-400.->12-2 H-400.->12-4 H-400.->12-5 H-400.->21-0 H-400.->21-1 H-400.->22-1 H-400.->22-2 H-400.->22-3 Temperature F 62.60 62.88 83.51 146.75 122.12 122.78 122.79 122.79 Pressure psi 25.00 62.00 62.00 60.00 60.00 60.00 60.00 60.00 Vapor Frac 0.00 0.00 0.00 0.00 0.00 0.00 0.00 1.00 MoleFlow lbmol/hr 1853. 1853. 1853. 1571. 1571. 629. 629. 0. MassFlow lb/hr 47411. 47411. 47411. 35204. 35204. 27511. 27511. 3. ETHYLENE 125. 125. 125. 18. 18. 7. 7. 0. OXYGEN 3. 3. 3. 0. 0. 0. 0. 0. CO2 492. 492. 492. 69. 69. 27. 27. 0. ARGON 11. 11. 11. 0. 0. 0. 0. 0. METHANE 15. 15. 15. 1. 1. 0. 0. 0. ETHANE 59. 59. 59. 13. 13. 5. 5. 0. EO 22982. 22982. 22982. 11491. 11491. 27276. 27276. 3. ACET 29. 29. 29. 17. 17. 30. 30. 0. FORMAL 150. 150. 150. 97. 97. 49. 49. 0. WATER 23546. 23546. 23546. 23498. 23498. 118. 118. 0. EG 0. 0. 0. 0. 0. 0. 0. 0. EDC 0. 0. 0. 0. 0. 0. 0. 0. K+ 0. 0. 0. 0. 0. 0. 0. 0. HCO3- 0. 0. 0. 0. 0. 0. 0. 0. CO3-- 0. 0. 0. 0. 0. 0. 0. 0. VolFlow cuft/hr 794.38 794.51 806.44 612.63 601.95 535.17 543.26 8.15 Enthalpy MMBtu/hr -180.36 -180.35 -179.59 -167.10 -167.86 -20.96 -20.96 0.00

Page 79 of 135
Table 3B: Alternative Ethylene Oxide Production Process Technology – Stream Tables – Cont’d Stream ID H-400.->22-4 H-400.->22-5
H-400.->401-OVHD H-400.->S8
Temperature F 122.79 122.79 81.91 122.79 Pressure psi 60.00 60.00 60.00 60.00 Vapor Frac 0.00 0.00 1.00 0.00 MoleFlow lbmol/hr 252. 377. 30. 629. MassFlow lb/hr 11003. 16505. 1200. 27508. ETHYLENE 3. 4. 104. 7. OXYGEN 0. 0. 3. 0. CO2 11. 16. 412. 27. ARGON 0. 0. 10. 0. METHANE 0. 0. 14. 0. ETHANE 2. 3. 44. 5. EO 10909. 16363. 579. 27272. ACET 12. 18. 0. 30. FORMAL 20. 29. 33. 49. WATER 47. 71. 0. 118. EG 0. 0. 0. 0. EDC 0. 0. 0. 0. K+ 0. 0. 0. 0. HCO3- 0. 0. 0. 0. CO3-- 0. 0. 0. 0. VolFlow cuft/hr 214.05 321.07 2908.79 535.11 Enthalpy MMBtu/hr -8.38 -12.57 -1.93 -20.96

Page 80 of 135
Figure 3A – Alternative Ethylene Oxide Process – Part 1
HIERARCHY
H-200
HIERARCHY
H-300
HIERARCHY
H-4008 12-1
14-2
5A
15
17
12-0
21
22
3-13-3 3-4
14A6
15-2
7
4-1
5
8-1
C-101-OV
4
8-5
6-1
14
6
8-4
1
2
A-3
3-2
8D
BFW STEAM1
5-OUTR-101
E-101H
K-101FSP-7
C-101
MIX-4
VLV1
MIX11
FSP5
E-103
E-102
MIX-7
E-101C
K-102
E-STEAM
V-101A
P-5
R-101EO Reactor
C-101Absorber
E-SteamSteam Generation
E-101HProcess Heater
K-101Recycle Compressor
K-102Compressor
H-200Seperatin Section
H-300CO2 Recovery Section
H-400EO- Purification

Page 81 of 135
Figure 3B – Alternative Ethylene Oxide Process – Pt 2
88(IN)12-1(OUT)
A-1414-2(OUT)
A-55A(OUT)
10
9
8-A C201-OVH
11-2
11-3 11-3A
5-2
11
12-1
12-3
12-2
12-5
12-7
12-4
13
A-14-1
12-6
12-8
C-201
E-202P8
E-201C
R202V201
P11E-201H
E-206
FSP-11
V-202
V-203
E-203A
E-204C-202
K-201
MIX-12
P12
C-201Stripping Column
R202V202Hydrolyser C-202
Reabsorber

Page 82 of 135
Table 3C: NEW Base Ethylene Oxide Production Process Technology – Energy and Exergy Loss Profile Energy Loss Exergy Loss
= = Unit OP Type Btu/lb Btu/lb
Total Total
External Total
Internal Total = = = =
8,345 % 1,175 5,772 6,947 %
FEED -PRETREAT
..K-101 Compressor 0 0 0 75 75 1.09
..FSP-7 Flow Splitter 0 0 0 0 0 0
..MIX-7 Mixer 0 0 0 127 127 1.82
..MIX11 Mixer 0 0 0 1 1 0.01
EXOTHERMIC REACTOR ..R-101 Reactor 0 0 0 2,380 2,380 34.25
..FSP5 Flow Splitter 0 0 0 0 0 0
..E-102 Cooler 1,186 14.21 252 41 293 4.22
..E-101C Process Exchanger 0 0 0 313 313 4.5
EO ABSORBER ..MIX-4 Mixer 0 0 0 103 103 1.48
..C-101 Absorber 1 0.01 0 478 478 6.88
..VLV1 Valve 0 0 0 421 421 6.07
..V-101A Separator 611 7.32 42 0 42 0.6
..K-102 Compressor 742 8.9 162 348 510 7.34
..E-103 Cooler 583 6.99 121 3 124 1.79
..P-5 Pump 0 0 0 29 29 0.41
EO STRIPPER H-200..P8 Pump 0 0 0 1 1 0.02
H-200..E-202 Process Exchanger 1,032 12.37 172 23 195 2.8
H-200..C-201 Stripping Column 326 3.9 69 31 100 1.43
H-200..E-201C Cooler 0 0 0 215 215 3.09 H-200..R202V201 EG Reactor 0 0 0 10 10 0.14
H-200..P11 Pump 0 0 0 4 4 0.06
H-200..E-206 Cooler 1,802 21.59 142 6 148 2.13
H-200..FSP-11 Flow Splitter 0 0 0 0 0 0
H-200..V-202 Flash Drum 0 0 0 0 0 0
H-200..V-203 Flash Drum 0 0 0 0 0 0
H-200..E-203A Cooler 296 3.54 7 1 8 0.11
H-200..E-204 Cooler 87 1.04 4 1 5 0.07
H-200..C-202 Rectifying Column 7 0.08 0 2 2 0.03
H-200..K-201 Compressor 0 0 0 1 1 0.01
H-200..MIX-12 Mixer 0 0 0 3 3 0.05
H-200..P12 Pump 0 0 0 0 0 0

Page 83 of 135
Table 3C: NEW Base Ethylene Oxide Production Process Technology – Energy and Exergy Loss Profile (Cont’d)
Energy Loss Exergy Loss = =
Unit OP Type Btu/lb Btu/lb
Total Total
External Total
Internal Total = = = =
8,345 % 1,175 5,772 6,947 %
CO2 RECOVERY H-300..C-301 Absorber 0 0 0 369 369 5.31 H-300..VLV-301 Valve 0 0 0 419 419 6.03
H-300..MIX15 Mixer 0 0 0 141 141 2.03
H-300..K-201 Compressor 0 0 0 146 146 2.1
H-300..V-301 Flash Drum 0 0 0 0 0 0
H-300..E-301 Ovd Condenser 243 2.91 35 0 35 0.5
H-300..P-C301 Pump 0 0 0 0 0 0
H-300..C-302 Compressor 0 0 0 0 0 0
H-300..MIX-17 Mixer 0 0 0 2 2 0.03
H-300..K-302 Compressor 0 0 0 0 0 0
H-300..E-302C Process Exchanger 0 0 0 18 18 0.26
H-300..C-303 Desorber 895 10.73 75 0 75 1.09
H-300..E-302B Heater 0 0 0 0 0 0
H-300..MIX-16 Mixer 0 0 0 0 0 0
H-300..P16 Pump 0 0 0 6 6 0.09
H-300..P15-6 Pump 0 0 0 0 0 0
H-300..E-301A Heater 0 0 0 40 40 0.58
H-300..V-302 Flash Drum 386 4.62 87 0 87 1.25
EO PURIFICATION H-400..C-401 EO Column 149 1.79 7 10 17 0.25
H-400..E-403 Cooler 0 0 0 0 0 0
H-400..V-401 Flash Drum 0 0 0 0 0 0 H-400..FSPT-22 Flow Splitter 0 0 0 0 0 0
H-400..E-401C Process Exchanger 0 0 0 4 4 0.05

Page 84 of 135
Table 3D: New Base Ethylene Oxide Production Process Technology – Stream Tables Stream ID .->1 .->2 .->3-1 .->3-2 .->3-3 .->3-4 .->4 .->4-1 Temperature F 230.00 230.00 320.49 328.11 480.00 308.11 200.00 182.94 Pressure psi 310.00 310.00 310.00 310.00 310.00 310.00 310.00 310.00 Vapor Frac 1.00 1.00 1.00 1.00 1.00 1.00 1.00 1.00 MoleFlow lbmol/hr 736. 652. 26553. 26559. 26281. 26281. 26281. 31113. MassFlow lb/hr 20751. 21000. 665142. 665232. 665142. 665142. 665142. 805927. ETHYLENE 19097. 0. 185697. 185695. 167105. 167105. 167105. 234286. OXYGEN 0. 20354. 67779. 67779. 47549. 47549. 47549. 49076. CO2 0. 0. 81568. 81580. 92056. 92056. 92056. 127339. ARGON 0. 646. 106764. 106765. 106764. 106764. 106764. 110055. METHANE 0. 0. 200369. 200479. 200321. 200321. 200321. 213741. ETHANE 1654. 0. 21285. 21287. 21285. 21285. 21285. 41178. EO 0. 0. 0. 2. 23911. 23911. 23911. 24007. ACET 0. 0. 0. 0. 34. 34. 34. 34. FORMAL 0. 0. 28. 28. 118. 118. 118. 118. WATER 0. 0. 1627. 1618. 5974. 5974. 5974. 6068. EG 0. 0. 21. 0. 21. 21. 21. 21. EDC 0. 0. 3. 0. 3. 3. 3. 3. K+ 0. 0. 0. 0. 0. 0. 0. 0. HCO3- 0. 0. 0. 0. 0. 0. 0. 0. CO3-- 0. 0. 0. 0. 0. 0. 0. 0. VolFlow cuft/hr 17565.35 15572.33 717112.90 724284.47 854890.25 698504.79 600152.66 692118.16 Enthalpy MMBtu/hr 14.68 0.70 -537.94 -535.97 -584.24 -634.24 -662.59 -794.28 Stream ID .->5 .->5-OUT .->5A .->6 .->6-1 .->7 .->8 .->8-1 Temperature F 100.79 100.79 100.00 101.09 101.09 132.68 120.14 134.87 Pressure psi 260.00 260.00 60.00 260.00 260.00 310.00 15.00 260.00 Vapor Frac 0.00 0.00 0.00 1.00 1.00 1.00 0.00 0.00 MoleFlow lbmol/hr 52616. 52615. 52615. 64. 25388. 22698. 53445. 58277. MassFlow lb/hr 974938. 974875. 974875. 1589. 633891. 566722. 1004606. 1145390. ETHYLENE 0. 0. 0. 417. 166565. 148861. 126. 67306. OXYGEN 0. 0. 0. 119. 47400. 42376. 30. 1557. CO2 0. 0. 0. 228. 91121. 81507. 708. 35992. ARGON 0. 0. 0. 267. 106414. 95133. 84. 3375. METHANE 0. 0. 0. 500. 199628. 178494. 193. 13614. ETHANE 0. 0. 0. 53. 21185. 18931. 48. 19942. EO 0. 0. 0. 0. 0. 0. 23911. 24007. ACET 0. 0. 0. 0. 0. 0. 34. 34. FORMAL 151. 80. 80. 0. 30. 26. 239. 239. WATER 936759. 936810. 936810. 4. 1548. 1393. 941179. 941273. EG 38025. 37979. 37979. 0. 0. 0. 38045. 38045. EDC 3. 5. 5. 0. 0. 0. 7. 7. K+ 0. 0. 0. 0. 0. 0. 0. 0. HCO3- 0. 0. 0. 0. 0. 0. 0. 0. CO3-- 0. 0. 0. 0. 0. 0. 0. 0. VolFlow cuft/hr 15856.83 15855.47 15848.49 1472.69 587604.12 465435.61 16556.68 20596.46 Enthalpy MMBtu/hr -6486.66 -6486.73 -6487.45 -1.61 -643.96 -569.65 -6519.29 -6635.38

Page 85 of 135
Table 3D: NEW Base Ethylene Oxide Production Process Technology – Stream Tables – Cont’d Stream ID .->8-4 .->8-5 .->8C .->8D .->12-0 .->12-1 .->14 .->14-2 Temperature F 350.00 100.00 120.14 120.14 59.69 59.65 586.58 665.83 Pressure psi 310.00 310.00 15.00 15.00 25.00 25.00 260.00 260.00 Vapor Frac 1.00 1.00 0.09 1.00 0.00 0.00 1.00 1.00 MoleFlow lbmol/hr 4832. 4832. 58277. 4832. 2141. 2141. 15. 16. MassFlow lb/hr 140784. 140784. 1145390. 140784. 52637. 52637. 356. 402. ETHYLENE 67181. 67181. 67306. 67181. 101. 101. 32. 25. OXYGEN 1527. 1527. 1557. 1527. 3. 3. 26. 27. CO2 35283. 35283. 35992. 35283. 597. 597. 98. 111. ARGON 3291. 3291. 3375. 3291. 9. 9. 53. 75. METHANE 13420. 13420. 13614. 13420. 44. 44. 134. 149. ETHANE 19893. 19893. 19942. 19893. 46. 46. 1. 2. EO 95. 95. 24007. 95. 22981. 22981. 0. 0. ACET 0. 0. 34. 0. 34. 34. 0. 0. FORMAL 0. 0. 239. 0. 156. 156. 0. 0. WATER 94. 94. 941273. 94. 28664. 28664. 11. 13. EG 0. 0. 38045. 0. 0. 0. 0. 0. EDC 0. 0. 7. 0. 1. 1. 0. 0. K+ 0. 0. 0. 0. 0. 0. 0. 0. HCO3- 0. 0. 0. 0. 0. 0. 0. 0. CO3-- 0. 0. 0. 0. 0. 0. 0. 0. VolFlow cuft/hr 135434.76 93616.87 2284076.41 2004374.32 884.77 874.90 628.09 752.47 Enthalpy MMBtu/hr -117.74 -131.69 -6635.38 -130.69 -215.93 -215.93 -0.61 -0.69 Stream ID .->14A6 .->15 .->15-2 .->17 .->21 .->22 .->A-3 .->BFW Temperature F 101.40 132.68 132.68 114.72 132.15 122.22 134.55 100.00 Pressure psi 260.00 310.00 310.00 310.00 60.00 60.00 310.00 214.70 Vapor Frac 1.00 1.00 1.00 1.00 0.00 0.00 1.00 0.00 MoleFlow lbmol/hr 25402. 2704. 25402. 2473. 1856. 260. 26559. 2203. MassFlow lb/hr 634247. 67524. 634247. 56758. 40345. 11353. 665232. 39695. ETHYLENE 166597. 17737. 166597. 17737. 17. 2. 185695. 0. OXYGEN 47426. 5049. 47426. 5049. 0. 0. 67779. 0. CO2 91219. 9711. 91219. 72. 94. 14. 81580. 0. ARGON 106468. 11335. 106468. 10986. 0. 0. 106765. 0. METHANE 199762. 21267. 199762. 21984. 2. 0. 200479. 0. ETHANE 21186. 2256. 21186. 702. 11. 2. 21287. 0. EO 0. 0. 0. 2. 11490. 11237. 2. 0. ACET 0. 0. 0. 0. 19. 15. 0. 0. FORMAL 30. 3. 30. 1. 104. 25. 28. 0. WATER 1559. 166. 1559. 224. 28606. 57. 1618. 39695. EG 0. 0. 0. 0. 0. 0. 0. 0. EDC 0. 0. 0. 0. 1. 0. 0. 0. K+ 0. 0. 0. 0. 0. 0. 0. 0. HCO3- 0. 0. 0. 0. 0. 0. 0. 0. CO3-- 0. 0. 0. 0. 0. 0. 0. 0. VolFlow cuft/hr 588269.15 55456.04 520891.67 47072.57 691.08 220.67 546324.06 648.09 Enthalpy MMBtu/hr -644.57 -67.87 -637.52 -31.70 -202.22 -8.72 -585.97 -269.77

Page 86 of 135
Table 3D: NEW Base Ethylene Oxide Production Process Technology – Stream Tables – Cont’d Stream ID
.->C-101-OV .->STEAM1 H-200.->5-2 H-200.->8 H-200.->8-A H-200.->8B H-200.->9 H-200.->10
Temperature F 101.09 387.91 146.49 120.14 227.14 120.18 100.00 258.83 Pressure psi 260.00 214.70 60.00 15.00 25.00 25.00 25.00 34.70 Vapor Frac 1.00 1.00 0.00 0.00 0.03 0.00 0.00 1.00 MoleFlow lbmol/hr 25451. 2203. 52615. 53445. 53445. 53445. 1771. 1235. MassFlow lb/hr 635479. 39695. 974875. 1004606. 1004606. 1004606. 31902. 22246. ETHYLENE 166982. 0. 0. 126. 126. 126. 0. 0. OXYGEN 47519. 0. 0. 30. 30. 30. 0. 0. CO2 91349. 0. 0. 708. 708. 708. 0. 0. ARGON 106681. 0. 0. 84. 84. 84. 0. 0. METHANE 200128. 0. 0. 193. 193. 193. 0. 0. ETHANE 21238. 0. 0. 48. 48. 48. 0. 0. EO 0. 0. 0. 23911. 23911. 23911. 0. 0. ACET 0. 0. 0. 34. 34. 34. 0. 0. FORMAL 30. 0. 80. 239. 239. 239. 0. 0. WATER 1552. 39695. 936810. 941179. 941179. 941179. 31902. 22246. EG 0. 0. 37979. 38045. 38045. 38045. 0. 0. EDC 0. 0. 5. 7. 7. 7. 0. 0. K+ 0. 0. 0. 0. 0. 0. 0. 0. HCO3- 0. 0. 0. 0. 0. 0. 0. 0. CO3-- 0. 0. 0. 0. 0. 0. 0. 0. VolFlow cuft/hr 589076.82 93348.71 16274.01 16556.68 488587.19 16557.06 520.86 274420.08 Enthalpy MMBtu/hr -645.57 -223.48 -6444.37 -6519.29 -6387.85 -6519.26 -216.81 -126.56
Stream ID H-200.->11 H-200.->11-
1 H-200.->11-
2 H-200.->11-
3 H-200.->11-
3A H-200.->12 H-200.->12-
1 H-200.->12-
2 Temperature F 146.49 239.48 239.61 270.00 146.49 59.65 150.00 59.65 Pressure psi 60.00 25.00 60.00 60.00 60.00 25.00 25.00 25.00 Vapor Frac 0.00 0.00 0.00 0.00 0.00 0.00 1.00 0.03 MoleFlow lbmol/hr 1909. 54545. 54545. 54524. 54524. 2141. 590. 2207. MassFlow lb/hr 35363. 1010238. 1010238. 1010238. 1010238. 52637. 23292. 55178. ETHYLENE 0. 0. 0. 0. 0. 101. 122. 169. OXYGEN 0. 0. 0. 0. 0. 3. 30. 32. CO2 0. 0. 0. 0. 0. 597. 689. 955. ARGON 0. 0. 0. 0. 0. 9. 83. 87. METHANE 0. 0. 0. 0. 0. 44. 192. 211. ETHANE 0. 0. 0. 0. 0. 46. 46. 64. EO 0. 931. 931. 0. 0. 22981. 20458. 24787. ACET 0. 0. 0. 0. 0. 34. 30. 35. FORMAL 3. 83. 83. 83. 83. 156. 124. 163. WATER 33982. 971173. 971173. 970792. 970792. 28664. 1517. 28674. EG 1378. 38045. 38045. 39356. 39356. 0. 0. 0. EDC 0. 6. 6. 6. 6. 1. 0. 1. K+ 0. 0. 0. 0. 0. 0. 0. 0. HCO3- 0. 0. 0. 0. 0. 0. 0. 0. CO3-- 0. 0. 0. 0. 0. 0. 0. 0. VolFlow cuft/hr 590.33 17878.68 17880.20 18251.35 16864.35 874.90 154396.53 15632.59 Enthalpy MMBtu/hr -233.77 -6580.29 -6580.15 -6546.73 -6678.14 -215.93 -22.00 -218.62

Page 87 of 135
Table 3D: NEW Base Ethylene Oxide Production Process Technology – Stream Tables – Cont’d Stream ID
H-200.->12-3
H-200.->12-4
H-200.->12-5
H-200.->12-6
H-200.->12-7
H-200.->12-8 H-200.->13 H-200.->A-5
Temperature F 150.00 60.00 59.65 74.99 122.22 75.05 95.00 100.00 Pressure psi 25.00 25.00 25.00 17.00 25.00 25.00 25.00 60.00 Vapor Frac 0.00 0.00 1.00 0.00 0.24 0.00 0.00 0.00 MoleFlow lbmol/hr 1316. 1316. 66. 1617. 2207. 1617. 251. 52615. MassFlow lb/hr 25224. 25224. 2541. 31886. 55178. 31886. 4522. 974875. ETHYLENE 4. 4. 68. 47. 169. 47. 0. 0. OXYGEN 0. 0. 28. 1. 32. 1. 0. 0. CO2 20. 20. 358. 266. 955. 266. 0. 0. ARGON 0. 0. 78. 4. 87. 4. 0. 0. METHANE 1. 1. 167. 19. 211. 19. 0. 0. ETHANE 2. 2. 18. 18. 64. 18. 0. 0. EO 2523. 2523. 1806. 4328. 24787. 4328. 0. 0. ACET 4. 4. 1. 5. 35. 5. 0. 0. FORMAL 33. 33. 7. 39. 163. 39. 0. 80. WATER 22637. 22637. 10. 27157. 28674. 27157. 4522. 936810. EG 0. 0. 0. 0. 0. 0. 0. 37979. EDC 1. 1. 0. 1. 1. 1. 0. 5. K+ 0. 0. 0. 0. 0. 0. 0. 0. HCO3- 0. 0. 0. 0. 0. 0. 0. 0. CO3-- 0. 0. 0. 0. 0. 0. 0. 0. VolFlow cuft/hr 428.11 405.84 14757.65 519.24 130612.64 519.25 73.63 15848.49 Enthalpy MMBtu/hr -154.64 -156.72 -2.69 -189.55 -211.55 -189.54 -30.75 -6487.45
Stream ID H-200.->A-
14 H-200.->A-
14-1 H-200.-
>C201-OVH H-200.-
>C201OVH1 H-300.->15-
2 H-300.->15-
3 H-300.->15-
4 H-300.->15-
4-1 Temperature F 665.83 91.56 221.53 150.00 617.08 229.88 203.78 232.50 Pressure psi 260.00 17.00 25.00 25.00 310.00 310.00 45.00 45.00 Vapor Frac 1.00 1.00 1.00 0.31 1.00 0.00 0.10 0.14 MoleFlow lbmol/hr 16. 16. 1906. 1906. 5483. 40555. 40555. 40555. MassFlow lb/hr 402. 402. 48517. 48517. 120876. 863219. 863219. 863219. ETHYLENE 25. 25. 126. 126. 64006. 64006. 64006. 64006. OXYGEN 27. 27. 30. 30. 1264. 1264. 1264. 1264. CO2 111. 111. 708. 708. 0. 0. 0. 0. ARGON 75. 75. 84. 84. 1990. 2487. 2487. 2487. METHANE 149. 149. 193. 193. 19987. 19987. 19987. 19987. ETHANE 2. 2. 48. 48. 0. 2909. 2909. 2909. EO 0. 0. 22981. 22981. 0. 12. 12. 12. ACET 0. 0. 34. 34. 0. 0. 0. 0. FORMAL 0. 0. 156. 156. 8. 11. 11. 11. WATER 13. 13. 24154. 24154. 33621. 598382. 598382. 598382. EG 0. 0. 0. 0. 0. 1. 1. 1. EDC 0. 0. 1. 1. 0. 0. 0. 0. K+ 0. 0. 0. 0. 0. 81594. 81594. 81594. HCO3- 0. 0. 0. 0. 0. 58924. 58924. 58924. CO3-- 0. 0. 0. 0. 0. 33643. 33643. 33643. VolFlow cuft/hr 752.47 5636.40 557249.27 154824.51 201192.50 17931.54 631638.77 931372.50 Enthalpy MMBtu/hr -0.69 -0.78 -151.97 -176.65 -150.56 -4643.85 -4643.85 -4601.00

Page 88 of 135
Table 3D: NEW Base Ethylene Oxide Production Process Technology – Stream Tables – Cont’d Stream ID
H-300.->15-5
H-300.->15-6
H-300.->15-7
H-300.->15-8 H-300.->16
H-300.->16-0
H-300.->16-1
H-300.->16-3
Temperature F 232.50 232.50 480.48 232.50 118.77 172.44 172.44 173.10 Pressure psi 45.00 45.00 310.00 45.00 310.00 17.00 17.00 310.00 Vapor Frac 1.00 0.00 1.00 0.00 0.00 0.00 0.00 0.00 MoleFlow lbmol/hr 5483. 35072. 8188. 35072. 35313. 35564. 35564. 35564. MassFlow lb/hr 120876. 742343. 188400. 742343. 731268. 736076. 736076. 736076. ETHYLENE 64006. 0. 81743. 0. 0. 0. 0. 0. OXYGEN 1264. 0. 6313. 0. 0. 0. 0. 0. CO2 0. 0. 9711. 0. 11538. 11600. 11600. 11600. ARGON 1990. 497. 13325. 497. 2. 3. 3. 3. METHANE 19987. 0. 41254. 0. 717. 514. 514. 514. ETHANE 0. 2909. 2256. 2909. 1337. 1907. 1907. 1907. EO 0. 12. 0. 12. 14. 9. 9. 9. ACET 0. 0. 0. 0. 0. 0. 0. 0. FORMAL 8. 3. 11. 3. 1. 2. 2. 2. WATER 33621. 564761. 33787. 564761. 573446. 577827. 577827. 577827. EG 0. 1. 0. 1. 1. 1. 1. 1. EDC 0. 0. 0. 0. 0. 0. 0. 0. K+ 0. 81594. 0. 81594. 81594. 81594. 81594. 81594. HCO3- 0. 58924. 0. 58924. 0. 0. 0. 0. CO3-- 0. 33643. 0. 33643. 62618. 62618. 62618. 62618. VolFlow cuft/hr 896155.00 10528.68 261693.85 10528.69 10165.14 10430.37 10430.37 10423.67 Enthalpy MMBtu/hr -174.49 -4435.74 -218.44 -4435.74 -4450.65 -4454.27 -4454.27 -4453.56
Stream ID H-300.->16-
5 H-300.->16-
7 H-300.->17 H-300.->17-
1 H-300.->17-
2 H-300.->17-
3 H-300.->17-
4 H-300.->17-
5 Temperature F 110.15 110.21 796.28 230.54 110.15 110.15 228.72 227.69 Pressure psi 310.00 312.00 310.00 310.00 310.00 310.00 45.00 45.00 Vapor Frac 0.00 0.00 1.00 1.00 0.92 1.00 1.00 0.00 MoleFlow lbmol/hr 220. 220. 10. 2683. 2683. 2463. 10. 35325. MassFlow lb/hr 4239. 4239. 309. 60689. 60689. 56450. 309. 743569. ETHYLENE 795. 795. 0. 18532. 18532. 17737. 0. 0. OXYGEN 35. 35. 0. 5084. 5084. 5049. 0. 0. CO2 0. 0. 72. 0. 0. 0. 72. 7305. ARGON 68. 68. 146. 10907. 10907. 10839. 146. 351. METHANE 588. 588. 0. 22572. 22572. 21984. 0. 1534. ETHANE 38. 38. 19. 721. 721. 684. 19. 2890. EO 0. 0. 0. 2. 2. 2. 0. 12. ACET 0. 0. 0. 0. 0. 0. 0. 0. FORMAL 0. 0. 0. 2. 2. 1. 0. 3. WATER 2715. 2715. 71. 2869. 2869. 153. 71. 567710. EG 0. 0. 0. 0. 0. 0. 0. 1. EDC 0. 0. 0. 0. 0. 0. 0. 0. K+ 0. 0. 0. 0. 0. 0. 0. 81594. HCO3- 0. 0. 0. 0. 0. 0. 0. 38466. CO3-- 0. 0. 0. 0. 0. 0. 0. 43703. VolFlow cuft/hr 168.08 168.08 426.94 62455.85 46692.86 46524.77 1610.17 10796.62 Enthalpy MMBtu/hr -18.99 -18.99 -0.65 -44.23 -50.04 -31.05 -0.70 -4438.09

Page 89 of 135
Table 3D: NEW Base Ethylene Oxide Production Process Technology – Stream Tables – Cont’d Stream ID
H-300.->17-6
H-300.->17-T H-300.->18 H-300.->19 H-300.->20
H-300.->20-1
H-300.->A-16
H-300.->A15
Temperature F 208.94 114.72 100.00 266.86 186.00 158.46 192.96 132.68 Pressure psi 45.00 310.00 310.00 39.70 17.00 17.00 310.00 310.00 Vapor Frac 0.00 1.00 1.00 1.00 1.00 1.00 0.00 1.00 MoleFlow lbmol/hr 35325. 2473. 96. 342. 419. 419. 35564. 2704. MassFlow lb/hr 743569. 56758. 1534. 6167. 13660. 13660. 736076. 67524. ETHYLENE 0. 17737. 0. 0. 0. 0. 0. 17737. OXYGEN 0. 5049. 0. 0. 0. 0. 0. 5049. CO2 7305. 72. 0. 0. 9577. 9577. 11600. 9711. ARGON 351. 10986. 0. 0. 348. 348. 3. 11335. METHANE 1534. 21984. 1534. 0. 1020. 1020. 514. 21267. ETHANE 2890. 702. 0. 0. 983. 983. 1907. 2256. EO 12. 2. 0. 0. 3. 3. 9. 0. ACET 0. 0. 0. 0. 0. 0. 0. 0. FORMAL 3. 1. 0. 0. 1. 1. 2. 3. WATER 567710. 224. 0. 6167. 1729. 1729. 577827. 166. EG 1. 0. 0. 0. 0. 0. 1. 0. EDC 0. 0. 0. 0. 0. 0. 0. 0. K+ 81594. 0. 0. 0. 0. 0. 81594. 0. HCO3- 38466. 0. 0. 0. 0. 0. 0. 0. CO3-- 43703. 0. 0. 0. 0. 0. 62618. 0. VolFlow cuft/hr 10715.51 47072.57 1791.96 66179.26 169935.08 162596.75 10496.00 55456.04 Enthalpy MMBtu/hr -4448.29 -31.70 -3.06 -35.08 -49.60 -49.71 -4443.36 -67.87
Stream ID H-400.->12-
2 H-400.->12-
4 H-400.->12-
5 H-400.->21-
0 H-400.->21-
1 H-400.->22-
1 H-400.->22-
2 H-400.->22-
3 Temperature F 59.69 59.97 78.34 153.13 132.15 122.20 122.22 122.22 Pressure psi 25.00 62.00 62.00 60.00 60.00 60.00 60.00 60.00 Vapor Frac 0.00 0.00 0.00 0.00 0.00 0.00 0.00 1.00 MoleFlow lbmol/hr 2141. 2141. 2141. 1856. 1856. 650. 650. 0. MassFlow lb/hr 52637. 52637. 52637. 40345. 40345. 28385. 28385. 4. ETHYLENE 101. 101. 101. 17. 17. 6. 6. 0. OXYGEN 3. 3. 3. 0. 0. 0. 0. 0. CO2 597. 597. 597. 94. 94. 36. 36. 0. ARGON 9. 9. 9. 0. 0. 0. 0. 0. METHANE 44. 44. 44. 2. 2. 1. 1. 0. ETHANE 46. 46. 46. 11. 11. 4. 4. 0. EO 22981. 22981. 22981. 11490. 11490. 28095. 28095. 3. ACET 34. 34. 34. 19. 19. 38. 38. 0. FORMAL 156. 156. 156. 104. 104. 62. 62. 0. WATER 28664. 28664. 28664. 28606. 28606. 143. 143. 0. EG 0. 0. 0. 0. 0. 0. 0. 0. EDC 1. 1. 1. 1. 1. 0. 0. 0. K+ 0. 0. 0. 0. 0. 0. 0. 0. HCO3- 0. 0. 0. 0. 0. 0. 0. 0. CO3-- 0. 0. 0. 0. 0. 0. 0. 0. VolFlow cuft/hr 884.77 875.10 886.39 701.37 691.08 551.73 560.09 8.41 Enthalpy MMBtu/hr -215.93 -215.92 -215.16 -201.46 -202.22 -21.81 -21.81 0.00

Page 90 of 135
Table 3D: NEW Base Ethylene Oxide Production Process Technology – Stream Tables – Cont’d Stream ID
H-400.->22-4
H-400.->22-5
H-400.->401-OVHD H-400.->S8
Temperature F 122.22 122.22 52.86 122.22 Pressure psi 60.00 60.00 60.00 60.00 Vapor Frac 0.00 0.00 1.00 0.00 MoleFlow lbmol/hr 260. 390. 25. 650. MassFlow lb/hr 11353. 17029. 936. 28382. ETHYLENE 2. 4. 82. 6. OXYGEN 0. 0. 3. 0. CO2 14. 21. 489. 36. ARGON 0. 0. 9. 0. METHANE 0. 0. 42. 1. ETHANE 2. 2. 33. 4. EO 11237. 16855. 250. 28092. ACET 15. 23. 0. 38. FORMAL 25. 37. 27. 62. WATER 57. 86. 0. 143. EG 0. 0. 0. 0. EDC 0. 0. 0. 0. K+ 0. 0. 0. 0. HCO3- 0. 0. 0. 0. CO3-- 0. 0. 0. 0. VolFlow cuft/hr 220.67 331.00 2261.76 551.67 Enthalpy MMBtu/hr -8.72 -13.08 -2.11 -21.81

Page 91 of 135
Figure 3C – New Base EO Process – pt 1
HIERARCHY
H-200
HIERARCHY
H-300
HIERARCHY
H-4008 12-1
14-2
5A
15
17
12-0
21
22
3-13-3 3-4
14A6
15-2
7
4-1
5
8-1
C-101-OV
4
8-5
6-1
14
6
8-4
1
2
A-3
3-2
8D
BFW STEAM1
5-OUTR-101
E-101H
K-101FSP-7
C-101
MIX-4
VLV1
MIX11
FSP5
E-103
E-102
MIX-7
E-101C
K-102
E-STEAM
V-101A
P-5
R-101EO Reactor
C-101Absorber
E-SteamSteam Generation
E-101HProcess Heater
K-101Recycle Compressor
K-102Compressor
H-200Seperatin Section
H-300CO2 Recovery Section
H-400EO- Purification

Page 92 of 135
Figure 3D – New Base EO Process – pt 2
88(IN)12-1(OUT)
A-1414-2(OUT)
A-55A(OUT)
10
9
8-A C201-OVH
11-2
11-3 11-3A
5-2
11
12-1
12-3
12-2
12-5
12-7
12-4
13
A-14-1
12-6
12-8
C-201
E-202P8
E-201C
R202V201
P11E-201H
E-206
FSP-11
V-202
V-203
E-203A
E-204C-202
K-201
MIX-12
P12
C-201Stripping Column
R202V202Hydrolyser C-202
Reabsorber

Page 93 of 135
Appendix 4 – Ammonia Table 4A: Alternative Ammonia Production Process Technology – Energy and Exergy Loss Profile
Energy Loss Exergy Loss = =
Unit OP Type Btu/lb Btu/lb
Total Total External Total
Internal Total = = = =
5,725 % 1,353 2,734 4,087 %
PREHEATING/REFORMING
..COMP3 Methane Comp 151 2.63 25 65 90 2.21
..E-101 Process Preheater 0 0 0 1 1 0.02
..MIX1 Ref1 Feed Mixer 0 0 0 87 87 2.14
..COMP4 Process Air Comp 218 3.82 0 133 133 3.25
..E-103 Process Air Preheater 0 0 0 3 3 0.07
..REF1 Primary Reformer 0 0 0 36 36 0.87
..E-112 Process Air Preheater 0 0 0 0 0 0
..E201 Ref1 Effluent Heat Losses 74 1.3 53 0 53 1.31
..REF2 Secondary Reformer 118 2.06 91 469 560 13.69
..FLOW1 Flow Splitter 0 0 0 0 0 0
..WB Waste Heat Boiler 0 0 0 517 517 12.66
SHIFT ..CONV Shift Converter 19 0.33 8 158 165 4.04
GAS UPGRADING ..SEP1 Syn Gas Separator 2506 43.78 590 113 702 17.18
..MET Methanator 1 0.01 0 24 25 0.6
..E104 Process Heat Exchanger 0 0 0 38 38 0.93
..FLOW2 Flow Splitter 0 0 0 0 0 0
AMMONIA SYN ..E-105 Process Gas Cooler 93 1.63 8 1 9 0.22
..MIX3 Comp6 Feed Mixer 0 0 0 12 12 0.29
..MIX5 Mixer 0 0 0 0 0 0
..V-101 Knock Out Drum 0 0 0 0 0 0
..COMP5 Hp Syn Gas Comp 628 10.96 10 303 313 7.66
..COMP6 Recir Gas Comp 57 1 4 46 49 1.21
..SYN Syn Gas Reactor 58 1.01 33 276 308 7.54
..SEP2 Ammonia Seprator#1 30 0.53 4 0 4 0.09
..SEP3 Ammonia Separator #2 36 0.63 18 0 18 0.43
..E106 Feed Water Pre-Heater 0 0 0 270 270 6.59
..E107 Process Heat Exchanger 0 0 0 127 127 3.1
..E-108 Process Gas Cooler 360 6.29 30 0 30 0.75
..E109 Process Heat Exchanger 0 0 0 14 14 0.34
..E-110 Process Gas Cooler 446 7.79 166 0 166 4.05
..MIX4 Product Mixer 0 0 0 0 0 0.01

Page 94 of 135
Table 4A: Alternative Ammonia Production Process Technology – Energy and Exergy Loss Profile (Cont’d) Energy Loss Exergy Loss
= = Unit OP Type Btu/lb Btu/lb
Total Total External Total
Internal Total = = = =
5,725 % 1,353 2,734 4,087 %
RESIDUAL NH3 REMOVAL ABS-STRP..FSPLT-75 Flow Splitter 0 0 0 0 0 0
ABS-STRP..E-73 Cooler 93 1.63 10 0 10 0.25
ABS-STRP..P71 Pump 0 0 0 3 3 0.08
ABS-STRP..C-402 Stripper 237 4.14 121 0 121 2.96
ABS-STRP..C-401 Absorber 0 0 0 15 15 0.36
ABS-STRP..MIX79 Mixer 0 0 0 0 0 0
ABS-STRP..E-51 Cooler 343 5.99 105 0 105 2.57
ABS-STRP..FLOW4 Flow Splitter 0 0 0 0 0 0
ABS-STRP..K84 Compressor 0 0 0 0 0 0
HEAT RECOVERY
..E-601 Heat
Recovery 257 4.49 79 25 104 2.54
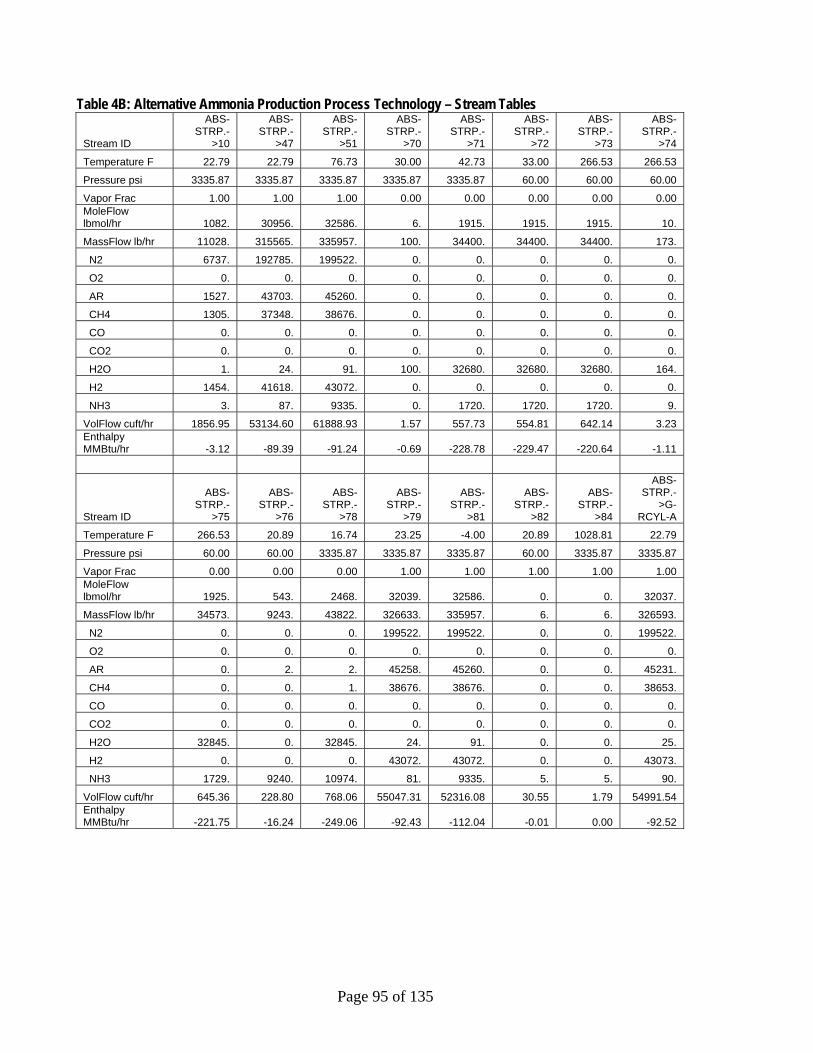
Page 95 of 135
Table 4B: Alternative Ammonia Production Process Technology – Stream Tables
Stream ID
ABS-STRP.-
>10
ABS-STRP.-
>47
ABS-STRP.-
>51
ABS-STRP.-
>70
ABS-STRP.-
>71
ABS-STRP.-
>72
ABS-STRP.-
>73
ABS-STRP.-
>74
Temperature F 22.79 22.79 76.73 30.00 42.73 33.00 266.53 266.53
Pressure psi 3335.87 3335.87 3335.87 3335.87 3335.87 60.00 60.00 60.00
Vapor Frac 1.00 1.00 1.00 0.00 0.00 0.00 0.00 0.00 MoleFlow lbmol/hr 1082. 30956. 32586. 6. 1915. 1915. 1915. 10.
MassFlow lb/hr 11028. 315565. 335957. 100. 34400. 34400. 34400. 173.
N2 6737. 192785. 199522. 0. 0. 0. 0. 0.
O2 0. 0. 0. 0. 0. 0. 0. 0.
AR 1527. 43703. 45260. 0. 0. 0. 0. 0.
CH4 1305. 37348. 38676. 0. 0. 0. 0. 0.
CO 0. 0. 0. 0. 0. 0. 0. 0.
CO2 0. 0. 0. 0. 0. 0. 0. 0.
H2O 1. 24. 91. 100. 32680. 32680. 32680. 164.
H2 1454. 41618. 43072. 0. 0. 0. 0. 0.
NH3 3. 87. 9335. 0. 1720. 1720. 1720. 9.
VolFlow cuft/hr 1856.95 53134.60 61888.93 1.57 557.73 554.81 642.14 3.23 Enthalpy MMBtu/hr -3.12 -89.39 -91.24 -0.69 -228.78 -229.47 -220.64 -1.11
Stream ID
ABS-STRP.-
>75
ABS-STRP.-
>76
ABS-STRP.-
>78
ABS-STRP.-
>79
ABS-STRP.-
>81
ABS-STRP.-
>82
ABS-STRP.-
>84
ABS-STRP.-
>G-RCYL-A
Temperature F 266.53 20.89 16.74 23.25 -4.00 20.89 1028.81 22.79
Pressure psi 60.00 60.00 3335.87 3335.87 3335.87 60.00 3335.87 3335.87
Vapor Frac 0.00 0.00 0.00 1.00 1.00 1.00 1.00 1.00 MoleFlow lbmol/hr 1925. 543. 2468. 32039. 32586. 0. 0. 32037.
MassFlow lb/hr 34573. 9243. 43822. 326633. 335957. 6. 6. 326593.
N2 0. 0. 0. 199522. 199522. 0. 0. 199522.
O2 0. 0. 0. 0. 0. 0. 0. 0.
AR 0. 2. 2. 45258. 45260. 0. 0. 45231.
CH4 0. 0. 1. 38676. 38676. 0. 0. 38653.
CO 0. 0. 0. 0. 0. 0. 0. 0.
CO2 0. 0. 0. 0. 0. 0. 0. 0.
H2O 32845. 0. 32845. 24. 91. 0. 0. 25.
H2 0. 0. 0. 43072. 43072. 0. 0. 43073.
NH3 1729. 9240. 10974. 81. 9335. 5. 5. 90.
VolFlow cuft/hr 645.36 228.80 768.06 55047.31 52316.08 30.55 1.79 54991.54 Enthalpy MMBtu/hr -221.75 -16.24 -249.06 -92.43 -112.04 -0.01 0.00 -92.52

Page 96 of 135
Table 4B: Alternative Ammonia Production Process Technology – Stream Tables – Cont’d
Stream ID
ABS-STRP.-
>G-RCYL-B .->3 .->4 .->5 .->7 .->8 .->9 .->9A
Temperature F 23.27 76.73 76.73 76.73 76.73 76.73 77.35 76.73
Pressure psi 3335.87 464.12 14.50 14.50 14.50 14.50 650.34 650.34
Vapor Frac 1.00 0.00 1.00 1.00 0.00 1.00 0.00 0.00 MoleFlow lbmol/hr 32039. 10778. 2761. 3954. 6049. 2807. 95. 90.
MassFlow lb/hr 326639. 194168. 44290. 112592. 108969. 119014. 1707. 1625.
N2 199522. 0. 0. 84801. 0. 0. 0. 0.
O2 0. 0. 0. 26087. 0. 0. 0. 0.
AR 45258. 0. 0. 1557. 0. 0. 0. 0.
CH4 38676. 0. 44290. 0. 0. 0. 0. 0.
CO 0. 0. 0. 0. 0. 183. 0. 0.
CO2 0. 0. 0. 0. 0. 117569. 0. 0.
H2O 24. 194168. 0. 0. 108969. 1128. 1707. 1625.
H2 43072. 0. 0. 147. 0. 134. 0. 0.
NH3 87. 0. 0. 0. 0. 0. 0. 0.
VolFlow cuft/hr 55049.62 3130.12 1093274.30 1568668.78 1756.66 1108158.51 27.53 26.19 Enthalpy MMBtu/hr -92.43 -1333.10 -88.48 -0.02 -748.29 -458.82 -11.72 -11.15
Stream ID .->9B .->9C .->9D .->11 .->12 .->12A .->12B .->15
Temperature F 85.73 85.73 85.73 36.76 1138.02 1138.02 76.73 458.33
Pressure psi 1121.58 1934.28 3335.87 3335.87 464.12 464.12 14.70 464.12
Vapor Frac 0.00 0.00 0.00 0.00 1.00 1.00 0.00 0.00 MoleFlow lbmol/hr 1. 2. 1. 5573. 849. 10778. 849. 10778.
MassFlow lb/hr 20. 41. 23. 94910. 15300. 194168. 15300. 194168.
N2 0. 0. 0. 0. 0. 0. 0. 0.
O2 0. 0. 0. 0. 0. 0. 0. 0.
AR 0. 0. 0. 2. 0. 0. 0. 0.
CH4 0. 0. 0. 0. 0. 0. 0. 0.
CO 0. 0. 0. 0. 0. 0. 0. 0.
CO2 0. 0. 0. 0. 0. 0. 0. 0.
H2O 20. 41. 23. 0. 15300. 194168. 15300. 194168.
H2 0. 0. 0. 0. 0. 0. 0. 0.
NH3 0. 0. 0. 94908. 0. 0. 0. 0.
VolFlow cuft/hr 0.32 0.66 0.37 2394.77 30841.24 391386.30 246.65 4132.37 Enthalpy MMBtu/hr -0.13 -0.28 -0.15 -164.39 -80.66 -1023.65 -105.07 -1248.24

Page 97 of 135
Table 4B: Alternative Ammonia Production Process Technology – Stream Tables – Cont’d Stream ID .->16 .->18 .->19 .->20 .->21 .->22 .->23 .->24
Temperature F 1138.02 301.73 580.73 391.73 710.33 1021.73 978.25 1471.73
Pressure psi 464.12 478.62 464.12 493.13 464.12 464.12 464.12 435.11
Vapor Frac 1.00 1.00 1.00 1.00 1.00 1.00 1.00 1.00 MoleFlow lbmol/hr 9929. 2761. 2761. 3954. 3954. 3954. 12689. 16933.
MassFlow lb/hr 178868. 44290. 44290. 112592. 112592. 112592. 223158. 223158.
N2 0. 0. 0. 84801. 84801. 84801. 0. 0.
O2 0. 0. 0. 26087. 26087. 26087. 0. 0.
AR 0. 0. 0. 1557. 1557. 1557. 0. 0.
CH4 0. 44290. 44290. 0. 0. 0. 44290. 10255.
CO 0. 0. 0. 0. 0. 0. 0. 25655.
CO2 0. 0. 0. 0. 0. 0. 0. 53061.
H2O 178868. 0. 0. 0. 0. 0. 178868. 118927.
H2 0. 0. 0. 147. 147. 147. 0. 15261.
NH3 0. 0. 0. 0. 0. 0. 0. 0.
VolFlow cuft/hr 360545.06 46381.23 66498.13 73913.05 108081.26 136751.82 414819.97 810064.26 Enthalpy MMBtu/hr -942.99 -83.10 -74.34 8.59 17.79 27.07 -1017.33 -756.57
Stream ID .->25 .->26 .->27 .->28 .->29 .->30 .->31 .->32
Temperature F 1426.73 1885.73 661.73 440.33 76.73 85.73 622.51 710.33
Pressure psi 435.11 420.61 414.81 406.11 14.50 394.50 388.70 382.90
Vapor Frac 1.00 1.00 1.00 1.00 0.00 1.00 1.00 1.00 MoleFlow lbmol/hr 16933. 21350. 21350. 24092. 2742. 12494. 12494. 12329.
MassFlow lb/hr 223158. 335750. 335750. 385142. 49392. 107767. 107767. 107767.
N2 0. 84801. 84801. 84801. 0. 84801. 84801. 84801.
O2 0. 0. 0. 0. 0. 0. 0. 0.
AR 0. 1557. 1557. 1557. 0. 1557. 1557. 1557.
CH4 10255. 0. 0. 0. 0. 0. 0. 1329.
CO 25655. 44591. 44591. 2503. 0. 2320. 2320. 0.
CO2 53061. 51439. 51439. 117569. 0. 0. 0. 0.
H2O 118927. 137449. 137449. 159771. 49392. 282. 282. 1774.
H2 15261. 15913. 15913. 18942. 0. 18808. 18808. 18307.
NH3 0. 0. 0. 0. 0. 0. 0. 0.
VolFlow cuft/hr 791149.36 1283383.02 618464.09 565498.41 796.23 187547.32 376490.70 407457.43 Enthalpy MMBtu/hr -763.62 -747.74 -972.33 -1313.27 -339.17 -4.86 42.25 42.20

Page 98 of 135
Table 4B: Alternative Ammonia Production Process Technology – Stream Tables – Cont’d Stream ID .->33 .->34 .->35 .->35A .->36 .->37 .->38 .->39
Temperature F 170.33 85.73 85.73 85.73 40.10 50.00 391.73 776.93
Pressure psi 380.00 377.10 3335.87 3335.87 3335.87 3625.94 3625.94 3625.94
Vapor Frac 1.00 0.99 1.00 1.00 1.00 1.00 1.00 1.00 MoleFlow lbmol/hr 12329. 12329. 12234. 12235. 43189. 43189. 43189. 37616.
MassFlow lb/hr 107767. 107767. 106060. 106083. 421625. 421625. 421625. 421625.
N2 84801. 84801. 84801. 84801. 277586. 277586. 277586. 199522.
O2 0. 0. 0. 0. 0. 0. 0. 0.
AR 1557. 1557. 1557. 1557. 45260. 45260. 45260. 45260.
CH4 1329. 1329. 1329. 1329. 38676. 38676. 38676. 38676.
CO 0. 0. 0. 0. 0. 0. 0. 0.
CO2 0. 0. 0. 0. 0. 0. 0. 0.
H2O 1774. 1774. 67. 89. 91. 91. 91. 91.
H2 18307. 18307. 18307. 18307. 59925. 59925. 59925. 43072.
NH3 0. 0. 0. 0. 87. 87. 87. 95003.
VolFlow cuft/hr 221741.39 192230.62 23958.96 23959.33 77111.16 73118.32 119488.41 147435.47 Enthalpy MMBtu/hr -4.91 -13.78 -2.22 -2.37 -91.61 -88.29 22.06 16.59
Stream ID .->40 .->41 .->42 .->43 .->44 .->45 .->46 .->47
Temperature F 503.39 144.89 85.00 85.73 46.60 -4.27 -4.27 22.79
Pressure psi 3335.87 3335.87 3335.87 3335.87 3335.87 3335.87 3335.87 3335.87
Vapor Frac 1.00 1.00 0.94 1.00 0.96 0.93 1.00 1.00 MoleFlow lbmol/hr 37616. 37616. 37616. 35227. 35227. 35227. 32586. 30956.
MassFlow lb/hr 421625. 421625. 421625. 380933. 380933. 380933. 335957. 315565.
N2 199522. 199522. 199522. 199522. 199522. 199522. 199522. 192785.
O2 0. 0. 0. 0. 0. 0. 0. 0.
AR 45260. 45260. 45260. 45260. 45260. 45260. 45260. 43703.
CH4 38676. 38676. 38676. 38676. 38676. 38676. 38676. 37348.
CO 0. 0. 0. 0. 0. 0. 0. 0.
CO2 0. 0. 0. 0. 0. 0. 0. 0.
H2O 91. 91. 91. 91. 91. 91. 91. 24.
H2 43072. 43072. 43072. 43072. 43072. 43072. 43072. 41618.
NH3 95003. 95003. 95003. 54311. 54311. 54311. 9335. 87.
VolFlow cuft/hr 124902.16 77094.50 67261.90 66116.90 60245.84 53378.79 52283.37 53134.60 Enthalpy MMBtu/hr -68.26 -178.61 -211.73 -145.84 -166.71 -190.58 -112.11 -89.39

Page 99 of 135
Table 4B: Alternative Ammonia Production Process Technology – Stream Tables – Cont’d Stream ID .->48 .->49 .->203 .->H2OS .->NH3-3
Temperature F 85.73 -4.27 76.73 76.73 20.89
Pressure psi 3335.87 3335.87 3335.87 14.50 60.00
Vapor Frac 0.00 0.00 1.00 0.00 0.00 MoleFlow lbmol/hr 2389. 2641. 32586. 8790. 543.
MassFlow lb/hr 40692. 44976. 335957. 158361. 9243.
N2 0. 0. 199522. 0. 0.
O2 0. 0. 0. 0. 0.
AR 0. 0. 45260. 0. 2.
CH4 0. 0. 38676. 0. 0.
CO 0. 0. 0. 0. 0.
CO2 0. 0. 0. 0. 0.
H2O 0. 0. 91. 158361. 0.
H2 0. 0. 43072. 0. 0.
NH3 40692. 44976. 9335. 0. 9240.
VolFlow cuft/hr 1096.44 1081.83 61888.93 2552.89 228.80 Enthalpy MMBtu/hr -68.30 -79.86 -91.24 -1087.46 -16.24

Page 100 of 135
Figure 4A – Alternative Ammonia Process – pt 1
HIERARCHY
ABS-STRP
203
NH3- 3
47
23
24
31
32
22
25 26
27
29
28
18 19
20
21
16
12A
12
H2OS
7
30
33
34
48
49
11
44
45
43
46
35
36
15
39
3
40
37
41
38
42
5
9A
9B9C
35A
4
9D
8
9
12B
REF1
MET REF2
CONV
E- 101
E- 103
MIX1
FLOW1
E- 112
FLOW2
E104
E- 105
MIX4
E- 110E109MIX3
WB
E106
E107
E- 108
E201
COMP4
COMP5
COMP3
COMP6
V- 101
SEP1
MIX5
SEP3
SEP2
ZH12
SYN
COMP3Methane Comp
COMP4Process Air Comp
WBWaste Heat Boiler
COMP5HP Syn Gas Comp
SYNSyn Gas Reactor
CONVShift Converter
METMethanator
SEP1Syn Gas Separator
SEP2 &SEP3Ammonia Separator
REF1Primary Reformer

Page 101 of 135
Figure 4B – Alternative Ammonia Process – Pt 2
203(I N)
76 NH3-3(OUT)
4747(OUT)
74
7372
71
78
82
70
81
7984
G-RCYL-B
G-RCYL-A
10
FSPLT-75
E-73P71
C-402
C-401
MIX79
E-51
FLOW4K84
C-401Residual NH3 Water Absorber
C-402NH3 Stripper
K-84Rcycle compressor

Page 102 of 135
Figure 4C – Base Ammonia Case
2324
31
32
22
2526
27
29
28
18
19
20
21
16
12A
12
H2OS
7
30
33
34
38
39
48
49
11
44
45
203
10
47
43
46
35
36
15
3
40
37
4142
5
9A
9B9C
35A
4
9D
8
9
REF1
MET
REF2
CONV
E-101
E-103
MIX1
FLOW1
E-112
FLOW2
E104
E-105
SYN
MIX4
E-110
FLOW4
E109
MIX3
WB
E106
E107
E-108
E201
COMP4
COMP5
COMP3
COMP6
V-101
SEP1
MIX5
SEP3
SEP2
COMP3Methane Comp
COMP4Process Air Comp
WBWaste Heat Boiler
COMP5HP Syn Gas Comp
COMP6Recir Gas Comp
REF1Primary Reformer
REF2Secondary Reformer
METMethanator
SEPA1Syn Gas Separator
SYNSyn Gas Reactor
SEPA2 &SEPA3Ammonia Separator
CONVShift Converter

Page 103 of 135
Appendix 5 – Purified Terephthalic Acid (PTA) Table 5A: Alternative PTA/IPA Combined Production Process Technology – Energy and Exergy Loss Profile
Energy Loss Exergy Loss = =
Unit OP Type Btu/lb Btu/lb
Total Total
External Total
Internal Total = = = =
9,345 % 2,222 2,996 5,218 %
Feed Prep
H-100..C-F1 Lights Separator 216 2.26 2 64 66 1.24
H-100..C-F2 O-xylene Separator 1554 16.27 430 18 448 8.4
H-100..C-F3 O-Xylene Rectifier 206 2.16 115 3 117 2.2
Oxidation
H-200..MX-100 Acetic Acid Mixer 0 0 0 2 2 0.03
H-200..V-101 Catalyst Dissolver 0 0 0 0 0 0
H-200..MX-101 Feed/Recycle Mixer 0 0 0 2 2 0.05
H-200..V-102 Catalyst Solution Tank 0 0 0 13 13 0.24
H-200..K-101 Air Compressor 0 0 0 46 46 0.86
H-200..FS-101 Flow Splitter: Air 0 0 0 0 0 0
H-200..R-101 Oxidation Reactor 1399 14.65 508 1760 2268 42.5
H-200..E-101
Reactor Product Condenser 247 2.59 45 19 64 1.2
H-200..V-103 Condensate De-Gasser 0 0 0 2 2 0.04
H-200..R101VL
Knock Out Tank 67 0.7 24 4 28 0.52
H-200..R-102 MeAcetate Converter 8 0.09 1 13 14 0.26
H-200..C-101 Hp-Acetic Scrubber 0 0 0 1 1 0.01
H-200..R-103 MeAcetate Converter 0 0 0 0 0 0
H-200..S-105 N2-Expander 61 0.64 61 29 89 1.68 H-200..PSA-G104 N2-Separator 25 0.26 3 -7 -4 -0.08

Page 104 of 135
Table 5A: Alternative PTA/IPA Combined Production Process Technology – Energy and Exergy Loss Profile (Cont’d)
Energy Loss Exergy Loss = =
Unit OP Type Btu/lb Btu/lb
Total Total
External Total
Internal Total = = = =
9,345 2,222 2,996 5,218 0 % 0 0 0 %
CTA Crystallizer
H-200..S-101 Crystallizer No. 1 0 0 0 2 2 0.03
H-200..E-102 S-101 Condenser 48 0.5 11 4 15 0.28
H-200..V-104 De-Gas Tank 0 0 0 0 0 0
H-200..S-102 Crystallizer No. 2 44 0.46 14 3 17 0.32
H-200..E-103 S-102 Condenser 1 0.01 0 0 0 0.01
H-200..V-105 De-Gas Tank 0 0 0 0 0 0
H-200..MIX11+13 Mixer 0 0 0 0 0 0
H-200..MIX10+12 Mixer 0 0 0 1 1 0.01
H-200..S-103 Crystallizer No. 3 102 1.07 23 13 36 0.67
H-200..E-104 S-103 Condenser 1 0.01 0 0 0 0
H-200..V-106 De-Gas Tank 0 0 0 0 0 0
H-200..MIX9+14 Mixer 0 0 0 0 0 0
H-200..MX-104 Mixer 0 0 0 0 0 0
H-200..V-107 Slurry Tank 0 0 0 0 0 0
H-200..S-104 Belt Filter 0 0 0 -14 -14 -0.26
H-200..V-108 De-Gas Tank 0 0 0 0 0 0
H-200..M:18A+32 Mixer 0 0 0 1 1 0.02
H-200..SP-V109L
Flow Splitter: V-109 LIQ. 0 0 0 0 0 0
H-200..V-109
Mother Liquor Tank 0 0 0 0 0 0

Page 105 of 135
Table 5A: Alternative PTA/IPA Combined Production Process Technology – Energy and Exergy Loss Profile (Cont’d)
Energy Loss Exergy Loss = =
Unit OP Type Btu/lb Btu/lb
Total Total
External Total
Internal Total = = = =
9,345 % 2,222 2,996 5,218 %
H-200..C-102 Acetic Acid Stripper 0 0 0 4 4 0.08
H-200..MIX24+26 Mixer 0 0 0 9 9 0.17 H-200..MIX17+23 Mixer 0 0 0 -3 -3 -0.06
H-200..E-105
C-210 Overhead Cooler 18 0.19 5 0 5 0.1
H-200..V-110 Condensate Hold Tank 79 0.83 15 7 22 0.41
H-200..C-103
C-103 Solvent Dehydrator 1776 18.59 238 298 535 10.04
H-200..SPLIT:31 Flow Splitter 0 0 0 0 0 0 H-200..PUMP21 R-103 Pump 0 0 0 0 0 0
Hydrogenation
H-300..T-201 Inhibitor Tank 0 0 0 0 0 0
H-300..V-201 Slurry Tank 12 0.13 6 2 8 0.15
H-300..P-201 V-201 Pump 0 0 0 4 4 0.09
H-300..MX-201 Mixer 0 0 0 27 27 0.51
H-300..E-201 Dowtherm Heater 0 0 0 56 56 1.08
H-300..E-207 Cooler 47 0.51 11 1 12 0.22
H-300..S:E204HP Flow Splitter 0 0 0 0 0 0 H-300..E-204HOT Flow Splitter 0 0 0 270 270 5.17 H-300..SP-C201T Flow Splitter 0 0 0 0 0 0
H-300..V-202 Slurry Dissolver 0 0 0 0 0 0
H-300..C-201 Solvent Evaporator 0 0 0 96 96 1.84
H-300..M:39B+40 Mixer 0 0 0 0 0 0

Page 106 of 135
Table 5A: Alternative PTA/IPA Combined Production Process Technology – Energy and Exergy Loss Profile (Cont’d)
Energy Loss Exergy Loss = =
Unit OP Type Btu/lb Btu/lb
Total Total
External Total
Internal Total = = = =
9,345 % 2,222 2,996 5,218 %
H-300..K-40 Compressor 0 0 0 0 0 0
H-300..R-201 Hydrogenation Reactor 0 0 0 0 0 0
PTA/ISO-PA Purification
H-300..E-205 S-205 Condenser 0 0 0 0 0 0
H-300..E-206 Process Water Cooler 192 2.01 29 2 31 0.58
H-300..MIXFILTR Mixer 0 0 0 10 10 0.18
H-300..S-202 Crystallizer 426 4.46 139 39 179 3.35
H-300..E-202 S-202 Condenser 2 0.02 1 0 1 0.01
H-300..V-203 Separator 0 0 0 0 0 0
H-300..S-203 Crystallizer 77 0.81 23 2 25 0.46
H-300..V-204 Condensate Separator 0 0 0 0 0 0
H-300..E-203 S-203 Condenser 0 0 0 0 0 0
H-300..V-205 Holding Tank 0 0 0 0 0 0
H-300..PUMP45 V-205 Pump 0 0 0 0 0 0.01
H-300..S-204 Centrifuge Separator 0 0 0 -25 -25 -0.47
H-300..S:FILTER Flow Splitter 0 0 0 0 0 0
H-300..V-206 Re-Slurry Vessel 641 6.71 189 -37 153 2.86
H-300..MX-204 Mixer 0 0 0 4 4 0.08
H-300..S-205 Crystallizer 0 0 0 0 0 0
H-300..V-207 Condensate Separator 0 0 0 0 0 0

Page 107 of 135
Table 5A: Alternative PTA/IPA Combined Production Process Technology – Energy and Exergy Loss Profile (Cont’d)
Energy Loss Exergy Loss = =
Unit OP Type Btu/lb Btu/lb
Total Total External Total
Internal Total = = = =
9,345 % 2,222 2,996 5,218 %
H-300..V-208 Knock Out Tank 156 1.63 32 7 39 0.74
H-300..S-206 Vacuum Filter 0 0 0 0 0 0
H-300..SPLIT:51
Flow Splitter 0 0 0 0 0 0
Product Refining H-400..MIX-100 Mixer 0 0 0 188 188 3.61
H-400..E-301 Cooler 457 4.9 127 12 138 2.65 H-400..SEP-301 Separator 0 0 0 0 0 0
H-400..E-302 Cooler 345 3.69 80 11 91 1.74 H-400..SEP-302 Separator 0 0 0 0 0 0
H-400..E-303 Cooler 1,343 14.37 205 17 221 4.24 H-400..SEP-303 Separator 0 0 0 0 0 0
H-400..P50 Pump 0 0 0 1 1 0.01 H-400..MIX-50 Mixer 0 0 0 19 19 0.37

Page 108 of 135
Table 5B: Alternative PTA/IPA Combined Production Process Technology – Stream Tables Stream ID H-100.->81 H-100.->82 H-100.->83 H-100.->84 H-100.->85 H-100.->86 H-100.->87 H-100.->88 Temperature F 100.00 82.95 82.95 286.49 282.25 297.91 291.30 338.55 Pressure psi 14.70 14.70 14.70 14.70 14.70 14.70 14.70 14.70 Vapor Frac 0.00 1.00 0.00 0.00 0.00 0.00 0.00 0.00 MoleFlow lbmol/hr 534. 8. 40. 485. 341. 144. 121. 23. MassFlow lb/hr 55477. 282. 3248. 51946. 36275. 15671. 12856. 2815. N2 0. 0. 0. 0. 0. 0. 0. 0. H2 2. 2. 0. 0. 0. 0. 0. 0. O2 0. 0. 0. 0. 0. 0. 0. 0. CO 0. 0. 0. 0. 0. 0. 0. 0. CO2 0. 0. 0. 0. 0. 0. 0. 0. ACETICAC 0. 0. 0. 0. 0. 0. 0. 0. P-XYLENE 10867. 0. 1. 10866. 10768. 98. 98. 0. M-XYLENE 24358. 0. 2. 24356. 23815. 541. 541. 0. O-XYLENE 12153. 0. 0. 12153. 97. 12056. 12034. 22. TPA 0. 0. 0. 0. 0. 0. 0. 0. CH3ACET 0. 0. 0. 0. 0. 0. 0. 0. TOLUICAC 0. 0. 0. 0. 0. 0. 0. 0. 4-CBA 0. 0. 0. 0. 0. 0. 0. 0. HBR 0. 0. 0. 0. 0. 0. 0. 0. BZIOCAC 0. 0. 0. 0. 0. 0. 0. 0. PHTHA-01 0. 0. 0. 0. 0. 0. 0. 0. ISOPH-01 0. 0. 0. 0. 0. 0. 0. 0. TRIMELAC 0. 0. 0. 0. 0. 0. 0. 0. METHANOL 0. 0. 0. 0. 0. 0. 0. 0. WATER 0. 0. 0. 0. 0. 0. 0. 0. C1P 0. 0. 0. 0. 0. 0. 0. 0. C2O 0. 0. 0. 0. 0. 0. 0. 0. C2P 209. 192. 17. 0. 0. 0. 0. 0. C3P 5. 4. 1. 0. 0. 0. 0. 0. C4P 7. 4. 3. 0. 0. 0. 0. 0. C5P 10. 3. 8. 0. 0. 0. 0. 0. C6P 2. 0. 2. 0. 0. 0. 0. 0. C7P 0. 0. 0. 0. 0. 0. 0. 0. C8N 5. 0. 0. 5. 5. 0. 0. 0. C8P 4. 0. 2. 2. 2. 0. 0. 0. C9N 0. 0. 0. 0. 0. 0. 0. 0. C9P 314. 0. 0. 314. 314. 0. 0. 0. BEN 2314. 70. 2244. 0. 0. 0. 0. 0. TOL 976. 9. 967. 1. 1. 0. 0. 0. EB 1275. 0. 0. 1275. 1274. 1. 1. 0. PB 42. 0. 0. 42. 0. 42. 40. 3. MEB 226. 0. 0. 226. 0. 226. 49. 177. TMB 2293. 0. 0. 2293. 0. 2293. 92. 2201. DEB 280. 0. 0. 280. 0. 280. 2. 278. DMEB 134. 0. 0. 134. 0. 134. 1. 133. VolFlow cuft/hr 1778.01 3288.59 60.51 1098.17 770.77 327.78 267.34 60.57 Enthalpy MMBtu/hr -4.99 -0.21 0.63 -0.89 -0.57 -0.31 0.01 -0.26

Page 109 of 135
Table 5B: Alternative PTA/IPA Combined Production Process Technology – Stream Tables
Stream ID H-200.->1 H-200.->1A H-200.->2 H-200.->2A H-200.->3 H-200.->4 H-200.->5 H-200.->5A Temperature F 100.00 533.53 282.25 282.25 100.00 236.04 228.32 377.60 Pressure psi 14.70 71.01 14.70 14.70 15.00 14.70 14.70 215.00 Vapor Frac 1.00 1.00 0.00 0.00 0.00 0.01 0.00 1.00 MoleFlow lbmol/hr 5187. 5187. 341. 341. 47. 1384. 1645. 9622. MassFlow lb/hr 149641. 149641. 36275. 36275. 2823. 77829. 110200. 312804. N2 114787. 114787. 0. 0. 0. 0. 0. 115418. H2 0. 0. 0. 0. 0. 0. 0. 0. O2 34854. 34854. 0. 0. 0. 0. 0. 5258. CO 0. 0. 0. 0. 0. 0. 0. 0. CO2 0. 0. 0. 0. 0. 0. 0. 0. ACETICAC 0. 0. 0. 0. 2823. 54938. 53249. 109827. P-XYLENE 0. 0. 10768. 10768. 0. 24. 10386. 883. M-XYLENE 0. 0. 23815. 23815. 0. 71. 23081. 1868. O-XYLENE 0. 0. 97. 97. 0. 0. 94. 0. TPA 0. 0. 0. 0. 0. 269. 269. 0. CH3ACET 0. 0. 0. 0. 0. 0. 0. 0. TOLUICAC 0. 0. 0. 0. 0. 158. 158. 8. 4-CBA 0. 0. 0. 0. 0. 14. 14. 0. HBR 0. 0. 0. 0. 0. 0. 0. 0. BZIOCAC 0. 0. 0. 0. 0. 221. 221. 0. PHTHA-01 0. 0. 0. 0. 0. 3. 3. 1. ISOPH-01 0. 0. 0. 0. 0. 596. 596. 0. TRIMELAC 0. 0. 0. 0. 0. 8. 8. 0. METHANOL 0. 0. 0. 0. 0. 0. 0. 0. WATER 0. 0. 0. 0. 0. 6124. 5440. 59914. C1P 0. 0. 0. 0. 0. 0. 0. 0. C2O 0. 0. 0. 0. 0. 0. 0. 0. C2P 0. 0. 0. 0. 0. 0. 0. 0. C3P 0. 0. 0. 0. 0. 0. 0. 0. C4P 0. 0. 0. 0. 0. 0. 0. 0. C5P 0. 0. 0. 0. 0. 0. 0. 0. C6P 0. 0. 0. 0. 0. 0. 0. 0. C7P 0. 0. 0. 0. 0. 0. 0. 0. C8N 0. 0. 5. 5. 0. 175. 175. 234. C8P 0. 0. 2. 2. 0. 0. 2. 0. C9N 0. 0. 0. 0. 0. 0. 0. 0. C9P 0. 0. 314. 314. 0. 15229. 15272. 17287. BEN 0. 0. 0. 0. 0. 0. 0. 0. TOL 0. 0. 1. 1. 0. 0. 1. 1. EB 0. 0. 1274. 1274. 0. 1. 1233. 2105. PB 0. 0. 0. 0. 0. 0. 0. 0. MEB 0. 0. 0. 0. 0. 0. 0. 0. TMB 0. 0. 0. 0. 0. 0. 0. 0. DEB 0. 0. 0. 0. 0. 0. 0. 0. DMEB 0. 0. 0. 0. 0. 0. 0. 0. VolFlow cuft/hr 2118432.13 779492.08 770.77 770.77 42.78 7902.42 2014.86 387354.12 Enthalpy MMBtu/hr 0.82 16.72 -0.57 -0.57 -9.20 -233.13 -224.59 -670.95

Page 110 of 135
Table 5B: Alternative PTA/IPA Combined Production Process Technology – Stream Tables Stream ID
H-200.->5A1
H-200.->5A2 H-200.->5B H-200.->6 H-200.->7 H-200.->8 H-200.->8A H-200.->9
Temperature F 230.00 163.40 377.60 163.40 366.80 163.40 152.60 125.60 Pressure psi 215.00 215.00 215.00 210.00 139.00 210.00 180.00 139.00 Vapor Frac 0.48 0.45 0.00 0.00 0.00 1.00 1.00 0.00 MoleFlow lbmol/hr 9622. 9622. 2161. 5309. 2020. 4313. 4313. 141. MassFlow lb/hr 312804. 312804. 136284. 190743. 131144. 122061. 122061. 5128. N2 115418. 115418. 93. 1871. 31. 113546. 113546. 40. H2 0. 0. 0. 0. 0. 0. 0. 0. O2 5258. 5258. 8. 201. 17. 5057. 5057. 27. CO 0. 0. 0. 0. 0. 0. 0. 0. CO2 0. 0. 0. 0. 0. 0. 0. 0. ACETICAC 109827. 109827. 51899. 108434. 48954. 1393. 1393. 2935. P-XYLENE 883. 883. 138. 756. 118. 128. 128. 19. M-XYLENE 1868. 1868. 396. 1630. 352. 239. 239. 42. O-XYLENE 0. 0. 0. 0. 0. 0. 0. 0. TPA 0. 0. 15943. 0. 15943. 0. 0. 0. CH3ACET 0. 0. 0. 0. 0. 0. 0. 0. TOLUICAC 8. 8. 240. 8. 240. 0. 0. 0. 4-CBA 0. 0. 118. 0. 118. 0. 0. 0. HBR 0. 0. 0. 0. 0. 0. 0. 0. BZIOCAC 0. 0. 431. 0. 431. 0. 0. 0. PHTHA-01 1. 1. 150. 1. 150. 0. 0. 0. ISOPH-01 0. 0. 35362. 0. 35362. 0. 0. 0. TRIMELAC 0. 0. 32. 0. 32. 0. 0. 0. METHANOL 0. 0. 0. 0. 0. 0. 0. 0. WATER 59914. 59914. 15203. 58630. 13657. 1283. 1283. 1537. C1P 0. 0. 0. 0. 0. 0. 0. 0. C2O 0. 0. 0. 0. 0. 0. 0. 0. C2P 0. 0. 0. 0. 0. 0. 0. 0. C3P 0. 0. 0. 0. 0. 0. 0. 0. C4P 0. 0. 0. 0. 0. 0. 0. 0. C5P 0. 0. 0. 0. 0. 0. 0. 0. C6P 0. 0. 0. 0. 0. 0. 0. 0. C7P 0. 0. 0. 0. 0. 0. 0. 0. C8N 234. 234. 173. 231. 167. 2. 2. 6. C8P 0. 0. 2. 0. 2. 0. 0. 0. C9N 0. 0. 0. 0. 0. 0. 0. 0. C9P 17287. 17287. 15134. 17146. 14666. 140. 140. 467. BEN 0. 0. 0. 0. 0. 0. 0. 0. TOL 1. 1. 1. 1. 1. 0. 0. 0. EB 2105. 2105. 961. 1833. 904. 272. 272. 55. PB 0. 0. 0. 0. 0. 0. 0. 0. MEB 0. 0. 0. 0. 0. 0. 0. 0. TMB 0. 0. 0. 0. 0. 0. 0. 0. DEB 0. 0. 0. 0. 0. 0. 0. 0. DMEB 0. 0. 0. 0. 0. 0. 0. 0. VolFlow cuft/hr 162798.39 136984.24 2332.62 3350.10 2205.77 136942.38 156661.32 87.59 Enthalpy MMBtu/hr -758.02 -771.79 -381.11 -762.46 -362.10 -9.28 -9.75 -20.40

Page 111 of 135
Table 5B: Alternative PTA/IPA Combined Production Process Technology – Stream Tables Stream ID H-200.->10
H-200.->10+12 H-200.->11
H-200.->11+13 H-200.->12 H-200.->13 H-200.->14 H-200.->15
Temperature F 125.60 124.05 329.00 328.77 125.60 125.60 125.60 232.34 Pressure psi 139.00 77.00 77.00 77.00 77.00 77.00 17.00 17.00 Vapor Frac 1.00 1.00 0.00 0.00 1.00 0.00 0.00 0.00 MoleFlow lbmol/hr 52. 53. 2016. 2019. 1. 3. 2. 2016. MassFlow lb/hr 1507. 1531. 131005. 131121. 23. 116. 72. 131032. N2 1170. 1186. 14. 15. 17. 0. 0. 5. H2 0. 0. 0. 0. 0. 0. 0. 0. O2 313. 319. 11. 11. 6. 0. 0. 6. CO 0. 0. 0. 0. 0. 0. 0. 0. CO2 0. 0. 0. 0. 0. 0. 0. 0. ACETICAC 10. 10. 48887. 48954. 0. 67. 42. 48911. P-XYLENE 1. 1. 117. 118. 0. 0. 0. 118. M-XYLENE 2. 2. 351. 352. 0. 1. 1. 351. O-XYLENE 0. 0. 0. 0. 0. 0. 0. 0. TPA 0. 0. 15943. 15943. 0. 0. 0. 15943. CH3ACET 0. 0. 0. 0. 0. 0. 0. 0. TOLUICAC 0. 0. 240. 240. 0. 0. 0. 240. 4-CBA 0. 0. 118. 118. 0. 0. 0. 118. HBR 0. 0. 0. 0. 0. 0. 0. 0. BZIOCAC 0. 0. 431. 431. 0. 0. 0. 431. PHTHA-01 0. 0. 150. 150. 0. 0. 0. 150. ISOPH-01 0. 0. 35362. 35362. 0. 0. 0. 35362. TRIMELAC 0. 0. 32. 32. 0. 0. 0. 32. METHANOL 0. 0. 0. 0. 0. 0. 0. 0. WATER 9. 9. 13622. 13657. 0. 35. 21. 13635. C1P 0. 0. 0. 0. 0. 0. 0. 0. C2O 0. 0. 0. 0. 0. 0. 0. 0. C2P 0. 0. 0. 0. 0. 0. 0. 0. C3P 0. 0. 0. 0. 0. 0. 0. 0. C4P 0. 0. 0. 0. 0. 0. 0. 0. C5P 0. 0. 0. 0. 0. 0. 0. 0. C6P 0. 0. 0. 0. 0. 0. 0. 0. C7P 0. 0. 0. 0. 0. 0. 0. 0. C8N 0. 0. 166. 167. 0. 0. 0. 166. C8P 0. 0. 2. 2. 0. 0. 0. 2. C9N 0. 0. 0. 0. 0. 0. 0. 0. C9P 1. 1. 14655. 14666. 0. 11. 7. 14659. BEN 0. 0. 0. 0. 0. 0. 0. 0. TOL 0. 0. 1. 1. 0. 0. 0. 1. EB 2. 2. 902. 903. 0. 2. 1. 902. PB 0. 0. 0. 0. 0. 0. 0. 0. MEB 0. 0. 0. 0. 0. 0. 0. 0. TMB 0. 0. 0. 0. 0. 0. 0. 0. DEB 0. 0. 0. 0. 0. 0. 0. 0. DMEB 0. 0. 0. 0. 0. 0. 0. 0. VolFlow cuft/hr 2353.73 4307.56 2148.23 2159.36 64.66 1.98 1.23 2027.36 Enthalpy MMBtu/hr -0.07 -0.07 -364.12 -364.58 0.00 -0.47 -0.29 -370.02

Page 112 of 135
Table 5B: Alternative PTA/IPA Combined Production Process Technology – Stream Tables Stream ID H-200.->16 H-200.->17 H-200.->18
H-200.->18A H-200.->19 H-200.->20 H-200.->21
H-200.->21A
Temperature F 357.80 231.68 231.68 231.80 231.68 231.80 126.95 152.60 Pressure psi 150.00 17.00 17.00 30.00 17.00 30.00 180.00 180.00 Vapor Frac 0.01 0.41 0.00 0.00 0.00 0.00 0.00 0.00 MoleFlow lbmol/hr 359. 622. 1126. 225. 627. 901. 223. 223. MassFlow lb/hr 6501. 27446. 53107. 10609. 56979. 42499. 4031. 4031. N2 1. 6. 0. 0. 0. 0. 5. 5. H2 0. 0. 0. 0. 0. 0. 0. 0. O2 1. 7. 0. 0. 0. 0. 4. 4. CO 0. 0. 0. 0. 0. 0. 0. 0. CO2 0. 0. 0. 0. 0. 0. 0. 0. ACETICAC 37. 3667. 45097. 9008. 184. 36089. 18. 18. P-XYLENE 0. 0. 118. 24. 0. 94. 0. 0. M-XYLENE 0. 0. 352. 70. 0. 282. 1. 1. O-XYLENE 0. 0. 0. 0. 0. 0. 0. 0. TPA 0. 12. 147. 29. 15785. 118. 0. 0. CH3ACET 0. 0. 0. 0. 0. 0. 0. 0. TOLUICAC 0. 35. 174. 35. 32. 139. 0. 0. 4-CBA 0. 4. 47. 9. 68. 37. 0. 0. HBR 0. 0. 0. 0. 0. 0. 0. 0. BZIOCAC 0. 117. 259. 52. 55. 207. 0. 0. PHTHA-01 0. 0. 1. 0. 148. 1. 0. 0. ISOPH-01 0. 26. 326. 65. 35009. 261. 0. 0. TRIMELAC 0. 2. 29. 6. 0. 23. 0. 0. METHANOL 0. 0. 0. 0. 0. 0. 0. 0. WATER 6460. 7839. 6558. 1310. 5698. 5248. 3999. 3999. C1P 0. 0. 0. 0. 0. 0. 0. 0. C2O 0. 0. 0. 0. 0. 0. 0. 0. C2P 0. 0. 0. 0. 0. 0. 0. 0. C3P 0. 0. 0. 0. 0. 0. 0. 0. C4P 0. 0. 0. 0. 0. 0. 0. 0. C5P 0. 0. 0. 0. 0. 0. 0. 0. C6P 0. 0. 0. 0. 0. 0. 0. 0. C7P 0. 0. 0. 0. 0. 0. 0. 0. C8N 0. 166. 0. 0. 0. 0. 0. 0. C8P 0. 2. 0. 0. 0. 0. 0. 0. C9N 0. 0. 0. 0. 0. 0. 0. 0. C9P 0. 14659. 0. 0. 0. 0. 0. 0. BEN 0. 0. 0. 0. 0. 0. 0. 0. TOL 0. 1. 0. 0. 0. 0. 0. 0. EB 2. 904. 0. 0. 0. 0. 4. 4. PB 0. 0. 0. 0. 0. 0. 0. 0. MEB 0. 0. 0. 0. 0. 0. 0. 0. TMB 0. 0. 0. 0. 0. 0. 0. 0. DEB 0. 0. 0. 0. 0. 0. 0. 0. DMEB 0. 0. 0. 0. 0. 0. 0. 0. VolFlow cuft/hr 344.59 111669.75 923.74 184.54 711.68 739.29 66.89 67.90 Enthalpy MMBtu/hr -42.18 -72.57 -190.88 -38.13 -145.51 -152.75 -27.13 -27.03

Page 113 of 135
Table 5B: Alternative PTA/IPA Combined Production Process Technology – Stream Tables Stream ID
H-200.->21X H-200.->22 H-200.->23 H-200.->24 H-200.->25 H-200.->26 H-200.->27 H-200.->28
Temperature F 125.60 147.26 148.36 266.74 297.74 124.17 288.97 261.62 Pressure psi 16.00 180.00 180.00 25.00 25.00 80.00 50.00 20.00 Vapor Frac 0.00 1.00 0.00 1.00 0.00 1.00 0.18 1.00 MoleFlow lbmol/hr 223. 4302. 233. 879. 23. 54. 856. 932. MassFlow lb/hr 4031. 120742. 5350. 40635. 1863. 1547. 32796. 42183. N2 5. 113473. 78. 0. 0. 1196. 84. 1196. H2 0. 0. 0. 0. 0. 0. 0. 0. O2 4. 5052. 9. 0. 0. 324. 15. 324. CO 0. 0. 0. 0. 0. 0. 0. 0. CO2 0. 0. 0. 0. 0. 0. 0. 0. ACETICAC 18. 4. 1406. 35118. 971. 11. 5073. 35129. P-XYLENE 0. 127. 1. 71. 24. 1. 1. 71. M-XYLENE 1. 237. 3. 198. 84. 2. 3. 200. O-XYLENE 0. 0. 0. 0. 0. 0. 0. 0. TPA 0. 0. 0. 0. 118. 0. 12. 0. CH3ACET 0. 0. 0. 0. 0. 0. 0. 0. TOLUICAC 0. 0. 0. 0. 138. 0. 35. 0. 4-CBA 0. 0. 0. 0. 37. 0. 4. 0. HBR 0. 0. 0. 0. 0. 0. 0. 0. BZIOCAC 0. 0. 0. 0. 207. 0. 117. 0. PHTHA-01 0. 0. 0. 0. 1. 0. 0. 0. ISOPH-01 0. 0. 0. 0. 261. 0. 26. 0. TRIMELAC 0. 0. 0. 0. 23. 0. 2. 0. METHANOL 0. 0. 0. 0. 0. 0. 0. 0. WATER 3999. 1576. 3706. 5248. 0. 10. 11545. 5257. C1P 0. 0. 0. 0. 0. 0. 0. 0. C2O 0. 0. 0. 0. 0. 0. 0. 0. C2P 0. 0. 0. 0. 0. 0. 0. 0. C3P 0. 0. 0. 0. 0. 0. 0. 0. C4P 0. 0. 0. 0. 0. 0. 0. 0. C5P 0. 0. 0. 0. 0. 0. 0. 0. C6P 0. 0. 0. 0. 0. 0. 0. 0. C7P 0. 0. 0. 0. 0. 0. 0. 0. C8N 0. 0. 2. 0. 0. 0. 169. 0. C8P 0. 0. 0. 0. 0. 0. 2. 0. C9N 0. 0. 0. 0. 0. 0. 0. 0. C9P 0. 0. 140. 0. 0. 1. 14799. 1. BEN 0. 0. 0. 0. 0. 0. 0. 0. TOL 0. 0. 0. 0. 0. 0. 1. 0. EB 4. 272. 4. 0. 0. 3. 907. 3. PB 0. 0. 0. 0. 0. 0. 0. 0. MEB 0. 0. 0. 0. 0. 0. 0. 0. TMB 0. 0. 0. 0. 0. 0. 0. 0. DEB 0. 0. 0. 0. 0. 0. 0. 0. DMEB 0. 0. 0. 0. 0. 0. 0. 0. VolFlow cuft/hr 66.84 155244.76 92.41 267934.83 28.69 4190.43 25124.23 354953.28 Enthalpy MMBtu/hr -27.14 -7.06 -29.72 -136.78 -4.43 -0.07 -102.29 -136.85

Page 114 of 135
Table 5B: Alternative PTA/IPA Combined Production Process Technology – Stream Tables Stream ID H-200.->29 H-200.->30 H-200.->31 H-200.->32 H-200.->33 H-200.->34 H-200.->35
H-200.->35A
Temperature F 124.35 125.60 125.60 245.69 125.60 238.88 12.08 147.26 Pressure psi 80.00 16.00 16.00 16.00 16.00 14.70 50.00 180.00 Vapor Frac 0.01 1.00 0.00 0.00 0.00 0.01 1.00 1.00 MoleFlow lbmol/hr 143. 74. 862. 984. 639. 1208. 3654. 3654. MassFlow lb/hr 5201. 2886. 15600. 61285. 11569. 71893. 102387. 102387. N2 40. 1220. 21. 0. 15. 0. 102126. 102126. H2 0. 0. 0. 0. 0. 0. 0. 0. O2 27. 338. 14. 0. 11. 0. 253. 253. CO 0. 0. 0. 0. 0. 0. 0. 0. CO2 0. 0. 0. 0. 0. 0. 0. 0. ACETICAC 2977. 0. 70. 43082. 52. 52090. 0. 0. P-XYLENE 19. 90. 1. 0. 1. 24. 0. 0. M-XYLENE 43. 242. 3. 0. 2. 71. 0. 0. O-XYLENE 0. 0. 0. 0. 0. 0. 0. 0. TPA 0. 0. 0. 12. 0. 41. 0. 0. CH3ACET 0. 0. 0. 0. 0. 0. 0. 0. TOLUICAC 0. 0. 0. 36. 0. 70. 0. 0. 4-CBA 0. 0. 0. 4. 0. 13. 0. 0. HBR 0. 0. 0. 0. 0. 0. 0. 0. BZIOCAC 0. 0. 0. 118. 0. 169. 0. 0. PHTHA-01 0. 0. 0. 0. 0. 0. 0. 0. ISOPH-01 0. 0. 0. 26. 0. 91. 0. 0. TRIMELAC 0. 0. 0. 2. 0. 8. 0. 0. METHANOL 0. 0. 0. 0. 0. 0. 0. 0. WATER 1558. 166. 15475. 2600. 11477. 3910. 8. 8. C1P 0. 0. 0. 0. 0. 0. 0. 0. C2O 0. 0. 0. 0. 0. 0. 0. 0. C2P 0. 0. 0. 0. 0. 0. 0. 0. C3P 0. 0. 0. 0. 0. 0. 0. 0. C4P 0. 0. 0. 0. 0. 0. 0. 0. C5P 0. 0. 0. 0. 0. 0. 0. 0. C6P 0. 0. 0. 0. 0. 0. 0. 0. C7P 0. 0. 0. 0. 0. 0. 0. 0. C8N 6. 0. 0. 175. 0. 175. 0. 0. C8P 0. 2. 0. 0. 0. 0. 0. 0. C9N 0. 0. 0. 0. 0. 0. 0. 0. C9P 474. 0. 1. 15229. 1. 15229. 0. 0. BEN 0. 0. 0. 0. 0. 0. 0. 0. TOL 0. 0. 0. 0. 0. 0. 0. 0. EB 56. 826. 15. 1. 11. 1. 0. 0. PB 0. 0. 0. 0. 0. 0. 0. 0. MEB 0. 0. 0. 0. 0. 0. 0. 0. TMB 0. 0. 0. 0. 0. 0. 0. 0. DEB 0. 0. 0. 0. 0. 0. 0. 0. DMEB 0. 0. 0. 0. 0. 0. 0. 0. VolFlow cuft/hr 155.43 29039.91 258.67 1117.32 191.83 6809.88 368959.38 132049.05 Enthalpy MMBtu/hr -20.69 -0.80 -105.03 -169.33 -77.89 -207.46 -1.74 1.65

Page 115 of 135
Table 5B: Alternative PTA/IPA Combined Production Process Technology – Stream Tables Stream ID H-200.->36 H-200.->38 H-200.->54 H-200.->57 H-200.->74 H-200.->100
H-200.->AIR2R101
H-200.->AIR2S101
Temperature F 147.26 100.00 12.08 362.24 125.60 100.00 533.53 533.53 Pressure psi 180.00 14.70 50.00 150.00 15.00 14.70 71.01 71.01 Vapor Frac 0.88 0.00 1.00 0.00 0.00 0.00 1.00 1.00 MoleFlow lbmol/hr 648. 327. 2779. 148. 7. 446. 5135. 52. MassFlow lb/hr 18355. 34755. 77865. 3511. 269. 47378. 148145. 1496. N2 11347. 0. 77667. 0. 0. 0. 113639. 1148. H2 0. 0. 0. 0. 0. 0. 0. 0. O2 4799. 0. 192. 0. 0. 0. 34505. 349. CO 0. 0. 0. 0. 0. 0. 0. 0. CO2 0. 0. 0. 0. 0. 0. 0. 0. ACETICAC 4. 0. 0. 102. 201. 0. 0. 0. P-XYLENE 127. 34583. 0. 0. 0. 47144. 0. 0. M-XYLENE 237. 86. 0. 0. 0. 117. 0. 0. O-XYLENE 0. 86. 0. 0. 0. 117. 0. 0. TPA 0. 0. 0. 227. 0. 0. 0. 0. CH3ACET 0. 0. 0. 0. 0. 0. 0. 0. TOLUICAC 0. 0. 0. 87. 0. 0. 0. 0. 4-CBA 0. 0. 0. 0. 0. 0. 0. 0. HBR 0. 0. 0. 0. 0. 0. 0. 0. BZIOCAC 0. 0. 0. 52. 0. 0. 0. 0. PHTHA-01 0. 0. 0. 2. 0. 0. 0. 0. ISOPH-01 0. 0. 0. 504. 0. 0. 0. 0. TRIMELAC 0. 0. 0. 0. 0. 0. 0. 0. METHANOL 0. 0. 0. 0. 0. 0. 0. 0. WATER 1569. 0. 6. 2535. 68. 0. 0. 0. C1P 0. 0. 0. 0. 0. 0. 0. 0. C2O 0. 0. 0. 0. 0. 0. 0. 0. C2P 0. 0. 0. 0. 0. 0. 0. 0. C3P 0. 0. 0. 0. 0. 0. 0. 0. C4P 0. 0. 0. 0. 0. 0. 0. 0. C5P 0. 0. 0. 0. 0. 0. 0. 0. C6P 0. 0. 0. 0. 0. 0. 0. 0. C7P 0. 0. 0. 0. 0. 0. 0. 0. C8N 0. 0. 0. 0. 0. 0. 0. 0. C8P 0. 0. 0. 0. 0. 0. 0. 0. C9N 0. 0. 0. 0. 0. 0. 0. 0. C9P 0. 0. 0. 0. 0. 0. 0. 0. BEN 0. 0. 0. 0. 0. 0. 0. 0. TOL 0. 0. 0. 0. 0. 0. 0. 0. EB 272. 0. 0. 0. 0. 0. 0. 0. PB 0. 0. 0. 0. 0. 0. 0. 0. MEB 0. 0. 0. 0. 0. 0. 0. 0. TMB 0. 0. 0. 0. 0. 0. 0. 0. DEB 0. 0. 0. 0. 0. 0. 0. 0. DMEB 0. 0. 0. 0. 0. 0. 0. 0. VolFlow cuft/hr 20597.38 656.61 280593.61 65.29 4.45 895.10 771697.22 7794.92 Enthalpy MMBtu/hr -10.07 -3.09 -1.32 -18.43 -1.12 -4.21 16.55 0.17
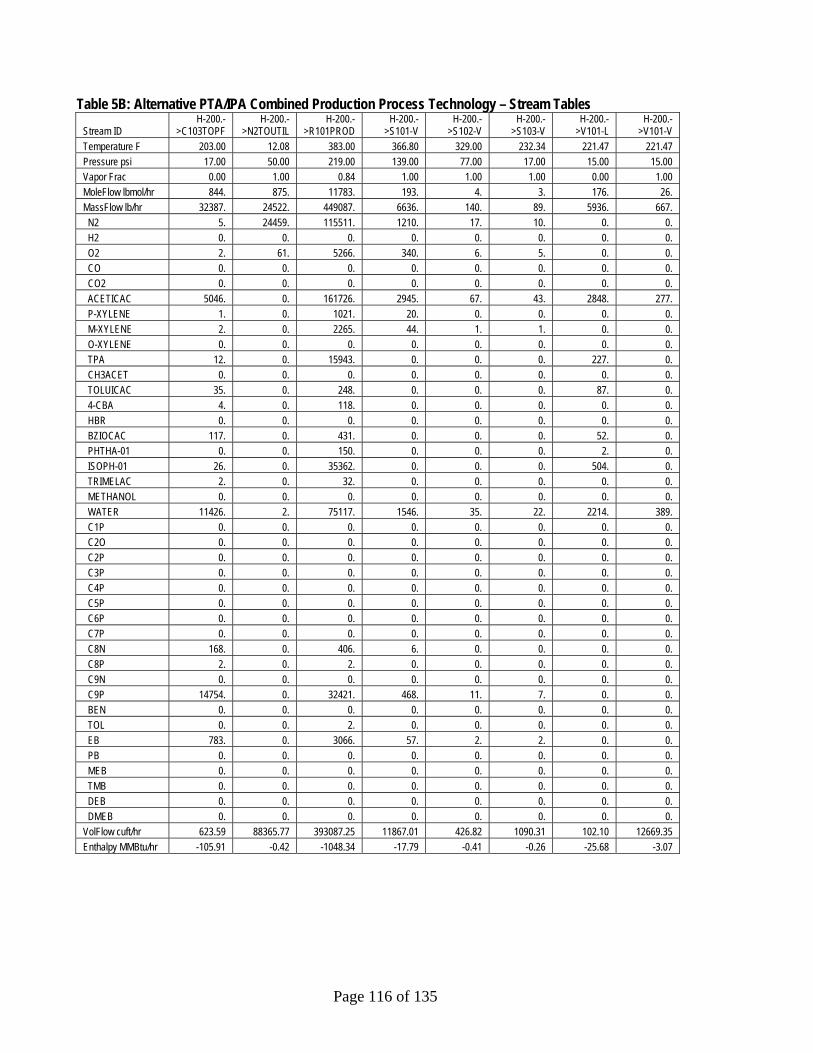
Page 116 of 135
Table 5B: Alternative PTA/IPA Combined Production Process Technology – Stream Tables Stream ID
H-200.->C103TOPF
H-200.->N2TOUTIL
H-200.->R101PROD
H-200.->S101-V
H-200.->S102-V
H-200.->S103-V
H-200.->V101-L
H-200.->V101-V
Temperature F 203.00 12.08 383.00 366.80 329.00 232.34 221.47 221.47 Pressure psi 17.00 50.00 219.00 139.00 77.00 17.00 15.00 15.00 Vapor Frac 0.00 1.00 0.84 1.00 1.00 1.00 0.00 1.00 MoleFlow lbmol/hr 844. 875. 11783. 193. 4. 3. 176. 26. MassFlow lb/hr 32387. 24522. 449087. 6636. 140. 89. 5936. 667. N2 5. 24459. 115511. 1210. 17. 10. 0. 0. H2 0. 0. 0. 0. 0. 0. 0. 0. O2 2. 61. 5266. 340. 6. 5. 0. 0. CO 0. 0. 0. 0. 0. 0. 0. 0. CO2 0. 0. 0. 0. 0. 0. 0. 0. ACETICAC 5046. 0. 161726. 2945. 67. 43. 2848. 277. P-XYLENE 1. 0. 1021. 20. 0. 0. 0. 0. M-XYLENE 2. 0. 2265. 44. 1. 1. 0. 0. O-XYLENE 0. 0. 0. 0. 0. 0. 0. 0. TPA 12. 0. 15943. 0. 0. 0. 227. 0. CH3ACET 0. 0. 0. 0. 0. 0. 0. 0. TOLUICAC 35. 0. 248. 0. 0. 0. 87. 0. 4-CBA 4. 0. 118. 0. 0. 0. 0. 0. HBR 0. 0. 0. 0. 0. 0. 0. 0. BZIOCAC 117. 0. 431. 0. 0. 0. 52. 0. PHTHA-01 0. 0. 150. 0. 0. 0. 2. 0. ISOPH-01 26. 0. 35362. 0. 0. 0. 504. 0. TRIMELAC 2. 0. 32. 0. 0. 0. 0. 0. METHANOL 0. 0. 0. 0. 0. 0. 0. 0. WATER 11426. 2. 75117. 1546. 35. 22. 2214. 389. C1P 0. 0. 0. 0. 0. 0. 0. 0. C2O 0. 0. 0. 0. 0. 0. 0. 0. C2P 0. 0. 0. 0. 0. 0. 0. 0. C3P 0. 0. 0. 0. 0. 0. 0. 0. C4P 0. 0. 0. 0. 0. 0. 0. 0. C5P 0. 0. 0. 0. 0. 0. 0. 0. C6P 0. 0. 0. 0. 0. 0. 0. 0. C7P 0. 0. 0. 0. 0. 0. 0. 0. C8N 168. 0. 406. 6. 0. 0. 0. 0. C8P 2. 0. 2. 0. 0. 0. 0. 0. C9N 0. 0. 0. 0. 0. 0. 0. 0. C9P 14754. 0. 32421. 468. 11. 7. 0. 0. BEN 0. 0. 0. 0. 0. 0. 0. 0. TOL 0. 0. 2. 0. 0. 0. 0. 0. EB 783. 0. 3066. 57. 2. 2. 0. 0. PB 0. 0. 0. 0. 0. 0. 0. 0. MEB 0. 0. 0. 0. 0. 0. 0. 0. TMB 0. 0. 0. 0. 0. 0. 0. 0. DEB 0. 0. 0. 0. 0. 0. 0. 0. DMEB 0. 0. 0. 0. 0. 0. 0. 0. VolFlow cuft/hr 623.59 88365.77 393087.25 11867.01 426.82 1090.31 102.10 12669.35 Enthalpy MMBtu/hr -105.91 -0.42 -1048.34 -17.79 -0.41 -0.26 -25.68 -3.07

Page 117 of 135
Table 5B: Alternative PTA/IPA Combined Production Process Technology – Stream Tables Stream ID
H-200.->V101FEED
H-200.->V102-V
H-200.->V104FEED
H-200.->V105FEED
H-200.->V106-V
H-200.->V106FEED
H-200.->V107-L
H-200.->V107-V
Temperature F 221.47 228.32 125.60 125.60 125.60 125.60 232.34 -459.67 Pressure psi 15.00 14.70 139.00 77.00 17.00 17.00 17.00 17.00 Vapor Frac 0.13 1.00 0.27 0.20 1.00 0.22 0.00 0.00 MoleFlow lbmol/hr 202. 80. 193. 4. 1. 3. 2016. 0. MassFlow lb/hr 6602. 3904. 6636. 140. 17. 89. 131032. 0. N2 0. 0. 1210. 17. 10. 10. 5. 0. H2 0. 0. 0. 0. 0. 0. 0. 0. O2 0. 0. 340. 6. 5. 5. 6. 0. CO 0. 0. 0. 0. 0. 0. 0. 0. CO2 0. 0. 0. 0. 0. 0. 0. 0. ACETICAC 3125. 1689. 2945. 67. 1. 43. 48911. 0. P-XYLENE 0. 406. 20. 0. 0. 0. 118. 0. M-XYLENE 0. 804. 44. 1. 0. 1. 351. 0. O-XYLENE 0. 3. 0. 0. 0. 0. 0. 0. TPA 227. 0. 0. 0. 0. 0. 15943. 0. CH3ACET 0. 0. 0. 0. 0. 0. 0. 0. TOLUICAC 87. 0. 0. 0. 0. 0. 240. 0. 4-CBA 0. 0. 0. 0. 0. 0. 118. 0. HBR 0. 0. 0. 0. 0. 0. 0. 0. BZIOCAC 52. 0. 0. 0. 0. 0. 431. 0. PHTHA-01 2. 0. 0. 0. 0. 0. 150. 0. ISOPH-01 504. 0. 0. 0. 0. 0. 35362. 0. TRIMELAC 0. 0. 0. 0. 0. 0. 32. 0. METHANOL 0. 0. 0. 0. 0. 0. 0. 0. WATER 2603. 684. 1546. 35. 1. 22. 13635. 0. C1P 0. 0. 0. 0. 0. 0. 0. 0. C2O 0. 0. 0. 0. 0. 0. 0. 0. C2P 0. 0. 0. 0. 0. 0. 0. 0. C3P 0. 0. 0. 0. 0. 0. 0. 0. C4P 0. 0. 0. 0. 0. 0. 0. 0. C5P 0. 0. 0. 0. 0. 0. 0. 0. C6P 0. 0. 0. 0. 0. 0. 0. 0. C7P 0. 0. 0. 0. 0. 0. 0. 0. C8N 0. 4. 6. 0. 0. 0. 166. 0. C8P 0. 0. 0. 0. 0. 0. 2. 0. C9N 0. 0. 0. 0. 0. 0. 0. 0. C9P 0. 271. 468. 11. 0. 7. 14659. 0. BEN 0. 0. 0. 0. 0. 0. 0. 0. TOL 0. 0. 0. 0. 0. 0. 1. 0. EB 0. 42. 57. 2. 0. 2. 902. 0. PB 0. 0. 0. 0. 0. 0. 0. 0. MEB 0. 0. 0. 0. 0. 0. 0. 0. TMB 0. 0. 0. 0. 0. 0. 0. 0. DEB 0. 0. 0. 0. 0. 0. 0. 0. DMEB 0. 0. 0. 0. 0. 0. 0. 0. VolFlow cuft/hr 12771.44 39617.26 2441.31 66.65 207.45 208.68 2027.36 0.00 Enthalpy MMBtu/hr -28.75 -9.11 -20.47 -0.47 -0.01 -0.29 -370.02 0.00

Page 118 of 135
Table 5B: Alternative PTA/IPA Combined Production Process Technology – Stream Tables Stream ID
H-200.->V108-L
H-200.->V108-V
H-200.->V108FEED
H-200.->V109-L
H-200.->V109-V
H-200.->V110-V H-300.->16 H-300.->19
Temperature F 231.80 231.80 231.80 231.80 -459.67 203.00 357.80 231.68 Pressure psi 30.00 30.00 150.00 30.00 30.00 17.00 150.00 17.00 Vapor Frac 0.00 1.00 0.00 0.00 0.00 1.00 0.01 0.00 MoleFlow lbmol/hr 359. 0. 359. 1126. 0. 12. 359. 627. MassFlow lb/hr 6501. 0. 6501. 53107. 0. 409. 6501. 56979. N2 1. 0. 1. 0. 0. 79. 1. 0. H2 0. 0. 0. 0. 0. 0. 0. 0. O2 1. 0. 1. 0. 0. 13. 1. 0. CO 0. 0. 0. 0. 0. 0. 0. 0. CO2 0. 0. 0. 0. 0. 0. 0. 0. ACETICAC 37. 0. 37. 45097. 0. 27. 37. 184. P-XYLENE 0. 0. 0. 118. 0. 0. 0. 0. M-XYLENE 0. 0. 0. 352. 0. 0. 0. 0. O-XYLENE 0. 0. 0. 0. 0. 0. 0. 0. TPA 0. 0. 0. 147. 0. 0. 0. 15785. CH3ACET 0. 0. 0. 0. 0. 0. 0. 0. TOLUICAC 0. 0. 0. 174. 0. 0. 0. 32. 4-CBA 0. 0. 0. 47. 0. 0. 0. 68. HBR 0. 0. 0. 0. 0. 0. 0. 0. BZIOCAC 0. 0. 0. 259. 0. 0. 0. 55. PHTHA-01 0. 0. 0. 1. 0. 0. 0. 148. ISOPH-01 0. 0. 0. 326. 0. 0. 0. 35009. TRIMELAC 0. 0. 0. 29. 0. 0. 0. 0. METHANOL 0. 0. 0. 0. 0. 0. 0. 0. WATER 6460. 0. 6460. 6558. 0. 118. 6460. 5698. C1P 0. 0. 0. 0. 0. 0. 0. 0. C2O 0. 0. 0. 0. 0. 0. 0. 0. C2P 0. 0. 0. 0. 0. 0. 0. 0. C3P 0. 0. 0. 0. 0. 0. 0. 0. C4P 0. 0. 0. 0. 0. 0. 0. 0. C5P 0. 0. 0. 0. 0. 0. 0. 0. C6P 0. 0. 0. 0. 0. 0. 0. 0. C7P 0. 0. 0. 0. 0. 0. 0. 0. C8N 0. 0. 0. 0. 0. 1. 0. 0. C8P 0. 0. 0. 0. 0. 0. 0. 0. C9N 0. 0. 0. 0. 0. 0. 0. 0. C9P 0. 0. 0. 0. 0. 45. 0. 0. BEN 0. 0. 0. 0. 0. 0. 0. 0. TOL 0. 0. 0. 0. 0. 0. 0. 0. EB 2. 0. 2. 0. 0. 125. 2. 0. PB 0. 0. 0. 0. 0. 0. 0. 0. MEB 0. 0. 0. 0. 0. 0. 0. 0. TMB 0. 0. 0. 0. 0. 0. 0. 0. DEB 0. 0. 0. 0. 0. 0. 0. 0. DMEB 0. 0. 0. 0. 0. 0. 0. 0. VolFlow cuft/hr 114.99 0.02 114.99 923.83 0.00 4897.11 344.59 711.68 Enthalpy MMBtu/hr -43.17 0.00 -43.17 -190.88 0.00 -0.77 -42.18 -145.51

Page 119 of 135
Table 5B: Alternative PTA/IPA Combined Production Process Technology – Stream Tables Stream ID
H-300.->19A
H-300.->19B H-300.->33
H-300.->33A H-300.->37
H-300.->37A
H-300.->37X H-300.->38
Temperature F 143.60 147.23 125.60 185.99 125.60 125.60 220.95 125.60 Pressure psi 15.00 915.00 16.00 16.00 15.00 14.70 16.00 14.70 Vapor Frac 0.00 0.00 0.00 0.00 0.00 0.00 0.06 1.00 MoleFlow lbmol/hr 4123. 4123. 639. 2352. 3496. 3496. 3496. 0. MassFlow lb/hr 162449. 162449. 11569. 64146. 105470. 105470. 105472. 0. N2 8. 8. 15. 18. 8. 8. 8. 0. H2 0. 0. 0. 0. 0. 0. 0. 0. O2 9. 9. 11. 13. 9. 9. 9. 0. CO 0. 0. 0. 0. 0. 0. 0. 0. CO2 0. 0. 0. 0. 0. 0. 0. 0. ACETICAC 594. 594. 52. 71. 410. 410. 410. 0. P-XYLENE 1. 1. 1. 1. 1. 1. 1. 0. M-XYLENE 3. 3. 2. 3. 3. 3. 3. 0. O-XYLENE 0. 0. 0. 0. 0. 0. 0. 0. TPA 30376. 30376. 0. 7541. 14592. 14592. 14592. 0. CH3ACET 0. 0. 0. 0. 0. 0. 0. 0. TOLUICAC 174. 174. 0. 3. 142. 142. 142. 0. 4-CBA 68. 68. 0. 0. 0. 0. 0. 0. HBR 0. 0. 0. 0. 0. 0. 0. 0. BZIOCAC 139. 139. 0. 1. 84. 84. 84. 0. PHTHA-01 285. 285. 0. 71. 137. 137. 137. 0. ISOPH-01 67374. 67374. 0. 16726. 32364. 32364. 32364. 0. TRIMELAC 0. 0. 0. 0. 0. 0. 0. 0. METHANOL 0. 0. 0. 0. 0. 0. 0. 0. WATER 63401. 63401. 11477. 39684. 57703. 57703. 57705. 0. C1P 0. 0. 0. 0. 0. 0. 0. 0. C2O 0. 0. 0. 0. 0. 0. 0. 0. C2P 0. 0. 0. 0. 0. 0. 0. 0. C3P 0. 0. 0. 0. 0. 0. 0. 0. C4P 0. 0. 0. 0. 0. 0. 0. 0. C5P 0. 0. 0. 0. 0. 0. 0. 0. C6P 0. 0. 0. 0. 0. 0. 0. 0. C7P 0. 0. 0. 0. 0. 0. 0. 0. C8N 0. 0. 0. 0. 0. 0. 0. 0. C8P 0. 0. 0. 0. 0. 0. 0. 0. C9N 0. 0. 0. 0. 0. 0. 0. 0. C9P 1. 1. 1. 1. 1. 1. 1. 0. BEN 0. 0. 0. 0. 0. 0. 0. 0. TOL 0. 0. 0. 0. 0. 0. 0. 0. EB 16. 16. 11. 14. 16. 16. 16. 0. PB 0. 0. 0. 0. 0. 0. 0. 0. MEB 0. 0. 0. 0. 0. 0. 0. 0. TMB 0. 0. 0. 0. 0. 0. 0. 0. DEB 0. 0. 0. 0. 0. 0. 0. 0. DMEB 0. 0. 0. 0. 0. 0. 0. 0. VolFlow cuft/hr 2383.56 2387.28 191.83 1028.89 1612.42 1612.37 97858.90 0.05 Enthalpy MMBtu/hr -638.80 -638.20 -77.89 -317.96 -492.62 -492.62 -481.96 0.00

Page 120 of 135
Table 5B: Alternative PTA/IPA Combined Production Process Technology – Stream Tables Stream ID H-300.->39
H-300.->39A
H-300.->39B
H-300.->39C H-300.->40
H-300.->40B H-300.->41
H-300.->41A
Temperature F 225.08 512.60 512.60 512.31 194.00 2157.35 512.60 512.60 Pressure psi 915.00 915.00 915.00 915.00 14.70 915.00 975.00 975.00 Vapor Frac 0.00 0.00 0.00 0.00 1.00 1.00 0.00 0.00 MoleFlow lbmol/hr 4532. 4532. 4532. 4534. 2. 2. 4533. 4533. MassFlow lb/hr 169853. 169853. 169853. 169856. 4. 4. 169856. 169856. N2 9. 9. 9. 9. 0. 0. 9. 9. H2 0. 0. 0. 4. 4. 4. 2. 2. O2 10. 10. 10. 10. 0. 0. 10. 10. CO 0. 0. 0. 0. 0. 0. 0. 0. CO2 0. 0. 0. 0. 0. 0. 0. 0. ACETICAC 636. 636. 636. 636. 0. 0. 636. 636. P-XYLENE 1. 1. 1. 1. 0. 0. 1. 1. M-XYLENE 4. 4. 4. 4. 0. 0. 4. 4. O-XYLENE 0. 0. 0. 0. 0. 0. 0. 0. TPA 30376. 30376. 30376. 30376. 0. 0. 30376. 30376. CH3ACET 0. 0. 0. 0. 0. 0. 0. 0. TOLUICAC 174. 174. 174. 174. 0. 0. 235. 235. 4-CBA 68. 68. 68. 68. 0. 0. 1. 1. HBR 0. 0. 0. 0. 0. 0. 0. 0. BZIOCAC 139. 139. 139. 139. 0. 0. 139. 139. PHTHA-01 285. 285. 285. 285. 0. 0. 285. 285. ISOPH-01 67374. 67374. 67374. 67374. 0. 0. 67374. 67374. TRIMELAC 0. 0. 0. 0. 0. 0. 0. 0. METHANOL 0. 0. 0. 0. 0. 0. 0. 0. WATER 70759. 70759. 70759. 70759. 0. 0. 70767. 70767. C1P 0. 0. 0. 0. 0. 0. 0. 0. C2O 0. 0. 0. 0. 0. 0. 0. 0. C2P 0. 0. 0. 0. 0. 0. 0. 0. C3P 0. 0. 0. 0. 0. 0. 0. 0. C4P 0. 0. 0. 0. 0. 0. 0. 0. C5P 0. 0. 0. 0. 0. 0. 0. 0. C6P 0. 0. 0. 0. 0. 0. 0. 0. C7P 0. 0. 0. 0. 0. 0. 0. 0. C8N 0. 0. 0. 0. 0. 0. 0. 0. C8P 0. 0. 0. 0. 0. 0. 0. 0. C9N 0. 0. 0. 0. 0. 0. 0. 0. C9P 1. 1. 1. 1. 0. 0. 1. 1. BEN 0. 0. 0. 0. 0. 0. 0. 0. TOL 0. 0. 0. 0. 0. 0. 0. 0. EB 18. 18. 18. 18. 0. 0. 18. 18. PB 0. 0. 0. 0. 0. 0. 0. 0. MEB 0. 0. 0. 0. 0. 0. 0. 0. TMB 0. 0. 0. 0. 0. 0. 0. 0. DEB 0. 0. 0. 0. 0. 0. 0. 0. DMEB 0. 0. 0. 0. 0. 0. 0. 0. VolFlow cuft/hr 2610.94 3068.46 3068.46 3139.10 868.70 56.37 3097.92 3097.92

Page 121 of 135
Table 5B: Alternative PTA/IPA Combined Production Process Technology – Stream Tables Stream ID H-300.->42 H-300.->43 H-300.->44 H-300.->45 H-300.->45A H-300.->46 H-300.->46A H-300.->46B Temperature F 125.60 125.60 125.60 302.00 302.31 512.60 302.31 302.31 Pressure psi 114.00 114.00 70.00 73.00 150.00 975.00 150.00 150.00 Vapor Frac 1.00 0.00 0.00 0.00 0.00 0.00 0.00 0.00 MoleFlow lbmol/hr 1. 6. 0. 4526. 4526. 4533. 1479. 2313. MassFlow lb/hr 8. 116. 0. 169732. 169732. 169856. 27596. 43165. N2 3. 0. 0. 5. 5. 9. 2. 3. H2 2. 0. 0. 0. 0. 2. 0. 0. O2 2. 0. 0. 7. 7. 10. 3. 4. CO 0. 0. 0. 0. 0. 0. 0. 0. CO2 0. 0. 0. 0. 0. 0. 0. 0. ACETICAC 0. 1. 0. 636. 636. 636. 238. 373. P-XYLENE 0. 0. 0. 1. 1. 1. 0. 1. M-XYLENE 0. 0. 0. 3. 3. 4. 1. 2. O-XYLENE 0. 0. 0. 0. 0. 0. 0. 0. TPA 0. 0. 0. 30376. 30376. 30376. 227. 356. CH3ACET 0. 0. 0. 0. 0. 0. 0. 0. TOLUICAC 0. 0. 0. 235. 235. 235. 88. 137. 4-CBA 0. 0. 0. 1. 1. 1. 0. 0. HBR 0. 0. 0. 0. 0. 0. 0. 0. BZIOCAC 0. 0. 0. 139. 139. 139. 52. 81. PHTHA-01 0. 0. 0. 285. 285. 285. 2. 3. ISOPH-01 0. 0. 0. 67374. 67374. 67374. 504. 789. TRIMELAC 0. 0. 0. 0. 0. 0. 0. 0. METHANOL 0. 0. 0. 0. 0. 0. 0. 0. WATER 0. 115. 0. 70651. 70651. 70767. 26470. 41403. C1P 0. 0. 0. 0. 0. 0. 0. 0. C2O 0. 0. 0. 0. 0. 0. 0. 0. C2P 0. 0. 0. 0. 0. 0. 0. 0. C3P 0. 0. 0. 0. 0. 0. 0. 0. C4P 0. 0. 0. 0. 0. 0. 0. 0. C5P 0. 0. 0. 0. 0. 0. 0. 0. C6P 0. 0. 0. 0. 0. 0. 0. 0. C7P 0. 0. 0. 0. 0. 0. 0. 0. C8N 0. 0. 0. 0. 0. 0. 0. 0. C8P 0. 0. 0. 0. 0. 0. 0. 0. C9N 0. 0. 0. 0. 0. 0. 0. 0. C9P 0. 0. 0. 1. 1. 1. 0. 1. BEN 0. 0. 0. 0. 0. 0. 0. 0. TOL 0. 0. 0. 0. 0. 0. 0. 0. EB 0. 0. 0. 18. 18. 18. 7. 11. PB 0. 0. 0. 0. 0. 0. 0. 0. MEB 0. 0. 0. 0. 0. 0. 0. 0. TMB 0. 0. 0. 0. 0. 0. 0. 0. DEB 0. 0. 0. 0. 0. 0. 0. 0. DMEB 0. 0. 0. 0. 0. 0. 0. 0. VolFlow cuft/hr 62.66 1.93 0.00 2709.27 2709.70 3097.92 510.93 799.19 Enthalpy MMBtu/hr 0.00 -0.78 0.00 -670.79 -670.73 -643.47 -176.73 -276.44

Page 122 of 135
Table 5B: Alternative PTA/IPA Combined Production Process Technology – Stream Tables Stream ID H-300.->47 H-300.->48 H-300.->49 H-300.->50 H-300.->51 H-300.->52A H-300.->52B H-300.->53 Temperature F 302.31 302.00 125.60 217.40 217.40 217.40 217.40 194.00 Pressure psi 150.00 16.00 16.00 17.00 17.00 17.00 17.00 80.00 Vapor Frac 0.00 0.92 0.00 0.00 0.00 0.00 0.00 0.00 MoleFlow lbmol/hr 733. 2352. 0. 1285. 1799. 623. 1176. 1090. MassFlow lb/hr 98970. 64146. 0. 67962. 95133. 32943. 62190. 19634. N2 0. 18. 0. 5. 7. 2. 5. 0. H2 0. 0. 0. 0. 0. 0. 0. 0. O2 0. 13. 0. 4. 6. 2. 4. 0. CO 0. 0. 0. 0. 0. 0. 0. 0. CO2 0. 0. 0. 0. 0. 0. 0. 0. ACETICAC 25. 71. 0. 40. 56. 19. 37. 0. P-XYLENE 0. 1. 0. 0. 1. 0. 0. 0. M-XYLENE 0. 3. 0. 1. 2. 1. 1. 0. O-XYLENE 0. 0. 0. 0. 0. 0. 0. 0. TPA 29793. 7541. 0. 15557. 21777. 7541. 14236. 0. CH3ACET 0. 0. 0. 0. 0. 0. 0. 0. TOLUICAC 10. 3. 0. 5. 7. 3. 5. 0. 4-CBA 0. 0. 0. 0. 0. 0. 0. 0. HBR 0. 0. 0. 0. 0. 0. 0. 0. BZIOCAC 6. 1. 0. 3. 4. 1. 3. 0. PHTHA-01 280. 71. 0. 146. 204. 71. 134. 0. ISOPH-01 66080. 16726. 0. 34505. 48301. 16726. 31575. 0. TRIMELAC 0. 0. 0. 0. 0. 0. 0. 0. METHANOL 0. 0. 0. 0. 0. 0. 0. 0. WATER 2777. 39684. 0. 17688. 24760. 8574. 16186. 19634. C1P 0. 0. 0. 0. 0. 0. 0. 0. C2O 0. 0. 0. 0. 0. 0. 0. 0. C2P 0. 0. 0. 0. 0. 0. 0. 0. C3P 0. 0. 0. 0. 0. 0. 0. 0. C4P 0. 0. 0. 0. 0. 0. 0. 0. C5P 0. 0. 0. 0. 0. 0. 0. 0. C6P 0. 0. 0. 0. 0. 0. 0. 0. C7P 0. 0. 0. 0. 0. 0. 0. 0. C8N 0. 0. 0. 0. 0. 0. 0. 0. C8P 0. 0. 0. 0. 0. 0. 0. 0. C9N 0. 0. 0. 0. 0. 0. 0. 0. C9P 0. 1. 0. 0. 0. 0. 0. 0. BEN 0. 0. 0. 0. 0. 0. 0. 0. TOL 0. 0. 0. 0. 0. 0. 0. 0. EB 0. 14. 0. 6. 8. 3. 5. 0. PB 0. 0. 0. 0. 0. 0. 0. 0. MEB 0. 0. 0. 0. 0. 0. 0. 0. TMB 0. 0. 0. 0. 0. 0. 0. 0. DEB 0. 0. 0. 0. 0. 0. 0. 0. DMEB 0. 0. 0. 0. 0. 0. 0. 0. VolFlow cuft/hr 1096.65 1097452.18 0.01 967.99 1355.00 469.21 885.79 338.76 Enthalpy MMBtu/hr -217.53 -276.42 0.00 -223.73 -313.18 -108.45 -204.73 -131.62

Page 123 of 135
Table 5B: Alternative PTA/IPA Combined Production Process Technology – Stream Tables Stream ID H-300.->57 H-300.->58 H-300.->59 H-300.->60 H-300.-
>C201TOP H-300.->E-
207F H-300.-
>E204HF H-300.-
>E204HP Temperature F 362.24 358.99 125.60 224.04 358.99 357.80 358.99 357.80 Pressure psi 150.00 150.00 150.00 975.00 150.00 150.00 150.00 150.00 Vapor Frac 0.00 1.00 0.00 0.00 1.00 0.01 1.00 0.01 MoleFlow lbmol/hr 148. 409. 563. 4533. 1331. 563. 922. 922. MassFlow lb/hr 3511. 7404. 10181. 169856. 24085. 10181. 16681. 16681. N2 0. 1. 1. 9. 2. 1. 1. 1. H2 0. 0. 0. 2. 0. 0. 0. 0. O2 0. 1. 1. 10. 3. 1. 2. 2. CO 0. 0. 0. 0. 0. 0. 0. 0. CO2 0. 0. 0. 0. 0. 0. 0. 0. ACETICAC 102. 42. 58. 636. 137. 58. 95. 95. P-XYLENE 0. 0. 0. 1. 0. 0. 0. 0. M-XYLENE 0. 0. 1. 4. 1. 1. 1. 1. O-XYLENE 0. 0. 0. 0. 0. 0. 0. 0. TPA 227. 0. 0. 30376. 0. 0. 0. 0. CH3ACET 0. 0. 0. 0. 0. 0. 0. 0. TOLUICAC 87. 0. 0. 235. 1. 0. 0. 0. 4-CBA 0. 0. 0. 1. 0. 0. 0. 0. HBR 0. 0. 0. 0. 0. 0. 0. 0. BZIOCAC 52. 0. 0. 139. 0. 0. 0. 0. PHTHA-01 2. 0. 0. 285. 0. 0. 0. 0. ISOPH-01 504. 0. 0. 67374. 0. 0. 0. 0. TRIMELAC 0. 0. 0. 0. 0. 0. 0. 0. METHANOL 0. 0. 0. 0. 0. 0. 0. 0. WATER 2535. 7358. 10117. 70767. 23935. 10117. 16577. 16577. C1P 0. 0. 0. 0. 0. 0. 0. 0. C2O 0. 0. 0. 0. 0. 0. 0. 0. C2P 0. 0. 0. 0. 0. 0. 0. 0. C3P 0. 0. 0. 0. 0. 0. 0. 0. C4P 0. 0. 0. 0. 0. 0. 0. 0. C5P 0. 0. 0. 0. 0. 0. 0. 0. C6P 0. 0. 0. 0. 0. 0. 0. 0. C7P 0. 0. 0. 0. 0. 0. 0. 0. C8N 0. 0. 0. 0. 0. 0. 0. 0. C8P 0. 0. 0. 0. 0. 0. 0. 0. C9N 0. 0. 0. 0. 0. 0. 0. 0. C9P 0. 0. 0. 1. 0. 0. 0. 0. BEN 0. 0. 0. 0. 0. 0. 0. 0. TOL 0. 0. 0. 0. 0. 0. 0. 0. EB 0. 2. 3. 18. 7. 3. 5. 5. PB 0. 0. 0. 0. 0. 0. 0. 0. MEB 0. 0. 0. 0. 0. 0. 0. 0. TMB 0. 0. 0. 0. 0. 0. 0. 0. DEB 0. 0. 0. 0. 0. 0. 0. 0. DMEB 0. 0. 0. 0. 0. 0. 0. 0. VolFlow cuft/hr 65.29 22902.43 168.70 2617.00 74502.58 539.65 51600.15 884.24 Enthalpy MMBtu/hr -18.43 -41.73 -68.70 -680.05 -135.74 -66.06 -94.01 -108.24
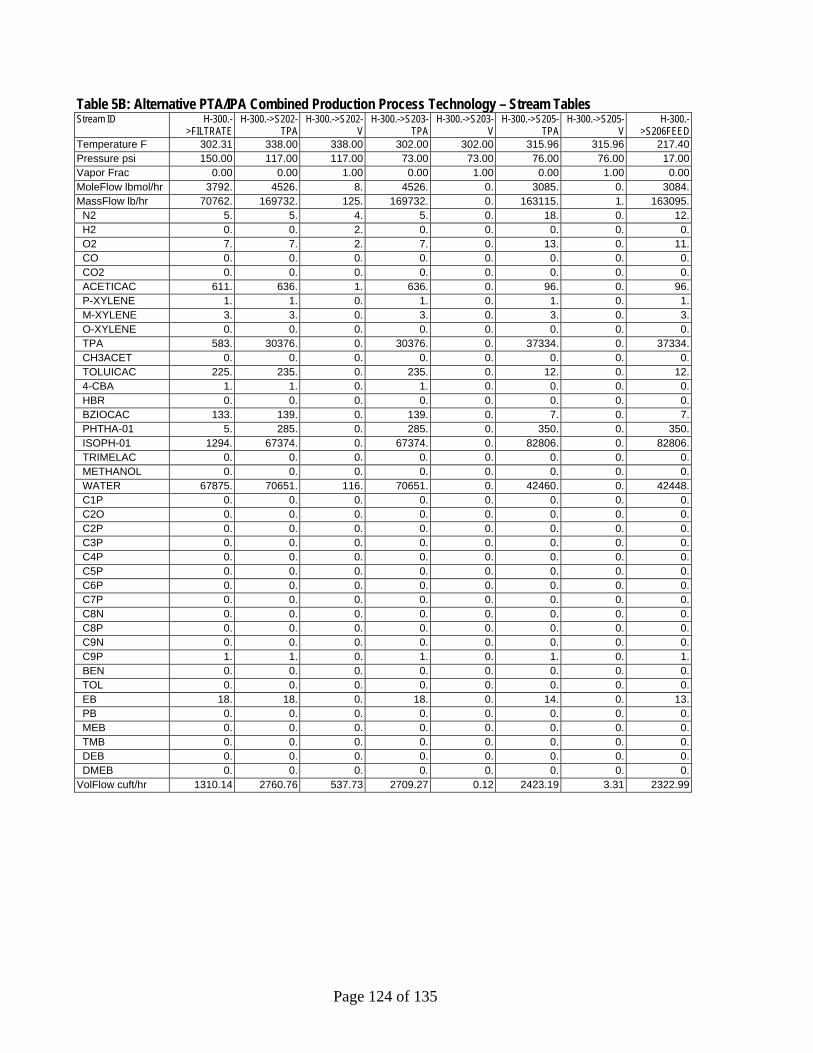
Page 124 of 135
Table 5B: Alternative PTA/IPA Combined Production Process Technology – Stream Tables Stream ID H-300.-
>FILTRATE H-300.->S202-
TPA H-300.->S202-
V H-300.->S203-
TPA H-300.->S203-
V H-300.->S205-
TPA H-300.->S205-
V H-300.-
>S206FEED Temperature F 302.31 338.00 338.00 302.00 302.00 315.96 315.96 217.40Pressure psi 150.00 117.00 117.00 73.00 73.00 76.00 76.00 17.00Vapor Frac 0.00 0.00 1.00 0.00 1.00 0.00 1.00 0.00MoleFlow lbmol/hr 3792. 4526. 8. 4526. 0. 3085. 0. 3084.MassFlow lb/hr 70762. 169732. 125. 169732. 0. 163115. 1. 163095. N2 5. 5. 4. 5. 0. 18. 0. 12. H2 0. 0. 2. 0. 0. 0. 0. 0. O2 7. 7. 2. 7. 0. 13. 0. 11. CO 0. 0. 0. 0. 0. 0. 0. 0. CO2 0. 0. 0. 0. 0. 0. 0. 0. ACETICAC 611. 636. 1. 636. 0. 96. 0. 96. P-XYLENE 1. 1. 0. 1. 0. 1. 0. 1. M-XYLENE 3. 3. 0. 3. 0. 3. 0. 3. O-XYLENE 0. 0. 0. 0. 0. 0. 0. 0. TPA 583. 30376. 0. 30376. 0. 37334. 0. 37334. CH3ACET 0. 0. 0. 0. 0. 0. 0. 0. TOLUICAC 225. 235. 0. 235. 0. 12. 0. 12. 4-CBA 1. 1. 0. 1. 0. 0. 0. 0. HBR 0. 0. 0. 0. 0. 0. 0. 0. BZIOCAC 133. 139. 0. 139. 0. 7. 0. 7. PHTHA-01 5. 285. 0. 285. 0. 350. 0. 350. ISOPH-01 1294. 67374. 0. 67374. 0. 82806. 0. 82806. TRIMELAC 0. 0. 0. 0. 0. 0. 0. 0. METHANOL 0. 0. 0. 0. 0. 0. 0. 0. WATER 67875. 70651. 116. 70651. 0. 42460. 0. 42448. C1P 0. 0. 0. 0. 0. 0. 0. 0. C2O 0. 0. 0. 0. 0. 0. 0. 0. C2P 0. 0. 0. 0. 0. 0. 0. 0. C3P 0. 0. 0. 0. 0. 0. 0. 0. C4P 0. 0. 0. 0. 0. 0. 0. 0. C5P 0. 0. 0. 0. 0. 0. 0. 0. C6P 0. 0. 0. 0. 0. 0. 0. 0. C7P 0. 0. 0. 0. 0. 0. 0. 0. C8N 0. 0. 0. 0. 0. 0. 0. 0. C8P 0. 0. 0. 0. 0. 0. 0. 0. C9N 0. 0. 0. 0. 0. 0. 0. 0. C9P 1. 1. 0. 1. 0. 1. 0. 1. BEN 0. 0. 0. 0. 0. 0. 0. 0. TOL 0. 0. 0. 0. 0. 0. 0. 0. EB 18. 18. 0. 18. 0. 14. 0. 13. PB 0. 0. 0. 0. 0. 0. 0. 0. MEB 0. 0. 0. 0. 0. 0. 0. 0. TMB 0. 0. 0. 0. 0. 0. 0. 0. DEB 0. 0. 0. 0. 0. 0. 0. 0. DMEB 0. 0. 0. 0. 0. 0. 0. 0.VolFlow cuft/hr 1310.14 2760.76 537.73 2709.27 0.12 2423.19 3.31 2322.99

Page 125 of 135
Table 5B: Alternative PTA/IPA Combined Production Process Technology – Stream Tables Stream ID H-300.-
>V201-V H-300.-
>V202-V H-300.-
>V203FEEDH-300.-
>V204-VH-300.-
>V204FEEDH-300.-
>V205-VH-300.-
>V206-L H-300.-
>V206-VTemperature F -459.67 -459.67 125.60 125.60 125.60 -459.67 302.00 -459.67Pressure psi 15.00 915.00 117.00 70.00 73.00 73.00 76.00 76.00Vapor Frac 0.00 0.00 0.15 1.00 0.18 0.00 0.00 0.00MoleFlow lbmol/hr 0. 0. 8. 0. 0. 0. 3085. 0.MassFlow lb/hr 0. 0. 125. 0. 0. 0. 163115. 0. N2 0. 0. 4. 0. 0. 0. 18. 0. H2 0. 0. 2. 0. 0. 0. 0. 0. O2 0. 0. 2. 0. 0. 0. 13. 0. CO 0. 0. 0. 0. 0. 0. 0. 0. CO2 0. 0. 0. 0. 0. 0. 0. 0. ACETICAC 0. 0. 1. 0. 0. 0. 96. 0. P-XYLENE 0. 0. 0. 0. 0. 0. 1. 0. M-XYLENE 0. 0. 0. 0. 0. 0. 3. 0. O-XYLENE 0. 0. 0. 0. 0. 0. 0. 0. TPA 0. 0. 0. 0. 0. 0. 37334. 0. CH3ACET 0. 0. 0. 0. 0. 0. 0. 0. TOLUICAC 0. 0. 0. 0. 0. 0. 12. 0. 4-CBA 0. 0. 0. 0. 0. 0. 0. 0. HBR 0. 0. 0. 0. 0. 0. 0. 0. BZIOCAC 0. 0. 0. 0. 0. 0. 7. 0. PHTHA-01 0. 0. 0. 0. 0. 0. 350. 0. ISOPH-01 0. 0. 0. 0. 0. 0. 82806. 0. TRIMELAC 0. 0. 0. 0. 0. 0. 0. 0. METHANOL 0. 0. 0. 0. 0. 0. 0. 0. WATER 0. 0. 116. 0. 0. 0. 42461. 0. C1P 0. 0. 0. 0. 0. 0. 0. 0. C2O 0. 0. 0. 0. 0. 0. 0. 0. C2P 0. 0. 0. 0. 0. 0. 0. 0. C3P 0. 0. 0. 0. 0. 0. 0. 0. C4P 0. 0. 0. 0. 0. 0. 0. 0. C5P 0. 0. 0. 0. 0. 0. 0. 0. C6P 0. 0. 0. 0. 0. 0. 0. 0. C7P 0. 0. 0. 0. 0. 0. 0. 0. C8N 0. 0. 0. 0. 0. 0. 0. 0. C8P 0. 0. 0. 0. 0. 0. 0. 0. C9N 0. 0. 0. 0. 0. 0. 0. 0. C9P 0. 0. 0. 0. 0. 0. 1. 0. BEN 0. 0. 0. 0. 0. 0. 0. 0. TOL 0. 0. 0. 0. 0. 0. 0. 0. EB 0. 0. 0. 0. 0. 0. 14. 0. PB 0. 0. 0. 0. 0. 0. 0. 0. MEB 0. 0. 0. 0. 0. 0. 0. 0. TMB 0. 0. 0. 0. 0. 0. 0. 0. DEB 0. 0. 0. 0. 0. 0. 0. 0. DMEB 0. 0. 0. 0. 0. 0. 0. 0.VolFlow cuft/hr 0.00 0.00 62.94 0.02 0.02 0.00 2408.28 0.00Enthalpy MMBtu/hr 0.00 0.00 -0.78 0.00 0.00 0.00 -529.58 0.00
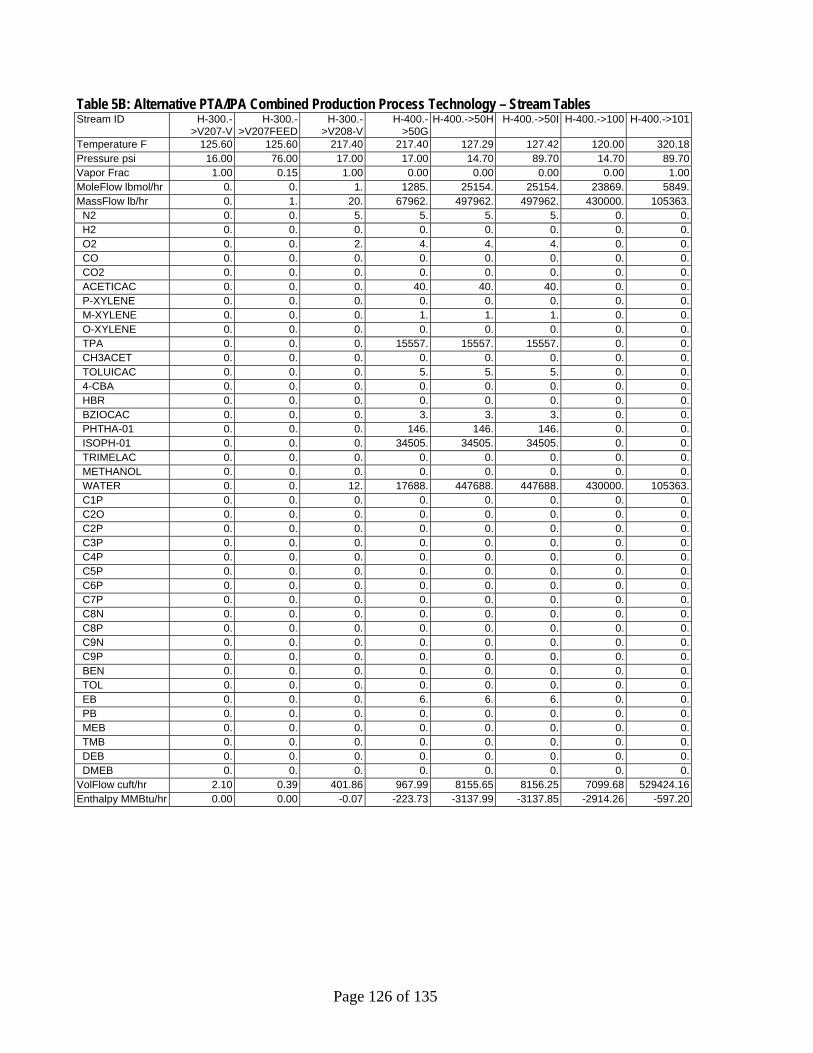
Page 126 of 135
Table 5B: Alternative PTA/IPA Combined Production Process Technology – Stream Tables Stream ID H-300.-
>V207-V H-300.-
>V207FEED H-300.-
>V208-VH-400.-
>50GH-400.->50H H-400.->50I H-400.->100 H-400.->101
Temperature F 125.60 125.60 217.40 217.40 127.29 127.42 120.00 320.18Pressure psi 16.00 76.00 17.00 17.00 14.70 89.70 14.70 89.70Vapor Frac 1.00 0.15 1.00 0.00 0.00 0.00 0.00 1.00MoleFlow lbmol/hr 0. 0. 1. 1285. 25154. 25154. 23869. 5849.MassFlow lb/hr 0. 1. 20. 67962. 497962. 497962. 430000. 105363. N2 0. 0. 5. 5. 5. 5. 0. 0. H2 0. 0. 0. 0. 0. 0. 0. 0. O2 0. 0. 2. 4. 4. 4. 0. 0. CO 0. 0. 0. 0. 0. 0. 0. 0. CO2 0. 0. 0. 0. 0. 0. 0. 0. ACETICAC 0. 0. 0. 40. 40. 40. 0. 0. P-XYLENE 0. 0. 0. 0. 0. 0. 0. 0. M-XYLENE 0. 0. 0. 1. 1. 1. 0. 0. O-XYLENE 0. 0. 0. 0. 0. 0. 0. 0. TPA 0. 0. 0. 15557. 15557. 15557. 0. 0. CH3ACET 0. 0. 0. 0. 0. 0. 0. 0. TOLUICAC 0. 0. 0. 5. 5. 5. 0. 0. 4-CBA 0. 0. 0. 0. 0. 0. 0. 0. HBR 0. 0. 0. 0. 0. 0. 0. 0. BZIOCAC 0. 0. 0. 3. 3. 3. 0. 0. PHTHA-01 0. 0. 0. 146. 146. 146. 0. 0. ISOPH-01 0. 0. 0. 34505. 34505. 34505. 0. 0. TRIMELAC 0. 0. 0. 0. 0. 0. 0. 0. METHANOL 0. 0. 0. 0. 0. 0. 0. 0. WATER 0. 0. 12. 17688. 447688. 447688. 430000. 105363. C1P 0. 0. 0. 0. 0. 0. 0. 0. C2O 0. 0. 0. 0. 0. 0. 0. 0. C2P 0. 0. 0. 0. 0. 0. 0. 0. C3P 0. 0. 0. 0. 0. 0. 0. 0. C4P 0. 0. 0. 0. 0. 0. 0. 0. C5P 0. 0. 0. 0. 0. 0. 0. 0. C6P 0. 0. 0. 0. 0. 0. 0. 0. C7P 0. 0. 0. 0. 0. 0. 0. 0. C8N 0. 0. 0. 0. 0. 0. 0. 0. C8P 0. 0. 0. 0. 0. 0. 0. 0. C9N 0. 0. 0. 0. 0. 0. 0. 0. C9P 0. 0. 0. 0. 0. 0. 0. 0. BEN 0. 0. 0. 0. 0. 0. 0. 0. TOL 0. 0. 0. 0. 0. 0. 0. 0. EB 0. 0. 0. 6. 6. 6. 0. 0. PB 0. 0. 0. 0. 0. 0. 0. 0. MEB 0. 0. 0. 0. 0. 0. 0. 0. TMB 0. 0. 0. 0. 0. 0. 0. 0. DEB 0. 0. 0. 0. 0. 0. 0. 0. DMEB 0. 0. 0. 0. 0. 0. 0. 0.VolFlow cuft/hr 2.10 0.39 401.86 967.99 8155.65 8156.25 7099.68 529424.16Enthalpy MMBtu/hr 0.00 0.00 -0.07 -223.73 -3137.99 -3137.85 -2914.26 -597.20

Page 127 of 135
Table 5B: Alternative PTA/IPA Combined Production Process Technology – Stream Tables Stream ID H-400.->102 H-400.->103 H-400.->104 H-400.->105 H-400.-
>105BH-400.->107 H-400.-
>107B H-400.->108
Temperature F 318.13 280.00 280.00 280.00 250.00 250.00 250.00 250.00Pressure psi 89.70 89.70 89.70 89.70 89.70 89.70 89.70 89.70Vapor Frac 0.00 0.00 0.00 0.00 0.00 0.00 0.00 0.00MoleFlow lbmol/hr 31304. 31304. 190. 31114. 31114. 301. 301. 30813.MassFlow lb/hr 653387. 653387. 17286. 636102. 636102. 50062. 50062. 586039. N2 5. 5. 0. 5. 5. 0. 0. 5. H2 0. 0. 0. 0. 0. 0. 0. 0. O2 4. 4. 0. 4. 4. 0. 0. 4. CO 0. 0. 0. 0. 0. 0. 0. 0. CO2 0. 0. 0. 0. 0. 0. 0. 0. ACETICAC 40. 40. 0. 40. 40. 0. 0. 40. P-XYLENE 0. 0. 0. 0. 0. 0. 0. 0. M-XYLENE 1. 1. 0. 1. 1. 0. 0. 1. O-XYLENE 0. 0. 0. 0. 0. 0. 0. 0. TPA 31114. 31114. 15557. 15557. 15557. 15557. 15557. 0. CH3ACET 0. 0. 0. 0. 0. 0. 0. 0. TOLUICAC 5. 5. 0. 5. 5. 0. 0. 5. 4-CBA 0. 0. 0. 0. 0. 0. 0. 0. HBR 0. 0. 0. 0. 0. 0. 0. 0. BZIOCAC 3. 3. 0. 3. 3. 0. 0. 3. PHTHA-01 146. 146. 0. 146. 146. 0. 0. 146. ISOPH-01 69010. 69010. 0. 69010. 69010. 34505. 34505. 34505. TRIMELAC 0. 0. 0. 0. 0. 0. 0. 0. METHANOL 0. 0. 0. 0. 0. 0. 0. 0. WATER 553051. 553051. 1729. 551323. 551323. 0. 0. 551323. C1P 0. 0. 0. 0. 0. 0. 0. 0. C2O 0. 0. 0. 0. 0. 0. 0. 0. C2P 0. 0. 0. 0. 0. 0. 0. 0. C3P 0. 0. 0. 0. 0. 0. 0. 0. C4P 0. 0. 0. 0. 0. 0. 0. 0. C5P 0. 0. 0. 0. 0. 0. 0. 0. C6P 0. 0. 0. 0. 0. 0. 0. 0. C7P 0. 0. 0. 0. 0. 0. 0. 0. C8N 0. 0. 0. 0. 0. 0. 0. 0. C8P 0. 0. 0. 0. 0. 0. 0. 0. C9N 0. 0. 0. 0. 0. 0. 0. 0. C9P 0. 0. 0. 0. 0. 0. 0. 0. BEN 0. 0. 0. 0. 0. 0. 0. 0. TOL 0. 0. 0. 0. 0. 0. 0. 0. EB 6. 6. 0. 6. 6. 0. 0. 6. PB 0. 0. 0. 0. 0. 0. 0. 0. MEB 0. 0. 0. 0. 0. 0. 0. 0. TMB 0. 0. 0. 0. 0. 0. 0. 0. DEB 0. 0. 0. 0. 0. 0. 0. 0. DMEB 0. 0. 0. 0. 0. 0. 0. 0.VolFlow cuft/hr 11964.54 11651.22 216.87 11379.11 11153.51 490.51 490.51 10396.56Enthalpy MMBtu/hr -3839.66 -3865.11 -43.21 -3821.90 -3841.07 -104.61 -104.61 -3736.45
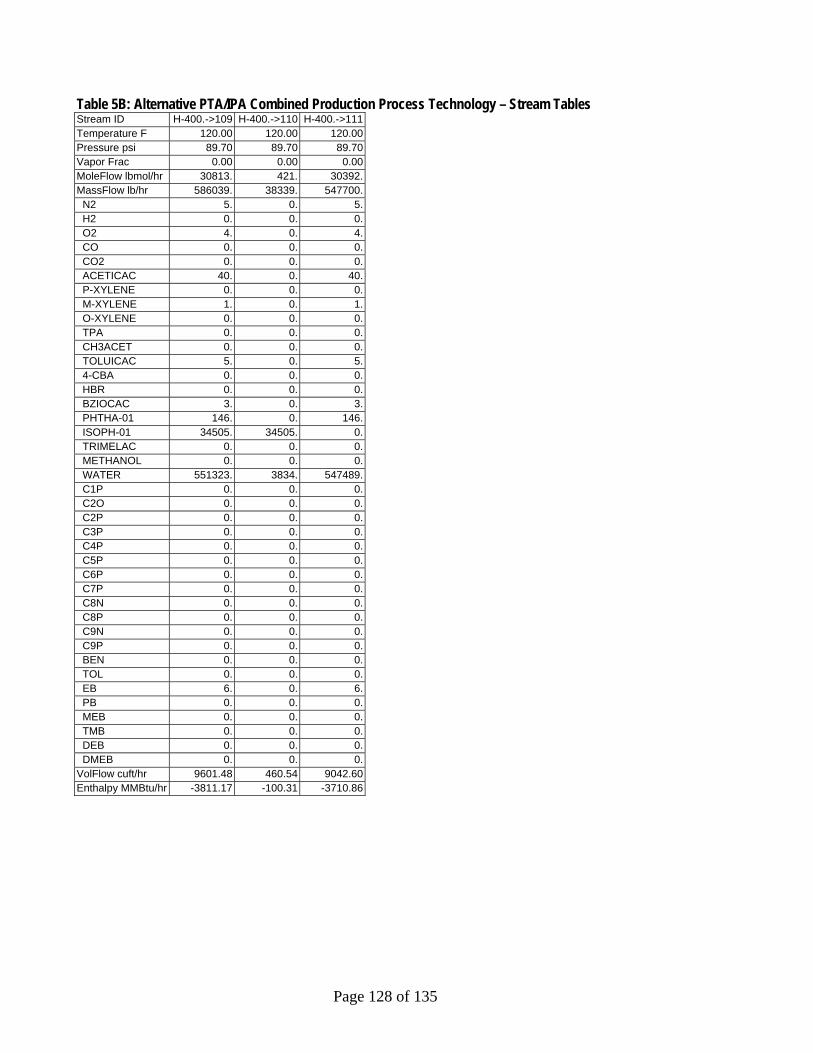
Page 128 of 135
Table 5B: Alternative PTA/IPA Combined Production Process Technology – Stream Tables Stream ID H-400.->109 H-400.->110 H-400.->111Temperature F 120.00 120.00 120.00Pressure psi 89.70 89.70 89.70Vapor Frac 0.00 0.00 0.00MoleFlow lbmol/hr 30813. 421. 30392.MassFlow lb/hr 586039. 38339. 547700. N2 5. 0. 5. H2 0. 0. 0. O2 4. 0. 4. CO 0. 0. 0. CO2 0. 0. 0. ACETICAC 40. 0. 40. P-XYLENE 0. 0. 0. M-XYLENE 1. 0. 1. O-XYLENE 0. 0. 0. TPA 0. 0. 0. CH3ACET 0. 0. 0. TOLUICAC 5. 0. 5. 4-CBA 0. 0. 0. HBR 0. 0. 0. BZIOCAC 3. 0. 3. PHTHA-01 146. 0. 146. ISOPH-01 34505. 34505. 0. TRIMELAC 0. 0. 0. METHANOL 0. 0. 0. WATER 551323. 3834. 547489. C1P 0. 0. 0. C2O 0. 0. 0. C2P 0. 0. 0. C3P 0. 0. 0. C4P 0. 0. 0. C5P 0. 0. 0. C6P 0. 0. 0. C7P 0. 0. 0. C8N 0. 0. 0. C8P 0. 0. 0. C9N 0. 0. 0. C9P 0. 0. 0. BEN 0. 0. 0. TOL 0. 0. 0. EB 6. 0. 6. PB 0. 0. 0. MEB 0. 0. 0. TMB 0. 0. 0. DEB 0. 0. 0. DMEB 0. 0. 0.VolFlow cuft/hr 9601.48 460.54 9042.60Enthalpy MMBtu/hr -3811.17 -100.31 -3710.86
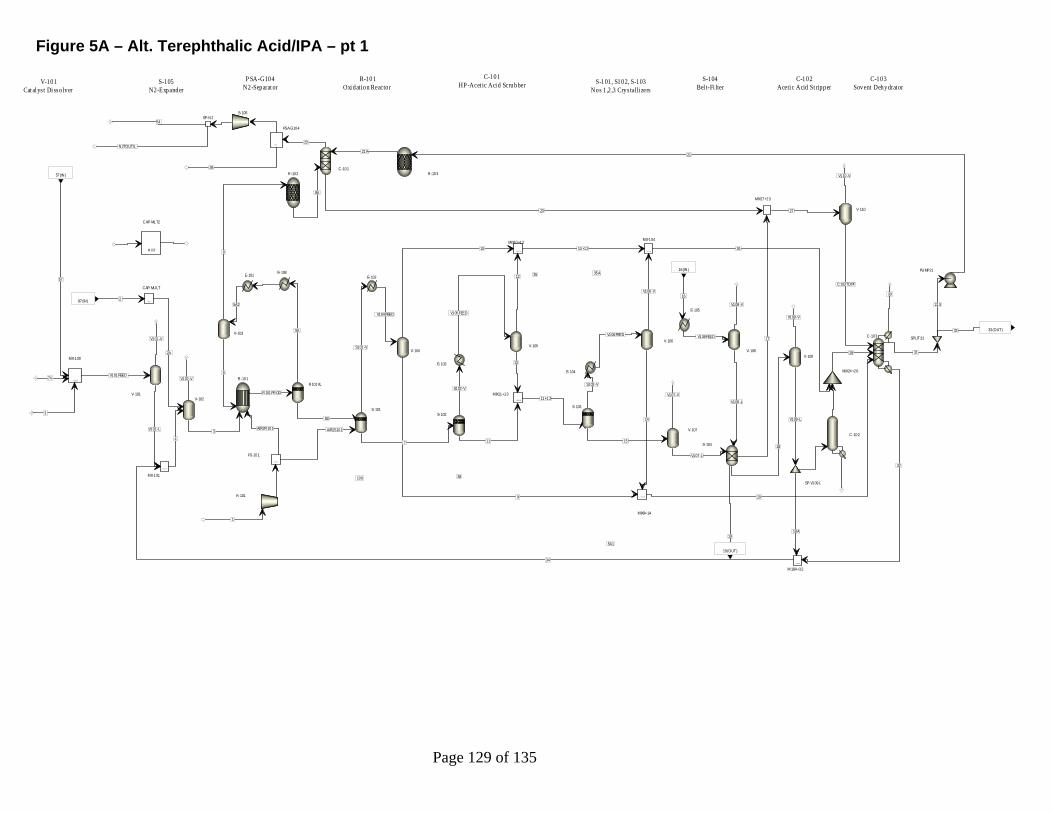
Page 129 of 135
Figure 5A – Alt. Terephthalic Acid/IPA – pt 1
57
57(IN)
16
16(IN)
287(IN)
19
19(OUT)
33 33(OUT)
4
2A
5
V102-VV101FEED
V101-V
V101-L
1
5A1
5A2
6
8
V104FEED
9
10
S101-V
R101PROD
5A
5B
AIR2S101
7
AIR2R101
34
74
3
8A
2121A
22
35A
36
23
35
N2TOUTIL
54
15
V107-L
V107-V
V105FEED
13
12
V106FEED
14
V106-V
S102-VS103-V
11
11+13
10+12 26
29
V108-L
18
17V108FEED
V108-V
27
V110-V
C103TOPF
31
21X
V109-V
V109-L
18A
32
28
30
100 38
V- 102V- 101
K- 101
E- 101
V- 103
V- 104
E- 102
R101VL
S- 101
E- 108
FSPL I T
FS-101
R-101
MI X ER
MX-101
MI X ER
MX-100
R-102 R-103
MUL T
CAP- MULT
SEP2
PSA-G104
C-101
S- 105
F S P L I T
SP-N2
V- 107
V- 105V- 106
E- 103
E- 104
S- 102
S- 103
MI X ER
MIX11+13
MI X ER
MIX10+12
MI X ER
MX-104
MI X ER
MIX9+14
S- 104
V- 108
E- 105
M I X E R
MIX17+23
V- 110
SPLIT:31
V- 109
SP-V109L
MI X ER
M:18A+32
C-102
MIX24+26
C-103
PUMP21
MULT
CAP- MLT2
V-101Catalyst Di ssolver
S-105N2-Expander
P SA-G104N2-Separator
R-101Oxi dation Reactor
C-101HP -Acet ic Acid Scrubber S-101, S102, S-103
Nos 1,2,3 Crys talli zersS-104
Bel t-Fi lterC-102
Aceti c Acid St ripperC-103
Sovent Dehydrator
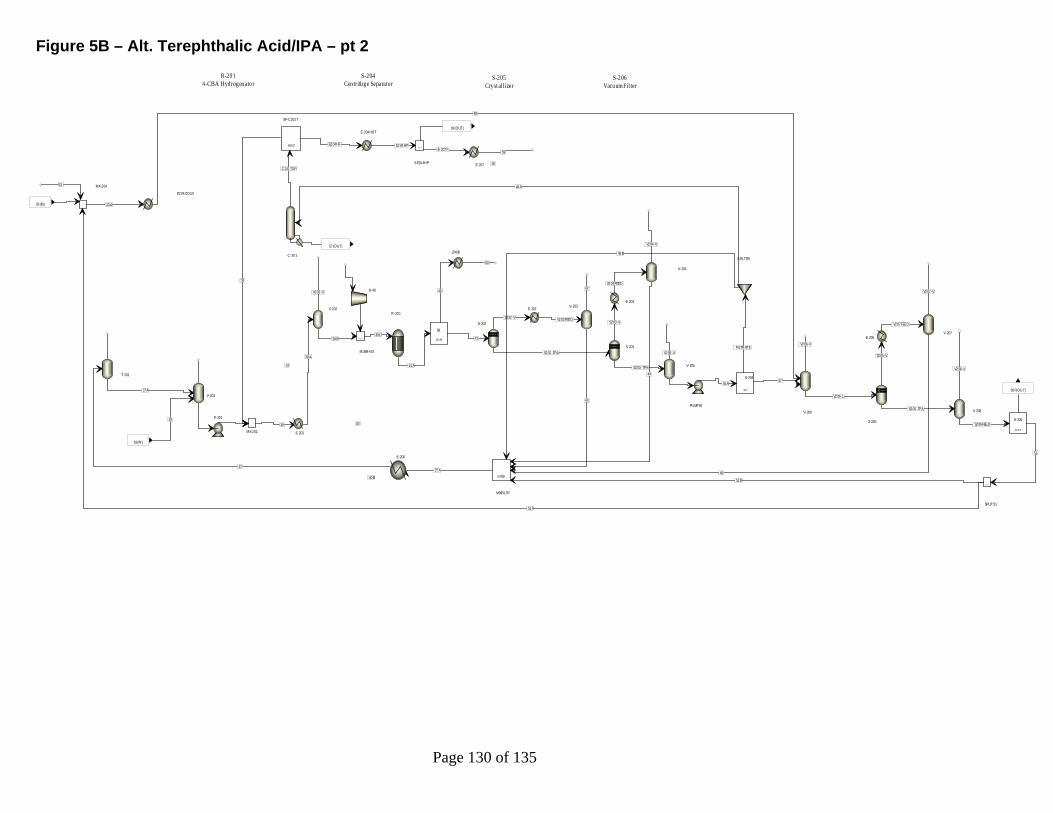
Page 130 of 135
Figure 5B – Alt. Terephthalic Acid/IPA – pt 2
19
19(IN)
33(IN)
57
57(OUT)
16
16(OUT)
50F(OUT)37A
37
58
39
39A
46A
C201TOP
E204HF E204HPE- 207F
59
V202-V
39B39C
41A
41
S202-V
S202-TPA
S203-TPA
S203-V
V204FEED
V203FEED
42
43
44
V204-V
V205-V
40B
46B
49
52B
37X
46
60
48
47
V206-L
V206-V
S205-TPA
S205-V
V207FEED
V207-V
V208-V
S206FEED
45A
FILTRATE
33A
51
52A
53
40
V- 201
T- 201
P- 201
M I X E R
MX-201 E- 201
C-201
FSPLIT
SP-C201T
FSPL I T
S:E204HP
E- 204HOT
E- 207
V- 202R-201
S- 202
S- 203
E- 203
E- 202V- 203
V- 204
V- 205
MI X ER
M:39B+40
MIXER
MIXFILTR
E- 206
DUPL
B1
ZHB6
V- 206
S- 205
V- 207
V- 208
E- 205
SE P
S- 204
E204COLD
S:FILTER
FS PLIT
S- 206
FSPL I T
SPLIT:51
PUMP45
M I X E R
MX-204
K- 40
R-2014-CBA Hydrogenator
S-204Centrifuge Separator
S-205Cryst al li zer
S-206Vacuum Fil ter

Page 131 of 135
Figure 5C – Alt. Terephthalic Acid/IPA – pt 3
50F(IN)
101
107B
102 103
104
105 105B
107
108 109
110
111100
MIX-100
SEP-301
SEP-302
E-303SEP-303
P50MIX-50
P107
E-301E-302
E-302/SEP-3022nd _Crystalizer
E-303/SEP-3033rd _Crystalizer
E-301/SEP-3011st _Crystalizer

Page 132 of 135
Figure 5D – Base Terephthalic Acid Case – pt 1
V-101Catalyst Dissolver
S-105N2-Expander
PSA-G104N2-Separator
R-101Oxidation Reactor
C-101HP-Acetic Scrubber
R-103MeAcetate Converter
S-101, S-102, S-103Nos.1, 2, 3 Crystallizers
V-102
V-101
K-101
E-101
V-103
V-104 V-105V-106
E-102 E-103
E-104
R101VL
S-101
S-102
S-103
E-108
FSPLIT
FS-101
R-101
MIXER
MX-101
MIXER
MIX11+13
MIXER
MIX10+12MIXER
MX-104
MIXER
MIX9+14
MIXER
MX-100
R-102
R-103
MULT
CAP-MULT
PSA-G104
C-101
S-105
FSPLI T
SP-N2
42A
5
V102-VV101FEED
V101-V
V101-L
15
1
1A
5A15A2
6
8
V104FEED
9
10
V105FEED
13
12
V106FEED
14
V106-V
S101-V
S102-V
S103-V
R101PROD
5A
5B
AIR2S101 7 11
11+13
AIR2R101
10+12 26
29
57
74
3
54
23
8A
21
21A
2
22
35A
36
35N2TOUTIL

Page 133 of 135
Figure 5E – Base Terephthalic Acid Case – pt 2
S-104Belt Filter
C-102Acetic Acid Stripper
C-103Solvent Dehydrator R-201
4-CBA Hydrogenator
V-107
SEP
S-104
V-108
E-105
V-201
T-201
P-201
M I XER
MX-201
E-201
V-202
R-201
S-202
E-202
V-203
MIXER
M:39B+40
MIXER
MIX17+23
V-110
FSPLIT
SPLIT:31
V-109
FSPLIT
SP-V109LC-102
MIXER
MIX24+26
C-103
MIXER
MIXFILTR
E-206
C-201
FSPLIT
SP-C201T
FSPLIT
S:E204HP
E-204HOT
E-207
PUMP21
15
V107-L
V107-V
26
29
57
V108-L
18
19
17
V108FEED
V108-V
16
37A
19A
V201-V
37
3819B
58
39
39A
V202-V
39B
39C
41
S202-V
S202-TPA
V203FEED
42
43
44
49
40
33
23 27
V110-V
C103TOPF
31
21X
V109-V
V109-L20
18A
32
25
24
28
21
30
46B
46A
52B
37X
E204HFE204HP
E-207F
59

Page 134 of 135
Figure 5F – Base Terephthalic Acid – Part 3
S-204Centrifuge Separator
S-206Vacumm filter
S-207TPA Dryer
S-205 Crystallizer
S-203
E-203
V-204
V-205
V-206
S-205
V-207
V-208
E-205
SEP
S-207
S-208 S-209
SEP
S-204
E204COLD
MI XER
MX-204
FSPLI TS:FILTER
FSPLIT
S-206
FSPLI T
SPLIT:51
PUMP45
S202-TPA
S203-TPA
S203-V
V204FEED
44
V204-V
45
V205-V
48
47 V206-L
V206-V
S205-TPA
S205-V
V207FEED
49
V207-V
V208-V
S206FEED
50
54
55-VENT
50A
50B
56
S209-V
45A
FILTRATE
33A
33 53
52A
46B
46A
51
52B

Page 135 of 135
Appendix 6—Fuel and Feedstock Prices used for CPAT Table 6A: Raw Material, Product, and Utility Prices used for CPAT Cases (based on 2006 prices) Fuel/Feedstock Notes Cost Unit Utilities Electricity, KWH $0.0557 per KWH
Fuel/Steam $8.22per MM Btu
Chemicals Ethylene $0.55 per lb Ethane $0.18 per lb Propylene Co-product $0.45 per lb Chlorine $0.17 per lb Sodium Chloride $0.02 per lb Causttic Soda Co-product $0.15 per lb Hydrogen By-product $1.27 per lb Ethylene Oxide $0.80 per lb Ethylene $0.55 per lb Oxygen $0.05 per lb Dilute MEG By-product $0.38 per lb Ammonia $0.16 per lb Methane $0.15 per lb Terephthalic Acid $0.42 per lb PTA/IPA $0.42 per lb p-Xylene $0.52 per lb Acetic Acid $0.47 per lb Mixed Xylenes $0.31 per lb o-Xylene By-product $0.37 per lb