Items Module 6
8
~ = = = = = = = = = = = = = = = = = = ~ ~ = = = = = = = = IT MS • Instructional Topics in ducational Measurement ~ ~ ~ ~ ~ ~ = = = = = = ~ = = = = = n N ME Instructional Module on Traditional quating Methodology Michael J Kalen The merican ollege Testing Program This instructional module is intended to promote a conceptual under- standing of test form equating using traditional methods. The pur- pose of equating and the context in which equa ting occurs are describe d. The process of equating is distinguished from the related process of scaling to achieve comparability. Three equating designs are con- sidered and three equating methods-mean linear and equiper- centile-are described and illustrated. Special attention is given to equatin g with nonequivale nt group s and to sources of equating error. Student X takes a college admissions test for the second time and earns a higher score than on the firs t testing. Why? We might conclude that this higher score reflects a higher level of achievement. What if , however, S tudent X had been administered exactly the same test questions on the second testing as on the first testing? Then rather than indicating a higher level of a chievement, Stude nt X s score on the se- cond testing mig ht be inflated because X had already been exposed to the test items. Fortunately, most college admis- sion s testing programs use a new test form (set of test ques- tions) on each test date, so it would be unlikely for Student X to be administered the same test questions on two test dates. The use of different test forms on different test dates sug- gests another potential problem, as illustrated by the follow- ing situation. Students Y and Z are applying for the same college scholarship that is based, in part, on scores on a test. Students Y and Z take the test on different test dates, and Student Yearns a higher score than Z. Is Student Y higher achieving than Z? What if Y took an easier test form than Michael J Kolen is Director Measuremen t Research Depart- ment American ollege Testing Program P.O. Box 168, Iowa City Iowa 52243. He specializes in educational measurement and statistics. Serie s Information ITEMS is a series of units designed to facilitate instruction in educati onal measurement. These units are published by the Na- tional Council on Measurement in Education. This module may be photocopied w ithout permission i reproduced in its entirety and used for instructional purposes. Fred Brown, Iowa State University, has served as the editor for this module. Winter 198 8 Z? If so, then Y could be unfairly advantaged relative to Z because Y took an easier form. However, most college testing programs equate test forms. In equating, test scores are ad- justed based on the difficulty of the form administered. If the test forms were succe ssful ly equated, th en th e difference observed between Y and Z could not be attributed to Y be- ing administered the easier form. The process of equa ting is used in situations where mul ti- ple forms of a test exist , and examinees taking different forms are compared to each other. Even though test developers at- tempt to construct test forms that are as similar as possible to one another in content and statistical speci ficat ions, the forms will still differ somewh at in diffi culty. Equ ati ng is in - tended to ad just for diff icult y difference s, allowing the forms to be used interchangeably. Mter successful equating, exam- inees can be expected to earn the same score regardless of the test form administered. There are processes similar to equating that are better referred to as scaling to achieve comparability as suggested in the Standards for E ducationa l and Psych ological Testing (AP A, 1985) . One of thes e pro cesse s is ve rtical scaling (fre - quently referred to as vertical equating ), which is often used with elementary achievement test batteries. In these batteries, studen ts typically are administered test questions matched to their current educational level (e.g., grade), but scores over test questions ma tched to different educational levels are all reported on the same score scale (e.g., grade equivalents). This procedure allows the scores of examinees at differe nt levels to be compared, and allows for the assess- ment of an individual's growth over time. Because the con- tent of the tests administered to the students at various educational levels is different, scores on tests intended for different educational levels ca nnot be used interchangeably, even though they are reported on the same score scale. Other examples of scaling include converting scores on one test to the score scale of another test, and scaling the tests within a battery so they all have th e same distributional char - acteristcs. As with vertical scaling, solutions to these prob- lems do not allo w the test s to be used interchangeably because the content of the tests is different; that is, equating adjusts for differences in difficulty-not for differences in content. Many of the procedures used in equating are also used in scaling to achieve comparability. In this module the focus is on equating. Angoff (198 4) and Pet erse n, Kolen, and Hoover (in press) present more detailed discussions of equating and 29
-
Upload
putu-wisna-ariawan -
Category
Documents
-
view
218 -
download
0
Transcript of Items Module 6

8/12/2019 Items Module 6
http://slidepdf.com/reader/full/items-module-6 1/8
~ = = = = = = = = = = = = = = = = = = ~ ~ = = = = = = = = IT MS • Instructional Topics in ducational Measurement ~ ~ ~ ~ ~ ~ = = = = = = ~ = = = = =
n N ME Instructional Module on
Traditional quating
MethodologyMichael J Kalen
The merican ollege Testing Program
This instructional module is intended to promote a conceptual under-
standing of test form equating using traditional methods. The pur-
pose ofequating and the context in which equating occurs are described.
The process of equating is distinguished from the related process of
scaling to achieve comparability. Three equating designs are con-
sidered and three equating methods-mean linear and equiper-centile-are described and illustrated. Special attention is given to
equating with nonequivalent groups and to sources ofequating error.
Student X takes a college admissions test for the second
time and earns a higher score than on the first testing. Why?We might conclude that this higher score reflects a higher
level of achievement. What if, however, S tudent X had been
administered exactly the same test questions on the second
testing as on the first testing? Then rather than indicating
a higher level of achievement, Student X s score on the se-
cond testing might be inflated because X had already beenexposed to the test items. Fortunately, most college admis-
sions test ing programs use a new test form (set of test ques-
tions) on each test date,so
it would be unlikely for StudentX to be administered the same test questions on two test
dates.
The use of different test forms on different test dates sug-
gests another potential problem, as illustrated by the follow-ing situation. Students Y and Z are applying for the same
college scholarship that is based, in part, on scores on a test.
Students Y and Z take the test on different test dates, andStudent Yearns a higher score than Z. Is Student Y higher
achieving than Z? What if Y took an easier test form than
MichaelJ
Kolen is Director Measurement Research Depart-ment American ollege Testing Program P.O. Box 168, Iowa
City Iowa 52243. He specializes in educational measurement and
statistics.
Series Information
ITEMS is a series of units designed to facilitate instruction in
educational measurement. These units are published by the Na-
tional Council on Measurement in Education. This module may
be photocopied without permission i reproduced in its entirety
and used for instructional purposes. Fred Brown, Iowa State
University, has served as the editor for this module.
Winter 1988
Z? If so, then Y could be unfairly advantaged relative to Z
because Y took an easier form. However, most college testing
programs equate test forms. In equating, test scores are ad-
justed based on the difficulty of the form administered. If
the test forms were successfully equated, then the difference
observed between Y and Z could not be attributed to Y be-ing administered the easier form.
The process of equating is used in situations where multi-ple forms of a test exist, and examinees taking different forms
are compared to each other. Even though test developers at-tempt to construct test forms that are as similar as possible
to one another in content and statistical specifications, the
forms will still differ somewhat in difficulty. Equating is in-tended to adjust for difficulty differences, allowing the forms
to be used interchangeably. Mter successful equating, exam-inees can be expected to earn the same score regardless ofthe test form administered.
There are processes similar to equating that are better
referred to as scaling to achieve comparability as suggestedin the Standards for Educational and Psychological Testing
(AP A, 1985). One of these processes is vertical scaling (fre-
quently referred to as vertical equating ), which is often
used with elementary achievement test batteries. In these
batteries, students typically are administered test questions
matched to their current educational level (e.g., grade), but
scores over test questions matched to different educational
levels are all reported on the same score scale (e.g., gradeequivalents). This procedure allows the scores of examinees
at different levels to be compared, and allows for the assess-ment of an individual's growth over time. Because the con-
tent of the tests administered to the students at variouseducational levels is different, scores on tests intended for
different educational levels cannot be used interchangeably,even though they are reported on the same score scale.
Other examples of scaling include converting scores on onetest to the score scale of another test, and scaling the tests
within a battery so they all have the same distributional char-acteristcs. As with vertical scaling, solutions to these prob-lems do not allow the tests to be used interchangeably becausethe content of the tests is different; that is, equating adjustsfor differences in difficulty-not for differences in content.
Many of the procedures used in equating are also used inscaling to achieve comparability. In this module the focus ison equating. Angoff (1984) and Petersen, Kolen, and Hoover(in press) present more detailed discussions of equating and
29

8/12/2019 Items Module 6
http://slidepdf.com/reader/full/items-module-6 2/8
i
~ ~ ~ ~ ITEMS • Instructional Topics in Educational e a s u r e m e n t
related issues, and Skaggs and Lissitz (1987) have reviewedthe research on equating methods. Refer to these referencesfor more in-depth treatments of the topics presented in thismodule. •
Purpose and Context
As previously indicated, equating has the potential to im-prove score reporting and interpretation for testing programsthat possess oth of the following chal acteristcs: a) alternateforms are administered and (b) exarrtinees admioi tered
different forms are evaluated with reference to the same standard or norm group.
There are at least two alternatives to equating in situationswhere these two characteristics hold. First , raw scores canbe reported, regardless of the form administered. As was thecase with examinees Y and Z (considered earlier), this approach can cause problems because examinees administeredan easier form will be advantaged and those administereda more difficult form will be disadvantaged. In addition, ifraw scores are reported, it is difficult to disentangle test formdifferences from examinee group differences. As an exam
ple, suppose that the mean score on a 40-item test increasedfrom 27 one year to 30 another year, and that different formsof the test were administered in the two years. Can we saywhat caused this increase? Without additional informationit would be impossible to know whether this 3-point score in-crease was attributable to differences in the difficulty of thetwo forms, differences in the achievement level of the groups,or some combination of these two factors.
A second alternative to equating is to convert raw scoresto other types of scores so that certain characteristics of thescore distributions are the same across test dates. For example, in a testing program that tests twice a year, say inFebruary and August, the February raw scores might be converted to scores baving a mean of 5 among February examinees and the August raw scores converted to have a mean
of 50 among August examinees. Suppose, in addition, thatan examinee somehow knew that August examinees werehigher achieving, on average, than February examinees. In
which month should the examinee take the test to maximizeher score? Because the August examinees are higher achieving, it would be more difficult to get a high converted scorein August than in February, so it would be to the examinee s
T BLE 1
ypothetical Conversion Tables for Three Test Forms
Form 1 Form 2 Form 1 Form 3 Form 2
Raw Scaled Raw Raw Scaled Raw Raw Scaled
• • • • • • • •• • • • • • • •• • • • • • • •
30 15 30 29 15 30 29 14
29 15 29 28 14 29 28 14
28 14 28 27 14 28 27 13
27 14 27 26 13 27 26 13
26 13 26 25 13 • • •25 13 • • • • • •• • • • • • • •
30
advantage to take the test in February. Therefore, undethese circumstances, examinees who take the test with alower achieving group are advantaged and examinees whotake the test with a higher achieving group are disadvantaged. Furthermore, trends in average examinee performance cannot be addressed using this alternative because theaverage (converted) score will be the same, regardless of theachievement level of the group tested.
When equating is successful, equated scores are not affected by the problems that occur with these two alternativesbecause equat ing will adjust for differences in the difficultyof test forms. Unfortunately, it is not always possible to conduct an adequate equating. f certain assumptions are nomet, application of equating methods can make matters worsethan using either of the alternatives just discussed.
Scaling/Equating Process
Equating can be viewed as an aspect of a more general scaling/equating process. In this process, a scale for reportingscores is established at the beginning of a testing program
(or at the time that a test is revised). This score scale is chosento enhance the interpretability of scores by incorporating useful information into the score scale so s to avoid misleadinginterpretations. Incorp0rating normative information is oneway to enhance score interpretability. For example, IQ scoreare scaled to have a mean of 100 at each age level for a nationally representative group of individuals, and grade equivalents are scaled to indicate the typical performance ostudents in a particular grade.
Score scales typically are established using a single tes
form. For subsequent test forms, the scale is maintainedthrough an equating process that places scores from subsequent forms on the score scale that was established initiallyIn this way, a scaled score of 26 means the same thing regardless of the test form administered.
The hypothetical conversions shown in Table 1 illustratthe scaling/equating process. The first two columns show thconversion of Form 1 raw scores to scaled scores. For example, a raw score of 28 on Form 1 converts to a scaled scorof 14. (At this point we need not be concerned with what particular method was used to convert raw scores to scaledscores.) Note that the first two columns do not involvequating only scaling.
Now assume that an equating process indicates that Form
2 is uniformly one raw score point easier than Form 1. Thenfor example, a raw score of 29 on Form 2 would reflect thsame level of achievement as a raw score of 28 on Form 1This conversion of Form 2 raw scores to Form 1 raw scoreis shown in the second set of columns in Table 1. What scaledscore corresponds to a Form 2 raw score of 29? The answeis a scaled score of 14, because a Form 2 raw score of 29 cor
responds to aForm 1 raw score of 28 which, from the firspair of columns, corresponds to a scaled score of 14.
To carry the example one step further, assume that Form
3 is found to be uniformly one raw score point easier than
Form 2. Then, as illustrated in Table 1, a raw score of 30on Form 3 corresponds to a raw score of 29 on Form 2, whiccorresponds to a raw score of 28 on Form 1, which corresponds to a scaled score of 14. Later on, additional forms cabe converted to scaled scores by a similar chaining process(A new form also could be directly equated to the originaform.) The result of a successful scaling/equating process ithat reported scores (Le., scaled scores) on all forms are othe same scale and, therefore, can be used interchangeably
Educational Measurement: Issues and Practic

8/12/2019 Items Module 6
http://slidepdf.com/reader/full/items-module-6 3/8
I
~ ~ ~ ~ ~ ~ ~ ~ ~ = = ITEMS Instructional Topics in Educational e a s u r e m e n t = = ~ ~ ~ ~ ~ = ~ ~ ~
Equating Methodology
Three interrelated issues must be considered when equatingtests. First a design for collecting the data for equating isneeded. A variety of designs for data collection are used, andpractical concerns usually enter into the choice of the design.Second, what constitutes correspondence between scores on
alternate forms needs to be defined. In traditional equatingmethods, score correspondence is defined by setting certaincharacteristics of score distributions equal for a specifiedgroup of examinees, for example, the means and standarddeviations of two forms might be set equal for a particulargroup of examinees. (Item response theory methods use adifferent definition of score correspondence. These methodsare not considered here, but will be considered in a forthcom- .ing instructional module by Cook and Eignor, in press.) Third,the statistical methods used to estimate the defined score corr e ~ p o n d e n c e must be specified.
Equating Designs
A variety of designs are used for collecting data forequating, and the choice of a design involves considering both
practical and statist ical issues. Three commonly used designsare illustrated in Figure 1 Assume that a conversion forForm 1 raw scores to scaled scores has been developed, andthat Form 2 is a new.form to be equated to Form 1
Single group design In the single group design the sameexaminees (Group A are administered both Form 1 and Form2. What if Form 1 were administe red first to all examinees,followed by Form 2? f fatigue were a factor in examinee performance, then Form 2 could appear to be relatively moredifficult than Form 1 because examinees would be tired whenadministered Form 2. On the other hand, if familiarity withthe test increased performance, then Form 2 would appearto be easier than Form 1 To avoid effects such as fatigueand practice, the order of administration of the two formsusually is counterbalanced. In one method for counterbalanc
ing, one-half of the test booklets are printed with Form 1following Form 2 and the other half are printed with Form
2 following Form 1 In packaging, booklets having Form 1first would be alternated with the booklets having Form 2first. When the booklets are handed out, the fir st student getsForm 1 first, the second student Form 2 first, the third student Form 1 first, and so on. This spiraling process helpsto ensure that the examinee group receiving Form 1 first iscomparable to the examinee group receiving Form 2 first.
Suppose that the single group design is used to equate twoforms of a lOO-item test and that the mean for Form 1 is72 and the mean for Form 2 is 77. Assume also that a largerepresentative examinee group is used, and that counterbalancing effectively controls factors such as fatigue and practice. What can be concluded about the relative difficulty ofthe two forms? Because the mean for Form 2 is five pointshigher than the mean for Form 1 for the same examinees,we can conclude that Form 2 is on average five raw scorepoints easier than Form 1
In addition to the need to control for factors such as practice and fatigue, other practical problems can restrict the
usefulness of the single groups design. Because two formsmust be administered to the same students, testing time isdoubled, which often is not feasible. In addition, it is oftenriot possible to administer more than one form at a singleadministration.
Random groups design The random groups design is the
second design shown in Figure 1. A spiraling process typicallyis used to implement this design, where al ternate examinees
Winter 1988
in a test center are administered Form 1 and Form 2. Thisspiraling process leads to comparable (randomly equivalent)groups taking Form 1 and Form 2. As with the single groupdesign, if large representative groups of examinees are used,then the difference between means on the forms is a directindication of the average difference in difficulty between the
forms.From a practical standpoint, the random groups design isoften preferable to the single group design because each examinee takes only one form of the test, thus minimizingtest ing time. Like the single group design, the random groupsdesign requires two (or more) forms to be available andadministered at the same time, which may be difficult in somesituations. Because different examinees take the two (ormore) forms in the random groups design, la rger samples areneeded for the random groups design than for the singlegroup design where the examinees serve as their owncontrols.
Common item nonequivalent groups design The thirddesign is the common item nonequivalent groups design. Thisdesign typically is used when test security or other practicalconcerns make it impossible to administer more than one
form per test date. In this design, Form 1 and Form 2 havea set of items in common, and di fferent groups of examineesare administered the two forms. There are two variationsof this design. When the score on the set of common itemscontributes to the examinee s score on the test the set ofcommon items is referred to as internal Typically, internalcommon items are interspersed among the other items in thetest. When the score on the common items does not con-
Form I
Sinale Group
Form 2
8 8Random Groups
Form I Form 2
Common hem Nonequivalent Groups
Form I
Form 2
FIGURE 1 Illustration of three data olle tion designs
31
8/12/2019 Items Module 6
http://slidepdf.com/reader/full/items-module-6 4/8
~ ~ ~ ~ = = = = ~ ~ ~ ~ = = = ; ITEMS· Instructional Topics n Educational M e a s u r e m e n t ~ ~ ~ ~ ~ ~ ~ ~ ~ ~ ~
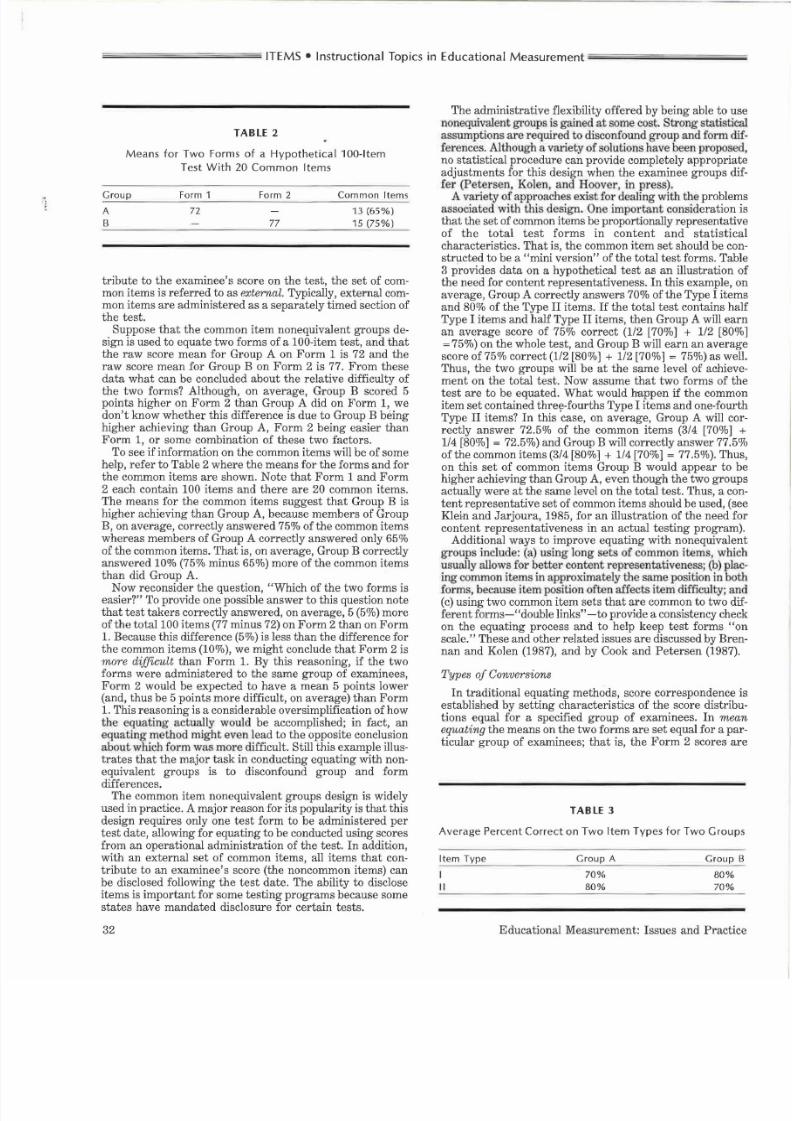
T BLEMeans for Two Forms of a Hypothetical100 ltem
Test With 20 Common Items
Group Form 1 Form 2 Common Items
A
B
72
77
13 (65 )
15 (75 )
tribute to the examinee's score on the test, the set of com-mon items is referred to as external. Typically, external com-mon items are administered as a separately timed section ofthe test.
Suppose that the common item nonequivalent groups de-sign is used to equate two forms of a 100-item test, and thatthe raw score mean for Group A on Form 1 is 72 and theraw score mean for Group B on Form 2 is 77. From these
data what can be concluded about the relative difficulty ofthe two forms? Although, on average, Group B scored 5points higher on Form 2 than Group A did on Form 1, wedon' t know whether this difference is due to Group B beinghigher achieving than Group A, Form 2 being easier thanForm 1, or some combination of these two factors.
To see if information on the common items will be of somehelp, re fer to Table 2 where the means for the forms and forthe common items are shown. Note that Form 1 and Form2 each contain 100 items and there are 20 common items.The means for the common items suggest that Group B ishigher achieving than Group A, because members of GroupB, on average, correctly answered 75 of the common itemswhereas members of Group A correctly answered only 65of the common items. That is, on average, Group B correctly
answered 10 (75 minus 65 ) more of the common itemsthan did Group A.Now reconsider the question, Which of the two forms is
easier? To provide one possible answer to this question notethat test takers correctly answered, on average, 5 (5 ) moreof the total 100 items (77 minus 72) on Form 2 than on Form
1. Because this difference (5 ) is less than the difference forthe common items (10 ), we might conclude that Form 2 ismore difficult than Form 1. By this reasoning, if the twoforms were administered to the same group of examinees,Form 2 would be expected to have a mean 5 points lower(and, thus be 5 points more difficult, on average) than Form1. This reasoning is a considerable oversimplification of howthe equating actually would be accomplished; in fact, anequating method might even lead to the opposite conclusionabout which form was more difficult. Still this example illustrates that the major task in conducting equating with nonequivalent groups is to disconfound group and formdifferences.
The common item nonequivalent groups design is widelyused in practice. A major reason for its popularity is that thisdesign requires only one test form to be administered per
test date, allowing for equating to be conducted using scoresfrom an operational administration of the test. In addition,with an external set of common items, all items that contribute to an examinee's score (the noncommon items) canbe disclosed following the test date. The ability to discloseitems is important for some test ing programs because somestates have mandated disclosure for certain tests.
32
The administrative flexibility offered by being able to usenoneql.livaleot groups is gained at some cost. Strong statisticaassumptions are required to disconfound group and form differences. Although a val'ietyofsolutions have been proposedno statistical procedure can provide completely appropriatadjustments for this design when the examinee groups dif
fer (petersen, Rolen and Hoover, in press).A variety of approaches exist for dealing with the problemas oeiated with \.his design. One important consideration ithat the set of common items be proportionally representativof the total test forms in content and statistica
characteristics. That is, the common item set should be constructed to be a mini version of the total test forms. Tabl3 provides data on a hypothetical test as an illustration othe need for content representativeness. In this example, oaverage, Group A correctly answers 70 of the Type I itemand 80 of the Type II items. f the total test contains halType I items and half Type II items, then Group A will ear
an average score of 75 correct (112 [70 ] 112 [80 =75%) on the whole test, and Group B will earn an averagscore of 75 correct 1/2 [80 ] 1/2 [70 ] = 75 ) as wellThus, the two groups will be at the same level of achievement on the total test. Now assume that two forms of thtest are to be equated. What would happen if the commoitem set contained thre€il-fourths Type I items and one-fourthType II items? In this case, on average, Group A will correctly answer 72.5% of the common items 3/4 [70 ]114 [80 ] = 72.5%) and Group B will correctly answer 77.5%of the common items 3/4 [80 ] 114 [70 ] = 77.5%). Thuson this set of common items Group B would appear to bhigher achieving than Group A, even though the two groupactually were at the same level on the total test . Thus, a content representat ive set of common items should be used, (seKlein and Jarjoura, 1985, for an illustration of the need focontent representativeness in an actual testing program)
Additional ways to improve equating with nonequivalengroups include: (a) using long sets of common items, which
usually allows for better content representativeness; (b) placing common items in approximately the same posi.tion in bothforms, because item position often affects item difficulty; and(c) using two common item sets that are common to two different forms- double links to provide a consistency checon the equating process and to help keep test forms oscale. These and other related issues are discussed by Brennan and Kolen (1987), and by Cook and Petersen (1987).
Types o Conversions
In traditional equating methods, score correspondence iestablished by setting characteristics of the score distributions equal for a specified group of examinees. In meaequating the means on the two forms are set equal for a particular group of examinees; that is, the Form 2 scores are
T BLE 3
Average Percent Correct on Two Item Types for Two Croups
Item Type
I
II
Group A
70
80
Group B
80
70
Educational Measurement: Issues and Practice

8/12/2019 Items Module 6
http://slidepdf.com/reader/full/items-module-6 5/8
I T M S · Instructional Topics in Educational M e a s u r e m e n t
>-uC))
I.U
0.8
i} 0 6))
L.t
))
.2:;'S 0 4 ·
E::J
U
))
>0 2
V
'
I
Form 1
I/
H H ~ ~ ~ - - - - r ~ - - - I - - - - ~ - - - - - - - - - - - io m w w
Raw Score
FIGURE 2. Relative Cumulative Frequencies (Percentile
Ranks 100) for Two CT ssessment Mathematics Forms
converted so that their mean will equal the mean of the scoreson Form 1. In linear equating the means and standard deviations on the two forms for a particular group of examineesare set equal. In this method, Form 2 scores are convertedso as to have the same mean and standard deviation as scoreson Form 1. In equipercentile equating the Form 2 distribution is set equal to the Form 1 distribution for a particulargroup of examinees. Form 2 scores converted using equipercentile equating have approximately the same mean, standard deviation, and distributional shape (skewness, kurtosis,etc.) as do scores on Form 1. Any of these types of conversions can be used with any of the equating designs described
previously. Although the equating relationship always.isderived for a specified group of examinees, Angoff and Cowell(1986) and Har ris and Kolen (1986) indicate that similar conversions can be expected for a wide range of examinee groupswhen equating alternate forms.
Mean equating. Consider the example described earlier forthe single group design in which the mean on Form 1 was72 and the mean on Form 2 was 77. In mean equating, a Form1 score of 72 would be set equal to a Form 2 score of 77, sothat a score of 77 on Form 2 would be judged to ref lect the
same level of achievement as a score of 72 on Form 1. In meanequating, the difference observed at the mean (in this example, 77 - 72 = 5 points) is defined to be constant throughoutthe score scale. So, for example, a Form 2 score of 70 wouldbe considered as indicating the same level of achievement
as Form 1 score of 65.To express mean equating in the form of an equation, first
set equal those scores on the two forms that are an equaldistance away from their respective means:
Xl - Xl = X2 - X2,
where Xl is Lscore on Form 1, X2is the corre..§ponding scoreon Form 2, Xl is the mean on Form 1, and X2 is the meanon Form 2. Then solve for Xl:
Xl = X2 - X2 Xl,
which is the equation for finding the Form 1 score correspond-
Winter 1988
ing to a particular Form 2 score. For the example:
Xl = X2 - 77 72 = X2 - 5.
What is the Form 1 equivalent of a Form 2 score of 70? I t
can be found by plugging 70 into the preceding equation.Thus, Xl = 70 - 5 = 65, which was indicated earlier.
Linearequating. Mean equating assumes that the difference in difficulty between the forms is constant throughout
the entire score range. In many cases the difference inrelative difficulty between two forms is better considered tobe variable along the score scale. For example, Form 1 mightbe relatively more difficult than Form 2 for low achievingstudents than for high achieving students. Linear conversionsallow the relative difficulty of the forms to vary along the
score scale.The linear conversion is defined by setting standardized
scores on the two forms equal, so that:
Xl - Xl X2 - X2
Sl S2
where Sl is the standard deviation for Form 1 and S2 is the
standard deviation for Form 2. Solving for Xl:
X, = X, [ 5< - X ] = B,
where,
A = Sl and B = Xl - Sl X2.
S2 S2
The constant A is often referred to as the slope of the linearconver'sion and B as the intercept.
Suppose that for the previously described mean equa tingexample the standard deviations are Sl = 9 and S2 = 10.The linear conversion is
Xl = ~ X2 [ 72 - ~ 77) ] = .9 X2 2.7 .10 10
First apply this equation at the mean X2value of 77. In thiscase Xl = .9(77) 2.7 = 72, which is the mean on Forn;.1.This result illustrates that linear and mean equat ing give thesame conversion at the mean score. What if X2is 67? ThenXl = .9(67) 2.7 = 63. What if X2 is 87? Then Xl = .9(87)
2.7 = 81. Thus, the difference in test form difficulty varieswith the score level; in this example the difference for scoresaround 85 (e.g., 87 - 81 = 6) is greater than the differencefor scores around 65 (e.g., 67 - 63 = 4). Recall that thisdifference would be constant using mean equating.
Equipercentile equating. Equipercentile equating providesfor even greater similarity between distributions of equatedscores than does linear equating. In equipercentile equating,scores on Form 1 and Form 2 with the same percentile rank
for a particular group of examinees are considered to indicatethe same level of performance.
The process of equipercentile equating is presented graphically in Figures 2 and 3. The equating shown in these figureswas based on an administrat ion of two forms of the 40-itemACT Mathematics test to over 3000 examinees using the random groups design. The first step in this graphical processis to plot the relative cumulative frequency distributions(percentile ranks/l00) for each form. Form 1 and Form 2
33
8/12/2019 Items Module 6
http://slidepdf.com/reader/full/items-module-6 6/8
.i
~ ~ ~ ~ ~ ITEMS • Instructional Topics in Educational Measurement ~ ~ ~ ~ ~ ~
40 -
55 ·
1Il
1:Q) 25
' J20
E 15,£
10
00
_ _ Unsmoolhed Equipereanlile
Smoothed quipercentile
Linear
/o b
Form Raw Score
i
0
/
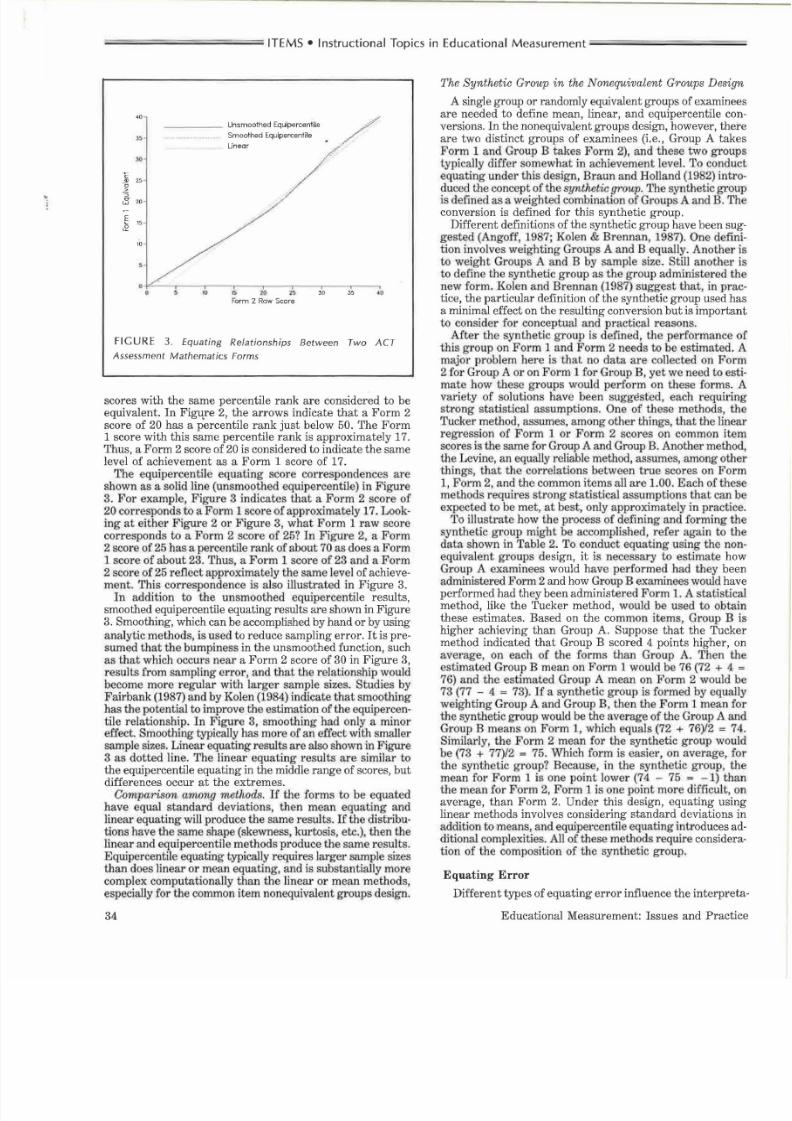
FIGURE 3 Equating Relationships Between Two CT
ssessment Mathematics Forms
scores with the same percentile rank are considered to beequivalent. In Figtlfe 2, the arrows indicate that a Form 2score of 20 has a percentile rank just below 50. The Form1 score with this same percentile rank is approximately 17.Thus, a Form 2 score of 20 is considered to indicate the samelevel of achievement as a Form 1 score of 17.
'l'he equipercentile equating core correspondences are
shown as a. solid line (unsmoothed equipercentile) in Figure3. For example, Figure 3 indicates that a Form 2 score of20 corresponds to a Form 1 score of approximately 17. Looking at eitbel' Figure 2 or Figure 3, what Form 1 raw scorecorresponds to a Form 2 score of 25? In Figul'e 2 a Form2 score of 25 has a. percentile l'ank of about 70 as o ~ s a Form1 score of about 23. Thus, a Form 1 score of 23 and a Form2 score of 25 reflect approximately the same level of achievement. This correspondence is also illustrated in Figure 3.
In addition to the unsmoothed equipercentile resultssmoothed equipercentile equating results are shown in i g u r ~3. Smoothing, which can be accomplished by hand or by usinganalytic methods, is used to reduce sampling error. t is presumed that the bumpiness in the unsmoothed function suchas that which occu:s near a Form 2 score of 30 in F i ~ e 3,results from samphng errol', and tha.t the relationship wouldb e ~ o m e more regular with larger sample sizes. Studies byFall'bank (1987) and by Kolen (1984) indicate that smoothingh.as the P?tenti.al to imI;>l ove the estimation o the equipercentile l e l a t i o n s ~ p In ~ g u r e 3 smoothing had only amino)'effect. Smoothing typIcally has more of an effect with smallersample sizes. Linear equating results are also shown in Figure
3 as dotted line. The lineal' equating results are similar tothe equipercentile equating in the middle range of scores butdifferences occur at the extremes. '
omparison urtWng methods f the forms to be equatedhave equal standard deviations then mean equating andlinear equating will produce the same results. f the distribut.ions have the a m e shape (skewness ku.rtosis, etc,), then thetineal' and eqUlpercenti.le methods produce the same results.Equipercentile equating typically requires larger sample sizesthan does linear or mean equating, and is substantially morecomplex computationally than the linear or mean methodsespecially for the common item nonequivalent groups design:
34
The Synthetic Group in the Nonequivalent Groups Design
A single group or randomly equivalent groups of examineeare needed to define mean, linear, and equipercentile conversions. In the nonequivalent groups design, however, thereare two distinct groups of examinees (i.e., Group A takeForm 1 and Group B takes Form 2), and these two grouptypically differ somewhat in achievement level. To conducequating under this design, Braun and Holland (1982) intro
~ u c e d the o n c e p ~ of the y n t ~ t : i c group The synthetic group1S defined as a weIghted combmation of G,'oups A and B. Theconversion is defined for this synthetic group.
Different definitions of the synthetic group have been suggested (An goff, 19 7; Kolen Brennan, 1987). One definition involves weighting Groups A and B equally. Another isto weight Groups A and B by sample size. Still another ito define the synthetic gt OUp as the group administered th
~ e w form. Kolen and Bl'ennan (1987) suggest that, in pract l c e ~ t ~ e particular definition of the synthetic group used haa minimal effect on the resulting conversionbut is importanto consider for conceptual and practical reasons.
:UteI' the synthetic group is defin,ed, the performance oth ls gJ'oup on Form 1 and Form 2 needs to be estimated. Amajor problem here is that no data are collected on Form
2 for Group A or on Form 1 for Group B, yet we need to estimate how these groups would perform on these forms. Avariety of solutions have been suggested, each requiringstrong statistical assumptions. ne of these methods, theTucker ~ e t h o d , assumes, among other things, that the linearegresslon of FOt m 1 01' Form 2 scores on common itemscores is the same for Group A and Group B. Another methodthe Levine, an equally reliable method, assumes, among othetthings, that the correlations between true scores on Form1, Form 2, and the common items all are 1.00. Each of thesemethods l'equU'es strong statistical assumptions that can beexpected to be met at best, only approximately in practice
To illustrate how the process of defining and forming thesynthetic group might be accomplished, refer again to thdata shown in Table 2. To conduct equating using the nonquivalent groups design, it is necessary to estimate how
G r o ~ p . A examinees would have performed had they beenadmmlstered Form 2 and how Group B examinees would havperformed had they been administered Form 1. A statisticamethod, like the Tucker method, would be used to obtainthese estimates. Based on the common items Group B ihigher achieving than Group A. Suppose that the Tuckemethod indicated that Group B scored 4 points higher, onaverage, on each of the forms than Group A. Then thestimated Group B mean on Form 1 would be 76 (72 476) and the estimated Group A mean on Form 2 would be
73 (77 - tt 73). f a synthetic group is formed by equallyweighting Group A and Group B, then the Form 1 mean fOthe synthetic group would be the average of the Group A andGroup B means on Form 1, which equals (72 76)/2 = 74Similarly, the Form 2 mean for the synthetic group would
be (73 77 /2 = 75. Which form is easier, on average, fothe synthetic group? Because, in the synthetic gJ'oup, thmean fol' Form 1 is one point lower ( 74 - 75 = -1 thanthe mean for Form 2, Form 1 is one point more difficult, onll;verage, than ~ o r m 2. Under this design, equating usinglmear methods Involves considering standard deviations inaddition to means, and equipercentile equating introduces additiOl1al complexities. All of these methods require consideration of the composition of the synthetic group.
Equating Error
Different types of equating error influence the interpreta
Educational Measurement: Issues and Practic

8/12/2019 Items Module 6
http://slidepdf.com/reader/full/items-module-6 7/8
IT MS· Instructional Topics in Educational e s u r e m e n t
tion of results from the application of equating methods.Equating designs and equating meth.ods s ~ o u l d be ~ o s e n to
lead to as little equating error as possIble, gIVen practical constraints. In some practical circumstances the amount ofequating error may be so large that it is better not to evenattempt to equate.
andom equating error is present h e n ~ v e r samples from
populations of examinees are used to estImate parameterssuch as means, standard deviations, and percentile ranks.Random error can be reduced by using larger samples of examinees and by the choice of equating design. Random error
can be especially troublesome when practical considerationsdictate the use of small samples of examinees.
Systematic equating error results from ~ o l a t i o n s of ~ h eassumptions and conditions of the partIcular equatmgmethodology used. In the single group design, failure to con- .trol for fatigue and practice effects can be major s o u r ~ eof systematic error. In the random r o ~ p s d e s I ~ s ~ s t e m ~ t I cerror will resul t if the spiraling process IS meffectIve m achIeving group comparability. S y s t e m a t i ~ equating error is e s ~ e c i -ally problematic in the noneqmvalent ~ T O U p S d e s I ~ nSystematic error will result if the assumptIOns underlymgthe method (e.g., Tucker or Levine) used are not met. These
assumptions can be especially difficult to meet if the groupsdiffer substantially or if the common items are not representative of the total test form in content and statistical characteristics. In addition, systematic error will likely result ifthe common items function differently from one administration to another. or example, common items sometimes £mIction differently if their position in the old and new form isnot the same. Or, in some professional certification and licensure examinations (e.g., medicine), changes in the body ofknowledge can change the difficulty of an item or even thekeyed answer. or any equating desilpl, s ~ s t e m a t i c err.or. canresult if the new form and old form differ content, diffICulty, and reliability.
When a large number of test forms are n v o l v e ~ in the scaling/equating process, both random and systematIc error ~ n dto accumulate. Although random error can be quantifIedfairly readily using the standard error of equating, s y s t e m ~ t i cerror is much more dificult to estimate. In conductmgequating and in set ting up equating plans, it is necessary toattempt to minimize both kinds of error.
Self Test
1 A scholarship test is administered twice per year and dif
ferent forms are administered on each test date. Current
ly the top 10 0 of the examinees on each test date earn
scholarships, and the test forms are not equated.
a. f the test forms were equated, would this affect whowas awarded a scholarship? Why or why not?
b. Suppose the top 10 0 who took the test during the year(rather than at each test date) were awarded scholar
ships. In this case, could equating affect who passed?Why or why not?
2. Refer to the example in Table 1 f orm 4 were foundto be uniformly one point more difficult than Form 3 whatscaled score would correspond to a orm 4 raw score of
29?
3. The following data resulted from the administration of two
forms of a test using a random groups design:
Winter 1988
orm 1
Xl = 30
Sl = 5
orm 2
X2 = 32
S2 = 4
a. Using mean equating, what Form 1 score correspondsto a orm 2 score of 36?
b. Using linear equating, what Form 1 score corresponds
to a orm 2 score of 36?4. Based on the graphs in Figure 2 what orm 2 score cor
responds to a orm 1 score of 15 using equipercentileequating?
5. Refer to the data shown in Table 3.
a. Which group would appear to be higher achieving onset of common items composed only of Type I items?
b. Which group would appear to be higher achieving ona set of common items composed only of Type items?
6. One state passes a law that all items that contribute toan examinee s score on a test must be released to that
examinee, on request, following the test date. Assumingthat the test is to be secure, which of the equating designscan be used to equate forms of the test? Briefly indicate
how equating would be accomplished using this (these)design(s).
Answers to Self-Test
1 a. Because the top 1 of the examinees on a particulartest date will be the same regardless of whether or notan equating process is used, equating would not affectwho was awarded a scholarship.
b. t is necessary to consider examinees who were administered two forms as one group in order to identify thetop 10 0 of the examinees during the whole year. f theforms on the two test dates were unequally difficult,then the use of equating could result in scholarshipsbeing awarded to different examinees than just usingthe raw score on the form each examinee happened tobe administered. When successful equating is feasible,it generally provides for a more equitable basis forawarding scholarships, because equating adjusts for thedifferences in the difficulty of test forms.
2. Because orm 4 is one point more difficult than orm 3a score of 29 on orm 4 would be indicative of the samelevel of achievement as a raw score of 30 on Form 3. FromTable 1 a orm 3 score of 30 corresponds to a orm 2score of 29, which corresponds to a orm 1 score of 28which corresponds to a scaled score of 14. Therefore, a
orm 4 raw score of 29 converts to a scaled score of 14.3. a. rom Equation 1,
Xl = X2 - X2 + Xl = X2 - 32 + 30 = X2 - 2.
Thus, using mean equating, a orm 2 score of 36 corresponds to a orm 1 score of 36 - 2 = 34.
b. rom Equation 2
Xl = Q 36) + 30 - Q 32) = 35.4 4
Thus, using linear equating, a orm 2 score of 36 corresponds to a orm 1 score of 35.
4. A orm 1 score of 15 has a percentile rank of approximately 39 as does a orm 2 score of approximately 18.Thus a orm 1 score of 15 indicates approximately the
same level of achievement as a orm 2 score of 18.
35

8/12/2019 Items Module 6
http://slidepdf.com/reader/full/items-module-6 8/8
TEMS Instructional Topics in Educational e s u r e m e n t ~
5. a. Group B would appear to be higher achieving becausethey correctly answer 80 of the Type I items as com-pared to 70 for Group A.
b. Group A would appear to be higher achieving becausethey correctly answer 80 of the Type II items as com-pared to 70 for Group B
6. Because the test is to be secure, items that are going to
be used as scored items in subsequent administrations cannot be released to examinees. A common items design withan external set of common items would be the easiestdesign to implement in these circumstances. On a particular administration, each examinee would receive a testform containing the scored items, a set of unscored itemsthat had been administered along with a previous form,and possibly another set of un scored items to be used asa common item section in subsequent equatings. Thus, allitems that contribute to an examinee's score would be newitems that would never need to be reused. The single groupand random groups designs also could be implemented using a special study. For example, using the random groupsdesign a number of forms could be spiraled in a state orstates that did not have test disclosure legislation, andthese forms then used lat er in the state with the legisla
tion. In this case, no common items would be needed.
Annotated References
American Psychological Association. (1985). Standards for educa-
tional and psychological testing. Washington, DC: Author.Presents a discussion of equating and rela ted issues and standards
for conducting equating.
Angoff, W. H. (1984). Scales norms and equivalent scores. Princeton,NJ: Educational Testing Service. Originally appeared in R. L.Thorndike (Ed.), Educational measurement (2nd ed.), 508-600.
Washington, DC: American Council on Education, 1971.
A comprehensive treatment of equating as well as norming andscore scales that present s major developments through 1971. Thischapter contains discussions of issues from both conceptual and
statistical perspectives.
Angoff, W. H. (1987). Technical and practical issues in equating: Adiscussion of four papers. Appl ied Psychological Measurement 11
291-306.
An extensive discussion of the Cook and Petersen, Fairbank, Kolen,
and Brennan, and Brennan and Kolen papers in a special issue ofthis journal. Presents a conceptual perspective that is sometimes dif
ferent from that presented by the authors of the individual papers.Angoff, W. H., Cowell, W. R. (1986). An examination of the
assumption that the equating of parallel forms is populationindependent. Journal o Educational Measurement 23, 327-345.Describes a study that showed that equating relationships for alter-
nate test forms are very similar for different examinee groups.
Braun, H. I., Holland, P. W. (1982). Observed score test equating:A mathemat ical analysis of some ETS equating procedures. In P.
W. Holland D. B. Rubin (Eds.), Test equating (pp. 9-49). New
York: Academic Press.A detailed mathematical analysis of traditional equating methods.
Much of the volume that contains this chapter is also recommended.
Brennan, R. L., Kolen, M. J. (1987). Some practical issues inequating. Applied Psychological Measurement 11, 279-290.
A number of practical issues are discussed in this paper includingequating error, equating adequacy, co ntent specifications changes,cutting score issues, and security breaches.
Cook, L. L., Eignor, D. R (in press). Equating using item response
theory methods. Educational measurement: Issues and practice.
An instructional module that focuses on item response theory
equating methods.
Cook, L. L., Pete rsen , N. S. (1987). Problems rela ted to the use
36
of conventional and item response theory equat ing methods in lessthan optimal circumstances. Appl ied Psychological Measurement
11, 225-244.
Review of the literature on how equating methods are affected
by sampling error, sample characteristics, and characteristics of com-
mon items. Includes discussions of smoothing in equipercentileequating and th e effects of the characteristics of common items onequating results.
Fairbank, B. A. (1987). The use of presmoothing and postsmoothingto increase the precision of equating. Applied Psychological
Measurement 11, 245-262.
An extensive study of analytic methods for smoothing in
equipercentile equating. The results indicate that some of the methodsstudied had the potential to improve equating.Harris, D. J., Kolen, M. J. (1986). Effect of examinee group on
equating relationships. Applied Psychological Measurement 10
35-43.
An illustrative study showing that equating relationships are similarfor different examinee groups when conducting random groupsequating of alternate test forms.
Klein, L. W., Jarjoura, D. (1985). The importance of conten t representati on for common item equating with nonrandom groups.
Journal o Educational Measurement 22, 197-206.
A study that shows the problems that arise in nonequivalent groupsequating when the content of the common items is not representativeof the content of the total test.
Kolen, M. J (1984). Effectiveness of analytic smoothing in equipercentile equating. Journal o Educational Statistics 9, 25-44.
A description of a study of an analytic smoothing method in equipercentile equating and a study of the effectiveness of the method.
Kolen, M. J., Brennan, R. L. (1987). Line ar equat ing models forthe common item nonequivalent populations design. Applied
Psychological Measurement 11, 263-277.
Provides a formulation and comparison of the Tucker and Levine
equally reliable equating methods that explicitly considers the synthetic group, discusses issues in defining the synthetic group, and
provides formulas for decomposing observed differences in meansand variances into population differences and form differences.
Petersen, N. S., Kolen, M. J., Hoover, H. D. (in press). Scaling,norming, and equating. In R. L. Linn (Ed.), Educational measure-
ment (3rd ed.). New York: Macmillan.Extensive treatment of traditional and item response theory
equating methods and designs along with discussions of score scalesand norms.
Skaggs, G., Lissitz, R. W. (1987). IRT test equating: Relevantissues and a review of recent research. Review o Educational
Research 56, 495-529.
Reviews much of the recent empirical research on equatingmethodology.
Teaching Aids Are Available
A set of teaching aids, designed by Michael J. Kolento complement his ITEMS module, Traditional Equating Methodology, is available at cost from NCME.These teaching aids contain masters that can be usedto create transparencies of figures and tabular materialcontained in this module. As long as they a re available,they can be obtained by sending $5.00 to: TeachingAids, ITEMS Module #6, NCME, 1230 17th St., NW,Washington, DC 20036.
Educational Measurement: Issues and Practice