ITEM MANAGEMIENT EVALUATOR VOLUME S DENNY … -r12i 981 rine: the recoverable item managemient...
164
-R12i 981 RINE: THE RECOVERABLE ITEM MANAGEMIENT EVALUATOR VOLUME 1/2 MODEL DESCRIPTION(U) DECISION SYSTEMS DAYTON OH Wd S DENNY MAY 88 TR-808 8 F33688 78 C-8524 UNCLASSIFIED F/G 9/2 ,N El' E=hhhhhhEollE mhhhhhhhhhhhol smhhhhhhhhhl
Transcript of ITEM MANAGEMIENT EVALUATOR VOLUME S DENNY … -r12i 981 rine: the recoverable item managemient...

-R12i 981 RINE: THE RECOVERABLE ITEM MANAGEMIENT EVALUATOR VOLUME 1/2MODEL DESCRIPTION(U) DECISION SYSTEMS DAYTON OH
Wd S DENNY MAY 88 TR-808 8 F33688 78 C-8524
UNCLASSIFIED F/G 9/2 ,N
El' E=hhhhhhEollEmhhhhhhhhhhholsmhhhhhhhhhl
'10 We..S
MICROCOPY RESOLUfION TEST CHARTni~om* SeAU or sw*hom - s96 - A

PHOTOGRAPH THIS SHEET
K? I,.^ . R - --
LEVEL RY
~ 1XIE; VlIDOCUMIENrIDE IFICATION
rnwAAAproe im public t.1.ou4
Dfitan Uzalsated
DISJTRUION STATEMENT
A¢CCEION FORNrU GRAWVm TAB
UNANNOUNCED 0TIJUSMIICAT1ON ELECTE__ __ SDEC I1W 0BYDEflRI'rON
S D
AVAILABUIMi CODESAVAIL ANDIOR WICL DATE ACCESSIONED
DISTRIBUTION STAMP
DATE RECEVED IN DTIC KPHOTOGRAPH THIS SHEET AND RETURN TO DTIC-DDA-2
P OM DOCUMENT PROCESSING SHEET
*. . . . . . . . . .~".- - . .4r - .. ..... .. ..t~t'.:.. ..... :. ,..... ............... .,... .......-.-...........% . -..............
. .
-. ' " * °,.,P', .% ,% • 4, ", .". ' ', " " - I ". " "- . P..". .- ", " "-. "- ". %. - ". ". . . . . "-4*4,. . . '. ". .
0 0 0 0 0 6
0 0 0 0 0 6
RIME:
The Recoverable Item Management Evaluator:
Volume 1: Model Description
by
W. Steven Demmy
I.,
TR-80-OI
I)EC I S I S STE'r.MS2125 Crystni HFirle irive.
Dayton, (ihlo 45431
(513) '.?(, -ft 5
Am.d o. npbli@ mno.ag- I.Diftuibutiou unu~ted
ILL.....,4 . . . . . . .. . . . . . . . . . . .
WORKING PAPERO0 NOT PHOTOGRAPH
RIME:
The Recoverable Item Management Evaluator:
Volume I: Model Description
by
W. Steven Demmy
TR-80-01l)ECI S J~lW 5yf;'IEt
2125 Crysntni a:rle I)rw,.)LIyLI~11 , |(1ito 45431
I-L (53
D Ms. 7=1 S TATEMEN AAP~ww" in publie i.uM
.. Dibutu114mo D td
* .DEC
bE1CUNITY UL *5.ev( aitoN or ?v4I. o*Ac.O rov....Ii, t..*
REPORT DOCUMENTATION PAGE 1Atm'wvrON
1, RPON? "NMIIA 3GOVY ACCSSIONO. 3 NECiPIENT'SCATAI.O" %UMUiR
4. 4 ITLE (Aued Subii884e) S. TYPE OF REPORT a P~Eeeot) LOWERED
RIME; The Recoverable Item Management Evaluator4 INTERIMVolume 14 Model Description Aiwj'umi 79 = 1..n1.
a. PERFORMING 010. REPORT HUMMER
I. AUTHOR(S) A.CONTIRACT OnROAN UMBER(s)Y.I, S!teven Deumy -F33600-78-4-051
S. PERFORMING ORGANIZATION NAME ANO ADDRESS SO. PROGRAM ELEMENT. PROjECT. f ASKAll WR UNTNUBRDecision System A6RKI"Usa
3575 Charlene Drive 23041A5
11I. CONTROLLING OFFICE NAME AND ADDRESS 12. REPORT OATS
2750thi ABW/PMA May 1980Bldg 1, Area C 13. MUMER Of PAGES
Vrah-atterso AfR hic 153* Id.MONIOING AGENCY AMEa ADESIEUOm r mftI Ii IS SECURITY CLASS. lot uthis epeee)
Unclassified1441. OCCL £551 VICATIO/ DOWN GRADING
N/A SCM DLouIS. DISTRtIOUTION STATEMENT (a# thi. kopeert)
*Approved for public release; distribution unlimited.
17. DiSTRISuTion STATEMENT (*fib* abstraclt 0d0#4041401 Stck2. 110EII*tsmf k0Alies"p~)
Of. SUPPLCMENTARY NOTES
It. KIEY WORDS (Centhwa onl revese ide, it a..a..wy a"d Idenify~ Or 511 Number)
Recoverable Item, multi-echelon, Inventory/repair. simulation, METRIC,MOD-METRIC, AFLC
20 AW~RACT (C.ei... an rosiede 114008.0aau identify6F 5*0ck number#)
This report describes the Recoverable Item Management Evaluator (RIME), aFORTRAN simulation model for evaluating the relative coet-effectiveness ofanalytic optimization procedures proposed for use in Air Force LogisticsComand recoverable Item management systems. Major features of the model include(a) the use of actual Air Force demand histories to drive the model demandprocesses, (b) modeling of current Air Force .qtqtigticigl estimation procedures,and (c) modeling of the dynamic interations among initial provisioning, replenish,meant act distribution plicies. Volume I describes major model concepts end featutes.
DD ,..17) ~~u~oF IOVOS 0Unclassified
$11cuiRIv CLASSIFICATION OF THIS PAG9 (hfwmi 0.. E8*e.,.d
W.~ I I -,%
SECURITY CL ASSIFIC A li N OF TNiS PAC.r" (Iftm es READ I .'gaerud)
REPORT DOCUMENTATION PAGE BEFRE INSTHUCTIONS• IUul*'lOlr COMPII- TNC F()H%1
1. REPORT NUMNLR 2. GOVT ACCESSION NO. 3. RECiPIENTS CATALOG NUMUER
4. TITLE (,ud Sublifle) S. TYPE OF REPORT & PERIOD COVEREDf RIMEr The Recoverable Item Management Evaluator4 INTERIMVolume 1; Model Description AIonfv 7Q " T,,, ) A
S. PERFORMING 014G. REPORT NUMBER='-,T1R..t 1
:. ". AUTHOR(s) S. CONTRACT OR GRAM UER(s)
W, Steven Demmy F33600-78 rr)
. PERFORMING ORGANIZATION NAME AND ADORESS 10. PROGRAM ELEMENT. PROJECT. TASKAREA & WORK UNIT NUMBERSDecision System
3575 Charlene Drive 23041A5.. ". Dayton. Ohio 45432
I1. CONTROLLING OFFICE NAME AND ADDRESS 12. REPORT DATE
2750th ABW/PMA May 1980Bldg 1, Area C IS. NUMBER OF PAGES
- right-Patterson AFR Ahtn 15314. MONITORING AGENCY NAME & AOORESS(I dileorent from CoaI,.llind Office) IS. SECURITY CLASS. (of this repot)
Unclassified11s. DECL ASSI FI CATION/ DOWN GRAOINGN/A SCHEDULE
- I. DISTRIBUTION STATEMENT (at this Reportj
Approved for public release; distribution unlimited.
17. DISTRISuTION STATEMENT (of the abt tact enterod In Blok 20. II different item Roperl)
IS. SUPPLEMENTARY NOTES
I9. KEY WORDS (Continue on o *voe side it neessaary Arid Idenliy by blek amabor)
1.: Recoverable item, multi-echelon, inventory/repair, simulation, METRIC,HOD-METRIC, AFLC
20. ABSTRACT (Continue on reverse side Ii nacesary ad Identiy by block number)
This report describes the Recoverable Item Management Evaluator (RINE), a* FORTRAN simulation model for evaluating the relative cost-effectiveness of. analytic optimization procedures proposed for use in Air Force Logistics
Commnd recoverable item management systems. Major features of the model include-. (a) the use of actual Air Force demand histories to drive the model demand
processes, (b) modeling of current Air Force ,statistical estimation procedures,and (c) modeling of the dynamic interations among initial provisioning, replenishment a4 distribution policies. Volume I describes major model concepts and featu Cs.
. ORM , DITIONOF 0 5o INoS OBSOLETE Unclassified
ISCURITY CLASSIFICATION OF THIS PAGE (len Date E deeed)
., ..- .- ..- . + .- - . . . . -, - . - , . " ' : " ' . - . .. . . ' . . . ". .. .- ," .. k.,. .,. . ,--, -" -. • • . . ". . . ,. " - _ " •+ , . - 'i.. ii-. . . , ,

Table of Contents
Section
: I. Introduction
II. Major Model ConceptsIII. The Events Generator
IV. The Levels of Computation System
V. Using the Recoverable Item Management Evaluator
Appendix. RIME Record Layouts
a.
..... ""'"""°~~.. ...... ""...............,...., ", -"..."""- " .- ",,... ,,,,..... . .. . . ,. . . ,,, .. . ., ,,.§2..- . , .
)
Chapter I
Introduction
The rapid developments in computer science and operations research tech-
niques have spawned several technical revolutions in the past 30 years. Multi-
echelon inventory theory Is one of these areas. An 1950, only a few limited results
from queuing theory were available to assist inventory managers. Today, com-
puterized systems exist capable of computing jointly optimal inventory policies for
thousands of items stocked at perhaps several hundred locations, considering
assembly/sub-assembly relationships, and multi-echelon logistics support systems.
Several of these models have become major components of Air Force Logistics
Command (AFLC) data systems, and several other models have been proposed for
implementation. Application areas covered by these systems include planning and
budgeting, initial provisioning, replenishment, and distribution.
The Recoverable Item Management Evaluator (RIME) is a Fortran-based
simulation model for evaluating the relative cost-effectiveness of analytic optimi-
zation procedures proposed for use in AFLC recoverable item management
systems. Major features of RIME include:
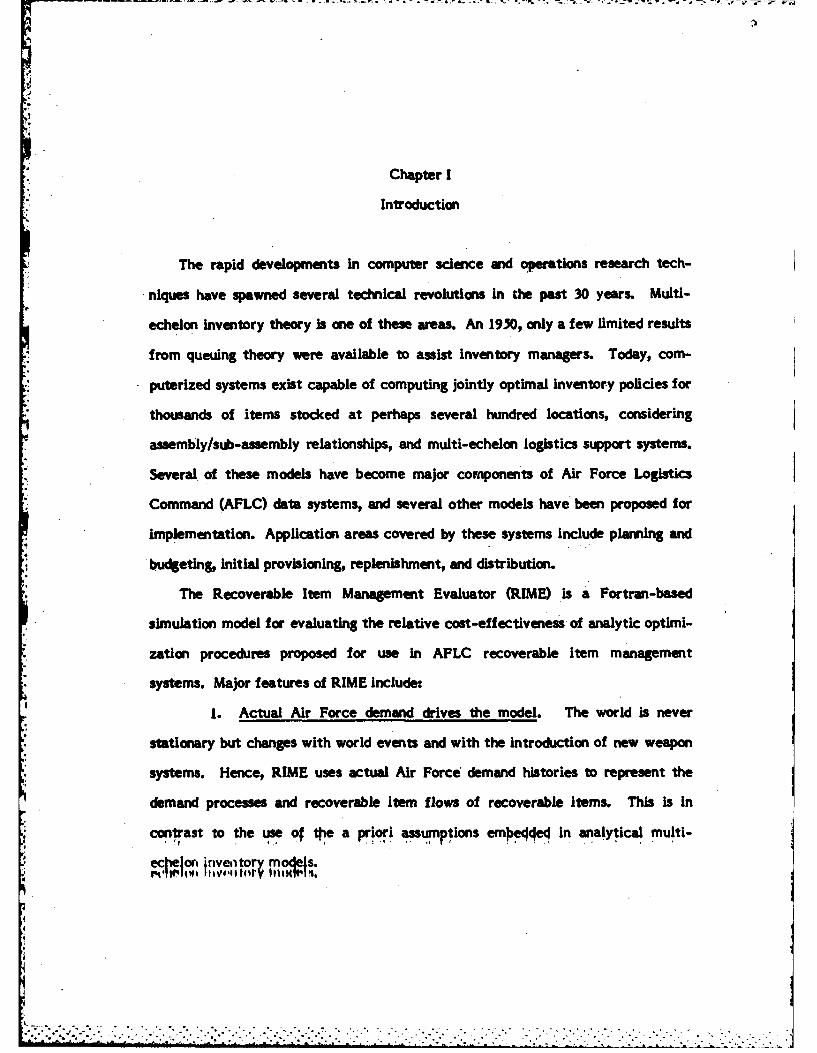
1. Actual Air Force demand drives the model. The world is never
stationary but changes with world events and with the introduction of new weapon
systems. Hence, RIME uses actual Air Force demand histories to represent the
demand processes and recoverable item flows of recoverable Items. This is in
contrast to the use of the a priori assumptions emoecjj In analytical multi-
ecelon inveitory models.
,- . .... . . . . . .
4, .-....... ,..,..........,,,,........ ............. ... ......... . . ..-= , ,.,.", : , - .';, , " .- *. k - . .. . = - " _- , . ._. , ' " ". .. " ". " - . -,. .: - '
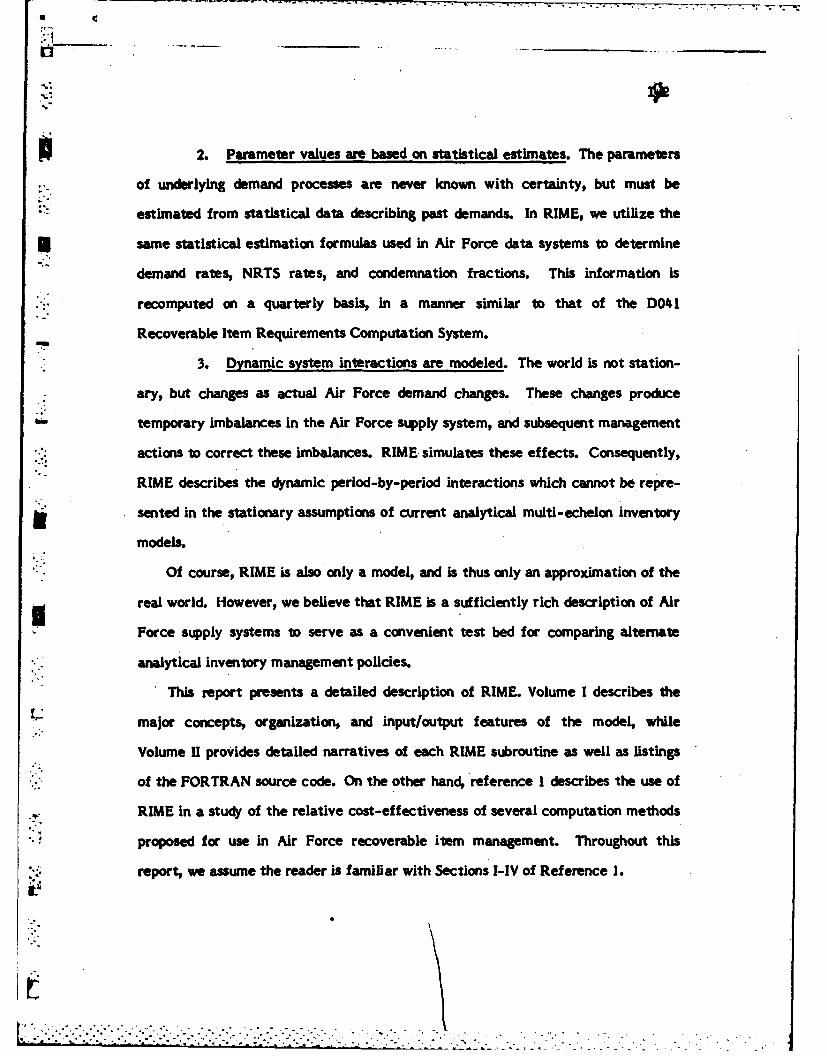
2. Parameter values are based on statistical estimates. The parameters
of underlying demand processes are never known with certainty, but must be
estimated from statistical data describing past demands. In RIME, we utilize the
U same statistical estimation formulas used in Air Force data systems to determine
demand rates, NRTS rates, and condemnation fractions. This information is
recomputed on a quarterly basis, in a manner similar to that of the D041I
-Recoverable Item Requirements Computation System.
3. Dynamic system interactions are modeled. The world is not station-
ary, but changes as actual Air Force demand changes. These changes produce
temporary imbalances in the Air Force supply system, and subsequent management
actions to correct these imbalances. RIME. simulates these effects. Consequently,
RIME describes the dynamic period-by-period interactions which cannot be repre-
sented in the stationary assumptions of current analytical multi-echelon inventory
models.
Of course, RIME is also only a model, and is thus only an approximation of the
real world. However, we believe that RIME is a sufficiently rich description of Air
Force supply systems to serve as a convenient test bed for comparing alternate
analytical inventory management policies.
This report presents a detailed description of RIME. Volume I describes the
major concepts, organization, and input/output features of the model, while
Volume U provides detailed narratives of each RIME subroutine as well as listings
* of the FORTRAN source code. On the other hand, reference I describes the use of
RIME in a study of the relative cost-effectiveness of several computation methods
proposed for use in Air Force recoverable Item management. Throughout this
report, we assume the reader is familiar with Sections I-IV of Reference 1.

An Overview of the Recoverable Item Management Evauator System
The major components of the Recoverable Item Management Evaluation
System are shown In Figure I-1. At the heart of the system is the RIME Simulator.
The Simulator simulates a multiple echelon recoverable item inventory system, and
provides the means for estimating the procurement dollars and supply support
measures associated with given sets of inventory management levels.
Figure 1-1 illustrates the major components in the RIME system. As shown in
the figure, the RIME System has four major components. The Data Extract System
is toed to obtain LRU/SRU data f rom the D041 Data Bank, and to manipulate tis
inoormation into the form required for Input to the RIME System. We call this data
file the "Matter Data Set. The Exogenow Event Generator translates the
aggregate istiodcal demands obtained from the Master Data Set into a detailed
List describing LRU and SW reparable generations and associated requisition,
repair, and NRTS activilles by bae. These detailed lists are recorded on the
Exogenous Event File, and represents a major input to the RIME Simulation Model.
The Stock Level Computation system also uses the Master Data Set as input.
ThUs system computes inventory levels for each time period In the simulation
horizon for each Item In the Master Data Set. By varying the input parameters,
the system can compute stock levels uing the METRIC, MOD-METRIC, Variable
Sadety Level (VSL), or AFLCR 37-27 computational methodologies, as well as
several variations of these methods. As shown in the figure, different computa-
tional methods may be used In Initial provisioning calculations from those used
during the replenishment owae of an Item's life cycle. The individual Item stock
levels computed by this system are stored In a "Levels" File. This File'provides the
second major Input to the RIME Simulation Model.
.,
-

D041 Data$asek Data~
~i a~ser .sa,
EXOGENO)US EVENT GENERATOR SOKLVLC)PTTO
Data 1prepag-atiL0
System.
Replenishmenton
gSM I .geomveable
SIMULATOR alto
Figure Ii
Mijor Components In SUN System.
'.1-
The heart of the RIME system is, of course, the simulation model itself. This
model inputs the detailed list of historical reparable generations and assodated
exogenous events, as well as sets of levels computed by the Stock Levels Computa-
tion system. It then uses simulation techniques to evaluate how well the given
stock levels would have performed in managing the events described in the Event
File.
Outputs from the simulation model indude. (a) detailed statistics of
inventory/repair activities by location, item type, and time period, (b) a short-form
report which displays totals of six major statistics summed over all simulated
periods, (c) results for each replication for each LRU/SRU group, and (d) printouts
to assist in the debugging of extensions to the RIME model.
Chapters I through IV of Reference I provide a general overview of the RIME
model, and we assume that the reader is f amiliar with this material. In this report,
we provide detailed description of each of the components of the RIME system. In
Chapter II, we review the major concepts employed in the RIME Simulation Model.
This Chapter describes the numbering systems used to keep track of inventories at
different stocking locations, methods of describing the passage of times within the
uimqlated modeli the spedflc events simulated by the RIME system, and a
description of the detailed statistics collected by the Simulation Model. Chapter
,o i provides a detailed description of the Events Generator. This Chapter describes
methods for generating exogenous events and the computer programs used to
Impiement the event generation activities. Chapter IV describes the Levels
Computatln System. This Chapter describes the network of computer prorarns
SInvolved In simulating specific combinations of Initial provisioning and replenish-
mont calculation methods. Finally, Chapter V provides Instructions for individuals
L 7

14
interested In utilizing the current RIME version. Tlis chapter describes the steps
invalved in simulating specific inventory management policie, and also describes
* Output reports produced by the RIME Skmulotion Model.
Chapter II
Major Model Concepts
To understand the detailed program structure of RIME, one must possess a
clear understanding of (a) the numbering system used to keep track of the stock
status of each simulated LRU and SRU at each at the possible stocking locations,
(b) the methods used to simulate the passage of time, (c) the events that simulate
significant inventory system transactions, and (d) the data files that record current
system status and that measure simulated performance. These major elements are
the subject of this chapter.
Stock Keeping Unit Conventions
In RIME, each LRU and SRU may be stocked at possibly several stocking
locations. As discussed in Chapter 1, the RIME model represents several types of
stocking locations, including a depot level maintenance facility, several operating
bases, and an aircraft overhaul facility. In simulating these systems, it is
necessary to keep track of the on-hand and on order stock for each stock number
at each of the possible locations. We use the term Stock Keeping Unit (SKU) to
refer to the specific number assigned to a given stock number-geographic location
pair.
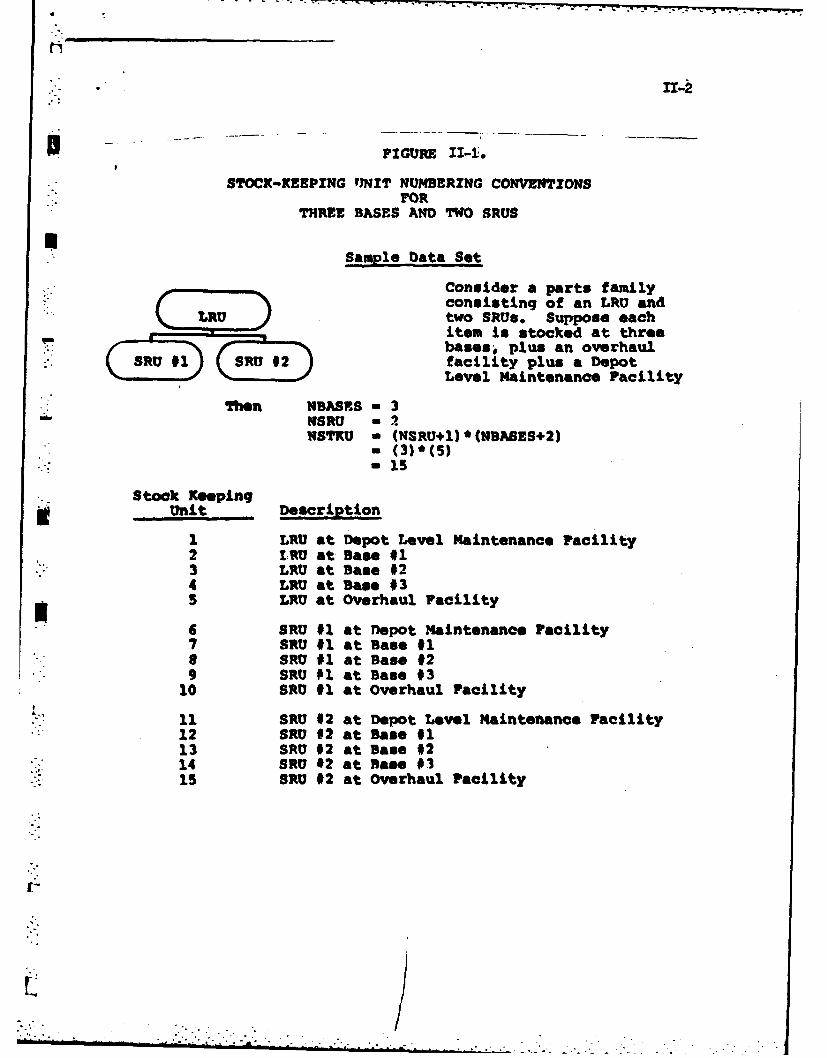
7Figure i-1 illustrates the assignment of Stock Keeping Unit Numbers for an
LRU/SRU family consisting of an LRU and two SRUs that are stocked at three
operating bases. As shown in the figure, inventories of the LRU at the Depot Level
Maintenance Facility are always assigned a Stock Keeping Unit number of 1. Stock
. m4
U -FIGURE II-l.
SFoc/CIEEPING f1INT NUMBERING CONVENTIONSFOR
THREE BASES AND TWO SRUSU
Sample Data Set
Consider a parts familyconsisting of an LRU andtwo SRUs. Suppose eachitem is stocked at threebases, plus an overhaul
SR U #12 facility plus a DepotLevel Maintenance Facility
Then NBASES - 3NSRU -2NSTRU - (NSRU+1)*(NBAES+2)
- (3)*(5)-15
Stock KeepingUnit Description
1 LRU at Depot Level Maintenance Facility2 I*RU at Base #13 LRU at Base #24 LRU at Rase 035 LRU at Overhaul Facility
6 SRU #1 at Depot Maintenance Facility7 SRU #1 at Base #18 SRU #1 at Base #29 SRU 1 at Base #3
10 SRU #1 at Overhaul Facility
11 SRU 42 at Depot Level Maintenance Facility12 SRU #2 at Base #113 SRU 02 at Base #214 SRO 42 at Base #315 SRU #2 at Overhaul Facility
I°

II-3
Keeping Unit numbers o 2,3, &d 4 are assigned to inventories of the LRU at base
locations 1, 2, and 3 respectively. Finally, an SKU of 5 is assigned to Inventories of
* the LRU at ttoh Aircraft Overhaul Facility.
Stock Keeping Unit numbers for the SRUs follow a similar pattern. Conse-
*quently, an SKU of 6 represents Inventories of SRU #1 at the Depot Maintenance
* Facility, while the SKUs of 7, 8, and 9 represents inventories of this SRU at Bases
* 1, 2, and 3, respectively. Finally, an SKU of 10 is assigned to inventories of SRU
#1 at the Aircraft Overhaul Facility. As shown In Figure II-1, a similar pattern is
used In assigning Stock Keeping Unit numbers to the inventories for SRU #2.
In RIME, the variable NSRU denotes the number of SRUs that are components
of the LRU, and the variable NBASES denotes the total number of base locations.
Hence, counting the LRU there are (NSRU+I) distinct stock numbers simulated in
RIME, and each of these may be stocked at any of the NBASES bases in addition to
being stocked at the depot and the overhaul facility. Hence, the total number of
stock keeping units needed to keep track of inventories by location is (NSRU + I)*
(NBASES +2).
The Timing Mechanism
The fundamental modeling concept employed in RIME Is that of an "event."
An event is a specific point in time In which the state or condition of the system
changes or potentially changes. For example, the amount of stock on hand changes
If a requisition is received and goods are shipped to fill the demand. Hence,rreceipt of a customer requisition Is an event. Other events that may change the
amount of on hand stock Indude delivery of a replenishunent order by a vendor of
the supply system and the return of serviceable assets from a customer.
I.' ' '''-': '' '2' '* ''"'''* ' -'''': '". '. ''' " "' '': .. " " • " " " " ' - . .. " '

4 -,
hIIa4
0 In simulating any system, two distinct categories of events may be identified.
Exeenous events are events that are "caused by" activities that are external to
*. the system; they are the stimuli that cause the system that react in some manner.
On the other hand, endogenous events are caused by the reaction of the simulated
P system to either exogenous events or other endogenous events. For example, in
RIME reparable generations of LRUs and SRUs and associated demands for
serviceable replacements are treated as exogenous events -- events that drive the
entire simulated repair/resupply system. The shipment of goods and the placement
of replenisiment orders are examples of endogeuous events. They are "caused by"
the LRU and SRU demands which deplete on hand stocks.
In RIME, a number of events are treated as exogenous events; these are:
1. LRU and SRU reparable generations, and associated condemnation,
serviceable return, repair, and NRTS actions whose timing may be
determined from the timing of the reparable generation event.
2. The computation of initial provisioning stock levels.
3. The calculation of replenishnent stock levels.
Because of the large volume of data involved in simulating an LRU and all of
its SRUs simultaneously, all exogenous events for a given LRU/SRU family are
generated as a preprocessing step and recorded on magnetic tape. This list of
* - /events Is called the "Exogenous Event File (EEFIP. Events recorded on this file are
-Isorted in time sequence. Consequently, the time interrelationships of exogenous
events may be determined by sequenially reading the EEF. On the other hand, the
time interrelationships of Exogenous Events are maintained through the use of a
Future Events List (FEL) that is updated dynamically as part of the RIME
simulation process. We will discuss each of these files and illustrate their use later
in this chapter.
L .. .. - .. S -.. - .- . .. . . .
11-5
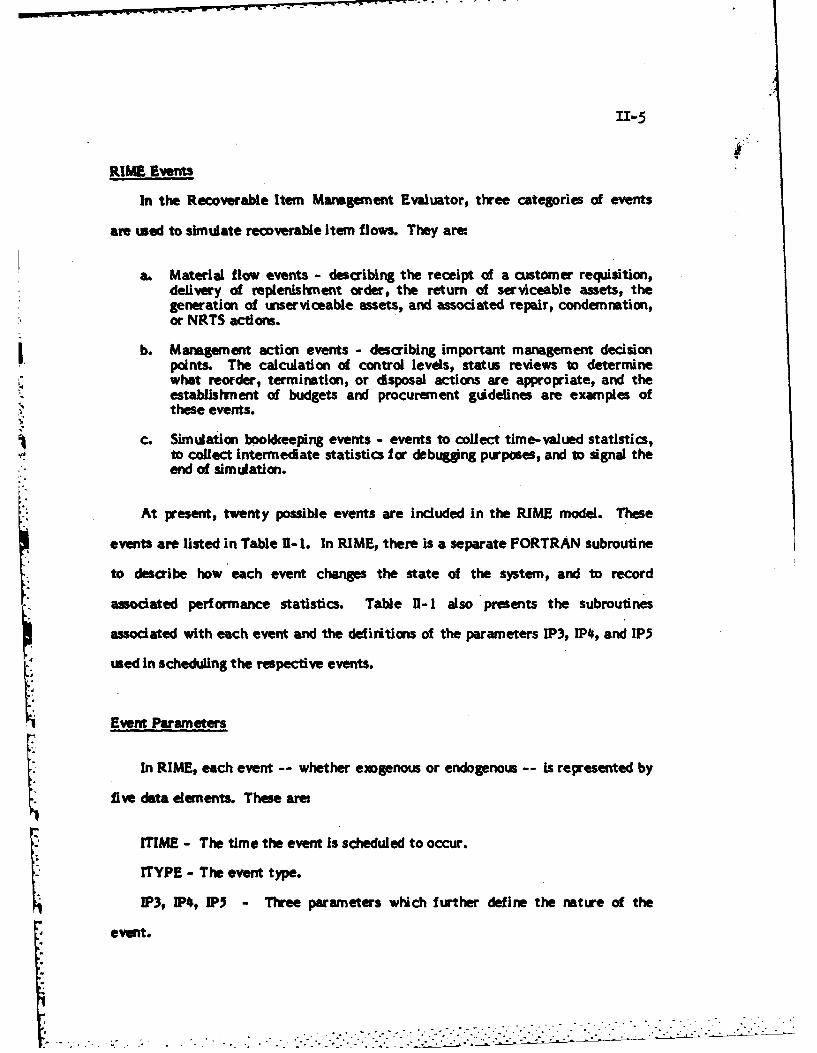
RIME Events
In the Recoverable Item Management Evaluator, three categories of events
are used to simulate recoverable Item flows. They are
a. Material flow events - describing the receipt of a customer requisition,delivery of replenislient order, the return of serviceable assets, thegeneration of unserviceable assets, and associated repair, condemnation,or NRTS actions.
b. Management action events - describing important management decisionpoints. The calculation of control levels, status reviews to determinewhat reorder, termination, or disposal actions are appropriate, and theestablishment of budgets and procurement guldelines are examples ofthese events.
c. Simulation bookkeeping events - events to collect time-valued statistics,to collect Intermediate statistics for debugiing purposes, and to signal theend of simulation.
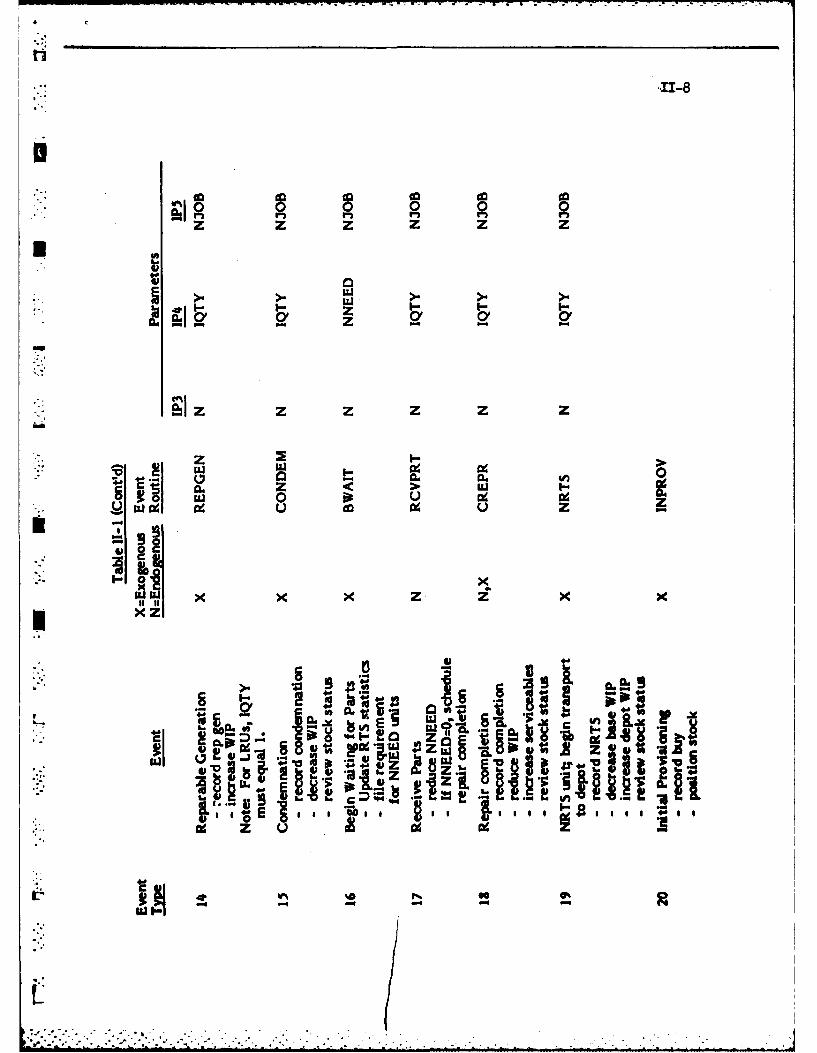
At present, twenty possible events are included in the RIME model. These
events are listed in Table U- 1. In RIME, there is a separate FORTRAN subroutine
to describe how each event changes the state of the system, and to record
associated performance statistics. Table II- 1 also presents the subroutines
associated with each event and the defiritions of the parameters IP3, IP4, and IP5
used in scheduling the respective events.
Event Parameters
In RIME, each event -- whether enogenous or endogenou -- is represented by
five data elements. These are:
ITIME - The time the event Is scheduled to occur.
ITYPE - The event type.
IP3, IP lP3 - Three parameters which further define the nature of the
event.
-""..-.. . . . . . . . .... . .. .... ". . "".".".'".".."- . . . . ...._- -- :"'° -.. .

11-6
ad z
Izz z z z
LZJ L U uj U I.
N~~ x4 x( Z XX x x x Z Z ZZ
.r.
L. S
.... ....

i o
~. 2.kb
'V E
'V
lop .CP
v9*
fbc
0 0
zz z z z z
.9uIL~
~I zz z z z
0L 0 t04dC
ed ocu c
*x z
*g log z S 1 .l0 E0 * . 04 0 .sLI
V -0 4-0 zZJ ul
0E I I I t. I ~ 1l 8 ,, m 1a
Cd z uz
vs so 0iut - 4 4-4-
11-9
E'
on
e 02

n-10Fl
'I-.jO
U As shown in Table I-I, event type I represents the receipt of a requisition from a
customer of the supply organization. This event may be either exogenous X) or
endogenous (N), depending upon the origin of the requisition request. In simulating
type I events, subroutine REQ is used. Further, the three parameters associated
with a type I (requisition) event are defined as follows:
• IP3 = The Stock Keeping Unit Nunber N associated with the inventory item
being requisitioned.
IP4 = The nunber of units (IQTY) being requisitioned.
IP5 = The priority of the requisition. Definitions of the other event types
and the associated FORTRAN routines may be seen by further inspection
of Table I- 1.
* Timinx Conventions and Initial Events
To simplify programming and analysis tasks, it was desirable to establish
timing conventions that differ slightly from values associated with the Gregorian
calendar. Specifically, RIME assmnes that each day consists of 100 Time Units
(TU). Days, weeks, months, and years are then assuned to be related as shown in
Table II-2. Since the values are used repeatedly throughout a simulation run,
specific COMMON variables are established for each of these time units. Values of
these variables are initialized by subroutine INITAL at the beginning of each RIME
simulation run. Other timing variables that are initalized by subroutine INITAL are
shown in Table 11-3.
All RIME events may be dassified as either (a) scheduled events, (b) random
events, or (c) dependent events. Scheduled events are events with a specific
I% ;

n-il
TABLE 11-2
Time Conventions
Time Basic Time in
Intervals Value TU's Variable
I 1Day 100 TU's = ITDAY
I Week 7 Days 700 TIPs : ITWEEK
I Month 4 Weeks 2,800 TU's : ITMNTH
1 Quarter 3 Months 8,400 TU's : ITQTR
I Year 4 Quarters 33,600 TU's = ITYEAR
NOTES
It is assumed that I Day 1 100 Time Units (TU's), and each Time Variable isexpressed in TU's.
, _~. . . . . . . . . . . . . .-, . . . .. . . . . . . . . . ;. .. - . •. . . .

F 11-12
TABLE I-3
Timing Vriables Established in INITAL
Variable Definition
IQTRND clock time that marks end of current quarter
ITINV number of current quarter
ITIME current simulation clock time (100 Time Units = I day).• At the begnning of a simulation run, ITIME = 0.
ITLEVL clock time of the next computation of stock levels
IDLEVL time interval between stock level computation
ITDIV* clock time of the next division level review1- IDDIV* time interval between division level reviews
ITFOR* time of the next update of demand history records (Event
type 9)
IDFOR* time between history file updates
ITHQ* time of next Headquarters USAF stock fund budget review
IDTHQ* time-between Headquarters USAF budget reviews.
ISTOP clock time that simulation is to be stopped
ISTAT clock time for activating statistics collection routines
IDSTAT time interval between statistics collection
' INQTR number of quarters to be simulated
NOTES
*These variables are not used in the current verision of RIME. However, thesevariable: names are reserved for future extensions of the model.
.K
.... . . . ...
11-13
schedule of occurrence times. For example, initial provisioning calculations (event
type 20) occur at the beginning of each simulation run, and leveling events (event
type 6) occur at the end of every quarter. On the other hand, reparable
generations (event type 14) and serviceable returns (event type 4) are random
events--the time of occurrence of these events is not known in advance. Finally,
* the delivery of a replenishment order (event type 2) is a dependent event since the
time of delivery is dependent upon earlier management reordering decisions.
Dependent events are caused by the occurrence of an associated random or
scheduled event. Hence, requisitions for serviceable assets (event type i) to
replace flight line reparable generations are dependent events, since the requisition
for a serviceable unit was caused by the flight line failure.
In RIME, the first occurrence of each scheduled event is created by subroutine
INITAL; that is, INITAL puts an entry on the Future Events List for each scheduled
event at the beginning of a simulation run. Subsequent scheduled events are put on
the Future Events List each time a new scheduled event occurs. For example, at
the condusion of a Leveling event (event type 6), a subsequent type 6 event is
scheduled to occur one quarter in the iture.
Specific values for the time between scheduled events are set in subroutine
INITAL. Table U-3 defines specific time variables initialized in this routine.
The Future Events List
The sequencing of endogenous events through time is controlled by a Future
Events List (FEL). The FEL is a list of all endogenous events scheduled to occur at
some future (simulated) time. For each event on the list, the following values are
recorded.
ITIME = The time the event is scheduled to occur.
11-14
ITYPE The event type (code).
IP3, IP4, IP5 = Event parameters.
Structurally, the FEL is a linked list in ascending order by scheduled event
A time. In such a list, new entries to the list are inserted in a previously unused data
storage location, and pointers are used to indicate the correct sequencing of the
entry in the list. The major variables associated with this list are shown in Table
-. II-4.
At the beginnning of each simulation run, subroutine INFEL is called to
initialize the pointers and other control variables associated with the FEL.Scheduled events are then entered and removed from the Future Events List by
subroutine ENTER and REMOVE, respectively. New events are inserted into the
FEL by the fallowing CALL statement:
CALL ENTER (ITIME, ITYPE, IP3, IP4, P3)
where ITIME, ITYPE, IP3, IP4, IP5, are as defined above. When subroutine ENTER
is called, the new event data is recorded, and the list pointers are updated to Insert
the new event in the proper time sequence.
Events are removed from the Futtre Events List by subroutine REMOVE; the
CALL statement takes the form
CALL REMOVE (ITIME, ITYPE, IP3, IP4, IP3)
and the calling parameters are as defined above. Subroutine REMOVE removes the
first entry from the FEL and updates the pointers accordngly; that is, it deletes
the list entry with the smallest (earliest) scheduled dock time from the FEL, and
returm the corresponding data values through the parameter list.
U.
::,,Id,h.
p

TABLE 11-&
Future Events List Variables
NFEMAX umaximum numnber of entries on Future Events List
NENTRY =number of entries on the Future Events list
ILOCFE(3 = number of Jth unwsed data location in the Future Eventsfile
K = list index
MTME(K = clock time of event transaction
JTYPE(K) Uevent type
3POINT(K) = pointer to next transaction In list
3FSN(K) = stock number identif ication*
JQTY(K) = quantity Involved*
JPRIOR.() =pdiorlty,* where
3PRIOR = h priority3PRIOR2-lowpriority
NFIRST = location of f irst transaction of chain
NTIME = time of earliest transaction on list
NLOC = location of last transaction placed on the chan
**if applicable
n1-16
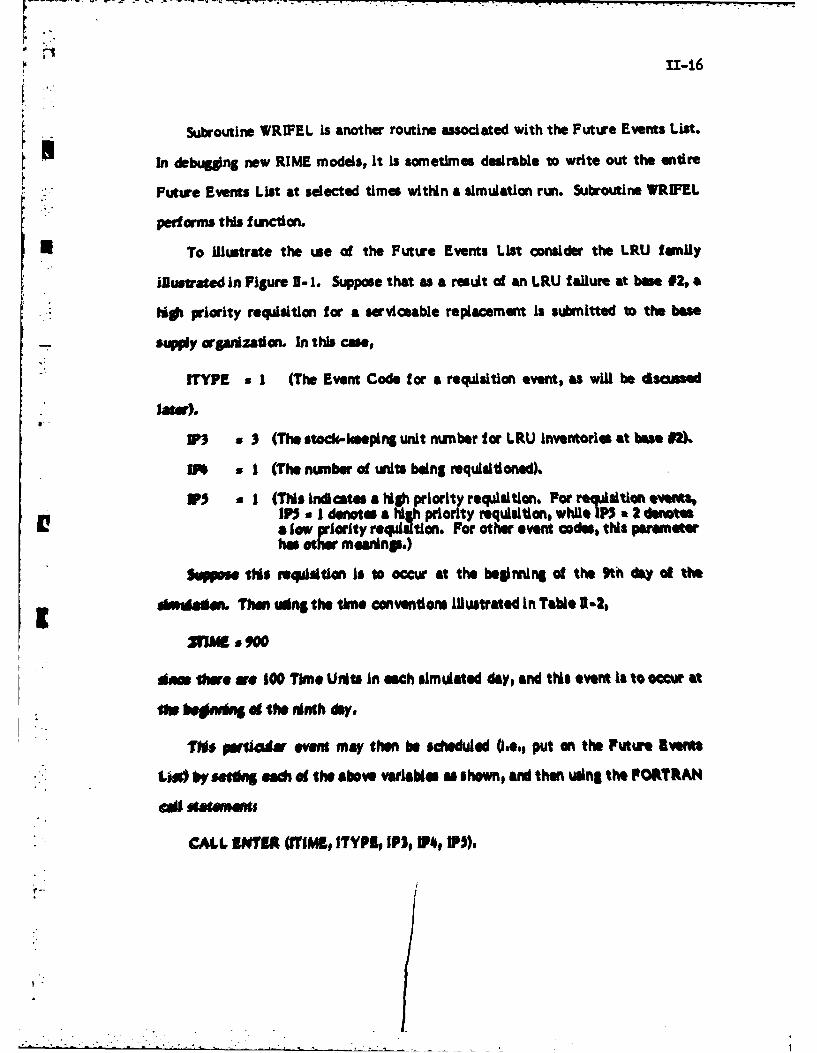
Subroutine WRIFEL Is another routine associated with the Future Events List.
In debuggng new RIME models, it is sometimes desirable to write out the entire
Future Events List at selected times within a simulation run. Subroutine WRIFEL
performs this function.
To ilustrate the we of the Future Events List consider the LRU fmUily
illustrated In Figure 1-1. Suppose that as a result of an LRU failure at bae #2, a
igh priority requisition for a serviceable replacement Is submitted to the base
supply organization. In this case,
ITYPE z I (The Event Code for a requisition event, as will be discused
lawe).
W3 z3 (The stock-keeping unit number for LRU Inventories at base
014 z I (The number of units being requisitioned).
s I (This indicates a high priority requisition. For requisition evw&%IP5 z I denotes a high priority requisition, while IP a 2 denotea low iority requdsition. For other event codes, this paremeterha other mennsp.)
Suppoe this mqusitlon Is to occur at the beginning of the 9th day d the
Awdai'. Then win S the time conventions Illustrated In Table 3.2,
MW, a 900
dm Oe re 100 Time Units in each sieldated day, and this event is to oem at
t w boon" g the ninth day.
This plWar event may then be sheduled .e., put on the Puture ivents
LW) by st each of the above variables as shown, and then using the FORTRAN
CALL MARs (fITIMI, ITYPS, IFS, IP40 IPj).
When the simulated dock time eventually reaches 900 time units. the absv
* ~event date would be removed from the FEL and an appropriate "Wwroeag w"i be
aled to simulate the actionse which result from receipt at this reqdmn
Marowine EVNTht The Zvent ScheMie
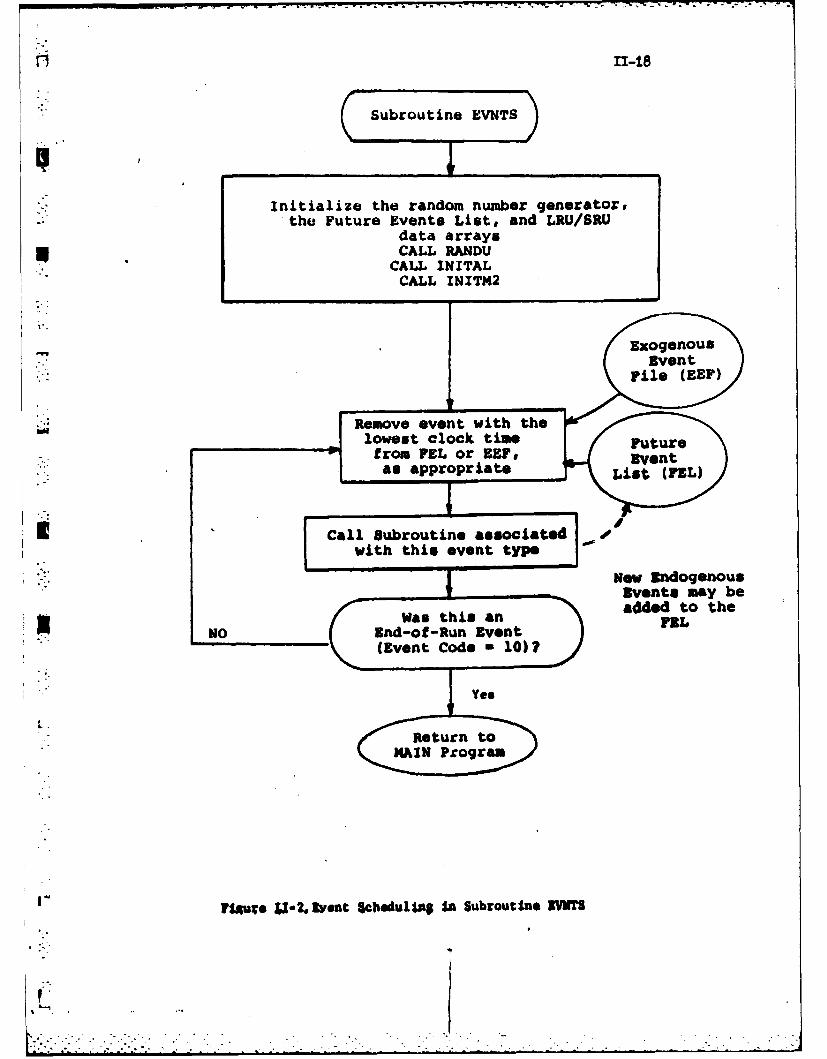
The scheduling of specific exgenous and endoganows events Is onvtolled by
Subroutine EVNTS. The general logic of this routine are illustrated In pmg 3-2.
As shown In the figure, subroutine BYNTS first initializes the pseudo-rand..
* number generator and the Future Events List, arid then reads In dat dscuibing the
* LRUISRU family currently being simulated. Tis Is done by calls to sabrgnm
RANDU, INITAL and INITM21 respectively. The routine then Inspects the ms
Imminent events (that is, the events with the lowest scheduld dock timne) on both
the Evogenaus Event File (BEP) and the Future Evoit List (FEL). It then remsoe
the event with the lowest scheduled dock time f rom the appropriate list and Cells
the subroutine asociated with that event. For example, If the event with the
lowest scheduled time Is a type I event, subroutine REQ Is called. The routines
associated with each event type are defined In Table 11-i1. These event routne
update the status of the system and work-in-process Inventories to reilect
occurrence of the event. In addition, the event routines update appropriate
performance statistics. Sarme of the events also cause additional endogenows
events to be scheduled. If this occurs, subroutine ENTER Is called to place the
nowiy-created event an the FEL. For examiple, when a stock level computation
event (Event Type 6) occurs, subroutine LEVEL Is called to compute new stock
levels for each LRU and SRU at each stocking location. At the conclusion of its
calculators, subroutine LEVEL calls subroutine ENTER to schedule the next stock
level com pufibatlon event.
[1 1M-18
(.Subroutine EVNTS)
Initialize the random number generator#the Future Events List, and LRU/SRU
data arraysCALL RANDU
CALL INITALCALL INITM2
ewEogenousEventmyb
*~~emv eves thi h an the o hloes cnd oRu tie F re(rmTL rC EventCoe*1)
Rihthsent to p
MAoN Programo
Nou~ U-2ofRu Event TELw~ipi urutn VT
(Een Code =I0). .. . .Yes

11-19
When an End-of-Run Event (Event Code 10) is encountered, Subroutine EVNTS
returns to the MAIN program. Otherwise, the routine again scam both the
exogenous event file and the updated FEL, and Identifies the particular event with
* the lowest dock time. This event Is then removed from the appropriate list and
*' the proem continues until a End-of-Run Event is eventually encountered.
IN. ~ . . . . - . - - --- -2 -- -- - . .*

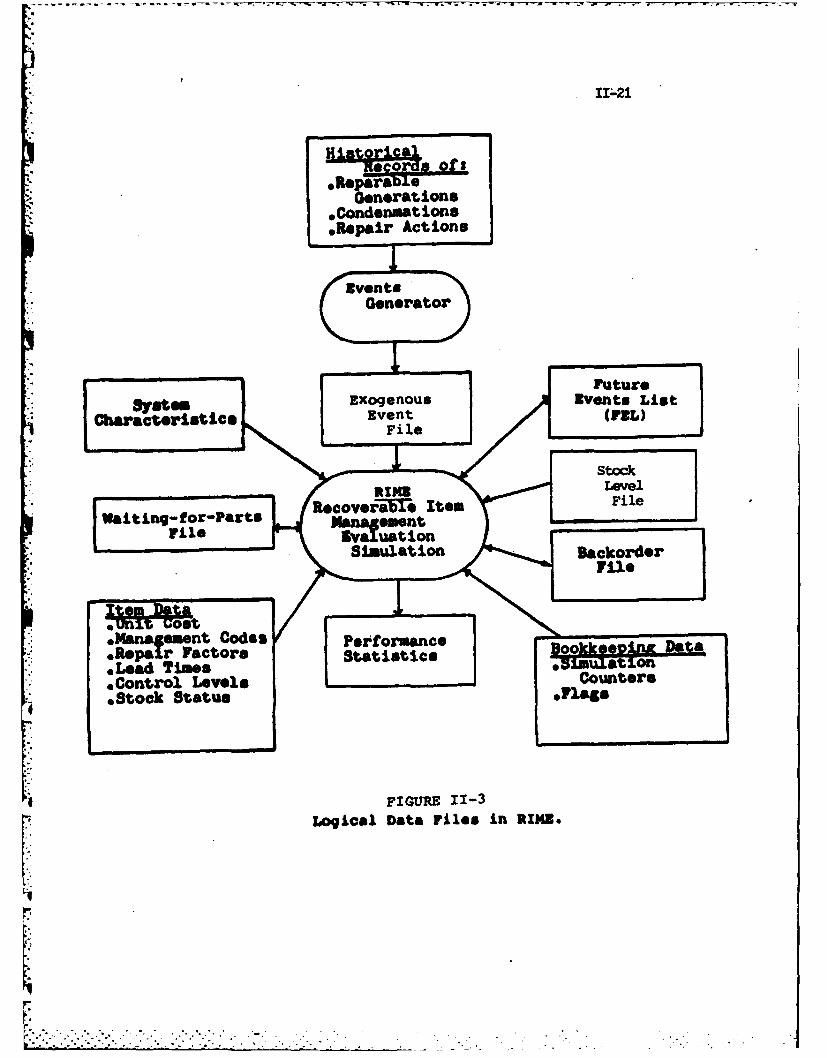
ri11-20
Data Files
A large number of data elements are required to operate any computer
simulation model, and RIME is no exception. The major categories of data
associated with RIME are illustrated in Figure 11-3. As shown in the Figure, RIME
data elements may be logically classified into one of the following files:U
1. Exogenous Event File (EEF).
2. Future Events List (FEL).
3. System Characteristics File.
4. Waiting-for-Parts File.
5. Item Data File.
-' 6. Stock Level File.
" 7. Backorder File.
8. Simulation Counters and Flags File.
9. Performance Statistics File.
The Exogenous Event File and Future Events List have been dscussed earlier.
Let us now consider the contents of each of the remaining data files.I
System Characteristics File
The Systems Characteristics File contain data elements that define the
system as a whole. The set of items to be included in a RIME simulation run, the
number of operating bases to be simulated, and the number of historical data
periods available are examples of data elements in this file. This information is
provided primarily through inputs of file 05. Table I-5 defines the major variables
contained in this logical data file. Specific data elements input through this file
will be dscussed in detail in Section VL
-
I.
- -- - - -- - - - - - r - - - - - - - - r r - - - -- ---.
Generations*Cond nMsati ns.Repair Act ions
zventsGenerator
Stock
*Repa-W FailePrfrane0
1o9ca Daaaitai 113
Un.T U *- -

11-22
TABLE il-5
P System Characteristics File
N30B Last assigned job number. N30B is initially set to 1001, and isincremented each time an exogenous event is created.
*NBASES Number of bases, not counting the depot or the overhaulf acility. Hence, the total number of stocking locations equalsNBASES+2.
NSRU Number of SRU's in the LRU
NITEM Number of stock keeping unit3, which equals (NBASES.2)*(NSRU+ I)
11-23
Work-In-Process File
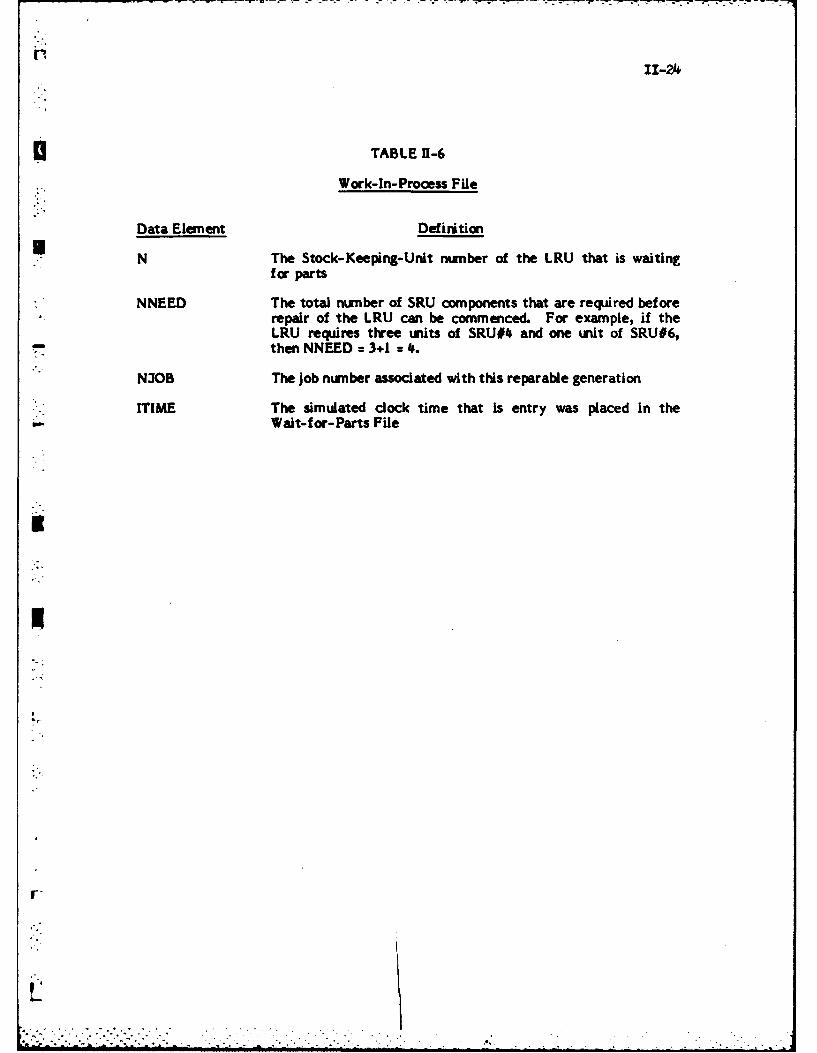
To repair an unserviceable LRU, it may be necessary to remove and replace
possibly several of the LRUs components. When this situation occurs, a "Wait-
for-Part' event (event type = 16) is scheduled, and an appropriate entry is made to
the Work-In-Process File. Table 1-6 illustrates the data elements contained in
this file.
The GASP Simulation routines FILEM and RMOVE are used to enter and
remove entries in the Work-In-Process File, and the Subroutine INGASP is used to
initialize the approprate GASP file variables. INGASP is called by Subroutine
INITAL at the beginning of each RIME simulation replication.
A detailed description of the GASP file system and its associated routines is
presented by A.A.B. Pritsker (The GASP IV Simulation Language, 3ohn Wiley and
Sons, New York, 1974), and will not be discussed further in this report.
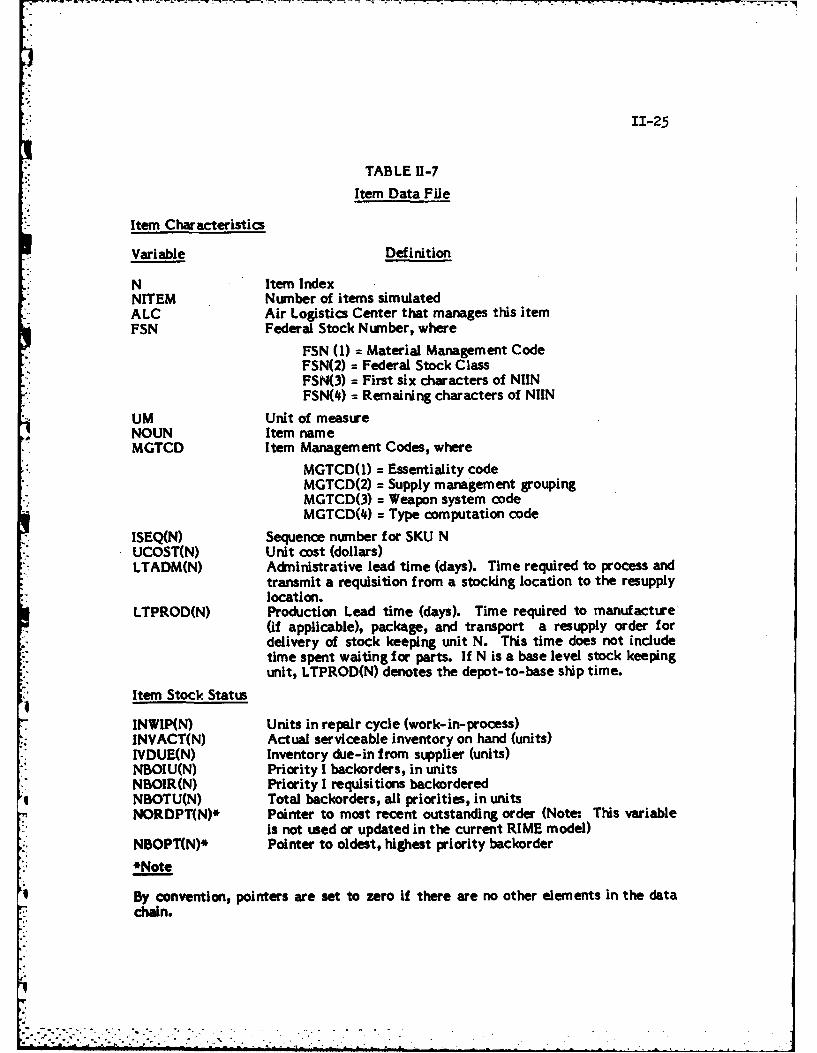
Item Data File
The item data file contains information specifically related to each item being
simulated. An item's unit cost, its current level of on-hand, on-order and
work-in-process stocks, and its control levels (eg., reorder level, support level,
termination level, or retention level) are examples of this type of data. Table 1-7
presents a detailed list of information items which are contained in this file. As
shown in Table 1-7, the item data file contains several subcategories of informa-
tion. These define (a) specific physical and management characteristics of the
item, (b) data describing the stock status of the item, (c) variables describing
repair and shipping times for the item, (d) variables describing the demand history
for the item, (e) forecast variables which quantify forecast usage rates and demand
variability and (f) control levels used in the management of the item's inventories.
:,..:.:.:.:.:,:.:.:::-:, . . .,...... . . .:. :.... . ... 2 .
11-24
fl TABLE U-6
Work-In-Process File
Data Element Definition
N The Stock-Keeping-Unit number of the LRU that is waitingfor parts
NNEED The total number of SRU components that are required beforerepair of the LRU can be commenced. For example, if theLRU requires three units of SRU#4 and one unit of SRU#6,
- then NNEED = 3+1 = 4.
N30B The job number associated with this reparable generation
ITIME The simulated clock time that is entry was placed in the-Wait-for- Parts File
r
I
L;
11-25
TABLE !1-7
Item Data File
Item Characteristics
Variable Definition
N Item IndexNITEM Number of items simulatedALC Air Logistics Center that manages this itemFSN Federal Stock Number, where
FSN (1) : Material Management CodeFSN(2) = Federal Stock ClassFSN(3) = First six characters of NIINFSN(4) = Remaining characters of NIIN
UM Unit of measureNOUN Item nameMGTCD Item Management Codes, where
MGTCD(I) = Essentiality codeMGTCD(2) = Supply management groupingMGTCD(3) = Weapon system codeMGTCD(4) = Type computation code
ISEQ(N) Sequence number for SKU NUCOST(N) Unit cost (dollars)LTADM(N) Administrative lead time (days). Time required to process and
transmit a requisition from a stocking location to the resupplylocation.
LTPROD(N) Production Lead time (days). Time required to manufacture(if applicable), package, and transport a resupply order fordelivery of stock keeping unit N. This time does not includetime spent waiting for parts. If N is a base level stock keepingunit, LTPROD(N) denotes the depot-to-base ship time.
Item Stock Status
INWIP(N) Units in repair cycle (work-in-process)INVACT(N) Actual serviceable inventory on hand (units)IVDUE(N) Inventory due-in from supplier (units)NBOIU(N) Priority I backorders, in unitsNBOIR(N) Priority I requisitions backorderedNBOTU(N) Total backorders, all priorities, in unitsNORDPT(N)* Pointer to most recent outstanding order (Note: This variable
is not used or updated in the current RIME model)NBOPT(N)* Pointer to oldest, highest priority backorder*Note
By convention, pointers are set to zero If there are no other elements in the datachain.
F'
11-26
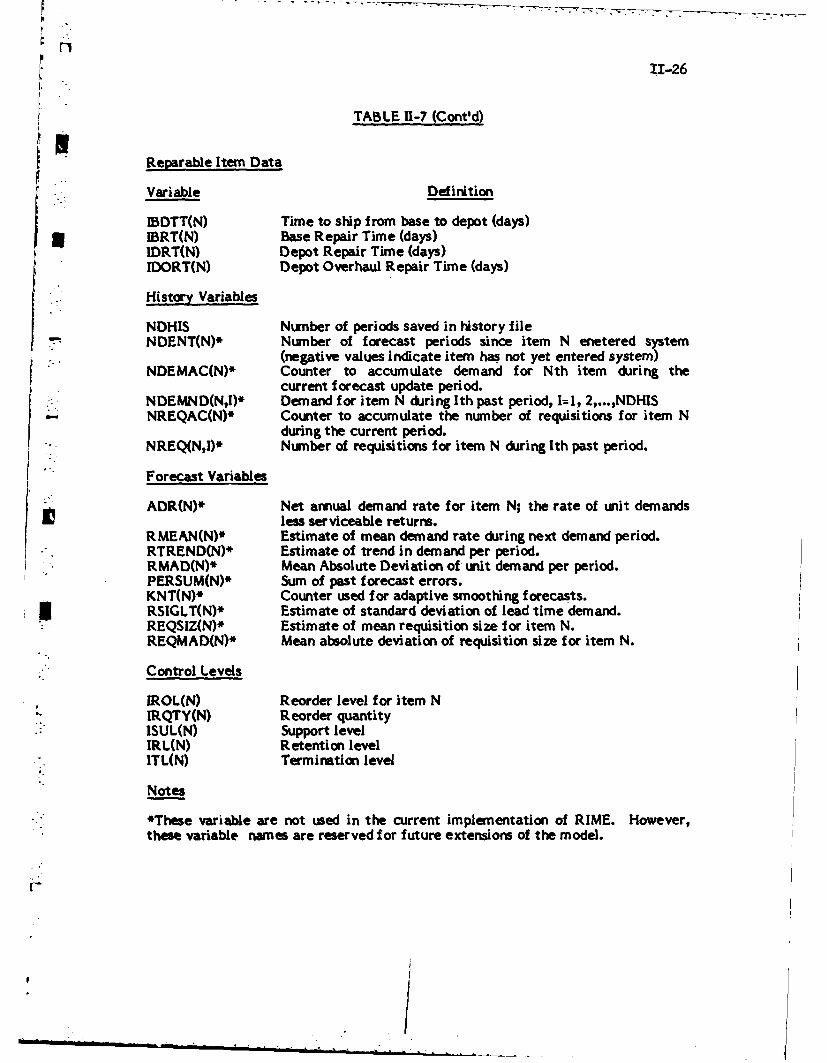
TABLE I-7 (Cont'd)
Reparable Item Data
Variable Definition
IBDTT(N) Time to ship from base to depot (days)IBRT(N) Base Repair Time (days)IDRT(N) Depot Repair Time (days)IDORT(N) Depot Overhaul Repair Time (days)
History Variables
NDHIS Number of periods saved in history fileNDENT(N)* Number of forecast periods since item N enetered system
(negative values indicate item has not yet entered system)NDEMAC(N)* Counter to accumulate demand for Nth item during the
current forecast update period.NDEMND(N,I)* Demand for item N during Ith past period, 1=1, 2,...,NDHISNREQAC(N)* Counter to accumulate the number of requisitions for item N
during the current period.NREQ(N,n* Number of requisitions for item N during Ith past period.
Forecast Variables
ADR(N)* Net annual demand rate for item N; the rate of unit demandsless serviceable returns.
RMEAN(N)* Estimate of mean demand rate during next demand period.RTREND(N)* Estimate of trend in demand per period.RMAD(N)* Mean Absolute Deviation of unit demand per period.PERSUM(N)* Sum of past forecast errors.KNT(N)* Counter used for adaptive smoothing forecasts.
* RSIGLT(N)* Estimate of standard deviation of lead time demand.REQSIZ(N)* Estimate of mean requisition size for item N.REQMAD(N)* Mean absolute deviation of requisition size for item N.
Control Levels
IROL(N) Reorder level for item NIRQTY(N) Reorder quantityISUL(N) Support levelIRL(N) Retention levelITL(N) Termination level
Notes
*These variable are not used in the current implementation of RIME. However,these variable names are reserved for future extensions of the model.
I I -- /n , l
11"28
In the current implementation of RIME, forecast and levels computation
events are treated as exogenous variables, and all forecasting and stock level
calculations are performed in the Levels Computation module as a preprocessing
step. Consequently, the History and Forecast Variables defined in Table U1-7 are
neither used nor updated in the current RIME model. However, these data names
are reserved f or f uture use in studies in which these activities are to be treated as
endogenous events.
Stock Level File
As noted in the previous paragraph, stock levels computations are performed
as a pre-processing step in the Levels Computation module. These pre-computed
levels are recorded in the Stock Levels File. When a Levels Computation Event
(Event Code 6) occurs in RIME, subroutine LEVEL reads the Stock Levels File to
determine the required stock levels for each Stock Keeping Unit. See Chapter TV,
"The Levels Computation System"', f or a discussion of the data elements in this
f ile.
Backorder Files
4 The backorder file records all outstanding backorders in the inventory system
at a given point in time. This file contains a record f or each requisition in a
backorder status. Specific data elements in this file are defined in Table 11-8.
Included in these data elements are the SKU ntrnber associated with the backorder,
the backorder quantity and priority, and the time the item was backordered. A
pointer system is used to relate entries in the backorder file with the specific
stock- keeping- units associated with that backorder. These pointer variables are
also defined in Table Il-S.
11-29
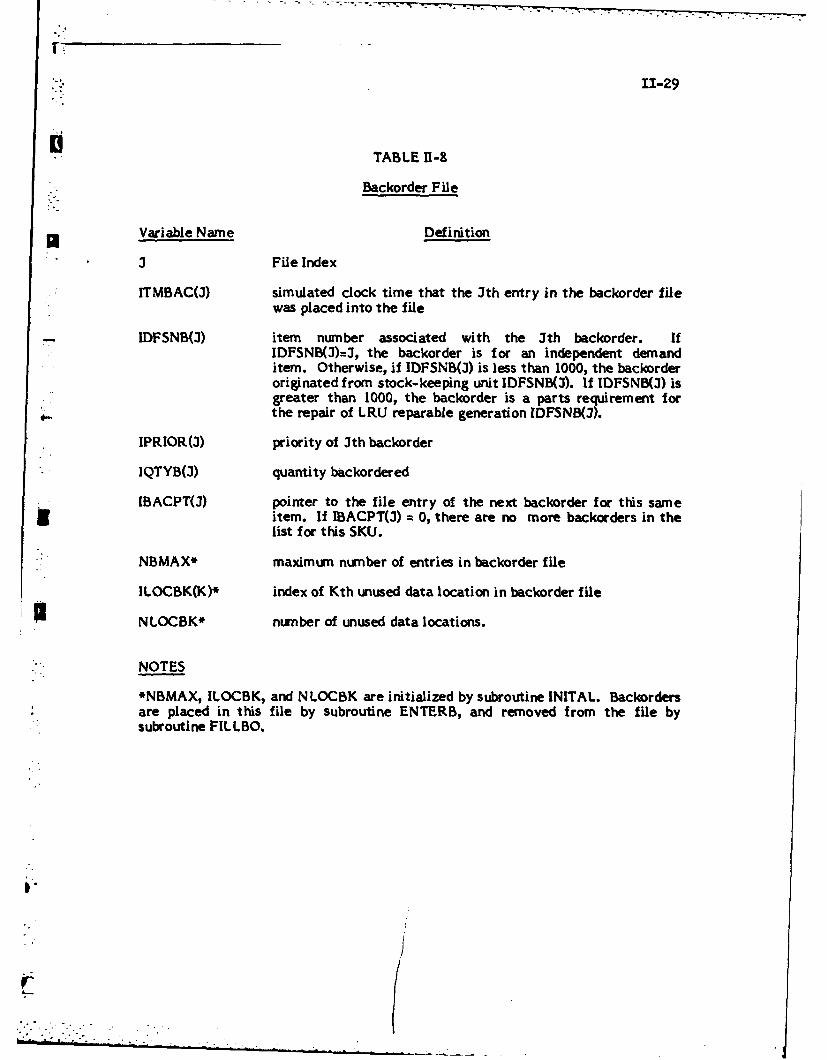
- TABLE il-S
Backorder File
Variable Name Definition
i File Index
ITMBAC() simulated clock time that the Jth entry in the backorder filewas placed into the file
IDFSNB(J) item number associated with the Jth backorder. IfIDFSNB(J)=3, the backorder is for an independent demanditem. Otherwise, if IDFSNB(J) is less than 1000, the backorderoriginated from stock-keeping unit IDFSNB(J). If IDFSNB(J) isgreater than 1000, the backorder is a parts requirement forthe repair of LRU reparable generation IDFSNB(3).
IPRIOR(J) priority of Jth backorder
IQTYB(J) quantity backordered
IBACPT(J) pointer to the file entry of the next backorder for this same1 item. If IBACPT(J) = 0, there are no more backorders in the
list for this SKU.
NBMAX* maximum number of entries in backorder file
ILOCBK(K)* index of Kth unused data location in backorder file
NLOCBK* number of unused data locations.
NOTES
*NBMAX, ILOCBK, and N LOCBK are initialized by subroutine INITAL. Backordersare placed in this file by subroutine ENTERB, and removed from the file bysubroutine FILLBO.
S"
II
11-30
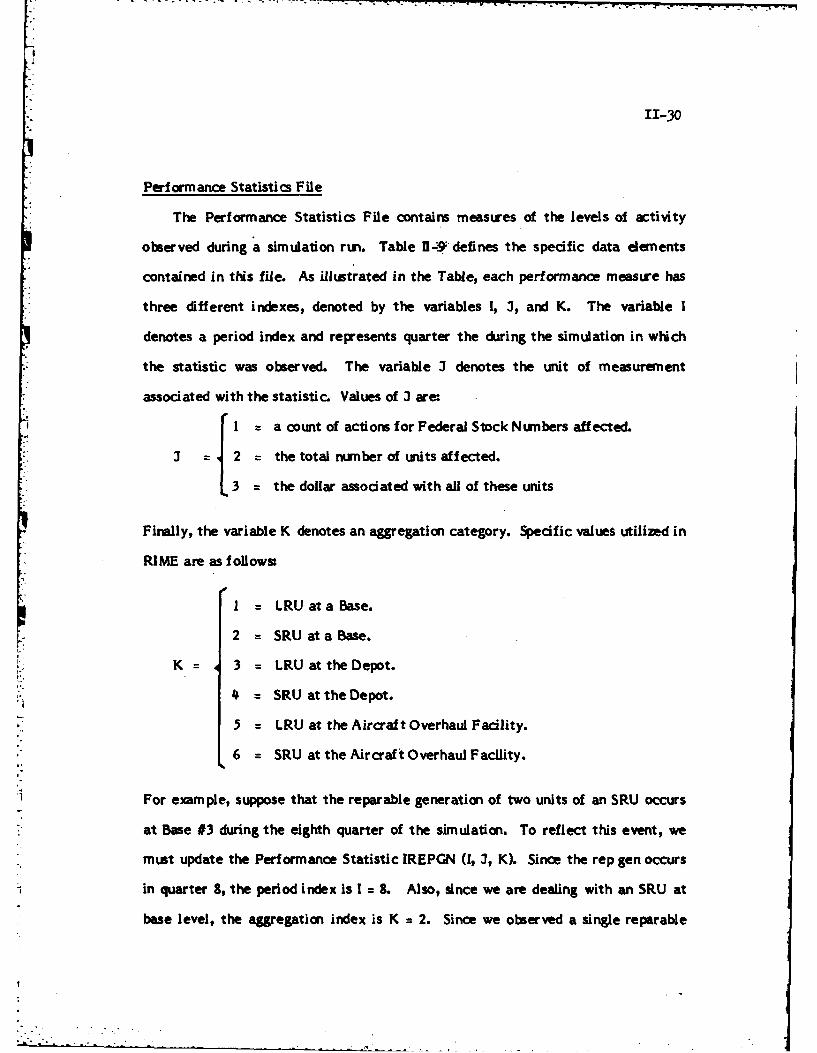
Performance Statistics File
The Performance Statistics File contains measures of the levels of activity
observed during a simulation run. Table 11,9 defines the specific data elements
contained in this file. As illustrated in the Table, each performance measure has
three different indexes, denoted by the variables 1, 3, and K. The variable I
denotes a period index and represents quarter the during the simulation in which
the statistic was observed. The variable 3 denotes the unit of measurement
associated with the statistic. Values of 3 are:
I a count of actions for Federal Stock Nunbers affected.
3 : 2 the total number of units affected.
3 =the dollar associated with all of these units
Finally, the variable K denotes an aggregation category. Specific values utilized in
RIME are as followu
S= LRU at a Base.
2 = SRUataBase.
I K = 3 = LRU at theDepot.!'.
4 = SRU at the Depot.
5 = LRU at the Aircraft Overhaul Facility.
6 = SRU at the Aircraft Overhaul Facility.
For example, suppose that the reparable generation of two units of an SRU occurs
at Base #3 during the eighth quarter of the simulation. To reflect this event, we
must update the Performance Statistic IREPGN (1, 3, K). Since the rep gen occurs
in quarter 8, the period index is I = 8. Also, since we are dealing with an SRU at
base level, the aggregation index is K = 2. Since we observed a single reparable

- 11-31
TABLE Ui-9
Perform ance Statistics File
Variable Definition
* I Period index, where 1= 1, 2, ... , 16
3 1=actions/FSNType of measure, where 3 f2 = units
13 = dollars
I = LRU at Base2 = SRU at Base
K Aggregation cateogry, where K: 3 = LRU at Depot4 = SRU at Depot
5= SRU at OverhaulFacility
6 =SRU at OverhaulFacility
I. INVOH (1, 3, K) inventory on hand at end of period
*-2. INVOR (1, 3, K) inventory on-order at end of period
3. IRECET (1, 3, K) receipts
4. IRETRN (1, 3, K) returns
5. INYDAY (1, 3, K) inventory- weeks
I6. JORDER (1, 3, K) orders placed
7. IDISPS (It 3, K)* disposals
8. ITERM (1, 3, K)* terminations completed
9. JEXPED (1, 3, K)* expediting actions
10. IRATON (1, 3, K)* rationing actions
11. IREQC (1, 3, K)* total requisitions cancelled
12. TP EQT (1, 3, K) total requisitions received f rom customers
13. IREQI (1, 3o K) priority I requisitions received f rom customers
14. IBACKT (1t 3, K) total backorders (end of period)
Note: *Thee variables are not used in the current version of RIME.
11-32
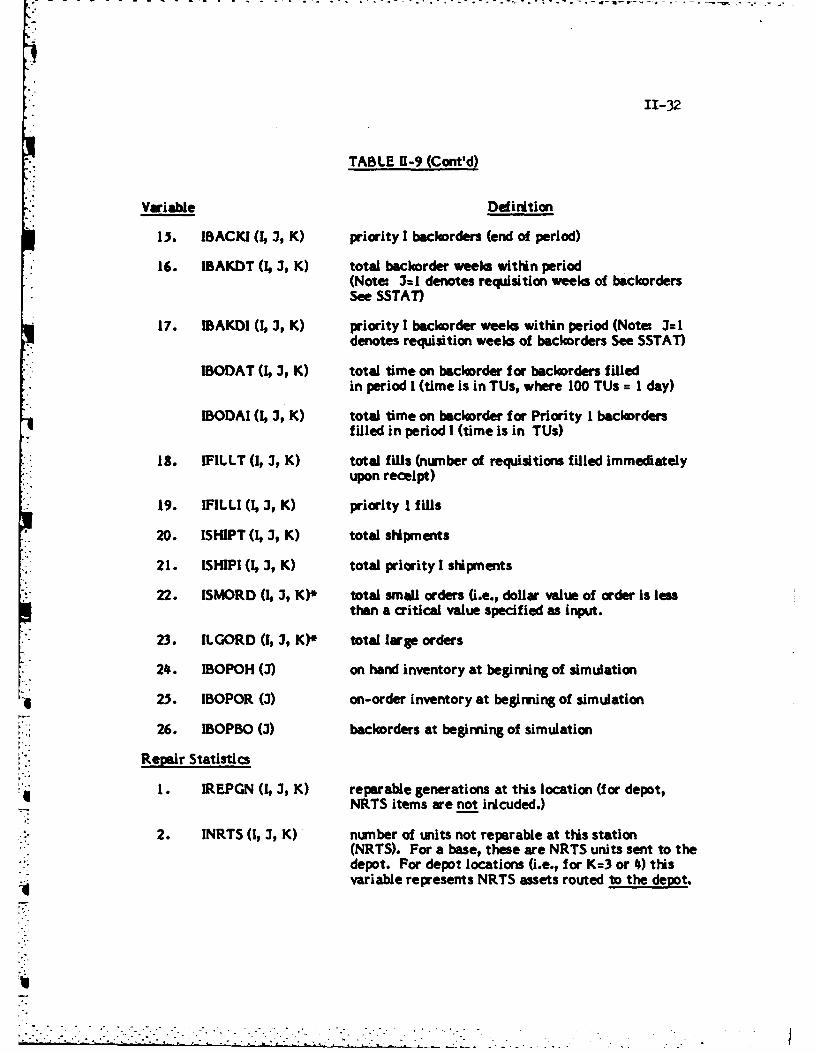
TABLE f1-9 (Cont'd)
Variable Definition
15. IBACKI (i 3, K) priority I backorders (end of period)
16. IBAKDT (it3, K) total backorder weeks within period(Note 3= 1 denotes requisition weeks of backordersSee SSTAT)
17. IBAKDI li 3, K) priority I backorder weeks within period (Note 3=1denotes requisition weeks of backorders See SSTAT)
IBODAT (it3, K) total time on backorder for backorders filledin period I (time is in TUs, where 100 TUs = I day)
IBODAI (1 3, K) total time on backorder for Priority I backordersfilled in period I (time is in TUs)
18. IFILLT (Iv 3, K) total fills (number of requisitions filled immediately
upon receipt)
19. IFILLI (it 3, K) priority I fills
20. ISHIPT (1, 3, K) total shipments
21. ISHIPI (i 3, K) total priority I shipments
22. ISMORD (4 3, K)* total small orders (i.e., dollar value of order is lessthan a critical value specified as input.
23. ILGORD (1 3, K)* total large orders
. 24. IBOPOH (3) on hand inventory at beginning of simulation
25. IBOPOR (3) on-order inventory at beginning of simulation
26. IBOPBO (3) backorders at beginning of simulation
Repair Statistics
S1. IREPGN (1, 3, K) reparable generations at this location (for depot,
NRTS items are not inicuded.)
2. INRTS (1 3, K) number of units not reparable at this station(NRTS). For a base, these are NRTS units sent to thedepot. For depot locations (i.e., for K=3 or 4) thisvariable represents NRTS assets routed to the depot.
. ..,

11-33
i] TABLE 11-9 (Cont'd)
Retalr Statistics
3. ICNDEM (I, 3, K) nunber of reparable generations condemned thisperiod. Note:. Number of NRTS items = IREPGN-IRTS-ICONDM
4. IRECPL (1, 3, K) numiber of repairs completed
' 3. IWIP (1, 3, K) Work in process at end of period
6. IWFP (I, 3, K) Time waiting for parts - (in TUs, 100 TUs =I day) (Computed by RCVPRT when parts are finallyreceived, in the quarter received.)
I|
~/
-~I .".
. . . . -

11-34
generation, the action count (3 = 1) statistic IREPGN (8, 1, 2) is increased by I
even though two assets were involved. However, since two assets generated at this
time, the units count (3 = 2) statistic is increased from IREPGN (8, 2, 2) to a value
of IREPGEN (8, 2, 2) + 2. Finally, suppose that the LRU has a unit price of $6,500.
In this case, the dollars (3=3) statistic IREPGN (8, 3, 2) is increased by 2 x $6,500
= $13,000. The subroutine CUM is used to perform these update calculations for all
of the Performance Statistics shown in Table I-8.
Simulation Counters and Flags
Every simulation model requires a series of counters and flags to control the
progress of the simulation, and to perform necessary bookkeeping tasks. The
number of quarters to be simulated, the number of the current statistics collection
interval, and the number of simulation runs to be performed are examples of these
types of data elements. The variables of the Future Events List are an important
example of this type of information. Other major variables in this category are
defined as inputs to RIME through File 05. These latter variables are discussed in
detail in Section VI.
'-,r',_~~~~~~~~~~~~~~~~~.."...... .. . .... : ".... '.:.. ... , . .,i- i" , - . . .- . :,:, ; ,.,il
i
Chapter III
The Events Generator
The Events Generator uses Monte Carlo techniques to generate detailed lists
of LRU and SRU reparable generations and all related requisition, condemnation,
and repair activities. This chapter describes the major features of this system and
the computer codes wich implement it.
The Event Generation Process
A major design feature of the RIME evalution model is that all recoverable
item flows are driven by actual Air Force histories of recoverable item activity.
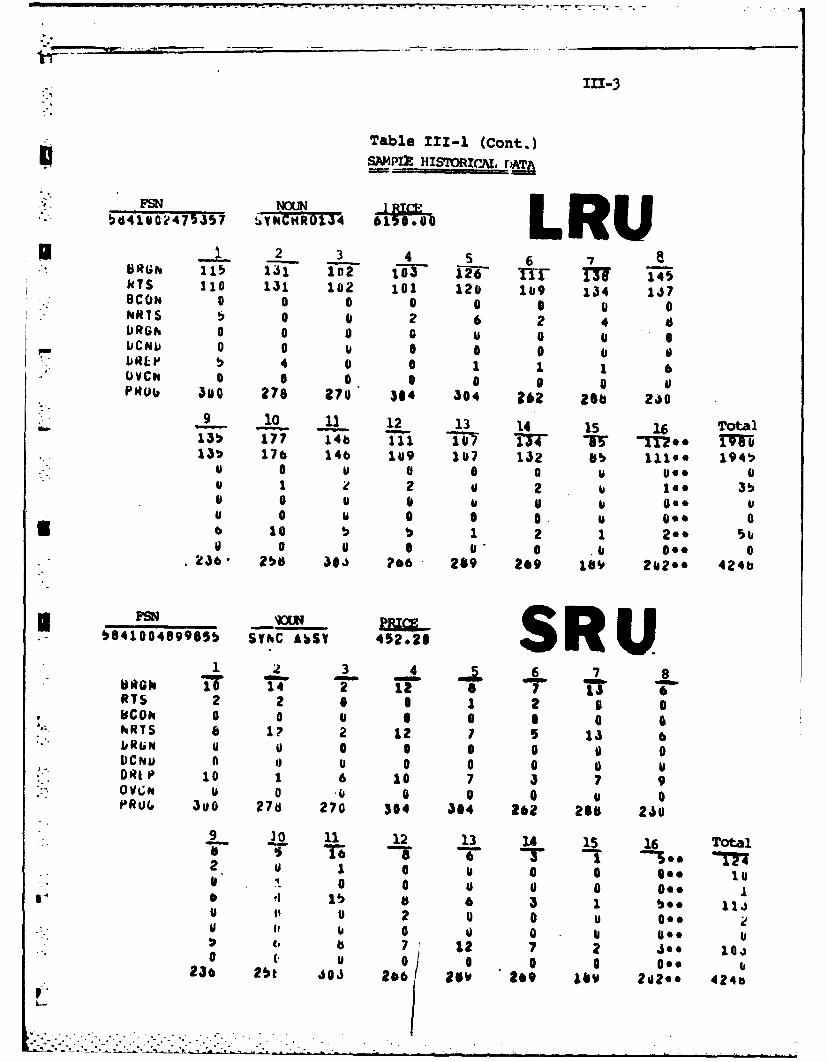
For example, Table 111-1 presents listorical data from the D041 Depot Data Bank
* for Federal Stock Numiber 5841-00-2475357. This FSN is a Line Replaceable Unit
* for the F-Ill aircraft with a price of $6,10 per unit. This LRU has a single SRU
component; the SRU is FSN 5841-00-489935, a SYNC ASSY with a unit price of$-"52.20. Table Ill-I presents the repairable item generation data for these two
stock nubers for the first quarter of FY74, as well as the total repairable
generation in each category shown for the four year period from FY74-1 through
FY7S -4.
As shown in the table, this LRU had 115 repairable generations during the first
quarter of FY74. Of this total, 110 were repaired at base level, while 3 were NRTS
assets. That is, five assets were returned to the depot for repair. None of the
total of 115 assets were condemned at the base level, and there were no depot
repairable generations of this LRU during FY74-1 (.e, there were no generations
- . . .- -. .. - - - . - +. .- .. ., :. .+ . . : . .+.. . . : : : : :

&O go 00 0.
.v.Evc0
(~~~4~ 0 0 0 02z 22
~IL
(4 R 0
-I..
41 ui~ A Z .
V) -0 C)
v0@ 0 0 1'L))4
.-. ; 4
*1io
z -C 4 W; % z1
117-3
Table in-. (Cont.)SAMPIZ HISTORIc1AL r)ATA
5641oc0?475357 4YkCHROL4 615*00L RB(k 115 131 102 f803 T2-6 T IS!rM 14
RTS 110 131 102 101 120 109 134 147OCOi. 0 a 0 0 0 0 (I 0hlS0 0 2 6 2 4
IJRGft0 0 0 0 u00__ CNLI 0 0 0 0 0 0
OIILP 4 0 0 1 1 1 6(JVCh 0 0 0 0 0 0 0 VPRlOb 300 276 170' 344 304 92 266 240__9 10 12 12 13 1.4 15 16 Total
13!p 177 14b 111 -1-07 ITC 5W TI?.. IVw(1 3> 176 146 10V9 207 132 65 1110', 194too u 0 0 a0 * 0V 1 2 V 2 3b.0 0 II 0 u .0*Iu 0 0 0. 49*0 0
*0 10 b1 2 1 2*' 15 tO0 a 0 b1 0 . * 0236- 2bO 3#j ?66 269 209 16v Zo?.' 424b
* b841004899855 SyhC A50SV 452.268 R1 2 34 6 7 8
RTS 2 2 0 0 1 9 0b coE 0 0 1 0 0hR IS 8 ? 2 12 7 5 131 6
i#u u 0 0 0 0 I) 0PCNLI u )I 0 0 0 u1T.p 10 1 6 10 7 3 7 9*OVCN Ia 0 0 0 0P~ul 30 27a 270 304 384 262 268 24bu
9 L0 11 12 13 14 15 16 Total
2 u 1 6 Se 10 7t00 0 0 0*.
* 1 1b 6 3 1 be. 11u It 0 0 0 u 0** if
(a 6 7~ 12 7 2 Je 104o 0 o 0 0 0 0**236 25t J~os 266 z/ 209 a lo?..* 42415
=-~4
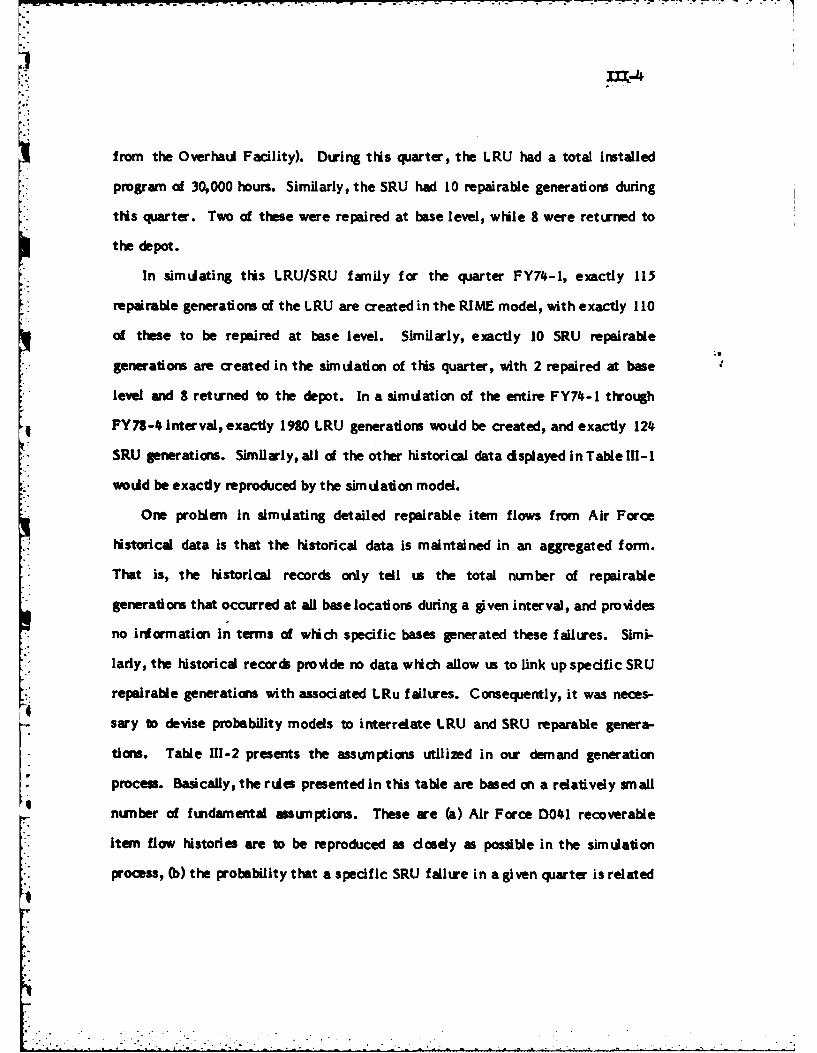
from the Overhaul Facility). During this quarter, the LRU had a total installed
program of 30,000 hours. Similarly, the SRU had 10 repairable generations during
this quarter. Two of these were repaired at base level, while 8 were returned to
the depot.
In simulating this LRU/SRU family for the quarter FY74-1, exactly 115
: repairable generations of the LRU are created in the RIME model, with exactly 110
of these to be repaired at base level. Similarly, exactly 10 SRU repairable
generations are created in the simulation of this quarter, with 2 repaired at base
level and 8 returned to the depot. In a simulation of the entire FY74-1 through
FY7-4 interval, exactly 1980 LRU generations would be created, and exactly 124
SRU generations. Similarly, all df the other historical data displayed in Table Ill-I
would be exactly reproduced by the simulation model.
One problem in simulating detailed repairable item flows from Air Force
: historical data is that the historical data is maintained in an aggregated form.
That is, the historical records only tell t the total number of repairable
generations that occurred at all base locations during a given interval, and provides
-. no information in terms of which specific bases generated these failures. Simi-
larly, the historical records provide no data which allow us to link up specific SRU
* repairable generations with associated LRu failures. Consequently, it was neces-
sary to devise probability models to interrelate LRU and SRU reparable genera-
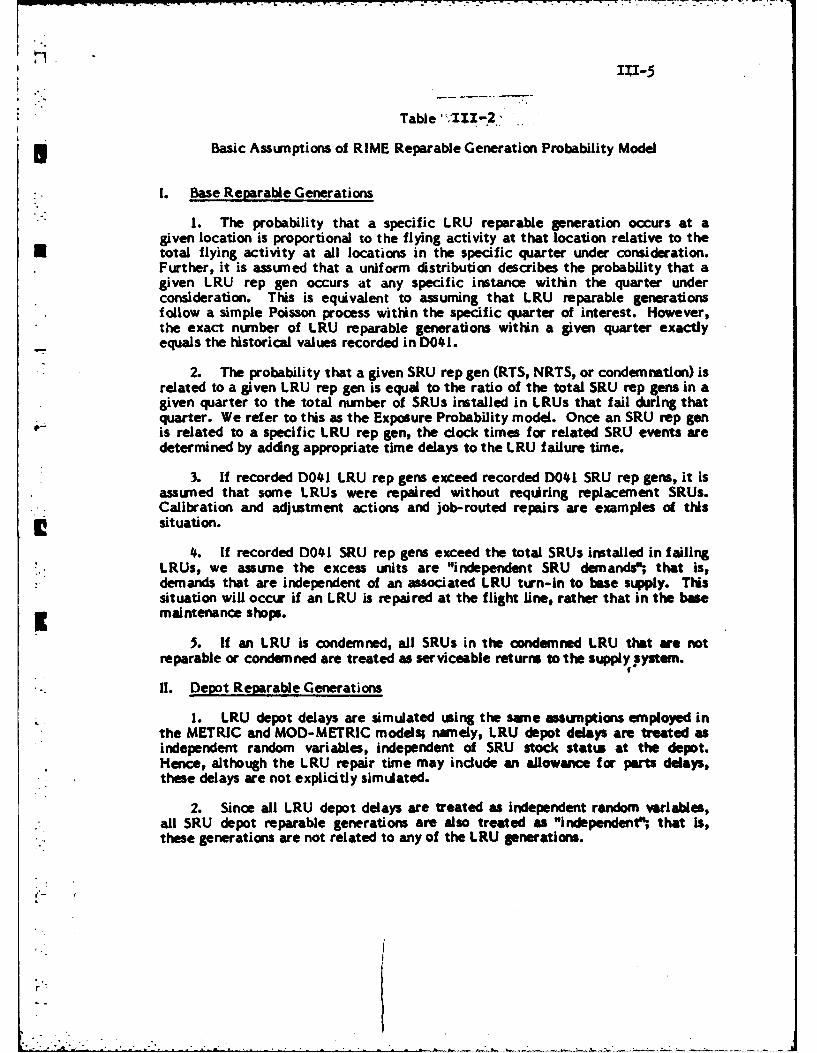
tions. Table 111-2 presents the assumptions utilized in our demand generation
process. Basically, the rules presented in this table are based on a relatively small
number of fundamental assumptions. These are (a) Air Force D041 recoverable
. item flow histories are to be reproduced as dosely as possible in the simulation
*process, (b) the probability that a specific SRU failure in a given quarter is related
111-5
p -..
Table .111-2 .
*Basic Assunptions of RIME Reparable Generation Probability Model
I. Base Reparable Generations
1. The probability that a specific LRU reparable generation occurs at agiven location is proportional to the flying activity at that location relative to the
* total flying activity at all locations in the specific quarter under consideration.Further, it is assuned that a uniform distribution describes the probability that agiven LRU rep gen occurs at any specific instance within the quarter underconsideration. This is equivalent to assuming that LRU reparable generationsfollow a simple Poisson process within the specific quarter of interest. However,the exact number of LRU reparable generations within a given quarter exactly
-- equals the historical values recorded in D041.
2. The probability that a given SRU rep gen (RTS, NRTS, or condemnation) isrelated to a given LRU rep gen is equal to the ratio of the total SRU rep gens in agiven quarter to the total number of SRUs installed in LRUs that fail during thatquarter. We refer to this as the Exposure Probability model. Once an SRU rep genis related to a specific LRU rep gen, the dock times for related SRU events aredetermined by adding appropriate time delays to the LRU failure time.
3. If recorded D041 LRU rep gens exceed recorded D041 SRU rep gem, it isasstmed that some LRUs were repaired without requiring replacement SRUs.Calibration and adjustment actions and job-routed repairs are examples of this
* situation.
4. If recorded D041 SRU rep gens exceed the total SRUs installed in failingLRUs, we assumne the excess units are "independent SRU demands, that is,demands that are independent of an associated LRU turn-in to base supply. Thissituation will occur if an LRU is repaired at the flight line, rather that in the basemaintenance shops.
5. If an LRU is condemned, all SRUs in the condemned LRU that we notreparable or condemned are treated as serviceable returns to the supply systemn.
II. Depot Reparable Generations
1. LRU depot delays are simulated using the same assumptions employed inthe METRIC and MOD-METRIC models; namely, LRU depot delays are treated asindependent random variables, independent of SRU stock status at the depot.Hence, although the LRU repair time may include an allowance for parts delays,these delays are not explicitly simulated.
2. Since all LRU depot delays are treated as independent random variables,all SRU depot reparable generations are also treated as "independent"; that Is,these generations are not related to any of the LRU generations.
of J
111-6
Table Z4-((Cont
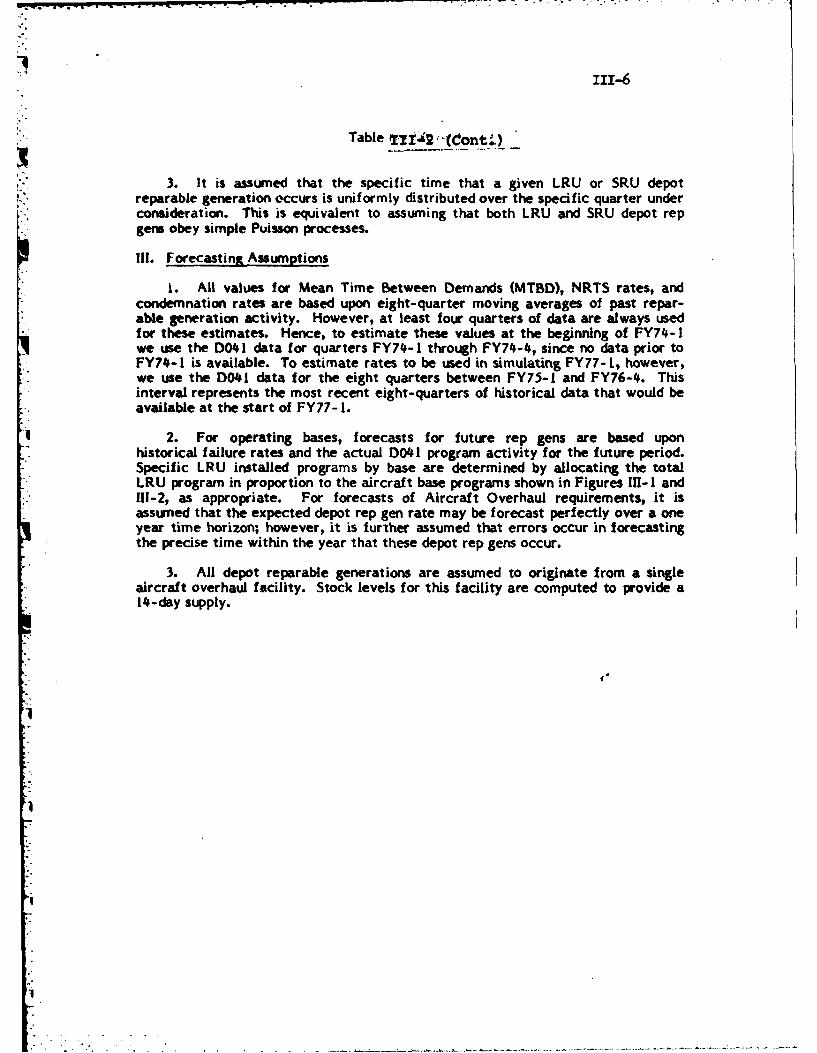
3. It is assumed that the specific time that a given LRU or SRU depotreparable generation occurs is uniformly distributed over the specific quarter underconsideration. This is equivalent to assuming that both LRU and SRU depot repgenu obey simple Puisson processes.
!11. Forecastinz Assumptions
1. All values for Mean Time Between Demands (MTBD), NRTS rates, andcondemnation rates are based upon eight-quarter moving averages of past repar-able generation activity. However, at least four quarters of data are always usedfor these estimates. Hence, to estimate these values at the beginning of FY74-1we use the D041 data for quarters FY74-1 through FY74-4, since no data prior toFY74-1 is available. To estimate rates to be used in simulating FY77- 1, however,we use the D041 data for the eight quarters between FY75-! and FY76-4. Thisinterval represents the most recent eight-quarters of historical data that would beavailable at the start of FY77-1.
2. For operating bases, forecasts for future rep gens are based uponhistorical failure rates and the actual D041 program activity for the future period.Specific LRU installed programs by base are determined by allocating the totalLRU program in proportion to the aircraft base programs shown in Figures I-I and111-2, as appropriate. For forecasts of Aircraft Overhaul requirements, it isassumed that the expected depot rep gen rate may be forecast perfectly over a oneyear time horizon; however, it is further assumed that errors occur in forecastingthe precise time within the year that these depot rep gens occur.
3. All depot reparable generations are assumed to originate from a singleaircraft overhaul facility. Stock levels for this facility are computed to provide a14-day supply.
I
1
F
1.2-7
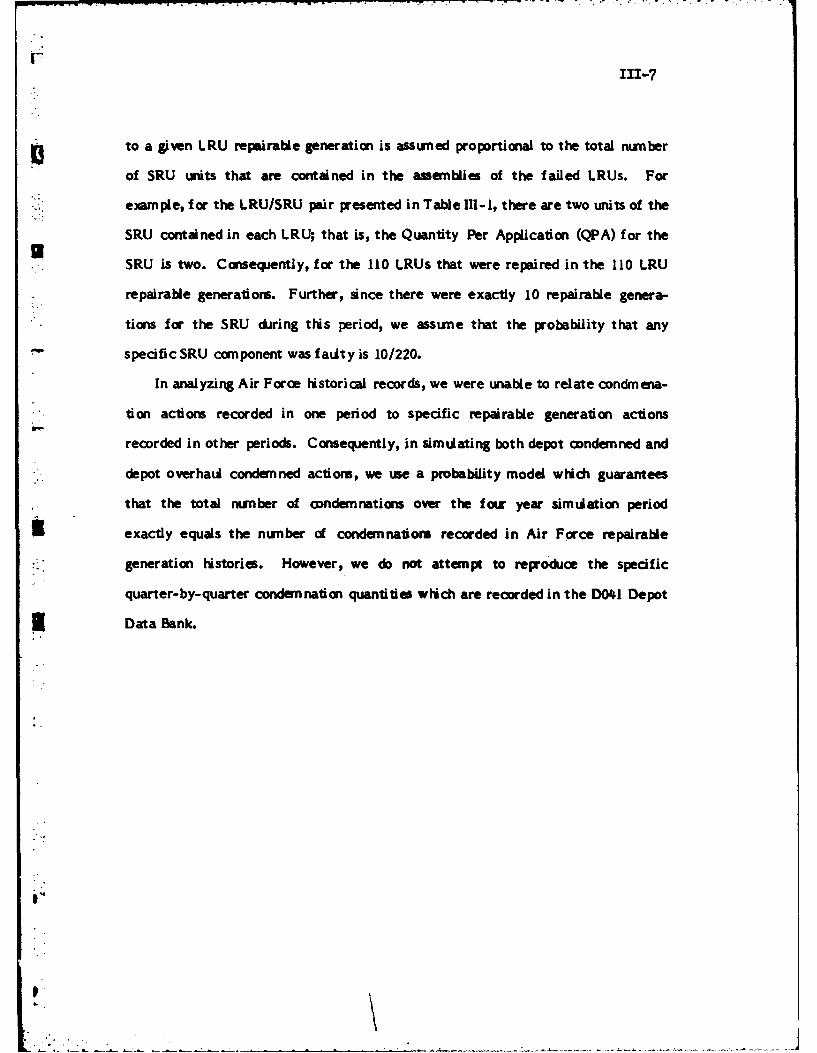
ato a given LRU repairable generation is assumed proportional to the total number
of SRU units that are contained in the assemblies of the failed LRUs. For
example, for the LRU/SRU pair presented in Table lll-1, there are two units of the
SRU contained in each LRU; that is, the Quantity Per Application (QPA) for the
SRU is two. Consequently, for the 110 LRUs that were repaired in the 110 LRU
repairable generations. Further, since there were exactly 10 repairable genera-
tions for the SRU during this period, we assume that the probability that any
* specific SRU conponent was faity is 10/220.
In analyzing Air Force historical records, we were unable to relate condmena-
tion actions recorded in one period to specific repairable generation actions
reorded in other periods. Consequently, in simulating both depot ondemned and
* depot overhaul condemned actions, we we a probability model which guarantees
that the total number of condemnations over the four year simulation period
£ exactly equals the number of condemnatiom recorded in Air Force repairable
• - generation histories. However, we do not attempt to reproduce the specific
quarter-by-quarter condemnation quantities which are recorded in the 1D041 Depot
Data Bank.
i"

111-8
Relationships Among Exogenous Events
As noted above, the objective of the Events Generator is to generate detailed
descriptions of each LRU and SRU reparable generation in such a way that the
totals of these events exactly equal values recorded in D041 reparable generation
histories. In doing this, we wish to generate not only events describing specific
reparable generations, but also to generate all associated serviceable return,
repair, NRTS, and condemnation actions whose timing may be determined from the
timing of the reparable generation event. Table III-I presents a sample of
historical reparable generation data which drives the Events Generator, while
Table 111-2 defines the probability model used to generate specific reparable
generation events. On the other hand, Figures 11-I through l1-4 describe the
relationships between reparable generation events and all associated exogenous
events "caused by" the reparable generation.
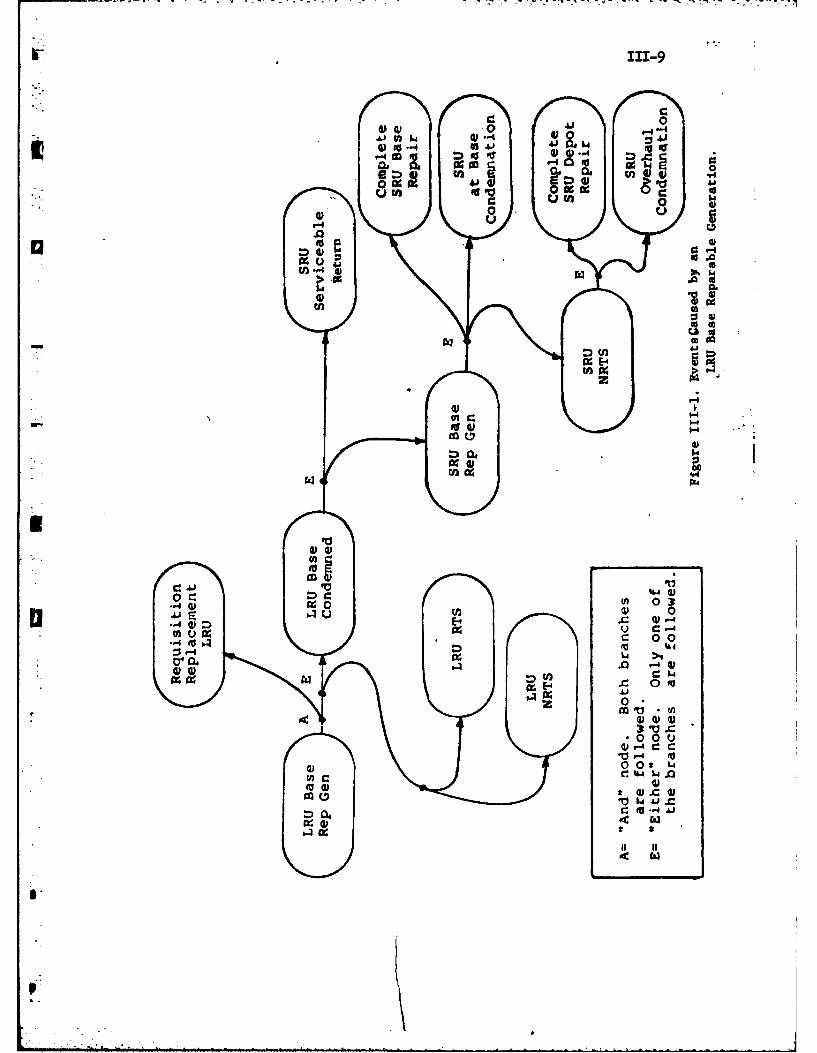
Figure 111-I illustrates the relationships among exgenous events caused by an
LRU base reparable generation. As shown in the figure, an LRU base rep gen event
is always accompanied by a corresponding requisition (Event Type 1) for a
replacement (serviceable) LRU. In addition, one of three possible additional LRU
events may be related to the LRU base rep gen. These are: (a) an LRU base
condemnation event (Event Type 15), (b an LRU RTS event (Event Type 18), or (c)
4 an LRU NRTS event (Event Type 19). Which of these three specific events will be
generated depends on a Monte Carlo computation to be discussed later in this
section. Suppose that this Monte Carlo -alculation indicates that the LRU basertl reparable generation is to be condemned. As shown in Figure lIII, t he next step is
K
117-9
C 0
0 M -41
iUr 4 f 9
0
.0
AF
I
It;
.. 44
W Z) 4 -4
I I
0 "4 U) 4
WVW
IIz 03
KM
to determine the relationships between the condemned LRU asset and the
individual SRU components which go into the LRU unit. As shown in the Figure, a
Monte Carlo process is applied to determine the status of each SRU unit that is a
member of the condemned LRU asset. If the Monte Carlo computation indicates
that the SRU is serviceable, the Event Generator schedules a Serviceable Return
event (Event Type 4) to represent the return of the serviceable SRU to available
base stocks. On the other hand, the Monte Carlo computation may indicate that
the SRU component is in some way faulty. In this case, the Events Generator
schedules a Base Reparable Generation event (Event Type 14) for each faulty SRU
component. Monte Carlo techniques are also used to determine the additional
exogenous events to associate with the SRU reparable generation. As shown in
Figure Ill-1, one of three different exogenous events may be associated with a
given SRU Base Reparable Generation event. These are: (a) completion of repair
activities for the SRU (Event Type 18), (b) condemnation of the SRU (Event Type
1,), or (c) Initiation of a NRTS event (Event Type 19) to represent the beginning of
transportation of the faulty SRU to the depot level repair facility. In the latter
case, i.e., the case of an SRU NRTS event, a Monte Carlo process is again used to
4 determine the disposition of the SRU when it reaches the Depot Level Maintenance
facility. One possibility is that the SRU may be successfully repaired at the depot
level. In this case, the Events Generator schedules an SRU repair completion event
(Event Type 18) to occur at the depot. The other possibility is that the SRU cannot
be repaired. In this case, the Events Generator schedules a Condemnation event
(Event Type 13) to occur for the SRU after a suitable time delay to represent the
time required to transport the SRU to the depot.
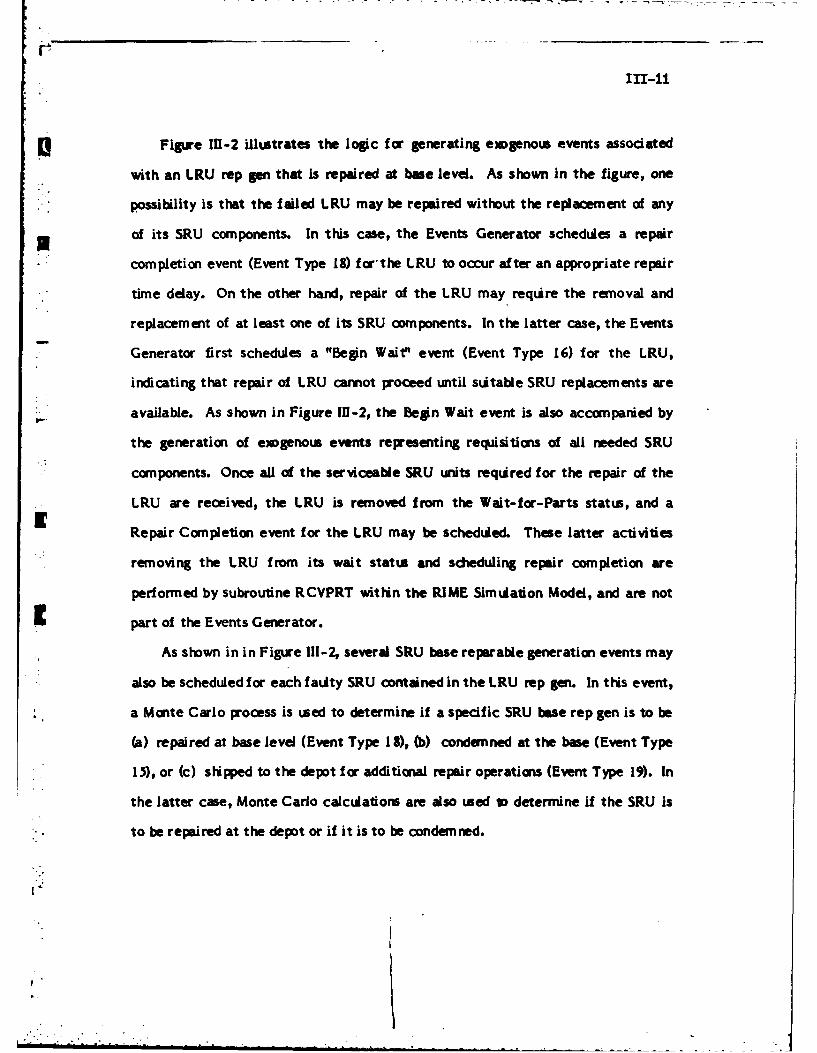
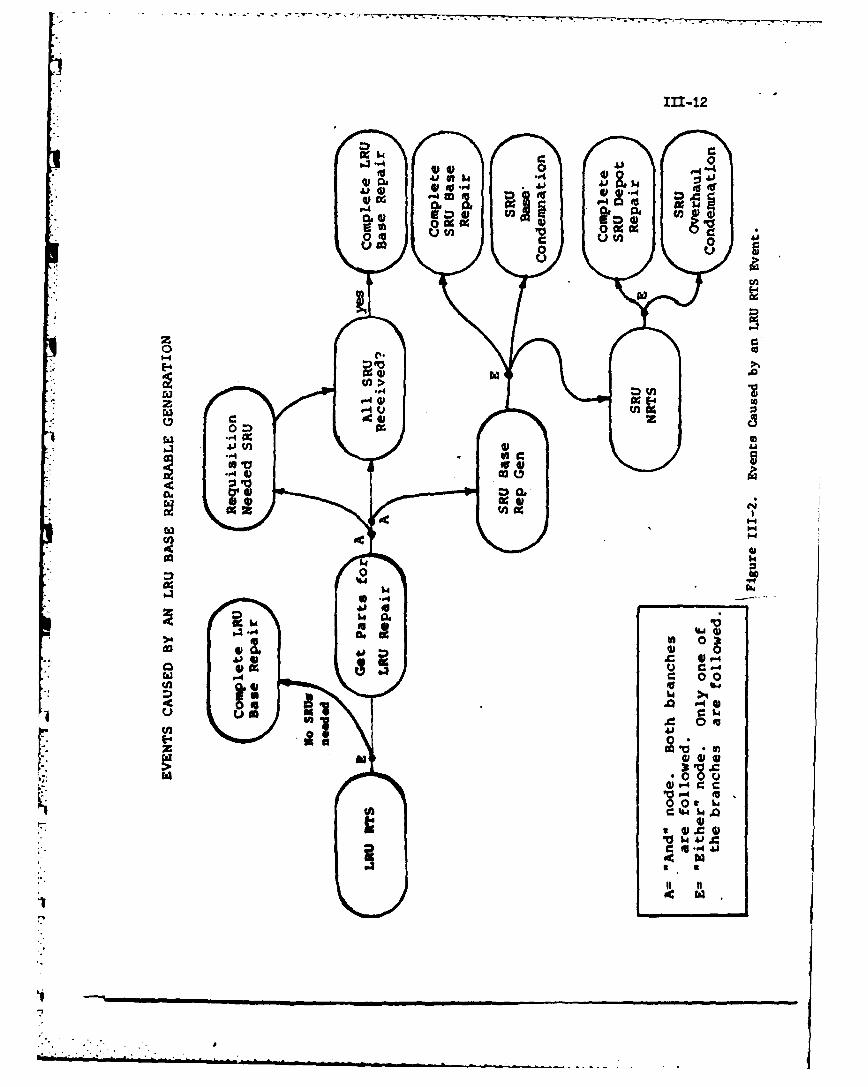
Figure III-2 illustrates the logic for generating exgenou events associated
with an LRU rep gen that is repaired at base level. As shown in the figure, one
possibility is that the failed LRU may be repaired without the replacement of any
of its SRU components. In this case, the Events Generator schedules a repair
completion event (Event Type 18) for'the LRU to occur after an appropriate repair
time delay. On the other hand, repair of the LRU may require the removal and
replacement of at least one of its SRU components. In the latter case, the Events
Generator first schedules a "Begin Wait" event (Event Type 16) for the LRU,
indicating that repair of LRU cannot proceed until suitable SRU replacements are
available. As shown in Figure 11-2, the Begin Wait event is also accompanied by
the generation of exogenous events representing requisitions of all needed SRU
components. Once all of the serviceable SRU units required for the repair of the
LRU are received, the LRU is removed from the Wait-for-Parts status, and aRepair Completion event for the LRU may be scheduled. These latter activities
removing the LRU from its wait status and scheduling repair completion are
performed by subroutine RCVPRT within the RIME Simulation Model, and are not
part of the Events Generator.
As shown in in Figure 111-2, several SRU base reparable generation events may
also be scheduled for each faulty SRU contained in the LRU rep gen. In this event,
, a Monte Carlo process is used to determine if a specific SRU base rep gen is to be
(a) repaired at base level (Event Type 18), (b) condemned at the base (Event Type
15), or (c) shipped to the depot for additional repair operations (Event Type 19). In
the latter case, Monte Carlo calculations are also used vo determine if the SRU is
to be repaired at the depot or if it is to be condemned.
111-12
0- 0
Oi -Wa w .
OU1 0 4
wU U
0 0a
V.440 z
0 n~-. 4 0
W4-
>4 0
IV *r4
IKC 004
.4 P-40
C*4
0 f
0
Ctb.4 .4Q
14' 4 441
As shown in Table 111-2, we attempt to relate all SRU base reparable
generations to LRU reparable generations. However, this is not aways possible.
At times, D041 histories show more SRU base reparable generations then can be
explained by the failure of every SRU installed in all recorded LRU failures. In
RIME, we assume that all SRU reparable generations which cannot be associated
with LRU failures are "independent" base reparable generations. Such generations
might occur, for example, if faulty SRUs are removed from an LRU at the
flightline, rather than at an intermediate repair organization. In this case, the
LRU reparable generation would never be recorded in the D041 demand history,
while the SRU reparable generation would be recorded.
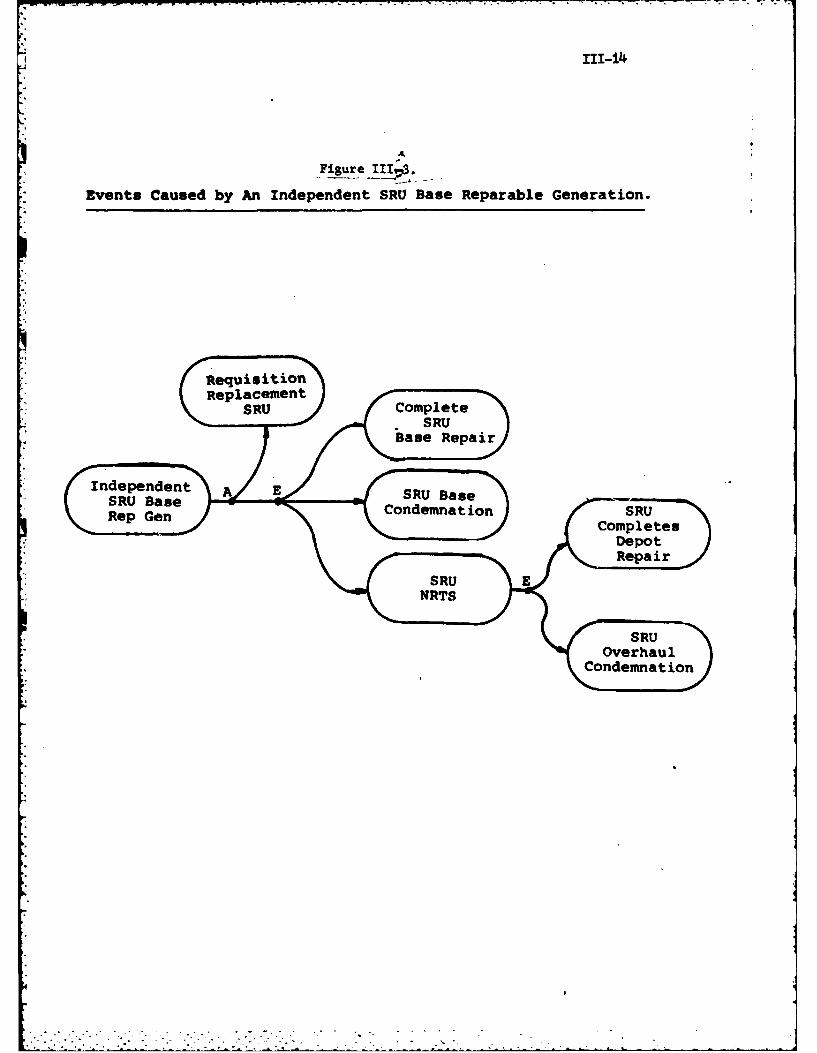
Figure MI-3 illustrates the relationship; among all exogenous events associated
with Independent SRU base reparable generation events. As may be seen in the
figure, these are essentially the same event relationships as when the SRU is
associated wtih an LRU failure.
Figure 111-4 illustrates the relationship among exogenous events associated
with the Depot Level Maintenance facility. As shown in the figure, there is no
Iattempt to relate LRU repair or condemnation actions at the depot level with SRU
repair or condemnation events. Basically, this flowchart assuines the same
LRU/SRU depot relationships as those modeled in the METRIC and MOD-METRIC
mathematical models.
I-
111-14
FigureIIff3 ._
* Events Caused by An Independent SRU Base Reparable Generation.
RequisitionReplacement
Independent A E SUBs
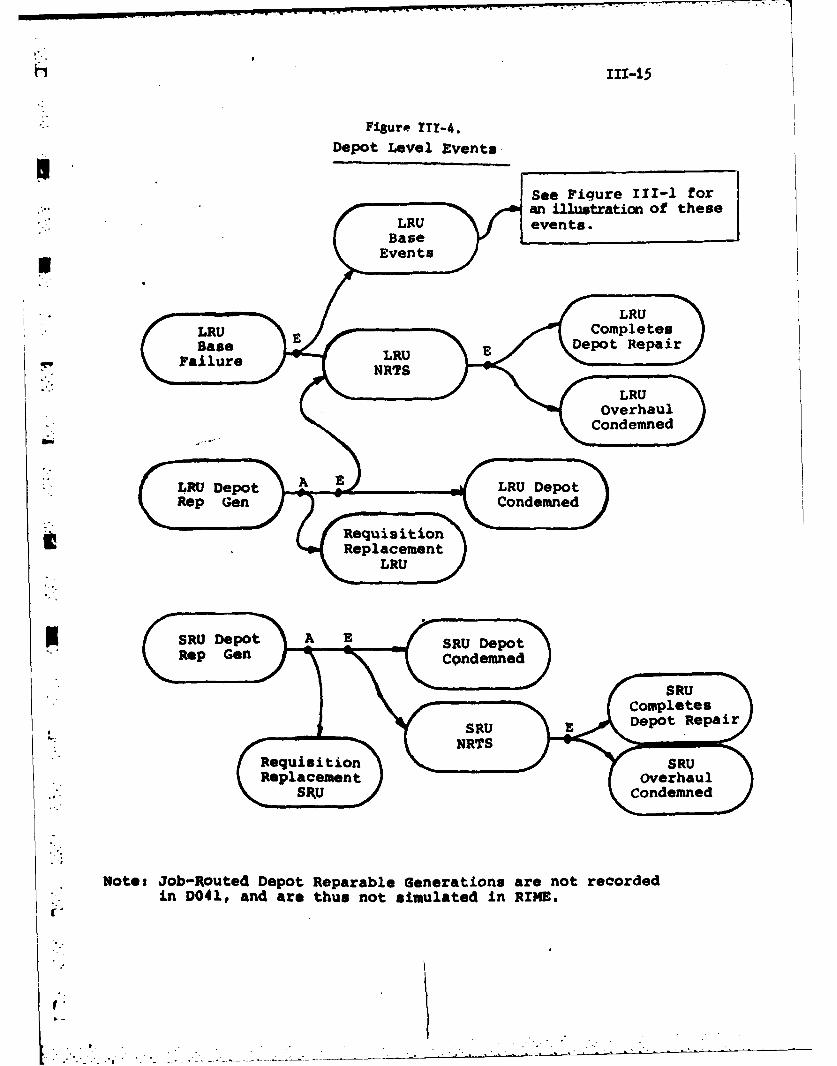
Figure ITZ-4.Depot Level Events,
LRU
overhaulCondemned
USRU Depot AR eo
Note U Job poote A Deo Rearbl Denra oaentrcreRen Ge4 nd arChu otsmuae nRE.
Copee

111-16
Programs Used in the Events Generator
Figure 111-5 illustrates the computer programs which implement the Events
Generator. As shown in the figure, the program EVTGN2 is the main program for
the events generation process. The subroutines BASEDA and READF2 are used to
input base flying program data by quarter and LRU/SRU item data, respectively.
The subroutines NOSETI and NOSET2 are used to set counters required to control
the events generation process. Subroutine NOSETI sets counters of depot level
events, while NOSET2 sets base level counters. The routines LRUEVT and SRUEVT
perform the bulk of calculations in the Events Generator. The routine LRUEVT
controls the scheduling of LRU reparable generations and all associated LRU
excgenous events, and LRUEVT calls subroutine SRUEVT to generate all related
SRU events. In some cases, D041 histories show more SRU reparable generations
than can be explained by the historical values for LRU reparable generations. In
this case, the subroutine SRUIND is called to schedule all "excess" SRU reparable
generations as "independenf' events. In turn, SRUIND calls subroutine SCHIND to
perform the detailed scheduling calculations associated with these independent
events.
In addition, three general utility routines -- INFEL, ENTER, and REMOVE --
are called to facilitate the scheduling of exogenous events. Subroutine INFEL is
called to initialize the Future Events List (FEL), while subroutine ENTER is called
to place specific events on the FEL. At the end of each quarter, subroutine
REMOVE is called to remove all events associated with the given quarter from the
Future Events List. Let us now consider Interrelationships among these routines in
more detail.
. . . . . . . . . .

111-17
Cd
pP4

111-18
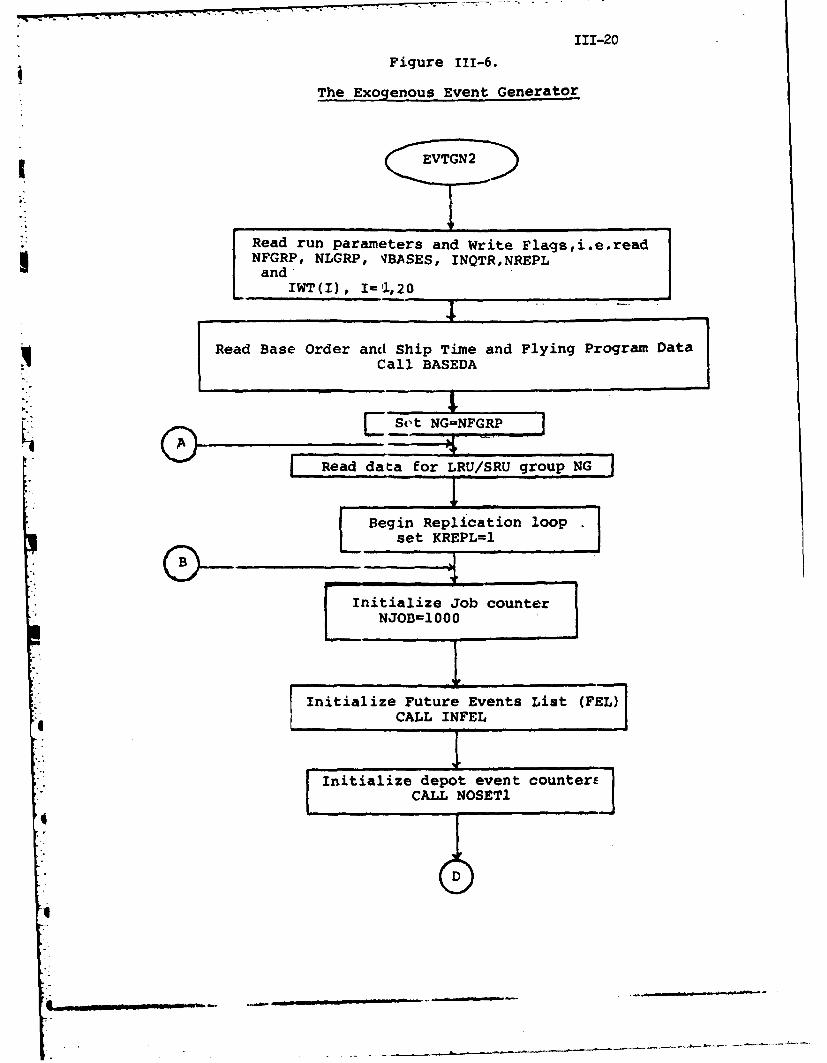
EVTGN?. The Exogenous Event Generator Main Program
The program EVTGN2 is the main program for the Exogenous Event Generator.
A flow chart of the major computations performed by EVTGN2 is shown in Figure
111-6, while detailed source program listings of EVTGN2 are presented in Volume H.
As shown in the figure, EVTGN2 begins by reading parameters which control the
computations performed by the Events Generator, and which control the types of
• "outputs to be produced during the Events Generation Process. The run parameters
read in are:
NFGRP The number of the first LRU/SRU group included
in the events generation process.
NLGRP The number of the last LRU/SRU group be included
in the events generation process.
NBASES = The number of operating bases assumed during
events generation process.
INQTR = The number of quarters in the events generation
planning horizon.
NREPL = The number of replications to be performed for each
LRU/SRU group.

111-19
IWT(1) A "Write" Flag, which specifies if
output option I is to be exercised. If IWT(I)
1, the Ith print option is to be used;
otherwise, that option is not used.U
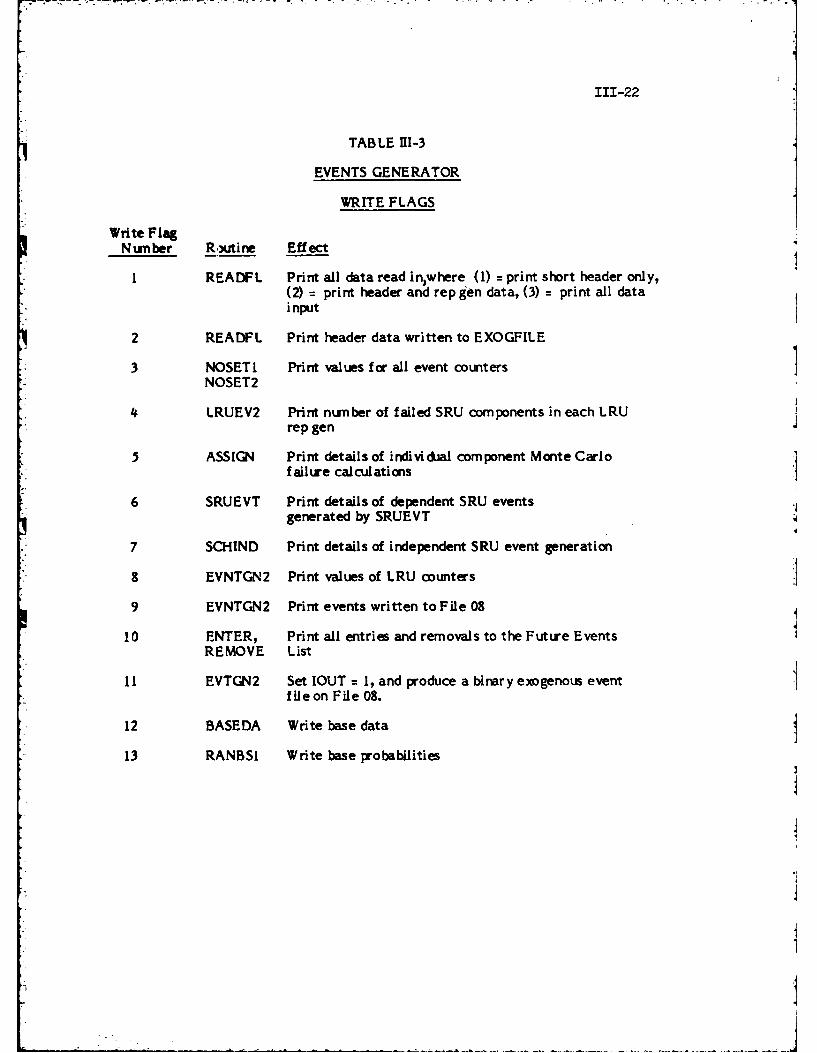
The Write Flags are most useful during the debugging of new data sets and in
the development of alternate versions of the Events Generation System. Table
S111-3 defines the specific meanings of each of these Flags.
After reading the run parameters and Write Flags, subroutine BASEDA is
-: called to read in base order and ship times. BASEDA also reads in flying program
data by base for each quarter in the events generAtion planning horizon. Next,
EVTGN2 scans down the Master Data Set until LRU/SRU group NFGRP is found.
The routine then begins the generation of exogenous events with this particular
* group.
In processing each new LRU/SRU group, the replication counter KREPL is
reset to 1, and the reparable generation counter N3OB is set to 1,000. The Future
*Events List is then initialized by calling subroutine INFEL, and the counters of
depot level events are initialized by a call to subroutine NOSET.
The quarter loop now begins by setting the quarter counter variable IQTR = 1.
At the beginning of each quarter, subroutine RANBSI is called to initialize the
base probability array CPROB, and subroutine NOSET2 is called to initialize the
counters of all base level events to be generated within the current quarter.
Probability array CPROB is used by subroutine RANBAS later in the events
generation process to determine a randomly selected base. This selection is
performed so that the base selection probability is proportional to the flying hour
activity at each base in specific quarter under consideration.
p1
111-20
Figure 111-6.
The Exogenous Event Generator
EVTGN2
Read run paramneters and Write Flags,i.e.read
Read Base Order and Ship Time and Flying Program DataI Call BASEDA
Se t NG=FR
Read data for LRU/SRU group NG
0ei-elcainlo
se RPI
IntaieJo4one
NJB10

Figure 111-6 (Continued)
Initialize base probability array CPRO3ITINVZIQTR
- CALL RANBS(ITINV)Initialize base event counters
CALL NOSET2 (ITINV)
CALLRUZVT to generate events forsS ) LRU base RTS and base condemnation events
c)LRU NRTS events
Generate any remaining SRU eetas independent rep gens
CALL BRUIND
Remove all events scheduled for
th urn qatrfomteFL
an rt ee-rcodt h
Exgnu vn Fl Fl 8
111-22
TABLE 111-3
EVENTS GENERATOR
WRITE FLAGS
Write FlagN umber Routine Effect
1 READFL Print all data read in where (1) = print short header only,(2) = print header and rep gen data, (3) = print all datai nput
2 READFL Print header data written to EXOGFILE
3 NOSETI Print values for all event countersNOSET2
4 LRUEV2 Print number of failed SRU components in each LRUrep gen
ASSIGN Print details of individual component Monte Carlofailure calculations
6 SRUEVT Print details of dependent SRU eventsgenerated by SRUEVT
7 SCHIND Print details of independent SRU event generation
8 EVNTGN2 Print values of LRU counters
9 EVNTGN2 Print events written to File 08
10 ENTER, Print all entries and removals to the Future EventsREMOVE List
II EVTGN2 Set IOUT = I, and produce a binary exogenous eventfile on File 08.
12 BASEDA Write base data
13 RANBSI Write base probabilities
-ii
oj

111-23 r
After the above initialization procedures, subroutine LRUEVT is called three
times to generate all exogenous events associated with historical D041 LRU
reparable generations associated with quarter IQTR. First, LRUEVT is called to
generate specific events associated with historical LRU base RTS and base
condemnation events. The second and third calls to subroutine LRUEVT generate
all exogenous events associated with LRU NRTS and LRU depot reparable
generations, respectively. In performing the LRU event generation process,
-- subroutine ASSIGN is called to determine the number of SRU reparable generations
to associate with each LRU failure, while subroutine SRUEVT is called to schedule
the specific exogenous events associated with these SRU reparable generations.
After all LRU events have been scheduled, subroutine SRUIND is called. This
routine checks the base level counter arrays for each SRU to determine if there
are any remaining SRU reparable generations, i.e., SRU generations which could
I not logically be associated with LRU failures. If so, subroutine SCHIND is called
to schedule the remaining SRU events as "independent" SRU reparable generations,
and to schedule all related requisition, cancellation, and repair activities.
1Finally, at the end of each simulated quarter, subroutine REMOVE is called to
remove all exogenous events scheduled for quarter IQTR from the FEL, and to
. output an event record to the Exogenous Event File (File 08). The quarter counter
IQTR is then increased by one, and the event generation process continues until all
quarters have been considered.
After all quarters have been processed, an "End-of-Run" (Event Type 10)
event record is written to the Exogenous Event File. The RIME Simulation Model
uses the "End-of-Run" event record to determine that there are no additional
events for the current replication of a given LRU/SRU group. If additional
J
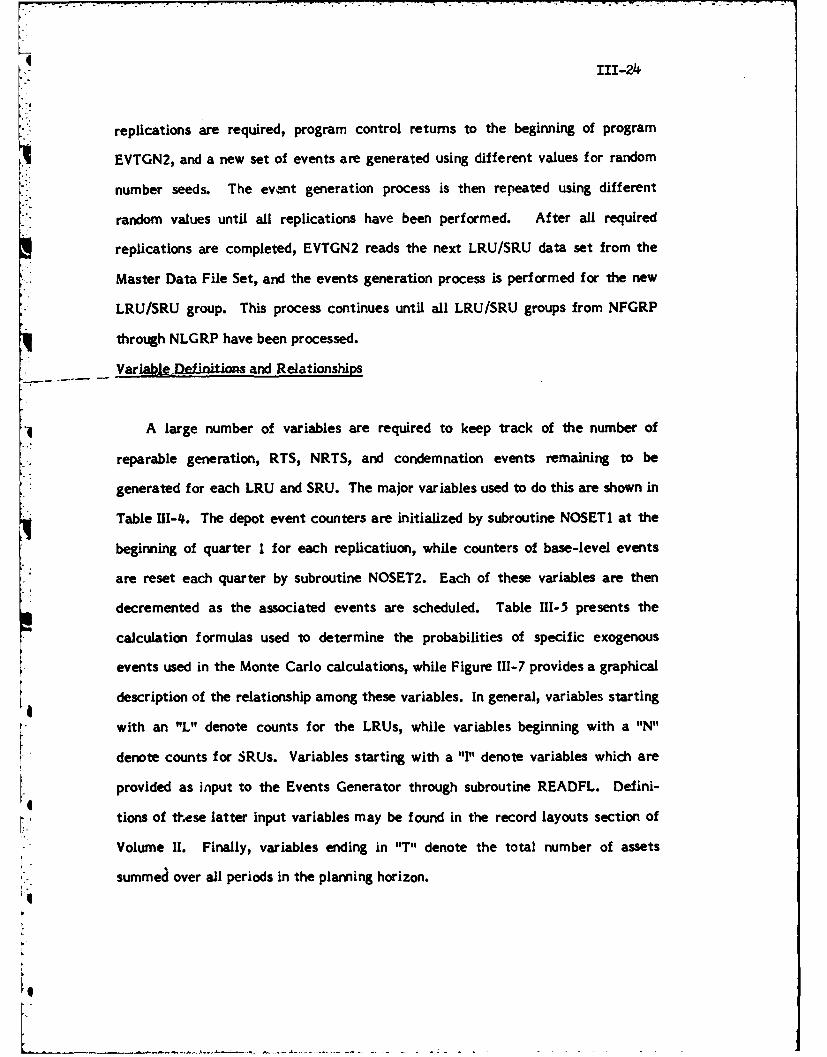
111-24
L replications are required, program control returns to the beginning of program
EVTGN2, and a new set of events are generated using different values for random
- number seeds. The event generation process is then repeated using different
random values until all replications have been performed. After all required
replications are completed, EVTGN2 reads the next LRU/SRU data set from the
Master Data File Set, and the events generation process is performed for the new
LRU/SRU group. This process continues until all LRU/SRU groups from NFGRP
through NLGRP have been processed.
Varlaboeiniio and Relationships
A large number of variables are required to keep track of the number of
* reparable generation, RTS, NRTS, and condemnation events remaining to be
generated for each LRU and SRU. The major variables used to do this are shown in
Table 1II-4. The depot event counters are initialized by subroutine NOSETI at the
beginning of quarter 1 for each replicatiuon, while counters of base-level events
are reset each quarter by subroutine NOSET2. Each of these variables are then
decremented as the associated events are scheduled. Table 111-5 presents the
calculation formulas used to determine the probabilities of specific exogenous
events used in the Monte Carlo calculations, while Figure 111-7 provides a graphical
description of the relationship among these variables. In general, variables starting
with an "L" denote counts for the LRUs, while variables beginning with a "N"
denote counts for SRUs. Variables starting with a "I" denote variables which are
provided as input to the Events Generator through subroutine READFL. Defini-
tions of these latter input variables may be found in the record layouts section of
Volume II. Finally, variables ending in "T" denote the total number of assets
summed over all periods in the planning horizon.
K,

111-25
TABLE 111-4
O EVENTS GENERATORVARIABLE DEFINITIONS
+ VARIABLE DEFINITION
* NLRUGP Number of LRU/SRU groups to be simulated.
NBASES Number of Operating Bases.
NSRU Number of SRUs in the LRU.
NITEM Number of stock-keeping units (SKUs).
NMPH Number of months of program data provided.
INQTR Number of quarters of events to be generated.
- FH(I,3) Flying program (in 100s of hours) in quarter I at base J.
TFH(3) Total flying program at base 3 for months 1, 2 ..... NMPH.
ITINV Current Quarter index.
ITDAY Time units in I day (ITDAY = 100 Time Units).
ITQTR Time units in 1 quarter = 8400 (7 days/week x 4 weeks/month x 3months/quarter).
For a liven quarter, let K denote the Kth type of SRU in an LRU. Then,
NOINL(K) Number of SRU Type K failures in the LRU reparable generationcurrently being considered.
NOSRUF(K) Total number of base level RTS, NRTS, and condemnation eventsremaining to be assigned to rep gen events.
NORTS(K) Number of base level Reparable This Station (RTS) SRU Type Kgenerations remaining to be assigned to rep gen events.
NONRTS(K) Number of base level NRTS generations remaining to be assigned torep gen events.
NOCON(K) Number of base condemnations remaining to be assigned to rep genevents.
-. . .

111-26
TABLE 111-4 (CONI'D)
NODCN(K) Number of depot condemnations remaining to be assigned to rep gen
events,
NODRP(K) Number of depot repairs remaining to be assigned to rep gen events.
LBRGN Number of base level LRU failures in the current quarter (total LRUsrecorded as RTS or condemned.
NOLEFT Number of LRU failures that have not yet been scheduled.
LRTS Number of LRU RTS events that have not yet been scheduled.
N3OB Job number associated with the current rep gen and to all relatedexogenous repair events.
LNRTS Number of LRU NRTS events in the current quarter.
LDRGN Number of LRU depot rep gens in the current quarter.
LDCON Number of LRU depot condemnations in the current quarter.
LDCONT NUMBER OF LRU depot condemnations over the planning horizon.
LOVGNT Number of NRTS and depot LRU generations less depot condeman-tions over the planning horizon. LOVGNT thus represents the totalnumber of LRU carcasses received at the depot over the planninghorizon.
LDREP Number of the LOVGNT LRUs that are repaired.
LOVCNT Number of depot LRU overhaul condemnations over the planninghorizon.
NDRGN(K) Number of depot generations of SRU K over the planning horizon.
NINDGN (I,K) Number of independent depot generations for SRU K in quarter I.
NDCOND(K) Number of depot condemnations of SRU K.
NOVCNT(K) Number of overhaul condemantions of SRU K over the planninghorizon.
* NSRUGN(K) Total SRU NRTS plus total SRU depot rep gens over the planninghorizon.
LRUREP LRU Repair Status Flag.0 indicates the LRU is to be condemned.I indicates the LRU is repairable.
LRULOC = Base number associated with a given LRU condemnation, whereLRULOC = 0 indicates a depot condemnation.

111-27
TABLE 111-5
MONTE CARLO CALCULATION FORMULAS
A. LRU Base Failure Probabilities
P P [RU is ]=LBCOND/LBRGNP [ RU is 3=LRTS/LBRGN
- [RU K is defective[n aiven LRU base] NOSRUF(K)/ LBRGN*IQPA(K)
rp gen
*B. Given that a particular SRU K unit is defective,
P [RU K ]=NBRTS(K)/(NBRTS(K) + NBCOND(K) +NNRTS(K))
P [SRU K I=NBCOND(K)/(NBRTS(K) + NBCONDWK + NNRTS(K))Lis condemned
* '[RU K 3=NNRTS(K)/(NBRTS(K) + NBCONDWK + NNRTS(K))
C. The number of independent base SRU rep gens, NOIND(KL is computed asfollows:
If LBRGN*IQPA(K) NOSRUF(K), then NOIND(K) = 0I Otherwise, NOIND(K = NOSRUF(K) - LBRGN*IQPA(K)
D. SRU depot repair Probabilities
SRU NRTS 1=NOVCNT(K)/(NOVCNT(K) + NODRPT(K))P is ELOverhaul Condemned]
SRU NRTS 1=NODRPT(K)/(NOVCNT(K) +NODRPT(K))
P Is[Repaired
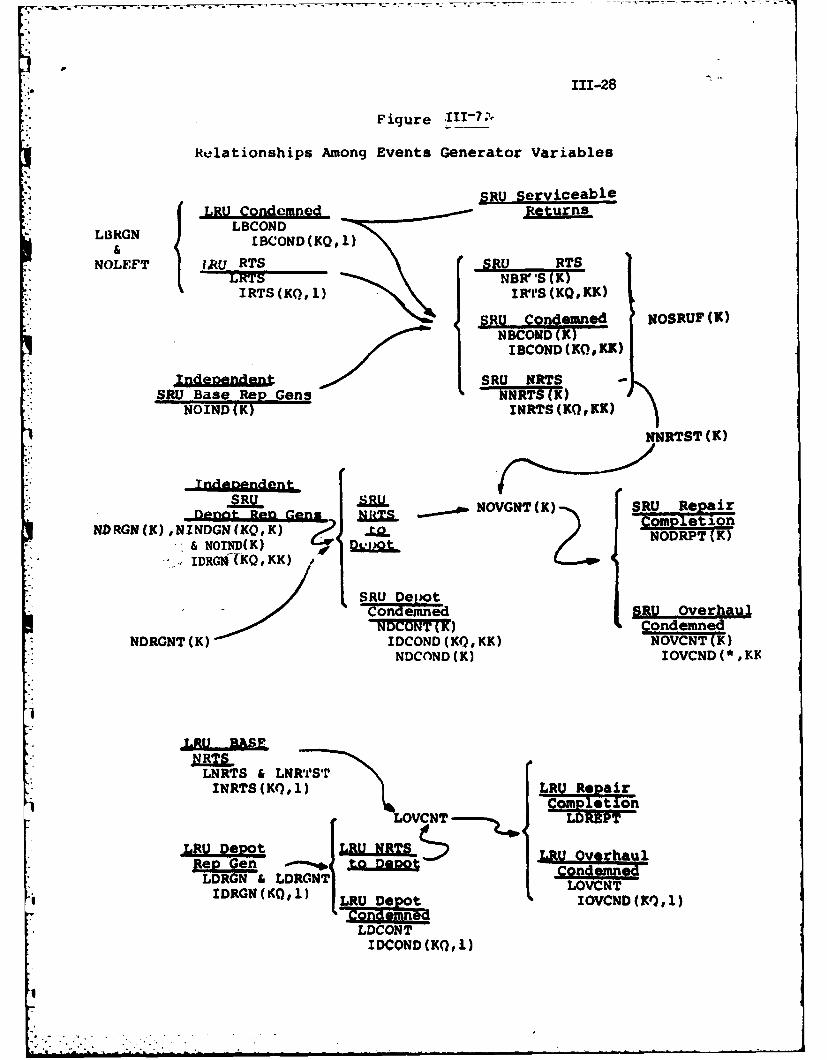
111-28
Figure .I-~
Relationships Among Events Generator Variables
SRU ServiceablegLRU Condemned tun
L13RGN I LBCOND& I BCON D(KO,l1)
NOLEFT IR~U RTS SU RTSLHTS NBRI'S (K)IRTS (3(), 1) IRLS(KQKK)
SRUColemnd, OSRLJF(KNBCONJDTK)
IBCOND ((O,3()
Inde~fpndent SRU NRTSSRU Base Rep Gens NNRTS (K)
NOIND(K) INRTS (3(0,3K)
NNRTST (K)
SRU suRpiflntr% r-eris N~T NOVGNT (K) cRUpRetin
NDRGN(K),NINDGN(KQK) 2 Q N oDRPeTion& NOIND(K) NODRPT (K
IDRGNf(KQ, KK)/
Condemni SRU OverhaulNDCONT!) Condemned
NDRGNT(K) IDCOND(KQ,KK) NOVCNT(K)NDCOND (K) IOVCND(* ,KI(
LNRTS £LNR's~rINRTS (3C, 1) ~LfRU eir
LOVCNT- ., LREP
LRU epo LRUNRTL SLRU OverhaulRep Gen la 22
LDRGN & LDRGNT LVNIDRGN(i(Qtl) IOVCND )l
LDCONTIDCOND (KQ, 1)
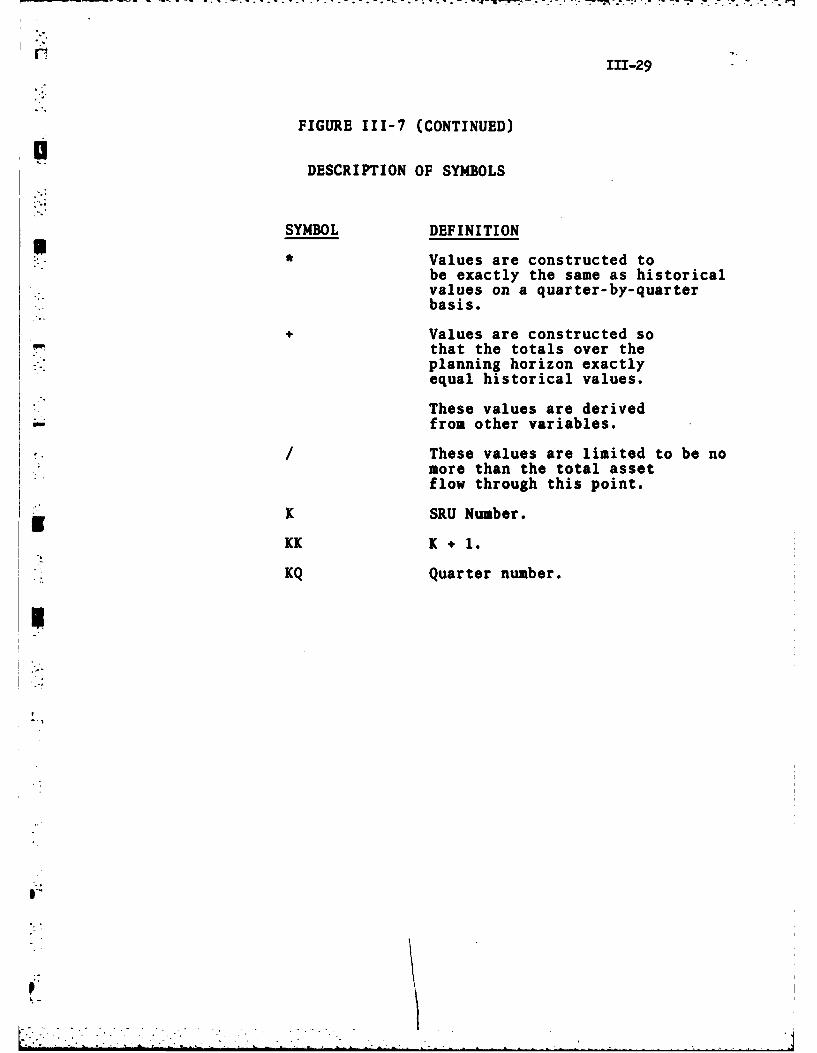
111-29
FIGURE 111-7 (CONTINUED)
DESCRIPTION OF SYMBOLS
SYMBOL DEFINITION
U Values are constructed to
be exactly the same as historicalvalues on a quarter-by-quarterbasis.
Values are constructed sothat the totals over theplanning horizon exactlyequal historical values.
These values are derived-from other variables.
/ These values are limited to be nomore than the total assetflow through this point.
K SRU Number.
KK K+ 1.
KQ Quarter number.
I.
.p-

* 111-30
An Example
If the Write Flag 1WT(l0) =1, all events which are entered or removed from
the Future Events List are printed. For example, Figure 111-8 illustrates a set of 34
events placed on the FEL during a test run of the Events Generator. As shown in
* the figure, these events are related to three individual LRU reparable generations.
These reparable generations are assigned job numbers of 1001, 1002, and 1003,
respectively. The first LRU reparable generation event (Event Code 14) Is
scheduled to occur at base 03 at time 4444. Consequently, the Stock Keeping Unit
number associated with this event is 4. (The reader should review the SKU
* numbering rules discussed in Chapter DI to verify this). Figure 111-8 shows the time,
event code, Stock Keeping Unit number, quantity, and "priority/job number" code
associated with each generated event. Consequently, the f irst line of this Figure
*shows that a Code 14 event is scheduled at time 4444 for SKU = 4. Further, this
line shows that only I asset is involved and that a reparable generation number
N30B = 1001 has been assigned to this reparable generation event. The second line
of Figure 111-8 shows that a requisition to replace the failed LRU is scheduled to
occur at time 4454. This requisition has an Event Code = 1, the SKU = 4, a
quantity of I unit is involved, and a priority code of 1 has been assigned indicating
* this is a high priority requisition.
The third line of Figure 111-7 shows that at time 4449 a type 16 event is
scheduled,, indicating that the LRU(SKU = 4) begins to wait for SRU components
associated with the LRU failure at that time. For this event, the quantity field
* equals 3, Indicating that the total number of SRU components required to complete
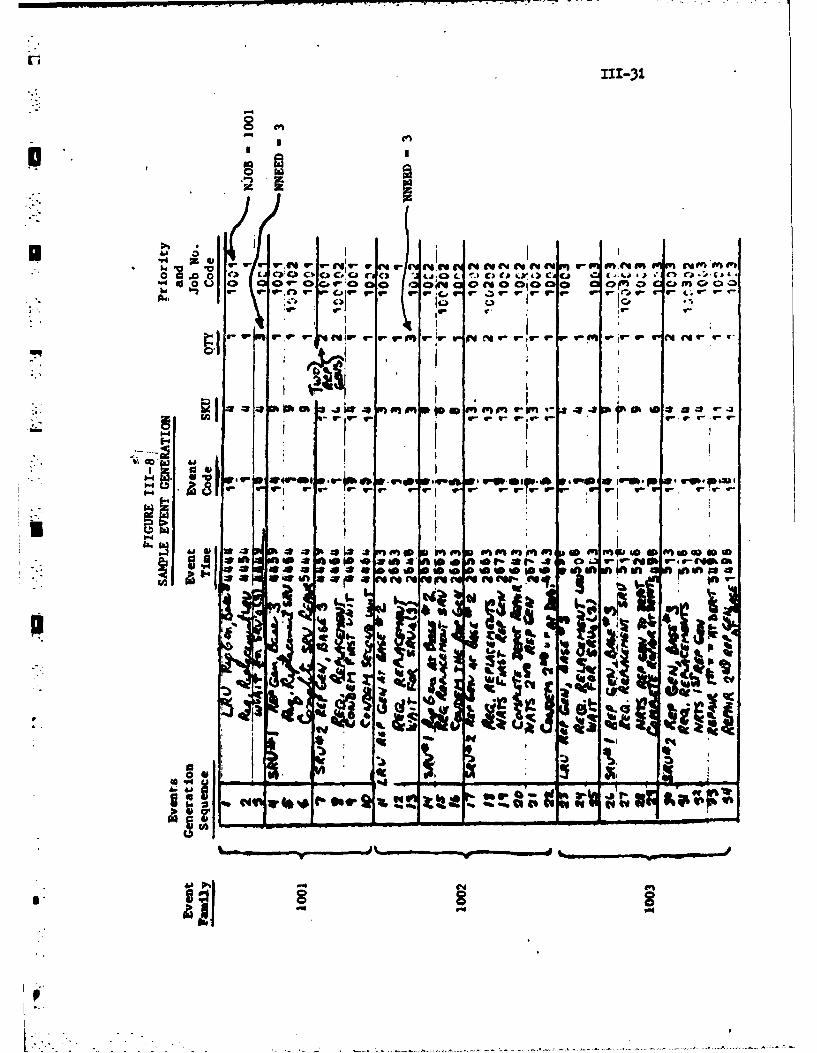
111-31
w IU . ' V .wi- .( 4
o m m m
I -s 0 090Cir PD 41 or40jao =I CM0
S, ~b q - U* Cj U 3 U I Ir W, 4r 6 U - V- a , U r- "p.., I
•4 ." i n m OD i ;no n " w9 i & 0I noc o
U--- -- u",r -- u. - - -- U-U U- U I -U - ( ' - U
a t v- -a- - m i f --
'" "-"U" " ". ... ., :-
I......q-&
sw 'I qJ~~ ft 9c C% 400P0W~ IW 04qae
0 %4
- lo

111-32
repair of the LRU is NNEED = 3. Since this Begin Wait event is associated with
LRU reparable generation 1001, the job number 1001 is shown in the right hand
-" column for this event.
Lines 4 through 10 of Figure IlI-S show the SRU events associated with LRU
reparable generation number 1001. Events 4 and 5 represent the generation of one
failed unit of SRU #1 at base 3, and an associated requisition for a serviceable
unit, respectively, while event 6 indicates that repair of this failed SRU will be
completed at time 5444. On the other hand, events 7 through 10 describe
exogenous events associated with reparable generations of SRU #2. Event 7
*records the generation of 2 failed units of SRU #2; the right hand column indicates
these failures were discovered during the repair of LRU job number 1001. Event 9
• :indicates a requisition for 2 serviceable units to replace the failed components will
reach base supply at time 4464. On the other hand, events 9 and 10 describe the
disposition of the failed assets of SRU #2. Event 9 indicates that the first unit of
SRU #2 to be removed from LRU reparable generation 1001 is to be condemned
(Event Code 15) at time 4464, and event 10 shows the second unit of SRU #2
removed from LRU job number 1001 is also condemned at base level. This second
condemnation is also scheduled to occur at time 4464. This completes the list of
exogenous events associated with LRU reparable generation number 1001.
Events 11 through 22 describe the events associated with the second LRU
reparable generation. This second reparable generation is assigned the job number
1002. As shown for event 11, this LRU reparable generation is scheduled to occur
at base number 2 at time 2643, while event 12 indicates that the requisition for a
serviceable replacement is scheduled to reach base supply at time 2653. In this
case, three replacement SRU units are needed to return LRU to 1002 a serviceable
I
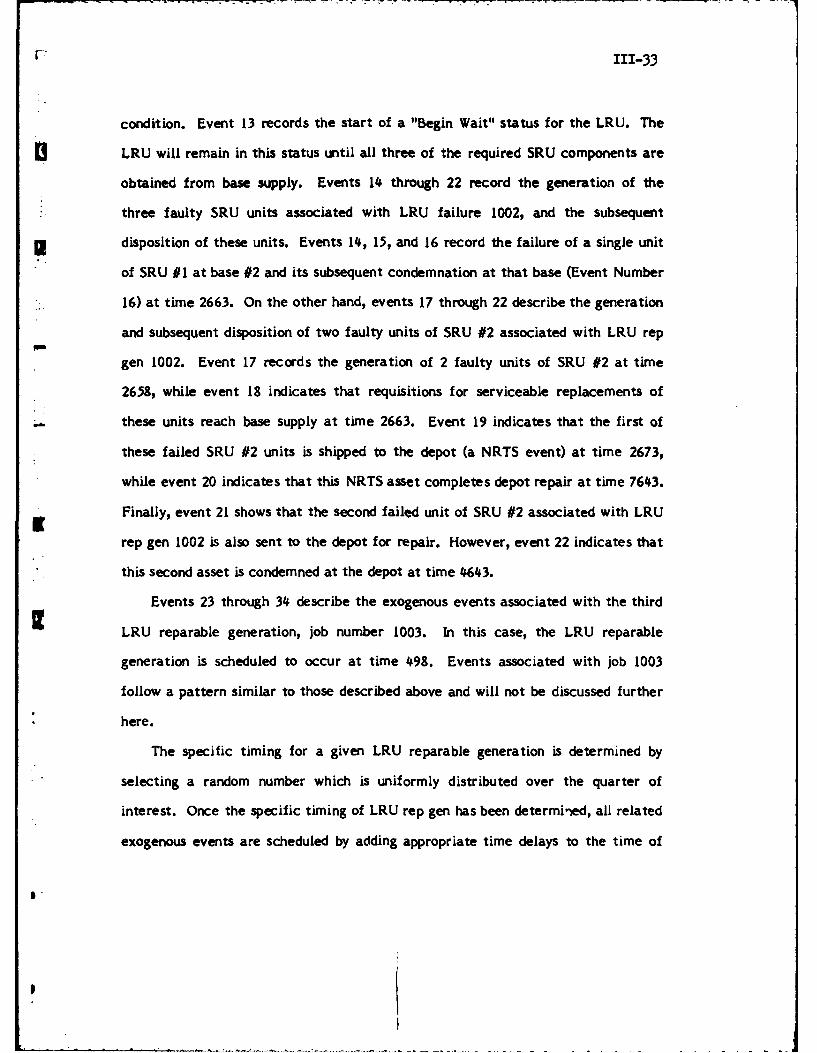
F: 111-33
condition. Event 13 records the start of a "Begin Wait" status for the LRU. The
U LRU will remain in this status until all three of the required SRU components are
obtained from base supply. Events 14 through 22 record the generation of the
three faulty SRU units associated with LRU failure 1002, and the subsequent
U disposition of these units. Events 14, 15, and 16 record the failure of a single unit
of SRU #1 at base #2 and its subsequent condemnation at that base (Event Number
16) at time 2663. On the other hand, events 17 through 22 describe the generation
and subsequent disposition of two faulty units of SRU #2 associated with LRU rep
gen 1002. Event 17 records the generation of 2 faulty units of SRU #2 at time
2658, while event 18 indicates that requisitions for serviceable replacements of
these units reach base supply at time 2663. Event 19 indicates that the first of
these failed SRU #2 units is shipped to the depot (a NRTS event) at time 2673,
while event 20 indicates that this NRTS asset completes depot repair at time 7643.
Finally, event 21 shows that the second failed unit of SRU #2 associated with LRU
rep gen 1002 is also sent to the depot for repair. However, event 22 indicates that
this second asset is condemned at the depot at time 4643.
Events 23 through 34 describe the exogenous events associated with the third
I LRU reparable generation, job number 1003. In this case, the LRU reparable
generation is scheduled to occur at time 498. Events associated with job 1003
follow a pattern similar to those described above and will not be discussed further
here.
The specific timing for a given LRU reparable generation is determined by
selecting a random number which is uniformly distributed over the quarter of
interest. Once the specific timing of LRU rep gen has been determin~ed, all related
exogenous events are scheduled by adding appropriate time delays to the time of
111-34
* LRU reparable generation. Individual exogenous events are scheduled (iLe., put on
the FEL) as soon as the need for the event is established, regardless of the specific
timing of the event. This explains why the first LRU reparable generation (job
* 1001) -- which is scheduled to occur at time 4444 - - is placed on the FEL before
LRU rep gen 1003, which is scheduled to generate at time 498. For output,
* however, all exogenous events must be ordered by ascending event times. This
sorting of events into time sequence is performed by subroutines ENTER and
REMOVE. When the need for a given event is determined, subroutine ENTER is
called, and the five data elements for the event is placed into its appropriate time
sequence on the Future Events List. At the end of each quarter, subroutine
* REMOVE is called to remove all of those events scheduled to occur within the
* given quarter.
If the Write Flag JWT(10) = 1, all events that are removed from the Future
Events List are printed. Figure 111-9 shows the list of events removed from the
* Future Events List subsequent to the scheduling activities described in Figure 11-8.
As shown in Figure 111-9, the first event to be removed from the FEL is the Event
Type 14 event associated with reparable generation 1003. This event is scheduled
to occur at time 498. Although this was the 23rd event to be generated (see Figure
111-8), it has the lowest scheduled clock time, and consequently is the first event to
be removed from the Future Events List. Similarly, the second event to be
removed from the FEL is the Begin Wait event (Event Type 16) associated with
* LRU reparable generation 1003. The reader may verify that the other elements
shown in Figure 111-9 correspond to the time-sorted values of Figure 111-8.
Each time an event is removed from the Future Events List, a corresponding
record is written to the Exogenous Event File (File 08). Consequently, at the end
of an Events Generator run, File 08 contains a list of exogenous events in ascending
time sequence.
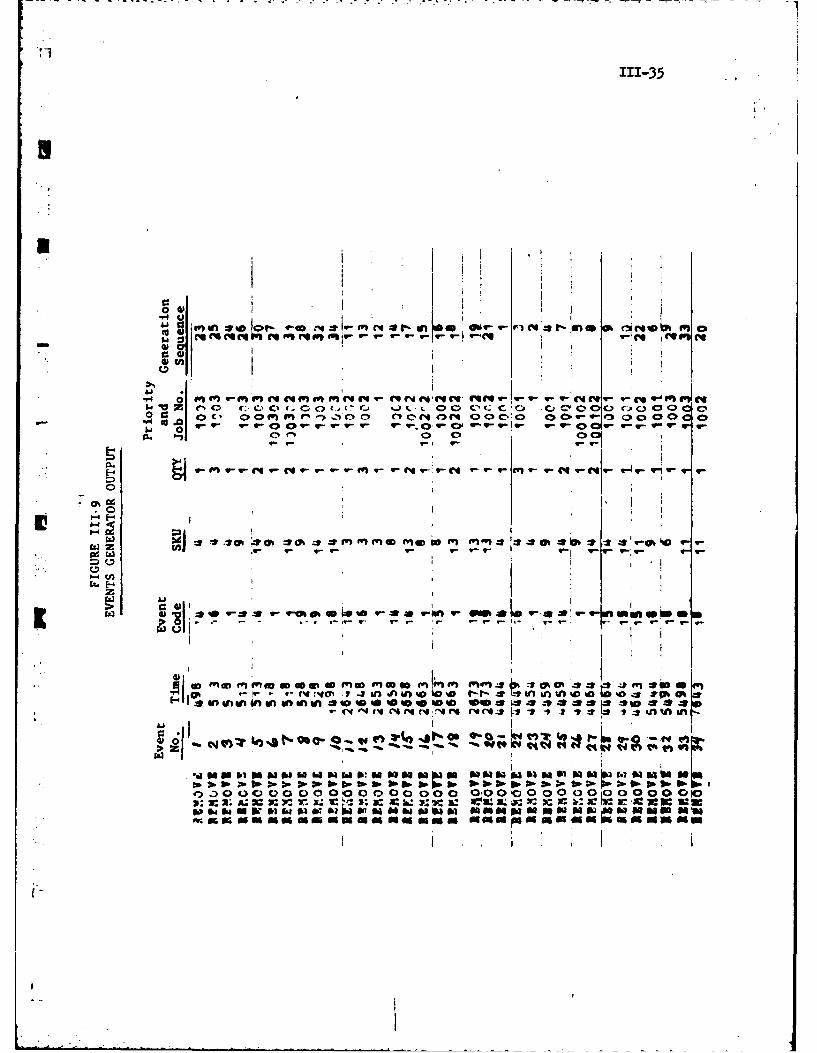
111-35
-,
a 4)
I q 'I in e n "I'qC4 r v'M c ,e e -w ,wcc ~ .0 W.9 W - e)O W.4*I9-mrW. W8ir
- ~I '-'W i6
* oA. O l
S V- MV -W- V - 00 - uP- W- g- M - g- -r- 0 -V 4 0 - c9-9-, -- g- 0~ W- 9-,4q- - g- w
1 i s v* a- - w6vo zra -rw- aL -e , 9- Go -
an fn 9n Vn 004 OD ('4 dD 60 f" 9- f" 40 40 In 9-9fn I- 9- M- ' h -:s' c- ( 4 'M *m a
'-9- 9-r-0(No r c" . -j n 4n 10 to n %n-9 -
.vi i)4 in in 9 9 9- 9- w~9 10t 0tIDN 0 WDA vz - s4 t -t
-1~~~4 % t I"
O.) 00 v00 00 0a00 0a 0 00 0000 0OOON 0.000 IOv:3.x.A r . r3;w -i c:k ~ c iv :xx3 p c .3-i 3 C 2WSO wI o P ) "s b11U bS h WU ~ U ~ 3 94o Uei A 0 4ia e"Qai sw"iaS E
Ow IG . a 8 84ms as0 11 d I60444 asa aa s aaae ma MUM

CHAPTER IV
The Levels Computation System
The Levels Computation System provides the capability to compute LRU and
* SRU stock levels using the METRIC, MOD-METRIC, VSL, and AFLCR 57-27 of
requirements computation methodologies, as well as variations of these methods.
This Chapter describes the major features of this system.
Stock Level Computations
The management of recoverable item inventories involves providing answers to
three basic questions. These are:
1. When will recoverable spares be needed?
2. How much is needed?
K3. Where should the spares be located?
The first two questions are Procurement issues, for they determine how much stock
* is needed to support a given system, and when this stock should be acquired and
brought into the Air Force supply system. The third question, on the other hand, is
a Distribution issue. The answer to this question determines at which locations the
currently available stock should be positioned.
Two distinct phases may be identified during the life cycle of a given item.
These are the Initial Provisioning Phase and the Replenishment Phase. The Initial
Provisioning Phase determines the number of assets which will be acquired during
thet initial buy of an asset, while the Replenishment Phase determines the number
of additional assets which are required to compensate for (a) condemnations
IV-2
resulting from operations, (b) unexpectedly high failure rates, or (c) increased
levels of program activity. Different computational methods may be used in each
of these phases to determine recoverable item spares requirements.
As noted earlier, we wish to evaluate the relative cost-effectiveness of
METRIC, MOD-METRIC, VSL, AFLCR 57-6, in variants of these methods in
managing Air Force Recoverable Items. Some of the interesting variations indlude
the use of one of these techniques for initial provisioning and a :.econd technique
* for decisions. For example, the Air Force currently uses MOD-METRIC for initial
provisioning of major end items, while VSL is used for replenishment calculations.
None of the above methods is currently used for distribution of Air Force
recoverable spares, but work is currently underway to develop a distribution system
based upon Sherbrooke's METRIC model.
To evaluate each of these alternate methods, we needed a set of computer
programs to perform the millions of required calculations. To obtain the required
computation capability, we modified the family of programs developed to imple-
ment the MOD-METRIC algorithm. By adjusting input data to these programs, and
by making minor changes in the programs themselves, it was possible to compute
stock levels using a 13 sets of inventory management rules that were of interest
in this study.
Table IV-l presents the relationship between the family of MOD-METRIC
computer programs and the specific computational methods of interest in this
study. As shown in the Table, with appropriate input data the MOD-METRIC
program ONEIND can be used to perform stock level computations according to the
assumptionis of the original METRIC mathematical model. Similarly, the program
TWOIND computes levels using Muckstadt's Mod-Metric mathematics. With

IV-3
Ltor-
U 2 )4)
z
0 U
LU 'UV W u
o 0
o n0; 0- 0: 0-8
I-K U 0 0 uLU u 0 w- c U
'....~~ 0 - u 4
R R R E 'L: .:
z 0 0 IJ LU £ Oo< P: E U 0o
0o CC 4 -
> < 00 .-
in 000 0LU 2 20 o
0-
2Z 00Lf(L
LUJ LU 0
0 LU
U < -jz < ZLUz Sl
ULU
<~ <
a. LI 0 U.22> <
0u
0u
0Ul

IV-4
slightly different manipulations of input data, Variable Safety Level (VSL) compu-
tations may be performed using the ONEIND program. Unfortunately, the family
of MOD-METRIC computer programs provided no way of computing requirements
using logic specified in AFLCR 57-27. However, Mr. Terry Mitchell of AFALD/
XRS previously implemented a CREATE Time Sharing Program to accomplished
this. We converted Mr. Mitchell's program to a subroutine to provide an AFLCR
57-27 computation capability in our Stock Levels Computation system.
To automate the levels computation process, it was convenient to assign codes
to identify each of the basic stock level computation methodologies. These codes
are shown on the left-hand side of Table N-I. As shown in the table, the code
IMETH is used to identify the computational methodology used for Initial Pro-
visioning Calculations, while the code KMETH is used to specify the computational
method for replenishment computations. Thus, IMETH = I indicates that the
ONEIND program is to be used in initial provisioning calculations in accordance
with METRIC math model assumptions, while KMETH = I indicates the same
calculation is to be performed during the replenishment phase. Similarly, IMETH =
2 indicates that the TWOIND program is to be used to represent MOD-METRIC
calculation methods in the initial provisioning phrase, while KMETH = 2 indicates
TWOIND is to be used for replenishment calculations.
The computation codes IMETH and KMETH specify the general computational
method to be used for Initial Provisioning and Replenishment Calculations,
repsectivey. However, three other pairs of codes are also used in RIME to
completely specify a stock level computation method. These additional codes are
defined in Tables IV-2 and IV-3.
4t
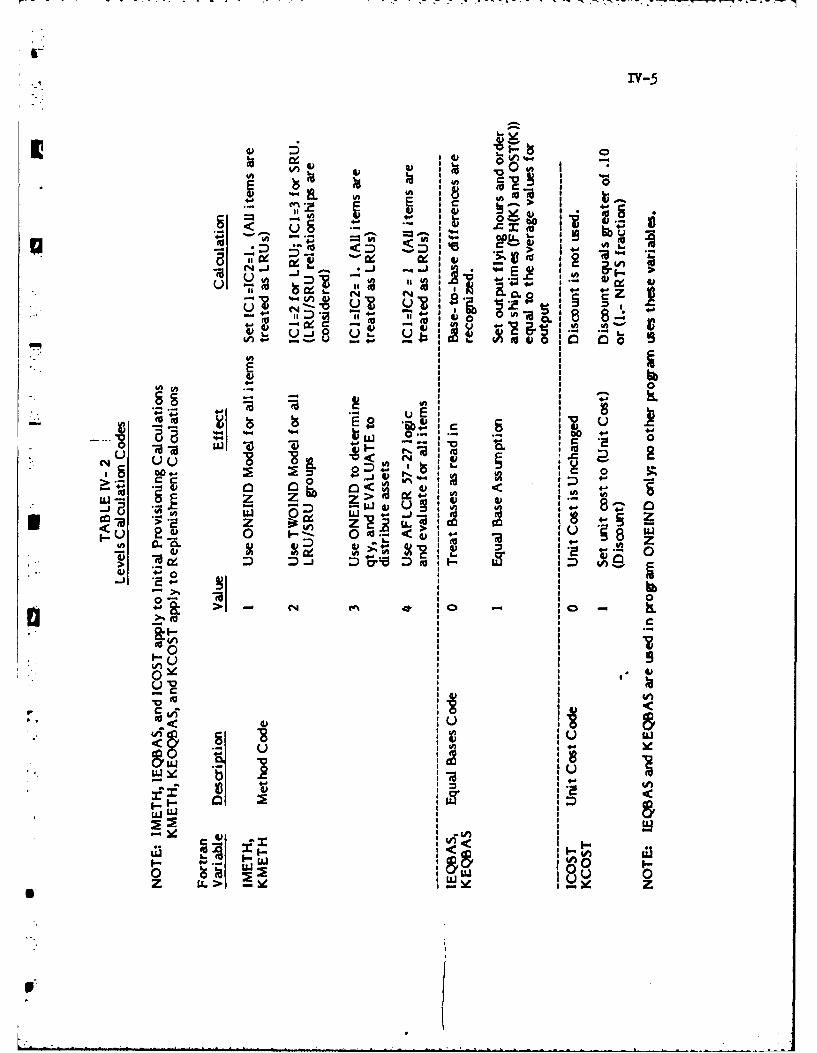
I-IV-5
4)4)~'
#A 00t
~vDuL bbj
Iv >
- v - o l
N _j 0
u lowC14 CA. 4
ct, -V IV'
.- 4 0 4) 0 .0
-It
lo~
-u - -6 l.. 1, : 0 1& 0a -a t I MI8 I
I Iw
0 0 % M gItDn
Ii vi Z
I U,
u~ 0 0 < :3 AAI- 0IL'I
Z4 0 z. U

IV-6
IA )
I. C>
4)
"o o
4-- 4
I' U)4L9w8 '1 > I
~ V
UU4
o 0 4a4-AEI
o
0 4W
a) 0*C 4 )
I~ Mf
a aU4e
IW
z

IV-?
[3 Table IV-2 defines two additional codes defining required manipulations of
input data to the ONEIND and TWOIND programs. The codes IEQBAS and KEQBAS
define whether or not base-to-base differences are to be recognized during stock
levels computations. If the code equals 0, base-to-base differences are recog-
nized. On the other hand, if the code equals I all bases are assumed to be equal.
* In the latter case, the stock level computations are performed by replacing input
values for flying hour programs and order and ship times for each base by the
*respective average values for all bases combined. This latter data modification is
required to represent the Equal Base Assuimption employed in the VSL computation.
- The codes ICOST and KCOST specify whether or not the cost discount
computation utilized in VSL is to be employed. If this code equals zero, stock
level computations are performed without any modification to the D041 unit cost.
On the other hand, if the code equals 1, the D041 unit cost is multiplied by aUdiscount factor which equals the greater of .10 or (I.-NRTS fraction). Code ICOST
applies to initial provisioning predictions, while the code KCOST specifies the
replenishment calculation method.
ITable IV-3 specifies four variables used in establishing upper and lower bounds
upon computed stock levels. The variables IMINSK and BOMINI are employed to
specify bounds on initial provisioning calculations, while KMINSK and BOMINK
specify values to be used in replenishment decisions. If the code IMINSK equals
zero, no upper or lower bounds are used in the initial provisioning calculations. On
the other hand, if the Bound code IMINSK is 1, all stock levels are computed with a
lower bound equal to the expected number of assets in the repair/resupply pipeline,
and an upper bound specified by Upper Bound Variable BOMINI. Specific numerical
values for upper bounds used in this study and their interpretation are given in
I pl lm im ll-'- m l b " -" - .. ' . ..
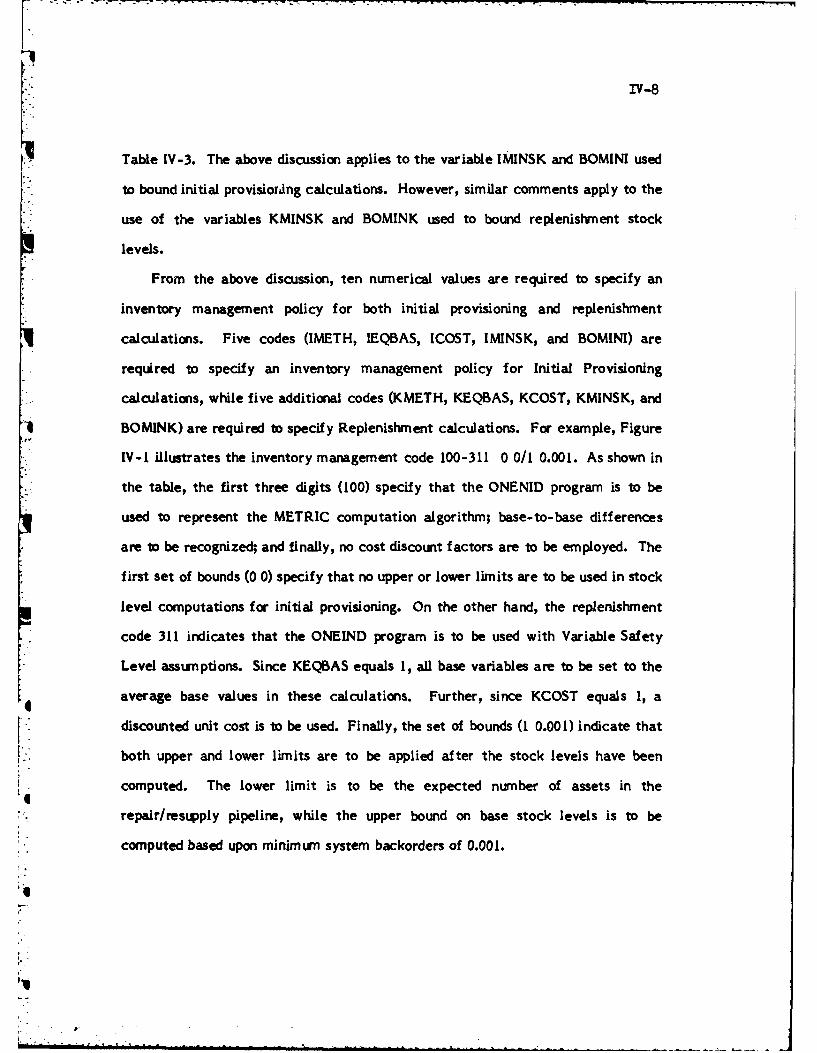
IV-8
Table IV-3. The above discussion applies to the variable IMINSK and BOMINI used
to bound initial provisioring calculations. However, similar comments apply to the
use of the variables KMINSK and BOMINK used to bound replenishment stock
levels.
From the above discussion, ten numerical values are required to specify an
inventory management policy for both initial provisioning and replenishment
calculations. Five codes (IMETH, IEQBAS, ICOST, IMINSK, and BOMINI) are
required to specify an inventory management policy for Initial Provisioning
calculations, while five additional codes (KMETH, KEQBAS, KCOST, KMINSK, and
1BOMINK) are required to specify Replenishment calculations. For example, Figure
;* IV-l illustrates the inventory management code 100-311 0 0/1 0.001. As shown in
* the table, the first three digits (100) specify that the ONENID program is to be
used to represent the METRIC computation algorithm; base-to-base differences
are to be recognized; and finally, no cost discount factors are to be employed. The
first set of bounds (0 0) specify that no upper or lower limits are to be used in stock
level computations for initial provisioning. On the other hand, the replenishment
code 311 indicates that the ONEIND program is to be used with Variable Safety
Level assumptions. Since KEQBAS equals 1, all base variables are to be set to the
average base values in these calculations. Further, since KCOST equals 1, a
discounted unit cost is to be used. Finally, the set of bounds (1 0.001) indicate that
both upper and lower limits are to be applied after the stock levels have been
computed. The lower limit is to be the expected number of assets in theI*. repair/resupply pipeline, while the upper bound on base stock levels is to be
* .computed based upon minimum system backorders of 0.001.
,
'1
D"
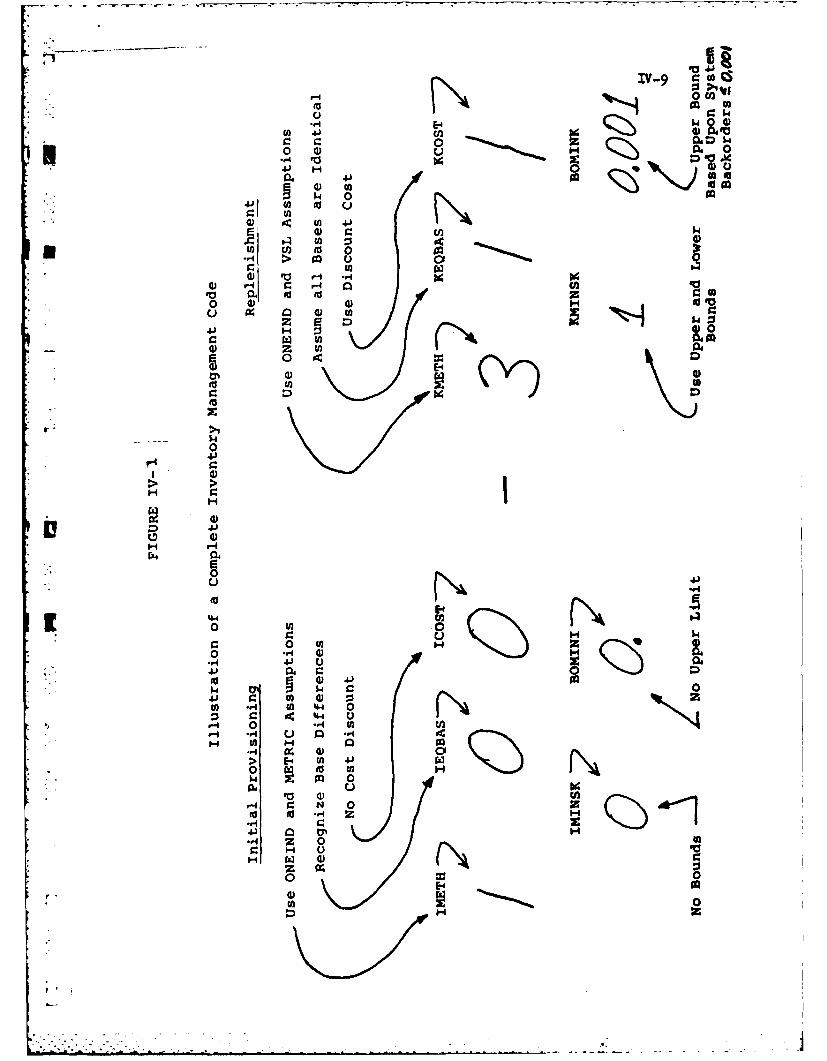
IV-9 'o:3X>r-4 0
E-4 H )
41 tnt
to M .
-~ 0 (A
$1 4 0oC'
0 ( )U ~ ~ t 0 oHSd
to go
01H
0
4.4
0 (A
04))
044 Q
04
0 .,1oo 4 U I -4 )
4.) 4)
>) t E- J 0 J0o go4 U)~
5- 4 m~- 0u hd
41 a> E-' toto
00
0 EU *.E-4
0
IV1
'v'j
SPNDMS
To simplify the submission of RIME evaluation runs, the program SPNDMS was
written to automate the preparation of input data and Job Control Language
statements. Thirteen specific combinations of inventory management codes are
recorded in a table within the SPNDMS program. The codes included in this table
are presented in Table IV-4. In utilizing SPNDMS, the program asks which of these
13 rules are to be used for inventory calculations. It then obtains the required
parameters from the internal table, and generates the JCL required to implement
the calculations. SPNDMS is discussed further in Chapter V; in the following
sections, we discuss the job streams generated by SPNDMS.
4
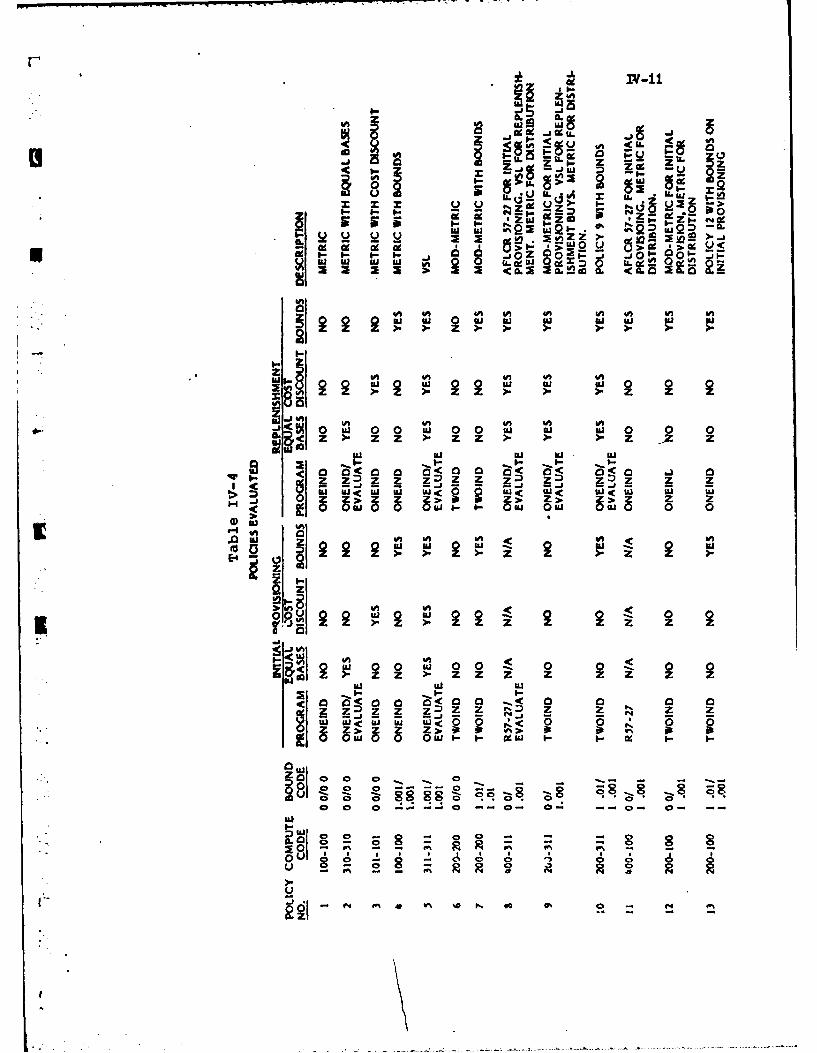
i- 99 --,0 in It 0
-x z- -. - - 0:
"S' Oz ",o- -j H "- 0 5 a-
El, zl z El4 xV
.6- m >
<00<00 o<0 J< 0<0 . 0
~ ~ ~ << .< 3
c x0t 00 w0 0 w 0u u 0 0 0< z Z Z Z Z z Z Z z
a < <o < I.- Nj- z z z z zz:
W a. W a < S
Z Z 0 Z ~ > ->-:1
0 0 &u 0- uo s 0<---0 - 0- 0- 0- 0- 0 -0
lu
'A % ~ ~ C 0

IV-12
Alternate Job Streams in the Levels Computation System
All Levels System job streams utilize a combination of MOD-METRIC
programs and other programs specifically written for the RIME system. The
MOD-METRIC programs ONEIND, TWOIND, GETBSO, and EVALUATE are essen-
tially identifical to the AFLCR 57-6 MOD-METRIC programs with minor modifica-
tions required for the incorporation of upper and lower bounds. The programs
SAVDAT, GETDAT, LEVLDP and SORT were specifically written for RIME. They
provide for the storage and sorting of stock levels data produced by the MOD-
METRIC routines.
Figure IV-2 illustrates the set of alternate job streams which might be utilized
in runs of the Levels Computation System. The program DMSGNI is a key element
in this system for it generates the input records required by all the MOD-METRIC
computer programs. The program DMSGNI first obtains LRU and SRU descriptive
data from the Master Data Set, and writes output records required as input to
MOD-METRIC computational programs. Record layouts for data produced by
*DMSGNI are presented in Section III of Appendix A.
As shown in Figure IV-2, records used to drive Initial Provisioning calculations
are written to file 12, while Replenishment calculation input records are written to
; file R2. Branches on the left-hand side of Figure IV-2 correspond to Initial4Provision Calculations, while those on the right-hand side of the figure correspond
to Replenishment. The Calculation Codes IMETH and KMETH specify which of
the specific branches will be followed in a given RIME run.
As shown in Table IV-2, setting Code IMETH = I indicates that the ONEIND
computer program is to be used to simulate the computation of stock levels
r4
1

Initial Replenlishmfent
IiilProvisioning CalculationsCalculations
SAAA
1* two *ErSb
Fiur IVS The CoptainSytm
Leve\
x.v-14
according to the METRIC mathematical model. As shown in Figure IV-2, setting
IMETH = I specifies that the job stream on the far left side of Figure IV-2 is to be
used for Initial Provisioning Calculations. The first step in this process is the use
of the program ONEIND to compute a set of stock levels for up to 20 different Buy
Support Objectives (BSOs). Details of these calculations are printed to File PI,
while the stock levels and associated buy suport objectives computed by ONEIND
are output to File 13. File 13 serves as input to the MOD-METRIC program
GETBSO. The GETBSO program reads specified buy support objectives from File
05, and scans the set of buy support objectives and their associated stock levels on
, input file 13. In performing this scan, the routine GETBSO attempts to find a set of
stock levels with a buy support objective closest to the desired BSO. Once the
required stock levels are found, GETBSO writes these levels to the output file 16.
Suppose that the Computation Code for replenishment calculations KMETH is
also set to 1. As shown in Figure IV-2, this indicates that the MOD-METRIC
program ONEIND is also to be used to compute stock levels for Replenishment
calculations, while GETBSO is to be used to determine the specific stock levels
associated with each desired buy support objectives. These levels are then output
to File R6.
As shown in the figure, replenishment stock levels are always written to File
R6. At the conclusion of a Levels Computation System run, Initial Provisioning
: stock levels on File 16 and Replenishment stock levels on File R6 are merged,
sorted, and the resulting records are output to the "Levels File" A3. This file is
one of major inputs to the RIME simulation model.
Before leaving this section, let us briefly discuss each of the other job streams
illustrated in Figure IV-2. If the computation Code IMETH is set to 2, the
1
Iv-15
MOD-METRIC program TWOIND is used to compute stock levels according to
Muskstadt's multi-indenture, multi-echelon mathematical model. This program is
similar to the ONEIND program in that it computes stock levels for a range of buy
support objectives. The set of levels computed by TWOIND is then written to the
output file 13. In turn, file 13 serves as input to the program GETBSO. GETBSO
then reads the desired buy support objectives from Logical Unit 05 and scans the
levels file 13 to find a set of levels whose buy support objective is closest to the
desired BSO. The resulting levels are output to File 16. Essentially the same
calculations are performed when the replenishment Computation Code KMETH = 2.
I
K
AD-A12l. 981 RIME. THE RECOVERABLE ITEM MANAGEMENT EVALUATOR VOLUME 2/2MODEL DESCRIPTION(U) DECISION SYSTEMS DAYTON OH
WI S DENNY MRAY 88 TR-88-81 F3368878-C-8524UNCLASSIFIED F/G 9/2 NLEhhhhhhhhhhiII Ihflhhh/hENDlmIIIIIIIIII
I IhhhhhhhhhhI|I lflfllflfllll
1.0.
E1.25 01.41.6
MICROCOPY RESOLUTION TEST CHARTWA tWnAhlu OF STA Oi- 1943 -A
iv-16
As shown in Table IV-2, setting the Computation Code IMETH equal to 3 indicates
that the Variable Safety Level (VSL) calculation is to be used in Initial Provisioning
to determine the total number of assets to be procured, while the METRIC math
model is to be used to determine the distribution of these assets. As shown in
Figure IV-2, implementation of this computation requires several job steps. First,
program SAVDAT is called. This program stores the MODMETRIC item identification
and job control cards on the random file MI. This file is used later in the job stream
as Input to the program GETDAT. After SAVSAT stores this informantion, the
program ONEIND is used to compute stock levels. When IMETH =3, ONEIND performs
these computations assuming that all bases are equal. Stock levels computed
by ONEIND are output to file 13, which provides input to the program GETBSO.
In turn, GETBSO determines the set of stock levels associated with the desired
BSO's, and outputs these stock levels to file 14.
The program GETDAT reads the sets of stock level from file 14, and obtains
unit cost, NRTS rate, failure rate, and other item decription data from the random
file Mi. GETDAT then uses this information to construct a set of data cards for
input to the MODMETRIC program EVALUATE. In doing this, GETDAT computes
the total number of assets associated with each desired buy support objectivt by
summing the stock levels for the depot and for each base. It then outputs a
MODMETRIC "delivery schedule" card with the computed asset total in the first
quarter deliveries field. The program EVALUATE then reads this total number of
assets, and determines the optimum distribution of these assets among the depot and
using bases. In performing its calculation, EVALUATE recognizes base-to-base
LRU/SRU relationships.
Finally, stock levels computed by EVALUATE are output to File 16. If the
Replenishunent Computation Code KMETH = 3, calculations are similar to those for
IMETH = 3, but In this case the computed stock levels are written to the file R6.
• . . . .
A final possibility Is that the Initial Provisioning Computation Code IMETH is
set to #, indicating that logic specified in AFLCR 57-27 is to be used for Initial
Provisioning calculations. When this option is specified, program DMSGNI calls
subroutine INTPRO to compute the total number of assets associated with AFLCR
*l 57-27 logic. This total is recorded in the part number identification field of the
MODMETRIC delivery schedule card is also output to file 12. Later in the job
* stream, program EVALUATE is used to determine distribution of the total number
of AFLCR 57-27 assets among each of the using bases. Stock levels computed by
*. EVALUATE are output to file 14.
The RIME Simiulation Model expects to find separate sets of stock levels for
each Buy Support Objective to be evaluated. However, a desired buy support
objective is not a factor in the AFLCR 37-27 computation logic, and AFLCR 57-27
logic always computes the same requirement regardless of the specified BSO.
Consequently, the program LEVLDP is used to create duplicates of the AFLCR 57-
. 27 stock levels output from EVALUAT'. To do this. LEVLDP reads the BSO file,
and counts the number of BSO records on this file. It then creates a like numver of
p :duplicates of each stock level record on file 14, and writes all of these levels
records to file 16. Stock levels on file 14 are then merged and sorted with the
replenishment levels on file R6.
Note: Setting KMETH =4 is not a legal option in the Levels Computations System.
That is, AFLCR 37-27 logic cannot be used in preforming replenishment calcula-
tions.
i-.
. * - . . .
Chapter V
Using the Recoverable Item Management Evaluator
Introduction
U To exercise the Recoverable Item Management Evaluator (RIME), the user
must perform three major steps. These are:
1. Construct a Master Data Set containing required information on all LRUs
* ' and SRUs to be included in the evaluation calculations.
2. Utilize the Events Generator to create an exogenous event file to drive the
Simulation Model.
3. Utilize the program SPNDMS.O to generate stock levels according to
* specified criteria, and to initiate a simulation run.
Let us now consider each of these steps In more detail.
Generatinm the Master Data Set
To utilize the Recoverable Item Management Evaluator the user must provide
- Item description and historical reparable generation data for each LRU and SRU to
be evaluated. Required formats for this information are documented in Appendix
A of this report. Definitions of associated FORTRAN input variables used In the
RIME system are defined as part of the record layouts presented in Appendix A.
These data elements are designed to closely correspond to data elements in the
DOl Recoverable Consumption Item Requirements System.
Uuir the Events Generator
r..........k
V-2
The file EVTGN.A contains 3ob Control Language (3CL) required to exercise
the Events Generator. A listing of EVTGN.A is shown in Figure V-i. The
"SELECT" cards are used to select compiled object programs for each of the
routines used by the Events Generator for use in the current run. Lines 210, 220,
and 225 specify input parameters which control the EVTGN.A run.
Table V-I defines the Input parameters required as the first two lines of Input
to the EVTGN.A run. The first record specifies the set of LRU/SRU groups to be
selected from the Master Data Set during this run, while the variable NBASES
specifies the number of operating bases to be assumed during the events generation
process. The variables INQTR and NREPL specify the number of quarters in the
simulation planning horizon and the number of replications of the events generation
process to be performed, respectively. For example, line 210 of Figure V-I
specifies that LRU/SRU groups I thru 3 are to be included in the current EVTGN.A
run. In performing the events generation process, line 210 specifies that 6 bases
are to be assumed, that the events generation process is to utilize a 16-quarter
planning horizon and two replications of the events generation process are to be
performed for each LRU/SRU group.
The second input line of EVTGN.A specifies a set of "Write" flags which
specify output options to be employed during the current simulation run. These
flags are defined In Table 111-3. Finally, line 223 of Figure V-I specifies an ASCII
input file which contains base order and ship time information, as well as data
describing flying hour programs by base for each period to be simulated. Table V-2
defines the variables which are specified by this file, while Table V-3 illustrates
the structure of this file. As shown in Table V-2, the first line of this file specifies
the number of bases, NBASES, for which data Is provided in this file. In addition,
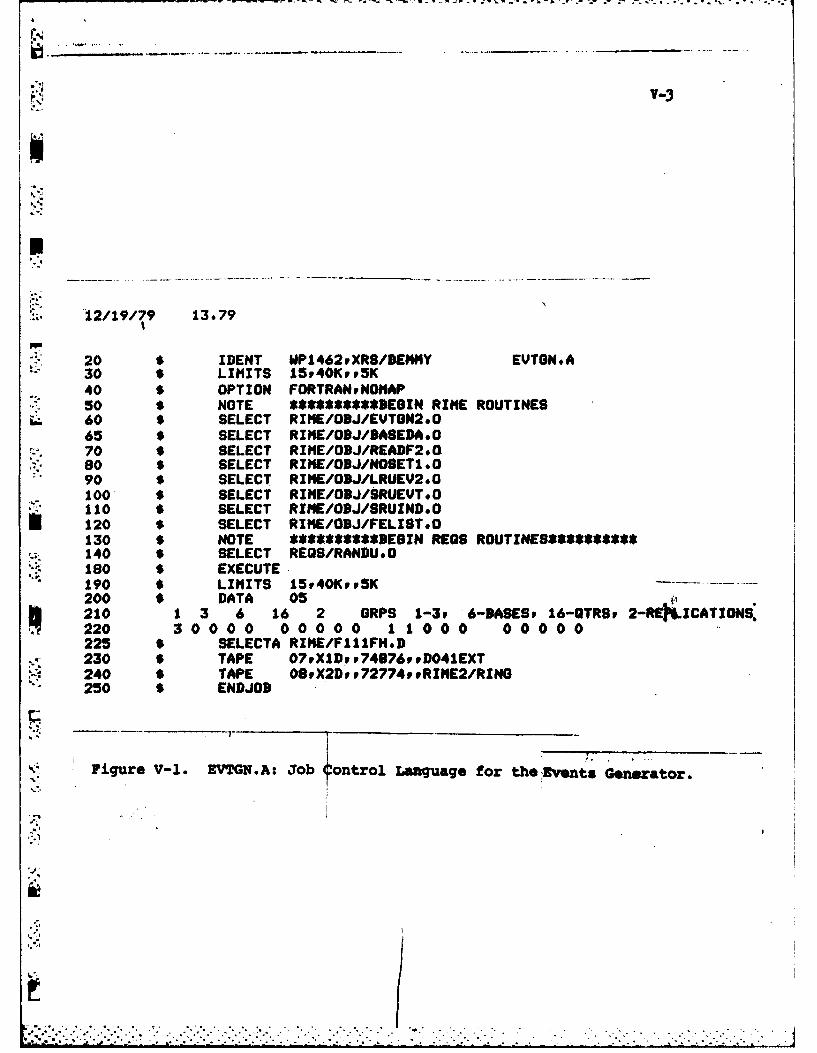
V..3
I
12/19/79 13.79
20 $ IDENT MP1462tXRS/DEMNY EVTGN.A30 $ LIMITS 15,40Kvp5K40 $ OPTION FORTRANPNOlAP50 $ NOTE ********$*EGIN RIME ROUTINES60 S SELECT RINE/OBJ/EVTGN2.O65 S SELECT RINE/O9J/3ASEDA.O70 $ SELECT RINE/OBJ/READF2.Gso $ SELECT RIME/O9J/NOSETI.090 S SELECT RIME/ODJ/LRUEV2.0100 $ SELECT RIME/OBJ/SRUEUT.O110 $ SELECT RIME/ODJ/SRUIND.O120 $ SELECT RIME/ODJ/FELIST.O130 $ NOTE *********DESIN REOS ROUTINES********8140 S SELECT REGS/RANDU.O180 $ EXECUTE.190 $ LIMITS 15p40KpvSK200 $ DATA 05210 1 3 6 16 2 ORPS 1-3, 6-BASESP 16-GTRSP 2-REKLICATIONi.2203 0 000 0 0 0 0 0 1 1 000 0 0 0 0 0225 $ SELECTA RIME/FlllFH.D230 $ TAPE 07PXIDPP74876.PDO41EXT240 $ TAPE OvX2Dpu72774uuRINE2/RING250 $ ENDJOB
Figure V-1. EVTGN.A: Job %ontrol Laaguage for thelEvents Generator.
,d
° °/.,. ... . .. .. . . .. ... . ... .. . . . . . - . .. ...
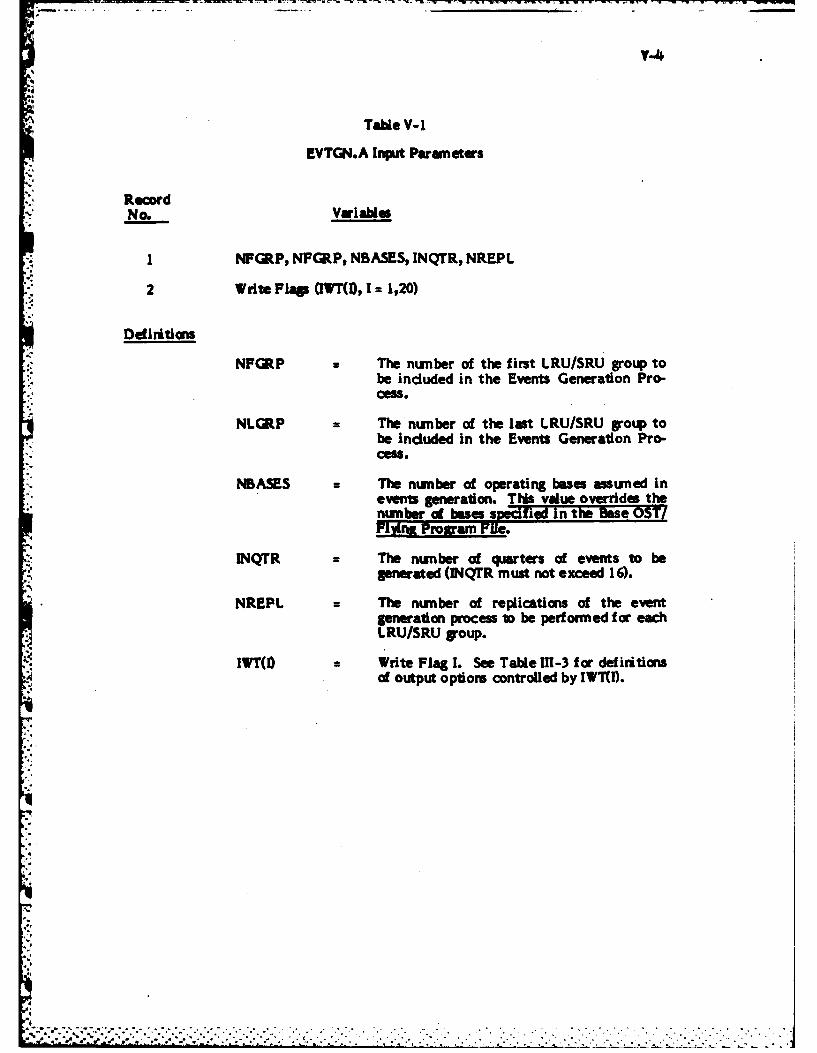
Table V-I
EVTGN.A Input Parameters
RecordNo. Variable
I NFGRP, NFGRP, NBASES, INQTR, NREPL
2 Write Flag (WT), I= 1,20)
Defiritlons
NFGRP z The number of the first LRU/SRU group tobe included in the Events Generation Pro-
NLCRP The number of the last LRU/SRU group tobe Included in the Events Generation Pro-e".
"BASES = The number of operating bases assumed inevents generation. This value overrides thenumber of bases sprdfie l I te as OTFlvrl Pl.. r-arn File.
INQTR The number of quarters of events to begenerated (INQTR must not exceed 16).
NREPL = The number of replications of the eventgeneration process iD be performed for eachLRU/SRU group.
IWT(1) = Write Flag I. See Table 111-3 for defiritionsof output options controlled by IWT(I).
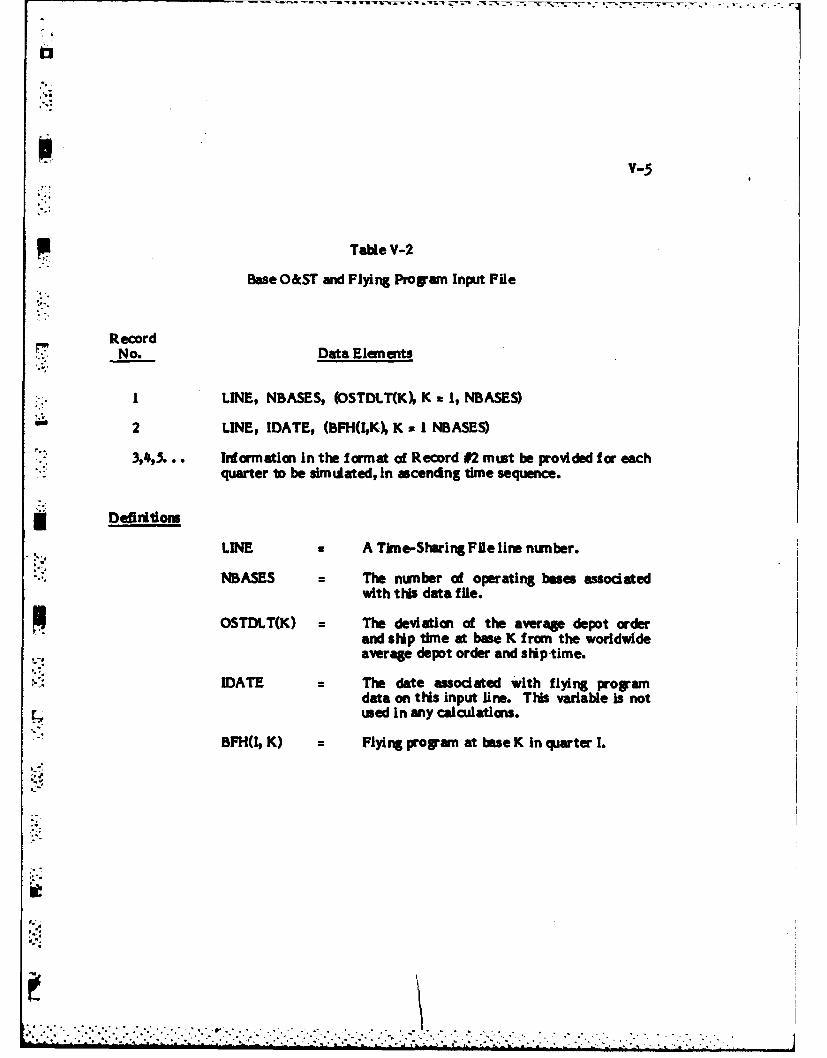
v-s
Table V-2
Base O&ST and Flying Program Input File
RecordNo. Data Elements
I LINE, NBASES, (OSTDLT(K), K I, NBASES)
2 LINE, IDATE, (BFH(IK), K = 1 NBASES)
394,.. Irormation in the format of Record #2 must be provided for each. quarter to be simiated, In ascending time sequence.
*Definition
LINE C A Tkne-Shmring File line nunber.
.. ASES = The nunber of operating bases assocatedwith this data file.
OSTDLT(K) = The deviation ci the average depot orderand ship time at base K from the worldwideaverage depot order and sliptime.
IDATE The date associated with flying programdata on this input line. This variable Is notused In any calculations.
BFH(I, K) Flying program at base K In quarter I.
i.-2

v-6
Table V-3.
A Sample Base Data Input File.
100 6 -6 -6 9 9 -2 -4*110 741 2908 2908 2140 2140 5261 5755
120 742 2618 2618 2063 2063 4763 5841130 751 2816 2816 2273 2273 4769 5234140 752 2618 2618 2197 2197 5412 6151150. 753 2179 2179 2259 2259 5501 6440160 754 1135 1135 2048 2048 4626 4907170 761 2465 2465 2097 2097 4853 6276180 762 690 690 1311 1311 4906 4622190 763 566 566 1598 1598 4488 6185200 764 1736 1736 1489 1489 4158 5282210 771 2320 2320 2356 2356 4826 5462220 772 2804 2804 2325 2325 5526 4313230 773 1785 1785 2700 2700 5431 4546240 774 1828 1928 2207 2207 5863 5060250 781 1619 1619 1351 1351 2748 3280
*260 792 1739 1738 1543 1543 3621 3146270 783 2514 2514 2470 2470 5292 4534
*280 794 2230 2230 2329 2329 4773 4281290 791 1820 1820 1963 1963 4789 4549300 792 2367 2367 2216 2216 5622 5874310 793 2400 2400 2500 2500 5700- 4900320 794 2400 2400 2500 2500 5500 5000330 901 2350 2350 2600 2600 4700 4800

V-7
the first line of this file also specifies values for computing the Order and Ship
Time (O&ST) for an indlvidual base once the worldwide average OST value is
known. The remaining lines in the file specify the flying program activity by base
for each of the quarters to be simulated.
In Figure V-I, line 230 specifies the data tape which contains the Master Data
Set, while line 240 specifies the data tape that is to contain the Exogenous Event
File. This latter tape then becomes the major input element to the RIME
Simulation Model.
Using SPNDMS.O to Generate RIME Simulation Runs
To exercise the Levels Computation System and to initiate an associated
simulation run, it Is necessary to:
1. Provide appropriate input parameters to the program DMSGNI which
specify the specific Initial Provisioning and Replenishment calculations to be
*' performed, and
2. Create an appropriate set of 3ob Control Language commands to bring the
L .required levels of computation programs Into use, and to control Input/output files
which interconnect these programs. This is a substantial task, since several
hundred 3CL cards may be required for certain types of stock levels computations.
Fortunately, many of the required input parameters remain constant in performing
* .a given study of proposed inventory management methods. This was true in our
case. Consequently, we developed the program SPNDMS to automate a major
portion of the run specification task.
The Levels Computation System Input data gmnerator DMSGNI requires two
major types of Input data. One of thee the Master Data Set discussed above.
T,",".","," , ,''.,..,..,.,.. .... .' ."-. . . ." . . " - -". ..,. . , ' ,. ' . : , ., _ -, ..-.. -, , . ,.. : ''.". ,.•.... ,....-, '_ .' -: . . . -. .. . .,.. - ,.-. -. ...- .... :_ . . ._ .

The other major input Is a set of parameters which specify the specific stock
leveling calculations to be performed in a given run. Table V-4 defines these
required input parameters. The FORTRAN variable names used in program
DMSGNI are shown in Table V-4. All of these values are read using a Free-Field
input format.
As shown in Table V-4, the first two input lines to DMSGNI specify the
Computation Codes needed to define required Initial Provisioning and Replenish-
ment calculations. The third input record specifies the set of LRU/SRU groups to
be included in the current run, the number of quarters for which levels are to be
computed, and a value of the variable NDHIS. The fourth input line specifies the
set of Write Flags to be employed in the current run. Definitions of these DMSGNI
Write Flags are presented in Table V-3.
Input lines S thru 7 specify values to be used in MOD-METRIC computer
program control cards. These parameters are defined in AFLCR 57-6, and will not
be discussed further here. Finally, the remaining input cards to DMSGN I specify
the base Order and Ship Time calculation variables and flying hour programs by
base to be used for the current computation run. These latter inputs are the same
as those defined in Table V-2.
(Fortunately, it is not necessary for the user to specify these data cards each
time he wishes to exercise the RIME system. Rather, the program SPNDMS may
be used to automate most of this process.
Usina SPNDMS
The compiled program SPNDMS.O is a FORTRAN Time-Sharing program
which automates many of the steps required In the preparation of Input data and
associated 3CL statement required in the use of the RIMh model. Figure V-2
- .5 ' , ,. . : . . ., ' .. . . .. . , . - , , ., . ., -. - . . . . . " .

V-9
UL
4'
LUc
Iiiid
0U 0 L
4 .I- 4n..
Vd R
> 0. U 0 z~
SZ u
-i z
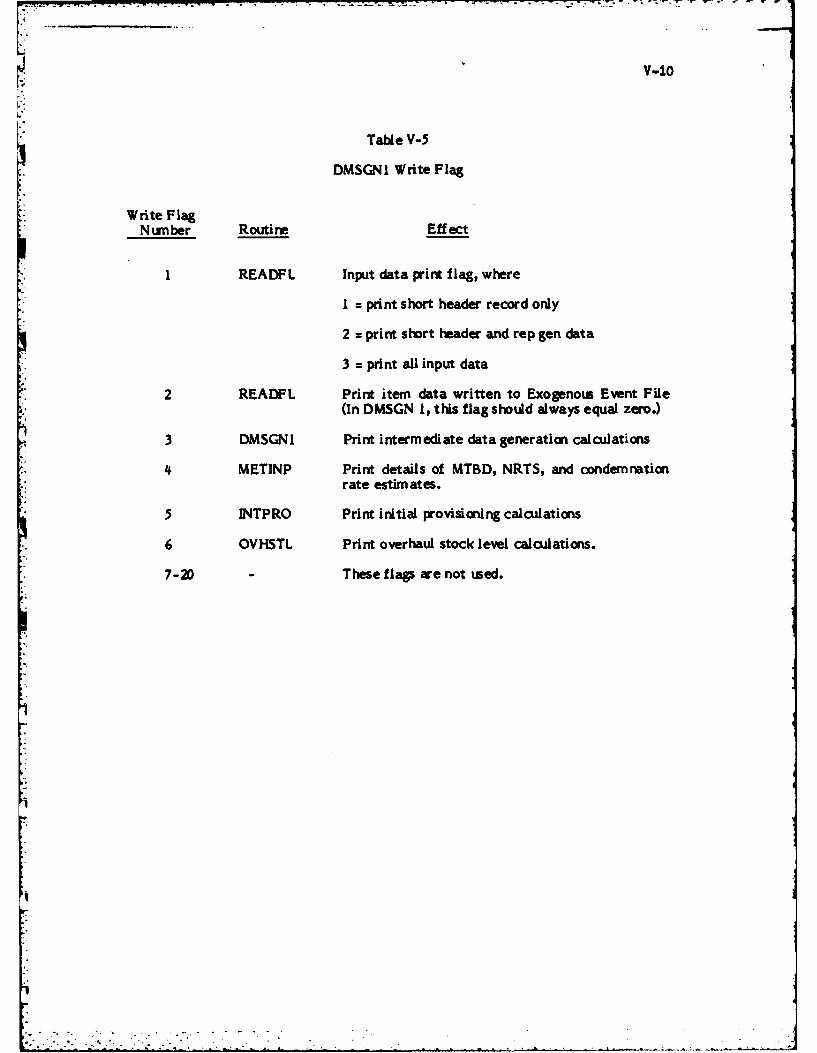
V-10
Table V-5
DMSGN I Write Flag
Write FlagNutxber Routine Eff ect
I READFL Input data print flag, where
I = print short header record only
2 = print short header and rep gen data
3 = print all input data
2 READFL Print item data written to Exogenous Event File(In DMSGN Ip this flag should always equal zero.)
3 DMSGN1 Print intermediate data generation calculations
4 METINP Print details of MTBD, NRTS, and condemnationrate estimates.
5INTPRO Print initial provisioning calculations
6 OVHSTL Print overhaul stock level calculations.
7-2D These flags arenot used.

illustrates the use of this program for initiating a particular RIME simulation run.
As may be seen in the Figure, SPNDMS.O asks the reader several questions.
Answers to Question #1 define where outputs from the current run are to be
directed and the size of the runs to be performed. Questions #2 and #3 define the
3CL control card which identifies the Exogenous Event File to be used as input to
the Simulation Model. Question #4 asks for the values of NFGRP, NLGRP, INQTR,
and NDHIS to be provided as input to DMSGNI. It also asks for the maximum
amount of CPU time to be used in the current run specified in hundredths of
CPU-hours. Finally, Question #5 asks for the formula number to be evaluated in
S: the current RIME run. Values for the 13 Computation Codes required to specify
Initial Provisioning and Replenishment calculations defined in Table IV-4 arerecorded in a table within the SPNDMS program. After the user specifies the
required formula number, SPNDMSdoes a table lookup to determine the values for
the variables IMETH, IEQBAS, and so on, and SPNDMS then prints these values at
"i the user's terminal. Next, SPNDMS accesses the specific files of 3CL statements
required to implement the desired calculations. Once the set of required input
parameters in 3ob Control Language statements have been accumulated, SPNDMS
submits the entire set of 3CL records to the CREATE batch processing system.
The CREATE control number assigned to the batch job is then printed at the user's
terminal. In Figure V-2, the job number g363t was assigned.
In Question #6, SPNDMS asks if any more evaluation runs are to be launched
for the current set of LRU/SRU groups. If the user answers yes, program logic
returns to Question #5. Otherwise, SPNDMS asks Question #7. Question #7 asks if
r-:. the user wishes to continue generating RIME evaluation runs, or if he wishes to
terminate the current session with SPNDMS. If the user wishes to continue,
program logic returns to Question #1. Oth rwlse, SPNDMS terminates its run.
. .. . . . . . . . . .- *., .. . . . . . . . . * . .*

V-12
RUN~ SF'NLIMS*0AC' PONCI? SIMUJLATE? MORE CORE? (I-YS NOQu ton*
IS - s: IPE:0,x9D,7003,,EOGF -Question *OK FOR.EXUGFIL.E? (Y:=YES)
-NINP~LJ EXOGFIL.E CONTROL. CARD *-q"estion *3
-* ~CARD WAS READ) AS---- -
-====:T'APE;o7,X9D, v72774, vRIME2IS CARD OK?(Y OR N)
NFORPP NLGRPV INQ*TRPNDHISt CPU-LIMIT ~ g~to= 1 3 16 0 15 .
4-Question #5IDENTr?
IDENT IMETH IELOhAS ICOST KMETH KEQBAS IKCOST3 1 0 1 1 0.
IMINSK BOMINI KMINSK BOMINK0 00 0 0.
SNUI~i' # g365t *--Question #6CONTINUE?(Y OR NT)
DO ANO1'HER GROIJPT(Y OR N) uetfl7
=I.
-~~~~~~~~~~~ -- ---------------- --- - - - __ _ __ __ __ _
*NOTE: See Table V-6 for further description of
these questions.
Figure , An Illustration of the Use of SPNDMe.o to
Initiate a RIME Evaluation Run.

V-13
Table V-6
SPNDMS.O Input Parameters
Question# (1 =Yes, 0 No)
AC? Is the output for this job to be directed to station code AC? If-~ not, output is printed at the CREATE Central Site.
: PUNCH? Are the computed stock levels to be output on punched cards?
SIMULATE? Is the RIME Simulation Model to be used (I = YES). Otherwise,the run terminates after all stock levels have been computed.
• MORE CORE? Does the current run Involve more than 40 Stock Keeping Unitsfor the largest LRU/SRU family to be considered? If so, morecore is needed.
Question #4
[: NFGRP The number of first LRU/SRU goup to be included in":' calculation.
NLGRP = The number of the last LRUSRU group.
INQTR = The number of quarters In Planning Horizon
NDHIS = The number of quarters of input data to be consideredas past history at simulation time zero. For most RIMEapplications, set NDHIS = 0.
F:: CPU-LIIIT = 3ob time limit for the current run in hundredtt of
CPU- hours.
U+
I
V-14i
RIME Simulation Model Input/Output Files
Figure V-3 illustrates the input and output files utilized by the RIME
Simulation Model, and the associated Logical Unit Designators. As shown in the
figure, Logical Units 05, 07, and 09 provide the inputs to the Simulation Model,
while logical units 06, 15, 16, and 43 are output files. Logical unit I1I is a work file
used for the temporary storage of stock level data.
Logical Unit 05 specifies run parameters and output options to be used in the
control of the current simulation run. Logical Unit 07 is associated with the
Exogenous Event File, while Logical Unit 09 is associated with the set of Stock
Levels to be evaluated duiring the current simulation run. The Stock Levels File is
a sequencial file. To simpify processing, this file is read in sequential order by
subroutine INITM I at the beginning of a RIME run, and stock levels read from this
file are recorded on the random file 11. Stock levels are then obtained as needed
by subroutine LEVEL from file I11 during the simulation run. This greatly simplifies
the processing of mutiple replication evaluation runs.
The Simulation Model provides outputs to report codes 06, 15, and 16, and also
provides punched card results to logical unit 43. The Summary and Short-Form
Reports are printed to file -06, while files 15 and 16 are used to print 8- and
16-quarter totals of selected statistics. The information printed on files 15 and 16
is also punched on logical unit #3 if the flag ITWRT = 2.
Details of the Exogenous Event File and the Stock Levels File have been
discussed in previous sections, and will not be considered further here. In the
following sections, we discuss the features of the Run Parameter file, and of the
output options available to users of the RIME Simulation Model.

V-15
ExogenousEventFile
Run ParametersStc,Wite FlassLvlBase OST and FlProgram Data
07 0
Figue V-. Rie Siulato\~ odelInpu and otpu File.
* . . . . ... . . . .

v-16
Run Parameters File
The Run Parameters File (Logical Unit 05) specifies variables which control
the size of the current simulation run, and the output products to be produced as a
result of this run. Table V-7 defines the variables specified in this file, while
Figure V-4 illustrates a "print-bac" of Run Parameter data produced in a sample
Simulation Model run.
As shown in Table V-7, the first set of Run Parameters are specified in the
* header record of the Exogenous Event File (Logical Unit 07). This record specifies
the set of LRU groups to be included in the current run, and the number of bases,
the length of the planniing horizon and the number of replications for which
exogenous events are provided. This record is created automatically during the
Events Generator run. The remaining Run Parameters are provided in f ree-field
format on Logical Unit 03. The first record on Logical Unit 05 specifies four
Output Controls, while the second record specifies values for 7 "debug" flags. The
Debug flags are useful in the development of new programs for the Simulation
Model. Finally, the third input record specifies the size of the simulation run to be
performed. Definitions of these parameters are presented in Table V-4.
RIME Output Products
As discussed in Chapter H, all RIME performance statistics have three
different indices. For example, the Performance Statistic IREQT(I, 3, K) records
the total number of requisitions received f rom customers of the supply organiza-
tion. The index I denotes the quarter in which the requisition was received. The
index 3 records the type of measure associated with this statistic, where 3 = 1
denotes the number of distinct federal stoc numbers or distinct actions associated

V-17
NTable V-7
Simulation Model Control Parameters
U
(Cl) Exogenous Event File Characteristics
Note: The following variables are read from the header record of the
Exogenous Event File (EEF) on Logical Unit 07.
NFGRP = The number of the first LRU group on the EEF.
NLGRP = The number of the last LRU group on the EEF.
NBASES = The number of bases assumed in the EEF.
* NNQTR = The number of quarters of events on the EEF.
NREPL = The number of replications performed for each LRU group.
(C2) Output Controls... (Note. I = YES)
ITWRT The item "write" flag. If ITWRT I1 or 2, ubroutine TRSLT
called to punch ten major statistics for each replication of eachL .- LRU group. If ITWRT a 1, cummulative values throgh quearrs
Sand INQTR, respectively, am punched. Nf ITRT u29 the
statistics are punched for each of te INQTh quarrs simu-
lated.
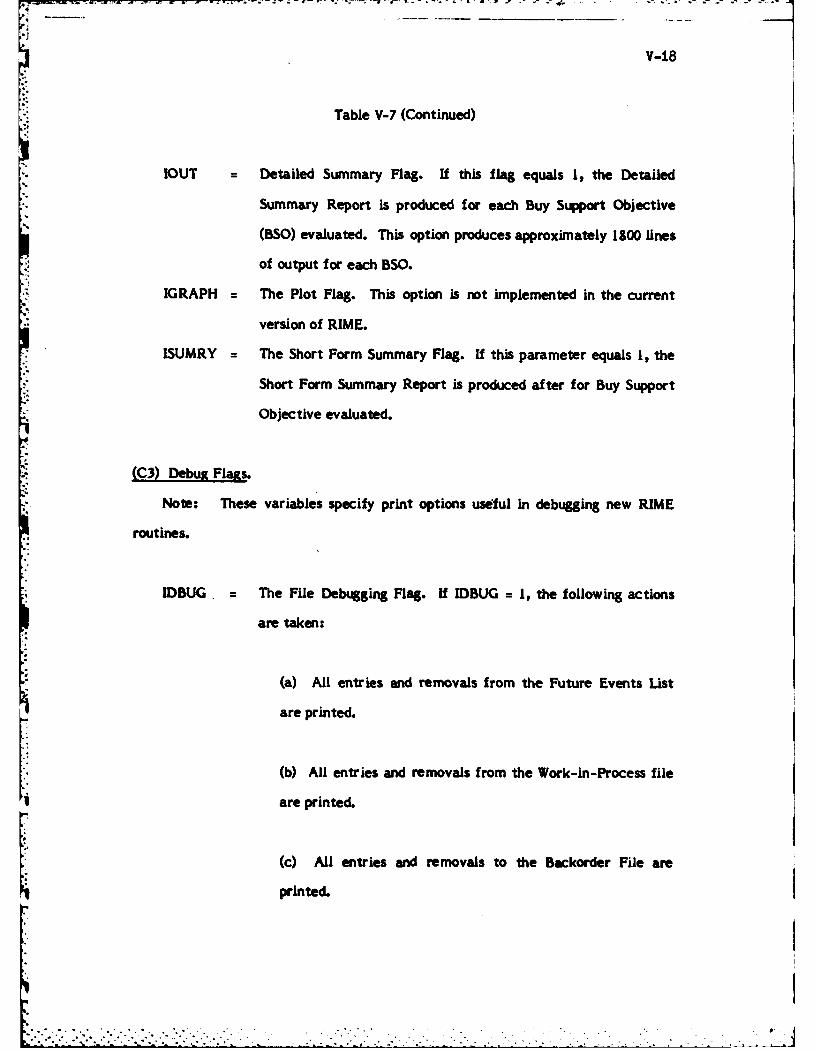
~V-18
Table V-7 (Continued)
IOUT = Detailed Summary Flag. If this flag equals 1, the Detailed
Summary Report is produced for each Buy Support Objective
(BSO) evaluated. This option produces approximately 1800 lines
of output for each BSO.
IGRAPH = The Plot Flag. This option is not implemented in the current
version of RIME.
ISUMRY The Short Form Summary Flag. If this parameter equals 1, the
Short Form Summary Report is produced after for Buy Support
Objective evaluated.
(C3) Debug Flags.
Note: These variables specify print options useful in debugging new RIME
routines.
IDBUG The File Debugging Flag. If IDBUG = 1, the following actions
are taken:
(a) All entries and removals from the Future Events List
are printed.
(b) All entries and removals from the Work-in-Process file
are printed.
c) All entries and removals to the Backorder File are
printed.
..................
..... . .. ....
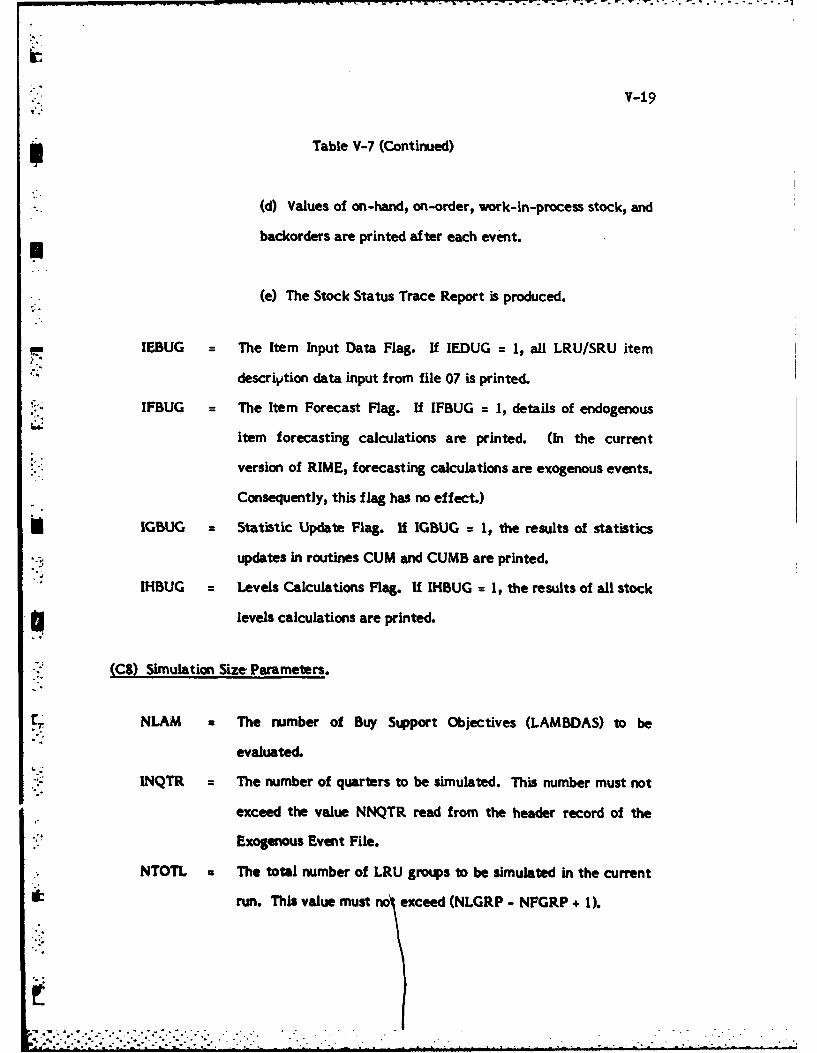
V-19
Table V-7 (Continued)
(d) Values of on-hand, on-order, work-in-process stock, and
backorders are printed after each event.
(e) The Stock Status Trace Report is produced.
IEBUG = The Item Input Data Flag. If IEDUG = 1, all LRU/SRU item
: = description data input from file 07 is printed.
IFBUG = The Item Forecast Flag. If IFBUG = I, details of endogenous
item forecasting calculations are printed. (In the current
version of RIME, forecasting calculations are exogenous events.
Consequently, this flag has no effect.)
* IGBUG = Statistic Update Flag. If IGBUG = 1, the results of statistics
updates in routines CUM and CUMB are printed.
IHBUG = Levels Calculations Flag. If IHBUG = 1, the results of all stock
levels calculations are printed.
(C9) Simulation Size Parameters.
NLAM = The number of Buy Support Objectives (LAMBDAS) to be
evaluated.
INQTR = The number of quarters to be simulated. This number must not
exceed the value NNQTR read from the header record of the
Exogenous Event File.
NTOTL The total number of LRU groups to be simulated in the current
d: run. This value must no exceed (NLGRP - NFGRP + 1).
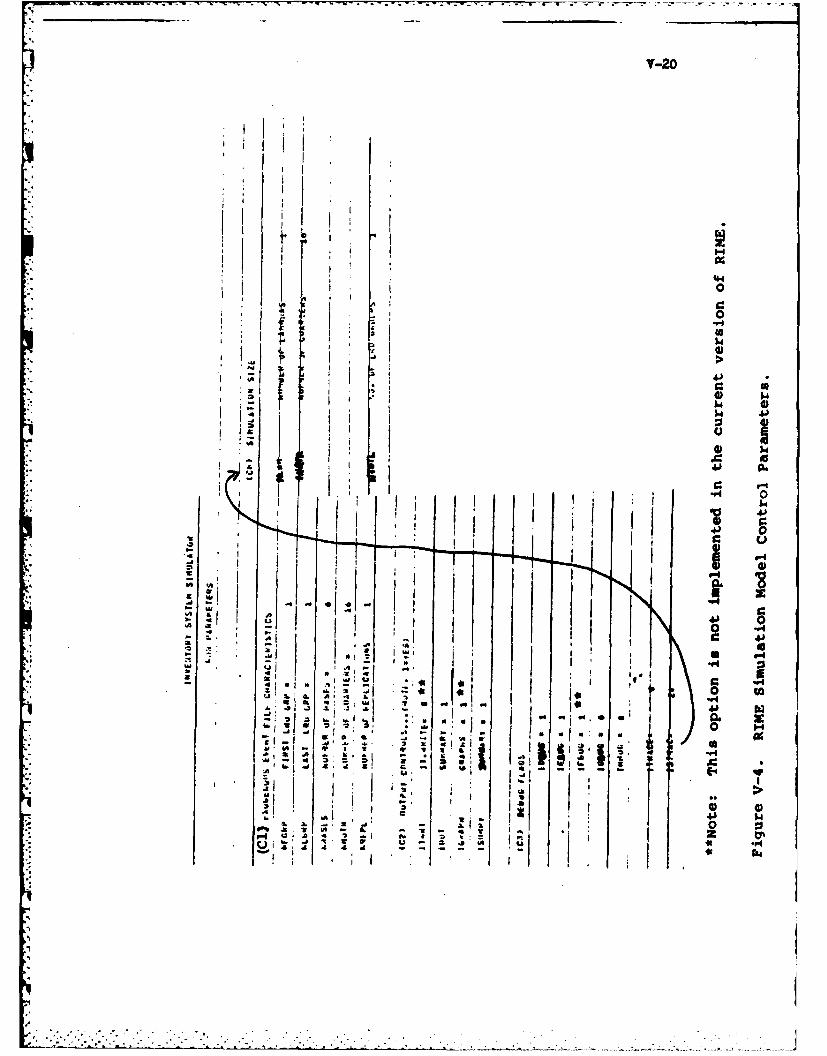
V-20
C: I
'141
r4J
l z CAC
* U ,
*64
.41
0. Iior rA'-
a a9
V-21
*! with the current event, 3 = 2 denotes the number of units associated with the
event, and 3 = 3 denotes the dollar value of all units associated with the event.
Finally, the index K denotes the aggregation category for the statistic. Values of
K and their meaning are as follows:
Aggregation
Index
, *Value DefinitionI LRU at base level
2 SRU at base level
3 LRU at the depot
- 4 SRU at the depot
5SRU at the Aircraft Overhaul Facility
6 SRU at the Aircraft Overhaul Facility
For example, suppose that a requisition for 12 units of a $10 item is received
at a base during the fourth quarter of the simulation. In this case, the period index
Is 1 4. Consequently, the RIME statistic IREQT(4, 1, 1) is increased by I to
record this order action. Since 12 units were ordered, the statistic IREQT(4, 2, 1)
is increased by 12, and the statistic IREQT(#, 3, 1) is Increased by 120 to record the
dollar value of the requisition.
As discussed in Chapter 1, RIME collects 32 different statistics, for 16
a" distinct quarters. To print all of the statistics collected In a single replication of
the RIME model results in a very large volume of output.
J -

"~..-22
Detailed Summary Report. If the input parameter IOUT = I, RIME prints the
Detailed Summary Report to Logical Unit 06. This report prints the values of
every RIME performance statistic, an output of approximately 1100 lines for each
Buy Support Objective evaluated. Figures V-5 thru V-8 illustrate the format of
this report. As shown in Figure V-5 thru V-7, three pages of output are produced
for each value of the aggregation index K. Figure V-5 illustrates the first of these
three pages for an LRU at a base facility (aggregation index K = 1). This page
displays the receipts, returns, shipments, ordering actions, and requisitions asso-
ciated with LRUs at base level during the simulation run. As shown in the figure,
J4 these statistics are given by quarter, and results are shown both in terms of number
of actions/FSNs involved, the number of units associated with these actions, and
the dollar values of these units.
Figure V-6 illustrates the second page of the three page output associated
with the aggregation index K = 1. This page records the number of expediting,
rationing, disposal, and termination actions that were recorded in the simulation
run, as well as the number of reparable generations, condemnation, and NRTS
actions perfromed. The final columns of this page record the number of repairs
completed within each quarter, the number of assets that in a work-in-process
status at the end of each quarter, and the total number of days that assets spent
waiting for parts.
Figure V-7 illustrates the third page of statistics output for the aggregation
index K = 1. This page records the supply performance observed durirg the
simulation run. Values for end of period backorders, backorder days, inventory
weeks, and observed fill rates by priority dass are displayed on this page of the
report.
- .".
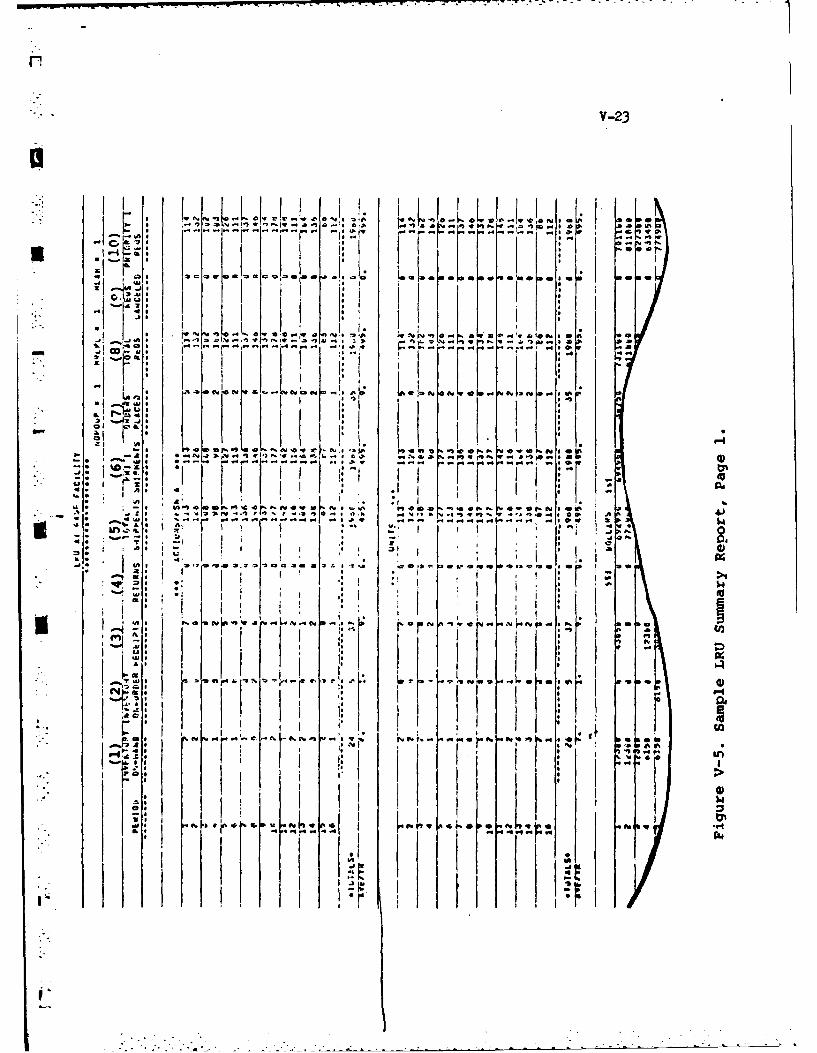
V-23
SRII rr rL 'r IsII *
. ..
. . . .- . . . .-I!I S k !I IL I
;i~ ~ . ...... F rI)ftft i
. .
"- I!I ,, I I I
i!0' is.I! I
.. ,,N S *IfS41-: I V :0 .'I a . N0 .f
° I ' : -,
r , A S I w 3L "
Iii S I I " >
ii ,
• °,
t I I C I'C.4-
N ~ ~ 9 VUS.~ 114j~q N..iv.i. a Af% e ft
A- .
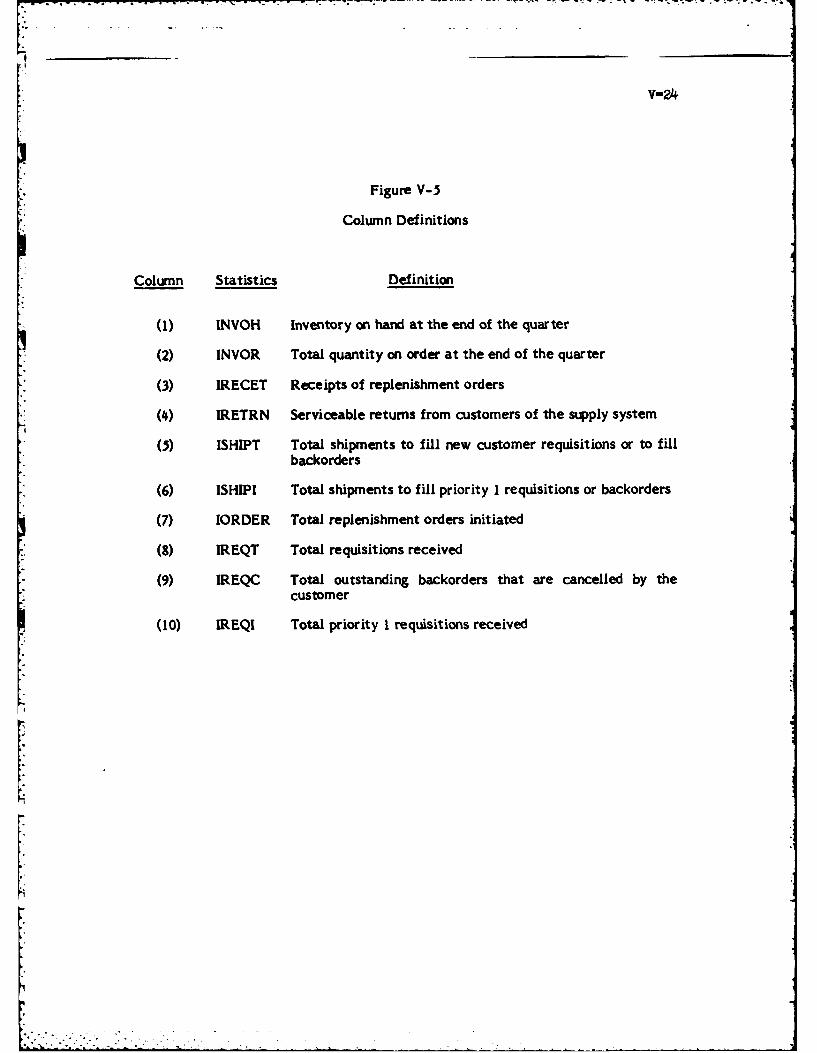
Figure V-5
Column Definitions
Column Statistics Definition
(1) INVOH Inventory on hand at the end of the quarter
(2) INVOR Total quantity on order at the end of the quarter
(3) IRECET Receipts of replenishment orders
(4) IRETRN Serviceable returns from customers of the supply system
(5) ISHIPT Total shipments to fill new customer requisitions or to fillbackorders
(6) ISHIPI Total shipments to fill priority I requisitions or backorders
(7) IORDER Total replenishment orders initiated
(8) IREQT Total requisitions received
(9) IREQC Total outstanding backorders that are cancelled by thecustomer
(10) IREQI Total priority I requisitions received
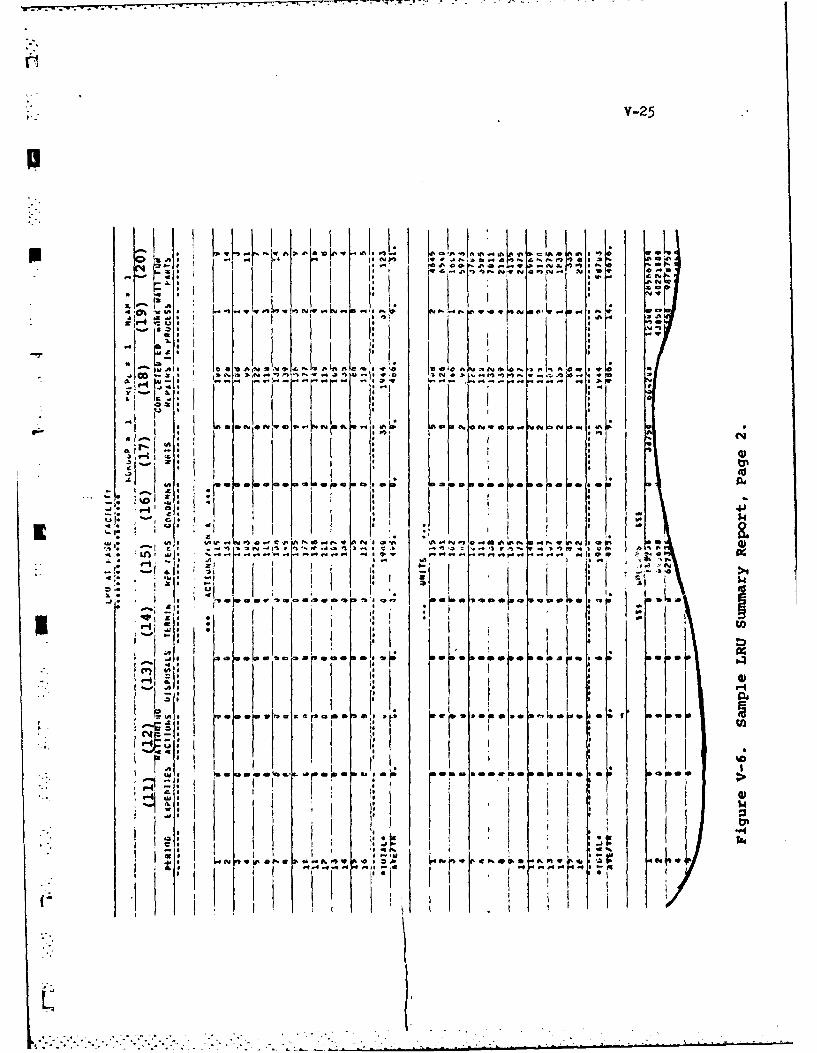
V-25
I.P)10 1K . ZP oaL
Rt 1- -3 -a-
0 39
04
%A I [4 to Fi0in, 2 -sa,4
Do 1 I a, 0 -a
* jIt60 'r. n. , 0 0 0 ,4* ft .4..aF 4~ S *.. ~~ I ~old
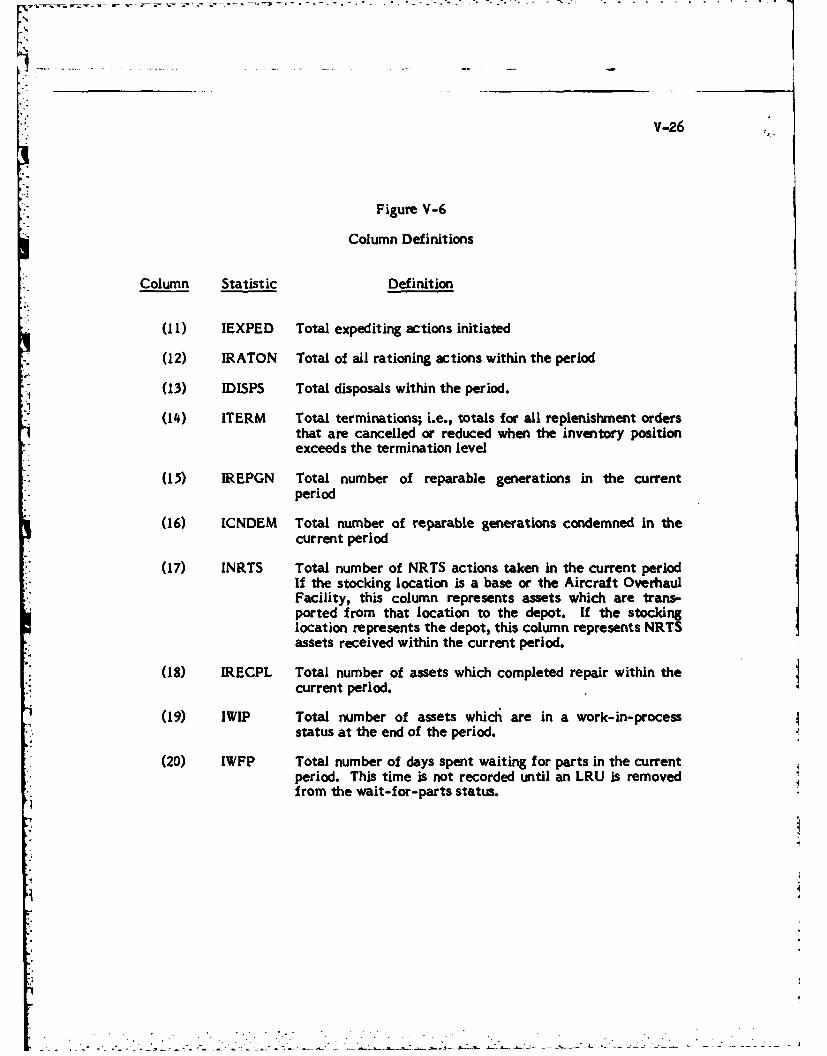
V-26
Figure V-6
Column Definitions
Column Statistic Definition
(11) IEXPED Total expediting actions initiated
(12) IRATON Total of all rationing actions within the period
(13) IDISPS Total disposals within the period.
(14) ITERM Total terminations; i.e., totals for all replenishment ordersthat are cancelled or reduced when the inventory positionexceeds the termination level
(15) IREPGN Total number of reparable generations in the currentperiod
(16) ICNDEM Total number of reparable generations condemned in thecurrent period
(17) INRTS Total number of NRTS actions taken in the current periodIf the stocking location is a base or the Aircraft OverhaulFacility, this column represents assets which are trans-ported from that location to the depot. If the stockinglocation represents the depot, this column represents NRTSassets received within the current period.
(18) IRECPL Total number of assets which completed repair within thecurrent period.
(19) IWIP Total number of assets which are in a work-in-processstatus at the end of the period.
(20) IWFP Total number of days spent waiting for parts in the currentperiod. This time is not recorded until an LRU is removedfrom the wait-for-parts status.
.o - -- - - - ~ -' - ~-a---.---------- - - - . . . - - - - -~

0* V-27
ja I Ir Or Ir DP "
0 . W Goi I II w w . .- .
A', I rt~F A. aDu aN w
*'....E" 0 WO. OS ASq! A
.j Ke T: :1: 0.4 KL 7 :
Km V% 'KF I& a P.84 P KO 4 I*
N~ O w % ~ Y~t 5
'A~. 4h~bg
A I% Ld No A
;AfFfwr pe l

V-28
Figure V-7
Column Definitions
Column Statistic Definition
(21) IBACKT Total backorders outstanding at the end of the period.
(22) IBACKI Total priority I backorders outstanding at the end of theperiod.
(23) IBAKDT Total backorder-weeks observed during the period. Forexample, if one item has a single requisition for 12 units in
* a backorder status for 3 weeks, there are three requisi-tion-weeks of backorders, and three X 12 = 36 unit-weeksof backorders for that item.
(24) IBAKDI Total backorder-days observed for priority I requisitions.
(25) INVDAY Total number of inventory-weeks observed. If there are 15units on hand for the first 8 weeks of a quarter, and 6 unitson hand for the remaining four weeks, a total of (15 X 8 + 6X 4) = 144 inventory unit-weeks were observed in theperiod.
(26) IFILLT Total number of requisitions that were filled "off-the-shelf, i.e., that were filled without backordering.
(27) IFILLI Total fills for priority 1 requisitions.
(28) IFILLT/ Fill rate for the period based upon the totals of allIREQT requisitions received.
(29) IFILLI/ Priority I fill rate.IREQI
Fi
*. . . . . . . . . .... -.-.- ,
V-29
K. As noted above, the aggregation index K may take on six distinct values, and
three separate statistics pages are produced for each of these indices -- a tota of
*18 pages of output statistics for each Buy Support Objective. Figure V-9
illustrates the first of the three output statistics pages associated with an
aggregation index K = 2. This index records results associated with SRUs at base
level. This report has the same format as for the case when K = 1, and will not be
discussed f urther here.
Short-Form Summary Report. Because of the very large volume of printout
associated with the Detailed Summary Report, the user will usually find it
desirable to develop a specialized output report designed for the needs of the
specific project in which he is involved. Figure V-9 illustrates the format of a
report which might be developed in this effort. This figure displays totals of six
major categories of performance statistics. The report displays the number of
requisitions which a given stocking location submits to suppliers of that location,
* the total amount of time spent waiting for parts, the number of backorder weeksobserved in filling requisitions submitted to that supply Organization, and the total
number of requisitions which customers of the organization submitted. The total
number of these requisitions which were filled off the shelf, and the corresponding
fill percentage is also displayed. Separate statistics are printed for each value of
* the aggregation Index K, as well as totals for each category. Figure V-S illustrates
statistics expressed in units (3 =2); however, the Short-Form Report has three
- pages, one page for each of the three possible values Of the measure type index 3.
p Quarter Totals and Punched Card Output. To facilitate statistical analysis of
RIME simulation results the values of 10 major statistics are punched on cards by
subroutine ITRSLT at the conclusion of each BSO e ainreplication. Record
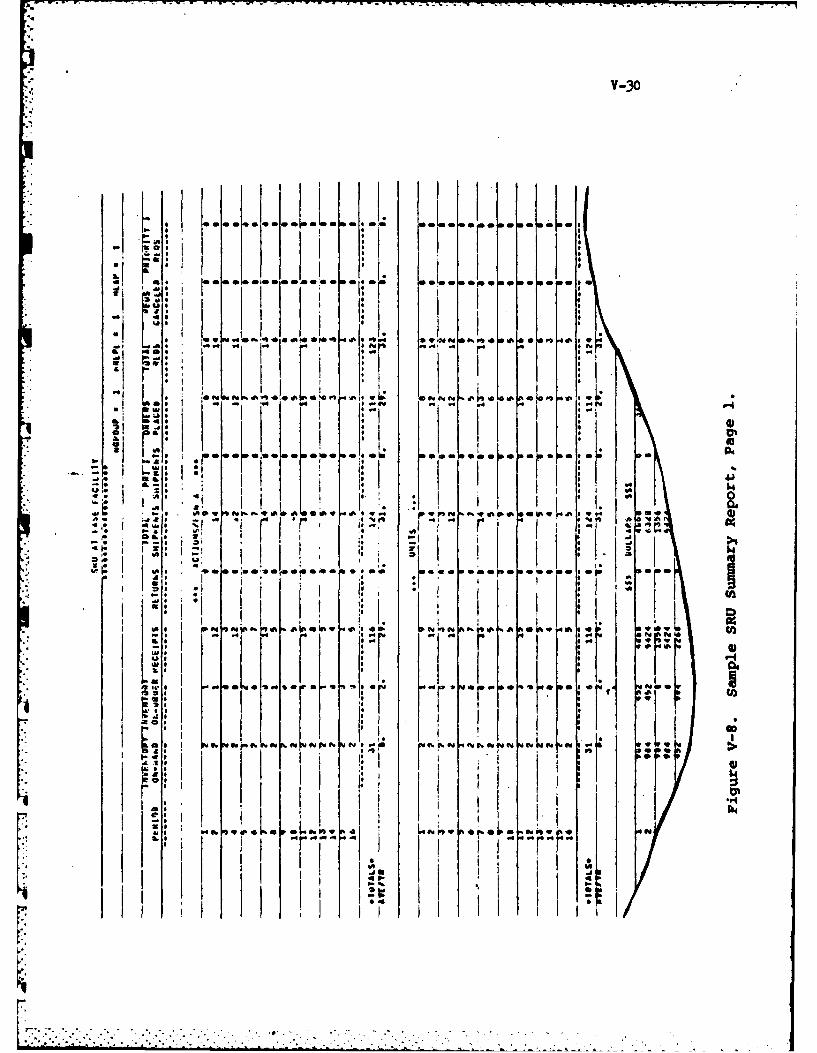
V-30
0 a16a . o o . . . . .
Ub.
ftl d6a o .4D 19O 1 Z .
as so neA woo m O
-i ', !. K .
1M I
-I 0 i
I I
.. 4v%
P4 4, t A t-.4 f
AS
'I 8 L~ a P.a f w1 0

V-31
Il
I0 L La :La :.i L:
~: .: *~i0
I I K I-toULI- i ~: i 4). S *
:4 46I
6J w
* ~ L *

V-32
Code FI in Appendix A defines the format of these output cards, and the
FORTRAN variable names used to produce them. In addition, the punch card data
* is also printed to Logical Units 15 and 16. As shown in Figure V-10, the report
printed to Logical Unit 15 displays totals of activities for the first 8 quarters of
-* the simulation for depot buy-dollars, depot backorders, base fills, base requisitions,
and base backorder-days for both LRUs and SRUs. The first column of Figure V- 10
presents the number of the Buy Support Objective used in the stock level
computations, while the second column of the figure displays the replication
number associated with the output statistics. Observe that the LRU and SRU base
requisitions (IREQT) are identical in each of the 10 runs shown in Figure V-10.
-This is because the Exogenous Events Generator forces an identical number of
reparable generations in each replication of the simulation model. Note, however,
that the buy dollars and other support statistics change for varying values of
MLAM and different replications, reflecting increasing buy dollars and support
effectiveness for increasing values of MLAM, and varying support performance
within replications for a given value of MLAM.
Figure V-Il displays the report printed to Logical Unit 16. This report is
identical in format to that of Figure V-10. However, this report provides the
totals of statistics accumulated over the entire 16 quarter simulation period.
Debugging Aids. As noted above, the user may specify values for several
debug flags to assist in the development of new RIME routines. Figure V- 12
illustrates outputs obtained when the flags IEBUG and IDBUG are set to 1.
IEBUG. When IEBUG = I, all item data input from the Exogenous Event File is
". printed. A sample of the printout is shown at the top of Figure V-12. The specific
variables printed correspond exactly to the variable names shown for the Item Data
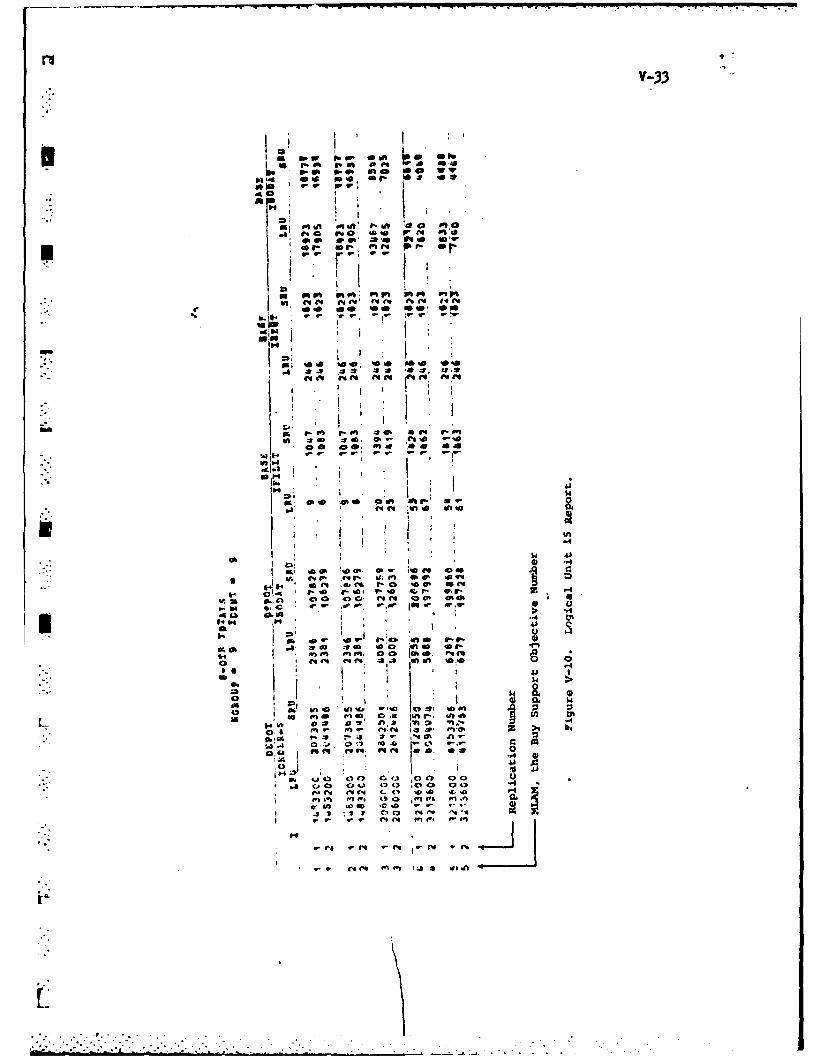
.4 0 g4 o 94 *., as e. i.
sk' v' sk, a. **e *4o.m*'er is .
V. , V.' P*T4 4
aUtP% i m : P% rl'4 o S"P r
ev rto f.4
40
* I
=m si o~- **in
. cv- "-.on 4,4, a4n la -' aW. C 01
Is . <3 Q!4 " 0CA 0
.,4Pt4Ad 4
to.. 0 ~ .0 '
zW d.l) f cia 1)CI C.5 4" m* #'m bf"4 f"C 0". 07 C,= it ft0fVm. #4 4 ft4 4. t i
, 41
tin In 4 . ~
-A# 1 401aeft 04 M~ $40 9r I. 1 6
94q fq a1 *A. 0:0
a" C3 fl C)I. 4j .4.3'o P 04f. CO CN C-4 C. CN & Ic 00on 6-6 c, n PIJ &S O'k 0M
An4. 'o~ CD ( .44 . 1I ~ ~ .3 C.0 f-45 e* 1
C4 .V.f. I..
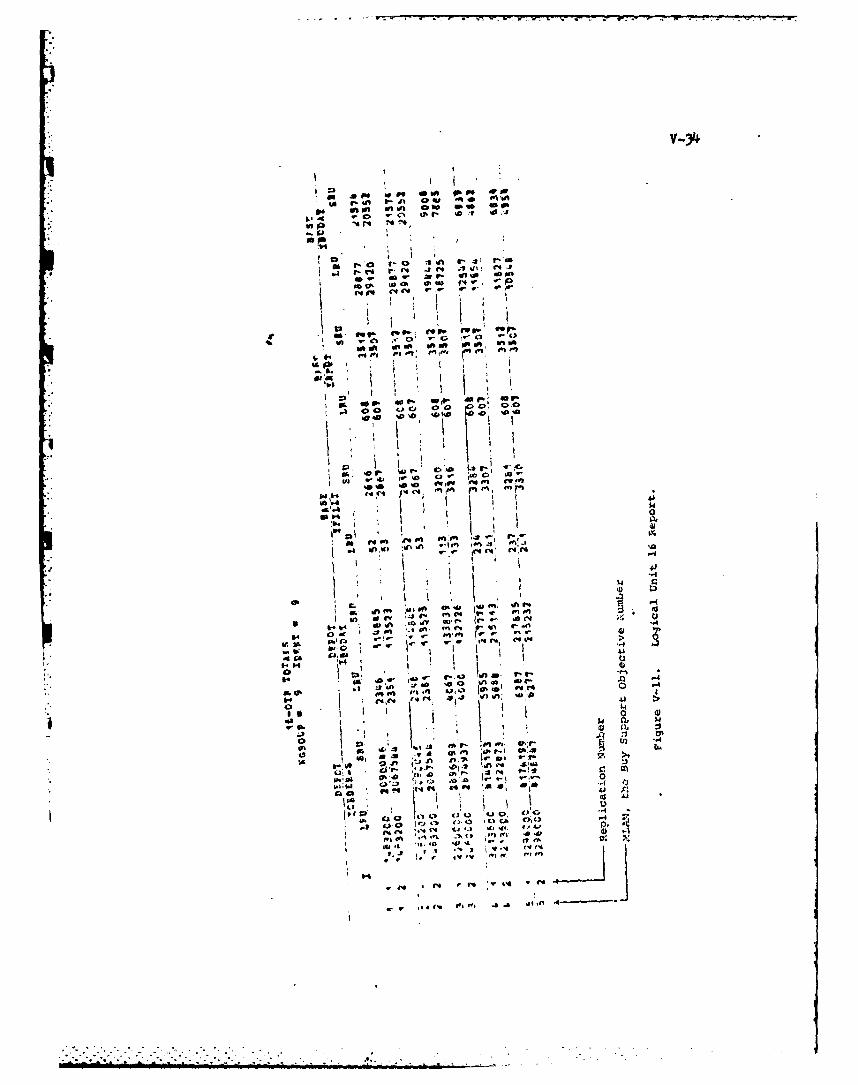
in i
r14
IA UP4f C4~O ve M
I.~~4 -e C C4 ~f 1~
'o I N I ; ;. . 0 ,~
1- 4. 8 p14
eqI
SL 0 40)C 00 00Cl
o o A . 40,
I 0
341-4
AN l!"~ fqa Ve 'Sv- t
f. .
0~ 4w~..
86 fp 4-- " a'%r
4A r-, 9pl ,
my ~ .U0 In'
w ;4 I l ga ; 4v l % 4 4
aiD $4 0.
.440 1,% el0". .06 m
V-35
Record (Record Code B2) presented in Appendix A. Basically, these variables
BI display unit cost and time delay values associated with each LRU and SRU.
IDBUG. When IDBUG = 1, an information line is printed whenever events are
entered or removed from the Future Events List, or whenever there are changes in
1 the backorder or Work-in-Process Files. As illustrated in Figure V-12, when
IDBUG = I the subroutine INGASP prints the dimensions used to initialize the
* Work-in-Process file. The next six lines show details of event transactions being
-placed on the F.E.L. by subroutine INITAL through calls to subroutine ENTER. The
list of events on the F. E. L. at time 0 is also printed when IDBUG = 1.
The above discussion concerned the entry of event notices onto the F.E.L. The
bottom of Figure V-12 illustrates the information printed when an event is
. removed from the F.E.L. As shown in the figure, at time 0, a type 13 event is
removed from the F.E.L., while at time I (ITIME = 1), an Initial Provisioning Event
(ITYPE = 20) is removed from the F.E.L.
Stock Status Trace Report. When IDBUG = 1, the Stock Status Trace Report
is produced on logical unit 52. The first 5 columns of this report display the event
Utime (ITIME), the event type (ITYPE), and the three event parameters (IPI, IP2,
* and IP3). The remaining columns display the status of stock on hand, on order,
work-in-process, and backordered at the time each event is removed from the F.
E. L. These values are displayed by Stock Keeping Unit. Values for the first 8
SKUs are displayed on the first line, and any additional SKU values are displayed in
* subsequent groups of 8 on following lines.
ITRACE. ISTRAC. At times the analyst will not want to produce the many
lines of print that result when IDBUG = 1, although he may be interested in
i-

V-36
.. ~ 1.
WN $4 I
IA * .44
00 SI w
a~ -a-
0o zIN 0:
E.3
Is*04 In
-:10 $40
-C- L * oZI~ 12c
oU 4.' II I
E-I I r~ ,~iI -
JJ . -- 4
9.4
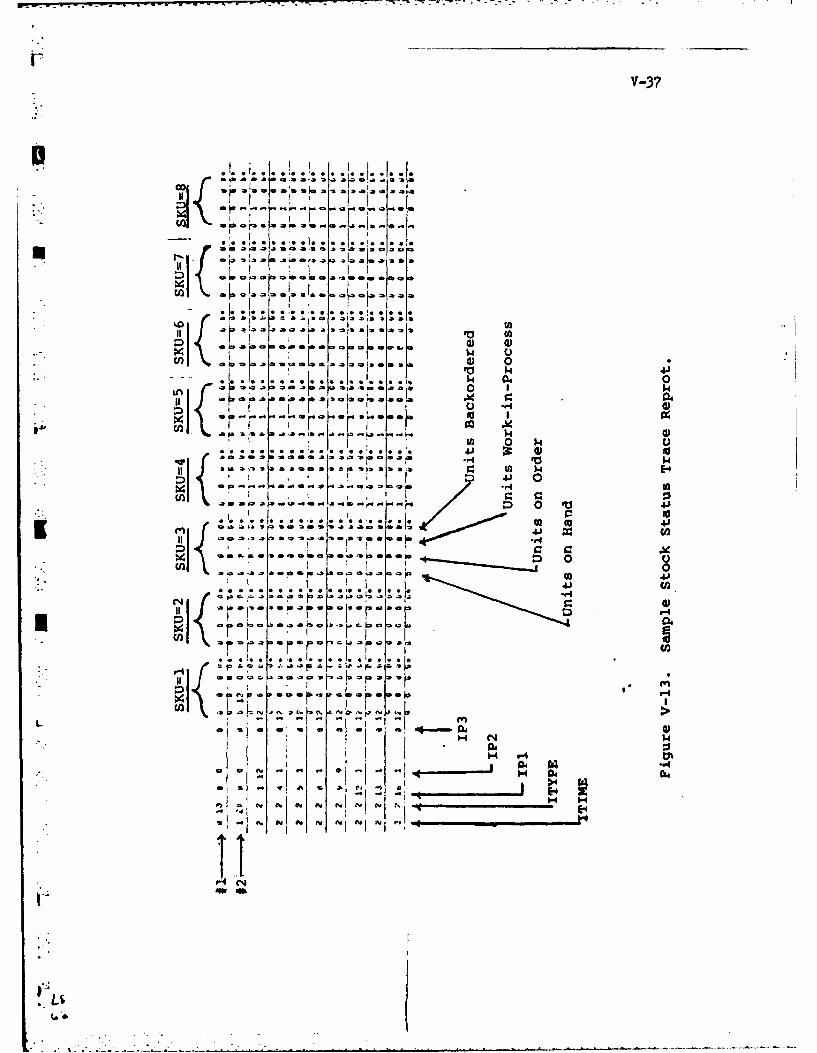
F
V-37
:!o r . * aI I r-,
MO{ a a:o: 0.. 4 0 0 0 040 *0 6 -44
int. I I...a . ......m I ... .
ro a aj.a a v. a 63 o a a a5 C
III
I I I 104
a1 : " : i f
4 J 0QP~- a Ma oo o0.0Z0;H moo. D 0j u go
jr~~ ~ li .l .,i .li . . . 4 41!
I1 10 f a .I
.0..* i ,,Ib l a,, iV.8 Os *rI
. .. . .. . ... .a 04
U O I a ,,6 w a a
S . ) .. 0 1 z
p6 P
wmp a a -4
N1' .,-V ,.,..- ,.U - ,..O. .
ff
H r- U
01 I v A / 1
(.3'4
V-38
obtaining event printouts during a specific time interval in the simulation. The
flags ITRACE and ISTRACE provide this capability. The variable ITRACE
specifies the point in simulated time that a detailed trace of simulation of events
is the start. At that point in time, the flag IDBUG is set equal to 1. This causes
the event by event printout to start. The flag remains equal to I until the
simulated clock time ISTRAC. At this time, IDBUG is reset to zero, and the event
by event printouts cease.
7.

REFERENCES
1. Demmy, W. Steven, RIME: The Recoverable Item ManagementEvaluator, Volume I: Model Description, TR-80-01 DecisionSystems, 3575 Charlene Drive,'Dayton, Ohio 45432, May 1980,153 pp.
2. Demmy, W. Steven, RIME: The Recoverable Item ManagementEvaluation Volume .IIPrgram Listings and Narratives,
* TR-80-OZ, Decision Systems, 3575 Charlene Drive, Dayton,Ohio 45432, May 1980, 298 pp.
3. Demmy, W. Steven, An Empirical Evaluation of Proposed StockagePolicies for Recoverable Item Management, TR-80-03, DecisionSystems, 3575 Charlene Drive, Dayton, Ohio 45432, May 1980,173 pp.
4. Demmy, W. Steven and Victor J. Presutti, Jr., Multi-EchelonInventory Theory in the Air Force Logistics Command, WorkingPaper 7b-3011-Z7, Department of Management, Wright'StateUniversity, Dayton, Ohio 45435.
S. Muckstadt, John A., "A Model for a Multi-Item, Multi-Echelon,Multi-Indenture Inventory System, Management Science, v20,n4, December, 1973, pp. 472-481.
C
S
U

Appendix
RIME Record Layouts
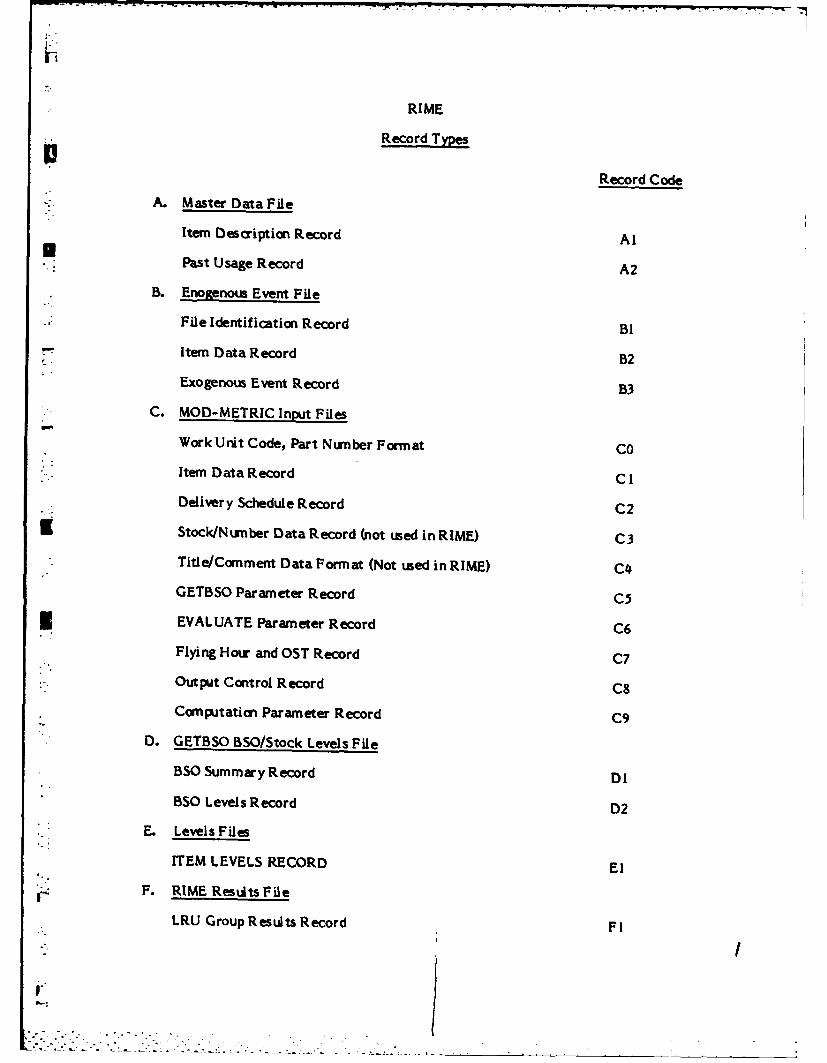
RIME
Record Types
Record Code
A. Master Data File
Item Description Record AlPast Usage Record A2
B. Enogenous Event File
File Identification Record BI
Item Data Record B2
Exogenous Event Record B3
C. MOD-METRIC Input Files
Work Unit Code, Part NLrnber Format CO
Item Data Record CI
Delivery Schedule Record C2i Stock/Number Data Record (not used in RIME) C3
Title/Comment Data Format (Not used in RIME) C4
GETBSO Parameter Record C5* EVALUATE Parameter Record C6
Flying Hour and OST Record C7
Output Control Record C8
Computation Parameter Record C9
D. GETBSO BSO/Stock Levels File
BSO Summary Record DI
BSO Levels Record D2
E. Levels Files
ITEM LEVELS RECORD El
F. RIME Results File
LRU Group Results Record FI
I.
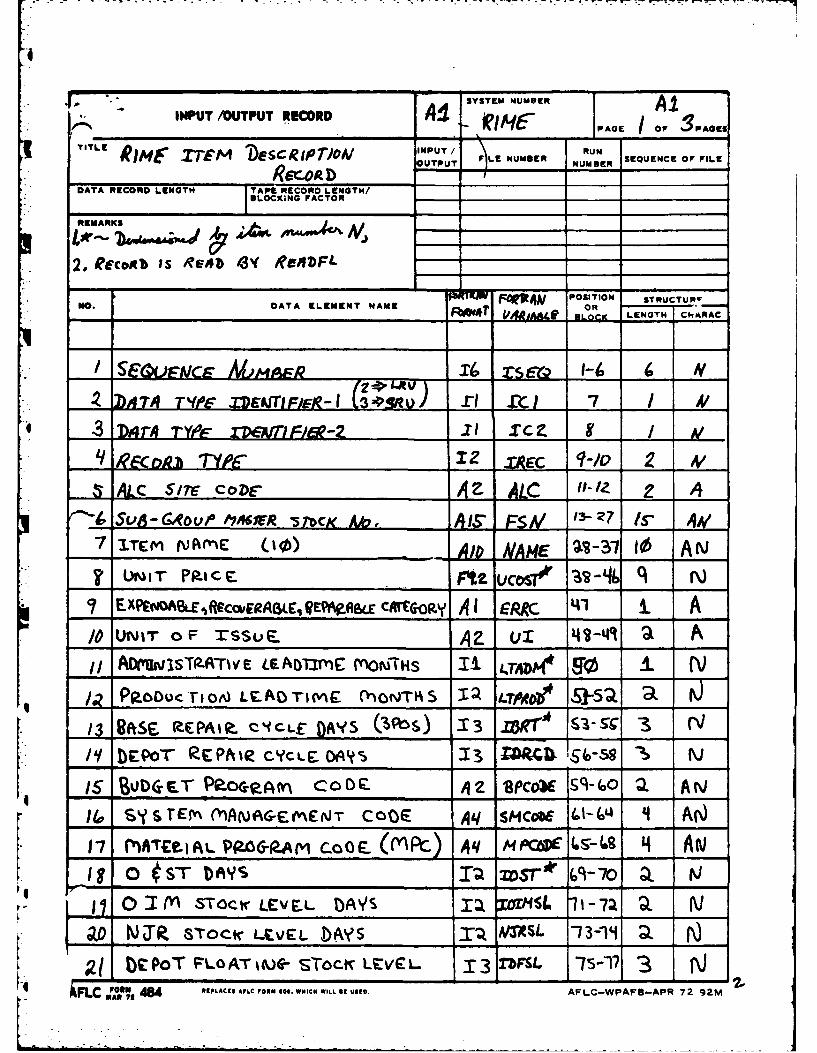
40 ~INPUT ADUTPUT RECORD SSE Ie"A* l~'~-.PAGE Of %SJPACES
if I C .17EP BeSCR~Ir'II'Vl INUT L NUME UN *~SEQUENCE OF FILE
DATA RECORD LENGTH TAPE RECORD LENGTH/BLOCKING FACTOR ________
REMARKS
I.*- 7) 4 . r AiW4f IV'~ _______
2, IReco'is IS 64b 13N( Re_ ___ ___ ___
r1 it POSITION STRUCTURv
No. DATA ELEMENT NAME ;X rt.V je O___ ___ ___ ___ ___ ___ ___ ___ ___ ___ __LENGTH CIWARAC
SEQUECE NMAfE 7 / 7A1'
-3 DiqrA TYPE- rPQVi4-c II X9
L/b "W- 1y' RAEC 1-/v M 4
A...~Lc s/re- coDe- A&Z A& LC 0-/ 2 A4~SUA-CAOw0 IIACX 'STOCK A AIS' FaSL. A/13'z IS' 4wL
7 ITEM NAMr~E (10) AID AA mE 9 I3 A N*N T FAI 'C E Fut ucoll a %-A i N* 7EXPeW0A&E .iciERa ,g'AWB CNro A11 EwRC~ A
/UNIT' 0F MSSUE. AZ i 41-41 a A~AD vs'T(.A-E LEmAoTmE VflOaiUHs IAT i TAZte f0 1 (
* ~ PRO~~o, LZCTM C(NTIS 32 ILTAOe 975,a a _
1 3 OftSE REAI CCLf oA'I'S (3'OS) 13 IstRT S- Iscs1Y /9 -P~oT REPAIR Ct'CLF DfVS 13 1,5o~s N ~ L
/5 BUDxr Pec*P-Ar CODC 2j 8pco) -Sq-' (6 AN'14 s TErf% M~ANAGEMENTr CGODE ,qq s/Cow6 0I-0 1 A f
17 .. Z vATrEZAL RP-AM CGOE (m~c.) .4i qm pav L5~-L L9 A wK TC E - DAYS_____________11-7a: 'aN
aV NJTR STOCICLEVEL rDYS 'i~ AML -3-1 a. N~
WL ~ FC FORN 484 REPLACE$ AFLC FORM 400. W"IC" WILL 99 USED. AFLC-WPAFB-APR 72 92M
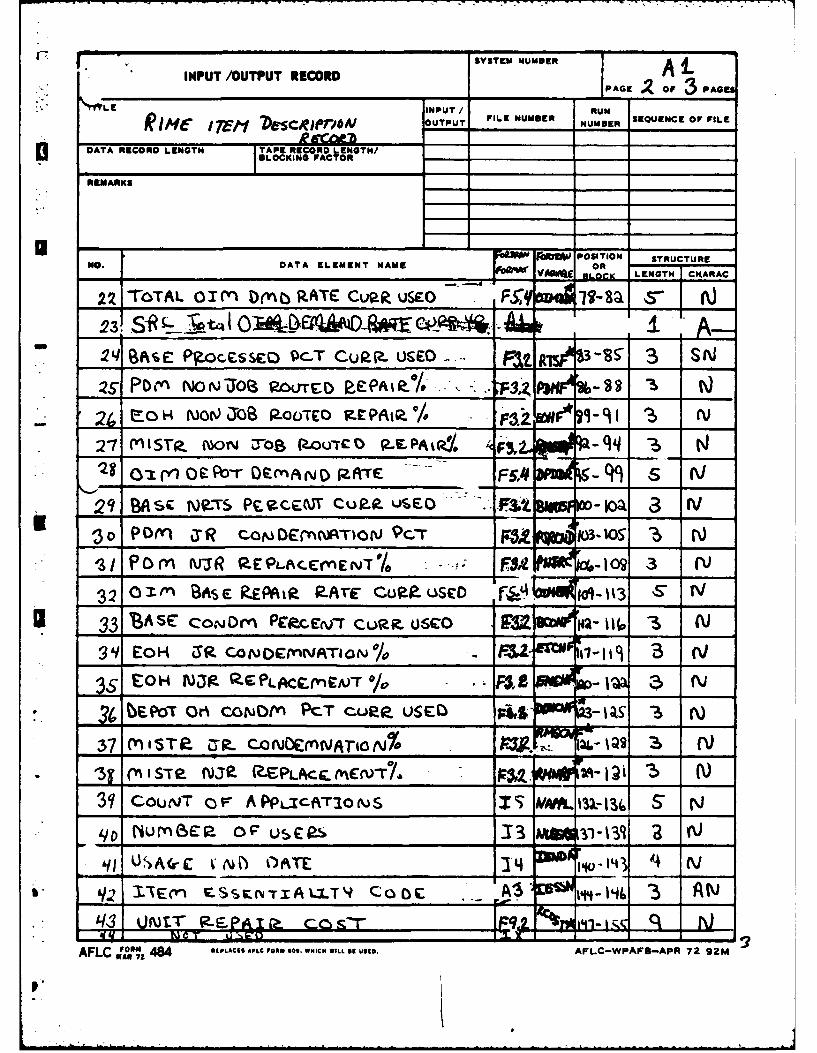
F ~SSTEM NUMBER J AlINPUT /OUTPUT RECORD PAG ;zO 3 PAGE
1 LE INPUT/ RUN
APN 7EH ZhM Ruc.46/ OUTPUT FILE NUBE NUMBER SEQUENCE OF FILE
DATA RECORD LENGTH TAPE RECORD LEN4GTH/p U~~~~LOCKCING FACTOR- _ ______
REMARKS
* - ___ ___ ___ ____ ___ _ -dbw POSITION STRUCTUREMO. DATA ELEMENT NAME L. OR
- ~ ~ ~ ~ ~ ~ ~ ~ ~ ~ ~ ~ ~ 00 BLOCK__________________________VM LENGTH CKARAC
STO~TAL 01Mf D(VMI RATE Cupgj u62o 72- 8a S- P
- 2q) BASE Pgoc-ESSC lc-T CupJR. USE- -S 3 Sl
2S P~ipy NONJOl 9-~rED PEPAZ'p/* -s~ I2L EIQH N00 r3XOB R.ooTEO V--Pt 03j 91 -6cI ? N
27 MISrT9. M1ON U-0B RouTO PLEPAt% f< Fq -6
Gmri0CPb )F NOTD Ih ATE ----- FS 9S (VJ
21 BA sr N9-7 P~CE(UT CuP-P usE FUZ - oa 3r3o POMCTR r1? orJIvEATIO 'Pc 9C 0J3.lOs -6 N\
S/j POrn WRu R.EPL.AcCC'fNT0. F 3_e c-IM, 3 (V
32 GIMtn BAsekEPte P- CuP-PUSCD IfjM 0oi-13 E N
* 33 'BA SE CON~m PEacevc~r ue. ti Iic RI~ 3 (
3' EoN ZY CONDEwtJATION 0o-F2 i-~
EON lUJ9 -r LCUAccme / F1B f ~ a 3 N
~PaT 06% cOOMl PCT cuP-g_ USF0 I A')
37 MtlSTP- ZM cvNENArotaBIT Mj(IS'Te 1VJP (EPLAcmCr)T/. i-1i' 36 W
3'? COUNT o v A PpL.Ic-~ o 'S :1 w &L U I N
firap Orr UERS &~ T)~ 3-13q 3'u SArC~M )ATE 34 i'$o4 14 (V.
q2~ ILEcvi CS~r&-r3AX1.ITl C-OC i% A W
AFLC FORN 484 REPLACES APLC FORM 609. WHICE WILL 89 .910. AFLC-WPAFS-APR 72 92M
MA.7
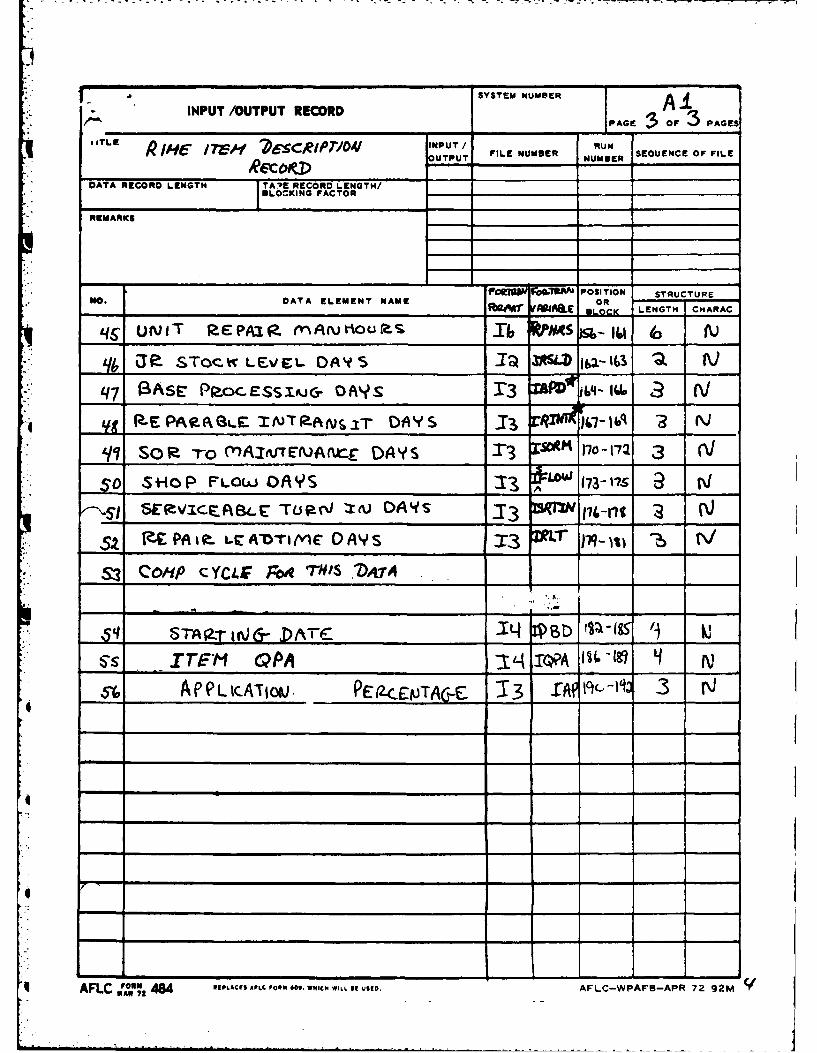
SYSTEM NUMBER A* - INPUT /OUTPUT RECORD PF 3 PAGES,.~~ PAGE :3 ,3AG
,""rm Z OUTPUT FILE NUMBER N SEQUENCE OF FILEOUTPUT_____ NUMBSER _______
DATA RECORD LENGTH TAmE RECORD LENGTH/BL,,OCKI NG FACTOR
'°L" REMARKS
NO.DATAIFP' oS fbQ3 POSITION STRUCTURE
MO. DATA ELEMENT NAME fbaft , O LO& OR__________________________________________ ~E ~ _ABJ&E LENGTHI CHARAC'
Lg UNIT E:PAIR MruAou lb iIb n-I 1 6 _J
S - Toc W LEV E"L DA'5 - R !LzD1ba-163 iq7 IASE PP-ocEss:W& oAYs 173 US4'1q-iU6 2 (V
RE I-EPA ( L" A).TP-tNc.iT DAVS -Ti 1iRZ 1/ q o0 a J
'/SoI -r-o MAl pj'rAflr- DAYS T3 M 10-1-72 3 (VSO SHOP FLOWJOAYS :13 L. 173- 115 P _J
- SE V cF.Ae.E TSPIN rO O's _"3 _l 3s -PAIP- L:ADT IVE OAYS 13 L'T7 -il
s3 C oP c YCLtE FoA TnS .VAI_
5- . -I
rF ITI 06i :t4 TIQPA I( " N
AePLICATo1J. PEZacEJTAEC T3 INA 19'-1 3 N
MW
a -
U! AFLC FOR 484 3(,LACII ALC oRM *o. W,,CM WILL "1 Js. AFLC-WPAFB-APR 7 2 92M S
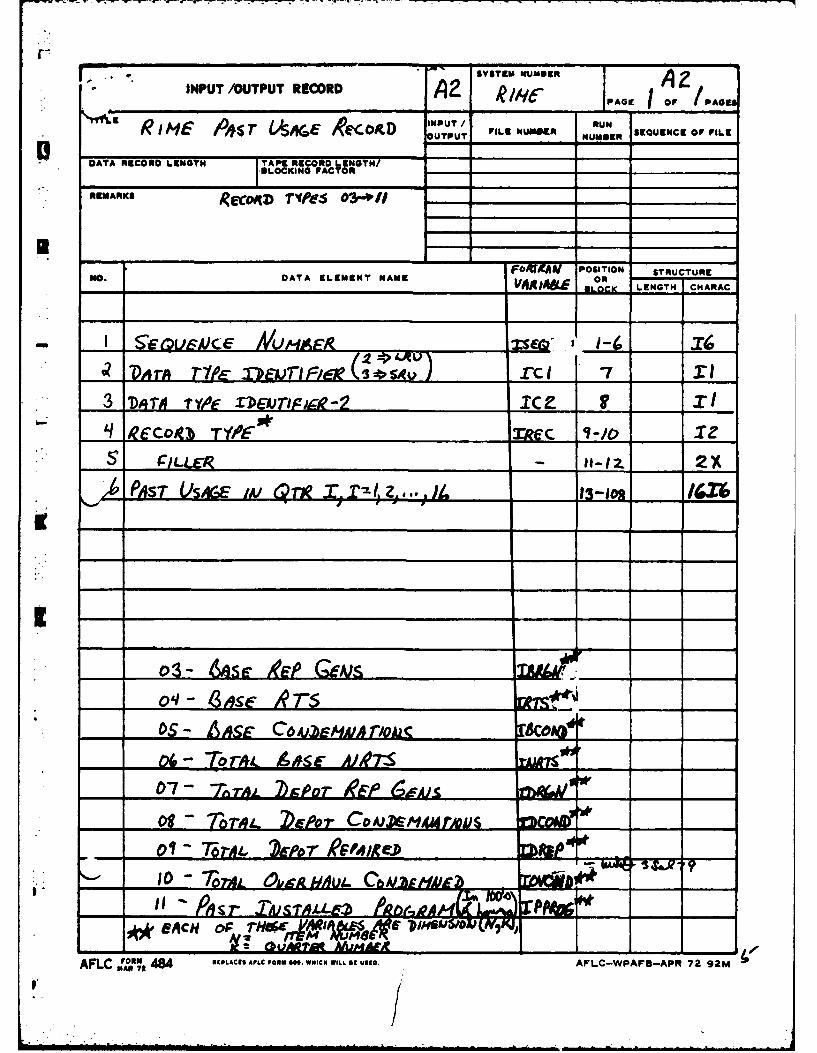
- INPUT /OUTPUT RECORD AZkACPAE O A
E ii 0 tkff,c fecoo INUT FILE NUM"AE RUN FIL
LI - _____OUTPUT_ NUMIER ISEQUENCE OF IL
DATA RECORD LENGTH -TApE RECORD L INGTH/BLOCKING FACTORI
REMARKS ~ c~ YE ~ I_ _ _ _ __ _ _ _ _ _
No. DATA ELEMENT NAME iIbAAf POIIN STUTR
__________________________________________ ___OR_ LENGTH CHARAC
3DT EfQ YAC IDEVjTIP,-:2 ____ Z ' x
PAsT --USAW IA? (Qre
03 - &5c~ X~EP EAS04 - £3qeAT5
- 06 - A Asc C6 AabEAIAA r~o~ 8co
04 - 7o r4. 1, AS 6 Ale0-7- 7orTAL 7 )g1P0T ,'P C&US- - -
- 01 - TO-*. N L -sr~r e!AOFOP-1C
filACH *F tH(,w m4 -'~
A FLC POEMj 484 RILACKS AUC OR 1011- WHICH WILL .1 U.ND. AFLC-WPAFS-APR 72 92M
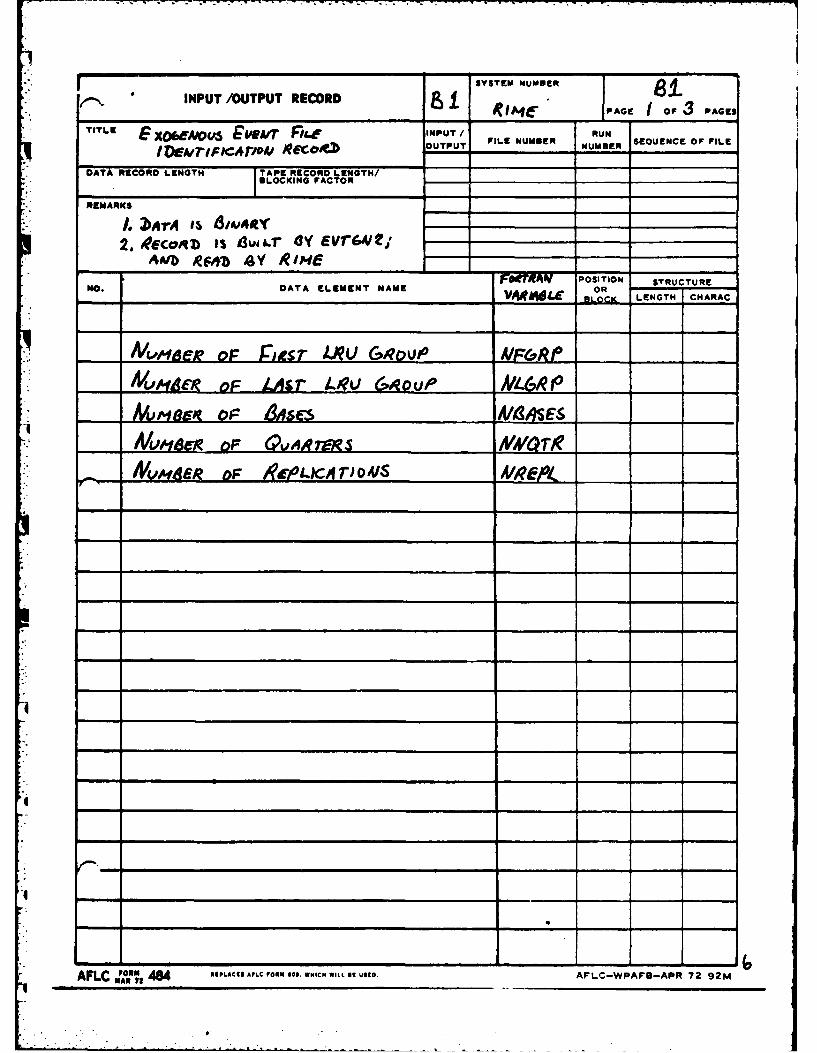
-SYSTEM NUMMER eINPUT /OUTPUT RECORD ~PG AE
TILE x~vsEv~e o ~ NPT FILE NUMBER RNSEQUENCE OF FILOUTPUT NUMBER ILE_______
DATA RECORD LENGTH TAPE RECORD LENGTH4/
2. 0'EevA is saud&i 4Y EvrrA/~ ___
AAMb RF*Z 4Y II4N.DATA ELEMENT NAME POIIN STUTR
____________________________________________BLOCKE LENGTH CNARAC
lVdXOF Cje~r JALI &'?ovw ____q
AIAMWoFisrku 6Av AM6,1 P _ _ _
AL M 44PAI PC~S S@ HC ILg go AFLC-WVPAFS-APR 7292

INPU /OUPUT E~RDSYSTEM NUMBER IINPUT_/OUTPUTRECORD R~ime PAG OF3 PAGE
TITLE EX62/0c* fEOgT INPUT/ FIENME NUN SQEC FFLIOUTPUT ILNUEN NUMBER SQEC FFL
REMARKS-
I.1>D4r, is 3i,.RnYA 2., REcotb is &.r SY R&APFfLI;
4011b R641) C4 1AICH,
no. DATA ELEMENT NAME RIME OSon STUUE* - ___ ___ ___ ____ ___ ___ ___ ____ ___ Vfl111LO.C K _ CHARAC
D~rs T' I Dewrlt/e Fic IC ___
(No-ie; xC I o DjoTm ~C.V Iii CW?4____
- - LU I Z DWAOMS AJV IaL
rc 1 2 -3 DsvoreS, *kq. -S#? -
2)ATri "PE IDEPJilF/ER 2 _____
RC' ?COAD TYPE (A1fosr rc3 __
SE7QUEA/ce A/umt3i zegFV'Dek ShC MA*ls __
(-'iT CoST- - ILo QLPAWJITY P, APLICATIO&' ___
- qr- ro -VEPOT To PJs i T 7/# M euIts) ZSZrTT 4 __
?z6por ,fpe Time ( mys) rbi r - -
dAse* REe4iue rT,-, (P4ys) .~
6VErR-#AUL TovA-eoU~ ROO TM~E NIS) ZDieZ~
ADM//.rTRArv6 L4,zo-11- (AYS) LTIIDM - -
0 ~ct'oV Lg-A T, pLy) 'r~eoD ___r
84se -TO- P o ee ORPER IS~/s UVOi V __ z_
- 'Webr-Tv-OtERM4vL F.4c, SH'IP tPsEUK~S) .OVSh'P
ARC IDErATjCU Fo0 14LL Ai9S 4S
AFLC PON 484 REPLACE$ APLC Popuo 40 W"IC" WILL 61 USED. AL- WPF- -292
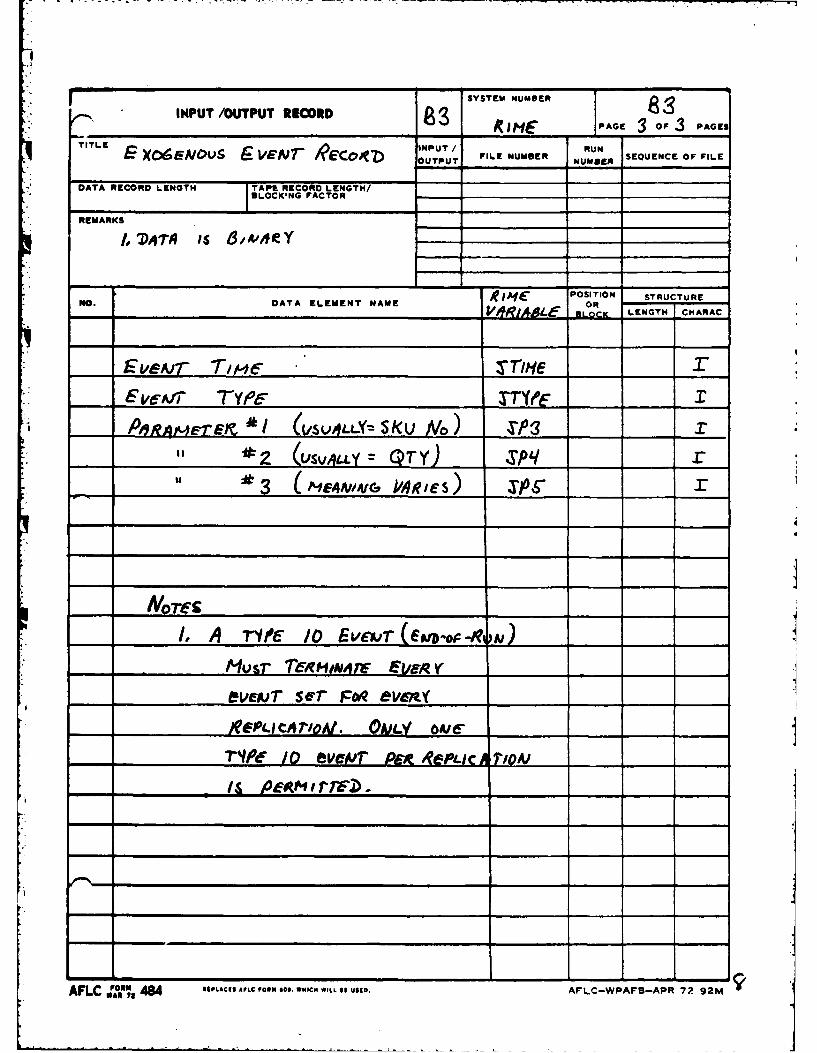
* I iSYSTEM NUMBE 8INPUT /OUTPUT RECORD PAGE 3 Or 3 PAGES
TITLE INPUT / RUN
X,6EE V EOU _ VEV ,Co OUTPUT FILE NUMBER NUMBER SEQUENCE OF FILE
DATA RECORD LENGTH TAPE RECORO LENGTH/I BLOCKING FACTOR
REMARKS
I,D T-A Is 8,Av4ey
POSITION STRUCTURENo. DATA ELEMENT NAME O-
_ _ _ _ _ _ _ _ _ _ _ _ __-_ _ ,L LENGTH CHARAC
SveAv7 TIM- Tte -_ !
Eve-Ar TYpEr TTYE __
P,,RqMEIt~l(LS V,4 LLY Skv lo) T/'3 __
€2 (usvuqa.Y QTy) Vpq ___
0 3 mom c7 114Res)
/, q Ife /0 Evc, (Emb-op-g A __ _
evmT sert" Foe ew'_ n
rqIpj /(p ewctj~ pFfx -Ree/CAT/ON I
A.~~ ~i Peot- * i Se.D.
AFLC .. FOM ,PLACIS A8LC 1040 60. WHICH WILL II U810. AFLC-WPAFS-APR 72 92M

I "" SYSTEM NUMBER
INPUT/OUTPUT RECORD CO I Co
T TL :1, 1, PAGE OF PAGES
RiME M ic RrFoRb FILE NUMBER UN SEQUENCE OF FILE
DATA RECORD LENGTH ITAPE RECORD LENGTH/BILOCKING FACTOR
REMARKS
i~i "T7#wE B*A FLEm ,v'rs A e^Uc"Tme wax uwrT coWE'hO NO, FP&D5oF *)"I-MT.ZC Y.iNL'7 d( 'C>.S -. ____
NINE POSITION STRUCTURE
MO. DATA ELEMENT NAME W ORW 1 " .LOCK LENGTH CHARAC
" JV61NTro MrGT, P8LKCY Numsex INN 14-S" TZ
L u 6govp ANOTE__:
(::-vmreR 1u'i& Z__ 6i
. __In Rifle, the above fielddefinitions are used in place F
of the Work Unit Code/Part Number #2-1-Fields defined on the MOD-METRIC
System Record Layouts. Thisconvention applies to all of theMOD-METRIC input records.
AFLC ",o3U, 484 OP..,CIS &PLC POPE 0. wIC wt., at u6o. AFLC-WPAFI-APR 7292M
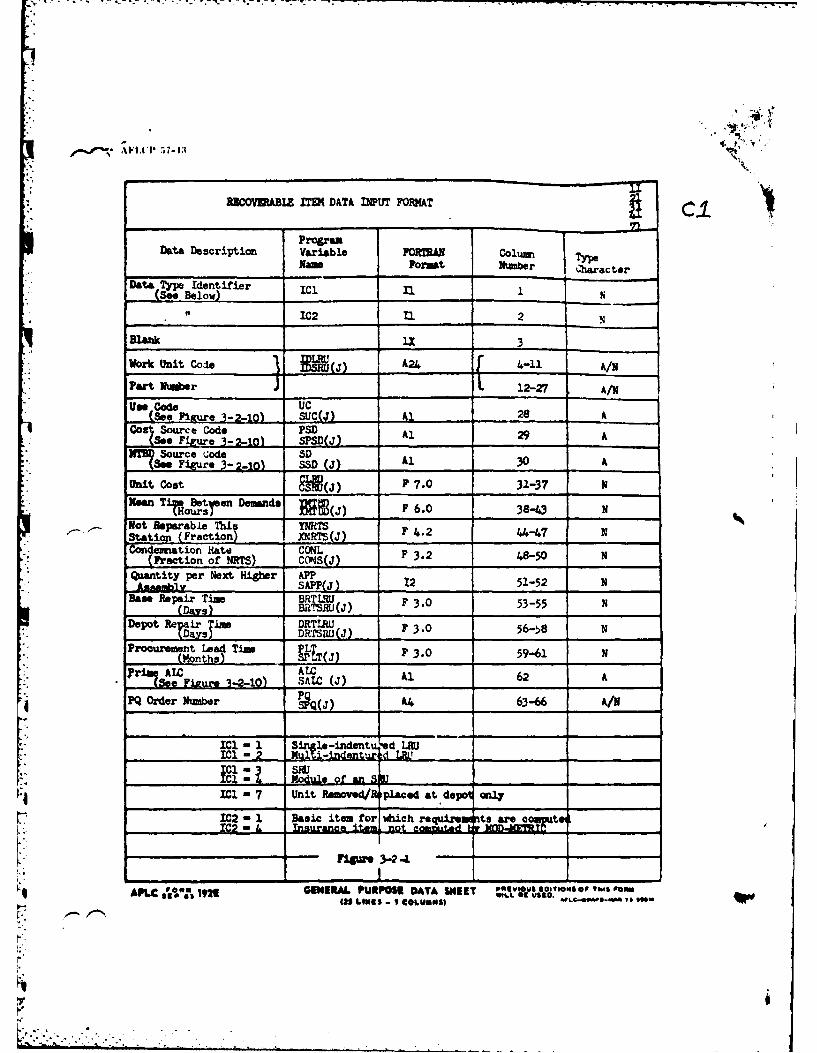
-. 41
E ,, r=W( DATA UT FOMT
ProgramData Description Variable FORTRN Column
Formt Nmber harac or
Data Type Identifier , 3(See Below) ICi II 1
IC2 I1 2
Blank ___ 3Work Unit Code MW jQ L 4-11
Part Nuber 12-27 A/M
Use Code UC(See Figure 3-2-0) SUc(.) AL 28 ACost Source Code PSDl
(sP Eu-e -( Al 29 AXT2 Source Code SD
F 7. 30..3 A. (,kSe Figure 3-2-IO) SSD (J) l0
Unit Cost FkIJ(J) _______ 7__0_31_37__
Mean TitsBet uen Demands
Not Reparable This d F 6.0 44-47 NStation (Fraction) XNRTS(J) F 4.2 44-47 NCodemnation Rate C#L
_Fraction of NRTS) CCNS(J) F 3.2 485 NQuantity per Next Highr APP____________________2 51-52 w
Base Repair T e BRTI 3.0 53-55 N(Days) BRWU(J)
Depot e DRTIW FU3.0 56- s N
Procuuent Lea Tim P 3.0 59-61 N
Pri AL Alz Al 62 A..I. M.2Se -- sAc(J) FIRM=3-2-10) SAW_(_)
PQ Order Number (j 4 63-66 A/N
,IMI - 1 Singe -indentu. d LRU-- ICl - 2 Multl-indentur, d R,"ci SRU.,'"ICI Module of UAn V
IC1 7 Unit Reoved/ placed at o ally
I02 - 1 Basic item for which requizr ts are aco"teIXC 2 -In ge -tem l not egad E r I MTI} fI
n e -2,,,1
APLC s'~,1921 GEEA UPS AASET WILL S SDW. L11 IS42 S COLUMN) AvLc.,, w -NAm Is e
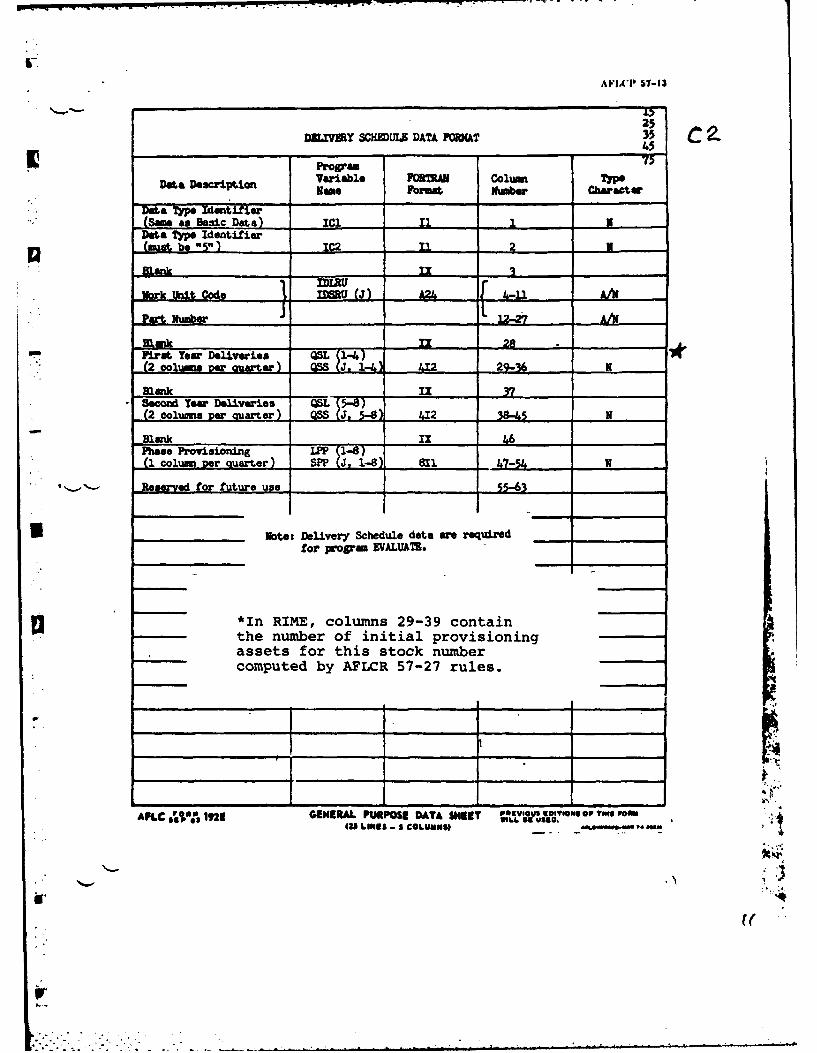
AFIAT' 57-13
.0.25
DN.IVMY SCHEDULE DATA FORMAT 35 C -
ProgramData Descripti Variable FOR'UAN Columin
Name Format Number Character
(Same as Basic Data) Xc. Il N,...Data TWpe Identifier
IDLRWWork U". CodeR (J) AU-11 AN
eran Yea Deliveries QSL 1-4)(2 colums ver cuater) 1J. 1-4) 412 9-36 N
Secon Year Deliveries L 5L-8
*________ Note: Delivery Schedule data are required -
~*In RIME, columns 29-39 contain
the number of initial provisioningassets for this stock numbercomputed by AFLCR 57-27 rules.
A¢LC 1921 GENER.L PURPOSE DATA SNEeT ",Ev',o 90, OF o, Ff42S LINIS,2 COLUMNS) . . ' , ,
*(
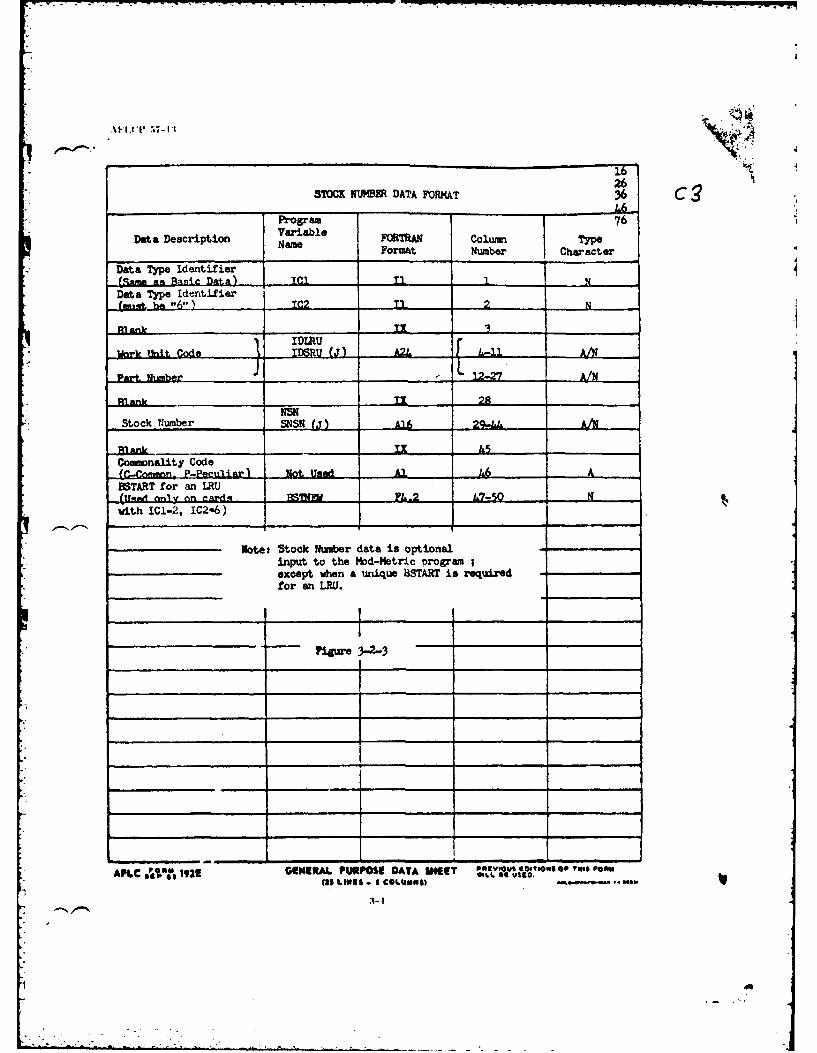
.I , 5 -11 'Al
STOCK NUMBN DATA FORMAT 36
Program 76
Data Description Variable FORTRAN Column Type
Name Format Number Character
Data Type Identifier(Sama an Basic Data) C1 T1 I N_ _
Data Type Identifier
R1 1 IDW TX I______
Work Unt Codq IDO U (J [ /
Part Number L 12_27 AIN
JlnL.________e________ .. Z ... 28Al Ank(NSN
..Stock Zumber SNSN W ) 2!L -
lAnnk 1x _Commonality Code(C.-Cmon. P-PeullAr) Not Used Al ASTART for an LRU(.1-t-a nmly nn cafrd-g _S_ _ F&,2 10-50 Nwith 1C1-2, IC2-6)
Note: Stock Number data is optionalinput to the Mod-Metric programexcept when a unique HSTART is requiredfor an LRU.
Figure 3-42-3
APLC .'1,1923 GENERAL PURPOSE DATA INSET P~aIv~,?$USSO.?IUs *U ?"Is FOR"(2S LINN$ . 2 COLUMNS) MO Sao
3-.
4

TITZo CONMT DATA FORMT 91 C4
DzDcp4O arbl. FOTN Format Column Numbers ChrceData Description Name
-Data Type Id~entifi~erst be ICI Xl 1 U
a Type Identifier(see below) C2 Ii 2
Blk I 3TitleorCo'uW. HDG A69 4-72 A/
IC2o1 Card is ,ot 'ead by program; used to permitcorwents owow. neaoLm " Lngs in daza e.
IC2-2 Card is read end will be printed as a title onOut u repo,
-Figur 3- 2-44" _ _ _ _ _ _ _3-5
f1A
U __ _ _ _ _ _________ _ _ _ _ _ _
U _ _ _ _ _ ___ _ _ _ _ _
APLC s'°$'j 1921 GI[NER.AL PURPOSE DATA SMf~lT PRIVvoUm*.,m So.*Y° o rn ,ou
,5LIES. :::: i.4 .
q
r(-
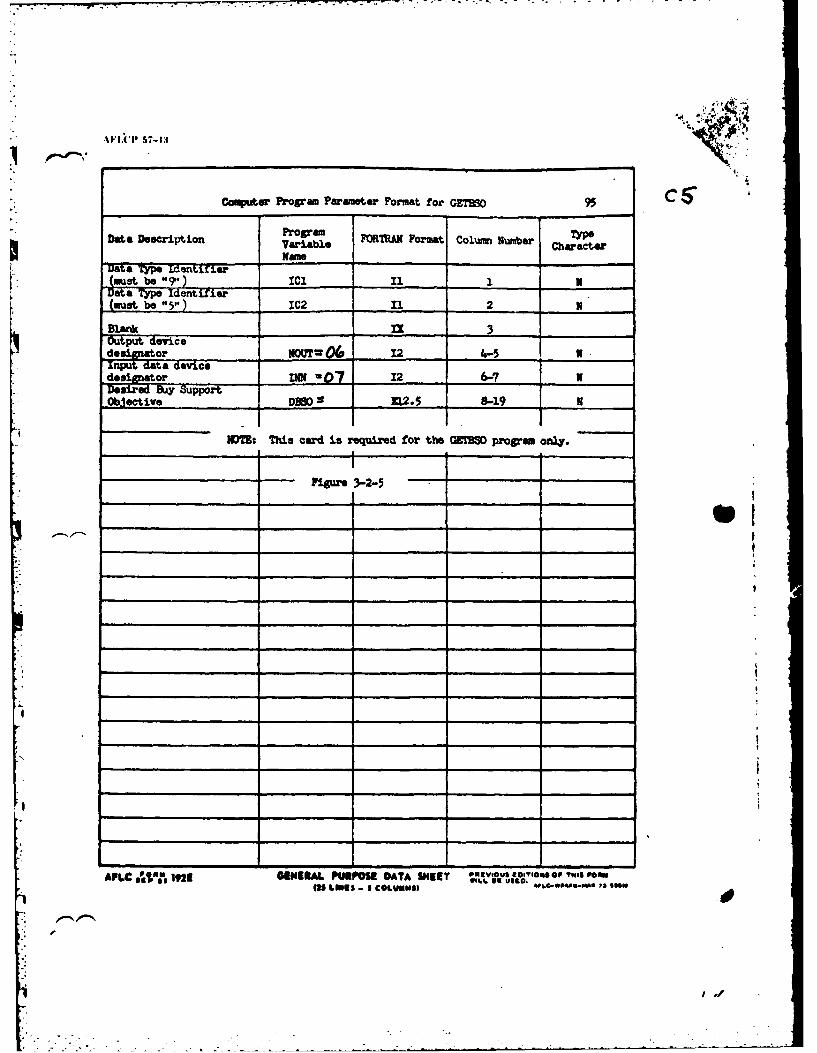
AIIoI 57- 13 ,
CoMputer Program Parameter Format for GEM'', 95 CS
Data Description Program FOTR Format Colum Number TypeVariable FKlKFrtCoumTmb CharacterName
Data Typ Ident, e-r(must be 09, ) l 1 1 N-Data -T Identifier
(must _________ beC2 11 2 N
Blank __ 3Output device
doqm!nlor MMU 0 12 4-5 xinput data deviceSdesisnat or us( -07 12 -6-7 NDesired Bi SupportObjective DBUD 12 .5 . -19 N
HMTE: This card is required for the 0EM18 program only.
t
APLCo,'t$o" M92 GENEAl PUrPosE DATA SHIET pou~gOY"8eU oa'. 'on(25 LUMIS - S CeOvUM1s6 MId0oO S$O
go.

NWAUTOR PARMKTMDATA FORMT 6 (
ProgamTpData Description Variash 7(1138 Formiat Column Number Character
9iaub ") Idl Nl_____ ____
it~ lyp Jentiler(abe60) 1C2 11 2____ N____
MlAU* ________ 3 ______
Delivery Quarters NQ'5 12 4-5 1
Phase Provisioning Quart rs WQ 12 6-7 w
Codemation Factor CFAC 76.2 &-13 N
WM:I This card is required for the EVALUATS propram only.
Figure 3-2-6
APLC .'J 1 922 GE#ERAL PURPOS DATA SHUT 'V~@'OPwsPe
US6 LINES -S COLUMNS30.wmm
3-7

-. - -- -- . .. . . . - .- - -- ,-,. - - . - -. -- -- . -- -.- - r - .
r.4
fr
13
PLURW HlOUR PRlOGRAM4 DATA 703(1? 9 C 7
Data Description Prgaml FWMAN Format Colum Nugbers TypeNm
Data Type Identifier
Data Type Identifier IT ______
(mstb 27" T(!2 T _____
-* ,ihi. f bg :fl5'
Order end Ship Tim OT(K) F3. . 13-15 N
Note: Data in colu m 715 oris f or aar 1.TColumn 16-24 e for base #2
DaColums 2 e for ba 3.1etc., for as m ny bases (NBAas there are L, t 1there are mere than 6 bases, wntinu
-- _ on additional 1,97" cards sta a in _
colun 7.
For .he 3-echelon -K del( VRT us-Me qgo. of interm ediate fo l. w inst for colu s 4-39 : __ _ _ _ _ _ _ _ _ _ _ _
renir bases (No. groups) NP .4-No. of satellite basespe .1 NS? 13 7-9 NFlying hiours at repairham Rer month .p e?)9 M.0 10-15 NFlyin~g hours at n'achsatellite base per month FHSAT 76.o 16-21 NOSs days from repair baseto satellite base OSTCK M6. 22-27 NOST days from depot tos=MN
Cair base _ 07. -O" days for aircraft at
as? -e ohere M6.0 system. N
thes- areigure 3-2-7
AFLC 'ON" 1921 GENERAL PURP9SE DATA SKEET OP "- 00
(35 LItS - S COLUNNSI ')''
r
• column17......
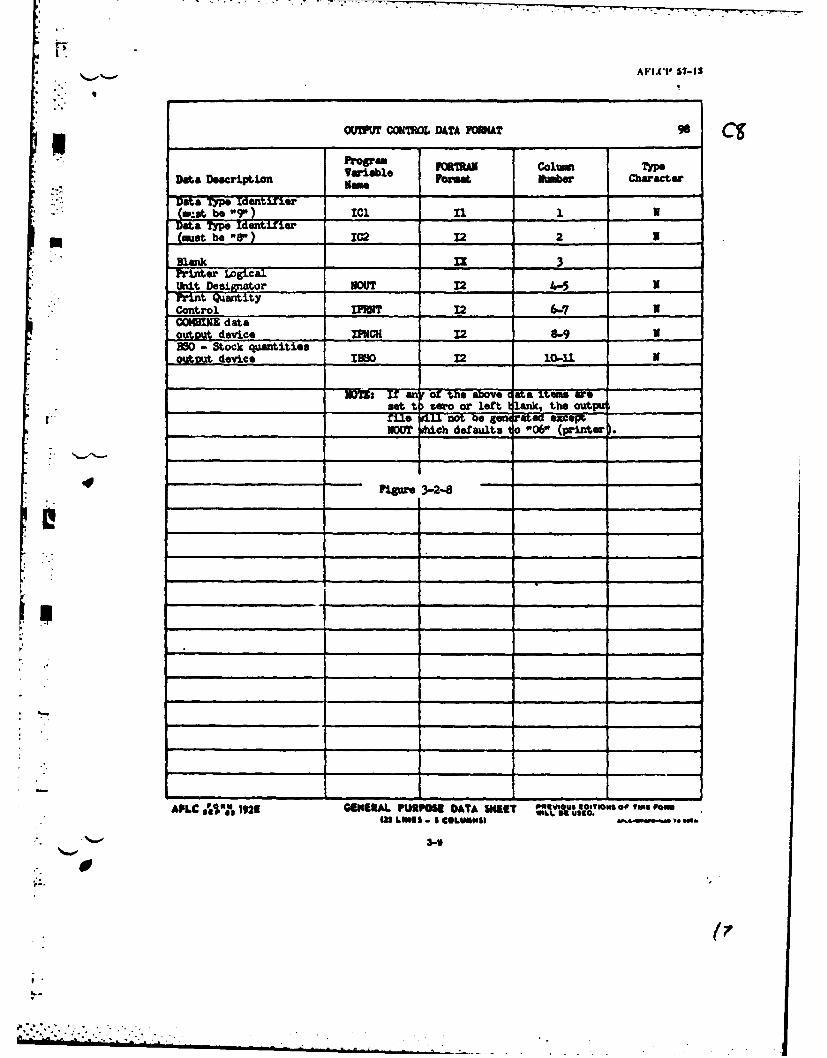
F AVI.'' ° 57-IS
OUrWT, OKON1L DATA 704AT C9
Prograu VCE2AN Colum Typ
Data Description variable er CharacterN.me
:-...(pt be "9 ) ICl x11Data Type Identifier
_(t be -8-) IC2 12 2 U'Blank 1rr 3
_Unt Designator UM 12 .N !l "Int Wantity
Control ___ _ .... 2 6.-,7 ICONKBNE dataoutout device _ _CH 12 8-9BO - Stock quantitiesoutout device I__SO 12 ,10-11__ _....
WWI if tano the above ata 'tems reSset t iwo or left lank, the outpu
_ c? h defaults to 006" (printer) .
'$tur 3 -2-a"
A.LC GENERAL URPOSg ATA g11 ,um. t fr p0US LIN@S - I COLUNWIS "69.0.-, '.s"-
A3-
*- - * .*. - '

MA 5. P'7-13
OOIUTS FPWtA PARARMT POT4AT
Program-Data Description Variable FCR1AW Colun ~ TYPe
NOW Format umber CharacterData Type Identifier
(at bwe Id Ii 1 1 N-. Data lype Identigier
(mst be9 Ic2 11 2 N
Blank 32 3___
Nulmber of bisections MW 13 4-6 N
* eaUTA 76.2 N-2
*StarUtkg biWaet f actor MTAILT 76.2 13-l8 If
* 80in 1* acor 3810 F6 192 N
*Cimataio flotor ... ZAC F6.2 - 25-30 N
~ rMISK, 0'lINZ, 4AJI Q Au (SX
FoR IA/mi/*. b0 oU/sIomaxeC c~ci.47YO$s.
Fitc ,QePLGAisomeir, KmtoWsK) £0P1 wk)<,AND IKeQ&S 40 USEDV
AFLC 09%Ws-s4O0*1 ILM 1 jf OMP, UZAL PWPOSE DATA sIII? orL vgs o
As
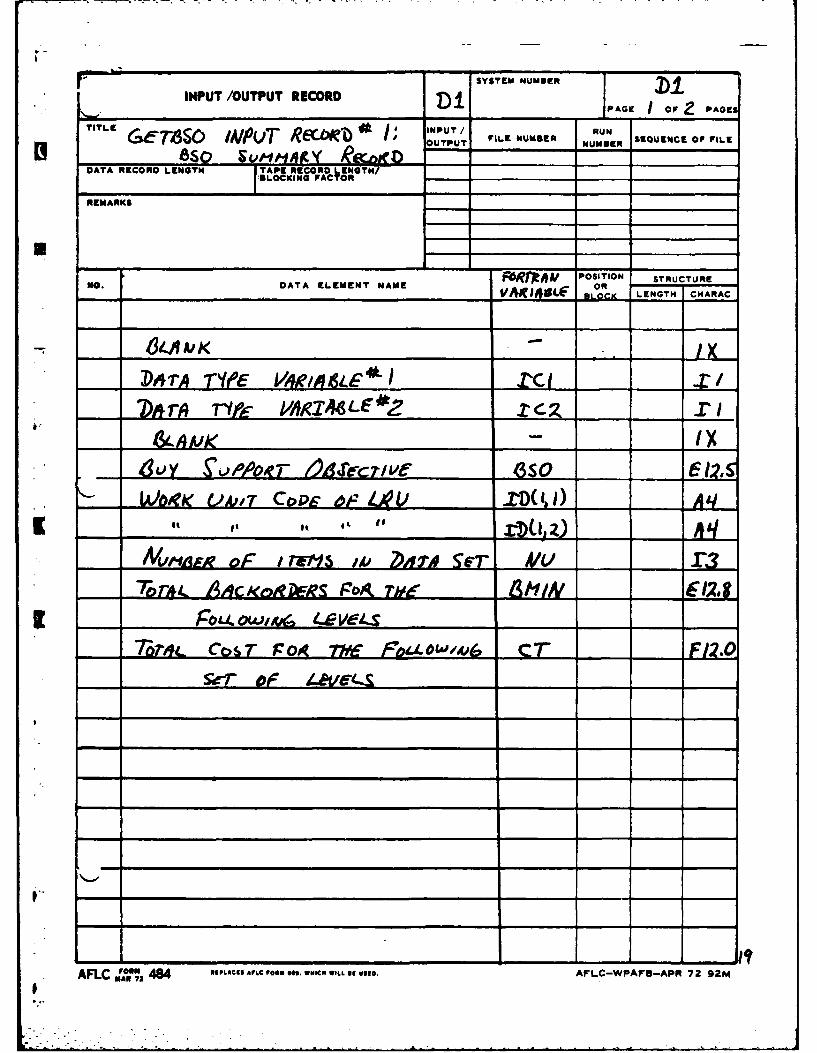
SYSTEM NUMmER Di1INPUT /OUTPUT RECORD D . NU MBAERS
TITLE TI 1IUT R INPUT / RUNGeT,8SO upIr R/i OUTPUT FILE NUMER SEQUENCE OF FILE[! as850 SuMd-Y cD.MEDATA RECORD LNGTN TAPE RECORD ,,,ON
:BLOCKING FAC T I _______
REMARKS
NO. DATA ELEMENT NAME OR EN STRU C-,___________________________ VAJ ItIILE" iloc LENGTH. CHARAC
-& Pi/ K / IX
7 re} ritfr j,/AeIA4_E2 7&AAK - ___ IX
4y g.,o~e of 7vcnv C 123S
WoRKi VA, CoPs oFLA.L L(II) 6F Aq- " ' ,, D"LIt z) a
/V,,R oP rVs , TI SET A/IU7 p~rAk AAcmo~jxvs rop re -MI - 2's
P ou.ow,o,_LeVdets,___
T r4L CcosT o,( .4 F7w o ,w/,o6 CT F12.0
ARC , 484 IEPLACS * LC . o . WIC" WtIL L uSEo. AFLC-WPAFB-APR 72 92M
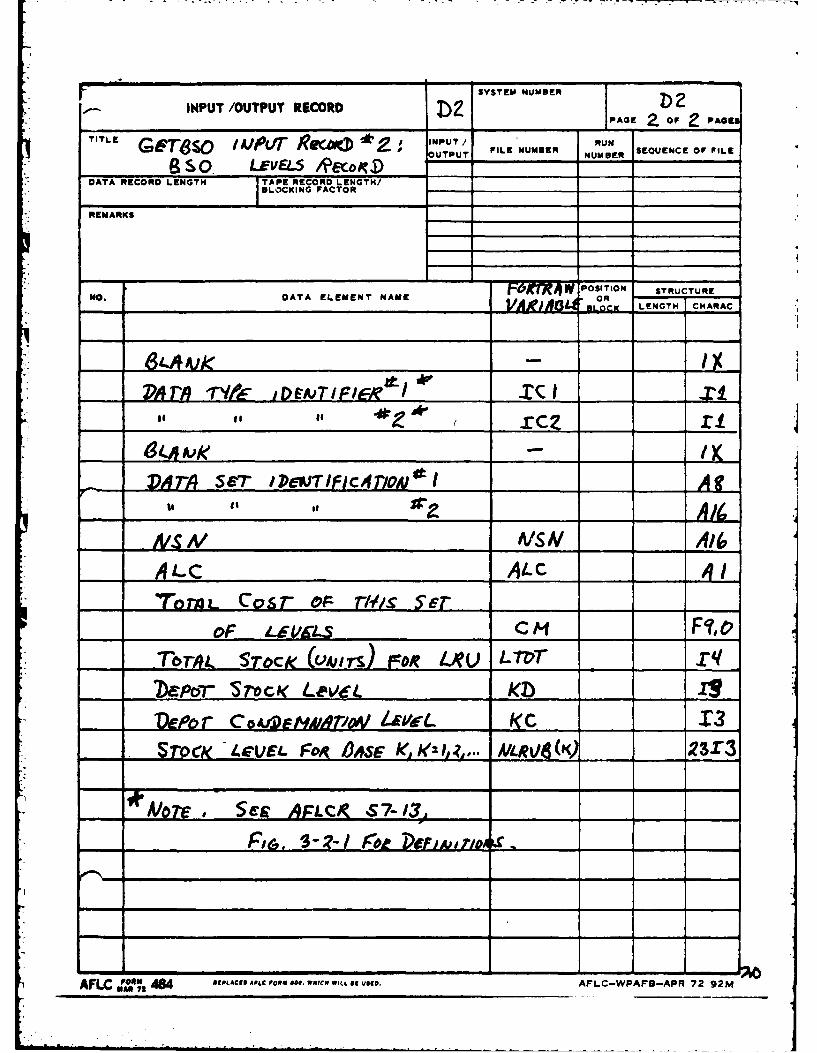
SYSTEM NUMBER
oo- INPUT /OUTPUT RECORD AZ O PI: PAGE 2. OF PAGES'
_G_ SO. O. R o °go RUT LE NUENU MUEER SEQUENCE OF FILE
Sp o LEVELS OUTPUT5 -NUMBER- __ __
DATA RECORD LENGTH TAPE RECORD LENGTH/BLOCKING FACTOR
REMARKS ___
No. POSITION STRUCTURE
NO.DATA ELEMENT NAME OR--OR- L 'LENGTH CHARAC
PA "?6 "QkIIRx&4 -CiA~ I j
go~A r~4 cz __ _
VArA 56-r /'ePJTlflcif V~tIDl_____A
- A/ A/SAI11ALC AyC AILS
OF LEVEL Cm ___ __
STr . UOL (CJAJITS ISKoc, L,. I/TIT _"_ _
Zcbr~, SrocI L,&Vr1 Kb__ £
Fie, S- / oe DeFIAjID, A . _.
AFLC 00110 464 ag ,Iu fcFR *#. " ilc WIL 0 a" AFLC-WPAFB-APR 72 92M

INUT/OTPT ECRDSYSTEM umSea El 1INPU /~TPU RERD i R PAGE iOPF PAGE
LZINPUT / RUN
ITEM LFVC-Ls R~ECORD OUPFILE NUM9ER mumnSEQUENCE OP PILE
'i$FLOCKING FACTO
NO. DATA ELEMENT MNZ RIMC POSITION STRUCTURE_________________________________________~ 'R ~ OR LENGTH CMNA
46 4Auk / j* L~4/AuE A/u mMK~J 2SI
S MOD- Hfm / ic .10 1C2z Copes 7f __1
131-A AiK /-
22 r ~~i Fi c4,oA c obe 2ETi-It
* 3 __ __ __ __ __ __ _ #/LAM m-~
QuA , Al-umAE-, Kea~ 4-74 LR'J/5A1 44irnwk (Lgu WIem) owuia'~/
* 7 OvExovL sn~cK LEVEL- INVL T3 1
- ALC (Alor us-b e. -o Ri/r
Tom~K coS7 OF VVVTJMSCI UCDWk', -UM'i FI'Ton&L -or- DEpvrT A AwS UsVE - i -~q 7 £9/
/0 7epor STOcK LEVEL Ki 4vt-SoT
I/ COAO j9-710AJ L5VfL kCC siS3 Z
I~BiS LEVA4. Fop, 6AS6ckhmI2., 1N4 8Sj) Sq.-' na
____ ___ ___ ___ ___ ___ ___ ___ ___ __ ___ 75-771
AFLC FORN, 484 RIPLACIS ALC~ 0 011. ,WHICM WILL III U110. AFLC-WPAPU-APR 72 92m
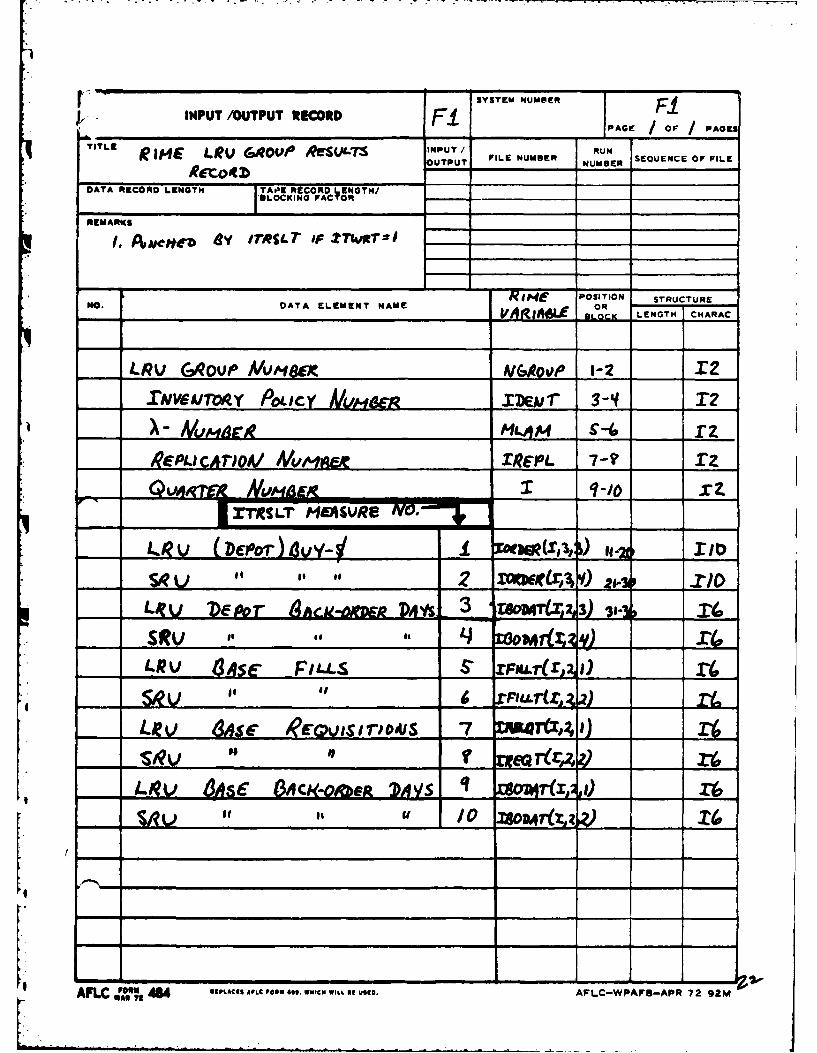
INUT/OTPT ECRDSYTEM NUMBER F1INPT ~UPUTRERDF1 PAGE /OF PAGES
TTER IHE L.IN "UTAc(~sIPUT FILE NUMBER NE SEQUENCE OF FILE
DATA RECORD LENGTH TAPES RECORD LENGTH/BLOCKING FACTOR
REMARKS
I. PMC~tr'8Y ITr*LT If ImT~I __ _____ __ ____
J4R tPL POSITION STRUCTURENO. DATA ELEMENT NAME VAZAE OR
- ___BLOCK_ LENGTH CHARAC,
L-RI QoUIov Musi44w A14v 1-2 1____
.rVA/o~ Poicy ArLjtErp newr- 3-qf__
~PLICAMjo/ MOMMiq I*EPL 7-t' ___
QtmqTrx Num1e 1-10 r z-IZtSLT P*gASVRe 0O.
-~V (D*1)dY- 1
~~lRver.' 23A-e- VILD___ _
- LF.LiV 4ser RE3,2Cpistr AvS 7 Mftz; 1)
AF LC als"01 484 RILAI AFL FOR $09 WMC4 IL RC AFLC-WPAFB-APA 72 92M