
ITC AND RATIO
24
Assignment no-1 ON ITC (Indian Tobacco Company) DESH BHGAT UNIVERSITY Submitted By:- Submitted To:- Manpreet kaur syan Mrs.Pooja Sharma Roll No- 17
-
Upload
manprit-syan -
Category
Business
-
view
66 -
download
4
Transcript of ITC AND RATIO

Assignment no-1 ON
ITC (Indian Tobacco Company) DESH BHGAT UNIVERSITY
Submitted By:- Submitted To:-Manpreet kaur syan Mrs.Pooja Sharma Roll No- 17

CONTENTS
Introduction of the company History of the company Vision and Mission Products list of the company New of the company Balance sheet (9,10,11) Ratio And Interpretation (12- 22) Advantages Conclusion

INTRODUCTION
Indian Tobacco Company Limited
( ITC) Company – Public Headquarter - Kolkata ,west
Bengal , India Chairman – Y. C .Deveshwar (yogrsh chander deveshwar)

HISTORY
Established -1910 Name of the company - Imperial
Tobacco Company of India Limited
Change of name - 1970 Indian Tobacco Company Limited and in 1974 I.T.C. Limited .
Hotels business – 1975 Paperboards business - 1979 Stationery products - 2000
The ITC Mission
Sustain ITC’s position as one of India’s most valuable corporations through world class performance, creating growing value for the Indian economy and the Company’s stakeholders.
To enhance the wealth generating capability of the enterprise in a globalizing environment, delivering superior and sustainable stakeholder value.
The ITC Vision
Vision and mission

PRODUCTS
Tobacco products Stationery products Personal care Safety matches Paperboard Information technology Printing and packaging
ITC slips 2%, govt. may impose tighter norms on smoking
Shares of ITC fell 2 percent intraday Wednesday on government’s tighter norms to put a check on smoking. According to a media report, the government may also ban sale of loose cigarettes. The report states that an expert panel headed by Delhi government’s former principal secretary Ramesh Chandra has submitted its observations to the health ministry.
Balance sheet
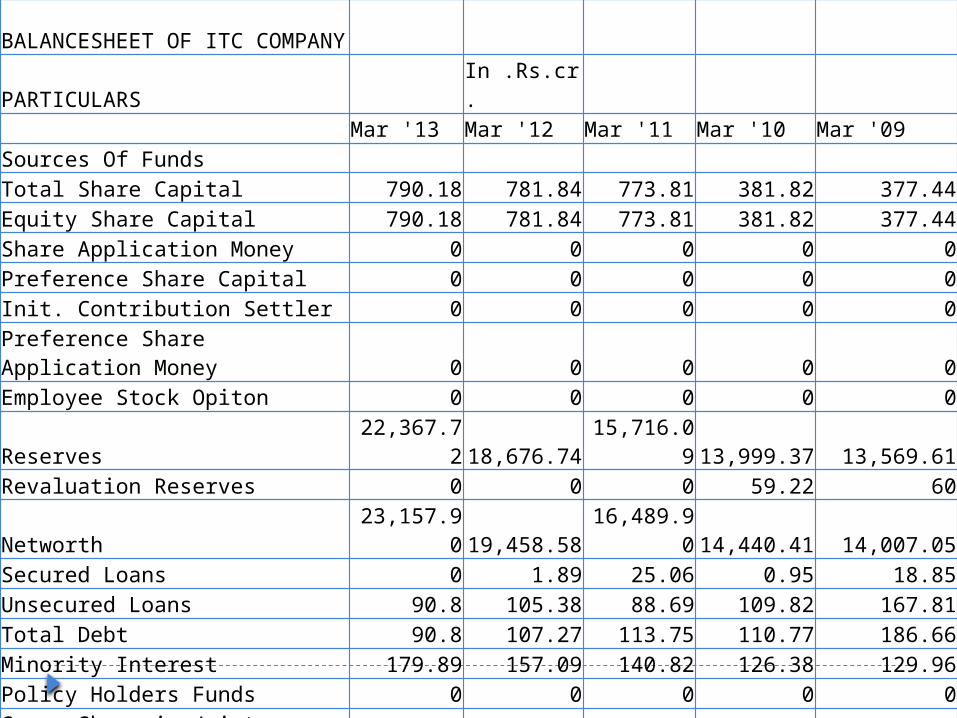
BALANCESHEET OF ITC COMPANYPARTICULARS In .Rs.cr.
Mar '13 Mar '12 Mar '11 Mar '10 Mar '09Sources Of FundsTotal Share Capital 790.18 781.84 773.81 381.82 377.44Equity Share Capital 790.18 781.84 773.81 381.82 377.44Share Application Money 0 0 0 0 0Preference Share Capital 0 0 0 0 0Init. Contribution Settler 0 0 0 0 0Preference Share Application Money 0 0 0 0 0Employee Stock Opiton 0 0 0 0 0
Reserves 22,367.72 18,676.74 15,716.09 13,999.37 13,569.61Revaluation Reserves 0 0 0 59.22 60
Networth 23,157.90 19,458.58 16,489.90 14,440.41 14,007.05Secured Loans 0 1.89 25.06 0.95 18.85Unsecured Loans 90.8 105.38 88.69 109.82 167.81Total Debt 90.8 107.27 113.75 110.77 186.66Minority Interest 179.89 157.09 140.82 126.38 129.96Policy Holders Funds 0 0 0 0 0Group Share in Joint Venture 0 0 0 27.7 35.52
Total Liabilities 23,428.59 19,722.94 16,744.47 14,705.26 14,359.19

Mar '13 Mar '12 Mar '11 Mar '10 Mar '09
12 mths 12 mths 12 mths 12 mths 12 mths
Application Of FundsGross Block 18,055.17 15,243.34 13,798.71 12,974.91 11,513.40Less: Accum. Depreciation 5,909.67 5,230.25 4,621.32 4,218.72 3,667.97Net Block 12,145.50 10,013.09 9,177.39 8,756.19 7,845.43Capital Work in Progress 2,056.36 2,390.79 1,362.28 1,023.58 1,243.12Investments 5,981.28 5,206.83 4,867.80 4,996.51 2,507.07Inventories 7,522.09 6,426.87 5,734.80 5,079.98 4,782.58Sundry Debtors 1,395.76 1,200.20 1,086.68 1,007.44 798.18Cash and Bank Balance 3,828.30 3,130.12 2,426.87 265.48 288.31Total Current Assets 12,746.15 10,757.19 9,248.35 6,352.90 5,869.07Loans and Advances 2,424.09 1,733.67 1,748.75 1,548.07 1,591.35Fixed Deposits 0 0 0 1,082.03 1,028.79Total CA, Loans & Advances 15,170.24 12,490.86 10,997.10 8,983.00 8,489.21Deffered Credit 0 0 0 0 0Current Liabilities 6,585.65 5,899.90 5,497.45 4,508.18 4,061.18Provisions 5,339.14 4,478.73 4,162.65 4,586.48 1,724.92Total CL & Provisions 11,924.79 10,378.63 9,660.10 9,094.66 5,786.10Net Current Assets 3,245.45 2,112.23 1,337.00 -111.66 2,703.11Minority Interest 0 0 0 0 0Group Share in Joint Venture 0 0 0 40.43 60.14Miscellaneous Expenses 0 0 0 0.21 0.32Total Assets 23,428.59 19,722.94 16,744.47 14,705.26 14,359.19

current ratio
1.06 1.20 1.14
0.99
1.45 Current ratio is unsatisfied because current ratio's rule of thumb is 2:1
Current ratio
Current ratio = current assets /current liabilities
Ratio Mar 13
Mar 12
Mar 11
Mar 10
Mar 9 Interpretation

quick ratio
0.43 0.41 0.36
0.13
0.18 Quick ratio is also unsatisfied because it's rule of thumb is 1:1
Quick ratio
Quick ratio = quick assets /current liabilities
Ratio Mar 13
Mar 12 Mar 11
Mar 10
Mar 9Interpretation

Inventory turnover ratio
3.9 3.9 3.6 3.65
3.13 Inventory turnover ratio equally increase in 2011-10 =3.6 and also in 13-12 =3.9
Inventory turnover ratio
Inventory turnover ratio =net sales /average inventory
Ratio Mar 13
Mar 12
Mar 11
Mar 10
Mar 9 Interpretation
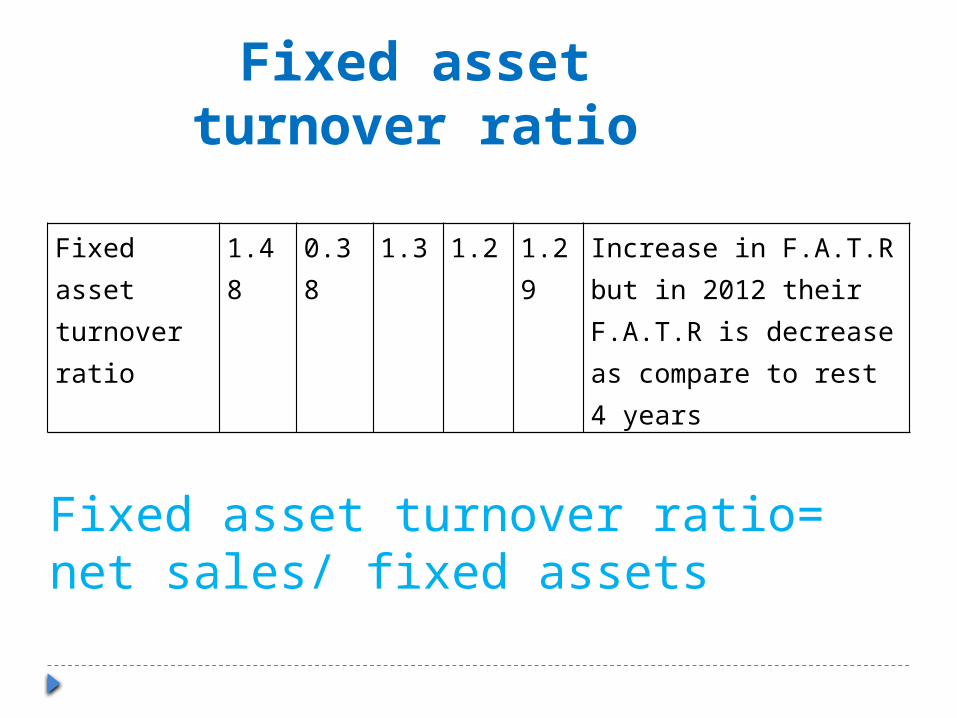
Fixed asset turnover ratio
1.48 0.38 1.3 1.2 1.29
Increase in F.A.T.R but in 2012 their F.A.T.R is decrease as compare to rest 4 years
Fixed asset turnover ratio
Fixed asset turnover ratio= net sales/ fixed assets
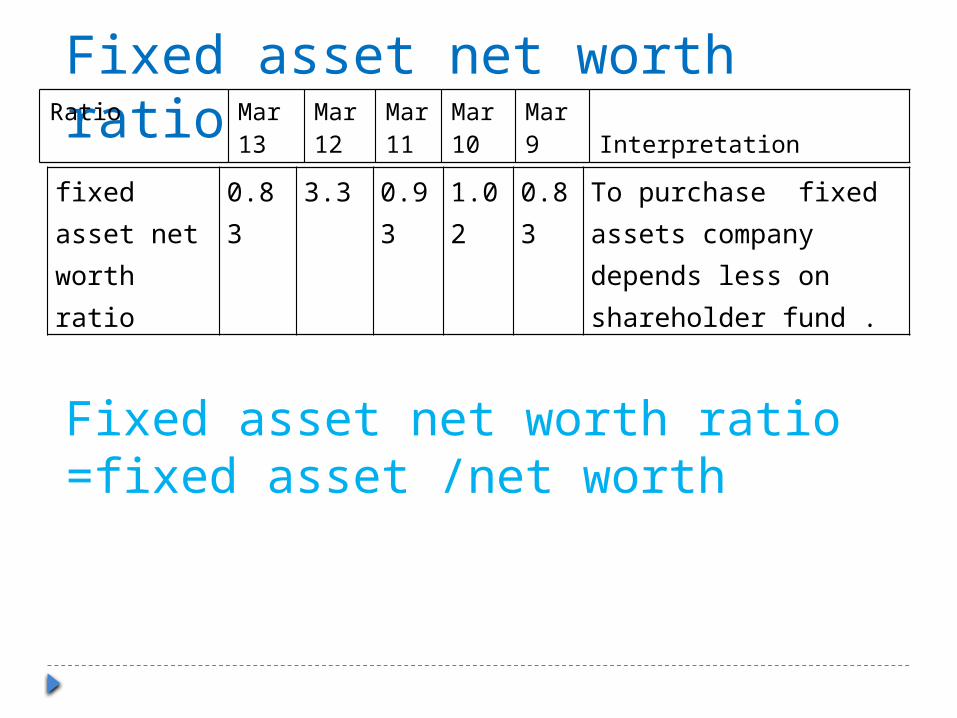
fixed asset net worth ratio
0.83 3.3 0.93
1.02
0.83
To purchase fixed assets company depends less on shareholder fund .
Fixed asset net worth ratio
Fixed asset net worth ratio =fixed asset /net worth
Ratio Mar 13
Mar 12
Mar 11
Mar 10
Mar 9 Interpretation
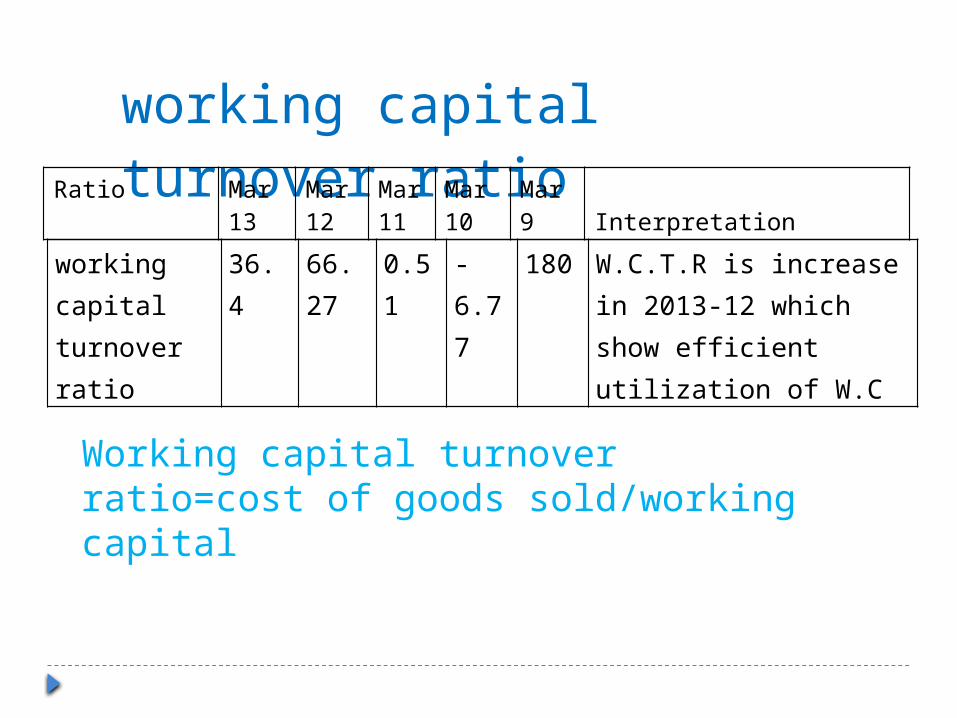
working capital turnover ratio
36.4 66.27
0.51
-6.77
180 W.C.T.R is increase in 2013-12 which show efficient utilization of W.C
working capital turnover ratio
Working capital turnover ratio=cost of goods sold/working capital
Ratio Mar 13
Mar 12
Mar 11
Mar 10
Mar 9 Interpretation
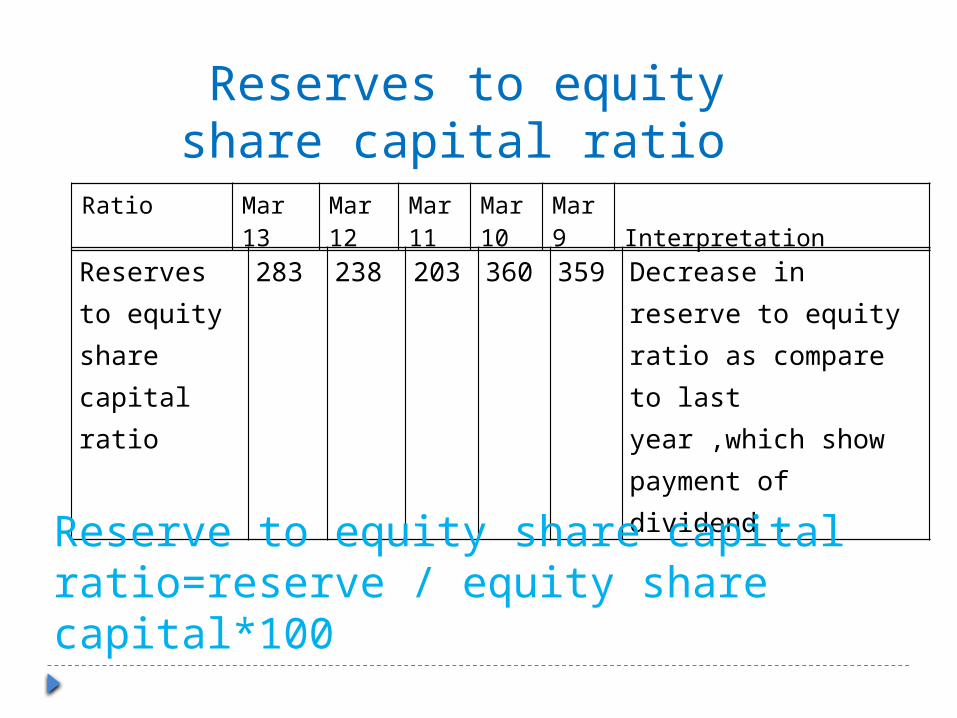
Reserves to equity share capital ratio
283 238 203 360 359 Decrease in reserve to equity ratio as compare to last year ,which show payment of dividend .
Reserves to equity share capital ratio
Reserve to equity share capital ratio=reserve / equity share capital*100
Ratio Mar 13
Mar 12
Mar 11
Mar 10
Mar 9 Interpretation

Selling and adminis. Exp.
0 100 110 112 112 Lower the ratio ,greater the profit
Selling and administrative exp.
Selling and admin. Exp. = selling and admin . Exp/net sale * 100
Ratio Mar 13
Mar 12
Mar 11
Mar 10
Mar 9Interpretation
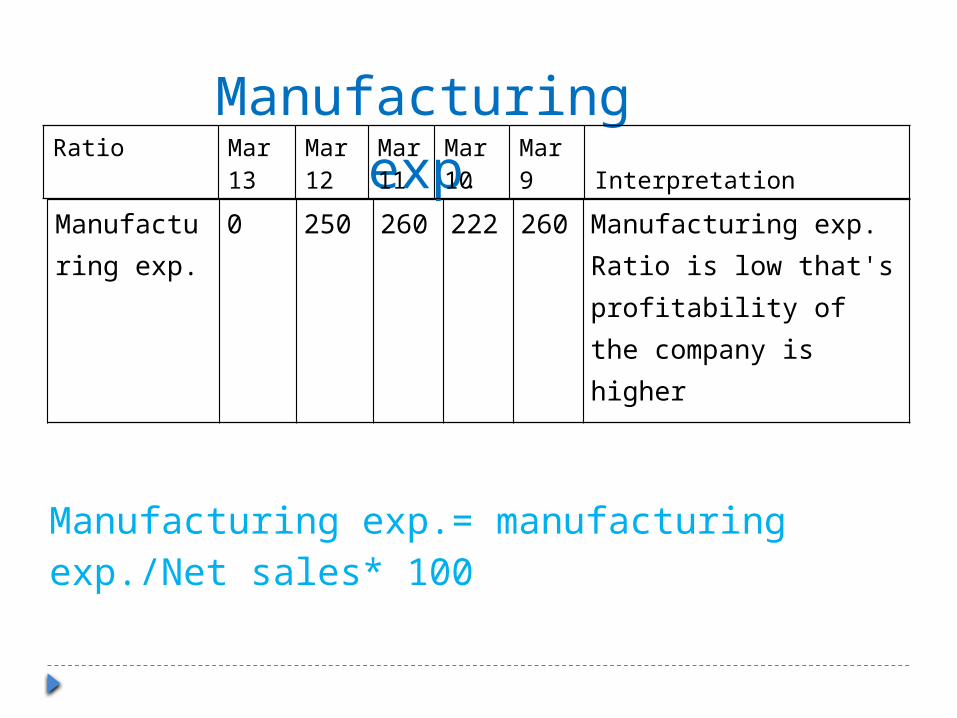
Manufacturing exp.
0 250 260 222 260 Manufacturing exp. Ratio is low that's profitability of the company is higher
Manufacturing exp.
Manufacturing exp.= manufacturing exp./Net sales* 100
Ratio Mar 13
Mar 12
Mar 11
Mar 10
Mar 9 Interpretation

Ratio of C.A to proprietary Fund
55.04
55.2 56.08
44.2
42.8
Increase in C.A to proprietary fund ratio year to year
Current asset to proprietary fund ratio
C. A to proprietary fund ratio= current assets/proprietary fund
Ratio Mar 13
Mar 12
Mar 11
Mar 10
Mar 9 Interpretation
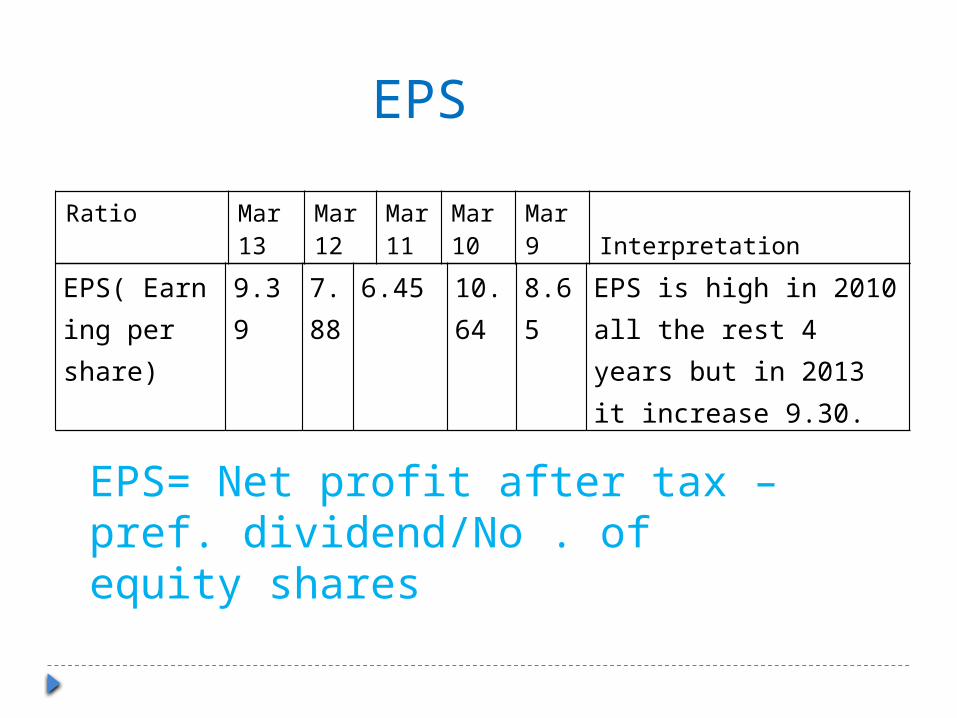
EPS( Earning per share)
9.39 7.88
6.45 10.64
8.65
EPS is high in 2010 all the rest 4 years but in 2013 it increase 9.30.
EPS
EPS= Net profit after tax – pref. dividend/No . of equity shares
Ratio Mar 13
Mar 12
Mar 11
Mar 10
Mar 9 Interpretation

Advantages of product Quality product . Branded products at reasonable price. Market leader in India. Innovation Regular introduction of new products .
Conclusion
Promoting their brands through advertisement.
Focuses on retailing and wholesaler. ITC knows their strength and weakness in the
personal care market, so they are applying new concept to overcome their weaknesses….


![P6 Malpractice & Misconduct 2015 [1] - ITC First · P6 ITC Malpractice and ... P6 Malpractice and Misconduct Policy [1] January 2015 . P6 ITC ... therefore instigated the following](https://static.fdocuments.in/doc/165x107/5b81492b7f8b9a2b678c0861/p6-malpractice-misconduct-2015-1-itc-first-p6-itc-malpractice-and-.jpg)


