Italy: The Italian transition from an emigration to ...idea6fp.uw.edu.pl/pliki/WP5_Italy.pdfItaly:...
92
Italy: The Italian transition from an emigration to immigration country C. Bonifazi Institute of Research on Population and Social Policies (IRPPS-CNR) F. Heins Institute of Research on Population and Social Policies (IRPPS-CNR) S. Strozza Institute of Research on Population and Social Policies (IRPPS-CNR) M. Vitiello Institute of Research on Population and Social Policies (IRPPS-CNR) No. 5, March 2009
Transcript of Italy: The Italian transition from an emigration to ...idea6fp.uw.edu.pl/pliki/WP5_Italy.pdfItaly:...

Italy:
The Italian transition from an emigration to immigration country
C. Bonifazi Institute of Research on Population and Social Policies (IRPPS-CNR) F. Heins Institute of Research on Population and Social Policies (IRPPS-CNR) S. Strozza Institute of Research on Population and Social Policies (IRPPS-CNR)
M. Vitiello Institute of Research on Population and Social Policies (IRPPS-CNR)
No. 5, March 2009

2
Table of contents List of Tables.............................................................................................................................. 3 List of Figures ............................................................................................................................ 4 1. Introduction ............................................................................................................................ 5 2. A long history of emigration: a general overview.................................................................. 6 3. International migration flows in recent decades .................................................................... 9
3.2 International migration flows assessed using population register data .......................... 10 3.2.2 Migration flows of Italians and foreigners: a comparison ...................................... 16 3.2.3 Migration flows by area and country of citizenship since the 1990s ...................... 17
3.3 International migration flows assessed using census data ............................................. 20 3.3.1. The gender and age structure of the foreign population at the time of the 2001 census ............................................................................................................................... 21 3.3.2. The reason given for immigration by the foreign population at the time of the 2001 census ............................................................................................................................... 22 3.3.3. The year of arrival of the foreign population at the 2001 census........................... 24
3.4. The regularisation processes - characteristics of regularisation programmes and numbers of regularised foreigners........................................................................................ 26
3.4.1. Regularisation Programmes: a long history ........................................................... 28 3.4.2. Gender and country of citizenship of regularised immigrants ............................... 30 3.4.3. Periods of immigration and role of regularisation programmes ............................ 31 3.4.4. From regularisations to decrees regulating immigration flows: recent experience 34
4. Size of foreign population in Italy........................................................................................ 36 4.1. Description and critical assessment of statistical sources on foreign population stock 36 4.2 Size, growth and characteristics of the foreign population ............................................ 37
4.2.1. Estimates of regular and irregular foreign population stocks ................................ 37 4.2.2. Size of the regular foreign population stock .......................................................... 38
4.3. Reasons for permits to stay ........................................................................................... 41 4.4. Area and country of origin ............................................................................................ 42 4.5. Geographical Distribution ............................................................................................. 46
5. Migration and integration policies in Italy........................................................................... 51 5.1. Changeover from an emigration to immigration country and the rise of immigration policies ................................................................................................................................. 51 5.2. Entry policies and the conditions of stay ...................................................................... 55 5.3. Integration policies........................................................................................................ 59 5.4. Analysis of the determinants of policies ....................................................................... 62
6. The impact of foreign immigration ...................................................................................... 65 6.1. Demographic impact ..................................................................................................... 65 6.2. Labour market participation and economic impact....................................................... 67 6.3. Social impact ................................................................................................................. 72 6.4. Integration Outcomes .................................................................................................... 74
References ................................................................................................................................ 82 Annex 1 - Italian statistics on migration flows ........................................................................ 88 Annex 2 – Completeness of the 2001 14th General Population and Housing Census.............. 91

3
List of Tables Table 3.1 - Population change and net migration in Italian regional subdivisions, 1951 to 2006.................................................................................................................................................. 10 Table 3.2 - Change in foreign population in Italian regional sub-divisions, 1991-2001 (average absolute yearly values in thousands) ......................................................................... 11 Table 3.3 - Population change in Italian regional subdivisions, 2002-2006 (average absolute yearly values in thousands) ...................................................................................................... 11 Table 3.4 - Immigration and net migration of Italians by regional subdivisions, Italy 1980 to 2004 (absolute values in thousands)......................................................................................... 17 Table 3.5 - Immigration and net migration of foreigners by regional subdivisions, Italy 1980 to 2004 (absolute values in thousands) .................................................................................... 17 Table 3.6a - Resident foreigners born abroad at the time of the 2001 census by sex and age at arrival in Italy, regional subdivisions (absolute values in thousands)...................................... 21 Table 3.6b - Resident foreigners born abroad at the time of the 2001 census by sex and age at arrival in Italy, regional subdivisions (percentages) ................................................................ 22 Table 3.7 - Resident foreigners at the time of 2001 census by sex and motive of moving to Italy, selected citizenships........................................................................................................ 23 Table 3.8 - Resident foreigners at the time of the 2001 census by sex and motive of moving to Italy, regional subdivisions ...................................................................................................... 23 Table 3.9 - Principal characteristics of the programmes to regularise immigrants in an irregular situation, Italy ............................................................................................................ 27 Table 3.10 - Applications of regularisation by country of citizenship, Italy 1990, 1995-96, 1998 and 2002 .......................................................................................................................... 27 Table 4.1 – Some estimates of the foreign population in Italy (a) (absolute values in thousands)................................................................................................................................. 37 Table 4.2 – Permits to stay, resident foreigners, and estimate of regular foreign stock (values in thousands at the beginning of the year)................................................................................ 40 Table 4.3 – Permits to stay according to reason, 1980-2007 (values at the beginning of the year).......................................................................................................................................... 41 Table 4.4 - Permits to stay by geographical area of citizenship, 1971-2007 (values at the beginning of the year) .............................................................................................................. 43 Table 4.5 - Permits to stay by main countries of citizenship, index number and gender structure, beginning 1992, 2000 and 2007 (absolute values in thousands).............................. 44 Table 4.6 – Main countries of citizenship of the permits to stay holders by gender, beginning of some year (absolute values in thousands) ............................................................................ 45 Table 4.7 – Permits to stay by geographical division, 1971-2007 (values at the beginning of the year).................................................................................................................................... 47 Table 4.8 - Foreigners resident by subdivision, region and main provinces, 1993 and 2007 (absolute values in thousands).................................................................................................. 48 Table 4.9 - Province with the highest numbers and percentages of residents foreigners, beginning 1993, 2000 and 2007 ............................................................................................... 49 Table 6.1 – Age structure of resident foreign population, 1991, 2001, 2005 and 2007........... 65 Table 6.2 - Resident foreign and Italian population (15-64 years) by economic condition, 1991, 2001, 2005 and 2007 (absolute values in thousands)..................................................... 68 Table 6.3 - Activity, employment and unemployment rates of resident foreign and Italian population (15-64 years), 2007 (%) ......................................................................................... 68 Table 6.4 – Resident foreign population by economic sector and geographic division, 1991 and 2001 censuses. (absolute values in thousands).................................................................. 70 Table 6.5 – Resident foreign population by economic sector and geographic division, 2007 (absolute values in thousands).................................................................................................. 70

4
Table 6.5 – Rates of school advancement (2004-2005) ........................................................... 76 Table 7.1 Main phases of migration experience ...................................................................... 81 List of Figures Figure 2.1 - Migration flows of Italian nationals (1876-1988) (values in thousands) ............... 6 Figure 3.1 - International migration flows, Italy 1955 to 2006 (absolute values).................... 13 Figure 3.2 - International migration flows, Italy 1955 to 2006 (per 1,000 inhabitants). ......... 13 Figure 3.3 - International migration flows, Italian regional subdivisions 1955 to 2006 (absolute values)....................................................................................................................... 14 Figure 3.4 - International migration flows, Italian regional subdivisions 1955 to 2006 (per 1,000 inhabitants) ..................................................................................................................... 15 Figure 3.5 - International net-migration by citizenship, Italy 1980 to 2006 (absolute values) 16 Figure 3.6 - Immigration of foreigners by sex, Italy 1990 to 2004 (percent of women) ......... 18 Figure 3.7 - Immigration of foreigners by age, Italy 1990 to 2004 (percent of age groups) ... 19 Figure 3.8 - Immigration of foreigners by area of citizenship, Italy 1990 to 2004 selected areas (absolute values in thousands).................................................................................................. 19 Figure 3.9 - Immigration of foreigners by country of citizenship, Italy 1990 to 2004 selected countries (absolute values in thousands) .................................................................................. 20 Figure 3.10 - Foreigners at the time of 2001 census by sex, age (at move) and motive of moving to Italy ......................................................................................................................... 24 Figure 3.11 - Resident foreigners at the 2001 census by sex and year of arrival in Italy ........ 25 Figure 3.12 - Resident foreigners at the time of the 2001 census by sex and year of arrival in Italy, selected citizenships........................................................................................................ 26 Figure 3.13 - Foreigners who applied for regularisation in 2002 by sex and year of arrival in Italy........................................................................................................................................... 32 Figure 3.14 - Foreigners who applied for regularisation in 2002 by sex and year of arrival in Italy, selected citizenships........................................................................................................ 33 Figure 4.1 Permits to stay and resident foreigners according to different sources, 1971-2007 (beginning of the year; values in thousands)............................................................................ 39 Figure 4.2 Acquisition of citizenship according to Ministry of Interior (marriage and residence, 1991-2006) and to ISTAT (population registers data). (absolute values in thousands)................................................................................................................................. 50 Figure 6.1 Age pyramid of the resident foreign population, beginning in 2007...................... 66 Figure 6.2 - Births and deaths of foreigners, marriages with at least one foreign spouse, 1993-2006 (absolute values in thousands)......................................................................................... 67 Figure 6.3 Activity rates of Italians and foreigners by sex and geographic division (only for Italians), 2007 (%); Source: calculations on ISTAT data ....................................................... 69 Figure 6.4 - Foreign students by type of school, 1983/84 (absolute values in thousands) ...... 75

5
1. Introduction For almost a century, Italy was one of the leading European emigration countries and only in the second half of the 1970s did the country begin to receive immigration flows of a certain amount from the Third World and, later, from Central and Eastern Europe (CEE). For this reason we have dedicated Chapter 2 to a brief description of the main stages of migration history before the start of foreign immigration. In Chapter 3, we look at migration flows in terms of arrivals and departures from 1955 onward and, particularly, at flows of foreign immigrants in more recent years. Population registers data are used, as well as census data according to the reason of immigration. Additionally, the characteristics of irregular flows are analysed with the data of regularisations. Chapter 4 analyzes data on foreign population stocks, looking at both the regular and irregular components and evaluates four aspects: reason for stay, area of origin, area of settlement and naturalisation trends. We then move on in Chapter 5 to examine migration policy, assessing the development of regulation, entry policies and conditions of stay, integration policies and the determinants of such policies. In Chapter 6 we turn to describing some aspects of the impact of migration on Italian demographics, the economy and society at large. Our report closes in Chapter 7 with an overall evaluation of Italy’s transformation from an emigration to an immigration country.

6
2. A long history of emigration: a general overview
The only statistical source giving a comprehensive overview of Italian emigration over an extended period is the survey of national emigration conducted from 1876; of national returnees from non-European countries conducted from 1905 and from other European countries conducted from 1921. As expected, these statistics present considerable problems in terms of reliability but they are an extremely useful fact-finding tool notwithstanding their broad quantifications1. The total volume of Italian emigration from 1876 to the early 1980s was more than 26 million, with a corresponding flow of returnees of just under 9 million from 1905 to 1981 [Birindelli 1984]. According to inter-census population estimates, net migration between 1861 and 1981 was in the order of about 8,300,000 individuals [ibidem]. Considering the evolution of migration from 1876 to the second half of the 1970s, when net migration became positive, we can identify six main stages (Figure 2.1) [Federici 1979 and Birindelli 1989]2. Stage 1, from 1876 to the start of the 20th century, was characterised by a steady growth in emigration: from 100,000 expatriations a year at the beginning of the period to more than 300,000 a year in the last five-year period of the 19th century. Up until 1885, emigration to other European destinations prevailed, especially to France, but also to Switzerland, the Austro-Hungarian Empire and Germany; whereas in the following years, transatlantic flows were in the majority, divided almost equally among the United States, Argentina and Brazil. Initially, the migration flows came predominantly from the North of Italy, and it was only towards the end of the century that there was an increase in the share of emigration from the South of the country. Figure 2.1 - Migration flows of Italian nationals (1876-1988) (values in thousands) Source: Federici [1979], Bonifazi and Heins [1996]. Stage 2, running from the beginning of the 1900s until the start of the First World War, was the period when migration increased the most: on average there were more than 600,000 people emigrating each year, peaking at 873,000 emigrants in 1913. In this period, the transatlantic flow accounted for between 55 and 60 per cent of the total, with the United States alone absorbing 1 For an evaluation of this statistical source, see contributions included in Rosoli [1978]. 2 The data reported here are taken from these two works.
0
100
200
300
400
500
600
700
800
900
1000
1876 1886 1896 1906 1916 1926 1936 1946 1956 1966 1976 1986
Years
Emigrants Immigrants

7
more than three million Italian immigrants. The main emigration destinations in continental Europe were France, Germany and Switzerland. In this period, there was an increase in the share of migrants from the South of Italy which came to constitute about half the flows leaving the country. Stage 3 coincided with the First World War and was characterized by a strong reduction in emigration. Stage 4 began at the end of the conflict and lasted until 1930. This was the stage preceding the full implementation of the Fascist government’s anti-migration policy, which was applied progressively from 1924 until 1928 when it achieved full effect. The volume of flows to other European countries increased, with France being the main destination, while migration to the United States fell drastically, above all as a result of increasingly restrictive measures towards immigration, starting with the adoption of the Literacy Act of 1917, barring the entry of illiterate foreigners, up until the introduction of the quota system in 1921, strongly reducing the opportunities for Italians to gain entry [Birindelli 1984]. In the 1930s, which comprise the first part of Stage 5, the anti-migration policy introduced by fascism and the Great Depression that began in 1929 led to a strong contraction in emigration. In the fifteen years covered by this stage, there was considerably less emigration, most of it to other parts of continental Europe. The final period, Stage 6, began at the end of the Second World War when emigration resumed with renewed vitality, although not as strongly as during the peaks at the beginning of the century. In these years, Italy found itself facing two in-flows typical of European migration at the time: migrants arriving from parts of the territory ceded to other states and those coming from the former colonies. In the first case, territories ceded to Yugoslavia witnessed an almost complete exodus of the entire Italian community that was forced to leave the region, even without any formal expulsion provisions being made. It is estimated by various sources that between 200,000 and 350,000 people were involved [Pupo 2001]. In the second case, following the loss of Italy’s African colonies, in November 1949 it was estimated that 206,000 refugees came to Italy: 55,000 from Ethiopia, 45,000 from Eritrea, 12,000 from Somalia, and almost 94,000 from Libya [Del Boca 1984]. The resumption of emigration was an explicit choice of Italian governments, achieved as a result of numerous bilateral agreements with the various European immigration countries (France, Belgium, Switzerland, Germany, the Netherlands, Sweden, Luxemburg, and Great Britain) and some non-European countries (Argentina, Brazil and Australia). Between 1946 and 1965, total outflows numbered 5.6 million emigrants, with a noticeable decline in non-European destinations as early as the second half of the 1950s. In this period, Italian labour constituted the most substantial part of immigration to many European countries. The interesting aspect, from the point of view of region of origin, was that emigration flows were increasingly coming from the South at the same time as departures from the other traditional sending areas of North-East Italy slowed down. After the Second World War, migration was affected by economic conditions in Italy and the main receiving countries [Pugliese 2006]. From the 1960s on, Switzerland and Germany determined the basic emigration trends: the prevailing model was that of the “guest worker” who stayed for short periods, confirmed by migration flow statistics showing high numbers of return-migration flow. This process took place in very different legal contexts given the “free movement” of emigrants to Germany after the establishment of the European Economic Community (EEC) on the one hand, and the stringent controls on emigrants to Switzerland on

8
the other. It is therefore possible to conclude that, during this stage, the Italian emigration model was one of short-period mobility with periods of residence abroad alternating with stays at home. It should be noted that, at the same time, strong economic growth in Central and Northern areas of the country allowed a high degree of internal migration to take place. In fact, in the post-war period, besides emigration flows abroad, Italy was witnessing a strong increase in internal migration from the more economically backward areas of the North-East and the South towards the industrial centres in the North-West and the capital city of Rome [Bonifazi 1999, Bonifazi and Heins 2000]. At the end of this process of population movements, the situation of Italy had profoundly changed: we need only consider that from 1955 to 1970, there were 24.8 million registrations of change-of-address between different municipalities, with negative net migration for the South (a balance of more than - 2 million) [Golini 1974]. In the early 1970s, mainly as a result of the restrictive policies being implemented in the receiving countries, the foreign net migration balance became positive for the first time. And so the long period of mass emigration, begun shortly after the unification of Italy, came to an end. Reaching this balance of migration into and out of the country, an internal balance was also achieved between “strong” and “weak” areas, with a significant reduction of inter-regional internal migration. Overall, Italian emigration in the seventies began a process that, despite exchanges with communities living abroad, would make flows of Italian nationals increasingly similar to the migration patterns of the nationals of other developed countries.

9
3. International migration flows in recent decades
3.1 A critical assessment of statistical sources on migration flows The two main statistical sources on migration flows are the municipal population registers and the general population census. Population register data are reported on a yearly basis with a delay of 2 to 3 years. Each of the more than 8,000 Italian municipalities keeps a population register (anagrafe). Each official responsible for the population register, at least in theory, follows well-defined procedures in registering births, deaths, and changes-of-residence – registrations (iscrizioni) and cancellations (cancellazioni) - to and from other Italian municipalities and to and from abroad. Population register procedures are described in detail in Annex 1. The main problems concerning migration flow data from the population registers are missing or late registrations of immigration and non-cancellations in the case of emigration. There are no specific studies regarding the quality of the population registers. The non-cancellation problem concerns Italian as well as foreign citizens. In the case of Italian citizens a special archive of Italians living abroad (Anagrafe degli Italiani Residenti all’Estero - AIRE) was established by the Law 470/1988 that allows Italian emigrants to retain a special status in Italy and to acquire specific rights (for example, since 2006, the right to vote in parliamentary elections). On emigration, the records of the population registers are transferred to this special archive, with a copy kept at the Ministry of the Interior, but traditionally not all Italian emigrants notify the official of the local population register, especially when the envisaged period of emigration is short. In this case the number of Italian emigrants and, as a consequence, of Italian return migrants is underestimated. In the case of foreigners, different aspects of under-registration are obvious: not all foreigners register on arrival, or in the 3-month period after their arrival in Italy. The various efforts to regularize undocumented immigration (see paragraph 3.4) and the high numbers of foreigners registered as a result indicate the structural shortcomings of the population register system to keep track of foreign immigration. At least, thanks to these efforts to regularize unregistered immigrants, the number of unregistered foreigners is controlled through the different regularisations3. On the other hand, the regularisations are creating the, perhaps justified, expectation that other regularisations will follow. In conclusion, registration of foreign immigration is underestimated and not always timely. Through regularisation efforts immigrants are registered, but the year of registration does not correspond to the year of arrival in Italy. Taking a certain degree of underestimation into account and allowing for a delay in registration, the immigration flows of foreigners as recorded through the population registers should give a realistic idea of trends in migration flows. As the numbers reveal, very few foreigners residing in Italy notify the officials of the population register of their departure. These non-cancellations cause a considerable underestimation of emigration flows and an overestimation of the stock of foreigners residing in Italy. In Italy the General Population and Housing Census is held every 10 years. The last census was conducted on 21 October 2001. The results of the survey regarding the coverage of the 2001 14th General Population and Housing Census are reported in Annex 2. A direct comparison of the two sources of migration data, without indicating which of the two is better, or more comprehensive, is also given.
3 See Table 4.1 for an overview of various estimates of the number of unregistered foreigners.

10
As demonstrated, both Italian data sources regarding information on migration flows have their advantages and their limitations. In the present report data from both sources will be presented and limitations and inconsistencies will be underlined where necessary. However, it seems that in an international context the Italian data offer a relatively high degree of reliability, completeness and accuracy of the information gathered. 3.2 International migration flows assessed using population register data Before examining population register data in detail, the following tables will give an overview of population change in Italy in recent decades. Table 3.1 gives an overview of population change in the period 1951 to 2006 based on a combination of census data (population stock in the census years) and register data (data on natural change and data on population stock for 2002 and 2006). Net migration is calculated and therefore also includes changes in the degree of census undercounting throughout the observation period. Total population change was high in the 1950s, 1960s and 1970s. After years of balanced demographic change in the 1980s and the 1990s, Italy has once again become a demographically dynamic country. Until the 1980s natural change was highly positive and dominated total population change. Net migration was negative in the 1950s and 1960s when Italy was a country of emigration. The beginning of the 1970s with the economic crises in most destination countries reduced the outflows. Emigration further decreased and return migration increased in the 1980s at a time of economic development in Italy. The last period from 2002 to 2006 is characterized by high (foreign) immigration determining the total population change. The population register data indicate an annual net migration flow of 439,000, which amounts to an average yearly migration gain of about 7.6 per thousand inhabitants. Table 3.1 - Population change and net migration in Italian regional subdivisions, 1951 to 2006
Population change (average annual value in 1,000)
Population change (average annual value per 1,000 inhabitants) Period
natural change net migration total change natural change net migration total change
1951-1961 415 -104 311 8.5 -2.1 6.3 1961-1971 456 -105 351 8.7 -2.0 6.7 1971-1981 238 4 242 4.3 0.1 4.4 1981-1991 42 -20 22 0.7 -0.3 0.4 1991-2001 -18 40 22 -0.3 0.7 0.4 2002-2006 -11 439 428 -0.2 7.6 7.4
Source: estimates based on Italian National Statistics Institute (ISTAT) data. Table 3.2 focuses on the foreign population during the inter-census period 1991 to 2001. During this period, there was a growing presence of foreign population in all geographic sub-divisions, but this was concentrated (with an increase of more than one-third) in the North-West sub-division, which comprises the Milan and Turin metropolitan areas. The North-West was followed by the North-East and the Centre. During the 1991-2001 period, natural change was of minor importance with an average yearly value of 13 per 1,000 at the national level. Migration flows determined the change in the foreign population throughout this period. The acquisition of Italian citizenship - an average of about 9,000 a year - was not very high, but indicated that the foreign population concerned was, in part, a population of long-term residents in Italy4. 4 The analysis of the 2001 census data in paragraph 3.3 will show this clearly.

11
Table 3.2 - Change in foreign population in Italian regional sub-divisions, 1991-2001 (average absolute yearly values in thousands)
Foreign population Regional Subdivisions Total change natural change Net migration
Acquisition of Italian citizenship
North-West 35 5 34 -3 North-East 29 3 28 -2 Central 23 3 22 -2 South 11 2 10 -1 ITALY 98 13 94 -9
Source: estimates based on ISTAT data. During the following period, which brings us close to the present day, the total change in the foreign population increased more than threefold: from a yearly increase of 98,000 to 316,000 (Table 3.3). Table 3.3 - Population change in Italian regional subdivisions, 2002-2006 (average absolute yearly values in thousands)
Regional subdivisions
Total change
Natural change
Net internal migration(a)
Net international
migration
Other changes
Acquisition of Italian
citizenship
Total Population (Italians and Foreigners)
North-West 139 -16 22 104 29 … North-East 113 -7 35 78 7 … Central 126 -13 21 71 46 … South 50 24 -47 35 37 … ITALY 428 -11 30 289 120 …
Foreign population
North-West 118 17 8 103 -2 -7 North-East 87 13 8 76 -3 -7 Central 78 9 -1 71 3 -5 South 33 3 -6 39 -1 -3 ITALY 316 42 9 290 -2 -23
Note: (a) Net internal migration is not zero, because provisional data are used that did not yet undergo the verification process between registrations and cancellations in different municipalities. Sources: elaboration by ISTAT data from Population Registers. The total change in the foreign population is slightly more concentrated in the North-West, due to various factors. In fact all components (natural change, internal migration, but mainly international inflows) contributed to the gains of the North-Western sub-division. Compared to the 1991-2001 period there are no considerable changes in relative terms, but the positive contribution of the foreign population to natural population change is evident. Only the South of Italy has a positive natural balance without taking the foreign population into account. In the other regional sub-divisions, the negative natural balance would be even greater without the foreign population. Interestingly, internal migration does not only involve the Italian population, but the foreign population is also participating in the internal migration process and contributing to the traditional migration flows from Southern Italy to the economically more prosperous Northern sub-divisions5. Net international migration of the total population mirrors the net international migration of the foreign population and exhibits similar regional patterns. Only in the South does the total population show slightly lower values than the 5 In 2003, foreigners were 9.8 per cent of all internal migrations.

12
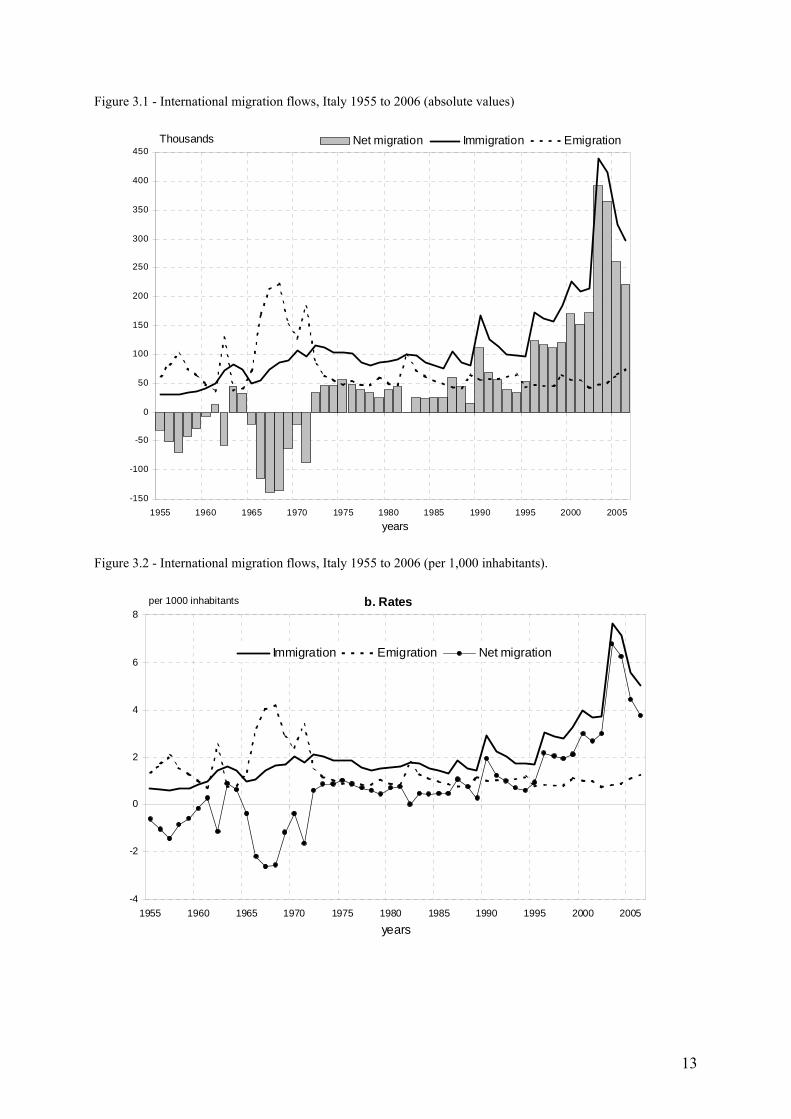
foreign population, due to the loss of Italian population through a negative difference between continuous emigration flows and return migration flows. The category ‘Other changes’ includes the results of corrections to the municipal population registers after verification procedures following the 2001 population census. The importance of acquiring Italian citizenship did not increase in the last period of observation in relative terms, but in absolute terms. Every year there were about 23,000 foreigners who became Italians. 3.2.1. The long view: from emigration to immigration As already emphasized, Italy must be considered a country of emigration until the beginning of the 1970s. Italian emigration followed various models. One part of emigration was seen as permanent emigration, whereas migration flows toward Western European countries such as Switzerland and Germany were considered very often a temporary emigration leading to a kind of shuttle migration. Thus, temporary migration back and forth was frequently not reflected in the population registers. Figure 3.1 shows clearly that this phase ended at the beginning of the 1970s. Apart from local peaks in emigration linked to the post-census operations of updating the population registers, emigration flows, in part managed through bilateral treaties with the destination countries, were dependent on the economic situation in the destination countries. Since the mid-1970s these emigration flows have fluctuated around 50,000 persons per year. Immigration flows were, for many years, return flows linked to previous emigration flows, but from the 1980s and especially from the mid-1990s, immigration flows often involved more and more foreign nationals (around 80 per cent of the total). In recent years, the local peaks in immigration flows have often been due to the regularisation programmes, which are discussed in detail in other parts of this report. Figure 3.2 relates migration flows and net migration to the resident population to compare the quantitative impact of international migration on the population in Italy over time. In recent years, immigration has clearly exceeded the impact emigration had in the 1960s. Analysing the same statistical information at the level of regional subdivisions (Figure 3.3 and 3.4) it must be concluded that Italy is clearly divided into different regional sub-systems as regards international migration processes. The stage of emigration (corresponding to stage 6 in ‘A long history of emigration’), was hardly observable in the North-West. In the Centre, only a short period in the second half of the 1950s and again in the late 1960s saw some emigration, leading to a population loss. The North-East and especially the South were the emigration areas in the 1950s and the 1960s. In the South the population loss due to emigration was, in absolute and relative terms (Figures 3.3 and 3.4), the by far most important, and the process had wider effects. Even in the 1980s and 1990s emigration continued to play a role. In the immigration stage of the Italian migration process, the South is almost excluded. Whereas in absolute terms the North-West is clearly in the forefront, in relative terms immigration is similarly important for the North-West, the North-East and the Centre sub-divisions.
13
Figure 3.1 - International migration flows, Italy 1955 to 2006 (absolute values)
Figure 3.2 - International migration flows, Italy 1955 to 2006 (per 1,000 inhabitants).
-150
-100
-50
0
50
100
150
200
250
300
350
400
450
1955 1960 1965 1970 1975 1980 1985 1990 1995 2000 2005years
Thousands Net migration Immigration Emigration
b. Rates
-4
-2
0
2
4
6
8
1955 1960 1965 1970 1975 1980 1985 1990 1995 2000 2005
years
per 1000 inhabitants
Immigration Emigration Net migration

14
Figure 3.3 - International migration flows, Italian regional subdivisions 1955 to 2006 (absolute values)
a. North-West
-100
-50
0
50
100
150
1955 1960 1965 1970 1975 1980 1985 1990 1995 2000 2005years
Thousands
Net migration Immigration Emigration
b. North-East
-100
-50
0
50
100
150
1955 1960 1965 1970 1975 1980 1985 1990 1995 2000 2005
Net migration Immigration Emigration
c. Centre
-100
-50
0
50
100
150
1955 1960 1965 1970 1975 1980 1985 1990 1995 2000 2005years
Thousands
Net migration Immigration Emigration
d. Mezzogiorno
-100
-50
0
50
100
150
1955 1960 1965 1970 1975 1980 1985 1990 1995 2000 2005
Net migration Immigration Emigration

15
Figure 3.4 - International migration flows, Italian regional subdivisions 1955 to 2006 (per 1,000 inhabitants)
a. North-West
-6
-4
-2
0
2
4
6
8
10
1955 1960 1965 1970 1975 1980 1985 1990 1995 2000 2005years
per 1000 inhabitants
Immigration Emigration Net migration
b. North-East
-6
-4
-2
0
2
4
6
8
10
1955 1960 1965 1970 1975 1980 1985 1990 1995 2000 2005
Immigration Emigration Net migration
c. Centre
-6
-4
-2
0
2
4
6
8
10
1955 1960 1965 1970 1975 1980 1985 1990 1995 2000 2005
Immigration Emigration Net migration
d. Mezzogiorno
-6
-4
-2
0
2
4
6
8
10
1955 1960 1965 1970 1975 1980 1985 1990 1995 2000 2005
Immigration Emigration Net migration

16
3.2.2. Migration flows of Italians and foreigners: a comparison Obviously, these two stages of the international migration process in Italy have different actors. Until 1980, very few foreigners lived in Italy and emigration only involved Italians (predominantly from the North-East and the South of the country). In contrast, the immigration flows involved primarily foreigners. In the 1980s net migration in Italy was fairly balanced and Italians and foreigners both showed a slight migration gain, but in the second half of the 1980s the situation changed and net foreign migration increased considerably, whereas net Italian migration even became negative in several years (Figure 3.5). Figure 3.5 - International net-migration by citizenship, Italy 1980 to 2006 (absolute values)
Tables 3.4 and 3.5 allow for a more detailed analysis of the differences regarding immigration flows and net migration of Italians and foreigners in the regional Italian context. Emigration and immigration of Italians continue to play a role, even if the overall level continues to diminish. The interplay between emigration and immigration flows of the Italian population led to a migration loss over the entire period of 1995-1999 of 58,000. In more recent periods, immigration and emigration is almost balanced. Since the 1990s, Italians from the South have begun to migrate once again. It seems that Italian emigration has not yet run its course. As already mentioned, emigration flows of foreigners seem to be still negligible, or as hypothesised above, seem not to be covered and counted adequately in the population register system. Nevertheless, Table 3.5 summarises, from a regional perspective, the considerable impact that the immigration flows of the foreign population have. In the 1980s the international migration of foreigners still had less quantitative importance and was probably governed by very different factors and not predominantly by the labour market6. In the 1990s 6 We would like to emphasise the importance of religious and other institutions in Italy that account for a small but continuous flow of foreigners to and from Italy.
-50
0
50
100
150
200
250
300
350
400
1980 1982 1984 1986 1988 1990 1992 1994 1996 1998 2000 2002 2004 2006
Italians Foreigners

17
the North-West became the prime subdivision of destination. Today net migration of the foreign population is the highest in the North-West, followed by the North-East and the Centre. However, in-migration flows of foreigners also effect the South, although to a lesser extent. Table 3.4 - Immigration and net migration of Italians by regional subdivisions, Italy 1980 to 2004 (absolute values in thousands)
Period North-West North-East Centre South Italy Immigration 1980-84 55 48 60 195 357 1985-89 48 39 62 133 283 1990-94 56 50 64 107 277 1995-99 34 27 23 65 150 2000-04 47 38 34 84 204 Net migration 1980-84 5 11 31 6 53 1985-89 8 12 27 11 58 1990-94 19 21 26 -54 12 1995-99 -8 1 -2 -48 -58 2000-04 7 10 1 -23 -4
Source: ISTAT, Population Registers. Table 3.5 - Immigration and net migration of foreigners by regional subdivisions, Italy 1980 to 2004 (absolute values in thousands)
North-West North-East Centre South Italy
Immigration 1980-84 35 18 29 25 108 1985-89 52 26 29 39 147 1990-94 106 74 77 73 330 1995-99 213 144 159 108 624 2000-04 466 332 324 178 1,300
Net migration 1980-84 24 13 24 20 81 1985-89 39 21 21 34 115 1990-94 93 67 69 69 298 1995-99 197 133 150 103 583 2000-04 450 317 314 173 1,254
Source: ISTAT, Population Registers. 3.2.3. Migration flows by area and country of citizenship since the 1990s The demographic characteristics of the foreign population fluctuated more during the early years when immigration flows were not so large. In recent years the immigration flows of foreigners have been relatively balanced as regards gender (Figure 3.6). This result is, however, due to the compensation between imbalances in the gender composition of the different national groups immigrating into Italy. The imbalances are sometimes particularly marked, in some cases favour men and in other cases favour women. Considering only the more numerically important nationalities, we see a clear prevalence of men among the Tunisians, Moroccans and Albanians (in the ten years 1995-2004, women accounted for 32,

18
38 and 42 per cent respectively of these immigrant groups. Among the Filipinos, women predominated (60 per cent), as was the case for the former Soviet Union and, in particular, Ukraine. Other groups were more balanced, such as the Chinese (45.5 per cent are women), and above all, the Romanians (50.7 per cent of women). Regarding the age structure, the 20- to 39-year-olds dominate (Figure 3.7). These people fell within the first working-age cohorts and accounted for approximately two thirds of all immigrants, indicative of the fact that work was still clearly the main reason for migration. The share of the younger population among immigrants fluctuated around 20 per cent, showing that migration intentions were for the medium-long term and that children who followed or arrived later for family reunification then stabilised. This proportion did not, however, increase with time, the trend actually mirrored the 20- to 39-year-old group of immigrants for whom there were peaks following regularisations and troughs in the intervening years. The share of the younger population declined as the adults were recorded in the municipal population registers following regularisations and increased a couple of years later as a result of family reunions. This is the correct interpretation of the fall in the share in 2003-04, when a huge number of foreign adults were added to the municipal population registers following the 2002 regularisation, which is discussed in more detail below. The effect of the most recent regularisation can also clearly be seen in the growth in the proportion of registrations of foreigners aged 40-59 years. Immigration of foreigners aged 60 or older was still the exception, accounting for a negligible share of total arrivals. Figure 3.6 - Immigration of foreigners by sex, Italy 1990 to 2004 (percent of women)
Data on immigrants in the last 15 years per area or country of citizenship allow us to identify when new migration flows started, when pre-existing flows intensified, and when arrivals from some sending areas began to slow down. First, it should be underlined that data for all the countries of citizenship are available since 1995, and, as a consequence, for some nationalities that are important today, up until that date information was included in larger geographic macro-areas. Figure 3.8 shows that, over all countries of origin, over time, there has been an increase in registrations in the municipal registers from abroad, although there are peaks due to the regularisations that are more or less marked according to area. At the beginning of the 1990s
30
40
50
60
70
1991 1993 1995 1997 1999 2001 2003year
%

19
immigration from Africa predominated, especially following regularisations in 1990 and 1995-96. But from the second half of the 1990s onwards, immigration from Central and Eastern Europe clearly became the most important group, in particular as a result of the regularisations in 1998 (shown by municipal register entries in 2000) and in 2002 (effects seen in registrations in 2003 and 2004). Immigration from Asia and Latin America also increased, the latter with a marked rise in the latest period when there was also a sharp rise in the number of African immigrants following the regularisation. Figure 3.7 - Immigration of foreigners by age, Italy 1990 to 2004 (percent of age groups)
Figure 3.8 - Immigration of foreigners by area of citizenship, Italy 1990 to 2004 selected areas (absolute values in thousands)
0
20
40
60
80
1991 1993 1995 1997 1999 2001 2003year
%
0-1920-3940-5960+
0
25
50
75
100
125
150
175
200
225
1990 1992 1994 1996 1998 2000 2002 2004
year
Thousands
Non-EU EuropeAfricaAsiaLatin America
20
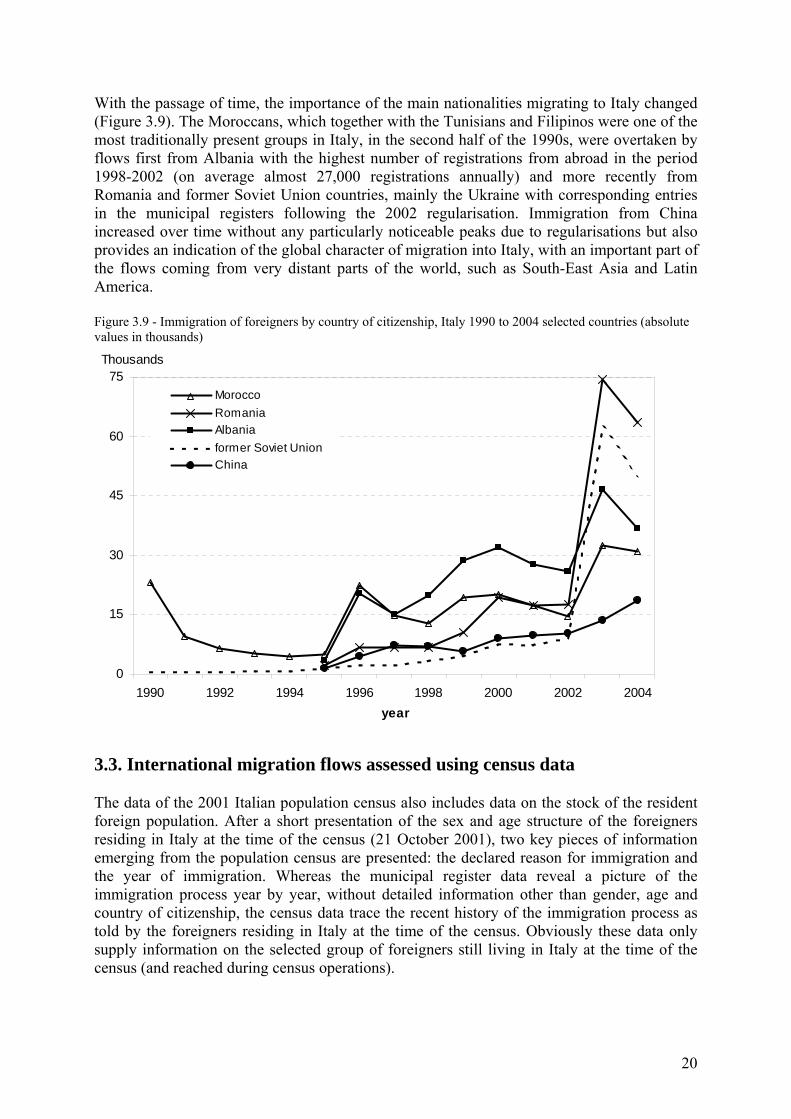
With the passage of time, the importance of the main nationalities migrating to Italy changed (Figure 3.9). The Moroccans, which together with the Tunisians and Filipinos were one of the most traditionally present groups in Italy, in the second half of the 1990s, were overtaken by flows first from Albania with the highest number of registrations from abroad in the period 1998-2002 (on average almost 27,000 registrations annually) and more recently from Romania and former Soviet Union countries, mainly the Ukraine with corresponding entries in the municipal registers following the 2002 regularisation. Immigration from China increased over time without any particularly noticeable peaks due to regularisations but also provides an indication of the global character of migration into Italy, with an important part of the flows coming from very distant parts of the world, such as South-East Asia and Latin America. Figure 3.9 - Immigration of foreigners by country of citizenship, Italy 1990 to 2004 selected countries (absolute values in thousands)
3.3. International migration flows assessed using census data The data of the 2001 Italian population census also includes data on the stock of the resident foreign population. After a short presentation of the sex and age structure of the foreigners residing in Italy at the time of the census (21 October 2001), two key pieces of information emerging from the population census are presented: the declared reason for immigration and the year of immigration. Whereas the municipal register data reveal a picture of the immigration process year by year, without detailed information other than gender, age and country of citizenship, the census data trace the recent history of the immigration process as told by the foreigners residing in Italy at the time of the census. Obviously these data only supply information on the selected group of foreigners still living in Italy at the time of the census (and reached during census operations).
0
15
30
45
60
75
1990 1992 1994 1996 1998 2000 2002 2004year
Thousands
MoroccoRomaniaAlbaniaformer Soviet UnionChina

21
3.3.1. The gender and age structure of the foreign population at the time of the 2001 census Of the 1,334,900 foreign residents counted by the 2001 census, 1,175,800 (Table 3.6a) immigrated to Italy. In the years leading up to the census, immigration was concentrated in the younger age groups: 33.4 per cent in the 25-34 years age group, followed by the age groups 15-24 (30.7 per cent) and 0-14 (17.4 per cent). Slight gender differences did exist, but did not seem systematic. Foreigners living in the North-West and the North-East seemed to be more concentrated in the 15-34 age group. Table 3.6 reports the sex and age structure of the foreign population born abroad. The share of foreigners born in Italy was about 12 per cent and did not vary substantially by regional sub-divisions. The age structure of the foreign population at the time of the census was more balanced, with a peak of 28.6 per cent in the 25-34 years age group, followed by the age groups 35-44, 0-14 and 15-24. On average, foreigners living in the Centre and the South seemed to be slightly older at the census date. Table 3.6a - Resident foreigners born abroad at the time of the 2001 census by sex and age at arrival in Italy, regional subdivisions (absolute values in thousands)
Resident foreigners Age at arrival North-West North-East Centre South Italy
Men 0-14 35.8 28.2 25.0 15.5 104.5 15-24 61.5 50.4 39.2 20.1 171.2 25-34 73.7 57.3 44.3 24.2 199.5 35-44 23.4 19.2 17.2 10.1 69.8 45-54 6.1 4.9 5.7 3.1 19.7 55-64 2.7 2.2 2.8 1.2 9.0 65-74 1.2 1.1 1.2 0.4 3.8 75+ 0.5 0.3 0.3 0.2 1.3 Total 204.9 163.6 135.7 74.8 578.9 Women 0-14 33.6 25.8 24.6 15.9 100.0 15-24 65.2 48.4 51.4 25.0 190.0 25-34 68.0 48.7 52.5 24.7 193.8 35-44 23.1 16.4 19.5 9.7 68.7 45-54 7.5 6.0 7.6 3.7 24.7 55-64 3.9 3.3 3.9 1.7 12.7 65-74 1.7 1.4 1.5 0.6 5.2 75+ 0.6 0.5 0.5 0.2 1.8 Total 203.5 150.5 161.4 81.5 596.9 Total 0-14 69.4 54.0 49.6 31.5 204.5 15-24 126.7 98.8 90.6 45.1 361.2 25-34 141.7 106.0 96.7 48.9 393.3 35-44 46.5 35.6 36.7 19.7 138.5 45-54 13.5 10.9 13.2 6.8 44.5 55-64 6.6 5.5 6.7 2.9 21.7 65-74 2.9 2.5 2.6 1.1 9.1 75+ 1.1 0.8 0.9 0.4 3.1 Total 408.4 314.1 297.1 156.2 1,175.8
Source: ISTAT, Population and Housing Census 2001.

22
Table 3.6b - Resident foreigners born abroad at the time of the 2001 census by sex and age at arrival in Italy, regional subdivisions (percentages)
Resident foreigners Age at arrival North-West North-East Centre South Italy
Men 0-14 17.5 17.2 18.4 20.8 18.1 15-24 30.0 30.8 28.9 26.9 29.6 25-34 36.0 35.0 32.6 32.4 34.5 35-44 11.4 11.7 12.7 13.5 12.1 45-54 3.0 3.0 4.2 4.1 3.4 55-64 1.3 1.4 2.1 1.6 1.6 65-74 0.6 0.6 0.8 0.6 0.7 75+ 0.2 0.2 0.3 0.2 0.2 Total 100.0 100.0 100.0 100.0 100.0 Women 0-14 16.5 17.1 15.3 19.6 16.7 15-24 32.0 32.2 31.8 30.7 31.8 25-34 33.4 32.3 32.5 30.3 32.5 35-44 11.4 10.9 12.1 11.8 11.5 45-54 3.7 4.0 4.7 4.5 4.1 55-64 1.9 2.2 2.4 2.1 2.1 65-74 0.8 1.0 0.9 0.8 0.9 75+ 0.3 0.3 0.3 0.3 0.3 Total 100.0 100.0 100.0 100.0 100.0 Total 0-14 17.0 17.2 16.7 20.1 17.4 15-24 31.0 31.4 30.5 28.9 30.7 25-34 34.7 33.7 32.6 31.3 33.4 35-44 11.4 11.3 12.3 12.6 11.8 45-54 3.3 3.5 4.5 4.3 3.8 55-64 1.6 1.8 2.3 1.8 1.8 65-74 0.7 0.8 0.9 0.7 0.8 75+ 0.3 0.3 0.3 0.2 0.3 Total 100.0 100.0 100.0 100.0 100.0
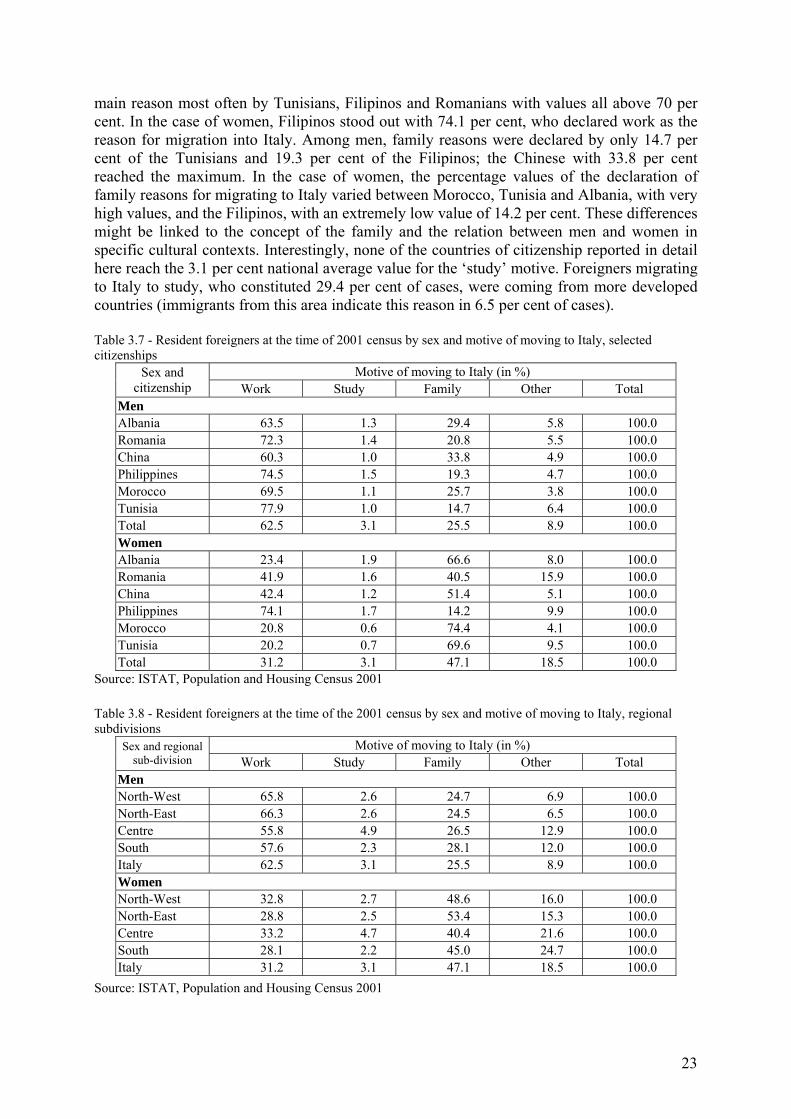
Source: ISTAT, Population and Housing Census 2001 3.3.2. The reason given for immigration by the foreign population at the time of the 2001 census One of the most important census questions asked of foreign residents was the reason for their move to Italy. Among the 1,175,800 foreign residents, 46.6 per cent declared ‘work’ as the main reason for their move to Italy, followed by 36.5 per cent who declared that the presence of family members was the principal reason. Some 3.1 per cent came to Italy to study and 13.8 per cent declared other motives. Obviously there were important differences between men and women: whereas 62.5 per cent of foreign men declared ‘work’ as the main reason, in the case of women this percentage decreased to 31.2 per cent. However, family reasons were more important for women (47.1 per cent) than for men (25.5 per cent). The group of motives described as ‘other’, representing 8.9 per cent of the cases among men and 18.5 per cent of the cases among women, are not commented on, because they were too unspecific. Table 3.7 shows the important differences in the declaration of the main reason for the move to Italy between the various countries of citizenship7. Among men, ‘work’ was declared as the
7 The countries of citizenship selected are the countries with the most numerous foreign communities in Italy at the 2001 census.
23
main reason most often by Tunisians, Filipinos and Romanians with values all above 70 per cent. In the case of women, Filipinos stood out with 74.1 per cent, who declared work as the reason for migration into Italy. Among men, family reasons were declared by only 14.7 per cent of the Tunisians and 19.3 per cent of the Filipinos; the Chinese with 33.8 per cent reached the maximum. In the case of women, the percentage values of the declaration of family reasons for migrating to Italy varied between Morocco, Tunisia and Albania, with very high values, and the Filipinos, with an extremely low value of 14.2 per cent. These differences might be linked to the concept of the family and the relation between men and women in specific cultural contexts. Interestingly, none of the countries of citizenship reported in detail here reach the 3.1 per cent national average value for the ‘study’ motive. Foreigners migrating to Italy to study, who constituted 29.4 per cent of cases, were coming from more developed countries (immigrants from this area indicate this reason in 6.5 per cent of cases). Table 3.7 - Resident foreigners at the time of 2001 census by sex and motive of moving to Italy, selected citizenships
Motive of moving to Italy (in %) Sex and citizenship Work Study Family Other Total
Men Albania 63.5 1.3 29.4 5.8 100.0 Romania 72.3 1.4 20.8 5.5 100.0 China 60.3 1.0 33.8 4.9 100.0 Philippines 74.5 1.5 19.3 4.7 100.0 Morocco 69.5 1.1 25.7 3.8 100.0 Tunisia 77.9 1.0 14.7 6.4 100.0 Total 62.5 3.1 25.5 8.9 100.0 Women Albania 23.4 1.9 66.6 8.0 100.0 Romania 41.9 1.6 40.5 15.9 100.0 China 42.4 1.2 51.4 5.1 100.0 Philippines 74.1 1.7 14.2 9.9 100.0 Morocco 20.8 0.6 74.4 4.1 100.0 Tunisia 20.2 0.7 69.6 9.5 100.0 Total 31.2 3.1 47.1 18.5 100.0
Source: ISTAT, Population and Housing Census 2001 Table 3.8 - Resident foreigners at the time of the 2001 census by sex and motive of moving to Italy, regional subdivisions
Motive of moving to Italy (in %) Sex and regional sub-division Work Study Family Other Total
Men North-West 65.8 2.6 24.7 6.9 100.0 North-East 66.3 2.6 24.5 6.5 100.0 Centre 55.8 4.9 26.5 12.9 100.0 South 57.6 2.3 28.1 12.0 100.0 Italy 62.5 3.1 25.5 8.9 100.0 Women North-West 32.8 2.7 48.6 16.0 100.0 North-East 28.8 2.5 53.4 15.3 100.0 Centre 33.2 4.7 40.4 21.6 100.0 South 28.1 2.2 45.0 24.7 100.0 Italy 31.2 3.1 47.1 18.5 100.0
Source: ISTAT, Population and Housing Census 2001
24
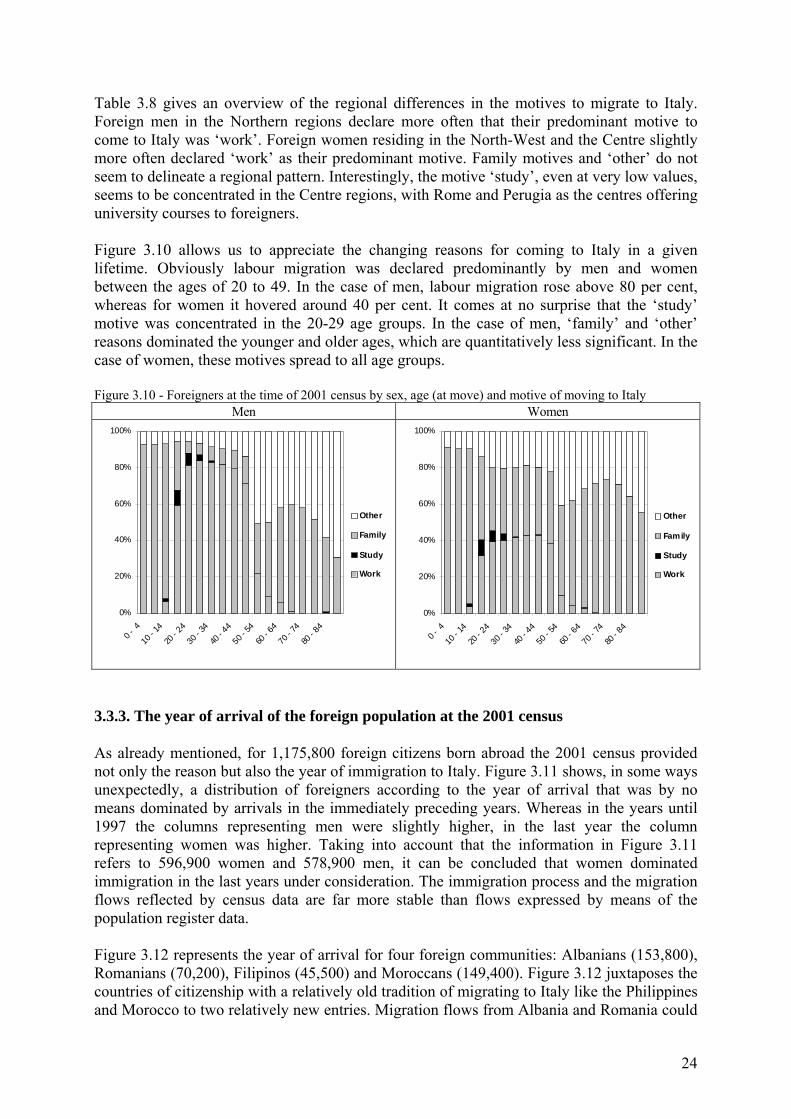
Table 3.8 gives an overview of the regional differences in the motives to migrate to Italy. Foreign men in the Northern regions declare more often that their predominant motive to come to Italy was ‘work’. Foreign women residing in the North-West and the Centre slightly more often declared ‘work’ as their predominant motive. Family motives and ‘other’ do not seem to delineate a regional pattern. Interestingly, the motive ‘study’, even at very low values, seems to be concentrated in the Centre regions, with Rome and Perugia as the centres offering university courses to foreigners. Figure 3.10 allows us to appreciate the changing reasons for coming to Italy in a given lifetime. Obviously labour migration was declared predominantly by men and women between the ages of 20 to 49. In the case of men, labour migration rose above 80 per cent, whereas for women it hovered around 40 per cent. It comes at no surprise that the ‘study’ motive was concentrated in the 20-29 age groups. In the case of men, ‘family’ and ‘other’ reasons dominated the younger and older ages, which are quantitatively less significant. In the case of women, these motives spread to all age groups. Figure 3.10 - Foreigners at the time of 2001 census by sex, age (at move) and motive of moving to Italy
Men Women
3.3.3. The year of arrival of the foreign population at the 2001 census As already mentioned, for 1,175,800 foreign citizens born abroad the 2001 census provided not only the reason but also the year of immigration to Italy. Figure 3.11 shows, in some ways unexpectedly, a distribution of foreigners according to the year of arrival that was by no means dominated by arrivals in the immediately preceding years. Whereas in the years until 1997 the columns representing men were slightly higher, in the last year the column representing women was higher. Taking into account that the information in Figure 3.11 refers to 596,900 women and 578,900 men, it can be concluded that women dominated immigration in the last years under consideration. The immigration process and the migration flows reflected by census data are far more stable than flows expressed by means of the population register data. Figure 3.12 represents the year of arrival for four foreign communities: Albanians (153,800), Romanians (70,200), Filipinos (45,500) and Moroccans (149,400). Figure 3.12 juxtaposes the countries of citizenship with a relatively old tradition of migrating to Italy like the Philippines and Morocco to two relatively new entries. Migration flows from Albania and Romania could
0%
20%
40%
60%
80%
100%
0 - 4
10 - 1
4
20 - 2
4
30 - 3
4
40 - 4
4
50 - 5
4
60 - 6
4
70 - 7
4
80 - 8
4
Other
Family
Study
Work
0%
20%
40%
60%
80%
100%
0 - 4
10 - 1
4
20 - 2
4
30 - 3
4
40 - 4
4
50 - 5
4
60 - 6
4
70 - 7
4
80 - 8
4
Other
Family
Study
Work
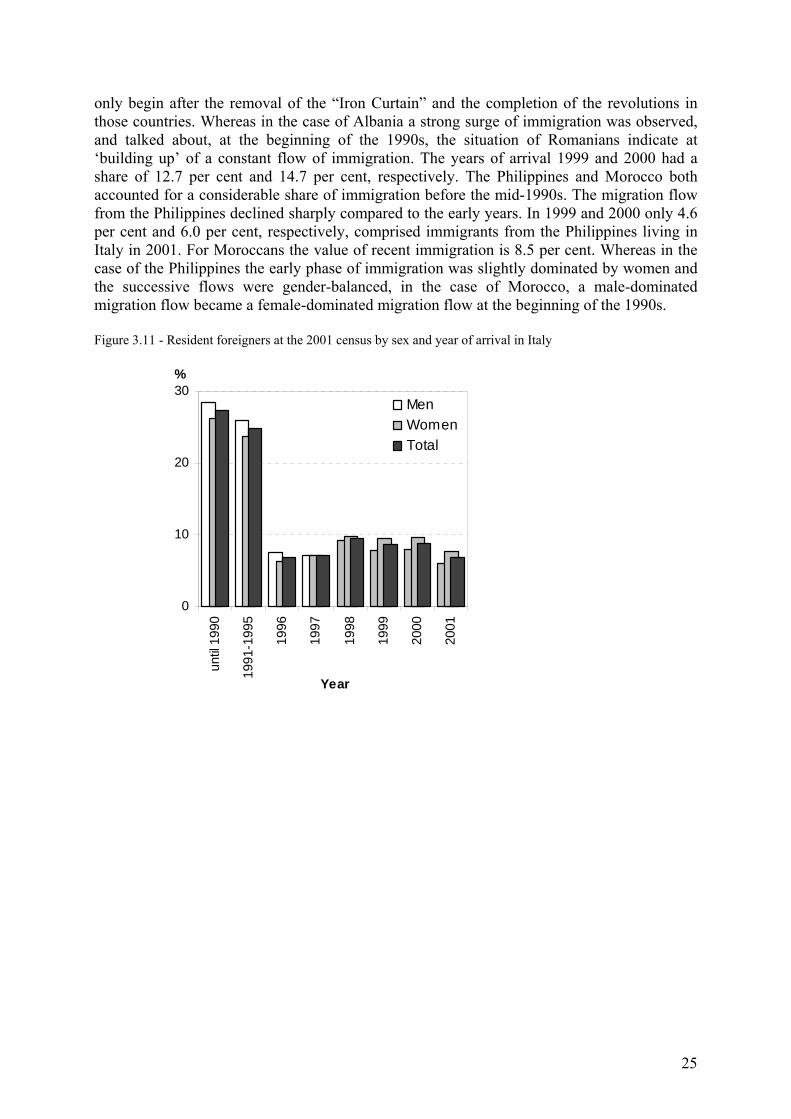
25
only begin after the removal of the “Iron Curtain” and the completion of the revolutions in those countries. Whereas in the case of Albania a strong surge of immigration was observed, and talked about, at the beginning of the 1990s, the situation of Romanians indicate at ‘building up’ of a constant flow of immigration. The years of arrival 1999 and 2000 had a share of 12.7 per cent and 14.7 per cent, respectively. The Philippines and Morocco both accounted for a considerable share of immigration before the mid-1990s. The migration flow from the Philippines declined sharply compared to the early years. In 1999 and 2000 only 4.6 per cent and 6.0 per cent, respectively, comprised immigrants from the Philippines living in Italy in 2001. For Moroccans the value of recent immigration is 8.5 per cent. Whereas in the case of the Philippines the early phase of immigration was slightly dominated by women and the successive flows were gender-balanced, in the case of Morocco, a male-dominated migration flow became a female-dominated migration flow at the beginning of the 1990s. Figure 3.11 - Resident foreigners at the 2001 census by sex and year of arrival in Italy
0
10
20
30
until
1990
1991
-199
5
1996
1997
1998
1999
2000
2001
Year
%
MenWomenTotal

26
Figure 3.12 - Resident foreigners at the time of the 2001 census by sex and year of arrival in Italy, selected citizenships
3.4. The regularisation processes - characteristics of regularisation programmes and numbers of regularised foreigners As underlined above, the annual trend of registrations of foreign nationals arriving from abroad is closely linked to the periodic regularisation programmes adopted in Italy over the last twenty years. Indeed, in the year of regularisation and/or in the following one to two years, the foreigners who have benefited from the amnesty and obtained a permit to stay, then go on to register their stay with municipal population registers. This has determined peaks of registrations from abroad in the regularisation years and/or those immediately following, which, however, involve immigrants who arrived in Italy some years earlier than the date of registration. It would therefore be interesting to briefly outline the rules and conditions adopted in different regularisation programmes (Table 3.9), focusing on the number and the characteristics of the
Romania
0
10
20
30
40
until
1990
1991
-199
5
1996
1997
1998
1999
2000
2001
Year
%
MenWomenTotal
Philippines
0
10
20
30
40
until
1990
1991
-199
5
1996
1997
1998
1999
2000
2001
Year
%
MenWomenTotal
Morocco
0
10
20
30
40
until
1990
1991
-199
5
1996
1997
1998
1999
2000
2001
Year
%
MenWomenTotal
Albania
0
10
20
30
40
until
1990
1991
-199
5
1996
1997
1998
1999
2000
2001
Year
%
MenWomenTotal

27
immigrants who took advantage of each amnesty (Tables 3.10). It is interesting because these immigrants came to Italy before the date required for regularisation. It is also interesting to analyse, when possible, the actual period of arrival, to assess the extent to which the amnesty resolves a situation of consolidated illegality and how far it represents in itself an instrument that draws more illegal immigration just before these exceptional provisions are put into effect. Table 3.9 - Principal characteristics of the programmes to regularise immigrants in an irregular situation, Italy Law
943/1986(a) Law
39/1990 Decree of Law
489/1995
Decree of the C. M. President
16/10/1998(b)
Laws 189 and 222 of
2002 Year/s 1987-88 1990 1995-96 1998 2002 Last data of arrival 27/01/1987 31/12/1989 19/11/1995 27/03/1998 10/06/2002 N. of applications (thousands) 105-119 235 256 251 705 % of accepted applications 92.9 93.8 96.2 86.8 90.5 Rates (applications per 100 LDCs(c) holder of permit to stay)
… 85.8 46.6 26.8 51.9
% female 26.0 26.0 31.0 28.9 45.8 Notes: (a) Some decrees of extension were granted, the last one is the law 81/88. The percentages reported are referred to the 119 thousands registered by Ministry of Labour. (b) The percentages do not take into account about 35 thousands applications that remained undefined because of their incomplete documentation. (c) Countries of Asia (except Israel and Japan), Africa Latin America and Central and Eastern Europe. Source: elaboration on data of ISTAT, Ministry of Interior and Ministry of Labour; Natale, Strozza, 1997; Carfagna, 2003 [Cangiano and Strozza 2006]. Table 3.10 - Applications of regularisation by country of citizenship, Italy 1990, 1995-96, 1998 and 2002
Rank Country of citizenship
Abs. val. (thousand)
% by citizenship
per 100 permit to stay Rank Country of
citizenship Abs. val.
(thousand) % by
citizenship per 100
permit to stay 1990 1995-96
1 Morocco 48.7 22.1 206 1 Morocco 34.8 13.6 43 2 Tunisia 26.3 11.9 211 2 Albania 32.4 12.7 107 3 Senegal 16.0 7.2 221 3 Philippines 19.5 7.6 54 4 Philippines 13.7 6.2 96 4 China 15.8 6.2 98 5 Yugoslavia 8.9 4.0 59 5 Peru 13.5 5.3 169
Total 220.5 100.0 51 Total 256.0 100.0 35 1998(a) 2002
1 Albania 35.7 16.3 49 1 Romania 143.1 20.4 173 2 Morocco 23.9 10.9 20 2 Ukraine 106.7 15.2 846 3 Romania 22.8 10.4 79 3 Albania 54.1 7.7 34 4 China 15.4 7.0 44 4 Morocco 53.8 7.7 32 5 Senegal 11.2 5.1 35 5 Ecuador 36.6 5.2 297
Total 219.3 100.0 21 Total 701.9 100.0 48
Note: (a) accepted applications. Source: elaboration on data of ISTAT and Ministry of Interior [Cangiano and Strozza 2006].

28
3.4.1. Regularisation Programmes: a long history It should be noted, first of all, that regularisation programmes have, from time to time, been accompanied by broader legislative reforms aimed at regulating various aspects of immigration (see paragraph 5.2). The widespread perception of increasing numbers of illegally employed foreigners led, after lengthy parliamentary procedures, to the enactment of the first significant amnesty8, implemented in accordance with the provisions contained in a first attempt to regulate the entry, residence, and employment of immigrants (Law 943/1986 and subsequent extensions). The measure, aimed at non-EU employees who were in Italy before 27 January 1987, envisaged first the regularisation of stay and then employment. Both the Ministry of Interior and the Ministry of Labour made a count of regularisation applications. The data recorded by the two sources were not perfectly consistent and the figures were different (105,000 and 119,000 respectively), since some workers who already had permits to stay also applied for work permits [Natale and Strozza 1990]. About 105,000 permits to stay were granted, more than 40 per cent going to non-EU workers who were not employees or who could not prove that they had been hired as employees. Under Law 39/1990 (known as the Martelli Law) the amnesty was extended to all foreign nationals present in Italy on December 31, 1989. This provision contained the least degree of selectivity among the various measures enacted, since its main aim was to reveal the actual numbers of foreigners present in Italy without permits to stay. The examination of the applications submitted ended in 1991 with about 220,000 accepted (almost 94 per cent) and most of them (87 per cent) involved the issue of permits for enrolment in job centres (for foreign jobseekers). Therefore, many of the beneficiaries were granted the right to register in job centres on condition that they could prove, after two years, that they had a job to obtain a renewal of their permit to stay. This method was probably used by a certain number of family members – since the law did not envisage the issue of permits for family reasons - as is shown by the nearly 50,000 women registered as unemployed [Carfagna 2003]. The main focus of Legislative Decree 489/1995 (known as the Dini Decree) was primarily the regularisation of illegally employed foreigners in Italy up to 18 November 1995. According to Ministry of the Interior’s figures, permits were issued to 246,000 foreigners (96 per cent of applicants). This provision was more selective than the previous one, which basically required presence in Italy to obtain a permit to stay, partly because it excluded self-employed workers from the pool of potential beneficiaries. However, it did include the possibility of regularisation for family reasons. The decree stipulated that employers pay the Istituto Nazionale Previdenza Sociale (INPS - National Institute for Social Insurance) a sum equal to 4-6 months of contributions, depending on whether employment was for a temporary or indefinite period. Unemployed foreigners able to document previous employment for a period of no less than four months were allowed to enrol in job centres, but had to find a job within a year to obtain a renewal of their permits. The last regularisation of the 1990s, introduced under the Decree of the President of the Council of Ministers on 16/10/1998, also coincided with an important legislative reform 8 In fact, the first measure which allowed illegal workers (without a permit or whose permit had expired) to regularise employment was issued in the early 1980s through Ministry of Labour circulars (2 March and 9 September 1982). The effects, however, were limited (a few thousand regularisations) because the information needed was poorly publicised, with a lack of involvement by the competent authorities.

29
regarding immigration - Law 40/1998 known as the Turco-Napolitano Law. At first the measure sought to regularise a limited number of workers (38,000), in addition to the planned entry quota. Subsequently, regularisation was extended to all immigrants who could prove they were living in Italy before the law came into force. The procedure involved a series of implementation circulars that simplified the application requirements, gradually expanding the pool of potential beneficiaries. Although more selective than the Martelli Law of 1990, this amnesty involved more than 250,000 immigrants. The provision led to the issue of about 217,000 permits to stay (less than 87 per cent of the applications). Although the majority of workers were issued with permits on giving concrete proof of future employment, almost 15 per cent of regularisation applications were for self-employment. As in the previous amnesty the closest family members were also granted the opportunity to regularise their legal status –however this applied to only 5 per cent of foreigners who benefited from the amnesty. The regularisation associated with the Bossi-Fini Law (Law 189/2002) was the most far-reaching measure to uncover illegal foreign work ever introduced in a European country, equalled later by the 2005 regularisation in Spain. For this reason it is known as the “great regularisation” [Strozza 2004; Anastasia, Bragato and Rasera 2004; Zucchetti and Strozza 2006]. More than 705,000 applications were made and nearly 647,000 were accepted (approximately 92 per cent), albeit over 60,000 of these conditionally [Carfagna et al. 2008]. Initially envisaged for the regularisation of the position of domestic workers and personal assistants (“badanti”) it was later extended to employees in companies under Legislative Decree 195/2002, converted into Law 222/2002. The declaration was to be sent to INPS, together with a payment of 700 euros to cover welfare costs for the three months before the amnesty, as well as administrative costs. Thanks to improved organization, operations were significantly faster compared with similar procedures carried out in the 1990s, despite the far higher number of applications. The huge numbers of foreigners applying for this regularisation were even more remarkable considering the relatively restrictive eligibility requirements when compared with the previous measures. In fact, only those working in families or employed in companies were able to apply, while the self-employed, unemployed, and family members were excluded from the measure. An indication of the extent of illegality that existed before the various measures - or, from a slightly different perspective, of the impact of uncovering illegality within the numbers of legal immigrants - can be seen by comparing the number of regularisations to the number of permits in existence before each provision came into force9. A marked fall in illegality clearly occurred in the early 1990s as a result of the Martelli Law. This trend has continued substantially throughout the last decade, as evidenced by the decreasing impact of the two subsequent regularisations on the numbers of legal foreigners (Table 3.10). Some argue that, following the 1998 amnesty, the number of illegal immigrants in Italy fell to a “physiological” (normal) level of 100,000-150,000 [Blangiardo and Farina 2001], probably one of the lowest levels ever seen since the 1980s [Strozza 2004]. A clear reversal of this trend occurred, however, just before the last amnesty, which recorded 52 regularised immigrants for every 100 from countries experiencing strong migratory pressure legally present in the country [Blangiardo 2005]10. Considering that the only possible beneficiaries of the latest measure were employees, a comparison with the number of permits to stay for employees in early 9 Since, in official statistics, the number of permits refers to the beginning of each year, the figures refer to the 1st January closest to the deadline set in each regularisation for entry in Italy. 10 This figure is strongly consistent with the estimates for illegal immigrants up to 1 January 2002 (541,000-730,000) proposed by Blangiardo, who extended the levels of illegal immigration detected by observers in Lombardy to the country as a whole.

30
2002 (623,000) gives us an even better idea of the wide-ranging effect of the recent regularisation, following which the number of regularly employed foreign workers has virtually doubled. 3.4.2. Gender and country of citizenship of regularised immigrants An analysis of regularised immigrants by gender and by area or country of citizenship reveals some salient aspects of the evolution over time of foreign immigration to Italy for work reasons. One aspect that all amnesties until the end of the 1990s had in common was a strong imbalance in terms of gender: the number of regularised women in the first four measures did not exceed 31 per cent of the total, a percentage reached in the 1995-96 regularisation. Significantly different, however, were the figures for the “great regularisation”, in which women accounted for almost 46 per cent of applicants and just over 46 per cent of those who were granted permits (accepted applications). It can be said that the increase in the proportion of women among regularised immigrants was the result of composite processes: the growing importance of nationalities with a balanced gender composition (this was particularly the case for Romanians) and an increase of nationalities with a significant prevalence of women (Ukrainians, Moldavians, Poles and Ecuadorians). Composition by area of citizenship varied significantly over the different amnesties, reflecting the gradual changes in the complex network of immigration to Italy for work and, highlighting the emergence, consolidation and/or reduction, over time, of some of the main migration flows. From this point of view, in fact, successive regularisations show that there have been tangible consequences affecting the legally resident foreign population, directly modifying the relative importance of various communities and activating, for the communities with a greater propensity for family migration, stable settlement projects and self-generating mechanisms of immigration flows through family reunification [Cangiano and Strozza 2006]. Under the amnesty of 1990 there was a clear prevalence of immigrants from Africa (about 60 per cent), largely due to the significant number of regularised North African immigrants (almost 88,000, amounting to just under 40 per cent of the total). There were fewer but still significant numbers of Asians (21 per cent). In subsequent regularisations there was a gradual increase in immigration flows from Central and Eastern Europe. The proportion of Eastern Europeans increased compared with Africans and, in the last amnesty, even compared with Asians [Cangiano and Strozza 2006]. Immigrants from the Balkans and Eastern Europe dominated the latest regularisation. Overall, the 411,000 applications from immigrants coming from countries of the former Soviet bloc represented nearly 60 per cent of all those submitted, which led to nearly 383,000 permits to stay being issued and, approximately doubling the numbers of those legally residing in Italy from this area. This mass participation of Eastern Europeans, which reached a peak in the great regularisation, affected, in different ways, all the new immigration countries of Southern Europe. While in Greece immigration from the Balkans has always been clearly prevalent, in Spain and Portugal, Eastern Europeans reached significant figures only in the most recent amnesties. Similarly, it is no surprise, in light of what has happened in Spain, that as a result of successive amnesties there has been a rise in the numbers of Latin Americans, who at the last regularisation made up 10 per cent of applications and permits issued. A detailed look at the first five nationalities involved in regularisation programmes allows us to identify the changes that have taken place (see Table 3.10). In the first regularisation of the past decade, Moroccans were by far the most important community numerically (22 per cent),

31
while Tunisians came second (12 per cent), among the first to arrive in Italy. They were followed in order of importance by Senegalese (7 per cent) and Filipinos (6 per cent). The next amnesty involved significant numbers of Albanians (13 per cent), almost equalling Moroccans (14 per cent), while there was an increase in the importance of the Chinese community (6 per cent) and the Peruvians (5 per cent), who came just behind the Filipinos (8 per cent). The 1998 amnesty saw, in first place, Albanians (16 per cent) and the emergence of Romanians (10 per cent), almost equal in number to Moroccans - who applied in smaller numbers than before (23,000), less than half compared with 1990. There was a significant reduction in Filipinos (3 per cent), while numbers for the Chinese remained about the same (6 per cent). In the last provision, five of the first ten nationalities in terms of numbers of regularisations were from the Balkans and countries in Central and Eastern Europe. The Romanians were the undisputed leaders in terms of applications and subsequent granting of permits (143,000 and 135,000 respectively, representing over 20 per cent of total), which placed them, as will be seen in more detail in paragraph 4.4, at the top of the list of the permits-to-stay holders with the Moroccans and Albanians. But the real outliers in the 2002 regularisation were the Ukrainians, submitting a number of applications (106,000), eight times higher than the number of permits issued before the amnesty and, becoming, after nearly 102,000 permits granted, the fifth-ranked nationality in terms of permits to stay (see paragraph 4.4). Although less significant in relative terms (7.7 per cent) compared with the previous amnesties and with fairly low levels of illegality compared with the now widespread regularisation (32-34 per cent), Morocco and Albania are still important areas of immigration to Italy, each with over 50,000 regularisation applications and about 48,000 permits to stay granted. Among the communities that participated en masse in the amnesty we find Ecuadorians, fifth in terms of numbers of applications (37,000) and permits issued (over 34,000), which have quadrupled, and Moldavians, whose 31,000 applications, if considered in relation to a population of just over four million inhabitants, provide a significant indicator of the strong migratory pressure present in that country. Many other countries took part in the regularisations apart from the nationalities mentioned so far, in line with the highly diversified immigration situation typical of Italy. Significant numbers of Poles, Egyptians, Ghanaians, Nigerians, and Peruvians also took advantage of the various measures. Other groups (Bangladeshi, Sri Lankans, Indians, Pakistanis, Algerians, Somalis, and Argentines) also form large communities, as has emerged from the regularisations. As a result of the massive participation of Eastern Europeans in the latest regularisation, there has been a significant increase in these nationalities at the top of the rankings, with a greater polarisation in terms of national groups, with slightly mitigated the still strongly polycentric immigration to Italy [Cangiano and Strozza 2006]. 3.4.3. Periods of immigration and role of regularisation programmes Some indications about the role played by regularisations in the 1990s can be seen from the 2003 survey carried out by the Observatory for Integration and Multi-ethnicity in the region of Lombardy, which analyses annually a broad selection of immigrants. It was found that more than 70 per cent of respondents who had benefited from the 1995-96 regularisation had entered Italy before 1995 (around 65 per cent in the 1991-94 period), more than 73 per cent of those that benefited from the next measure had immigrated the year prior to the amnesty or earlier (just under 60 per cent in the 1996-97 biennium), and almost 80 per cent of those regularised in the 2002 amnesty arrived in Italy before that year, with over 70 per cent in the 1999-2001 period [Blangiardo and Tanturri 2004]. The evidence gathered thus provides valuable input to support the hypothesis that each amnesty seems to have substantially

32
reduced the numbers of illegal immigrants that had formed in the intervals between one measure and the next [Cangiano and Strozza 2006]. Moreover, while the amnesties probably exhibited a certain attraction, especially when preceded by a broad political debate echoed by public opinion, it appears that their relative importance was quite low and accounted for about one quarter of the cases at most. Data from the survey SUD, carried out in 30 provinces in the South included in Objective 1, and 10 provinces of the Centre-North, provide more detail and a broader territorial reference for the year of arrival in Italy of the respondents who said they benefited from the 2002 regularisation (almost 8,300 out of a total of 30,000 respondents). More than half the arrivals came more or less evenly over 2000-2001, while figures for the year of the regularisation programme came to less than 20 per cent (Figure 3.13). It should also be noted that as many as one quarter of regularised immigrants came to Italy as early as the second half of the 1990s. It is therefore evident that even the last regularisation essentially uncovered an area of illegality that had formed in the years after the previous amnesty, also due to the fact that the projected number of immigrants was too low to satisfy the effective demand for immigrant workers from companies and households.
Figure 3.13 - Foreigners who applied for regularisation in 2002 by sex and year of arrival in Italy
Clear differences can be seen in the distribution by year of arrival among the main nationalities that benefited from regularisation (Figure 3.14). The Albanians have been present for longest in terms of total number of regularised immigrants and compared to the other main nationalities taking part in the programme. In fact, arrivals in the 1990s exceeded 30 per cent and were close to 60 per cent of those arriving in the first two years of the present decade. It is interesting to note that, among women, the proportion of arrivals just before the amnesty was clearly greater. The same can be observed among the Moroccans, who mostly arrived in 2000-2002, with almost 60 per cent of regularised women arriving in Italy in the last two years. It can therefore be assumed that for women from these communities, regularisation was an attractive option, even bearing in mind their less important role in the immigration process, often subordinate to men, family reunification being in most cases the reason for immigration. Immigration to Italy of Romanians, Ecuadorians and Ukrainians who benefited from regularisation is more recent than the other nationalities mentioned. However, there are differences of no small account. Among the Romanians, as for regularised immigrants as a whole, the year when immigration was highest was 2001, although 2002 was also significant (approximately 25 per cent). Immigration from Ecuador and Ukraine in 2000
0
10
20
30
40
until1997
1998 1999 2000 2001 2002
year
% MenWomanTotal

33
was quite considerable, especially for the former group; among the latter community, it should be stressed that the proportion of arrivals in the amnesty year among women did not exceed 20 per cent but among men it came to 30 per cent, indicating perhaps that the attractiveness of regularisation in this case heightened for men, probably with women paving the way. In the case of immigrants from China, the most important year of arrival is 2000, above all for women. In general, it seems that, despite the partly different arrival times of the different nationalities involved in the great regularisation, it is difficult to find situations where a particularly high proportion of immigration to Italy occurred in the proximity of, and therefore as a result of, the amnesties. As we have seen, the attraction effect may have effected less negligibly Moroccan and Albanian women, as well as Ukrainian men. In most cases, however, regularisation was used a posteriori (after the fact) to make up for inadequate control of immigration flows and to regularise situations in which immigrants were already working, but illegally. Figure 3.14 - Foreigners who applied for regularisation in 2002 by sex and year of arrival in Italy, selected citizenships
Albania
0
10
20
30
40
until1997
1998 1999 2000 2001 2002
year
%MenWomanTotal
Romania
0
10
20
30
40
until1997
1998 1999 2000 2001 2002
year
%MenWomanTotal
Ukraine
0
10
20
30
40
until1997
1998 1999 2000 2001 2002
year
%MenWomanTotal
Marocco
0
10
20
30
40
until1997
1998 1999 2000 2001 2002
year
%MenWomanTotal
Ecuador
0
10
20
30
40
until1997
1998 1999 2000 2001 2002
year
%MenWomanTotal
China
0
10
20
30
40
until1997
1998 1999 2000 2001 2002
year
%MenWomanTotal

34
Some additional elements show how the regularisations have, for a large majority of foreigners in Italy, been a vital step in the process of settling down and integrating in their adopted country, involving the transition from illegality to legality. Indeed, compared with the 784,000 applications accepted in the first four measures, no fewer than 566,000 were still in possession of a valid permit in early 2000 [Carfagna 2003]. The high proportion of foreigners settling down in the country is also confirmed in the great regularisation of 2002. Of the approximately 647,000 foreigners who obtained permits in 2003, more than 505,000, representing 78 per cent, still had a valid permit to stay in early 2007, despite the fact that the annual renewal of permits depended on the existence of an employment contract [Carfagna et al. 2008]. On the basis of empirical evidence we can also agree with the statement of Carfagna [2002] that the effect of regularisation programmes carried out so far has not been to repeatedly regularise the same individuals who returned to a state of illegality, but to effectively initiate a course of legality for most foreign nationals submitting applications.
3.4.4. From regularisations to decrees regulating immigration flows: recent experience After 2002, there have been no other regularisation procedures, even though some provisions adopted to control immigration flows have been similar in substance to the mechanisms and rules used in the previous amnesties (especially that of 1998). To this end it must be remembered that in Italy, as of 1990, the Martelli Law has delegated the control of annual immigration flows to special decrees. But only in 1995 were pre-established quotas introduced, which involved from about 20,000 to 25,000 individuals in 1995-97, 58,000 in the 1998-99 biennium, and about 80,000 in the following five years. The system of legal immigration for work reasons culminated in the two decrees regulating immigration flows issued in 2006. Almost 600,000 applications were presented and mostly accepted. From the outset, employers and foreign workers saw the policy of quotas also as an opportunity for regularisation. Indeed, some of the workers included in these quotas did not come from abroad but were already in Italy [Einaudi 2007]. According to some, this interpretation was further legitimised in the immigration flow decrees of 2006. Indeed, the gradual extension of the decree to all applicants, doing away with the idea of a programmed immigration ceiling (initially set at 120,000 plus 50,000 seasonal workers), extended the range of beneficiaries to workers already present in Italy, making the decree quite similar to an amnesty. This aspect was not denied by the government, which declared on several occasions that the aim was to regularise the situation of many foreign workers [Colombo and Martini 2007]. The first report on immigrants in Italy, recently issued by the Ministry of the Interior [2007a], provides information derived from a central computer database at the Department for Immigration and Civil Liberties of the Ministry of the Interior, which collects information from immigration desks in government offices in each territorial Prefecture to deal with the paperwork regarding foreign workers’ first employment and family reunification. In 2006, over 582,000 applications for first employment were submitted, of which 39.5 per cent for domestic work. The first four nationalities account for over half the applications (Romanians 27.6 per cent, Moroccans 10.8 per cent, Ukrainians 7.0 per cent, and Moldavians 6.8 per cent), thus consolidating a process of selection, that had already emerged in the great regularisation. Furthermore, the nationalities with the highest numbers of permits to stay are more or less in the same position in terms of registering for first employment, which leads to the supposition that the immigration flows are still in full force [Colombo and Martini 2007]. The decision of whether to accept or reject applications, excluding cases of withdrawal by the employer or worker, is based on two criteria: one formal, that is, whether the forms have been
35
correctly completed; and the other based on whether the remuneration indicated is appropriate and whether the employer has enough economic resources to pay the expenses involved in recruitment. Data on the outcome of applications is still provisional but they show that around 30 per cent of applications have been rejected. Rejected applications mainly comprise young African males who applied for work in the Southern regions of the country [Colombo and Martini 2007]. Entry visas issued up to 2007 amounted to only 172,000, and a not insignificant proportion of those still have to be withdrawn. For this reason the impact of the 2006 immigration flows decree on the numbers of legal immigrants remains to be seen in the permits-to-stay dataset (see paragraph 4.2.2). An analysis of the applications submitted, which, according to several experts, often concern those who are already in Italy, often employed informally, allows us to make some interesting observations. Those benefiting most are communities from Eastern Europe, the Balkans, and Latin America; those from Africa less so. A large quota of admissions is allocated to domestic workers, as is clear from the applications submitted in 2006, but also from those in 2007 and the quotas set for 2008. Among the applications submitted in 2006, more than 21 per cent of employers are foreigners, a proportion that is higher than for the same regularisation applications in 2002 (less than 11 per cent). In a significant number of cases, recruitment by foreign employers is a ploy to regularize compatriots who otherwise, with the restrictive system of quotas and with the problems of reuniting their families, would have difficulty entering Italy on a legal basis. But there are many cases that can be described as ethnic businesses, where employers and employees are of the same origin. This is particularly true for the Chinese, Bangladeshi and Ghanaian communities, where almost all applications to employers of these nationalities are made by employees of the same nationality. Finally, the ability to attract flows of regular workers increases significantly as we move from the Southern regions to the central and Northern parts of the country. The South seems to be increasingly unimportant, also in terms of first arrivals and initial employment. It is in the Centre-North where most immigrants are not only settling but also finding their first regular job [Colombo and Martini 2007].
36
4. Size of foreign population in Italy 4.1. Description and critical assessment of statistical sources on foreign population stock For information on the size and characteristics of the foreign population stock in Italy, there are three main statistical sources: records of permits to stay, records of foreigners recorded as resident in municipal registers, and census data. Assessments of the size of the foreign population stock can also be found in the numerous estimates attempted over the years that have used various methodologies; these are described in more detail below in paragraph 4.2.1. The Ministry of the Interior keeps records of permits to stay and these data are then revised by ISTAT and categorised according to sex, age, marital status, citizenship, reason for stay and province of issue. This source measures regular foreign population and reflects any changes in regularisation procedures with peaks in the years following the introduction of new programmes. Records take account of foreigners staying in Italy for brief periods, including those who are not necessarily migrants but are instead in the country on holiday or for health reasons, for example, though do not count minors who are not registered individually but named on their parents’ permits. ISTAT’s revision of the data and improvements in the Ministry’s management of the archive have resolved the problem of duplications and the non-cancellation of expired permits which, for many years, were the main problems with these records11. Starting in 1992, on the basis of forms returned to them from local authorities, ISTAT began a survey of foreigners registered in municipal population registers. This survey measures the more settled part of the immigrant population and numbers are also influenced by amnesty laws. It has the advantage of filling some of the gaps left by simply counting the number of permits issued since it includes a more accurate measure of the number of minors. Nevertheless, the survey still depends on municipal register management procedures which are not always above criticism, especially as regards some of the less stable sectors of the resident population, such as foreigners. The small number of cancellations from the register that result from the people leaving the country shows that departures of foreigners are not being recorded and, therefore, municipal registers include people who are no longer in Italy (see also paragraph 3.1). As a result, the surveys tend to overestimate the size of the foreign population, a situation confirmed by the generally higher number of de-registrations from the register because people are untraceable rather than because people are leaving the country12, as well as by the difference between the census data total and the municipal registers’ total of the foreign resident population in October 2001. Here, it should be borne in mind that part of the difference is due to undercounting in the census, estimated by ISTAT at around 10 per cent of the foreign population. In any case, the 2001 census provided an opportunity to adjust the municipal register data, which, for the current decade, uses the census data as a starting point for countering the tendency to overestimate foreign population. Even if in some municipalities,
11 File clearing in the archive often drastically reduced the official permit figures: in 1989, for example, data checks by the Ministry led to the cancellation of almost 30 per cent of the permits on record [Natale 1990]. It should be noted that Legislative Decree 30/2007 removed the requirement for EU citizens to apply for permits to stay which means that in the next few years, Ministry records will only show non-EU immigration - which nevertheless accounted for 4/5 of the total at the beginning of 2007. 12 In 2006, for example, 37,600 foreigners were removed from the register because they were untraceable and a further 17,000 because they had left Italy.

37
where local authorities have not made a complete post-census check of the population registers (including Rome and Naples), the register data probably underestimated immigration [Conti and Strozza 2006a]. The third source of data for measuring foreign immigration is the census, whose main advantages are: highly detailed data collection at the territorial level, the wide range of the variables surveyed, and the possibility of identifying at least a part of irregular immigration. In Italy, the first census to truly take account of the foreign population was made in 1981. On the occasion of the 1991 census, ISTAT made a considerable effort to improve the quality of the data by: improving definitions, producing a special form for non-resident foreigners in six different languages (Arabic, French, English, Spanish, Portuguese, and German), attempting to involve foreign communities and associations dealing with immigration at the central and local levels for the census operations. [ISTAT 1993]. The experience gained in 1991 allowed the data collection process used in 2001 to be honed and improved. In this last census, particular attention was paid to immigration and to measure the population of foreign origin as well [ISTAT 2005]. 4.2. Size, growth and characteristics of the foreign population 4.2.1. Estimates of regular and irregular foreign population stocks
At least until the mid-1990s, official immigration statistics were of poor quality and slow to be published and this, together with the considerable size of irregular immigration, prompted several attempts to estimate total foreign population. Estimates were made using different methodologies to make the best use of the data available at the time. Some of these estimates are given in Table 4.1 and they give a general idea of the overall dimensions of foreign immigration13.
Table 4.1 – Some estimates of the foreign population in Italy (a) (absolute values in thousands)
Irregular Author Year Estimate (a.v.) a.v. %
Natale [1986] 1985 523-725 97-299 19-41 Birindelli [1990] 1990 824 140 17 ISTAT [1991] 1990 1144 623 55 Blangiardo [1997] (b) 1995 833-912 344-423 41-46 Natale and Strozza [1997] 1995 1146 431 36 Blangiardo [1998] (b) (c) 1998 982-1101 176-295 18-27 Blangiardo [2006] (b) (d) 2005 3357 541 16 Blangiardo [2008] 2007 3982 349 9
Notes: (a) values at the beginning of the year, if not differently stated; (b) only citizens of CEE and Third World countries; (c) April 15; (d) July 1. Source: Strozza [2004] and some of the original sources. The first attempts to use statistical methods in producing estimates were made in the 1980s. According to Natale [1986], who arrived at a minimum estimate by comparing the available statistical data, and a maximum estimate by using the foreigners’ crime rate, total foreign population in Italy in 1985, excluding tourists, was between 523,000 and 725,000. At the end of the decade, a growing interest in immigration was mirrored by a renewed commitment to quantifying the size of the foreign population [Birindelli 1990]. An “irregularity” rate was calculated on the basis of regularisations in 1987 and this was added to the official data
13 For estimation methodologies, see Strozza [2004] and the original sources.

38
giving an estimate of foreign immigration at the start of 1990 at around 824,000. Also in relation to 1990, ISTAT’s estimate [1991], which for many years was the most detailed and complex attempt at evaluating foreign immigration, was 1,144,000, of which 181,000 were European Community citizens and 963,000 came from elsewhere. Towards the end of the 1990s, the results available from numerous local surveys encouraged further attempts. Using data from these surveys and comparing them with the official data, Blangiardo [1997] estimated at the beginning of 1995 that the number of foreigners from CEE and less developed countries was between 833,000 and 912,000, with the share of irregular immigrants accounting for between 41 and 46 per cent of all immigrants. For the same year, Natale and Strozza [1997], using the results of specific questions on irregular stays contained in field surveys, estimated the number of foreigners (including More Developed Countries) at 1,194,000, with the share of irregular immigrants at around 36 per cent of the total. In reference to April 1998 regarding immigrants from countries with strong migration pressure14, Blangiardo [1998] made a new evaluation, quantifying irregular immigrants as between 176,000 and 295,000 and total immigration as between 982,000 and 1,101,000. On that occasion, the estimation criteria aimed at improving the official data by adding specific information on the irregular component to emerge from inspections made by the Ministry of Employment and from some local surveys. The results of estimates in more recent years have yielded extraordinarily high numbers. Using the quotients for the irregular immigration calculated on the basis of field survey results, Ismu quantified the number of immigrants from countries with strong migration pressure as 3.4 million on 1 July 2005 and almost 4 million on 1 January 2007 [Blangiardo 2006 and 2008]. These assessments bear witness to the radical change in the size of migration numbers which has clearly increased considerably over the last ten years. Because of the amnesty laws, this growth has basically been due to the increase in the regular component, even if the numbers of irregular immigrants have remained high. Inevitably, foreign immigration estimates are influenced by various subjective factors and are therefore arbitrary. The overall impression is that evaluations made in the 1980s overestimated the size of immigration, probably because there was a similar inflation of data on permits to stay declared by the Ministry [Colombo and Sciortino 2004]; by contrast, estimates made in the second half of the 1990s, in particular those based on survey data, seemed to be underestimating the numbers of immigrants. Overall, trying to make an estimate based on all the available data, albeit not a very precise one due to the numerous problems involved in comparing the various estimates, it appears that the size of foreign immigration more or less doubled between 1985 and 1995 and then clearly increased even more strongly – almost three-fold - in the following 12 years. 4.2.2. Size of the regular foreign population stock
The main instruments used in Italy for measuring the regular foreign population stock in the recent period are the three previously mentioned sources: records of permits to stay, municipal population registers, and the census (Figure 4.1). Strictly speaking, the census data on the resident population could also include a small proportion of irregular immigrants but it is not
14 Countries with strong migration pressure are a category used by ISTAT that include CEE and less developed countries.

39
truly possible to quantify them. For this reason, we have considered the census data on resident foreigners as a measure of the regular foreign population stock. The census allows for the tracking of foreign migration into Italy over the longer period. The 1951 census, for example, recorded 47,177 foreign residents and then 62,780 in the 1961 edition [Cortese 1986]; the figure reached 121,000 in 1971 and 211,000 in 1981. In 1991, foreign residents numbered 356,000 and in the latest census, made in 2001, the total was 1.3 million, a figure that had increased fourfold in ten years.
Figure 4.1 Permits to stay and resident foreigners according to different sources, 1971-2007 (beginning of the year; values in thousands) Source: Ministry of Interior, Colombo and Sciortino [2004] and ISTAT data Between 1971 and 1991, data on permits were produced directly by the Ministry of the Interior. This series was characterized by a continuous growth in numbers until 1989, although part of the 36 per cent increase recorded between 1980 and 1981 was attributable to the inclusion in the survey of permits with a minimum duration of one month, while previously only those valid for more than three months had been counted [Birindelli 1990]. In any case, in 1971 some 147,000 permits were recorded, in 1981 there were 272,000 and in 1989 the figure had risen to 645,000. In 1990 the number of permits fell to 490,000 after the Ministry removed expired and duplicate permits from the files, but the number rose again to 781,000 the following year as a result of the amnesty included in the Martelli law. In fact, Ministry data overestimated the number of permits throughout the 1980s. For example, Colombo and Sciortino [2004] tried to estimate the number of permits that were actually valid, using the ministry archives. These new data give a completely different picture of both numbers and trends (Figure 4.1): between 1981 and 1987 the number of permits remained more or less the same, around 200,000, rising as a result of the amnesty law to 283,000 at the beginning of 1988 and to 548,000 in 1991. Starting in 1992, ISTAT revised the permit data and published a more accurate quantification of immigration after compensating for the more obvious shortcomings in the Ministry’s records.
781.2
121.1 210.9 356.2
1334.9
0
500
1000
1500
2000
2500
3000
1971 1976 1981 1986 1991 1996 2001 200
Years
Permits min. Permits Col.-Scior.
Permits Istat Residents pop.reg.
Residents cen.

40
From 1993 onward, in addition to permit data, the number of resident foreigners according to the municipal population registers was collected, giving a broader picture of the situation (Figure 4.1 and Table 4.2) The trends in the two data series concur in showing the extraordinary growth of immigration in the last fifteen years: the number of permits to stay has increased 3.7 times, from 649,000 in 1992 to 2.4 million in 2007, while there are 5.1 times more foreigners on the municipal population registers, rising from 573,000 in 1993 to 2.9 million, according to the latest figures. Both series show growth accelerations in the years following regularisations – in 2003 as regards permits to stay and in the two-year period between 2003 and 2004 as regards the population register data. Table 4.2 – Permits to stay, resident foreigners, and estimate of regular foreign stock (values in thousands at the beginning of the year)
Source: ISTAT data and our calculations To make an overall assessment of regular foreign immigrants, we have added the number of minors to the number of permits to stay in force at the beginning of the year, since children are only partially represented in permit data. Thus, assuming that all the minors with their own permits are recorded on the municipal population registers, regular immigration appears to have passed the one million mark in 1997 and is expected to be close to 3 million in 2007. However, in reality, this latest count also underestimates the real size of regular foreign immigration, especially because the official sources have not yet registered – or have only partially registered – the effects of the Prodi government’s decision in 2006 to issue a second decree law on immigration flows that allowed all the 540,000 foreigners who had presented an application to enter the country for economic reasons to be regularly employed (see also the more detailed discussion in 3.4.4). In effect, if we take this situation into account as well, the number of foreigners ‘regularly’ living in Italy was estimated at 3.6 million at the beginning of 2007, of which almost 700,000 were regular immigrants, but non-residents [Blangiardo 2008].
Permits to stay Resident foreigners Years Total less 18 Total less 18
Estimate
1992 648.9 18.5 n.a n.a n.a 1993 589.9 18.2 573.3 65.7 637.4 1994 649.1 19.9 629.2 80.6 709.8 1995 677.8 23.5 685.5 95.6 749.9 1996 729.2 26.0 737.8 110.6 813.8 1997 986.0 27.6 884.6 125.6 1084.0 1998 1022.9 32.0 991.7 150.1 1141.0 1999 1090.8 43.8 1116.4 186.9 1233.9 2000 1340.7 58.5 1270.6 229.9 1512.1 2001 1379.7 58.4 1464.6 278.0 1599.4 2002 1448.4 67.7 n.a n.a n.a 2003 1503.3 62.4 1549.4 353.5 1794.4 2004 2227.6 71.5 1990.2 413.3 2569.4 2005 2245.5 82.5 2402.2 503.0 2666.1 2006 2286.0 103.6 2670.5 585.5 2768.0 2007 2415.0 109.4 2938.9 665.6 2971.2

41
4.3. Reasons for permits to stay Permits to stay also provide information on the reasons why foreigners come to Italy (Table 4.3): these data only refer to the regular component and, naturally, the reasons given to obtain the permit may not actually be the real reason. Nevertheless, as early as the beginning of the 1980s, work was the reason for the largest number of permits to be issued and this number grew continuously in the following years, especially in the wake of the regularisations. The progressive stabilisation of economic immigration is even more evident if we consider the growth in the percentage share of permits issued for work reasons [Bonifazi 2007]: the figure was basically constant at around 30 per cent until 1990, but by 1992 it had jumped to 65.3 per cent. After that, the percentage of permits for work reasons began to fluctuate, increasing at times of regularisations and falling subsequently because of the higher rate of growth in permits issued for family reasons [Bonifazi 2007]. At the start of 2007, work was the reason given for the permit applications of almost 1.5 million people, accounting for 60.6 per cent of the total. Table 4.3 – Permits to stay according to reason, 1980-2007 (values at the beginning of the year)
Reason 1975 1980 1992 2000 2004 2007 Absolute values (in thousands) Work 58.8 66.8 424.0 827.6 1,479.4 1,463.1 Family 47.0 46.7 92.1 334.1 545.3 763.7 Study 27.3 31.8 21.1 31.5 37.4 51.6 Tourism 10.5 10.2 8.3 6.6 9.7 4.6 Residence 20.4 20.2 35.5 53.5 58.5 44.8 Religion 19.8 22.1 39.0 53.6 53.0 32.1 Other 2.8 2.5 28.9 33.7 44.3 55.0 Total 186.7 200.3 648.9 1,340.7 2,227.6 2,415.0 Percentages Work 31.5 33.4 65.3 61.7 66.4 60.6 Family 25.2 23.3 14.2 24.9 24.5 31.6 Study 14.6 15.9 3.3 2.4 1.7 2.1 Tourism 5.6 5.1 1.3 0.5 0.4 0.2 Residence 10.9 10.1 5.5 4.0 2.6 1.9 Religion 10.6 11.0 6.0 4.0 2.4 1.3 Other 1.5 1.2 4.5 2.5 2.0 2.3 Total 100.0 100.0 100.0 100.0 100.0 100.0
Source: calculations on Ministry of Interior data in Birindelli [1988] and on ISTAT data
Family reunions were given as the second most common reason for permits to be issued: just under one third of regular immigrants fall in this category in 2007. During the 1990s, the progressive stabilisation of numerous foreign communities, by means of family reunions, led to a significant and almost regular growth in the number of these permits. In absolute terms, at the start of 2007, there were almost 764,000 foreigners in Italy for family reasons, 2.3 times the number recorded only seven years earlier. The share of permits for family reasons had declined during the 1980s, falling from 23.3 per cent in 1980 to 14.2 per cent in 1992. This fall was due to the growth of the percentage share of immigrants from Third World and Central and Eastern European countries, which had more difficulty than those from MDCs in obtaining the right to family reunion, introduced into Italian law in 1986. In the last 20 years, applications for family reunion permits have increased along with immigration, partly because in the meantime the administrative framework has been tried and tested, even if numerous problems still exist. In this way, there has been growth in absolute terms of this type of permit

42
and a projected increase in the percentage share of the group as a whole. As we have already underlined, the growth of this share has been curbed by the much higher than average growth of permits for work reasons at the time of the amnesty laws. This can also be seen in the slight fall in the percentage of permits for family reasons between 2000 and 2004 and, by contrast, the sharp rise between 2004 and 2007. The numbers are much lower for other types of permits. Between 1992 and 2007, there was a growth in the trend of permit applications for study reasons but this did not prevent a fall in its relative percentage share. There are even fewer foreigners in the country with permits to stay for residence reasons15 or for religious reasons. The former now account for 1.9 per cent of all permits and the latter for 1.3 per cent. The numbers of both these types of permits have fallen in recent years following the revision of the ministry archives when permits were annulled if the holders (especially those from developed countries) were no longer present in Italy [ISTAT 2007a]. The numbers are even lower for permits issued for asylum and humanitarian reasons, which numbered only 29,500 in 2007, accounting for 1.2 per cent of the total.
4.4. Area and country of origin
Italy is a particularly interesting case for the analysis of the geographical areas from which immigration flows originate. It is in the centre of the Mediterranean; it was not a great colonial power; it has no privileged ties with countries that potentially have a lot of emigrants. For these reasons, migration dynamics are free from many conditioning factors exhibited by other countries. From the existing permits to stay data, it can seen that in 1971 (Table 4.4) 43.8 per cent of legal foreign immigrants came from one of the fifteen countries that, until May 2004, formed the European Union and the percentage for all developed countries was 75.8 per cent. The remainder was made up of foreigners from Latin America (5.7 per cent), Asia (6.3 per cent), CEE countries (8.1 per cent), North Africa (1.6 per cent) and sub-Saharan Africa (1.6 per cent). The situation almost exclusively reflected relations with developed countries while the Third World component could only be associated to a limited extent with the immigration flows which, in subsequent years, would migrate to Italy. Indeed, more than one fifth of Asian citizens with permits to stay were Israelis, while the strong links that the Italian emigrating population had established in the past with Latin American countries meant that, in all likelihood, a certain number of the more than 8,000 Latin Americans were Italian emigrants or their descendants who had meanwhile acquired another nationality. This state of affairs changed gradually in the following years; the percentage from LDCs and CEE countries increased regularly until the beginning of the nineties: in 1980 it was 27.4 per cent, in 1992 it accounted for almost three quarters of the total. In subsequent years, there was a fall in immigration from developed countries: in 2000 it made up 16.9 per cent while by early 2007 it had fallen to around 7.7 per cent. At the same time, there was an extraordinary increase in absolute and relative terms of immigration from CEE countries: from 1991 to 2007, CEE citizens legally present in Italy increased 12.3-fold, totalling more than one million and representing 42.1 per cent of the total. There was also a strong but lesser-marked increase in immigration from developing countries, rising from 390,000 in 1992 to 1,213,000 in 2003, representing a reduction from 60.7 to 50.2 per cent of the total.
15 This type of permit is issued to foreigners (usually from MDCs) who decide to settle in Italy and can demonstrate that they have adequate financial resources to do so. [Bonetti 1993].

43
The evolution of immigration in terms of area of origin is clear: there was a rise in the size and proportion of immigration from the Third World and especially from CEE countries, and a corresponding reduction of the percentage from developed countries − despite an increase in absolute terms − as a result of growing economic integration between Italy and the other Western countries.
Table 4.4 - Permits to stay by geographical area of citizenship, 1971-2007 (values at the beginning of the year) Absolute values (in thousands) % Geographical area
1971 1980 1992 2000 2007 1971 1980 1992 2000 2007 UE-15 64.3 87.4 100.4 145.9 135.3 43.8 43.6 15.5 10.9 5.6Other Western Europe (a) 15.1 16.1 20.0 21.1 11.1 10.2 8.0 3.1 1.6 0.5North America 28.4 35.3 44.2 50.4 29.7 19.3 17.6 6.8 3.8 1.2Other MDC (b) 3.6 5.5 6.9 9.2 8.9 2.5 2.8 1.1 0.7 0.4Total 111.5 144.3 171.5 226.5 185.0 75.8 72.0 26.4 16.9 7.7
CEE (c) 10.9 12.3 82.6 357.0 1,017.0 7.4 6.1 12.7 26.6 42.1Of which new 10 EU 3.8 4.1 27.8 112.0 401.8 2.6 2.0 4.3 8.4 16.6 North Africa 2.4 4.6 148.0 251.3 392.0 1.6 2.3 22.8 18.7 16.2Other Africa 2.4 8.4 79.6 138.2 178.8 1.6 4.2 12.3 10.3 7.4Latin America 8.4 12.1 50.1 110.8 217.9 5.7 6.0 7.7 8.3 9.0Asia (d) 10.2 17.6 116.3 256.1 423.9 6.9 8.8 17.9 19.1 17.6Total LDC 23.4 42.7 393.9 756.5 1,212.7 15.9 21.3 60.7 56.4 50.2 Total (e) 147.0 200.3 648.9 1,340.7 2,415.0 100.0 100.0 100.0 100.0 100.0Notes: (a) including Cyprus and Malta; (b) Japan and Oceania; (c) until 1992 including new Asian states of Former USSR; (d) including Turkey and from 2000 new Asian states of Former USSR, excluding Japan; (e) including stateless. Source: calculations on Ministry of Interior data in Birindelli [1988] and on ISTAT data
From the nineties onward, the geography of immigration began to take on an increasingly precise shape. In the present decade there is a clear prevalence of Albanians, Romanians and Moroccans and a gradual stabilization of many other sizeable communities (Table 4.5). In the two decades considered, increases in the biggest communities have been very different. There has always been a much higher percentage growth in Romanian immigration, while growth in Albanian immigration, though higher in absolute terms, is now close to the average. Moroccans have always been below the overall growth rate and this explains why Romanians and Albanians have now exceeded them in number. Recently, there has been an extraordinary increase in the numbers of Ukrainians, up from 6,500 permit holders in 2000 to 118,500 in 2007, and of Moldavians, who, in the same period, increased more than 25-fold, numbering more than 50,000 in 2007. There has also been a considerable increase in the number of Ecuadorians. The growth rate of Tunisians, Senegalese and Filipinos (especially in the present decade) has been small; the rate for the Chinese has remained basically stable, while in the current decade there has been a resumption of flows from Poland. In recent years, more and more immigrants have been settling down in Italy, which has also resulted in a greater balance in the demographic composition of the foreign community. In particular, there has been a slight trend towards normalisation in terms of gender. Compared to 1992, by early 2007 women were closer to representing half the total in almost all communities. The Indian community is an exception, since the proportion of women, already under 50 per cent, has decreased further. Among Ukrainians and Poles, by contrast, the

44
proportion of women has increased. The situation appears, however, still highly unbalanced and immigrant communities continue to show great differences in gender breakdown, a sign of the many different reasons for emigrating from their country to Italy. The percentage of women immigrants according to the major countries of origin ranges from the 13.7 per cent for Senegal, 21.7 per cent for Egypt and 28.8 per cent for Tunisia to the 83.2 per cent for Ukraine, 71.6 per cent for Poland, 68 per cent for Moldavia and 63.8 per cent for Peru. Table 4.5 - Permits to stay by main countries of citizenship, index number and gender structure, beginning 1992, 2000 and 2007 (absolute values in thousands)
Absolute values Index number % female % permits for
work (female) Country of citizenship
1992 2000 2007 2000 (1992=1)
2007 (2000=1) 1992 2007 1992 2007
Albania 24.9 133.0 282.7 5.3 2.1 14.1 43.5 43.7 18.5 Romania 8.3 61.2 278.6 7.4 4.6 58.0 54.1 24.6 54.1 Morocco 83.3 155.9 258.6 1.9 1.7 9.8 37.0 68.5 25.0 China 15.8 56.7 122.4 3.6 2.2 39.8 47.1 71.5 57.3 Ukraine (a) 0.9 6.5 118.5 7.2 18.2 77.9 83.2 47.4 80.1 Poland 12.1 29.5 78.9 2.4 2.7 55.7 71.6 53.8 65.4 Philippine 36.3 67.4 76.4 1.9 1.1 67.2 61.8 85.7 76.8 Tunisia 41.5 46.8 64.9 1.1 1.4 9.0 28.8 65.9 15.1 India 9.9 27.6 57.1 2.8 2.1 43.0 38.2 14.8 10.4 Serbia and Montenegro (b) 26.7 41.2 55.7 1.5 1.4 37.1 42.5 51.5 26.4 Perù 5.0 29.1 52.1 5.8 1.8 63.7 63.8 64.4 68.5 Moldova n.d. 1.9 50.3 - 26.5 5.0(c) 68.0 43.0(c) 70.2 Ecuador 1.0 10.5 50.3 10.5 4.8 68.5 63.5 59.6 73.3 Senegal 24.2 40.9 49.8 1.7 1.2 2.9 13.7 80.1 29.9 Egypt 18.5 34.0 49.6 1.8 1.5 14.2 21.7 29.2 11.9 Total 648.9 1,340.7 2,415.0 2.1 1.8 39.9 50.4 45.9 43.6
Note: (a) 1992 values refer to 1996; (b) 1992 former Yugoslavia; (c) 2000 Source: ISTAT data
Thus, for some countries of origin we have a predominantly male immigration, with men representing the vanguard to be joined later by the rest of the family. In other cases, there is the opposite situation, wherein most immigrants are woman, who are joined in later years by other members of the family. The fact that there are immigration flows primarily made up of women represents an important new aspect of the phenomenon, showing the great adaptability of international immigration in this period and the loose family structures of many emigration countries, and revealing a complete reversal of traditional gender relations in terms of mobility. The proportion of work permits issued to women gives a good idea of gender differences in immigration patterns. Thus, women are clearly the driving force behind immigration in the 80.1 per cent of work permits issued to women among Ukrainians, the 76.8 per cent among Filipinos and 73.3 per cent among Ecuadorians; on the other hand, the more traditional family role of women emerges from the 10.4 per cent of work permits issued to women in the Indian community, 11.9 per cent among Egyptians and the 15.1 per cent among Tunisians. The trend was, probably, also set by the first immigrant women belonging to communities with a high prevalence of males; this can help explain the significant drop in the number of work permits

45
issued to women between 1992 and 2007 in some national groups. This happened with Moroccan, Albanian, Tunisian, Senegalese and Egyptian women, for whom numerical growth and gradual settlement have clearly led to a progressive reduction in the percentage of women who emigrate autonomously compared to those who accompany family members. The changes in immigration dynamics in recent years and different models of mobility that have characterized the various communities can also be seen from the perspective of the country of origin (Table 4.6). At the beginning of 2007, the first developed country to appear in the ranking was Germany, coming 14th in terms of females and 21st in terms of males. In 1982, however, the first ten places for men and women were almost all taken by developed countries. In 1992 American men were ranked seventh and German men ninth, and for women as many as six of the first ten places were taken by developed countries. This gradual drop in importance of developed countries in immigration flows has not been the only change. Different evolutionary dynamics characterise communities from Third World countries and CEE countries. Among males, for example, the Moroccans have been at the top of the list since 1992; Albanians, Romanians and Chinese have, in recent years, risen up in the ranking, while Tunisians, Senegalese and Filipinos have fallen back by more than one place. Among women, on the other hand, Romanians now lead the rankings, followed by Albanians, Ukrainians and Moroccans. As regards the latter, despite big increases (in relative terms, even more than their male counterparts), they have failed to keep pace with the communities in which women play a much more important role in immigration flows.
Table 4.6 – Main countries of citizenship of the permits to stay holders by gender, beginning of some year (absolute values in thousands)
1982 1992 2000 2007
Country a.v. Country a.v. Country a.v. Country a.v.
Men 1 Greece 10.7 Morocco 75.1 Morocco 112.7 Morocco 162.8 2 USA 10.0 Tunisia 37.8 Albania 87.7 Albania 159.7 3 Germany 8.9 Senegal 23.5 Senegal 38.0 Romania 127.8 4 Iran 6.2 Albania 21.4 Tunisia 36.5 China 64.7 5 UK 5.8 F. Yugoslavia 16.8 Romania 31.3 Tunisia 46.2 6 Switzerland 5.6 Egypt 15.8 China 31.1 Senegal 43.0 7 France 4.6 USA 14.4 Egypt 27.9 Egypt 38.8 8 Yugoslavia 3.7 Philippine 11.9 Yugoslavia 24.1 India 35.3 9 Egypt 3.1 Germany 11.0 Philippine 22.8 Serbia and Monten. 32.0
10 Spain 3.1 China 9.5 Sri Lanka 18.3 Bangladesh 30.3 Women
1 USA 16.2 USA 27.1 Albania 45.3 Romania 150.8 2 Germany 10.4 Philippine 24.4 Philippine 44.6 Albania 122.9 3 UK 7.2 Germany 15.3 Morocco 43.1 Ukraine 98.6 4 Switzerland 6.7 France 10.1 USA 31.8 Morocco 95.7 5 France 6.1 UK 10.0 Romania 29.9 China 57.6 6 Greece 4.3 F. Yugoslavia 9.9 China 25.5 Poland 56.5 7 Philippine 4.0 Switzerland 8.3 Germany 20.9 Philippine 47.2 8 Spain 3.9 Morocco 8.2 Poland 20.8 Moldova 34.2 9 Yugoslavia 3.1 Brazil 7.5 Peru 19.8 Peru 33.3
10 Austria 2.6 Spain 7.0 Yugoslavia 17.1 Ecuador 31.9 Source: ISTAT data

46
In terms of total - male and female - immigration, some national groups have shown an increase in their importance while others have experienced a drop - an example of how immigration is the sum of a variety of factors, which, in recent years, has linked Italy to many other countries of the world. Each migration flow has followed and is following its own evolutionary course, which has determined a more or less rapid increase of the immigrant community in Italy: in some cases the increase in size has been steady, in others extraordinarily rapid, while it has remained relatively small in yet others. 4.5. Geographical Distribution
Another factor to consider is the direction these migration flows take. From this point of view there is no doubt that large urban agglomerations still have a considerable power of attraction, even though immigrants no longer find work in large industrial estates in the suburbs but look for work in the services sector. They have the skills to carry out financial activities and advanced services, and still supply the labour force for unskilled jobs, often involving a high degree of insecurity, needed even in the central sectors of the economy [Sassen 1991]. Still today, the provinces of the two major Italian cities, Rome and Milan, absorb one third of all immigrants with permits to stay in Italy. Immigration, however, is also important in medium-sized towns and small urban centres. This is partly due to the structural shortcomings that are common to the country as a whole (the lack of public services for children and the elderly means that families must fend for themselves). Another factor is that industrial production and manufacturing in Italy are decentralised and so the need for an immigrant work-force is spread throughout the country rather than concentrated in circumscribed areas. At first, immigration was directed at university cities but soon it extended to other urban areas and even included rural areas, where foreign workers have been widely employed in physically demanding jobs and seasonal work in the agricultural sector. Immigrants, therefore, can be found in many different situations, even though the pull factors are very different from a geographical point of view. In Central and Northern Italy, very often immigrants are employed in industrial jobs, while in the South, domestic work is the main attraction. In the Centre-North it is usually the industrial areas of the “Third Italy” that absorb most foreign labour. Over the last two decades in this area, where production systems are generally the most dynamic of the national economy, immigration has helped to fill the need that local labour has not been able to meet, given the low level of unemployment, high incomes and an unfavourable demographic context. Data on permits to stay in relation to geographical area (Table 4.7), at least for the 1991-2007 period, for which we have data from the same source, show a big increase in the role played by the two Northern areas at the expense of other parts of the country. However, the province that issues a permit to stay is not necessarily the one where the person actually lives. Therefore, in order to examine the geographical distribution of foreigners in the country we should refer to data on the resident population of the municipal registers.

47
Table 4.7 – Permits to stay by geographical division, 1971-2007 (values at the beginning of the year) Absolute values (in thousands)
1971 1980 1992 2000 2007 North West 48.8 62.8 181.4 423.4 846.6 North East 28.5 31.9 127.6 301.4 675.7 Centre 50.2 77.2 220.9 407.3 606.1 South 14.7 20.2 65.6 142.0 208.6 Islands 4.9 8.3 53.5 66.6 78.0 Total 147 200.3 648.9 1,340.7 2,415.0
% North West 33.2 31.3 27.9 31.6 35.1 North East 19.4 15.9 19.7 22.5 28.0 Centre 34.1 38.6 34.0 30.4 25.1 South 10 10.1 10.1 10.6 8.6 Islands 3.3 4.1 8.2 5.0 3.2 Total 100.0 100.0 100.0 100.0 100.0
Source: calculations on Ministry of Interior data in Birindelli [1988] and on ISTAT data.
The great majority of resident immigrants are concentrated in the Centre-North of Italy. In early 2007, the percentage of foreign residents in the South only came to 11.6 per cent (Table 4.8). The greatest numbers were in North West Italy (36.3 per cent), followed by the North East (27.3 per cent) and the Centre (24.8 per cent). At the regional level, Lombardy, Veneto, Emilia Romagna and Lazio have the highest number of foreigners: 729,000 in the first region, 350,000 the second, 330,000 the third and 318,000 in the fourth, amounting respectively to 24.8, 11.9, 11.2 and 10.8 per cent of the total. Note that, unlike the situation in the other regions of the Centre-North, Lazio experienced a drop in relative terms between 1993 and 2004, from 19.8 to 11.2 per cent.

48
Table 4.8 - Foreigners resident by subdivision, region and main provinces, 1993 and 2007 (absolute values in thousands)
Absolute values % by geographical area
% of resident population Geographical areas
1993 2007 1993 2007 1993 2007 Piedmont 36.0 252.3 6.3 8.6 0.8 5.8 Turin 19.7 129.5 3.4 4.4 0.9 5.8 Aosta Valley 1.0 5.5 0.2 0.2 0.9 4.4 Lombardy 125.8 728.6 21.9 24.8 1.4 7.6 Milan 74.2 317.5 12.9 10.8 1.9 8.2 Trentino-Alto Adige 10.4 61.7 1.8 2.1 1.1 6.2 Veneto 39.3 350.2 6.9 11.9 0.9 7.3 Friuli-Venezia Giulia 12.1 72.5 2.1 2.5 1.0 6.0 Liguria 19.0 80.7 3.3 2.7 1.1 5.0 Emilia-Romagna 43.1 317.9 7.5 10.8 1.1 7.5 Tuscany 41.7 234.4 7.3 8.0 1.2 6.4 Umbria 11.8 63.9 2.1 2.2 1.4 7.3 Marche 12.1 99.3 2.1 3.4 0.8 6.5 Lazio 113.7 330.1 19.8 11.2 2.2 6.0 Rome 102.0 278.5 17.8 9.5 2.7 6.9 Abruzzo 9.6 48.0 1.7 1.6 0.8 3.7 Molise 0.9 4.8 0.2 0.2 0.3 1.5 Campania 21.5 98.1 3.8 3.3 0.4 1.7 Naples 11.8 47.6 2.1 1.6 0.4 1.5 Apulia 14.3 51.2 2.5 1.7 0.4 1.3 Basilicata 1.7 6.7 0.3 0.2 0.3 1.1 Calabria 7.7 35.2 1.3 1.2 0.4 1.8 Sicily 42.4 78.2 7.4 2.7 0.8 1.6 Sardinia 9.1 19.4 1.6 0.7 0.6 1.2
North West 181.8 1,067.2 31.7 36.3 1.2 6.8 North East 104.9 802.2 18.3 27.3 1.0 7.2 Centre 179.4 727.7 31.3 24.8 1.6 6.3 South 55.6 244.1 9.7 8.3 0.4 1.7 Islands 51.6 97.7 9.0 3.3 0.8 1.5
Total 573.3 2,938.9 100.0 100.0 1.0 5.0
Source: ISTAT data.
The percentage of foreigners out of the total resident population rose from 1 per cent in 1993 to 5 per cent in 2007. In this case, too, there are significant geographical differences. In 2007 the highest percentage was in the North-East (7.2 per cent), followed by the North-West (6.8 per cent) and the Centre (6.3 per cent), while figures were much lower for the South (1.7 per cent) and the Islands (1.5 per cent). At the regional level, Lombardy had the highest value (7.6 per cent), followed by Emilia Romagna with 7.5 per cent and then by Veneto and Umbria with 7.3 per cent. In other regions of the Centre-North, percentages are above the national average, the only exceptions being Liguria, which has the same percentage as the national average, and the small region of Val d’Aosta, with a percentage of 4.4 per cent. In a country with great regional differences such as Italy, it is interesting to have a geographically detailed picture of immigration: thus, in Table 4.9, we list the provinces where, in early 1993, 2000 and 2007, there were the greatest numbers and highest proportions of foreigners. In absolute terms Rome, Milan and Turin have always been the main poles of

49
attraction, and in 2007, the Lombard capital, with its 317,000 foreign residents, surpassed the national capital’s 278,000 immigrants.
Table 4.9 - Province with the highest numbers and percentages of residents foreigners, beginning 1993, 2000 and 2007
Rank 1993 2000 2007 Absolute values (in thousands)
1 Rome 102.0 Rome 184.0 Milan 317.5 2 Milan 74.2 Milan 153.9 Rome 278.5 3 Turin 19.7 Turin 46.7 Turin 129.5 4 Florence 18.2 Brescia (Lombardy) 39.9 Brescia (Lombardy) 120.8 5 Palermo 13.2 Florence 34.4 Bergamo (Lombardy) 78.2 6 Brescia (Lombardy) 12.1 Naples 29.3 Treviso (Veneto) 77.9 7 Naples 11.8 Vicenza (Veneto) 28.9 Vicenza (Veneto) 75.6 8 Genoa 11.4 Bologna 28.5 Firenze 75.6 9 Bologna 11.0 Verona (Veneto) 28.1 Verona (Veneto) 72.5
10 Perugia (Umbria) 10.3 Bergamo (Lombardy) 25.9 Bologna 65.8 % of resident population
1 Rome 2.7 Rome 4.8 Prato (Tuscany) 10.7 2 Milan 1.9 Milan 4.1 Brescia (Lombardy) 10.1 3 Trieste 1.7 Prato (Tuscany) 3.9 Reggio Emilia (Emilia) 9.3 4 Imperia (Liguria) 1.7 Vicenza (Veneto) 3.7 Treviso (Veneto) 9.1 5 Perugia (Umbria) 1.7 Reggio Emilia (Emilia) 3.7 Vicenza (Veneto) 9.0 6 Reggio Em. (Emilia) 1.5 Brescia (Lombardy) 3.6 Modena (Emilia) 8.9 7 Florence 1.5 Florence 3.6 Mantova (Lombardy) 8.8 8 Modena (Emilia) 1.4 Verona (Veneto) 3.4 Piacenza (Emilia) 8.8 9 Bolzano (Trentino) 1.3 Perugia (Umbria) 3.4 Milan 8.2
10 Trapani (Sicily) 1.3 Modena (Emilia) 3.4 Verona (Veneto) and Pordenone (Friuli)
8.2
Source: ISTAT data.
In the fourteen years considered here, however, there has been a gradual increase in the importance of medium-sized towns. In 1993, in fact, the first ten places in terms of number of foreign residents were, with the exception of Brescia (sixth) and Perugia (tenth), the biggest Italian cities. In 2007, however, the three major metropolitan areas were followed almost exclusively by medium-sized towns: numbers in Brescia came to almost 121,000 immigrants, a figure very close to that of Turin. This rapid growth of immigration in urban and industrial areas of Italy is all the more evident if we consider the numbers of immigrants in percentage terms. In 1993 the biggest concentrations were in the two major metropolitan areas of the country: in the province of Rome 2.7 per cent of the population was composed of foreign nationals and in Milan it was 1.9 per cent, followed by Trieste, Imperia and Perugia with 1.7 per cent and then Reggio Emilia, Florence, Modena, Bolzano and Trapani. In 2000, Rome and Milan retained the top two places and were followed by Prato, Vicenza and Reggio Emilia. In 2007, the growth of immigration in medium-sized towns became even more evident: in first place we find Prato and Brescia with figures of over 10 per cent, followed by Reggio Emilia, Treviso, Vicenza and Modena, while Milan dropped to ninth place and Rome to twenty-second. 4.6. Naturalization and citizenship trends
Current legislation on naturalization is particularly restrictive (see paragraph 5.3). There are four main channels for foreign nationals to acquire Italian citizenship: marriage, residence

50
(ten years for non-EU and four for EU citizens); birth (with the provision of continuous residence in Italy until legal age of 18); children of naturalised citizens. The Ministry of the Interior provides data on the first two methods of acquiring citizenship; while ISTAT provides aggregate data on naturalisations recorded by population registers, giving no indication of the channel through which Italian citizenship was acquired (Figure 4.2). Figure 4.2 Acquisition of citizenship according to Ministry of Interior (marriage and residence, 1991-2006) and to ISTAT (population registers data). (absolute values in thousands) Both sources show a big increase in naturalisations. According to Ministry of the Interior data, in 2005 there were 19,300 immigrants who acquired citizenship through marriage and residence, a figure that shot up to 35,800 in 2006. The reason for such a big increase is probably due to greater resources being assigned to offices responsible for dealing with the paperwork, which made it possible to get through almost twice as many applications [Ministero dell’Interno 2007b]. Citizenship is mostly acquired through marriage, which, after a drop in 2005 to 61.7 per cent of the total, rose in the following year to 84.4 per cent. Data provided by ISTAT are, with the only exception of 2006, higher than Ministry figures. Figures for 2006 came to 35,300, a little lower than those of the Ministry. This is due to the delay between the granting of citizenship and registration, so the ISTAT data does not include all the naturalisations carried out by the Ministry.
35,3
8,9
0
5
10
15
20
25
30
35
40
1991 1996 2001 2006
Years
Marriage Residence Acquisition (p.r.)

51
5. Migration and integration policies in Italy
5.1. Changeover from an emigration to immigration country and the rise of immigration policies Italy’s experience within the European migratory system is now fairly well consolidated. Immigration is at an advanced stage, as shown by the presence of the large and growing share of foreigners who can be considered second generation immigrants. Consequently, Italy also has a well-developed, albeit recent, experience with formulating migration policies. When Italy started to witness immigration in the early 1970s, the country was basically open to migration flows because of the absence of any particular rules controlling the entry of foreign workers and the conditions under which they could stay. This substantial openness, in addition to the changes in migration policies that precluded further entry into European countries with more experience with immigration, constituted some important factors for Italy’s transformation into a new destination for immigration flows [Calvanese 1983]. This point of view suggested that immigration to Italy, as seen in other Southern European countries, was a transitory phenomenon, that would not involve large numbers and would certainly only be temporary because it was thought that Italy was only a stage of the journey of migrants on their way to the more traditional European immigration countries [Simon 1986]. This supposition was based on the hypothesis that this phenomenon was mainly caused by a worsening of social and economic conditions (push effects) in the sending countries, and did not take into consideration the fact that labour demand in the countries of Southern Europe might attract migrants. The role played by the demand for labour was underestimated because it was mainly a result of the segmentation of the labour market. There was a significant increase in job opportunities in the second category, i.e., the precarious, dangerous and badly paid jobs that the national labour force refused to do and that were waiting to be taken up by the immigrant labour force. In this framework, Law 943/1986 was adopted as a first attempt to regulate migration flows and the foreign presence in Italy. The main aim of the law was to ensure that all non-European Community migrants who were legally resident in Italy, as well as their families, would receive equal treatment and equal rights as Italian workers. Another laudable aspect of this law was the recognition of the right to family reunion for immigrant workers. Although the legislation was quite advanced in that it recognized the social rights of immigrant workers, it had little effect on immigration in Italy. The main reason for this failure was the social position of the immigrant as perceived by the lawmakers. They thought that the immigrant payroll worker would be the main beneficiary of the law, but this category only included part of the immigrant population in Italy at that time. Consequently, the regularisation provision contained in the law was successful in legalising the position of only 105,000 foreigners, in many cases for seeking work (see paragraph 3.4.1). The poor results for regularisations and the low number of permits granted for payroll employment were a testament to a vision of immigration that lagged behind the times and was anchored to the immigration of the Fordism stage in the old immigration countries of Europe when the immigrant was seen as young, male, and single, with a stable payroll job, possibly in a big factory. However, the Italian case was part of the “new migration age”, with its more complicated migration movements and different types of migrants [Castles and Miller 2003]. In Italy, there was primarily a marked
52
feminisation for some nationalities and a predominantly male model for others. Moreover, the inclusion of the immigrant population in the labour market was showing some new characteristics: women tended to work in domestic service while men were concentrated in the retail, agriculture, and construction sectors [Calvanese and Pugliese 1990]. Immigrants found work mainly in low-paid and low-skilled jobs, i.e., they did jobs that were difficult for the authorities to keep track of and which were organized along informal channels. This explains why the pull factors in the Italian labour market vis-à-vis migration flows were underestimated. Insufficient consideration was also given to the new social types of immigrants in Italy. The importance of the role of demand for labour became more pronounced and visible as Italy went ahead with the experience of immigration, especially because of the increase in the number of foreigners, the stabilization of the immigrant population, and the fact that, in the South, the increased number of foreigners was accompanied by a high rate of unemployment [Pugliese 1992, p. 82]. In the following years, there was a steady increase in the immigrant population, which now included a group of nationalities coming from the countries of Eastern Europe, alongside the consolidation of foreigners coming from African countries bordering the Mediterranean. Mainly in the initial stages, part of the rise in numbers was linked to an increase in what was referred to as “clandestine” immigration - entries that were not authorized under legislation in force at the time - and “irregular” immigration - those who stayed on longer than permitted by their entry visas. To counter any further increases in clandestine and irregular immigration and to meet the need for better legislation on migration and immigrants’ rights, in 1990 a law was passed together with new provisions for regularisation (Law 39/1990). The main aim of this law was to completely reformulate the rules on conditions of the entry, stay, and expulsion of immigrants in Italy and, later, to establish strict controls for migration flows by means of provisions such as: the redefinition of the list of countries whose nationals must obtain an entry visa (Art. 3); control of labour migration flows (Art. 2); and expulsion orders that become obligatory when the requirements for the application of the order are met (Art. 7). In the final analysis, this law was marked by a strong discouragement of new flows of immigrants, establishing, as it did, rigid control mechanisms both at the borders, for example, the new visa regime and the control of flows, and also within Italy, with the establishment of a rigid system for expulsions and a series of rules on the renewal and revocation of permits to stay (Art. 4). All of these left ample space for discretion on the part of the ministries concerned, which often acted counter to their own legislative decisions on the subject. As regards social policies, it could be said that the years in which Law 39/1990 was in force were characterized by a migration policy composed of circulars and administrative decrees that often contradicted each other [Bolaffi 2001, p. 37]. The most immediate consequence of such a migration regime was that immigrants had a rather precarious legal status in which not only did they not have the necessary information to exercise their rights, but the social workers themselves were unclear about the situation they were dealing with. The stricter handling of new admissions and the precarious legal framework created a political and social situation for immigration in Italy that was characterized by large numbers of immigrants with absolutely no kind of authorization for entry or stay, and by difficulty of access to social services on the part of regular immigrants. This situation necessarily led to the passing of another two regularisation provisions and a law (Law 48/1998), in an effort to rectify the pre-existing situation, to give immigrants a more

53
certain legal status, and to open official and regular channels for immigration into Italy. This law was later included and expanded in the “Consolidation Act (Testo Unico) on immigration and status of foreigners” (Law 286/1998). The main merit of this law, passed by a centre-left government, was to try to reduce to a minimum any regulatory ministerial circulars, which had left ample space for discretion on the part of ministry officials and had led to the unequal treatment that was typical under the preceding legislation. Furthermore, in those years, the choice of a system of annual quotas for economic migrants seemed to run counter to European guidelines. In some ways, it would seem that the choices made by Italy were precursors to the European Union’s later statement that it was on a path beyond the “zero option”, based on the recognition of the current and potential role of immigrant labour in the European economies. In this connection, it should be noted that the quota system for admissions did not work as a way of governing flows, mainly thanks to its structurally ambiguous formulation: it established a maximum threshold which could, however, be exceeded under complementary decrees and, at the same time, it defined a guaranteed minimum quota that was not, in reality, guaranteed at all. Another innovation was the introduction of “sponsors”, Italian citizens or businesses, that could nominate a foreigner directly. Lastly, it is worth mentioning the considerably more open approach towards the stabilized immigrant population with an extension of their social rights, and guarantees of basic rights for clandestine immigrants, such as the right to healthcare and education. The Consolidation Act was amended in some ways by the more recent Law 189/2002, this time under a centre-right government. This law is commonly named after two of the leaders in the government majority at the time and referred to as the “Bossi-Fini Law”. The regulatory framework of this law sees the immigration question principally as a problem of public order, in which the basic idea is that foreigners on national territory are an issue, first and foremost, for State security in the “true” sense of the protection and defence of public order. Consequently, a series of instruments was devised to provide continuous control of the immigrant population on two fronts. First, there was to be better control of the flow of new entries and of the irregular immigrant population, with stricter policing of regular entry channels and an increase in the number of expulsions. Second, control of regular immigrants already present was to be increased by creating a new kind of permit to stay linked to a work contract, and by complicating the procedures for the renewal of the permit to stay in order to make immigration more temporary in nature and also to discourage stabilization. In short, the measures contained in this law seem to constitute a migration regime reflecting what might be termed a “reluctant” approach [Cornelius et al. 1994]. Therefore, immigration policies in those years were dominated mainly by the attempt to reconcile the opposing needs presented to the state institutions regarding immigration. On the one hand, there was a real need for an immigrant workforce to do the jobs that domestic workers would not consider. This need pushed towards an immigration policy that was more permissive towards new entries, creating new and wider channels for regular arrivals. On the other hand, however, there was a strong drive towards a general reduction in the regular entry channels, based on the negative views of migration flows held by some parts of the public that saw, in immigration, a threat to security in three areas: economic - as a result of competition from immigrant workers; social – in the fear that immigration could also increase levels of crime; and national identity – a concern about “invasion” and the presumed unshakeable “otherness” of the immigrant. Lastly, we must also consider the requests of European countries of old immigration that saw the countries of Southern Europe as the backdoors for the latest inflows because of their lack of controls. Their requests did not only act so as to spur the development of specific migration
54
policies to address the new situation but also they favoured the adoption of restrictive immigration control policies. Following the policies that curtailed new migration flows that were in place since 1973, various initiatives were developed by the traditional immigration countries of continental Europe to coordinate entry policies at a supranational level in order to increase their effectiveness. This coordination was brought about through bilateral or intergovernmental agreements, which later provided the basis for the Schengen Agreements of June 1985 and the subsequent Implementation Convention of June 1990. These intergovernmental agreements were made between Belgium, France, Germany, Luxembourg and the Netherlands to address the difficulties encountered at community level in reaching agreement on the free movement of citizens. The main aim was to create a common space for the signatory states of the agreement, progressively eliminating controls at internal borders, adopting the necessary compensatory measures and developing cooperation between customs and police authorities. Membership in the Schengen system and the implementation of the agreements for new members were subject to the creation of a series of conditions that required differing lengths of time. Italy became a full member of the system only on 1 April 1998 after the approval of the previously mentioned Consolidation Act. One of the objectives of this law was precisely that of satisfying the conditions placed on entry into the Schengen area. This basically meant passing a series of regulations ensuring the free movement of citizens of European Union member states regardless of their reasons for travel. However, these regulations established that citizens of non-EU countries could enter and travel in member states’ territories for a maximum of three months, on condition that they meet the entry requirements established in the Schengen Acquis, namely:
to have a valid travel document; to have a short-stay visa; to be able to justify the reason for travel; to have sufficient means of support for the duration of their stay and return journey; not to be blacklisted in the Schengen information system and not to be considered a
danger for public order or national security in any of the Schengen area countries. Lastly, in 2001, the Council of the European Union adopted a regulation listing the third countries whose citizens must have a short-stay visa to cross the external borders of member states, and countries whose citizens need not have such a visa. In recent years, then, the supranational nature of the immigration regulations adopted by the European Union, has had a growing influence on the framing of Italy’s immigration policies, in the same way as it had in the other countries of Southern Europe. In conclusion, the main effect of the contrasting views that still persist today in the field of migration policy in Italy, but also in the other countries of Southern Europe, have mainly influenced immigration policies. It is precisely in this field of migration policies that the “Europeanization effect” has had most influence, delimiting the framework within which the law on the possibilities and procedures of entry are placed, as discussed in the next part.

55
5.2. Entry policies and the conditions of stay As already mentioned, issues regarding immigration in Italy are regulated by the Consolidation Act on immigration and status of foreigners (Law 286/1998) and amended by Law 189/2002. In the text one can clearly recognize the subdivision of regulations according to two groupings, that address different aspects of immigration. On the one hand, in Title II (articles 4-20), there are provisions regarding entry, stay and expulsion from Italy. On the other hand, later in the text, in Title III (articles 21-27), there are regulations governing labour. These codify the rights and duties of foreign workers and their employers on matters regarding labour and benefits, with reference to the possibility of entry for work reasons. Lastly, Title IV (articles 28–33) and Title V (articles 34-48) regulate the right to family reunion and the protection of minors; integration into the healthcare and education system; housing; participation in public life; and social integration, respectively. This paragraph will analyse immigration policies − namely, the directives found in Title II and III that identify a set of internal and external mechanisms for the control of immigration. These were crafted so as to screen foreigners’ entry [Brochmann and Hammar 1999]. The external control mechanisms are those mainly applied at the border. The norms that identify the latter essentially operate through a rigid system of visas, which became compulsory after membership in the Schengen space, and by controlling the flow of authorized entries. Visas in Italy are regulated by Article 4 of the Consolidation Act. It establishes which persons need a visa to enter Italy, what the conditions for issuing the visa are, the typology and the length of stay authorized by the visas, which may be for 90 days or less. Those persons, entering regularly, in accordance with Article 4, must apply for a permit to stay as provided for in Article 5 to extend their stay to more than 90 days. The latter article states that the type of permits and the length of stay cannot exceed: three months for visits, business and tourism; six months for seasonal labour, or nine months for seasonal labour in the sectors that require such a duration; a year, in the case of enrolment in an academic course or in a certified training course, although the permit may be renewed annually in the case of courses exceeding one year; two years for self-employed work, permanent contract payroll employment, and family reunification. The requirements for the issuing of permits generally correspond to those required for the issuing of visas. The requirements are: holding a valid passport (or equivalent identification) with a visa where the nationality, year and place of birth of the applicant are shown; not having previous criminal convictions or previous expulsions; proof of having sufficient means of support to stay and then return home, although this latter is not a requirement for permits to stay for work or family reasons. In this last case, in addition to the required documentation, the applicant must provide proof, with the appropriate certification, of having the means to support any family members coming to Italy. Clearly, the resources must be sufficient for the number of people to be supported by the applicant, who must also certify the availability of further resources and of adequate housing. The abovementioned Law 189/2002, amended the Consolidation Act on immigration in the section regarding the permit to stay issued for work reasons. The amended rule, Article 5b), states that the permit shall be issued only after the work contract has been stipulated. In this way, the permit to stay is tied to having a work contract and to the length of the period of employment.

56
The same requirements that were needed for the original issue are required for the renewal of a permit to stay. Certifying whether the applicant fulfils the requirements is thus particularly complicated and lengthens the whole process. As for permanent residence, the same Law 189/2002 extended the minimum legal period of presence in the country from five years to six before applying for the residence card. The latest legislation was led by a centre-left coalition. The first outcome of the wide debate regarding the need to amend the laws on immigration was the return to the previous five-year minimum period. Again, in the context of internal control mechanisms, Article 21 rules that, in addition to visa entries, it is also possible to come to Italy for payroll employment, which may be seasonal, and for self-employment. Entry depends on the quotas, which in turn are based on the estimated need for foreign labour, namely, those occupations not performed by the national workforce. Previously, new foreign workers’ entry into Italy was regulated by Law 943/1986. The law requested the foreigner to be specifically nominated, after checking on the availability of the local workforce (Article 9, par. 3). This rule soon turned out to be too restrictive to deal with the actual inflows. Law 39/1990 introduced migrant inflow control based on inter-ministerial decrees, yet until 1995 it did not establish any sort of quota on new entries. New restrictions based on the criterion or objective of “zero immigration” were then introduced. The target was common to other European countries and enacted through the previously mentioned stop policies. This entailed the need to revolutionize the quota entry mechanism, which took place under the 1998 Consolidation Act. The method to determine the acceptable entry quotas is established by Article 3, par. 4 of the Consolidation Act. Every year, the Italian Prime Minister, with one or more decrees, sets the maximum quotas of foreigners allowed to enter. The number of quotas is set so as to be proportionate to the needs of the Italian labour market (the necessary data is provided by the Ministry of Labour) and to the permits to stay already issued for family reunifications or for reasons of temporary social protection. A specific number of authorizations are assigned to each entry category (payroll labour, self-employed labour, seasonal labour, etc.). The decree also sets the number of immigrants, for each country, that may enter Italy. If the decrees are not published, the quotas are determined in accordance with the decrees published the previous year. Amendment law 189/2002 abolished sponsorships after which an Italian citizen or business could not directly request and employ an individual foreign citizen. Lastly, Article 21, par. 1, provides that the countries that signed readmission agreements and collaborate in fighting clandestine immigration should receive privileged entry quotas. Moreover, when addressing how to allot entry quotas for foreign workers, the Consolidation Act explicitly mentions the agreements that regulate migration flows and readmission procedures. These instruments fall under the so-called internal control mechanisms, which are composed of all the rules and regulations governing the expulsion of foreigners who are not legally present or resident (articles 10-17). The expulsions and border rejection system is the most established among the immigration policies. Since the enactment of the Schengen and Dublin agreements, this policy has become the prime instrument in blocking new migration waves. Border rejections are regulated by Community Regulation 562/2006. The latter provided for the strengthening and the coordination of external border controls, as requested under the Schengen Convention of 1990. In this context it is important to mention EC Council Regulation 2007/2004, which established the European Agency for the coordination of the operational cooperation of European Union member states’ external border control, FRONTEX. Its task is to coordinate the operational cooperation between member states in the

57
field of border security. The main activities of the Agency take place in the Mediterranean area. These are joint patrolling operations aimed at preventing illegal immigration. Italy, Greece and Spain are the main operational hubs for these operations. As a consequence of these activities, it is possible to identify a trend wherein the European external borders have shifted towards countries such as Ghana, Mauritania and Senegal. The latter countries have entered into cooperation agreements to fight illegal immigration [Vassallo Paleologo 2007]. Thus, in the last few years, legal instruments aimed at controlling entries − particularly those coming across the Mediterranean Sea − have proliferated. Various agreements regarding readmission between Italy and countries of origin, or dealing with migration flow transits were reached to ensure the effectiveness of the expulsions and the border rejections. Readmission agreements represent the other instrument the European Union has adopted to oppose clandestine immigration. A definition of readmission, the decision of a destination state regarding the readmission of an individual, can be found in the “Green Paper on a Community return policy on illegal residents” (COM (2002) 175 def. of 10.04.2002). The latter establishes a link between the repatriation of people illegally present in one of the member states and the settlement of European association and cooperation agreements. Thus it was with this aim that agreement on the readmission provisions to be included in community and mixed treaties was reached. These provisions are defined as “qualifying” in the literature because the method of implementation of readmission must be specified case-by-case by the relative agreements between the European Union or the member states and the third country. The so-called principle of migration conditionality is applied in this context. It subordinates economic aid policies to “collaboration” in readmitting irregular migrants and offers higher entry quotas for work reasons to those countries that implement stricter rules in stopping illegal migrants. Furthermore, the Commission has provided for a set of incentives, called a “lever mechanism,” for third countries to facilitate the negotiation and application of readmission agreements. Italian entry control policies are profoundly influenced by the directives and rules drawn up at the level of the European Union. These are aimed at strictly limiting the legal entries for the new immigration flows. This has given rise to a paradoxical situation in which the globalisation of goods and capital is taking place in an environment of increasingly free exchange and the removal of barriers to free movement, while migration flows are operating in an institutional environment marked by increasing limitations to the legal entry channels for immigrant workers. This paradox has been identified by Harris as the root of the growing clandestine component of today’s migration flows [Harris 2000]. In Italy, this component is fairly large, as indicated by the data on regularisations in Italy (see tables 3.9 and the discussion in paragraph 3.4). According to the data, regularisations in Italy from 1986 onward, have rectified the situation of almost 1,500,000 immigrants, roughly corresponding to two thirds of the foreign presence in 2005. Therefore, it would seem that the status of being “clandestine” is a transitory condition that has been common to most of foreign immigration into Italy. Furthermore, the high number of regularisation applications made under Law 189/2002, takes on greater significance because of the fact that not much time had passed since the previous one. Therefore, from a merely qualitative point of view, the functioning of the entry mechanisms of the immigration policies do not seem able to ensure satisfactory results as regards the control and selection of migration flows.

58
In this context, the mechanism of the quotas established by the Consolidation Act requires better criteria for the determination of the quotas and the mechanisms that direct them. This decision does not involve national origins but, above all, the professional skills of foreign workers to be admitted and the work available for them. The limits of the quota system adopted in Italy can be explained by the fact it does not sufficiently take into account the changes that have taken place in European immigration flows. First and foremost, immigration is a systemic factor determined by the combination of two processes under way in the developed economies: on the one hand, the permanent production of low-quality jobs that do not require any particular qualifications, sometimes defined as “McJobs”, and the fact that, for an advanced economy, a high level of education and training is the most important thing in order to obtain a successful job [Sassen 1999, p. 141]. This means there is a continuous need for immigrant labour and that the “zero immigration” policy cannot be put into practice. The correct regulation of immigration, therefore, means that sufficient regular entry channels must be guaranteed or there must at least be a mechanism to determine the most flexible quotas, in particular from a quantitative point of view. At the moment, the large numbers of immigrants working in the low-paid, low-skilled segments of the labour market in Italy are meeting a demand for labour that the quota system has difficulty in quantifying. This means that the demand for labour is underestimated, specifically as regards the new migration flows, and so the maximum quota for annual entries is also underestimated. Furthermore, since immigration is now a systemic factor in Italy as well, a large part of new immigration will not be authorized to enter or stay in the country. Considering also that the directions and dimensions of the new immigration flows are constantly changing, any predetermined estimate of the maximum quotas for new entries, used as a tool in planning and managing the flows, must take into account various new factors, and so the quota should be a flexible instrument that can be corrected as and when it is necessary. At the same time, given the kind of jobs performed by immigrants and considering that the main characteristics of current migration flows (circular migration and permanent settlement) are also evident in Italy, any quota policy attempting to encourage temporary migration or a policy that allows for only this kind of migration is condemned to criticism for underestimating the inflows and for the irregular nature of a large part of these flows. Therefore, when controlling the inflows, an estimate of the demand for labour cannot be the only tool used to determine the quotas. In any case, it is not possible to place a cap on entries on this basis, since demand for labour does not take into consideration the other basic component of today’s inflows – family reunion. Lastly, reducing the possibility for non-EU foreigners to enter the country and move freely, will only turn the circular component of the new migration flows into that part of the immigrant population that decides to settle in Italy permanently. Since circular migration and low-paid, low-skilled employment often coincide, these immigrants will be limited to precarious jobs and statuses for their entire migration experience. One useful suggestion as regards adopting more flexible regulatory instruments and concerning the possible tools to adopt was recently provided by the European Parliament, when it invited the Commission to consider the possibility of granting a job-seeker’s permit to stay, to be valid for six months, as was the case in Italy until 2001 through the sponsor system.

59
5.3. Integration policies
The part of the Consolidation Act governing immigrants’ rights and identifying integration policies goes from Article 34 to 46. These regulations are mainly concerned with healthcare, the right to education and professional training and, lastly, the right to housing. All regular immigrants in Italy with permits to stay will benefit from social policies. Further, the law also recognizes that the right to healthcare and education are fundamental human rights that must be guaranteed regardless of a person’s legal status. Consequently, urgent hospital or other medical treatment is also available for foreigners without permits to stay, as is the right to compulsory schooling for foreign minors who are, in any case, living in Italy. As regards access to health and social services, the Consolidation Act provides a stable and clear framework. Implementation of the principles and provisions of the law are further explained in an enactment regulation provided for by the law itself (Presidential Decree 394/1994). Further information is also given in a Health Ministry Circular dated 24 March 2000. The declared objective is to allow legal immigrants access to health service on par with Italian citizens. In particular, the regulations state that all foreign citizens with a valid permit to stay or who have applied to renew a previous permit can register with the Sistema Sanitario Nazionale (SSN - National Health System) in order to use the health service. Obligatory registration implies rights and duties equal to those of Italian citizens as regards: treatment in Italy, the obligation to contribute, and the period of validity. Furthermore, access to healthcare does not stop while the permit to stay is being renewed. Foreigners who are legally present but who have not registered with the SSN have the right to receive immediate urgent treatment (at a clinic or in hospital as an in-patient or as a day-hospital patient). The cost of treatment, set by the local regional authorities, are payable upon discharge from hospital (if the patient is insolvent, the Ministry of the Interior is responsible for the payment). Foreigners who are illegally living in Italy have the right to urgent treatment (treatment that cannot be postponed without endangering life or health) in public health facilities and private health facilities contracted by the SSN. They also have the right to essential treatment (treatment for conditions that are not immediately dangerous but which could, over time, cause greater damage to health or death), and to continued treatment (complete treatment and rehabilitation programmes), and in particular to the following:
• healthcare for pregnant women and new mothers; • healthcare for minors; • vaccinations included in Regional health campaigns; • preventive treatments as part of global health campaigns; • prevention programmes, diagnosis and treatment of infectious diseases and
decontamination of centres of infection; • treatment, prevention and rehabilitation for drug addiction.
Health facilities are forbidden from reporting the presence of irregular immigrants requesting treatment to the police authorities in order not to discourage access to care. When illegal immigrants receive their first treatment, they are assigned an anonymous code called STP (Straniero Temporaneamente Presente - temporarily present foreigner), valid for six months (renewable) throughout Italy. Another aspect to be considered regards local arrangements, given the advanced degree of federalism in the organization of the Italian health system. It

60
should be noted that each Region’s regulatory path to providing healthcare for immigrants has led to some striking disparities between different areas, both in terms of access and in terms of which services may be used. Access to social integration programmes is restricted to citizens of non-EU countries who can demonstrate they are abiding by the regulations governing their stay in Italy (Article 40, par. 1b). Right of access, on par with Italian citizens, to public housing, social intermediation services established by the Regions or local authorities to facilitate rentals and access to credit for the construction, restoration, purchase and rental of the principal dwelling, is only granted to foreigners holding a residence card (“carta di soggiorno”) and to foreigners legally living in Italy who have a permit to stay with a validity of more than two years, with a regular payroll job or who are self-employed. Lastly, foreigners with residence cards or permits to stay with a validity of not less than one year, and minors listed on their residence cards or permits to stay, have rights equal to those of Italian citizens vis-à-vis social welfare assistance and benefits (also financial benefits), including those allocated to sufferers of Hansen’s disease or tuberculosis, deaf-mutes, the blind, disabled persons, and the destitute. The new social legislation contained in Law 328/2000 established two levels of assistance for immigrants: social welfare assistance, covering national and regional social welfare programmes under central and decentralized social services, and integration support, regulated by immigration legislation. Furthermore, the abovementioned law establishes that local authorities are responsible, in the first place, for policy decisions and their implementation as regards social welfare assistance for immigrants. Evaluating the integration policies adopted in Italy on the basis of the integration of the immigrant population in quantitative terms (based on the number of foreign immigrants who use the services) and tracking their development as time goes on, we have found a tendency towards a steady integration of immigrants into the Italian welfare system. However, this result could be attributable mainly to the increased size of the resident foreign population and the stabilization of this part of the population rather than to the creation of new social services for foreign immigrants. In other words, greater inclusion of foreign immigrants has been produced by their feeling more encouraged to use the social services, which is an effect of the stabilization of this part of the population, the related changes in its demographic composition and its social and economic integration. This observation seems to be confirmed by the contradictory trends in the number of social welfare clients and social welfare spending on immigrants. Taking the case of social services spending disbursed by the Provinces, in the period 2000-2003, in the face of a large increase in the number of clients, there was a reduction in social welfare spending on immigrants and nomads. Analysis of the data on the social services provided, at an individual level, for the immigrant population shows great geographical differences. In the general context of a strong reduction in social welfare spending that most greatly affected those geographical areas where the situation was already one of need, the immigrant citizen was found to be the weakest in social terms and the one suffering most from the drastic reduction in spending [Vitiello 2006]. This does not mean that there was no effort, in terms of legislation and its implementation, to produce adequate rules for immigration, but it was an insufficient attempt, partly due to intrinsic limitations and also due to the numerous obstacles encountered during implementation.

61
As far as the intrinsic limitations are concerned, it should be noted that in the Consolidation Act they are found in the admission criteria that immigrants must satisfy in order to gain access to social services. In the holder of a residence card and associated legal definition, we can find the legal status of “semi-citizen”, which today is possibly the most common way of including immigrants in the welfare systems throughout Europe [Baldwin-Edwards 2004]. This concept recalls the definition of denizenship, proposed by Hammar, who identified the particular legal status of immigrants who have not achieved full integration in the host country and the full recognition of their civil rights even though they have achieved economic integration [Hammar 1985, p. 76]. This initial statement, however, corresponds in a concrete way to an “actual situation where services depend on a classification of legal status that is frequently very complex and in which rights are differentiated according to the legal status of the individual: regular immigrant with permit to stay; regular, stabilized immigrant; asylum-seeker; refugee; irregular immigrant; or clandestine immigrant” [Spinelli 2005, p. 87]. This classification of social rights enjoyed by citizens in Italy defines both the limits for immigrants trying to access social services and also a new distinction, albeit implicit, between the deserving and the undeserving of social benefits linked to citizenship: that of “immigrants who are unfairly undeserving” [Spinelli 2005, p. 75]. In this last case, immigrants can access social services only if they can demonstrate that they deserve them, in that they possess a permit to stay and observe the rules governing its renewal. This new category also highlights the fact that any minor tightening of the rules governing the renewal of permits to stay or the granting of residence cards – which could even simply be an over-strict interpretation of those rules – affects the living conditions of immigrants and the integration processes for a part of the foreign population. In this respect, it should perhaps be specified that there is a connection between the rules on the management of the flows and controls on foreign presences and the regulations regarding social policies. The Bossi-Fini law (189/2002) amending the Consolidation Act and passed by Berlusconi’s government, as already mentioned, does not deal with the points of Law 40 and the Consolidation Act as regards social policies. Nevertheless, by making it much more difficult to renew permits to stay and reducing the period of validity, many previously regular immigrants were forced into the position of no longer having the right to welfare system benefits. This is not, however, the main explanation for immigrants’ reduced access to the benefits of social policies. As we have tried to demonstrate, the limited application of social policies for immigrants is due to a substantial reduction in funding that has taken place in recent years. In other words, the legislative and institutional framework remains basically unchanged, but there has been a striking lack of implementation [Pugliese 2006]. There is a final point to be made regarding the possibility of immigrants and their children to acquire Italian citizenship, which is regulated by Law 91/1992. This law establishes four main criteria for acquiring citizenship, already considered above in paragraph 4.6. Italian citizenship may be conferred upon a non-EU foreign citizen who has been legally resident in Italy for at least ten years by decree from the President of the Republic, after being heard by the Council of State and following a proposal by the Ministry of Interior (Article 9, par. 1, sub-par. f). The length of this process – a minimum of two-three years - must also be taken into consideration, so the overall time is at least twelve or thirteen years [Blangiardo and Molina 2006]. Furthermore, proof of income must be supplied, usually for the three-year period immediately prior to the application being made. Lastly, the children of immigrants who were born in Italy may only apply for citizenship when they reach their eighteenth

62
birthday and they lose this right permanently if they do not apply within twelve months of that birthday (Article 4, par. 2). An application for citizenship on the part of children of immigrants also requires proof of uninterrupted legal residency since birth. This rule has given rise to several controversies since there have been many cases where even those born in Italy who have always lived there until their eighteenth birthday have been unable to obtain citizenship simply because their mothers, who had permits to stay when they were born, had not acquired residency in their town, which can happen when people do not have a fixed address. Other difficulties arise when families have moved away from Italy in the space of the eighteen years and residency has been lost. These loopholes, together with the slow pace of the bureaucracy in conferring citizenship for naturalisation, mean that naturalisation is rarely taken up by immigrants (see Figure 4.2), despite the fairly high numbers of them having the necessary requisites for obtaining citizenship. The low number of applications for naturalisation and, in particular, the difficulties experienced by citizens born in Italy to immigrant parents, have been tackled in the first case by a government bill of 04/08/2006 to modifying Law 91/1992 and also by a Circular of the Ministry of Interior of 7 November 2007 which states that the late registration of a minor shall not be considered prejudicial to the acquisition of Italian citizenship if there is documentation to demonstrate the presence of the minor prior to the regularisation of the registration (vaccination certificates, general medical certificates and so on). The same cannot be said for the right of immigrants to vote, which is not foreseen under current legislation. 5.4. Analysis of the determinants of policies An analysis of the determinants of Italian migration policies shows they are influenced by a complex mix of factors including: the demand for labour on the part of businesses and Italian families; demographic changes and the crisis of the welfare system; the public’s perception of this migration; the role of the mass media in shaping this perception; political and ideological considerations; and the role of non-profit organizations working in the field of immigration. The elements that make up this mix create opposing forces, especially with regard to immigration policies, where some are in opposition and bring about either an increase or a decrease in migration flows. This opposition becomes less marked when immigrant integration problems need to be addressed. The social and economic integration of immigrants in this stage of Italy’s migration history does not suffer from any particular legislative problems, except those already mentioned concerning the lack of implementation of the law and the difficulty of access to certain social services. Even among those political parties most opposed to the immigrant population, objections become less heated if it is a question of those who are already here and have a job. The general agreement on the equality of rights between Italians and immigrants is perhaps due to the fact that, for now it is limited to the functional aspect of immigration, i.e., what it produces. It is to be expected that as the migration phenomenon matures, the immigrant population will begin to express needs that go beyond this and will then meet greater resistance from the political parties opposed to immigration. As far as immigration policies are concerned, Italy insisted on a strict closing of the borders to new immigrants throughout the 1990s, ignoring the fact that Italy was already part of a stable Euro-Mediterranean migration system. The case of Law 943/1986 should be borne in mind, as it had disappointing results and was then radically changed after only three years because it did not consider the changes in the post-1973 migration flows. Furthermore, immigration in Italy is only one aspect of a larger system connecting the receiving countries of Europe as a whole to the sending countries on the Southern and Eastern coasts of the Mediterranean.

63
European integration has placed Italy, together with the other countries in the Mediterranean area, in a close-knit network of economic and political interdependencies which form a complex mix of push effects in the sending countries and pull effects in the receiving countries, economic, political and historical links, and finally the migratory networks and migratory chains. This mix of elements makes a serious contribution to the creation and support of the Euro-Mediterranean migration system. For this reason, the regulation of migration flows cannot be attempted in or even devised by one single country. International coordination of migration policies is required and must also include the participation of sending countries in drawing up migration policies within the stable and official framework of multilateral relations. The political situation is further complicated by the fact that migration is increasingly a global phenomenon whose mechanisms are influenced by global processes that cannot be dealt with or regulated by partial legislative instruments either from a geographical point of view or from that of the perception of the immigration phenomenon. We must also bear in mind that freedom to emigrate is clearly recognized both in international treaties and in national constitutions, for example in Article 13 of the Universal Declaration on Human Rights, in Article 2.2 of the fourth protocol of the European Convention on Human Rights and in Article 10 of the Italian Constitution. In this kind of situation, the strongest influences on migration policies in Italy are the decisions made within the European Union. The European dimension has actually had a significant impact on the drawing up of Italian immigration policies, as illustrated in the previous paragraphs dealing with the systematic and deep-rooted links between the policies adopted at Italian level and those of the European Union. The European Union’s influence has been most marked on border checks and expulsion procedures. In this sense, the adoption of measures insisting on the restrictive control of immigration has prevailed, justified by a perception of the phenomenon that emphasizes security and which has little to do with the migration reality that concerns Europe at this time [Bigo 2002]. The drive by the European Union towards the adoption of more restrictive entry policies as part of migration policy is supplemented by internal factors whose main action can be summarized as two opposing pushes: of those in favour of a more open-door policy and those who want to close the entry channels to new flows. The social participants in this debate are, first of all, businesses and Italian families who have the greatest need for immigrant labour, and then Catholic and lay associations, the Church, left-wing political parties and trade unions. On the opposing side there are right-wing political parties. These actions have led to a progressive “politicization” of immigration, followed by its progressive “juridification”. The term “politicization” is taken to mean the steady rise in importance of the immigration question until it becomes a central part of the political agenda. The essential part of this politicization process is the fact that immigration is increasingly a topic on the electoral and political agenda. The term is therefore used to indicate the continuing increase in legislative and public interest in the legal and security aspects of immigration. Moreover, this increased interest is expressed by the passage of the legislative emphasis and production from integration policies to control policies vis-à-vis migration flows and immigrants, so that immigration is increasingly a question of public order and civil law. The result is a progressive “juridification”, that is to say the jurisdiction and decision-making powers regarding immigration and its associated problems are gradually transferred from the political sphere (legitimate) to the legal sphere (functional). The Italian political system has always tried to mediate between these two positions on immigration. Even when the political scene was dominated by the right wing, the needs of both businesses and Italian families were

64
considered, as they needed an open policy for immigrants, and this led to the largest regularisation campaign ever witnessed in Italy. This mediation essentially consisted of the adoption of the quota mechanism for deciding the number of new migrant entries. The objective of this mechanism is to allow entry to a group of new immigrants that can then be absorbed by the labour market and by society without tensions or social conflicts. In this sense it is also like one of the legitimate entry channels that aims to reduce the flow of immigrants entering without prior authorization or any other kind of permit to stay. It is therefore clear that this mechanism’s specific objective is to achieve a substantial reduction in migration flows composed of undocumented migrants. It is thus an attempt to reconcile the opposing needs represented to the authorities as regards migration policies. The legislative activity of the past left-wing government moved in that direction. Some provisions have already been made, such as: the new rules on family reunions eliminating some of the conditions that limited people’s rights or made it very difficult for them to exercise them, the maintaining of rights while waiting for renewal of a permit to stay, action against the exploitation of foreign workers; and visa and declaration waiting times reduced to less than three months. The proposed reform of the Consolidation Act had the following objectives:
- to encourage a legitimate balance between the supply and demand for foreign labour, thus
making the connection between entry and employment more realistic and more in tune with the needs of Italian businesses and families;
- to synchronize the length of the permit to stay with the reality of the workplace and make the procedures for issuing and renewing permits easier for both the authorities and immigrants;
- to create a preferential system for qualified workers; - to make repatriation effective by motivating immigrants to collaborate; - to move on from the current system of permanent and temporary reception centres by
radically reforming existing rules and regulations, thus ensuring that there are efficient systems for the assistance, rescue, and identification of immigrants as well as for sending them home if they are expelled.
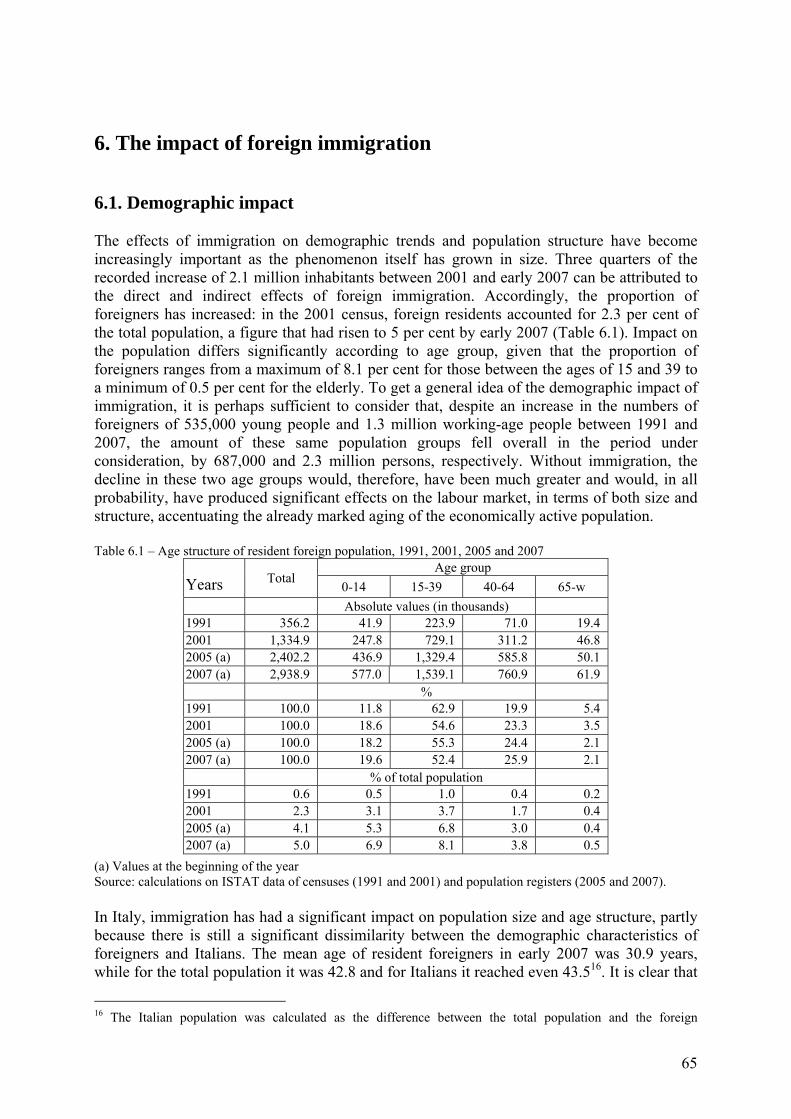
65
6. The impact of foreign immigration 6.1. Demographic impact The effects of immigration on demographic trends and population structure have become increasingly important as the phenomenon itself has grown in size. Three quarters of the recorded increase of 2.1 million inhabitants between 2001 and early 2007 can be attributed to the direct and indirect effects of foreign immigration. Accordingly, the proportion of foreigners has increased: in the 2001 census, foreign residents accounted for 2.3 per cent of the total population, a figure that had risen to 5 per cent by early 2007 (Table 6.1). Impact on the population differs significantly according to age group, given that the proportion of foreigners ranges from a maximum of 8.1 per cent for those between the ages of 15 and 39 to a minimum of 0.5 per cent for the elderly. To get a general idea of the demographic impact of immigration, it is perhaps sufficient to consider that, despite an increase in the numbers of foreigners of 535,000 young people and 1.3 million working-age people between 1991 and 2007, the amount of these same population groups fell overall in the period under consideration, by 687,000 and 2.3 million persons, respectively. Without immigration, the decline in these two age groups would, therefore, have been much greater and would, in all probability, have produced significant effects on the labour market, in terms of both size and structure, accentuating the already marked aging of the economically active population. Table 6.1 – Age structure of resident foreign population, 1991, 2001, 2005 and 2007
Age group Years Total
0-14 15-39 40-64 65-w Absolute values (in thousands) 1991 356.2 41.9 223.9 71.0 19.4 2001 1,334.9 247.8 729.1 311.2 46.8 2005 (a) 2,402.2 436.9 1,329.4 585.8 50.1 2007 (a) 2,938.9 577.0 1,539.1 760.9 61.9 % 1991 100.0 11.8 62.9 19.9 5.4 2001 100.0 18.6 54.6 23.3 3.5 2005 (a) 100.0 18.2 55.3 24.4 2.1 2007 (a) 100.0 19.6 52.4 25.9 2.1 % of total population 1991 0.6 0.5 1.0 0.4 0.2 2001 2.3 3.1 3.7 1.7 0.4 2005 (a) 4.1 5.3 6.8 3.0 0.4 2007 (a) 5.0 6.9 8.1 3.8 0.5
(a) Values at the beginning of the year Source: calculations on ISTAT data of censuses (1991 and 2001) and population registers (2005 and 2007).
In Italy, immigration has had a significant impact on population size and age structure, partly because there is still a significant dissimilarity between the demographic characteristics of foreigners and Italians. The mean age of resident foreigners in early 2007 was 30.9 years, while for the total population it was 42.8 and for Italians it reached even 43.516. It is clear that
16 The Italian population was calculated as the difference between the total population and the foreign

66
Italy is still in a situation where the demographic advantages of immigration are high and rising, as can be seen from the age pyramid of foreign residents (Figure 6.1). This is, in fact, typical of a population in which the migration process is still in full swing: a strong concentration in the central age range, a growing number of young people, and a rapid decline towards the end of the working life. Most foreigners are between 27 and 40 years, with no major differences between the sexes, while there is a clear increase in the numbers of children, as a result of family reunifications and the growing number of births. Figure 6.1 Age pyramid of the resident foreign population, beginning in 2007 Source: ISTAT data. There has been an 8.3-fold increase in births to foreign couples in 13 years, rising from 7,000 in 1993 to 57,800 in 2006 (Figure 6.2); thus these children now represent 10.3 per cent of all births in the country, with a regional maximum of 17.4 per cent in Emilia Romagna and a provincial maximum of 27.3 per cent in Prato (Tuscany). Figures for those born to at least one foreign parent are even higher: just under 72,000 in 2005, amounting to 13 per cent of births. These figures indicate a much higher fertility of the foreign population than the local population. Indeed, the fertility rate of foreign women in 2005 is estimated at 2.41 children per woman, compared to a figure of 1.24 for Italians and an overall total of 1.32 [ISTAT 2007b]. This figure may well be an overestimation of the actual fertility rate of foreign women, since the legal status of many was regularized in the same period. In fact, a big increase in the immigrant population and a high proportion of women with a reduced length of stay in the host country produce an increase in fertility rates [Toulemon 2004].
population.
2,0 1,5 1,0 0,5 0,0 0,5 1,0 1,5 2,00
5
10
15
20
25
30
35
40
45
50
55
60
65
70
75
80
85
90
95
100 +
%
FemaleMale

67
Deaths of foreigners have increased in recent years, but did so much less than births: 3,450 foreigners died in 2006, representing just 0.6 per cent of all deaths in Italy. The limited number of deaths is evidently due to the youthful age structure of the foreign community. The number of marriages in which one spouse is a foreigner have increased less than births but more than deaths: figures, in fact, almost tripled, from 10,000 in 1993 to almost 32,000 in 2005, amounting to 12.2 per cent of all weddings celebrated in Italy.
Figure 6.2 - Births and deaths of foreigners, marriages with at least one foreign spouse, 1993-2006 (absolute values in thousands)
0
10
20
30
40
50
60
70
1993 1998 2003
Years
Births Deaths Marriages
Source: ISTAT data. 6.2. Labour market participation and economic impact In economic terms, too, the impact of foreign immigration has become greater with the increase in the immigrant population. According to unofficial estimates, in 2005, 6.1 per cent of GDP was produced by immigrants [Dell’Oste and Paolazzi 2006]; in 2007 the labour force survey showed that 7 per cent of workers in the country were foreigners, while in the 2001 census they accounted for just 3.1 per cent. This growth in numbers of immigrant workers took place in a context, which saw an increase, between 1998 and 2007, of 2.2 million in employment figures and a parallel decrease in the unemployed of 1.1 million. These developments took place, however, in a macroeconomic situation that was far from favourable, with economic growth rates that have, since 1998, always been lower than the EU-15 average, even recording zero growth in 2003 and just 0.5 and 0.6 per cent in 2002 and 2005. In our analysis of immigrants’ participation in the labour market, we refer to data on foreign residents from the censuses carried out in 1991 and 2001 and the labour force survey, which, since 2005, has also produced statistics on foreigners. These figures, of course, do not take into account either foreigners without permits to stay or those that hold permits to stay but are not residents, two groups which, in the case of Italy, represent, as shown above, a large proportion of the immigrant population. Consequently, the amount of immigrant labour is certainly greater than it appears from these two sources and it is also very likely that, in sectors where there is a greater amount of undeclared employment (agriculture, construction, domestic work, catering, etc), the gap is even wider.

68
In 1991, labour market participation levels of Italian and foreign residents were quite similar (Table 6.2). In 2001, the differences between men became greater, while among women it remained small. In more recent years, both foreign men and foreign women have employment and unemployment rates that are higher than those of Italians, while for both sexes the percentage of people not included in the labour force is lower.
Table 6.2 - Resident foreign and Italian population (15-64 years) by economic condition, 1991, 2001, 2005 and 2007 (absolute values in thousands)
Men Women
Total (a.v.)
Employed (%)
Unemployed(%)
No labour force (%)
Total (a.v.)
Employed (%)
Unemployed (%)
No labour force (%)
1991 Foreign 158.7 66.7 8.2 25.1 136.1 34.8 11.4 53.9 Italian 19,246.5 65.1 11.5 23.3 19,527.5 34.6 9.6 55.8 2001 Foreign 514.4 79.0 7.0 14.0 525.9 42.8 9.7 47.5 Italian 18,526.8 65.7 7.0 27.3 18,679.6 42.0 7.3 50.8 2005 (a) Foreign 937.4 81.1 6.1 12.8 917.3 49.6 8.5 42.0 Italian 18,384.2 69.3 4.4 26.3 18,432.6 45.1 4.9 50.0
2007 Foreign 1,106.0 83.3 4.7 12.1 1,124.4 51.3 7.4 41.3 Italian 18,360.7 69.9 3.6 26.4 18,354.3 46.3 3.8 49.8 (a) Average of the last three quarters of the year Source: calculations from ISTAT data of the censuses [1991 and 2001] and of the Labour Force survey
In particular, the proportion of economically active foreign men in 2007 was 88 per cent of the population between the ages of 15 and 64, compared to 73.5 per cent for Italians; for women, both figures were lower and reached 58.7 per cent for immigrants and 50.1 per cent for Italians (Table 6.3). Unemployment rates were also higher among foreigners; the difference with Italians was very low for men and higher for women.
Table 6.3 - Activity, employment and unemployment rates of resident foreign and Italian population (15-64 years), 2007 (%)
Population Activity rates (%) Employment rates (%) Unemployment rates (%) Men Foreign 87.9 83.3 5.3 Italian 73.6 69.9 5.0 Women Foreign 58,7 51.3 12.7 Italian 50.2 46.3 7.6
The data in question are also influenced, of course, by the very different age structures of the populations examined. It is interesting to compare economic activity rates by age and sex of the foreign population up to 2007 with those of Italians resident in the Centre-North and the South, to take into account the big differences in the labour market in the two major areas of the country (Figure 6.3). Male foreigners have higher activity rates than Italians resident in the South, but figures are virtually the same for those in the Centre-North between the ages of 35 and 54. There are also big differences at the younger and older ages. Among foreign women, all age groups have a higher activity rate than Italians in the South, but the range in which the

69
highest figures are to be found among Italian women in the Centre-North is, compared to men, much greater and the differences in rates are bigger. These trends also reflect, for foreign males, low school attendance and very low numbers of pensioners. In the case of foreign women, these two factors are compounded by the existence of a large proportion of immigrants that has not entered (or has yet to enter) the labour market, determining rates that are lower than or equal to those of Italian women in the Centre-North, but just higher than those of Italian women in the South. Figure 6.3 Activity rates of Italians and foreigners by sex and geographic division (only for Italians), 2007 (%); Source: calculations on ISTAT data
In 1991, 5.5 per cent of the 155,000 foreign residents were employed in agriculture, 27.6 per cent in industry, 12.2 per cent in construction and the remaining 57.7 per cent in the services sector (Table 6.4). In ten years, figures increased to nearly 637,000, with an increase of 5 percentage points in industry, nearly 3 in construction and a drop of over 8 in the services sector. According to the 2007 labour force survey, a total of 1.5 million foreigners were employed, with slightly less than one quarter of the total employed in industry, followed by 20.5 per cent in the other public, social and domestic service17, 17.1 per cent in construction and 17.9 in the other sectors of activity (Table 6.5).
17 In the two labour force surveys, the new classification of economic activities (Ateco 2002) is used, which includes domestic work in this broad category, while in the two censuses the previous classification (Ateco 1991) is used, in which it is considered a separate sector [ISTAT 2003].
0
20
40
60
80
100
15-24 25-34 35-44 45-54 55-64
Centre-North South Foreigners
Male
0
20
40
60
80
100
15-24 25-34 35-44 45-54 55-64
Centre-North South Foreigners
Female

70
Table 6.4 – Resident foreign population by economic sector and geographic division, 1991 and 2001 censuses. (absolute values in thousands)
Settori (%)
Division Total (a.v.)
Agriculture Industry Construction
Wholesale and
retail trade
Accomod. and food service
Domestic service
Other service
activities (a)
1991 North West 55.9 2.5 32.5 9.9 .. .. .. 55.2 North East 37.5 4.2 41.4 11.4 .. .. .. 43.0 Centre 39.0 5.8 15.9 7.3 .. .. .. 71.0 South 22.8 14.2 12.7 8.0 .. .. .. 65.1 Italy 155.1 5.5 27.6 9.3 .. .. .. 57.7 2001 North West 231.9 4.1 33.4 12.8 9.1 7.0 12.4 21.2 North East 185.0 4.3 43.6 12.5 7.9 7.7 5.9 18.1 Centre 152.7 6.1 24.8 12.5 10.2 8.2 14.6 23.6 South 67.0 16.3 16.8 8.6 16.9 6.8 14.1 20.6 Italy 636.6 5.9 32.6 12.2 9.8 7.5 11.2 20.8
.. = not available. (a) In 1991include all service activities Source: calculations on ISTAT data. Table 6.5 – Resident foreign population by economic sector and geographic division, 2007 (absolute values in thousands)
Sectors (%)
Division Total (a.v.) Agriculture Industry Construction
Wholesale and
retail trade
Accomod. and food service
Other public,
social and domestic service
Other service
activities
Men North West 337.0 3.4 33.1 25.1 7.6 6.7 5.2 18.9 North East 269.9 2.2 40.9 24.7 8.6 6.4 2.5 14.7 Centre 219.4 5.3 18.8 37.5 9.2 7.9 8.2 13.0 South 97.2 13.5 11.5 20.3 26.0 6.8 15.4 6.4 Italy 923.5 4.6 29.7 27.4 10.2 6.9 6.2 14.9 Women North West 201.2 0.7 11.5 0.6 6.4 8.4 46.1 26.3 North East 138.9 0.9 22.3 0.6 6.9 13.2 25.4 30.7 Centre 165.2 1.9 10.1 0.8 8.3 13.9 47.4 17.6 South 73.6 5.7 5.5 0.0 7.7 11.6 60.1 9.4 Italy 578.9 1.7 12.9 0.6 7.2 11.5 43.3 22.7 Total North West 538.2 2.4 25.1 15.9 7.1 7.3 20.5 21.6 North East 408.8 1.8 34.6 16.5 8.0 8.7 10.3 20.1 Centre 384.5 3.9 15.1 21.8 8.8 10.5 25.0 14.9 South 170.9 10.1 9.0 11.5 18.1 8.9 34.7 7.7 Italy 1502.4 3.5 23.3 17.1 9.1 8.7 20.5 17.9
Source: calculations on ISTAT data of Labour Force survey.

71
There were big differences across regions and gender. For males in the Centre-North, industry and construction absorbed most of the labour force, while in the South it was trade and construction. Among women, the domestic service sector is predominant almost everywhere, with the significant exception of the North East, where it is in second place. According to data from the 2007 labour force survey, the self-employed account for 14.8 per cent of the overall foreign labour force (15.9 per cent for men and 12.9 per cent for women). Almost three-quarters of all male and female foreign employment is made up of manual workers, confirming the trend for immigrants to be predominantly employed at the lowest end of the employment scale. As previously mentioned in paragraph 4.5, there are differences according to geographical area and types of pull factors. Some of these elements can be more precisely characterized now in relation to labour market participation. The increase in foreign employment in the industry, which reached 350,000 in 2007, is an extremely important element in the evolution of immigration. In many areas of the industrialized Centre-North, local labour force reserves had essentially dried up, due also to ongoing demographic trends, which pushed companies to employ immigrant workers in manufacturing and, significantly expanded opportunities for employment in central areas of the national economy. Construction is a main area of employment for immigrant workers throughout the country, above all offering foreigners their first chance at securing a job, often irrespective of any professional qualifications or without guarantees of regular work, as confirmed by the high turnover highlighted by recent research findings [Macioti and Pugliese 2003]. The construction sector is also one of the areas where, in all likelihood, the data from the labour force survey underestimates the true scale of employment. Domestic work, of different types and functions, remains one of the most important sectors of immigrant participation in the labour market. The unwillingness of Italians to work in private households and fulfilling tasks such as cleaning, babysitting and caring for the disabled or elderly, and the general inadequacy of the welfare system to meet the needs of families, particularly in a period characterized by a growing number of female workers and more old people in need of assistance, explain the origin, development and considerable size of this sector today. These pull factors should remain valid in the coming years; indeed, in demographic terms, it is certain that the amount of nursing and care work in families will increase as a result of population aging. Therefore, it can be assumed that the demand for domestic work will not only remain at its present level, but that it will also continue to grow. Demand for workers to do menial tasks in the service sector represents an important component. In this case the dynamics that have affected the national economy seem to be quite similar to what has happened in other developed countries: it is difficult, if not impossible, in this kind of employment to introduce innovations to reduce production costs. Moreover, by their very nature, these activities cannot be delocalized abroad, so the quickest and most effective option remains that of cutting guarantees and labour costs by means of offering informal and temporary work. Again in the services sector, an ethnic trend can be seen in businesses, in which Chinese with their restaurants and shops represent the most visible but not the only group.

72
In 2007, agriculture accounted for 3.5 per cent of foreign employment, which reached 10.1 per cent in the South. These figures carry a certain weight and show the importance of immigrant labour in this sector. In the South, foreign workers are used mainly to harvest crops and perform, in general, all the typical activities of Mediterranean agriculture where workload, in principle, is strongly seasonal. In the Centre-North, on the other hand, immigrants are mostly given a contract and paid the minimum wage; stable employment is most common in livestock farming [Reyneri 1996]. Regarding the overall role of immigration in the national labour market, a recent study that took into consideration the results of research conducted in recent years came to the conclusion that “there is greater complementarity than competition between national and migrant labour […]. In a segmented labour market such as Italy’s, where large pockets of unemployment coexist with difficulties in finding labour […], non-EU workers do "low quality" jobs rejected by Italian workers” [Brandolini et al. 2005, 261]. However, as regards the possible delaying effect of immigration in economic modernization, there is no doubt that the growing role of the services sector in absorbing immigrant labour has tended to increase this risk [Reyneri 1996]. Indeed, a study pooling the results of two surveys conducted by the Bank of Italy with INPS archives showed that, other things being equal, companies that usually paid lower wages employed more non-EU workers [Brandolini et al. 2005]. It is also likely that the increase of foreign workers has been influential in the reduction of the annual growth rate of labour productivity, down from 1 per cent at the end of 1990s to nil for the 2000-2005 period, so that at present labour productivity in Italy is 10 per cent below the EU-15 average [Reyneri 2007]. In any event, it is unrealistic to suppose that “3D” jobs (dirty, dangerous and demanding) are confined only to the backward areas of the economic system; indeed, very often innovation determines the need for workers to perform menial tasks. Thus, in a situation where there is a demographic shortage of labour, as happens in many industrial districts of the Centre-North, even companies with a good level of innovation and, actively present on world markets have a need for low-skilled workers that cannot be satisfied by the local labour force at low salaries, and they therefore look to immigrants. It should also be borne in mind that immigrant workers have given firms a greater degree of flexibility in responding to market demands since the mid-1990s. 6.3. Social impact It is a difficult task to assess the impact of immigration on Italian society given the complex and dynamic nature of the phenomenon in question. The reaction of society to the presence of immigrants, their impact not only on political parties but also on Italian political culture and the national welfare system, is complicated by the fact that immigration in Italy has undergone profound changes in terms of both numbers and social and demographic composition. These changes are a consequence of the stabilization and integration of the immigrant population in Italian society, which have not only produced an increase in the number of foreigners but have also led to the emergence of a new social class of immigrants and, therefore, new needs which translate into increased demand for social services and new strains on the Italian welfare state.

73
Although there are some universal elements in the system of social protection in Italy, such as those regarding the health sector, it is still centred on social security and employment. This means essentially that, with rare exceptions, welfare is provided almost exclusively to those employed in regular jobs. In this context, therefore, immigrants are among the least-protected members of Italian society today. Their affiliation with the welfare system is governed by the 1998 Consolidation Act, according to which all immigrants in Italy in possession of a regular permit to stay may benefit from welfare policies. Two levels are established for immigrants: social assistance, involving national and regional social welfare interventions provided by central and decentralized social services; and integration, which is governed by the laws on immigration. The fact that local authorities are mainly responsible for policy decisions and implementation of social assistance policies for immigrants has shifted the attention of researchers from macro areas to micro aspects. The analysis of data on social services provided at the local level to the migrant population highlights the great regional inequalities that exist in accessing social services (see also paragraph 5.3). In a general situation in which substantial reductions in social spending have had a greater impact on territorial areas already marked by a shortage of services, those in the weakest position and the ones who suffer most from the drastic reduction in spending are immigrants. ISTAT recently published the results of a second survey on social services and action provided by municipalities alone or in conjunction with other public bodies [ISTAT 2007c]. Social services and interventions can be grouped into three macro-areas: support services and interventions, money transfers and facilities. Users, on the other hand, have been classified, in accordance with the Framework Law on welfare (Law 328/2000) and the European classification of social protection (ESSPROS), into seven types: households and children, the disabled, dependents, the elderly, immigrants, the adults in poverty, and multi-category users. The report shows that, as regards users, most municipal expenditure is on “households and children” (39 per cent of total) then “the elderly” (24 per cent) and “the disabled” (20 per cent). The remaining 16 per cent is spent on the other areas, of which just over 2 per cent of the total is spent on “immigrants”. Moreover, in 2004 just over 38 per cent of municipal expenditure for immigrants went into social services and interventions, over 35 per cent into facilities and the remaining 27 per cent was paid in the form of monetary transfers. A detailed analysis of individual items shows that professional social services18 accounted for just over 17 per cent of total municipal expenditure for “Immigrants and nomads” in 2004, of which just 2 per cent was for housing and/or accommodation for immigrants, compared to 35 per cent of the total spent on community and residential facilities and emergency services19 [ISTAT 2007c]. These figures suggest that the low municipal spending on services for immigrants is mainly used to improve situations of serious social exclusion, economic marginalization, or to provide initial temporary accommodation for immigrants. The same approach to immigration (initial temporary accommodation, emergency situations and control) can also be seen in central government spending. 18 This item includes interventions to provide advice and information on social services and support activities to help people identify and activate possible solutions to their problems. 19 Residential facilities, summer or winter centres, facilities for nomads. As regards emergency social intervention activities, street units, etc. are counted.

74
The report of the Court of Auditors on the resources allocated for activities linked to immigration in the budget shows that €65,469,100 were used in 2002 for law enforcement and €63,404,004 for support measures, while in 2003 spending for law enforcement rose to €164,794,066, and immigration support and integration measures fell to €38,617,768 [Corte dei conti 2004, p. 2]. In 2004 the amount set aside for immigration control fell to €115,467,102, which is not proportional to the amount set aside for integration, which was a modest €29,078,933. It is evident, therefore, that during these years, “administrative activity connected to immigration was conditioned by urgency and emergency, within a regulatory and organizational framework yet to be stabilized” [Corte dei conti 2005, p. 6]. In a situation marked by a sharp reduction in expenditure for immigrant integration, central government spending for this population is increasingly used for emergency management of new immigration flows and law enforcement, while local authority spending is still poorly calibrated for what is the new phase of the stabilization of immigration. 6.4. Integration Outcomes
As we know, integration is a complex process that involves many different aspects. Here we have taken into account two aspects (poverty and schooling) that seemed the best way of highlighting the living conditions of immigrants and show the distance that separates them from Italians. The level of poverty of immigrants indicates the degree of effective economic integration in the host society. Reliable information on this at the national level is not currently available, but reference can be made to data collected in Lombardy since 2004 by the Ismu Regional Observatory20 on behalf of the National Committee on Social Exclusion [Blangiardo 2007]. The picture that emerges from these data is anything but positive. Adopting the same poverty threshold used by ISTAT we find that, for example, in 2006, 39.6 per cent of households with at least one foreigner were below the poverty line: a figure four times higher than the national level and ten times higher than that of Lombardy [ibidem]. Moreover, the longer families have been in Italy and the more children they have the greater the percentage of poverty. In 2006, for example, families living in Italy for over ten years had a poverty level six percentage points below the average, while the risk of poverty doubled for families with one child and tripled for families with three or more children. Another significant element in the integration process is the social inclusion of young immigrants and second generation immigrants. The most obvious demonstration of the gradual stabilization of immigration in Italy is precisely the increasing presence of foreign pupils in schools (Figure 6.4). At all school levels, figures have steadily increased: total numbers have risen from just 8,400 in the 1983-84 school year to almost 425,000 in 2005-06. In relative terms, while ten years ago the proportion of non-Italian pupils was below 1 per cent throughout the country, now it is 4.8 per cent, reaching 9.5 per cent in Emilia Romagna, 11.9 per cent in the province of Mantua and 12.7 per cent in the municipality of Milan.
20 Data from the survey that the Observatory carries out each year in the region on a sample of about 8,000 foreigners from countries experiencing strong migratory pressure.

75
Figure 6.4 - Foreign students by type of school, 1983/84 (absolute values in thousands) Source: ISTAT and Ministry of Education data.
But what are the results of this increase in the number of foreign pupils? Using the 2001 census data we can calculate the school attendance rates using uniform data for the numerator and the denominator, since they come from the same source and regard the same population. The school attendance rate for foreign children is lower than that of Italians at all ages, with slightly widening gaps in the transition from the first to the second level of compulsory schooling and bigger differences in the later years of secondary school. Some 94.4 per cent of foreigners between the ages of 6 and 10 were enrolled in school, 91.9 per cent of those were between 11 and 13 years old, and 63.3 per cent of those between 14 and 18 years old, figures which are proportionally lower than those of Italians by nearly 3, over 4 and over 23 percentage points respectively. There are evident differences between different generations of young immigrants, a gap that from the age of 14 begins to expand gradually to reach truly significant differences at 18. Lower school attendance rates mainly concern children who came to Italy between the ages of 13 and 17, followed by those who came when they were under 13, regardless of whether they arrived at school or pre-school age; from the age of 16 levels of school attendance are clearly lower than foreign children born in Italy (second generation) [Strozza 2008]. Truancy and early school leaving, which are already significant among foreign residents, is likely to be greater among non-residents, despite the fact that Italian law guarantees school access to all foreigners regardless of their legal status. Another answer is to be found in Ministry of Education data [2005 and 2006] on foreign pupils in schools. Firstly, as regards secondary school education, 40.6 per cent of foreign pupils attend technical colleges compared to 19.9 per cent of their Italian peers. Furthermore, more foreign children than Italian ones attend classes meant for younger pupils. This is already evident at the beginning of primary school: 10.7 per cent of foreign pupils compared to 1.3 per cent of Italians start school late. At the end of primary school the gap widens, reaching 35.2 per cent and 2.3 per cent, respectively. The distance widens further in middle schools, involving 60.5 per cent of foreign pupils and 8.8 per cent of Italians. In high school the gap remains very wide but tends to narrow after the third year. At the end of high school, the delay involves about a quarter of Italian pupils and nearly 70 per cent of foreigners. These delays are not necessarily the result of failure at school, but can also be determined by other factors related to immigration and resulting delays in enrolling at Italian schools. The
0
20
40
60
80
100
120
140
160
180
1983-84 1988-89 1993-94 1998-99 2003-04
Preschool Primary Middle High Sc.

76
difference between foreign and Italian pupils, however, can also be seen in pass rates (see Table 6.5). The difference is small but present at all school levels. A slight gap (3.2 percentage points) is already to be found in primary schools, where almost all Italian children pass their exams; the difference climbs to 7.9 points at middle school and reaches 12.8 in higher education.
Table 6.5 – Rates of school advancement (2004-2005)
Type of school Foreign students Italian students Primary 96.7 99.9 Middle 89.8 97.7 High School 72.3 85.1
Source: Ministry of Education data. A study conducted by the Ministry of Education on the 2003-2004 school year did not produce unequivocal results, showing, ultimately, how the relation between the number of foreign students and educational advancement is anything but linear, and depends very much on what the school does to address the situation. Ministry data reveals a problematic situation. The high proportion of pupils in classes designed for younger children and the high failure rate are clear signs of the distance that separates young foreigners from Italians, a distance which, in the coming years, will inevitably be transferred to the labour market and society, where small but significant numbers of second generation immigrants are likely to find themselves with skills far below those of Italian children.

77
7. Transition from an emigration to immigration country In the early 1970s, Italy experienced net immigration for the first time, coinciding with the end of a period of exceptionally high economic growth in the country (Table 7.1). Between 1951 and 1963, the Italian economy grew by an average annual rate of 5.8 per cent, reaching 6.5 per cent in the boom years between 1958 and 1963; between 1964 and 1973 it continued to grow at a rate of 5 per cent per year, while the unemployment rate remained below 5.5 per cent throughout this period [Coccia 2007]. From the structural point of view, the share of agricultural workers fell from 43.9 per cent in 1951 to 16.6 per cent in 1973; in the same period, the share of industrial workers increased from 29.5 per cent to 38.3 per cent. Such extraordinary economic growth and the equally important structural changes in the Italian economy amply explain the trend towards diminishing emigration and negative net migration figures recorded in the 1960s. Net immigration coincided with the beginning of an overall reorganization of European migration patterns following the oil crises. In fact, once the extraordinary economic growth of the post-war period had come to an end, there began a long and far-reaching process of industrial restructuring that radically changed the role of immigrants in the labour markets. Official recruitment channels were closed and the governments of the receiving countries were forced to face the fact that immigration – until then considered as mainly temporary by all concerned – had become a structural reality throughout Europe. In Italy, the combined effect of economic growth and the closure to immigration in the receiving countries meant that there were more national returnees than emigrants, with the closing of a migration cycle that had begun almost a century earlier. Towards the end of the decade, the first flows of foreigners began to arrive: Tunisians came to Sicily to work in agriculture and fishing; Yugoslavians came to Friuli in the North-East of the country to work in construction; and domestic workers from Cape Verde and the Philippines arrived in the larger cities. There was a lack of legislation governing these flows, as was typically the case at that time in the Mediterranean countries of the EU and, according to more than one observer, this was the reason for the start of foreign immigration in this part of the continent. The very restrictive official immigration channels led to the substantial irregularity of a considerable part of immigration flows of the period, an aspect destined to become a constant in Italy’s immigration history, together with repeated regularisations. In the meantime, Italian economic growth had slowed down: in the 1970s, GDP had grown on average by 3.8 per cent annually, while in the following decade it slowed to 2.4 per cent, on average [Coccia 2007]. Further, unemployment had risen from 6.2 per cent in 1973 to 11.8 per cent in 1989, while the activity rate for the working-age population in this period reached just over 61 per cent at most. These early immigration flows were undoubtedly encouraged by the strong increase in the push forces in countries of the Third World, while the closing of the doors to immigration in the traditional receiving countries had made Italy a possible destination. It is also worth noting that the segmentation of the labour market was already creating labour shortages in some specific manufacturing sectors and in some geographical areas, even in a situation of high overall unemployment. In an economy like Italy’s, characterized by a high level of

78
underground economy and informal employment, this process of segmentation finds a particularly favourable climate. During the 1980s, the attitude towards immigration was basically positive. A large majority approved the first piece of legislation, Law 943/1986. The climate changed radically in the following decade after the fall of the Berlin Wall, which set new processes in motion. It therefore seems appropriate to consider the period 1973-1989 as the moment of Italy’s passage from emigration to immigration country. At first, the change was almost exclusively in the flows of Italian nationals, but the arrival of foreigners steadily increased during the 1980s and became the most important part of the country’s international migration. To sum up, the main factors behind the start and then consolidation of immigration flows in this period were: the growth of push forces in the Third World and, to a lesser extent, in Central and Eastern Europe; the closure to further immigration from traditional European receiving countries; an inadequate legislative framework; a large underground economy; and the largely tolerant attitude towards immigration on the part of both government and public opinion. Therefore both external and internal factors contributed to the start and initial growth of significant foreign immigration into Italy [Neri 1988]. This situation then changed when, in the early months of 1990, during parliamentary debates to approve the Martelli Law, a large division opened up between the two parties (Movimento Sociale and Partito Repubblicano) opposing the legislation and a broad grouping in favour of the law, including most political parties, also supported by the trade unions and the Catholic Church. The immigration problem once again became the centre of attention for politicians and public opinion in a dramatic way between March and August 1991, when several waves of Albanian refugees arrived by boat on Italian shores. The dramatic nature of events highlighted, and even reinforced, the profound change that had occurred in Italian society in the meantime, as regarded immigration. The press had gradually moved its attention away from the problem of reception to that of control and ways of counteracting what it described as an unstoppable and an increasingly threatening tide of migration. The prevailing image used when talking about immigration was that of a “threat”, of “an invading and besieging army”, and the immigrant was identified as “clandestine”, “irregular”, “illegal” or “undocumented” [ter Wal 1991 and 1995]. There was little or no mention of the economic role of these foreign workers in a country in which this contribution would become increasingly important in the years to come [Sciortino and Colombo 2004]. Political opinion followed a similar path, with the political parties becoming more and more fearful of leaving any space to those opposing immigration restrictions more forcefully. Even the opinion polls showed quite clearly that, during 1991, among the general public, openness and tolerance had given way to fear and a desire to batten down the hatches [Bonifazi 1996]. This explains why the forced repatriation of 21,000 Albanians who had arrived on the beaches of Puglia in August and been held for some days in the football stadium in the town of Bari, went ahead with hardly any opposition in an extraordinary – and largely unexpected - climate of converging public sentiment and government action. [Pittau and Reggio 1992]. In addition to pressure from public opinion particularly influenced by the massive numbers of Albanian refugees arriving on the beaches of Puglia in 1991, there was also the need to manage immigration according to the criteria informing the policies of the other European

79
Union countries. In fact, in June 1990, Italy signed the Schengen Agreement, which established precise conditions for controlling external borders in order to abolish the internal ones; and in 1991 the signature of the Maastricht Treaty, which came into force in 1993, was another step on the road towards European integration [Sabatino 2004]. Nevertheless, the Martelli law did not help Italy move away from an essentially emergency-driven management of immigration. Firstly, because the immigrant integration measures introduced by the law were totally inadequate and were limited in practice to the creation of reception centres. Secondly, although Italy’s European partners had been pushing for stricter control of clandestine immigration, considering Italy to be the soft underbelly of the Union, the law only made partial provision for such controls, given the lack of any real means for expelling irregular immigrants following arrest [Zincone and Di Gregorio 2002]. During the 1990s, growth in the economy slowed to an annual rate of barely 0.6 per cent and unemployment remained at just over 11 per cent for most of the decade, with peaks close to 20 per cent in the South of the country. From the employment perspective, the situation has improved in the current decade, with unemployment falling (in 2007, 6.1 per cent overall, 11.1 per cent in the South) and an increase in activity rates (75 per cent for males and 51 per cent for females, partly due to the presence of immigrants). However, as already noted, in the current decade, macroeconomic performance has been somewhat lacklustre. In 2000, GDP growth was 3.6 per cent falling to 1.8 per cent in 2001, 0.5 per cent in 2002, arriving at zero growth in 2003. In the following years, there was an alternating trend: 1.5 per cent in 2004, 0.6 per cent in 2005 and 1.8 per cent in 2006. It should also be borne in mind that in 1992 Italy suffered a dramatic political crisis that caused the disappearance of many political parties and radical change in others [Ginsborg 1998]. This crisis greatly influenced the decision-making process as regards migration policies. In fact, despite a very obvious need for regulation, there was no new legislation before 1998 when the Turco-Napolitano law was passed. At the start of 2000, there were more than one and a half million regular immigrants. Political discussion about immigration was becoming steadily harsher in tone; in 1999 there had been a proposal by the party Lega Nord to hold a referendum to repeal the new law (a proposal dismissed by the Constitutional Court), and later there was the Bossi-Berlusconi bill, fired by popular enthusiasm and proposed in March 2000 during the regional election campaign [Zincone 2001a]. The arrival of the new centre-right government in 2001 had important implications for migration policy leading to the new Bossi-Fini law being passed in July 2002. In line with the election manifesto of the Casa delle Libertà, this law had the goals of better management of migration flows and more effective prevention of clandestine immigration [Nascimbene 2003, 532]. The latter aspect was clearly the more important one, even if, despite initial intentions being quite different, the law provided for the regularisation of immigrants working in domestic service and as caretakers and there was also a decree law in September of the same year to legalise the jobs done by non-EU irregular workers in industry [ibidem]. These provisions led to the presentation of 705,000 applications for regularisation of which around 650,000 were approved. This was by far the most important policy initiative of its kind in Italy’s history, and it made a decisive contribution to bringing the total number of regular immigrants to almost 2.8 million at the start of 2006.

80
In the last few years, the role of the European Union in the determination of migration policies has become even more active than in the past. Under the Treaty of Amsterdam of 1997, immigration and asylum issues were moved to the third pillar to make the decision-making process more effective and direct. The 1999 Tampere summit meeting confirmed in its conclusions that a common approach to the migration question was called for, recognising the need for national laws based on a common assessment of economic and demographic trends within the Union and in the sending countries. Later, in May 2004, ten more countries joined the Union, with important implications for migration, regarding both policy and management aspects and also the flows themselves. In this regard, it should be recalled that initially, except in the cases of Malta and Cyprus, Italy made use of the clause in the accession treaties allowing a transition period prior to the free circulation of workers from the new member states. The centre-left Prodi government that came into power after the elections of April 2006 began work on a series of immigration measures. In particular, a second decree-law on migration flows was passed which: enabled 350,000 immigrants to be regularly employed; abolished the transition period limitations on workers from eight of the new EU member countries; implemented the Community directives on family reunion and long-term residents, with more favourable rules than those in force at the time; and proposed a bill to revise the law on acquiring citizenship and another to modify the Bossi-Fini law. The entry of Romania and Bulgaria into the European Union at the start of 2007 was followed in February of the same year by a decree-law on the entry and residence of EU member states citizens, implementing Community directive of 2004. The fall of the Prodi Government at the start of 2008 and the dissolution of Parliament held up the approval of two measures presented by the executive regarding naturalization and immigration. With the victory of the centre-right parties in the April elections, a more literal application of the Bossi-Fini law can be expected, even if the problem of the lack of any truly effective channels for managing regular entries remains. Undoubtedly, apart from the different approaches to immigration on the part of left and right, over the last few years the economic system has demonstrated its growing need for foreign workers. The extraordinary growth in the numbers of officially registered foreigners in this decade indicates the increasing stabilisation of numerous immigrant communities and the work of various migration networks; but it also demonstrates the increasingly strong demand for foreign labour in Italian factories and homes as a result of specific demographic, economic and social factors.

81
Table 7.1 Main phases of migration experience
Period Phase Main flows Migration policies and domestic context International context
1945-1972 Labour emigration Labour migration towards WE.
Bilateral agreements with immigration countries. Strong economic growth.
Strong economic growth. Positive political climate towards migration inflows. Recruitment of foreign workers. Principle of free circulation of workers within the EEC.
1973-1989 The transition from emigration to immigration country
Return migration exceeds emigration. Foreign immigration.
No legal framework; first law in 1986. Positive general attitude towards foreign immigration. Lack of suitable channels for regular entries. Regularisation (1986).
Stop policies. Zero net migration policy.
1990-2007 Stabilisation as an immigration country
Growth of immigration.
Three main laws: 1990, 1998, and 2002. Migration becomes a controversial issue in political debate. Public concern. Channels for regular entries still lacking. Regularisations: 1990, 1995, 1998, and 2002.
Fall of the Berlin Wall. Growing role of EU in migration issues. Gradual incorporation of CEE in the EU migration system

82
References
Anastasia, B., S. Bragato and M. Rasera (2004), “Dopo la «grande regolarizzazione» del 2002. Percorsi lavorativi degli immigrati e impatto sul mercato del lavoro”, in Barbagli M., A. Colombo, G. Sciortino (eds.), I sommersi e i sanati. Le regolarizzazioni degli immigrati in Italia, Bologna, pp. 103-137, Il Mulino.
Barbagli, M., A. Colombo and G. Sciortino (eds.) (2004), I sommersi e i sanati. Le regolarizzazioni degli immigrati in Italia, Bologna, Il Mulino.
Bigo, D. (2002), Security and immigration: towards a critic of the governmentality of Unease in “Alternatives”, n. 27
Birindelli, A. M. (1984), Dalle grandi emigrazioni di massa all’arrivo dei lavoratori stranieri: un secolo di esperienza migratoria in Italia, Materiali di studi e di ricerche, 5. Roma, Dipartimento di scienze demografiche dell’Università di Roma La Sapienza.
Birindelli, A. M. (1988), Gli stranieri in Italia: quadro di sintesi, in «L’Assistenza Sociale», 42, 5.
Birindelli, A. M. (1989), Le migrazioni con l’estero. Chiusura di un ciclo e avvio di una nuova fase, in Demografia e società in Italia, E. Sonnino (ed.), Roma, Editori Riuniti.
Birindelli, A. M. (1990), Aspetti quantitativi della presenza straniera in Italia, in La presenza straniera in Italia, Labos (ed.), Roma, Edizioni Ter.
Blangiardo, G. C. (1997), La dimensione quantitativa, in Secondo rapporto sulle migrazioni, 1996, Ismu (ed.), Milano, Franco Angeli.
Blangiardo, G. C. (1998), Relazione di sintesi sugli aspetti quantitativi della presenza straniera irregolare, in Relazione sulla presenza straniera in Italia e sulle situazioni di irregolarità, Ministero dell’Interno (ed.), s.l., Centro stampa microfilm.
Blangiardo, G. C. and P. Farina (2001), “La presenza regolare e irregolare”, in Fondazione I.S.MU., Sesto rapporto sulle migrazioni, Milano, Franco Angeli.
Blangiardo, G. C. and M. L. Tanturri (2004), “Il popolo dei regolarizzati”, in Barbagli M., Colombo A., G. Sciortino (eds.), I sommersi e i sanati. Le regolarizzazioni degli immigrati in Italia, pp. 47-70, Bologna, Il Mulino.
Blangiardo, G. C. (2005), “I processi di immigrazione: dall’illegalità alla regolarizzazione”, in Livi Bacci M. (ed.), L’incidenza economica dell’immigrazione, Quaderni Cesifin, n. 20, Torino, Giappichelli.
Blangiardo, G. C. (2006), La presenza straniera in Italia, in Undicesimo rapporto sulle migrazioni 2005, Ismu (ed.), Milano, Franco Angeli.
Blangiardo, G. C. (2007), Immigrati poveri …..o poveri immigrati?, «Neodemos», www.neodemos.it.

83
Blangiardo, G. C. (2008), Aspetti quantitativi e riflessioni su prospettive e convenienza dell’immigrazione straniera in Italia, in Ismu Tredicesimo rapporto sulle migrazioni 2007, Milano, Franco Angeli.
Blangiardo, G. and S. Molina (2006), “Immigrazione e presenza straniera”, in Fondazione Agnelli and GCD-SIS (eds.), Generazioni, famiglie, migrazioni. Pensando all’Italia di domani, pp. 63-97, Torino, Edizioni Fondazione Agnelli.
Bolaffi, G. (2001), I confini del patto Il governo dell'immigrazione in Italia, Torino, Einaudi.
Bonetti, P. (1993), La condizione giuridica del cittadino extracomunitario. Lineamenti e guida pratica, second edition, Rimini, Maggioli.
Bonifazi, C. (1996), Gli italiani e l’immigrazione straniera, in Bambini, anziani e immigrati. Le opinioni degli italiani in un’indagine dell'Istituto di ricerche sulla popolazione, C. Bonifazi, A. Menniti and R. Palomba (eds.), Scandicci, La Nuova Italia.
Bonifazi, C. (ed) (1999), Mezzogiorno e migrazioni interne, Roma, Irp-Cnr.
Bonifazi, C. (2007), L’immigrazione straniera in Italia, Bologna, Il Mulino.
Bonifazi, C. and F. Heins (1996), Le migrazioni di ritorno nel sistema migratorio italiano: un riesame, in «Studi Emigrazione», 33, 122.
Bonifazi, C. and F. Heins (2000) Long-term trends of internal migration in Italy, in «International Journal of Population Geography», 6.
Brandolini, A., P. Cipollone and A. Rosolia (2005), Le condizioni di lavoro degli immigrati in Italia, in L’incidenza economica delle migrazioni, M. Livi Bacci (ed.), Torino, Giappichelli.
Brochmann, G. and T. Hammar (1999), Mechanisms of migration control, Oxford, Berg.
Calvanese, F. (1983), Emigrazione e politica migratoria negli Settanta. L’esperienza italiana ed europea, Salerno, Pietro Laveglia editore.
Calvanese, F. and E. Pugliese (eds.) (1990), L’immigrazione straniera in Italia. Il caso della Campania, Milano, Franco Angeli.
Cangiano, A. and S. Strozza (2006), “Le procedure straordinarie di regolarizzazione: regole e risultati delle diverse tornate”, in Strozza S. and E. Zucchetti (ed.), Il Mezzogiorno dopo la grande regolarizzazione. Vecchi e nuovi volti della presenza migratoria. Volume secondo, Milano, Franco Angeli, pp. 13-40.
Carfagna, M. (2002a), “Le regolarizzazioni tra il 1986 e il 1998”, in Caritas di Roma, Immigrazione. Dossier statistico 2002. XII Rapporto sull’immigrazione, Roma, Nuova Anterem.
Carfagna, M. (2003), “I sommersi e i sanati. Le regolarizzazioni degli immigrati in Italia”, in Sciortino G. and A. Colombo (eds.), Stranieri in Italia. Assimilati ed esclusi, Bologna, Il Mulino.

84
Carfagna, S., D. Gabrielli, M. P. Sorvillo and S. Strozza (2008), “Changes of status of immigrants in Italy: results of a record-linkage on administrative sources”, Barcelona, European Population Conference 2008 - EAPS, 9-12 July.
Castles, S. and M. J. Miller (1993), The age of migration, New York, The Guilford Press.
Colombo, A. and E. Martini (2007), “Il flusso legale di lavoratori dall’estero”, in Barbagli M. (ed.), Rapporto sugli immigrati in Italia, Ministero dell’Interno, pp. 80-131.
Colombo, A. and G. Sciortino (eds.) (2004), Italian immigration: the origins, nature and evolution of Italy’s migratory systems, in «Journal of Modern Italian Studies», 9, 1.
Coccia, P. (2007), Ricchi per sempre? Una storia economica d’Italia (1796-2005), Torino, Bollati Boringhieri.
Conti, C. and S. Strozza (2006), Il censimento degli stranieri, in La rappresentazione difficile. Il XIV Censimento generale della popolazione e delle abitazioni a Roma, C. Conti, F. Deriu and G. B. Sgritta (eds.), Roma, Centro stampa di Ateneo.
Cornelius, W. A. et al. (1994), Controlling immigration. A global perspective, Stanford, Stanford University Press.
Corte dei conti (2004), Programma di controllo 2003 - Gestione delle risorse previste in connessione al fenomeno dell’immigrazione. Regolamentazione e sostegno all’immigrazione e controllo dell’immigrazione clandestina, Roma.
Corte dei conti (2005), Programma di controllo 2004 - Gestione delle risorse previste in connessione al fenomeno dell’immigrazione. Regolamentazione e sostegno all’immigrazione e controllo dell’immigrazione clandestina, Roma.
Cortese, A. (1986), La presenza straniera in Italia al 1981: considerazioni sulla qualità dei risultati del censimento demografico, in «Economia & Lavoro», 20, 4.
Del Boca, A. (1984), Gli italiani in Africa Orientale. Vol. III, Bari, La Terza.
Dell’Oste, C. and L. Paolazzi (2006), Immigrati, un lavoro da 87 miliardi, in «Il Sole 24 ore», 11 dicembre.
Einaudi, L. (2007), Le politiche dell’immigrazione in Italia dall’Unità a oggi, Bari, Editori Laterza.
Federici, N. (1979), Istituzioni di demografia, Roma, Elia.
Fortini, M., G. Gallo, E. Paluzzi, A. Reale and A. Silvestrini (2007), La progettazione dei censimenti generali 2010-2011. 3 - Criticità di processo e di prodotto nel 14° Censimento generale della popolazione e delle abitazioni: aspetti rilevanti per la progettazione del 15° Censimento, Documenti n. 10, Roma, ISTAT.
Gesano, G., F. Onagro and A. Rosina (eds.) (2007), Rapporto sulla popolazione. L’Italia all’inizio del XXI secolo, Bologna, il Mulino.
Ginsborg, P. (1998), L’Italia del tempo presente: famiglia, società civile, Stato, 1980-1996,

85
Torino, Einaudi.
Golini, A. (1974), Distribuzione della popolazione, migrazioni interne e urbanizzazione in Italia, Roma, Istituto di demografia dell'Università di Roma La Sapienza.
Hammar, T. (ed.) (1985), European immigration policy, Cambridge, Cambridge University press.
Hammar, T. (1990), Democracy and nation state. Aliens, denizens and citizens in a world of international migration, Aldershot, Gower.
Harris, N. (2000), I nuovi intoccabili. Perché abbiamo bisogno degli immigrati, Milano, Il Saggiatore.
Isbister, J. (1996), The immigration debate. Remaking America, West Hartford, Kumarian Press.
ISTAT (1991), Gli immigrati presenti in Italia. Una stima per l’anno 1989, in «Note e Relazioni», 1.
ISTAT (1993), La presenza straniera in Italia. Una prima analisi dei dati censuari, Roma, ISTAT.
ISTAT (2003), Classificazione delle attività economiche. Ateco 2002, in «Metodi e norme», 18.
ISTAT (2005), Gli stranieri in Italia: analisi dei dati censuari, Roma, ISTAT.
ISTAT (2007a), La popolazione straniera regolarmente presente in Italia, 1° gennaio 2006, Nota informativa, 11 aprile, on the web 15 March 2007.
ISTAT (2007b), “La popolazione straniera residente in Italia al 1° gennaio 2007”, Statistiche in breve, 2 ottobre 2007, on the web 15 March 2007.
ISTAT (2007c), La seconda indagine censuaria sugli interventi e i servizi sociali dei Comuni. Anno 2004. ISTAT, Roma.
Macioti, M. I. and E. Pugliese (2003), L’esperienza migratoria. Immigrati e rifugiati in Italia, Bari, Laterza.
Marshall, T. H. (1976), Cittadinanza e classe sociale, Torino, UTET.
Ministero della Pubblica istruzione (2005), Indagine sugli esiti degli alunni con cittadinanza non italiana, anno scolastico 2003-2004, on the web September 2006.
Ministero della Pubblica istruzione (2006), Alunni con cittadinanza non italiana. Scuole statali e non statali. Anticipazione dei principali risultati. Anno scolastico 2005-2006, on the web September 2006.
Ministero dell’Interno (2007a), 1° Rapporto sugli immigrati in Italia, Roma, Ministero dell’Interno.
Ministero dell’Interno (2007b), Concessione della cittadinanza italiana. Nel 2006 più di

86
35.000 stranieri hanno ottenuto lo ‘status civitatis’, in www1.interno.it.
Nascimbene, B. (2003), Nuove norme in materia di immigrazione. La legge Bossi-Fini: perplessità e critiche, in «Corriere Giuridico», 4.
Natale, M. (1986), Fonti e metodi di rilevazione della popolazione straniera in Italia. Contributi del dibattito in corso e nuovi elementi conoscitivi, in «Studi Emigrazione», 23, 82-83.
Natale, M. (1990), L'immigrazione straniera in Italia: consistenza, caratteristiche e prospettive, in «Polis», 4, 1.
Natale, M. and S. Strozza (1990), “I lavoratori extracomunitari in Italia: consistenza e principali caratteristiche”, in Moretti E. (ed.), I movimenti migratori in un quadro di riferimento internazionale, Volume primo, Ancona, Clua edizioni.
Natale, M. and S. Strozza (1997), Gli immigrati stranieri in Italia. Quanti sono, chi sono, come vivono?, Bari, Cacucci Editore.
Neri, F. (1988), Immigrazione e mercato italiano del lavoro: una contraddizione, in «Economia Italiana», 2, 153-165.
Pittau, F. and M. Reggio (1992), Il caso Albania: immigrazione a due tempi, in «Studi Emigrazione», 29, 106.
Pugliese, E. (1992), Sociologia della disoccupazione, Il Mulino, Bologna.
Pugliese, E. (2006), L’Italia tra migrazioni internazionali e migrazioni interne, Bologna, Il Mulino.
Pupo, R. (2001), L’esodo forzoso dall’Istria, in Bevilacqua et al. (eds.), Storia dell’emigrazione italiana. Partenze, Roma, Donzelli.
Reyneri, E. (1996), Sociologia del mercato del lavoro, Bologna, Il Mulino.
Reyneri, E. (2007), Immigration in Italy: trends and perspectives, Iom, Argo.
Rosoli, G. (ed.) (1978), Un secolo di emigrazione italiana: 1876-1976, Roma, Cser.
Rumbaut, R. G. (1997), Assimilation and its discontents: between rhetoric and reality, International Migration Review, n. 120.
Sabatino, D. (2004) Le politiche migratorie, in Lo stato sociale in Italia. Un decennio di riforme. Rapporto Irpps-Cnr 2003-2004, E. Pugliese (ed.), Roma, Donzelli.
Sassen, S. (1991), The global cities. New York, London, Tokyo, Princeton, Princeton University Press.
Sassen, S. (1999), Migranti coloni, rifugiati. Dalla migrazione di massa alla fortezza Europa, Milano, Feltrinelli.
Simon, G. (1986), La nouvelle donne migratoire en Europe du sud in “Revue Européenne des Migrations”.

87
Strozza, S. (2004), Estimates of illegal foreigners in Italy: a review of the literature, in «International Migration Rewiew», 38, 1.
Strozza, S. (2008), Partecipazione e ritardo scolastico dei ragazzi stranieri e d’origine straniera, in «Studi Emigrazione», 171, 699-722.
Strozza, S. and E. Zucchetti (eds.) (2006), Il Mezzogiorno dopo la grande regolarizzazione. Vecchi e nuovi volti della presenza migratoria. Volume secondo, Milano, Franco Angeli.
ter Wal, J. (1991), Il linguaggio del pregiudizio etnico, in «Politica ed Economia», 4.
ter Wal, J. (1995), The social representation of immigrants in Italian press discourse, relazione alla International Conference “Immigration, stereotypes and prejudice”, Rome, April 5-7.
Toulemon, L. (2004), Fertility among immigrant women: new data, a new approach, in «Population & Sociétés», 400.
Vassallo Paleologo, F. (2007), La frontiera Mediterraneo: migrazioni irregolari e diritti fondamentali dei migranti, Palermo.
Vitiello, M. (2006), L’accesso al sistema italiano di welfare e l’uso dei servizi sociali da parte dei cittadini immigrati in E. Pugliese (ed.), Nord e Sud. Rapporto Irpps – Cnr sullo stato sociale in Italia. 2005 – 2006, Roma, Donzelli Editore.
Zincone, G. (2001), Introduzione e sintesi. Utili, uguali, dissimili, in Secondo rapporto sull’integrazione degli immigrati in Italia, G. Zincone (ed.), Bologna, Il Mulino.
Zincone, G. and L. Di Gregorio (2002), Il processo delle politiche di immigrazione in Italia: uno schema interpretativo integrato, in «Stato e Mercato», 66.
Zucchetti, E. (ed.) (2004), La regolarizzazione degli stranieri. Nuovi attori nel mercato del lavoro italiano, Fondazione ISMU, Ministero del Lavoro e delle Politiche Sociali, Milano, Franco Angeli.

88
Annex 1 - Italian statistics on migration flows
The published data
The main source of statistical information on flow data is the municipal population registers (anagrafe). The idea behind the municipal population registers is to monitor the permanent resident population.
Three kinds of data are reported based on the municipal population registers: - migration of the resident population - the demographic balance of the registered resident population - the demographic balance of the foreign resident population
Whereas in the first case the unit of data collection is an individual’s change of residence, in the other two it is the municipality. In the first case, a very detailed form, which is used for all types of changes of residence (internal and international) and based on self-reporting or administrative acts, reports information regarding the person changing residence (country of origin or country of destination, date and place of birth, sex, marital status, citizenship, etc). In the other two cases only the absolute number for each sex of the residents (total and foreign) registered or deregistered for a foreign country are reported for each municipality. We prefer data recorded under the category ‘migration of the resident population’ since they are checked at the micro level through the ISTAT offices prior to publication. The downside is that they take about four years to be published, instead of less than one year in the case of the ‘demographic balance of the foreign resident population’.
The population register The resident population is the population with its usual residence in Italy, even if temporarily absent. People with their usual residence in Italy have to register with the population register (anagrafe). The natural movements consist of births and deaths. In the case of migration movements there are two forms to register with/to cancel from the register: changes of residence from/to other Italian municipalities and changes of residence from/to abroad. In addition, there is also the category of ‘changes of residence for other reasons’. This includes all forms of rectification of the population register linked to census operations and to actual verifications of residence status. The only category of interest for our purposes is the migratory movements to or from abroad.
Registration There is an obligation for people to register with the municipality in which they usually reside (centre of family and social relations). All citizens - Italians, EU citizens or other foreign citizens are obliged to notify the local municipal offices of their current address. People who only intend to stay for a limited time for study, tourism, etc. are exempted from this obligation and the official in charge of the population register cannot accept a registration-application. The registration process starts with a declaration to be deposited during the first 20 days after taking up permanent residency. For the declaration, a form (ISTAT APR4) is filled in. The declaration must also state if other household members are changing residence, if the person moves into an existing (already registered) household. The date of this declaration determines

89
its legal validity and is the starting point of the administrative procedure. The administrative procedure is conducted by the official responsible for the population register and includes a verification of the facts. The address given must correspond to a dwelling with minimum living conditions (e.g., light, gas, water supplies) and the person must actually live there. In theory this verification should not take any longer than 20 days. After a positive outcome of the verification, usually conducted by the municipal police, the registration is approved. The date of approval determines the date considered for statistical purposes. The official responsible for the population register has 5 days to update the register. In the case of Italian citizens the persons involved in the change of residence have to be removed from the register of Italians living abroad (AIRE), which is maintained by the Italian municipality of last residence, or from the population register of another Italian municipality. Obviously Italian return migration can be registered only if the residence was transferred abroad in the first place. If the registration is not accepted, the person concerned can apply again or appeal the decision with a representative of the Ministry of the Interior (the Prefetto) within 30 days. Documents required from Italian citizens: Valid passport or identity card Documents required from EU citizens (there might be some special provisions regarding the new accession countries), who are put on par with Italian citizens: Valid passport or identity card. Documents needed by third country citizens: Valid passport, valid permit to stay for each member of the household, including minors (if issued for the first time it must be valid for at least 3 months21, however, in the past the rules governing the population registers referred in several cases to a period of 12 months as a rule of thumb to define ‘usual residence’. For example, Italian citizens emigrating for less than one year would stay on the population register and would not be transferred to the register of Italians residing abroad or AIRE), original documents regarding the marital status of the applicants and the tax code. The permit to stay has to be applied for during the first 8 working days after arrival from the Chief Constable (Questore) of the province. And the permit to stay should be given within 20 days following the application. The application to extend the permit to stay has to be made 90, 60 or 30 days before the final date of its validity, according to the reason and the duration of the permit. The permit cannot be extended if the foreigner has left Italy for a continuous period of more than 6 months (or a shorter period if the validity of the permit is less than 2 years). The length of validity of the permit is linked to the reason for the permit. If the conditions are fulfilled a foreigner can request residence status. The (extended) permit to stay should be presented to the official in charge of the population register. In theory, the official has the obligation to verify continuously that foreign citizens have a valid permit to stay. Should the permit be more than one year out of date, the official has the obligation to initiate the cancellation procedure. The essential juridical texts are collected in the Comprehensive Immigration Act (Testo Unico sull’immigrazione) DL 286/98 including Law 40/98 and DPR 394/99. 21 “The dwelling-place of a foreign citizen is considered to be established also as regards cases of documented stay for more than three months in an immigration reception centre. If the registrar checks the existence of the established dwelling-place, the duration of the stay permit or similar document, given that this must be valid at registration, cannot prevent registration”. (http://www.comune.firenze.it/servizi_pubblici/stranieri/english.pdf).

90
“It is important to remember that, according to the law ‘art. 7, par. 3, of DPR 30.05.1989, n.223’, as replaced by law ‘art. 14, par. 2, of DPR 31.08.1999, n.394’, foreign citizens registered in the population register must renew the declaration of residency before the registrar within 60 days of the renewal of the permit to stay, thus handing over a copy of the permit itself to the municipal office. For all the foreign citizens equipped with a residence card (carta di soggiorno), the renewal of the declaration of residency is made within 60 days of the renewal of the residence card.” It should also be remembered “that, according to the law ‘art. 11, del DPR 30.05.1989, n.223’, as replaced by the law ‘art.14, par. 3, of DPR 31.08.1999, n.394’, the names of foreign citizens can be removed from the records of the resident population only if their unavailability is verified, (or because the declaration of residency has not been renewed) after one year has passed from the expiration of the permit to stay or the residence card.” (http://www.comune.piacenza.it/immigrazione/guidapiufacile/demografici200508.pdf)
Cancellation: When the usual residence is transferred abroad or to another Italian municipality the persons concerned (both parents in the case of minors) have to make a declaration and the same form as for the registration (ISTAT APR4) is used. Whereas the registration in a register of another Italian municipality should automatically lead to the cancellation in the register of the municipality of origin, a move abroad must be notified. Without notification there will be no legal or statistical trace. As mentioned previously, a register entry can also be cancelled from the population register if they are untraceable following a general census or cannot be traced following repeated attempts. They can also be cancelled from the lists for failure to renew the declaration regarding habitual address within a year of the expiry of the permit to stay. The foreigner is notified and invited to rectify the situation within 30 days. (http://www.comune.firenze.it/servizi_pubblici/stranieri/english.pdf) This cancellation is reported as ‘other cancellations’ in the aggregate statistics. Further remarks
Attention has to be paid regarding the change of definition by some countries of citizenship over time (for example, the Soviet Union and successor countries or the Balkan states).
Sources Compiled using the instructions manuals for the officials responsible for municipal population registers Gabellini Franco, Francioni Alessandro, Cecchini Catia, 2002, Manuale teorico-pratico dell’Ufficiale d’anagrafe. Maggioli Editore; Parducci Mauro, 2004, Manuale per l’operatore dell’ufficio anagrafe. Halley informatica; and material from the municipalities of Florence and Piacenza: (http://www.comune.firenze.it/servizi_pubblici/stranieri/english.pdf) (http://www.comune.piacenza.it/immigrazione/guidapiufacile/demografici200508.pdf)

91
Annex 2 – Completeness of the 2001 14th General Population and Housing Census
The results of the survey regarding the cover of the 2001 14th General Population and Housing Census are published in Fortini et al. [2007]. The results of this survey indicate that, for the Italian population at the national level, the coverage was about 98.6 per cent, with a maximum of 99.4 per cent in the North-East and a minimum of 97.47 per cent in the Centre sub-division. The coverage decreased with the average size of the municipality from 99.3 per cent in municipalities with up to 10,000 inhabitants to 95.9 per cent in metropolitan municipalities22. The critical results for the Centre sub-division are probably because Rome falls in this sub-division. The coverage of the foreign population in the 2001 census was significantly lower than the percentage values cited above for the Italian population: the average national value of coverage of the foreign population is 89.7 per cent, highest in the North-East, followed by the South. The North-West with 88.8 per cent and the Centre with 81.2 per cent had significantly lower coverage. The differences for the municipal size-classes were even more marked. Whereas the coverage of the foreign population in non-metropolitan municipalities was about 94 per cent, in metropolitan municipalities it reached only 73.9 per cent. The quality control in the elaboration process focuses on the correction and completion of census records – at the household and at the individual level. Apart from rules defined for these levels, a special procedure regarding the citizenship of residents in households established 43 typologies of possible errors or incompatibilities. For example, many individuals declared they were Italian since birth and had foreign citizenship. Although, these cases can be attributed to Italian citizens who forgot to respond to an ‘obvious’ question, in about 70,000 cases, foreign citizens did not declare the year and the reason for their transfer to Italy. The ISTAT document [Fortini et al. 2007] states that the procedure to correct information linked to citizenship, in the case of the household population and in the case of the institutionalised population, was especially onerous, with a long and intensive employment of resources to analyse consistency, to control and to correct interactively. The majority of corrections were made at the individual level, but incongruities also occurred in regard to the composition of households: in about 19,000 cases two parents with foreign citizenship declared Italian as the citizenship of their child, and in 6,000 cases couples with one foreign partner, declared that their child had foreign citizenship. Neither case corresponds to Italian law. The frequency of the correct values of specific variables could serve as an indicator of the quality of the data: citizenship 93.3 per cent, acquisition of Italian citizenship 97.1 per cent, and country of former citizenship, year and reason for transfer to Italy above 99.5 per cent [Fortini et al. 2007]. A last point reported the comparison of the 2001 census results and population register data. This allows for a direct comparison of the two sources of migration data, without indicating which of the two is better, or more comprehensive. The results indicate that probably the population registers of Northern Italy are better kept. The difference between the total population counted during the population census and that recorded in the population registers amounts to more than 1.5 million. At the national level, this difference is –2.6 per cent, ranging at the sub-divisional level from –0.9 per cent in the North-East to –4.2 in the Centre.
22 These metropolitan municipalities include those of, Bari, Bologna, Brescia, Cagliari, Catania, Florence, Foggia, Genoa, Livorno, Messina, Milan, Modena, Naples, Padua, Palermo, Parma, Prato, Reggio di Calabria, Rome, Taranto, Turin, Trieste, Venice, and Verona.

92
The difference increases with the size class from just around -1 per cent in small municipalities to –7 per cent in the case of cities with more than 500,000 inhabitants. A further comparison was made between the census results and the population obtained through calculation – population at the beginning of the year adding and subtracting the natural and migratory population change, respectively. The differences between the census population and this population are less pronounced.
Source Population
21 October 2001 (thousands)
Difference from the census population
(percentages) Census population 56,995.7 0.0 Calculated population 57,957.7 -1.7 Population register 58,515.1 -2.7


![THE EMIGRATION ACT, 1983epcom.org/Emigration-Act-1983.pdf · 1 THE EMIGRATION ACT, 1983 [31 of 1983, dt. 10-9-1983 ] An Act to consolidate and amend the law relating to emigration](https://static.fdocuments.in/doc/165x107/5e4809dfa0b97a0b973726e3/the-emigration-act-1-the-emigration-act-1983-31-of-1983-dt-10-9-1983-an-act.jpg)