It starts with the creation of coordinated, consistent ... · It starts with the creation of...
26
1
Transcript of It starts with the creation of coordinated, consistent ... · It starts with the creation of...

1

2

33
It starts with the creation of coordinated, consistent design information. Not
just points, surfaces, alignments, and profiles, but a rich set of information
and metadata associated with them.
The next step is to optimize your designs through better decision making,
leveraging the model to conduct visualization, simulation, and analysis, then
using the results to improve the design. This is the heart of the BIM process,
which we will focus on today.
The third phase is using the model to create the design deliverables, which
consist not only of construction drawings, but the model itself and all of the
rich information it contains.

How many of you here are familiar with the concept of Sustainable Design?
Definitions of Sustainability abound; one that will serve for our purposes is
“Meeting the needs of the present while improving the ability of future
generations to meet their own needs.”
You have been doing environmental studies, impact statements, mitigation,
critter crossings for decades, but there is growing impetus around Green or
Sustainable design that will make this aspect of design development more
and more important.
The building industry is well ahead of us in this area, and it has become
increasingly common for building designs to be scored on industry-defined
sustainability criteria. Around the world, much effort is going into defining
standards and criteria for sustainable transportation development. I have no
doubt that within a few years, sustainability scoring will be a standard
practice for transportation infrastructure projects.
And this means that civil engineers will have a greater need to better
understand the environmental impact of projects before they are built, and
the ability to perform many types of detailed sustainability analysis.
4

This is an example of just one of the LEED credits that are available for the
Civil Engineer to “capture”.
There are potentially more LEED credits available for the Civil Engineer
than the Architect, even though LEED began in the Architectural arena.
5

6

7
Here is an example of an Isopluvial map for the State of Washington,
representing 24 hour precipitation for the “100 year storm”.
Isopluvial: (¦ī·sō′plü·vē·əl) (meteorology) A line on a map drawn through
geographical points having the same pluvial index.
This is really just a contour map of rainfall.

8
IDF stands for Intensity-Duration-Frequency. It represents intensities in
inches/hr for the first N (100 in this case) minutes for storms with various
return frequencies.
This one was created in the 1930’s and has been used for more than 70
years. The area this IDF curve represents has experienced more that 10
“100-year storms” in the past 5 years. For this reason, the ability to create
more current IDF curves is critical. Hydraflow performs this function very
well.

9
A snapshot of a typical map page from a traditional paper based County Soil
Survey. This data was collected starting in the 1930’s and has been
sporadically updated since.

10
In the past, the primary means of Hydrological Site Analysis was to interpret
a Topographic map along with a site visit to further investigate the location of
ponds and pools, water courseways, ridges, and valleys.
Flow path lengths for Tc, areas, and water courseways were then measured
with an engineer’s scale or planimeter

11
This slide shows several traditional Stormwater Runoff Analysis programs;
TR-55, TR-20, and “Bowstring” (a variant of the rational method).
Hydraflow accommodates all these methods, as well as SCS unit
Hydrographs.

12
You can convert the “Legacy” precipitation into its digital equivalent. This
slide describes a portion of the process.
The full process is:
1. Obtain image file or scan paper copy.
2. Using AutoCAD Raster Design, insert image into georeferenced drawing
(with a known coordinate system).
3. Rubber sheet the image to known reference points. This process will
result in each image pixel having an actual geographic coordinate.
4. Use the Contour Follower routine in Raster Design to “auto-trace” the
contours in the image, using the precipitation amount as the Z value
(instead of elevation).
5. Create Civil 3D surface from the Contours. Surface values are now
precipitation values and are interpolated between the Contour intervals.

13
This site provides various scanned NOAA Rainfall Frequency Atlases and
digital tables in the highlighted areas. The digital data is continually updated
from the NOAA network of weather stations and weather offices.
This data is particularly useful in creating localized, updated IDF curves

14
This site contains DEM’s, DLG’s, Aerial Photos, and Soils Data for nearly the
entire United States. The data is available at no cost for FTP download or a
minimal cost for CDROM or DVD. You must sign up either way under “S4:
Shipping Info”.
Under the Soils classification, the SSURGO selection incorporates both
Geospatial and Tabular (including Engineering Properties) Data. The
Geospatial Data is in ESRI Shape format and the Tabular Data is in a
Microsoft Access database.

Three new extensions are available to Civil 3D subscription customers for
storm water hydraulics and hydrology. These extensions add important
technology to AutoCAD Civil 3D, enabling you to address crucial parts of your
workflow and increase the value of your design information for predicting
project performance.
For purposes of comparison, we will compare the Hydraflow Extensions to the
equivalent Haestad Methods programs.
1. Hydraflow Storm Sewers Extension compares very well with the Haestad
StormCAD program.
2. Hydraflow Hydrographs Extension compares very well with the Haestad
PondPack program.
3. Hydraflow Express Extension exceeds, in many areas, the functionality of 2
Haestad programs: FlowMaster and CulvertMaster.
A recent price quotation for the equivalent Haestad programs to match the
functionality of the Hydraflow Extensions was $12,500.00.
“Autodesk sells the Hydraflow Extensions for $7,500.00 and includes a free
copy of Civil 3D with each purchase” is another way of looking at the fact
that Autodesk provided these tools at no additional cost to Civil 3D
customers.
15

Hydraflow Storm Sewers Extension for AutoCAD® Civil 3D® software is an
easy-to-use, full-featured storm sewer design and analysis package. Import
your pipe network directly from Civil 3D or graphically draw your system plan
onscreen or with the spreadsheet editor. Plug in your drainage areas and
compute flows using industry-standard methodologies. Then automatically
design pipes, inverts, slopes, and inlets based on user-defined design
parameters. Interactive features allow you to modify and optimize your storm
sewer designs in real time, assuring your designs will have the highest
hydraulic efficiency at the lowest possible cost. When you are finished,
compute cut-depth quantities and produce customizable reports that meet
agency submittal requirements.
16

Discusses capabilities in greater detail….
17

Hydraflow Hydrographs Extension for AutoCAD® Civil 3D® software is a
comprehensive solution for watershed analysis and detention pond design,
from simple sites to complex watersheds with interconnected ponds. Use
Hydraflow Hydrographs Extension for simple site designs, complex watershed
modeling and regional drainage studies, pre- and post- development studies,
detention pond design, and submitting agency-ready reports.
18

Discusses capabilities in greater detail….
19
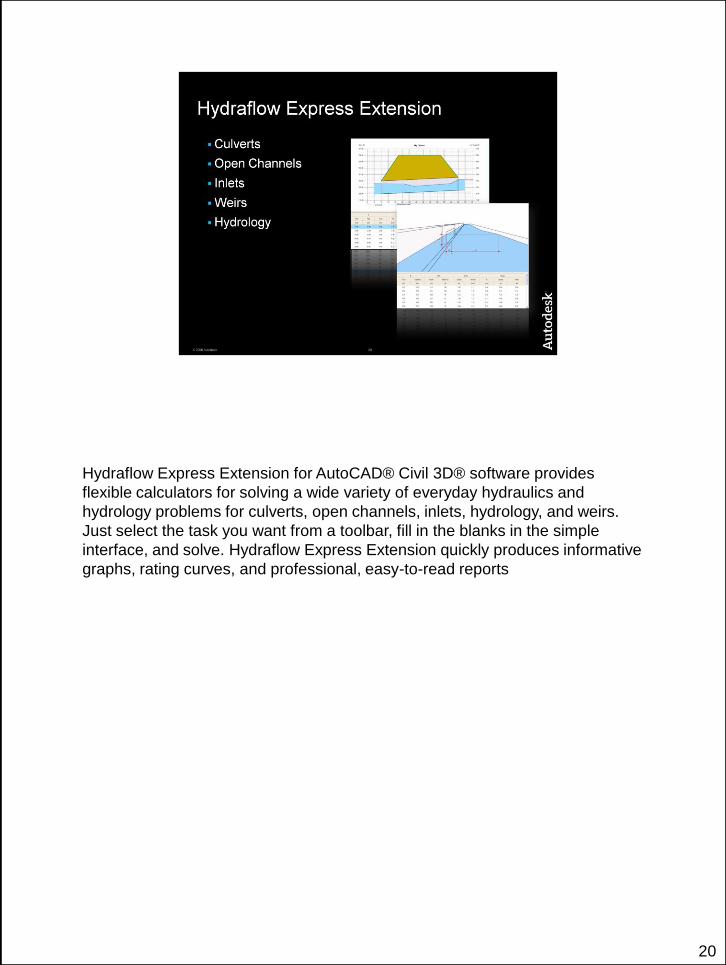
Hydraflow Express Extension for AutoCAD® Civil 3D® software provides
flexible calculators for solving a wide variety of everyday hydraulics and
hydrology problems for culverts, open channels, inlets, hydrology, and weirs.
Just select the task you want from a toolbar, fill in the blanks in the simple
interface, and solve. Hydraflow Express Extension quickly produces informative
graphs, rating curves, and professional, easy-to-read reports
20

Discusses capabilities in greater detail….
21

Autodesk recently acquired two new extensions; the HEC RAS Import/Export
Extension and the Stage Storage Extension.
22

Autodesk recently acquired two new extensions; the HEC RAS Import/Export
Extension and the Stage Storage Extension.
23

24

In addition to the links shown, a PDF file is available containing a variety of
links to free GIS data sources for the entire United States.
25

26
THANK YOU!