IT Skills Analysis
35
DATA MINING AND STATISTICAL ANALYSIS SOLUTIONS Skills demand analysis based on the data from online HR websites: Using web scraping and text mining applications: IT Sector Habet Madoyan Vahe Movsisyan Sunday, July 03, 2016 The analysis is funded by the research grant from American University of Armenia. Presented at: IX International School-Seminar. Town of Tsakhkadzor, Republic of Armenia
-
Upload
habet-madoyan -
Category
Data & Analytics
-
view
382 -
download
1
Transcript of IT Skills Analysis

DATA MINING AND STATISTICAL ANALYSIS SOLUTIONS
Skills demand analysis based on the data from online HR websites: Using web scraping and text
mining applications: IT Sector
Habet Madoyan
Vahe Movsisyan
Sunday, July 03, 2016
The analysis is funded by the research grant from American University of Armenia.
Presented at: IX International School-Seminar. Town of Tsakhkadzor, Republic of Armenia

Methodology: Overview
Datamotus LLC 2

Introduction
In recent years online job ads became a popular job-search model, that’s
why the research community is increasingly experimenting with the
detailed breakdown of online job ads to study labor market dynamics.
It is estimated that in USA 60-70 percent of job openings are now posted
on the Internet. However these job ads are biased toward industries and
occupations that seek high-skilled, “white-collar” workers.
Introduction
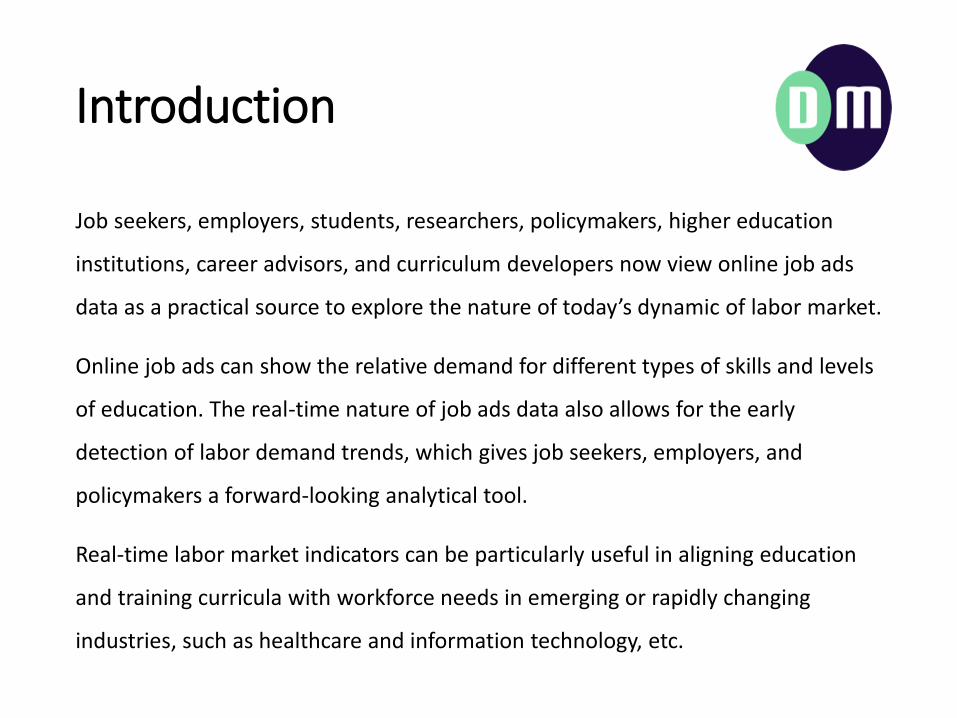
Job seekers, employers, students, researchers, policymakers, higher education
institutions, career advisors, and curriculum developers now view online job ads
data as a practical source to explore the nature of today’s dynamic of labor market.
Online job ads can show the relative demand for different types of skills and levels
of education. The real-time nature of job ads data also allows for the early
detection of labor demand trends, which gives job seekers, employers, and
policymakers a forward-looking analytical tool.
Real-time labor market indicators can be particularly useful in aligning education
and training curricula with workforce needs in emerging or rapidly changing
industries, such as healthcare and information technology, etc.

Job ads provide an incomplete picture of labor demand
Online job ads data strongly correlate with job openings data


Web ScrapingText Mining
Datamotus LLC 7

Synopsys of the study
• Develop an algorithm for web scrapping job announcement data (careercenter.am)
• Text mining and parsing algorithms to structure job announcements
• Algorithms to assess and track vacancy rates by:
• Industry
• Job role
• Specific skills

What was done• Around 20,000 posts are scrapped from the web,
• Posts come in rough, unstructured way. Algorithm is developed to structure them.

A variable for each “section”

Total vacancy rate (Careercenter) and Official LaborDemand (2004-2016 I Quarter)
Datamotus LLC 11
500
1000
1500
2000
2500
3000
100
150
200
250
300
350
400
450
500
550
600
20
04
Q1
20
04
Q2
20
04
Q3
20
04
Q4
20
05
Q1
20
05
Q2
20
05
Q3
20
05
Q4
20
06
Q1
20
06
Q2
20
06
Q3
20
06
Q4
20
07
Q1
20
07
Q2
20
07
Q3
20
07
Q4
20
08
Q1
20
08
Q2
20
08
Q3
20
08
Q4
20
09
Q1
20
09
Q2
20
09
Q3
20
09
Q4
20
10
Q1
20
10
Q2
20
10
Q3
20
10
Q4
20
11
Q1
20
11
Q2
20
11
Q3
20
11
Q4
20
12
Q1
20
12
Q2
20
12
Q3
20
12
Q4
20
13
Q1
20
13
Q2
20
13
Q3
20
13
Q4
20
14
Q1
20
14
Q2
20
14
Q3
20
14
Q4
20
15
Q1
20
15
Q2
20
15
Q3
20
15
Q4
20
16
Q1
Total jobs (Careercenter) Job Demand (NSS, right scale)
Correlation=0.76

Job Market OverviewIT sector
Datamotus LLC 12

ICT sector and overall economy
Datamotus LLC 13
3.00
3.20
3.40
3.60
3.80
4.00
4.20
4.40
1.60
1.70
1.80
1.90
2.00
2.10
2.20
2005 2006 2007 2008 2009 2010 2011 2012 2013 2014 2015
Average yearly wage in Transport and Communication sector/Average yearly wage in RA
Weight of Transport and Communication sector (including IT sector) in GDP (right scale, in %)

Total vacancy and IT sector vacancy rates (Careercenter,2004-2016)
Datamotus LLC 14
0
20
40
60
80
100
120
140
160
180
200
100
150
200
250
300
350
400
450
20
04
Q1
20
04
Q2
20
04
Q3
20
04
Q4
20
05
Q1
20
05
Q2
20
05
Q3
20
05
Q4
20
06
Q1
20
06
Q2
20
06
Q3
20
06
Q4
20
07
Q1
20
07
Q2
20
07
Q3
20
07
Q4
20
08
Q1
20
08
Q2
20
08
Q3
20
08
Q4
20
09
Q1
20
09
Q2
20
09
Q3
20
09
Q4
20
10
Q1
20
10
Q2
20
10
Q3
20
10
Q4
20
11
Q1
20
11
Q2
20
11
Q3
20
11
Q4
20
12
Q1
20
12
Q2
20
12
Q3
20
12
Q4
20
13
Q1
20
13
Q2
20
13
Q3
20
13
Q4
20
14
Q1
20
14
Q2
20
14
Q3
20
14
Q4
20
15
Q1
20
15
Q2
20
15
Q3
20
15
Q4
20
16
Q1
Non IT Jobs (Careercenter) IT Jobs (Careercenter, right scale)
Correlation=0.81

Hard Skills in IT Sector
Datamotus LLC 15

Time series: Annual demand for top 5 programming languages
Datamotus LLC 16
0
50
100
150
200
250
2004 2005 2006 2007 2008 2009 2010 2011 2012 2013 2014 2015
C++ Javascript Java C# PHP

Time series: Annual demand for top 5 programming languages (parabolic trend)
Datamotus LLC 17
-30
20
70
120
170
220
2004 2005 2006 2007 2008 2009 2010 2011 2012 2013 2014 2015
Poly. (C++) Poly. (Javascript) Poly. (Java) Poly. (C#) Poly. (PHP)

Analyzing demand for programming languages using association rules
Datamotus LLC 18

Arules
• Association rules mining is used to analyse the co-occurrence of programming languages in a job post
• R package “”arules” and “arulesViz” are used for the analysis
• Analysis is done for IT jobs only

Association rules: Measures of rules interestingness
Datamotus LLC 20
Measure 1
Support = 𝑃 𝐴 ∩ 𝐵
Measure 2
Confidence = 𝑃 𝐵|𝐴 = 𝑃(𝐵 ∩ 𝐴)/𝑃(𝐴)
Measure 3
Lift = 𝑃 𝐵|𝐴
𝑃 𝐵=
𝑃(𝐴∩𝐵)
𝑃(𝐴)∗
1
𝑃(𝐵)
Suppose we have the rule : IF {A} = > {B}
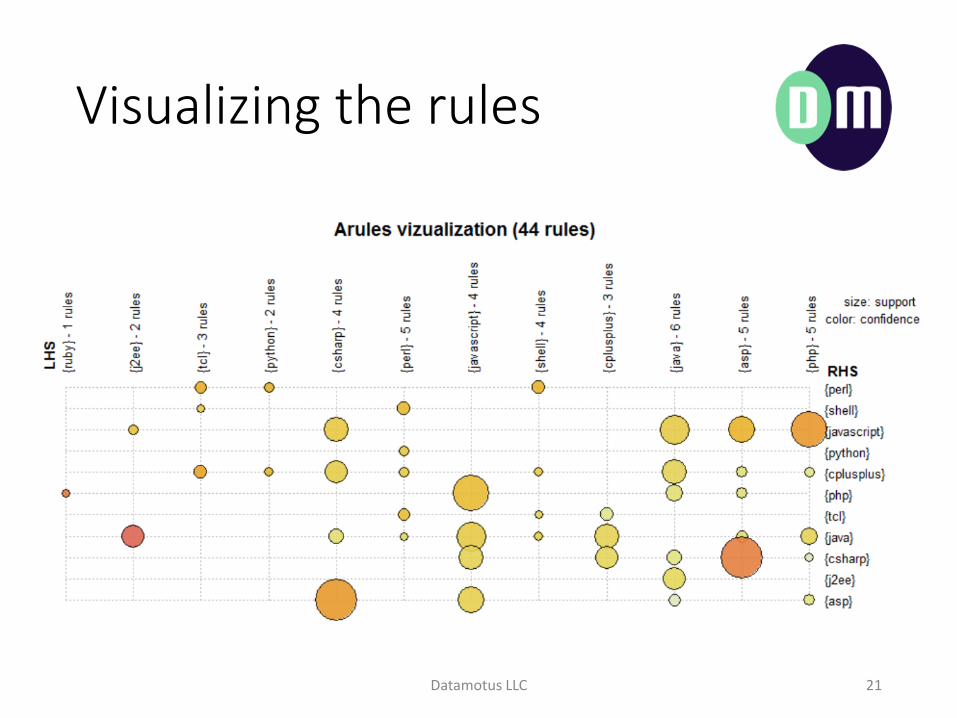
Visualizing the rules
Datamotus LLC 21

Association Mining for Programming languages: C++
Datamotus LLC 22
• Set of association rules is generated for top20 programming languages.• Rules are subsetted with min support of 0.01 and min confidence of 0.1
Two items on the left
One item on the left

Association Mining for Programming languages: Java
Datamotus LLC 23

Rules visualization: Java (all rules)
Datamotus LLC 24

Rules Visualization: Javascript
Datamotus LLC 25

Job Title Analysis
Datamotus LLC 26

IT Job Titles Frequency
Datamotus LLC 27
Most popular Job Titles (2004Q1-2016Q1) Percentage
software developer/engineer 18.29%
quality assurance engineer 5.42%
java software developer 4.98%
system administrator 4.00%
web developer 3.66%
.net developer 2.94%
php developer 2.33%
graphic designer 1.89%
ios developer 1.31%
android developer 1.26%
deep submicron 0.98%
database developer 0.96%
support specialist 0.96%
database administrator 0.92%
technical support 0.89%
technical writer 0.83%
support engineer 0.80%
application developer 0.72%
design engineer 0.72%
r&d engineer 0.68%
team leader 0.67%
frontend developer 0.55%
monitoring evaluation 0.52%
information security 0.50%
senior r&d 0.50%
57.29%

Software developer/engineer
Datamotus LLC 28
0
20
40
60
80
100
120
140
2004 2005 2006 2007 2008 2009 2010 2011 2012 2013 2014 2015

Quality assurance engineer
Datamotus LLC 29
0
5
10
15
20
25
30
35
40
45
2004 2005 2006 2007 2008 2009 2010 2011 2012 2013 2014 2015
quality.assurance.engineer
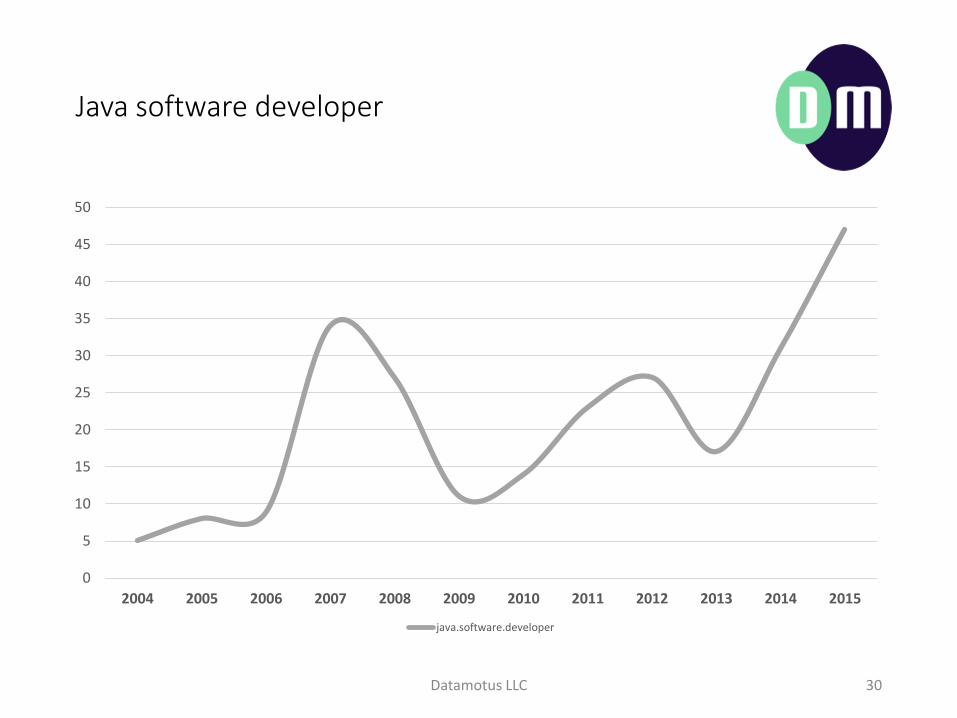
Java software developer
Datamotus LLC 30
0
5
10
15
20
25
30
35
40
45
50
2004 2005 2006 2007 2008 2009 2010 2011 2012 2013 2014 2015
java.software.developer

System administrator
Datamotus LLC 31
0
5
10
15
20
25
30
35
2004 2005 2006 2007 2008 2009 2010 2011 2012 2013 2014 2015
system.administrator

Web developer
Datamotus LLC 32
0
5
10
15
20
25
30
35
40
2004 2005 2006 2007 2008 2009 2010 2011 2012 2013 2014 2015
web.developer

IT Job Titles vs Programming languages
Job Titile => Programming language confidence Job Titile => Programming language confidence{software developer/engineer} => {csharp} 0.33 {java software developer} => {java} 0.98
{software developer/engineer} => {java} 0.30 {java software developer} => {javascript} 0.47
{software developer/engineer} => {javascript} 0.20 {java software developer} => {j} 0.39
{software developer/engineer} => {asp} 0.20 {java software developer} => {shell} 0.11
{software developer/engineer} => {php} 0.12 {java software developer} => {ruby} 0.05
{software developer/engineer} => {j} 0.12 {system administrator} => {perl} 0.09
{software developer/engineer} => {tcl} 0.09 {system administrator} => {shell} 0.09
{software developer/engineer} => {python} 0.07 {system administrator} => {bash} 0.03
{software developer/engineer} => {cplusplus} 0.06 {system administrator} => {pl.sql} 0.02
{software developer/engineer} => {ruby} 0.03 {web developer} => {javascript} 0.76
{software developer/engineer} => {visual.basic} 0.02 {web developer} => {php} 0.57
{software developer/engineer} => {verilog} 0.02 {web developer} => {asp} 0.36
{quality assurance engineer} => {java} 0.27 {web developer} => {csharp} 0.27
{quality assurance engineer} => {shell} 0.25 {web developer} => {ruby} 0.02
{quality assurance engineer} => {perl} 0.22 {.net developer} => {asp} 0.82
{quality assurance engineer} => {python} 0.14 {.net developer} => {csharp} 0.80
{quality assurance engineer} => {tcl} 0.12 {.net developer} => {javascript} 0.42
{quality assurance engineer} => {bash} 0.04 {.net developer} => {visual.basic} 0.03
{quality assurance engineer} => {verilog} 0.04 {php developer} => {php} 1.00
{php developer} => {javascript} 0.71
{php developer} => {ruby} 0.08
{php developer} => {python} 0.07
Datamotus LLC 33

Next Steps:
• Develop machine learning algorithm to classify job ads by sectors,
• Develop state of art text mining and topic modeling algorithms to predict demand for skills, professions and job roles,
• Create interactive web dashboard (using R shiny) to help:
• Potential job seekers
• Potential employees
• Policy makers
• Universities
Datamotus LLC 34

Thank You For Your Attention!
Datamotus LLC 35