
It is only the beginning: Putting microarrays into context Matthias E. Futschik Institute for...
21
It is only the beginning: Putting microarrays into context Matthias E. Futschik Institute for Theoretical Biology Humboldt-University, Berlin, Germany Hvar sommer school, 2004
-
Upload
clifford-webb -
Category
Documents
-
view
214 -
download
0
Transcript of It is only the beginning: Putting microarrays into context Matthias E. Futschik Institute for...

It is only the beginning:
Putting microarrays into context
Matthias E. FutschikInstitute for Theoretical BiologyHumboldt-University, Berlin, Germany
Hvar sommer school, 2004

The Whole Picture
??
MetabolitesMetabolitesProtein FunctionsProtein Functions
Protein StructuresProtein Structures
Medical expertMedical expert knowledgeknowledge
MicroarraysMicroarraysDNA DNA
Chromosomal LocationChromosomal Location

Networks of GenesGene expression is regulated
by complex genetic networks
with a variety of interactions on
different levels (DNA, RNA, protein),
on many different
time scales (seconds to years)
and at various locations
(nucleus, cytoplasma, tissue).
Models:
Boolean networks
Bayesian networks
Differential equations

Onthologíes: Categorising and labeling objects
Onthology: restricted vocabulary with structuríng rules describing relationship between terms
Representation as graph:•Terms as nodes•Edges as rules•Transitivity rule•Parent and child nodes
Bard and Rhee,Nature Gen. Rev., 2004

Gene Onthology
Consists of three independent onthologies:• molecular function e.g. enzyme• biological process e.g. signal transduction• cellular component
Gene sets / clusters can easily be analysed based on gene onthology terms
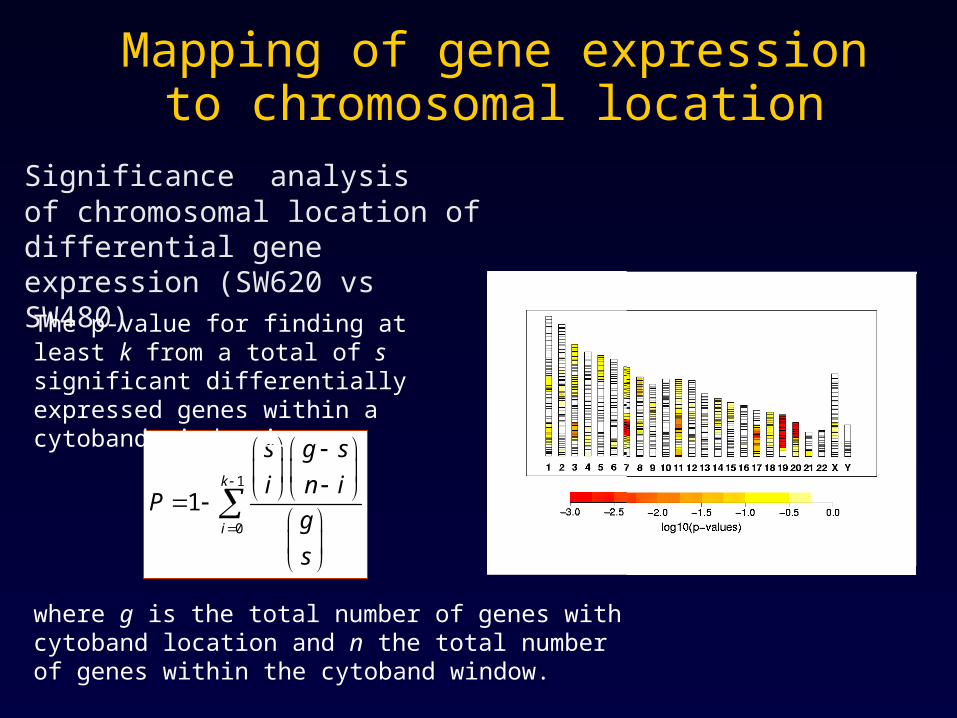
Mapping of gene expression to chromosomal location
Significance analysisof chromosomal location of differential gene expression (SW620 vs SW480)
1
0
1
k
i
s g s
i n iP
g
s
The p-value for finding at least k from a total of s significant differentially expressed genes within a cytoband window is
where g is the total number of genes with cytoband location and n the total number of genes within the cytoband window.

Relating number of gene copies and geneexpression I
Pollack et al., PNAS, 2001• Study of chromosomal abnormalities in breast cancer• usage of genomic DNA and cDNA arrays• hotspots of increased number of gene copies

Relating number of gene copies and gene expression II
Correlation of gene copy number and transcriptional levéls detected
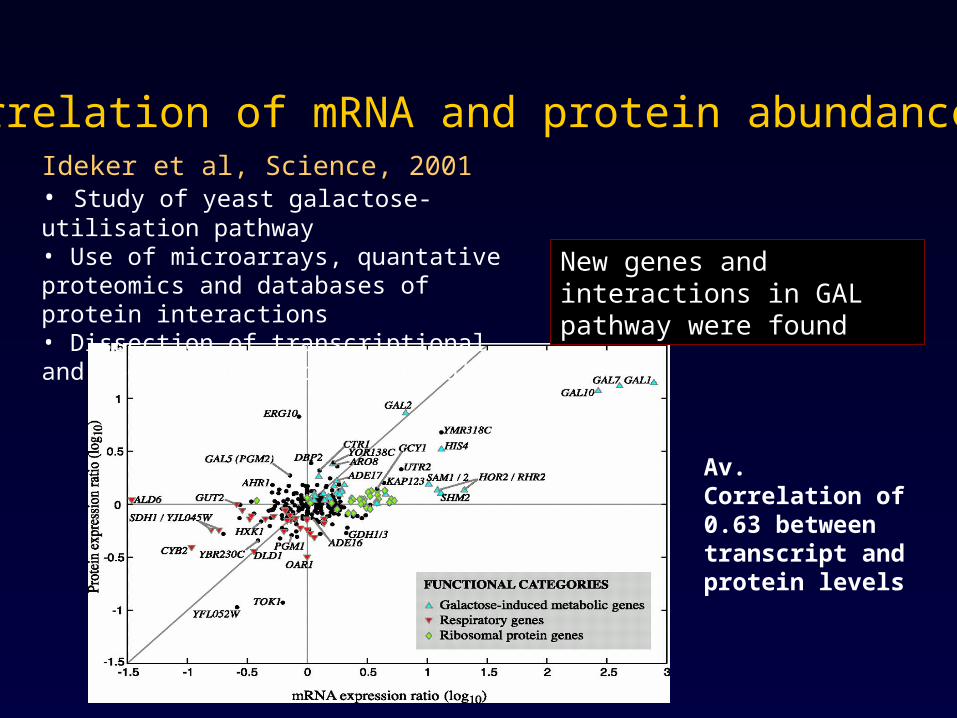
Correlation of mRNA and protein abundanceIdeker et al, Science, 2001• Study of yeast galactose-utilisation pathway• Use of microarrays, quantative proteomics and databases of protein interactions• Dissection of transcriptional and post-translational control
New genes and interactions in GAL pathway were found
Av. Correlation of 0.63 between transcript and protein levels

Genome, Transcriptome and Translatome
Greenbaum et al, Genome Research, 2001• Interrelating geneome, transcriptome and translatome• Similar compostion based on functional categories of translatome and transcriptome • Differing composition of genome

Linking expression to drug effectiveness
Relevance networks:Butte et al, PNAS, 2000• Correlation between growth
inhibition by drugs and gene expression for NCI60 cell lines
• Gene expression based on Affymetrix chips (7245 genes)
• 5000 anticancer agents• Significance testing based
on randomisation• Significant link between
LCP1 and NSC 624044

Combinining gene expression data with clinical parameters
Diffuse large B-cell Lymphoma (DLBCL)
•Most common lymphoid malignancy in adults
•Treatment by multi-agent chemotherapy
•In case of a relapse: bone marrow transplantation
•Clinical course of DLBCL is widely variable: Only 40% of treatments successful
=> Accurate outcome prediction is crucial for stratifying patients for intensified therapy

Case study: DLBCL
Current prognostic model: International Prediction Index (IPI)Alternative: Microarray-based prediction of treatment outcome
DLBCL study by Shipp et al. (Nature Medicine, 2002, 8(1):68-74)
•expression profiles of 58 patients using Hu6800 Affymetrix chips (corresponding to ca. 6800 genes)
•Prediction accuracy of outcome using leave-one-out procedure: Knn: 70.7%; WV: 75.9%; SVM:77.6%

Sammon's Mapping of top 22 genes ranked by signal-to-noise: Large overlap between classes with ‘cured’ and ‘fatal’ outcome.
Low correlation of gene expression with classes: Only 3 genes with correlation coef > 0.4
<=> Leukemia study by Golub et al : 263 genes
<=> Colon cancer study by Alon et al.: 215 genes
Limitation of microarray approach: Only mRNA abundance is measured.However, many different factors (patient and tumour related) determine outcome of therapy: Integration might be necessary!
DLBCL outcome prediction is challenging!

Prognostic models for DLBCL
Clinical predictor:• IPI based on five risk factors (age, tumour stage, patient’s
performance, number of extranodal sites, LDH concentration)
• Survival rate determined in clinical study:
Low risk: 73%, low-intermediate: 51%, intermediate-high: 42%, high: 26%
• Conversion of IPI into Bayesian classifier using survival rates as conditional probabilities P:
e.g. Sample belongs to class ‘cured’ if P(‘cured’|IPI)> P(‘fatal’|IPI)
=> Overall accuracy of 73.2%.

Prognostic models for DLBCL
Microarray-based predictor:
•Identifies clusters by unsupervised learning
•Supervised classification
•EfuNN as five layered neural network
•Based on 17 genes using signal-to-noise criterion
•Accuracy using leave-one-out: 78.5%

Independence of predictors
C1
C28
3311
C1 C2
U
Microarray-based predictor
IPI-based predictor
Set theory:
For 19 of 56 samples complementary (8 samples only correctly classified by IPI-based predictor, 11 only by microarray-based predictor)
Setting upper threshold to 92.6% (52 out of 56 samples)
Mutual Information x,y = (0,1) : microarray-based, IPI-based predictions of class (cured -fatal)
P,Q : probability of microarray-, IPI-based predictions
R(x,y): joint probability of predictions by microarray- and IPI-based predictors
I = Σ x,y R(x,y) log2(R(x,y)/[P(x)Q(y)]) ~ 0.05
=> Microarray-based and IPI-based predictor statistically independent!

Hierarchical modular decision system
IPI
EFuNNBayesianClassifier
Class A Class B
Combined Prediction
1-
1
21
2
Class A/Class B
Decision layer
Class unit layer
Predictor modulelayer
1-
Three layered hierarchical modelPredictor module layer consisting of independently trained predictorsClass unit layer integrating prediction by single predictorsDecision layer producing final prediction
Model parameters: α, β1,β2
Training: error backpropagation with parallel trainingof neural network
Integration of predictions in class units: weighted sum
Validation: leave-one-out

Improved prediction by integration
Significantly improved accuracy of modular hierarchical system (parameter values:α=0.4, β1= 0.8, β2= 0.75)
73.2%IPI
78.5%EFuNN
87.5%Hierarchical model
AccuracyModel
Constructive and destructiveinterference:Both microarray-based and clinical predictor are necessary for improvement

Identification of areas of expertise
IPI Microarrayß = ß = 1 ß 2
=> Data stratification can be used to detect areas of expertise e.g. IPI risk group low, low-intermediate, intermediate- high for microarray-based classifier=> Identification by data stratification can indicate limits of models e.g. IPI risk group high for microarray-based classifier
Stratification of data set by IPI category
M.E. Futschik et al., Prediction of clinical behaviour and treatment for cancers, OMJ Applied Bioinformatics, 2003

The way out of the microarray cave
Hvala i dovidjenja!