Reliability Must-Run Analysis 2006 – 2015 4 th BTA Presentation
Upload
maurice-warrenCategory
view
214download
0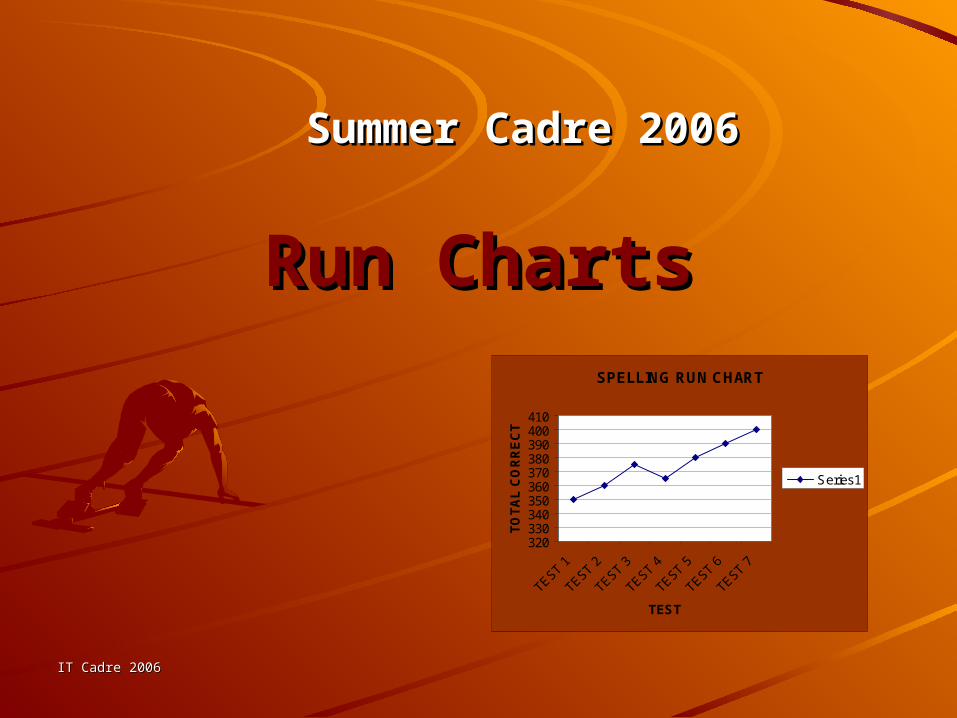
IT Cadre 2006IT Cadre 2006
Run ChartsRun Charts
Summer Cadre 2006Summer Cadre 2006
SPELLING RUN CHART
320330340350360370380390400410
TEST 1
TEST 2
TEST 3
TEST 4
TEST 5
TEST 6
TEST 7
TEST
TO
TA
L C
OR
RE
CT
Series1
IT Cadre 2006IT Cadre 2006
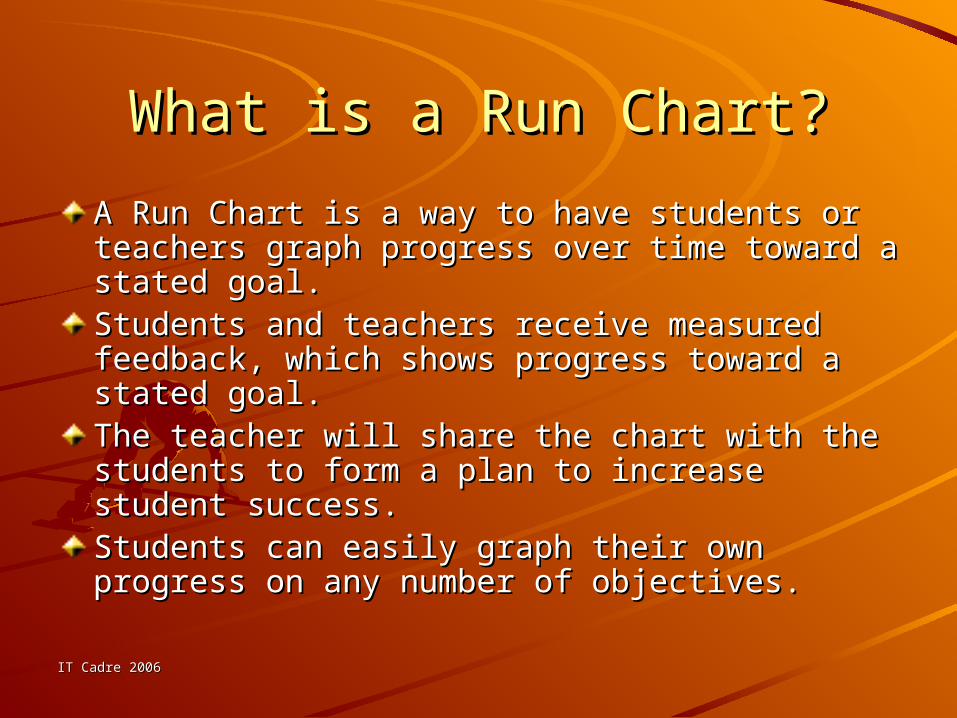
What is a Run Chart?What is a Run Chart?
A Run Chart is a way to have students or teachers A Run Chart is a way to have students or teachers graph progress over time toward a stated goal.graph progress over time toward a stated goal.Students and teachers receive measured Students and teachers receive measured feedback, which shows progress toward a stated feedback, which shows progress toward a stated goal. goal. The teacher will share the chart with the students The teacher will share the chart with the students to form a plan to increase student success.to form a plan to increase student success.Students can easily graph their own progress on Students can easily graph their own progress on any number of objectives.any number of objectives.
IT Cadre 2006IT Cadre 2006
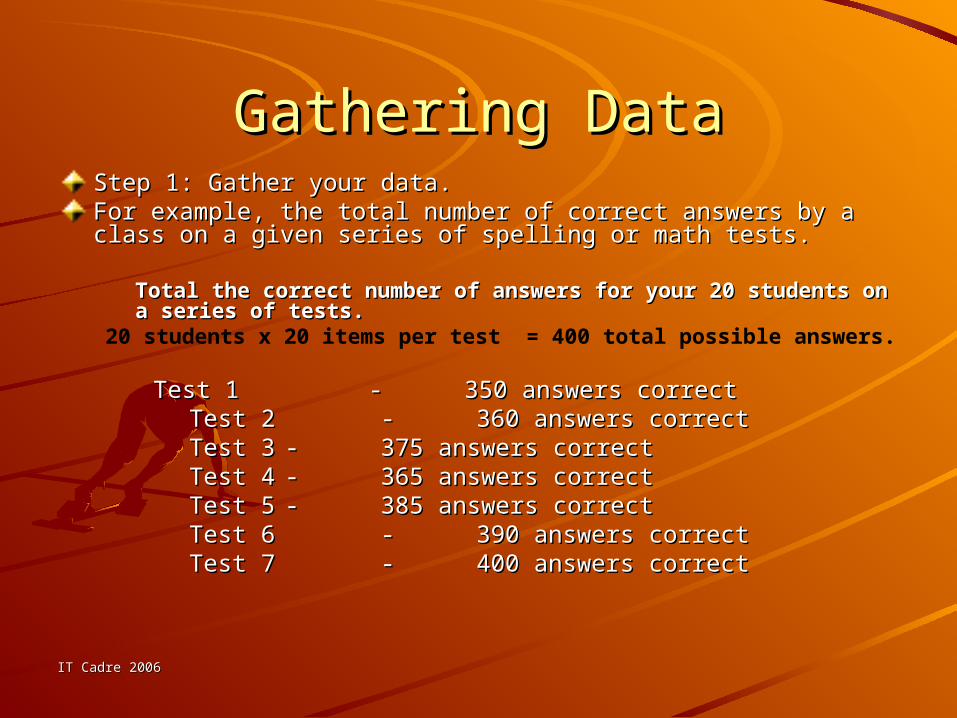
Gathering DataGathering DataStep 1: Gather your data. Step 1: Gather your data. For example, the total number of correct answers by a class on a For example, the total number of correct answers by a class on a given series of spelling or math tests. given series of spelling or math tests.
Total the correct number of answers for your 20 students on a Total the correct number of answers for your 20 students on a series of tests. series of tests.
20 students x 20 items per test = 400 total possible answers.
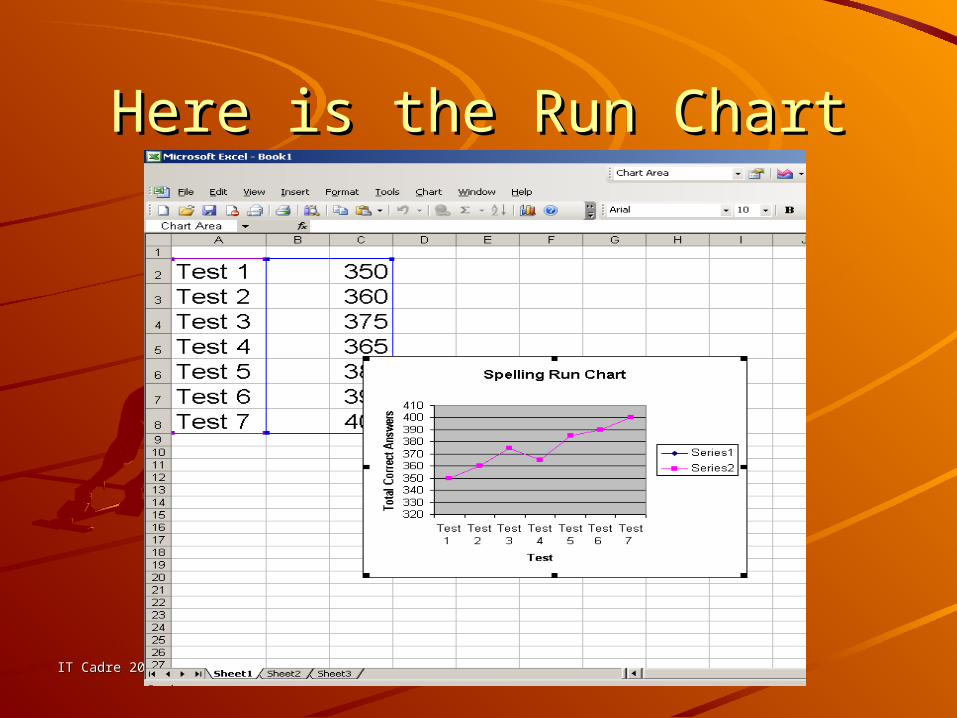
Test 1 Test 1 -- 350 answers correct350 answers correctTest 2 Test 2 -- 360 answers correct360 answers correctTest 3Test 3 -- 375 answers correct375 answers correctTest 4Test 4 -- 365 answers correct365 answers correctTest 5Test 5 -- 385 answers correct385 answers correctTest 6 Test 6 - - 390 answers correct390 answers correctTest 7 Test 7 -- 400 answers correct400 answers correct
IT Cadre 2006IT Cadre 2006
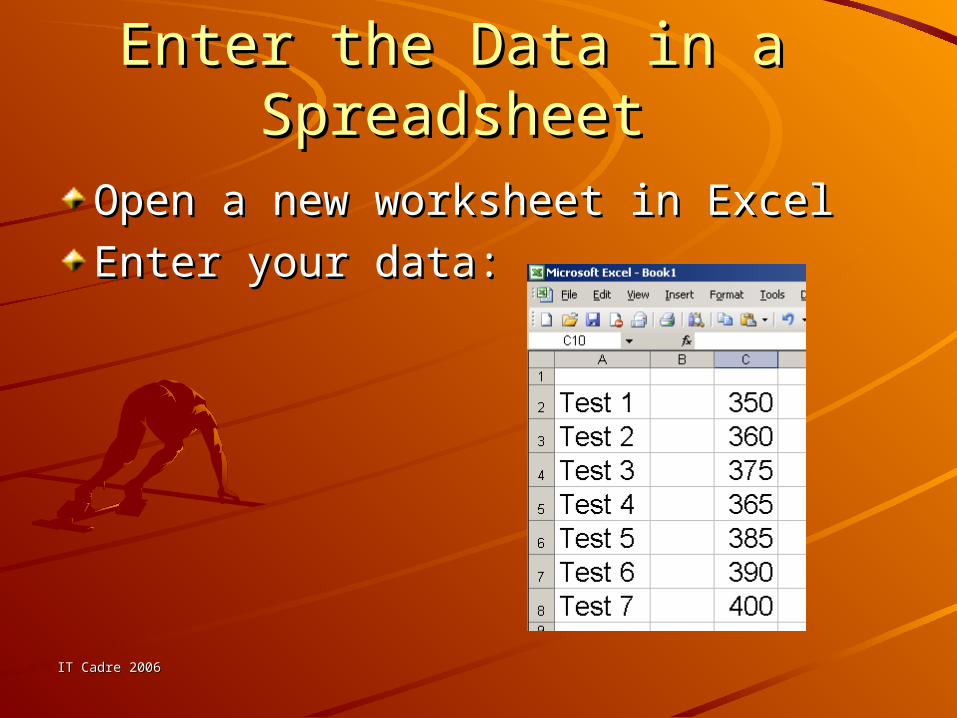
Enter the Data in a Enter the Data in a SpreadsheetSpreadsheet
Open a new worksheet in ExcelOpen a new worksheet in Excel
Enter your data:Enter your data:
IT Cadre 2006IT Cadre 2006
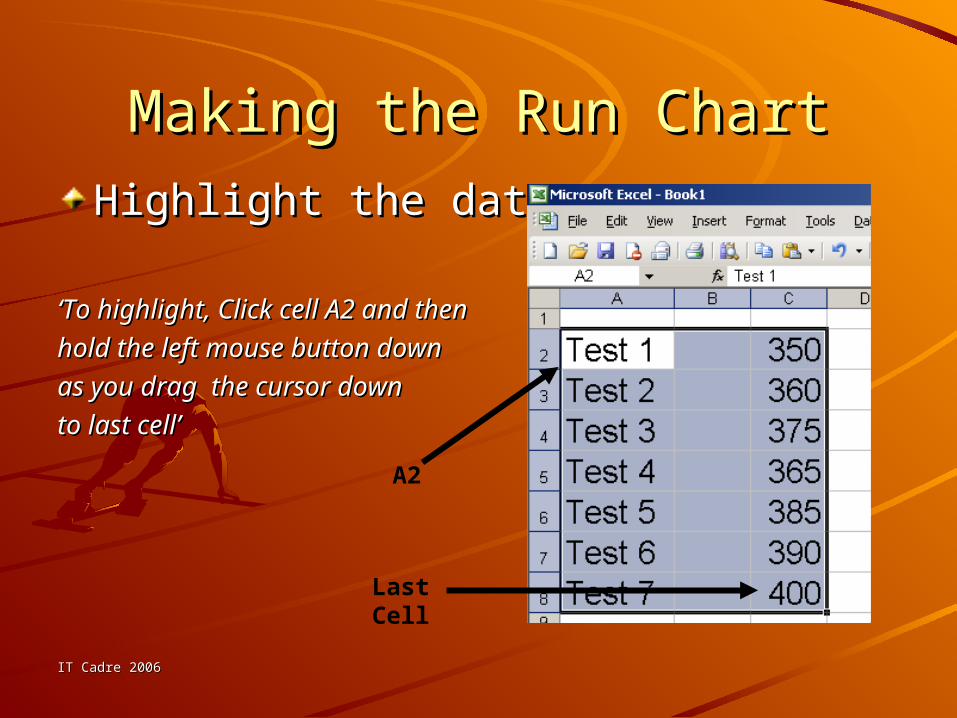
Making the Run ChartMaking the Run Chart
Highlight the dataHighlight the data
‘‘To highlight, Click cell A2 and then To highlight, Click cell A2 and then
hold the left mouse button down hold the left mouse button down
as you drag the cursor down as you drag the cursor down
to last cell’to last cell’
A2
Last Cell
IT Cadre 2006IT Cadre 2006
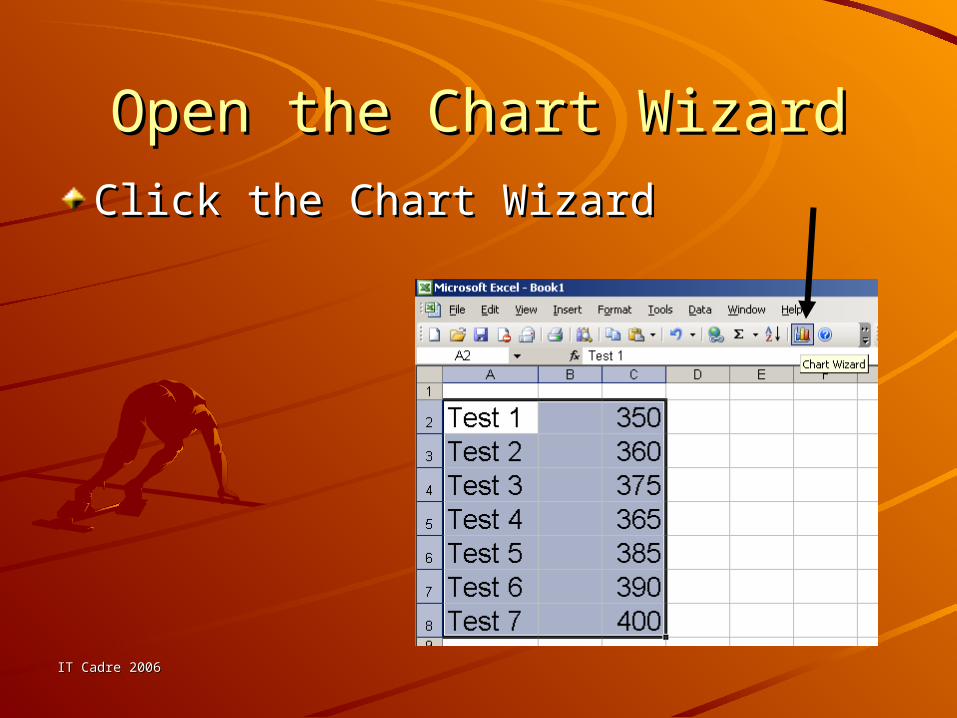
Open the Chart WizardOpen the Chart Wizard
Click the Chart WizardClick the Chart Wizard
IT Cadre 2006IT Cadre 2006
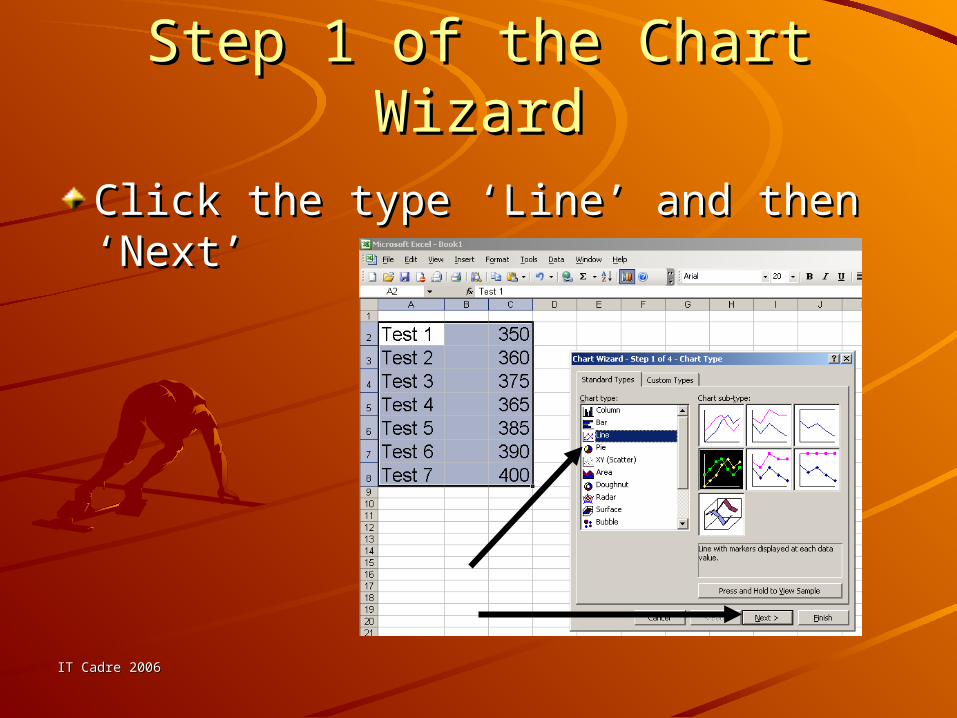
Step 1 of the Chart WizardStep 1 of the Chart Wizard
Click the type ‘Line’ and then ‘Next’Click the type ‘Line’ and then ‘Next’
IT Cadre 2006IT Cadre 2006
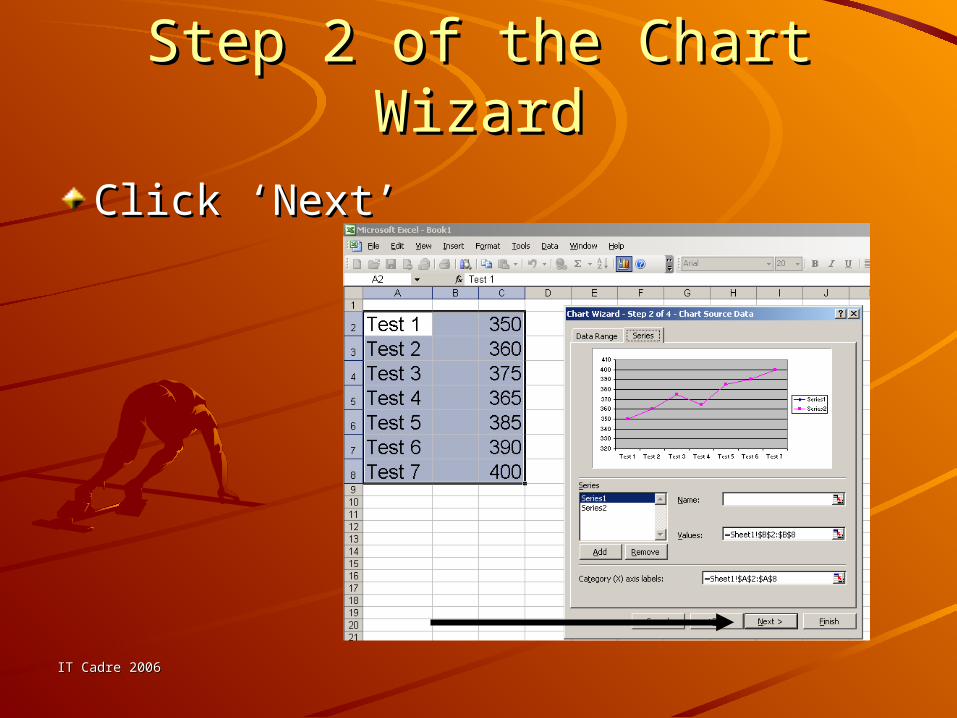
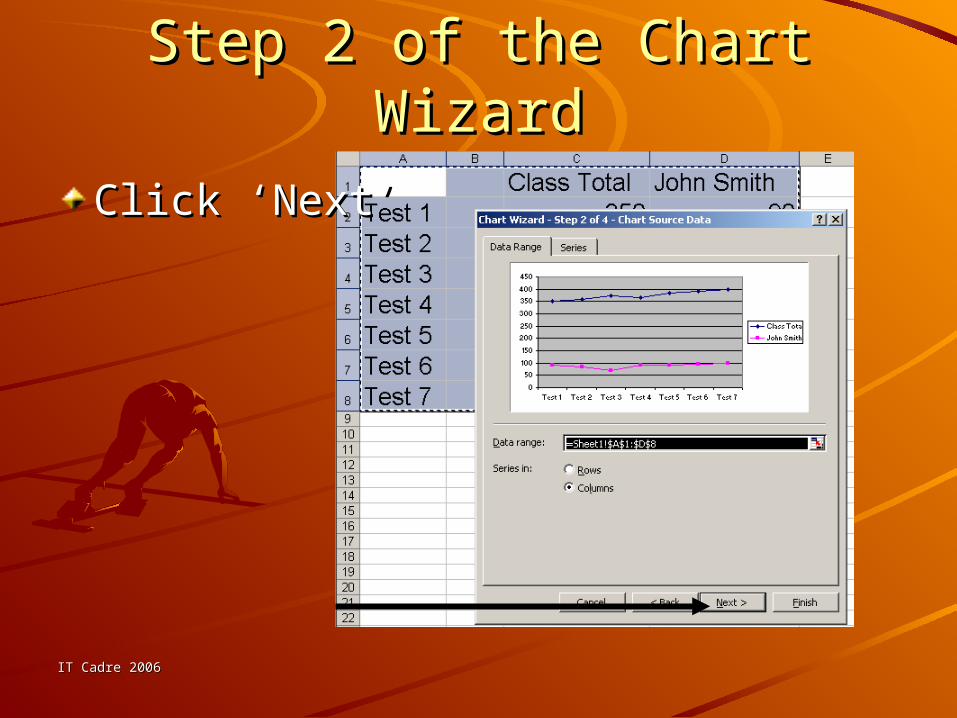
Step 2 of the Chart WizardStep 2 of the Chart Wizard
Click ‘Next’Click ‘Next’
IT Cadre 2006IT Cadre 2006
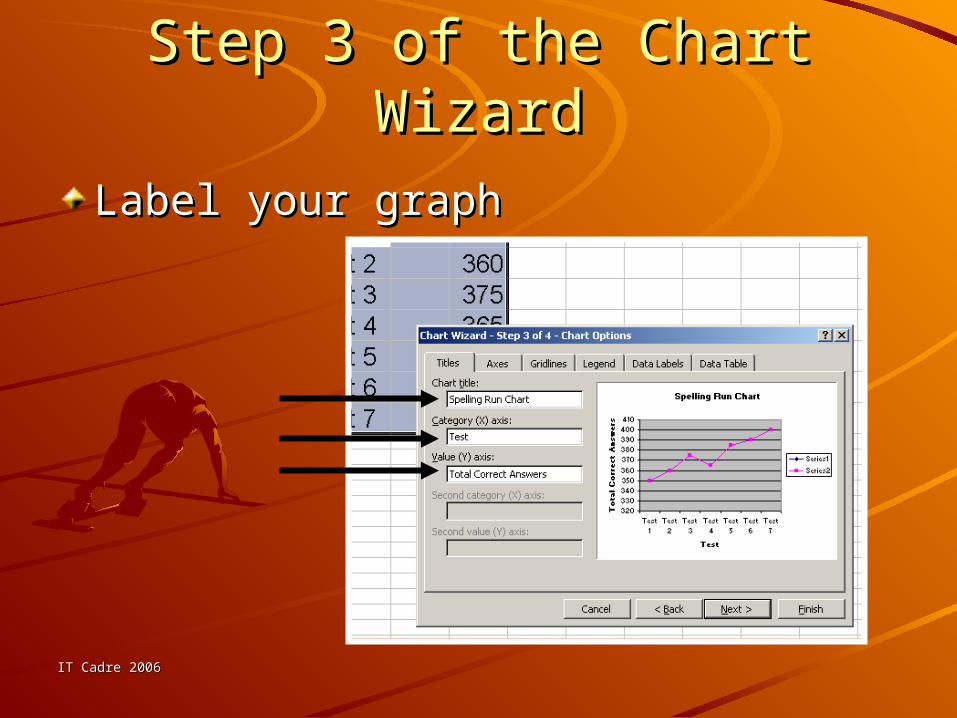
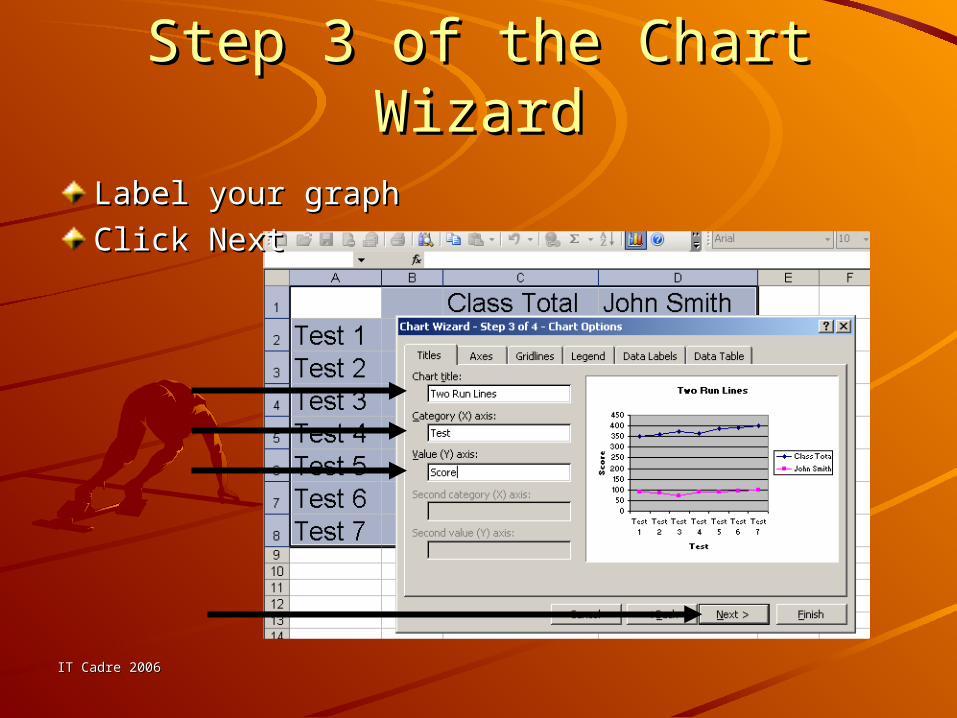
Step 3 of the Chart WizardStep 3 of the Chart Wizard
Label your graphLabel your graph
IT Cadre 2006IT Cadre 2006
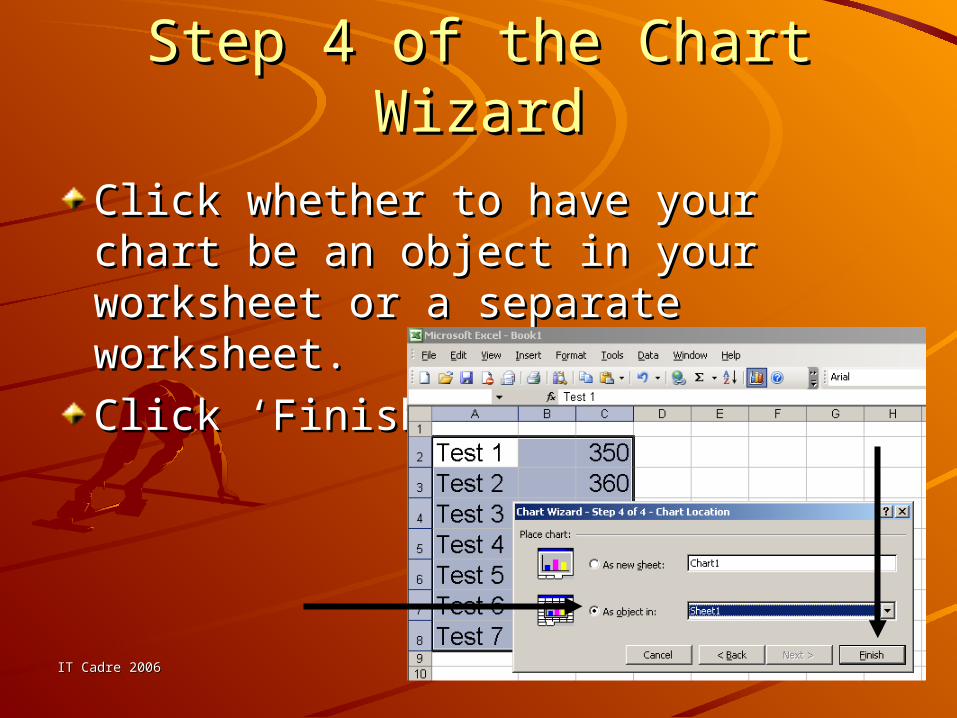
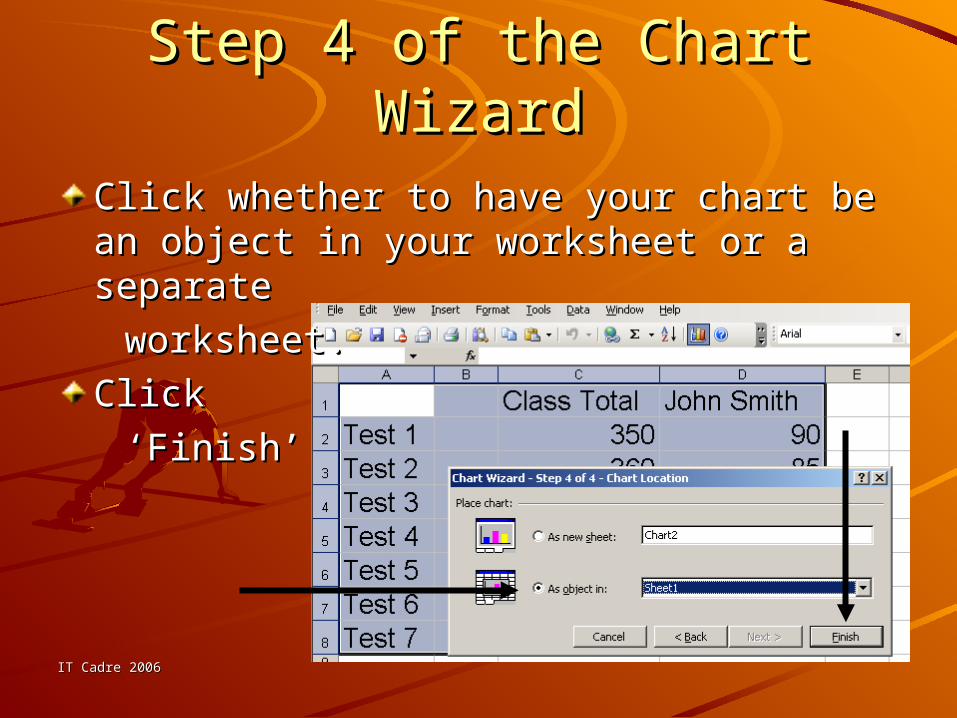
Step 4 of the Chart WizardStep 4 of the Chart Wizard
Click whether to have your chart be Click whether to have your chart be an object in your worksheet or a an object in your worksheet or a separate worksheet.separate worksheet.
Click ‘Finish’Click ‘Finish’
IT Cadre 2006IT Cadre 2006
Here is the Run ChartHere is the Run Chart
IT Cadre 2006IT Cadre 2006
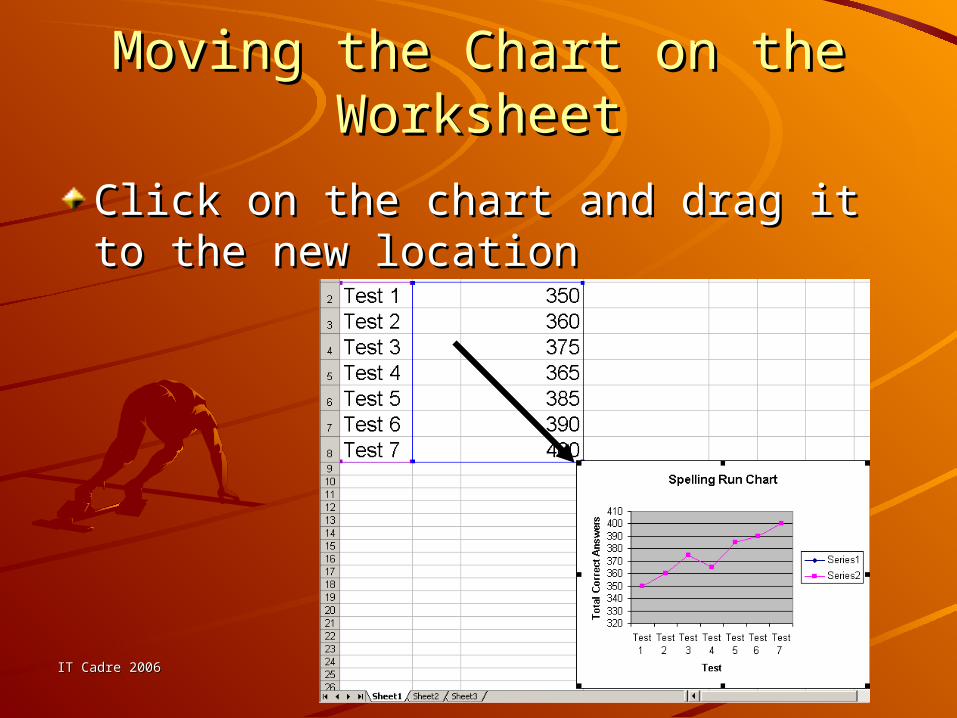
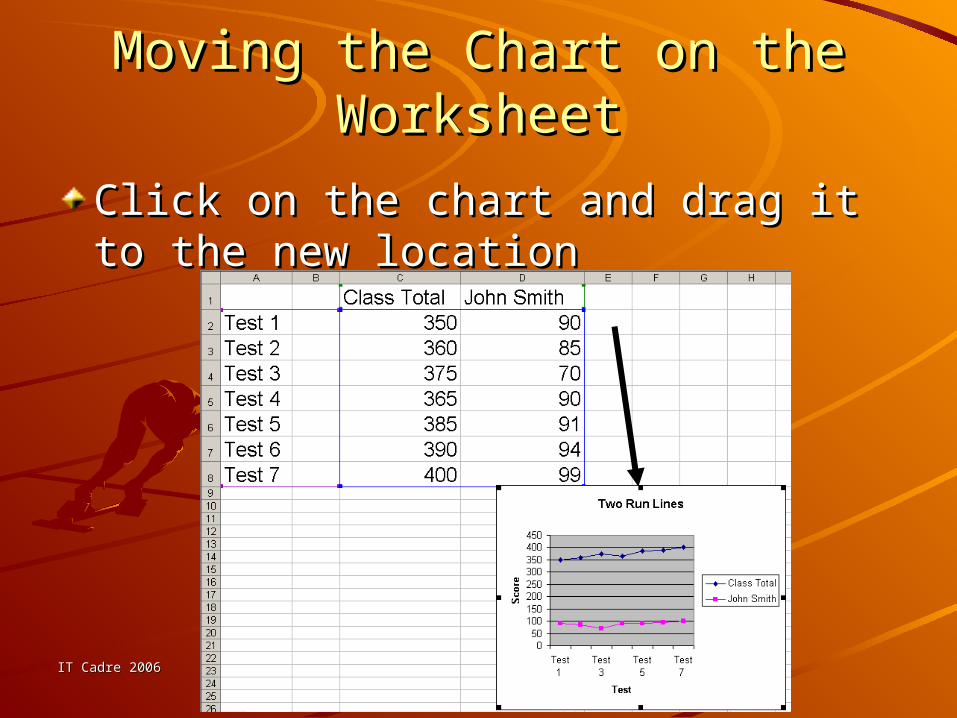
Moving the Chart on the WorksheetMoving the Chart on the Worksheet
Click on the chart and drag it to the Click on the chart and drag it to the new locationnew location
IT Cadre 2006IT Cadre 2006
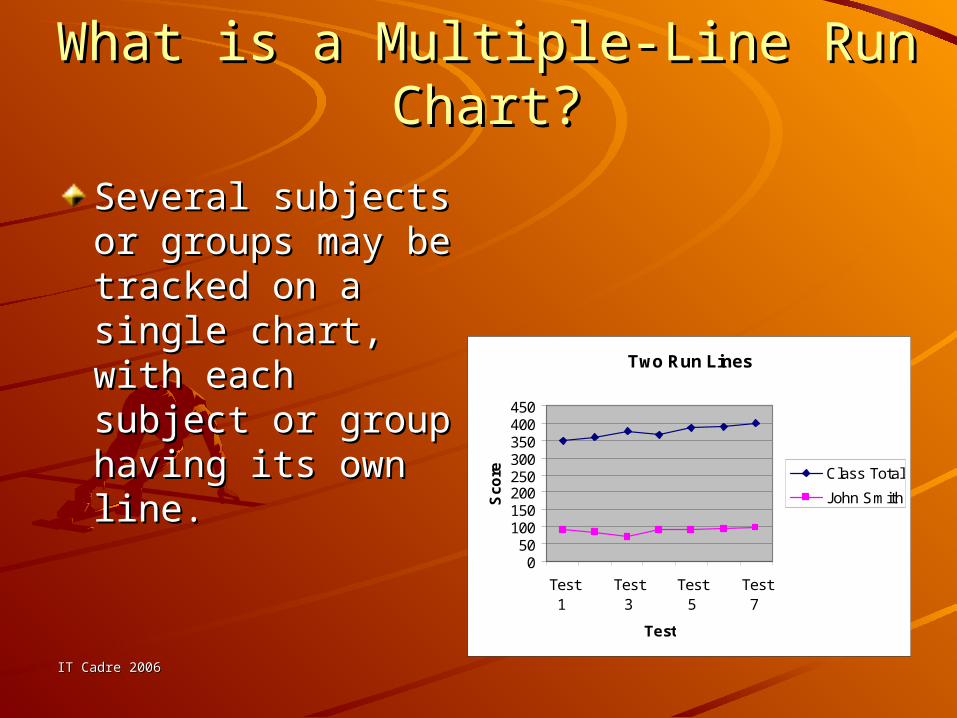
What is a Multiple-Line Run Chart?What is a Multiple-Line Run Chart?
Several subjects or Several subjects or groups may be groups may be tracked on a single tracked on a single chart, with each chart, with each subject or group subject or group having its own line.having its own line.
Two Run Lines
050
100150200250300350400450
Test1
Test3
Test5
Test7
Test
Sco
re Class Total
John Smith
IT Cadre 2006IT Cadre 2006
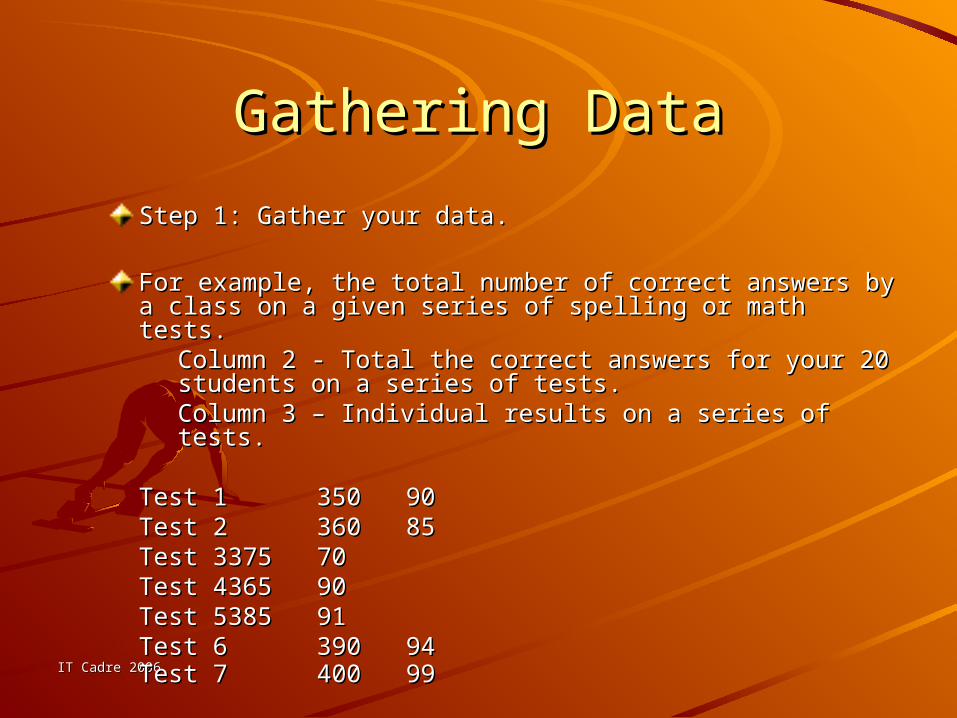
Gathering DataGathering Data
Step 1: Gather your data. Step 1: Gather your data.
For example, the total number of correct answers by a For example, the total number of correct answers by a class on a given series of spelling or math tests. class on a given series of spelling or math tests.
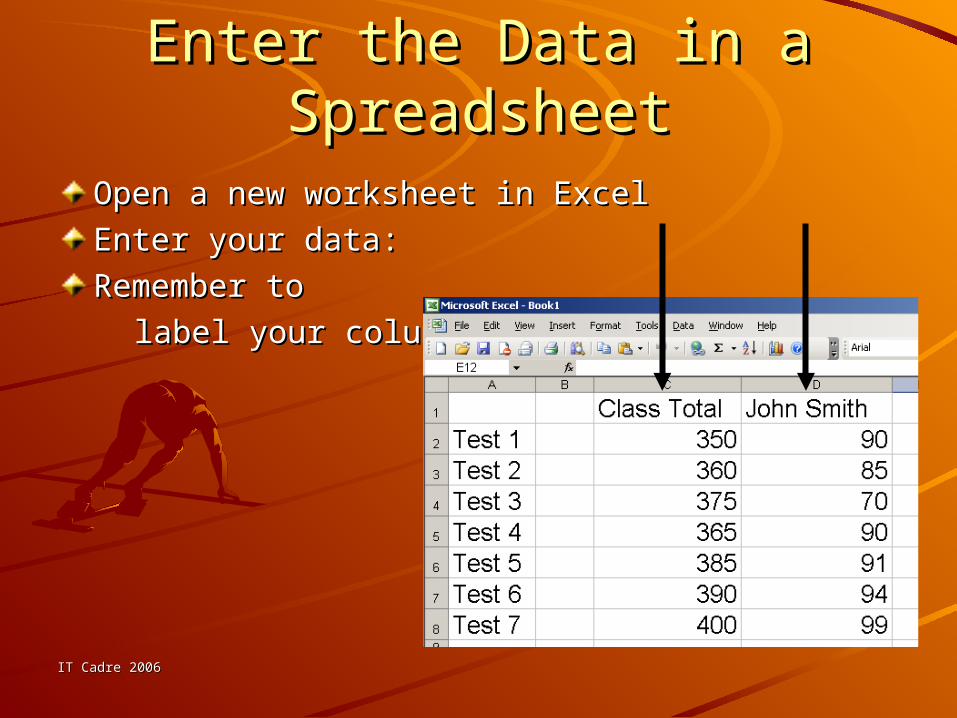
Column 2 - Total the correct answers for your 20 Column 2 - Total the correct answers for your 20 students on a series of tests.students on a series of tests.Column 3 – Individual results on a series of tests.Column 3 – Individual results on a series of tests.
Test 1 Test 1 350350 9090Test 2 Test 2 360360 8585Test 3Test 3 375375 7070Test 4Test 4 365365 9090Test 5Test 5 385385 9191Test 6 Test 6 390390 9494Test 7 Test 7 400400 99 99
IT Cadre 2006IT Cadre 2006
Enter the Data in a SpreadsheetEnter the Data in a SpreadsheetOpen a new worksheet in ExcelOpen a new worksheet in Excel
Enter your data:Enter your data:
Remember to Remember to
label your columnslabel your columns
IT Cadre 2006IT Cadre 2006
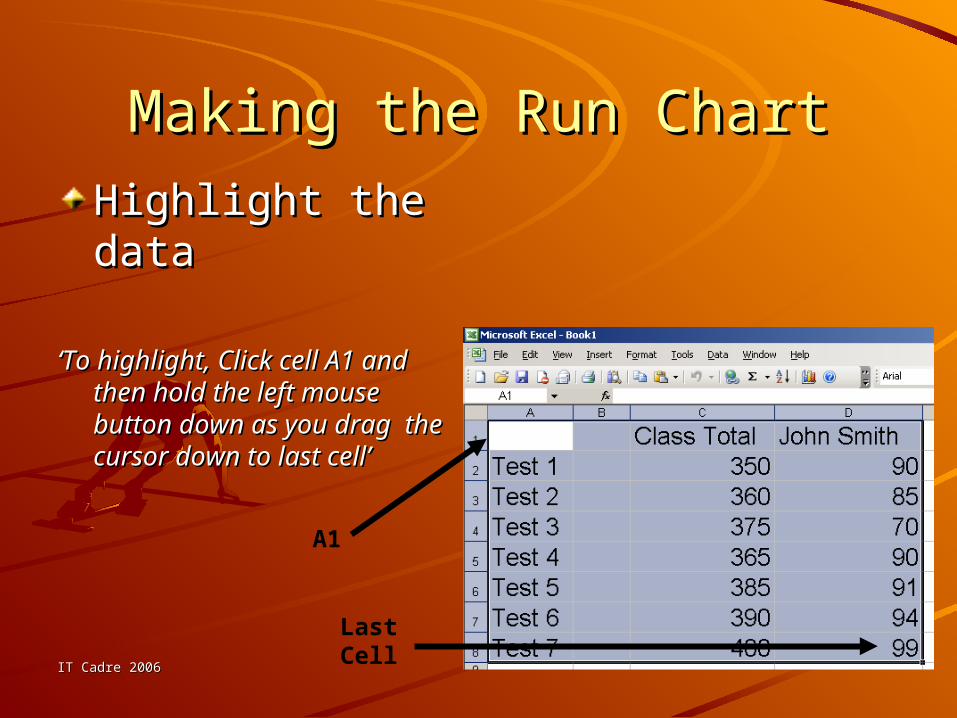
Making the Run ChartMaking the Run Chart
Highlight the Highlight the datadata
‘‘To highlight, Click cell A1 To highlight, Click cell A1 and then hold the left and then hold the left mouse button down as mouse button down as you drag the cursor down you drag the cursor down to last cell’to last cell’
A1
Last Cell
IT Cadre 2006IT Cadre 2006
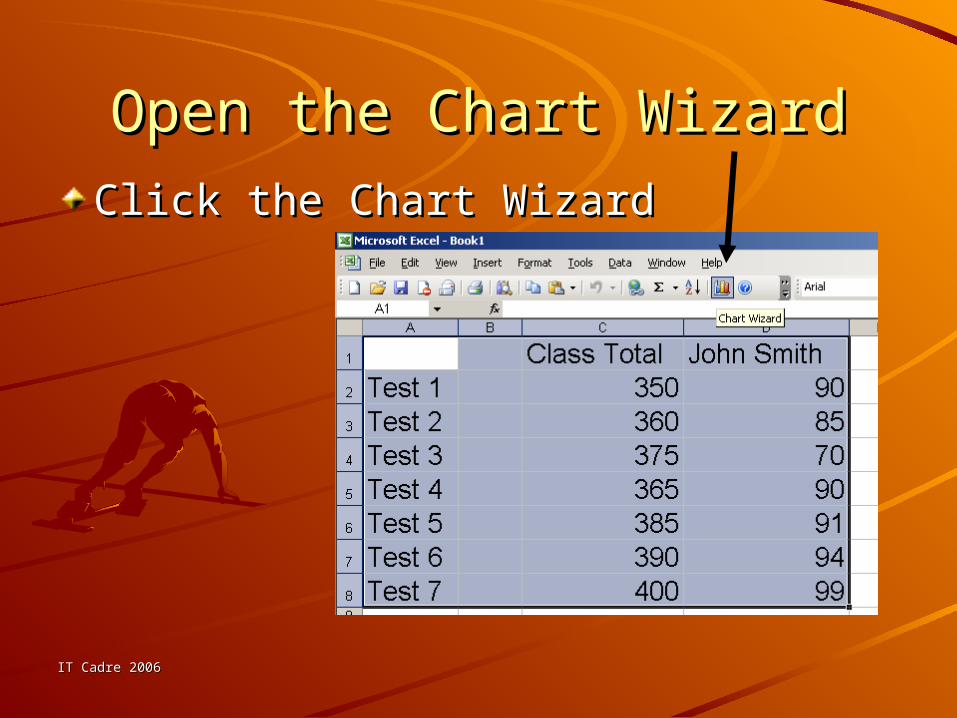
Open the Chart WizardOpen the Chart Wizard
Click the Chart WizardClick the Chart Wizard
IT Cadre 2006IT Cadre 2006
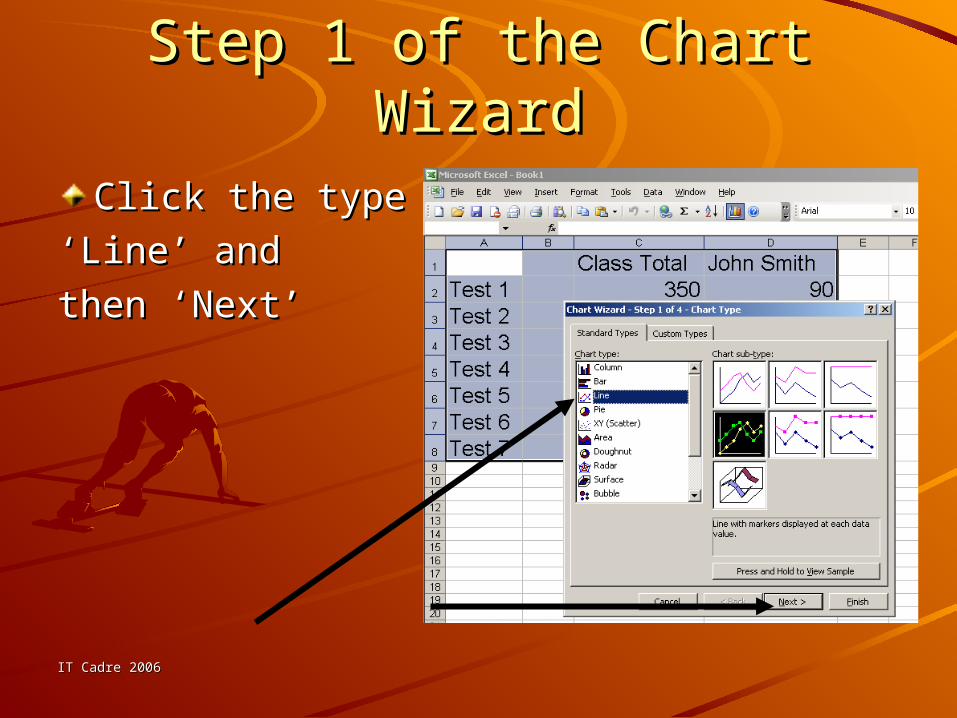
Step 1 of the Chart WizardStep 1 of the Chart WizardClick the type Click the type
‘‘Line’ and Line’ and
then ‘Next’then ‘Next’
IT Cadre 2006IT Cadre 2006
Step 2 of the Chart WizardStep 2 of the Chart Wizard
Click ‘Next’Click ‘Next’
IT Cadre 2006IT Cadre 2006
Step 3 of the Chart WizardStep 3 of the Chart WizardLabel your graphLabel your graph
Click NextClick Next
IT Cadre 2006IT Cadre 2006
Step 4 of the Chart WizardStep 4 of the Chart WizardClick whether to have your chart be an Click whether to have your chart be an object in your worksheet or a separate object in your worksheet or a separate
worksheet.worksheet.
Click Click
‘ ‘Finish’Finish’
IT Cadre 2006IT Cadre 2006
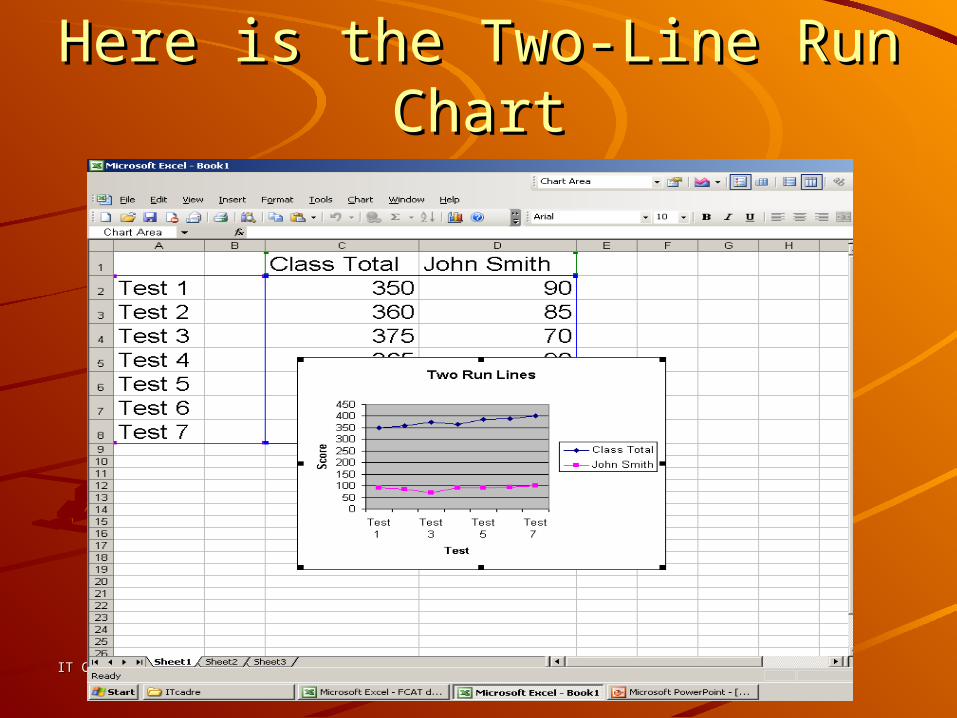
Here is the Two-Line Run ChartHere is the Two-Line Run Chart
IT Cadre 2006IT Cadre 2006
Moving the Chart on the WorksheetMoving the Chart on the Worksheet
Click on the chart and drag it to the Click on the chart and drag it to the new locationnew location