ISTOXX Europe Factor Indices – Harvesting Equity Returns ... · PDF fileEQUITY RETURNS...
27
INNOVATIVE. GLOBAL. INDICES. May 2017 ISTOXX EUROPE FACTOR INDICES – HARVESTING EQUITY RETURNS WITH BOND- LIKE VOLATILITY Dr. Jan-Carl Plagge, Head of Applied Research & William Summer, Quantitative Research Analyst, STOXX Ltd.
Transcript of ISTOXX Europe Factor Indices – Harvesting Equity Returns ... · PDF fileEQUITY RETURNS...

INNOVATIVE. GLOBAL. INDICES.
May 2017
ISTOXX EUROPE FACTOR INDICES – HARVESTING EQUITY RETURNS WITH BOND-LIKE VOLATILITY Dr. Jan-Carl Plagge, Head of Applied Research & William Summer, Quantitative Research Analyst, STOXX Ltd.

STOXX LTD. 2
TABLE OF CONTENTS
Abstract 3
1 Introduction 4
2 The Index Concept 4
3 iSTOXX Europe Single Factor Market Neutral Indices 7
4 iSTOXX Europe Multi-Factor Market Neutral Index 11
5 A potential portfolio diversifier – an example 14
6 Conclusion 18
References 19
Appendix A 20
Appendix B 22

STOXX LTD. 3
ISTOXX EUROPE FACTOR INDICES – HARVESTING EQUITY RETURNS WITH BOND-LIKE VOLATILITY
Abstract
The iSTOXX Europe Market Neutral Single and Multi-Factor Indices developed by STOXX in collaboration with Alpha Centauri1 offers investors a unique and very innovative way to target and capture premia of six well-documented sources of systematic risk: value, carry, momentum, size, low risk as well as quality.
Based upon the long only iSTOXX Europe Factor indices, which provide investors with a broad market exposure plus a factor tilt, the market neutral indices are constructed by beta hedging the factor index with one of Europe’s most liquid benchmark index, the STOXX Europe 600. Due to its innovative construction, these market neural indices distill the respective equity factor premia, mostly undisturbed by systematic sources of risk, into an investable index, hereby neutralizing market directionality and volatility. Hence, investors can capture pure returns associated with targeted factors without the need to “drag along” a broad market exposure.
Comparably low volatility levels around five percent make market neutral factor indices an interesting investment vehicle also for risk-averse investors, who traditionally might only consider fixed income products. Further, very low correlations between market neutral factor returns and the market itself enables investors to build better diversified portfolios with superior risk-return characteristics. The increased diversification can decrease sensitivities to common market risk factors (such as interest rate risk for bond portfolios).
The empirical results show that all iSTOXX Europe Market Neutral Single Factor Indices provide significant excess returns relative to their benchmark over our sample period of twelve years. With correlations to the benchmark index STOXX Europe 600 ranging from a minimum of -0.62 (low risk factor) to a maximum of 0.06 (value factor), factor returns are found to also serve as a great source of diversification when used in addition to an existing investment in a broad European benchmark index such as the STOXX Europe 600. Low correlations among factor returns further add to the diversification potential when investing in more than just one factor index.
However, risk premia are found to vary over time. This observation as well as the low correlation among factor returns provide the grounds for the construction of the iSTOXX Europe Market Neutral Multi-Factor index. Its innovative methodology leads to higher returns compared to a heuristic, e.g. equally weighted aggregation of single factor indices.
1 Alpha Centauri is an independent multi-asset management boutique founded in 2005 and based in Hamburg, Germany. It is an investment manager specialized in innovative liquid alternative products, with factor investing at the core of its business. www.alpha-centauri.com.

STOXX LTD. 4
ISTOXX EUROPE FACTOR INDICES – HARVESTING EQUITY RETURNS WITH BOND-LIKE VOLATILITY
1 Introduction
The traditional Capital Asset Pricing Model (CAPM) which goes back to the 1960s suggests only one risk factor, the market factor, to be systematically priced.2 Over the following decades, however, empirical research observed the existence of additional factors in the attempt to explain equity returns. The first extension of the CAPM was brought forward by Fama and French (1992) who suggested an extension of the one-factor CAPM by two additional factors, size and value. They found that small-cap companies as well as companies that are relatively undervalued compared to their book value outperformed their respective counterparts. Carhart (1997) extended the “Three Factor Model” by a fourth factor, momentum. Next to these four factors, today’s models typically include a variety of additional factors such as carry or quality.
What all of these factors have in common is that they contribute to the explanation of equity returns. In other words, investors may harvest additional return, in terms of a premium, when exposing themselves to such risk factors.
The iSTOXX Europe Single Factor index family developed by STOXX in collaboration with Alpha Centauri offers investors a very unique and innovative way to target and capture these risk premia while simultaneously minimizing distortions, which may arise from other systematic sources of risk. In addition, the iSTOXX Europe Multi-Factor index aims at simultaneously capturing premia from various well-known risk factors rather than from just one single source of risk.
This paper starts off with an introduction into the construction of the long only iSTOXX Europe Single and Multi-Factor indices before discussing the achievement of market neutrality. In the next sections, the development of market neutral risk premia over time is analyzed from a single-factor as well as from a multi-factor perspective.
The empirical results show that all iSTOXX Europe Market Neutral Single Factor Indices provide significant excess returns relative to their benchmark over a sample period of twelve years. With correlations to the benchmark index STOXX Europe 600 ranging from a minimum of -0.62 (low risk factor) to a maximum of 0.06 (value factor), factor returns are found to also serve as a great source of diversification when used in addition to an existing investment in a broad European benchmark index such as the STOXX Europe 600. Low correlations among factor returns further add to the diversification potential when investing in more than just one factor index.
However, risk premia are found to vary significantly over time. This observation as well as the low correlation among factor returns provide the grounds for the construction of the iSTOXX Europe Multi-Factor Market Neutral index. Its innovative methodology leads to lower risk and higher returns compared to a heuristic, e.g. equally weighted aggregation of single factor indices.
2 The Index Concept
iSTOXX Europe Factor Indices aim at capturing targeted risk premia while simultaneously minimizing the exposure to other systematic sources of risk. Available factors are value, carry, momentum, size, low risk as
2 The CAPM goes back to William F. Sharpe, John Lintner and Jan Mossin who developed the model, independent from one another, in the 1960s. See, e.g., Sharpe (1964), Lintner (1965) and Mossin (1965).

STOXX LTD. 5
ISTOXX EUROPE FACTOR INDICES – HARVESTING EQUITY RETURNS WITH BOND-LIKE VOLATILITY
well as quality.3 The underlying universe for the construction of all factor indices is the STOXX Europe Total Market Index. This index covers appr. 95% of the investable market capitalization of developed Europe.
In the selection process, the exposure of each company in the universe to each factor is assessed by a variety of fundamental measures.4 In order to compose a single, company-factor-specific score, each measure is transformed into a normalized score, subject to industry specific level deviations, before being aggregated. Hereby, each variable is assigned the same importance, i.e. the same weight.
The selection of stocks, as well as the determination of corresponding weights, happen simultaneously based on an optimization approach.5 The optimization hereby aims at maximizing the exposure to the respective targeted factor while subjecting itself to a series of constraints that are chosen in order to achieve the best tradeoff between tradability and factor replication. The constraints are as follows:
maximum tracking error of three percent relative to STOXX Europe 600, maximum systematic risk contribution of ten percent to tracking error, targeted beta of one relative to STOXX Europe 600 with allowed maximum deviation of +/- 0.025,
maximum deviation of component weights from those of the STOXX Europe 600 of +/- 1.5 percentage points,6
targeted number of components between 50 and 120,
components are capped in such a way that the sum of stocks with a weights of more than 4.5% cannot exceed 35% which each single stock is capped at a maximum weight of 8%
industry weights cannot deviate from those of the STOXX Europe 600 by more than +/- 1.5%, one-way turnover per month is set to a maximum of 25%, liquidity constraint on constituent level: 100 mn times weight needs to be at most 15% of the
average 20-day value traded.
The factor exploitation takes place within the allowed tracking error of three percent relative to the benchmark index. As this remainder, however, is influenced by a variety of systematic factors, the influence of these remaining factors is restricted to a maximum of ten percent, i.e. 0.3% (= 10% *3%) within the optimization process.
Unconstrained optimizations have two tendencies: on the one hand, they may derive very concentrated results. On the other hand, they may end up with a large number of components that have very small weights and thus, an insignificant contribution to the characteristics of the overall portfolio. In order to control for both effects, the optimization aims at a number of components that ranges between a minimum of 50 and a maximum of 120.7 The specified maximum of 120 also aims at keeping the number of components at a reasonable level in order to facilitate trading. Further, the maximum weight on component level is set to 10% in order to prevent single components from dominating the index.
Lastly, the optimization process takes into account the industry allocation of the STOXX Europe 600 Index. Industry weights of the iSTOXX Europe Factor Indices cannot deviate by more than 1.5 percentage points from those of the benchmark. This step is necessary in order to increase the purity of the targeted premium
3 The iSTOXX Europe Multi-Factor Index aims at maximizing the overall exposure to the targeted risk factors. 4 For an overview and explanation of the measures underlying the factor construction, please refer to Appendix A. 5 The optimization is conducted using the APT Risk Model. FIS’ investment risk solution (APT) provides award-winning investment technology for multi-asset class risk management, analytics and risk reporting, serving buy-side institutions globally. www.fisglobal.com. 6 For companies that are not part of the STOXX Europe 600, the reference weight is set to 0%. 7 Please note that the actual number of components may be above or below the defined thresholds. However, the optimization procedure assigns a penalty for deviations. Thus, there needs to be a “good” reason for a breach of this criterion.

STOXX LTD. 6
ISTOXX EUROPE FACTOR INDICES – HARVESTING EQUITY RETURNS WITH BOND-LIKE VOLATILITY
when shorting the market via the STOXX Europe 600. Without industry constraints, sector deviations between the long and short positions, which remain in spite of the industry-specific normalization of factor scores and the targeted beta of 1 relative to the benchmark, may still lead to active sector bets or, in more general terms, to exposure to unwanted risk factors.
2.1 Market Neutral Factors
In order to allow for the extraction of the pure factor premium net of the market, the optimization tries to achieve a beta of one relative to a highly tradable broad market index. In our case, one of Europe’s most liquid indices in terms of derived products, the STOXX Europe 600, is used. Thus, a long investment in one of the iSTOXX Europe Factor indices while maintaining a short position in STOXX Europe 600 futures allows to easily hedge the market and extract the targeted risk premium.
The size of the short position in STOXX Europe 600 futures is calculated in such a manner that that the resulting portfolio is market neutral, that is, has a Beta of 0. The market neutral index values are calculated as follows:
𝐼𝑉𝑡 = 𝐼𝑉𝑟𝑒𝑏 × [𝐹𝐼𝑡
𝐹𝐼𝑟𝑒𝑏− 𝛽 × (
𝑅𝐹𝑡
𝑅𝐹𝑟𝑒𝑏− 1)]
where: IV: Market Neutral Index value FI: Single/Multi Factor Equity index RF: Rolling Future index (the iSTOXX Europe Market Net Return Total Return indices use the STOXX
Europe 600 Futures Roll Excess Return as RF while the iSTOXX Europe Market Neutral Net Return Excess Return indices use the STOXX Europe 600 Futures Roll Total Return as RF)
β: Beta of FI to the STOXX Europe 600 (180 weekly returns) Reb: Rebalancing day (index close as of Friday)
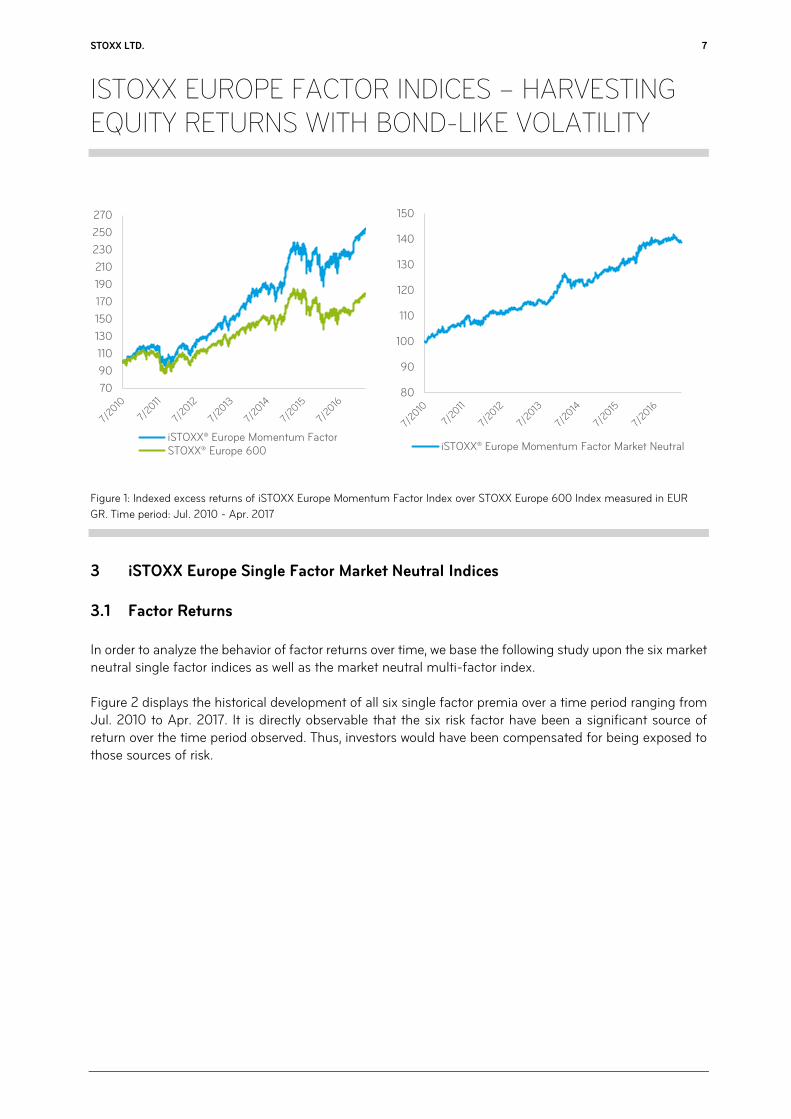
Figure 1 graphically demonstrates the move from long only to market neutral factor indices. The left hand side of Figure 1 details the returns of both the STOXX Europe 600 and the long only iSTOXX Europe Momentum Factor performance since 2010. The right hand side of Figure 1 exhibits the performance of the market neutral value factor, that is the beta hedged version of the iSTOXX Europe Momentum Factor.
STOXX LTD. 7
ISTOXX EUROPE FACTOR INDICES – HARVESTING EQUITY RETURNS WITH BOND-LIKE VOLATILITY
Figure 1: Indexed excess returns of iSTOXX Europe Momentum Factor Index over STOXX Europe 600 Index measured in EUR
GR. Time period: Jul. 2010 - Apr. 2017
3 iSTOXX Europe Single Factor Market Neutral Indices
3.1 Factor Returns
In order to analyze the behavior of factor returns over time, we base the following study upon the six market neutral single factor indices as well as the market neutral multi-factor index.
Figure 2 displays the historical development of all six single factor premia over a time period ranging from Jul. 2010 to Apr. 2017. It is directly observable that the six risk factor have been a significant source of return over the time period observed. Thus, investors would have been compensated for being exposed to those sources of risk.
70
90
110
130
150
170
190
210
230
250
270
iSTOXX® Europe Momentum FactorSTOXX® Europe 600
80
90
100
110
120
130
140
150
iSTOXX® Europe Momentum Factor Market Neutral

STOXX LTD. 8
ISTOXX EUROPE FACTOR INDICES – HARVESTING EQUITY RETURNS WITH BOND-LIKE VOLATILITY
Figure 2: Indexed total returns of iSTOXX Europe Factor Indices over STOXX Europe 600 Index measured in EUR GR. Time
period: Jul. 2010 - Apr. 2017
The momentum factor hereby yielded the highest overall premium with an annualized return of 5.17% while the low risk factor showed the lowest return with 2.43% on an annualized basis (see column 2 of Table 1).
Performance (p.a.) Annualized volatility Correl. to STX Europe 600
Carry 4.29% 4.30% -0.14
Low Risk 2.43% 3.46% -0.62
Momentum 5.17% 3.99% -0.04
Quality 3.80% 3.35% -0.17
Size 2.64% 6.31% -0.09
Value 2.62% 4.46% 0.06
Multi-Factor 6.47% 4.25% -0.28
Table 1: Annualized performance figures, standard deviations and correlations of factor returns to benchmark (STOXX Europe 600).
All figures are based on EUR GR. Volatility and correlation figures are based on weekly returns. Time period: Jul. 2010 - Apr. 2017.
But apart from overall positive returns, the graphical representation of Figure 3 also indicates that factor returns vary over time. In times of market distress, as observable during the European debt crisis, returns stemming from more cyclical factors such as value and size, are found to have been negative.
80
90
100
110
120
130
140
150
7/2010 7/2011 7/2012 7/2013 7/2014 7/2015 7/2016
Factor Premia
Carry Low Risk Momentum Quality Size Value

STOXX LTD. 9
ISTOXX EUROPE FACTOR INDICES – HARVESTING EQUITY RETURNS WITH BOND-LIKE VOLATILITY
3.2 Factor Correlations
Investors who consider a factor investment will typically have an existing exposure to a standard, i.e. market cap weighted broad market index. In our case, this may be the STOXX Europe 600. It is therefore of significant importance to understand how factor indices interact with a corresponding broad market investment.
To investigate these interactions, we look at correlations between market neutral factor premia and the STOXX Europe 600 Index (see Figure 3).
Figure 3: Correlations between factor returns and the STOXX Europe 600 (EUR GR). Time period: Jul. 2010 – Mar. 2017. Correlations are based on weekly returns measured over a 52-week time period.
One-year time averages range of weekly correlations range from a minimum of -0.64 (Low-Risk factor) to a maximum of 0.06 (Value factor).8 Thus, with correlations to the broad market being this low, factor returns indeed serve as a good instrument for diversification. However, when following correlations over time, it can be observed that this diversification potential fluctuates.
The low correlations between market neutral factor returns and the broad market have a direct impact also on risk characteristics of long only indices. One may intuitively assume that the addition of a factor as a source of risk may increase the overall volatility of a portfolio. However, this may not always be the case. This conclusion is supported when looking at volatilities of the long-only iSTOXX Europe Factor Indices, rather than at the excess returns constructed by long-short positions (see column 2 of Table 2). With the exception of the iSTOXX Europe Value index, which had the highest correlation to the broad market (0.04)
8 See also column 4 of Table 1 for correlations measured over the entire time period observed.
-1.0
-0.8
-0.6
-0.4
-0.2
0.0
0.2
0.4
0.6
7/2011 1/2012 7/2012 1/2013 7/2013 1/2014 7/2014 1/2015 7/2015 1/2016 7/2016 1/2017
Correlation to Benchmark
Carry Low Risk Momentum Quality Size Value

STOXX LTD. 10
ISTOXX EUROPE FACTOR INDICES – HARVESTING EQUITY RETURNS WITH BOND-LIKE VOLATILITY
an annualized volatility of 17.0%, all other factor indices actually display lower levels of risk that the STOXX Europe 600 (see Table 2).
Performance (p.a.) Annualized Volatility Max. Drawdown
iSTOXX Europe Carry 13.9% 16.2% -22.7%
iSTOXX Europe Low Risk 11.9% 14.4% -20.1%
iSTOXX Europe Momentum 14.8% 16.2% -21.7%
iSTOXX Europe Quality 13.3% 16.2% -22.6%
iSTOXX Europe Size 12.1% 15.8% -29.0%
iSTOXX Europe Value 11.8% 17.0% -27.3%
iSTOXX Europe Multi-Factor 16.3% 15.2% -21.1%
STOXX Europe 600 9.1% 16.9% -25.2%
Table 2: Annualized performance figures and standard deviations of long only iSTOXX Europe Factor Indices and STOXX Europe
600. Volatilities are based on weekly returns. Returns are measured in EUR GR. Time period: Jul. 2010 – Apr. 2017.
So far, we have looked at correlations between factor returns and returns of the broad market. When adding one or more factor indices to an existing portfolio, however, it is important to understand the interactions, i.e. correlations, among factors. Table 3 provides correlations among factor returns measured over a time period ranging from Jul. 2010 to Mar. 2017.
Carry Low Risk Momentum Quality Size Value
Carry - 0.39 0.67 0.52 0.51 0.24
Low Risk 0.39 - 0.38 0.35 0.23 0.01
Momentum 0.67 0.38 - 0.53 0.44 0.19
Quality 0.52 0.35 0.53 - 0.49 0.37
Size 0.51 0.23 0.44 0.49 - 0.54
Value 0.24 0.01 0.19 0.37 0.54 -
Average 0.47 0.27 0.44 0.45 0.44 0.27
Table 3: Correlations among factor returns measured based on weekly EUR gross returns. Time period: Jul. 2010 - Mar. 2017.
Correlations range from a minimum of 0.01 (Value and Low Risk) to a maximum of 0.67 (Carry and Momentum).9 To put these figures into context: with an average correlation of 0.62 among developed market equity indices and an average correlation among developed markets’ industries with about 0.72, style factors are found to be significantly less similar among each other10.
As stated, factor returns as well as correlations between factor returns and the STOXX Europe 600 Index fluctuate over time. This leads us to assume that correlations among factor returns may be subject to the
9 Correlations between factor returns may be higher compared to returns of indices that are constructed according to Fama-French. This is due to the fact that the Fama-French approach is mainly free from benchmark and tradability constraints and allows long-short positions within factor indices. 10 Correlations among countries and industries are based on developed countries (classified according to the STOXX country classification system) and industries (classified based on the ICB industry classification) and measured over the time period: Sept. 2010 to March 2017.

STOXX LTD. 11
ISTOXX EUROPE FACTOR INDICES – HARVESTING EQUITY RETURNS WITH BOND-LIKE VOLATILITY
same behavior. Figure 4 graphically displays average correlations among all six factor premia.11 To view the behavior of correlations in a market context, the performance of the STOXX Europe 600 is also displayed.
4 iSTOXX Europe Multi-Factor Market Neutral Index
Given the variation of factor returns over time and in light of low correlations among those returns, it makes intuitive sense to consider an investment across more than just one factor for matters of diversification. But how to best combine single factor exposures in a multi-factor index?
The iSTOXX Europe Multi-Factor Index aims to maximize the aggregated exposure to all of the six factors - value, carry, momentum, size, low risk as well as quality. As we will see, this approach yields significantly better results than a mere heuristic, i.e. equal weighted combination of single factor indices.
Figure 4 provides median percentiles of company factor exposures from the perspective of each of the six single factor indices as well as from the perspective of the multi-factor index.12
Figure 4: Median percentiles of companies selected into a respective factor index with regard to every one of the six specified
factors.
As expected, companies selected into the single factor indices score highest on the factor in focus. The median percentiles to non-targeted factors are mostly below 50%.
11 Average correlations are calculated as average of averages. In a first step, the average over all correlations between factor return x and all other factor returns is determined (which is repeated for each factor). In a second step, the average over all previously calculated average correlations is determined. 12 Percentiles are calculated relative to the universe index STOXX Europe Total Market Index. Cut-Off Date: Feb. 29, 2016.
0
10
20
30
40
50
60
70
80
90
100
Carry Risk Momentum Quality Size Value Multi
Med
ian P
erce
ntile
Median Percentile of Normalized Score
Median Carry Median Risk Median Momentum Median Quality Median Size Median Value

STOXX LTD. 12
ISTOXX EUROPE FACTOR INDICES – HARVESTING EQUITY RETURNS WITH BOND-LIKE VOLATILITY
With the exception of the size factor, median percentiles of companies selected into the iSTOXX Europe Multi-Factor Index, however, are found to be above 50%. Thus, the majority of companies selected into the multi-factor index belong to the top 50% with regard to more than just one factor. Hence, the iSTOXX Europe Multi-Factor Index tends to include companies that score relatively well across the majority of the factors rather than selecting those companies that score well in just one dimension but do badly in all the others. Here lies a significant difference compared to a mere combination of single factor indices.
To further illustrate the differences between the two approaches, Figure 6 provides a simplified graphical representation of two possible extremes of combining factors for the case of a hypothetical two-factor scenario with factors E and F.
Figure 5: Simplified graphical representation of hypothetical two factors investment with factors E and F. The “index of indices”
approach is displayed on the right hand side while a simultaneous maximization to both factors is displayed on the left hand
side.
The “index of indices” approach, displayed on the left hand side of Figure 5, would lead to the inclusion of companies from quadrants A, B and C. Assuming that both factors E and F are independent from one another, companies that score high with regard to factor E (e.g. belong to the top 50%) could either have a very high (quadrant B) or very low (quadrant C) exposure to factor F. The same holds true from the perspective of factor F relative to factor E. Consequently, a combination of single factor indices would be a mix of companies with very different exposures to both factors.
The other extreme would be to include only those companies that score above the median with regard to both factors, E and F (quadrant B). As we have seen in Figure 4, the iSTOXX Europe Multi-Factor index
A
0.5
0.5 1
1
B
D C
A
0.5
0.5 1
1
B
D C
Factor E
Fact
or F
Factor E
Fact
or F
Simple combination of factor indicesSimultaneous maximization of
exposure to all factors

STOXX LTD. 13
ISTOXX EUROPE FACTOR INDICES – HARVESTING EQUITY RETURNS WITH BOND-LIKE VOLATILITY
tends to rather include those companies that score relatively well in both dimensions which would correspond with quadrant B (see right hand side of Figure 5).13
But how does this difference translate into performance? Figure 6 provides performance figures for both approaches, the “index of indices” concept as well as the methodology chosen for the iSTOXX Europe Multi-Factor Index.
Figure 6: Annual and indexed returns of iSTOXX Europe Multi-Factor index as well as of equal-weighted combination of iSTOXX
Europe Single Factor returns over STOXX Europe 600 measured in EUR GR. Time period: Jul. 2010 to Mar. 2017.
With an overall performance of 42.8% measured from Jul. 2010 to Apr. 2017, the iSTOXX Multi-Factor Index outperforms its equal-weighted benchmark, which generated a performance of “only” 23.7% over the 7 years observed, by a factor of 1.8 or 19 percentage points. More importantly, the superior performance does not only emerge in the long run. In fact, the iSTOXX Europe Multi-Factor Index outperformed its benchmark in all but one of the seven years observed. Thus, focusing on “hidden champions”, i.e. those companies that score relatively well across more than one factor, rather than focusing on companies that score very well with regard to just one factor but poorly in the remaining factors, leads to better performance results.
As we have seen above, factor returns are found to have low correlation not only with the market but also amongst each other. Hence, an investment that combines a broad market investment with an investment across factors should provide significantly lower risk than an investment into the broad market alone. A comparison of volatility and maximum drawdown figures for those two alternatives supports this assumption (see columns 3 and 4 of Table 2). The iSTOXX Europe Multi-Factor index shows a total risk
13 Please note that the selection process of the iSTOXX Europe Multi-Factor index does not explicitly require companies to fall into quadrant B. However, the empirical results indicate that the majority of companies selected into the index tend to score above the median in the majority of the targeted factors.
-15%
5%
25%
45%
65%
85%
-40%
-30%
-20%
-10%
0%
10%
20%
2010 2011 2012 2013 2014 2015 2016 2017
Ret
urn
(in
dex
ed)
Ret
urn
(p
.a.)
Factor Premia
Multi-Factor Simple Average Multi-Factor Simple Average

STOXX LTD. 14
ISTOXX EUROPE FACTOR INDICES – HARVESTING EQUITY RETURNS WITH BOND-LIKE VOLATILITY
that is about 1.7 percentage points below that of a stand-alone investment into the STOXX Europe 600. Even more notably, the maximum drawdown of the iSTOXX Europe Multi-Factor index, measured over the entire period observed, is four percentage points below that of the STOXX Europe 600.
5 A potential portfolio diversifier – an example
In this section, we make use of the iSTOXX Europe Multi-Factor Index in a concrete portfolio construction example. The iSTOXX® Europe Multi-Factor Market Neutral exhibits very low correlations with traditional asset classes. This makes it an ideal portfolio diversifier. Table 4 highlights the correlations between major (European) asset classes and the iSTOXX® Europe Multi-Factor Market Neutral index, which has an average correlation of -0.1 against the four indices listed in Table 4. This property, coupled with its low volatility enables even highly risk-averse investors, who traditionally would only invest in fixed income products, to gain access to equity factor premia and as a result construct better diversified portfolios.
iSTOXX Europe Multi-Factor
Market Neutral
EURO STOXX 50 Corporate Bond
STOXX 600 TR
Bloomberg Eurozone
Sovereign Bond Index
Bloomberg Commodity
Index Euro Total Return
iSTOXX Europe Multi-Factor Market Neutral 1.00 0.03 -0.38 -0.03 -0.10
EURO STOXX 50 Corporate Bond 0.03 1.00 0.06 0.64 0.11
STOXX 600 TR -0.38 0.06 1.00 0.13 0.39 Bloomberg Eurozone Sovereign Bond Index -0.03 0.64 0.13 1.00 -0.04 Bloomberg Commodity Index Euro Total Return -0.10 0.11 0.39 -0.04 1.00
Table 4: Correlations of a selection of Euro based indices. Correlations are based on weekly returns. Returns are measured in EUR
GR. Time period: Jan. 2011 – Apr. 2017.
By adding the iSTOXX® Europe Multi-Factor Market Neutral index to his portfolio, a fixed income investor may increase diversification, resulting in higher returns at no increase in volatility. For instance, a bond portfolio’s performance may primarily be driven by two factors, interest rates and credit spreads, however, by allocating a certain proportion into the market neutral multi-factor index, the performance can be improved without increasing risk. In Table 4 below we calculate a hypothetical portfolio that is invested by 70% in the EURO STOXX 50 Corporate Bond TR and by 30% in the iSTOXX Europe Multi-Factor Market Neutral, based on monthly rebalancings. This combination portfolio strictly dominates an exclusive investment in the EURO STOXX 50 Corporate Bond index on a risk-return basis, with annualised returns from 5.3% compared to 4.7% whilst the historical annual volatility is equivalent for both at 2.3%.
Performance
(p.a.) Annualized
Volatility Return/Risk
Ratio Maximum Drawdown
EURO STOXX 50 Corporate Bond TR 4.7% 2.3% 2.0 -3.3%
iSTOXX Europe Multi-Factor Market Neutral 6.6% 4.6% 1.4 -4.5%
70%-30% Combination 5.3% 2.3% 2.3 -2.7%
Table 5: performance statistics of EURO STOXX 50 Corporate Bond TR, iSTOXX Europe Multi-Factor Market Neutral and a linear
combination thereof. Returns are measured in EUR GR. Time period: Jan. 2011 – Apr. 2017.

STOXX LTD. 15
ISTOXX EUROPE FACTOR INDICES – HARVESTING EQUITY RETURNS WITH BOND-LIKE VOLATILITY
Figure 7 outlines the historical performance of the 70-30 portfolio. The benefit of such an allocation can be observed around mid-2015 when the performance of the EURO STOXX 50 Corporate Bond TR begins to flatten as a consequence of low to negative interest rates. The combined portfolio significantly outperforms the stand alone bond investment over this period.
But even in an environment with ultra-low interest environment poised to come to an end and economic growth and inflation gradually increasing, an allocation to market neutral style factors should be value adding. In such an environment, bond investors face severe performance headwinds. Diversifying their portfolios with market neutral factor indices will allow investment managers to better insulate their portfolios against these risks, whilst maintaining a similar risk profile.
Figure7: Annual and indexed returns of EURO STOXX 50 Corporate Bond TR index, iSTOXX Europe Multi-Factor Market Neutral
as well as a 70-30-weighted combination of EURO STOXX 50 Corporate Bond TR index returns iSTOXX Europe Multi-Factor
Market Neutral measured in EUR GR. Time period: Jan. 2011 to Apr. 2017.
To further illustrate the diversification benefits, Figure 8 plots both the returns and return/risk ratios for 11 different combinations of the market neutral multi factor and the bond index from (0% invested in the multi-factor to 100%). It is noteworthy that the return/risk ratio is maximized in the 10% - 30% (multi-factor allocation) range.
80
90
100
110
120
130
140
150
160
2011 2012 2013 2014 2015 2016 2017
EURO STOXX 50 Corporate Bond TR iSTOXX Europe Multi-Factor Market Neutral

STOXX LTD. 16
ISTOXX EUROPE FACTOR INDICES – HARVESTING EQUITY RETURNS WITH BOND-LIKE VOLATILITY
Figure 8: Based on weighted combinations of EURO STOXX 50 Corporate Bond TR index returns iSTOXX Europe Multi-Factor
Market Neutral measured in EUR GR. Time period: Jan. 2011 to Apr. 2017.
Another benefit of diversification is the reduction of sensitivities to common market risk, such as interest rate risk. We investigate the impact of including the factor index on the sensitivity to interest rates and credit spreads by performing regression analyses. The results of the regressions detailed in equations (1) and (2) for weekly changes in credit spreads (Bloomberg Euro Aggregate Corporate OAS Index) and changes in 3M Euro LIBOR are outlined in Table 6. We find that the iSTOXX® Europe Multi-Factor Market Neutral has no statistically significant sensitivity to either credit spreads or 3M LIBOR and hence adding it to the portfolio reduces the sensitivity to changes in credit spreads and 3M LIBOR by 49% and 22% respectively.
∆𝐼𝑉𝑡
𝐼𝑉𝑡= 𝛼𝐶𝑆 + 𝛽𝐶𝑆∆𝐶𝑆𝑡 + 𝜀𝑡 (1)
∆𝐼𝑉𝑡
𝐼𝑉𝑡= 𝛼𝐼𝑅 + 𝛽𝐼𝑅∆𝐼𝑅𝑡 + 𝜀𝑡 (2)
Where: IV: Index value (or portfolio value for 70/30 combined) CS: Credit Spread (Bloomberg Euro Aggregate Corporate OAS Index) IR: 3M Euro LIBOR β: Sensitivity to changes in explanatory variable
0%10%20%
30%40%
50%60%
70%80%
90%100%
0%
10%
20% 30%
40%50%
60%70%
80%90%
100%
0.00
0.50
1.00
1.50
2.00
2.50
3.0%
3.5%
4.0%
4.5%
5.0%
5.5%
6.0%
6.5%
7.0%
1.5% 2.0% 2.5% 3.0% 3.5% 4.0% 4.5% 5.0%
Ret
urn
/Ris
k R
atio
Ret
urn
s (A
nnual
ised
)
Volatility (Annualised)Returns (LHS) Return / Risk (RHS)

STOXX LTD. 17
ISTOXX EUROPE FACTOR INDICES – HARVESTING EQUITY RETURNS WITH BOND-LIKE VOLATILITY
Allocation Corp Bonds Allocation MN Multi Factor Beta (ΔCS) Beta (ΔIR)
100% 0% -0.92*** -6.12***
0% 100% 0.59 -1.60
70% 30% -0.47** -4.76 *** Table 6: Regression Results of combinations of EURO STOXX 50 Corporate Bond TR and iSTOXX Europe Multi-Factor Market
Neutral against changes in Bloomberg Euro Aggregate Corporate OAS Index and 3M Euro LIBOR. Returns are measured in EUR
GR. Time period: Jan. 2011 – Apr. 2017. (* significant at 10% level, ** significant at 5% level, *** significant at 1% level)
This further illustrates the diversification powers of the iSTOXX Europe Multi-Factor Market Neutral and highlights its potential to aid investors to insulate against risk posed by rising interest rates or widening credit spreads for example.

STOXX LTD. 18
ISTOXX EUROPE FACTOR INDICES – HARVESTING EQUITY RETURNS WITH BOND-LIKE VOLATILITY
6 Conclusion
The empirical results show that iSTOXX Europe Market Neutral Factor Indices provide significant excess returns relative to their benchmark over a sample period of twelve years. With correlations to the benchmark index STOXX Europe 600 ranging from a minimum of -0.62 (low risk factor) to a maximum of 0.06 (value factor), factor returns are found to also serve as a great source of diversification when used in addition to an existing investment in a broad European benchmark index such as the STOXX Europe 600. Low correlations among factor returns further add to the diversification potential when investing in more than just one factor index.
However, risk premia are found to vary significantly over time. This observation as well as the low correlation among factor returns provide the grounds for the construction of the iSTOXX Europe Multi-Factor index. Its innovative methodology leads to lower risk and higher returns compared to a heuristic, e.g. equally weighted aggregation of single factor indices.
Finally, iSTOXX Europe Market Neutral Factor indices are shown to be uncorrelated with traditional asset classes, and as a result can act as portfolio diversifier. This enables investors to include these indices in their portfolio in order to build better diversified portfolios with superior risk-return characteristics without adversely affecting the risk characteristics of their portfolios. Furthermore, the increased diversification can decrease sensitivities to common market risk factors (such as interest rate risk for bond portfolios).

STOXX LTD. 19
ISTOXX EUROPE FACTOR INDICES – HARVESTING EQUITY RETURNS WITH BOND-LIKE VOLATILITY
References
Carhart, M. M. (1997). On persistence in Mutual Fund Performance. Journal of Finance, 52 (1), 57-82.
Fama, E. F., and, K. R. French (1992). The Cross-Section of Expected Stock Returns. Journal of Finance, 47 (2), 427-465.
Lintner, J. (1965). The Valuation of Risk Assets and the Selection of Risky Investments in Stock Portfolios and Capital Budgets. Review of Economics and Statistics, 47 (1), 13-37.
Mossin, J. (1965). Equilibrium in a Capital Asset Market. Economitrica, 34 (4), 768-783.
Sharpe, W. (1964). A Theory of Market Equilibrium under Conditions of Risk. Journal of Finance, 19 (3), 425-442.

STOXX LTD. 20
ISTOXX EUROPE FACTOR INDICES – HARVESTING EQUITY RETURNS WITH BOND-LIKE VOLATILITY
Appendix A
Metrics underlying the factor construction
A.1 Carry
The carry factor is a composite of four measures:
A.1.1 𝑃𝑟𝑖𝑐𝑒 𝑡𝑜 𝑑𝑖𝑣𝑖𝑑𝑒𝑛𝑑 =𝑃𝑟𝑖𝑐𝑒
𝑑𝑖𝑣𝑖𝑑𝑒𝑛𝑑 𝑝𝑒𝑟 𝑠ℎ𝑎𝑟𝑒 𝑜𝑣𝑒𝑟 𝑡ℎ𝑒 𝑙𝑎𝑠𝑡 12 𝑚𝑜𝑛𝑡ℎ𝑠 ,
A.1.2 𝐼𝑛𝑡𝑒𝑟𝑛𝑎𝑙 𝑔𝑟𝑜𝑤𝑡ℎ = 𝑅𝑒𝑡𝑢𝑟𝑛 𝑜𝑛 𝑒𝑞𝑢𝑖𝑡𝑦 × 𝑃𝑎𝑦𝑜𝑢𝑡 𝑟𝑎𝑡𝑖𝑜 =𝐸𝑎𝑟𝑛𝑖𝑛𝑔𝑠
𝐵𝑜𝑜𝑘 𝑣𝑎𝑙𝑢𝑒× (1 −
𝐷𝑖𝑣𝑖𝑑𝑒𝑛𝑑 𝑝𝑒𝑟 𝑠ℎ𝑎𝑟𝑒
𝐸𝑎𝑟𝑛𝑖𝑛𝑔𝑠 𝑝𝑒𝑟 𝑠ℎ𝑎𝑟𝑒 𝑜𝑣𝑒𝑟 𝑡ℎ𝑒 𝑙𝑎𝑠𝑡 12𝑚) ,
A.1.3 𝐸𝑎𝑟𝑛𝑖𝑛𝑔𝑠 𝑑𝑖𝑠𝑝𝑒𝑟𝑠𝑖𝑜𝑛 = 𝑆𝑡𝑎𝑛𝑑𝑎𝑟𝑑 𝑑𝑒𝑣𝑖𝑎𝑡𝑖𝑜𝑛 𝑜𝑓 𝑒𝑎𝑟𝑛𝑖𝑛𝑔𝑠; 𝑡𝑖𝑚𝑒𝑤𝑒𝑖𝑔ℎ𝑡𝑒𝑑 𝑓𝑜𝑟𝑤𝑎𝑟𝑑 12 𝑚𝑜𝑛𝑡ℎ ,
A.1.4 𝑆ℎ𝑎𝑟𝑒𝑠 𝑜𝑢𝑡 𝑟𝑒𝑑𝑢𝑐𝑡𝑖𝑜𝑛 =𝐻𝑖𝑠𝑡𝑜𝑟𝑖𝑐𝑎𝑙 𝑐𝑜𝑚𝑚𝑜𝑛 𝑠ℎ𝑎𝑟𝑒𝑠 𝑑𝑒𝑐𝑟𝑒𝑎𝑠𝑒 𝑜𝑣𝑒𝑟 𝑙𝑎𝑠𝑡 24 𝑚𝑜𝑛𝑡ℎ𝑠
𝐶𝑜𝑚𝑚𝑜𝑛 𝑠ℎ𝑎𝑟𝑒𝑠 𝑜𝑢𝑡 .
A.2 Risk
The risk factor is a composite of three measures:
A.2.1 3𝑀 𝑣𝑜𝑙𝑎𝑡𝑖𝑙𝑖𝑡𝑦 = 𝑆𝑡𝑎𝑛𝑑𝑎𝑟𝑑 𝑑𝑒𝑣𝑖𝑎𝑡𝑖𝑜𝑛 𝑜𝑓 𝑟𝑒𝑡𝑢𝑟𝑛𝑠 𝑜𝑣𝑒𝑟 3 𝑚𝑜𝑛𝑡ℎ𝑠 ,
A.2.2 12𝑀 𝑣𝑜𝑙𝑎𝑡𝑖𝑙𝑖𝑡𝑦 = 𝑆𝑡𝑎𝑛𝑑𝑎𝑟𝑑 𝑑𝑒𝑣𝑖𝑎𝑡𝑖𝑜𝑛 𝑜𝑓 𝑟𝑒𝑡𝑢𝑟𝑛𝑠 𝑜𝑣𝑒𝑟 12 𝑚𝑜𝑛𝑡ℎ𝑠 ,
A.2.3 12𝑀 𝑠𝑒𝑚𝑖 𝑣𝑜𝑙𝑎𝑡𝑖𝑙𝑖𝑡𝑦 = 𝑆𝑒𝑚𝑖 𝑑𝑒𝑣𝑖𝑎𝑡𝑖𝑜𝑛 𝑜𝑓 𝑟𝑒𝑡𝑢𝑟𝑛𝑠 𝑜𝑣𝑒𝑟 12 𝑚𝑜𝑛𝑡ℎs.
A.3 Momentum
The momentum factor is a composite of two measures:
A.3.1 1M reversal = −𝑇 𝑉𝑎𝑙𝑢𝑒 of return index over 1 month ,
A.3.2 12M momentum = 𝑇 𝑉𝑎𝑙𝑢𝑒 of return index over 12 months .
A.4 Quality
The quality factor is a composite of five measures:
A.4.1 𝑂𝑝𝑒𝑟𝑎𝑡𝑖𝑛𝑔 𝑖𝑛𝑐𝑜𝑚𝑒 𝑡𝑜 𝑐𝑜𝑚𝑚𝑜𝑛 𝑒𝑞𝑢𝑖𝑡𝑦 =𝑂𝑝𝑒𝑟𝑎𝑡𝑖𝑛𝑔 𝑖𝑛𝑐𝑜𝑚𝑒
𝐶𝑜𝑚𝑚𝑜𝑛 𝑒𝑞𝑢𝑖𝑡𝑦, 𝑤ℎ𝑖𝑐ℎ 𝑏𝑒𝑐𝑜𝑚𝑒𝑠
𝑂𝑝𝑒𝑟𝑎𝑡𝑖𝑛𝑔 𝑖𝑛𝑐𝑜𝑚𝑒
𝑇𝑜𝑡𝑎𝑙 𝑎𝑠𝑠𝑒𝑡𝑠 𝑖𝑓 𝐶𝑜𝑚𝑚𝑜𝑛 𝑒𝑞𝑢𝑖𝑡𝑦 ≤ 0,
A.4.2 𝐶𝑎𝑠ℎ 𝑡𝑜 𝑐𝑢𝑟𝑟𝑒𝑛𝑡 𝑙𝑖𝑎𝑏𝑖𝑙𝑖𝑡𝑖𝑒𝑠 = −1 ×𝐶𝑎𝑠ℎ 𝑎𝑛𝑑 𝑒𝑞𝑢𝑖𝑣𝑎𝑙𝑒𝑛𝑡
𝐶𝑢𝑟𝑟𝑒𝑛𝑡 𝑙𝑖𝑎𝑏𝑖𝑙𝑖𝑡𝑖𝑒𝑠 ,

STOXX LTD. 21
ISTOXX EUROPE FACTOR INDICES – HARVESTING EQUITY RETURNS WITH BOND-LIKE VOLATILITY
A.4.3 𝑁𝑒𝑡 𝑒𝑥𝑡𝑒𝑟𝑛𝑎𝑙 𝑓𝑖𝑛𝑎𝑛𝑐𝑖𝑛𝑔 12𝑀 = −1 ×12𝑀∆ 𝑠ℎ 𝑜𝑢𝑡 × 12𝑀 𝑎𝑣𝑒𝑟𝑎𝑔𝑒 𝑝𝑟𝑖𝑐𝑒 + 12𝑀∆ 𝑙𝑜𝑛𝑔 𝑑𝑒𝑏𝑡 + 12𝑀∆ 𝑠ℎ𝑜𝑟𝑡 𝑑𝑒𝑏𝑡 + 12𝑀 ∆ 𝑝𝑟𝑒𝑓 𝑠𝑡𝑜𝑐𝑘𝑠
12𝑀𝐴𝑣𝑒𝑟𝑎𝑔𝑒 𝑡𝑜𝑡𝑎𝑙 𝑎𝑠𝑠𝑒𝑡𝑠 ,
with,
12𝑀 ∆ 𝑠ℎ 𝑜𝑢𝑡 = 𝑆ℎ𝑎𝑟𝑒𝑠 𝑜𝑢𝑡𝑠𝑡𝑎𝑛𝑑𝑖𝑛𝑔𝑡0− 𝑆ℎ𝑎𝑟𝑒𝑠 𝑜𝑢𝑡𝑠𝑡𝑎𝑛𝑑𝑖𝑛𝑔𝑡0−12𝑚𝑜𝑛𝑡ℎ ,
12𝑀 ∆ 𝑙𝑜𝑛𝑔 𝑑𝑒𝑏𝑡 = 𝐿𝑜𝑛𝑔 𝑑𝑒𝑏𝑡𝑡0− 𝐿𝑜𝑛𝑔 𝑑𝑒𝑏𝑡𝑡0−12𝑚𝑜𝑛𝑡ℎ ,
12𝑀 ∆ 𝑠ℎ𝑜𝑟𝑡 𝑑𝑒𝑏𝑡 = 𝑆ℎ𝑜𝑟𝑡 𝑑𝑒𝑏𝑡𝑡0− 𝑆ℎ𝑜𝑟𝑡 𝑑𝑒𝑏𝑡𝑡0−12𝑚𝑜𝑛𝑡ℎ,
12𝑀 ∆ 𝑝𝑟𝑒𝑓 𝑠𝑡𝑜𝑐𝑘𝑠 = 𝑃𝑟𝑒𝑓𝑒𝑟𝑟𝑒𝑑 𝑠𝑡𝑜𝑐𝑘𝑠𝑡0− 𝑃𝑟𝑒𝑓𝑒𝑟𝑟𝑒𝑑 𝑠𝑡𝑜𝑐𝑘𝑠𝑡0−12𝑚𝑜𝑛𝑡ℎ,
12𝑀 𝑎𝑣𝑒𝑟𝑎𝑔𝑒 𝑝𝑟𝑖𝑐𝑒 = 𝐴𝑣𝑒𝑟𝑎𝑔𝑒 𝑝𝑟𝑖𝑐𝑒 𝑖𝑛 𝑙𝑜𝑐𝑎𝑙 𝑐𝑢𝑟𝑟𝑒𝑛𝑐𝑦 𝑤𝑖𝑡ℎ 𝑚𝑜𝑛𝑡ℎ𝑙𝑦 𝑜𝑏𝑠𝑒𝑟𝑣𝑎𝑡𝑖𝑜𝑛𝑠,
12𝑀𝐴𝑣𝑒𝑟𝑎𝑔𝑒 𝑡𝑜𝑡𝑎𝑙 𝑎𝑠𝑠𝑒𝑡𝑠 = 𝐴𝑣𝑒𝑟𝑎𝑔𝑒 𝑡𝑜𝑡𝑎𝑙 𝑎𝑠𝑠𝑒𝑡𝑠 𝑖𝑛 𝑙𝑜𝑐𝑎𝑙 𝑐𝑢𝑟𝑟𝑒𝑛𝑐𝑦 𝑤𝑖𝑡ℎ 𝑞𝑢𝑎𝑟𝑡𝑒𝑟𝑙𝑦 𝑜𝑏𝑠𝑒𝑟𝑣𝑎𝑡𝑖𝑜𝑛𝑠,
A.4.4 𝐶𝑜𝑣𝑒𝑟𝑎𝑔𝑒 = 𝐶𝑜𝑚𝑝𝑜𝑠𝑖𝑡𝑒 (𝐸𝐵𝐼𝑇
𝐼𝑛𝑡𝑒𝑟𝑒𝑠𝑡 𝑝𝑎𝑦𝑚𝑒𝑛𝑡𝑠;
𝐸𝐵𝐼𝑇
𝑇𝑜𝑡𝑎𝑙 𝑑𝑒𝑏𝑡;
𝐶𝐹𝑂
𝐼𝑛𝑡𝑒𝑟𝑒𝑠𝑡 𝑝𝑎𝑦𝑚𝑒𝑛𝑡𝑠;
𝐶𝐹𝑂
𝑇𝑜𝑡𝑎𝑙 𝑑𝑒𝑏𝑡) .
A.4.5 Accruals quality = 12M∆NetOperatingAssets
Total Assets ,
with,
12𝑀 ∆ 𝑛𝑒𝑡 𝑜𝑝𝑒𝑟𝑎𝑡𝑖𝑛𝑔 𝑎𝑠𝑠𝑒𝑡𝑠 = 𝑁𝑒𝑡 𝑜𝑝𝑒𝑟𝑎𝑡𝑖𝑛𝑔 𝑎𝑠𝑠𝑒𝑡𝑠𝑡0− 𝑁𝑒𝑡 𝑜𝑝𝑒𝑟𝑎𝑡𝑖𝑛𝑔 𝑎𝑠𝑠𝑒𝑡𝑠𝑡0−12𝑚𝑜𝑛𝑡ℎ ,
with,
𝑁𝑒𝑡 𝑜𝑝𝑒𝑟𝑎𝑡𝑖𝑛𝑔 𝑎𝑠𝑠𝑒𝑡𝑠 = 𝑇𝑜𝑡𝑎𝑙 𝑎𝑠𝑠𝑒𝑡𝑠 − 𝐶𝑎𝑠ℎ − 𝑇𝑜𝑡𝑎𝑙 𝑙𝑖𝑎𝑏𝑖𝑡𝑖𝑙𝑖𝑡𝑖𝑒𝑠 + 𝑆ℎ𝑜𝑟𝑡 𝑑𝑒𝑏𝑡 + 𝐿𝑜𝑛𝑔 𝑑𝑒𝑏𝑡 .
A.5 Size
The size factor is a composite of two measures:
A.5.1 Inverse MCAP = −1 ∗ Market capitalization ,
A.5.2 Inverse EV = −1 ∗ (Market capitalization at end of fiscal year + Preferred stocks + Minority interest + Total debt - Cash) .
A.6 Value
The value factor is a composite of two measures:
A.6.1 𝐹𝑜𝑟𝑤𝑎𝑟𝑑 12𝑀 𝑒𝑎𝑟𝑛𝑖𝑛𝑔𝑠 𝑦𝑖𝑒𝑙𝑑; 𝑟𝑒𝑝𝑙𝑎𝑐𝑒𝑑 𝑤𝑖𝑡ℎ 𝐶𝑎𝑠ℎ 𝑓𝑙𝑜𝑤𝑠 𝑓𝑟𝑜𝑚 𝑜𝑝𝑒𝑟𝑎𝑡𝑖𝑜𝑛𝑠
𝑇𝑜𝑡𝑎𝑙 𝑠𝑠𝑠𝑒𝑡𝑠 𝑖𝑓 𝑛𝑒𝑔𝑎𝑡𝑖𝑣𝑒 ,
A.6.2 𝐶𝑎𝑠ℎ 𝑓𝑙𝑜𝑤 𝑦𝑖𝑒𝑙𝑑; 𝑟𝑒𝑝𝑙𝑎𝑐𝑒𝑑 𝑤𝑖𝑡ℎ 𝐶𝑎𝑠ℎ 𝑓𝑙𝑜𝑤𝑠 𝑓𝑟𝑜𝑚 𝑜𝑝𝑒𝑟𝑎𝑡𝑖𝑜𝑛𝑠
𝑇𝑜𝑡𝑎𝑙 𝑎𝑠𝑠𝑒𝑡𝑠 𝑖𝑓 𝑛𝑒𝑔𝑎𝑡𝑖𝑣𝑒 .

STOXX LTD. 22
ISTOXX EUROPE FACTOR INDICES – HARVESTING EQUITY RETURNS WITH BOND-LIKE VOLATILITY
Appendix B
Figure A.1: Average correlations among factor returns from the perspective of each factor to all other five factors. Correlations are
based on weekly EUR gross returns measured over a 52-week time-period. Time period: Jul. 2010 - Mar. 2017.
Figure A.2: Correlations of carry factor to all other factors. Correlations are based on weekly EUR gross returns measured over a
52-week time-period. Time period: Jul. 2010 - Mar. 2017.
-0.1
0
0.1
0.2
0.3
0.4
0.5
0.6
0.7
7/2011 1/2012 7/2012 1/2013 7/2013 1/2014 7/2014 1/2015 7/2015 1/2016 7/2016 1/2017
Average Correlations
Carry Low Risk Momentum Quality Size Value
-0.4
-0.2
0
0.2
0.4
0.6
0.8
1
7/2011 1/2012 7/2012 1/2013 7/2013 1/2014 7/2014 1/2015 7/2015 1/2016 7/2016 1/2017
Correlation to Carry Factor
Low Risk Momentum Quality Size Value
STOXX LTD. 23
ISTOXX EUROPE FACTOR INDICES – HARVESTING EQUITY RETURNS WITH BOND-LIKE VOLATILITY
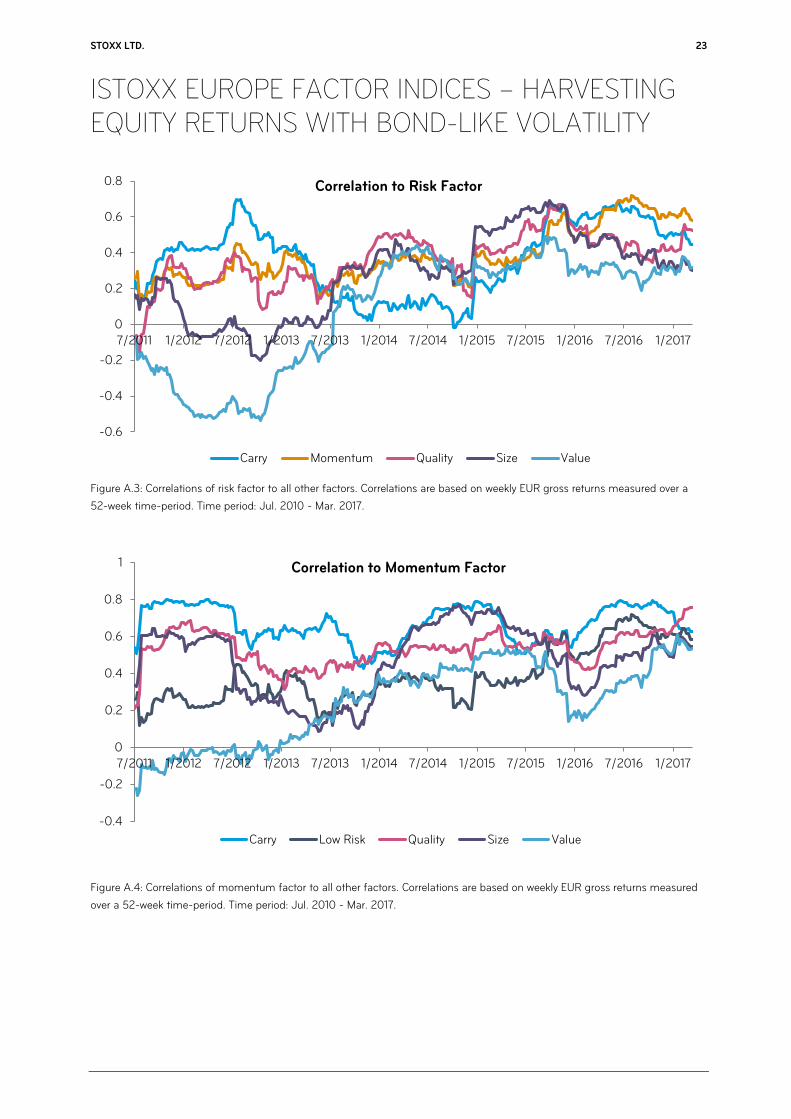
Figure A.3: Correlations of risk factor to all other factors. Correlations are based on weekly EUR gross returns measured over a
52-week time-period. Time period: Jul. 2010 - Mar. 2017.
Figure A.4: Correlations of momentum factor to all other factors. Correlations are based on weekly EUR gross returns measured
over a 52-week time-period. Time period: Jul. 2010 - Mar. 2017.
-0.6
-0.4
-0.2
0
0.2
0.4
0.6
0.8
7/2011 1/2012 7/2012 1/2013 7/2013 1/2014 7/2014 1/2015 7/2015 1/2016 7/2016 1/2017
Correlation to Risk Factor
Carry Momentum Quality Size Value
-0.4
-0.2
0
0.2
0.4
0.6
0.8
1
7/2011 1/2012 7/2012 1/2013 7/2013 1/2014 7/2014 1/2015 7/2015 1/2016 7/2016 1/2017
Correlation to Momentum Factor
Carry Low Risk Quality Size Value

STOXX LTD. 24
ISTOXX EUROPE FACTOR INDICES – HARVESTING EQUITY RETURNS WITH BOND-LIKE VOLATILITY
Figure A.5: Correlations of quality factor to all other factors. Correlations are based on weekly EUR gross returns measured over a
52-week time-period. Time period: Jul. 2010 - Mar. 2017.
Figure A.6: Correlations of size factor to all other factors. Correlations are based on weekly EUR gross returns measured over a
52-week time-period. Time period: Jul. 2010 - Mar. 2017.
-0.4
-0.2
0
0.2
0.4
0.6
0.8
1
7/2011 1/2012 7/2012 1/2013 7/2013 1/2014 7/2014 1/2015 7/2015 1/2016 7/2016 1/2017
Correlation to Quality Factor
Carry Low Risk Momentum Size Value
-0.4
-0.2
0
0.2
0.4
0.6
0.8
1
7/2011 1/2012 7/2012 1/2013 7/2013 1/2014 7/2014 1/2015 7/2015 1/2016 7/2016 1/2017
Correlation to Size Factor
Carry Low Risk Momentum Quality Value

STOXX LTD. 25
ISTOXX EUROPE FACTOR INDICES – HARVESTING EQUITY RETURNS WITH BOND-LIKE VOLATILITY
Figure A.7: Correlations of value factor to all other factors. Correlations are based on weekly EUR gross returns measured over a
52-week time-period. Time period: Jul. 2010 - Mar. 2017.
-0.8
-0.6
-0.4
-0.2
0
0.2
0.4
0.6
0.8
1
7/2011 1/2012 7/2012 1/2013 7/2013 1/2014 7/2014 1/2015 7/2015 1/2016 7/2016 1/2017
Correlations to Value Factor
Carry Low Risk Momentum Quality Size

STOXX LTD. 26
ISTOXX EUROPE FACTOR INDICES – HARVESTING EQUITY RETURNS WITH BOND-LIKE VOLATILITY
About STOXX Limited
STOXX Ltd. is a global index provider, currently calculating a global, comprehensive index family of over 7,000 strictly rules-based and transparent indices. Best known for the leading European equity indices EURO STOXX 50, STOXX Europe 50 and STOXX Europe 600, STOXX Ltd. maintains and calculates the STOXX Global index family which consists of total market, broad and blue-chip indices for the regions Americas, Europe, Asia/Pacific and sub-regions Latin America and BRIC (Brazil, Russia, India and China) as well as global markets.
To provide market participants with optimal transparency, STOXX indices are classified into three categories. Regular “STOXX” indices include all standard, theme and strategy indices that are part of STOXX’s integrated index family and follow a strict rules-based methodology. The “iSTOXX” brand typically comprises less standardized index concepts that are not integrated in the STOXX Global index family, but are nevertheless strictly rules-based. While indices that are branded “STOXX” and “iSTOXX” are developed by STOXX for a broad range of market participants, the “STOXX Customized” brand covers indices that are specifically developed for clients and do not carry the STOXX brand in the index name.
STOXX indices are licensed to more than 500 companies around the world as underlyings for Exchange Traded Funds (ETFs), futures and options, structured products and passively managed investment funds. Three of the top ETFs in Europe and approximately 25% of all assets under management are based on STOXX indices. STOXX Ltd. holds Europe's number one and the world's number two position in the derivatives segment.
STOXX is part of Deutsche Börse Group, and markets the DAX indices.
www.stoxx.com
STOXX LTD. 27
ISTOXX EUROPE FACTOR INDICES – HARVESTING EQUITY RETURNS WITH BOND-LIKE VOLATILITY
CONTACTS
Manessetrasse 85 CH-8045 Zurich P +41 (0)43 430 7160 [email protected] www.stoxx.com Frankfurt: +49 (0)69 211 13243 London: +44 (0)20 7862 7680 New York: +1 212 669 6426 Tokyo: +81-3-4578-6688 Sydney: +61 2 9089 8844
INNOVATIVE. GLOBAL. INDICES. STOXX is part of Deutsche Börse Group
STOXX Ltd. is part of Deutsche Börse Group. ©STOXX 2015. All Rights Reserved. STOXX research reports are for informational purposes only and do not constitute investment advice or an offer to sell or the solicitation of an offer to buy any security of any entity in any jurisdiction. Although the information herein is believed to be reliable and has been obtained from sources believed to be reliable, we make no representation or warranty, expressed or implied, with respect to the fairness, correctness, accuracy, reasonableness or completeness of such information. No guarantee is made that the information in this report is accurate or complete, and no warranties are made with regard to the results to be obtained from its use. STOXX Ltd. will not be liable for any loss or damage resulting from information obtained from this report. Furthermore, past performance is not necessarily indicative of future results. Exposure to an asset class, a sector, a geography or a strategy represented by an index can be achieved either through a replication of the list of constituents and their respective weightings or through investable instruments based on that index. STOXX Ltd. does not sponsor, endorse, sell, promote or manage any investment product that seeks to provide an investment return based on the performance of any index. STOXX Ltd. makes no assurance that investment products based on any STOXX index will accurately track the performance of the index itself or return positive performance. The views and opinions expressed in this research report are those of the author and do not necessarily represent the views of STOXX Ltd. This report is for individual and internal use only. It may not be reproduced or transmitted in whole or in part by any means—electronic, mechanical, photocopying or otherwise—without STOXX's prior written approval. No guarantee is made that the information in this report is accurate or complete and no warranties are made with regard to the results to be obtained from its use. STOXX Ltd. will not be liable for any loss or damage resulting from information obtained from this report. Furthermore, past performance is not necessarily indicative of future results. The views and opinions expressed in this research report are those of the author and do not necessarily represent the views of STOXX Ltd. This report is for individual and internal use only. It may not be reproduced or transmitted in whole or in part by any means, electronic, mechanical, photocopying, or otherwise, without STOXX's prior written approval.