IST-2003-507581 WINNER D2.10 v1.0 Final report on ...
180
WINNER D2.10 v1.0 Page 1 (180) IST-2003-507581 WINNER D2.10 v1.0 Final report on identified RI key technologies, system concept, and their assessment Contractual Date of Delivery to the CEC: Month 24 Actual Date of Delivery to the CEC: 23/12/2005 Author(s): Johan Axnäs, Karsten Brüninghaus, Martin Döttling, Kari Kalliojärvi, Vaia Sdralia, Kai-Erik Sunell, Mikael Sternad, Ernesto Zimmermann (editors; see author list for full set of authors) Participant(s): AAU, ACL, CTH, CTH/UU, CTTC, CU, DLR, DoCoMo, EAB, FTR&D, IBM, KTH, LUK, MOT, NTUA, NOK, NOKCH, RWTH, PRL, PUT, SEUK, SM, SM/BenQ, SM/RMR, SM/TUB, SM/TUD, SM/TUHH, SM/UU, TID, TUD, TUI, UniS, UOULU Workpackage: WP2 – Radio Interface Estimated person months: 210 Security: PU Nature: R Version: 1.0 Total number of pages: 18080 Abstract: A radio-interface concept for a ubiquitous WINNER radio system is presented and assessed, both in terms of performance and in terms of implementation complexity. The developed radio-interface concept is a packet-oriented, user-centric, always-best concept targeting 100 Mbps sector-throughput for wide-area coverage and 1 Gbps for local-area coverage. It defines a scalable and flexible radio interface based on adaptive and compatible system modes that are tailored to particular situations such as the radio environment, the usage scenario, the economic model, etc. In contrast to the deliverable D7.6, which focuses on the functional architecture of the overall WINNER system concept, and D3.5, which describes protocols and deployment concepts, the present deliverable focuses on the actual design of the radio interface, primarily its lower layers, in order to enable optimisation and evaluation of performance. Results of extensive simulations on link, multi-link, and system levels are presented, supporting important system design choices, exemplifying favourable configurations of the radio interface in different scenarios, and providing an initial system performance estimation. Analyses of system complexity and implementation issues are found not to reveal any major showstoppers that would prevent a cost-efficient implementation at the time of deployment of the WINNER system. Keyword list: radio interface, physical layer, channel coding, duo-binary turbo codes, LDPCC, pilot grid, self-organised synchronisation, CP-OFDM, adaptive transmission, relays, medium access control, spatial processing, multi-antenna systems, radio resource management, implementation complexity, simulations, multiple access, generalised multi-carrier, serial modulation, time-frequency chunks Disclaimer:
Transcript of IST-2003-507581 WINNER D2.10 v1.0 Final report on ...
WINNER D210 v10
Page 1 (180)
IST-2003-507581 WINNER D210 v10
Final report on identified RI key technologies system concept and their assessment
Contractual Date of Delivery to the CEC Month 24
Actual Date of Delivery to the CEC 23122005
Author(s) Johan Axnaumls Karsten Bruumlninghaus Martin Doumlttling Kari Kalliojaumlrvi Vaia Sdralia Kai-Erik Sunell Mikael Sternad Ernesto Zimmermann (editors see author list for full set of authors)
Participant(s) AAU ACL CTH CTHUU CTTC CU DLR DoCoMo EAB FTRampD IBM KTH LUK MOT NTUA NOK NOKCH RWTH PRL PUT SEUK SM SMBenQ SMRMR SMTUB SMTUD SMTUHH SMUU TID TUD TUI UniS UOULU
Workpackage WP2 ndash Radio Interface
Estimated person months 210
Security PU
Nature R
Version 10
Total number of pages 18080
Abstract A radio-interface concept for a ubiquitous WINNER radio system is presented and assessed both in terms of performance and in terms of implementation complexity The developed radio-interface concept is a packet-oriented user-centric always-best concept targeting 100 Mbps sector-throughput for wide-area coverage and 1 Gbps for local-area coverage It defines a scalable and flexible radio interface based on adaptive and compatible system modes that are tailored to particular situations such as the radio environment the usage scenario the economic model etc In contrast to the deliverable D76 which focuses on the functional architecture of the overall WINNER system concept and D35 which describes protocols and deployment concepts the present deliverable focuses on the actual design of the radio interface primarily its lower layers in order to enable optimisation and evaluation of performance Results of extensive simulations on link multi-link and system levels are presented supporting important system design choices exemplifying favourable configurations of the radio interface in different scenarios and providing an initial system performance estimation Analyses of system complexity and implementation issues are found not to reveal any major showstoppers that would prevent a cost-efficient implementation at the time of deployment of the WINNER system
Keyword list radio interface physical layer channel coding duo-binary turbo codes LDPCC pilot grid self-organised synchronisation CP-OFDM adaptive transmission relays medium access control spatial processing multi-antenna systems radio resource management implementation complexity simulations multiple access generalised multi-carrier serial modulation time-frequency chunks
Disclaimer
WINNER D210 v10
Page 2 (180)
Executive Summary The objective of WP2 and this final deliverable is to identify key technologies for a future broadband radio interface to develop basic concepts based on these technologies that will lead to a ubiquitous radio system concept and perform assessments thereof This is an inherently iterative process determined not only by pure technical considerations but also by regulatory and other decisions and restrictions The snapshot provided in the present deliverable will be further refined and adapted to various external conditions during WINNER Phase II The present deliverable differs from the overall concept description given in deliverable D76 in that it primarily focuses on lower layers goes more into technical depth and contains extensive results of simulations and other evaluations in addition to the concept description
The developed WINNER radio interface concept is a packet-oriented user-centric always-best concept It defines a scalable flexible and efficient radio interface A tool for obtaining such flexibility is to define a small number of compatible system modes that provide a unified interface to higher layers and implement tailored solutions Within the modes parameterisations can be used to provide added flexibility and maximum efficiency depending on the particular radio environment usage scenario economic model etc The always-best solution is further supported by the flexible protocol architecture of the WINNER radio interface and incorporates mechanisms for both long-term and short-term adaptation Both relaying and advanced spatial processing are integrated parts of the system architecture
The WINNER radio interface targets fulfilment of the ITU-R M1645 recommendation according to the views and amendments specified in the WINNER deliverable D71 In order to enable detailed system design and appropriate optimisations the general and user-oriented requirements of D71 have been mapped onto more technically oriented design targets on the radio interface for different application scenarios under consideration by WINNER
The physical layer of the WINNER radio interface uses generalised multi-carrier (GMC) as the transmission format as this technique enables flexible switching between different forms of multi-carrier and (frequency-domain generated) serial modulation Specifically GMC configured as standard cyclic-prefix (CP) OFDM is the preferred option for downlink as well as uplink transmission when terminal power consumption is not a limiting factor (eg in short-range scenarios) For all other cases GMC configured as serial modulation is the preferred option (mainly in the uplink for wide area coverage) The resource allocation in the physical layer is based on a slotted time-frequency chunk pattern that can be adjusted to different propagation scenarios The chunk and frame durations are short to ensure a low transmission delay over the radio interface (less than 1 ms) In the case of spatial reuse of resources each chunk contains several chunk layers Adaptive modulation supports higher-order modulation up to 64-QAM and even 256-QAM in short range connections and uses Gray labelling Forward error correction coding is based on (quasi-cyclic) block low-density parity-check codes for large code-blocks Duo-binary turbo codes are additionally considered for medium and smaller block sizes Convolutional codes are currently foreseen only for very short block lengths (less than 200 information bits)
Generic and baseline transceiver structures have been developed including a flexible spatial processing architecture which enables multi-user spatial domain link adaptation based on the following basic components (linear) dispersion codes directive transmission (beamforming) per stream rate control and multi-user precoding This architecture exploits the spatial processing gains (ie spatial diversity SDMA spatial multiplexing and interference control) in flexible combinations as required by different scenarios Apart from the generic architecture a baseline implementation using adaptive modulation linear dispersion codes and linear precoding is also provided
The WINNER radio interface uses a scattered pilot grid that supports efficient channel estimation also on chunk basis with very low overhead Spatial processing on the one hand limits the potential reuse of pilots for different purposes and on the other hand introduces additional requirements A classification of pilot types including the effects of spatial processing is provided The cyclic prefix is used to achieve coarse synchronisation (ie on OFDM-symbol level) Training symbols at the beginning of the super-frame enable inter-cell synchronisation also when no global timing reference (eg GPS Galileo) is available Efficient means have been developed for compressing the channel quality information feedback required for adaptive transmission and the channel state information required for some multi-antenna schemes These methods reduce the required feedback overhead to reasonable levels
The WINNER concept is designed for large bandwidth flexibility and is duplex neutral there is a time-division duplex (TDD) solution available for use in unpaired spectrum and a frequency-division duplex (FDD) solution for paired spectrum
WINNER D210 v10
Page 3 (180)
The medium access control (MAC) system layer of the proposed WINNER radio interface allocates the time-frequency-spatial resources to packet flows Its key element is a resource scheduler which is assumed to be physically located close to or within each base station and relay node Functionality for handling and formulating constraints on the allocation to be performed by the resource scheduler is also parts of the MAC system layer Packets arrive at the MAC in different transport channels intended for control broadcast contention-based traffic scheduled point-to-point and scheduled point-to-multipoint traffic The MAC performs resource allocation on two time scales
(1) Resource partitioning on a time scale of the super-frame (5ndash10 ms) The overall allocation of time-frequency-spatial resources to different transport channels is adjusted on this time scale based on the aggregated demand within each transport channel Unused guard chunks used for interference avoidance and spectrum sharing are also reserved
(2) Resource scheduling for the scheduled flows on the time scale of the slot (034 ms) The scheduled flows are allocated to time-frequency-spatial resources available for this purpose in the super-frame There are two options (algorithm variants) for performing resource scheduling adaptive allocation and non-frequency-adaptive allocation With adaptive allocation individual time-frequency chunks can be allocated to different flows Fast link adaptation is performed within each chunk based on predictions of the channel quality This method offers maximal performance and a high potential for multi-user diversity gains but it cannot be used at high interference levels and high vehicular velocities A general framework for adaptive resource scheduling is outlined that enables the allocation to be performed with reasonable complexity With non-frequency-adaptive allocation bits from each flow are allocated onto sets of chunks that are dispersed in frequency Coding and interleaving is used here to combat frequency selective fading Link adaptation may be performed with respect to shadow fading but not with respect to frequency-selective fading This method is required for control signalling and is the primary method in the case of point-to-multipoint transmission It offers a robust option for scheduled flows and also serves as a fallback solution for adaptive scheduling The resource scheduling (adaptive as well as non-frequency adaptive) is fast offering around 1 ms minimum delay over the radio interface
The user plane of the MAC system layer can be outlined as follows for the downlink The arriving packets are separated into retransmission units that are coded The coded blocks denoted FEC blocks are buffered with per-flow queuing The scheduler allocates resources to flows and then drains the queues with bit-level granularity to fill the allocated chunks Contention-based uplink transmission and peer-to-peer communication use a separate set of subcarriers Cell-wide broadcast messages utilise a set of broadcast OFDM symbols that are located in the preamble of each super-frame
The choice of multiple access method is intimately connected to the problems of resource partitioning and resource scheduling For adaptively allocated flows TDMAOFDMA is used In the baseline design individual chunks are exclusively allocated to flows For non-frequency-adaptively allocated flows mapping a flow on a set of chunks would provide insufficient diversity for small packets The preferred options for solving this problem are presented The problem of integrating SDMA with the studied time-frequency based multiple access schemes is also discussed
Radio resource management (RRM) has the overall goal of utilising the given radio resources in an effi-cient manner The RRM functions are divided into mode-specific RRM functions that are targeted and optimised for a specific system mode and deployment scenario mode-generic RRM functions that are shared between the different WINNER system modes or used for their coordination and cooperative RRM functions which are used for the cooperation of the WINNER system with legacy RANs such as UMTS (including 3GPP long-term evolution) and WLAN An initial set of algorithms for the RRM functions studied within the WINNER framework is described including spectrum mapping and allocation service level controller mode and RAN selection handover admission control load sharingcongestion control and routing The location of these RRM algorithms within the RAN architecture is an essential issue It is envisioned that for the WINNER system with its multiple system modes a hybrid (hierarchical) approach could be suitable where different decision levels of the same RRM functionality that work at different time scales are located in different nodes Finally a first approach to the RRC signalling and a survey of required measurements reports is presented
Extensive performance assessments of the current WINNER concept and variants thereof have been performed through simulations Results are presented for link multi-link and system levels The insight obtained by such simulations supports important system design choices allows identification of favourable configurations of the radio interface and allowed initial system performance estimation Comparisons with other systems and technologies are made where appropriate Implementation impact and performance-complexity trade-offs have been analysed in depth in earlier WINNER deliverables and an overview is contained in this deliverable including electromagnetic field (EMF) exposure aspects
WINNER D210 v10
Page 4 (180)
Authors Partner Name Phone Fax E-mail
AAU Albena Mihovska Phone +45 96358639
Fax +45 98151583
E-mail albenakomaucdk
ACL Thorsten Wild Phone +49 711 821 35762
Fax +49 711 821 32185
E-mail thorstenwildalcatelde
CTH Tommy Svensson Phone +46 31 772 1823
Fax +46 31 772 1782
E-mail tommysvenssons2chalmersse
CTHUU Mikael Sternad Phone +46 704 250 354
Fax +46 18 555096
E-mail mikaelsternadsignaluuse
CTTC Monica Navarro Phone +34 93 645 2915
Fax +34 93 645 2901
E-mail monicanavarrocttces
Stephan Pfletschinger E-mail stephanpfletschingercttces
CU David Falconer Phone +1 613 520 5722
Fax +1 613 520 5727
E-mail ddfscecarletonca
Chan Tong Lam E-mail lamcsangamscecarletonca
Florence Danilo-Lemoine Phone +1 613 520 2600 ext 5691
Fax +1 613 520 5727
E-mail fdaniloscecarletonca
WINNER D210 v10
Page 5 (180)
DLR Armin Dammann Phone +49 8153 28 2871
Fax +49 8153 28 1871
E-mail armindammanndlrde
Simon Plass Phone +49 8153 28 2874
Fax +49 8153 28 1871
E-mail simonplassdlrde
DoCoMo Gunther Auer Phone +49 89 5682 4219
Fax +49 89 5682 4301
E-mail auerdocomolab-eurocom
Jeacuterocircme Bonnet Phone +49 89 5682 4229
Fax +49 89 5682 4301
E-mail bonnetdocomolab-eurocom
EAB David Asteacutely Phone +46 8 585 301 49
Fax +46 8 585 314 80
E-mail davidastelyericssoncom
Johan Axnaumls Phone +46 8 404 38 59
Fax +46 8 585 314 80
E-mail johanaxnasericssoncom
Niklas Johansson Phone +46 8 508 77860
Fax +46 8 7575720
E-mail niklasjJohanssonericssoncom
Goumlran Klang Phone +46 8 404 4794
Fax +46 8 585 314 80
E-mail gorannklangericssoncom
Magnus Olsson Phone +46 8 585 307 74
Fax +46 8 585 314 80
E-mail magnusaolssonericssoncom
Per Skillermark Phone +46 8 58531922
Fax +46 8 7575720
E-mail perskillermarkericssoncom
Kai-Erik Sunell Phone +46 8 757 35 61
Fax +46 8 585 314 80
E-mail kai-eriksunellericssoncom
WINNER D210 v10
Page 6 (180)
FTRampD Marie-Heacutelegravene Hamon Phone +33 2 99 12 48 73
Fax +33 2 99 12 40 98
E-mail mhelenehamonfrancetelecomcom
Rodolphe Legouable E-mail rodolphelegouablefrancetelecomcom
Mylegravene Pischella Phone +33 1 452 98 963
Fax +33 1 452 94 194
E-mail mylenepischellafrancetelecomcom
Thomas Saumllzer E-mail thomassalzerfrancetelecomcom
IBM Pedro Coronel Phone +41 1 724 8532
Fax +41 1 724 8955
E-mail pcozurichibmcom
Wolfgang Schott Phone +41 1 724 8476
Fax +41 1 724 8955
E-mail sctzurichibmcom
KTH Mats Bengtsson Phone +46 8 790 8463
Fax +46 8 790 7260
E-mail matsbengtssons3kthse
LUK Angeliki Alexiou Phone +44 1793 776620
Fax +44 1793 776725
E-mail alexioulucentcom Abdelkader Medles Phone +44 1793 776783
Fax +44 1793 776725
E-mail medleslucentcom
MOT Markus Muck Phone +33 1 6935 2573
Fax +33 1 6935 7701
E-mail MarkusMuckmotorolacom
WINNER D210 v10
Page 7 (180)
NTUA Elias Tragos Phone +302107721511
Fax +302107722534
E-mail etragostelecomntuagr
NOK Carl Eklund Phone +358 50 4836566
Fax +358 7180 36067
E-mail carleklundnokiacom
Kari Kalliojaumlrvi Phone +358 50 4836232
Fax +358 7180 35935
E-mail karikalliojarvinokiacom
Antti Sorri Phone +358 50 4821294
Fax +358 7180 36857
E-mail anttisorrinokiacom
Samuli Visuri Phone +358 50 4868219
Fax +358 7180 36857
E-mail samulivisurinokiacom
NOKCH Yong Teng Phone +86 10 65392828 2753
Fax +86 10 84210576
E-mail yongtengnokiacom
RWTH Ole Klein Phone +49 241 80 28575
Fax +49 241 80 22242
E-mail olekleincomnetsrwth-aachende
Ralf Pabst Phone +49 241 80 25828
Fax +49 241 80 22242
E-mail pabcomnetsrwth-aachende
PRL Keith Roberts Phone +44 1293 815754
Fax +44 1293 815024
E-mail keithrobertsphilipscom
WINNER D210 v10
Page 8 (180)
PUT Zbigniew Dlugaszewski Phone +48 61 665 3916
Fax +48 61 665 2572
E-mail zdlugaszetputpoznanpl
Adam Piatyszek Phone +48 61 665 3936
Fax +48 61 665 2572
E-mail adampiatyszeketputpoznanpl
Michal Wodczak Phone +48 61 665 3913
Fax +48 61 665 2572
E-mail mwodczaketputpoznanpl
SEUK Thierry Lestable Phone +44 1784 428600 Ext720
Fax +44 1784 428624
E-mail thierrylestablesamsungcom
Vaia Sdralia Phone +44 1784 428600
Fax +44 1784 428629
E-mail vaiasdraliasamsungcom
SM Elena Costa Phone +49 89 636 44812
Fax +49 89 636 45591
E-mail elenacostasiemenscom
Martin Doumlttling Phone +49 89 636 73331
Fax +49 89 636 1373331
E-mail martindoettlingsiemenscom
Joumlrn von Haumlfen Phone +49 89 636 46228
Fax +49 89 722 13034834
E-mail joernvon_haefensiemenscom
Eiman Mohyeldin Phone +49 89 636 45340
Fax +49 89 636 45591
E-mail eimanmohyeldinsiemenscom
SMBenQ Mobile Karsten Bruumlninghaus Phone +49 2842 95 1742
Fax +49 2842 95 3387
E-mail karstenbrueninghausbenqcom
WINNER D210 v10
Page 9 (180)
SMRMR Bill lsquoXinqunrsquo Liu Phone +44 1794 833547
Fax +44 1794 833586
E-mail xinqunliurokecouk
David Thomas Phone +44 1794 833431
Fax +44 1794 833433
E-mail davidThomasrokecouk
SMTUB Eduard A Jorswieck Phone +49 30 31002860
Fax +49 30 31002863
E-mail jorseycstu-berlinde
Volker Jungnickel Phone +49 30 31002768
Fax +49 30 31002647
E-mail volkerjungnickelmktu-berlinde
Malte Schellmann Phone +49 30 31002770
Fax +49 30 31002647
E-mail malteschellmanntu-berlinde
Aydin Sezgin Phone +49 30 31002868
Fax +49 30 31002863
E-mail aydinsezginmktu-berlinde
SMTUD Tobias Frank Phone +49 6151 16 3769
Fax +49 6151 16 53 94
E-mail tobiasfranknttu-darmstadtde
SMTUHH Ting Chen Phone +49 40 42878 2165
Fax +49 40 42878 2281
E-mail tchentu-harburgde
Rainer Gruumlnheid Phone +49 40 42878 2166
Fax +49 40 42878 2281
E-mail gruenheidtu-harburgde
WINNER D210 v10
Page 10 (180)
SMUU Stephan Stiglmayr Phone +49 731 50-31531
Fax +49 731 50-31509
E-mail stephanstiglmayre-technikuni-ulmde
TID Emilio Mino Phone +34 91 3374428
Fax +34 91 3374212
E-mail eminotides
TUD Ernesto Zimmermann Phone +49 351 463 34958
Fax +49 351 463 37255
E-mail zimmereifnettu-dresdende
TUI Martin Fuchs Phone +49 3677 69 1156
Fax +49 3677 691195
E-mail martinfuchstu-ilmenaude
Veljko Stankovic Phone +49 3677 69 1156
Fax +49 3677 691195
E-mail veljkostankovictu-ilmenaude
Martin Haardt Phone +49 3677 69 2613
Fax +49 3677 691195
E-mail martinhaardttu-ilmenaude
UniS Mohammad Abaii Phone +44 1483 683609
Fax +44 1483 686011
E-mail MAbaiisurreyacuk
Yajian Liu Phone +44 1483 686015
Fax +44 1483 686011
WINNER D210 v10
Page 11 (180)
UOULU Kari Hooli Phone +358 8 553 2883
Fax +358 8 553 2845
E-mail karihoolieeoulufi
Juha Karjalainen Phone +358 8 553 7637
E-mail JuhaKarjalaineneeoulufi
Zexian Li Phone +358 8 553 2877
E-mail zexianlieeoulufi
WINNER D210 v10
Page 12 (180)
Table of Contents
Terminology Acronyms and Abbreviations 17
Mathematical Symbols and Notation 22
1 Introduction and Radio Interface Structure 23 11 Requirements and design targets 23 12 Key components of the radio interface 24 13 Top-down overview of the WINNER system concept 24
131 Services protocols and design 24 132 System layers modes and parameterisation 26
14 Scope of this document 28
2 Physical Layer 29 21 Forward error correction 29 22 Modulation and space-time-frequency processing 30
221 General resource allocation strategy 30 222 Modulation technique 30 223 Modulation parameters 31 224 Transceiver structure 31 225 Space-time-frequency processing 33
23 Pilot grid design for channel estimation and synchronisation 34 231 Synchronisation 34 232 Channel estimation 35
3 Medium Access Control (MAC) Layer 36 31 Medium access control for FDD and TDD cellular transmission 36
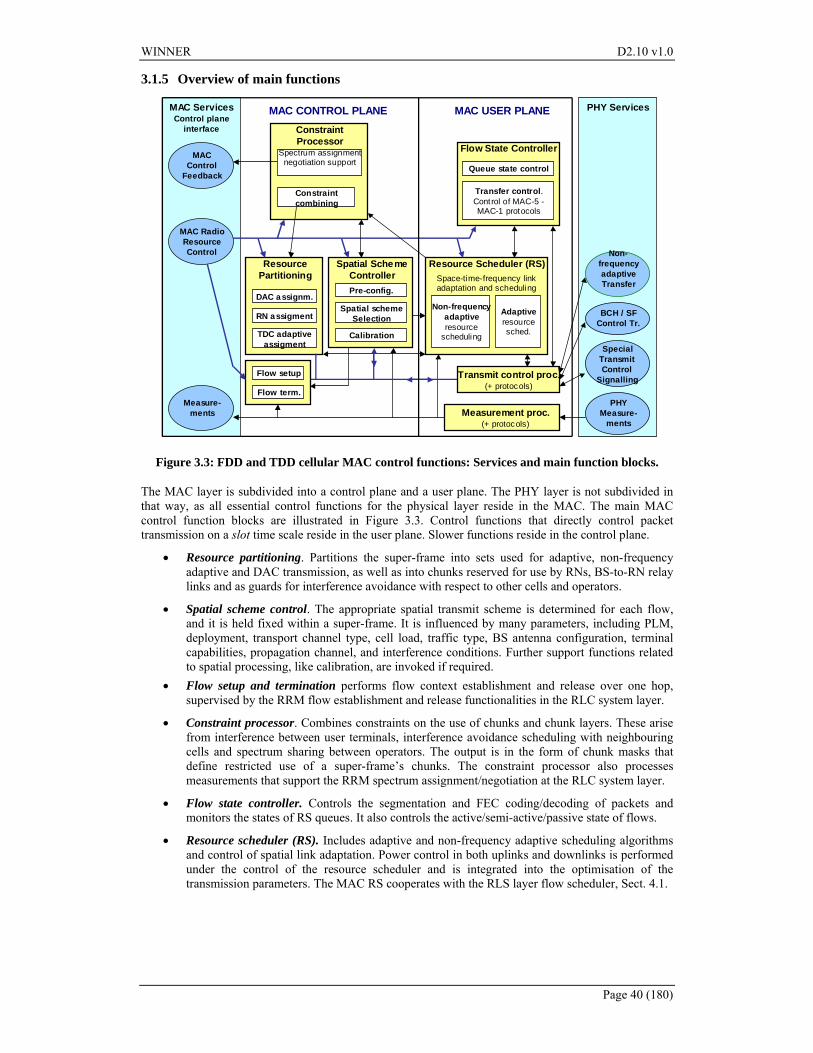
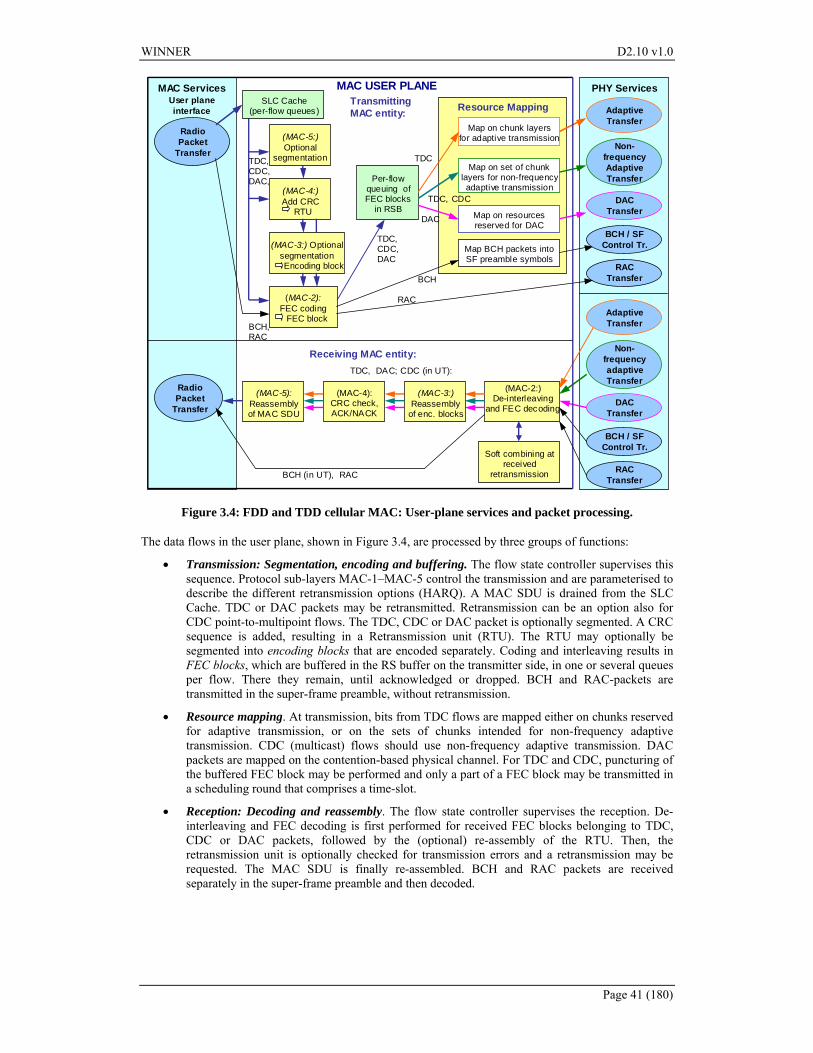
311 Goals and design principles 36 312 Control of relay-enhanced cells 36 313 The MAC services and tasks 37 314 The chunk slot frame and super-frame structure 38 315 Overview of main functions 40 316 Resource mapping and multiple access 42
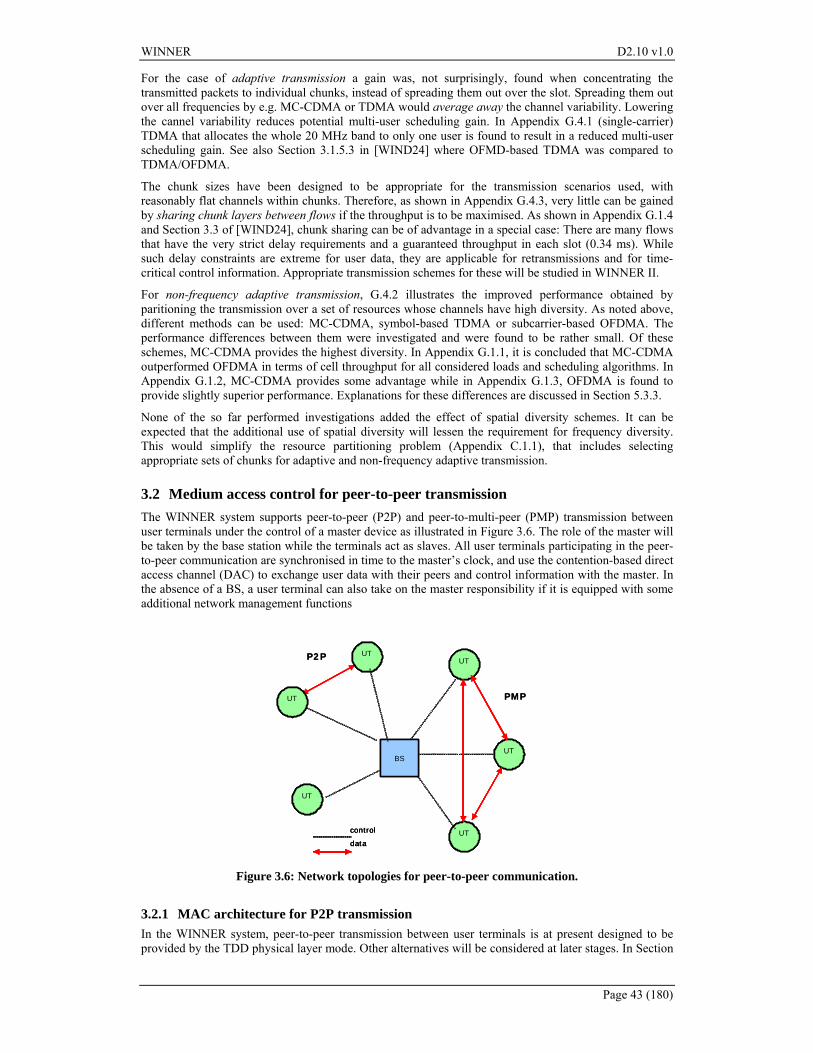
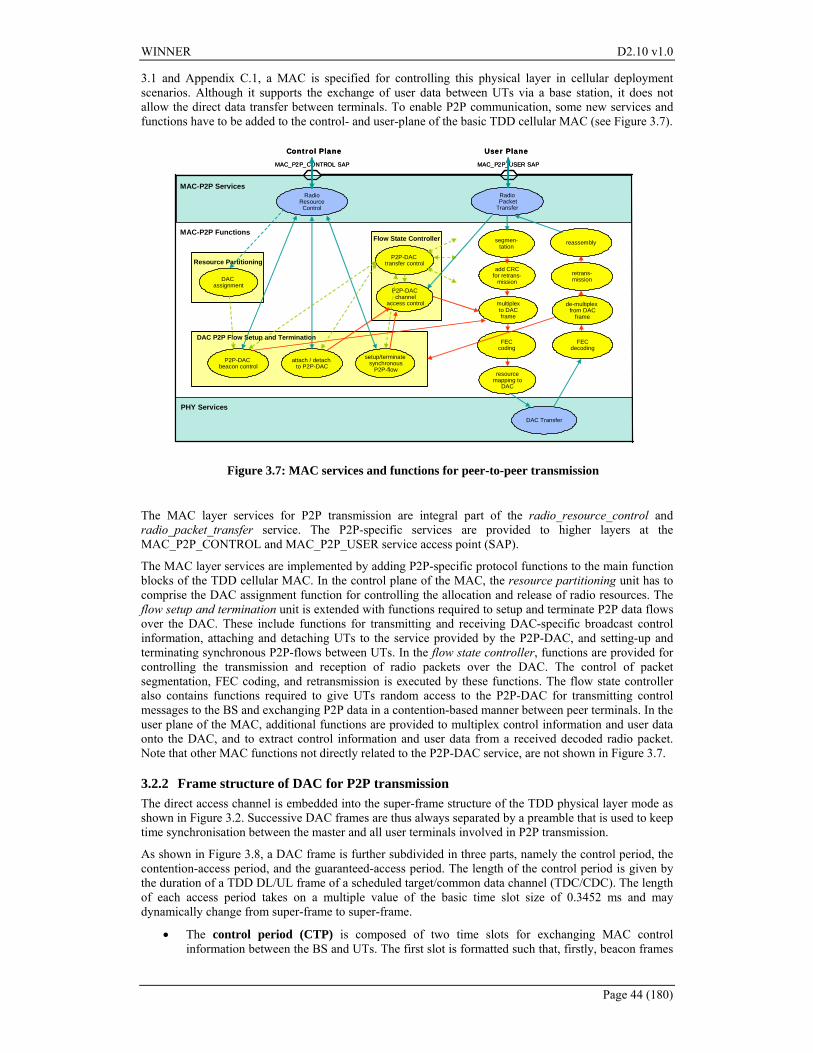
32 Medium access control for peer-to-peer transmission 43 321 MAC architecture for P2P transmission 43 322 Frame structure of DAC for P2P transmission 44
4 Radio Resource Management (RRM) and Radio Resource Control (RRC) 46 41 RRM functions 46 42 WINNER RRM architecture 48
WINNER D210 v10
Page 13 (180)
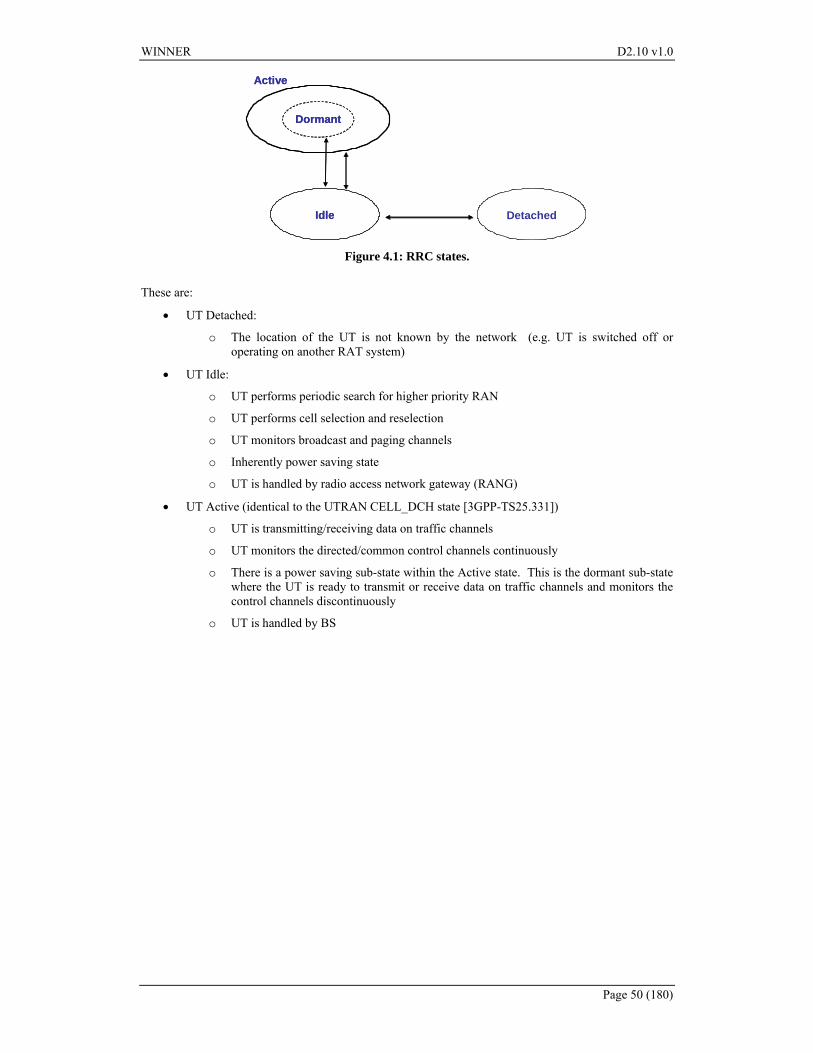
43 Radio resource control 49 431 RRC states 49
5 Assessment Overview 51 51 General 51 52 Challenges 51 53 Summary of results ndash performance and complexity 52
531 Analogue RF 52 532 Digital baseband 52 533 Multiple access 55 534 Radio protocols 56
54 Comparison of performance results with requirements and design targets 56
6 Conclusions and Outlook 59
Appendix A Requirements and Design Targets 60 A1 Targets for different scenarios 60
A11 Scenarios 60 A12 Rural area 60 A13 Metropolitan area 61 A14 Local area 61
A2 Additional targets 61 A3 System assumptions 62
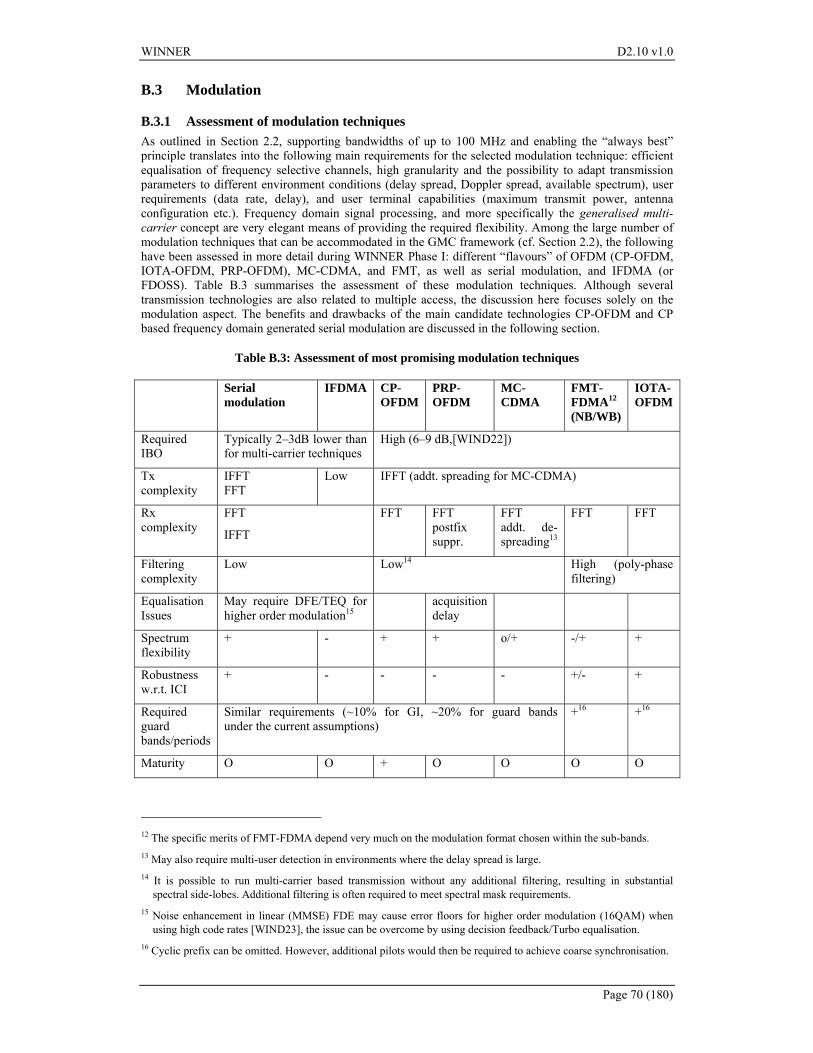
Appendix B Physical Layer 63 B1 Spatial processing and space-time-frequency mapping 63 B2 Forward error correction 66
B21 Implementation issues flexibility parallelisation throughput 67 B22 Rate compatible code sets for HARQ-II 68 B23 Low-density parity-check codes decoding options 69 B24 Scheduling of the decoder 69
B3 Modulation 70 B31 Assessment of modulation techniques 70 B32 OFDM vs single carrier 71 B33 Guard interval design 72 B34 Modulation alphabets and bit mapping 72
B4 Pilot design for channel estimation and synchronisation 73 B41 Intra- and inter-cell synchronisation using dedicated training symbols 73 B42 Pilot grid for generalised multi-carrier (GMC) 75
B5 Adaptive transmission 78 B51 Bit and power loading algorithms 78 B52 Channel quality prediction for adaptive transmission 79
WINNER D210 v10
Page 14 (180)
B53 Compression of channel state feedback for adaptive transmission 81
Appendix C MAC System Layer Functions 83 C1 Functional architecture of the WINNER medium access control for FDD and TDD cellular
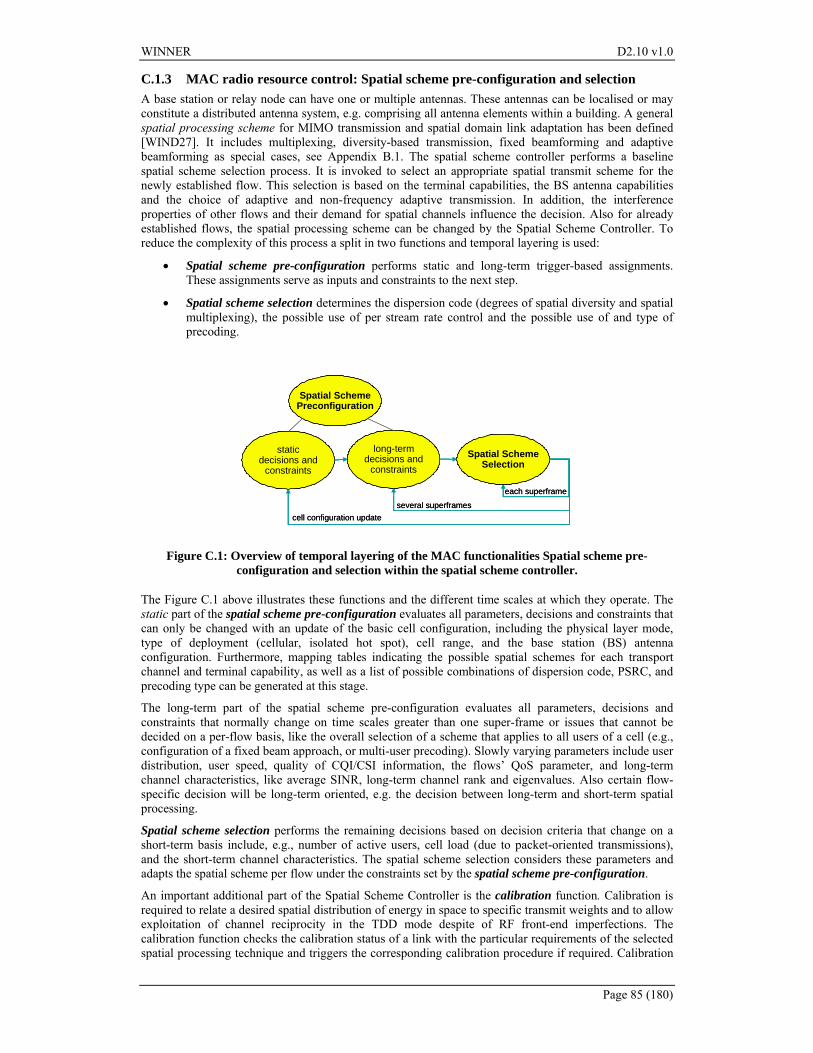
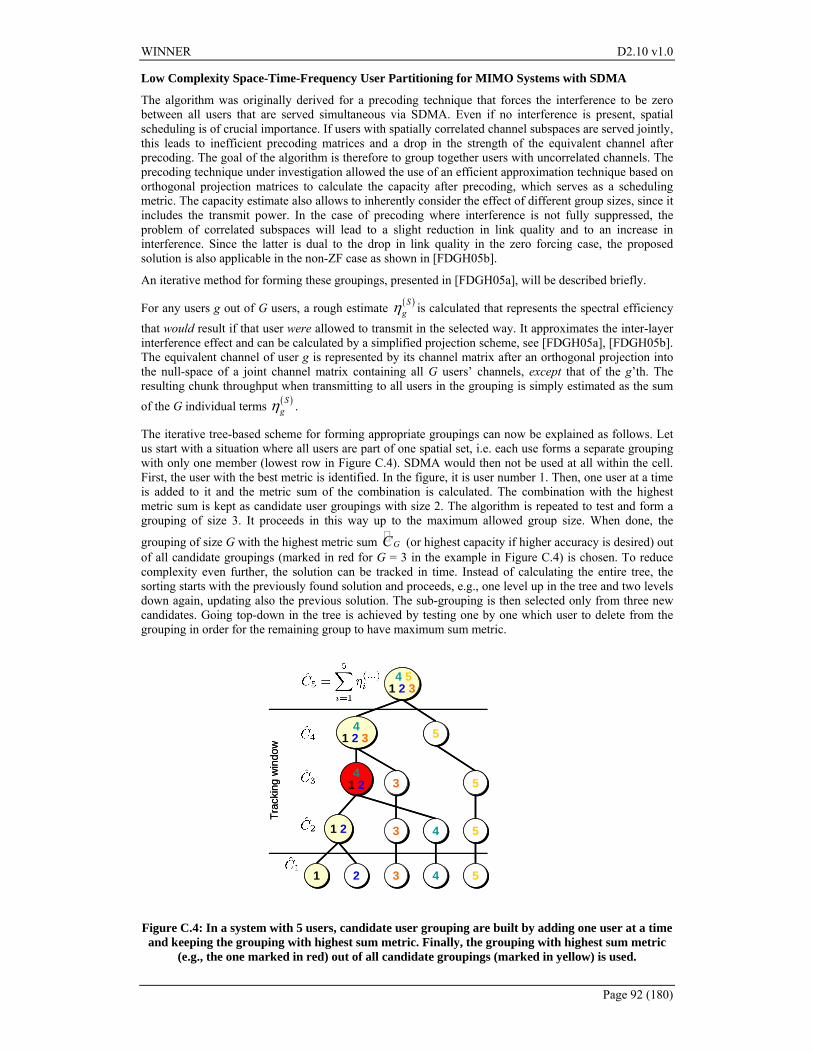
transmission 83 C11 MAC radio resource control Resource partitioning and constraint combining 83 C12 MAC radio resource control Flow setup and termination 84 C13 MAC radio resource control Spatial scheme pre-configuration and selection 85 C14 MAC control feedback 86 C15 Radio packet transfer Transmission and reception 86 C16 Resource scheduling 88 C17 SDMA and spatial user partitioning 91 C18 Timing of the execution of the main MAC functions 93
C2 Functional architecture for peer-to-peer MAC 93 P2P-DAC channel access control functions 95
C3 Chunk definition 96
Appendix D Radio Resource Management (RRM) and Radio Resource Control (RRC) 97 D1 RRM functions 97
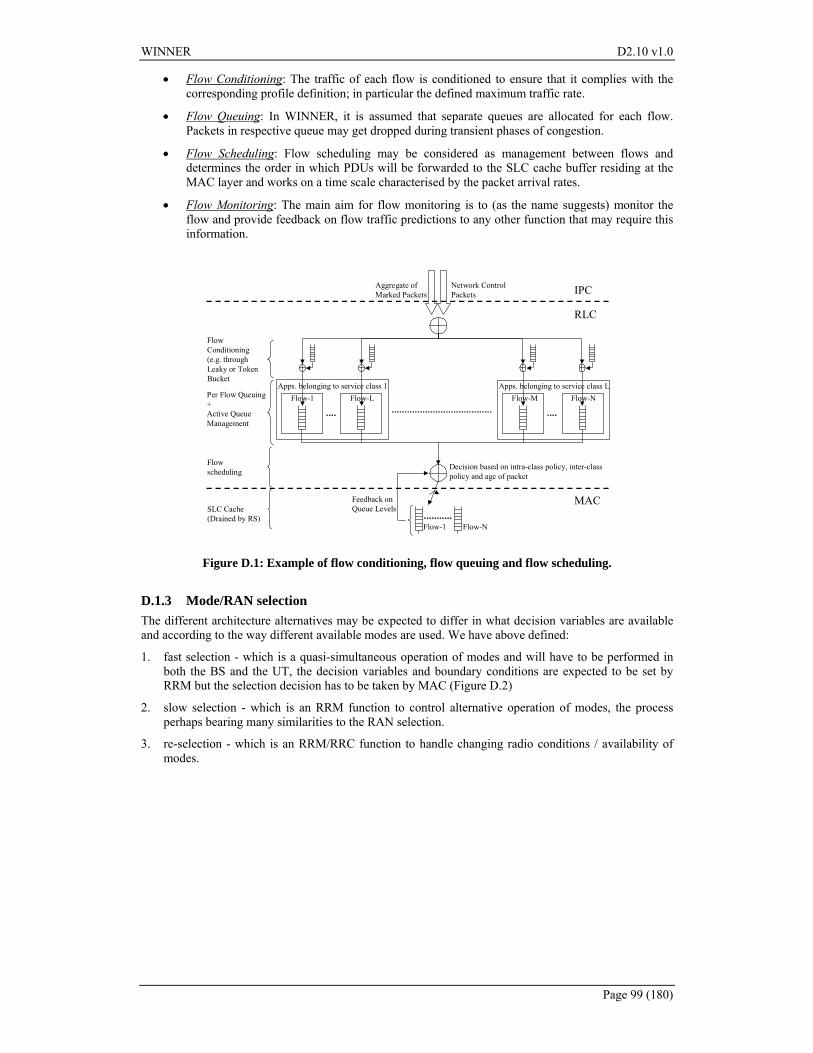
D11 Spectrum control 97 D12 Service level control (SLC) 98 D13 ModeRAN selection 99 D14 Handover 100 D15 Admission control 101 D16 Load control 102 D17 Routing 102
D2 RRM architecture 104 D21 Location of WINNER functions 104
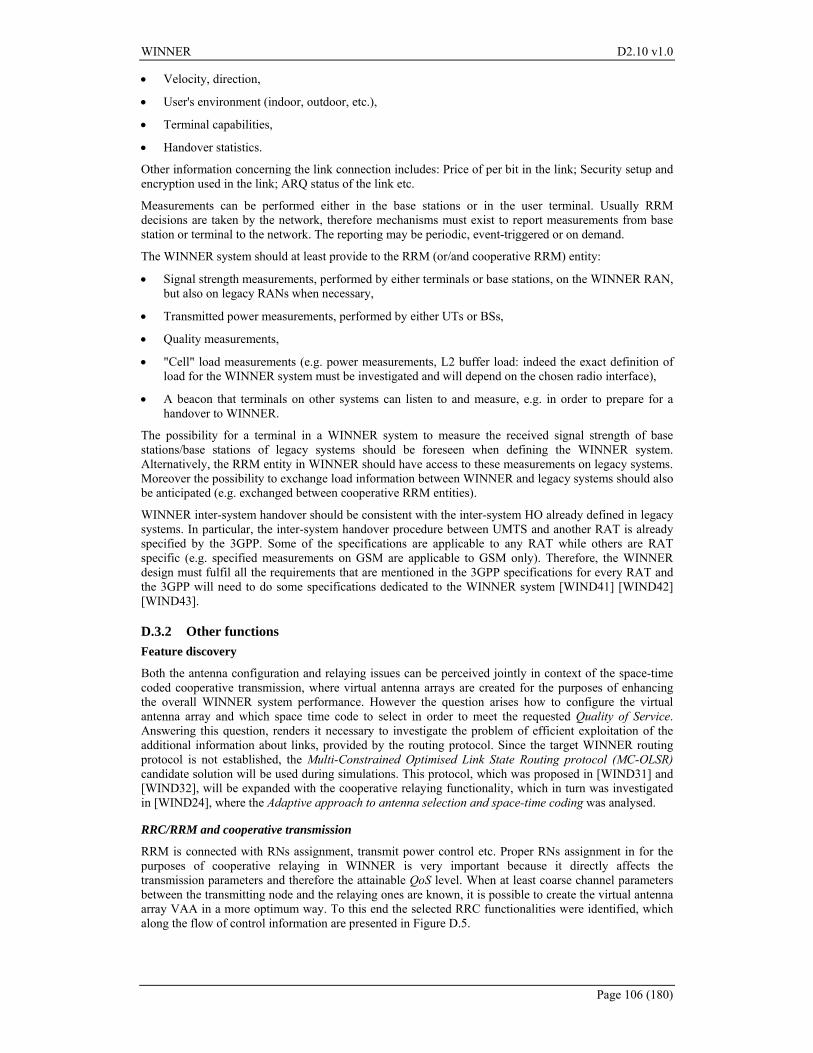
D3 RRC functionalities 105 D31 Measurements and reports 105 D32 Other functions 106
Appendix E Assessments Assumptions 108 E1 Overview 108 E2 Basic parameters for link level evaluations 108 E3 Basic parameters for multi-link and system level evaluations 109
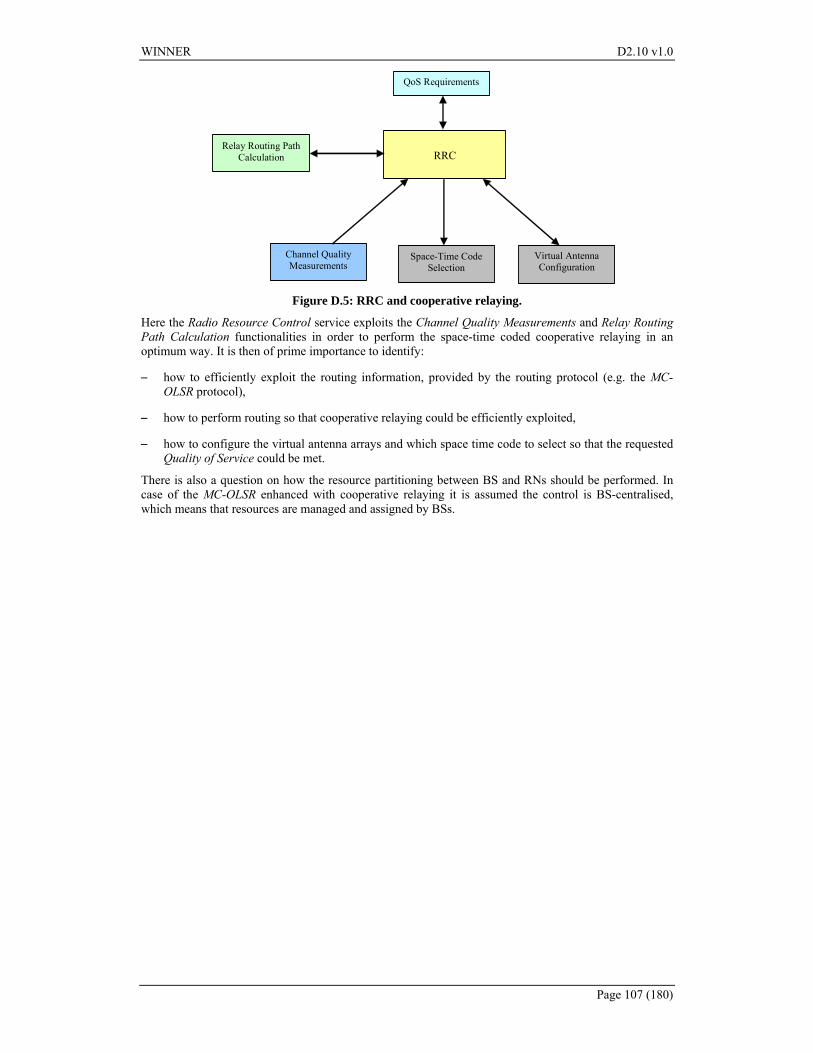
E31 Mode specific parameters 109 E32 Common to all modes 110
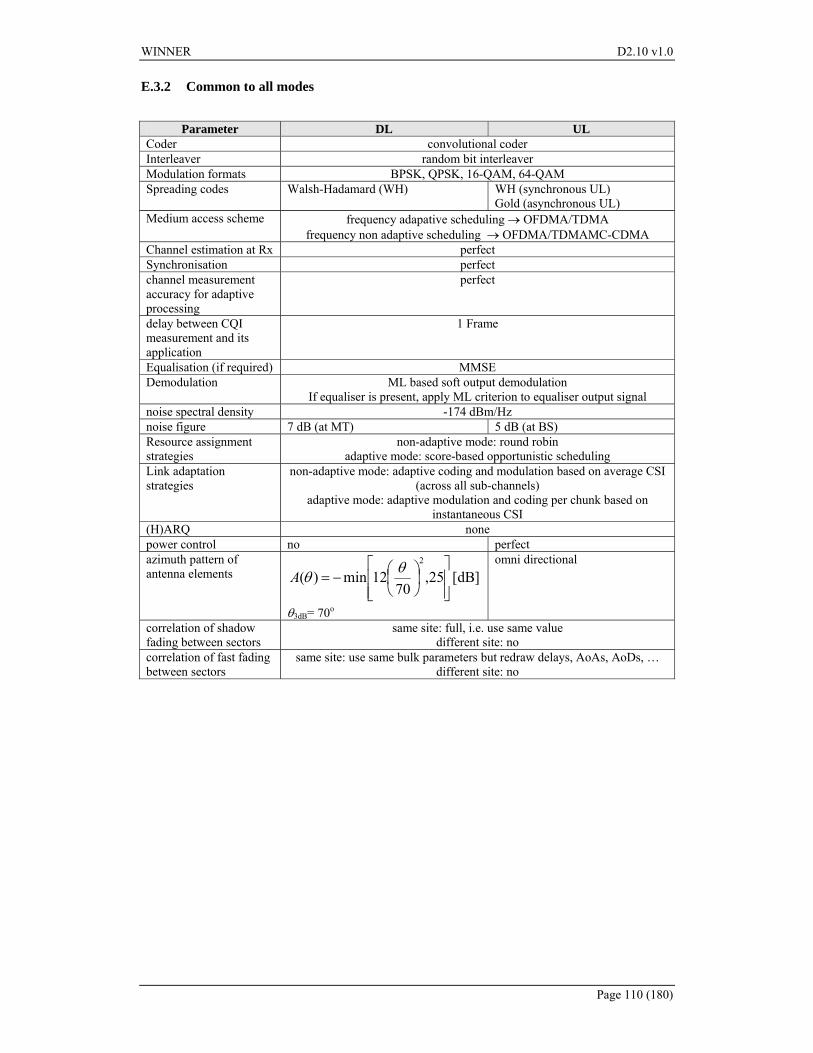
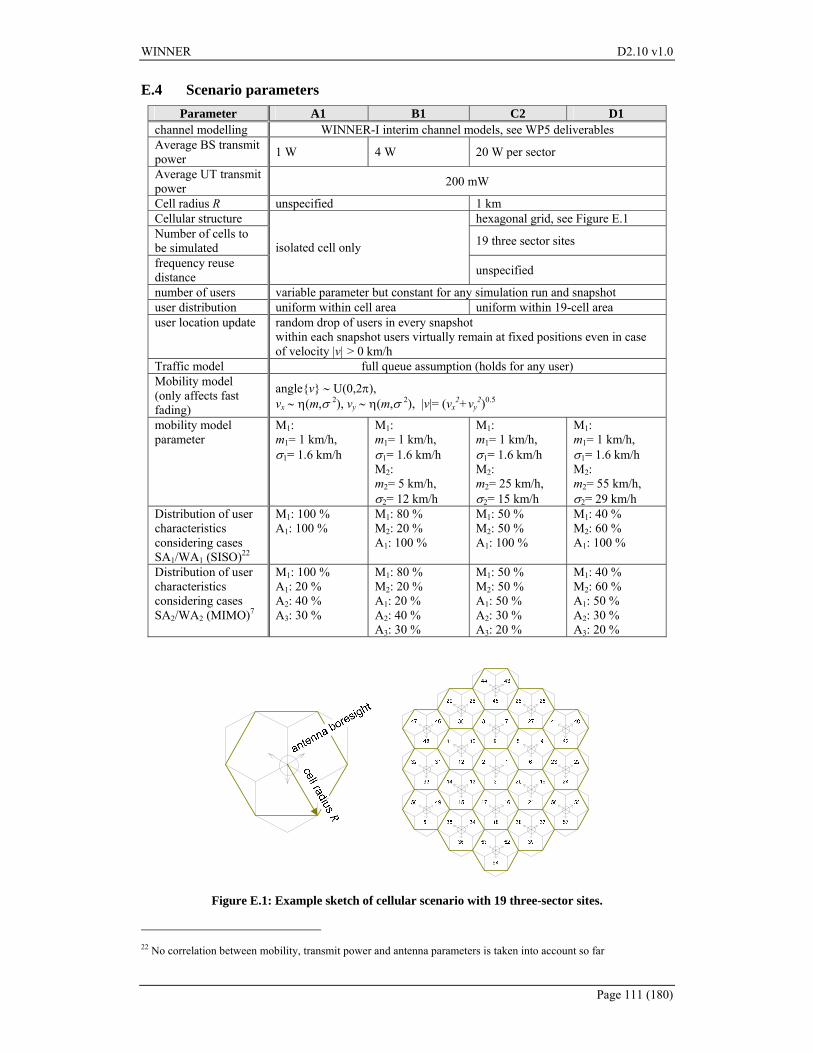
E4 Scenario parameters 111
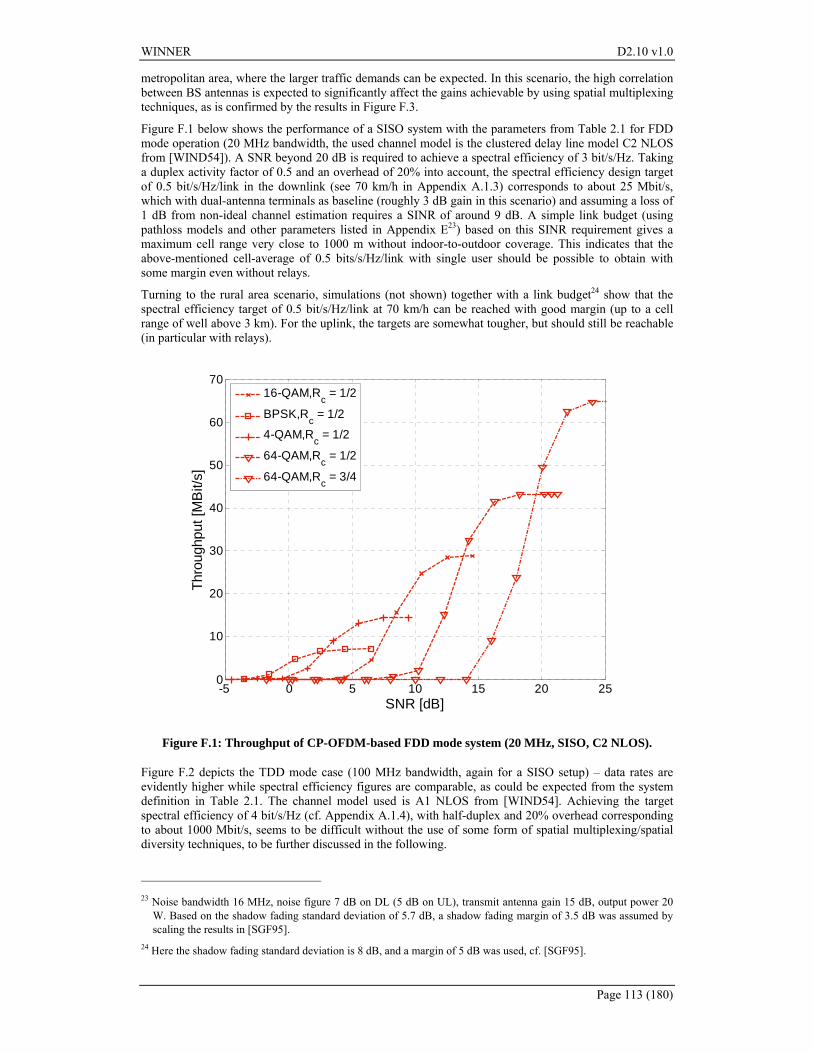
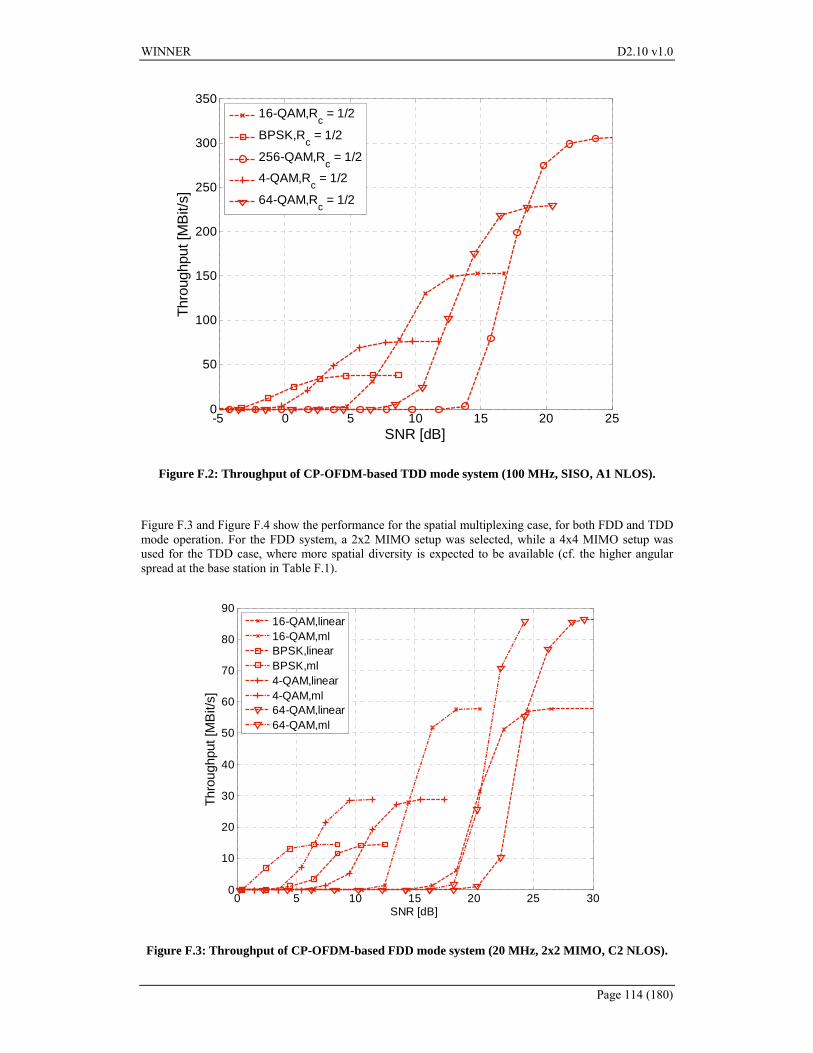
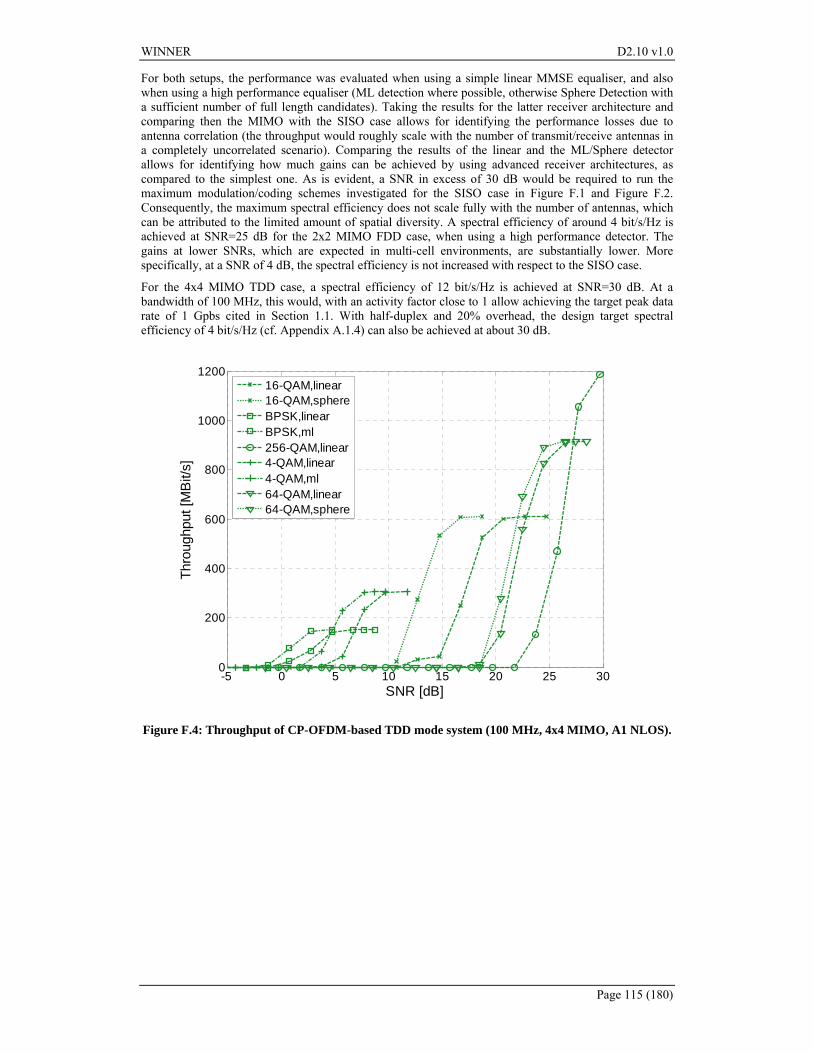
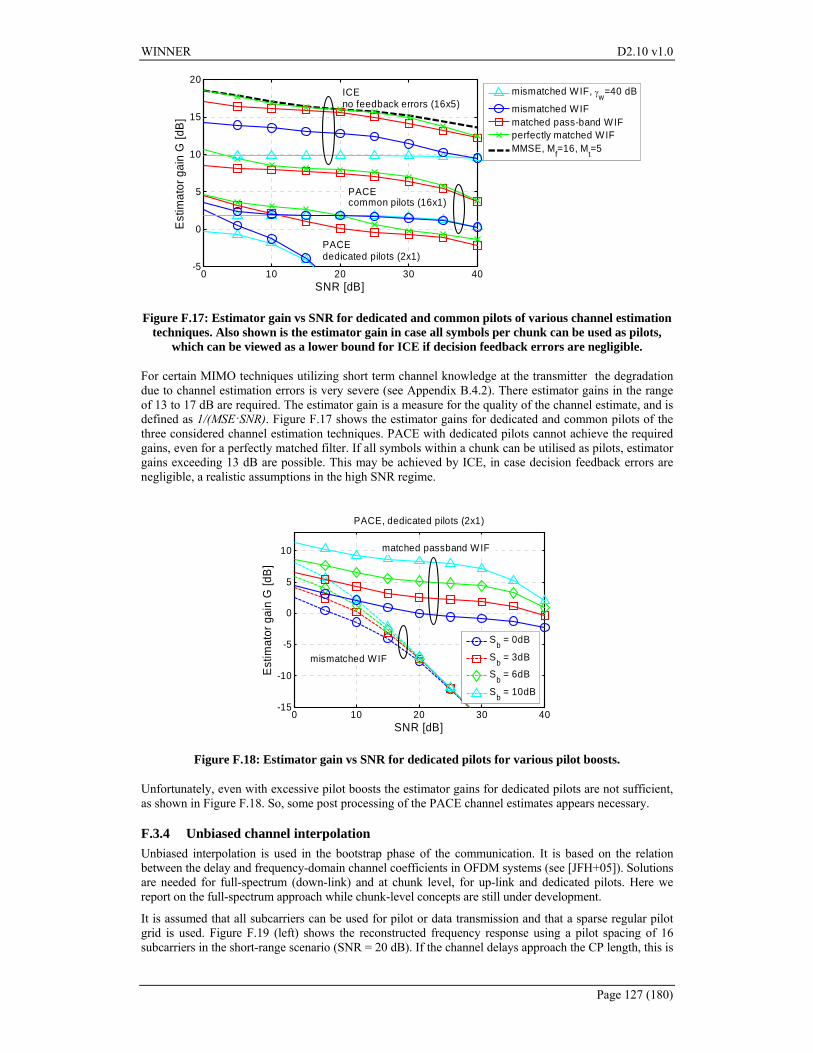
Appendix F Link-Level Assessments 112 F1 Link layer performance Throughput 112
WINNER D210 v10
Page 15 (180)
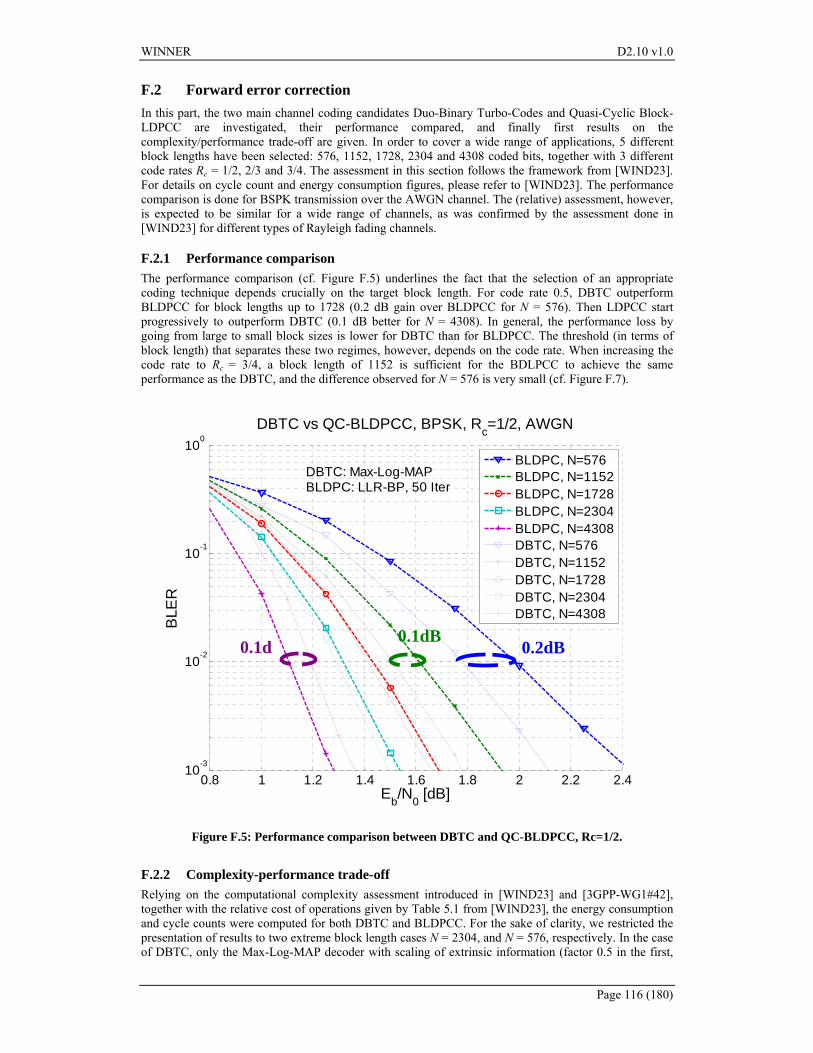
F2 Forward error correction 116 F21 Performance comparison 116 F22 Complexity-performance trade-off 116 F23 Performance comparison of rate compatible punctured codes 118 F24 BLDPCC performance comparison of major decoding algorithms 118 F25 Performance when using different decoding schedules 119 F26 Base model matrices for BLDPC codes 120
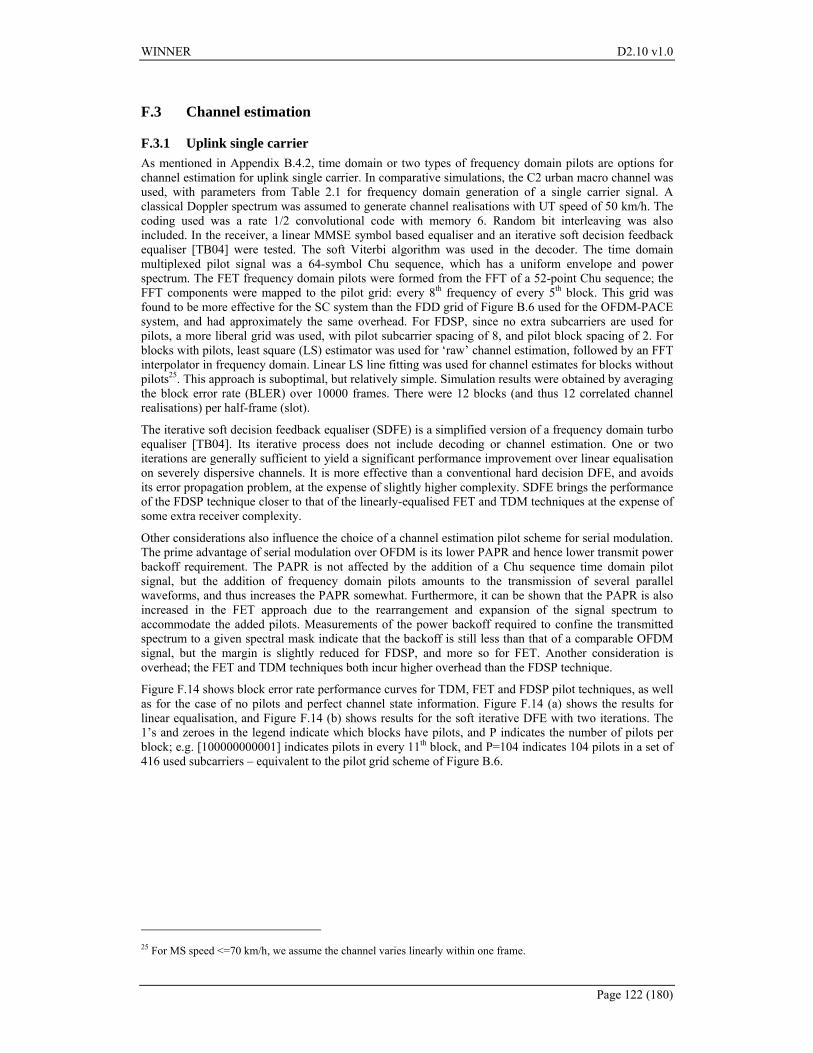
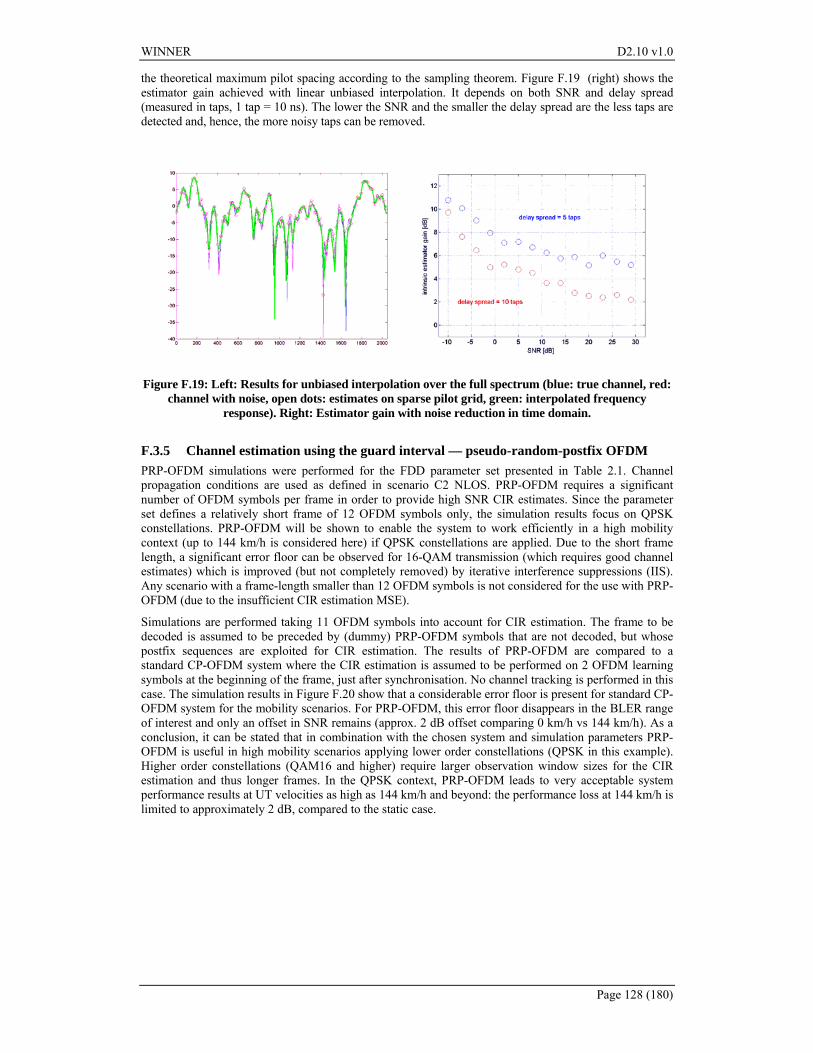
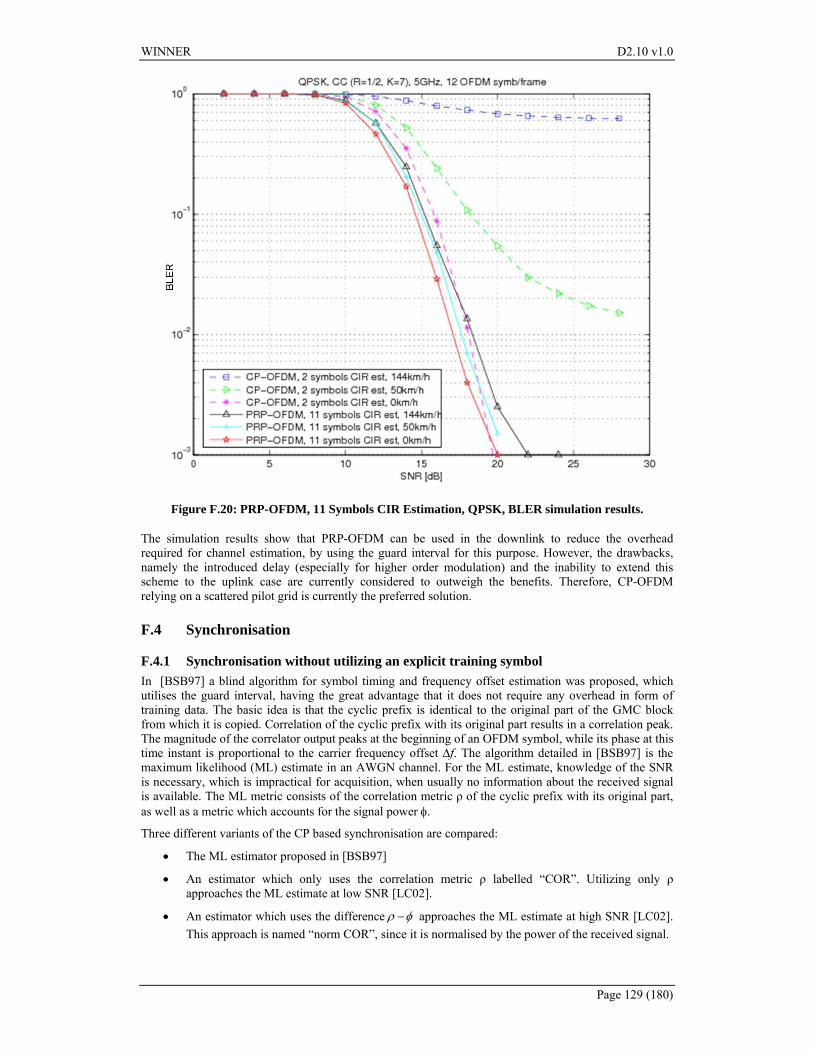
F3 Channel estimation 122 F31 Uplink single carrier 122 F32 Pilot-aided and iterative channel estimation for OFDM 124 F33 Design of the channel estimation unit 126 F34 Unbiased channel interpolation 127 F35 Channel estimation using the guard interval mdash pseudo-random-postfix OFDM 128
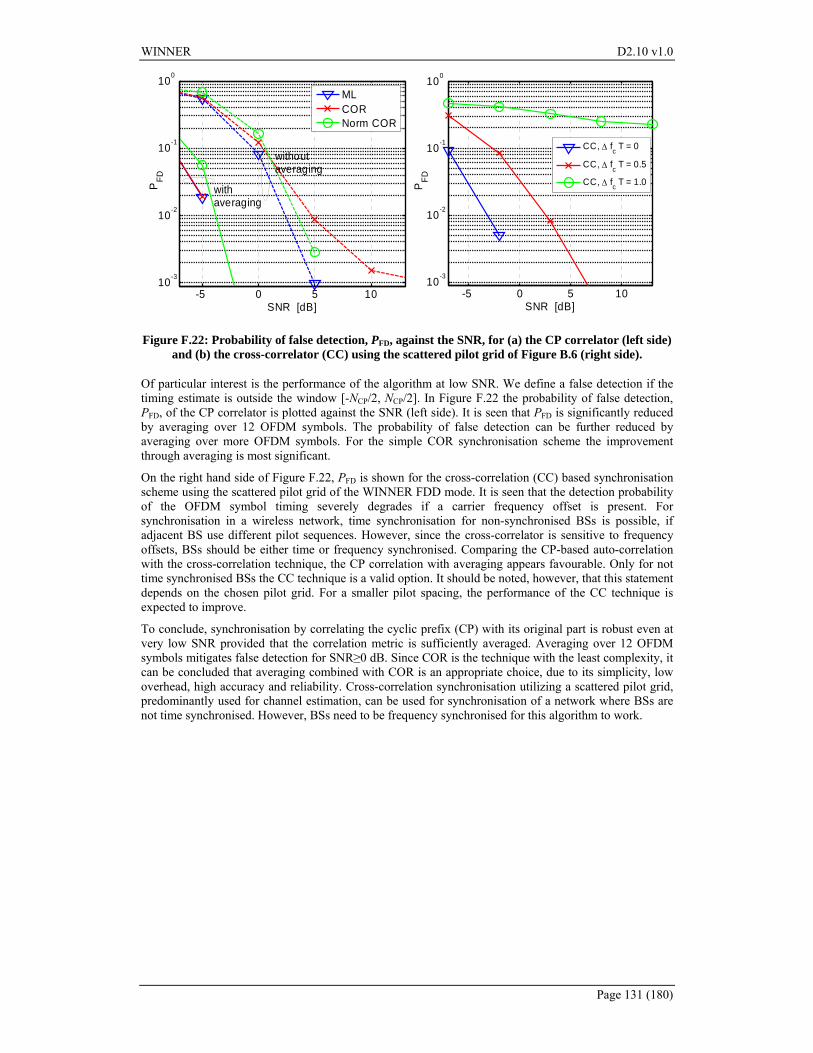
F4 Synchronisation 129 F41 Synchronisation without utilizing an explicit training symbol 129
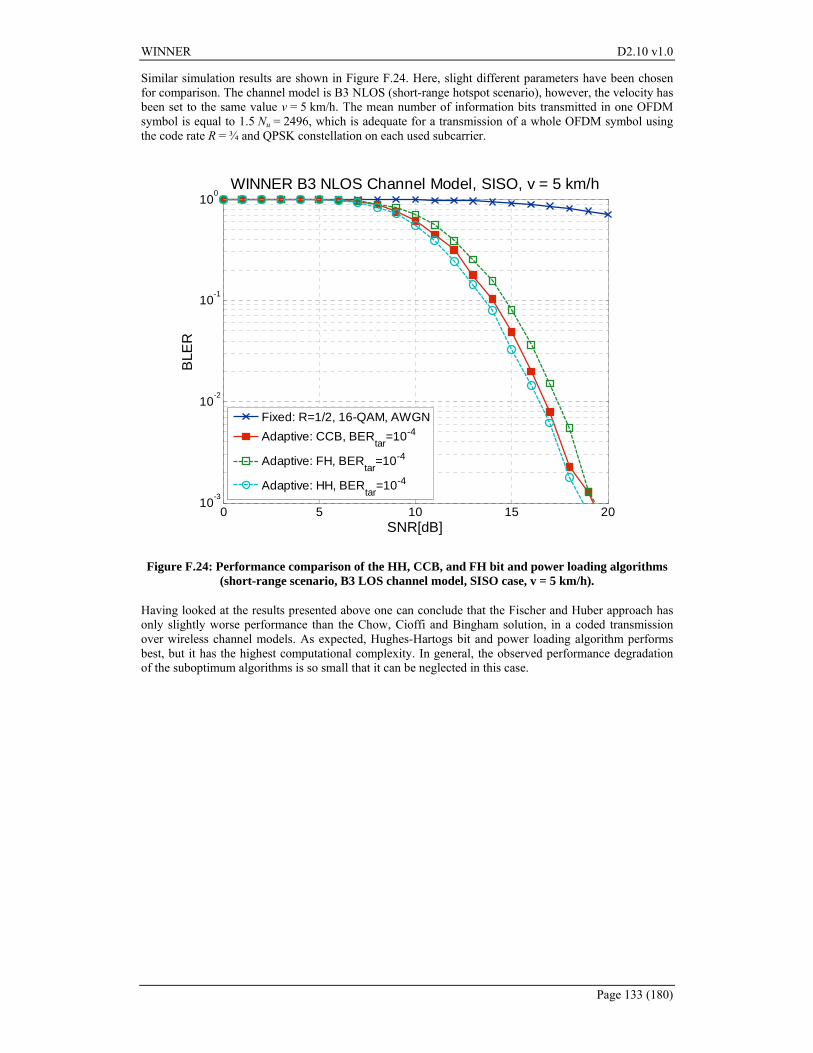
F5 Performance of selected bit and power loading algorithms 132
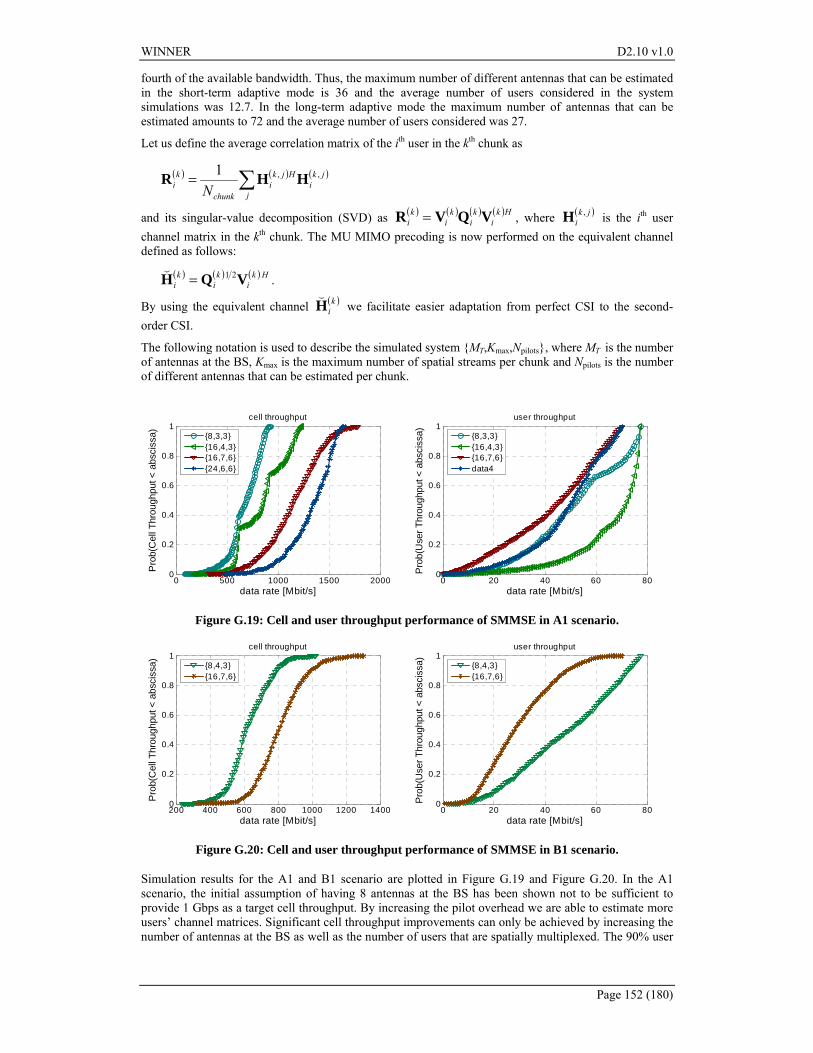
Appendix G Multi-Link and System-Level Assessments 134 G1 Downlink multiple access 135
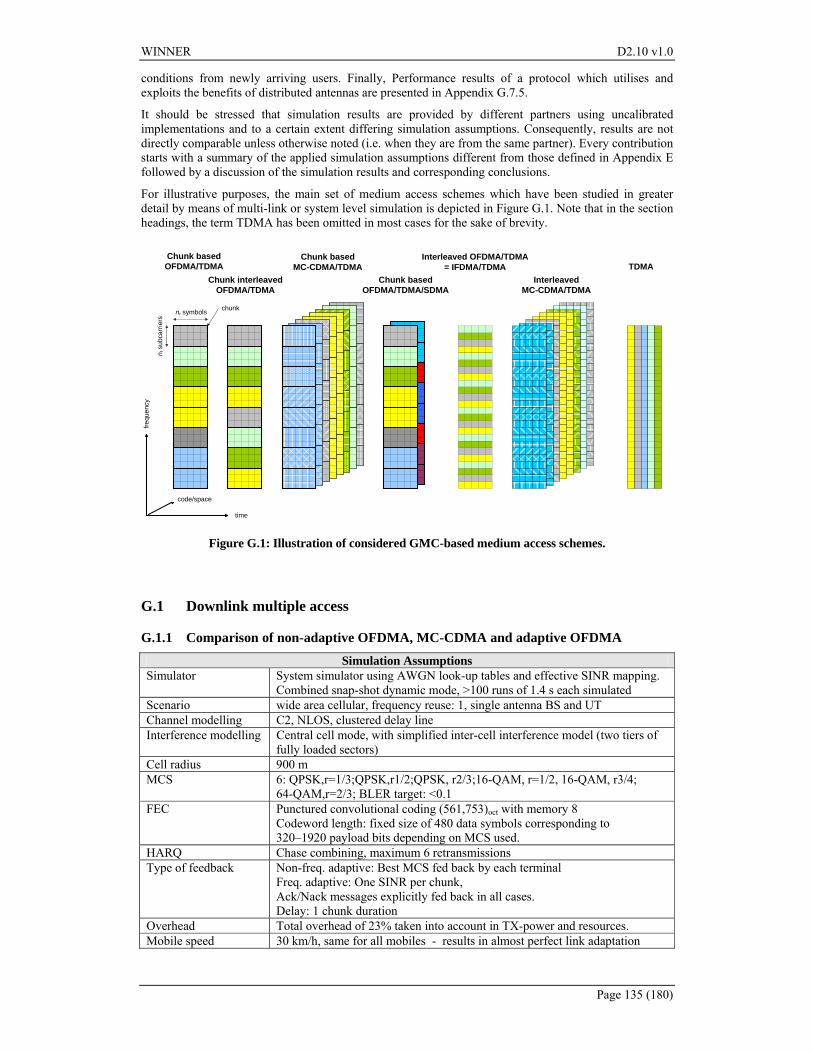
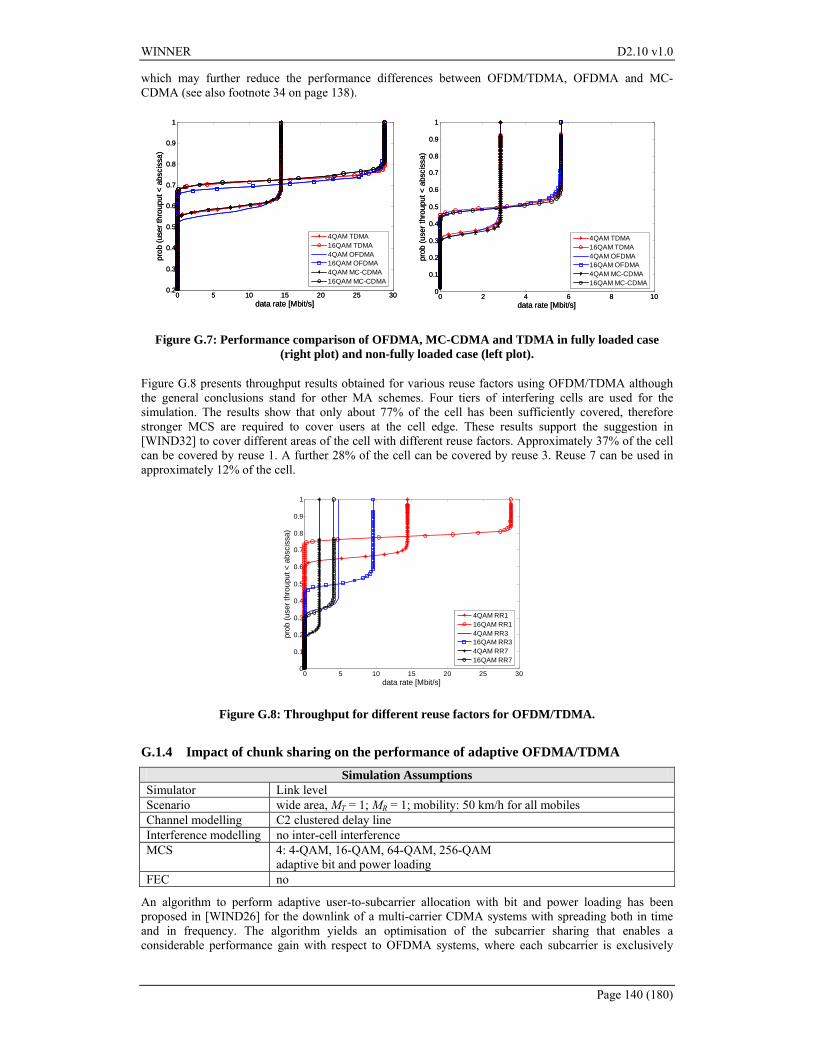
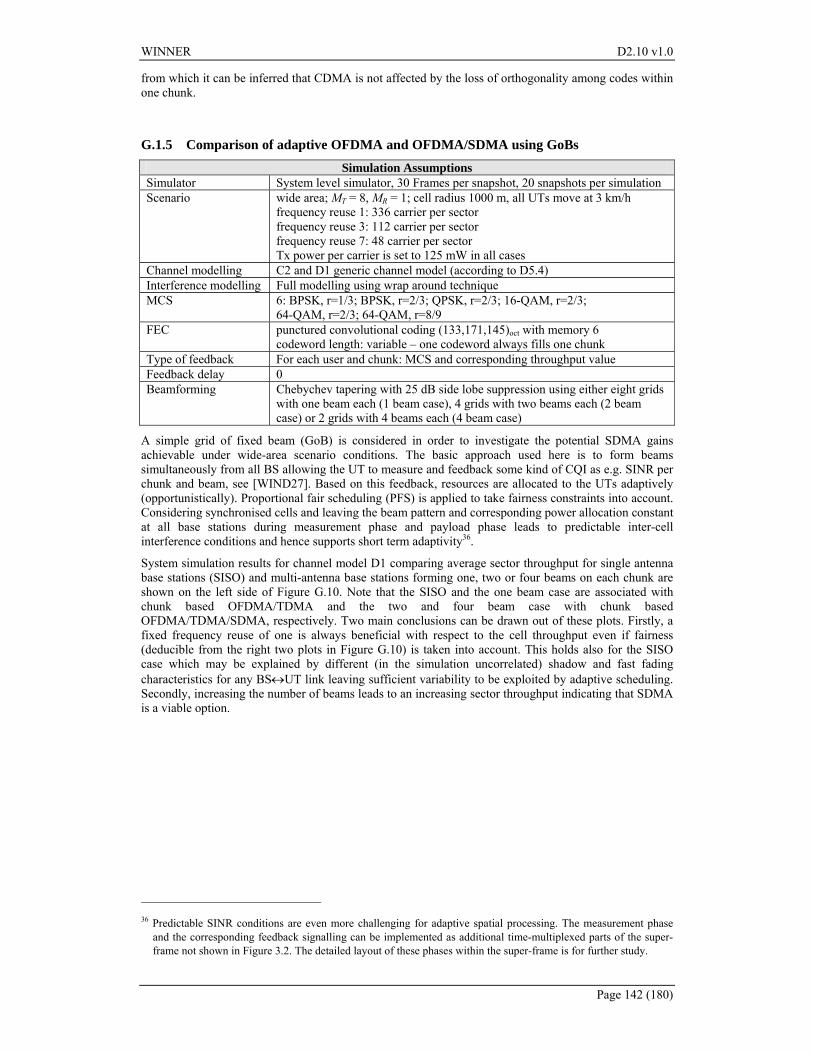
G11 Comparison of non-adaptive OFDMA MC-CDMA and adaptive OFDMA 135 G12 Comparison of non-adaptive subcarrier interleaved OFDMA and MC-CDMA 138 G13 Comparison of non-adaptive OFDMA MC-CDMA and TDMA 139 G14 Impact of chunk sharing on the performance of adaptive OFDMATDMA 140 G15 Comparison of adaptive OFDMA and OFDMASDMA using GoBs 142
G2 Downlink spatial processing 144 G21 Comparison of fixed and tracking based beamforming 144 G22 Comparison of various adaptive beamforming techniques 145 G23 Comparison of maximal ratio and interference rejection combining at UT 147 G24 Comparison of beamforming diversity and multiplexing 148 G25 Performance of SMMSE precoding 151
G3 Downlink multi-user detection 153 G31 Comparison of receiver structures for SISO MC-CDMA 153 G32 Comparison of receiver structures for MIMO MC-CDMA 154
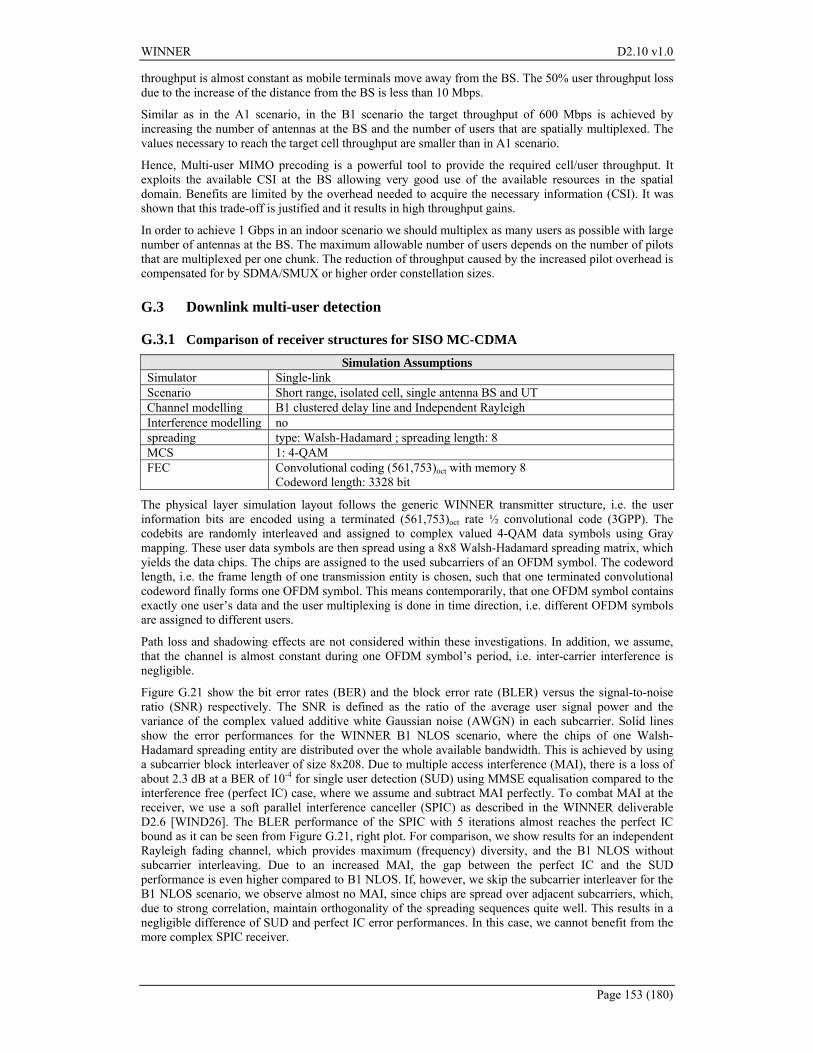
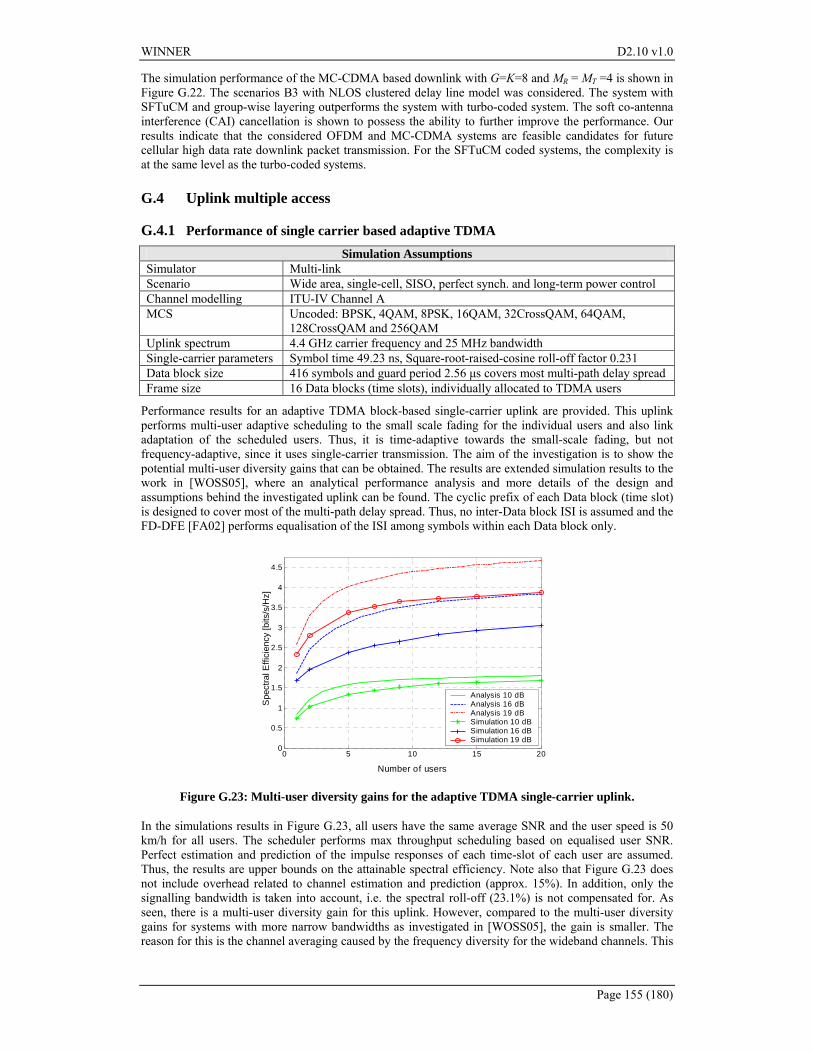
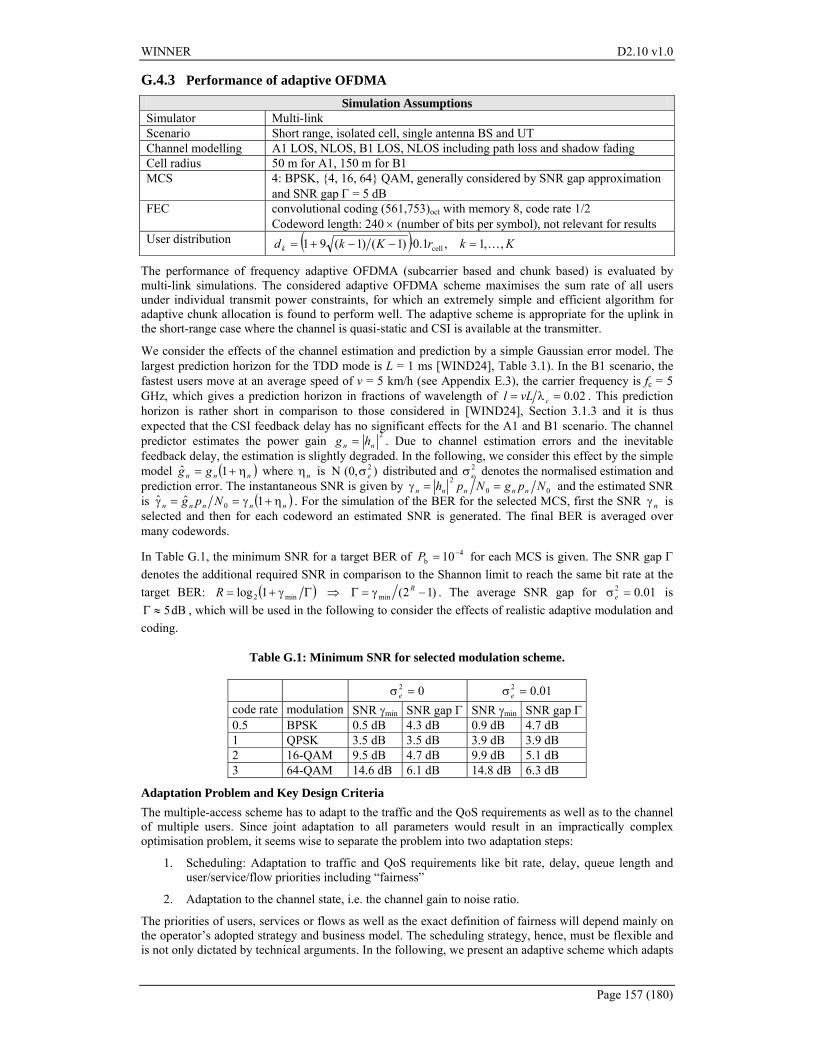
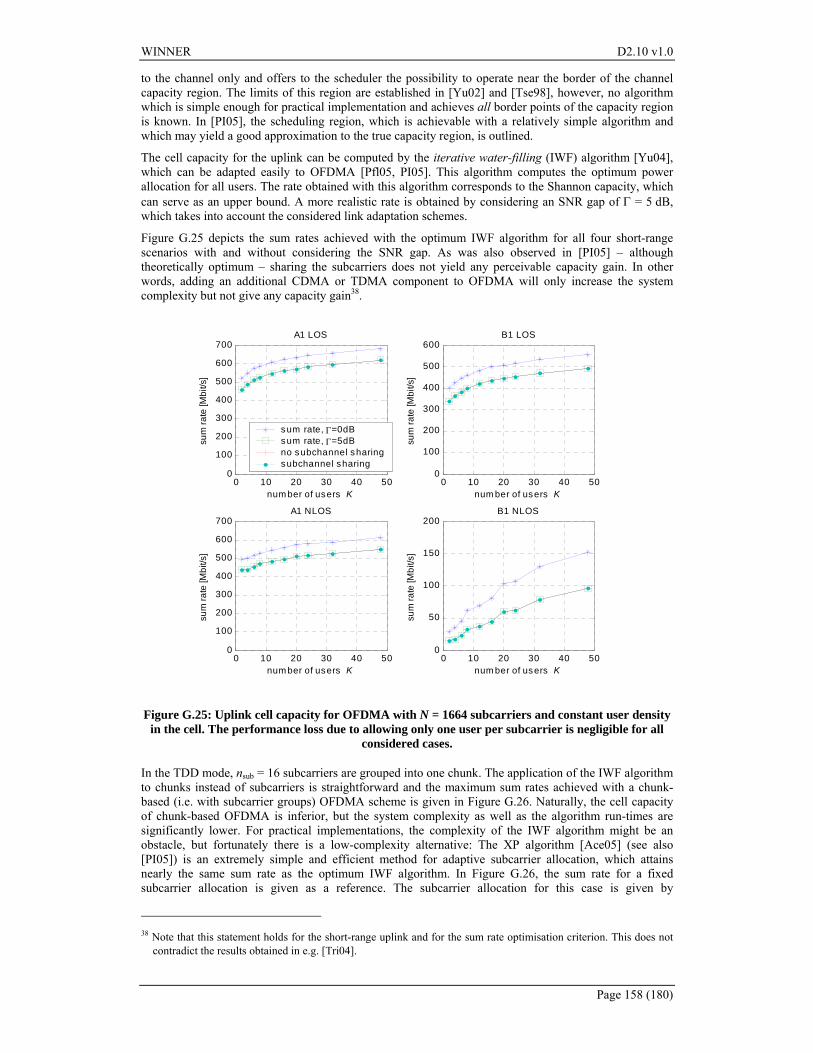
G4 Uplink multiple access 155 G41 Performance of single carrier based adaptive TDMA 155 G42 Comparison of IFDMA and chunk based OFDMA 156 G43 Performance of adaptive OFDMA 157 G44 Comparison of adaptive OFDMA and OFDM-TDMA 159
G5 Uplink spatial processing 161 G51 Performance of spatial diversity 161 G52 Linear precoding concepts with long term channel state information 162
WINNER D210 v10
Page 16 (180)
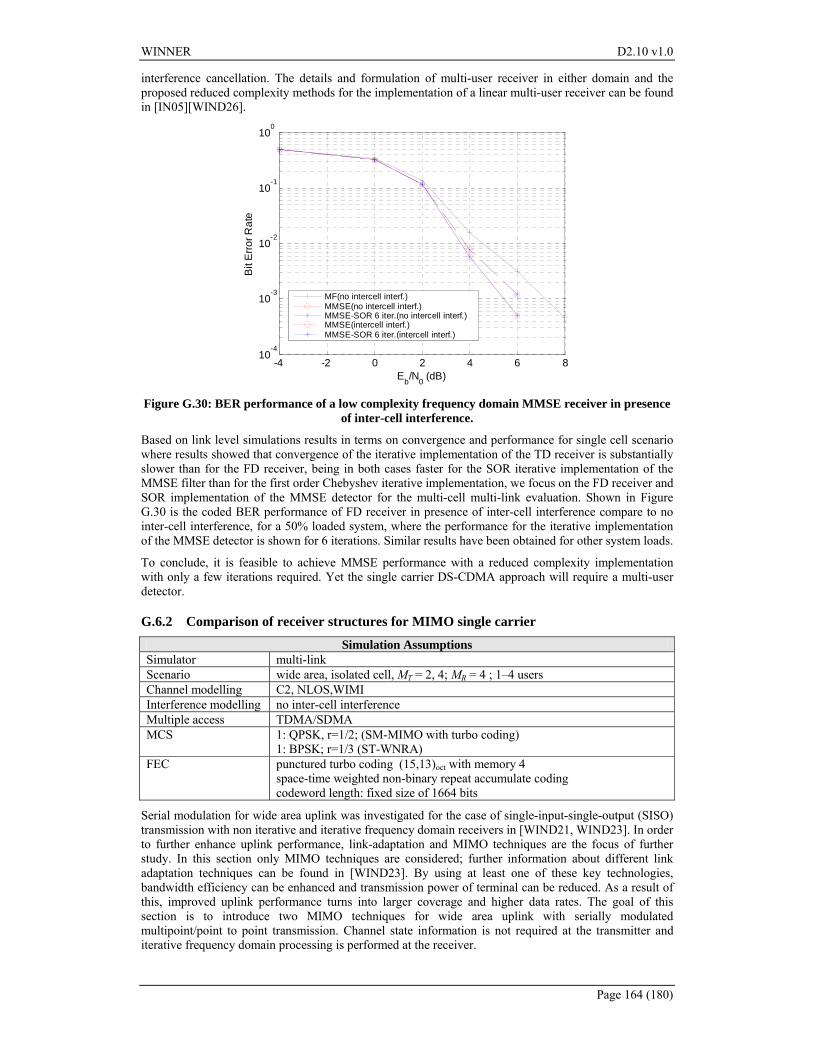
G6 Uplink multi-user detection 163 G61 Comparison of receiver structures for DS-CDMA 163 G62 Comparison of receiver structures for MIMO single carrier 164
G7 Other topics 166 G71 OFDM versus single carrier based uplinks 166 G72 Performance of low rate channel coding for one-cell frequency reuse 167 G73 Comparison of FDMA and TDMA based resource partitioning among BS 169 G74 Comparison of conventional and self-organised RRM in cellular networks 171 G75 VAA technology with adaptive pre-selection aided by MC-OLSR protocol 172
References 174
WINNER D210 v10
Page 17 (180)
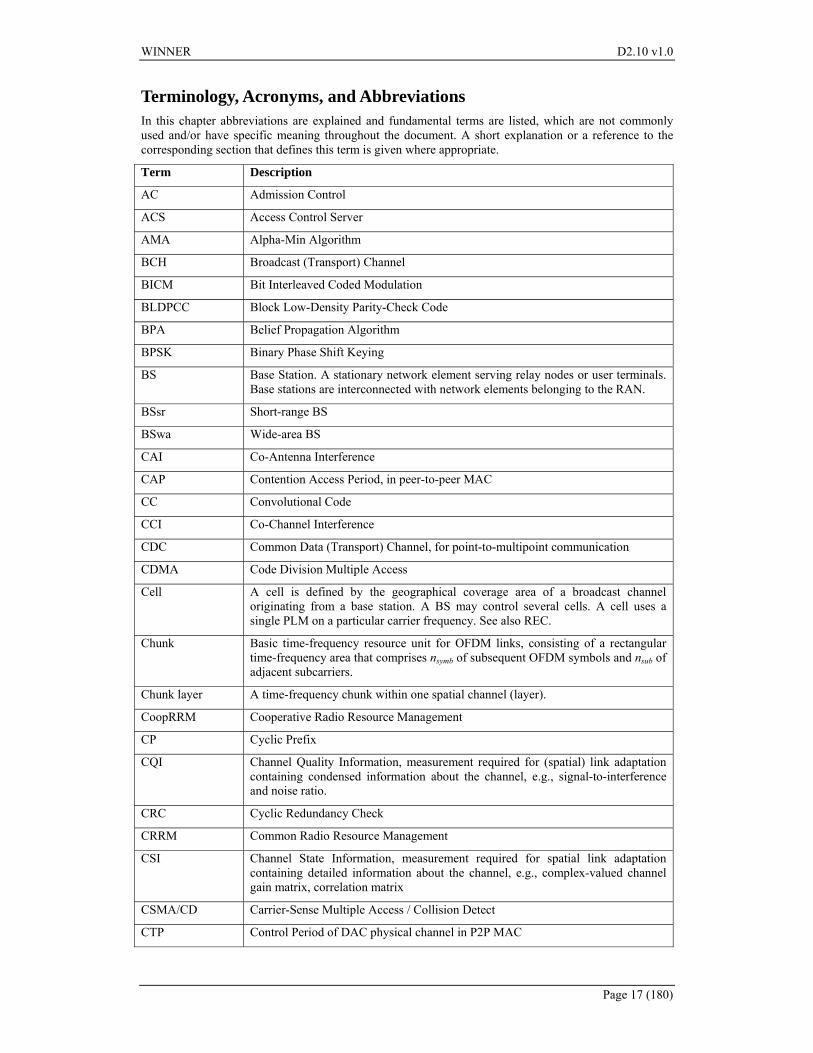
Terminology Acronyms and Abbreviations In this chapter abbreviations are explained and fundamental terms are listed which are not commonly used andor have specific meaning throughout the document A short explanation or a reference to the corresponding section that defines this term is given where appropriate
Term Description
AC Admission Control
ACS Access Control Server
AMA Alpha-Min Algorithm
BCH Broadcast (Transport) Channel
BICM Bit Interleaved Coded Modulation
BLDPCC Block Low-Density Parity-Check Code
BPA Belief Propagation Algorithm
BPSK Binary Phase Shift Keying
BS Base Station A stationary network element serving relay nodes or user terminals Base stations are interconnected with network elements belonging to the RAN
BSsr Short-range BS
BSwa Wide-area BS
CAI Co-Antenna Interference
CAP Contention Access Period in peer-to-peer MAC
CC Convolutional Code
CCI Co-Channel Interference
CDC Common Data (Transport) Channel for point-to-multipoint communication
CDMA Code Division Multiple Access
Cell A cell is defined by the geographical coverage area of a broadcast channel originating from a base station A BS may control several cells A cell uses a single PLM on a particular carrier frequency See also REC
Chunk Basic time-frequency resource unit for OFDM links consisting of a rectangular time-frequency area that comprises nsymb of subsequent OFDM symbols and nsub of adjacent subcarriers
Chunk layer A time-frequency chunk within one spatial channel (layer)
CoopRRM Cooperative Radio Resource Management
CP Cyclic Prefix
CQI Channel Quality Information measurement required for (spatial) link adaptation containing condensed information about the channel eg signal-to-interference and noise ratio
CRC Cyclic Redundancy Check
CRRM Common Radio Resource Management
CSI Channel State Information measurement required for spatial link adaptation containing detailed information about the channel eg complex-valued channel gain matrix correlation matrix
CSMACD Carrier-Sense Multiple Access Collision Detect
CTP Control Period of DAC physical channel in P2P MAC
WINNER D210 v10
Page 18 (180)
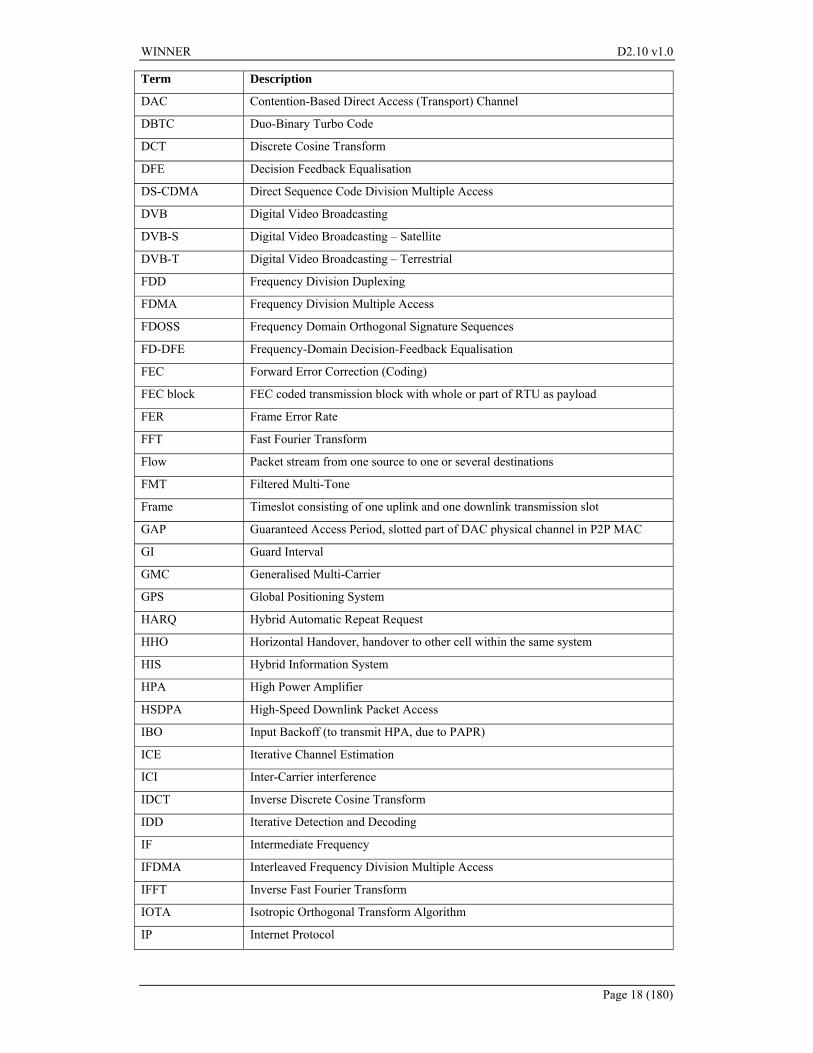
Term Description
DAC Contention-Based Direct Access (Transport) Channel
DBTC Duo-Binary Turbo Code
DCT Discrete Cosine Transform
DFE Decision Feedback Equalisation
DS-CDMA Direct Sequence Code Division Multiple Access
DVB Digital Video Broadcasting
DVB-S Digital Video Broadcasting ndash Satellite
DVB-T Digital Video Broadcasting ndash Terrestrial
FDD Frequency Division Duplexing
FDMA Frequency Division Multiple Access
FDOSS Frequency Domain Orthogonal Signature Sequences
FD-DFE Frequency-Domain Decision-Feedback Equalisation
FEC Forward Error Correction (Coding)
FEC block FEC coded transmission block with whole or part of RTU as payload
FER Frame Error Rate
FFT Fast Fourier Transform
Flow Packet stream from one source to one or several destinations
FMT Filtered Multi-Tone
Frame Timeslot consisting of one uplink and one downlink transmission slot
GAP Guaranteed Access Period slotted part of DAC physical channel in P2P MAC
GI Guard Interval
GMC Generalised Multi-Carrier
GPS Global Positioning System
HARQ Hybrid Automatic Repeat Request
HHO Horizontal Handover handover to other cell within the same system
HIS Hybrid Information System
HPA High Power Amplifier
HSDPA High-Speed Downlink Packet Access
IBO Input Backoff (to transmit HPA due to PAPR)
ICE Iterative Channel Estimation
ICI Inter-Carrier interference
IDCT Inverse Discrete Cosine Transform
IDD Iterative Detection and Decoding
IF Intermediate Frequency
IFDMA Interleaved Frequency Division Multiple Access
IFFT Inverse Fast Fourier Transform
IOTA Isotropic Orthogonal Transform Algorithm
IP Internet Protocol
WINNER D210 v10
Page 19 (180)
Term Description
IR Incremental Redundancy
ITU International Telecommunication Union
ISI Inter-Symbol Interference
LA Link Adaptation
LDC Linear Dispersion Code
LDPCC Low-Density Parity-Check Code
Link A link is a radio connection between two network elements of the WINNER access system It subdivides into relay links between base station and relay nodes or between relays and the user link between the user terminal and the radio access point
LLR Log-Likelihood Ratio
LT Long-Term
LTE Long-Term Evolution of 3GPP
MAC Media Access Control Name used both to denote a system layer (MACSL) and a protocol layer (MACPL) that is implemented in the MAC system layer user plane
MAI Multiple Access Interference
MC-CDMA Multi-Carrier Code Division Multiple Access
MCN Multi-hop Cellular Network cellular network that includes relay nodes
MIMO Multiple Input Multiple Output
MMSE Minimum Mean Square Error
MSA Min-Sum Algorithm
MU Multi-User
OBF Opportunistic Beamforming
OFDM Orthogonal Frequency Division Multiplexing
OFDMA Orthogonal Frequency Division Multiple Access
P2P Peer-to-Peer transmission
PACE Pilot-Aided Channel Estimation
PAPR Peak-to-Average Power Ratio
PARC Per Antenna Rate Control
PCCC Parallel Concatenated Convolutional Code (Turbo Code)
PDP Power Delay Profile
PDU Protocol Data Unit
PHY Physical Layer Name used both to denote a system layer (PHYSL) and a protocol layer (PHYPL)
PHY mode Basic physical layer transmission strategy currently two modes are defined TDD and FDD Also denoted PLM Physical Layer Mode
Physical channel A set of chunk layers onto which the resource scheduler in the MAC system layer maps data associated with one sub-flow
PLM Physical Layer Mode see PHY mode
PLMN Public Land Mobile Network
PMP Peer-to-Multi-Peer transmission
WINNER D210 v10
Page 20 (180)
Term Description
PRP Pseudo-Random-Postfix
PSAP Provided Service Access Point
PSRC Per Stream Rate Control
QoS Quality of Service
QAM Quadrature Amplitude Modulation
QC-BLDPCC Quasi-Cyclic Block Low-Density Parity-Check Code
RAC Contention-Based Random Access (Transport) Channel
RAN Radio Access Network
RANG Radio Access Network Gateway
RAP Radio Access Point common term that encompasses both base stations and relay nodes
RAT Radio Access Technology
RC Rate-Compatible
REC Relay-enhanced cell The geographical area covered by one broadcast channel from a single base station plus the broadcast channels from its connected relay nodes
RF Radio Frequency
RI Radio Interface
RLC Radio Link Control Name used both to denotes a system layer (RLCSL) and a protocol layer RLCPL) that is implemented in the RLC system layer user plane
RN Relay Node A network element serving other RN or UT in a given geographical area via its radio access capabilities It is wirelessly connected to a base station another relay node andor a user terminal and forwards data packets between these network elements
RNC Radio Network Controller
RRC Radio Resource Control Protocol that provides the signalling for control and feedback messages
RRM Radio Resource Management Control functions implemented in the RLC system layer control plane
RSB Resource Scheduling Buffer
RTU Retransmission Unit packets upon which HARQ is performed
RUP Reuse Partitioning
SAP Service Access Point
SC Single Carrier
SDMA Spatial Division Multiple Access
SDU Service Data Unit
SDFE Soft Decision Feedback Equalisation
Sector Azimuth angle partition of a base station coverage area In the system-level simulations of this document each sector constitutes a separate cell
SF Super-Frame
SF preamble Initial part of super-frame transmitted cell-wide in spectrum available everywhere
SF-MMSE Space-Frequency MMSE
WINNER D210 v10
Page 21 (180)
Term Description
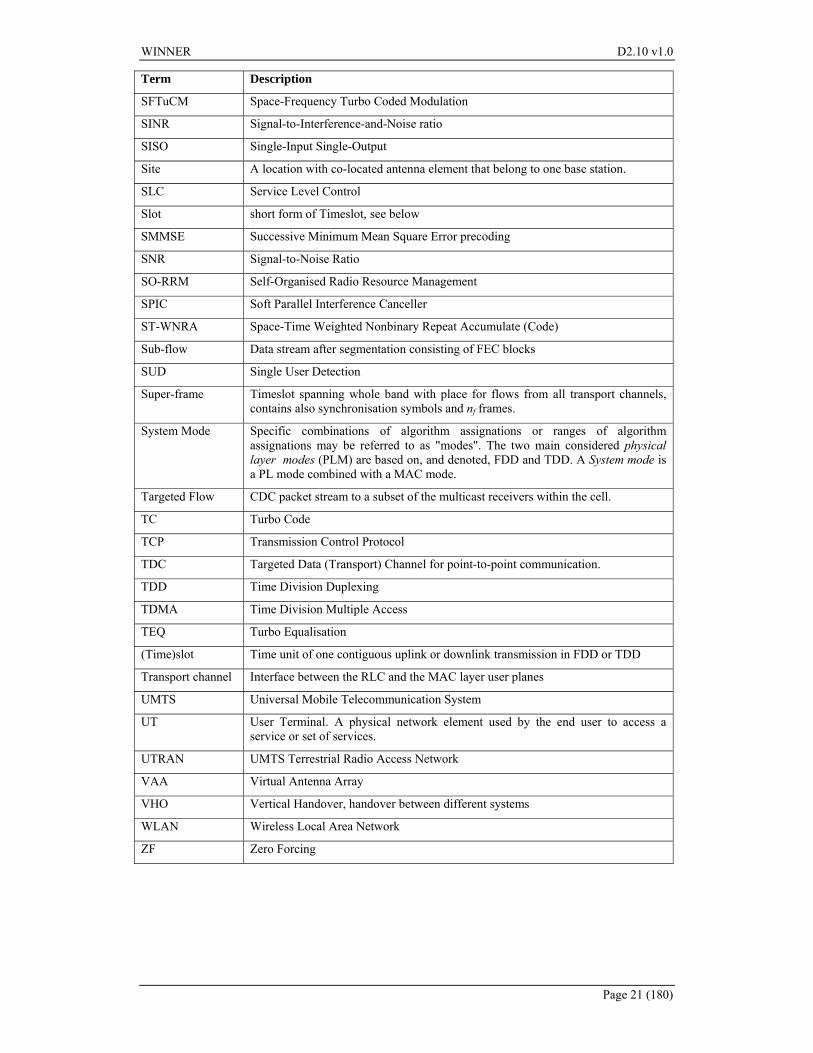
SFTuCM Space-Frequency Turbo Coded Modulation
SINR Signal-to-Interference-and-Noise ratio
SISO Single-Input Single-Output
Site A location with co-located antenna element that belong to one base station
SLC Service Level Control
Slot short form of Timeslot see below
SMMSE Successive Minimum Mean Square Error precoding
SNR Signal-to-Noise Ratio
SO-RRM Self-Organised Radio Resource Management
SPIC Soft Parallel Interference Canceller
ST-WNRA Space-Time Weighted Nonbinary Repeat Accumulate (Code)
Sub-flow Data stream after segmentation consisting of FEC blocks
SUD Single User Detection
Super-frame Timeslot spanning whole band with place for flows from all transport channels contains also synchronisation symbols and nf frames
System Mode Specific combinations of algorithm assignations or ranges of algorithm assignations may be referred to as modes The two main considered physical layer modes (PLM) are based on and denoted FDD and TDD A System mode is a PL mode combined with a MAC mode
Targeted Flow CDC packet stream to a subset of the multicast receivers within the cell
TC Turbo Code
TCP Transmission Control Protocol
TDC Targeted Data (Transport) Channel for point-to-point communication
TDD Time Division Duplexing
TDMA Time Division Multiple Access
TEQ Turbo Equalisation
(Time)slot Time unit of one contiguous uplink or downlink transmission in FDD or TDD
Transport channel Interface between the RLC and the MAC layer user planes
UMTS Universal Mobile Telecommunication System
UT User Terminal A physical network element used by the end user to access a service or set of services
UTRAN UMTS Terrestrial Radio Access Network
VAA Virtual Antenna Array
VHO Vertical Handover handover between different systems
WLAN Wireless Local Area Network
ZF Zero Forcing
WINNER D210 v10
Page 22 (180)
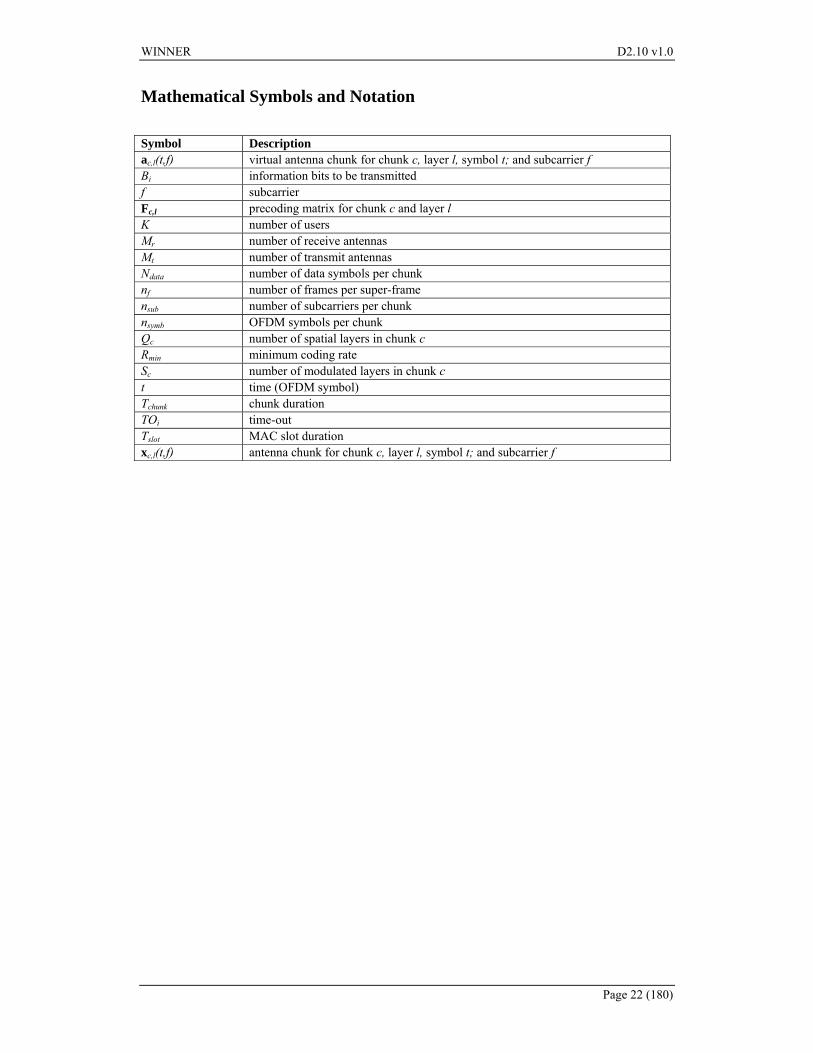
Mathematical Symbols and Notation
Symbol Description acl(tf) virtual antenna chunk for chunk c layer l symbol t and subcarrier f Bi information bits to be transmitted f subcarrier Fcl precoding matrix for chunk c and layer l K number of users Mr number of receive antennas Mt number of transmit antennas Ndata number of data symbols per chunk nf number of frames per super-frame nsub number of subcarriers per chunk nsymb OFDM symbols per chunk Qc number of spatial layers in chunk c Rmin minimum coding rate
Sc number of modulated layers in chunk c
t time (OFDM symbol)
Tchunk chunk duration
TOi time-out Tslot MAC slot duration
xcl(tf) antenna chunk for chunk c layer l symbol t and subcarrier f
WINNER D210 v10
Page 23 (180)
1 Introduction and Radio Interface Structure The definition of a new radio interface (RI) concept is an inherently iterative process determined not only by pure technical considerations but also by regulatory and other decisions or restrictions The technical and regulatory processes are mutually dependent From a design perspective this is clearly a problem since the regulatory framework is needed to provide an optimised solution On the other hand the regulatory process requires technical arguments and indications to define the system and spectrum framework
This is the prevailing situation under which the new WINNER system and in particular the new WINNER radio interface is developed It therefore provides solutions for different system frameworks and a wide range of possible spectrum allocations This document describes the general WP2 RI concept and current mainstream assumptions based on a consolidation process of previous WINNER deliverables and results Key technology concepts are assessed against the requirements and assessment criteria derived from WP7 work System design choices are guided by technical strategic and economic aspects Technical assessment criteria include system performance implementation aspects terminal and system complexity scalability and flexibility Also of major concern is the interworking with legacy radio technologies and efficient implementation of multi-standard equipment in particular OFDM-based systems eg like the one discussed in 3GPP long-term evolution (LTE)
The overall requirements design targets and key components for the WINNER RI are given in Chapter 1 Chapter 1 also provides some background to the system framework as far as required for the remainder of this document in the form of a top-down survey The contribution of this deliverable is discussed in the framework of the overall system concept work including service specification service architecture protocols and system design Thereafter Chapters 2ndash4 provide a detailed bottom-up discussion of the system design The physical layer design including transceiver diagrams coding modulation spatial processing synchronisation and channel estimation is explained in Chapter 2 Chapter 3 shows the functional design and architecture for the cellular medium access control (MAC) system layer and the MAC for peer-to-peer direct communications Chapter 4 does the same for radio resource management (RRM) and radio resource control (RRC) Chapter 5 gives an overview on key assessments performed to support design choices to exemplify favourable configurations of the RI and to obtain initial performance estimation For brevity these chapters focus on major results and key components further rationale and detail is provided in dedicated appendices for each topic
11 Requirements and design targets The WINNER system should fulfil the ITU-R Recommendation M1645 about systems beyond IMT-2000 (ie beyond 3G) In particular 100 Mbps peak aggregate useful data rate for mobile access and 1 Gbps for local area are assumed for these systems Peak data rates do not however give any indication on the quality of service experienced by one user and a set of amendments and extended system requirements are presented in [WIND71] A number of them are directly relevant to the radio interface
bull R36 Peak spectral efficiency in connected sites of 10 bitsHzsite in wide-area deployments for high load
bull R37 Peak spectral efficiency in isolated (non-contiguous) sites of 25 bitsHzsite
bull R32 A sustainable average ldquohigh endrdquo data rate per link of 50 Mbits above Layer 2
bull R33 A consistent and ubiquitous data rate per link of 5 Mbits above Layer 2
bull R312 User speeds ranging from 0ndash500 kmh should be supported
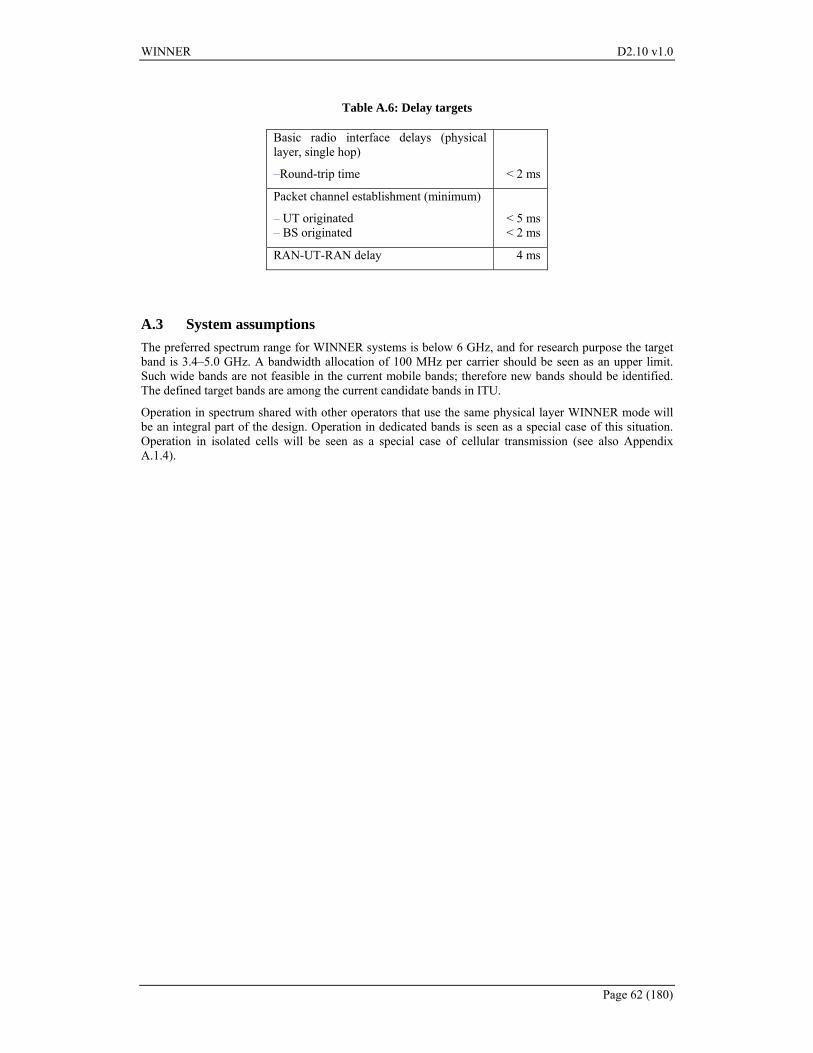
bull R34 A maximum delay over the radio interface of 1 ms at Layer 2
bull R67 Maximum bandwidth per radio link 100 MHz
Although providing useful indications these system requirements do not provide sufficient information to completely specify required capabilities and performance of the radio interface The reason is that several fundamental pieces of information eg the traffic intensity for which the system is to be designed the admission and congestion strategies the maximum allowed output power from different types of network nodes in different environments spectrum availability etc are not yet established ndash but crucial to calculate absolute numbers of many key parameters This uncertainty is unavoidable since most of the missing parameters are determined by pending political legal and strategic decisions of different regulating bodies and in the end by the network operator
WINNER D210 v10
Page 24 (180)
Nevertheless in order to develop an adequate system concept technical design targets and guidelines for the radio interface are needed at an early stage Therefore a number of scenarios believed to be relevant for the WINNER system have been identified and for each scenario a set of more technically oriented targets with details about bit rates and other parameters have been specified The scenarios and targets are summarised in Appendix A In Chapter 5 and its associated appendices (Appendix E Appendix F and Appendix G) comparisons of simulation results with these design targets are made In addition direct comparisons with the requirements are made to the extent possible In the latter case several additional assumptions about missing parameters are needed and there are many simplified conditions and uncertainties that must be borne in mind when interpreting such results as further discussed in Chapter 5
12 Key components of the radio interface In order to meet the requirements discussed above the WINNER radio interface has been designed as a packet-oriented user-centric always-best concept It defines a scalable and flexible radio interface based on adaptive and compatible system modes tailored to particular situations such as the radio environment the usage scenario the economic model etc The always-best solution is enabled by several innovative key components such as
bull a flexible multi-mode protocol architecture enabling efficient interworking between different system modes
bull relay-enhanced cells as an integrated part of the concept
bull design and support for operation in shared spectrum and inter-system coordination
bull consequent MAC design for packet-oriented transmission including two-layered resource scheduling and short radio interface delays
bull resource allocation targeting interference avoidance by coordinated scheduling across base stations and relay nodes or using joint (spatial) precoding over distributed antennas
bull physical layer design using generalised multi-carrier (GMC) in different configurations to ensure low complexity high spectral efficiency and high granularity of resource elements
bull a spatial multi-user link adaptation concept allowing scalability in link adaptation and multi-user optimisation and being able to adapt to a wide range of deployments operational scenarios propagation channel service requirements and terminal capabilities
bull novel multi-user precoding techniques developed within WINNER
bull support of self-organised synchronisation of terminals and base station
bull optimisation techniques for overhead and control signalling
A detailed discussion of these key elements is provided in the conceptual part of this document The remainder of Chapter 1 is dedicated to introducing the overall WINNER system concept in order to provide the necessary framework and nomenclature
13 Top-down overview of the WINNER system concept
131 Services protocols and design A challenging task in the concept development work is to ensure that the different key components can be embedded into one single radio interface concept that is technically sound for a ubiquitous radio system and its multiple deployment scenarios A fundamental principle is to study important problems from different perspectives in a systematic manner taking advantage of the large variety of technical competence that is available in the different working groups Consequently the radio interface concept development work is carried out from service-oriented protocol and design perspective The main differences between these three perspectives are that they all represent different levels of abstractions and technical details as illustrated in Figure 11 The studies of technical details and the development of abstractions are performed in parallel and complement each other
The service-oriented view is based on a top-down system engineering approach A system consists of layers and each system layer provides services towards the layer above Services and their users are first identified starting from the highest layer Identified services are broken into service components and the
WINNER D210 v10
Page 25 (180)
external behaviour of these components (as seen by the users) are modelled with high-level abstractions or provided service access point (PSAP) state-machines1 The main goal of this type of representation is to describe services without touching any technical details The resulting hierarchical structure of these behavioural descriptions is referred to as a service specification [WIND76] The service specification describes the system at the highest level of abstraction
Level of abstraction
Level of technical details
Radio interface design
Radio interface design
Protocol architecture
Protocol architecture
Layer-to-layer and
peer-to-peer
communication
Service specification
Service specification
Layer-to-layer
communication
Entity-to-entity
communication
Figure 11 The three views on radio interface concept studies
The service specification is further mapped to a service architecture that explains the provided services thus providing the starting point for the protocol view The service architecture describes the details of provided services by defining service access point (SAP) interfaces between layers One single PSAP state-machine may be mapped onto one or several SAPs eg (highly-abstract) packet transfer services (as described by the service specification) may be explained with multiple SAPs that are aimed for different purposes such as point-to-point and point-to-multipoint communication The definition of these interfaces is followed by a description of protocol architecture that is a set of radio protocols and protocol layers that implements the service architecture
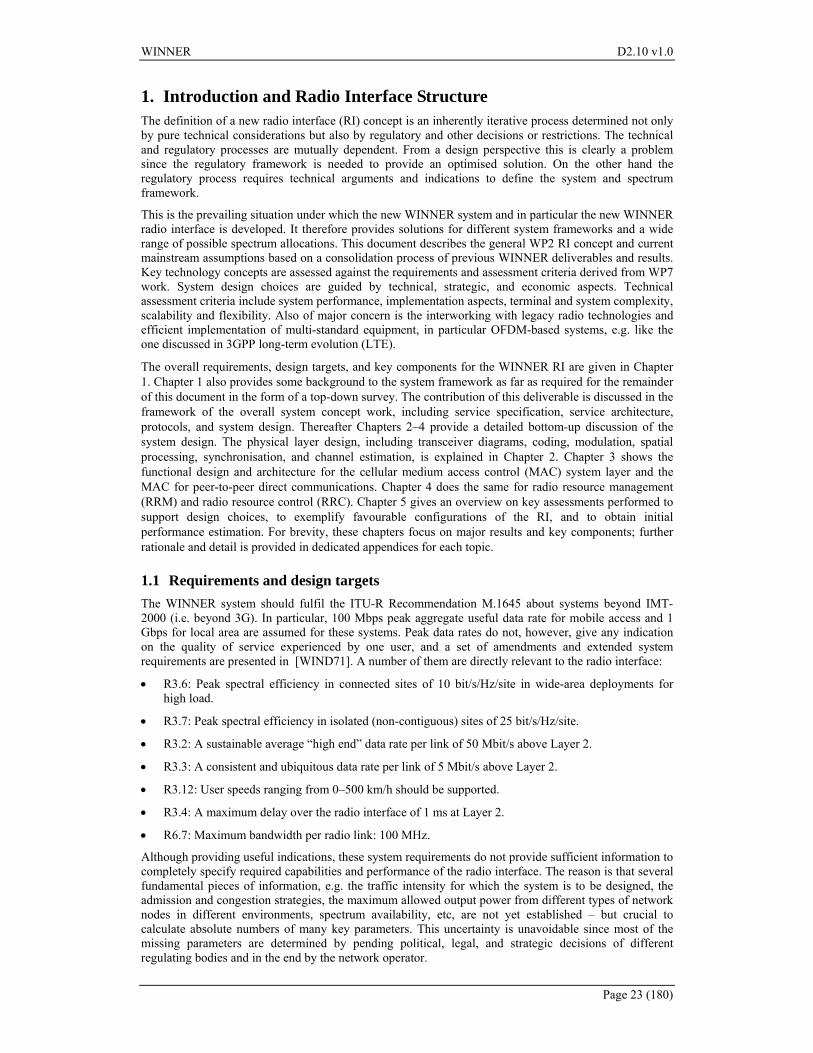
Protocols are in turn defined as set of rules and formats that govern the communication between protocol peer-entities2 ie communicating parties at the same level over the air Even though the placement of control functions and the formal description of protocols is currently under discussions there is a general consensus concerning the overall protocol structure and protocol layers Currently the overall structure consists of radio resource control (RRC) radio link control (RLC) medium access control (MAC) and Physical (PHY) protocol layers The RRC protocol is used by the radio resource management functions RLC protocol provides reliable packet transfer over the radio interface The MAC protocol arbitrates access to the shared medium and associates each destination with a unique address The PHY protocol is responsible for transferring information over a physical link As the vision is to connect the radio interface to an Ambient Network [AN05] upper layers handle the rest of the functionalities
The radio protocol architecture is shown in Figure 12 where SAPs are illustrated with circles and proto-col instances are illustrated with rectangles For further information about protocols and service-oriented descriptions see [WIND76 WIND35 WIND32 WIND31]
It should be emphasised that the radio protocol architecture is a very general description about the communication of two nodes over the air In order to ensure that the radio interface architecture can support all envisioned key technologies and reach the desired performance design and implementation related studies are important Of particular interest is to gain knowledge about the technical feasibility of envisioned key technologies for lower layers The design view describes the radio interface with the high-est level of technical details and it addresses problems that are related to radio interface functions and
1 In WP7 UML 20 is used to describe these state-machines 2 This should not be confused with the notion of peer-to-peer communication that later on (throughout this
deliverable) refers to direct communication between physical nodes
WINNER D210 v10
Page 26 (180)
detailed algorithmic solutions Since the main focus of this deliverable is on those lower layer protocols and functions and the evaluation of their performance the design perspective is consistently used throughout this document
PHY
RLCRLC
RLCRLC
RLC
MAC
RRC
rdquoTransportrdquo channels
Chunk rdquolayersrdquo
Packet transfer services
L1PHY
L2MAC
L2RLC
L3RRC
Figure 12 WINNER radio protocol layers and interfaces
132 System layers modes and parameterisation There are four system layers in the WINNER system concept according to the description in [WIND76] These layers are further divided into user plane and control plane The services that need to operate on individual data units (IP packets or lower layer PDUs) have been placed in the user plane The control plane services operate on longer time scales and control the operation of the user plane services by way of control signalling
1321 The system layers The functional role of each system layer is as follows
IP convergence (IPC) layer
The user plane of the IPC layer receives IP packets from the user of the WINNER RAN maps them into flows and performs header compression and decompression The control plane is responsible for RAN association functions as well as macro-mobility (IP level mobility)
Radio link control (RLC) layer
The user plane of the RLC layer provides reliable packet transfer over the radio interface It also performs confidentiality protection and packet prioritisation in order to meet the quality-of-service (QoS) goals The control plane takes care of flow establishment and release location services load spectrum and micro-mobility control These radio resource management (RRM) functions of the control plane will be described in Chapter 4 and Appendix D
Medium access control (MAC) layer
The MAC user plane provides the service ldquoradio packet transferrdquo ie transmission and reception of packets over the radio interface An important part of this service is the scheduling of packets The control plane provides the ldquoMAC radio resource controlrdquo service ie acceptance and execution of control messages from higher layers that specify required transmission parameters and boundary conditions Furthermore it implements ldquoMAC control feedbackrdquo ie messaging that supports the flow control the QoS control and the spectrum assignment and other functions at the RLC system layer There is a tight inter-layer interaction between MAC and physical layers and this is crucial for the performance of the WINNER system Some functions such as encoding and decoding that are traditionally placed in the physical layer are in the WINNER system concept placed in the MAC system layer The MAC system layer is outlined in Chapter 3 and Appendix C
WINNER D210 v10
Page 27 (180)
Physical (PHY) layer
The PHY system layer handles the physical transmission of flows and of measurements and control signalling directly related to the radio interface The PHY system layer is not separated into user plane and control plane since it is assumed that all control functionality for the PHY layer resided within the control plane of the MAC system layer The design of the PHY system layer is one of the major topics of this document It is described in Chapter 2 and Appendix B
1322 Physical layer modes and flexible parameterisations The WINNER architecture should be unified yet flexible enough to handle deployments from wide area coverage to high capacity hot spots A basic goal is that the WINNER radio interface should present a unified set of services to higher layers yet include some specific parts that provide the required flexibil-ity To provide flexibility and convergence in a structured way the definition of modes is helpful
A physical layer mode (PLM) can be defined where there is a significant impact (discontinuity in adap-tation) of PHY functionality on the radio interface concept Two PLMs have been defined
bull Frequency division duplex (FDD) transmission performed over paired bands and supporting half-duplex FDD terminals
bull Time division duplex (TDD) transmission over unpaired band
Although any PLM can be configured for any kind of deployment in this document the FDD mode is evaluated primarily in wide-area cellular deployment scenarios using frequency bands of different width The TDD PLM has so far primarily been evaluated in short-range cellular deployment
A system mode represents a specific combination of physical layer modes and MAC modes (Section 83 of [WIND76]) All higher layer functions are designed to be mode-independent (generic) and form the unified interface of the WINNER system
There are three MAC modes within the concept
bull FDD cellular MAC
bull TDD cellular MAC
bull MAC for peer-to-peer transmission at present designed using the TDD physical layer mode
The combinations of PHY and MAC modes thus define three WINNER system modes
Parameterisations within modes provide further flexibility and adaptability Both PLMs use generalised multi-carrier (GMC) transmission which includes CP-OFDM and serial modulation as special cases (Section 222) Multiple access is realised in frequency time space and in particular cases also in the code domain Further details are provided in Section 316
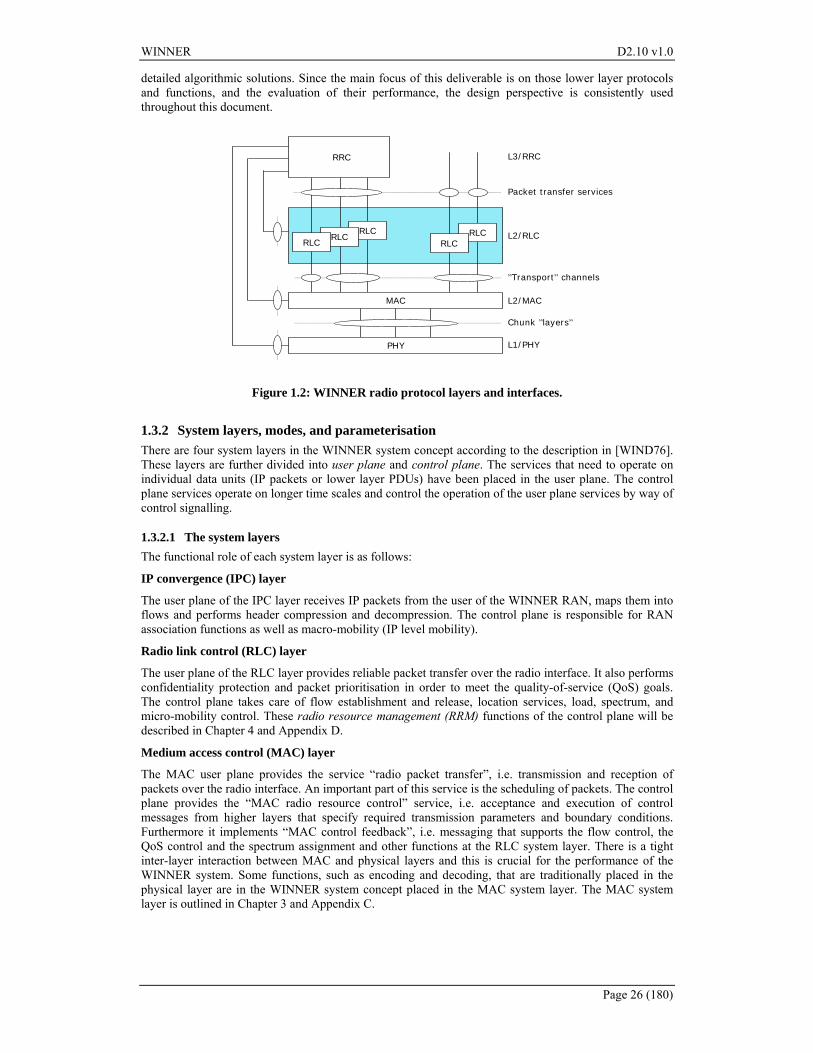
The basic time-frequency unit for resource partitioning is denoted a chunk It consists of a rectangular time-frequency area (see Figure 13 a) that contains payload symbols and pilot symbols It may also contain control symbols that are placed within the chunks to minimise feedback delay (in-chunk control signalling) The number of offered payload bits per chunk depends on the utilised modulation-coding formats and on the chunk sizes In transmission using multiple antennas the time-frequency resource defined by the chunk may be reused by spatial multiplexing A chunk layer represents the spatial dimen-sion (Figure 13 b)
The chunks and chunk layers are pre-assigned to different types of data flows on a super-frame time scale (Section 314 and Appendix C11) They are then used in a flexible way to optimise the transmission performance For example
bull The antenna resources can be used differently for different flows tofrom user terminals
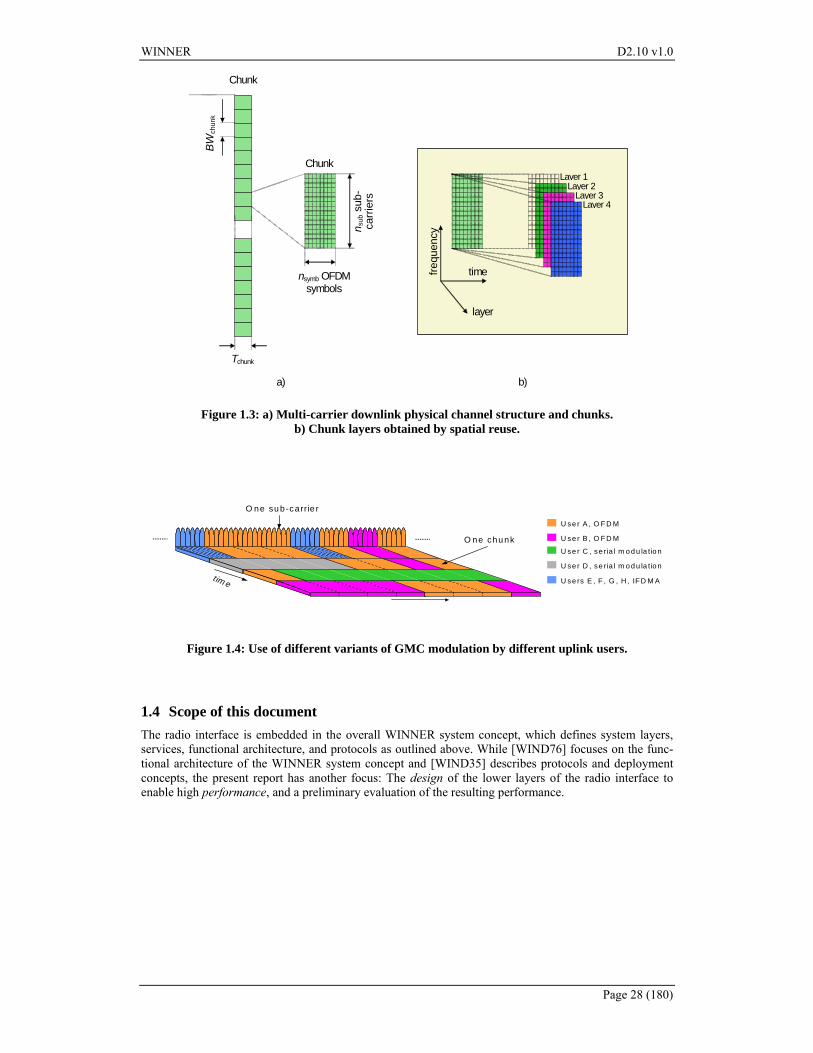
bull Different users may use different variants of GMC as depicted in Figure 14 For example in uplinks power-constrained users may use single-carrier waveforms within their assigned transmission resources while other terminals use CP-OFDM A prerequisite for attaining both efficiency and flexibility is efficient synchronisation of all transmissions within a cell (Appendix B4)
The coming chapters will describe the concepts used to combine the desired flexibility with the equally desired high efficiency two goals that are often contradictory and challenging to combine
WINNER D210 v10
Page 28 (180)
Tchunk
BWch
unk
nsymb OFDM symbols
n sub
sub
- ca
rrie
rs
Chunk
Chunk
time frequ
ency
Layer 1 Layer 2
Layer 3 Layer 4
layer
a) b)
Figure 13 a) Multi-carrier downlink physical channel structure and chunks b) Chunk layers obtained by spatial reuse
tim e
O ne chunk
U se rs E F G H IF D M A
U se r C se ria l m o d u la tio n
U se r D se ria l m o d u la tio n
U se r A O F D M
U se r B O F D M
O ne sub-carrie r
Figure 14 Use of different variants of GMC modulation by different uplink users
14 Scope of this document The radio interface is embedded in the overall WINNER system concept which defines system layers services functional architecture and protocols as outlined above While [WIND76] focuses on the func-tional architecture of the WINNER system concept and [WIND35] describes protocols and deployment concepts the present report has another focus The design of the lower layers of the radio interface to enable high performance and a preliminary evaluation of the resulting performance
WINNER D210 v10
Page 29 (180)
2 Physical Layer The design of the physical layer implements several innovative features of the WINNER concept
bull A slotted time-frequency chunk pattern that can be adjusted to different propagation scenarios The chunk and frame durations are short which is a basic requirement for a low transmission delay over the radio interface
bull A transmission chain based on generalised multi-carrier (GMC) which enables flexible switching between multi-carrier modulation and (frequency-domain generated) serial modulation
bull A flexible spatial processing is integrated into the transmission and reception chains
bull A scattered pilot grid that supports efficient channel estimation also on chunk basis at very low overhead The cyclic prefix is used to achieve coarse intra-cell synchronisation Additionally training symbols at the beginning of the super-frame enable inter-cell synchronisation also in cases where no global timing reference (eg GPS) is available
bull Efficient means have been developed for compressing the channel quality information feedback required for adaptive transmission and the channel state information required for some multi-antenna schemes These methods reduce the required feedback overhead to reasonable levels
The purpose of this chapter is to present a concise summary of the current selection of technologies for different parts of the WINNER physical layer To provide the rationale behind this selection a detailed assessment is given in Appendix B (concept details) and Appendix F (simulation results) including a summary of the results from previous deliverables [WIND21 WIND22 WIND23 WIND24 WIND27]
21 Forward error correction Among the large number of possible options for forward error correction identified in [WIND21] three techniques have been identified as main candidates for the WINNER system [WIND23] convolutional codes (CC) parallel concatenated convolutional codes (PCCC Turbo Codes) and low-density parity-check codes (LDPCC) More specifically Duo-Binary Turbo-Codes (DBTC) and Block-LDPC Codes (BLDPCC) are able to provide excellent performance at medium to large block sizes (200 information bits and beyond) while taking implementation simplicity (eg parallelisation memory requirements) into account already in the code design phase BLDPCC outperform DBTC at large block lengths andor high code rates (for a detailed assessment please refer to Appendix B2) The use of convolutional codes is currently considered for block lengths below 200 information bits However DBTC show very good performance also in this regime so that CC might eventually not be needed to implement channel coding in the WINNER radio interface
Table B1 in Appendix B summarises the relative merits of the three candidate technologies with respect to the most relevant assessment criteria Details on the assessment can be found in [WIND23] and Appendix B2 Note that while the discussion on FEC schemes forms part of the PHY chapters coding in the WINNER system will be mainly implemented in the MAC system layer (MAC-2 sub-layer) as detailed in the Chapter 3 Only convolutional coding as a part of the (spatial) link adaptation within individual chunks will form part of the PHY system layer
In situations where the channel coding gain (using reasonable code rates eg 13 and above) is not suffi-cient to support reliable transmission additional spreading can be used to provide reasonable SINR values This avoids further decoding complexity as would be the case for low-rate channel codes It is however understood that this comes at the expense of lower achievable data rates
WINNER D210 v10
Page 30 (180)
22 Modulation and space-time-frequency processing
221 General resource allocation strategy The overriding principle for allocating the total available resources is to strive primarily for orthogonal use of time-frequency resources Non-orthogonality for example in the form of CDMA SDMA or contention-based signalling is allowed only within carefully prescribed subsets of the total resources designed to limit interference with other parts of the resource pool Furthermore some resources have to be reserved as guard bandsguard spaces to preserve the orthogonality Extension of the orthogonality from single cellssectors to clusters of neighbouring sectors can be done for example by
bull interference avoidance scheduling between cells or
bull joint (spatial) precoding (and detection) over sectors [SWW+04 LWZ04]
For the spatial dimension non-orthogonality is unavoidable spatial reuse of time-frequency resources will always create some interference The general time-frequency space transmission chain outlined in Appendix B1 provides means to tailor and control such interference as outlined in Appendix C17
222 Modulation technique Block signal processing in the frequency domain at both transmitter and receiver using efficient fast (inverse) Fourier transform (IFFTFFT) operations is a natural choice for future high bit rate wireless radio interfaces as signal processing complexity per data symbol rises only logarithmically with the channel delay spread [FK05] Furthermore frequency domain processing enables transmitters to easily and adaptively shape their spectrum occupancy in response to user data rate requirements user terminal capabilities and the availability of unoccupied spectrum It also enables flexible choice of bit rates modulation formats and multiple access schemes according to the current channel state and user need
The generalised multi-carrier (GMC) technique [WIND21 WIND23] will be used for modulation in WINNER as it is essential for providing the flexibility needed to fulfil the ldquoalways bestrdquo principle also on the physical layer It enables to accommodate a plurality of multi-carrier modulationmultiple access schemes such as different flavours of OFDM (CP-OFDM IOTA-OFDM PRP-OFDM) FMT and MC-CDMA as well as the following serial modulation schemes single carrier single carrier DS-CDMA and IFDMA This is done by selection of an appropriate mapping strategy (data symbols to subcarriers) guard interval design and (frequency domain) filtering The GMC approach is also extremely useful in generating multi-band signals for spectrum flexibility [WIND22]
A small set of the above stated modulation technique options will be sufficient to efficiently adapt the WINNER system to the most relevant deployment scenarios outlined in Appendix A1 This restriction will also keep the complexity of the WINNER radio interface in terms of implementation options at a reasonable level To enable the choice of appropriate techniques their relative merits have been thoroughly studied [WIND21 WIND22 WIND23] The results of this assessment work are summarised in Table B3 and the following options have been selected for use in the WINNER system
bull GMC configured as standard CP-OFDM
o for downlink transmission in the TDD and FDD modes
o for uplink transmission when terminal power consumption is not a limiting factor
bull GMC configured as serial modulation (DFT precoded CP-OFDM)
o for uplink transmission in the power limited wide-area case
The above specifications define only the modulation technique ndash the choice of appropriate multiple access schemes for the different modes is discussed in Chapter 3 For adaptive transmission chunk-based OFDMA will be used for non-frequency adaptive transmission MC-CDMA in conjunction with FDMATDMA is the preferred option while for the serially modulated uplink FDMATDMA is envisioned (eg DFT-precoded block OFDMA or IFDMA)
The specific parameterisation of these transmission techniques is governed by the physical channel conditions as outlined in [WIND23] Based on this methodology appropriate parameters have been selected and are summarised in Table 21 Non-differential M-QAM modulation (with BPSK as a special case) is proposed for the use in the WINNER system since channel state information can be made available to the receiver at relatively low pilot overhead in all scenarios as detailed in Section 23 For the wide-area scenario modulation formats up to 64-QAM are proposed while for short-range transmission
WINNER D210 v10
Page 31 (180)
even 256-QAM appears to be feasible Gray mapping is proposed as it is a natural choice for the bit labelling facilitating the calculation of soft output at the detector with low complexity The use of other labellings (in combination with a weaker outer code) is also under investigation in the context of iterative equalisation andor channel estimation
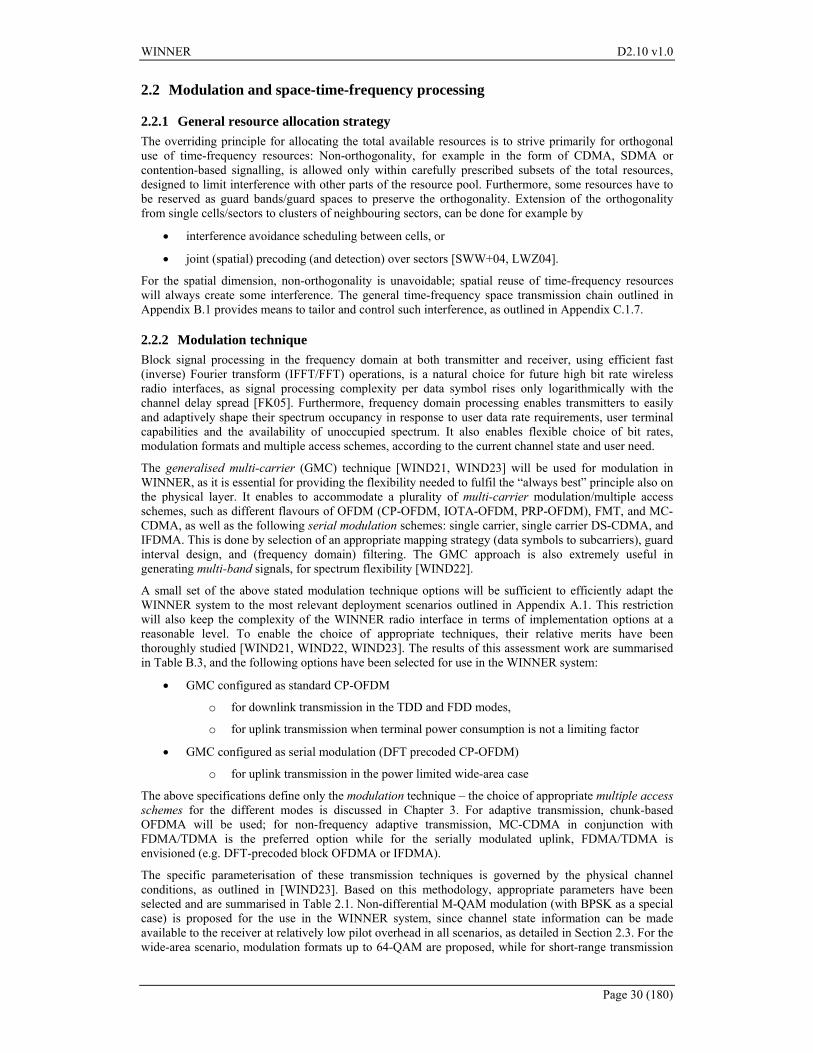
223 Modulation parameters The configuration presented below was used for investigations during the last part of WINNER Phase I Note that the real WINNER system will be required to support several different configurations (parameter sets) in order to effectively adapt to differing channel conditions and fulfil the ldquoalways-bestrdquo objective The parameters listed below are examples for such parameter settings which can be used to study the relative merits of different techniques They are however not claimed to be optimal and refined sets of parameters might be used for Phase II A framework for deriving appropriate parameter sets can be found in [WIND23] The range of reasonable values is much wider for the TDD mode than for the FDD mode where parameter ranges are more severely constrained by assumed channel delay spreads and vehicular velocities [WIND23] in the wide-area scenario All uplink transmissions are embedded in the super-frame and are assumed to be fine-synchronised The assumed centre frequencies are worst-case values The use of FFT sizes up to 2048 has been assumed to be reasonable from an implementation point of view
Table 21 Basic transmission parameters used for simulation of GMC based systems
Parameter FDD mode
(2times20 MHz)
TDD mode
Unitsnotes
Centre frequency 50 DL 42 UL 50 GHz
Duplexing method FDD (paired)
TDD
FFT BW 200 1000 MHz
Number of subcarriers in GMC 512 2048 Equals length of FFT
Subcarrier spacing 39062 48828 Hz
Symbol length
(Excluding cyclic prefix)
2560 2048 micros
Cyclic prefix length 320 128 micros
Total symbol length 2880 21763 micros
Number of subcarriers in use 416 1664 [-208208] and [-832832]
Subcarrier 0 not used
Signal BW 1625 8125 MHz
Chunk size in symbols 8times12 = 96 16times5 = 80 Subcarriers times Symbols
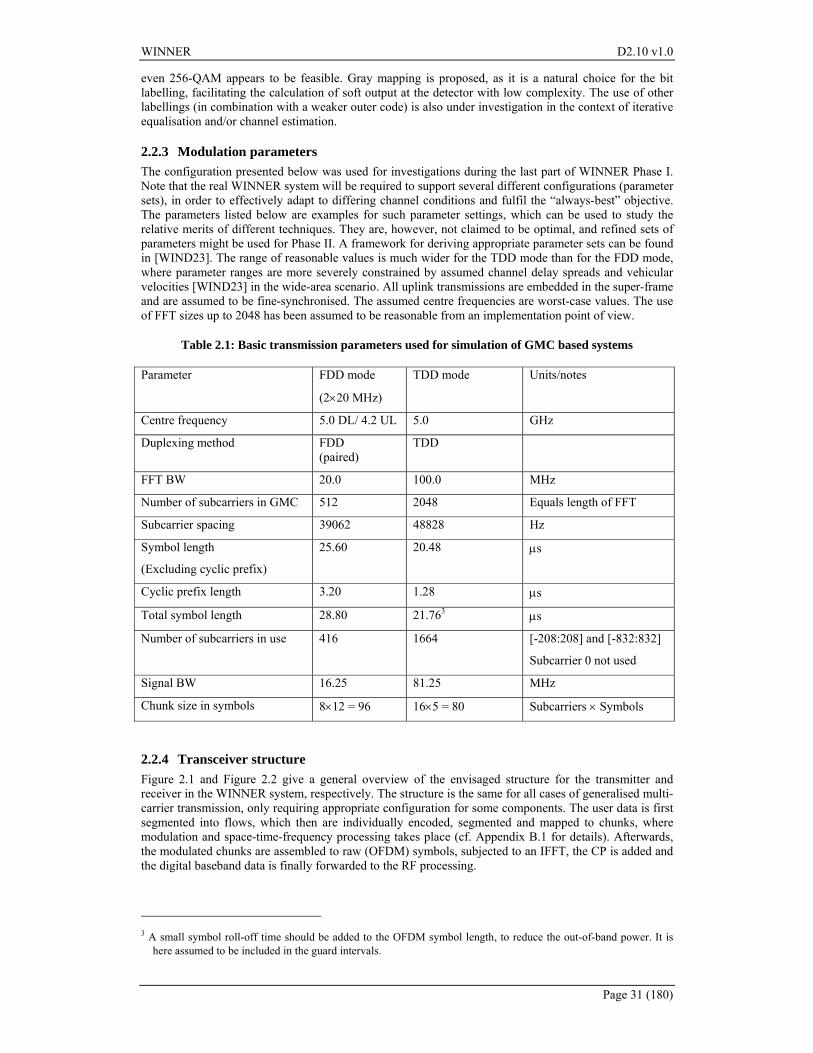
224 Transceiver structure Figure 21 and Figure 22 give a general overview of the envisaged structure for the transmitter and receiver in the WINNER system respectively The structure is the same for all cases of generalised multi-carrier transmission only requiring appropriate configuration for some components The user data is first segmented into flows which then are individually encoded segmented and mapped to chunks where modulation and space-time-frequency processing takes place (cf Appendix B1 for details) Afterwards the modulated chunks are assembled to raw (OFDM) symbols subjected to an IFFT the CP is added and the digital baseband data is finally forwarded to the RF processing
3 A small symbol roll-off time should be added to the OFDM symbol length to reduce the out-of-band power It is
here assumed to be included in the guard intervals
WINNER D210 v10
Page 32 (180)
For OFDM transmission the ldquoGMCrdquo preprocessing block in Figure 21 would only contain (optional) frequency domain filtering For serial modulation however it is necessary to subject the modulated symbols to a FFT prior to any frequency domain (spatial) processing ie modulation has to be done prior to the formation of chunks (spatial processing for single carrier transmission may also be done in the time domain) This operation will be done in the GMC processing block of Figure 21 a block of M modulated symbols that eventually will be turned into one or more chunks will be passed through an M-point FFT The M symbols are now in the frequency domain and are mapped into the specified chunk layers The remaining processing is equivalent to that for other GMC signals eg OFDM It should be emphasised that this approach somewhat reduces the flexibility of the system in the case of serial modulation as all chunks within one serially modulated block will have to undergo the same kind of spatial processing However as serial modulation is envisaged for uplink transmission from user terminals only it will anyway require only a quite basic configuration of the generic spatial processing chain described in detail in Appendix B1 so this limitation is not very severe
Figure 21 Overview of transmitter structure
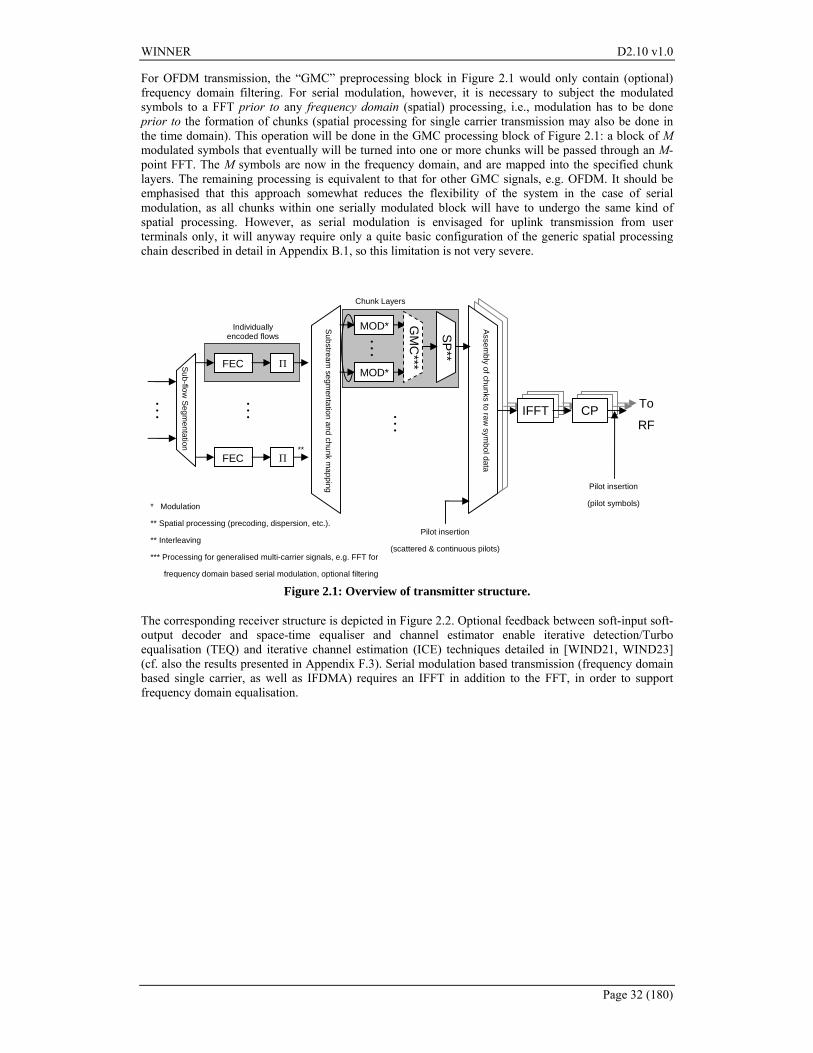
The corresponding receiver structure is depicted in Figure 22 Optional feedback between soft-input soft-output decoder and space-time equaliser and channel estimator enable iterative detectionTurbo equalisation (TEQ) and iterative channel estimation (ICE) techniques detailed in [WIND21 WIND23] (cf also the results presented in Appendix F3) Serial modulation based transmission (frequency domain based single carrier as well as IFDMA) requires an IFFT in addition to the FFT in order to support frequency domain equalisation
IFFT CP
FECSub-flow
Segm
entation
Π
hellip
FEC Π
Substream
segmentation and chunk m
apping
Individually encoded flows
Chunk Layers
Pilot insertion
(scattered amp continuous pilots)
hellip
helliphellip
Assem
bly of chunks to raw sym
bol data
To
RF
Pilot insertion
(pilot symbols)
SP
GM
C
Modulation
Spatial processing (precoding dispersion etc)
Interleaving
Processing for generalised multi-carrier signals eg FFT for
frequency domain based serial modulation optional filtering
MOD
MOD
WINNER D210 v10
Page 33 (180)
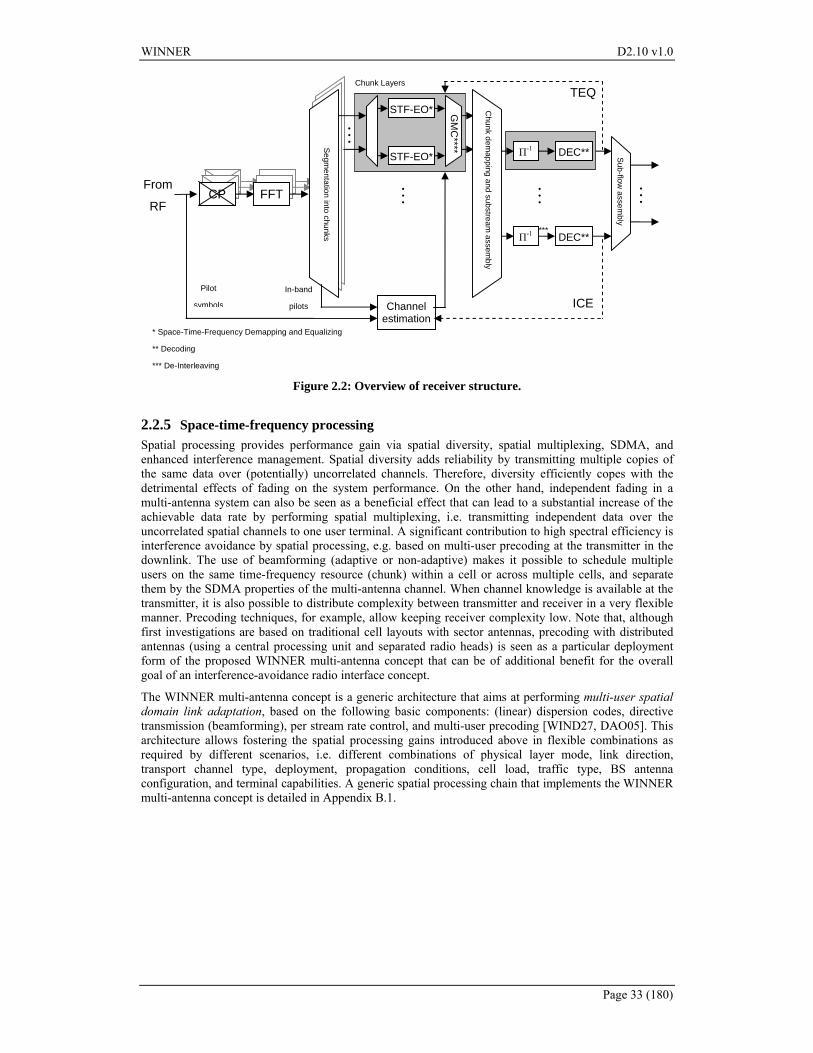
Figure 22 Overview of receiver structure
225 Space-time-frequency processing Spatial processing provides performance gain via spatial diversity spatial multiplexing SDMA and enhanced interference management Spatial diversity adds reliability by transmitting multiple copies of the same data over (potentially) uncorrelated channels Therefore diversity efficiently copes with the detrimental effects of fading on the system performance On the other hand independent fading in a multi-antenna system can also be seen as a beneficial effect that can lead to a substantial increase of the achievable data rate by performing spatial multiplexing ie transmitting independent data over the uncorrelated spatial channels to one user terminal A significant contribution to high spectral efficiency is interference avoidance by spatial processing eg based on multi-user precoding at the transmitter in the downlink The use of beamforming (adaptive or non-adaptive) makes it possible to schedule multiple users on the same time-frequency resource (chunk) within a cell or across multiple cells and separate them by the SDMA properties of the multi-antenna channel When channel knowledge is available at the transmitter it is also possible to distribute complexity between transmitter and receiver in a very flexible manner Precoding techniques for example allow keeping receiver complexity low Note that although first investigations are based on traditional cell layouts with sector antennas precoding with distributed antennas (using a central processing unit and separated radio heads) is seen as a particular deployment form of the proposed WINNER multi-antenna concept that can be of additional benefit for the overall goal of an interference-avoidance radio interface concept
The WINNER multi-antenna concept is a generic architecture that aims at performing multi-user spatial domain link adaptation based on the following basic components (linear) dispersion codes directive transmission (beamforming) per stream rate control and multi-user precoding [WIND27 DAO05] This architecture allows fostering the spatial processing gains introduced above in flexible combinations as required by different scenarios ie different combinations of physical layer mode link direction transport channel type deployment propagation conditions cell load traffic type BS antenna configuration and terminal capabilities A generic spatial processing chain that implements the WINNER multi-antenna concept is detailed in Appendix B1
From
RF
STF-EQ
FFT CP
Segm
entation into chunks
DEC Π-1
DEC Π-1
Sub-flow
assembly
Chunk Layers
STF-EQ
helliphellip hellip
hellip
Channel estimation
In-band
pilots
Pilot
symbols
TEQ
ICE
Chunk dem
apping and substream assem
bly
GM
C
Space-Time-Frequency Demapping and Equalizing
Decoding
De-Interleaving
WINNER D210 v10
Page 34 (180)
23 Pilot grid design for channel estimation and synchronisation
231 Synchronisation For synchronisation we have to distinguish between coarse synchronisation (acquisition) where all other relevant system parameters are still unknown and fine synchronisation (tracking) where a previous coarse estimate is further improved and adapted to variations of eg the local oscillator Furthermore there are three quantities which have to be synchronised in an OFDM system
bull OFDM symbol and frame timing
bull Carrier frequency
bull Sampling rate
The choice of an appropriate synchronisation strategy for the radio interface is based on several criteria
bull Robustness expressed in the lock in probability ie the probability of successful acquisition
bull Residual synchronisation offsets in the steady state
bull Time required to achieve synchronisation
bull Required overhead
With respect to synchronisation the scenarios in which the WINNER radio interface is to operate can be distinguished as follows
bull Hot spot mainly indoor environment with no significant interference from adjacent BSs
bull Wireless network with global reference time All BSs operate synchronised governed by a global reference clock which may be provided by the Global Positioning System (GPS) or the European Satellite Navigation System (Galileo)
bull Synchronised wireless network without timing reference If no global timing reference is available synchronisation of the network can be achieved in a self-organised way Since coordinated operation of a wireless network essentially requires BSs to be synchronised it is generally believed that the attainable system capacity of a synchronised wireless network exceeds a non-synchronised network
bull Uncoordinated wireless network BSs operate non-synchronised In this case the UT needs to be able to distinguish between several signals in order to identify the closest BS
For synchronisation purposes different types of pilots are foreseen for the WINNER system concept
bull Two sets of training symbols (uplink and downlink) consisting of three OFDM symbols are included in the super-frame preamble for self organised inter- and intra-cell synchronisation The structure of the training symbols and the related synchronisation algorithms are described in Appendix B41
bull Continual pilot subcarriers (or tones) They may serve various purposes such as phase noise compensation tracking of carrier and sampling frequency offset (see [WIND23] Section 6252) In combination with cyclic prefix based synchronisation differential modulation of the pilot tones allows establishing frame synchronisation as well as to detect frequency offsets of a multiple of the subcarrier spacing [SFF+99]
Within the WINNER framework a synchronisation concept that can synchronise a wireless network in a self-organised way has been identified in [WIND21] The algorithm relies on dedicated set of training symbols inserted in the super frame preamble In Appendix B41 its basic principles are summarised and some enhancements are presented Simulation results reported in [WIND23] show that both frequency and time synchronisation of all BSs within the cellular network can be achieved after 20 super-frames with remaining frequency offset of about 1 of the subcarrier spacing and time offset of about 10 of the guard interval respectively Since the duration of one super-frame is 8x12 and 8x30 OFDM symbols for the WINNER FDD and TDD modes respectively the time to synchronise for this algorithm totals to about 110 ms for 20 super-frames which may be too long for some applications
For hot spots or for networks with access to a global timing reference synchronisation utilizing the cyclic prefix in combination with continual pilot tones is considered to be an appropriate choice [WIND21 WIND23] This approach is in particular attractive for OFDM systems with a large number of subcarriers in terms of pilot overhead and performance [BBB+99] It is demonstrated in Appendix F41 that reliable
WINNER D210 v10
Page 35 (180)
acquisition can be achieved within 12 OFDM symbols at SNR gt -4 dB Furthermore a scattered pilot grid predominantly used for channel estimation (see Appendix B42) can be used to achieve acquisition in a non-synchronised wireless network However numerical results in Appendix F41 suggest that the carrier frequency offset must not exceed half of the subcarrier spacing for this algorithm to work
A timing advance strategy which compensates for the propagation delays between signals transmitted from UTs to their assigned BS during uplink is proposed in Appendix B41 The proposed ranging process enables the UTs to estimate the propagation delays of their signals by utilising individual synchronisation tones This information is subsequently used for a time advanced transmission during uplink providing a time aligned arrival of different usersrsquo signals at the BS If the synchronisation tones are retransmitted by the UTs after the ranging process is finished they may further be used for a fine estimation of the carrier frequency offset at the BS
232 Channel estimation For channel estimation purposes the following types of pilots are foreseen
bull A scattered pilot grid is used for OFDM channel estimation and channel prediction For the pilot grids presented in B42 the pilot overhead is 25 and 4 per spatial stream for the WINNER TDD and FDD mode respectively In Appendix F41 it is shown that a scattered pilot grid could also be utilised for acquisition in a non-synchronised wireless network
bull In OFDM uplinks that use adaptive transmission channels from many users have to be estimated and predicted in each chunk Methods based on simultaneous pilot transmission from all candidate terminals (overlapping pilots) can then be used to limit the pilot overhead fraction in the uplink [WIND24]
bull For uplink (frequency domain generated) serial modulation pilot patterns may be generated in the frequency domain in either of two ways The first way is to use a scattered pilot grid equivalent to OFDM Alternatively pilot patterns for serial modulation in the uplink may be generated in the time domain in the form of short training blocks time-multiplexed with data blocks Both techniques are described in Appendices B42 and F31 respectively
For multi-antenna transmission a combination of dedicated pilots per flow common pilots per cellsector common pilots per antenna and common pilots per beam are required as described in Appendix B42 Interference estimates per chunk layer or averaged over chunk layers may be obtained as by-products of the pilot-based channel estimation The residual ie the signal component that cannot be explained through the known pilots and the channel model is used as interference estimate
Channel estimation by interpolation in time and frequency based on a scattered pilot grid is considered to be an efficient solution for an OFDM-based radio interface [WIND21 WIND23] In Appendix B42 a generic framework for the pilot design of GMC signals is described To this end a scattered pilot grid is applicable to any GMC signal Alternatively short time domain training symbols can be implemented for single carrier signals on the uplink
During the start of communication interpolation techniques with limited information about the channel conditions must be used An unbiased channel estimation scheme which does not require any information about the channel statistics is proposed and evaluated in Appendix F34 A robust interpolation filter which only assumes knowledge about the CP duration and the maximum velocity expected in a certain environment is another possible choice cf results in [WIND23] and Appendix F32 During operation statistical knowledge about the power delay profile and the Doppler spectrum is accumulated Channel interpolation utilizing this knowledge can improve performance significantly (see Appendix F33)
Especially in case of dedicated pilots purely pilot aided techniques may have severe limitations Conventional channel estimation by interpolation may then require a pilot boost andor a significant degree of over-sampling Advanced solutions such as iterative channel estimation aim to make a pilot boost redundant at the expense of increased complexity cf results in [WIND23] and Appendix F32 If an iterative receiver structure is already in place iterative channel estimation offers a good compromise between performance and complexity
Adaptive transmission requires channel prediction for use in the resource allocation Channel prediction can be based on common pilot symbols that are also used for other purposes It should utilise the channel correlation in time and frequency In Appendix B52 the results obtained by using Kalman state-space algorithms in the frequency domain for prediction are outlined Similar results are obtained with time-domain extrapolation of channel taps With these methods adaptive transmission becomes possible in the WINNER system at vehicular velocities The channel prediction accuracy estimates (covariances) are furthermore important inputs in the design of the link adaptation and resource scheduling schemes
WINNER D210 v10
Page 36 (180)
3 Medium Access Control (MAC) Layer The WINNER medium access control (MAC) system layer is designed as three MACs (modes)
bull FDD cellular MAC including multiple-access multi-hop and multi-antenna aspects
bull TDD cellular MAC including multiple-access multi-hop and multi-antenna aspects
bull MAC for peer-to-peer transmission at present based on the TDD physical layer mode
The first two have a largely identical design and are described briefly in the section below with additional details in Appendix C1 See also [WIND76] The peer-to-peer MAC is outlined in Section 32 with further details in Appendix C2
31 Medium access control for FDD and TDD cellular transmission
311 Goals and design principles The cellular MAC design supports and enables several innovative features of the WINNER system
bull The super-frame is designed with pilots that support self-organised synchronisation of all involved base stations relay nodes and user-terminals Having a synchronised network enables an improved spectral efficiency in two ways it makes large guard-bands unnecessary and simplifies interference-avoidance scheduling between cells and relay nodes
bull MACs for FDD and TDD cellular transmission support fast transmission and very low re-transmission delays over the RI These properties are key to attaining high spectral efficiency via adaptive schemes [WIND24] reliable communication through efficient re-transmission and high data rates for TCPIP traffic
bull Adaptive transmission is integrated into the design on all time scales Up to moderate vehicular velocities link adaptation and scheduling can be performed with fine granularity in the frequency domain (OFDMATDMA) This provides multi-user scheduling gains for mobile as well as stationary terminals For higher velocities the transmission only adapts to the path loss and shadow fading On a super-frame time scale the resource partitioning can adapt to the traffic demand over different transport channels
bull Multi-antenna transmission can be adjusted in a very flexible way per flow to obtain an appropriate balance between different objectives Obtaining multiplexing gains to boost throughput achieving robustness via diversity transmission and obtaining SDMA gains by transmitting flows to different user terminals over different spatial channels
bull Operation in spectrum shared with other operators who all use the same physical-layer WINNER mode [WIND63] will be an integral part of the design Operation in dedicated bands is seen as a special case of this situation Such single-system shared spectrum use has the potential of both improving the flexibility and simultaneously increasing the throughputspectral efficiency
bull The super-frame and the resource partitioning are designed to work efficiently in conjunction with inter-cell interference-avoidance schemes They are also designed for relay-enhanced cells so that base stations and a set of relay nodes can share the total spectral resources efficiently
In the design of the adaptive transmission system the different reaction times and control time scales of various control functions have been an important guiding principle The slower control functions have been placed as RRM functions in the control plane of the RLC system layer (see Appendix D1) The faster control functions are located in the MAC control plane while the fastest ones which directly control data flows are located in the MAC user plane To minimise transmission time delays due to communication between nodes a complete MAC layer is assumed to be implemented at each base station (BS) and at each relay node (RN) Thus all antenna resources belonging to a BS or a RN can be controlled tightly by the MAC system layer Cooperative multi-antenna transmission and distributed antenna systems are supported when all antennas are regarded as encompassing one BSRN
312 Control of relay-enhanced cells The MAC system layer is designed to work in relay-enhanced cells (REC) in which a set of nodes (RNs or BS) are linked to each other over the air (Nodes here refer to logical nodes cf [WIND35]) The BS but not the RNs has a fixed connection to the RAN The RNs may be used for improving the coverage
WINNER D210 v10
Page 37 (180)
within the cell or for extending the range of the cell Each RN is connected to one but not more BSs Some or all UTs may communicate directly with the BS If RNs are present some UTs may transmit toreceive from these RNs The MAC implemented in each RN controls those transmissions Thus the RNs essentially control separate sub-cells The MAC system layer controls flows over a single hop Flow QoS control over links spanning multiple hops is the responsibility of the RLC layer
While both heterogeneous and homogenous relaying is under consideration the cellular MAC design has focused on the more challenging case of homogenous relaying where RNs and BS use the same PLM and share spectral resources The total time-frequency resources are partitioned into parts used by the BS shared parts and parts used by RNs This partitioning is computed by RRM functions at a central location in cooperation with the MAC that is implemented at the BS It is then signalled to all RNs and UTs
313 The MAC services and tasks The MAC system layer for FDD and the TDD cellular transmission has a MAC protocol implemented in its user plane It also contains resource allocation and planning functions in its control plane It should provide the following services to the RLC system layer
bull Radio packet transfer ie transmission and reception over the radio interface of packets belonging to any of the transport channels defined below
bull MAC radio-resource control ie acceptance and execution of control messages
bull MAC control feedback ie messaging from MAC to RLC that supports the flow control the QoS control and the spectrum assignment and other functions at the RLC system layer
The WINNER transport channels are defined as being the interfaces between the RLC protocol layer (in the RLC system layer user plane) and the MAC protocol layer (in the MAC system layer user plane) They define the basic types of radio-packet transfer that are provided
bull Broadcast channel (BCH) for broadcasting system information from RLC and higher layers to all terminals inside the coverage area of the cell
bull Contention-based random access channel (RAC) for initial access to a BS or RN and also for BS-to-BS control signalling in the TDD mode
bull Contention-based direct access channel (DAC) for contention-based uplink data transfer
bull Common data channel (CDC) for scheduled point-to-multipoint communication
bull Targeted data channel (TDC) for scheduled point-to-point communication
bull Targeted control channel (TCC) for control-plane generated control messages
MAC flow control and resource allocation is performed two time scales That of the slot (half frame) and that of the super-frame (Section 314 below)4
bull Time-frequency resource partitioning and spatial scheme control is planned on a time scale of the super-frame (5ndash10 ms) The allocation to different transport channels is adjusted on this time scale based on the aggregated demand within each transport channel Unused chunks enable flexible spectrum use between WINNER operatorsusers and adaptive interference avoidance between neighbouring cells and parts of cells
bull Resource scheduling (RS) is performed on the time scale of the slot (034 ms) The scheduled flows are allocated to time-frequency-spatial resources in one of two ways Adaptive RS utilises the frequency-selective fading This requires processing of CSICQI feedback from the PHY layer Non-frequency adaptive RS uses a diversity-based transmission within the frame
Adaptive resource scheduling and support for adaptive transmission is a major feature of the design discussed further in Appendix C16 Detailed transmission schemes for adaptive transmission in both FDD and TDD modes have been presented in Section 31 of [WIND24] Key enabling features are here the use of chunks of appropriate granularity the use of in-frame control signalling to obtain tight feedback loops the use of channel prediction to enable adaptive transmission at vehicular velocities (Appendix B52) and appropriate schemes for compressing feedback information (Appendix B53) 4 We say that a function in a certain system layer works on a given time scale if the reaction time on a control
message need not be smaller than the time indicated by the time scale Thus the required adaptation speed of a given function that is distributed among different physical nodes is given by this time scale
WINNER D210 v10
Page 38 (180)
314 The chunk slot frame and super-frame structure As outlined in Section 1322 the basic time-frequency unit for resource allocation is the chunk During the later part of WINNER Phase I the transmission parameter examples outlined in Table 21 have been used for simulation purposes In the FDD physical layer modes chunks then comprise 8 subcarriers by 12 OFDM symbols or 3125 kHz times 3456 micros In the TDD physical layer mode the chunk dimension is 16 subcarriers by 5 OFDM symbols or 78125 kHz times 1080 micros Using the parameter sets of Table 21 an FDD downlinkuplink with 20 MHz FFT bandwidth is divided into 52 chunks on the 1625 MHz signal bandwidth A 40 MHz FFT bandwidth accommodates 104 chunks The TDD PLM with 100 MHz FFT bandwidth has 104 chunks on 8125 MHz signal bandwidth Please see Appendix C3 for a discussion on chunk dimensioning 5
The chunks are organised into frames In the TDD mode each frame consists of a downlink transmission interval followed by an uplink transmission interval denoted slots or time-slots In FDD the frame is also split into two slots Half-duplex terminals may be separated into two groups where one group has downlink transmission in the first slot and transmits in uplinks in the other while the other group uses the opposite scheme (Appendix C12) FDD base stations use full duplex
The frame duration has been set equal in the two PLMs to facilitate inter-mode cooperation With a frame duration of 6912 micros an FDD frame consists of two chunk durations with one chunk per slot A TDD frame consists of in total 6 chunks and two duplex guard intervals organised into a downlink slot and an uplink slot With downlink-uplink asymmetry 11 the TDD slot thus consists of three downlink chunks followed by three uplink chunks See the figure below The asymmetry ration could be varied from 51 to 15 but to provide sufficient time for signalling and scheduling calculations during the uplink slot in adaptive transmission it should not be set larger than 21
The super-frame (SF) is a time-frequency unit that contains pre-specified resources for all transport channels Figure 32 illustrates its preliminary design comprising of a preamble followed by nf frames Here nf = 8 resulting in super-frames of approximate duration 56 ms (It could be extended to eg 16 frames if required) The available number of chunks in the frequency direction could vary with the geographical location It is assumed that for the FDD DL and UL as well as for TDD there exist frequency bands that are available everywhere The preamble is transmitted in those commonly available bands The remainder of the super-frame may use other spectral areas that are available at some locations or to some operators but not to others All of these spectral areas are spanned by one FFT at the receiver and are at present assumed to span at most 100 MHz
Duplex guard time 192 micros
7812 KHz
03456 ms for 11 asymmetry
03456 ms chunk duration
15 OFDM symbols 12 OFDM symbols
Time Time
f f
8 subcarriers
16 subcarriers
20 MHz and 40 MHz FDD mode
100 MHz TDD mode
96 symbols 80 symb 3125 KHz
80 symb 80 symb
Figure 31 Summary of assumed chunk sizes in the two physical layer modes The figures show a slot (half of the frame) in each case assuming 11 TDD asymmetry
5 Note that the dimensions used here differ from the ones assumed in earlier deliverables such as [WIND24] in two
ways 1) The FDD chunk width in frequency has been doubled since the earlier narrower size contained few symbols and thus incurred a higher pilot and control overhead 2) In the TDD mode the chunks have been made shorter The TDD frame now contains six instead of two chunks This enables terminals to concentrate their transmission and reception in time and go into short power saving micro-sleep intervals in-between
WINNER D210 v10
Page 39 (180)
The subsequent main part of the super-frame is shared by the contention-based direct access channel (DAC) the scheduled data channels CDC and TDC and their related control signalling It also contains time-frequency-spatial resources that are not to be used due to interference avoidance constraints The resource partitioning (allocation) is performed in terms of chunks It is performed on a super-frame basis but it may be changed between super-frames The DAC resource is used both for the DAC channel and for the peer-to-peer transmission described in Section 32 below It is organised as a constant set of frequencies over the whole super-frame to enable the use of carrier-sense multiple access contention based transmission The resource partitioning is described in more detail in Appendix C11
RA
C (U
LD
L)D
L S
ynch
UL
Syn
ch
BC
H (D
L)
Freq
uenc
yFull System
Ban dw
idth
1664
Sub
-Car
riers
= 10
4 C
hunk
s
Figure 32 WINNER MAC super-frame example consisting of 8 TDD frames with asymmetry 11 a preamble and the DAC for contention based peer-to-peer communication The frame for TDD
cellular transmission with its chunk-based substructure has been enlarged
The super-frame is synchronous in all BS and RN In the FDD mode one super-frame is of course required in each of the paired bands The preamble has the following structure
bull At the beginning of each super-frame there are two synchronisation slots Self-organising synchronisation of terminals and network nodes as described in [WIND23] and Appendix B41 can be used on a super-frame basis by this design In the second slot each base stationrelay node transmits on four OFDM symbols The first the T-pilot is used for coarse synchronisation In the remaining three symbols each BS transmits on two adjacent subcarriers with the others set to zero On reception they are used for updating the UT synchronisations The first slot of three OFDM symbols the next super-frame is the uplink synchronisation slot Here all terminals transmit on the two adjacent subcarriers that were received strongest ie those that were used by the BSRN closest to them This part of the iteration is used for self-organizing synchronisation of the base stations and relay nodes which receive uplink synchronisation symbols from terminals at other BS that in turn synchronise to those BS In the FDD mode the UL synch slot is in the UL super-frame and the DL synch slot is in the DL super-frame
bull In-between these synchronisation slots a short timeslot over the whole band is reserved for the contention-based random access channel (RAC) plus a guard time This channel enables initial access to a BS or RN Placing the RAC and its guard time in-between the synchronisation slots gives the RAP sufficient time to process the uplink synch signal and adjust its synchronisation before transmitting the downlink synchronisation signal The RAC time-slot is in TDD system modes also used for BS-to-BS and RN-to-BS over-the-air control signalling
bull Subsequently a set of OFDM symbols carries the downlink preamble control transmission It contains the broadcast control channel (BCH) messages from the RLC layer It also contains a control message that specifies the overall resource allocation used within this super-frame
WINNER D210 v10
Page 40 (180)
315 Overview of main functions
MAC Services Control plane
interface
PHY Services
MAC Control
Feedback
MAC Radio Resource Control
Special Transmit Control
Signalling
PHY Measure-
ments
Constraint Processor
Flow State Controller
Spatial Scheme Controller
Resource Partitioning
Resource Scheduler (RS)
Non-frequency adaptive resource
scheduling
Adaptive resource sched
MAC CONTROL PLANE
Space-time-frequency link adaptation and scheduling
Queue state control
Transfer control Control of MAC-5 - MAC-1 protocols
Pre-config
Spatial scheme Selection
Constraint combining
Spectrum assignment negotiation support
RN assigment
DAC a ssignm
TDC adaptive assigment
MAC USER PLANE
Flow setup
Flow term
Calibration
Measure- ments
Non- frequency adaptive Transfer
BCH SF Control Tr
Transmit control proc (+ protocols)
Measurement proc (+ protocols)
Figure 33 FDD and TDD cellular MAC control functions Services and main function blocks
The MAC layer is subdivided into a control plane and a user plane The PHY layer is not subdivided in that way as all essential control functions for the physical layer reside in the MAC The main MAC control function blocks are illustrated in Figure 33 Control functions that directly control packet transmission on a slot time scale reside in the user plane Slower functions reside in the control plane
bull Resource partitioning Partitions the super-frame into sets used for adaptive non-frequency adaptive and DAC transmission as well as into chunks reserved for use by RNs BS-to-RN relay links and as guards for interference avoidance with respect to other cells and operators
bull Spatial scheme control The appropriate spatial transmit scheme is determined for each flow and it is held fixed within a super-frame It is influenced by many parameters including PLM deployment transport channel type cell load traffic type BS antenna configuration terminal capabilities propagation channel and interference conditions Further support functions related to spatial processing like calibration are invoked if required
bull Flow setup and termination performs flow context establishment and release over one hop supervised by the RRM flow establishment and release functionalities in the RLC system layer
bull Constraint processor Combines constraints on the use of chunks and chunk layers These arise from interference between user terminals interference avoidance scheduling with neighbouring cells and spectrum sharing between operators The output is in the form of chunk masks that define restricted use of a super-framersquos chunks The constraint processor also processes measurements that support the RRM spectrum assignmentnegotiation at the RLC system layer
bull Flow state controller Controls the segmentation and FEC codingdecoding of packets and monitors the states of RS queues It also controls the activesemi-activepassive state of flows
bull Resource scheduler (RS) Includes adaptive and non-frequency adaptive scheduling algorithms and control of spatial link adaptation Power control in both uplinks and downlinks is performed under the control of the resource scheduler and is integrated into the optimisation of the transmission parameters The MAC RS cooperates with the RLS layer flow scheduler Sect 41
WINNER D210 v10
Page 41 (180)
MAC Services User plane interface
PHY Services
Radio Packet
Transfer
Radio Packet
Transfer
Adaptive Transfer
BCH SF Control Tr
Adaptive Transfer
RAC Transfer
DAC Transfer
Non-frequency Adaptive Transfer
Non- frequency adaptive Transfer
DAC Transfer
(MAC-4) Add CRC
RTU
Per-flow queuing of FEC blocks
in RSB
(MAC-3) Optional segmentation
Encoding block
(MAC-2) FEC coding FEC block
(MAC-4) CRC check ACKNACK
Soft combining at received
retransmission
(MAC-5) Reassembly of MAC SDU
(MAC-2) De-interleaving
and FEC decoding
Resource Mapping
Map on chunk layers for adaptive transmission
Map on set of chunk layers for non-frequency adaptive transmission
Map on resources reserved for DAC
Map BCH packets into SF preamble symbols
BCH RAC
BCH (in UT) RAC
TDC DAC CDC (in UT)
MAC USER PLANE Transmitting MAC entity
Receiving MAC entity
DAC
(MAC-5) Optional
segmentation TDC
TDC CDC
BCH SF Control Tr
RAC Transfer
(MAC-3) Reassembly
of enc blocks
TDC CDC DAC
TDC CDC DAC
BCH
RAC
SLC Cache (per-flow queues)
Figure 34 FDD and TDD cellular MAC User-plane services and packet processing
The data flows in the user plane shown in Figure 34 are processed by three groups of functions
bull Transmission Segmentation encoding and buffering The flow state controller supervises this sequence Protocol sub-layers MAC-1ndashMAC-5 control the transmission and are parameterised to describe the different retransmission options (HARQ) A MAC SDU is drained from the SLC Cache TDC or DAC packets may be retransmitted Retransmission can be an option also for CDC point-to-multipoint flows The TDC CDC or DAC packet is optionally segmented A CRC sequence is added resulting in a Retransmission unit (RTU) The RTU may optionally be segmented into encoding blocks that are encoded separately Coding and interleaving results in FEC blocks which are buffered in the RS buffer on the transmitter side in one or several queues per flow There they remain until acknowledged or dropped BCH and RAC-packets are transmitted in the super-frame preamble without retransmission
bull Resource mapping At transmission bits from TDC flows are mapped either on chunks reserved for adaptive transmission or on the sets of chunks intended for non-frequency adaptive transmission CDC (multicast) flows should use non-frequency adaptive transmission DAC packets are mapped on the contention-based physical channel For TDC and CDC puncturing of the buffered FEC block may be performed and only a part of a FEC block may be transmitted in a scheduling round that comprises a time-slot
bull Reception Decoding and reassembly The flow state controller supervises the reception De-interleaving and FEC decoding is first performed for received FEC blocks belonging to TDC CDC or DAC packets followed by the (optional) re-assembly of the RTU Then the retransmission unit is optionally checked for transmission errors and a retransmission may be requested The MAC SDU is finally re-assembled BCH and RAC packets are received separately in the super-frame preamble and then decoded
WINNER D210 v10
Page 42 (180)
316 Resource mapping and multiple access In [WIND26] different multiple access (MA) techniques were assessed for multi-carrier as well as for single-carrier transmission Subsequently a set of schemes has been selected as baseline choices for use within the WINNER system Several of the initially considered schemes turned out to useful The key distinguishing feature for selecting MA scheme turned out to be not the deployment scenario but instead the use of adaptive or non-frequency adaptive transmission which place different demands on the utilised resources The multiple access schemes will therefore differ for different flows Flows scheduled for adaptive and non-frequency adaptive transmissions are mapped onto the separate sets of chunks earmarked for these two purposes by the SF resource partitioning (Figure 35) The mappings use different MA schemes
bull Adaptive transmission (DLUL) uses chunk-based TDMAOFDMA Flows are mapped onto individual chunk layers with individual link adaptation per chunk layer The mapping is exclusive within the cells ie each chunk layer carries data from only one flow
Chunks are designed to work well for adaptive transmission See Appendix C3 for a background on the reasoning used for dimensioning the chunk sizes In a non-frequency adaptive transmission that is based on channel averaging there would be a problem in attaining sufficient frequency diversity when transmitting small packets when the packets are mapped directly onto chunks A small RTU or control packet may fill only one chunk Two schemes that increase the diversity significantly are selected
bull In non-frequency adaptive downlinks MC-CDMA is used within the assigned set of chunks In the downlink spreading may thus be used to code-multiplex the flows onto sets of chunks assigned for non-frequency adaptive transmission When code multiplexing is used spreading is performed only within chunks to minimise non-orthogonality of the received signals Orthogonal signalling (TDMA per OFDM symbol or FDMAIFDMA per subcarrier without code-multiplexing) are special cases of the scheme They may be used when appropriate
bull In non-frequency adaptive uplinks TDMAOFDMA is used on an OFDM symbol basis For non-frequency adaptive transmission in the uplink code multiplexing is not used to avoid the need for multi-user detection Instead TDMA is used on an OFDM symbol basis Several uplink flows with small FEC blocks may share one OFDM symbol (OFDMA) to improve the rate matching (Figure 35 middle part) Either OFDM or frequency-domain generated serial modulation can be used in the uplinks
Compared to chunk-based OFDMATDMA these schemes provide increased frequency diversity and resources of shorter duration The shorter time duration (mapping on individual OFDM symbolsGMC slots) provides increased opportunities for terminals to go into power-saving micro-sleep intervals
Time Time Time
FDMA TDMA MC-CDMA
Frequency
Frequency
Frequency Chunk for for non-frequency adaptive transmission
Chunk for adaptive transmission
Mappings for one flow
Figure 35 Illustration of the mapping of one flow on the chunks earmarked for non-frequency adaptive transmission when using FDMA TDMA or MC-CDMA within the set of chunks
The selected multiple access schemes have been evaluated and compared to several alternatives in Appendix G A summary of relevant results is given below and an additional discussion can be found in Section 533
WINNER D210 v10
Page 43 (180)
For the case of adaptive transmission a gain was not surprisingly found when concentrating the transmitted packets to individual chunks instead of spreading them out over the slot Spreading them out over all frequencies by eg MC-CDMA or TDMA would average away the channel variability Lowering the cannel variability reduces potential multi-user scheduling gain In Appendix G41 (single-carrier) TDMA that allocates the whole 20 MHz band to only one user is found to result in a reduced multi-user scheduling gain See also Section 3153 in [WIND24] where OFMD-based TDMA was compared to TDMAOFDMA
The chunk sizes have been designed to be appropriate for the transmission scenarios used with reasonably flat channels within chunks Therefore as shown in Appendix G43 very little can be gained by sharing chunk layers between flows if the throughput is to be maximised As shown in Appendix G14 and Section 33 of [WIND24] chunk sharing can be of advantage in a special case There are many flows that have the very strict delay requirements and a guaranteed throughput in each slot (034 ms) While such delay constraints are extreme for user data they are applicable for retransmissions and for time-critical control information Appropriate transmission schemes for these will be studied in WINNER II
For non-frequency adaptive transmission G42 illustrates the improved performance obtained by paritioning the transmission over a set of resources whose channels have high diversity As noted above different methods can be used MC-CDMA symbol-based TDMA or subcarrier-based OFDMA The performance differences between them were investigated and were found to be rather small Of these schemes MC-CDMA provides the highest diversity In Appendix G11 it is concluded that MC-CDMA outperformed OFDMA in terms of cell throughput for all considered loads and scheduling algorithms In Appendix G12 MC-CDMA provides some advantage while in Appendix G13 OFDMA is found to provide slightly superior performance Explanations for these differences are discussed in Section 533
None of the so far performed investigations added the effect of spatial diversity schemes It can be expected that the additional use of spatial diversity will lessen the requirement for frequency diversity This would simplify the resource partitioning problem (Appendix C11) that includes selecting appropriate sets of chunks for adaptive and non-frequency adaptive transmission
32 Medium access control for peer-to-peer transmission The WINNER system supports peer-to-peer (P2P) and peer-to-multi-peer (PMP) transmission between user terminals under the control of a master device as illustrated in Figure 36 The role of the master will be taken by the base station while the terminals act as slaves All user terminals participating in the peer-to-peer communication are synchronised in time to the masterrsquos clock and use the contention-based direct access channel (DAC) to exchange user data with their peers and control information with the master In the absence of a BS a user terminal can also take on the master responsibility if it is equipped with some additional network management functions
Figure 36 Network topologies for peer-to-peer communication
321 MAC architecture for P2P transmission In the WINNER system peer-to-peer transmission between user terminals is at present designed to be provided by the TDD physical layer mode Other alternatives will be considered at later stages In Section
BS
UT
UT
UT
UT
control
data
UT
UT
P2P
PMP
BS
UTUT
UTUT
UTUT
UTUT
control
data
control
data
UTUT
UTUT
P2P
PMP
WINNER D210 v10
Page 44 (180)
31 and Appendix C1 a MAC is specified for controlling this physical layer in cellular deployment scenarios Although it supports the exchange of user data between UTs via a base station it does not allow the direct data transfer between terminals To enable P2P communication some new services and functions have to be added to the control- and user-plane of the basic TDD cellular MAC (see Figure 37)
The MAC layer services for P2P transmission are integral part of the radio_resource_control and radio_packet_transfer service The P2P-specific services are provided to higher layers at the MAC_P2P_CONTROL and MAC_P2P_USER service access point (SAP)
The MAC layer services are implemented by adding P2P-specific protocol functions to the main function blocks of the TDD cellular MAC In the control plane of the MAC the resource partitioning unit has to comprise the DAC assignment function for controlling the allocation and release of radio resources The flow setup and termination unit is extended with functions required to setup and terminate P2P data flows over the DAC These include functions for transmitting and receiving DAC-specific broadcast control information attaching and detaching UTs to the service provided by the P2P-DAC and setting-up and terminating synchronous P2P-flows between UTs In the flow state controller functions are provided for controlling the transmission and reception of radio packets over the DAC The control of packet segmentation FEC coding and retransmission is executed by these functions The flow state controller also contains functions required to give UTs random access to the P2P-DAC for transmitting control messages to the BS and exchanging P2P data in a contention-based manner between peer terminals In the user plane of the MAC additional functions are provided to multiplex control information and user data onto the DAC and to extract control information and user data from a received decoded radio packet Note that other MAC functions not directly related to the P2P-DAC service are not shown in Figure 37
322 Frame structure of DAC for P2P transmission The direct access channel is embedded into the super-frame structure of the TDD physical layer mode as shown in Figure 32 Successive DAC frames are thus always separated by a preamble that is used to keep time synchronisation between the master and all user terminals involved in P2P transmission
As shown in Figure 38 a DAC frame is further subdivided in three parts namely the control period the contention-access period and the guaranteed-access period The length of the control period is given by the duration of a TDD DLUL frame of a scheduled targetcommon data channel (TDCCDC) The length of each access period takes on a multiple value of the basic time slot size of 03452 ms and may dynamically change from super-frame to super-frame
bull The control period (CTP) is composed of two time slots for exchanging MAC control information between the BS and UTs The first slot is formatted such that firstly beacon frames
Figure 37 MAC services and functions for peer-to-peer transmission
RadioResourceControl
RadioPacket
Transfer
MAC_P2P_CONTROL SAP MAC_P2P_USER SAP
Control Plane User Plane
segmen-tation
DAC Transfer
add CRC for retrans-
mission
FEC coding
resource mapping to
DAC
reassembly
FEC decoding
multiplex to DAC frame
retrans-mission
de-multiplex from DAC
frame
Resource Partitioning
DAC assignment
DAC P2P Flow Setup and Termination
P2P-DAC beacon control
attach detach to P2P-DAC
setupterminatesynchronous
P2P-flow
Flow State Controller
P2P-DAC transfer control
P2P-DACchannel
access control
MAC-P2P Services
MAC-P2P Functions
PHY Services
WINNER D210 v10
Page 45 (180)
can be broadcasted from the BS to the UTs to announce the format of the current DAC frame and to communicate management information to the terminals and secondly send DL MAC commands from the BS to a dedicated user terminal In the second time slot user terminals can send UL commands to the BS and exchange MAC protocol messages with peers Random channel access for the involved terminals is provided by using a time-slotted ALOHA protocol
bull The contention-access period (CAP) may be used to asynchronously transmit protocol messages andor small amount of user data peer-to-peer between user terminals Since several UTs can simultaneously access the CAP the possible contention for medium access is resolved by using a carrier sense multiple access protocol with collision avoidance (CSMA-CA)
bull The guaranteed-access period (GAP) consists of time slots of fixed length and is used for asynchronous and synchronous P2P transmission between user terminals Channel access in the GAP of the DAC frame is based on a TDMA method in which one or several time slots can be allocated to two or more UTs for peer-to-peer communication For synchronous transmission time slots are allocated to the UTs on a regular basis in successive DAC frames without limit in time while for asynchronous transmission a sequence of consecutive time slots is allocated to start at any arbitrary time instant the transfer of a fixed amount of data The time slot allocations in the current DAC frame and their usage are broadcasted in the beacon field of the control period
Figure 38 DAC frame structure for peer-to-peer transmission
8 TDD frames = 8 x 06912 ms = 553 ms
contention access period (CAP) guaranteed access period (GAP)
bea
con
asynchronous and synchronous
P2P data transmission
asynchronous P2P data and
P2P command transmission
Time slot 03452 msTime
DL
com
mand
UL
com
mand
control
period (CTP)
DL UL
8 TDD frames = 8 x 06912 ms = 553 ms
contention access period (CAP) guaranteed access period (GAP)
bea
con
asynchronous and synchronous
P2P data transmission
asynchronous P2P data and
P2P command transmission
Time slot 03452 msTime
DL
com
mand
UL
com
mand
control
period (CTP)
DL UL
WINNER D210 v10
Page 46 (180)
4 Radio Resource Management (RRM) and Radio Resource Control (RRC)
41 RRM functions Although the term radio resource management (RRM) is often used as a general term for numerous algorithms and protocols used to govern the radio resources it is in the context of WINNER reserved to denote the control functions implemented in the RLC system layer control plane Other functions related to management of radio resources such as scheduling link adaptation and power control were described within the MAC chapter (Chapter 4) The overall goal is to utilise the given radio resources in an efficient manner The WINNER RRM framework handles flows rather than UTs A flow is a packet stream from one source to one or several destinations classified by QoS requirements source and destination(s) One of the WINNER RRM advantages is that it handles the handover process per flow rather than per UT Therefore a UT might sendreceive traffic over different cells and routes that match best the requirements of the specific flow Additionally it includes functionalities for coordinated spectrum sharing with other radio access networks using the same radio access technology as well as for spectrum sharing with other radio access technologies Finally unlike in existing systems admission control is not responsible for only admitting a new or handover flow to a new cell but also for selecting the best cell among a group of candidate cells that are nominated by the micro mobility functionality A summary of the RRM functionalities studied herein can be found below while more details are given in Appendix D
Spectrum control Spectrum control coordinates flexible spectrum use between multiple WINNER RANs and spectrum sharing with radio access systems using some other radio access technology (RAT) To have more tractable problems spectrum control is divided into two components namely spectrum sharing coordinating spectrum sharing with systems using other RAT and spectrum assignment providing flexible spectrum use between WINNER RANs Spectrum sharing controls the access to the spectrum in frequency bands which are shared with other RATs which are probably legacy systems Spectrum assignment is divided further into long-term spectrum assignment providing slowly varying spectrum assignments for large geographical areas and Short-term Spectrum Assignment providing short-term local variations to the large-scale solution The detailed implementation of these functionalities remains an open issue and further development will be carried out in Phase II
Service level control (SLC) The SLC performs the management between flows of the same user andor between different users and is specific for a population of users (eg the population within one cell or sector) The SLC provides means to allocate network resources to the traffic associated with the different applications and end-user services (ie not radio interface services) The service differentiation is exercised through three different (and parallel) service components namely flow Conditioning flow queuing and flow scheduling The SLC also comprises a flow monitoring service component to provide feedback on eg load predictions The flow scheduling controls the resource scheduler and the interaction between these two schedulers is assumed to work as follows The flow scheduling should ensure that a sufficient amount of packets are residing in the SLC cache to enable high multi-user gains (ie based on predictions about the current rate the flow scheduling aims at keeping the overall SLC cache content at some predetermined level eg corresponding to what (on average) may be transmitted within 5 ms) At the same time the resource scheduler must guarantee that it will (to the furthest extent possible) transmit the packets in the SLC cache within a small amount of time eg in less than 10 ms Otherwise the resource scheduler could create head-of-line blocking and too much delay Effectively this means that the ultimate decision about if and when (within a few ms timeframe) a packet is transmitted lies with the flow scheduling since the resource scheduler sooner or later has to schedule the packets assigned to it This also means that service classes are transparent to the resource scheduler Nevertheless the interface between SLC and RS is still under investigation eg the resource scheduler may also be made aware of the service classes (or at least some priorities of the different flows) to support work-conserving packet pre-emption (ie that a higher priority packet can pre-empt the transmission of a lower priority packet destined for the same node) as well as to give preferential treatment of eg network control signalling packets
WINNER D210 v10
Page 47 (180)
ModeRAN selection Algorithms for the selection of one or several modesRANs to serve a particular flowuser The mode selection can be made on different time scales These include per call or session (slow selection) per packet (fast selection) or triggered by non-traffic related events like changes in radio conditions (mode re-selection) More frequent mode selection leads to larger potential capacity and quality gains (through exploitation of ldquomode-selection diversityrdquo) but can increase signalling load In some cases mode selection will require user interaction or be dictated by an application (also referred to as slow selection or even re-selection) The mode selection can either be controlled by a node in the fixed part of the network a base station a relay node or by the user terminal If one operator runs the network this operator likely prefers network controlled mode selection If the network is run by different operators terminal based mode selection is more likely
Handover
Algorithms for handover between two cells of the samedifferent mode (intra-system) as well as different radio access systems (inter-system) are studied In order to allow for a seamless handover within the WINNER RAN BSs and RNs of the same or different mode can announce their presence to the UTs by broadcasting control messages using orthogonal resources This scheme is especially helpful for the handover between WINNER FDD and TDD as it allows the UTs to be aware of the presence of BSs and RNs that operate at a different mode without disrupting their normal operation to ldquosniffrdquo other parts of the spectrum The case of an inter-system handover between WINNER and legacy RANs is expected to take place either due to loss of coverage of the current system or in case of overlapping coverage due to useroperator preferences or traffic congestion One solution could be to extend the inter-system handover based on the common RRM (CRRM) framework defined in the 3GPP Another approach could be location-based handover where user terminals (UTs) make use of foreign measurements and location information An inter-system handover is performed with the assistance of the cooperative RRM (CoopRRM) entity
Admission control (AC)
The AC ensures that the admittance of a new flow into a resource constrained network does not violate the service commitments made by the network to already admitted flows The decision is based on information such as load prediction statistics of current flows resource restrictions and physical layer measurements It is assumed that flow statistics will include
bull throughput per flow in previous super-frame
bull time-frequency-spatial resource use per flow
bull spare capacity within cell in previous super-frame
bull path loss estimate and
bull interference estimates
In case of limited resources in the candidate cells a number of different actions may be taken
bull reduce requests for connectionflow in question andor for lower priority flows
bull resource re-partitioning
bull lower load in (interference from) neighbouring cells
bull handover flows (cellmodeRAN)
bull drop flows
In the case of multiple RANs and multiple technologies the admission control must take into account the individual characteristics of each technology in order to make the final decision about admitting or rejecting a user in the network
Load control The load control algorithm is triggered in order to ensure that the system is in stable state It calculates the predicted load per cell based on information such as load prediction statistics of current flows and resource restrictions In particular
WINNER D210 v10
Page 48 (180)
bull The preventive load control takes care so that the network does not get overloaded and remains stable and attempts to improve the system performance by distributing userssessionsresources among cellssectors
bull The reactive load control attempts to bring the load back to stable regions as fast as possible
bull The load sharing aims to distribute the load (the offered traffic) andor resources between ldquoresource ownersrdquo (BSs and RNs) such that the resources are efficiently utilised
Potential actions for a ldquocongested cellrdquo are taken Examples are
bull interaction with the service level controller and restriction of incoming traffic
bull denial of new flow requests
bull change of TDD asymmetry factor
bull reduction of requests (eg bit rates) for flows (within limits as specified in the flow QoS specification)
bull attainment of more resources by resource re-partitioning or lower load in (ie lower interference from) neighbouring cells
bull handover of flows to another cellmodeRAN
bull dropping of flow(s)
Routing
Algorithms for the selection of the appropriate routepath per flow It is expected that several paths to a BS will exist due to the deployment of relays From the architecture perspective two basic routing strategies are envisioned in multi-hop systems centralised or distributed Under the centralised strategy route determination is performed in a central controller which normally possesses powerful processing capability and has knowledge on global network status so that sophisticated routing algorithms could be adopted to optimise the system performance With the distributed strategy individual network nodes from the source to the destination jointly perform route determination This strategy could function when no central controller is reachable but its performance is normally limited by network nodesrsquo processing capability and knowledge on network status
42 WINNER RRM architecture As previously described the WINNER radio interface will encompass a number of modes each of them targeted and optimised for a specific deployment scenario (and possibly also user scenario) Nevertheless many of the RRM functions may be shared between the different WINNER modes (eg admission control) Hence the RRM functions could be classified within the three following categories
1) Mode -specific RRM functions These are targeted and optimised for a specific mode and deployment scenario in terms of using different parameters specific to the current mode used In the MAC system layer they include scheduling power control and link adaptation In the RLC control plane they include intra-mode handover and routing
2) Generic RRM functions These are shared between the different WINNER modes or used for their coordination and include spectrum assignment service level control mode selection buffer management traffic policing admission control congestion control and inter-mode handover
3) Cooperative RRM functions which are used for the cooperation of the WINNER system with legacy RANs such as UMTS and WLAN and reside in the Cooperative RRM (CoopRRM) entity These include spectrum sharing inter-system handover admission control congestion control and RAN selection
It is very likely that an overlap between the generic and mode-specific RRM functions will exist where the generic part will administrate the mode-specific part For efficient management of the resources the location of the RRM functions within the network architecture is an essential issue as it can affect the performance of the network due to extensive signalling and delays In a centralised RRM architecture a central entity monitors and makes decisions regarding the allocation of the resources and it is usually located in a node at the RAN while user terminals have minimal role For example in UMTS most of the RRM functionalities are located in the Radio Network Controller (RNC) In addition terminals and Node B also contribute to parts of RRM in terms of power and load control In a distributed RRM architecture the decision entities for each resource management function are located in different nodes including the
WINNER D210 v10
Page 49 (180)
user terminal Furthermore in a hybrid approach different decision levels of the same RRM functionality that work at different time scales are located in different nodes
It is envisaged that for the WINNER system with the multiple operating modes the hybrid approach will be suitable In particular extensive delays in the decision making and signalling overload can be avoided by bringing some of the control plane functions closer to the BSs physical nodes Clearly this adds more complexity to the BSs physical nodes and therefore increases their cost However assuming different types of BSs for the wide-area and short-range scenarios we could restrict the extra functionality to the wide-area BSs (BSwa) In particular the WINNER vision is that the cells of the different modes will coexist and overlap either completely or partially This feature could be used in favour of the RRM architecture as the mode generic control plane functions that concern the coordination of the different modesBSs could be moved to the BSwa making the BSwa responsible for the control and allocation of resources per wide-area cell including all short-range BSs (BSsr) that fall within its coverage A requirement for such an approach would be the definition of a communication link between the BSwa and BSsr This link could be either wired or wireless (eg part of the FDD mode interface) More discussion on the RRM architecture can be found in Appendix D
43 Radio resource control The RRC provides the signalling for these RRM functions control measurements and reports Examples of RRC functionalities are
bull Broadcast of information related to the network
bull Control of broadcast
bull Establishment maintenance and release of an RRC connection between the UT and WINNER RAN
bull Assignment establishment reconfiguration and release of PHY resources
bull Feature discovery (antenna configuration relays etc)
bull Control of requested QoS
bull Measurement reporting and control of the reporting
bull Power control (slow)
bull Paging
bull Initial cell selection and cell re-selection
bull RRC message integrity protection
bull Timing advance
bull Control of synchronisation
bull Scanning of PHY resources
bull Control of masterslave mode (P2P)
The RRM measurements may be performed regularly upon request or triggered by some event To achieve the best possible performance the time period of the measurements should be chosen such that it may track the variations of the measured quantity However since some quantities (like a fading radio channel) undergo not only short-term but also long-term variations lower measurement frequencies may still be useful Moreover the measurement frequency may be adaptive adjusting the time period according to the variation of the measured quantity Similarly as for the measurements the reporting of the measurements can be performed periodically upon request or be event triggered The measurement reporting strategy that will be studied further in Phase II should not be selected independent of the measurement strategy We may distinguish between the case in which the measurement data itself is reported to the network and the case in which the measurement data is processed in the UT and only a RRM command is reported back to the network Further details are given in Appendix D
431 RRC states In order for WINNER to be harmonised with the 3GPP LTE work the same RRC states are proposed
WINNER D210 v10
Page 50 (180)
Dormant
Idle Detached
Active
Dormant
Idle Detached
Active
Figure 41 RRC states
These are
bull UT Detached
o The location of the UT is not known by the network (eg UT is switched off or operating on another RAT system)
bull UT Idle
o UT performs periodic search for higher priority RAN
o UT performs cell selection and reselection
o UT monitors broadcast and paging channels
o Inherently power saving state
o UT is handled by radio access network gateway (RANG)
bull UT Active (identical to the UTRAN CELL_DCH state [3GPP-TS25331])
o UT is transmittingreceiving data on traffic channels
o UT monitors the directedcommon control channels continuously
o There is a power saving sub-state within the Active state This is the dormant sub-state where the UT is ready to transmit or receive data on traffic channels and monitors the control channels discontinuously
o UT is handled by BS
WINNER D210 v10
Page 51 (180)
5 Assessment Overview
51 General Assessment of the performance of the developed system concept is an important aspect of the WINNER project In the case of WINNER the assessment work has been carried out to some extent by theoretical analysis but mostly by computer simulations In WP2 different kinds of simulations are required
bull link level simulations where the performance of the transmission and reception schemes under study are simulated with the selected fading channel models
bull multi-link simulations where multiple radio interface links are simulated simultaneously and thus effects of interference between users can be studied in detail
bull system level simulations where a coarser view of the physical layer is taken and higher level system functionalities are studied
At the link level simulation activities have been focusing on the following topics
bull channel coding schemes
bull novel modulation techniques
bull channel estimation
bull synchronisation
bull link adaptive transmission schemes
On the system and multi-link level the number of simulation alternatives is significantly higher Emphasis has been put on
bull multiple access technologies (TDMA FDMA CDMA SDMA and combinations thereof)
bull resource scheduling (frequencytime adaptive or non-adaptive)
bull spatial processing
bull multi-user detection
In addition implementation impact in terms of computational complexity and RF requirements are vital to consider The outline of the rest of this chapter is as follows In Section 52 the main challenges in performing the assessment work are discussed in Section 53 performance results implementation impact and performance-complexity trade-offs are discussed and in Section 54 comparisons with requirements and design targets from Section 11 and Appendix A are made
52 Challenges In the assessment work within WINNER WP2 there are two major challenges discussed in the following along with the strategies used to cope with them
1 There are a huge number of details and possible combinations of different functionalities In order to carry out a comprehensive assessment of the system concept all realistically possible combinations would have to be assessed and the associated performance checked However for a complex system as WINNER a fully comprehensive assessment is simply not possible to carry out with any reasonable amount of resources It is thus important to carefully select the areas on which the assessment work is focused The broad experience in designing communication systems that the WINNER personnel possesses helps significantly in this focusing and different partners have taken on to study different key aspects Also earlier results in previous WINNER deliverables are reused whenever possible to obtain as broad and accurate assessment as possible of the system capabilities
2 As different partners provide results it means that special emphasis needs to be put on the calibration and cross-verification of the simulation environments in order to ensure that system components are modelled in a similar manner in different simulators At link level the calibration is a straightforward operation and easy to carry out In the system level simulators the calibration is a much more challenging task due to significantly higher complexity larger number of parameters and larger number of issues (eg radio propagation related traffic
WINNER D210 v10
Page 52 (180)
models functionalities of the system etc) that need to be modelled Moreover the setup of one gigantic system simulator covering all aspects of a system in one study is simply not feasible Hence smaller system simulators dedicated to a specific topic studied by a partner can often provide more technical insight This fact is clearly reflected in the evaluation results in the appendices Link level results (Appendix F) from different partners are typically jointly presented in the same graphs whenever appropriate whereas multilink and system level results (Appendix G) from different partners are normally presented in different sections each with its own topic A detailed set of common simulation assumptions have been specified (Appendix E) to make the different studies as comparable as possible but nevertheless comparisons of absolute system-level performance between different partners cannot normally be directly made as the results may be sensitive to several details in the modelling approach
53 Summary of results ndash performance and complexity This section summarises major findings regarding performance and implementation issues the details of which can be found in the appendices of the present deliverable (primarily Appendix F and Appendix G) and in earlier WINNER deliverables It should be noted that many additional results not directly discussed here can be found in the deliverables [WIND23] [WIND24] and [WIND26]
531 Analogue RF In analogue RF implementation no major showstoppers have been identified With the assumed SNR requirement of 30 dB the RF sections of handheld terminals can be constructed using high-end components of today and the required components are expected to be available for the mass market when WINNER systems are to be deployed Zero-IF RF architecture seems to be the most promising solution Power consumption of analogue parts is generally expected to be within acceptable limits but with some restrictions for the use of higher order modulation schemes in combination with the large signal bandwidths and multiple antenna techniques However it is clear that power consumption in user terminals can become a limiting factor since the development of battery and heat dissipation technologies is not expected to be as rapid as the development of other analogue parts or the digital processing technologies
The requirements for the asynchronous TDD network (where interference between UL and DL on adjacent carriers may be substantial) with TDMA were found technically unfeasible taking into account the significant performance degradation and loss of area coverage To overcome this problem either synchronised networks or channel specific RF filtering should be used The latter is costly spectrally inefficient and unattractive to handheld terminals due to large size Therefore synchronised networks for TDD operation are strongly preferred
European and international electromagnetic field (EMF) exposure requirements and standards [HP98][OJEC99][CENELEC01] will be possible to fulfil for user terminals with the uplink output power levels used in the evaluations in this deliverable (200 mW for handheld device and 400 mW for laptop) and with designs and intended use similar to those of existing 2G3G terminals With downlink power levels and antenna installations similar to those used for 2G3G the EMF exposure requirements and standards [HP98][OJE99][CENELEC02] for radio base stations will also be fulfilled
532 Digital baseband In the following subsections the different components of a transmitterreceiver chain are first discussed individually An assessment of the overall link throughput is then provided followed by a subsection focusing further on multi-antenna aspects
5321 Forward error correction Decoding of the error control code is typically a dominant factor in the digital baseband processing complexity especially for single antenna systems On the other hand advanced forward error correction schemes based on iterative decoding provide substantial improvements in link layer performance
In this report the performance and complexity of two main candidate techniques DBTC and BLDPCC have been compared in detail (cf Appendices B2 and F2) The main finding is that DBTC provides best performance when the block length of the code is small while BLDPCC provides better performance at large block lengths The threshold block length where the advantage changes from one code to the other depends on the code rate DBTC show good performance already at block sizes around 100 information bits so CC might not be required for error control coding in the WINNER radio interface This is subject of further study The performance differences are in many cases rather small (lt05 dB) and other factors
WINNER D210 v10
Page 53 (180)
than performance may also affect the selection of coding technique BLDPCC show slightly lower (maximum) decoding complexity than DBTC ndash and provides the inherent capability to reduce power consumption when channel conditions are good
Overall the assessment showed that even for these advanced coding schemes decoders are expected to be implementable for data rates of 300 Mbps and beyond (see Appendix B21) in particular given the predicted increase in semiconductor computational power and the advances in parallelisation of decoding techniques The peak data rates of 1 Gbps can be somewhat challenging not only due to the power consumption but also due to increased clock rates at which the limits of the digital processing hardware (with respect to scaling and clocking limits current leakage heat dissipation etc) become more and more visible For these reasons solutions like lower complexity codes and even analogue decoding should be kept in mind Encoding of the error control code is of negligible complexity for all considered coding schemes
DBTC and BLDPCC represent the state of the art and such techniques are also under discussion in multiple standardisation activities [3GPP-WG142][80211n04][80211n-05][80216e-05] and have in some cases already been standardised [DVB00] Since basically all advanced coding schemes now come very close to the performance limits predicted by coding theory the coding schemes in these systems can be expected to have similar performance (and complexity) as those selected for the WINNER radio interface
5322 Modulation A variety of modulationdemodulation techniques have been investigated and good performance has been found to be achievable with low or moderate complexity already in previous deliverables [WIND21 WIND22 WIND23] However the selection of an appropriate modulation technique depends on a large number of aspects beyond complexity and basic performance as for example flexibility achievable spectral efficiency robustness to RF imperfections requirements on the RF (HPA backoff) and last but not least also on their suitability for implementation of different multiple access schemes and spatial processing methods Aspects directly related to physical layer performance and RF aspects of modulation schemes have been assessed in [WIND21 WIND22 WIND23] and are therefore treated in less detail here Based on the assessment of modulation techniques summarised in Appendix B31 GMC transmission configured as CP-OFDM (for DL transmission and for UL transmission in short-range scenarios) and serial modulation (mostly for the UL in wide-area scenarios) are the preferred options for the WINNER radio interface See also Appendix G71 for a comparison of single carrier and CP-OFDM on theUL The employed multiple access schemes are presented in Chapter 3 and evaluated in Appendix G
CP-OFDM is a well-established technique that is in use in a large number of systems such as DVB-S DVB-T and IEEE 80211 (WiFi) It is currently also under discussion for the use in 3GPP LTE and IEEE 80216e Serial modulationsingle carrier is under discussion in 3GPP LTE due to its advantages for uplink transmission from (power constrained) user terminals
5323 Synchronisation and channel estimation The choice of an appropriate synchronisation strategy for the WINNER radio interface is based on several criteria such as robustness residual synchronisation offsets acquisition delay and required overhead Two different types of pilots are foreseen for the WINNER system concept time and frequency multiplexed pilots in the form of OFDM training symbols and continuous pilot subcarriers respectively In combination with cyclic prefix based synchronisation differential modulation of continuous pilot subcarriers allows to establish frame synchronisation as well as to detect arbitrary frequency offsets (see Appendix F41 for details) Additionally a set of training symbols are included in the super-frame preamble for self organised inter- and intra-cell synchronisation (cf Appendix B41) A timing advance strategy is proposed enabling a time aligned arrival of different usersrsquo signals at the BS
Channel estimation by interpolation in time and frequency based on a scattered pilot grid is considered to be an efficient solution for the WINNER radio interface In Appendix B42 a generic framework for the pilot design of GMC signals is described The pilot overhead is only 25 and 4 per spatial stream for the WINNER TDD and FDD mode respectively For multi-antenna transmission dedicated pilots per flow common pilots per cellsector common pilots per antenna and common pilots per beam are required depending on the spatial scheme selected Especially in case of dedicated pilots purely pilot aided techniques may have severe limitations requiring a pilot boost andor a significant degree of over-sampling Advanced solutions such as iterative channel estimation aim to make a pilot boost redundant at the expense of increased complexity
WINNER D210 v10
Page 54 (180)
Adaptive transmission with respect to resource and physical layer processing requires channel prediction which can be based on common pilot symbols that are also used for other purposes Adaptive transmission becomes possible in the WINNER system at vehicular velocities The channel prediction accuracy estimates (covariances) are furthermore important inputs in the design of the link adaptation and resource scheduling schemes See Section 31 of [WIND24] for their use and impact
5324 Physical layer throughput The overall link level performance is assessed in Appendix F1 with throughput simulations for different scenarios and different physical layer parameters The focus is on the throughput achievable with a standard CP-OFDM system using different modulationcoding schemes under the assumption of ideal channel estimation and synchronisation The results are presented for the SISO case both for FDD and TDD as well as for the 2x2 MIMO case for FDD and the 4x4 MIMO case for TDD The obtained throughput figures indicate that at an S(I)NR between 20 to 25 dB a spectral efficiency for the single link of 3 bitsHz is achievable in the SISO case when considering the WINNER A1C2 NLOS tapped delay line channel models for the TDD and FDD mode respectively For the MIMO case a link spectral efficiency of 45 and 9 bitsHz in the 2x2 and 4x4 MIMO case respectively can be achieved at a target S(I)NR of 25 dB (using the same channel models)
At a bandwidth of 100 MHz the target of 1 Gbps at short ranges in isolated cells appears hence to be achievable For the wide area case achievable spectral efficiencies (and data rates) depend very much on the interference situation ndash cf the multi-link and system level results in the following section
5325 Multi-antenna processing The spatial processing aspects of the WINNER radio interface concept are described in Appendix B1 There the mapping of the data bits to the available space-time-frequency resources is described in detail Impacts of multiple transmit andor receive antennas to the physical layer (eg to synchronisation channel estimation) can be seen throughout the Appendix B Use of two antennas in the terminal is envisaged to be the baseline case as it provides substantial gains compared to single antenna at only moderate extra complexity
As multi-antenna transmission and reception is a fundamental part of the WINNER radio interface concept assessment results related to it are dispersed over the link- and system-level assessment appendices ie Appendix F and Appendix G The results verify that multi-antenna processing is one of the key technologies in reaching the stringent targets set for the WINNER system
Transmit beamforming and receive diversity are essential techniques to ensure coverage and high system throughput in the downlink Especially in wide-area scenarios with high number of active users fixed beam techniques offer high performance gains with low complexity and control overhead Average sector throughput increases by up to a factor of 3 for 8 transmit antennas (Appendices G15 and G24) The increased complexity of adaptive beams is easily justified in cases of few active users and SDMA where substantial sector throughput gain can be observed (Appendix G22) or for delay-sensitive flows (Appendix G21) Given an identical number of antenna elements spatial multiplexing can be used to increase the user peak data rates (Appendix F1) at approximately identical sector throughput ie at the expense of reduced inherent fairness (Appendix G24) The use of spatial diversity must always be considered in the context of other sources of diversity already exploited and therefore might provide only marginal additional gain (Appendix G24) Local area scenarios allow applying advanced spatial processing techniques based on short-term CSI and multi-user precoding like the SMMSE technique developed within WINNER Initial results in Appendix G25 shows that such techniques have the potential to meet the requirements of 4 bitssHz user throughput mentioned in Appendix A14 From multi-antenna receiver complexity point of view OFDMA is preferred over MC-CDMA (Appendix G23)
In downlinks (Appendix G23 Appendix G24) as well as uplinks one can note significant gains in throughput when going from one to two antennas at the user terminals MMSE combination in receivers can be seen to outperform MRC significantly (Appendix G23) The corresponding gain in sector throughput compared to the single receive antenna case is in the order of 35 for MRC and an additional 15 for MMSEIRC (Appendix G24)
The receiver complexity increase is considerable when compared to single antenna systems (factor of about 30 for a 4x4 system when spatial multiplexing is used) but still acceptable when compared to the decoding complexity of error control codes especially if higher order modulation is considered The evaluations show that the multi-antenna methods studied are feasible and practical with some restrictions on in which environments and specific system modes these methods should be used
WINNER D210 v10
Page 55 (180)
For the uplink base station receive diversity significantly improves sector throughput and enhances user data rates Performance improves with larger antenna separation and IRC with a lower number of antennas may give similar performance as MRC with a larger number of antennas (Appendix G51) In most of the cases SDMA using single-stream beamforming per user is the best solution to benefit from the spatial degrees of freedom (Appendix G52)
On the total system design there are still several open questions In particular the impact of simultaneous use of several complex techniques has not been analysed thoroughly For example the concurrent use of different multi-antenna technologies advanced coding methods fast link adaptation and scheduling can result in a challenging overall computational complexity even considering the expected advances in digital processing technologies
533 Multiple access Starting from the initial assessment of multiple access schemes in [WIND26] a further refined assessment has been performed for the most promising candidates by means of multi-link and system simulations In contrast to previous multiple access oriented simulation campaigns inter-cell interference one of the most important aspects when aiming at a frequency reuse one deployment is now modelled more properly However it should be stressed that still many simplifying simulation assumptions had to applied to keep simulation setup and run-time manageable Some aspects of the results have been highlighted in Section 316
Simulation results with focus on comparative or absolute performance assessments of multiple access schemes can be found in Appendix G1 and Appendix G4 for downlink and uplink respectively Regarding the downlink emphasis has been placed in comparing interleaved OFDMATDMA and MC-CDMATDMA as the most promising multiple access candidates for non-frequency-adaptively scheduled flows Results obtained in Appendix G11 indicate that OFDMATDMA performs slightly worse than MC-CDMATDMA if spreading is applied within one chunk only Spreading within a chunk enables low complex user separation at the UTs without performance penalties due to the flat fading characteristic of each chunk The decreased chunk granularity allows for a larger frequency diversity gain than with OFDMATDMA that explains its performance advantage If spreading is applied across several chunks as analysed in Appendices G12 and G13 MC-CDMA suffers from imperfect user separation at the UT with increasing load and OFDMA performs similar or slightly better in that case In addition equalisation considerably increases the complexity of MC-CDMA for the UT
Performance assessment of adaptive chunk based OFDMATDMA revealed the high multi-user diversity gains obtainable by frequency adaptive resource scheduling Considering a score-based scheduler that already takes fairness constraints into account the average cell throughput was increased by a factor of 16 see Appendix G11 compared to non-frequency adaptive scheduling However no traffic-model specific delay constraints have been taken into account yet since full queues were used as a baseline assumption throughout all simulations
In a wide-area scenario OFDMATDMASDMA has been proven to provide large system capacity gains by a factor of 2 compared to pure OFDMATDMA with beamforming using eight antennas in both cases see Appendix G15 Larger gains with more antennas are likely to be achieved From a complexity point of view adaptive OFDMATDMASDMA with beamforming supports simple UT receiver processing without the need for multiple antennas andor complex multi-user detection
Regarding the uplink similar studies were performed including pure TDMA MC-CDMA was not considered as viable multiple access scheme for the uplink due to the resulting high BS complexity From the UT perspective TDMA is attractive since it supports the use of single carrier transmission with lower peak to average power ratio and thus higher power efficiency than multi-carrier transmission In Appendix G41 it is shown that even TDMA allows for a multi-user diversity gain by adaptively scheduling in time albeit with much lower performance potential than adaptive scheduling in frequency
Frequency offset errors among UTs can be suppressed to around 1 of the subcarrier spacing by the UL-DL synchronisation scheme outlined in Appendix B41 and investigated in [WIND23] Therefore chunk based OFDMATDMA was chosen to be the main multiple access candidate for adaptively scheduled flows in the uplink as well as in the downlink Moreover it is highlighted in Appendix G43 that ndash although theoretically optimal ndash sharing the subcarriers does not yield any perceivable capacity gain Hence adding an additional CDMA component to OFDMA would only increase the system complexity
Even the synchronisation of a self-organised OFDM network is technically feasible with a reasonable overhead If relaying techniques are an integral part of the system design a single hop network can be extended to a multi-hop network without too high impact on implementation complexity at the user
WINNER D210 v10
Page 56 (180)
terminals On deployment costs no final conclusions can be made yet since the density of base stations and relay nodes depend crucially on the actual frequency allocation The restrictions due to the delay introduced by RNrsquos forwarding process the additional signalling overhead or the combination of duplex schemes at the two links at a RN require a more detailed analysis
The interference from other cells should be taken into account in the design of multiple access schemes and in the resource partitioning of the super-frame In frequency reuse 1 networks schemes for interference avoidance or reuse partitioning between cells (WP3 deliverables eg [WIND32] and [WIND35]) which in effect increase the reuse factor to between 1 and 2 are important for optimising the spectral efficiency The effect of introducing interference avoidance (RRM) is illustrated in the results of Appendix G12 It should be noted that the delay differences between cells are likely to exceed the OFDM symbol guard intervals Therefore reuse partitioning that allocates different sets of frequencies to different cells eg in their outer regions [WIND32] should not be performed without guard intervals in frequency As illustrated by Appendix G73 the overhead due to such guard intervals can be held at reasonable levels
534 Radio protocols As noted in Chapter 1 system design and protocol specification is an iterative procedure an initial design is needed in order to select an adequate protocol architecture which in turn may lead to a refined system design In Phase I of WINNER key protocol technologies have been identified and assessed but the final performance evaluations and subsequent choices for the WINNER RI can only be made when the consolidated and refined system concept is available Therefore in the following we focus on a brief but more general discussion about complexity and overhead aspects of different protocol technologies6
The complexity increase in the design of radio protocols is mainly due to the required measurements signalling overhead and due to the implementation of baseband processing at the base station It has been shown that the enhanced MAC protocols can provide high throughput and low delays at a feasible amount of complexity and overhead
The coordination between base stations is needed particularly in heavy traffic load situations and will increase performance in medium load situations A promising framework for inter-cell interference management and integrated load sharing with reasonable balance between performance and complexity is to perform the coordination hierarchically at different time scales with the lowest level working on the fastest time scale by assigning constraints on resources to distributed schedulers in the cells In addition self-organised radio resource management techniques which do not require signalling overheads or cause delays can be used and are particularly well suited for multi-hop networks where delays can be a problem
The multi-mode system concept introduces additional complexity both in the design of protocols and associated algorithms as well as hardware implementation In general modularity of system design helps to reduce the computational complexity but many of the implementation specific issues can be assessed only after the spectrum allocation is known
54 Comparison of performance results with requirements and design targets In Section 11 and Appendix A a number of requirements and design targets were listed This section assesses to what extent the present radio-interface concept can meet these targets This assessment is based on results from all appendices and also from previous WP2 deliverables but in particular on the multi-link and system-level assessments summarised in Appendix G
This kind of assessment faces several types of difficulties First several of the requirements have to be made more precise before they can be compared in a meaningful way with performance results Second one should be very careful when using the present simulations to assess absolute network performance figures The used models and assumptions are crucial for the outcome Moreover at this stage most evaluationssimulations are neglecting many imperfections eg estimations errors and delays Accounting for these imperfections may have a large impact on absolute performance figures Still the results may be used to indicate the performance potential of the technology
The assessments are based on the following assumptions summarised from Appendix A and Appendix E
6 See WP3 deliverables for first assessments in different deployment concepts
WINNER D210 v10
Page 57 (180)
bull Deployment Sites with three sectors (cells) as described in Appendix E deployed without use of relay nodes Max 8 antenna elements per base station sector and (mostly) two antenna element per UT
bull Duplexing and bandwidths Three types of radio bandwidths are considered FDD with paired 20 MHz and 40 MHz bands and TDD on one 100 MHz band Data rates per link refer to downlinks in TDD or half-duplex FDD both with activity factor 2 (reception half of the time)
bull Overhead The overhead due to guard bands and cyclic prefixes has been taken into account in all simulations Overhead due to pilots and downlink control signalling has been specified to around 20 in multi-link and system-level simulations see Appendix E31 and is taken into account in these results In the link-level results this overhead is not taken into account and has to be added separately The MAC layer adds some overhead due to CRC codes sequence numbers for retransmission units and non-perfectly filled chunks That MAC overhead has not been investigated and is therefore not taken into account below
bull Restrictions Perfect channel estimation will be assumed unless otherwise indicated and the results refer to downlinks Full queue models are used for the downlink flows
Requirements stated in Section 11
R33 A consistent and ubiquitous data rate per link of 5 Mbits above Layer 2
Assume a single user in the cell of interest and fully loaded neighbouring cells that generate interference Due to the activity factor for TDD or half-duplex FDD the requirement corresponds to 10 Mbits downlink cell throughput with one user at the cell edge This requirement is attained without problems in the considered 40 MHz FDD and 100 MHz TDD modes
For 20 MHz FDD downlinks relevant investigations are found in Appendix G24 for 700 m cell radius In the lower left Figure G16 the CDF value for 10 Mbits active radio link rate is around 015 for one BS antenna and a UT that uses two antennas with IRC This means that some but not all users at the cell edge would attain the performance Using fixed beamforming with 4 or 8 antennas at the BS the target would be attained with high probability see the lower left Figure G18 Results for larger cell sizes (not shown) indicate that the requirement can be fulfilled for cell radii above 2500 m with 8 BS antennas and 2 UT antennas At least two users at the cell edge (one in each slot of the FDD frame) can thus be provided at least 5 Mbits in rural deployment using the 20 MHz FDD mode
R32 A sustainable average high end data rate per link of 50 Mbits above Layer 2
With the same reasoning as above this requirement corresponds to an active radio link rate of 100 Mbits for a user on average over all locations in the sector
For 100 MHz TDD the requirement is fulfilled in short-range scenarios Considering 40 MHz FDD by scaling up the results for 20 MHz of Figure G17 we see that the result becomes attainable by using 8 BS antennas with grid-of-beams or adaptive beamforming and two UT antennas up to a cell radius of 1400 m by using non-frequency adaptive transmission based on turbo coding
For 20 MHz FDD the goal seems unattainable with non-frequency adaptive transmission With many users in the cell adaptive transmission and multi-user scheduling would boost the aggregate sector throughput but this would not enable an individual user to attain 50 Mbits on average over its location Thus the larger bandwidths of 40 MHz FDD or 100 MHz TDD seem to be required
R36 Peak spectral efficiency in connected sites of 10 bitssHz in wide area deploym for high load
The ldquopeakrdquo spectral efficiency normally refers to the maximum sector throughput allowed by the modulation coding and antenna design It is therefore not a function of the load of the system With 3-sector sites this requirement means 333 bitssHzsector The 20 downlink overhead margin raises the requirement to 416 bitssHzsector This figure is attained since 64-QAM transmission is allowed
R37 Peak spectral efficiency in isolated (non-contiguous) sites of 25 bitssHz
It is noted in Appendix F1 from the results in Figure F4 that this goal is attainable with diversity-based 4x4 MIMO in 3-sector sites but only at high SINRs of at least 30 dB
WINNER D210 v10
Page 58 (180)
R312 User speeds ranging from 0ndash500 kmh should be supported
The short OFDM symbol length used for evaluation provides reasonable robustness against the effect of channel variability within symbols but the performance for the highest vehicular velocities and relay links to moving relays in trains remains to be investigated
The OFDM pilot grid for non-frequency adaptive SISO transmission has been scaled to be appropriate up to 250 kmh (Appendix B42) Speeds up to 500 kmh and the use of beamforming (eg following a moving train) would require extra pilot overhead but no dramatic effects are expected
R34 A maximum delay over the radio interface of 1 ms at Layer 2
The delay over the radio interface is interpreted as the delay from arrival of a packet to the MAC layer to the earliest instance the packet can be received and decoded With the tightly designed MAC feedback loops delays of 07ndash17 ms are attained see Appendix C15 The target round-trip delay of 2 ms (Table A6) can be fulfilled since the decoding time for reasonably sized encoding blocks and retransmission units (at or below 1520 bytes) should be 01 ms or below according to Table B2
ITU-R 100 Mbps peak aggregate useful data rate for mobile access
This is a data rate as seen from the base station not the individual terminals It is here interpreted as the cellsector throughput Thus the terminal activity factor does not affect the assessment
This data rate is difficult to attain using 20 MHz FDD It could be attained in a rural site with many users in the cell by using max throughput scheduling and SDMA with four beams see upper left part of Figure G10 However that strategy would starve users not located close to the BS A better indication of the attainable performance for 20 MHz FDD downlinks are the 75 Mbps attained in Figure G10 when using proportional fair scheduling and SDMA with four beams
With many users in the cell experiments with adaptive beamforming in Appendix G21 (that use all 512 subcarriers) provide CDF curves in Figure G11 They show that the goal is almost attained when using the TrackingPSF mean-approach The average data rate with 416 subcarriers would be (416512)110 Mbps = 89 Mbps with 60 users per 1-km cell 8 BS antennas 1 UT antenna Note that with many users per sector the average throughput per user would of course be much lower (right-hand Figure G11)
ITU-R 1 Gbps peak aggregate useful data rate for local area
The results in Appendix G25 indicate that this target is attainable even when channel estimation errors are considered but only in short-range cells (50 m range) with MIMO links that use large numbers of transmit antennas and four receiver antennas
Design targets stated in Appendix A
Throughput per link targets for rural and metropolitan area deployment
The target 1 bitsHz corresponds to 40 Mbps on active links on 20 MHz half-duplex It can be regarded as fulfilled when using 20 MHz FDD up to 25 km cell radius if we have only one user per sector See Appendix G24 Figure G17 The target 05 bitsHz (at 70 kmh) was found to be attainable in Appendix F1
Results in Appendix G11 G15 G21 and G22 show that the requirements for low and medium terminal velocities are well fulfilled with multiple users per cell in particular when using multiple antennas Terminal velocities of 250 kmh have not been evaluated
Throughput per link targets for local area deployment
The target high-end throughput per link of 4 bitsHz per sector is attained for the A1 LOS and A1 NLOS channel models at 50 m distance according to Appendix G43 It is also attained for the B1 LOS channel model for 10 users all being at 150 m distance with OFDMA maximum throughput scheduling It is not attained at 150 m with a B1 NLOS model These results are for adaptive uplinks
WINNER D210 v10
Page 59 (180)
6 Conclusions and Outlook An overview of the current status of the WINNER radio interface concept was presented in Chapters 1ndash4 with an emphasis on novelties compared to existing systems Throughout the work design and functionalities that allow or facilitate operation in shared spectrum and interoperation between WINNER networks and different RATs deserved special focus
The design view was consistently used in this deliverable motivated by its focus on the lower layers and the need to enable direct assessments in terms of performance simulations and implementation impact analysis Service and protocol views and more information on higher layers can be found in the final deliverables of WP7 and WP3 An overview of simulations investigating different system components as well as the whole system was given in Chapter 5 Also comparisons were made with requirements from [WIND71] and other design targets defined within WP2 It was concluded that with reasonable assumptions about missing information (yet to be determined by political legal economic and other factors and decisions) and within the uncertainties of the simulations these requirements and design targets could be fulfilled The analyses of implementation impact in this and previous deliverables revealed no major critical issues that would prevent a cost-efficient implementation of the system at the time of deployment in 8ndash10 years More technical detail both regarding concept and assessments is provided in the appendices and in earlier deliverables
An important objective of Phase II is to further enhance and refine this initial concept to a level of detail needed to build a prototype within the project and to serve as input to the standardisation process that is expected to follow after World Radiocommunication Conference 2007 (WRC-07)
WINNER D210 v10
Page 60 (180)
Appendix A Requirements and Design Targets This appendix presents design targets for different scenarios as discussed in Section 11 A few scenario-independent targets and general assumptions about spectrum etc are also listed at the end
A1 Targets for different scenarios
A11 Scenarios Depending on the scenario being considered different subsets of the system requirements will be relevant In the following discussion we therefore distinguish between the three application scenarios that have been identified for WINNER (respective characteristics listed in sub-bullets)
bull Rural area o medium traffic demand o cellular large cells o range (coverage) issues
bull Metropolitan area o high traffic demand o cellular midsize cells o range (coverage) issues (to some extent)
bull Local area o high data rate demand high traffic demand o cellularisolated cellspeer-to-peer small cells o indooroutdoor
Rural area and metropolitan area will sometimes be referred to collectively as examples of ldquowide-areardquo scenarios Similarly local area will sometimes be referred to as ldquoshort rangerdquo For each scenario technical targets will be summarised in the following sections
A12 Rural area In the rural-area scenario coverage and high UT speeds are the main challenges for the radio interface Cell radii of 2 km and more will likely be desirable The system requirements state an average cell throughput of 50 Mbits in 100 MHz bandwidth and a cell border (ubiquitous) throughput of 5 Mbits Either FDD paired bands or TDD may be used half-duplex is assumed for terminals also in the former case for complexity reasons For maximum efficiency frequency 1-reuse is generally assumed but tech-niques discussed in eg Section 52 in [WIND32] may be used to create a higher effective reuse for users at the cell border The bit rates mentioned here will only be possible to guarantee at low and moderate speeds cf [WIND24] and Appendix B52
Requirements on downlink are summarised in Table A1 All bit rates refer to throughput above the MAC layer and full queues are assumed The cell range is only introduced as a reference point for the throughput values and the actual coverage areas might be different (at the expense of reduced throughput per link) For the uplink the lower output power of the terminal will reduce the possible bit rates see Table A2 Dual-antenna terminals are considered to be the baseline case Relaying may be needed to reach the tabulated targets the feeder links connecting base station and relay node are then normally assumed to use the same spectrum
Table A1 Targets for Rural Area (Downlink)
Reference cell range
UT velocity Throughput per link (cell average single user in cell)
2 km 0 kmh 70 kmh 120 kmh 250 kmh
1 bitsHz 05 bitsHz 05 bitsHz 01 bitsHz
WINNER D210 v10
Page 61 (180)
Table A2 Targets for Rural Area (Uplink)
Reference cell range
UT velocity Throughput per link (cell average single user in cell)
2 km 0 kmh 70 kmh
01 bitsHz 005 bitsHz
A13 Metropolitan area For metropolitan area spectral efficiency and inter-cell interference become more important considera-tions whereas extremely high UT speeds are less common Coverage may sometimes still be an issue but the maximum cell size is smaller than for the rural-area scenario and the performance difference between UL and DL is typically expected to be less significant Relays may be needed also in this scenario In order to maximise spectral efficiency MIMO preferably with fast feedback will likely be an important feature Requirements are summarised in Table A3 The throughput is given per link and with 3-sector sites and half-duplex for the UT it should be multiplied with 3times2=6 to obtain the corresponding value per site
Table A3 Targets for Metropolitan Area (Downlink)
Reference cell range
UT velocity Throughput per link (cell average single user in cell)
1000 m 0 kmh 70 kmh
1 bitsHz 05 bitsHz
A14 Local area Local area communication includes cellular systems as well as non-contiguous (isolated) sites and peer-to-peer communication In the cellular case the short-range requirements in Table A4 apply For non-contiguous cells inter-cell interference is not an issue and the highest spectral efficiency 25 bitssHzsite should be achievable With 3 sectors and half-duplex this corresponds to approximately 4 bitssHzlink (see Table A5)
Table A4 Targets for Local Area (Cellular)
Environment Reference cell range
UT velocity Throughput per link (cell average single user in cell)
Outdoor 100 m lt10 kmh 50 kmh
1 bitsHz 05 bitsHz
Indoor 30 m lt10 kmh 1 bitsHz
Table A5 Targets for Local Area (Isolated Cells and Peer-to-Peer)
Environment Reference cell range
UT velocity Throughput per link (cell average single user in cell)
Outdoor 100 m lt10 kmh 4 bitsHz
Indoor 30 m lt10 kmh 4 bitsHz
A2 Additional targets To be able to handle new delay sensitive applications and link adaptation efficiently it is essential to have a low delay over the radio interface The targets of Table A6 are assumed
WINNER D210 v10
Page 62 (180)
Table A6 Delay targets
Basic radio interface delays (physical layer single hop)
ndashRound-trip time
lt 2 ms
Packet channel establishment (minimum)
ndash UT originated ndash BS originated
lt 5 ms lt 2 ms
RAN-UT-RAN delay 4 ms
A3 System assumptions The preferred spectrum range for WINNER systems is below 6 GHz and for research purpose the target band is 34ndash50 GHz A bandwidth allocation of 100 MHz per carrier should be seen as an upper limit Such wide bands are not feasible in the current mobile bands therefore new bands should be identified The defined target bands are among the current candidate bands in ITU
Operation in spectrum shared with other operators that use the same physical layer WINNER mode will be an integral part of the design Operation in dedicated bands is seen as a special case of this situation Operation in isolated cells will be seen as a special case of cellular transmission (see also Appendix A14)
WINNER D210 v10
Page 63 (180)
Appendix B Physical Layer The purpose of this chapter is to provide more detail on the assessment of different physical layer candidate technologies which eventually lead to the design decisions presented in Chapter 2 of this report It also gives the rationale behind the parameterisation of different system components if not yet provided in previous deliverables [WIND23]
Appendix B1 contains a detailed description of the generic WINNER spatial processing framework along with some example configurations of it The provided figures illustrate in more detail the structure of the space-time-frequency processing sub-block of the generic transceiver architecture depicted in Figure 21 of Chapter 2 Extending on the framework for the assessment of coding techniques from [WIND23] Appendix B2 provides a detailed comparison of the most promising FEC schemes considered for the use in WINNER Duo-Binary Turbo Codes and Block-LDPC Codes Appendix B3 presents a short comparison of the different modulation techniques investigated during WINNER Phase I [WIND21 WIND22 WIND23] as well as a short summary of their merits and drawbacks Afterwards Appendix B4 covers the topic of pilot design for channel estimation and synchronisation The WINNER plot grid is presented including a discussion of different core requirements for channel estimation (chunk based channel estimation extension to the MIMO case etc) Finally Appendix B5 contains information related to link adaptation a comparison of different bit- and power loading algorithms details on the prediction horizons for channel quality prediction and methods for the compression of feedback for channel state information
B1 Spatial processing and space-time-frequency mapping Figure B1 shows a generic transmitter chain implementing the WINNER multi-antenna concept7 The segmentation stage shown corresponds to the MAC-3 sub-layer introduced in Section 315 which allows splitting one RTU into k encoding blocks that undergo individual forward error correction FECk and interleaving Πk Spatial reuse of a chunk adds a third dimension referred to as a chunk layer and presented along the vertical axis of Figure B1 The (maximum) number of layers l in chunk c denoted Qc can be different for different chunks The mapping of FEC blocks to chunk layers is performed by the resource scheduler In adaptive transmission each chunk layer carries data from one flow only In non-frequency adaptive transmission code-multiplexing may be used in downlinks The chunk layers may stem from the different RTUs of different flows in the case of SDMA or from the same flow in case of per stream rate control and multi-level coding Note that the number of layers in a chunk may be arbitrary in relation to the number of physical antennas denoted MT
The bits of chunk layer cl are first modulated onto Sc modulated layers The number of modulated layers is inferior or equal to the number of chunk layers Scle Qc Typically they are equal that is each chunk layer is modulated independently However for the case of multi-level coding several chunk layers are modulated onto the same modulated layer The modulated layers are then subject to an optional non-linear precoding8 The precoded modulated layers are then dispersed onto virtual antenna chunks with a dispersion code A virtual antenna chunk is a three-dimensional entity which spans MT virtual transmit antennas in space nsymb OFDM symbols in time and nsub subcarriers in frequency To simplify the presentation it is assumed that the number of virtual antennas is equal to the actual number of physical antennas If the underlying dispersion code encodes the signal over less or more dimensions appropriate zero padding and puncturing in the spatial dimension is assumed Typically a linear dispersion code is assumed but by allowing non-linear dispersion codes also schemes such as various forms of space-timefrequency trellis-coded modulation may be represented in the generic processing [WIND21 WIND23 WIND26 WIND27]9
7 Figure 21 shows the overall transmitter structure Here a detailed view of the spatial processing (SP) block in
Figure 21is given (GMC and pilot insertion aspects are neglected for readability) 8 The non-linear precoding proposed in [WIND27] is based on Tomlinson-Harashima precoding however the non-
linear precoding block can also include more general lattice coding techniques Such techniques allow approaching the optimal dirty paper coding and can be used to improve the performance of a MIMO single link
9 If some form of coding and modulation is performed by the dispersion code the outer code is probably relatively weak and the modulator essentially bypasses the encoded bits
WINNER D210 v10
Page 64 (180)
segmentation codingchunk layer multiplexing chunk processing OFDM
link adaptation and resource assignment
spac
efre
q
Seg FECk Πk
Res
ourc
e S
ched
uler
Mod NLP DC P BF
ant s
ummati
on
OFDM proc
essin
g
FEC forward error codingMod modulationNLP non-linear precodingDC linear dispersion codeP power allocationBF beamforming
segmentation codingchunk layer multiplexing chunk processing OFDM
link adaptation and resource assignment
spac
esp
ace
freq
Seg FECk ΠkSeg FECk ΠkFECk Πk
Res
ourc
e S
ched
uler
Mod NLP DC P BF
ant s
ummati
on
OFDM proc
essin
g
FEC forward error codingMod modulationNLP non-linear precodingDC linear dispersion codeP power allocationBF beamforming
Figure B1 Overview of the generic PHY processing chain
The virtual antenna chunk of each layer is then subject to power allocation and linear precoding which means that each virtual antenna chunk of each layer is mapped onto a physical antenna chunk Each element of the three-dimensional antenna chunk is a linear combination of the elements of the layerrsquos virtual antenna chunk The term linear precoding covers techniques such as closed-loop transmit diversity linear multi-user precoding and long-term beamforming and also antenna or beam selection and hopping as well as random beamforming that may be employed by opportunistic beamforming approaches For cases with multi-user optimisation the linear precoding and the power of virtual antenna chunks are optimised jointly Finally the layersrsquo antenna chunks are summed over the antennas to form a three-dimensional antenna chunk which is passed to assembly and OFDM modulation per antenna
The MAC function spatial scheme selection and link adaptation will select and configure the blocks of this generic chain to implement the most favourable spatial processing scheme for each flow A few illustrative example configurations are given in the following In case of open-loop space-time coding (using an LDC eg the well-known Alamouti-code) all data undergo identical FEC and modulation The LDC then maps the symbols onto the antenna chunk (Figure B2) For PARC however segmentation is performed first to allow for individual FEC and modulation of the sub-flows which are mapped to different chunk layers (Figure B3) Figure B4 shows the processing for SMMSE where the LDC implements purely a multiplexing onto virtual antenna chunks The power allocation and linear precoding (BF) is then optimised across all SDMA users according to the SMMSE algorithm [WIND27]
segmentation codingchunk layer multiplexing chunk processing OFDM
link adaptation and resource assignment
spac
efre
q
FECk Πk
Res
ourc
e Sc
hedu
ler
Mod
LDC
P
OFDM proc
essin
g
one userflow P
P
segmentation codingchunk layer multiplexing chunk processing OFDM
link adaptation and resource assignment
spac
esp
ace
freq
FECk Πk
Res
ourc
e Sc
hedu
ler
Mod
LDC
P
OFDM proc
essin
g
one userflow P
P
FEC forward error codingMod modulationNLP non-linear precodingLDC linear dispersion codeP power allocationBF beamforming
Figure B2 Example configuration for open-loop space-time coding
WINNER D210 v10
Page 65 (180)
segmentation codingchunk layer multiplexing chunk processing OFDM
link adaptation and resource assignment
Seg
spac
efre
q
FECk Πk
Res
ourc
e S
ched
uler
Mod P
OFDM proc
essin
g
one userflow
segmentation codingchunk layer multiplexing chunk processing OFDM
link adaptation and resource assignment
Seg
spac
esp
ace
freq
FECk ΠkFECk Πk
Res
ourc
e S
ched
uler
Mod P
OFDM proc
essin
g
one userflow
FEC forward error codingMod modulationNLP non-linear precodingLDC linear dispersion codeP power allocationBF beamforming
Figure B3 Example configuration for PARC
segmentation codingchunk layer multiplexing chunk processing OFDM
link adaptation and resource assignment
spac
efre
q
FECk Πk
Res
ourc
e S
ched
uler
Mod
BF
OFDM proc
essin
g
one userflow LDC
P
P
P
segmentation codingchunk layer multiplexing chunk processing OFDM
link adaptation and resource assignment
spac
esp
ace
freq
FECk Πk
Res
ourc
e S
ched
uler
Mod
BF
OFDM proc
essin
g
one userflow LDC
P
P
P
LDC
P
P
P
FEC forward error codingMod modulationNLP non-linear precodingLDC linear dispersion codeP power allocationBF beamforming
Figure B4 Example configuration for SMMSE
Apart from the generic processing chain and example configurations a lean baseline configuration is defined which serves as basic implementation guideline and benchmark It is based on the following simplifications
bull no segmentation (MAC-3 sub-layer) ie one RTU is encoded as a single FEC block
bull independent processing of each chunk layer ie each modulated layer stems from a single chunk layer
bull no non-linear precoding
bull linear dispersion codes that generate a set of virtual antenna streams out of each chunk layer
bull pure spatial linear precoding (beamforming) ie for a given chunk layer cl symbol t and subcarrier f the elements xcl(tf) of the antenna chunk are obtained by
)ft()ft( lclclc aFx =
where acl(tf) is an MT times 1 column vector holding the corresponding element of the virtual antenna Note that Fcl is identical for all symbols within one chunk layer and each column of Fcl can be viewed as transmit weight vector
Relaying is an integrated part of the WINNER system Investigations that combine relaying and spatial processing have been performed in [WIND27] It has been shown that FRN based on decode-and-forward can benefit from different kinds of spatial processing In-depth investigations and system design that tighly integrates relaying and spatial processing are foreseen in Phase II including more sophisticated concepts like cooperative relays [AY05]
WINNER D210 v10
Page 66 (180)
B2 Forward error correction A large number of possible options for forward error correction have been identified and discussed in [WIND21] With the advent of iterative decoding very powerful concatenated error correction schemes have been devised which exhibit a decoding complexity that is linear in the block length ndash a key requirement for inclusion into any practical wireless communications system Of the plurality of possible concatenated codes parallel concatenated convolutional codes and low-density parity-check codes have been selected as main candidate technologies as they showed the best trade-off between performance and implementation complexity Of these two general classes of codes Duo-Binary Turbo Codes and (Quasi-Cyclic) Block LDPCC (QC-BLDPCC) are considered for the use in the WINNER system since they provide the necessary amount of flexibility in terms of block lengths and code rates However iterative decoding schemes suffer from quite low performance at short block lengths Therefore convolutional codes are used with short block lengths below 200 information bits The domain of suitability (for a target BLER of 1) of all candidates is summarised in Figure B5 below (cf Appendix F2 for details)
Figure B5 Domain of suitability of DBTC and BLDPCC for a target BLER of 1
Table B1 summarises the assessment of these three candidate technologies
Table B1 Assessment of the most promising FEC techniques
CC10 DBTC BLDPCC
Short blocks - lt05 dB lt1 dB
Medium blocks lt1ndash15 dB - lt02ndash04 dB
Performance11
Large blocks lt2ndash25 dB lt02 dB -
Code structure Very low Low Medium Memory Requirements
Decoding Low Medium Medium
Encoding complexity lt 10 opsinfo bit
Decoding complexity ~ 2500 opsinfo bit lt1700 opsinfo bit lt1200 opsinfo bit
Maturity High Medium Medium
10 Memory 8 convolutional code soft Viterbi decoding 11 Loss with respect to the best technique at codeword sizes 50 576 4308 bits (AWGN BPSK target BLER 1)
0 500 1000 1500 2000 2500 3000 3500 4000 4500 5000
DBTC
DBTC
DBTC
BLDPCC
BLDPCC
BLDPCC
Codeword Size (bits)
Rc=12
Rc=23
Rc=34
CC
CC
CC
WINNER D210 v10
Page 67 (180)
DBTC show very good performance already at quite low block sizes (around 128 information bits) and may eventually be used instead of CC in such scenarios LDPCC are favoured over DBTC for large block sizes due to their superior error correction performance in this regime (lower required bit SNR to achieve BLER of 1 [WIND23]) All codes show the same high degree of flexibility in terms of block sizes and code rates (cf Appendix B21) and support the construction of rate compatible code sets (cf Appendix B22) It should be emphasised that the impact of selection of one or another of the proposed FEC technique on the overall system concept is rather limited as soft-input soft-output versions of decoder algorithms exist for all investigated techniques ndash the en-decoding sub-blocks can hence be regarded as a ldquoblack boxrdquo by the rest of the system
B21 Implementation issues flexibility parallelisation throughput An important practical issue when dealing with coding schemes for adaptive radio interfaces is the flexibility in terms of block sizes and code rates One typical way of constructing good LDPCC is to first optimise the error correction performance of the code ensemble for the target code rate (eg optimise the degree distribution using EXIT chart analysis) and then generate one specific code using construction algorithms that ensure low error floors (eg the progressive edge growth algorithms) The disadvantage of this approach (for practical implementation) is that a new code needs to be designed for each block length and rate Structured LDPC codes and especially Quasi-Cyclic and Block LDPC Codes [MY05 MYK05] on the other hand have been shown to have good performance and high flexibility in terms of code rates and block sizes at the same time The general idea is to base the construction of the LDPCC on different basic elements usually shifted andor rotated versions of the identity matrix Adaptation to different block lengths is easily done by expanding elements of the basic matrix (eg by replacing each ldquo1rdquo in the parity check matrix with an identity matrix and each ldquo0rdquo with an all-zeros matrix) Different code rates are obtained by appending more elements to the matrix in only one dimension (ie add more variable nodes but no check nodes) The decoder must obviously be designed to support such changes of the code structure The inherent parallelism of LDPCC is then exploited by allocating Variable Node Units (VNU) and Check Node Units (CNU) to groups of variable and check nodes respectively for processing of the decoding algorithm The degree of parallelism is dictated by the number of elements in each unit The throughput of such a semi-parallel decoder architecture can be expressed as follows
ckcb Fz
PITPRnD sdot+
sdotsdot= (B1)
where Fck denotes the clock frequency (nbmb) are the dimensions of the base model matrix Rc is the code rate and IT is the iteration number The degree of parallelism P is bounded as 1lt=Plt=z where z is the expansion factor Note that in this architecture the total number of VNUs and CNUs is Pnb and Pmb respectively [LZ05] Current technology does not allow yet exploiting this degree of parallelism in full at reasonable cost Nevertheless the flexibility of such architectures is quite attractive from a design point of view as it allows to scale and to tune the hardware cost very easily depending on the target throughput Such semi-parallel architectures are currently being investigated throughout the whole industry (some first complexity estimates can be found in [ZZ05]) As always when dealing with LDPCC the number of iterations IT can vary between an average number required for convergence and a maximum number which represents the worst case decoding delay (and strongly influences the error-correction performance)
Duo-Binary Turbo Codes [WIND21 WIND23] differ from classical PCCC by the fact that the information bits are encoded pair wise The internal inter-leaver is based on an algorithmic permutation defined by a single equation This PCCC can hence be adjusted to any frame size by modifying only four values which parameterise the internal interleaver implying a high flexibility of this type of PCCC As the mother code rate of the Duo-Binary Turbo Code is frac12 (instead of 13 for classical PCCC) it is inherently more robust to puncturing Duo-Binary PCCC not only achieve very good performance for long block lengths but also perform well at smaller block sizes and have been standardised in DVB with block lengths as small as 128 bits The performance has also been improved at low error rates thanks to the improved internal interleaver The decoder can be designed to decode 2 information bits per clock cycle and its throughput can hence be obtained by means of the following relation
ckFITPD sdot= (B2)
The throughput is independent of the code rate as code rates higher than 05 are obtained by puncturing
WINNER D210 v10
Page 68 (180)
For the throughput analysis we consider a clock frequency Fck of 200 MHz to be achievable which corresponds to a technology of 013 microm and beyond [THB04] By tuning the degree of parallelism P and the (maximum) number of iterations IT we can match the requested decoderrsquos throughput to the system requirements Table B2 below summarises the achievable throughput exemplarily for the case of a code raet Rc=05
Table B2 Achievable throughput for rate 05 DBTC and BLDPCC (200 MHz clock frequency)
Code Parallelism level Number of iterations Bit rate (decoded Mbitss)
6 8 150
12 8 300
4 5 160
DBTC
8 5 320
2 50 (flooding schedule) 192
4 50 384
1 20 (shuffled decoding) 240
BLDPCC
2 20 480
It can thus be concluded that a parallelism level of 12 for DBTC (when using 8 internal decoder iterations) and 4 for BLDPCC (using a standard flooding schedule and corresponding to 192 VNUs and 96 CNUs) is sufficient to achieve a throughput of 300 Mbps (and beyond) We conclude that both coding candidates can offer a suitable throughput It is however known that the inherent parallelism of BLDPCC can be attractive from a designer point of view as it allows tuning whole hardwaresoftware implementation to the cost and performance constraints Although very high data rates are theoretically achievable by BLDPC decoders technology constraints still limit the degree of parallelism affordable and thus the data rates To give the full picture the respective gate count (and thus area estimation) for DBTC and BLDPCC need to be considered As these figures depend very much on the target architecture and a number of other parameters this assessment will be done in the next phase of WINNER
B22 Rate compatible code sets for HARQ-II Hybrid automatic repeat request (HARQ) schemes combine the reliability of FEC with the throughput of ARQ Especially type II HARQ schemes also denoted as incremental redundancy (IR) provide an improved throughput and have for example been successfully employed in HSDPA To construct an efficient IR scheme a set of rate-compatible (RC) codes is needed This is a sequence of nested codes providing a range of different code rates It can be constructed eg by puncturing a low rate mother code A special case of IR is chase combining where the FEC codeword is repeated and soft combining is applied to the received code bits This is equivalent to using an outer repetition code (eg by additional spreading cf [WIND23]) which can be used when the channel SNR is insufficient to support successful decoding even at the lowest (mother) code rate
For the detection of a decoding failure an error detecting code is required This can either be implemented by an additional outer cyclic redundancy check (CRC) or is already inherently included in the code itself ndash like in the case of LDPCC The length of the CRC is determined by the desired probability of an undetected error which converges asymptotically as 2-b where b is the number of the CRC parity bits (cf [3GPP-TR25212] where a maximum CRC length of 24 bits is used)
Rate compatible punctured code sets are well known for CC and PCCC [RM00] but can also be created both for DBTC and BLDPCC For the performance of punctured LDPCC it is decisive that the number of punctured variable bits connected to each check node is minimised If a check node is connected to two punctured bits there will be only zero messages in the first iteration and the information of this parity check equation is lost Therefore best results can be achieved by puncturing only degree 2 variable nodes In most LDPC construction methods the redundancy part consists (almost) only of degree 2 variables Often it has a dual diagonal form Therefore it is possible to puncture only redundancy bits Figure F8 illustrates that the performance of rate compatible punctured DBTC and BLDPCCs is quite similar We
WINNER D210 v10
Page 69 (180)
hence conclude that rate compatible punctured codes can be constructed for all FEC techniques that are currently considered for use in the WINNER system
B23 Low-density parity-check codes decoding options The standard algorithm for decoding of LDPC codes is the so-called ldquobelief propagation algorithmrdquo (BPA) of which several good approximations exist In fact it has been shown in [CF02] that close-to-optimal error correction performance can be achieved by a corrected version of the so-called Min-Sum algorithm (MSA) The basic idea of the MSA is essentially the application of the maxLog approximation to BPA decoding Similar to the case when using maxLogMAP decoding of PCCC this comes at a performance loss in the order of 05 dB (on AWGN channels cf [WIND23]) This loss can be dramatically reduced by appropriate scaling of the extrinsic messages to compensate for the over-estimation of extrinsic information (this approach has been also applied in Turbo decoding [VF00]) This corrected version of the MinSum algorithm will in the following be denoted as ldquoMin-Sumrdquo Calculating variable and check node messages during decoding then only involves simple sum and minimum operations respectively plus a scaling of the check node messages In theory the scaling factor α needs to be optimised for each code and SNR by means of Density Evolution (DE) or Monte-Carlo simulation to achieve optimal results However Monte-Carlo simulations showed that choosing α=08 as proposed in [CF02] results in very good performance independent of the SNR operation point for the BLDPCC considered for use in WINNER The ldquoMinSumrdquo algorithm is therefore considered to give the best performance-complexity trade-off for LDPC decoders
However in the case of irregular LDPCC even using the MinSum with optimal correction still not fills the gap wrt true belief propagation decoding Therefore further investigations have been carried out recently leading to new sub-optimal decoding algorithms [GBD03 JVS+03] that could be good candidates in terms of complexityperformance trade-off and memory savings Bit-Flipping Algorithms [BR04 ZF04 ZB04 KLF01 ZF04] on the other hand might be considered an option for very low-end terminals where a loss in performance might be acceptable when large savings in decoding complexity can be achieved A drawback of such approaches is the absence of reliability information at the output of the decoder However since low-end terminals will most probably not use iterative equalisation andor channel estimation techniques this appears to be no significant limitation
B24 Scheduling of the decoder The decoder for LDPCC is a message-passing algorithm operating on the Tanner graph [WIND21] which is equivalent to the structure of the parity-check matrix of the code In the standard schedule of the BPA which is often denoted as flooding schedule first all check node are updated and then all variable nodes are updated An alternative is shuffled scheduling [KF98 MB01 ZF05 YNA01 MS02] also known as layered decoding Here the BP decoder uses not only the messages from the last iteration but uses also the information of the updates from the current iteration This leads to a considerable increase in convergence speed One can discern horizontal and vertical shuffling The vertical shuffling schedule operates along the variable nodes all check nodes connected to the current variable node are updated and the current variable node is updated The horizontal schedule operates along the check nodes the current check node is updated and all the variable nodes connected this check node are also updated Simulations show that both methods increase the convergence speed roughly by a factor of two for both maximum and average number of iterations However the operation count of a single iteration of the BP decoder is increased compared to the flooding schedule In vertical shuffling each check node is updated dc times per iteration while in horizontal shuffling each variable node is updated dv times per iteration (dv and dc is the degree of the respective node) As the check node update is more complex than the variable node update horizontal scheduling should be preferred It is possible to perform group-wise shuffling ie updates are performed on a group of nodes before the nodes of the other type are updated This is especially suited for quasi-cyclic block LDPC codes as nodes within one block do not exchange messages anyway Group-wise shuffling also enables semi-parallel decoding and reduces the required memory [MS02] For the LDPCC considered in the WINNER framework investigations showed that the performance of group-wise horizontal shuffling with 20 iterations is equivalent to that of the flooding schedule with 50 iterations (consistent with the speedup factors reported in [ZF05]) In the assessment of complexityperformance trade-off (cf Appendix F2) results will be given in terms of flooding scheduling as reference point for any other comparison
WINNER D210 v10
Page 70 (180)
B3 Modulation
B31 Assessment of modulation techniques As outlined in Section 22 supporting bandwidths of up to 100 MHz and enabling the ldquoalways bestrdquo principle translates into the following main requirements for the selected modulation technique efficient equalisation of frequency selective channels high granularity and the possibility to adapt transmission parameters to different environment conditions (delay spread Doppler spread available spectrum) user requirements (data rate delay) and user terminal capabilities (maximum transmit power antenna configuration etc) Frequency domain signal processing and more specifically the generalised multi-carrier concept are very elegant means of providing the required flexibility Among the large number of modulation techniques that can be accommodated in the GMC framework (cf Section 22) the following have been assessed in more detail during WINNER Phase I different ldquoflavoursrdquo of OFDM (CP-OFDM IOTA-OFDM PRP-OFDM) MC-CDMA and FMT as well as serial modulation and IFDMA (or FDOSS) Table B3 summarises the assessment of these modulation techniques Although several transmission technologies are also related to multiple access the discussion here focuses solely on the modulation aspect The benefits and drawbacks of the main candidate technologies CP-OFDM and CP based frequency domain generated serial modulation are discussed in the following section
Table B3 Assessment of most promising modulation techniques
Serial modulation
IFDMA CP-OFDM
PRP- OFDM
MC- CDMA
FMT-FDMA12 (NBWB)
IOTA-OFDM
Required IBO
Typically 2ndash3dB lower than for multi-carrier techniques
High (6ndash9 dB[WIND22])
Tx complexity
IFFT FFT
Low IFFT (addt spreading for MC-CDMA)
Rx complexity
FFT
IFFT
FFT FFT postfix suppr
FFT addt de-spreading13
FFT FFT
Filtering complexity
Low Low14 High (poly-phase filtering)
Equalisation Issues
May require DFETEQ for higher order modulation15
acquisition delay
Spectrum flexibility
+ - + + o+ -+ +
Robustness wrt ICI
+ - - - - +- +
Required guard bandsperiods
Similar requirements (~10 for GI ~20 for guard bands under the current assumptions)
+16 +16
Maturity O O + O O O O
12 The specific merits of FMT-FDMA depend very much on the modulation format chosen within the sub-bands 13 May also require multi-user detection in environments where the delay spread is large 14 It is possible to run multi-carrier based transmission without any additional filtering resulting in substantial
spectral side-lobes Additional filtering is often required to meet spectral mask requirements 15 Noise enhancement in linear (MMSE) FDE may cause error floors for higher order modulation (16QAM) when
using high code rates [WIND23] the issue can be overcome by using decision feedbackTurbo equalisation 16 Cyclic prefix can be omitted However additional pilots would then be required to achieve coarse synchronisation
WINNER D210 v10
Page 71 (180)
Interleaved Frequency Division Multiple Access (IFDMA) [WIND23 Section 5214] can be interpreted both as a serial modulation (FDOSS) [WIND21 Section 415][ChC00 DFL+04] and a multi carrier modulation scheme [GRC02] thus combining many of the advantages of the two approaches As a special case of frequency domain based serial modulation (using interleaved assignment of subcarriers) it enables the same high frequency diversity and low peak to average power ratio It also facilitates low complexity signal generation [FCS04] and user separation (as for OFDMA) On the other hand IFDMA and OFDMA exhibit a similar sensitivity to frequency offsets
Multi-Carrier Code Division Multiple Access (MC-CDMA) has been considered extensively in [WIND21 Section 45][WIND23 Section 5213][WIND26] Since it provides high frequency diversity and good granularity also for low data rate transmission MC-CDMA is proposed for the use with frequency non-adaptive transmission Detection complexity will be low when using MC-CDMA only within one chunk (ie under time and frequency non-selective fading) Complexity can however become an issue in environments with high delay spreads (high frequency diversity) and in conjunction with spatial processing Low-complexity techniques such as Pre-Detection SUD have been proposed together with linear (ZF MMSE) and non-linear multi-user detection that achieve good performance at the cost of higher receiver complexity
IOTA-OFDM [WIND21 Section 412][WIND23 Section 5212] [LGA01][JDL+04] and Filtered Multi Tone (FMT) [WIND21 Section 411][CFO+03][CEO02] modulation use prototype functionsfilters to guarantee good localisation of the subcarrier spectra in the frequency (and time) domain Thus high robustness to inter-carrier interference (eg arising due to time and frequency errors as well as to Doppler effects) is achieved without requiring the insertion of a cyclic prefix ndash leading to a higher spectral efficiency However the cyclic prefix is used in WINNER to achieve coarse synchronisation and the introduced overhead is below 10 for both the TDD and the FDD mode When using IOTA-OFDM or FMT an overhead would have to be invested for synchronisation pilots ndash thus reducing the potential gains in spectral efficiency
Wideband FMT with high subcarrier spacing (and hence frequency selective fading per sub-channel) is a valid alternative to traditional (time domain based) single carrier transmission over the whole bandwidth allowing a higher flexibility and granularity in the usage of the broadband channel The same (or higher) flexibility can be achieved by using frequency domain based serial modulation ndash wideband FMT is a special case of this scheme with block subcarrier assignment and a specific type of filtering
Using a Pseudo Random Postfix (PRP) as guard interval [WIND21 Section 46ndash410] [WIND23 Section 5211][MDC+04 MBL+05][MCD05] provides means to estimate andor track the channel impulse response without adding any overhead in terms of learning symbols andor pilot tones ndash allowing for increased spectral efficiency However in order to achieve a high precision (low MSE) of the channel estimates a delay of several OFDM symbols in the radio interface may have to be accepted This is especially the case for higher order modulation with high requirements on the channel estimation (cf results in Appendix F35) Moreover the scheme is less applicable for uplink scenarios where postfixes of different users superimpose at the base station Since low delay is a very important requirement for the WINNER radio interface and the overhead required for a scattered pilot grid is quite low (cf Appendix B42) this solution has been selected for channel estimation and tracking in WINNER instead
To summarise CP-OFDM is the preferred solution for the downlink (and the uplink when terminal power consumption is not an issue) as the spectral efficiency gains from using other techniques are currently considered not to justify the increase in implementation complexity (eg poly-phase filtering) andor delay (for the case of PRP-OFDM) Frequency domain based serial modulation is preferred for uplink transmission due to its low PAPR and as it enables to flexibly switch between interleaved (IFDMA) and block subcarrier assignment (wideband FMT) according to need
B32 OFDM vs single carrier Serial and parallel modulations have generally similar BER performance on frequency-selective channels when used with coding and other enhancements like iterative detection or adaptive loading Note however that linear FDE receivers become limited by noise enhancement at high SNR OFDM systems therefore yield better performance than serially modulated systems when considering transmission with higher order modulation and only linear equalisers OFDM has been (and is) in use in a number of wireless communications standards (eg IEEE 80211 and DVB systems) The main advantage of this technique is its implementation simplicity at least from a baseband perspective very low complexity equalisation algorithms are available and channel estimation and tracking is straightforward and of low arithmetical complexity if pilotlearning symbols based approaches (or derivates) are applied
Concerning the trade-offs between OFDM and serial modulation the main issues are the following ones
WINNER D210 v10
Page 72 (180)
i) the OFDM time domain signal is characterised by an inherent high peak-to-average-power ratio (PAPR) which is challenging for the RF implementation of HPAs (high power amplifiers) [FK05 WIND22 WIND23] The power backoff required by OFDM or other multi-carrier modulation approaches is typically 2 to 3 dB higher than for serial modulation even when PAPR-reduction methods are applied (for both systems cf [WIND23]) Serial modulation thus allows the use of cheaper power amplifiers Furthermore if a serial modulation system and a parallel system are required to use the same type of HPA and have the same maximum spectrum sidelobe levels the parallel systemrsquos average allowed transmit power will be lower resulting in lower received power and correspondingly higher bit error rate and lower coverage [WIND23] This constitutes the main motivation for the use of serial modulation in the uplink where terminal battery duration terminal cost and coverage are critical issues Furthermore generation of serial modulation by the generalised multi-carrier approach is equivalent to generation of OFDM or OFDMA that has been precoded by a FFT operation Thus serial (single carrier) modulation itself can be considered as just a form of OFDM to which a very effective PAPR reduction method has been applied
ii) OFDM is sensitive to time and frequency synchronisation offsets However efficient algorithms (of relatively low computational complexity) are available which assure a sufficiently precise synchronisation in both time and frequency From a practical point of view synchronisation issues are not a main limiting factor of OFDM
iii) OFDM is in general sensitive to higher levels of inter-carrier-interference (ICI) (resulting eg from high Doppler environments phase noise frequency offset etc) which lead to a degradation of the system performance A suitable design of the OFDM parameters (in particular the subcarrier spacing) is required in order to avoid this problem Assuming reasonable design parameters OFDM is also applicable to high mobility scenarios Phase noise on the other hand can be a limiting factor especially when high carrier frequencies andor low cost implementations are targeted Serial modulation is less sensitive to such self-interference effects [WIND23]
B33 Guard interval design The main purpose of the guard interval is obviously to limit inter-symbol-interference (ISI) for all block transmission based GMC schemes [WIND23] Therefore the amount of signal energy contained in the channel taps that exceed the guard interval length (resulting from a long channel impulse response potential inter-cell interference time synchronisation errors and filter impulse responses) should be low enough to avoid error floors in the transmission (ie be some dB below the thermalADC noise floor) There are efficient methods to minimise the ICI (eg timing-advanced transmission in up-link) which can be used to considerably reduce the guard interval length and thus increase spectral efficiency The guard interval length is often chosen to be a fraction 12n of the raw symbol length although this is not strictly necessary from the implementation perspective It should however be an integer multiple of the sampling interval [WIND23] Additionally to avoiding ISI the cyclic prefix in CP-OFDM turns the linear convolution into a set of parallel attenuations in the discrete frequency domain thus enabling simple single tap equalisation and contributing significantly to the receiver simplicity of OFDM systems
B34 Modulation alphabets and bit mapping Non-differential M-PSK and M-QAM modulation will be used in the WINNER system as channel state information can be made available to the receiver at relatively low pilot overhead in all scenarios (cf Sections 23 and B4) For the wide-area scenario modulation formats up to 64-QAM are proposed while for short-range transmission even 256-QAM appears to be feasible
As a baseline case Gray mapping is assumed It provides the highest amount of mutual information when no a-priori knowledge is available however it shows little gain when additional a-priori knowledge becomes available Since decoder and detectorchannel estimator EXIT transfer curves must be matched in order to achieve good performance it should evidently be used with a strong outer code mostly in non-iterative setups Note that the use of Gray mapping facilitates the calculation of soft output at the detector at low complexity if the standard maxLog approximation is used The selection of other mappings is useful in with the context of iterative equalisationchannel estimation mostly in conjunction with a weaker outer code Ideally the mapping and the channel encoder should be chosen jointly in order to maximise the gain achieved after several iterations In practice rapid changes of the propagation environment may render this optimisation unfeasible A robust solution shall then be preferred at the price of a loss of optimality Optimised bit labellings (used with a low memory CC) in Appendix F in the context of iterative channel estimation
WINNER D210 v10
Page 73 (180)
B4 Pilot design for channel estimation and synchronisation
B41 Intra- and inter-cell synchronisation using dedicated training symbols A synchronisation approach is proposed that enables both intra- and inter-cell synchronisation in a self-organised way without relying on any external reference eg GPS The approach assumes a cellular OFDM network where the terminals in every cell BSs or UTs are allowed to receive and transmit over the whole system frequency band at the same time during synchronisation
The approach proposed in this section is based on the acquisition of the coarse intra-cell time synchronisation by means of a DL synchronisation pilot referred to as T-pilot The T-pilot is sent in DL by all BSs inside the network at the beginning of each super-frame It is proposed to build the T-pilot for each cell as a specific Gold code This pilot structure has been proved to be robust against both inter-cell interference and multi-path fading [CSB05] However the correlation of T-pilots is sensitive to carrier frequency offsets as shown in Appendix F41
In order to improve the achieved accuracy the DL T-pilot is followed by at least two F-pilots that is two OFDM symbols The frequency and time offsets can be estimated simultaneously in the frequency domain (post FFT) as the phase rotation between two adjacent OFDM symbols on the same subcarrier in the same OFDM symbol and as the phase difference between two adjacent subcarriers respectively The phase rotation method requires the time and frequency offsets to be within one half of the OFDM symbol period and within one half of the subcarrier spacing respectively This condition is assumed to have been guaranteed at the beginning of the fine synchronisation by the initial coarse synchronisation
In order to achieve inter-cell synchronisation two methods can be considered which are described in the following
The first referred to as DL-UL synchronisation assumes that all UTs within a certain cell which have become mutually synchronised during the DL phase transmit UL sync signals which are in turn received and analysed by all BSs within range A synchronisation signal structure was proposed in [WIND23] that can be used in UL for the inter-cell synchronisation as well as alternative to the one described above for the DL fine intra-cell synchronisation This signal consists of three adjacent OFDM symbols during which each BS in DL transmits only on a single pair of adjacent subcarriers with the maximum power as described in [WIND21] Section 954 The DL-UL method has been shown to provide very high accuracy in [WIND23] for both intra- and inter-cell synchronisation More precisely in 20 super-frames both frequency and time synchronisation between all BSs within the cellular network can be achieved with remaining frequency offset of about 1 of the subcarrier spacing and time offset of about 10 of the guard interval respectively
According to the second method referred to as DL-only the inter-cell synchronisation is obtained without relying on UL sync signals Each UT continues to listen to the sync signals sent in DL by all other BSs measures itself the relative time and frequency offsets with respect to its own BS and feed back this information to its own BS Each BS adjusts then its clock and its oscillator according to the offset measurements signalled by the UTs within its cell An advantage of this method is that it can rely also on UTs in sleep mode since it does not require continual transmission of pilots on the UL but only the occasional feedback signalling Also for the DL-only method a very accurate convergence of the inter-cell synchronisation can be achieved under the assumption of ideal UL feedback Performance is similar to that of the DL-UL method reported in [WIND23] A proper design of such feedback signalling and the comparison of the involved overhead with respect to the DL-UL method described above should be subject of further investigation
Since the DL only synchronisation uses relative measurements the influence of the propagation delay might become smaller One additional advantage of the DL only synchronisation is that it relies on DL pilots There is an additional degree of flexibility adjacent BSs can also receive this pilots it they are able to receive DL signals and do not transmit during the pilot OFDM symbol Without changing the pilot structure the system is able to switch dynamically between UT-aided synchronisation and synchronisation based on measurements at the BS BS based synchronisation is useful in some deployment scenarios when the B2B link will give better receive signal level than the receive level at the UT (eg LOS conditions between BS) This flexibility can be conveniently exploited in TDD systems while the complexity would increase in FDD since the BS has to be able to receive DL signals Therefore it is suggested as an option in the system concept
WINNER D210 v10
Page 74 (180)
For the above described inter-cell synchronisation schemes there exists a drift of the achieved common time offset due to the propagation delay In the following a differentiated timing adaptation is proposed which can completely avoid the timing drift of stations
The idea of this method has been first proposed in [ER01] and [WER03] The systematic timing drift results from the fact that with each acquired time offset not only the actual difference of the node timings is acquired but also the distance-dependant propagation delay
In contrast to other timing adaptation methods the differentiated method only initiates a timing adaptation if a negative time offset is acquired If a positive observed time offset is acquired no timing adaptation is initiated except the case that the positive time offset is over a threshold which causes loss of synchronisation Since a positive time offset at a first station corresponds to a negative time offset at a second station the time offset will be compensated by the second station
Estimation of the propagation delays in intra-cell synchronisation Especially in the wide-area scenario large propagation delays may be observed A time-aligned arrival of signals from different UTs which is required for a joint spatio-temporal processing at the BS can be enabled if the UTs estimate their propagation delays during a so called lsquoranging processrsquo and use this information afterwards to transmit their data alligned to a common timing reference
The proposed ranging process requires two different pilot signals (T- and F-pilots) and consists of three phases an initial downlink phase a succeeding uplink phase and another final downlink phase depicted in Figure B1 where one BS and two UTs are considered The letters r and t denote the reception and the transmission status of each communication device The process is described as follows Initially the BS transmits a beacon signal which enables the UTs to perform a coarse synchronisation For this beacon signal a signal like the T-pilot introduced within the proposal above may be employed After the reception of the beacon signal each UT transmits its individual pilot which consists of a single frequency tone selected from a predefined set of equally spaced tones Each UT uses a different pilot tone At the BS the single user pilots are separated by filtering the received signal in he time domain
After a specific user pilot has been detected it is immediately retransmitted by the BS This retransmitted pilot then is detected at the dedicated UT in the same way as it is done at the BS From the temporal difference between the transmission of the UTrsquos pilot and the reception of its retransmission the UT may deduce the propagation delay
Within the simulations at an SNR of 0 dB hardly any values lying outside the range of the CIR length occurred hence the ranging process can be regarded as being robust and reliable
Figure B1 Detailed scheme of the ranging process
If the UTs retransmit their individual synchronisation tones (F-pilots) in advance by the estimated propagation delay after the ranging process has been finished a fine estimation of the carrier frequency offset may be carried out at the BS The single synchronisation tones which arrive aligned in time at the
WINNER D210 v10
Page 75 (180)
BS now are again separated by applying the filtering process from above and by averaging the slope of the phase of each separated tone information on each userrsquos carrier frequency offset may be obtained
B42 Pilot grid for generalised multi-carrier (GMC) Channel estimation by interpolation in time and frequency is considered to be an efficient solution for an OFDM-based radio interface [WIND21 WIND23] Generally a scattered pilot grid can be implemented for any GMC signal in the frequency domain on both the downlink and the uplink While blind channel estimation schemes require little or no pilot overhead their application may critically depends on the assumptions on the chosen transmission scheme With a large variety of adaptive algorithms in time frequency and space to choose from the flexibility of the WINNER radio interface might be severely compromised by exclusively relying on blind schemes Moreover as the pilot overhead of the considered pilot aided techniques is in the range of 2 to 5 per spatial stream the potential benefit of blind channel estimation techniques is limited On the other hand for highly dispersive channels andor high-end terminals blind or semi-blind schemes might provide a performance improvement and could therefore be considered as optional enhancements
In the following a generic framework for the pilot design of GMC signals is described Two types of frequency domain pilots and one type of time domain pilots are options the frequency expanding technique (FET) and Frequency domain superimposed pilots (FDSP) FET preserves and rearranges data-carrying subcarriers to accommodate pilots while FDSP obliterates data-carrying subcarriers where pilots are to be inserted Applied to OFDM FET is equivalent to a scattered pilot grid where data symbols are inserted at subcarriers where no pilots are present FDSP on the other hand can be viewed as a puncturing of the data symbols So data symbols are inserted on all subcarriers and subsequently pilots are superimposed This effectively results in an increased code rate
Frequency domain pilots for the WINNER radio interface Pilots are used for implementing certain physical layer support functions eg connection setup synchronisation mobility support power control CQI measurements and most importantly channel esti-mation Two types of channel estimation must be distinguished channel estimation for data reception (where the pilots are send at the same time) and channel estimation for adaptive transmit processing based on return link feedback or measurements (where an additional extrapolationprediction in time is required see also Appendix B52) In order to realise an efficient system the same pilots should be reused for different support functions Spatial processing however limits the potential reuse of pilots and brings along additional requirements [WIND27] In particular we need to distinguish
bull Dedicated pilots may be required if user-specific transmit processing (ie a user-specific adaptation of amplitude and phase) is applied to the data symbols These pilots are subject to the same transmit processing as the data symbols and therefore allow the receiver to estimate the effective channel HU sdot fU of user U The use of dedicated pilots for other purposes like CQI measurements is limited since they contain a power allocation specific (in most of the cases) to another user In time the interpolation is constrained by TDMA ie to the chunk duration in adaptive downlink transmission Regarding the interpolation in frequency two different types of dedicated pilots can be distinguished
o Full-band dedicated pilots having identical weights for all chunks in frequency dimension dedicated to a particular user Therefore interpolation over these chunks is possible
o Chunk-specific dedicated pilots where different weights are applied to each chunk and no interpolation in frequency domain is possible This is usually the case for user-specific transmit processing based on short-term CSI and or in case FDMA on chunk basis is used
bull Common pilots have the property not to include user-specific transmit processing and thus the interpolation in frequency is restricted by the specific channel estimation algorithm (ie related to the estimator complexity) and not by chunk specific constraints In case of user-specific transmit processing the amplitude and phase of common pilot deviates from those of the data symbols and therefore the receiver cannot detect those based on common pilots Different variants of common pilots exist eg
o A common pilot per cellsector which is transmitted omnidirectionally (ie not subject to beamforming) and normally used to support mobility-related functions It allows obtaining an unweighted channel coefficient h
WINNER D210 v10
Page 76 (180)
o Common pilots per antenna are used to obtain the unweighted channel matrix H which describes the propagation channel between any combination of transmit and receive antennas in the MIMO case
o Common pilots per beam are useful to estimate the effective channel (including the beamforming weights) and perform CQI measurements for the associated beam for fixed beamforming approaches Note that measurements on such pilots in neighbouring beams could then be used for beam handover Also the common pilots per beam benefit from the beamforming gain which reduces the transmit power required for a target channel estimation error and coverage area
Due to the fact that common pilots can be used by several users they are appealing for the downlink processing since the overall energy to perform the associated functions has only to be spent once and the pilot symbols can be spread over all resources Also they provide a basis for un-biased CQI measure-ments However certain user-specific spatial processing techniques require dedicated pilots
Multi-user precoding techniques are assumed to impose the most stringent requirement on channel estimation since high accuracy prediction of the downlink channel need to be obtained based on uplink measurements A performance degradation of 2 dB due to imperfect channel estimation requires a pilot SINR of 20 dB and channel estimator gains between 13 dB and 17 dB [WIND27] In Appendix F33 results for the channel estimator gains of the WINNER pilot specifications are presented It is shown that with pilot aided techniques the required gains of 13 to 17 dB can only be achieved with sophisticated post-processing for instance by an iterative channel estimation scheme
A careful radio interface design must balance the number of users that can be scheduled in the downlink with the number of users that can be estimated based on the uplink pilots in the TDD PLM The competition bands and the activesemi-active flow states that are discussed in Appendix C1 are tools for performing this trade-off Simulations for the linear precoding technique (SMMSE) have shown that in order to obtain sufficient SDMA and spatial multiplexing gain around 9 orthogonal pilots17 would be required per competition band
Since the requirements regarding pilot type number of pilots and pilot SNR are varying considerably a modular and scalable MIMO-pilot design should be adopted For example a combination of common pilots and additional dedicated pilots per chunk according to the requirements of the spatial processing scheme is conceivable
Common pilot symbolsDedicated pilot symbols
5 O
FDM
sym
bols
12 OFD
M sym
bols
TDD mode FDD mode
Additional pilots for non-adaptive transmissionPilots for 2nd spatial layerWith 2 spatial
layers
Df = 8
Df = 4
16 subcarriers8 subcarriers
Dt = 11
Common pilot symbolsDedicated pilot symbols
5 O
FDM
sym
bols
12 OFD
M sym
bols
TDD mode FDD mode
Additional pilots for non-adaptive transmissionPilots for 2nd spatial layerWith 2 spatial
layers
Df = 8
Df = 4
16 subcarriers8 subcarriers
Dt = 11
Figure B6 Frequency domain pilot grids for GMC signals
17 Corresponding to an average of 34 users according to the assumed user population (20 with 1 antenna 40 with
2 antenna and 40 with 4 antenna
WINNER D210 v10
Page 77 (180)
Figure B6 shows the pilot grid arrangement for the WINNER TDD and FDD modes The placement of pilot symbol within a chunk is based on the following rules (based on the framework from [WIND21 WIND23])
bull For common pilots a reasonable over-sampling factor in frequency direction would be 20mdash100 On the other hand the chunk dimension also imposes constraints on the pilot spacing To this end a constant number of common pilots per chunk is desirable For the TDD and FDD modes this translates to a pilot spacing of Df=8 and Df=4 respectively
bull For dedicated pilots the over-sampling factor should be at least 100 which also results in a pilot spacing of Df=8 and Df=4 for the TDD and FDD modes respectively
bull For channel estimation in time direction the number of available pilots is limited by the fact that half duplex FDD or TDD a mobile terminal is not able to transmit and receive at the same time Therefore the same guidelines for common and dedicated pilots apply
o For adaptive transmission the mobility of UTs must follow certain constraints which gives upper bounds on the maximum Doppler frequency This results in a total of 2 and 4 pilots per chunk for the TDD and FDD modes
o For non-frequency-adaptive transmission in the FDD mode two additional pilots are inserted in time direction to support mobile velocities up to 250 kmh totalling to 6 pilots per chunk For the TDD mode no additional pilots are necessary if at least 2 chunks per frame are used
In order to be able to estimate the channel from different antennas orthogonal pilots are required and the following principle design guidelines are possible
bull transmit pilots in frequency-multiplex (different subcarriers of one chunk) as indicated in Figure B6
bull transmit pilots in time-multiplex (consecutively on one subcarrier)
Additional code multiplexing of pilots in time as well as frequency multiplex is possible In existing MIMO-OFDM real-time test-beds code-multiplexing using Hadamard sequences on consecutive pilot symbols of one subcarrier has been extensively used and verified [MKK+05 JFH+05 JHF04] A similar design has also been proposed for fixed grid of beam techniques in WINNER (see Section 3222 of [WIND27] There each antenna is identified by an orthogonal sequence reused on all pilot subcarriers but additionally scrambled in the frequency domain Such overlapping pilot-based techniques have also been studied for adaptive uplink transmission see Appendix B52 and [WIND24] Section 311 Advantages are that the power on pilot carriers is not enhanced compared to the power of data ie the transmit spectrum is flat Moreover the reconstructed pilots can be reused for the carrier phase tracking at the receiver if the sequence is additionally stretched along the time direction over the chunk The pilot overheads of the pilot arrangements in Figure B6 per spatial stream per chunk are summarised in Table B4 The pilot overhead is defined as the ratio of the number of pilot symbols per chunk Npilot to the number of data symbols per chunk Ndata The chunk sizes are 96 and 80 symbols for the FDD and TDD modes
Table B4 Pilot symbol overheads per spatial stream per chunk
FDD mode TDD mode Tx mode
Pilots data
Non adaptive Adaptive Non adaptive Adaptive
pilots per chunk 6 4 2 2
Pilot overhead NpilotsNdata 75 5 25 25
The pro and cons of the pilot design principles in the WINNER framework are for further study This is particularly true for the various proposed MIMO schemes The assessment of channel estimation schemes for uplink single carrier signals is studied in Appendix F31 The performance of OFDM channel estimation schemes for common and dedicated pilots using the pilot grids in Figure B6 is evaluated in Appendix F32
WINNER D210 v10
Page 78 (180)
B5 Adaptive transmission
B51 Bit and power loading algorithms If channel quality information is available on each subcarrier (or chunk) is it possible to increase the performance of the radio link andor save power by performing bit andor power loading for each subcarrier (chunk) This single-user link adaptation can be used as an element in the solution of the complete multi-user adaptation and scheduling problem There are many different algorithms that realise so called water-filling concept in a multi-carrier transmission Most of them originate from the asymmetric digital subscriber line (ADSL) technology
Depending on their application existing bit and power loading algorithms can be divided into two groups
1 Algorithms that maximise the number of transmitted bits with a given total power and required BER constraints (variable bit rate)
2 Algorithms that minimise the BER with a given throughput and transmitted power constraints (fixed bit rate)
For most algorithms the average computational complexity of the analysed algorithms is proportional to O(N log(N)) where N represents the number of subcarriers (or chunks) being adaptively loaded The assessment presented in [WIND24] focused mainly on the Hughes-Hartogs (HH) algorithm [Hug91 Bin90] However from the complexity point of view this algorithm seems to be unsuitable for practical implementations (see Appendix B511) The complexity of Campellorsquos implementation [Cam98][Cam99] on the other hand is proportional only to O(N) Therefore this algorithm might be considered as a favourite one from the complexity point of view In practice however also other algorithms are much faster than the HH algorithm eg the one by Chow Cioffi and Bingham [CCB95] or the Fischer and Huber [FH96] algorithm The computational complexity may depend on the application and the channel transfer function as well Note that of the discussed algorithms only the Hughes-Hartogs and the Campello algorithm are optimum in the data rate maximisation sense For additional details please see the following discussion on complexity and implementation issues and the details given in Appendix F5
B511 Hughes-Hartogs optimum algorithm
The Hughes-Hartogs bit and power loading algorithm is a part of the ADSL modem US patent [Hug91] A detailed description of the steps of the algorithm is included in [WIND24] in the form described in [Bin90] The HH algorithm does not realise the water-pouring principle in its classical sense but it is an optimum solution for a multi-carrier transmission using QAM constellations and symbol-by-symbol detection since it spends the transmitted power in the most effective way However this procedure has high computational requirements because an extensive sorting and searching has to be performed in each step of the loop Since the average running time of the algorithm is proportional to the product of the total number of loaded bits loaded (fractional bits for coded transmission) and the number of subcarriers (chunks) it seems to be unsuitable to be implemented in systems with high data rates high granularity and a high number of subcarriers (chunks) to be adapted
B512 Chow Cioffi and Bingham algorithm This algorithm proposed by Chow Cioffi and Bingham in [CCB95] offers significant implementation advantages over the previously mentioned Hughes-Hartogs algorithm whilst the performance degradation is negligible as compared to the optimal solution Although this algorithm might be slightly sub-optimal it converges much faster as compared to the HH algorithm This is due to a limited number of internal iterations needed The authors have found that 10 iterations are sufficient to ensure the convergence of the algorithm The worst case running time of this procedure is proportional to
)2( cc NNMaxItersO +sdot (B3)
where MaxIters is the maximum number of iterations and Nc is the number of subcarriers (chunks) This figure is much lower than the average running time of the HH algorithm (see Appendix B511) Moreover the worst case running time of the CCB algorithm does not depend on the granularity of loaded bits so it is suitable for a joint code and modulation adaptation
WINNER D210 v10
Page 79 (180)
B513 Fischer and Huber algorithm
In this algorithm presented in [FH96] the data rate and power are assigned to each subcarrier to minimise the error probability The Fisher and Huber algorithm has a very low complexity even lower than that of the Chow Cioffi and Bingham algorithm According to what the authors claim the achievable performance is higher or at least comparable to the performance of the CCB algorithm However in the WINNER system case this seems to be a bit too optimistic assumption (see Appendix F5) One of the advantages of the algorithm from the implementation point of view is that the logarithms of the subcariersrsquo (chunksrsquo) noise variances are calculated only once in the beginning and stored in a memory In the main loop only additions and one division by an integer have to be performed for each subcarrier (chunk)
B514 Chunk-based single-user link adaptation in the adaptive resource scheduling framework
Adaptive transmission and scheduling in the WINNER AI concept is assumed to take place within the framework outlined in Appendix C16 For each chunk (layer) each candidate user terminal predicts the channel quality (SINR) Modulation levels inner code rates (typically using convolutional coding) and possibly power adjustments together comprise the link adaptation They are pre-computed for all chunks and all candidate flowsuser terminals This adjustment should take not only the predicted channel gain into account but also its accuracy That problem can be solved by averaging over the pdf of the power prediction error when adjusting the rate limits [FSE+04] [SF04] and Section 22 of [WIND24] Furthermore the interference level must be predicted Interference prediction remains a major research problem for WINNER II and it involves both the SDMA interference within the cell and the interference from other cells and operators
The link adaptation will in general work together with an outer code (turbo or LDPC)An appropriate criterion for the link adaptation would then be to target a constant SINR per bit This would essentially convert the fading channel into something closer to an AWGN channel as seen from the outer code
The pre-calculated chunk capacities (bits per payload symbol) that result from the link adaptation for each chunk layer and each flow form one set of inputs to the adaptive resource scheduler The scheduler uses them together with information on the queue levels and the flow priorities to allocate the next slot
B52 Channel quality prediction for adaptive transmission Adaptive transmission always involves a closed feedback loop and thus incurs a delay The allocation decision will be based on outdated channel quality information While most WINNER terminals are expected to be stationary or slowly moving this will create a problem for faster moving terminals It would be advantageous with a scheme that allows the vast majority of WINNER terminals including many of those moving at vehicular velocities to utilise adaptive transmission The situation can be improved markedly by introducing a channel predictor In [WIND24] it is shown that this enables prediction of the channel power at sufficient quality over time delays consistent with realisable feedback loops at vehicular velocities and 5 GHz carrier frequencies Adaptive transmission at vehicular velocities would not be possible if the present channel state is just extrapolated A special problem is prediction in the uplink Since several terminals will then be in competition for the whole or a part of the bandwidth they have to send pilots over the whole of this band The overhead due to these pilots would increase proportionally with the number of active terminals To prevent this overhead from becoming too large a simultaneous transmission of the pilots overlapping pilots is preferred This technique requires the terminals to be sufficiently well synchronised in time and frequency It also requires estimation of a multiple-input single-output channel based on these overlapping pilots Orthogonal symbol sequences would be used as pilots spread out over different frequencies in several chunks It should be noted that after propagation through different frequency-selective channels the received signals would no longer be orthogonal
Channel prediction can be performed in the time-domain for the impulse response [Ekm02] [SEA01] or in the frequency domain for the channel gains In [WIND24] frequency domain prediction is investi-gated It utilises the correlation between neighbouring subcarriers and the time-domain correlation between subsequent OFDM symbols in a state space model [SA03] Control symbols are used in the decision directed mode for improving the estimates Figure B7 below shows the results expressed in normalised prediction error MSE as a function of the SNR and the prediction horizon scaled in wavelengths The result is for downlink predictions for the FDD mode in cellular deployment assuming a full duplex FDD terminal that listens continuously on the downlink pilots The Urban Macro channel model has been used Note the large dependence of the performance on the SINR
WINNER D210 v10
Page 80 (180)
Figure B7 FDD downlink prediction accuracy in terms of the normalised channel prediction MSE as a function of the prediction horizon scaled in carrier wavelengths and the SNR Results for FDD
downlink over Urban Macro channels using a Kalman algorithm that utilises 8 subcarriers
Adaptive transmission tofrom a terminal will be feasible up to a maximal velocity for a given SINR or equivalently down to a limiting SINR at a given velocity For combinations of velocities and SINRs beyond such a boundary non-frequency-adaptive transmission must be used In [WIND24] a preliminary finding is that the normalised prediction error level 015 indicates the location of this boundary rather well when using adaptive convolutional coding combined with BPSK or M-QAM Based on this one may calculate the approximate SNR boundaries for different velocities different predictor designs and different designs of the adaptation feedback loops The results in Figure B7 are for the adaptation loop designs presented in Section 31 of [WIND24] For the FDD mode it is based on downlink channel prediction 25 slots ahead at the terminals In uplinks channel prediction is based on overlapping pilots at the base station For the short-range TDD modes the prediction is assumed to be performed by the user terminals (A scheme that moves the predictor to the base station is of course also possible) The required prediction horizons to the far end of the predicted chunk scaled in the carrier wavelength λc at 5 GHz are also shown in Table B5 For further results please see Section 31 of [WIND24] or [SFS+05]
Table B5 SINR limits for cases where the accuracy limit 150~2 =σ allows the use of adaptive transmission exemplified for three terminal velocities for a 5 GHz carrier frequency Also shown
are required prediction horizons in carrier wavelengths From [WIND24] Table 32
30 kmh 50 kmh 70 kmh
TDD downlink (prediction horizon 2 slots) lt 0 dB (0094 λc) 5 dB (0156 λc) 10 dB (0219 λc)
TDD uplink (prediction horizon 3 slots) 5 dB (0150 λc) 15 dB (025 λc) gt 25 dB (035 λc)
FDD downlink (Figure B7) lt 0 dB (0117 λc) 6 dB (0195 λc) 125 dB (0273 λc)
FDD uplink 2 users in competition band 0 dB (0117 λc) 7 dB (0195 λc) 15 dB (0273 λc)
FDD uplink 8 users in competition band 35 dB (0117 λc) 11 dB (0195 λc) 20 dB (0273 λc)
In these examples adaptive transmission can be expected to work in the widest variety of situations in the proposed wide-area FDD downlinks and short-range TDD downlinks while it works in the narrowest range of circumstances in the proposed short-range TDD uplink that requires the longest prediction hori-
WINNER D210 v10
Page 81 (180)
zon The case of wide-area FDD uplinks using overlapping pilots falls somewhere in-between The performance deteriorates with the number of simultaneous users that transmit overlapping pilots but this deterioration is not severe
B53 Compression of channel state feedback for adaptive transmission This section contains a brief summary of results from Section 314 in [WIND24] and and additional results on multi-antenna systems Assume that one or several clients within a terminal are in competition for a sub-bandwidth of the total band comprising N chunks (one-antenna SISO transmission is assumed here) K active terminals compete for this competition band Assume that each terminal feeds back a proposed code and modulation rate for each chunk For a scheme with r rates each terminal then needs to feed back N log2(r) bits per chunk duration Tchunk For K users the required total feedback data rate is then
chunkf TrKNR )(log2= [bits]
For a 40 MHz FDD downlink with N = 104 chunks and with r = 8 code and modulation rates we would have a feedback overhead of 925 kbits per active user Expressed in another way for each chunk for which K downlink users compete K log2(r) feedback bits would have to be transmitted in the following uplink chunk The FDD mode chunks of Appendix C3 contain 96 symbols With around 80 non-pilot symbols per uplink chunk K = 8 active terminals with r = 8 would consume 2480 = 30 of the uplink bandwidth for control signalling if one feedback bitfeedback symbol can be used on average The situation described here is clearly unacceptable Fortunately there are several ways in which the required feedback rate can be reduced significantly
The channel gains and SNRs at adjacent chunks will be highly correlated (If they were not the chunk widths would have been selected too wide and we would have severe problems with channel variability within the chunks) This correlation can be utilised to reduce the feedback rate The channels are also correlated in time Furthermore it is likely that in most cells except those situated close to major roads the large majority of terminals will not travel at vehicular speeds but rather be stationary For those terminals very little feedback is required
In Section 314 of [WIND24] several principles for compression are introduces and evaluated Lossless compression of the modulation-coding rates could for the considered ITU Vehicular A and Pedestrian A channels be performed at rates close to 091 bitschunk and 035 bitschunks respectively
Significantly lower feedback rates can be attained by using lossy compression of the SINR This method provides the added benefits that SINR-values not only suggested rates are fed back This enables the scheduler to select intelligently among users who would have suggested the same rates for a given chunk The net effect is that lossy compression of SINR values is superior to lossless compression of suggested modulation-coding rates It enables us to attain both lower feedback data rates and a higher performance in terms of the attained spectral efficiency when performing multi-user scheduling The suggested coder uses transform coding (discrete cosine transform DCT) to compress the SINR data in the frequency direction It combines this with sub-sampling in the time direction to obtain a further compression due to the temporal correlation Motivations for these design choices are discussed in [WIND24] The resulting algorithm is summarised by Figure B8 and Figure B9 below
FFTRx
Cal
cula
tech
unk
SN
R
DC
T
Sca
lar
Qua
ntiz
ers
104 104 104
Sub
-sa
mpl
ing
Tx feedback
FFTRx
Cal
cula
tech
unk
SN
R
DC
T
Sca
lar
Qua
ntiz
ers
104 104 104
Sub
-sa
mpl
ing
Tx feedback
Figure B8 A block diagram of feedback handling in the terminal
Q-1
Receivedfeedback
Ups
ampl
ing
IDC
T
104 104104
ChunkSNR
Sche
dulin
g
Q-1
Receivedfeedback
Ups
ampl
ing
IDC
T
104 104104
ChunkSNR
Sche
dulin
g
Figure B9 Block diagram of feedback handling at the base station
WINNER D210 v10
Page 82 (180)
With the discussed compression of SINR predictions only 025 bitschunk are required for the Vehicular A channels and 012 bitschunk for the Pedestrian A channels when all users travel at 50 kmh and the modulation-coding scheme uses r = 8 rates If the mobile speed is reduced it will be possible to further sub-sample the coded feedback information For example at 5 kmh it would be possible to reduce the feedback information further by a factor of 10 With a feedback rate of 025 bitschunk over the Vehicular A channel we would only need 4 bits per chunk to accommodate 16 vehicular 50 kmh users per competition band in addition to many more stationary users Uplink feedback with only four 4-QAM symbols per chunk that use rate frac12 coding is adequate for this
For multiple antenna systems the required feedback rate will of course increase proportionally with the number of virtual antenna streams for which the channel quality feedback is required If not only real-valued channel quality SINR values but channel state information in the form of complex-valued matri-ces is required this will increase the feedback requirements quite substantially In [KBLS06] a method is described that can significantly reduce the required CQI feedback using vector quantisation techniques
An example of a system with four transmit antennas and one receive antennas that would need 32 bits if all four complex gains were represented by 8 bits each Using an optimised quantiser it is possible to use only one or two bits and still reach a significant portion of the performance for perfect CSI Especially for scenarios where long-term CSI is available at the transmitter this additional information can be efficiently exploited by combining a fixed quantisation scheme for the short-term CSI with a linear transformation that only depends on the long-term CSI The resulting feedback requirement may still be high for adaptive multi-user transmission However further reductions can be expected by utilizing the temporal correlation as was outlined for the SISO case above
WINNER D210 v10
Page 83 (180)
Appendix C MAC System Layer Functions This appendix gives more details on the services and functions within the MAC modes that were presented in Chapter 3 Appendix C1 below gives brief descriptions of the resource and transmission control functions for in the two cellular MACs The functional architecture of the peer-to-peer MAC is outlined in Appendix C2
The functional description of the PHY system layer is important for understanding the transmission but it has been left out from this report to save space It can be found in Section 552 of [WIND76]
C1 Functional architecture of the WINNER medium access control for FDD and TDD cellular transmission The presently assumed design of the MAC system layer for FDD and TDD cellular transmission was outlined in Section 31 see Figure 33 and Figure 34 The implementations of these two MAC modes are common to about 90 and their interfaces to higher layers are identical They will therefore be described together below with mode-specific differences indicated when they appear
The description follows the presentation in Section 54 of [WIND76] Since the delivery of [WIND76] the design has been refined and modified on several points As compared to the presentation in [WIND76] the design has been modified as follows
1 The PHY control signalling is under current investigation It has been re-organised so that a major part of the transmit control processing is executed by the MAC system layer As outlined by Figure 33 three special PHY services can be invoked transferring control packets
a Transmission together with the BCH packets in the super-frame preamble b Use of non-frequency adaptive transmission c Use of special time-frequency resources earmarked for control transmission via the
service Special Transmit Control Signalling PHY service In addition piggybacking of control bits in ordinary packets may also be used
2 Measurements are as before provided as a PHY layer service They may also be provided in
further processed form as a MAC system layer service The partitioning of processing of measurements is under current discussion and will continue to be investigated in WINNER II
3 The transport channel TCC for control flows has provisionally been added to aid investigations
on the design of protocols that supports all required control messaging 4 Antenna calibration has been added as a function within the spatial scheme controller
The sections below describe all the main control functions that are introduced in Figure 33 Appendix C15 summarises how different transport channels are handled as illustrated by Figure 34 The resource scheduler (Appendix C16) is a crucial system element of the WINNER design it is in a sense the ldquospider in the netrdquo of the whole design Appendix C17 provides additional discussion on the problem of SDMA and spatial user partitioning Finally Appendix C18 summarises the time scales on which the different functions work
C11 MAC radio resource control Resource partitioning and constraint combining The problem that the resource partitioning has to solve is the structural preparation of the next super-frame outlined in Section 314 The time-frequency chunk is the basic unit for subdividing the radio resources The partitioning of the super-frame between different transport channels will be performed with chunk granularity Reuse partitioning between cells is supported18 It must be performed with guard-bands due to the non-orthogonality introduced by large time delays See Appendix G73 It has to be performed in terms of wider frequency resource units since the guard bands would otherwise represent too large an overhead The resource partitioning may be changed on a super-frame basis but most parameters will typically stay unchanged over longer time horizons In TDD one single super-frame is to be defined In FDD separate uplink and downlink super-frames are to be specified see Annex A31 of [WIND35] The uplink and downlink super-frames will normally use differing allocations
18 See Section 52 in [WIND32]
WINNER D210 v10
Page 84 (180)
The resources of the next super-frame are allocated and subdivided in the following sequence bull First all constraints on the use of chunks are updated by the Constraint combining function of
the constraint processor at the BS It receives control inputs from the RLC on restrictions due to spectrum sharing and interference avoidance with neighbouring base stations At the BS the spatial properties of the restrictions are re-calculated in terms of BS antenna transmission properties19
The subsequent steps are performed by the Resource partitioning function that is implemented in the MAC control plane at the base station
bull DAC assignment A (nonzero) set of consecutive chunks is reserved for DAC (contention-based traffic) In the TDD mode these resources may also be used for peer-to-peer traffic This assignment is placed in the frequency region that is assumed available everywhere (Figure 32)
bull RN assignment In cells that include relay nodes sets of chunk beams are reserved exclusively for transmission between these RNs and UTs Each set is reserved either for single RNs or for a group of RNs that will create little mutual interference Furthermore resources may be allocated for use in the relay links between BSs and RNs
bull TDC adaptive transmission assignment The remaining chunks are divided for use by adaptively and non-frequency adaptively scheduled flows respectively This division is based on the history of the previous traffic demand
bull The set of chunks reserved for adaptive transmission may be further divided into competition bands where one stream normally uses only a single band These competition band allocations are updated if required
The super-frame has now been constructed Control messages that specify the allocation are transmitted from the BS at two instances In the case of two-hop relaying the resource partitioning information is thereby distributed to all the participating UTs at the beginning of the following super-frame
bull The RN partitioning is transmitted from the BS to the RNs over the relay link in chunks that are reserved for control signalling within the present super-frame
The remaining control information is transmitted by the BS to the UTs This is done during the downlink control part within the preamble of the super-frame being defined In the here-considered case of two-hop relaying it is the next super-frame Simultaneously each RN transmits the RN assignment to the UTs under its control For more details please see Section 634 of [WIND35]
C12 MAC radio resource control Flow setup and termination New uplink and downlink flows are established by the Flow establishment RRM function in the RLC system layer It requires the detailed setup of a flow context over each involved hop That flow context establishment is executed by the MAC flow setup function Flow context release is initiated by the RLC and is executed by the MAC Flow termination function In the case of per stream rate control (PSRC) see Appendix B1 several queues per flow are used
When a new downlink flow is established it is given a local flow address that is unique within the cell Its destination UT (or UTs in the case of CDC point-to-multipoint flows) is notified and a resource scheduling buffer queue is initialised
In the FDD mode flows tofrom half-duplex terminals are assigned to one of four groups Group 1 transmits in the downlink the first half of the frame and in the uplink during the latter half Group 2 transmitsreceives in the opposite way Group 3 contains half-duplex terminals that have adaptable and flexible uplink and downlink transmission periods Full-duplex terminals belong to Group 4
TDC flows are initially assigned either for adaptive or for non-frequency adaptive transmission by the flow setup controller The choice is based on the capability of the terminal the average SINR and the velocity of the terminal The choice is also affected by the potentially available spatial schemes and their CSI and CQI requirements The initial assignment may be changed later if the circumstances change Flow setup in relay-enhanced cells is discussed further in Section 635 of [WIND35]
19 In a grid-of-beams implementation constraints on the transmit power used in each beam may be used In the
general case constraints on the transmit covariance matrix may be used
WINNER D210 v10
Page 85 (180)
C13 MAC radio resource control Spatial scheme pre-configuration and selection A base station or relay node can have one or multiple antennas These antennas can be localised or may constitute a distributed antenna system eg comprising all antenna elements within a building A general spatial processing scheme for MIMO transmission and spatial domain link adaptation has been defined [WIND27] It includes multiplexing diversity-based transmission fixed beamforming and adaptive beamforming as special cases see Appendix B1 The spatial scheme controller performs a baseline spatial scheme selection process It is invoked to select an appropriate spatial transmit scheme for the newly established flow This selection is based on the terminal capabilities the BS antenna capabilities and the choice of adaptive and non-frequency adaptive transmission In addition the interference properties of other flows and their demand for spatial channels influence the decision Also for already established flows the spatial processing scheme can be changed by the Spatial Scheme Controller To reduce the complexity of this process a split in two functions and temporal layering is used
bull Spatial scheme pre-configuration performs static and long-term trigger-based assignments These assignments serve as inputs and constraints to the next step
bull Spatial scheme selection determines the dispersion code (degrees of spatial diversity and spatial multiplexing) the possible use of per stream rate control and the possible use of and type of precoding
staticdecisions and
constraints
Spatial SchemePreconfiguration
Spatial SchemeSelection
long-termdecisions and
constraints
each superframe
several superframescell configuration update
staticdecisions and
constraints
Spatial SchemePreconfiguration
Spatial SchemeSelection
long-termdecisions and
constraints
each superframe
several superframescell configuration update
Figure C1 Overview of temporal layering of the MAC functionalities Spatial scheme pre-configuration and selection within the spatial scheme controller
The Figure C1 above illustrates these functions and the different time scales at which they operate The static part of the spatial scheme pre-configuration evaluates all parameters decisions and constraints that can only be changed with an update of the basic cell configuration including the physical layer mode type of deployment (cellular isolated hot spot) cell range and the base station (BS) antenna configuration Furthermore mapping tables indicating the possible spatial schemes for each transport channel and terminal capability as well as a list of possible combinations of dispersion code PSRC and precoding type can be generated at this stage
The long-term part of the spatial scheme pre-configuration evaluates all parameters decisions and constraints that normally change on time scales greater than one super-frame or issues that cannot be decided on a per-flow basis like the overall selection of a scheme that applies to all users of a cell (eg configuration of a fixed beam approach or multi-user precoding) Slowly varying parameters include user distribution user speed quality of CQICSI information the flowsrsquo QoS parameter and long-term channel characteristics like average SINR long-term channel rank and eigenvalues Also certain flow-specific decision will be long-term oriented eg the decision between long-term and short-term spatial processing
Spatial scheme selection performs the remaining decisions based on decision criteria that change on a short-term basis include eg number of active users cell load (due to packet-oriented transmissions) and the short-term channel characteristics The spatial scheme selection considers these parameters and adapts the spatial scheme per flow under the constraints set by the spatial scheme pre-configuration
An important additional part of the Spatial Scheme Controller is the calibration function Calibration is required to relate a desired spatial distribution of energy in space to specific transmit weights and to allow exploitation of channel reciprocity in the TDD mode despite of RF front-end imperfections The calibration function checks the calibration status of a link with the particular requirements of the selected spatial processing technique and triggers the corresponding calibration procedure if required Calibration
WINNER D210 v10
Page 86 (180)
is therefore invoked at flow setup and each time either the selected spatial scheme is altered or the calibration status changes (eg temporal expiry)
C14 MAC control feedback The definition of service primitives for the MAC Control Feedback service is driven completely by the demand for such feedback from the RLC system layer and the IP Convergence layer In principle all outputs from the main function blocks and even internal states of these function blocks could be made visible to upper layers to enable various forms of inter-layer interaction The set of required feedback parameters is under discussion It includes SLC Cache levels (see below) as well as resource use per flow
C15 Radio packet transfer Transmission and reception The transmission control is performed in cooperation with the QoS control of the RLC system layer A Service Level Controller (SLC) Cache with per-flow queues for all downlink TDC CDC and DAC flows is assumed to be implemented within the MAC at each BS and RN For uplink flows corresponding buffers are present at each RN and UT The RLC layer Service level controller and flow scheduler (Section 41 and Appendix D12) controls the inflows to the BS SLC Cache and monitors its state The outflow from the SLC Cache is under control of a MAC - For BS-to-UT downlinks and BS-to-RN relay links the MAC at the BS controls the transmission - For UT-to-RN uplinks the MAC at the RN controls the transmission - For UT-to-BS uplinks the MAC at the BS controls the transmission Packet transmission and reception will be handled differently for the five transport channels BCH packets and RAC packets are encoded at transmission and decoded at reception but are not processed further by the MAC layer TDC CDC and DAC packets are processed by a more elaborate transmit and receive sequence that is divided into five protocol sub-layers as illustrated by Figure 34 MAC-5 Performs optional segmentation and reassembly of MAC SDUs (ie RLC PDUs) MAC-5 also performs flow identification at reception MAC-4 Sender adds CRC resulting in a retransmission unit (RTU) Receiver checks CRC and may ask for retransmission in case of error The retransmission mechanism is denoted MAC retransmission MAC-3 Sender performs optional segmentation of RTUs into encoding blocks The receiver then performs reassembly of received blocks into RTUs MAC-2 Coding of each encoding block results in an FEC block (forward-error-correction coded block) that is saved in the appropriate RSB queue The receiver decodes each FEC block It may also perform (soft) combination with retransmitted FEC blocks This encoding decoding will in the following be referred to as the outer code Encoding and decoding schemes have been discussed in Appendix B2 MAC-1 Performs puncturing of FEC blocks and resource mapping onto assigned chunks Resource mapping is a separate main function of the MAC user plane The protocol sub-layers MAC-5ndashMAC-2 may all be transparent ie their functions are optional Special cases of this transmission sequence accommodate all retransmission schemes and segmentation strategies that are at present under consideration The design outlined above performs segmentation and encoding before the mapping onto chunks It thus decouples the segment size used for retransmission from the chunk size It also decouples the code block size from the chunk size in a practical way These factors are also important when the WINNER radio interface concept is used as a test-bed to compare and evaluate different combinations of MAC retransmission strategies and coding schemes
For BCH the mapping onto super-frame control symbols is controlled by the Resource partitioning function For TDC CDC and DAC the Transfer control function supervises both transmission and reception The transmission control is focused at fast transfer via the physical layer
bull For adaptively allocated TDC downlink flows a transmission can be initiated during the downlink part of frame j and then be performed during the downlink slot of frame j+1
bull For adaptively allocated TDC uplink flows a transmission can by requested during frame j prepared and scheduled during frame j+1 and then be performed in the uplink slot of frame j+2
WINNER D210 v10
Page 87 (180)
bull For non-frequency adaptively allocated TDC and CDC downlink flows the scheduling can be determined during frame j An allocation table is transmitted in the first DL OFDM symbol of frame j+1 The transmission can then be performed either within frame j+1 or during frame j+2
bull For non-frequency adaptively allocated TDC uplink flows the transmission is initiated during frame j and is then performed in the uplink slot of frame j+1
Thus the delay from initiation of a transmission to its completion is 10ndash25 frames (07ndash17 ms) over one hop Multi-hop transmission will add to the total delay The roundtrip delay until a MAC retransmission can be performed depends on the decoding delay The computation speed estimates presented in Table B2 in Appendix B21 is around 200 kbitms The additional decoding delay for the outer code should then not exceed 01 ms for RTU sizes of interest (up to 1520 bytes)
The transmission of packets belonging to the different transport channels is summarised below
TDC (downlinks and uplinks) Packets in scheduled Targeted Data Channel flows are optionally segmented and then coded using the transmission sequence outlined above The FEC blocks are buffered by per-flow queuing in the resource scheduling buffer Scheduling and the subsequent mapping is then performed by either the adaptive or the non-frequency adaptive resource scheduling algorithm depending on the assignment of the flow Thereafter transmission proceeds using the PHY Adaptive transfer or Non-frequency adaptive transfer services At reception complete FEC blocks are delivered to the MAC In downlinks the MAC at the BS or RN controls the transmission In uplinks packet transmissions are initiated by UT requests The MAC at the BSRN with which the UT communicates controls the subsequent scheduling transmission and retransmission
CDC (downlinks only) The point-to-multipoint transmission has to deal with a wide variety of channels and directions to the destination users This complicates the adjustment of the transmission parameters and the use of beamforming To reduce the problems a CDC flow may be partitioned into separate copies targeted flows which are destined to specific groups (clusters) of users in different directionswithin different beams A CDC flow is processed through the MAC-5ndashMAC-2 protocol layers The resulting FEC blocks are copied into one or several queues in the RSB one queue for each targeted flow Scheduling and mapping of each targeted flow then proceed by non-frequency adaptive transmission with transmission parameters that are adjusted in a conservative way The transmission uses the PHY Non-frequency adaptive transfer service At reception complete FEC blocks are delivered to the MAC where they are decoded Packets (MAC SDUs) are finally recombined if segmentation was used A reliable multicast service may utilise retransmission The retransmissions could be triggered by NACKs from any of the destination users of a targeted flow Schemes that combine this mechanism with ACKs from the terminal with worst channel are also possible
DAC (uplinks only) Contention-based transmission is potentially the best way of transmitting uplink flows that have small packets with a low packet arrival rate The main current proposal for contention-based transmission is a scheme that uses carrier-sense multiple access and therefore requires a constant set of frequencies to be assigned exclusively during the whole super-frame When an uplink packet destined for contention-based transmission is drained from the SLC Cache at the UT it is prepared for possible retransmission and then coded The same function blockssub-layers as for TDC and CDC transmission are used but the parameter settings may be different The FEC blocks are transmitted by using the PHY contention-based transfer service Received DAC FEC blocks are decoded and the RTUs are possibly retransmitted if an error is detected
BCH (downlinks only) The BCH packets contain control signalling from higher layers The range of their reliable reception places an upper bound on the size of the cell These downlink broadcast channel packets are combined with super-frame control information The combined packets are low-rate encoded in the MAC combined with space-time-frequency (inner) encoding performed at the PHY layer Transmission and reception proceeds via the PHY BCH and SF control transfer service Retransmission cannot be used Adjacent BS and RN should use orthogonal time-frequency sets within this timeslot for their downlink preamble control transmission to limit their mutual interference
RAC (uplinks and for TDD BS-to-BSRN) The Random access channel can be used for initial access to a BS or RN by the UTs eg after handover RAC packets are coded and then transmitted in the reserved time-slot of the super-frame preamble in a contention-based manner Transmission and reception proceeds via the PHY RAC transfer service The MAC protocol and transmission strategy for this channel has not yet been defined
The RAC time-slot can in TDD systems can also be used for BS-to-BS and RN-to-BS over-the-air control signalling A BS or RN involved in this transmission would use the RAC for transmission in a few super-frames while it listens for reception in the others
WINNER D210 v10
Page 88 (180)
C16 Resource scheduling The Resource scheduler determines the resource mapping for TDC and CDC flows It utilises two scheduling algorithms
bull The Adaptive resource scheduler used for high-performance TDC transmission
bull The Non-frequency adaptive resource scheduler used for all CDC flows and as a fallback alternative for TDC flows It is also foreseen to be used for parts of the control signalling
These algorithms take priorities from the RLC Service Level Controller into account as well as the queue levels in the RSB and the SLC Cache
In addition the resource scheduler contains several support functions Spatial link adaptation Uplink slow power control Active set selection RS parameterisation and Allocation Statistics that will not be discussed further here
bull The adaptive resource scheduling and transmission uses predictions of channel quality information (CQI) to utilise the small-scale and frequency-selective variations of the channel for different terminals The scheduler assigns a set of chunk layers (see Section 132) within the frame to each flow After scheduling the RSB queues are drained with bit-level resolution The bits from each flow are mapped onto the assigned chunk layers This mapping is exclusive ie several flows do not share a chunk layer The transmission parameters within each chunk layer are adjusted individually through link adaptation to the frequency-selective channel of the selected user This link adaptation may use combinations of adaptive modulation (inner) coding that is adjusted to each chunk and power control The link adaptation can be designed to provide a target SINR per bit for the FEC blocs that are coded with the (outer) FEC code It then converts the fading channel into something approximating an AWGN channel as seen by the outer code Link adaptation may be combined with spatial multiplexing for example in the form of per-stream rate control where different FEC blocks of one flow are mapped to different chunk layers By selecting the best resources for each flow multi-user scheduling gains can be realised The scheduling algorithm should take into account the channel quality information of each user in each chunk layer the RLC flow transmission requirementspriorities and the queue levels Timely channel quality information requires the SINR within each chunk layer and for each candidate terminal to be predicted with relatively high accuracy The most advanced multi-antenna transmit schemes furthermore require the whole MIMO channel gain matrix to be known at the transmitter This is denoted full channel state information (CSI)
bull Non-frequency adaptive resource scheduling and transmission is instead based on averaging strategies Such transmission schemes are designed to combat and reduce the effect of the variability of the SINR by interleaving space-time-frequency coding and diversity combining Non-frequency adaptive transmission is required when fast channel feedback is unreliable due to eg a high terminal velocity or a low SINR [WIND24] or when the terminal does not support adaptive transmission It is also required for point-to-multipoint communication belonging to the common data channel (CDC) flows The non-frequency adaptive transmission slowly adapts to the shadow fading but it averages over the frequency selective (small-scale) fading It requires the FEC blocks to be mapped on a set of chunks that are widely dispersed in frequency and if possible on different antennas to maximise the effectiveness of the coding and interleaving
Figure C2 below gives an overview of the downlink transmission of scheduled flows Among other things this figure illustrates that two scheduling entities control the flows and have to cooperate The Flow scheduler at the RLC system layer is part of the Service level controller (Section 41 and Appendix D12) The Resource scheduler at the MAC system layer works on a faster time scale and takes the channel properties into account The adaptive RS uses detailed knowledge of the available resources the non-frequency adaptive RS has to work with more crude measurements of the average channel qualities In the present design these SLC and the RS interact in a very simple way The SLC fills the SCL Cache while the RS is responsible for draining it The SCL furthermore reports priorities of each flow to the RS Only a few priority levels are used The RS drains the queues and allocates the transmission resources in a way that optimises a criterion that takes the queue levels and the priorities into account Existing algorithms with very low computational complexity can be used to solve the resource scheduling problem when formulated in this way See eg Chapters 6 and 7 in [Eri04] These algorithms have computational complexity that grows linearly with the number of scheduled resources and linearly with the number of scheduled flows Execution times below 01 ms can be attained which is consistent with the very fast transmission strategies outlined in Appendix C15 above
WINNER D210 v10
Page 89 (180)
Service Level Controller
Resouce Scheduler
Packet Processing
IFFT beamforming pulse shaping
Tchunk
Optional SLC buffer
Time
Virtual antennalayer Frequency
RLC
MAC
PHY
CQI CSI Buffer levels CQI errors
Antenna 1 Antenna N
Non-frequency-adaptive Resource Scheduler
Adaptive Resource Scheduler
Map on dispersed chunks Map on optimal chunks
Constraint Processing
(= End-to-end ARQ buffer)
- Scheduled Mapping onto chunks and layers - Link adaptation
Segmentation FEC Coding
SLC cache at BS
Per-flow flow control - Inter-flow fairness - Service constraints - Total delay contraints
Resource scheduling buffer
at BS or RN
TDC CDC
Flow classification Convergence layer
Spectrum mapping
and assignment
Figure C2 Data flows and some control functions in downlinks of the scheduled data channels
Adaptive transmission requires prediction of the channel quality due to the transmission control loop delay In [WIND24] summarised in Appendix B52 the predictability and attainable prediction accuracy is investigated as a function of the SINR and the terminal velocity The effect of the prediction errors on the attainable adaptive transmission performance and on attainable multi-user scheduling gain was investigated Fast adaptation control loops are a part of the WINNER design With correspondingly low delays adaptive transmission was found feasible at vehicular velocities at 5 GHz carrier frequencies A SINR and velocity-dependent boundary delineates when adaptive or non-frequency adaptive transmission is the best alternative (Appendix B52) This decision is taken at flow setup and may be changed later
Both downlink and uplink power control is supervised by the Resource scheduler and is integrated into the optimisation of the transmission parameters
A novel framework had been developed for handling the spatial dimension of the multi-user scheduling and link adaptation problem It integrates various SDMA (spatial division multiple access) strategies into the total solution
WINNER D210 v10
Page 90 (180)
[yes][no]
exit conditions could also be based on some quality metric instead of a fixed number of iterations
x stands for either adaptive or non-frequency adpative
This message determines the active set for the next frame
Upd
ate_
cons
train
ts(F
cbS
cb)
Spa
tial_
sche
me(
flow
num
ber)
su_la gtmax_su_la
mu_la gtmax_mu_la
su_la=su_la+1
RSB
_sta
tus(
Que
ue_s
tate
s_CD
C
Que
ue_s
tate
s_TD
C)
Upd
ate_
mea
sure
men
ts(C
QI_
pred
ictio
ns)
MAC_URSB
MAC_CSpatial Scheme SelectionMAC_CConstraint Processing
PHYMeasurements
mu_la=mu_la+1su_la = 0
Spatial userpartitioning
[yes]
[no]
Upd
ate_
flow
_sta
tes(
RS_a
ctiv
e_se
t_D
LU
L)
MAC_UQueue State Control
Channel-adaptivemulti-userscheduling
send
_enc
oded
_bits
(poi
nter
num
ber_
of_b
its)
PHYx TransferSend
PHYTransmit Control Signaling
Active setselection for
frame j+1
Preliminary spatialsingle-user link
adapatation
Link adaptation
Resource Mappingfor all flows in
frame j+1
Figure C3 Resource scheduling sequence overview (adaptive and non-frequency adaptive)
As outlined by Figure C3 above adaptive multi-antenna link adaptation and scheduling is separated into four steps to limit the computational complexity so that a fast feedback loop is obtained
1) Spatial user partitioning ie separation of users into spatially well separated sets
2) Preliminary single-user link adaptation for each potential user and potential resource
3) Channel-adaptive multi-user scheduling within the sets of spatially highly-interfering terminals using the chunk capacities calculated in step 2 (In case of non-frequency adaptive transmission only slow adaptation to the shadow fading is used)
4) Final link adaptation resource mapping and transmission of the selected flows using either the link adaptation parameters that were determined in step 2 or iteratively refined schemes
The sequence can be iterated a few times to improve the estimate of the spatial inter-set interference
Step 1 the spatial user partitioning will be discussed in more detail in Appendix C17 below Step 2 the single-user link adaptation was discussed briefly in Appendix B514
The channel-adaptive multi-user scheduling should in general be designed to take queue levels into account as discussed above In the simulation evaluation investigations presented in Appendix G below the simplification of a full queue model was used The following simple resource scheduling strategies were used in most of the investigations on adaptive transmission
bull Round robin ie periodic allocation to all flows
bull Max rate scheduling ie giving the resource to the flow that can have the highest throughput
bull Score-based scheduling [Bon04] a modified proportional fair strategy
To reflect the bursty nature of packet flows and to limit the transmission overhead each adaptively allocated TDC flow shifts between the following states
bull Passive The flow has an empty RSB queue and no packet in the SLC Cache Minimal transmission control signalling is required Terminals may be in micro-sleep mode except during specified control transmission time-slots
bull Semi-active This state is only used for adaptively allocated TDC flows The flow has segments in queue but is not eligible for scheduling during the present frame
bull Active The flow is eligible for scheduling during the present frame The full transmission control loop is up and running
WINNER D210 v10
Page 91 (180)
The transition between these three states and the corresponding PHY control messaging is governed by the Queue state control function within the Flow state controller and the active set selection in the RS The queue state is updated every slot (half-frame)
In cells with few flows all flows with packets to transmit will be in the active state In cells with many flows assigned for adaptive transmission the access to the active state can be restricted to limit several types of complexity and overhead The scheduling computational complexity the downlink control overhead the channel prediction complexity and the CQI and CSI feedback signalling overhead
C17 SDMA and spatial user partitioning The task of spatial user partitioning is to separate the user terminals into spatial sets with low mutual interference The aim is to group the user terminals so that their correlation matrix (power at receiver i resulting from a downlink transmission to terminal j) becomes approximately block diagonal Highly interfering terminals are placed into the same spatial sets members of pairs with mutual interference below a pre-defined threshold can be placed in different sets Once such spatial sets are established we can use SDMA for flows of different sets Such groups of flows that share a chunk are called (spatial user) groupings Other multiple access schemes (such as TDMA FDMA) are used to avoid interference when transmitting tofrom users within the same set The sets can be thought of as (generalised) beams They are reached by using specific spatial precoding (beamforming) weights
The spatial user partitioning allows controlling the interference generated by SDMA by setting appropriate interference thresholds during the generation of the spatial sets Therefore the allowed SDMA interference can be considered in the overall interference prediction used for in resource scheduling in the individual spatial sets To a first approximation we can therefore assume that the subsequent multi-user scheduling can be performed independently within each spatial set of terminals This reduces the computational complexity drastically spatial user partitioning reduces the problem of multi-user multi-antenna scheduling to that of performing chunk-adaptive multi-user scheduling within the individual sets
The procedure to obtain such spatial sets depends on the amount of channel knowledge at the transmitter If channel state information (CSI) is available at the transmitter the spatial sets can be generated by calculating the mutual correlation between users If only a channel quality indicator (CQI) is available so-called opportunistic or grid-of-beams beamforming approaches are used
As the number of users increases it becomes increasingly complex to find spatial sets with good separation properties and testing all possible terminal combinations must be avoided20 We may then partition the time-frequency resources into two or more groups and assign subsets of users to each group These subsets of user terminals are called orthogonal groups If this grouping is performed properly it simplifies the task of forming well-separated spatial sets within each orthogonal group Different criteria to form orthogonal groups are conceivable eg
bull For fixed beamforming the users associated to beams that can be transmitted concurrently with inter-beam interference below a pre-defined threshold can form one orthogonal group
bull For adaptive precoding terminals can be grouped according to their SINR requirements (ie according to their target data rates and interference suppression capabilities) This allows using different SDMA interference thresholds in the different groups It therefore improves the overall opportunities for SDMA (which would otherwise be limited over all resources by the weakest terminal)
The SDMA decision must be integrated in the overall resource allocation process ie the decision must integrate the priorities due to QoS contracts and the opportunities and constraints due to the spatial channel characteristics The numbers of users served concurrently by SDMA is a parameter which has a significant impact on the performance the throughput gain offered by serving multiple users at the same time comes at the expense of serving each user with a smaller fraction of the available transmit power
An example of the use of SDMA and spatial user partitioning is given in Appendix G22 Furthermore a specific algorithm for creating spatial groupings is discussed in more detail below
20 The complexity is especially severe in cases where CSI is used at the TX for precoding because the precoding solution depends on the combination (and possibly also on the user ordering) to be tested and again differs for every chunk
WINNER D210 v10
Page 92 (180)
Low Complexity Space-Time-Frequency User Partitioning for MIMO Systems with SDMA
The algorithm was originally derived for a precoding technique that forces the interference to be zero between all users that are served simultaneous via SDMA Even if no interference is present spatial scheduling is of crucial importance If users with spatially correlated channel subspaces are served jointly this leads to inefficient precoding matrices and a drop in the strength of the equivalent channel after precoding The goal of the algorithm is therefore to group together users with uncorrelated channels The precoding technique under investigation allowed the use of an efficient approximation technique based on orthogonal projection matrices to calculate the capacity after precoding which serves as a scheduling metric The capacity estimate also allows to inherently consider the effect of different group sizes since it includes the transmit power In the case of precoding where interference is not fully suppressed the problem of correlated subspaces will lead to a slight reduction in link quality and to an increase in interference Since the latter is dual to the drop in link quality in the zero forcing case the proposed solution is also applicable in the non-ZF case as shown in [FDGH05b]
An iterative method for forming these groupings presented in [FDGH05a] will be described briefly
For any users g out of G users a rough estimate ( )Sgη is calculated that represents the spectral efficiency
that would result if that user were allowed to transmit in the selected way It approximates the inter-layer interference effect and can be calculated by a simplified projection scheme see [FDGH05a] [FDGH05b] The equivalent channel of user g is represented by its channel matrix after an orthogonal projection into the null-space of a joint channel matrix containing all G usersrsquo channels except that of the grsquoth The resulting chunk throughput when transmitting to all users in the grouping is simply estimated as the sum of the G individual terms ( )S
gη
The iterative tree-based scheme for forming appropriate groupings can now be explained as follows Let us start with a situation where all users are part of one spatial set ie each use forms a separate grouping with only one member (lowest row in Figure C4) SDMA would then not be used at all within the cell First the user with the best metric is identified In the figure it is user number 1 Then one user at a time is added to it and the metric sum of the combination is calculated The combination with the highest metric sum is kept as candidate user groupings with size 2 The algorithm is repeated to test and form a grouping of size 3 It proceeds in this way up to the maximum allowed group size When done the
grouping of size G with the highest metric sum GC (or highest capacity if higher accuracy is desired) out of all candidate groupings (marked in red for G = 3 in the example in Figure C4) is chosen To reduce complexity even further the solution can be tracked in time Instead of calculating the entire tree the sorting starts with the previously found solution and proceeds eg one level up in the tree and two levels down again updating also the previous solution The sub-grouping is then selected only from three new candidates Going top-down in the tree is achieved by testing one by one which user to delete from the grouping in order for the remaining group to have maximum sum metric
Figure C4 In a system with 5 users candidate user grouping are built by adding one user at a time and keeping the grouping with highest sum metric Finally the grouping with highest sum metric
(eg the one marked in red) out of all candidate groupings (marked in yellow) is used
11 22 33 44 55
1 21 2 33 44 55
33 551 24
1 2 34 5
1 2 34
55
Trac
king
win
dow
11 22 33 44 55
1 21 2 33 44 55
33 551 24
1 2 34 5
1 2 34
55
Trac
king
win
dow
WINNER D210 v10
Page 93 (180)
C18 Timing of the execution of the main MAC functions
The main functions of the control plane (C) and the user plane (U) are executed on the following time scales
Executed once every super-frame
- Constraint combining (C) - Resource partitioning (C)
- Spatial scheme selection (C)
- Coding resource mapping and PHY transmission of RAC and BCH flows (U)
- Reception from PHY and decoding of RAC and BCH FEC blocks (U)
The execution of the following functions is trigger-based when required
- Flow setup control (C)
- Flow release control (C)
- Spatial scheme pre-configuration (long-term decisions and constraints) (C)
- Calibration in the spatial scheme controller (C)
- Support functions within the resource scheduler (U)
Executed every slot (half-frame in FDD UL DL period of frame in TDD)
- Queue state control (U) - Resource scheduling (U)
- Coding segmentation resource mapping and PHY transmission of TDC and CDC flows (U)
- Reception from PHY decoding and reassembly of TDC and CDC FEC blocks (U)
C2 Functional architecture for peer-to-peer MAC C21 MAC services provided for peer-to-peer transmission The Radio_Resource_Control service for P2P transmission is used to start maintain and stop the operation of a P2P-DAC in the BS User terminals which intend transmitting peer-to-peer have to attach to the channel before transferring data using this service Detaching terminals from the DAC is another service that is provided If a UT intends to transmit data packets synchronously the service provides functions to create and terminate a synchronous data flow The primitives of type req request ind indication rsp response and cnf confirm that are provided to use this service at higher layers are summarised in Table C1
Table C1 Overview on MAC_P2P_CONTROL primitives for P2P transmission
Name req ind rsp cnf
MAC_P2P_CONTROL_START_DAC - -
MAC_P2P_CONTROL_STOP_DAC - - -
MAC_P2P_CONTROL_ATTACH_TO_DAC
MAC_P2P_CONTROL_ATTACH_INFO - - -
MAC_P2P_CONTROL_DETACH_FROM_DAC -
MAC_P2P_CONTROL_CREATE_SYNC_FLOW - -
MAC_P2P_CONTROL_TERMINATE_SYNC_FLOW - -
After the P2P-DAC has been configured appropriately and the UTs involved in P2PPMP transmission have been attached the Radio_Packet_Transfer service for P2P transmission can be used to exchange
WINNER D210 v10
Page 94 (180)
segmented packets either asynchronously or synchronously between peer terminals The primitives which are provided to use this service at higher layers are summarised in Table C2
Table C2 Overview on MAC_P2P_USER primitives for P2P transmission
Name req ind rsp cnf
MAC_P2P_USER_SYNC_DATA -
MAC_P2P_USER_ASYNC_DATA -
C22 MAC functions provided for peer-to-peer transmission DAC-P2P flow setup data transfer and flow termination
Figure C5 shows the state-transition diagram implemented in the P2P-DAC flow setup and termination unit of the base station (see Figure 37) After radio resources have been allocated for the DAC the service primitive START_DACreq triggers the execution of the P2P-DAC initialisation function and the transition to state P2P-DAC_ACTIVE In this state the P2P-DAC beaconresource control function is continuously executed to control the operation of the DAC by broadcasting beacons with the appropriate information about the available DAC service and the current DAC frame structure This control function is terminated by executing the P2P-DAC terminate function after receiving a STOP_DACreq
The state-transition diagram in Figure C6 illustrates how the various protocol functions of the P2P-MAC interact with each other in the UT to setup a P2P-DAC flow control the data transfer and terminate the flow
After being synchronised to the BS the user starts the P2P-DAC attach function by sending an ATTACH_TO_DACreq primitive to the flow setup and termination unit This function conveys to the BS information about the UT and the BS assigns to the UT a unique identifier for efficient addressing After its successful completion a confirmation is sent to the user before the finite-state machine transits to state ATTACHED A UT can detach from the DAC at any time by executing the P2P-DAC detach function
In the state ATTACHED the user can request an asynchronous transfer of a radio packet in the CAP or GAP to the peer UT by sending a USER_ASYNC_DATAreq This initiates the execution of the P2P-DAC asynchronous transfer control function If the packet should be transmitted in the GAP the UT informs the BS with an UL command of the pending transmission request If resources are available the BS schedules time slots for the transfer request and announces the availability of the time slots for the requested P2P transfer in the beacon The transfer control function then controls segmentation retransmission and multiplexing of the segmented radio packet onto the assigned time slots If the packet should be transmitted in the CAP the request is forwarded to the P2P-DAC channel access control function After completing the data transfer the successful transfer is confirmed and the finite-state machine returns to state ATTACHED
Before radio packets can be synchronously transferred between peer UTs a service user has to request the execution of P2P-flow setup function by sending a CREATE_P2P_FLOWreq This procedure establishes a synchronous P2P-flow by exchanging protocol messages between the UTs and the BS If time slots are
Figure C5 State-transition diagram of P2P-DAC flow setup and termination in the base station
WINNER D210 v10
Page 95 (180)
periodically available for the requested data transfer the BS assigns a unique index to the newly created flow After the successful completion of the procedure a confirmation is sent to the user and the finite-state machine transits to state P2P-FLOW_ESTABLISHED A UT can terminate a P2P-flow by executing the P2P-flow termination function
In the state P2P-FLOW_ESTABLISHED the user can request a synchronous transfer of radio packet on the pre-established P2P-flow by sending the USER_SYNC_DATAreq primitive This primitive initiates the execution the P2P-DAC synchronous transfer control function which controls segmentation retransmission and the multiplexing of the segmented data to the pre-allocated time slots of the DAC frame After the completion of the data transfer the transfer is confirmed and the finite-state machine returns to state P2P-FLOW_ESTABLISHED
Figure C6 State-transition diagram of P2P-DAC flow setup transfer control and flow termination in the user terminal
P2P-DAC channel access control functions The P2P-DAC channel access control functions give UTs random access to the P2P-DAC for transmitting control messages to the BS and exchanging protocol messages or small amount of user data between peers
A UT which is synchronised to the P2P-DAC can transmit command frames to the BS in the UL command time slot by using a slotted ALOHA access protocol The access to the time slot is controlled by a contention window that is maintained by each UT The size of the window is defined as cw(a)=min2a+1256 where a represents the number of retransmission attempts already made by the UT The UT chooses a uniformly distributed random value r within the interval [1cw(a)] and starts the access after r DAC frames After receiving a response from the BS indicating successful command reception the parameter is reset to zero
A UT which is attached to the P2P-DAC can asynchronously transmit control messages or a small amount of data to a peer UT in the contention-access period Since no establishment of a synchronous P2P flow is required this method leads to a faster access and data transfer The basic medium access mechanism used in the CAP is the well-known carrier-sense multiple access scheme with collision avoidance A UT with a pending data transmit-request senses the state of the wireless medium before it can transmit If the medium is idle longer than a pre-defined time interval it can proceed with the transmission Otherwise it first waits until the medium becomes free then generates a random backoff time before it tries to transmit in order to minimise the risk of collisions with transmit request issued by other terminals
WINNER D210 v10
Page 96 (180)
C3 Chunk definition The scaling of chunks in the WINNER system is based on the following general considerations
bull The appropriate frequency extent of a chunk should be determined by analysing the balance between two factors 1) The performance loss due to channel variability within the chunk which is decreased with narrow chunks This factor depends on the typical channel power delay profile which is in turn related to the cell size and the deployment scenario 2) The required control overhead and feedback rate with adaptive transmission which is decreased with wide chunks
bull The appropriate time duration of a chunk is determined by the following factors 1) Short chunks lead to a small overall radio interface delay 2) Short chunks enable the design of feedback loops for adaptive transmission also for fast fading channels 3) Short chunks may contain so few payload symbols that the overhead due to pilots and in-band control symbols becomes prohibi-tive 4) Long chunks may contain too many payload symbols Transmission of small FEC blocks will then become problematic since flows are in general mapped exclusively to flows in adaptive transmission without chunk-sharing
The chunk definitions found below are specified for the (frequency) adaptive transmission mode which will be used whenever precise channel quality information is available at the transmitter to steer link adaptation on a fine granularity level Within chunks allocated for non-frequency adaptive transmission there is a potential need for a more fine-grained rate matching Solutions to solve this problem are outlined in Section 316
The chunk width is set to 8 subcarriers or 3125 KHz in the FDD mode and to 16 subcarriers or 7812 KHz in the TDD mode The motivation for this difference in chunk widths is that the FDD mode has in WINNER phase I been evaluated in rural area and metropolitan area deployments with rather high delay spread and frequency selectivity in the channels see Table F1 in Appendix F The TDD mode has been evaluated primarily in short-range deployments with less delay spread in the channel models and thus less frequency selectivity
Thus the usable 416 subcarriers in the FDD mode are partitioned into 52 chunks the usable 1664 subcarriers in the TDD mode are partitioned into 104 chunks The radio interface delay requirement of 1 ms [WIND71] can be interpreted as a requirement on the slot duration of the FDD transmission and the uplink and downlink slot lengths of the TDD transmission by the following reasoning The shortest control loop for a transmission consists of a request response and transmission Each such sequence should have duration of approximately 1 ms The chunk durations Tchunk of the FDD mode will therefore be set to 12 OFDM symbols plus guard times or 3456 micros The frame of the half-duplex FDD system consists of a downlink chunk followed by an uplink chunk with duration Tframe = 2 Tchunk = 6912 micros The frame of the TDD mode consists of a downlink period + duplex guard time + uplink period + duplex guard time This frame duration is set equal to the FDD frame duration of 6912 micros to simplify inter-mode cooperation The TDD chunk duration is set to 5 OFDM symbols plus guard times = 1088 micros The duplex guard time is set to 192 micros Each TDD frame contains 6 chunks plus two duplex guard times With asymmetry 11 each frame contains three uplink chunks and three downlink chunks
A chunk thus contains 96 symbols in the FDD cellular mode when used for CP-OFDM transmission and 80 symbols in the TDD cellular mode See Figure 31
WINNER D210 v10
Page 97 (180)
Appendix D Radio Resource Management (RRM) and Radio Resource Control (RRC)
D1 RRM functions
D11 Spectrum control
Spectrum Sharing Spectrum Sharing controls the access to the spectrum in frequency bands which are shared with other RATs which are probably the ones used by legacy systems Depending on the regulatory rules governing the shared bands different scenarios for spectrum sharing are possible
Horizontal sharing The involved systems in the shared frequency band have equal regulatory status ie no system has priority over the other(s) in accessing the spectrum
bull Horizontal sharing without coordination No signalling is required between the involved systems as eg nowadays on the ISM band Since QoS cannot be guaranteed for any system this possibility is not considered in further detail
bull Horizontal sharing with coordination The involved systems coordinate their spectrum access based on a set of predefined rules (spectrum etiquette) that all systems adhere to This requires capabilities for signalling or at least detection of the other systems
Vertical sharing In this modality sharing is performed with clearly established priorities The primary system has preference in accessing the spectrum and the secondary system(s) may only use the spectrum as long as they do not cause harmful interference towards the primary
The most important as well as complex service component is the one where WINNER is the secondary system which controls the emissions from the WINNER system to avoid harmful interference towards legacy systems This function first has to reliably identify the ldquowhite spacesrdquo ie unused spectrum and then determines the transmit constraints of the WINNER system The identification of the white spaces can be based on measurements and it can be significantly assisted with information provided by a spectrum database or a central radio controller Based on the available and measured information constraints for the transmit parameters are determined and signalled to the constraint processing function in the MAC layer
Spectrum Assignment Spectrum Assignment periodically reassigns a portion of the available spectral resources between multiple WINNER RANs In contrast to the conventional fixed spectrum assignment herein it allows dynamical balancing of spectral resources between networks As a result spectral resources available for a network can be adjusted according to eg changes on the operatorsrsquo customer base (or market shares) Spectrum assignment also facilitates introduction of operators with relatively small customer base or network coverage area In addition spectral resources can be re-assigned according to the variations on the aggregate loads on the networks hence enhancing the overall use of spectrum over all networks
Long-term Spectrum Assignment The spectral resources assigned to the networks are defined in terms of chunks and hence separation between networks can be done either in frequency (eg in FDD mode) or both in time and frequency One principle for the re-assignment assumed in the following is to keep the spectral resources assigned to the networks as orthogonal as possible In other words the resources are separated in time frequency or space so that interference between networks is minimised This prevents the need for extensive coordination (or tight coupling) between networks for complicated interference management over multiple networks as well as for strict limitations to the operation of RRM within networks The principle likely favours TDD bands where orthogonal resource allocations are efficiently obtained in time This is due to the synchronisation between networks required also with the conventional fixed spectrum assignment due to the adjacent channel interference Other principles assumed in the following are
bull The spectrum assignment functionality is distributed to all networks and re-assignments any negotiated between networks without any central controller
WINNER D210 v10
Page 98 (180)
bull Central database containing relevant information on spectrum priorities as well as on fairness and cost metrics enables higher layer control on the spectrum assignment through the priorities and fairnesscost metrics It also enables simple introduction of new networks
bull Spectral resources are divided into two categories resources assigned with a priority and common pool resources
o The purpose of resources assigned with a priority to a certain network is to guarantee basic operation of the network under all circumstances A network can release some of the priority assigned resources for other networks but it can retrieve the resource in the next negotiation phase In other words it has incontestable priority to the resource
o Common pool resources can be reserved by any network
bull Fairness and cost metrics are used in the negotiation of assignments to achieve fair and efficient allocation solution
bull Spectral resource assignments vary geographically although spatially contiguous assignments are preferred to avoid unnecessary interference between networks To facilitate smooth spatial transition in the assignments it is envisaged that long-term assignment specifies for large geographical areas with spatial granularity of several cells (sets of cells) and short-term assignment optimises the border regions further with cell-wise resource assignments
bull Spectral resource re-assignment is done periodically and at a slow rate (ie several minutes)
It may be preferable that resources in the common pool are assigned to a network for multiple spectrum assignment periods at a time In other words not all common pool resources are re-assigned at each period This results in a smoother spectrum assignment adaptation and probably reduced need for the priority assigned spectral resources A simple solution may be that assignments have a common duration of multiple assignment periods and a resource can be released during the assignment
Short-term Spectrum Assignment The short-term spectrum assignment complements the main spectrum assignment by providing short-term and local ie cell-specific variations to the spectrum assignments covering large geographical areas Hence it enables 1) faster adaptation to the local traffic load variations and 2) geographically more accurate spectrum assignments In the part of faster adaptation to load variations it provides complementary method for inter-network load sharing The assessment of the true benefits of this approach in comparison to plain load sharing remains to be done in WINNER II
The re-assignments of spectral resources are performed in the time scale of several seconds To limit the induced complexity the functionality resorts to only simple inter-network signalling Functionality requests resources from other WINNER RANs after triggered by the long-term spectrum assignment or preventive load control In the case of a resource request from other RANs the functionality rejects accepts or partially accepts the request based on information from load prediction and MAC control feedback on the overlapping and neighbouring cells Inter-network signalling is performed either over the air or through the core network For the over the air signalling RAC is used through the MAC radio packet transfer service The constraint information is updated based on the decisions and sent to appropriate MAC layer
D12 Service level control (SLC) The SLC has the overall responsibility of adjusting inter-flow fairness and assuring the fulfilment of service level contract agreements and total delay constraints In particular
bull it may perform by requesting resources from several BSs that may utilise different WINNER modes
bull it works on a slow time scale characterised by the packet arrival rates
bull it may allocate resources belonging to several modesbase stations
The SLC forwards packets to SLC cache (Figure C2) based on a predicted sum rate and QoS requirements which could be derived by the queue levels feedbacked by the SLC cache The SLC cache is kept rather small corresponding to few frames while separate queues are allocated for each flow Furthermore the SLC assigns static priorities per flow and RS schedules based on priority queuing time and channel state
The service differentiation is exercised through the following service components while an example is given in Figure D1
WINNER D210 v10
Page 99 (180)
bull Flow Conditioning The traffic of each flow is conditioned to ensure that it complies with the corresponding profile definition in particular the defined maximum traffic rate
bull Flow Queuing In WINNER it is assumed that separate queues are allocated for each flow Packets in respective queue may get dropped during transient phases of congestion
bull Flow Scheduling Flow scheduling may be considered as management between flows and determines the order in which PDUs will be forwarded to the SLC cache buffer residing at the MAC layer and works on a time scale characterised by the packet arrival rates
bull Flow Monitoring The main aim for flow monitoring is to (as the name suggests) monitor the flow and provide feedback on flow traffic predictions to any other function that may require this information
Flow-1 Flow-LApps belonging to service class 1
Decision based on intra-class policy inter-class policy and age of packet
Flow-1 Flow-N
Per Flow Queuing+Active QueueManagement
Flow scheduling
SLC Cache(Drained by RS)
Flow-M Flow-NApps belonging to service class L
MAC
RLC
Aggregate of Marked Packets
Network Control Packets
Flow Conditioning(eg through Leaky or Token Bucket
IPC
Feedback on Queue Levels
Figure D1 Example of flow conditioning flow queuing and flow scheduling
D13 ModeRAN selection The different architecture alternatives may be expected to differ in what decision variables are available and according to the way different available modes are used We have above defined
1 fast selection - which is a quasi-simultaneous operation of modes and will have to be performed in both the BS and the UT the decision variables and boundary conditions are expected to be set by RRM but the selection decision has to be taken by MAC (Figure D2)
2 slow selection - which is an RRM function to control alternative operation of modes the process perhaps bearing many similarities to the RAN selection
3 re-selection - which is an RRMRRC function to handle changing radio conditions availability of modes
WINNER D210 v10
Page 100 (180)
Application s
TCP UDP
IPvX
Multi-Mode Layer 2
Layer 1Mode 1
Layer 1Mode 2
IP Convergence Flow identification
Destination Identification
End-to-End Automatic Repeat
reQuest (ARQ)
Hop-by-Hop ARQ
Mode 2
ResourceScheduling
Mode 2
Hop-by-Hop ARQ
Mode 1
Resource Scheduling
Mode 1
Segmentationand
Reassembly (SAR)
(Inter -mode)-Scheduling =
fast mode selection
L2 M
odes
Con
verg
ence
Man
ager
RR
MR
RC P
aram
eter
izatio
n fo
r fas
t mod
e se
lect
ion
RR
MR
RC c
ontro
l for
slo
w m
ode
sele
ctio
n an
d re
-sel
ectio
n
Data FlowParameterization Composition and Status Information
Interaction
Figure D2 User plane data flow and fast mode selection (not shown slow mode selection and re-selection performed by RRMRRC)
According to the variant of mode selection applied a subset of the decision variables can be used
bull Mode availability - which subset of the modes that a terminal can support is in fact available at the current location
bull Service ndash the mode which is most efficient for the service in question is selected
bull Signal strength ndash the mode from which the strongest signal is received is selected This is a simple version of the more sophisticated selection parameter radio resource cost discussed below
bull Radio resource consumption ndash the mode for which the least relative amount of radio resources (eg power codes timeslots etc) is required to support the users is selected
bull System load ndash the mode with the least relative load is selected This does not necessarily improve capacity but improves user quality at loads below the capacity limit and avoids reallocations as the load approaches the capacity limit
bull Packet size ndash the mode which is most efficient for the packet size in question is selected
bull Price ndash the mode for which the price for supporting the user is lowest is selected This is especially interesting in case the different modes are run by different operators and the decision is taken by the end-user or the terminal
The RAN selection algorithm selects the most suitable RAT for attending the service requests of UTs Of importance here are the RATrsquos preferences for the requested service according to the QoS offered by each RAT and the balance among the radio resources occupation of the different RATs achieved by a suitable traffic load balance among them The algorithm is based on the availability of a list for all the available RATs capable to provide the service This list is made based on QoS information A decisive factor for prioritising a RAT over another RAT will be the user preference [WIND41] [WIND42]
D14 Handover The general rules for handover between the WINNER modes are expected to be mode availability and terminal mobility For example UTs with high mobility are expected to always be connected with the wide area cell even if they are in the vicinity of the short range cell Also the triggers for handover and their thresholds between the two modes will depend on the deployment scenario ie extension of coverage and increase of spectral efficiency as well as on the relaying concept In case of an inter-system handover this is expected to take place either when there is loss of coverage of the current system or in the case of overlapping coverage due to useroperator preferences or traffic congestion Example of handover triggers are given in [WIND41] [WIND42]
WINNER D210 v10
Page 101 (180)
Intra-system handover Since the wide area cell is going to exist as an umbrella over the short range cell there is a need for making the UT aware that it has the option of changing to TDD mode In order to allow for a seamless handover within the WINNER RAN BSs and RNs of the same or different mode can announce their presence to the UTs by broadcasting control messages using orthogonal resources This scheme is especially helpful for the handover between WINNER FDD and TDD as it allows the UTs to be aware of the presence of BSs and RNs that operate at a different mode without disrupting their normal operation to ldquosniffrdquo other parts of the spectrum Further information can be found at [WIND43] [WIND44]
Inter-system handover
Location-based Vertical Handover (VHO) In a homogeneous system the scanning of other possible connections is triggered by the condition of the link since an ongoing connection with good performance makes such a procedure dispensable For a vertical handover continuous surveillance is mandatory At the moment this can only be handled by the terminal itself because no entity exists for the integration and information exchange of different networks Therefore the mobile must scan all other possible RATs The autonomous gathering of information by means of scanning may impact both the own and other transmissions Therefore it makes sense to look for alternative ways of gaining respective measurement results Since the need for own measurements shall be reduced as much as possible another way of gathering the relevant information is to employ measurement reports which have been collected by other active UTs within the same or within other systems Information gathering within the same system thereby is required for horizontal handover (HHO) preparation whereas for VHO information gathering between different types of systems is needed However information may also be used to control other mechanisms such as appropriate physical mode selection for link adaptation (LA) or (joint) Radio Resource Management (RRM) In all cases the location-based VHO in combination with the Hybrid Information System (HIS) offers a great economic potential since participating devices can minimise or even avoid self-driven scanning procedures The principle of the HIS presumes that each system collects data about the current link state within the covered cell and provides this information on request to mobiles that are willing to change their connection within the same system (HHO) or different systems (VHO) [WIND41] [WIND42] [WIND43] [WIND44]
CRRM based VHO Another approach for an inter-system handover is based on the CRRM framework defined in the 3GPP [3GPP-TR25891] which allows the exchange of load information between UMTS and GSM networks The proposed algorithm takes in a first step only load criteria into account but in a second step will include also service criteria [WIND41] [WIND42] These algorithms can be extended to WINNER inter-mode handovers [WIND43] [WIND44]
D15 Admission control Admission control schemes are the decision making part of networks with the objective of providing to users services with guaranteed quality in order to reduce the network congestion and call dropping probabilities and achieve as much as possible resource utilisation An example of an admission control algorithm for the selection of the appropriate RAT in the case of RAN cooperation is summarised below [WIND41] [WIND42] [WIND43] [WIND44]
bull The algorithm makes a list of the candidate serving networks and candidate cells for each network The lists contain the candidate networks and cells capable of providing the requested flow service and they are ordered in such a way that better fulfils its requirements in each network
bull If there is only one RAT available in the flowrsquos location area and the flow can be served by that RAT then it is selected otherwise (if the flow cannot be served by that RAT) the flow will be rejected
After selecting the target RAT the algorithm checks if the flow is new or from handover (which means that the flow was already going on in a RAT and for some reason it was decided to change its RAT) If it is a new flow then if there are other flows waiting in the queue it will be rejected (or it will select another RAT if there is one in its list) otherwise it goes to the next step The next step of the algorithm is to check (no matter if it is a handover or new flow) if there are sufficient resources in that network for the flow to be served If there are sufficient resources the flow will be admitted to the target RATmode If the resources of the target RAN are insufficient it will be first checked if the flow can be served by another RATmode If the flow is new and has low priority then it is rejected in this RAN and itrsquos checked if another one can serve it and if none is available the flow is rejected If the flow is from handover or a new - high prioritised it is not rejected in the target RAT but it is first checked if it can be served by another
WINNER D210 v10
Page 102 (180)
RAT (suitable for it) If not it is checked if there is a possibility that other ongoing flows can perform a handover to another suitable network If this action does not also gain the needed resources for the flow then it is checked if degrading the QoS of some ongoing flows (in this RAT) with low priority (where ldquolowrdquo is relative to the priority that the flow has) is possible and enough to admit the flow
If the flow is new and has high priority it will be checked if degrading the QoS (ie lowering the bit rate at a tolerant level) of some low priority flows will gain the needed resources and if yes then the flow is admitted otherwise it is rejected
If it is a handover flow then it is also checked if low priority flows can degrade their QoS as much as it needs to admit the flow If this canrsquot be done the handover flow will enter the handover queue in a position related to its priority that means that it will enter in front of flows with lower priority The flow will remain in the queue until o The needed resources become available (ie by completion of other flows) o The flow leaves the cell ie the user moves to another cell or the flow is completed o The flow is terminated due to timeout
The admission control algorithm for the cooperation between B3G and legacy RANs aims to maximise the number of admitted or in-flow traffic sources supported over the RANs while guaranteeing their QoS requirements and ensuring that the new connection does not affect the QoS of the ongoing connections The decisions to accept or reject a new connection are based on different criteria taking into account each RATrsquos nature
D16 Load control Reactive load control is used to face a situation where the networks are in a overload situation and the usersrsquo QoS is at risk due to increase of the interference mobility aspects low bandwidth availability etc When already admitted users cannot satisfy their guaranteed QoS to their services for a specific percentage of time then the network is considered to be in an overloadcongestion situation Herein we describe am example of a reactive load control mechanism that is monitoring WINNER as well as legacy RANs and if an overload situation occurs it tries to decrease the load of the network performing several actions and especially trying to make the RANs cooperate ie by forcing users to perform handovers The reactive load control algorithm is divided into three phases [WIND41] [WIND42] [WIND43] [WIND44]
1) Detection phase The algorithm continuously monitors the networks and periodically checks the load of the networks in order to detect a overload situation in anyone of them It is considered that a network is overloaded if the load factor is over a certain pre-defined threshold during a certain amount of time
2) Resolution phase This is the phase that the algorithm is trying to resolve the problem that causes the overload situation At first as it is obvious we must drop all the incoming flows (new and handover) as they will increase more the load of the network so admission control is forced to reject the flow requests for that network Then in case flow conditioning is not used the algorithm checks if the overload situation is caused due to users that violate their QoS restrictions in terms of bit rate which means that it tries to find if there are flows that transmit with more bit rate than they should according to the service agreements made between the network and the user If such flows exist then the algorithm drops their bit rate to the value that exists in the service agreements After restoring the bit rate of the users to the agreed there is a check if the network is still in a congestion situation and if so the algorithm performs a number of actions which include handover of flows decreasing of their bit rate or even selective dropping of flows
3) Then the algorithm enters the recovery phase where we try to restore the transmission rate to the flows which rate was decreased in the second step of the resolution phase A recovery algorithm is necessary because we cannot leave the flows with a bit rate that violates the QoS service agreements The problem here is that if we restore the flowsrsquo bit rate incautiously the network could fall once again in a overload situation and thatrsquos why we must be very careful to that For all the flows that we have decreased their bit rate we check (separately) if we can restore their transmission rate without causing congestion again by computing the amount of load needed in order to restore the transmission rate
D17 Routing
The overall picture of the routing in multi-hop cellular networks (MCNs) is depicted in Figure D3 From the architecture perspective two basic routing strategies are envisioned in multi-hop systems centralised or distributed Under the centralised strategy route determination is performed in a central controller which normally possesses powerful processing capability and has knowledge on global network status so that sophisticated routing algorithms could be adopted to optimise the system performance With the
WINNER D210 v10
Page 103 (180)
distributed strategy individual network nodes from the source to the destination jointly perform route determination This strategy could function when no central controller is reachable but its performance is normally limited by network nodesrsquo processing capability and knowledge on network status
Figure D3 Routing in MCNs
In terms of protocol nature the routing algorithms in conventional multi-hop networks such as ad-hoc networks can be mainly broken down into two categories proactive routing and reactive routing With proactive routing schemes network nodes continuously evaluate the topology of the network so that when a packet needs to be forwarded the route is already known and can be immediately used Reactive schemes on the other hand invoke a route determination procedure on demand only Thus when a route is needed some sort of global search procedure is employed in order to find a suitable route to the destination The protocol nature of the routings in MCNs could be both proactive and reactive but being applied at different circumstances for instance reactive routing is be used for idle users whereas proactive routing is applied for active user Nevertheless further studies will be carried out on this issue
For both proactive and reactive routing schemes for ad-hoc networks topologyroute information is normally preserved in routing tables The difference is for proactive routing the table contains up-to-date and complete topology information whereas for reactive routing a route is only created in the table when needed For the routing in MCNs likewise routing tables are also supposed existing at BSs RNs and UTs to keep the necessary routing information for respective nodes This will be further explained in the later part of this section The routing in MCNs is responsible for a number of basic tasks such as routetopology discovery (NB route discovery is normally for reactive routing schemes whereas topology discovery is for proactive ones) and route table updatingmaintenance etc
Decision criteria In the literature various criteria have been proposed for the routing criteria in MCNs such as distance pathloss and transmission power etc For each user these routing algorithms intend to find and choose the route with the least distance pathloss or transmission power etc In our recent work [LHYT01] and [LHYT02] a novel routing criterion named the Load Cost Indicator (LCI) is proposed
ζroute i = Croute i R route i
Where ζroute i is the LCI of route i Croute i represents the consumed capacity of the transmission on route i and R route i is the transmission data rate on route i Apparently such a criterion reflects the consumed system capacity when delivering unit amount of traffic on a particular route Given a certain system capacity constraint if every user employs the route with the least LCI among all its possible routes the system throughput can be maximised
Routing tables As mentioned earlier like in ad-hoc networks in MCNs routing tables are also supposed existing at individual network nodes including BSs RNs and UTs Nevertheless due to the fact that the BS is the common source for all the downstream [WIND25] flows and meanwhile the common destination for all the upstream flows in one radio cell the routing tables in MCNs are much simpler than their counterparts in ad-hoc network moreover for packet delivering purposes an BS only needs to keep downstream routing tabletables a UT only needs to have upstream routing tabletables whereas a RN needs to have both downstream and upstream routing tables Nevertheless as mentioned earlier the routing is envisioned to be centralised (BS-based) in MCNs in another word the route table calculation
WINNER D210 v10
Page 104 (180)
for all the nodes within one cell is to be performed by the BS hence BS actually has the knowledge of the up-to-date route tables at individual nodes within the cell
D2 RRM architecture Intuitively the problem of optimising resources is better posed when doing it in a common fashion rather than regarding separately cellsmodes When information about interference induced by surrounding cells and about the amount of spectrum resources in other modes is available (CRRM approach) algorithms perform better and the usage efficiency is increased This also applies when considering not only surrounding cells but also different radio networks operating simultaneously ie JRRM approach
Benefits of centralised RRM are achieved at the expense of a higher computational complexity since the algorithms have to deal with a higher number of degrees of freedom and involve a larger interchange of information among network agents thus increasing the signalling Time restrictions on signalling are also to be considered Centralised RRM algorithms have been proven to perform worse than distributed ones when delay introduced by signalling is larger than few seconds (5 s)
D21 Location of WINNER functions A first approach regarding the WINNER RRM architecture is shown in Figure D4 According to this approach the mode specific functions are located at the BS and RN while the mode generic user plane ones are located at the RANG logical node All the control plane functionalities are located at the Access Control Server (ACS) logical node A disadvantage of such an RRM architecture would be the possible overload of the system due to increased signalling directed to the ACS node leading to delays
The service level controller (SLC) regarding the downlink is foreseen to be located at some distance from the BSs such as at RANG It has the overall responsibility for adjusting inter-flow fairness assuring the fulfilment of service level contract agreements and total delay constraints It may perform by requesting resources from several BSs that may utilise different WINNER modes working on a slower time scale and may allocate resources belonging to several modesbase stations As buffer management and traffic policing could impose constrains on the service load controller they could be located at the same node After flow classification the service level controller will direct packets of a flow to one specific queue within a buffer residing in an BS or RN On the other hand the flow scheduling of the SLC for the uplink direction will be located at the BS or even the RN The resource schedulers link adaptation and power control should always be located close to the BSs to minimise delays
However all mode generic control plane and cooperative functionalities are located at the ACS logical node In this almost centralised approach the problem of optimising resources is better posed as it is done in a common fashion rather than regarding separately cellsmodesRANs The main disadvantage of such an RRM architecture is the higher computational complexity since the algorithms have to deal with a higher number of degrees of freedom and involve a larger interchange of information leading to the possible overload of the system due to increased signalling directed to the ACS node leading to delays
WINNER D210 v10
Page 105 (180)
bullSchedulingbullService Level Control (uplink)bullShort Term Spectrum AssignmentbullLink AdaptationbullPower Control
bullService Level Control (downlink)bullFlow Establishment amp ReleasebullBuffer ManagementbullTraffic Policing
bullModeRAN SelectionbullHandoverbullAdmission ControlbullLoad Control bullLong Term Spectrum AssignmentbullSpectrum SharingbullRouting
Radio AccessNetwork RANG
AP
RN RN
UT
ARExternal IP
Network
bullSchedulingbullService Level Control (uplink)bullShort Term Spectrum AssignmentbullLink AdaptationbullPower Control
bullService Level Control (downlink)bullFlow Establishment amp ReleasebullBuffer ManagementbullTraffic Policing
bullModeRAN SelectionbullHandoverbullAdmission ControlbullLoad Control bullLong Term Spectrum AssignmentbullSpectrum SharingbullRouting
Radio AccessNetwork RANGRANG
AP
RN RN
AP
RN RN
UTUT
ARExternal IP
Network
Figure D4 WINNER RRM Architecture
It is envisaged that for the WINNER system with the multiple operating modes the hybrid approach would be suitable In particular in order to avoid extensive delays in the decision making and signalling overload a solution could be to bring some of the control plane functions closer to the BS physical nodes adding more complexity to the BS physical nodes and therefore increasing their cost However assuming different types of BSs for the wide-area and short-range scenarios we could restrict the extra functionality to the wide-area BSs (BSwa) In particular the ACS node would comprise mainly the RRM functions needed for the cooperation of the WINNER system with legacy RANs (handling user admission control to the WINNER system) and the coordination of the BSwa (if necessary) where a more comprehensive status of the system is required On the other hand the mode generic related control functions would be located at the BSwa (handling flow admission control) reducing the amount of signalling information required and allowing for faster decisions since the resources are controlled at a cell level For the BSwa to be able to make decisions on mode selection re-selection handover admission control congestion control and spectrum mapping between the BSsr that fall within its cell as well as between it and the BSsr several information are required to be transmitted periodically or upon request from the BSsr to the BSwa These include BSsr id and cell id current load max load power information handover statistics per RN and BSsr (successful drop rate etc) number of RNs attached to BSsr (in case of mobile RNs) CELLsr range (this can be change in case of mobile relays leavingjoining)Furthermore some of the mode specific RRM functions such as scheduling might reside at the RNs performing at different time scales as it is envisioned to have RNs with different functionality layers (layers 123)
D3 RRC functionalities
D31 Measurements and reports To choose the most suitable modeRAT a fundamental aspect is to assess the quality that different modesRATs will provide to the users This quality indication is basically obtained from measurements on the current and target networks RRM mechanisms in B3G systems will be able to use more metrics and information as inputs than the current RRM algorithms since information will be exchanged between networks and new metrics are becoming available
Current handover mechanisms are only based on received power either in cellular systems or in WLAN networks Congestion control algorithms in UMTS use mainly power measurements and service attributes to control access and load On the contrary in B3G systems various metrics coming from all the networks available can be used as inputs of any type of RRM algorithms
Some of these new metrics or information foreseen as useful to improve the RRM performance are listed below
bull Cell load free capacity
bull Location
WINNER D210 v10
Page 106 (180)
bull Velocity direction
bull Users environment (indoor outdoor etc)
bull Terminal capabilities
bull Handover statistics
Other information concerning the link connection includes Price of per bit in the link Security setup and encryption used in the link ARQ status of the link etc
Measurements can be performed either in the base stations or in the user terminal Usually RRM decisions are taken by the network therefore mechanisms must exist to report measurements from base station or terminal to the network The reporting may be periodic event-triggered or on demand
The WINNER system should at least provide to the RRM (orand cooperative RRM) entity
bull Signal strength measurements performed by either terminals or base stations on the WINNER RAN but also on legacy RANs when necessary
bull Transmitted power measurements performed by either UTs or BSs
bull Quality measurements
bull Cell load measurements (eg power measurements L2 buffer load indeed the exact definition of load for the WINNER system must be investigated and will depend on the chosen radio interface)
bull A beacon that terminals on other systems can listen to and measure eg in order to prepare for a handover to WINNER
The possibility for a terminal in a WINNER system to measure the received signal strength of base stationsbase stations of legacy systems should be foreseen when defining the WINNER system Alternatively the RRM entity in WINNER should have access to these measurements on legacy systems Moreover the possibility to exchange load information between WINNER and legacy systems should also be anticipated (eg exchanged between cooperative RRM entities)
WINNER inter-system handover should be consistent with the inter-system HO already defined in legacy systems In particular the inter-system handover procedure between UMTS and another RAT is already specified by the 3GPP Some of the specifications are applicable to any RAT while others are RAT specific (eg specified measurements on GSM are applicable to GSM only) Therefore the WINNER design must fulfil all the requirements that are mentioned in the 3GPP specifications for every RAT and the 3GPP will need to do some specifications dedicated to the WINNER system [WIND41] [WIND42] [WIND43]
D32 Other functions Feature discovery
Both the antenna configuration and relaying issues can be perceived jointly in context of the space-time coded cooperative transmission where virtual antenna arrays are created for the purposes of enhancing the overall WINNER system performance However the question arises how to configure the virtual antenna array and which space time code to select in order to meet the requested Quality of Service Answering this question renders it necessary to investigate the problem of efficient exploitation of the additional information about links provided by the routing protocol Since the target WINNER routing protocol is not established the Multi-Constrained Optimised Link State Routing protocol (MC-OLSR) candidate solution will be used during simulations This protocol which was proposed in [WIND31] and [WIND32] will be expanded with the cooperative relaying functionality which in turn was investigated in [WIND24] where the Adaptive approach to antenna selection and space-time coding was analysed
RRCRRM and cooperative transmission
RRM is connected with RNs assignment transmit power control etc Proper RNs assignment in for the purposes of cooperative relaying in WINNER is very important because it directly affects the transmission parameters and therefore the attainable QoS level When at least coarse channel parameters between the transmitting node and the relaying ones are known it is possible to create the virtual antenna array VAA in a more optimum way To this end the selected RRC functionalities were identified which along the flow of control information are presented in Figure D5
WINNER D210 v10
Page 107 (180)
RRC
Relay Routing Path Calculation
Channel Quality Measurements
Virtual Antenna Configuration
Space-Time Code Selection
QoS Requirements
Figure D5 RRC and cooperative relaying
Here the Radio Resource Control service exploits the Channel Quality Measurements and Relay Routing Path Calculation functionalities in order to perform the space-time coded cooperative relaying in an optimum way It is then of prime importance to identify
ndash how to efficiently exploit the routing information provided by the routing protocol (eg the MC-OLSR protocol)
ndash how to perform routing so that cooperative relaying could be efficiently exploited
ndash how to configure the virtual antenna arrays and which space time code to select so that the requested Quality of Service could be met
There is also a question on how the resource partitioning between BS and RNs should be performed In case of the MC-OLSR enhanced with cooperative relaying it is assumed the control is BS-centralised which means that resources are managed and assigned by BSs
WINNER D210 v10
Page 108 (180)
Appendix E Assessments Assumptions
E1 Overview This chapter summarises baseline simulations assumptions and parameters applied in link multi-link and system-level oriented simulations Four prioritised deployment scenarios A1 B1 C2 and D1 identified in [WIND72] are addressed Additionally the B3 scenario is considered for link level investigations For scenarios A1 B1 and B3 (collectively referred to as ldquoshort-rangerdquo scenarios) evaluations are performed using the TDD cellular system mode and for scenarios C2 and D1 evaluations are performed using the FDD cellular system mode A rough characterisation of these scenarios is given in Table E1 below
Table E1 Basis scenarios considered
Scenario identifier Deployment PHY
mode Mobility [kmh]
BS height
[m]
UT height
[m]
Traffic density
A1 In building
small office residential
TDD 100 MHz 0ndash5 2 1 high
B1 Hotspot
Typical urban micro cell
TDD 100 MHz
0ndash70 eg 10 (below RT21)
15 high
B3 Hotspot
Indoor TDD 100 MHz 0ndash5
C2 Metropolitan
Typical urban macro cell
FDD 2times20 MHz 0ndash70
eg 32 (above
RT) 15 medium
to high
D1 Rural
Rural Macro cell
FDD 2times20 MHz 0-200
eg 45 (above
RT) 15 low
It should be stressed that the selected assumptions models and parameters reflect a compromise taking into account the latest system design aspects the realisable simulator capabilities as well as the open issues to be addressed They only served as baseline assumption slightly different settings may have been used in the end Moreover not every detail is covered especially with respect to system level simulations in order to keep the simulator setup feasible for many partners
E2 Basic parameters for link level evaluations For performance evaluation of different link level parts (mainly modulation schemes channel estimation and synchronisation) the system parameters fixed in Table 21 have been used for simulation As channel models one ldquorepresentativerdquo example (ie a channel having a reasonable delay spread) has been selected for each the FDD and TDD case based on the tapped delay line models provided in [WIND54] The model C2 NLOS has been selected for simulations with the FDD system parameters while the B3 NLOS model was the baseline comparison case for the TDD system parameters Additionally the A1 NLOS model was used in some simulations as an example for a channel providing a high degree of spatial diversity (ie suitable for achieving high spectral efficiency when using spatial multiplexing techniques) For channel coding the memory 6 convolutional code was used as a baseline case (gains of around 2 dB are expected when using better codes for large block lenghts cf Appendix F2) More advanced coding schemes were used in Appendix F1 in order to demonstrate the potential performance of the coding within the WINNER physical and MAC layers For the (relative) performance assessment of different coding techniques simple BPSK transmission over an AWGN channel was used (without OFDM modulationdemodulation) as the relative merits of different coding techniques proved to be relatively independent of the channel and modulation technique [WIND23]
21 RT = rooftop
WINNER D210 v10
Page 109 (180)
E3 Basic parameters for multi-link and system level evaluations
E31 Mode specific parameters
FDD mode (used in wide area simulations) Parameter DL UL Centre frequency 50 GHz 42 GHz Bandwidthchannelisation 20 MHz paired ULDL Duplex scheme (T+F)DD Transmission technique OFDM
∆f=20 MHz512 = 390625 Hz rarr TN =256 micros fc=k∆f kisin[-208208] kne0 TG=32 micros rarr T=TN + TG =288 micros
a) single carrier (continuous) Pulse period T = 256 micros416 = 6154 ns pulse shaping square root raised cosine with roll-off β=0231 b) single carrier (block oriented) same pulse as in a) block length 416 symbols rarr TN = 256 micros guard length TG=32 micros
Number of sectors 3 1 Antenna configuration WA1
BS | A1 |
Antenna configuration WA2 (ULA)
BS | | | | | | | | (05λ)
A1 | A2 | | (05λ) A3 | | | | (05λ)
Antenna gain 15 dBi 0 dBi Frame length 6912 micros (=2 DL chunks) chunk size 8 subcarriers times 12 OFDM symbols unspecified overhead (parameter estimation signalling)
19 out of 96 resource elements of each chunk
unspecified
TDD mode (used inshort range simulations)
Parameter DL UL Centre frequency 50 GHz Bandwidthchannelisation 100 MHz Duplex scheme TDD Transmission technique OFDM
∆f=100 MHz2048 = 48828125 Hz rarr TN =2048 micros
fc=k∆f kisin[-832832] kne0 TG=128 micros
rarr T=TN + TG =2176 micros Number of sectors 1 1 Antenna configuration SA1
BS | A1 |
Antenna configuration SA2 (ULA)
BS | | | | | | | | (05λ)
A1 | A2 | | (05λ) A3 | | | | (05λ)
Antenna gain 8 dBi 0 dBi Frame length 6912 micros (3 DL chunks + 3 UL chunks + 2 times duplex guard time)
duplex guard time = 192 micros chunk size 16 subcarriers times 5 OFDM symbols virtual overhead for parameter estimation
15 out of 80 resource elements of each chunk
unspecified
WINNER D210 v10
Page 110 (180)
E32 Common to all modes
Parameter DL UL Coder convolutional coder Interleaver random bit interleaver Modulation formats BPSK QPSK 16-QAM 64-QAM Spreading codes Walsh-Hadamard (WH) WH (synchronous UL)
Gold (asynchronous UL) Medium access scheme frequency adapative scheduling rarr OFDMATDMA
frequency non adaptive scheduling rarr OFDMATDMAMC-CDMA Channel estimation at Rx perfect Synchronisation perfect channel measurement accuracy for adaptive processing
perfect
delay between CQI measurement and its application
1 Frame
Equalisation (if required) MMSE Demodulation ML based soft output demodulation
If equaliser is present apply ML criterion to equaliser output signal noise spectral density -174 dBmHz noise figure 7 dB (at MT) 5 dB (at BS) Resource assignment strategies
non-adaptive mode round robin adaptive mode score-based opportunistic scheduling
Link adaptation strategies
non-adaptive mode adaptive coding and modulation based on average CSI (across all sub-channels)
adaptive mode adaptive modulation and coding per chunk based on instantaneous CSI
(H)ARQ none power control no perfect azimuth pattern of antenna elements ]dB[25
7012min)(
2
⎥⎥⎦
⎤
⎢⎢⎣
⎡⎟⎠⎞
⎜⎝⎛minus=
θθA
θ3dB= 70o
omni directional
correlation of shadow fading between sectors
same site full ie use same value different site no
correlation of fast fading between sectors
same site use same bulk parameters but redraw delays AoAs AoDs hellip different site no
WINNER D210 v10
Page 111 (180)
E4 Scenario parameters Parameter A1 B1 C2 D1
channel modelling WINNER-I interim channel models see WP5 deliverables Average BS transmit power 1 W 4 W 20 W per sector
Average UT transmit power 200 mW
Cell radius R unspecified 1 km Cellular structure hexagonal grid see Figure E1 Number of cells to be simulated 19 three sector sites
frequency reuse distance
isolated cell only
unspecified
number of users variable parameter but constant for any simulation run and snapshot user distribution uniform within cell area uniform within 19-cell area user location update random drop of users in every snapshot
within each snapshot users virtually remain at fixed positions even in case of velocity |v| gt 0 kmh
Traffic model full queue assumption (holds for any user) Mobility model (only affects fast fading)
anglev sim U(02π) vx sim η(mσ 2) vy sim η(mσ 2) |v|= (vx
2+vy2)05
mobility model parameter
M1 m1= 1 kmh σ1= 16 kmh
M1 m1= 1 kmh σ1= 16 kmh M2 m2= 5 kmh σ2= 12 kmh
M1 m1= 1 kmh σ1= 16 kmh M2 m2= 25 kmh σ2= 15 kmh
M1 m1= 1 kmh σ1= 16 kmh M2 m2= 55 kmh σ2= 29 kmh
Distribution of user characteristics considering cases SA1WA1 (SISO)22
M1 100 A1 100
M1 80 M2 20 A1 100
M1 50 M2 50 A1 100
M1 40 M2 60 A1 100
Distribution of user characteristics considering cases SA2WA2 (MIMO)7
M1 100 A1 20 A2 40 A3 30
M1 80 M2 20 A1 20 A2 40 A3 30
M1 50 M2 50 A1 50 A2 30 A3 20
M1 40 M2 60 A1 50 A2 30 A3 20
Figure E1 Example sketch of cellular scenario with 19 three-sector sites
22 No correlation between mobility transmit power and antenna parameters is taken into account so far
WINNER D210 v10
Page 112 (180)
Appendix F Link-Level Assessments The merits of different coding modulation channel estimation and link adaptation techniques have already been assessed in a number of previous WINNER deliverables most notably [WIND22 WIND23WIND24WIND26WIND27] Therefore this chapter contains mainly assessment results necessary to justify the WINNER system design decisions reported in Chapter 2 of this report Thus Appendix F2 presents a detailed comparison of the complexity and performance of Duo-Binary Turbo Codes and Block-LDPC codes as these have been identified as the most promising FEC candidate technologies More detail on the assessment methodology and other coding techniques (CC standard PCCC and PEG-based LDPCC) can be found in [WIND23] Appendices F3 and F4 provide detail on the performance of different channel estimation and synchronisation techniques to back up the results from Appendix B4 in terms of the amount of pilots required to achieve a CSI of sufficient quality at the receiver Finally in Appendix F5 results for the performance of different bit-and power-loading algorithms are presented Another purpose of this chapter is to present results that give insight into the overall performance of the WINNER physical layer ndash Appendix F1 serves that purpose
F1 Link layer performance Throughput In order to assess whether the performance of the WINNER physical layer is sufficient to live up to the requirements stated in Section 11 and in order to provide first results that allow for an estimation of the SNRs required to achieve different spectral efficiencies the performance of a single user CP-OFDM system using advanved coding (3GPP Turbo Code 8 iterations maxLogMAP decoding) has been evaluated This setup can be considered as an example of a single user served in the non-frequency-adaptive mode (where MC-CDMA with spreading factor 1 reduces to CP-OFDM) Note that the protocol overhead (super-frame structure in-band signalling pilot subcarriers) as well as SNR penalties due to imperfect channel estimation synchronisation are not included in this assessment The overhead due to guard bands on the other hand is included The overall throughput of a single link will hence be slightly lower than the figures given in the following plots and the required SNR will be slightly higher The activity factor for FDD is not included in the throughput figures an appropriate scaling must be included for all cases where the activity factor is smaller than 1
Table F1 Summary of parameters for WINNER channel models
Scenario identifier Deployment PHY mode
UT speed [kmh]
Delay Spread [ns]
Composite angular
Spread at BSMT
[degrees]
A1 In building
small office residential
TDD 100 MHz 3 24 232391
B1 Hotspot
Typical urban micro cell
TDD 100 MHz 3 90 124364
B3 Hotspot
Indoor TDD 100 MHz 3 30 3187
C2 Metropolitan
Typical urban macro cell
FDD 2x20 MHz 70 310 853
D1 Rural
Rural Macro cell
FDD 2x20 MHz 70 28 224179
Table F1 summarises some relevant parameters for the used WINNER tapped delay line models Scenario A1 and B3 provide roughly the same amount of frequency diversity However the angular spread at the BS is very small for the B3 and C2 models ndash in contrast to most other results presented in this chapter the scenario A1 has therefore been selected for TDD mode evaluations Although both wide area cases (metropolitan and rural) have been simulated the focus in the present section is on the
WINNER D210 v10
Page 113 (180)
metropolitan area where the larger traffic demands can be expected In this scenario the high correlation between BS antennas is expected to significantly affect the gains achievable by using spatial multiplexing techniques as is confirmed by the results in Figure F3
Figure F1 below shows the performance of a SISO system with the parameters from Table 21 for FDD mode operation (20 MHz bandwidth the used channel model is the clustered delay line model C2 NLOS from [WIND54]) A SNR beyond 20 dB is required to achieve a spectral efficiency of 3 bitsHz Taking a duplex activity factor of 05 and an overhead of 20 into account the spectral efficiency design target of 05 bitsHzlink in the downlink (see 70 kmh in Appendix A13) corresponds to about 25 Mbits which with dual-antenna terminals as baseline (roughly 3 dB gain in this scenario) and assuming a loss of 1 dB from non-ideal channel estimation requires a SINR of around 9 dB A simple link budget (using pathloss models and other parameters listed in Appendix E23) based on this SINR requirement gives a maximum cell range very close to 1000 m without indoor-to-outdoor coverage This indicates that the above-mentioned cell-average of 05 bitssHzlink with single user should be possible to obtain with some margin even without relays
Turning to the rural area scenario simulations (not shown) together with a link budget24 show that the spectral efficiency target of 05 bitsHzlink at 70 kmh can be reached with good margin (up to a cell range of well above 3 km) For the uplink the targets are somewhat tougher but should still be reachable (in particular with relays)
-5 0 5 10 15 20 250
10
20
30
40
50
60
70
SNR [dB]
Thro
ughp
ut [M
Bit
s]
16-QAMRc = 12
BPSKRc = 12
4-QAMRc = 12
64-QAMRc = 12
64-QAMRc = 34
Figure F1 Throughput of CP-OFDM-based FDD mode system (20 MHz SISO C2 NLOS)
Figure F2 depicts the TDD mode case (100 MHz bandwidth again for a SISO setup) ndash data rates are evidently higher while spectral efficiency figures are comparable as could be expected from the system definition in Table 21 The channel model used is A1 NLOS from [WIND54] Achieving the target spectral efficiency of 4 bitsHz (cf Appendix A14) with half-duplex and 20 overhead corresponding to about 1000 Mbits seems to be difficult without the use of some form of spatial multiplexingspatial diversity techniques to be further discussed in the following
23 Noise bandwidth 16 MHz noise figure 7 dB on DL (5 dB on UL) transmit antenna gain 15 dB output power 20
W Based on the shadow fading standard deviation of 57 dB a shadow fading margin of 35 dB was assumed by scaling the results in [SGF95]
24 Here the shadow fading standard deviation is 8 dB and a margin of 5 dB was used cf [SGF95]
WINNER D210 v10
Page 114 (180)
-5 0 5 10 15 20 250
50
100
150
200
250
300
350
SNR [dB]
Thro
ughp
ut [M
Bit
s]
16-QAMRc = 12
BPSKRc = 12
256-QAMRc = 12
4-QAMRc = 12
64-QAMRc = 12
Figure F2 Throughput of CP-OFDM-based TDD mode system (100 MHz SISO A1 NLOS)
Figure F3 and Figure F4 show the performance for the spatial multiplexing case for both FDD and TDD mode operation For the FDD system a 2x2 MIMO setup was selected while a 4x4 MIMO setup was used for the TDD case where more spatial diversity is expected to be available (cf the higher angular spread at the base station in Table F1)
0 5 10 15 20 25 300
10
20
30
40
50
60
70
80
90
SNR [dB]
Thro
ughp
ut [M
Bit
s]
16-QAMlinear16-QAMmlBPSKlinearBPSKml4-QAMlinear4-QAMml64-QAMlinear64-QAMml
Figure F3 Throughput of CP-OFDM-based FDD mode system (20 MHz 2x2 MIMO C2 NLOS)
WINNER D210 v10
Page 115 (180)
For both setups the performance was evaluated when using a simple linear MMSE equaliser and also when using a high performance equaliser (ML detection where possible otherwise Sphere Detection with a sufficient number of full length candidates) Taking the results for the latter receiver architecture and comparing then the MIMO with the SISO case allows for identifying the performance losses due to antenna correlation (the throughput would roughly scale with the number of transmitreceive antennas in a completely uncorrelated scenario) Comparing the results of the linear and the MLSphere detector allows for identifying how much gains can be achieved by using advanced receiver architectures as compared to the simplest one As is evident a SNR in excess of 30 dB would be required to run the maximum modulationcoding schemes investigated for the SISO case in Figure F1 and Figure F2 Consequently the maximum spectral efficiency does not scale fully with the number of antennas which can be attributed to the limited amount of spatial diversity A spectral efficiency of around 4 bitsHz is achieved at SNR=25 dB for the 2x2 MIMO FDD case when using a high performance detector The gains at lower SNRs which are expected in multi-cell environments are substantially lower More specifically at a SNR of 4 dB the spectral efficiency is not increased with respect to the SISO case
For the 4x4 MIMO TDD case a spectral efficiency of 12 bitsHz is achieved at SNR=30 dB At a bandwidth of 100 MHz this would with an activity factor close to 1 allow achieving the target peak data rate of 1 Gpbs cited in Section 11 With half-duplex and 20 overhead the design target spectral efficiency of 4 bitsHz (cf Appendix A14) can also be achieved at about 30 dB
-5 0 5 10 15 20 25 300
200
400
600
800
1000
1200
SNR [dB]
Thro
ughp
ut [M
Bit
s]
16-QAMlinear16-QAMsphereBPSKlinearBPSKml256-QAMlinear4-QAMlinear4-QAMml64-QAMlinear64-QAMsphere
Figure F4 Throughput of CP-OFDM-based TDD mode system (100 MHz 4x4 MIMO A1 NLOS)
WINNER D210 v10
Page 116 (180)
F2 Forward error correction In this part the two main channel coding candidates Duo-Binary Turbo-Codes and Quasi-Cyclic Block-LDPCC are investigated their performance compared and finally first results on the complexityperformance trade-off are given In order to cover a wide range of applications 5 different block lengths have been selected 576 1152 1728 2304 and 4308 coded bits together with 3 different code rates Rc = 12 23 and 34 The assessment in this section follows the framework from [WIND23] For details on cycle count and energy consumption figures please refer to [WIND23] The performance comparison is done for BSPK transmission over the AWGN channel The (relative) assessment however is expected to be similar for a wide range of channels as was confirmed by the assessment done in [WIND23] for different types of Rayleigh fading channels
F21 Performance comparison The performance comparison (cf Figure F5) underlines the fact that the selection of an appropriate coding technique depends crucially on the target block length For code rate 05 DBTC outperform BLDPCC for block lengths up to 1728 (02 dB gain over BLDPCC for N = 576) Then LDPCC start progressively to outperform DBTC (01 dB better for N = 4308) In general the performance loss by going from large to small block sizes is lower for DBTC than for BLDPCC The threshold (in terms of block length) that separates these two regimes however depends on the code rate When increasing the code rate to Rc = 34 a block length of 1152 is sufficient for the BDLPCC to achieve the same performance as the DBTC and the difference observed for N = 576 is very small (cf Figure F7)
08 1 12 14 16 18 2 22 2410-3
10-2
10-1
100
EbN0 [dB]
BLE
R
DBTC vs QC-BLDPCC BPSK Rc=12 AWGN
BLDPC N=576BLDPC N=1152BLDPC N=1728BLDPC N=2304BLDPC N=4308DBTC N=576DBTC N=1152DBTC N=1728DBTC N=2304DBTC N=4308
DBTC Max-Log-MAPBLDPC LLR-BP 50 Iter
Figure F5 Performance comparison between DBTC and QC-BLDPCC Rc=12
F22 Complexity-performance trade-off Relying on the computational complexity assessment introduced in [WIND23] and [3GPP-WG142] together with the relative cost of operations given by Table 51 from [WIND23] the energy consumption and cycle counts were computed for both DBTC and BLDPCC For the sake of clarity we restricted the presentation of results to two extreme block length cases N = 2304 and N = 576 respectively In the case of DBTC only the Max-Log-MAP decoder with scaling of extrinsic information (factor 05 in the first
02dB 01dB01d
WINNER D210 v10
Page 117 (180)
075 in the 2nd to 7th and 1 in the last iteration) is used as it has been proven to give performance similar to Log-MAP decoding at attractive reduction in complexity Similarly the MinSum algorithm (MSA) provides the best trade-off for LDPC decoding as illustrated by the results in Appendix F24 Additionally alternative schedulings (shuffled decoding) should be used as they lead to faster convergence of the decoding algorithm and (same performance at roughly half the iterations cf results in Appendix F25)
In the sequel we tried to keep similar notations already introduced into [WIND23] Due to comparison between different packet lengths minor modifications have been proposed Packet length of N = 2304 bits are represented by purple coloured markers and those of N = 576 bits by blue coloured markers Concerning DBTC the triplet ldquo(mx iy lgMPz)rdquo indicates the memory size lsquoxrsquo of constituent encoders the number of maximum iterations lsquoyrsquo and maxLogMAP (lsquoz=0rsquo) or logMAP (lsquoz=1rsquo) decoding algorithm respectively In the present investigation only the maxLogMAP decoding algorithm will be considered for Duo-Binary Turbo-Code and its marker will be a diamond Due to simple operations only the edge colour will be green (energy cost=cycle count) The marker face colour represents the considered packet length In the case of block LDPC codes we have to differentiate also the number of iterations A circle marker denotes the maximum complexity (maximum number of iterations 20 in the considered setup) A triangle marker is used for the average complexity (average number of iterations) Energy and Cycles are distinguished then by the use of non-filled or filled marker respectively
15 16 17 18 19 2 21 220
200
400
600
800
1000
1200
1400
1600
1800
BLDPCC (MSAmax=20)N=576
EbN0 [dB] Required for BLER 1
Rela
tive
Cycl
eE
nerg
y
BLDPCC (MSAmax=20)N=2304
BLDPCC (MSAmax=20)N=2304
BLDPCC (MSAavg)N=2304
BLDPCC (MSAavg)N=2304
DBTC (m3i8lgMP0)N=2304
DBTC (m3i8lgMP0)N=576
DBTC Vs BLDPCC N=576 N=2304 Rc=05 AWGN
BLDPCC (MSAavg)N=576
BLDPCC (MSAmax=20)N=576
BLDPCC (MSAavg)N=576
Figure F6 Complexity-performance trade-off for QC-LDPCC and DBTC Rc=12
For the case of Rc=12 depicted in Figure F6 above Duo-Binary Turbo-Codes offer a better complexity-performance trade-off than block LDPC codes with low block size (N = 576) as they perform better at only slightly more energy consumption (wrt the maximum iteration case for BLDPCC) However for a higher block length (N = 2304) BLDPCC become more suitable since their energy consumption saving is achieved at the expense of only minor performance degradation These two trends are reinforced throughout the remaining results cf Figure F7 below Indeed the higher the coding rate the less energycycles are required by BLDPCC (provided that the high code rate is achieved by using a code of a different rate rather than puncturing the rate 12 code) It might be worth mentioning that DBTC still outperform BLDPCC for lower block length but their higher energy consumption in the present case of 8 internal decoder iterations seems to be the price to be paid for such performance
WINNER D210 v10
Page 118 (180)
26 27 28 29 3 31 32 33 34 350
200
400
600
800
1000
1200
1400
1600
1800
EbN0 [dB] Required for BLER 1
Rela
tive
Cycl
eE
nerg
y
DBTC Vs BLDPCC N=576 N=2304 Rc=075 AWGN
DBTC (m3i8lgMP0)N=2304
DBTC (m3i8lgMP0)N=576
BLDPCC (MSAmax=20)N=2304
BLDPCC (MSAmax=20)N=2304
BLDPCC (MSAmax=20)N=576
BLDPCC (MSAmax=20)N=576
BLDPCC (MSAavg)N=2304
BLDPCC (MSAavg) N=2304
BLDPCC (MSAavg) N=576
BLDPCC (MSAavg) N=576
Figure F7 Complexity-performance trade-off for QC-LDPCC and DBTC Rc=34
This complexityperformance trade-off is a necessary step towards fair comparison of these two main channel coding candidates DBTC and BLDPCC Although these results are quite informative they are not yet sufficient for any further technological decision Indeed the number of gates and the memory size requirements together with performance robustness to quantisation (fixed point simulations) still have to be investigated still Based on current assessment and know-how these two channel coding techniques look more like complementary than concurrent solutions (wrt block length) The next phase of WINNER (Phase II) should give additional answers and lead to in-depth understanding and comparison of both technologies by focusing more and more onto architecture and implementation aspect
F23 Performance comparison of rate compatible punctured codes The performance of rate compatible punctured standard PCCCs and LDPCCs can be considered to be equal LDPCC show better performance at high SNR which however is less relevant for HARQ as negligible number of retransmissions are needed in this SNR regime Figure F8 shows exemplary the performance of constructed BLDPCC punctured BLDPCC and DBTC for two block lengths (the mother code rate of the punctured codes was Rc = 12) Note that the average number of iterations of punctured LDPCC is about twice as large as that of the constructed LDPCC
F24 BLDPCC performance comparison of major decoding algorithms In recent years a lot of different LDPC decoding algorithms have been proposed in literature Our target in this part is thus to compare the most important ones ndash Belief Propagation [Gal63] A-Min [JVS+03] Lambda-Min [GBD03] Min-Sum and its corrected version [CF02] To do so we have assessed their performance for different block lengths and code rates As a summary of the performance-complexity trade-off Figure F9 depicts the decoding complexity over the bit SNR required to achieve BLER 1 for the example code rate 05 and two different code block lengths (again purple for N=2304 and blue for N=576) The advantage of the MinSum can be emphasised quite clearly as it leads to good performance at low cost expense
WINNER D210 v10
Page 119 (180)
0 05 1 15 2 25 3 3510-3
10-2
10-1
100Puncturing Block LDPC SEUK exact BP decoder max 50 iterations
EbN
0
BLE
R
punctured BLDPC R=066 N=1728 constructed BLDPC R=066 N=1728DBTC R=066 N=1728punctured BLDPC R=075 N=2304constructed BLDPC N=2304DBTC R=075 N=2304
Figure F8 Rate-compatible puncturing of block LDPC
14 16 18 2 22 24 260
1000
2000
3000
4000
5000
6000
7000
8000
9000
10000
BPA
BPA
EbN0 [dB] required for BLER 1
Rel
ativ
e C
ycle
Ene
rgy
DBTC vs BLDPCC N=576 N=2304 Rc=05 AWGN
BPA
BPA
MSAMSA
AMA
AMA
AMA
AMA
LMA 2
LMA 2
LMA 2
LMA 2
LMA 3
LMA 3
LMA 3
LMA 3
Figure F9 Complexity-performance trade-off for different LDPC decoding algorithms Rc=12
F25 Performance when using different decoding schedules Figure F10 illustrates that the same performance can be achieved by using either a maximum of 50 iterations and flooding decoding or a maximum of 20 iterations and shuffled decoding (cf Appendix B24)
WINNER D210 v10
Page 120 (180)
0 05 1 15 2 25 3 35 410-3
10-2
10-1
100Horizontal shuffling vs flooding schedule Block LDPC Z=12 N=576
EbN0 [dB]
BLE
R
flooding R=05shuffling R=05flooding R=066shuffling R=066flooding R=075shuffling R=075
05 1 15 2 25 3 3510-3
10-2
10-1
100Horizontal shuffling vs flooding schedule Block LDPC Z=48 N=2304
EbN0 [dB]
BLE
R
flooding R=05shuffling R=05flooding R=066shuffling R=066flooding R=075shuffling R=075
Figure F10 Scheduling of BPA decoder for block LDPC of lengths N=576 N=2304 Horizontal (group 48) shuffling with max 20 iterations vs flooding schedule with max 50
iterations
F26 Base model matrices for BLDPC codes The BLDPCC investigated in this document are relying on the following base model matrices in conjunction with the appropriate expansion process They constitute the current state-of-the-art when it comes to (LDPC) code construction in the WINNER project and will be the starting point of investigations in WINNER Phase II The three base model matrices in Figure F11 - Figure F13 correspond to the three code rates Rc=12 Rc=23 and Rc=34 respectively
Figure F11 (24 48) Base model matrix Rc=12
WINNER D210 v10
Page 121 (180)
Figure F12 (16 48) Base model matrix Rc=23
Figure F13 (12 48) Base model matrix Rc=34
WINNER D210 v10
Page 122 (180)
F3 Channel estimation
F31 Uplink single carrier As mentioned in Appendix B42 time domain or two types of frequency domain pilots are options for channel estimation for uplink single carrier In comparative simulations the C2 urban macro channel was used with parameters from Table 21 for frequency domain generation of a single carrier signal A classical Doppler spectrum was assumed to generate channel realisations with UT speed of 50 kmh The coding used was a rate 12 convolutional code with memory 6 Random bit interleaving was also included In the receiver a linear MMSE symbol based equaliser and an iterative soft decision feedback equaliser [TB04] were tested The soft Viterbi algorithm was used in the decoder The time domain multiplexed pilot signal was a 64-symbol Chu sequence which has a uniform envelope and power spectrum The FET frequency domain pilots were formed from the FFT of a 52-point Chu sequence the FFT components were mapped to the pilot grid every 8th frequency of every 5th block This grid was found to be more effective for the SC system than the FDD grid of Figure B6 used for the OFDM-PACE system and had approximately the same overhead For FDSP since no extra subcarriers are used for pilots a more liberal grid was used with pilot subcarrier spacing of 8 and pilot block spacing of 2 For blocks with pilots least square (LS) estimator was used for lsquorawrsquo channel estimation followed by an FFT interpolator in frequency domain Linear LS line fitting was used for channel estimates for blocks without pilots25 This approach is suboptimal but relatively simple Simulation results were obtained by averaging the block error rate (BLER) over 10000 frames There were 12 blocks (and thus 12 correlated channel realisations) per half-frame (slot)
The iterative soft decision feedback equaliser (SDFE) is a simplified version of a frequency domain turbo equaliser [TB04] Its iterative process does not include decoding or channel estimation One or two iterations are generally sufficient to yield a significant performance improvement over linear equalisation on severely dispersive channels It is more effective than a conventional hard decision DFE and avoids its error propagation problem at the expense of slightly higher complexity SDFE brings the performance of the FDSP technique closer to that of the linearly-equalised FET and TDM techniques at the expense of some extra receiver complexity
Other considerations also influence the choice of a channel estimation pilot scheme for serial modulation The prime advantage of serial modulation over OFDM is its lower PAPR and hence lower transmit power backoff requirement The PAPR is not affected by the addition of a Chu sequence time domain pilot signal but the addition of frequency domain pilots amounts to the transmission of several parallel waveforms and thus increases the PAPR somewhat Furthermore it can be shown that the PAPR is also increased in the FET approach due to the rearrangement and expansion of the signal spectrum to accommodate the added pilots Measurements of the power backoff required to confine the transmitted spectrum to a given spectral mask indicate that the backoff is still less than that of a comparable OFDM signal but the margin is slightly reduced for FDSP and more so for FET Another consideration is overhead the FET and TDM techniques both incur higher overhead than the FDSP technique
Figure F14 shows block error rate performance curves for TDM FET and FDSP pilot techniques as well as for the case of no pilots and perfect channel state information Figure F14 (a) shows the results for linear equalisation and Figure F14 (b) shows results for the soft iterative DFE with two iterations The 1rsquos and zeroes in the legend indicate which blocks have pilots and P indicates the number of pilots per block eg [100000000001] indicates pilots in every 11th block and P=104 indicates 104 pilots in a set of 416 used subcarriers ndash equivalent to the pilot grid scheme of Figure B6
25 For MS speed lt=70 kmh we assume the channel varies linearly within one frame
WINNER D210 v10
Page 123 (180)
0 2 4 6 8 10 12 1410-3
10-2
10-1
100
SNR [dB]
BLE
R
SC Rc = 12 K=7 Scenario C2 v=50kmh LE
TDM[100000000001] P=64TDM[101010101001] P=64FET[100000000001] P=52FET[100000000001] P=104FET[100001000010] P=52FET[101010101001] P=52FDSP[100000000001] P=52FDSP[101010101001] P=52Known CSI with LE
0 2 4 6 8 10 12 1410-3
10-2
10-1
100
SNR[dB]
BLE
R
SC Rc=12 K=7 Scenario C2 v=50kmh soft DFE
TDM[100000000001] P=64TDM[101010101001] P=64FET[100000000001] P=52FET[100000000001] P=104FET[100001000010] P=52FET[101010101001] P=52FDSP[100000000001] P=52FDSP[101010101001] P=52Known CSI with LEKnown CSI with Soft DFE
(a) (b)
Figure F14 Block error rates for linear (a) and soft DFE equalisers (b)
Table F2 summarises the SNR degradations relative to known channel for OFDM from Figure F15 and also the total overhead The total overhead includes pilots cyclic prefix and unused subcarriers in the FFT blocks The extra backoff is with respect to the power backoff required for the OFDM system The power backoff in each case was determined so to accommodate the transmitted spectrum emerging from a power amplifier modelled by a Rapp model [Rap91] with parameter p=2 The table also includes the OFDM-PACE and the iterative channel estimation OFDM-ICE scheme Iterative channel estimation schemes could also be applied for single carrier but were not evaluated here
WINNER D210 v10
Page 124 (180)
Table F2 Comparison of performance pilot overhead and required power backoff for three different pilot schemes for linear equalisation and soft decision feedback equalisation and for
OFDM Channel is C2 with wide area FDD signal parameters
Pilot schemes SNR degradation
BLER=10-2 relative to SNR=86 dB for OFDM with perfect CSI (dB)
Total overhead26 ()
Power backoff to satisfy spectral mask relative to OFDM (dB)
Power penalty relative to OFDM with perfect CSI (dB) and no pilots
(col 2+col 4)
LE27 SDFE28 LE SDFE
SC-TDM29 37 27 285 -30 07 -03
SC-FET30 36 24 296 -11 25 13
SC-FDSP31 39 29 278 -15 24 14
OFDM - PACE32 17 294 0 17
OFDM - ICE(8)33 0 294 0 0
The calculated overheads which are a direct measure of modulation inefficiency for the various schemes are similar Most of the overhead is contributed by cyclic prefix and unused subcarriers rather than by pilots The tablersquos last column shows the power penalty due to the combination of SNR degradation and required transmitter power backoff for a given power amplifier We see that single carrier with time division pilots give the least power penalty The single carrier frequency domain pilots and OFDM schemes are about 1 to 2 dB worse (due to their increased backoff requirements) The single carrier frequency domain pilot schemes have roughly the same power penalties as those of OFDM-PACE when the receiver uses the soft iterative DFE and would likely have similar penalties as OFDM-ICE if iterative channel estimation were added The major power backoff advantage of single carrier is best realised when time domain pilots are used for channel estimation
F32 Pilot-aided and iterative channel estimation for OFDM In this section pilot-aided (PACE) and iterative channel estimation (ICE) is evaluated for non-adaptive OFDM transmission in both FDD and TDD mode [WIND21 WIND23] The pilot-aided technique relies
26 Total overhead =
(1 )CP pilot GI CP GIp p
FFT CP pilot t FFT CP
N N N N NN N N N N
α α+ + +
sdot + minus+ + +
Where NCP cyclic prefix length=64 Npilot number of pilot symbols per block=52 64 or 104 NGI number of unused subcarriers in each FFT block=96 NFFT FFT block length=512 Npilott number of time domain pilot symbols (if any)=0 or 128 αp fraction of blocks with overhead-causing pilots=111
27 Linear frequency domain equaliser 28 Soft iterative decision feedback equaliser with 2 iterations 29 Single carrier with 64-symbol time domain-multiplexed pilot sequences Pilot sequence inserted every 11th block 30 Single carrier with frequency domain pilots inserted every 8th frequency in every 5th block 31 Single carrier with frequency domain pilots replacing data at every 8th frequency in every second block 32 OFDM with frequency domain pilots inserted every 4th frequency in every 11th block Results from Figure F15 33 Iterative channel estimation using 2 turbo iterations
WINNER D210 v10
Page 125 (180)
on common pilots proposed in Appendix B42 scattered over the whole available bandwidth or solely from dedicated pilots of one chunk
The pilot grid used for simulations is in line with the general pilot grid pattern suggested in Appendix B42 For Wiener filtering a robust filter design is selected for each mode according to the specifications of the ldquomismatched Wiener interpolation filter (WIF) in Appendix F33 While the actual velocity for the typical urban macro channel model C2 is set to 50 kmh a UT velocity of 100 kmh was assumed to generate the filter coefficients in time direction For the correlation in frequency direction a mismatched filter assuming a maximum delay of the channel τmax equal to the CP duration is used
For the case of QPSK modulation we consider channel estimation with common pilots using the full bandwidth and with dedicated pilots for chunk-based channel estimation The allocation of chunks to users is performed in a round-robin manner In the numerical simulations the channel encoder is a memory 6 CC with generator polynomials (133171) in octal form At the base station each data stream corresponding to a given user is iteratively decoded Figure F15 shows the BLER performance achieved with PACE or ICE respectively in the TDD and the FDD mode when channel estimation is carried out at the chunk level or using the full available bandwidth The results are summarised in Table F3 For ICE with common pilots no performance loss relative to perfect channel knowledge is observed For chunk based channel estimation with dedicated pilots ICE turns out to be particularly effective Generally the performance loss relative to perfect channel knowledge is greater in the FDD mode In this transmission scenario the user mobility and a higher frequency selectivity of the channel render channel estimation more difficult than for the TDD case
Table F3 SNR degradation of several channel estimation techniques with respect to the case of perfect channel knowledge at the receiver
Transmission mode SNR Degradation BLER = 10-2
Channel model
mobility Chunk-based -
PACE Chunk-based -
ICE Full BW -
PACE Full BW ndash
ICE
TDD B3 no mobility 28 dB 09 dB 12 dB 0 dB
FDD C2 100 kmh 34 dB 11 dB 17 dB 0 dB
0 2 4 6 8 10 12 1410-3
10-2
10-1
100
SNR [dB]
BLE
R
Perfect CSIChunk-based - PACEChunk-based - ICE 3 iterFull BW - PACEFull BW - ICE 2 iter
0 2 4 6 8 10 12 1410-3
10-2
10-1
100
SNR [dB]
BLE
R
Perfect CSIChunk-based - PACEChunk-based - ICE 3 iterFull BW - PACEFull BW - ICE 2 iter
Figure F15 BLER performance for PACE or ICE at the chunk level or using the full data
bandwidth with QPSK modulation Left SISO TDD mode channel B3 NLOS no mobility right SISO FDD mode channel C2 NLOS UT velocity 50 kmh
Figure F16 depicts the BLER performance achieved with PACE or ICE with higher-order modulation alphabets (16-64-QAM) Apart the parameters for common pilots using the full bandwidth from the previous figures apply For both 16 and 64-QAM ICE approaches the performance of a receiver with perfect channel knowledge For 16-QAM the SNR loss with PACE at BLER = 10-2 varies from 13 dB to 17 dB respectively for the TDD and the FDD mode With 64-QAM the performance degradation caused by channel estimation errors induced by PACE ranges from 12 dB in the TDD mode to 22 dB in the FD mode The SNR degradation for PACE remains almost constant over the range of BLER considered for the evaluation of the channel estimation performance
WINNER D210 v10
Page 126 (180)
0 5 10 15 2010-3
10-2
10-1
100
SNR [dB]
BLE
R
SR - Perfect CSISR - PACESR - ICE 2 iterWA - Perfect CSIWA - PACEWA - ICE 2 iter
5 10 15 20 25 3010-3
10-2
10-1
100
SNR [dB]
BLE
R
SO - Perfect CSISO - PACESO - ICE 2 iterWA - Perfect CSIWA - PACEWA - ICE 2 iter
Figure F16 BLER performance of PACE and ICE after 2 turbo iterations with 16-QAM modulation (left) and 64-QAM modulation (right) for the short-range (SR) TDD mode and the
wide-area (WA) FDD mode
F33 Design of the channel estimation unit For pilot aided channel estimation (PACE) two cascaded FIR interpolation filters are used one operating in frequency direction for interpolation over subcarriers of one OFDM symbol and the other operating in time for interpolation over OFDM symbols of a certain subcarrier as described in [WIND21] section 621 The performance of the interpolation filter depends on the amount of knowledge of the channel statistics these are
bull A Wiener interpolation filter (WIF) which is perfectly matched to the channel statistics The power delay profile (PDP) and the Doppler power spectrum (DPS) are assumed to be perfectly known
bull A WIF with ldquomatched pass-bandrdquo Knowledge about the maximum delay of the channel
maxτ and the maximum Doppler frequency maxDf are assumed However within [0 maxτ ] and [ maxDfminus maxDf ] the PDP and DPS are assumed to be unknown and uniformly distributed For the results the WINNER B3 and C2 channel models were used for the TDD and FDD mode respectively
bull A mismatched WIF where the maximum channel delay is assumed to be equal to the CP duration and the maximum Doppler frequency is set to the maximum value of expected mobile velocities For the TDD mode pedestrian velocities of 10 kmh while for the FDD mode velocities up to 100 kmh are assumed corresponding to a normalised Doppler frequency of
4max 10 minus=Df and maxDf =0013 respectively
In all cases perfect knowledge of the SINR at the receiver was assumed as it is expected that this information is needed also by other parts of the WINNER system
WINNER D210 v10
Page 127 (180)
0 10 20 30 40-5
0
5
10
15
20
SNR [dB]
Est
imat
or g
ain
G [d
B]
mismatched WIF γw=40 dB
mismatched WIFmatched pass-band WIFperfectly matched WIFMMSE Mf=16 Mt=5
ICEno feedback errors (16x5)
common pilots (16x1)PACE
PACEdedicated pilots (2x1)
Figure F17 Estimator gain vs SNR for dedicated and common pilots of various channel estimation techniques Also shown is the estimator gain in case all symbols per chunk can be used as pilots
which can be viewed as a lower bound for ICE if decision feedback errors are negligible
For certain MIMO techniques utilizing short term channel knowledge at the transmitter the degradation due to channel estimation errors is very severe (see Appendix B42) There estimator gains in the range of 13 to 17 dB are required The estimator gain is a measure for the quality of the channel estimate and is defined as 1(MSESNR) Figure F17 shows the estimator gains for dedicated and common pilots of the three considered channel estimation techniques PACE with dedicated pilots cannot achieve the required gains even for a perfectly matched filter If all symbols within a chunk can be utilised as pilots estimator gains exceeding 13 dB are possible This may be achieved by ICE in case decision feedback errors are negligible a realistic assumptions in the high SNR regime
0 10 20 30 40-15
-10
-5
0
5
10
SNR [dB]
Est
imat
or g
ain
G [d
B]
PACE dedicated pilots (2x1)
Sb = 0dB
Sb = 3dB
Sb = 6dB
Sb = 10dB
mismatched WIF
matched passband WIF
Figure F18 Estimator gain vs SNR for dedicated pilots for various pilot boosts
Unfortunately even with excessive pilot boosts the estimator gains for dedicated pilots are not sufficient as shown in Figure F18 So some post processing of the PACE channel estimates appears necessary
F34 Unbiased channel interpolation Unbiased interpolation is used in the bootstrap phase of the communication It is based on the relation between the delay and frequency-domain channel coefficients in OFDM systems (see [JFH+05]) Solutions are needed for full-spectrum (down-link) and at chunk level for up-link and dedicated pilots Here we report on the full-spectrum approach while chunk-level concepts are still under development
It is assumed that all subcarriers can be used for pilot or data transmission and that a sparse regular pilot grid is used Figure F19 (left) shows the reconstructed frequency response using a pilot spacing of 16 subcarriers in the short-range scenario (SNR = 20 dB) If the channel delays approach the CP length this is
WINNER D210 v10
Page 128 (180)
the theoretical maximum pilot spacing according to the sampling theorem Figure F19 (right) shows the estimator gain achieved with linear unbiased interpolation It depends on both SNR and delay spread (measured in taps 1 tap = 10 ns) The lower the SNR and the smaller the delay spread are the less taps are detected and hence the more noisy taps can be removed
Figure F19 Left Results for unbiased interpolation over the full spectrum (blue true channel red channel with noise open dots estimates on sparse pilot grid green interpolated frequency
response) Right Estimator gain with noise reduction in time domain
F35 Channel estimation using the guard interval mdash pseudo-random-postfix OFDM PRP-OFDM simulations were performed for the FDD parameter set presented in Table 21 Channel propagation conditions are used as defined in scenario C2 NLOS PRP-OFDM requires a significant number of OFDM symbols per frame in order to provide high SNR CIR estimates Since the parameter set defines a relatively short frame of 12 OFDM symbols only the simulation results focus on QPSK constellations PRP-OFDM will be shown to enable the system to work efficiently in a high mobility context (up to 144 kmh is considered here) if QPSK constellations are applied Due to the short frame length a significant error floor can be observed for 16-QAM transmission (which requires good channel estimates) which is improved (but not completely removed) by iterative interference suppressions (IIS) Any scenario with a frame-length smaller than 12 OFDM symbols is not considered for the use with PRP-OFDM (due to the insufficient CIR estimation MSE)
Simulations are performed taking 11 OFDM symbols into account for CIR estimation The frame to be decoded is assumed to be preceded by (dummy) PRP-OFDM symbols that are not decoded but whose postfix sequences are exploited for CIR estimation The results of PRP-OFDM are compared to a standard CP-OFDM system where the CIR estimation is assumed to be performed on 2 OFDM learning symbols at the beginning of the frame just after synchronisation No channel tracking is performed in this case The simulation results in Figure F20 show that a considerable error floor is present for standard CP-OFDM system for the mobility scenarios For PRP-OFDM this error floor disappears in the BLER range of interest and only an offset in SNR remains (approx 2 dB offset comparing 0 kmh vs 144 kmh) As a conclusion it can be stated that in combination with the chosen system and simulation parameters PRP-OFDM is useful in high mobility scenarios applying lower order constellations (QPSK in this example) Higher order constellations (QAM16 and higher) require larger observation window sizes for the CIR estimation and thus longer frames In the QPSK context PRP-OFDM leads to very acceptable system performance results at UT velocities as high as 144 kmh and beyond the performance loss at 144 kmh is limited to approximately 2 dB compared to the static case
WINNER D210 v10
Page 129 (180)
Figure F20 PRP-OFDM 11 Symbols CIR Estimation QPSK BLER simulation results
The simulation results show that PRP-OFDM can be used in the downlink to reduce the overhead required for channel estimation by using the guard interval for this purpose However the drawbacks namely the introduced delay (especially for higher order modulation) and the inability to extend this scheme to the uplink case are currently considered to outweigh the benefits Therefore CP-OFDM relying on a scattered pilot grid is currently the preferred solution
F4 Synchronisation
F41 Synchronisation without utilizing an explicit training symbol In [BSB97] a blind algorithm for symbol timing and frequency offset estimation was proposed which utilises the guard interval having the great advantage that it does not require any overhead in form of training data The basic idea is that the cyclic prefix is identical to the original part of the GMC block from which it is copied Correlation of the cyclic prefix with its original part results in a correlation peak The magnitude of the correlator output peaks at the beginning of an OFDM symbol while its phase at this time instant is proportional to the carrier frequency offset ∆f The algorithm detailed in [BSB97] is the maximum likelihood (ML) estimate in an AWGN channel For the ML estimate knowledge of the SNR is necessary which is impractical for acquisition when usually no information about the received signal is available The ML metric consists of the correlation metric ρ of the cyclic prefix with its original part as well as a metric which accounts for the signal power φ
Three different variants of the CP based synchronisation are compared
bull The ML estimator proposed in [BSB97]
bull An estimator which only uses the correlation metric ρ labelled ldquoCORrdquo Utilizing only ρ approaches the ML estimate at low SNR [LC02]
bull An estimator which uses the difference φρ minus approaches the ML estimate at high SNR [LC02] This approach is named ldquonorm CORrdquo since it is normalised by the power of the received signal
WINNER D210 v10
Page 130 (180)
Unfortunately the performance of this approach degrades in a frequency selective channel since the time dispersive channel impulse response reduces the ISI free part of the guard interval Computer simulations have been carried out for the WINNER FDD mode with channel model C2 and system parameters taken from Table 21 For the TDD mode the performance is expected to be better since CP correlation typically performs better if the number of subcarriers is large
Since the time and frequency offset will be constant during some OFDM symbols averaging over several estimates considerably improves the performance [BBB+99] This simple averaging of the correlation metric is a highly effective means to increase the robustness as well as accuracy of the CP based acquisition In the simulations averaging was performed over 12 OFDM symbols ie one OFDM frame
For channel model C2 the mean estimated timing offset is splTTE 6 asymp∆ which implies that the timing estimator is biased Unfortunately a positive mean will cause ISI and should therefore be avoided The bias may be compensated by a fine timing synchronisation unit operating in the frequency domain
The standard deviation of the time and frequency offsets is shown in Figure F21 Averaging the correlation metric of the CP based algorithm significantly improves the accuracy of the time and frequency estimates as shown in Figure F21 For cross-correlation based synchronisation averaging is only possible over the two OFDM symbols which carry pilot symbols Thus this technique cannot benefit from averaging to the same extend as CP based synchronisation While the combination of the CP based and the cross-correlation approach are possible [LWB+02] the cross-correlation approach cannot substantially improve the synchronisation accuracy Hence cross-correlation based synchronisation is applicable mainly in case that BSs are not synchronised
-5 0 5 10100
101
102
SNR [dB]
std(
∆ T
T spl)
MLCORNorm CORCC
withoutaveraging
withaveraging
-5 0 5 10
10-3
10-2
10-1
SNR [dB]
std(
∆ f c T
)
MLCORNorm COR
withaveraging
withoutaveraging
Figure F21 Standard deviation of the estimated time and frequency offset against the SNR (a) standard deviation of the time offset (left side CC = cross-correlator) and (b) standard deviation of
the frequency offset (right side)
WINNER D210 v10
Page 131 (180)
-5 0 5 1010-3
10-2
10-1
100
SNR [dB]
PFD
MLCORNorm COR
withaveraging
withoutaveraging
-5 0 5 1010-3
10-2
10-1
100
SNR [dB]
PFD
CC ∆ fc T = 0
CC ∆ fc T = 05
CC ∆ fc T = 10
Figure F22 Probability of false detection PFD against the SNR for (a) the CP correlator (left side) and (b) the cross-correlator (CC) using the scattered pilot grid of Figure B6 (right side)
Of particular interest is the performance of the algorithm at low SNR We define a false detection if the timing estimate is outside the window [-NCP2 NCP2] In Figure F22 the probability of false detection PFD of the CP correlator is plotted against the SNR (left side) It is seen that PFD is significantly reduced by averaging over 12 OFDM symbols The probability of false detection can be further reduced by averaging over more OFDM symbols For the simple COR synchronisation scheme the improvement through averaging is most significant
On the right hand side of Figure F22 PFD is shown for the cross-correlation (CC) based synchronisation scheme using the scattered pilot grid of the WINNER FDD mode It is seen that the detection probability of the OFDM symbol timing severely degrades if a carrier frequency offset is present For synchronisation in a wireless network time synchronisation for non-synchronised BSs is possible if adjacent BS use different pilot sequences However since the cross-correlator is sensitive to frequency offsets BSs should be either time or frequency synchronised Comparing the CP-based auto-correlation with the cross-correlation technique the CP correlation with averaging appears favourable Only for not time synchronised BSs the CC technique is a valid option It should be noted however that this statement depends on the chosen pilot grid For a smaller pilot spacing the performance of the CC technique is expected to improve
To conclude synchronisation by correlating the cyclic prefix (CP) with its original part is robust even at very low SNR provided that the correlation metric is sufficiently averaged Averaging over 12 OFDM symbols mitigates false detection for SNRge0 dB Since COR is the technique with the least complexity it can be concluded that averaging combined with COR is an appropriate choice due to its simplicity low overhead high accuracy and reliability Cross-correlation synchronisation utilizing a scattered pilot grid predominantly used for channel estimation can be used for synchronisation of a network where BSs are not time synchronised However BSs need to be frequency synchronised for this algorithm to work
WINNER D210 v10
Page 132 (180)
F5 Performance of selected bit and power loading algorithms In [WIND24] a set of various aspects of the adaptive link-level transmission using Hughes-Hartogs optimum bit-loading algorithm was assessed However as mentioned in Appendix B51 the HH approach is not ideal from the complexity point of view Therefore the following simulation results present a performance comparison between the HH algorithm and two others suboptimum less complex implementations by Chow Cioffi and Bingham and by Fischer and Huber
The presented bit error rate results have been obtained using a Monte-Carlo method by transmitting 100 million information bits per one particular SNR value This gives a sufficient precision to estimate bit error rates in the order of 10-5
A limited power constraint equal to the value of 1 [W] times the number of used subcarriers Nu = 1664 has been assumed in all evaluations Moreover a constant number of information bits have been loaded in each OFDM symbol ie
)(log2 MRNB ui sdotsdot= (F1)
where Nu means number of used subcarriers R represents the code rate and M is the constellation size In order to compare the performance of the evaluated loading algorithms the actual power loaded on each subcarrier has been normalised so the following criterion is fulfilled
summinus
=
=1
0arg
uN
ietti PP
where Pi is the power loaded on the ith subcarrier after normalisation and Ptarget is the total power limit
Figure F23 presents the simulation results for indoor scenario A1 NLOS channel model for a velocity v = 5 kmh The suboptimum less complex CCB and FH bit and power loading algorithms are compared to the Hughes-Hartogs approach All three algorithms have used the target BER setting equal to 10-4 The mean number of information bits transmitted in each OFDM symbol has been set to 2 Nu = 3328 The maximum number of iterations of the CCB algorithm has been limited to 10 (see Appendix B512) For comparison purposes an extra curve for non-adaptive transmission with fixed code rate and constellation size is depicted The overall bit rate of this fixed transmission is the same as in the adaptive cases
0 5 10 15 2010-3
10-2
10-1
100
SNR[dB]
BLE
R
WINNER A1 NLOS Channel Model SISO v = 5 kmh
Fixed R=34 QPSK AWGNAdaptive CCB BERtar=10-4
Adaptive FH BERtar=10-4
Adaptive HH BERtar=10-4
Figure F23 Performance comparison of the HH CCB and FH bit and power loading algorithms (short-range scenario A1 NLOS channel model SISO case v = 5 kmh)
WINNER D210 v10
Page 133 (180)
Similar simulation results are shown in Figure F24 Here slight different parameters have been chosen for comparison The channel model is B3 NLOS (short-range hotspot scenario) however the velocity has been set to the same value v = 5 kmh The mean number of information bits transmitted in one OFDM symbol is equal to 15 Nu = 2496 which is adequate for a transmission of a whole OFDM symbol using the code rate R = frac34 and QPSK constellation on each used subcarrier
0 5 10 15 2010-3
10-2
10-1
100
SNR[dB]
BLE
RWINNER B3 NLOS Channel Model SISO v = 5 kmh
Fixed R=12 16-QAM AWGNAdaptive CCB BERtar=10-4
Adaptive FH BERtar=10-4
Adaptive HH BERtar=10-4
Figure F24 Performance comparison of the HH CCB and FH bit and power loading algorithms (short-range scenario B3 LOS channel model SISO case v = 5 kmh)
Having looked at the results presented above one can conclude that the Fischer and Huber approach has only slightly worse performance than the Chow Cioffi and Bingham solution in a coded transmission over wireless channel models As expected Hughes-Hartogs bit and power loading algorithm performs best but it has the highest computational complexity In general the observed performance degradation of the suboptimum algorithms is so small that it can be neglected in this case
WINNER D210 v10
Page 134 (180)
Appendix G Multi-Link and System-Level Assessments Multi-link and system level simulations have been set up in order to study those techniques which directly or indirectly influence the level of interference at the receivers Basically these are multiple access radio resource management spatial processing at transmitter synchronisation of multiple transmitters (in case of a synchronised network) and power allocationcontrol Another class of techniques which has to be studied by means of system or multi-link simulations is related to receiver processing and the ability to cope with or to combat interference This class typically comprises the large set of single user and multi-user detection algorithm with or without the aid of multiple antennas and iterative processing Even synchronisation belongs to this class of receiver techniques provided there is a potential crosstalk from other simultaneously transmitting stations
This discussion reveals the huge amount of different topics which can and have to be assessed by means of multi-link or system level simulations Within WINNER Phase I emphasis has been placed on the evaluation of different multiple access schemes for up- and downlink partly in combination with various spatial processing options It is a continuation of the work being done in [WIND26] and [WIND27] focusing now on the most promising candidates and using more elaborated simulation environments For non-frequency-adaptively scheduled flows in the downlink the multiple access candidates are chunk based OFDMATDMA and MC-CDMATDMA and a comparison can be found in Appendix G11 The subcarrier interleaved variants of these two multiple access schemes are considered in Appendix G12 Regarding frequency-adaptively scheduled flows chunk based OFDMATDMA was identified as the most promising approach due the highest flexibility in allocating resources to users The additional SDMA gain using grid of fixed beams in a wide-area scenario is addressed in Appendix G14 In the same context spatial processing gains using more sophisticated adaptive beamforming approaches are analysed in Appendix G21 and Appendix G22 For non-adaptively scheduled flows a comparison of beamforming diversity and multiplexing is performed in Appendix G24 Moreover as in Appendix G23 the impact of multiple antennas at the UT and associated combining techniques on system performance is studied The absolute performance of linear multi-user SMMSE precoding is assessed in Appendix G25 for the short-range scenario considering again non-frequency-adaptively scheduled flows Taking realistic system impairments into account the required number of antennas to achieve an average sector throughput of 1 Gbits is identified
The preferred medium access candidates considered for the uplink are pretty much the same as for the downlink including additionally symbol based TDMA Compared to OFDMATDMA pure TDMA is beneficial from terminal power consumption point of view and it is less susceptible to frequency offsets among terminals However the impact of synchronisation errors is not yet included when comparing OFDMATDMA and OFDMTDMA in Appendix G44 The absolute performance of OFDMTDMA and ODFMATDMA with adaptive scheduling is assessed in Appendix G41 and Appendix G43 respectively Considering a short-range scenario in Appendix G43 the optimum resource allocation and bit loading scheme for OFDMATDMA with respect to sum capacity is compared to low complexity solutions
The impact of spatial diversity at the BS for various antenna configurations is analysed in Appendix G51 An information theoretic approach with respect to optimum spatial processing at the UT using two transmit antennas can be found Appendix G52
Other main results are related to multi-user detectionseparation at the receiver This holds not only for base stations but also for user terminals if MC-CDMA is applied Corresponding results considering different receiver structures without and with multiple antennas at the UT can be found in Appendix G31 and Appendix G32 respectively From the base station perspective receiver structures for SISO DS-CDMA and MIMO single carrier are presented and compared in Appendix G61 and Appendix G62
Other investigations which are not directly related to updownlink multiple access spatial processing or detection are part of Appendix G7 In Appendix G71 a comparison of OFDM and single carrier (with cyclic prefix) based uplinks is performed taking the increased power backoff constraint of OFDM into account Appendix G72 deals with low rate channel coding as a means to enable service to users at cell edge even in case of frequency reuse 1 Appendix G73 focuses on the crosstalk which is induced in an OFDM receiver if signals from different base station suffer from transmission delay differences larger than the guard interval Two resource partitioning schemes among base stations are compared with this respect TDMA and FDMA In Appendix G74 conventional and self-organised RRM is compared with respect to system throughput considering several options how to cope with varying interference
WINNER D210 v10
Page 135 (180)
conditions from newly arriving users Finally Performance results of a protocol which utilises and exploits the benefits of distributed antennas are presented in Appendix G75
It should be stressed that simulation results are provided by different partners using uncalibrated implementations and to a certain extent differing simulation assumptions Consequently results are not directly comparable unless otherwise noted (ie when they are from the same partner) Every contribution starts with a summary of the applied simulation assumptions different from those defined in Appendix E followed by a discussion of the simulation results and corresponding conclusions
For illustrative purposes the main set of medium access schemes which have been studied in greater detail by means of multi-link or system level simulation is depicted in Figure G1 Note that in the section headings the term TDMA has been omitted in most cases for the sake of brevity
chunknt symbols
n f s
ubca
rrie
rs
time
frequ
ency
codespace
Chunk based OFDMATDMA
Chunk basedMC-CDMATDMA
Interleaved OFDMATDMA= IFDMATDMA
Interleaved MC-CDMATDMA
Chunk basedOFDMATDMASDMA
TDMAChunk interleaved
OFDMATDMA
Figure G1 Illustration of considered GMC-based medium access schemes
G1 Downlink multiple access
G11 Comparison of non-adaptive OFDMA MC-CDMA and adaptive OFDMA
Simulation Assumptions Simulator System simulator using AWGN look-up tables and effective SINR mapping
Combined snap-shot dynamic mode gt100 runs of 14 s each simulated Scenario wide area cellular frequency reuse 1 single antenna BS and UT Channel modelling C2 NLOS clustered delay line Interference modelling Central cell mode with simplified inter-cell interference model (two tiers of
fully loaded sectors) Cell radius 900 m MCS 6 QPSKr=13QPSKr12QPSK r2316-QAM r=12 16-QAM r34
64-QAMr=23 BLER target lt01 FEC Punctured convolutional coding (561753)oct with memory 8
Codeword length fixed size of 480 data symbols corresponding to 320ndash1920 payload bits depending on MCS used
HARQ Chase combining maximum 6 retransmissions Type of feedback Non-freq adaptive Best MCS fed back by each terminal
Freq adaptive One SINR per chunk AckNack messages explicitly fed back in all cases Delay 1 chunk duration
Overhead Total overhead of 23 taken into account in TX-power and resources Mobile speed 30 kmh same for all mobiles - results in almost perfect link adaptation
WINNER D210 v10
Page 136 (180)
With the OFDMA variant considered here each user scheduled for transmission is assigned a subset of 6 chunks (out of 48) thus serving 8 users per chunk duration TDMA is applied in each of the two successive chunks forming a frame Thus 16 users are served in total in one FDD frame In the frequency non-adaptive case the 6 chunks of the 8 selected users are simply interleaved in frequency to provide a diversity gain for the channel decoder Note that in this case the link adaptation could also be pre-calculated at the terminal and best MCS feedback would be sufficient In the frequency-adaptive case the 8 users select their preferred 6 chunks in a fair way This requires an increased feedback using one SINR value per chunk for each user Link adaptation is then performed explicitly by the base station after chunk allocation
In case of MC-CDMA spreading is performed within the chunks only using a spreading factor of 8 Hence the whole available bandwidth is shared by 8 users simultaneously MC-CDMA requires only a feedback of the best MCS for each user in the cell assuming that link adaptation is pre-calculated at the terminals Based on this feedback time-domain scheduling (selecting 16 simultaneous users) and link adaptation is performed at the base-station
The simulation results in Figure G2 and Figure G3 firstly show a comparison of different scheduling algorithms in the non-frequency adaptive case using MC-CDMA An evaluation of these scheduling algorithms for pure TDMA and lower system bandwidth (5 MHz) was already presented in earlier WINNER deliverables The major difference compared to earlier results is the fact that with MC-CDMA using a spreading factor of 8 and half-duplex FDD 16 users are scheduled in parallel instead of just a single user Since the gains obtained from multi-user diversity depend on the number of users competing for the resource it is not surprising that the channel dependent schedulers Score Based and Maximum SINR achieve much lower gains in cell throughput compared to Round Robin (Figure G2) than was found in the earlier studies for a comparable number of users
40 users 80 users0
5
10
15
20
25
Mbi
ts
Average service throughput per cell
Round RobinScore BasedMaximum SINR
0 05 1 150
01
02
03
04
05
06
07
08
09
1
Mbits
Pro
b( a
v u
ser t
hrou
ghpu
t lt X
)
CDF of average user throughput
Round RobinScore BasedMaximum SINR
40 users
80 users
40 users 80 users0
5
10
15
20
25
Mbi
ts
Average service throughput per cell
Round RobinScore BasedMaximum SINR
0 05 1 150
01
02
03
04
05
06
07
08
09
1
Mbits
Pro
b( a
v u
ser t
hrou
ghpu
t lt X
)
CDF of average user throughput
Round RobinScore BasedMaximum SINR
40 users
80 users
Figure G2 Throughput for MC-CDMA vs number of userscell
100 200 300 400 500 600 700 800 9000
05
1
15
Mbi
ts
Distance [m]
80 users cell
100 200 300 400 500 600 700 800 9000
05
1
15
Distance [m]
Mbi
ts
40 users cell
Round RobinScore BasedMaximum SINR
Figure G3 Av user throughput vs distance (only scheduled users considered)
WINNER D210 v10
Page 137 (180)
Note also that the cell throughput for the fair score-based scheduler is limited by the low rate users at the cell border (Figure G3) similar to Round Robin In contrast the Maximum SINR scheduler artificially reduces the coverage by serving only users close to the cell centre Note from Figure G2 that for Maximum SINR scheduling around 30 (58) of the 40 (80) users in the cell are not served For Round Robin and score-based scheduling this number is slightly lower than 20 for both system loads Hence the single antenna configuration and the MCSs used for these first results do not provide satisfactory coverage and the use of multiple antennas and advanced coding strategies (eg Turbo Coding) does appear mandatory
In Figure G4 and Figure G5 MC-CDMA and OFDMA are compared for the frequency adaptive and the frequency non-adaptive case In the frequency non-adaptive case MC-CDMA outperforms OFDMA in terms of cell and user throughput for all considered loads and scheduling algorithms This is due to the frequency diversity advantage of MC-CDMA achieved by spreading the coded block over the whole bandwidth
40 users 80 users0
5
10
15
20
25
Mbi
ts
Average service throughput per cell
Round Robin MC-CDMAScore Based MC-CDMARound Robin OFDMAScore Based OFDMA NonFreqScore Based OFDMA FreqAdapt
0 05 1 150
01
02
03
04
05
06
07
08
09
1
Mbits
Pro
b( a
v u
ser t
hrou
ghpu
t lt X
)
CDF of average user throughput
Score Based MC-CDMAScore Based OFDMA NonFreqScore Based OFDMA FreqAdapt
40 users
80 users
Figure G4 Throughput for MC-CDMA and OFDMA vs nb of userscell
100 200 300 400 500 600 700 800 9000
05
1
15
Mbi
ts
D is tanc e [m ]
80 us ers c ell
100 200 300 400 500 600 700 800 9000
05
1
15
Dis tanc e [m ]
Mbi
ts
40 us ers c ell
S c ore B as ed M C-CDM AS c ore B as ed O FDM A NonFreqS c ore B as ed O FDM A F reqA dapt
Figure G5 Av user throughput vs distance (only scheduled users considered)
In the frequency-adaptive case where the base station can use feedback on chunk level for adaptive chunk allocation OFDMA achieves high gains in user and cell throughput However the gain is to a certain extent limited by the constraint that a fixed amount of chunks (6 in this case) is assigned to each user scheduled for transmission The percentage of un-served users decreases by adaptive transmission to around 12 (Figure G4) and the user throughput increases within the whole cell range (Figure G5) However the observation that overall coverage is unsatisfactory still holds in the frequency adaptive case
The following main conclusions can be drawn from the results
WINNER D210 v10
Page 138 (180)
bull Multi-user diversity gains from fast scheduling can only be obtained when a strong TDMA component on sub-frame level is kept in the multiple access scheme Only a limited number of users should be served simultaneously depending on delay constraints and required throughputs
bull In the considered single antenna system configuration the cell coverage is unsatisfactory The use of advanced antenna techniques (MIMO) and improved coding schemes (eg Turbo Coding) is mandatory to achieve satisfactory wide area coverage
bull OFDMA achieves high performance gains in the frequency adaptive mode when a reliable feedback of the channel quality per chunk eg SINR is available for all users competing for the resource
bull In the non-frequency adaptive case MC-CDMA outperforms OFDMA thanks to the better frequency diversity obtained by spreading the symbols over the whole bandwidth However the differences are rather small and will probably vanish if other sources of diversity are available34
G12 Comparison of non-adaptive subcarrier interleaved OFDMA and MC-CDMA
Simulation Assumptions Simulator multi-link level Scenario Short range cellular single antenna BS and UT Channel modelling IEEE 80211n including path loss and shadowing Interference modelling Whole tier of interfering cells around desired cell each cell generates own
transmit signal and signal is transmitted through independent channel Cell radius 300 m Link adaptation QPSK r=12 FEC Convolutional coding (561753)oct with memory 8
Codeword length 3328 spreading type Walsh-Hadamard spreading length 8
Despreading MMSE based Mobile speed 3 kmh
The simulation results in Figure G6 left plot show a direct comparison between subcarrier interleaved OFDMA and subcarrier interleaved MC-CDMA in a cellular environment in terms of BER In case of OFDMA each user gets exclusively 208 subcarriers out of 1664 allowing a maximum number of 8 users to be served simultaneously With MC-CDMA the data of each user is spread over 8 subcarriers leading to multiple access interference Since the number of active users the maximum number of users the data symbols per user and the frame size are equal the comparison of the medium access variants is regarded as fair The resource load of OFDMA is defined by the ratio of the number of allocated subcarriers relating to the number of available subcarriers In MC-CDMA the resource load is given by the ratio of the number of active users relating to maximum number of users which could be served using all available codes In the case of OFDMA an RRM over three cells can avoid a double allocation of subcarriers up to a resource load of 13 Otherwise the subcarriers are randomly allocated Three scenarios are investigated determined by the distance of the UTs to the base station d0=(150 200 300) In the inner part of the cell (d0=150 m) MC-CDMA outperforms OFDMA for resource loads smaller than 075 due to enhanced frequency diversity but the difference is rather small if translated into throughput The benefit of MC-CDMA reduces with increasing resource load because the multiple access interference increases Since the inter-cellular interference is small in the inner part of the cell the RRM for OFDMA does not enhance the performance dramatically In contrast the RRM improves drastically the performances for OFDMA in the outer parts of the cell (d0 gt200 m) for lower resource loads indicating that RRM is an important means for throughput enhancements at the cell edge especially if the system is not fully loaded (which is mostly the case in a real system) MC-CDMA always outperforms pure ODFMA in all three scenarios for resource loads lower than 06
34 The actual WINNER system concept offers additional sources of diversity in the spatial domain A comparison of
the additional benefit of MC-CDMA against the increased complexity in particular in conjunction with MIMO techniques is for further study
WINNER D210 v10
Page 139 (180)
0 02 04 06 08 110-6
10-4
10-2
100
resource load
BE
R
OFDMA with RRMOFDMA wo RRMMC-CDMA
d0=300m
d0=200m
d0=150m
0 50 100 150 200 250 300
10-6
10-4
10-2
100
distance [m]
BE
R
MC-CDMA RL=10OFDMA wo RRM RL=10OFDMA with RRM RL=10OFDMA wo RRM RL=05OFDMA with RRM RL=05MC-CDMA RL=05OFDMA wo RRM RL=0125MC-CDMA RL=0125OFDMA with RRM RL=0125
Figure G6 BER versus resource load for different UT distances (left plot) and BER versus UT distance for different resource loads (right plot) considering interleaved MC-CDMA and OFDMA
The right plot of Figure G6 shows the BER versus the mobile distance to the desired base station Three different resource loads for an OFDMA and MC-CDMA system are investigated Due to the avoidance of inter-cellular interference by using the RRM for OFDMA the BER with a resource load of 0125 is nearly zero in the whole cell MC-CDMA can utilise the whole frequency diversity and therefore MC-CDMA outperforms pure OFDMA in the scenarios with resource load 0125 and 05 in the whole cell area OFDMA slightly exceeds the MC-CDMA performance in the fully-loaded scenario because the multiple access interference is the major degradation factor of MC-CDMA
To sum up at low resource loads (smaller than 06) MC-CDMA performs always better than pure OFDMA due to the higher frequency diversity but the differences are small and will probably disappear if further sources of diversity are exploited see footnote 34 on page 138 However the enhanced interference suppression opportunities with smart RRM allow a large performance gain for lower bounds The RRM shows a lower bound for the OFDMA system without any channel knowledge at the transmitter side At high loads both techniques show similar performances
G13 Comparison of non-adaptive OFDMA MC-CDMA and TDMA
Simulation Assumptions Simulator Multi-cell link level Scenario Wide area single-antenna BS and UT cell radius 1000 m Channel modelling C2 generic channel model (D54) including path loss + shadowing Interference modelling Whole tier of interfering cells around desired cell MCS 2 4-QAM r=12 16-QAM r=12 FEC Convolutional coding (561753)oct with memory 8
Codeword length 1664 Spreading Type Walsh-Hadamard spreading length 8 Channel allocation for each codeword
TDMA ndash 4-QAM 416 carriers times 2 symbols TDMA ndash 16-QAM 416 carriers times 1 symbol OFDMA ndash 4-QAM 32 adjacent carriers times 26 symbols OFDMA ndash 16-QAM 32 adjacent carriers times 13 symbols MC-CDMA ndash 4-QAM 416 carriers times 16 symbols MC-CDMA ndash 16-QAM 416 carriers times 8 symbols Spreading is performed across 8 adjacent subcarriers
Simulations have been conducted in order to compare the performance of OFDMATDMA MC-CDMATDMA and pure TDMA which can be regarded as a special case of MC-CDMA with spreading factor 1 Figure G7 presents the throughput results for a fully loaded scenario ie where all resources are used for data transmission and 14 loaded scenario Resources are allocated to UTs of different cells randomly that is no interference avoidance scheme is used The results show that all considered multiple access schemes have very similar performances In fully loaded case OFDMA is slightly better than MC-CDMA due to inter-code interference in CDMA In 14 load case MC-CDMA is slightly better than the others confirming the results obtained in G12 It can also be seen that OFDMA is a little better than TDMA in both cases This is due to OFDMA taking more advantage of the time diversity provided by the channel conditions used in the simulation However no spatial diversity has been taken into account yet
WINNER D210 v10
Page 140 (180)
which may further reduce the performance differences between OFDMTDMA OFDMA and MC-CDMA (see also footnote 34 on page 138)
0 5 10 15 20 25 3002
03
04
05
06
07
08
09
1
data rate [Mbits]
prob
(use
r thr
oupu
t lt a
bsci
ssa)
4QAM TDMA16QAM TDMA4QAM OFDMA16QAM OFDMA4QAM MC-CDMA16QAM MC-CDMA
0 2 4 6 8 100
01
02
03
04
05
06
07
08
09
1
data rate [Mbits]
prob
(use
r thr
oupu
t lt a
bsci
ssa)
4QAM TDMA16QAM TDMA4QAM OFDMA16QAM OFDMA4QAM MC-CDMA16QAM MC-CDMA
Figure G7 Performance comparison of OFDMA MC-CDMA and TDMA in fully loaded case (right plot) and non-fully loaded case (left plot)
Figure G8 presents throughput results obtained for various reuse factors using OFDMTDMA although the general conclusions stand for other MA schemes Four tiers of interfering cells are used for the simulation The results show that only about 77 of the cell has been sufficiently covered therefore stronger MCS are required to cover users at the cell edge These results support the suggestion in [WIND32] to cover different areas of the cell with different reuse factors Approximately 37 of the cell can be covered by reuse 1 A further 28 of the cell can be covered by reuse 3 Reuse 7 can be used in approximately 12 of the cell
0 5 10 15 20 25 300
01
02
03
04
05
06
07
08
09
1
data rate [Mbits]
prob
(use
r thr
oupu
t lt a
bsci
ssa)
4QAM RR116QAM RR14QAM RR316QAM RR34QAM RR716QAM RR7
Figure G8 Throughput for different reuse factors for OFDMTDMA
G14 Impact of chunk sharing on the performance of adaptive OFDMATDMA
Simulation Assumptions Simulator Link level Scenario wide area MT = 1 MR = 1 mobility 50 kmh for all mobiles Channel modelling C2 clustered delay line Interference modelling no inter-cell interference MCS 4 4-QAM 16-QAM 64-QAM 256-QAM
adaptive bit and power loading FEC no
An algorithm to perform adaptive user-to-subcarrier allocation with bit and power loading has been proposed in [WIND26] for the downlink of a multi-carrier CDMA systems with spreading both in time and in frequency The algorithm yields an optimisation of the subcarrier sharing that enables a considerable performance gain with respect to OFDMA systems where each subcarrier is exclusively
WINNER D210 v10
Page 141 (180)
assigned to one user [WIND23] In order to implement subcarrier sharing other sharing techniques like TDMA or FDMA can be used as well Although chunk-wise resource allocation already implicitly provides time sharing in an OFDMA system we show that a considerable performance gain can be achieved through further chunk sharing in case that the number of users competing for resources is quite high (K=32 in this case) and the time constraints for serving all these users is very stringent (one chunk duration=3346micros) Sharing of a chunk by different data flows can be implemented in many different ways in particular
CDMA ndash all nsub nsymb time-frequency bins of a chunk or a subset thereof are simultaneously utilised by a number of data flows To decrease message delays it would be advantageous to perform pure frequency-domain spreading by which in frequency-selective fading CDMA can provide diversity gain even with single-user detection However in an adaptive system no room for diversity is left
TDMA ndash each flow utilises all subcarriers of a chunk during ρkqnsymb OFDM symbol periods
FDMA ndash flow k utilises ρkqnsub subcarriers during the nsymb OFDM symbol periods of a chunk Some kind of frequency hopping per chunk can be advantageous in severe frequency selective channels
Figure G9 illustrates the impact of chunk sharing and chunk size variations on BER performance Here Sf denotes the spreading factor and S the number of users sharing a chunk Under the specific conditions considered chunk sharing with nsub=4 and Sf=S=4 yields a significant performance improvement with respect to exclusive user-to-chunk assignment ie nsub=4 and Sf=S=1
-6 -4 -2 0 2 4 6 8 10 12 1410
-4
10-3
10-2
10-1
100
Relative transmitter power dB
BE
R
nsub=Sf=1S=4FDMA
nsub=Sf=4S=4FDMA
nsub=Sf=1S=1FDMA
nsub=4Sf=S=1FDMA
nsub=2Sf=S=1FDMA
nsub=2=Sf=S=2FDMA
Figure G9 Gain of chunk sharingchunk size considering 32 users competing for 416 subcarriers with a granularity nsub= 1 to 4 and nsymb=12 35
It is reasonable to expect that the achievable gain decreases by relaxing the constraint on the number of users to be served within one chunk duration ie by decreasing the demand on granularity as it had been previously shown in [WIND26] with reference to single subcarrier sharing Moreover from the figure it can be inferred that the gain of chunk sharing increases with the number of subcarriers constituting the chunk at BER=10-3 a gain of 2 dB is achieved for nsub=2 and 6 dB for nsub=4 respectively Furthermore it can be observed that by optimizing the transmission scheme over sub-bands of size nsubgt1 the transmitter power needed to achieve a given BER increases (by 1 dB for nsub=4) Indeed increasing the chunk size reduces the performance of link adaptation due to the effect of channel-to-noise ratio averaging But on the other hand it also reduces the amount of feedback information which was not taken into account here
We note that results for S le 4 have been plotted since preliminary results had shown that increasing S further does not provide any improvement Finally all curves refer to the case of FDMA sharing since it had also been proven that the performance of TDMA and CDMA chunk-sharing is essentially the same
35 It should be noted that the fairly large gains seen here apply only to specific situations with very strict delay
requirements as eg control signalling for scheduling and retransmissions for highly prioritised services
WINNER D210 v10
Page 142 (180)
from which it can be inferred that CDMA is not affected by the loss of orthogonality among codes within one chunk
G15 Comparison of adaptive OFDMA and OFDMASDMA using GoBs
Simulation Assumptions Simulator System level simulator 30 Frames per snapshot 20 snapshots per simulation Scenario wide area MT = 8 MR = 1 cell radius 1000 m all UTs move at 3 kmh
frequency reuse 1 336 carrier per sector frequency reuse 3 112 carrier per sector frequency reuse 7 48 carrier per sector Tx power per carrier is set to 125 mW in all cases
Channel modelling C2 and D1 generic channel model (according to D54) Interference modelling Full modelling using wrap around technique MCS 6 BPSK r=13 BPSK r=23 QPSK r=23 16-QAM r=23
64-QAM r=23 64-QAM r=89 FEC punctured convolutional coding (133171145)oct with memory 6
codeword length variable ndash one codeword always fills one chunk Type of feedback For each user and chunk MCS and corresponding throughput value Feedback delay 0 Beamforming Chebychev tapering with 25 dB side lobe suppression using either eight grids
with one beam each (1 beam case) 4 grids with two beams each (2 beam case) or 2 grids with 4 beams each (4 beam case)
A simple grid of fixed beam (GoB) is considered in order to investigate the potential SDMA gains achievable under wide-area scenario conditions The basic approach used here is to form beams simultaneously from all BS allowing the UT to measure and feedback some kind of CQI as eg SINR per chunk and beam see [WIND27] Based on this feedback resources are allocated to the UTs adaptively (opportunistically) Proportional fair scheduling (PFS) is applied to take fairness constraints into account Considering synchronised cells and leaving the beam pattern and corresponding power allocation constant at all base stations during measurement phase and payload phase leads to predictable inter-cell interference conditions and hence supports short term adaptivity36
System simulation results for channel model D1 comparing average sector throughput for single antenna base stations (SISO) and multi-antenna base stations forming one two or four beams on each chunk are shown on the left side of Figure G10 Note that the SISO and the one beam case are associated with chunk based OFDMATDMA and the two and four beam case with chunk based OFDMATDMASDMA respectively Two main conclusions can be drawn out of these plots Firstly a fixed frequency reuse of one is always beneficial with respect to the cell throughput even if fairness (deducible from the right two plots in Figure G10) is taken into account This holds also for the SISO case which may be explained by different (in the simulation uncorrelated) shadow and fast fading characteristics for any BSharrUT link leaving sufficient variability to be exploited by adaptive scheduling Secondly increasing the number of beams leads to an increasing sector throughput indicating that SDMA is a viable option
36 Predictable SINR conditions are even more challenging for adaptive spatial processing The measurement phase
and the corresponding feedback signalling can be implemented as additional time-multiplexed parts of the super-frame not shown in Figure 32 The detailed layout of these phases within the super-frame is for further study
WINNER D210 v10
Page 143 (180)
0 5 10 15 20 25 30 350
20
40
60
80
100
120
max SISO rate
number of users
aver
age
sect
or th
roug
hput
[Mbi
ts]
channel model D1 reuse 1
SISO PFS1 beam PFS2 beams PFS4 beams PFS4 beams max thrpt
0 5 10 15 20
0
02
04
06
08
1
data rate [Mbits]
prob
(use
r thr
ough
put lt
abs
ciss
a)
16 user channel model D1 reuse 1
SISO PFS1 beam PFS2 beams PFS4 beams PFS4 beams max thrpt
0 5 10 15 20 25 30 3510
20
30
40
50
60
70
max SISO rate
number of users
aver
age
sect
or th
roug
hput
[Mbi
ts]
channel model D1 reuse 3
SISO PFS1 beam PFS2 beams PFS4 beams PFS4 beams max thrpt
0 5 10 15 20
0
02
04
06
08
1
data rate [Mbits]
prob
(use
r thr
ough
put lt
abs
ciss
a)
16 user channel model D1 reuse 3
SISO PFS1 beam PFS2 beams PFS4 beams PFS4 beams max thrpt
Figure G10 average sector throughput and CDF of user throughput for channel model D1 with varying number of beams in different reuse scenarios zero feedback delay
Further exemplary simulations have been performed in order to assess the impact of various system parameters as feedback delay amount of feedback and number of antennas at the UT starting from the parameter setting [4beams channel model D1 reuse 1 prop fair scheduling 16 users] Figures are omitted for the sake of brevity but basically it turns out that in case of channel model D1 the system is quite robust with respect to feedback delays For example a delay of 64 OFDM symbols between measurement and payload phase in a scenario where all UTs move at 70 kmh (corresponding to a Doppler normalised delay fDtdelay=06) led to an average sector throughput loss of around 16 The relatively small loss is mainly due to high LOS probability associated with this channel model In case of channel model C2 (NLOS only) however the average sector throughput loss is substantially higher and amounts to 67 under the same conditions
Regarding the amount of feedback a considerable performance loss can be observed when CQI information is fed back for less than around 35 percent of all chunks But this threshold depends to a certain degree on the number of different grids and how they are mapped to the chunks In this simulation only two different grids each with four beams were considered causing a certain periodicity in frequency direction
Increasing the number of antennas at the UT provides significant system performance gains of around 25 (2 antennas) and 50 (4 antennas) using maximal ratio combining (MRC) Even larger gains are expected if the combiner accounts for the interference characteristics (IRC) as described in G24 Of course further investigations a required to study the interaction of the parameters presented
Realizing SDMA by GoBs requires a relatively low angle of departure spread to keep intra-cell interference ie intra-beam interference small The more beams are formed the more stringent this requirement is Channel model C2 has a much larger angle of departure spread than D1 and therefore the performance gain achieved by SDMA are considerable smaller In fact forming four beams yields approximately the same performance as with two beams
To sum up using grids of beams in combination with opportunistic scheduling is a simple but yet efficient and robust solution to realise SDMA gains with low complexity even in reuse case 1 provided
WINNER D210 v10
Page 144 (180)
that the angle of departure spread is sufficiently small as for scenario D1 In scenario C2 the SDMA gain with GoBs is limited to a factor of around 15 compared to pure beamforming
G2 Downlink spatial processing
G21 Comparison of fixed and tracking based beamforming
Simulation Assumptions Simulator System simulator 200 snapshots snapshot duration 250 chunks Scenario Wide area cellular MT = 8 MR = 1 frequency reuse 1 all 512 carriers used
cell radius 1 km Channel modelling C2 WIMI generic channel model Interference modelling Full interference modelling Multiple access adaptive OFDMATDMA MCS No MCS a successful transmission occurs when the predicted transmission
rate is lower than the actual capacity of the equivalent channel FEC No FEC Type of feedback 8 bits feedback per user per chunk SNR in case of OBF complex gain in
case of adaptive beamforming with channel tracking Feedback delay 2 chunk duration Overhead 19 out of 96 resource elements for each chunk Mobile speed Pedestrian (M1) 50 of users Vehicular (M2) 50 of users Beamforming OBF 1 varying beam spanning a grid of 40 fixed beams
In an environment where the NLOS (or fading) component of the channel is dominant with respect to the LOS component (typically C2 environment in WIMI) the performances of fixed beamforming and long-term CSI based beamforming techniques degrade due to the large angle of departure spread of the channel In this case short-term CSI based adaptive beamforming techniques are better suited to exploit the multi-antenna gain The main limitation when using these techniques in a wide-area scenario is the high signalling overhead needed for the feedback of the CSI from the mobile end to the BS In order to reduce the signalling overhead and still preserve the multi-antenna gain an adaptive beamforming technique based on channel tracking (TrackBF) is considered
With this approach the beamforming vectors are determined according to the maximum ratio combining solution ie )(ˆ)(ˆ)(
H nnn kk hhw = using the estimated (tracked) channel )(ˆ n
kh of the scheduled user
k It is assumed that the complex gain αk(n)=hk(n)w(n) is fed back and used to track the channel at the BS via Kalman filtering [GA93] In addition to the channel the Kalman filter gives an estimate of the covariance matrix ))(ˆ)(())(ˆ)(E()( H nnnnn kkkkk hhhhC minusminus= which is a measure of the quality of the channel estimation and is used to predict the transmission rate for user k The scheduling decision is then made using the Proportional Fair Scheduler (PFS)
The proposed technique has the same reduced complexity and feedback requirements as the existing Opportunistic Beamforming (OBF) [VTL02] approach which is implemented here using a varying beam w(n) that spans a grid of 40 fixed beams and where the resulting gain αk(n)=|hk(n)w(n)| or the associated SNR is fed back This technique is used as a benchmark for comparison
Results show both the TrackBF and OBF enhance the performance over the SISO case by exploiting the multiple transmit antennas advantage (Figure G11) In terms of mean cell throughput the TrackBF and OBF improve the performance by 47 and 16 respectively over the SISO case Moreover the TrackBF outperforms the OBF in terms of throughput and fairness the latter is reflected by the lower probability of high inter-packet delays (Figure G12) As expected the TrackBF performs much better for pedestrian users than for vehicular users (Figure G11) The performance degradation in the case of vehicular users is related to the poor channel tracking quality due to high mobility
WINNER D210 v10
Page 145 (180)
0 50 100 150 2000
02
04
06
08
1
Cell Throughput Mbits
Pro
b(C
ell T
hrou
ghpu
t lt a
bsci
ssa)
Cell Throughput Tc = 1000 K = 60 per cell
TrackingPFS mean = 110Mbits
Opportunistic BFPFS mean = 87Mb
SISOPFS mean = 75Mbits
0 2 4 6 8 100
02
04
06
08
1
User Throughput Mbits
Pro
b(U
ser T
hrou
ghpu
t lt a
bsci
ssa)
User Throughput K = 60 per cell
TrackingPFS Pedestrian(M1)Opportunistic BFPFS Pedestrian(M1)TrackingPFS Vehicular(M2)Opportunistic BFPFS Vehicular(M2)
Figure G11 CDF of cell throughput (left plot) and user throughput (right plot) for SISO adaptive beamforming with tracking and OBF with fixed grid of beams 20 users per sector
100 101 10210-4
10-3
10-2
10-1
Inter-packet delay in chunk duration
Pro
b(de
lay
gt ab
scis
sa)
Inter-packet delay distribution K = 60 per cell
TrackingPFSOpportunistic BFPFS
Figure G12 inter-packet delay distribution 20 users per sector
G22 Comparison of various adaptive beamforming techniques
Simulation Assumptions Simulator Multi-link one sector 1000 frames simulation time with 100 drops Scenario wide area cellular MT = 8 MR = 1 ULA Channel modelling SCME no path loss no shadowing Interference modelling Only Intra-cell interference by full simulation of all links Mulitple access adaptive OFDMATDMA(SDMA) OFDM parameters 20 MHz bandwidth 512 subcarriers (406 used) MCS 1 16-QAM r=12 FEC Conv coding (561753)oct with memory 8 Codeword length 2 chunks Feedback delay 1 frame CQI feedback either beam selection info or covariance matrix Overhead None Mobile speed 50 kmh same for all mobiles
In these investigations several beamforming techniques plus SDMA are studied in a wide-area scenario on multi-link level Scheduling is done chunk based in a score-based proportional fair way one chunk occupies 8 subcarriers times 12 OFDM symbols Coding and scheduling is always performed for groups of two consecutive chunks
The first beamforming technique is a grid of fixed beams (GOB) with 8 beams Non-neighboured beams share the same time-frequency resources A feedback of the strongest beam and a corresponding CQI value are assumed Inside each beam the CQI value is used for the scheduling score calculation
WINNER D210 v10
Page 146 (180)
-20 -10 0 10 20 300
20
40
60
80
100
120
SNR [dB]
aver
age
sect
or th
roug
hput
[Mbi
ts] 32 users
-20 -10 0 10 20 300
20
40
60
80
100
120
SNR [dB]
16 users
-20 -10 0 10 20 300
20
40
60
80
100
120
SNR [dB]
aver
age
sect
or th
roug
hput
[Mbi
ts] 8 users
-20 -10 0 10 20 300
20
40
60
80
100
120
4 users
SNR [dB]
MU ABSU ABGOBAB 1str4 str maxSISO
Figure G13 Score based suburban macro
-20 -10 0 10 20 300
20
40
60
80
100
120
SNR [dB]
aver
age
sect
or th
roug
hput
[Mbi
ts] 32 users
-20 -10 0 10 20 300
20
40
60
80
100
120
SNR [dB]
16 users
-20 -10 0 10 20 300
20
40
60
80
100
120
SNR [dB]
aver
age
sect
or th
roug
hput
[Mbi
ts] 8 users
-20 -10 0 10 20 300
20
40
60
80
100
120
4 users
SNR [dB]
4 str maxMU ABSU ABGOBSISOAB 1 str
Figure G14 Score based urban macro
The second technique is adaptive beams with single-user optimised antenna weights (AB SU) based on Eigenbeamforming (see [HBD00]) For SDMA the selection of users is done successively The user with the highest score is selected first All spatially separable users are candidates for scheduling From these candidates the user with the highest score is selected This process is repeated until there are no more spatially separable users or the maximum number of desired spatial streams is reached The transmitter relies on feedback of CQI information (to calculate the score) and the spatial covariance matrix to calculate the antenna weights and to decide on spatial separation
WINNER D210 v10
Page 147 (180)
The third technique is adaptive beams with multi-user optimised antenna weights (AB MU) The user selection is done as above additionally the antenna weights are altered to achieve mutual interference suppression by multiplying the Eigenbeam weights by an inverted interference covariance matrix
As a reference case also results for SISO and adaptive beams without SDMA (AB 1str) are shown The figures above show the average total sector throughput over the SNR for the different investigated techniques lsquo4 str maxrsquo refers to the maximum which can be achieved by a 4-stream SDMA with the given MCS GOB is hard limited by these four streams adaptive beams have a soft limit
It can be concluded that multi-user optimised adaptive beams always outperform the other two SDMA schemes The relative sector throughput gain versus GOB increases with decreasing number of users This is caused by more degrees of freedom in user selection and better mutual interference suppression But it relies on the knowledge of the long-term covariance matrix (meaning a higher feedback rate is necessary if no UL CSI can be used) Single user optimised adaptive beams are characterised by a reduced computational complexity compared to AB MU They always outperform GOB with few users On the other hand with high load (more streams) and a larger demand of spatial separation (eg Round Robin instead of score based or a scenario with more angular spread) they can even be outperformed by GOB So in total they are questionable to be used in conjunction with SDMA GOB inherently carry benefits by their simple feedback and scheduling and their orthogonal design being a simple form of multi-user optimisation
SDMA in general shows increasing gains with increasing number of active users (due to increased chances of spatial separability) and decreasing angular spread SDMA has a large potential for increasing cell throughput and is a promising candidate for a wide-area scenario
G23 Comparison of maximal ratio and interference rejection combining at UT
Simulation Assumptions Simulator Multi-link Scenario wide area downlink MT = 1 MR = 2 Channel modelling WINNER channel model C2 NLOS no path loss no shadowing Interference modelling One Inter-cell interference with DIR of 6 dB Multiple access Non-adaptive OFDMTDMA MC-CDMATDMA OFDM parameters 20 MHz bandwidth 512 subcarriers (406 used) MCS QPSK r=12 16QAM r=13 FEC 3GPP 12 and 13 Turbo coding Mobile speed 50 kmh for all terminals
When frequency reuse one is assumed in downlink at wide area mode inter-cell interference or co-channel interference will degrade system performance However multiple antennas at receiver can be used to mitigate the interference
Here 1x2 OFDM and 1x2 multi-carrier CDMA systems are considered in downlink for wide area For multi-carrier CDMA spreading factor and the number of Walsh-Hadarmard codes are both equal to 8 One inter-cell interference with dominant interference ratio (DIR) of 6 dB is generated QPSK with 3GPP 12 Turbo coding and 16QAM with 13 Turbo coding are used At receiver two combining methods are considered One is maximum ratio combining (MRC) and another is interference rejection combining (IRC) which is also referred to here as miminum mean square error combining (MMSEC)
Simulation results are shown in Figure G15 No matter which MCS and receiver algorithm is used the performance for 1x2 OFDM and multi-carrier CDMA are very similar However receiver complexity of multi-carrier CDMA is larger than that of OFDM system On the other hand MMSE combining provides significant gains over MRC combining under interference scenario Therefore receive antenna processing eg MMSE combining is a very efficient means to suppress inter-cell interference
WINNER D210 v10
Page 148 (180)
-7 -6 -5 -4 -3 -2 -1 0 1 210
-4
10-3
10-2
10-1
100
SINR (dB)
Err
or R
ate
BER OFDM-MRCBER OFDM-MMSECBER CDMA-MRCBER CDMA-MMSECFER OFDM-MRCFER OFDM-MMSECFER CDMA-MRCFER CDMA-MMSEC
-8 -6 -4 -2 0 210
-3
10-2
10-1
100
SINR (dB)
Err
or R
ate
BER OFDM-MRCBER OFDM-MMSECBER CDMA-MRCBER CDMA-MMSECFER OFDM-MRCFER OFDM-MMSECFER CDMA-MRCFER CDMA-MMSEC
Figure G15 Performance of 1 times 2 MRC and MMSEC considering OFDMTDMA and MC-CDMATDMA with QPSK modulation and 12 turbo coding (left plot) and 16QAM modulation
and 13 turbo coding (right plot)
G24 Comparison of beamforming diversity and multiplexing
Simulation Assumptions Simulator System 19 three-sector sites full interference modelling using wrap-around Scenario Wide area cellular on average 10 userssector frequency reuse 1
MT le 8 MR le 2 varying cell radius Channel model C2 NLOS WINNER interim channel model (WIMI) MCS Modulation schemes QPSK 16QAM and 64QAM
Channel code rates 110 13 12 23 34 and 89
FEC
Turbo code combined with Layer 1 code block segmentation (up to 5114 bits per block) and rate matching codeword length from 998 (QPSK rate 110) to 26624 bits (64QAM rate 89) rate 17 mother code (polynomials feedback 013 feedforward 015 017 011)
FeedbackOverhead Chunk SINR after receiver processing zero delay no overhead
A non-frequency adaptive downlink based on OFDMTDMA is evaluated in a multi-cell wide-area scenario in order to assess the value of different components of the WINNER multiple-antenna concept Performance is compared for different cell sizes and in terms of average sector throughput and active radio link data rates The latter measure is the (average) user throughput when scheduled for transmission Since round robin TDMA scheduling is applied the active radio link rate may be used to assess the fairness in the network Furthermore because many idealised assumptions are made one should not focus on the absolute performance figures but rather on the relative performance
The upper left plot in Figure G16 depicts the average sector throughput in a network using a single downlink transmit antenna Compared to single antenna reception terminal receive diversity may improve performance significantly MRC provides an average throughput gain of 35 in an interference limited scenario Interference rejection combining (IRC) referred to as optimum combining in [Win84] which suppresses inter-cell interference by taking the spatial colour into account on a per carrier basis adds another 10ndash15 The lower left plot shows the distributions of the active radio link rates for a cell radius of 700 m and as can be seen performance is improved for all users
Transmit diversity may be realised by using linear dispersion codes In here Alamoutirsquos orthogonal design is considered with two transmit antennas separated 20 wavelengths The terminals use one or two receive antennas and as a reference single antenna transmission is also considered In the upper right plot of Figure G16 the sector throughput is shown and in the lower right plot the distributions of the data rates are shown for a cell radius of 700 m With receive diversity terminals suppress inter-cell interference taking the structure of the interference into account The results indicate that compared to single-antenna transmission the gain of transmit diversity with Alamoutirsquos design is slightly below 10 with receive diversity and slightly above 10 without receive diversity It can also be seen that transmit diversity does not improve data rates for the lower percentiles but rather for the high percentiles We note that there is inherently a substantial amount of frequency diversity available in the channel which may explain the
WINNER D210 v10
Page 149 (180)
marginal improvement and the present evaluation does not illustrate potential benefits of reduced channel quality variations for non-ideal link adaptation
100 m 1 km 10 km0
10
20
30
40
50
60
cell radius
aver
age
sect
or th
roug
hput
[Mbi
ts]
MRX = 2 IRCMRX = 2 MRCMRX = 1
0 20 40 60 800
010203040506070809
1
prob
(use
r thr
ough
put lt
abs
ciss
a)
active radio link rate [Mbits]
100 m 1 km 10 km0
10
20
30
40
50
60
cell radius
aver
age
sect
or th
roug
hput
[Mbi
ts]
MTX = 2 MRX = 2MTX = 2 MRX = 1MTX = 1 MRX = 2MTX = 1 MRX = 1
0 20 40 60 800
010203040506070809
1
prob
(use
r thr
ough
put lt
abs
ciss
a)
active radio link rate [Mbits]
Figure G16 Average sector throughput and data rate distributions for spatial diversity techniques The data rate distributions are depicted for a cell radius of 700 m
Beamforming solutions provide a directivity gain and change the interference situation in the network Beamforming can be accomplished eg by creating a fixed grid of beams (GOB) and using the beam with the lowest pathloss at transmission An alternative is to form user-specific beams based on the transmit covariance matrix of the channel In here the eigenvector associated with the largest eigenvalue of the transmit covariance matrix is used and this is referred to as eigenbeamforming (EBF) The left plot in Figure G17 depicts the sector throughput with downlink beamforming based on a GOB and EBF respectively using two four and eight base station antennas With GOB the antennas are used to form four eight and 16 fixed beams respectively Terminals have two receive antennas for IRC The results indicate that in the studied scenario EBF provides only a marginal performance improvement compared to a solution using a GOB Thus heavily quantised knowledge of the transmit covariance matrix here in terms of a preferred beam may be enough to capture most of the available gain Increasing the number of antennas gives throughput improvements in the order of around 30 when going from two to four antennas and another 20-25 when increasing the number of base station antennas to eight The enhancement is generally higher at large cell sizes To the right in Figure G17 results with EBF and one and two terminal receive antennas for IRC are shown The gain of terminal receive diversity in terms of sector throughput is here in the range 35ndash50 The gain typically decreases when the number of base station antennas increases illustrating that benefits not necessarily are additive
To the left in Figure G18 performance with beamforming (EBF) at the base station combined with terminal receive diversity is shown The upper left plot shows the average sector throughput and the lower left plot is the corresponding data rate distributions in a deployment with 700 m cell radius As can be seen the combination of beamforming and terminal receive diversity really improves the fairness and the lower percentiles of the data rates A fraction of the users may even become modulation limited With eight base station antennas used for beamforming throughput has increased more than threefold compared to single antenna transmission and reception and more than twofold compared to single antenna transmission combined with dual terminal receive diversity
WINNER D210 v10
Page 150 (180)
100 m 1 km 10 km0
20
40
60
80
100
120
cell radius
aver
age
sect
or th
roug
hput
[Mbi
ts]
EBFGOB
100 m 1 km 10 km0
20
40
60
80
100
120
cell radius
aver
age
sect
or th
roug
hput
[Mbi
ts]
MRX = 2MRX = 1
Figure G17 Average sector throughput with beamforming comparing eigenbeamforming with grid of beams (left) and comparison of terminal receive diversity with single antenna reception
(right)
100 m 1 km 10 km0
20
40
60
80
100
120
cell radius
aver
age
sect
or th
roug
hput
[Mbi
ts]
MTX = 8 MRX = 2MTX = 4 MRX = 2MTX = 2 MRX = 2MTX = 1 MRX = 1
0 50 100 1500
010203040506070809
1
prob
(use
r thr
ough
put lt
abs
ciss
a)
active radio link rate [Mbits]
100 m 1 km 10 km0
20
40
60
80
100
120
cell radius
aver
age
sect
or th
roug
hput
[Mbi
ts]
MTX = 2x4 MRX = 2 PSRCMTX = 2x2 MRX = 2 PSRCMTX = 2x1 MRX = 2 PARCMTX = 1 MRX = 1
0 50 100 1500
010203040506070809
1
prob
(use
r thr
ough
put lt
abs
ciss
a)
active radio link rate [Mbits]
Figure G18 Performance comparison of conventional beamforming with single stream transmission (left) and dual stream transmission (right) The data rate distributions are for cell
radius 700 m
To achieve very high peak data rates though one may have to consider the use of spatial multiplexing For this purpose per antenna rate control (PARC) is considered With two streams one channel coded block is transmitted from each (virtual) antenna and IRC in combination with successive interference cancellation after channel decoding is employed at the receiver side The performance of such dual stream transmission is depicted to the right in Figure G18 together with the corresponding single antenna results In this case both PARC with two antennas separated 20 wavelengths as well as the combination with EBF referred to as per stream rate control (PSRC) for four and eight antennas are considered For PSRC antennas are divided into two groups (uniform linear sub-arrays) separated 20 wavelengths within each group the element separation is half a wavelength and the two eigenvectors associated with the two largest eigenvalues of the transmit covariance matrix are used to transmit the two streams with the same
WINNER D210 v10
Page 151 (180)
power As can be seen from the lower plots in Figure G18 which show the data rate distributions for cell radius 700 m dual stream transmission does indeed increase peak data rates and for PSRC with eight transmit antennas the fraction of the users benefiting from this is non-negligible However on average dual stream transmission provide a throughput that is slightly below or similar to that of conventional single-stream beamforming with same number of antenna elements An interpretation of the rate distributions is that the increase of peak data rates comes at the expense of a reduced fairness
In summary the results indicate that transmit beamforming and terminal receive diversity are essential components to ensure good coverage of high data rates and high system throughput For beamforming with no SDMA component eigenbeamforming gives a small performance advantage compared to a grid of beams In interference limited scenarios terminal receive diversity with interference suppression gives a non-negligible performance improvement compared to maximum ratio combining The results further indicate that in the studied scenario transmit diversity using Alamoutirsquos orthogonal design gives only a marginal performance improvement compared to single antenna transmission One possible explanation of the limited gain is that the wideband channel inherently provides a large amount of frequency diversity Finally spatial multiplexing can be used to increase the peak data rates and may be successfully combined with beamforming Compared to a deployment using conventional beamforming this increase of peak data rates comes at the cost of reduced fairness although the average throughput is similar
G25 Performance of SMMSE precoding
Simulation Assumptions Simulator System level simulator 1000 snapshots 1 frame per snapshot Scenario Short range MT = 8 16 24 MR = 1 2 4 Round Robin scheduling Channel modelling A1 B1 WIMI generic channel model Multiple access Non-adaptive OFDMATDMASDMA Number of active users
variable parameter depends on the number of pilots available and the number of antennas at the user terminals
Channel estimation error modelling
Channel estimation error is modelled as a zero mean complex Gaussian variable and the variance is inversely proportional to the average receive SNR The assumed estimator gain is about GN=13 dB37
Cell radius 30 m in A1 scenario and 550 m in B1 scenario virtual overhead for parameter estimation
14 or 20 out of 80 resource elements of each chunk
SDMASMUX One spatial stream per user Maximum number of users multiplexed is fixed
SMMSE precoding is a promising spatial processing candidate for the WINNER system concept [VH04] [VH05a] [VH05b] [WIND27] In order to assess its performance for varying antenna configurations under realistic impairments system simulations have been set up for the short range isolated cell scenario
Modelling of impairments with respect to transmitterreceiver inequalities are performed according to
( ) ( ) ( )( ) ( )( ) 1~~ minus= k
BSTULkk
MSDLk KHKH
where ( )ULkH~ and ( )DLkH~ denote the uplink and downlink channel matrix respectively The terms KMS
(k) and KBS(k) represent the perturbations introduced by the transmitter and the receiver front-ends
These matrices are diagonal if we assume that the front-ends have only non-linear imperfections which implies that these matrices can be inverted and that their products are commutative The amplitude of KMS
(k) and (KBS(k))-1 is modelled as a truncated random Gaussian variable with mean 10 and variance
0007 and 00008 respectively The phase is uniformly distributed in the interval [-87o 87o] and [-30o 30o] see [BCK03]
The average number of users in the system and the overhead per chunk depends on the number of pilots multiplexed for the channel estimation from the different antennas In the proposal for the channel estimation it is assumed that we can estimate the channel from 3 antennas in the short-term adaptive mode or 6 in the long-term adaptive mode per one chunk In our simulations we rely on the assumption that the channel or the second order statistics of the channel are constant over one frame Since there are 3 time slots in the frame we multiplex in every time slot pilots from different antennas regardless of whether these antennas are located at the same terminal or not We assume that one user transmits using only one 37 Practically the estimator gain may vary depending on the number of users antennas and on the preamble design
and if correlation in frequency domain is corrected or not see [WIND21]
WINNER D210 v10
Page 152 (180)
fourth of the available bandwidth Thus the maximum number of different antennas that can be estimated in the short-term adaptive mode is 36 and the average number of users considered in the system simulations was 127 In the long-term adaptive mode the maximum number of antennas that can be estimated amounts to 72 and the average number of users considered was 27
Let us define the average correlation matrix of the ith user in the kth chunk as
( ) ( ) ( )sum=j
jki
Hjki
chunk
ki N
1 HHR
and its singular-value decomposition (SVD) as ( ) ( ) ( ) ( )Hki
ki
ki
ki VQVR = where ( )jk
iH is the ith user
channel matrix in the kth chunk The MU MIMO precoding is now performed on the equivalent channel defined as follows
( ) ( ) ( ) Hki
ki
ki VQH 21=
(
By using the equivalent channel ( )kiH
( we facilitate easier adaptation from perfect CSI to the second-
order CSI
The following notation is used to describe the simulated system MTKmaxNpilots where MT is the number of antennas at the BS Kmax is the maximum number of spatial streams per chunk and Npilots is the number of different antennas that can be estimated per chunk
0 500 1000 1500 20000
02
04
06
08
1
data rate [Mbits]
Pro
b(C
ell T
hrou
ghpu
t lt a
bsci
ssa)
cell throughput
833164316762466
0 20 40 60 80
0
02
04
06
08
1
data rate [Mbits]
Pro
b(U
ser T
hrou
ghpu
t lt a
bsci
ssa)
user throughput
83316431676data4
Figure G19 Cell and user throughput performance of SMMSE in A1 scenario
200 400 600 800 1000 1200 14000
02
04
06
08
1
data rate [Mbits]
Pro
b(C
ell T
hrou
ghpu
t lt a
bsci
ssa)
cell throughput
8431676
0 20 40 60 80
0
02
04
06
08
1
data rate [Mbits]
Pro
b(U
ser T
hrou
ghpu
t lt a
bsci
ssa)
user throughput
8431676
Figure G20 Cell and user throughput performance of SMMSE in B1 scenario
Simulation results for the A1 and B1 scenario are plotted in Figure G19 and Figure G20 In the A1 scenario the initial assumption of having 8 antennas at the BS has been shown not to be sufficient to provide 1 Gbps as a target cell throughput By increasing the pilot overhead we are able to estimate more usersrsquo channel matrices Significant cell throughput improvements can only be achieved by increasing the number of antennas at the BS as well as the number of users that are spatially multiplexed The 90 user
WINNER D210 v10
Page 153 (180)
throughput is almost constant as mobile terminals move away from the BS The 50 user throughput loss due to the increase of the distance from the BS is less than 10 Mbps
Similar as in the A1 scenario in the B1 scenario the target throughput of 600 Mbps is achieved by increasing the number of antennas at the BS and the number of users that are spatially multiplexed The values necessary to reach the target cell throughput are smaller than in A1 scenario
Hence Multi-user MIMO precoding is a powerful tool to provide the required celluser throughput It exploits the available CSI at the BS allowing very good use of the available resources in the spatial domain Benefits are limited by the overhead needed to acquire the necessary information (CSI) It was shown that this trade-off is justified and it results in high throughput gains
In order to achieve 1 Gbps in an indoor scenario we should multiplex as many users as possible with large number of antennas at the BS The maximum allowable number of users depends on the number of pilots that are multiplexed per one chunk The reduction of throughput caused by the increased pilot overhead is compensated for by SDMASMUX or higher order constellation sizes
G3 Downlink multi-user detection
G31 Comparison of receiver structures for SISO MC-CDMA Simulation Assumptions
Simulator Single-link Scenario Short range isolated cell single antenna BS and UT Channel modelling B1 clustered delay line and Independent Rayleigh Interference modelling no spreading type Walsh-Hadamard spreading length 8 MCS 1 4-QAM FEC Convolutional coding (561753)oct with memory 8
Codeword length 3328 bit
The physical layer simulation layout follows the generic WINNER transmitter structure ie the user information bits are encoded using a terminated (561753)oct rate frac12 convolutional code (3GPP) The codebits are randomly interleaved and assigned to complex valued 4-QAM data symbols using Gray mapping These user data symbols are then spread using a 8x8 Walsh-Hadamard spreading matrix which yields the data chips The chips are assigned to the used subcarriers of an OFDM symbol The codeword length ie the frame length of one transmission entity is chosen such that one terminated convolutional codeword finally forms one OFDM symbol This means contemporarily that one OFDM symbol contains exactly one userrsquos data and the user multiplexing is done in time direction ie different OFDM symbols are assigned to different users
Path loss and shadowing effects are not considered within these investigations In addition we assume that the channel is almost constant during one OFDM symbolrsquos period ie inter-carrier interference is negligible
Figure G21 show the bit error rates (BER) and the block error rate (BLER) versus the signal-to-noise ratio (SNR) respectively The SNR is defined as the ratio of the average user signal power and the variance of the complex valued additive white Gaussian noise (AWGN) in each subcarrier Solid lines show the error performances for the WINNER B1 NLOS scenario where the chips of one Walsh-Hadamard spreading entity are distributed over the whole available bandwidth This is achieved by using a subcarrier block interleaver of size 8x208 Due to multiple access interference (MAI) there is a loss of about 23 dB at a BER of 10-4 for single user detection (SUD) using MMSE equalisation compared to the interference free (perfect IC) case where we assume and subtract MAI perfectly To combat MAI at the receiver we use a soft parallel interference canceller (SPIC) as described in the WINNER deliverable D26 [WIND26] The BLER performance of the SPIC with 5 iterations almost reaches the perfect IC bound as it can be seen from Figure G21 right plot For comparison we show results for an independent Rayleigh fading channel which provides maximum (frequency) diversity and the B1 NLOS without subcarrier interleaving Due to an increased MAI the gap between the perfect IC and the SUD performance is even higher compared to B1 NLOS If however we skip the subcarrier interleaver for the B1 NLOS scenario we observe almost no MAI since chips are spread over adjacent subcarriers which due to strong correlation maintain orthogonality of the spreading sequences quite well This results in a negligible difference of SUD and perfect IC error performances In this case we cannot benefit from the more complex SPIC receiver
WINNER D210 v10
Page 154 (180)
0 2 4 6 810-6
10-4
10-2
100
SNR [dB]
BE
R
0 2 4 6 810-3
10-2
10-1
100
SNR [dB]
FER
BLE
R
Figure G21 BER and BLER vs SNR for B1 NLOS and independent Rayleigh fading
G32 Comparison of receiver structures for MIMO MC-CDMA
Simulation Assumptions Simulator link-level Scenario short range MT = 4 MR = 4 Channel modelling B3NLOS WIMI Multiple access MC-CDMATDMA MCS 1 QPSK r=12 FEC punctured turbo coding (1513)oct with memory 4
codeword length fixed size of 6656
A downlink MIMO MC-CDMA system is considered where K users are active in each cell The desired user is located in the central cell The spreading factor (in frequency domain) is G (reducing to OFDM iff G=1) The input data bits are encoded by the single antenna turbo code (TC) or by space-frequency turbo-coded modulation (SFTuCM) which is designed for two transmit antennas We divide the available transmit antennas into independent layers denoted as J=MTJ0 where J0 is the number of antennas associated with the encoder For the single antenna turbo code J0=1 whereas J0=2 in the SFTuCM case A vertical layering structure is applied where the encoded and modulation mapped symbols are multiplexed for J transmit antenna groups By doing so the spatial diversity gain the space-time coding gain (in case of SFTuCM) and spatial multiplexing gain can be achieved simultaneously The MMSE based detectors for the multiple antenna MC-CDMA approach considered herein are relying on the techniques presented in [WIND23 WIND26] In order to achieve better spatial receiver diversity compared to linear receiver the principle of iterative detection and decoding (IDD) can be employed with the considered symbol level SF-MMSE receiver The soft interference cancellation with IDD is considered herein
Figure G22 Performance of layered MIMO MC-CDMA systems
WINNER D210 v10
Page 155 (180)
The simulation performance of the MC-CDMA based downlink with G=K=8 and MR = MT =4 is shown in Figure G22 The scenarios B3 with NLOS clustered delay line model was considered The system with SFTuCM and group-wise layering outperforms the system with turbo-coded system The soft co-antenna interference (CAI) cancellation is shown to possess the ability to further improve the performance Our results indicate that the considered OFDM and MC-CDMA systems are feasible candidates for future cellular high data rate downlink packet transmission For the SFTuCM coded systems the complexity is at the same level as the turbo-coded systems
G4 Uplink multiple access
G41 Performance of single carrier based adaptive TDMA Simulation Assumptions
Simulator Multi-link Scenario Wide area single-cell SISO perfect synch and long-term power control Channel modelling ITU-IV Channel A MCS Uncoded BPSK 4QAM 8PSK 16QAM 32CrossQAM 64QAM
128CrossQAM and 256QAM Uplink spectrum 44 GHz carrier frequency and 25 MHz bandwidth Single-carrier parameters Symbol time 4923 ns Square-root-raised-cosine roll-off factor 0231 Data block size 416 symbols and guard period 256 micros covers most multi-path delay spread Frame size 16 Data blocks (time slots) individually allocated to TDMA users
Performance results for an adaptive TDMA block-based single-carrier uplink are provided This uplink performs multi-user adaptive scheduling to the small scale fading for the individual users and also link adaptation of the scheduled users Thus it is time-adaptive towards the small-scale fading but not frequency-adaptive since it uses single-carrier transmission The aim of the investigation is to show the potential multi-user diversity gains that can be obtained The results are extended simulation results to the work in [WOSS05] where an analytical performance analysis and more details of the design and assumptions behind the investigated uplink can be found The cyclic prefix of each Data block (time slot) is designed to cover most of the multi-path delay spread Thus no inter-Data block ISI is assumed and the FD-DFE [FA02] performs equalisation of the ISI among symbols within each Data block only
0 5 10 15 200
05
1
15
2
25
3
35
4
45
Number of users
Spe
ctra
l Effi
cien
cy [b
itss
Hz]
Analysis 10 dBAnalysis 16 dBAnalysis 19 dBSimulation 10 dBSimulation 16 dBSimulation 19 dB
Figure G23 Multi-user diversity gains for the adaptive TDMA single-carrier uplink
In the simulations results in Figure G23 all users have the same average SNR and the user speed is 50 kmh for all users The scheduler performs max throughput scheduling based on equalised user SNR Perfect estimation and prediction of the impulse responses of each time-slot of each user are assumed Thus the results are upper bounds on the attainable spectral efficiency Note also that Figure G23 does not include overhead related to channel estimation and prediction (approx 15) In addition only the signalling bandwidth is taken into account ie the spectral roll-off (231) is not compensated for As seen there is a multi-user diversity gain for this uplink However compared to the multi-user diversity gains for systems with more narrow bandwidths as investigated in [WOSS05] the gain is smaller The reason for this is the channel averaging caused by the frequency diversity for the wideband channels This
WINNER D210 v10
Page 156 (180)
makes the variability of the instantaneous channels from the individual users to be smaller which in turn limits the obtainable amount of multi-user diversity gain
A fair comparison between the investigated adaptive TDMA single-carrier uplink and an adaptive TDMAOFDMA uplink has to take especially the pilot overhead feedback information rate subcarrier frequency offset and peak-to-average power ratio (PAPR) mitigation into account Preliminary results not shown here indicate that for a 5 MHz wide uplink channel there is at least 3 dB gain for the adaptive TDMAOFDMA uplink with 2 frequency offset of the subcarrier spacing compared to the adaptive TDMA single-carrier uplink and before PAPR mitigation loss Thus an adaptive multi-carrier based TDMAOFDMA uplink seems more promising as an adaptive uplink for the WINNER system concept
G42 Comparison of IFDMA and chunk based OFDMA
Simulation Assumptions Simulator Link level Scenario wide area MT = 1 MR = 1 mobility 70 kmh for all mobiles single user
considerations Channel modelling COST 207 TU Interference modelling no inter-cell interference OFDM parameter Number of used subcarrier = 512 subcarrier distance = 390625 kHz
guard period = 7 micros MCS 1 QPSK r=12 FEC convolutional coding (133171)oct with memory 6
Codeword length fixed size of 1000 bits
The purpose was to investigate the impact of frequency diversity on performance for IFDMA with interleaved subcarrier allocation compared to DFT-precoded OFDMA with block-wise subcarrier allocation As expected for coded transmission over a very frequency selective mobile radio channel as the one assumed IFDMA shows significant better performance compared to DFT-precoded block OFDMA for a number of subcarriers per user Qgt1 This is due to the fact that in IFDMA the subcarriers are equidistantly distributed over the total bandwidth of 20 MHz whereas for DFT-precoded OFDMA only a fraction of the bandwidth is used for transmission For Q=1 ie each user gets only a single subcarrier both schemes exhibits the same performance and cannot exploit frequency diversity
-5 0 5 10 15 20 25
10-3
10-2
10-1
100
SNR [dB]
BE
R
OFDM Q=1OFDM Q=4OFDM Q=16IFDMA Q=1IFDMA Q=4IFDMA Q=16
Figure G24 BER comparison for IFDMA and DFT-precoded block OFDMA for various number of allocated subcarriers per user Q
The SNR gains of IFDMA compared to DFT-precoded block OFDMA at BER=10-3 for an interleaving depth of about 250micros is still 55 dB at a not too low data-rate ie 625 Kbits It is expected that also for transmission using block codes and for the use of the WINNER channel model the same effect can be shown However further studies are required to assess the impact of real channel estimation as well as imperfectly synchronised and power controlled UTrsquos for either case which might reduce the interleaving gain considerably
WINNER D210 v10
Page 157 (180)
G43 Performance of adaptive OFDMA Simulation Assumptions
Simulator Multi-link Scenario Short range isolated cell single antenna BS and UT Channel modelling A1 LOS NLOS B1 LOS NLOS including path loss and shadow fading Cell radius 50 m for A1 150 m for B1 MCS 4 BPSK 4 16 64 QAM generally considered by SNR gap approximation
and SNR gap Γ = 5 dB FEC convolutional coding (561753)oct with memory 8 code rate 12
Codeword length 240 times (number of bits per symbol) not relevant for results User distribution ( ) KkrKkdk 110middot)1()1(91 cell K=minusminus+=
The performance of frequency adaptive OFDMA (subcarrier based and chunk based) is evaluated by multi-link simulations The considered adaptive OFDMA scheme maximises the sum rate of all users under individual transmit power constraints for which an extremely simple and efficient algorithm for adaptive chunk allocation is found to perform well The adaptive scheme is appropriate for the uplink in the short-range case where the channel is quasi-static and CSI is available at the transmitter
We consider the effects of the channel estimation and prediction by a simple Gaussian error model The largest prediction horizon for the TDD mode is L = 1 ms [WIND24] Table 31) In the B1 scenario the fastest users move at an average speed of v = 5 kmh (see Appendix E3) the carrier frequency is fc = 5 GHz which gives a prediction horizon in fractions of wavelength of 020=λ= cvLl This prediction horizon is rather short in comparison to those considered in [WIND24] Section 313 and it is thus expected that the CSI feedback delay has no significant effects for the A1 and B1 scenario The channel predictor estimates the power gain 2
nn hg = Due to channel estimation errors and the inevitable feedback delay the estimation is slightly degraded In the following we consider this effect by the simple model ( )nnn gg η+= 1ˆ where nη is )0( 2
eσΝ distributed and 2eσ denotes the normalised estimation and
prediction error The instantaneous SNR is given by 002 NpgNph nnnnn ==γ and the estimated SNR
is ( )nnnnn Npg η+γ==γ 1ˆˆ 0 For the simulation of the BER for the selected MCS first the SNR nγ is selected and then for each codeword an estimated SNR is generated The final BER is averaged over many codewords
In Table G1 the minimum SNR for a target BER of 4b 10minus=P for each MCS is given The SNR gap Γ
denotes the additional required SNR in comparison to the Shannon limit to reach the same bit rate at the target BER ( ) )12(1log minmin2 minusγ=ΓrArrΓγ+= RR The average SNR gap for 0102 =σe is
dB5asympΓ which will be used in the following to consider the effects of realistic adaptive modulation and coding
Table G1 Minimum SNR for selected modulation scheme
02 =σe 0102 =σe code rate modulation SNR γmin SNR gap Γ SNR γmin SNR gap Γ 05 BPSK 05 dB 43 dB 09 dB 47 dB 1 QPSK 35 dB 35 dB 39 dB 39 dB 2 16-QAM 95 dB 47 dB 99 dB 51 dB 3 64-QAM 146 dB 61 dB 148 dB 63 dB
Adaptation Problem and Key Design Criteria The multiple-access scheme has to adapt to the traffic and the QoS requirements as well as to the channel of multiple users Since joint adaptation to all parameters would result in an impractically complex optimisation problem it seems wise to separate the problem into two adaptation steps
1 Scheduling Adaptation to traffic and QoS requirements like bit rate delay queue length and userserviceflow priorities including ldquofairnessrdquo
2 Adaptation to the channel state ie the channel gain to noise ratio
The priorities of users services or flows as well as the exact definition of fairness will depend mainly on the operatorrsquos adopted strategy and business model The scheduling strategy hence must be flexible and is not only dictated by technical arguments In the following we present an adaptive scheme which adapts
WINNER D210 v10
Page 158 (180)
to the channel only and offers to the scheduler the possibility to operate near the border of the channel capacity region The limits of this region are established in [Yu02] and [Tse98] however no algorithm which is simple enough for practical implementation and achieves all border points of the capacity region is known In [PI05] the scheduling region which is achievable with a relatively simple algorithm and which may yield a good approximation to the true capacity region is outlined
The cell capacity for the uplink can be computed by the iterative water-filling (IWF) algorithm [Yu04] which can be adapted easily to OFDMA [Pfl05 PI05] This algorithm computes the optimum power allocation for all users The rate obtained with this algorithm corresponds to the Shannon capacity which can serve as an upper bound A more realistic rate is obtained by considering an SNR gap of Γ = 5 dB which takes into account the considered link adaptation schemes
Figure G25 depicts the sum rates achieved with the optimum IWF algorithm for all four short-range scenarios with and without considering the SNR gap As was also observed in [PI05] ndash although theoretically optimum ndash sharing the subcarriers does not yield any perceivable capacity gain In other words adding an additional CDMA or TDMA component to OFDMA will only increase the system complexity but not give any capacity gain38
0 10 20 30 40 500
100
200
300
400
500
600
700
num ber of users K
sum
rate
[Mbi
ts]
A1 LOS
sum rate Γ=0dBsum rate Γ=5dBno subchannel sharingsubchannel sharing
0 10 20 30 40 500
100
200
300
400
500
600
700
num ber of users K
sum
rate
[Mbi
ts]
A1 NLOS
0 10 20 30 40 500
100
200
300
400
500
600
num ber of users K
sum
rate
[Mbi
ts]
B1 LOS
0 10 20 30 40 500
50
100
150
200
num ber of users K
sum
rate
[Mbi
ts]
B1 NLOS
Figure G25 Uplink cell capacity for OFDMA with N = 1664 subcarriers and constant user density in the cell The performance loss due to allowing only one user per subcarrier is negligible for all
considered cases
In the TDD mode nsub = 16 subcarriers are grouped into one chunk The application of the IWF algorithm to chunks instead of subcarriers is straightforward and the maximum sum rates achieved with a chunk-based (ie with subcarrier groups) OFDMA scheme is given in Figure G26 Naturally the cell capacity of chunk-based OFDMA is inferior but the system complexity as well as the algorithm run-times are significantly lower For practical implementations the complexity of the IWF algorithm might be an obstacle but fortunately there is a low-complexity alternative The XP algorithm [Ace05] (see also [PI05]) is an extremely simple and efficient method for adaptive subcarrier allocation which attains nearly the same sum rate as the optimum IWF algorithm In Figure G26 the sum rate for a fixed subcarrier allocation is given as a reference The subcarrier allocation for this case is given by
38 Note that this statement holds for the short-range uplink and for the sum rate optimisation criterion This does not
contradict the results obtained in eg [Tri04]
WINNER D210 v10
Page 159 (180)
( ) 11mod +minus= fa Kf where af denotes the user allocated to subcarrier f For each user single-user water-filling is performed on his set of subcarriers to compute the resulting sum rate Surprisingly for the lsquoA1 LOSrsquo scenario this simple non-adaptive subcarrier allocation performs close to the optimum solution and even better than the XP algorithm while for the lsquoB1 LOSrsquo case it comes with a significant capacity penalty
0 10 20 30 40 500
100
200
300
400
500
600
700
num ber of users K
sum
rate
[Mbi
ts]
A1 LOS
0 10 20 30 40 500
100
200
300
400
500
600
700
num ber of users K
sum
rate
[Mbi
ts]
A1 NLOS
0 10 20 30 40 500
100
200
300
400
500
600
num ber of users K
sum
rate
[Mbi
ts]
B1 LOS
0 10 20 30 40 500
50
100
150
200
num ber of users K
sum
rate
[Mbi
ts]
B1 NLOS
IWFXPFixed allocation
Figure G26 Sum rate achieved with chunk-based OFDMA (Γ=5 dB) The optimum IWF (iterative water-filling) algorithm achieves the highest rate while the rate achieved with the low-complexity
XP algorithm [Ace05] is only slightly lower
Conclusions The considered adaptive OFDMA scheme maximises the sum rate of all users under individual transmit power constraints It is appropriate for the uplink in the short-range case where the channel is quasi-static and CSI is available at the transmitter The achievable gain is rather low compared to non-adaptive subcarrier allocation if LOS conditions prevail However in NLOS conditions with sufficient frequency-selectivity considerable performance improvements can be obtained
The considered optimisation criterion consciously excludes fairness issues since different notions of fairness exist and these may depend on the operatorsrsquo preferences ldquoFairnessrdquo and other QoS-related constraints can be included by a traffic-aware scheduler which selects for each Frame the appropriate subset of active users
The simulation results show the achievable sum rate per cell or sector in the uplink when both terminal and base station have one antenna The sum rates for an SNR gap of Γ = 0 dB are strict upper bounds while the rates for Γ = 5 dB consider the effect of realistic modulation and coding schemes
G44 Comparison of adaptive OFDMA and OFDM-TDMA
Simulation Assumptions Simulator Multi-link 8 Frames per snapshot 6000 snapshots Scenario Short range isolated cell single antenna BS and UT no power control Channel modelling A1 LOS and NLOS clustered delay line model Cell radius 100 m and 200 m MCS 5 BPSK r=13 BPSK r=23 QPSK r=23 16-QAM r=23 64-QAM
WINNER D210 v10
Page 160 (180)
r=89 FEC Punctured convolutional coding (133171145)oct with memory 6
codeword length variable ndash one codeword always fills one chunk (OFDMA) or one symbol (TDMA)
Type of feedback Average SINR per chunk (OFDMA) or symbol (OFDM-TDMA) Feedback delay 1 Frame Overhead Chunkrsquos overhead 175 tail of CC duplex time Mobile speed anglev sim U(02π) vx sim η(mσ 2) vy sim η(mσ 2) |v|= (vx
2+vy2)05
m = 1 kmh σ = 16 kmh
The performance of OFDMA and TDMA is assessed for the uplink considering several scheduling variants Common to all these variants is a two step approach in the first step a decision is taken which 8 users (out of 40 or 80 users) will be served and in the second step it is decided how many and what resources are assigned to the selected users
In case of Round Robin (RR) both users and resources are sequentially selected and linked With the MaxSNR1 approach the 8 users with the highest SNR are selected in the first step Then equal amount of resources are allocated to these users in a round robin manner With MaxSNR2 users are selected via round robin but the resource allocation is performed according to the maximum rate sharing principle Step one is the same for the fair rate (FR) scheduler but in step two each user gets a fraction of the resources which is inversely proportional to the userrsquos transmission rate In the second version (FR2) the resource assignment decision is made to maximise the overall frame throughput
Note that very simple link adaptation based on the average SNR was applied using reference curves from AWGN link level simulations Since such a model is suboptimum for TDMA (where the codeword suffers from frequency-selectivity) the comparison of both MA schemes is to a certain extent unfair
Independent encoding of each chunk with tail as considered in case of OFDMA increases the overhead and causes the overall throughput to decrease This factor is more significant for low quality channels (large distances between the UT and BS) when low order modulations and strong coding schemes are applied The measured loss with Round Robin scheduling is about 37 for 100 meter cells and about 69 for 200 meter cells on average however users at the cell edge experience a throughput loss higher than 7 and 11 respectively
The calculated average cell throughput obtained with RR scheduling for 100 meter cell radius and 40 users is equal to 7138 Mbps for OFDMA and 7335 for TDMA The MaxSNR1 scheduling algorithm adaptively selects the users to be served and thus offers an increase of the overall cell throughput to 14784 Mbps and 15315 Mbps respectively It should be stressed that similar results are obtained for both OFDMA and TDMA since no fully adaptive scheduling has been applied one part of the chain ie either user selection or resource assignment is always based on round robin For the MaxSNR2 algorithm the average cell throughput is about 7 Mbps lower than for MaxSNR1 and for Fair Rate scheduling the average cell throughput for OFDMA is equal to 4667 Mbps only Scheduling of users on the equal time sharing base (RR MaxSNR2 FR) slightly decreases the overall cell throughput for higher number of allocated users (by about 02 - 04 for 80 allocated users) Increase of the cell radius from 100 m to 200 m decreases the average cellrsquos throughput by about 50 for RR 19 for MaxSNR1 17 for MaxSNR2 and 68 for FR scheduling
0
5
10
15
20
25
0 20 40 60 80 100 120 140 160 180 200
distance [m]
Ave
rage
use
rs th
roug
hput
[Mbp
s]
RR TDMARR FDMAMaxSNR1 FDMAMaxSNR1 TDMAFR1 FDMAFR2 FDMA
0
20
40
60
80
100
120
140
160
0 20 40 60 80 100 120 140 160 180 200
distance [m]
Ave
rage
use
rs th
roug
hput
[Mbp
s]
MaxSNR2 FDMAMaxSNR2 TDMAMaxSNR1 FDMAMaxSNR1 TDMA
Figure G27 Average userrsquos throughput vs distance for different scheduling variants considering 40 users throughput figures are averaged across served users only
WINNER D210 v10
Page 161 (180)
Simulation results showing the average user throughput versus distance with the different scheduling algorithms discussed are shown in Figure G27 The average user throughput obtained with FR (left plot) drops very slightly with distance (in contrast to RR) however the price to be paid is its lower overall throughput Application of the FR2 increases the overall throughput only slightly compared to FR In case of MaxSNR1 the average throughput drops for the middle range users but compared to fair rate scheduling a much higher user throughput is achieved As depicted in the right plot of Figure G27 MaxSNR2 scheduling achieves dramatically higher throughput values for users located close to the base station than MaxSNR1 albeit at the expense of serving some users not at all (mainly those far away from the BS)
Results presented to far reveal the large impact of scheduling algorithms on cell throughput and fairness The two step scheduling approach considered here enables a trade-off between both aspects Further refinement is required to be able to exploit the multi-user-diversity potential of chunk based OFDMA and compare the results to the well known class of proportional fair scheduling algorithms
G5 Uplink spatial processing
G51 Performance of spatial diversity Simulation Assumptions
Simulator System 19 three-sector sites full interference modelling using wrap-around Scenario cellular on average 10 userssector frequency reuse 1
MT = 1 MR le 8 varying cell radius Channel model C2 NLOS WINNER interim channel model (WIMI) MCS Modulation schemes QPSK 16QAM and 64QAM
Channel code rates 110 13 12 23 34 and 89
FEC
Turbo code combined with Layer 1 code block segmentation (up to 5114 bits per block) and rate matching codeword length from 998 (QPSK rate 110) to 26624 bits (64QAM rate 89) rate 17 mother code (polynomials feedback 013 feedforward 015 017 011)
FeedbackOverhead Chunk SINR after receiver processing zero delay no overhead
A non-frequency adaptive uplink based on OFDM is considered The performance of the uplink access method is evaluated using different number of base station antennas in order to demonstrate the importance of antenna diversity Performance is compared for different cell sizes and in terms of average sector throughput and active radio link data rates The latter measure is the (average) user throughput when scheduled for transmission Since round robin TDMA scheduling is applied the active radio link data rate may be used to assess the fairness in the network Furthermore because many idealised assumptions are made one should not focus on the absolute performance figures but rather on the relative performance
Figure G28 shows the average uplink throughput for different number of base station antennas and for different diversity combining schemes namely MRC and IRC The antenna element spacing at the base station is half a wavelength (left) and four wavelengths (right) With tightly spaced antennas the gain of multiple antennas at the base station and MRC is in the order of 35ndash50 80ndash110 and 130-220 for two four and eight antennas respectively IRC which performs inter-cell interference suppression provides an additional gain of up to 10 20 and 25 With a wider antenna separation the diversity gain is enhanced even further and in particular the gain of IRC over MRC is more evident In interference-limited deployments the performance with four antennas and IRC is comparable to the performance with eight antennas and MRC
The lower plots depict uplink data rate distributions in a deployment in which cells have a radius of 700 m The distributions indicate that in order to provide high uplink data rates to a large fraction of the user population multiple base stations receive antennas are a very useful means
In summary base station receive diversity may significantly improve the uplink performance Such solutions increase total throughput and enhances data rates for all users Performance improves as expected with larger antenna separation and the results further indicate that IRC with a lower number of antennas may give similar performance as MRC with a larger number of antennas It should be kept in mind however that the inter-cell interference suppression gains of IRC relative to MRC may be smaller when estimation errors are considered
WINNER D210 v10
Page 162 (180)
100 m 1 km 10 km0
20
40
60
80
cell radius
aver
age
sect
or th
roug
hput
[Mbi
ts]
IRC (05 λ)MRC (05 λ)
0 20 40 60 800
010203040506070809
1
prob
(use
r thr
ough
put lt
abs
ciss
a)
active radio link rate [Mbits]
100 m 1 km 10 km0
20
40
60
80
active radio link rate [Mbits]
aver
age
sect
or th
roug
hput
[Mbi
ts]
IRC (4 λ)MRC (4 λ)
0 20 40 60 800
010203040506070809
1
prob
(use
r thr
ough
put lt
abs
ciss
a)
active radio link rate [Mbits]
Figure G28 Average uplink throughput and active radio link distributions for different number of base station receive antennas combining schemes and antenna element separations
G52 Linear precoding concepts with long term channel state information In the wide-area scenario the instantaneous CSI is not available at the transmitters due to the high mobility Therefore linear precoding is performed at the mobiles based on long-term CSI Long-term CSI are either the channel mean components (first moment of the channels ndash mean feedback) or the channel correlation matrices (second moment of the channels ndash covariance feedback) In general there are two ways to obtain long-term CSI implicit or explicit feedback
In TDD mode under the reciprocity assumption the downlink channel estimation can be reused for uplink transmission After estimation of the channel during downlink transmission the instantaneous channel at time t+τ that is seen by the mobile is modelled by the sum of the estimated channel matrix and a noise matrix This channel can be interpreted as an MIMO channel with effective LOS component The K factor corresponds to the quality of the channel estimate In the explicit form of mean-feedback the base station performs channel estimation averages over many blocks and transmits the mean matrix back over a control channel
In FDD mode the receiver estimates the correlation matrix on the set of carriers used for downlink transmission [BM04] There are two key issues regarding the efficiency of estimating the covariance matrix in this way The covariance must vary slowly enough ie the estimate is still valid when the base station is sending to user k There must be enough carriers in the set to well approximate the actual covariance matrix The explicit covariance feedback scenario is similar to the explicit mean feedback scenario discussed before The base collects the necessary channel statistics and feeds back the channel covariance matrix to the mobiles
Let assume the multi-user linear MMSE multi-user receiver is used at the base station Then the performance criterion is the average total sum MSE [JB03] The corresponding programming problem is given by minimizing the total sum MSE under individual power constraints Beamforming of user k on carrier n with the eigenvectors of the transmit covariance matrix power allocation of user k on carrier n with the eigenvalues of the transmit covariance matrix and resource allocation is described by the individual MSE of user k on carrier n
WINNER D210 v10
Page 163 (180)
If implicit feedback is used then the optimal beamforming directions of all users correspond to the eigenvectors of the effective LOS-component for mean feedback or the eigenvectors of the channel transmit correlation matrix for covariance feedback The resulting power allocation problem is characterised by the range in which a single-beam per user achieves the sum performance For sum capacity the analysis was performed in [SU05] The theoretical results and the corresponding SCME channel model results are shown in Figure G29
0 05 1 15 20
02
04
06
08
1
12
P λ11
P λ 1
2
MIMO 2x2
K=1K=2K=3K=4K=10
micmac
-2 -1 0 1 205
1
15
2
25
P λ1
ε
MIMO 2x2
K=1K=2K=3K=5K=10
Beamforming NOT optimal
Beamformingoptimal
Beamformingoptimal
Umi Uma Sma
Figure G29 Beamforming optimality range for covariance and mean feedback in theory and
WINNER SCME channel models (micro urban [umi] macro urban [uma] and macro suburban [sma])
Here P is the total transmit power M is the largest mean component λ11 and λ12 are the largest and second largest eigenvalue of the transmit correlation matrix of user one The term ε represents the beamforming condition function ie if ε gt 1 then beamforming is optimal Observe that for two transmit and two receive antennas single stream beamforming is optimal for two and more users Other antenna configurations are to be analyzed
G6 Uplink multi-user detection
G61 Comparison of receiver structures for DS-CDMA
Simulation Assumptions Simulator Multi-link Scenario wide area cellular frequency reuse 1 single antenna BS and UT average
(slow) power control Channel modelling C2 NLOS WIMI Interference modelling Interference generated by neighbour cells active users (6 cells surrounding
the cell of interest) Assume same number of active users in all cells MCS 1 BPSK FEC convolutional coding (561753)oct with memory 8 code rate 12
Codeword length 702 bits spreading Walsh-Hadamard spreading length 16 Cyclic Prefix length 52 chips (block oriented transmission) Overhead Total overhead of 23 taken into account in TX-power and resources Mobile speed 50 1 kmh 50 25 kmh User spatial distribution
( ) KkrKkdk 110middot)1()1(91 cell K=minusminus+=
The focus has been placed on evaluating performance of various reduced complexity receivers for the uplink in the wide area non-frequency adaptive WINNER mode for single carrier DS-CDMA where the multi-carrier approach could encounter important challenges Two transmission schemes are compared a time domain processing receiver based on conventional RAKE receiver and a frequency domain processing receiver that makes use of cyclic prefix (CP) In both cases several iterative implementations of the multi-user detector are investigated Motivated by complexity constraints the focus is on linear multi-user detectors The complexity of the MMSE receiver is dominated by the calculation of the MMSE filter which requires a large matrix inversion Rather than direct matrix inversion we use iterative methods for solution of linear systems concentrating on the Successive Over-relaxation (SOR) method associated with serial interference cancellation and the Chebyshev method associated with parallel
WINNER D210 v10
Page 164 (180)
interference cancellation The details and formulation of multi-user receiver in either domain and the proposed reduced complexity methods for the implementation of a linear multi-user receiver can be found in [IN05][WIND26]
-4 -2 0 2 4 6 810
-4
10-3
10-2
10-1
100
EbN0 (dB)
Bit
Erro
r Rat
e
MF(no intercell interf)MMSE(no intercell interf)MMSE-SOR 6 iter(no intercell interf)MMSE(intercell interf)MMSE-SOR 6 iter(intercell interf)
Figure G30 BER performance of a low complexity frequency domain MMSE receiver in presence
of inter-cell interference
Based on link level simulations results in terms on convergence and performance for single cell scenario where results showed that convergence of the iterative implementation of the TD receiver is substantially slower than for the FD receiver being in both cases faster for the SOR iterative implementation of the MMSE filter than for the first order Chebyshev iterative implementation we focus on the FD receiver and SOR implementation of the MMSE detector for the multi-cell multi-link evaluation Shown in Figure G30 is the coded BER performance of FD receiver in presence of inter-cell interference compare to no inter-cell interference for a 50 loaded system where the performance for the iterative implementation of the MMSE detector is shown for 6 iterations Similar results have been obtained for other system loads
To conclude it is feasible to achieve MMSE performance with a reduced complexity implementation with only a few iterations required Yet the single carrier DS-CDMA approach will require a multi-user detector
G62 Comparison of receiver structures for MIMO single carrier
Simulation Assumptions Simulator multi-link Scenario wide area isolated cell MT = 2 4 MR = 4 1ndash4 users Channel modelling C2 NLOSWIMI Interference modelling no inter-cell interference Multiple access TDMASDMA MCS 1 QPSK r=12 (SM-MIMO with turbo coding)
1 BPSK r=13 (ST-WNRA) FEC punctured turbo coding (1513)oct with memory 4
space-time weighted non-binary repeat accumulate coding codeword length fixed size of 1664 bits
Serial modulation for wide area uplink was investigated for the case of single-input-single-output (SISO) transmission with non iterative and iterative frequency domain receivers in [WIND21 WIND23] In order to further enhance uplink performance link-adaptation and MIMO techniques are the focus of further study In this section only MIMO techniques are considered further information about different link adaptation techniques can be found in [WIND23] By using at least one of these key technologies bandwidth efficiency can be enhanced and transmission power of terminal can be reduced As a result of this improved uplink performance turns into larger coverage and higher data rates The goal of this section is to introduce two MIMO techniques for wide area uplink with serially modulated multipointpoint to point transmission Channel state information is not required at the transmitter and iterative frequency domain processing is performed at the receiver
WINNER D210 v10
Page 165 (180)
Figure G31 Transmitter block diagram of space-time weighted nonbinary repeat accumulate (ST-WNRA) coded multipointpoint-to-point MIMO for serially modulated MIMO transmission
Figure G31 illustrates the transmitter block diagram of ST-WNRA coded MIMO The ST-WNRA encoder consists of two main parts a repeater and the concatenation of a weighter and an accumulator The function of the repeater is to provide coding gain and the concatenation of the weighter and accumulator is to provide full rank over the whole encoded data Therefore ST-WNRA codes can provide full transmit antenna diversity for any number of transmitter antennas in single user flat fading channels with low encoding and decoding complexity The full transmit antenna diversity can be only obtained by using BPSK as underlying modulation method because the full rank property is only retained in the binary field The interested reader is referred to [OY03] for more in-depth information about ST-WNRA codes The maximum achievable diversity order with ST-WNRA codes using the proposed iterative frequency domain reception is given as MT times L times MR where MT L and MR are the number transmit antennas the number of multi-paths and the number of receiver antennas respectively Since ST-WNRA is a pure diversity based MIMO technique the maximum transmission rate is constrained to one However the transmission rate can be enhanced by using a multilevel approach that is briefly described in the next subsection Finally it should be noticed that ST-WNRA codes are more flexible compared to other space-time codes that provide both coding and diversity gain eg space-time trellis and space-time turbo codes Flexibility is an important factor when capability to support for any number of transmitter antennas and short frame lengths is required
Figure G32 Transmitter block diagram of spatially multiplexed vertically encoded multipointpoint-to-point MIMO for serially modulated transmission
Figure G32 presents the transmitter block diagram for the well-known vertically encoded spatially multiplexed MIMO transmission In this scheme the input bit stream undergoes temporal encoding modulation and interleaving after it is demultiplexed into NT streams transmitted for individual antennas Obviously the purpose of this technique is just to maximise multiplexing gain Therefore the maximum achievable diversity order by using convolutionalturbo codes and with the proposed iterative frequency domain reception is given as L times MR Further details of this scheme can be found from [SD01]
The parameters used in the simulations are as follows for ST-WNRA multi-user MIMO the channel is typical urban C2 2 transmit antennas per user 4 receive antennas repetition rate 3 3 decoder iterations 4 equaliser iterations the number of users ranges from 1 to 4 Iterative frequency domain joint-over-antenna multi-user MIMO receiver is used For spatially multiplexed turbo-coded multi-user MIMO the parameters are the same except for the code rate being frac12 (generator polynomials (1513)) QPSK modulation
Figure G33 presents the simulation results of ST-WNRA and spatially multiplexed vertically turbo-coded multi-user MIMO ST-WNRA outperforms spatially multiplexed vertically coded MIMO However the maximum spectral efficiency in the case of ST-WNRA is 266 bitHzs whereas with spatially multiplexed case it is 8 bitHzs The results also show that with joint-over-antenna signal detection technique the same diversity order is maintained for each of the users Only a parallel shift is observed when the number of users is increased This is due to fact that joint-over-antenna technique can preserve the degrees of freedom for the joint-detection of interference and the signal of interest
Encoder πB
Modulator πS
SP
GI
GI
D
Symbol toBPSK
Mapper
Repeater
Weighter π πIGI
GI
ST-WNRA
SP
WINNER D210 v10
Page 166 (180)
BLE
R
Figure G33 BLER performance vs SNR of serially modulated multi-user MIMO transmission in typical urban C2 Scenario (each user has 2 transmitter antennas and base station has 4 receiver
antennas number of users U = 1234)
G7 Other topics
G71 OFDM versus single carrier based uplinks
Simulation Assumptions Simulator System 19 three-sector sites full interference modelling using wrap-around Scenario cellular on average 10 userssector frequency reuse 1
MT = 1 MR = 4 varying cell radius Channel model C2 NLOS WINNER interim channel model (WIMI) MCS Modulation schemes QPSK 16-QAM and 64-QAM
Channel code rates 110 13 12 23 34 and 89
FEC
Turbo code combined with Layer 1 code block segmentation (up to 5114 bits per block) and rate matching codeword length from 998 (QPSK rate 110) to 26624 bits (64QAM rate 89) rate 17 mother code (polynomials feedback 013 feedforward 015 017 011)
FeedbackOverhead Chunk SINR after receiver processing zero delay no overhead
A non-frequency adaptive uplink based on OFDM or single-carrier transmission is considered The impact of the high PAPR of the OFDM signal is coarsely modelled by introducing a power backoff factor that reduces the maximum terminal output power In case single-carrier transmission is considered a linear MMSE frequency domain equaliser (FDE) is assumed to be used in the base station receiver Performance is compared for different cell sizes and in terms of average sector throughput and active radio link data rates The active radio link data rate is the (average) user throughput when scheduled for transmission Since round robin TDMA scheduling is applied the active radio link rate may be used to assess the fairness in the network Because many idealised assumptions are made one should not focus on the absolute performance figures but rather on the relative performance
Investigations of single-carrier and multi-carrier modulation techniques in Appendix B indicate that the PAPR of an OFDM signal and the required power backoff is typically 2ndash3 dB higher than that of a single-carrier signal To capture the high PAPR of the OFDM signal OFDM transmission is in here modelled with a power backoff (pbo) of 2 dB As a reference case OFDM transmission without any power backoff (0 dB) is studied as well In the left part of Figure G34 the performance of an uplink access scheme using OFDM transmission is compared to a single-carrier transmission scheme in terms of average sector throughput Base stations are equipped with four antennas separated four wavelengths and IRC is used to suppress inter-cell interference The results indicate that in interference limited scenarios
WINNER D210 v10
Page 167 (180)
ie for small cells OFDM has a small performance advantage thanks to the absence of inter-symbol interference Note further that in such interference limited deployments the OFDM power backoff is of limited importance In large cell deployments in which noise rather than interference limits performance single-carrier transmission provides better performance thanks to the higher output power (compared to OFDM with a 2 dB power backoff) The right plot shows data rate distributions for cell radius 700 m The plot indicates that compared to OFDM with a 2 dB power backoff single-carrier transmission provides a small but uniform increase of data rates
100 m 1 km 10 km0
10
20
30
40
50
60
cell radius
aver
age
sect
or th
roug
hput
[Mbi
ts]
OFDM pbo = 0 dBOFDM pbo = 2 dBSC MMSE FDE
0 20 40 60 800
010203040506070809
1
prob
(use
r thr
ough
put lt
abs
ciss
a)
active radio link rate [Mbits]
OFDM pbo = 0 dBOFDM pbo = 2 dBSC MMSE FDE
Figure G34 Average sector throughput for OFDM and single-carrier transmission (left) and an example of the corresponding data rate distributions (right) The distributions are depicted for cell
size 700 m
In summary the results show that if accounting for the high PAPR of the OFDM signal here by introducing an OFDM power backoff penalty of 2 dB OFDM has a small performance advantage in interference limited scenarios while the single-carrier transmission scheme using a linear MMSE frequency domain equaliser at the receiver provides better performance in noise limited deployments
G72 Performance of low rate channel coding for one-cell frequency reuse
Simulation Assumptions Link level Inter-cell interference is modelled by Gaussian noise
Simulator System level 19 cells 3 sectorscell full inter-cell interference modelling using wrap-around
Scenario Wide area cellular frequency reuse 1 single antenna BS and UT Channel model Metropolitan channel model defined in D53 Mobile speed 4 kmh for all users Channel coding Turbo code ARQ Chase combining Maximum number of retransmissions M = 0 1 3 Scheduling (for system level) Proportional fair scheduling 4 userssector Full buffer model Channel estimation Real (Weighted subcarrier coherent averaging)
First using the link level simulation optimum minimum coding rate of a very-low-rate Turbo coding and spreading factor value that achieves one-cell frequency reuse in a multi-cell environment in the downlink OFDM is investigated The required average signal-to-interference plus noise power ratio (SINR) to satisfy an average packetblock error rate (BLER) of 10-2 is plotted in Figure G35 (left) as a function of the reciprocal of the coding rate 1R
In the figure QPSK modulation is employed and Q denotes the spreading factor As shown in the figure the required average SINR is reduced with increasing ratio QR which indicates that the suppression of severe inter-cell interference from the surrounding cells is in principle possible however at the expense of throughput Moreover under the same QR conditions the required average SINR is reduced with decreasing code rate R up to approximately 16 to 18 Therefore we see that the minimum coding rate providing a distinct channel coding gain is approximately R = 16 to 18 Figure G35 (right) shows the required SINR for the average residual BLER of 10-3 as a function of the product of 1R and Q Assuming real-time traffic with a rigid delay requirement we take into account hybrid ARQ with Chase combining
WINNER D210 v10
Page 168 (180)
Req
uire
d av
erag
e re
ceiv
ed S
INR
for a
vera
ge B
LER
= 1
0-2 [d
B]
-20
-15
-10
-5
0
5
10
M = 0M = 1M = 3
Req
uire
d av
erag
e (in
stan
tene
ous)
rece
ived
SIN
R
for a
vera
ge re
sidu
al P
ER =
10-3
(dB
)
Spreading factor Q1
Channel coding rate R12 14 18
2 4 8 16 32 64 128
1
5
Instantaneous
Average
1
5
-20
-15
-10
-5
0
5
10
M = 0M = 1M = 3
Req
uire
d av
erag
e (in
stan
tene
ous)
rece
ived
SIN
R
for a
vera
ge re
sidu
al P
ER =
10-3
(dB
)
Spreading factor Q1
Channel coding rate R12 14 18
2 4 8 16 32 64 128
1
5
Instantaneous
Average
1
5
for a
vera
ge re
sidu
al B
LER
= 1
0-3 [d
B]
Req
uire
d av
erag
ein
stan
tane
ous r
ecei
ved
SIN
R
Figure G35 Optimum minimum channel coding rate (left) and required coding rate and spreading factor for achieving one-cell frequency reuse (right)
Furthermore we assumed two extremely different packet call times a very long call time where the received SINR is approximated by the average SINR (denoted as Average) and a very short call time during one packet frame duration where the received SINR is approximated by the instantaneous SINR (denoted as Instantaneous) In the figure the dotted lines indicate the SINR values corresponding to the 1 and 5-point of CDF of the SINR ie cell-edge conditions in a multi-cell environment On the horizontal axis we first decrease the coding rate from R = 12 to 18 maintaining Q = 1 Next in order to achieve QR gt 8 we further increase the Q value with a fixed R = 18 As shown in the figure according to the increase in the QR value the required SINR value is significantly improved This is due to the effect of the improved processing gain associated with channel coding and spreading Furthermore assuming the same QR value on the horizontal axis increasing M brings about a reduction in the required average SINR since the time diversity gain from the hybrid ARQ improves the received SINR of a packet From the figure in order to satisfy the SINR value at the 1 and 5-point of CDF the required coding rate and the spreading factor becomes (R Q) = (18 8 - 16) (18 4 - 8) and (18 2 - 4) for M = 0 1 and 3 in the case of average SINR and (18 8 - 32) (18 4 - 16) and (18 2 - 8) for M = 0 1 and 3 in the case of instantaneous SINR Consequently we conclude that the spreading is inevitable to achieve one-cell frequency reuse together with the low-rate channel coding such as R = 18
MCS sets with low-rate channel coding and spreading MCS sets without low-rate channel coding and spreading MCS sets with low-rate channel coding and spreading MCS sets without low-rate channel coding and spreading
0
02
04
06
08
1
0 5 106 1 107 15 107 2 107
Cum
ulat
ive
dist
ribut
ion
User throughput (bps)
Without hybrid ARQ
0
02
04
06
08
1
0 5 106 1 107 15 107 2 107
Cum
ulat
ive
dist
ribut
ion
User throughput (bps)
0
02
04
06
08
1
0 5 106 1 107 15 107 2 107
Cum
ulat
ive
distr
ibut
ion
User throughput (bps)
With hybrid ARQ(Max retransmissions M = 1)
With hybrid ARQ(Max retransmissions M = 3)
0
02
04
06
08
1
0 5 106 1 107 15 107 2 107
Cum
ulat
ive
distr
ibut
ion
User throughput (bps)
Without hybrid ARQ
0
02
04
06
08
1
0 5 106 1 107 15 107 2 107
Cum
ulat
ive
dist
ribut
ion
User throughput (bps)
0
02
04
06
08
1
0 5 106 1 107 15 107 2 107
Cum
ulat
ive
distr
ibut
ion
User throughput (bps)
With hybrid ARQ(Max retransmissions M = 1)
With hybrid ARQ(Max retransmissions M = 3)
Figure G36 Effect of low rate channel coding and required channel coding rate and spreading on user throughput in a multi-cell environment
Next the effect of low rate channel coding together with spreading is evaluated in a multi-cellular environment using system level simulations In the simulations two sets of modulation and coding schemes (MCS) are used one with and one without spreading The first set comprises QPSK with code rate and spreading factor (R Q) = (18 16) (18 8) (18 4) (18 2) (18 1) (14 1) (12 1) (23 1) as
WINNER D210 v10
Page 169 (180)
well as 16-QAM with (R Q) = (12 1) (23 1) and (34 1) The second set includes QPSK with code rate R=12 and 23 as well as 16-QAM with rate R= frac12 23 and frac34
As shown in Figure G36 the user throughput performance is improved by employing the MCS set with low-rate channel coding and spreading compared to those without low-rate channel coding and spreading For example the MCS set with low-rate channel coding and spreading maintains approximately 600 kbps and 750 kbps user throughput at 5 and 10-point of CDF respectively In case of hybrid ARQ with more than one retransmission however the benefit of low rate channel coding and spreading is negligible
G73 Comparison of FDMA and TDMA based resource partitioning among BS
Simulation Assumptions Simulator Link level Scenario wide area cellular frequency reuse 7 single antenna BS and UT Channel modelling WSSUS Rayleigh fading with exponential power delay profile
Okumara-Hata path loss model Interference modelling AWGN Cell radius Up to 2 km OFDM parameter 512 used subcarriers subcarrier distance 390625 kHz guard period 64 micros MCS QPSK FEC no coding Mobile speed 30 kmh same for all mobiles - results in almost perfect link adaptation
In a wide area OFDM cellular systems even with perfect inter-cell time synchronisation time offsets between users in different cells due to propagation delays induce significant inter-cell interference This appears in form of inter-carrieradjacent band interference if different cells are assigned adjacent portions of the available bandwidth eg in a block-FDMA fashion and in form of inter-symbol interference if different cells are assigned the whole transmission bandwidth in successive periods of time eg slot-TDMA In order to avoidreduce such interference guard bands and guard periods can be introduced in FDMA and in TDMA respectively The aim of this analysis is that of deriving which of the two approaches is the most spectrally efficient under currently envisaged system parameters and requirements
In a first step the performance degradation due to time offsets in block FDMA inter-cell allocation with and without guard bands is evaluated A worst case scenario is considered in which there are only two cells and two users which are assigned interleaved blocks of adjacent subcarriers Moreover equal receive power and time offsets up to frac12 OFDM symbol are assumed Results are reported in Figure G37 left plot in terms of uncoded BER (rawBER) for blocks of 8 and 64 subcarriers at different values of time offsets ranging from 5 micros to 16micros (cell radius of 15 and 48 km respectively) It can be inferred that there is high performance degradation when the time offset is equal to or higher than the guard interval For some time offsets the rawBER curve saturates before 10-2 As it is reasonably expected significantly better performance is obtained with larger block size because the effect of inter-carrier interference is larger at the block border Hence for smaller blocks almost all subcarriers might be interfered
A better overview is offered by Figure G37 left plot which compares the dependency of the SNR degradation on the different values of time offsets The SNR degradation has been computed at a rawBER of 10-177 corresponding to coded BER of 10-3 which represents the considered QoS criterion for VoIP The SNR degradation for the block size of 8 subcarriers is visibly much higher than for blocks of 64 subcarriers At a time offset of 6 micros we have a loss in power efficiency of 12 dB39 Figure G37 right plot shows the comparison of SNR degradation with and without guard bands The introduction of guard sub-bands leads to a significant improvement For time offsets larger than 5micros in particular the SNR degradation saturates
To compare the spectral efficiency of the two inter-cell allocation schemes the power efficiency loss in the block-FDMA case has to be translated into a figure of spectral efficiency loss Given the not too high values involved we can resort to a simple rule of thumb derived from 2G and 3G experience according to which a 45 dB loss in power efficiency corresponds to 50 spectral efficiency loss In Table G2 results
39 Note that for block size of 8 sub-carriers the SNR degradation curve has not been plotted for time offset values larger than 6 micros since the rawBER curve saturates before reaching the value corresponding to the required QoS
WINNER D210 v10
Page 170 (180)
in terms of power and spectral efficiency loss are reported for block-FDMA with blocks of 64 subcarriers for cell radius of 2 km and reuse factor 7 with and without guard bands of 8 subcarriers
0 5 10 15 20 25 30
10-3
10-2
10-1
100
SNR [dB]
raw
BE
R
Block of 8 and 64 subcarriers QAM4
8-Sc t shift 08-Sc t shift 100 = 5us8-Sc t shift 120 = 6us8-Sc t shift 320 = 16us64-Sc t shift 064-Sc t shift 100 = 5us64-Sc t shift 120 = 6us64-Sc t shift 320 = 16us
0 5 10 15 20 25 30-2
0
2
4
6
8
time offset [micros]
SN
R d
egra
datio
n [d
B]
Block of 64 8 guard ScBlock of 64 no guard ScBlock of 8 no guard Sc
Figure G37 left plot raw BER for different sizes of block of subcarriers and different values of time offsets right plot Dependency of SNR degradation on time offset for block of 8 subcarriers
and for block of 64 subcarriers with and without guard band
In slot-TDMA the insertion of guard periods between any pair of time-slots assigned to different cells represents an overhead which induces spectral efficiency loss and can be computed as follows The total time consumed as guard time is given by the number of time slots multiplied by the length of the guard period that is at least equal to the maximum time offset For TDD and HD-FDD the number of time slots assigned to different cells is 2 times the reuse factor The maximum time offset to be taken into account depends on the considered scenario For example with reuse factor 16 in a macro-cellular deployment scenario with antennas above rooftop the link of interest can be affected by interference from the second ring of interfering cells which implies a propagation delay corresponding to four times the cell radius The resulting overhead is then given by the ratio between the total guard time and the frame duration Results are reported in Table G3 for different reuse factors
Table G2 Power and spectral efficiency loss for block-FDMA with blocks of 64 subcarriers with reuse factor 7 with and without guard bands of 8 subcarriers
Reuse Factor Additional Guard Bands Overhead []
Power Efficiency Loss [dB]
Spectral Efficiency Loss []
Total Loss []
7 0 628 698 698 7 125 180 201 326
Table G3 Overhead due to guard periods in slot-TDMA with reuse factor 5 and 7
Reuse Factor Frame Length [ms]
Number of Time Slots
Total Guard Time [micros]
Overhead []
5 07 10 133 19 7 07 14 186 gt100
From simulation results it can be derived that it would be recommended to assign blocks of at least 64 adjacent subcarriers to different cells in order to keep the performance degradation to a reasonable level (up to 1 dB) For a reuse factor 7 and cell radius of 2 km the spectral efficiency would be doubled through the insertion of guard bands of eight subcarriers Moreover it has been explained how the use of the slot-TDMA inter-cell allocation approach is restricted by the assumption of very short frame length For the currently assumed frame length of 07 ms the overhead due to the insertion of guard periods could result to be unacceptable (larger than 100 for reuse factor 7) Since the overhead depends on the number of slots which is determined by the reuse factor a reuse factor up to 6 would be acceptable while for reuse factors larger or equal to 7 it would be preferable to use block-FDMA
We note that although the results of this section have been derived under the assumption of reuse factor larger than 1 they remain valid in case of single-frequency network with interference-avoidance-based
WINNER D210 v10
Page 171 (180)
dynamic resource management Indeed in the latter case a reuse factor is implicitly implied by the size of the smallest resource units assigned to different cells
G74 Comparison of conventional and self-organised RRM in cellular networks
Simulation Assumptions Simulator System level Scenario Short range cellular frequency reuse 1 single antenna BS and UT Channel modelling Generic channel model including path loss + shadow fading Interference modelling Inter-cell interference 49-cell network (wrap-around) Cell radius 300 m Link adaptation Adaptive MCS selection based on estimated SINR values MCS BPSK QPSK 16QAM 64QAM 256QAM all with 12 coding rate FEC Convolutional coding (133 171)oct with memory 6 codeword length 2160 Type of feedback Only in link setup phase measured signal power resource candidate with
corresponding interference values Feedback delay 1 frame Overhead 1 OFDM symbol per frame Mobile speed Stationary
Instead of the conventional frequency planning a self-organised radio resource management (SO-RRM) scheme has been proposed for WINNER There is no pre-planning on frequency bands The whole bandwidth is accessible anywhere Each BS based on the ULDL signal power and interference values measured at both the BS and the UT does the resource allocation independently There is no direct communication between BSs The resources with highest possible SINR values are allocated to the new UT and suitable PHY modes are selected in accordance with those values
With the SO-RRM scheme a very flexible resource allocation can be realised which means an adaptive reuse distance is implied based on the respective interference situation of each resource in the network This scheme also facilitates high bandwidth efficiency in the hotspot case
Anti-dropping solutions
The long-term interference situation of a user changes when a new co-channel interferer is accepted into the network A BS accepts a new UT when the observed ULDL SINR is sufficient for the required transmission Meanwhile it introduces a new interferer to the network The updated interference at an existing UT may violate the requirements of its current PHY mode for transmission which results in a potential dropping In most systems the dropping rate dominates the system capacity
Two alternative solutions can be adopted against the dropping
- ldquoReallocationrdquo as a passive way that the scheduling algorithm reacts when channel degradation is observed during data transmission When a reallocation is activated new resources are allocated by implementing the similar procedure for new users
- ldquoSecurity Marginrdquo as an alternative active method The main idea of this method is to add a security margin into the threshold for the MCS selection in order to increase the tolerance for the possible degradation of SINR which is caused by new interferers The value of such a security margin depends on many aspects Generally a low margin does not help much in the dropping performance while a high margin achieves a large tolerance at the cost of efficiency Therefore a balance should be made
Comparison between SO-RRM and conventional RRM
A 49-cell network is considered The ldquowrap aroundrdquo technique [80220-05] is implemented in order to allow data collection from all cells within the network For the system level simulation the channel is assumed time invariant Each user has the same date rate and BLER requirements
A simulation starts with a blank system Users arrive at the network one by one whose locations follow a predefined distribution The BS starts the resource allocation scheme and allocates suitable resources to the UT A blocking occurs when a BS cannot find sufficient resources to serve its new UT A dropping occurs when a current transmission is destroyed be a new UT which means either the security margin is insufficient when the active anti-dropping solution is applied or the reallocation of resources fails in the case of the passive anti-dropping solution The ldquoSystem Capacityrdquo is used as the criterion of system level performance A system capacity of N is defined as that a blocking or dropping in the system happens at the first time when the (N+1) UT joins the network
WINNER D210 v10
Page 172 (180)
Both uniform and non-uniform distributions of users are considered In the non-uniform case a hotspot is defined in the central cell Inside each cell the users are always uniformly distributed A ldquohotspot fractionrdquo ρ is defined to quantitatively describe the user distribution as the number of users in the hotspot cell relating to the number of users in all cells
Comparison between SO-RRM and conventional RRM The performances of five schemes are plotted in Figure G38 The ldquooptimised security marginrdquo means that the applied margin is chosen with which the system has the highest capacity Generally it can be concluded from the results that the SO-RRM is better than the conventional RRM at the same situation The latter has good performance for uniform user distribution However its inflexibility induces a remarkable loss of spectrum efficiency with non-uniform user distribution where not all resources are accessible when many users are out of service
With the SO-RRM all resources are accessible in each cell It shows its robustness to the variance of user distribution In the cases where there are no anti-dropping solutions applied or the security is applied the performance of SO-RRM has a performance close to the conventional RRM with a uniform-like user distribution However with higher fraction of users located at the hotspot cell the flexibility of SO-RRM starts showing its efficiency When all users are located in the hotspot a 7 times higher number of users can be served
It is also observed that reallocation improves the system capacity with any user distribution In a system with uniform user distribution an increase of 60 can be achieved A passive solution gains at the cost of reallocation efforts This benefit decreases when the hotspot fraction gets higher which means a low necessity of reallocation
0 02 04 06 08 10
100
200
300
400
500
600
700
Hotspot Fraction ρ
Sys
tem
Cap
acity
SO-RRM with reallocationSO-RRM with optimized security marginSO-RRM without anti-droppingConventional RRM with optimized security marginConventional RRM without anti-dropping
Figure G38 Comparison of system performances with different RRM schemes
The effect of a security margin varies for different user distribution and different resource management schemes In a system with uniform user distribution or a system with low hotspot faction the margin is effective in the performance improvement However when the fraction of users in the hotspot increases the margin brings less improvement and even lowers the system capacity In a system with a high hotspot fraction the probability of a new user located outside the central cell is very low That is it happens rarely that an existing transmission suffers from an outage that is caused by the new co-channel interferer In this situation the security margin is only an obstacle
G75 VAA technology with adaptive pre-selection aided by MC-OLSR protocol
Simulation Assumptions Simulator Combined system and link level simulator Scenario Short range using virtual antenna arrays MT = 1 MR = 1 cell radius = 320 m
mobile speed 5 kmh VAA size = 2 Channel modelling B1 clustered delay line Interference modelling no inter-cell interference MCS 1 QPSK FEC no
WINNER D210 v10
Page 173 (180)
This issue was analysed in context of radio resource control and management and more specifically the optimum pre-selection and assignment of the relay nodes at the system level for the purposes of enhancing the space-time coded cooperative transmission with the use of virtual antenna arrays (VAA) [DGA04] at the link level was investigated To this end the MC-OLSR protocol enhanced with cooperative relaying was exploited and this work was performed on the basis of the Adaptive approach to antenna selection and space-time coding analysed in [WIND24] and the Multi-Constrained Optimised Link State Routing protocol (MC-OLSR) proposed in [WIND31] and [WIND32] respectively In the example depicted in Figure G39 VAA is constituted by RN 1 and RN 2 whereas the nodes 0 (BS) and 9 (UT) are the source and destination ones respectively
The performance comparison between the conventional and the space-time coded cooperative transmission with the use of virtual antenna arrays when the adaptive pre-selection mechanism aided by the MC-OLSR protocol is active is presented in Figure G39 There is a noticeable improvement in the region of higher SNR values however the BER curves start more or less from the same point The reason for this situation is that if there are transmission errors between the BS and the first-hop RNs they propagate and diminish the performance of the cooperative transmission during the second hop This proves the necessity for further joint cross-layer optimisation
0
2
22
1
3 4
5
6 7
8
9
10
11 12 13
23
14
15
16
17
18
19 20 21
24
0 10 20 3010-5
10-4
10-3
10-2
10-1
100
SNR [dB]
BE
R
CONV MC-OLSRVAA MC-OLSR
Figure G39 Space-time coded VAA technology ndash scenario and performance
WINNER D210 v10
Page 174 (180)
References [3GPP-TR25212] 3GPP TSG RAN ldquoHigh speed downlink packet access Physical layer aspectsrdquo TR
25212
[3GPP-WG142] 3GPP TSG RAN WG142 ZTE CATT RITT Huawei ldquoComparison of Structured LDPC Codes and 3GPP Turbo-Codesrdquo R1-050840
[3GPP-TS25331] 3GPP TS 25331 RRC Protocol Specification
[3GPP-TR25891] 3GPP TR 25891 ldquoImprovement of RRM across RNS and RNSBSS (post-Rel-5)rdquo Release 6 v030 (draft version) 22003
[80211n04] IEEE 80211n ldquoStructured LDPC Codes as an Advanced Coding Scheme for 80211nrdquo IEEE Doc 80211-04884r0 August 2004
[80211n-05] IEEE doc 80211-05150r1 ldquoWWiSE IEEE 80211n Proposalrdquo 2005
[80216-04] IEEE Std 80216-2004 ldquoAir Interface for Fixed Broadband Wireless Access Systemsrdquo
[80216e-05] IEEE doc 80216e-05006r2 ldquoLDPC coding for OFDMA PHYrdquo available online from httpwwwieee802org16tge
[80216e05b] IEEE P80216eD8 2005 ldquoAir Interface for Fixed and Mobile Broadband Wireless Access Systemsrdquo
[80220-05] ldquoIEEE 80220 Evaluation Criteriardquo September 2005
[Ace05] M Acentildea S Pfletschinger ldquoA computationally efficient algorithm for throughput maximization in OFDMArdquo 10th International OFDM-Workshop Hamburg Germany Aug-Sept 2005
[AN05] IST-Project IST-2002-507134 ldquoAmbient Networksrdquo httpwwwambient-networksorg
[AY05] A Adinoyi and H Yanikomeroglu ldquoPractical cooperative communication through fixed relaysrdquo accepted to Wireless World Radio Forum December 2005
[BBB+99] J J Beek P Boumlrjesson M L Boucheret D Landstroumlm J Arenas P Oumldling C Oumlstberg M Wahlqvist and S Wilson ldquoA Time and Frequency Synchronization Scheme for Multi-user OFDMrdquo IEEE Journal of Selected Areas on Communications vol 17 pp 1900-1914 Nov 1999
[BCK03] A Bourdoux B Come N Khaled ldquoNon-reciprocal transceivers in OFDMSDMA systems Impact and mitigationrdquo RAWCON 2003 Boston August 2003
[Bin90] J A C Bingham ldquoMulticarrier modulation for data transmission an idea whose time has comerdquo IEEE Communications Magazine Vol 28 pp 5-14 May 1990
[BM04] G Barriac U Madhow ldquoSpace Time Communication for OFDM with Implicit Channel Feedbackrdquo IEEE Trans on Information Theory vol 50 pp3111-3129 Dec 2004
[Bon04] T Bonald ldquoA score-based opportunistic scheduler for fading radio channelsrdquo European Wireless Conference Barcelona Feb 2004
[BR04] L Bazzi and T J Richardson ldquoExact Thresholds and Optimal Codes for the Binary-Symmetric Channel and Gallagerrsquos Decoding Algorithm Ardquo IEEE Trans on Info Theory vol 50 no 9 Sept 2004
[BSB97] J J Beek M Sandell and P Boumlrjesson ldquoML estimation of time and frequency offset in OFDM systemsrdquo IEEE Transactions in Signal Processing vol 45 pp 999-1008 July 1997
[Cam98] J Campello ldquoOptimal discrete bit loading for multicarrier modulation systemsrdquo Proceedings of International Symposium on Information Theory p 193 August 1998
[Cam99] J Campello ldquoPractical bit loading for DMTrdquo Proceedings of ICC 99 Vancouver Canada pp 801-805 June 1999
WINNER D210 v10
Page 175 (180)
[CCB95] P S Chow J M Cioffi J A C Bingham ldquoA practical discrete multitone transceiver loading algorithm for data transmission over spectrally shaped shannelsrdquo IEEE Trans Commun Vol 43 pp 773-775 April 1995
[CENELEC01] EN 50360 ldquoProduct standard to demonstrate the compliance of mobile phones with basic restrictions related to human exposure to electromagnetic fields (300 MHz - 3 GHz)rdquo European Committee for Electrotechnical Standardization (CENELEC) July 2001
[CENELEC02] EN 50385 ldquoProduct standard to demonstrate the compliance of radio base stations and fixed terminal stations for wireless telecommunication systems with the basic restrictions or the reference levels related to human exposure to radio frequency electromagnetic fields (110 MHz - 40 GHz) - General publicrdquo European Committee for Electrotechnical Standardization (CENELEC) European Standard August 2002
[CEO02] G Cherubini E Elefthriou and S Oelcer ldquoFiltered Multi Tone Modulation for very High Speed Digital Subscriber Linesrdquo IEEE Journ On Select Areas on Commun vol 20 n5 pp 1016-1028 June 2002
[CF02] J Chen and MPC Fossorier ldquoNear Optimum Universal Belief Propagation Based Decoding of Low-Density Parity Check Codesrdquo IEEE Transactions on Communications Vol 50 No 3 March 2002
[CFO+03] E Costa A Filippi S Ometto M Weckerle E Schulz ldquoAsynchronous uplink transmis-sion in FMT-FDMA systemsrdquo in Proc IEEE International Symposium on Personal Indoor and Mobile Radio Communications (PIMRC) Bejing China 2003
[ChC00] M Chang K-C Chen ldquoFrequency-Domain Approach to Multiuser Detection in DS-CDMArdquo IEEE Comm Letters vol 4 no 11 pp 331-333 Nov 2000
[CSB05] E Costa P Slanina V Bochnicka E Schulz G Spano Greco Downlink based Intra- and Inter-cell Time and Frequency Synchronisation in OFDM Cellular Systems Proceedings of World Wireless Congress 2005 San Francisco May 2005
[DAO05] M Doumlttling D Asteacutely and M Olsson ldquoA Multi-User Spatial Domain Link Adaptation Concept for Beyond 3G Systemsrdquo ProcPIMRC 2005 Berlin Germany September 2005
[DFL+04] R Dinis D Falconer Chan Tong Lam et al ldquoA Multiple Access Scheme for the Uplink of Broadband Wireless Systemsrdquo Globecom 2004
[DGA04] M Dohler A Gkelias H Aghvami ldquoA Resource Allocation Strategy for Distributed MIMO Multi-Hop Communication Systemsrdquo IEEE Communications Letters Volume 8 Issue 2 February 2004 pp 99-101
[DVB00] Interaction channel for satellite distribution systems ETSI EN 301 790 V122 pp 21-24 Dec 2000
[Ekm02] T Ekman Prediction of Mobile Radio Channels Modelling and Design PhD Th Signals and Syst Uppsala UnivhttpwwwsignaluusePublicationsabstractsa023html
[ER01] A Ebner and H Rohling A Self-Organized Radio Network for Automotive Applications Proceedings of the 8th World Congress on Intelligent Transport Systems Sydney Australia October 2001
[Eri04] NC Ericsson Revenue Maximization in Resource Allocation Applications in Wireless Communication Networks PhD Thesis Signals and Systems Uppsala Univ Oct 2004 httpwwwsignaluusePublicationsabstractsa043html
[FSE+04] S Falahati A Svensson T Ekman and M Sternad Adaptive modulation systems for predicted wireless channels IEEE Trans on Communications vol 52 Feb 2004 pp 307-316
[FA02] David D Falconer and S Lek Ariyavisitakul Broadband Wireless Using Single Carrier and Frequency Domain Equalization Proceedings WPMC 2002 pp 27 - 36 vol1 Honolulu USA Oct 2002
WINNER D210 v10
Page 176 (180)
[FCS04] A Filippi E Costa E Schulz ldquoLow Complexity Interleaved Sub-carrier Allocation in OFDM Multiple Access Systemsrdquo in Proc IEEE VTCrsquo04 Los Angeles California USA Sept 2004
[FDGH05a] M Fuchs G Del Galdo and M Haardt A novel tree-based scheduling algorithm for the downlink of multi-user MIMO systems with ZF beamforming In Proc IEEE Int Conf Acoust Speech Signal Processing(ICASSP) volume 3 pages 1121ndash1124 Philadelphia PA March 2005
[FDGH05b] M Fuchs G Del Galdo and M Haardt Low complexity space-time-frequency scheduling for MIMO systems with SDMA Submitted to IEEE Transactions on Vehicular Technology September 2005
[FH96] R F H Fischer J B Huber ldquoA new loading algorithm for discrete multitone transmissionrdquo Proceedings of GLOBECOM 96 London UK pp 724-728 November 1996
[FK05] D Falconer S Kaiser editors ldquoBroadband frequency Domain-Based Air Interfaces for Future-Generation Wireless Systemsrdquo WWRF Working Group 4 White Paper Version 016 Feb 18 2005
[GA93] Mohinder S Grewal and Angus P Andrews (1993) ldquoKalman Filtering Theory and Practicerdquo Upper Saddle River NJ USA Prentice Hall
[Gal63] R G Gallager ldquoLow-Density Parity-Check codesrdquo PhD Thesis Cambridge
[GBD03] F Guilloud E Boutillon and J-L Danger ldquoλ-Min Decoding Algorithm of Regular and Irregular LDPC Codesrdquo 3rd International Symposium on Turbo-Codes amp Related Topics
[GRC02] D Galda H Rohling E Costa H Haas E Schulz ldquoA Low Complexity Transmitter Structure for OFDM-FDMA Uplink Systemsrdquo in Proc VTC Spring 2002 pp 1737-1741 2002
[HBD00] JS Hammerschmidt C Brunner C Drewes Eigenbeamforming - a novel concept in array signal processing Proc VDEITG European Wireless Conference DresdenGermany Sept 2000
[HP98] Guidelines for limiting exposure to time-varying electric magnetic and electromagnetic fields (up to 300 GHz) International Commission on Non-Ionizing Radiation Protection Health Physics vol 74 no 4 pp 494-522 April 1998
[Hug91] D Hughes-Hartogs ldquoEnsemble modem structure for imperfect transmission mediardquo US Patent No 5054034 October 1991
[IN05] C Ibars M Navarro Reduced complexity iterative multiuser detector for beyond 3G CDMA systems IST Mobile amp Communication Summit 2005 (IST 2005) Dresden (Germany) June 19-23 2005
[JB03] E A Jorswieck and H Boche ldquoTransmission Strategies for the MIMO MAC with MMSE Receiver Average MSE Optimization and Achievable Individual MSE Regionrdquo IEEE Trans On Signal Processing vol 51 pp 2872-2881 Nov 2003
[JDL+04] JP Javaudin C Dubuc D Lacroix M Earnshaw An OFDM Evolution to the UMTS High Speed Downlink Packet Access in Proc of VTC Fall 2004 Los Angeles USA 26-29 September 2004
[JFH+05] V Jungnickel A Forck T Haustein SSchiffermuumlller C von Helmolt F Luhn M Pollock C Juchems M Lampe S Eichinger W Zirwas E Schulz ldquo1 Gbits MIMO-OFDM Transmission Experimentsrdquo Proc IEEE VTC Fall 2005 Dallas Texas
[JVS+03] C Jones E Valles M Smith and J Villasenor ldquoApproximate-Min Constraint Node Updating for LDPC Code Decodingrdquo IEEE MILCOM 2003
[KBLS06] T T Kim M Bengtsson E G Larsson and M Skoglund ldquoCombining Short-Term and Long-Term Channel State Information over Correlated MIMO Channelsrdquo Submitted to ICASSP 2006
WINNER D210 v10
Page 177 (180)
[KF98] F R Kschischang B J Frey ldquoIterative Decoding of Compound Codes by Probabilistic Propagation in Graphical Modelsrdquo Journal on Select Areas Commun pp 219-230 1998
[KLF01] Y Kou S Lin and M Fossorier ldquoLow Density parity-check codes based on finite geometries A rediscovery and morerdquo IEEE Trans Inform Theory vol 47 pp 2711-2736 Nov 2001
[LC02] D Lee and K Cheun ldquoCoarse Symbol Synchronization Algorithms for OFDM Systems in Multipath Channelsrdquo IEEE Communication Letters pp 446-448 Vol 6 no 10 Oct 2002
[LGA01] D Lacroix N Goudard M Alard OFDM with guard interval versus OFDMOffsetQAM for high data rate UMTS downlink transmission in Proc of VTC Fall 2001 October 2001 Atlantic City USA
[LHYT01] Y Liu R Hoshyar X Yang R Tafazolli Joint Routing and Packet Scheduling for Enhanced Uplink UTRA-FDD with Fixed Relay Stations in Proc IEEE Vehicular Technology Conference Dallas Texas USA September 2005
[LHYT02] Y Liu R Hoshyar X Yang R Tafazolli An Integrated Radio Resource Allocation Framework for Enhanced Uplink UTRA-FDD with Fixed Relay Stations 14th IST Mobile and Wireless communications Summit Dresden Germany June 2005
[LWB+02] D Landstroumlm S K Wilson J-J van de Beek P Oumldling and PO Bjoumlrjesson ldquoSymbol time offset estimation in coherent OFDM Systemsrdquo IEEE Transactions on Communications vol 50 pages 545-549 Apr 2002
[LWZ04] Y Liu T Weber W Zirwas Uplink performance investigations of the service area basd beyond 3G system JOINT in Proc Kleinheubacher Berichte Kleinheubach Germany October 2004 MS No KH2004-A-0051
[LZ05] T Lestable and E Zimmermann ldquoLDPC Codes Options for Next Generation Wireless Systemsrdquo Wireless World Research Forum (WWRF) WG5 San-Diego 2005
[MB01] Y Mao A H Banihashemi ldquoDecoding Low-Density Parity-Check Codes with Probabilistic Schedulingrdquo Comm Letters 5415-416 Oct 2001
[MBL+05] M Muck P Bernardin P Labbe X Miet D Pannicke and J Schoenthier ldquoPrototyping of a hybrid 5GHz60GHz OFDM WLAN system in the framework of IST-BroadWayrdquo Wireless World Research Forum 13th meeting Mar 2-3 2005 Jeju Island Korea
[MCD05] M Muck M de Courville P Duhamel rdquoA Pseudo Random Postfix OFDM modulator - Semi-blind channel estimation and equalizationrdquo accepted by IEEE Transactions on Signal Processing 2005
[MKK+05] N Maeda T Kataoka H Kawai K Higuchi J Kawamoto M Sawahashi ldquoExperiments on Real-Time 1-Gbps Packet Transmission Using Antenna-Independent AMC in MIMO-OFDM Broadband Packet Radio Accessrdquo Proc IEEE VTC Fall 2005 Dallas Texas
[MS02] M M Mansour and N R Shanbhag ldquoLow-Power VLSI Decoder Architectures for LDPC Codesrdquo IEEE ISLPED 2002
[MY05] S Myung and K Yang ldquoA Combining Method of Quasi-Cyclic LDPC Codes by The Chinese Remainder Theoremrdquo IEEE Comm Letters Vol9 N9 Sept 2005
[MYK05] S Myung K Yang and J Kim ldquoQuasi-Cyclic LDPC Codes for Fast Encodingrdquo IEEE Trans on Info Theory August 2005
[OJEC99] 1999519EC EU Council Recommendation of 12 July 1999 on the limitation of exposure of the general public to electromagnetic fields (0 Hz to 300 GHz) Official Journal of the European Communities July 1999
[OY03] J-E Oh K Yang ldquoSpace-time codes with full antenna diversity using weighted nonbi-nary repeat-accumulate codesrdquo IEEE Trans Commun vol 51 pp 1773ndash1778 Nov 2003
WINNER D210 v10
Page 178 (180)
[Pfl05] S Pfletschinger ldquoFrom cell capacity to subcarrier allocation in multi-user OFDMrdquo IST Mobile amp Wireless Communications Summit Dresden (Germany) 19 ndash 23 June 2005
[PI05] S Pfletschinger and C Ibars ldquoFrom cell capacity to subcarrier allocation in OFDMArdquo submitted to European Transactions on Telecommunications Sept 2005
[Rap91] C Rapp ldquoEffects of HPA-Nonlinearity on a 4-DPSKOFDM Signal for a Digital Sound Broadcasting Systemrdquo Proc 2nd European Conf on Satellite Comms Liege Oct 1991 pp 179-184
[RM00] D M Rowitch LB Milstein ldquoOn the performance of hybrid FECARQ systems using rate compatible punctured Turbo (RCPT) codesrdquo IEEE Trans on Comm vol 48 no 6 pp 948-958 June 2000
[SA03] M Sternad and D Aronsson ldquoChannel estimation and prediction for adaptive OFDM downlinks IEEE VTC 2003-Fall Orlando October 2003
[SD01] A Stefanov T Duman ldquoTurbo-coded modulation for systems with transmit and receive antenna diversity over block fading channels System model decoding approaches and practical considerationsrdquo IEEE J Select Areas Commun vol 19 no 5 pp 958ndash968 May 2001
[SEA01] M Sternad T Ekman and A Ahleacuten ldquoPower prediction on broadband channelsrdquo IEEE Vehicular Technology Conference VTC01-Spring Rhodes Greece May 6-9 2001
[SFF+99] M Speth S Fechtel G Fock and H Meyr ldquoOptimum Receiver Design for Wireless Broadband Systems Using OFDM-Part Irdquo IEEE Transactions on Communications vol 47 pp 1668-1677 Nov 1999
[SF04] M Sternad S Falahati ldquoMaximizing throughput with adaptive M-QAM based on imperfect channel predictionsrdquo IEEE PIMRC 2004 Barcelona Sept 2004
[SFS05] M Sternad S Falahati T Svensson and D Aronsson rdquoAdaptive TDMAOFDMA for wide-area coverage and vehicular velocitiesrdquo IST Summit Dresden July 2005
[SGF95] Johan Skoumlld Bjoumlrn Gudmundson Jan Faumlrjh ldquoPerformance and Characteristics of GSM-based PCSrdquo VTC 1995
[SU05] A Soysal and S Ulukus ldquoTransmit Directions and Optimality of Beamforming in MIMO-MAC with Partial CSI at the Transmittersrdquo Proc of CISS Jan 2005
[SW02] A Springer R Weigel The Physical Layer of the Universal Mobile Telecommunications System Berlin Heidelberg New York Springer 2002
[SWW+04] E Schulz M Weckerle T Weber M Meurer The OFDM based beyond 3G air inter-face JOINT featuring interference reduction by joint detection and joint transmission in Proc 8th WWRF Meeting Beijing China Feb 2004 pp 1-11
[TB04] S Tomasin and N Benvenuto ldquoA Reduced Complexity Block Iterative DFE for Dispersive Wireless Applicationsrdquo Proc VTC 2004 fall pp 1693-1697
[THB04] J Tousch M-H Hamon and J Benko ldquoTurbo-Codes Complexity Estimatesrdquo IEEE 80211n Proposal 1385-r1 Nov 2004
[Tse98] DNC Tse and SV Hanly ldquoMultiaccess fading channelsmdashPart I Polymatroid structure optimal resource allocation and throughput capacitiesrdquo IEEE Trans Information Theory vol 44 no 7 pp 2796-2815 Nov 1998
[Vai92] PP Vaidjanathan Multirate Systems and Filter Banks Englewood Cliffs NJ Prentice Hall
[VF00] J Vogt and A Finger ldquoImproving the Max-Log-MAP turbo decoderrdquo IEEE Electronincs Letters vol 36 no 23 pp 1937ndash1939 2000
[VH04] V Stankovic and M Haardt ldquoMulti-user MIMO downlink precoding for users with multiple antennasrdquo in Proc Of the 12-th Meeting of the Wireless World Research Forum (WWRF) Toronto Canada Nov 2004
WINNER D210 v10
Page 179 (180)
[VH05a] V Standovic and M Haardt ldquoMulti-user MIMO downlink beamforming over correlated MIMO channelsrdquo in Proc International ITGIEEE Workshop on Smart Antennas (WSA05) Duisburg Germany April 2005
[VH05b] V Stankovic and M Haardt ldquoImproved diversity on the uplink of multi-user MIMO systemrdquo in Proc European Conference on Wireless Technology (ECWT 2005) Paris France October 2005
[VTL02] P Viswanath DNC Tse and R Laroia ldquoOpportunistic beamforming using dumb antennasrdquo IEEE Transactions on Information Theory vol 48(6) June 2002
[WER03] L Wischhof A Ebner H Rohling M Lott and R Halfmann SOTIS -A Self-Organizing Traffic Information System Proceedings of the 57th IEEE Vehicular Technology Conference (VTC 03 Spring) Jeju Korea 2003
[Win84] JH Winters ldquoOptimum Combining in Digital Mobile Radio with Cochannel Interferencerdquo in IEEE Journal on Selected Areas in Communications Vol SAC-2 No 4 July 1984
[WIND21] IST-2003-507581 WINNER ldquoD21 Identification of Radio-Link Technologiesrdquo June 2004
[WIND22] IST-2003-507581 WINNER ldquoD22 Feasibility of multi-bandwidth transmissionsrdquo October 2004
[WIND23] IST-2003-507581 WINNER ldquoD23 Assessment of Radio-Link Technologiesrdquo February 2005
[WIND24] IST-2003-507581 WINNER ldquoD24 Assessment of adaptive transmission technologiesrdquo February 2005
[WIND25] IST-2003-507581 WINNER ldquoD25 Duplex arrangements for future broadband radio interfacerdquo October 2004
[WIND26] IST-2003-507581 WINNER ldquoD26 Assessment of multiple access technologiesrdquo October 2004
[WIND27] IST-2003-507581 WINNER ldquoD27 Assessment of Advanced Beamforming and MIMO Technologiesrdquo February 2005
[WIND31] IST-2003-507581 WINNER ldquoD31 Description of identified new relay based radio network deployment concepts and first assessment of comparison against benchmarks of well known deployment concepts using enhanced radio interface technologiesrdquo Oct 2004
[WIND32] IST-2003-507581 WINNER ldquoD32 Description of identified new relay based radio network deployment concepts and first assessment by comparison against benchmarks of well known deployment concepts using enhanced radio interface technologiesrdquo February 2005
[WIND35] IST-2003-507581 WINNER ldquoD35 Proposal of the best suited deployment concepts chosen for the identified scenariosrdquo December 2005
[WIND41] IST-2003-507581 WINNER ldquoD41 Identification and definition of cooperation schemes between RANs ndashfirst draftrdquo June 2004
[WIND42] IST-2003-507581 WINNER ldquoD42 Impact of cooperation schemes between RANs ndashfirst draftrdquo February 2005
[WIND43] IST-2003-507581 WINNER ldquoD41 Identification and definition of cooperation schemes between RANs ndashfinal deliverablerdquo June 2005
[WIND44] IST-2003-507581 WINNER ldquoD44 Impact of cooperation schemes between RANs ndash final deliverablerdquo November 2005
[WIND54] IST-2003-507581 WINNER ldquoD54 Final Report on Link Level and System Level Channel Modelsrdquo September 2005
WINNER D210 v10
Page 180 (180)
[WIND63] IST-2003-507581 WINNER ldquoD63 WINNER Spectrum Aspects Assesment reportrdquo December 2005
[WIND71] IST-2003-507581 WINNER ldquoD71 System requirementsrdquo July 2004
[WIND72] IST-2003-507581 WINNER ldquoD72 System Assessment Criteria Specificationldquo July 2004
[WIND76] IST-2003-507581 WINNER ldquoD76 WINNER System Concept Descriptionrdquo October 2005
[WOSS05] Wei Wang Tony Ottosson Tommy Svensson Arne Svensson Mikael Sternad rdquoEvaluations of a 4G Uplink System Based on Adaptive Single-Carrier TDMArdquo Proceedings IEEE Vehicular Technology Conference Fall Dallas Texas USA Sep 2005
[YNA01] E Yeo B Nikolie and V Anantharam ldquoHigh Throughput Low-Density Parity-Check Decoder Architecturesrdquo IEEE Globecom 2001
[Yu02] W Yu and JM Cioffi ldquoFDMA capacity of Gaussian multiple-access channels with ISIrdquo IEEE Trans Commun vol 50 no 1 pp 102-111 Jan 2002
[Yu04] W Yu W Rhee S Boyd JM Cioffi ldquoIterative water-filling for Gaussian vector multiple-access channelsrdquo IEEE Trans Information Theory Jan 2004
[ZB04] P Zarrinkhat and A H Banihashemi ldquoThreshold Values and Convergence Properties of Majority-Based Algorithms for Decoding Regular Low-Density Parity-Check codesrdquo IEEE Trans on Comm vol 52 no 12 Dec 2004
[ZF04] J Zhang and M Fossorier ldquoA Modified Weighted Bit-Flipping Decoding of Low-Density Parity-Check Codesrdquo IEEE Comm Letters vol 8 no 3 March 2004
[ZF05] J Zhang M Fossorier lsquoShuffled iterative decodingrsquo IEEE Trans on Comm Vol 53 No 2 February 2005
[ZZ05] H Zhong and T Zhang lsquoBlock-LDPC A Practical LDPC Coding System Design Approachrsquo IEEE Trans on Circ And Syst-I Reg Papers Vol 52 N 4 April 2005
WINNER D210 v10
Page 2 (180)
Executive Summary The objective of WP2 and this final deliverable is to identify key technologies for a future broadband radio interface to develop basic concepts based on these technologies that will lead to a ubiquitous radio system concept and perform assessments thereof This is an inherently iterative process determined not only by pure technical considerations but also by regulatory and other decisions and restrictions The snapshot provided in the present deliverable will be further refined and adapted to various external conditions during WINNER Phase II The present deliverable differs from the overall concept description given in deliverable D76 in that it primarily focuses on lower layers goes more into technical depth and contains extensive results of simulations and other evaluations in addition to the concept description
The developed WINNER radio interface concept is a packet-oriented user-centric always-best concept It defines a scalable flexible and efficient radio interface A tool for obtaining such flexibility is to define a small number of compatible system modes that provide a unified interface to higher layers and implement tailored solutions Within the modes parameterisations can be used to provide added flexibility and maximum efficiency depending on the particular radio environment usage scenario economic model etc The always-best solution is further supported by the flexible protocol architecture of the WINNER radio interface and incorporates mechanisms for both long-term and short-term adaptation Both relaying and advanced spatial processing are integrated parts of the system architecture
The WINNER radio interface targets fulfilment of the ITU-R M1645 recommendation according to the views and amendments specified in the WINNER deliverable D71 In order to enable detailed system design and appropriate optimisations the general and user-oriented requirements of D71 have been mapped onto more technically oriented design targets on the radio interface for different application scenarios under consideration by WINNER
The physical layer of the WINNER radio interface uses generalised multi-carrier (GMC) as the transmission format as this technique enables flexible switching between different forms of multi-carrier and (frequency-domain generated) serial modulation Specifically GMC configured as standard cyclic-prefix (CP) OFDM is the preferred option for downlink as well as uplink transmission when terminal power consumption is not a limiting factor (eg in short-range scenarios) For all other cases GMC configured as serial modulation is the preferred option (mainly in the uplink for wide area coverage) The resource allocation in the physical layer is based on a slotted time-frequency chunk pattern that can be adjusted to different propagation scenarios The chunk and frame durations are short to ensure a low transmission delay over the radio interface (less than 1 ms) In the case of spatial reuse of resources each chunk contains several chunk layers Adaptive modulation supports higher-order modulation up to 64-QAM and even 256-QAM in short range connections and uses Gray labelling Forward error correction coding is based on (quasi-cyclic) block low-density parity-check codes for large code-blocks Duo-binary turbo codes are additionally considered for medium and smaller block sizes Convolutional codes are currently foreseen only for very short block lengths (less than 200 information bits)
Generic and baseline transceiver structures have been developed including a flexible spatial processing architecture which enables multi-user spatial domain link adaptation based on the following basic components (linear) dispersion codes directive transmission (beamforming) per stream rate control and multi-user precoding This architecture exploits the spatial processing gains (ie spatial diversity SDMA spatial multiplexing and interference control) in flexible combinations as required by different scenarios Apart from the generic architecture a baseline implementation using adaptive modulation linear dispersion codes and linear precoding is also provided
The WINNER radio interface uses a scattered pilot grid that supports efficient channel estimation also on chunk basis with very low overhead Spatial processing on the one hand limits the potential reuse of pilots for different purposes and on the other hand introduces additional requirements A classification of pilot types including the effects of spatial processing is provided The cyclic prefix is used to achieve coarse synchronisation (ie on OFDM-symbol level) Training symbols at the beginning of the super-frame enable inter-cell synchronisation also when no global timing reference (eg GPS Galileo) is available Efficient means have been developed for compressing the channel quality information feedback required for adaptive transmission and the channel state information required for some multi-antenna schemes These methods reduce the required feedback overhead to reasonable levels
The WINNER concept is designed for large bandwidth flexibility and is duplex neutral there is a time-division duplex (TDD) solution available for use in unpaired spectrum and a frequency-division duplex (FDD) solution for paired spectrum
WINNER D210 v10
Page 3 (180)
The medium access control (MAC) system layer of the proposed WINNER radio interface allocates the time-frequency-spatial resources to packet flows Its key element is a resource scheduler which is assumed to be physically located close to or within each base station and relay node Functionality for handling and formulating constraints on the allocation to be performed by the resource scheduler is also parts of the MAC system layer Packets arrive at the MAC in different transport channels intended for control broadcast contention-based traffic scheduled point-to-point and scheduled point-to-multipoint traffic The MAC performs resource allocation on two time scales
(1) Resource partitioning on a time scale of the super-frame (5ndash10 ms) The overall allocation of time-frequency-spatial resources to different transport channels is adjusted on this time scale based on the aggregated demand within each transport channel Unused guard chunks used for interference avoidance and spectrum sharing are also reserved
(2) Resource scheduling for the scheduled flows on the time scale of the slot (034 ms) The scheduled flows are allocated to time-frequency-spatial resources available for this purpose in the super-frame There are two options (algorithm variants) for performing resource scheduling adaptive allocation and non-frequency-adaptive allocation With adaptive allocation individual time-frequency chunks can be allocated to different flows Fast link adaptation is performed within each chunk based on predictions of the channel quality This method offers maximal performance and a high potential for multi-user diversity gains but it cannot be used at high interference levels and high vehicular velocities A general framework for adaptive resource scheduling is outlined that enables the allocation to be performed with reasonable complexity With non-frequency-adaptive allocation bits from each flow are allocated onto sets of chunks that are dispersed in frequency Coding and interleaving is used here to combat frequency selective fading Link adaptation may be performed with respect to shadow fading but not with respect to frequency-selective fading This method is required for control signalling and is the primary method in the case of point-to-multipoint transmission It offers a robust option for scheduled flows and also serves as a fallback solution for adaptive scheduling The resource scheduling (adaptive as well as non-frequency adaptive) is fast offering around 1 ms minimum delay over the radio interface
The user plane of the MAC system layer can be outlined as follows for the downlink The arriving packets are separated into retransmission units that are coded The coded blocks denoted FEC blocks are buffered with per-flow queuing The scheduler allocates resources to flows and then drains the queues with bit-level granularity to fill the allocated chunks Contention-based uplink transmission and peer-to-peer communication use a separate set of subcarriers Cell-wide broadcast messages utilise a set of broadcast OFDM symbols that are located in the preamble of each super-frame
The choice of multiple access method is intimately connected to the problems of resource partitioning and resource scheduling For adaptively allocated flows TDMAOFDMA is used In the baseline design individual chunks are exclusively allocated to flows For non-frequency-adaptively allocated flows mapping a flow on a set of chunks would provide insufficient diversity for small packets The preferred options for solving this problem are presented The problem of integrating SDMA with the studied time-frequency based multiple access schemes is also discussed
Radio resource management (RRM) has the overall goal of utilising the given radio resources in an effi-cient manner The RRM functions are divided into mode-specific RRM functions that are targeted and optimised for a specific system mode and deployment scenario mode-generic RRM functions that are shared between the different WINNER system modes or used for their coordination and cooperative RRM functions which are used for the cooperation of the WINNER system with legacy RANs such as UMTS (including 3GPP long-term evolution) and WLAN An initial set of algorithms for the RRM functions studied within the WINNER framework is described including spectrum mapping and allocation service level controller mode and RAN selection handover admission control load sharingcongestion control and routing The location of these RRM algorithms within the RAN architecture is an essential issue It is envisioned that for the WINNER system with its multiple system modes a hybrid (hierarchical) approach could be suitable where different decision levels of the same RRM functionality that work at different time scales are located in different nodes Finally a first approach to the RRC signalling and a survey of required measurements reports is presented
Extensive performance assessments of the current WINNER concept and variants thereof have been performed through simulations Results are presented for link multi-link and system levels The insight obtained by such simulations supports important system design choices allows identification of favourable configurations of the radio interface and allowed initial system performance estimation Comparisons with other systems and technologies are made where appropriate Implementation impact and performance-complexity trade-offs have been analysed in depth in earlier WINNER deliverables and an overview is contained in this deliverable including electromagnetic field (EMF) exposure aspects
WINNER D210 v10
Page 4 (180)
Authors Partner Name Phone Fax E-mail
AAU Albena Mihovska Phone +45 96358639
Fax +45 98151583
E-mail albenakomaucdk
ACL Thorsten Wild Phone +49 711 821 35762
Fax +49 711 821 32185
E-mail thorstenwildalcatelde
CTH Tommy Svensson Phone +46 31 772 1823
Fax +46 31 772 1782
E-mail tommysvenssons2chalmersse
CTHUU Mikael Sternad Phone +46 704 250 354
Fax +46 18 555096
E-mail mikaelsternadsignaluuse
CTTC Monica Navarro Phone +34 93 645 2915
Fax +34 93 645 2901
E-mail monicanavarrocttces
Stephan Pfletschinger E-mail stephanpfletschingercttces
CU David Falconer Phone +1 613 520 5722
Fax +1 613 520 5727
E-mail ddfscecarletonca
Chan Tong Lam E-mail lamcsangamscecarletonca
Florence Danilo-Lemoine Phone +1 613 520 2600 ext 5691
Fax +1 613 520 5727
E-mail fdaniloscecarletonca
WINNER D210 v10
Page 5 (180)
DLR Armin Dammann Phone +49 8153 28 2871
Fax +49 8153 28 1871
E-mail armindammanndlrde
Simon Plass Phone +49 8153 28 2874
Fax +49 8153 28 1871
E-mail simonplassdlrde
DoCoMo Gunther Auer Phone +49 89 5682 4219
Fax +49 89 5682 4301
E-mail auerdocomolab-eurocom
Jeacuterocircme Bonnet Phone +49 89 5682 4229
Fax +49 89 5682 4301
E-mail bonnetdocomolab-eurocom
EAB David Asteacutely Phone +46 8 585 301 49
Fax +46 8 585 314 80
E-mail davidastelyericssoncom
Johan Axnaumls Phone +46 8 404 38 59
Fax +46 8 585 314 80
E-mail johanaxnasericssoncom
Niklas Johansson Phone +46 8 508 77860
Fax +46 8 7575720
E-mail niklasjJohanssonericssoncom
Goumlran Klang Phone +46 8 404 4794
Fax +46 8 585 314 80
E-mail gorannklangericssoncom
Magnus Olsson Phone +46 8 585 307 74
Fax +46 8 585 314 80
E-mail magnusaolssonericssoncom
Per Skillermark Phone +46 8 58531922
Fax +46 8 7575720
E-mail perskillermarkericssoncom
Kai-Erik Sunell Phone +46 8 757 35 61
Fax +46 8 585 314 80
E-mail kai-eriksunellericssoncom
WINNER D210 v10
Page 6 (180)
FTRampD Marie-Heacutelegravene Hamon Phone +33 2 99 12 48 73
Fax +33 2 99 12 40 98
E-mail mhelenehamonfrancetelecomcom
Rodolphe Legouable E-mail rodolphelegouablefrancetelecomcom
Mylegravene Pischella Phone +33 1 452 98 963
Fax +33 1 452 94 194
E-mail mylenepischellafrancetelecomcom
Thomas Saumllzer E-mail thomassalzerfrancetelecomcom
IBM Pedro Coronel Phone +41 1 724 8532
Fax +41 1 724 8955
E-mail pcozurichibmcom
Wolfgang Schott Phone +41 1 724 8476
Fax +41 1 724 8955
E-mail sctzurichibmcom
KTH Mats Bengtsson Phone +46 8 790 8463
Fax +46 8 790 7260
E-mail matsbengtssons3kthse
LUK Angeliki Alexiou Phone +44 1793 776620
Fax +44 1793 776725
E-mail alexioulucentcom Abdelkader Medles Phone +44 1793 776783
Fax +44 1793 776725
E-mail medleslucentcom
MOT Markus Muck Phone +33 1 6935 2573
Fax +33 1 6935 7701
E-mail MarkusMuckmotorolacom
WINNER D210 v10
Page 7 (180)
NTUA Elias Tragos Phone +302107721511
Fax +302107722534
E-mail etragostelecomntuagr
NOK Carl Eklund Phone +358 50 4836566
Fax +358 7180 36067
E-mail carleklundnokiacom
Kari Kalliojaumlrvi Phone +358 50 4836232
Fax +358 7180 35935
E-mail karikalliojarvinokiacom
Antti Sorri Phone +358 50 4821294
Fax +358 7180 36857
E-mail anttisorrinokiacom
Samuli Visuri Phone +358 50 4868219
Fax +358 7180 36857
E-mail samulivisurinokiacom
NOKCH Yong Teng Phone +86 10 65392828 2753
Fax +86 10 84210576
E-mail yongtengnokiacom
RWTH Ole Klein Phone +49 241 80 28575
Fax +49 241 80 22242
E-mail olekleincomnetsrwth-aachende
Ralf Pabst Phone +49 241 80 25828
Fax +49 241 80 22242
E-mail pabcomnetsrwth-aachende
PRL Keith Roberts Phone +44 1293 815754
Fax +44 1293 815024
E-mail keithrobertsphilipscom
WINNER D210 v10
Page 8 (180)
PUT Zbigniew Dlugaszewski Phone +48 61 665 3916
Fax +48 61 665 2572
E-mail zdlugaszetputpoznanpl
Adam Piatyszek Phone +48 61 665 3936
Fax +48 61 665 2572
E-mail adampiatyszeketputpoznanpl
Michal Wodczak Phone +48 61 665 3913
Fax +48 61 665 2572
E-mail mwodczaketputpoznanpl
SEUK Thierry Lestable Phone +44 1784 428600 Ext720
Fax +44 1784 428624
E-mail thierrylestablesamsungcom
Vaia Sdralia Phone +44 1784 428600
Fax +44 1784 428629
E-mail vaiasdraliasamsungcom
SM Elena Costa Phone +49 89 636 44812
Fax +49 89 636 45591
E-mail elenacostasiemenscom
Martin Doumlttling Phone +49 89 636 73331
Fax +49 89 636 1373331
E-mail martindoettlingsiemenscom
Joumlrn von Haumlfen Phone +49 89 636 46228
Fax +49 89 722 13034834
E-mail joernvon_haefensiemenscom
Eiman Mohyeldin Phone +49 89 636 45340
Fax +49 89 636 45591
E-mail eimanmohyeldinsiemenscom
SMBenQ Mobile Karsten Bruumlninghaus Phone +49 2842 95 1742
Fax +49 2842 95 3387
E-mail karstenbrueninghausbenqcom
WINNER D210 v10
Page 9 (180)
SMRMR Bill lsquoXinqunrsquo Liu Phone +44 1794 833547
Fax +44 1794 833586
E-mail xinqunliurokecouk
David Thomas Phone +44 1794 833431
Fax +44 1794 833433
E-mail davidThomasrokecouk
SMTUB Eduard A Jorswieck Phone +49 30 31002860
Fax +49 30 31002863
E-mail jorseycstu-berlinde
Volker Jungnickel Phone +49 30 31002768
Fax +49 30 31002647
E-mail volkerjungnickelmktu-berlinde
Malte Schellmann Phone +49 30 31002770
Fax +49 30 31002647
E-mail malteschellmanntu-berlinde
Aydin Sezgin Phone +49 30 31002868
Fax +49 30 31002863
E-mail aydinsezginmktu-berlinde
SMTUD Tobias Frank Phone +49 6151 16 3769
Fax +49 6151 16 53 94
E-mail tobiasfranknttu-darmstadtde
SMTUHH Ting Chen Phone +49 40 42878 2165
Fax +49 40 42878 2281
E-mail tchentu-harburgde
Rainer Gruumlnheid Phone +49 40 42878 2166
Fax +49 40 42878 2281
E-mail gruenheidtu-harburgde
WINNER D210 v10
Page 10 (180)
SMUU Stephan Stiglmayr Phone +49 731 50-31531
Fax +49 731 50-31509
E-mail stephanstiglmayre-technikuni-ulmde
TID Emilio Mino Phone +34 91 3374428
Fax +34 91 3374212
E-mail eminotides
TUD Ernesto Zimmermann Phone +49 351 463 34958
Fax +49 351 463 37255
E-mail zimmereifnettu-dresdende
TUI Martin Fuchs Phone +49 3677 69 1156
Fax +49 3677 691195
E-mail martinfuchstu-ilmenaude
Veljko Stankovic Phone +49 3677 69 1156
Fax +49 3677 691195
E-mail veljkostankovictu-ilmenaude
Martin Haardt Phone +49 3677 69 2613
Fax +49 3677 691195
E-mail martinhaardttu-ilmenaude
UniS Mohammad Abaii Phone +44 1483 683609
Fax +44 1483 686011
E-mail MAbaiisurreyacuk
Yajian Liu Phone +44 1483 686015
Fax +44 1483 686011
WINNER D210 v10
Page 11 (180)
UOULU Kari Hooli Phone +358 8 553 2883
Fax +358 8 553 2845
E-mail karihoolieeoulufi
Juha Karjalainen Phone +358 8 553 7637
E-mail JuhaKarjalaineneeoulufi
Zexian Li Phone +358 8 553 2877
E-mail zexianlieeoulufi
WINNER D210 v10
Page 12 (180)
Table of Contents
Terminology Acronyms and Abbreviations 17
Mathematical Symbols and Notation 22
1 Introduction and Radio Interface Structure 23 11 Requirements and design targets 23 12 Key components of the radio interface 24 13 Top-down overview of the WINNER system concept 24
131 Services protocols and design 24 132 System layers modes and parameterisation 26
14 Scope of this document 28
2 Physical Layer 29 21 Forward error correction 29 22 Modulation and space-time-frequency processing 30
221 General resource allocation strategy 30 222 Modulation technique 30 223 Modulation parameters 31 224 Transceiver structure 31 225 Space-time-frequency processing 33
23 Pilot grid design for channel estimation and synchronisation 34 231 Synchronisation 34 232 Channel estimation 35
3 Medium Access Control (MAC) Layer 36 31 Medium access control for FDD and TDD cellular transmission 36
311 Goals and design principles 36 312 Control of relay-enhanced cells 36 313 The MAC services and tasks 37 314 The chunk slot frame and super-frame structure 38 315 Overview of main functions 40 316 Resource mapping and multiple access 42
32 Medium access control for peer-to-peer transmission 43 321 MAC architecture for P2P transmission 43 322 Frame structure of DAC for P2P transmission 44
4 Radio Resource Management (RRM) and Radio Resource Control (RRC) 46 41 RRM functions 46 42 WINNER RRM architecture 48
WINNER D210 v10
Page 13 (180)
43 Radio resource control 49 431 RRC states 49
5 Assessment Overview 51 51 General 51 52 Challenges 51 53 Summary of results ndash performance and complexity 52
531 Analogue RF 52 532 Digital baseband 52 533 Multiple access 55 534 Radio protocols 56
54 Comparison of performance results with requirements and design targets 56
6 Conclusions and Outlook 59
Appendix A Requirements and Design Targets 60 A1 Targets for different scenarios 60
A11 Scenarios 60 A12 Rural area 60 A13 Metropolitan area 61 A14 Local area 61
A2 Additional targets 61 A3 System assumptions 62
Appendix B Physical Layer 63 B1 Spatial processing and space-time-frequency mapping 63 B2 Forward error correction 66
B21 Implementation issues flexibility parallelisation throughput 67 B22 Rate compatible code sets for HARQ-II 68 B23 Low-density parity-check codes decoding options 69 B24 Scheduling of the decoder 69
B3 Modulation 70 B31 Assessment of modulation techniques 70 B32 OFDM vs single carrier 71 B33 Guard interval design 72 B34 Modulation alphabets and bit mapping 72
B4 Pilot design for channel estimation and synchronisation 73 B41 Intra- and inter-cell synchronisation using dedicated training symbols 73 B42 Pilot grid for generalised multi-carrier (GMC) 75
B5 Adaptive transmission 78 B51 Bit and power loading algorithms 78 B52 Channel quality prediction for adaptive transmission 79
WINNER D210 v10
Page 14 (180)
B53 Compression of channel state feedback for adaptive transmission 81
Appendix C MAC System Layer Functions 83 C1 Functional architecture of the WINNER medium access control for FDD and TDD cellular
transmission 83 C11 MAC radio resource control Resource partitioning and constraint combining 83 C12 MAC radio resource control Flow setup and termination 84 C13 MAC radio resource control Spatial scheme pre-configuration and selection 85 C14 MAC control feedback 86 C15 Radio packet transfer Transmission and reception 86 C16 Resource scheduling 88 C17 SDMA and spatial user partitioning 91 C18 Timing of the execution of the main MAC functions 93
C2 Functional architecture for peer-to-peer MAC 93 P2P-DAC channel access control functions 95
C3 Chunk definition 96
Appendix D Radio Resource Management (RRM) and Radio Resource Control (RRC) 97 D1 RRM functions 97
D11 Spectrum control 97 D12 Service level control (SLC) 98 D13 ModeRAN selection 99 D14 Handover 100 D15 Admission control 101 D16 Load control 102 D17 Routing 102
D2 RRM architecture 104 D21 Location of WINNER functions 104
D3 RRC functionalities 105 D31 Measurements and reports 105 D32 Other functions 106
Appendix E Assessments Assumptions 108 E1 Overview 108 E2 Basic parameters for link level evaluations 108 E3 Basic parameters for multi-link and system level evaluations 109
E31 Mode specific parameters 109 E32 Common to all modes 110
E4 Scenario parameters 111
Appendix F Link-Level Assessments 112 F1 Link layer performance Throughput 112
WINNER D210 v10
Page 15 (180)
F2 Forward error correction 116 F21 Performance comparison 116 F22 Complexity-performance trade-off 116 F23 Performance comparison of rate compatible punctured codes 118 F24 BLDPCC performance comparison of major decoding algorithms 118 F25 Performance when using different decoding schedules 119 F26 Base model matrices for BLDPC codes 120
F3 Channel estimation 122 F31 Uplink single carrier 122 F32 Pilot-aided and iterative channel estimation for OFDM 124 F33 Design of the channel estimation unit 126 F34 Unbiased channel interpolation 127 F35 Channel estimation using the guard interval mdash pseudo-random-postfix OFDM 128
F4 Synchronisation 129 F41 Synchronisation without utilizing an explicit training symbol 129
F5 Performance of selected bit and power loading algorithms 132
Appendix G Multi-Link and System-Level Assessments 134 G1 Downlink multiple access 135
G11 Comparison of non-adaptive OFDMA MC-CDMA and adaptive OFDMA 135 G12 Comparison of non-adaptive subcarrier interleaved OFDMA and MC-CDMA 138 G13 Comparison of non-adaptive OFDMA MC-CDMA and TDMA 139 G14 Impact of chunk sharing on the performance of adaptive OFDMATDMA 140 G15 Comparison of adaptive OFDMA and OFDMASDMA using GoBs 142
G2 Downlink spatial processing 144 G21 Comparison of fixed and tracking based beamforming 144 G22 Comparison of various adaptive beamforming techniques 145 G23 Comparison of maximal ratio and interference rejection combining at UT 147 G24 Comparison of beamforming diversity and multiplexing 148 G25 Performance of SMMSE precoding 151
G3 Downlink multi-user detection 153 G31 Comparison of receiver structures for SISO MC-CDMA 153 G32 Comparison of receiver structures for MIMO MC-CDMA 154
G4 Uplink multiple access 155 G41 Performance of single carrier based adaptive TDMA 155 G42 Comparison of IFDMA and chunk based OFDMA 156 G43 Performance of adaptive OFDMA 157 G44 Comparison of adaptive OFDMA and OFDM-TDMA 159
G5 Uplink spatial processing 161 G51 Performance of spatial diversity 161 G52 Linear precoding concepts with long term channel state information 162
WINNER D210 v10
Page 16 (180)
G6 Uplink multi-user detection 163 G61 Comparison of receiver structures for DS-CDMA 163 G62 Comparison of receiver structures for MIMO single carrier 164
G7 Other topics 166 G71 OFDM versus single carrier based uplinks 166 G72 Performance of low rate channel coding for one-cell frequency reuse 167 G73 Comparison of FDMA and TDMA based resource partitioning among BS 169 G74 Comparison of conventional and self-organised RRM in cellular networks 171 G75 VAA technology with adaptive pre-selection aided by MC-OLSR protocol 172
References 174
WINNER D210 v10
Page 17 (180)
Terminology Acronyms and Abbreviations In this chapter abbreviations are explained and fundamental terms are listed which are not commonly used andor have specific meaning throughout the document A short explanation or a reference to the corresponding section that defines this term is given where appropriate
Term Description
AC Admission Control
ACS Access Control Server
AMA Alpha-Min Algorithm
BCH Broadcast (Transport) Channel
BICM Bit Interleaved Coded Modulation
BLDPCC Block Low-Density Parity-Check Code
BPA Belief Propagation Algorithm
BPSK Binary Phase Shift Keying
BS Base Station A stationary network element serving relay nodes or user terminals Base stations are interconnected with network elements belonging to the RAN
BSsr Short-range BS
BSwa Wide-area BS
CAI Co-Antenna Interference
CAP Contention Access Period in peer-to-peer MAC
CC Convolutional Code
CCI Co-Channel Interference
CDC Common Data (Transport) Channel for point-to-multipoint communication
CDMA Code Division Multiple Access
Cell A cell is defined by the geographical coverage area of a broadcast channel originating from a base station A BS may control several cells A cell uses a single PLM on a particular carrier frequency See also REC
Chunk Basic time-frequency resource unit for OFDM links consisting of a rectangular time-frequency area that comprises nsymb of subsequent OFDM symbols and nsub of adjacent subcarriers
Chunk layer A time-frequency chunk within one spatial channel (layer)
CoopRRM Cooperative Radio Resource Management
CP Cyclic Prefix
CQI Channel Quality Information measurement required for (spatial) link adaptation containing condensed information about the channel eg signal-to-interference and noise ratio
CRC Cyclic Redundancy Check
CRRM Common Radio Resource Management
CSI Channel State Information measurement required for spatial link adaptation containing detailed information about the channel eg complex-valued channel gain matrix correlation matrix
CSMACD Carrier-Sense Multiple Access Collision Detect
CTP Control Period of DAC physical channel in P2P MAC
WINNER D210 v10
Page 18 (180)
Term Description
DAC Contention-Based Direct Access (Transport) Channel
DBTC Duo-Binary Turbo Code
DCT Discrete Cosine Transform
DFE Decision Feedback Equalisation
DS-CDMA Direct Sequence Code Division Multiple Access
DVB Digital Video Broadcasting
DVB-S Digital Video Broadcasting ndash Satellite
DVB-T Digital Video Broadcasting ndash Terrestrial
FDD Frequency Division Duplexing
FDMA Frequency Division Multiple Access
FDOSS Frequency Domain Orthogonal Signature Sequences
FD-DFE Frequency-Domain Decision-Feedback Equalisation
FEC Forward Error Correction (Coding)
FEC block FEC coded transmission block with whole or part of RTU as payload
FER Frame Error Rate
FFT Fast Fourier Transform
Flow Packet stream from one source to one or several destinations
FMT Filtered Multi-Tone
Frame Timeslot consisting of one uplink and one downlink transmission slot
GAP Guaranteed Access Period slotted part of DAC physical channel in P2P MAC
GI Guard Interval
GMC Generalised Multi-Carrier
GPS Global Positioning System
HARQ Hybrid Automatic Repeat Request
HHO Horizontal Handover handover to other cell within the same system
HIS Hybrid Information System
HPA High Power Amplifier
HSDPA High-Speed Downlink Packet Access
IBO Input Backoff (to transmit HPA due to PAPR)
ICE Iterative Channel Estimation
ICI Inter-Carrier interference
IDCT Inverse Discrete Cosine Transform
IDD Iterative Detection and Decoding
IF Intermediate Frequency
IFDMA Interleaved Frequency Division Multiple Access
IFFT Inverse Fast Fourier Transform
IOTA Isotropic Orthogonal Transform Algorithm
IP Internet Protocol
WINNER D210 v10
Page 19 (180)
Term Description
IR Incremental Redundancy
ITU International Telecommunication Union
ISI Inter-Symbol Interference
LA Link Adaptation
LDC Linear Dispersion Code
LDPCC Low-Density Parity-Check Code
Link A link is a radio connection between two network elements of the WINNER access system It subdivides into relay links between base station and relay nodes or between relays and the user link between the user terminal and the radio access point
LLR Log-Likelihood Ratio
LT Long-Term
LTE Long-Term Evolution of 3GPP
MAC Media Access Control Name used both to denote a system layer (MACSL) and a protocol layer (MACPL) that is implemented in the MAC system layer user plane
MAI Multiple Access Interference
MC-CDMA Multi-Carrier Code Division Multiple Access
MCN Multi-hop Cellular Network cellular network that includes relay nodes
MIMO Multiple Input Multiple Output
MMSE Minimum Mean Square Error
MSA Min-Sum Algorithm
MU Multi-User
OBF Opportunistic Beamforming
OFDM Orthogonal Frequency Division Multiplexing
OFDMA Orthogonal Frequency Division Multiple Access
P2P Peer-to-Peer transmission
PACE Pilot-Aided Channel Estimation
PAPR Peak-to-Average Power Ratio
PARC Per Antenna Rate Control
PCCC Parallel Concatenated Convolutional Code (Turbo Code)
PDP Power Delay Profile
PDU Protocol Data Unit
PHY Physical Layer Name used both to denote a system layer (PHYSL) and a protocol layer (PHYPL)
PHY mode Basic physical layer transmission strategy currently two modes are defined TDD and FDD Also denoted PLM Physical Layer Mode
Physical channel A set of chunk layers onto which the resource scheduler in the MAC system layer maps data associated with one sub-flow
PLM Physical Layer Mode see PHY mode
PLMN Public Land Mobile Network
PMP Peer-to-Multi-Peer transmission
WINNER D210 v10
Page 20 (180)
Term Description
PRP Pseudo-Random-Postfix
PSAP Provided Service Access Point
PSRC Per Stream Rate Control
QoS Quality of Service
QAM Quadrature Amplitude Modulation
QC-BLDPCC Quasi-Cyclic Block Low-Density Parity-Check Code
RAC Contention-Based Random Access (Transport) Channel
RAN Radio Access Network
RANG Radio Access Network Gateway
RAP Radio Access Point common term that encompasses both base stations and relay nodes
RAT Radio Access Technology
RC Rate-Compatible
REC Relay-enhanced cell The geographical area covered by one broadcast channel from a single base station plus the broadcast channels from its connected relay nodes
RF Radio Frequency
RI Radio Interface
RLC Radio Link Control Name used both to denotes a system layer (RLCSL) and a protocol layer RLCPL) that is implemented in the RLC system layer user plane
RN Relay Node A network element serving other RN or UT in a given geographical area via its radio access capabilities It is wirelessly connected to a base station another relay node andor a user terminal and forwards data packets between these network elements
RNC Radio Network Controller
RRC Radio Resource Control Protocol that provides the signalling for control and feedback messages
RRM Radio Resource Management Control functions implemented in the RLC system layer control plane
RSB Resource Scheduling Buffer
RTU Retransmission Unit packets upon which HARQ is performed
RUP Reuse Partitioning
SAP Service Access Point
SC Single Carrier
SDMA Spatial Division Multiple Access
SDU Service Data Unit
SDFE Soft Decision Feedback Equalisation
Sector Azimuth angle partition of a base station coverage area In the system-level simulations of this document each sector constitutes a separate cell
SF Super-Frame
SF preamble Initial part of super-frame transmitted cell-wide in spectrum available everywhere
SF-MMSE Space-Frequency MMSE
WINNER D210 v10
Page 21 (180)
Term Description
SFTuCM Space-Frequency Turbo Coded Modulation
SINR Signal-to-Interference-and-Noise ratio
SISO Single-Input Single-Output
Site A location with co-located antenna element that belong to one base station
SLC Service Level Control
Slot short form of Timeslot see below
SMMSE Successive Minimum Mean Square Error precoding
SNR Signal-to-Noise Ratio
SO-RRM Self-Organised Radio Resource Management
SPIC Soft Parallel Interference Canceller
ST-WNRA Space-Time Weighted Nonbinary Repeat Accumulate (Code)
Sub-flow Data stream after segmentation consisting of FEC blocks
SUD Single User Detection
Super-frame Timeslot spanning whole band with place for flows from all transport channels contains also synchronisation symbols and nf frames
System Mode Specific combinations of algorithm assignations or ranges of algorithm assignations may be referred to as modes The two main considered physical layer modes (PLM) are based on and denoted FDD and TDD A System mode is a PL mode combined with a MAC mode
Targeted Flow CDC packet stream to a subset of the multicast receivers within the cell
TC Turbo Code
TCP Transmission Control Protocol
TDC Targeted Data (Transport) Channel for point-to-point communication
TDD Time Division Duplexing
TDMA Time Division Multiple Access
TEQ Turbo Equalisation
(Time)slot Time unit of one contiguous uplink or downlink transmission in FDD or TDD
Transport channel Interface between the RLC and the MAC layer user planes
UMTS Universal Mobile Telecommunication System
UT User Terminal A physical network element used by the end user to access a service or set of services
UTRAN UMTS Terrestrial Radio Access Network
VAA Virtual Antenna Array
VHO Vertical Handover handover between different systems
WLAN Wireless Local Area Network
ZF Zero Forcing
WINNER D210 v10
Page 22 (180)
Mathematical Symbols and Notation
Symbol Description acl(tf) virtual antenna chunk for chunk c layer l symbol t and subcarrier f Bi information bits to be transmitted f subcarrier Fcl precoding matrix for chunk c and layer l K number of users Mr number of receive antennas Mt number of transmit antennas Ndata number of data symbols per chunk nf number of frames per super-frame nsub number of subcarriers per chunk nsymb OFDM symbols per chunk Qc number of spatial layers in chunk c Rmin minimum coding rate
Sc number of modulated layers in chunk c
t time (OFDM symbol)
Tchunk chunk duration
TOi time-out Tslot MAC slot duration
xcl(tf) antenna chunk for chunk c layer l symbol t and subcarrier f
WINNER D210 v10
Page 23 (180)
1 Introduction and Radio Interface Structure The definition of a new radio interface (RI) concept is an inherently iterative process determined not only by pure technical considerations but also by regulatory and other decisions or restrictions The technical and regulatory processes are mutually dependent From a design perspective this is clearly a problem since the regulatory framework is needed to provide an optimised solution On the other hand the regulatory process requires technical arguments and indications to define the system and spectrum framework
This is the prevailing situation under which the new WINNER system and in particular the new WINNER radio interface is developed It therefore provides solutions for different system frameworks and a wide range of possible spectrum allocations This document describes the general WP2 RI concept and current mainstream assumptions based on a consolidation process of previous WINNER deliverables and results Key technology concepts are assessed against the requirements and assessment criteria derived from WP7 work System design choices are guided by technical strategic and economic aspects Technical assessment criteria include system performance implementation aspects terminal and system complexity scalability and flexibility Also of major concern is the interworking with legacy radio technologies and efficient implementation of multi-standard equipment in particular OFDM-based systems eg like the one discussed in 3GPP long-term evolution (LTE)
The overall requirements design targets and key components for the WINNER RI are given in Chapter 1 Chapter 1 also provides some background to the system framework as far as required for the remainder of this document in the form of a top-down survey The contribution of this deliverable is discussed in the framework of the overall system concept work including service specification service architecture protocols and system design Thereafter Chapters 2ndash4 provide a detailed bottom-up discussion of the system design The physical layer design including transceiver diagrams coding modulation spatial processing synchronisation and channel estimation is explained in Chapter 2 Chapter 3 shows the functional design and architecture for the cellular medium access control (MAC) system layer and the MAC for peer-to-peer direct communications Chapter 4 does the same for radio resource management (RRM) and radio resource control (RRC) Chapter 5 gives an overview on key assessments performed to support design choices to exemplify favourable configurations of the RI and to obtain initial performance estimation For brevity these chapters focus on major results and key components further rationale and detail is provided in dedicated appendices for each topic
11 Requirements and design targets The WINNER system should fulfil the ITU-R Recommendation M1645 about systems beyond IMT-2000 (ie beyond 3G) In particular 100 Mbps peak aggregate useful data rate for mobile access and 1 Gbps for local area are assumed for these systems Peak data rates do not however give any indication on the quality of service experienced by one user and a set of amendments and extended system requirements are presented in [WIND71] A number of them are directly relevant to the radio interface
bull R36 Peak spectral efficiency in connected sites of 10 bitsHzsite in wide-area deployments for high load
bull R37 Peak spectral efficiency in isolated (non-contiguous) sites of 25 bitsHzsite
bull R32 A sustainable average ldquohigh endrdquo data rate per link of 50 Mbits above Layer 2
bull R33 A consistent and ubiquitous data rate per link of 5 Mbits above Layer 2
bull R312 User speeds ranging from 0ndash500 kmh should be supported
bull R34 A maximum delay over the radio interface of 1 ms at Layer 2
bull R67 Maximum bandwidth per radio link 100 MHz
Although providing useful indications these system requirements do not provide sufficient information to completely specify required capabilities and performance of the radio interface The reason is that several fundamental pieces of information eg the traffic intensity for which the system is to be designed the admission and congestion strategies the maximum allowed output power from different types of network nodes in different environments spectrum availability etc are not yet established ndash but crucial to calculate absolute numbers of many key parameters This uncertainty is unavoidable since most of the missing parameters are determined by pending political legal and strategic decisions of different regulating bodies and in the end by the network operator
WINNER D210 v10
Page 24 (180)
Nevertheless in order to develop an adequate system concept technical design targets and guidelines for the radio interface are needed at an early stage Therefore a number of scenarios believed to be relevant for the WINNER system have been identified and for each scenario a set of more technically oriented targets with details about bit rates and other parameters have been specified The scenarios and targets are summarised in Appendix A In Chapter 5 and its associated appendices (Appendix E Appendix F and Appendix G) comparisons of simulation results with these design targets are made In addition direct comparisons with the requirements are made to the extent possible In the latter case several additional assumptions about missing parameters are needed and there are many simplified conditions and uncertainties that must be borne in mind when interpreting such results as further discussed in Chapter 5
12 Key components of the radio interface In order to meet the requirements discussed above the WINNER radio interface has been designed as a packet-oriented user-centric always-best concept It defines a scalable and flexible radio interface based on adaptive and compatible system modes tailored to particular situations such as the radio environment the usage scenario the economic model etc The always-best solution is enabled by several innovative key components such as
bull a flexible multi-mode protocol architecture enabling efficient interworking between different system modes
bull relay-enhanced cells as an integrated part of the concept
bull design and support for operation in shared spectrum and inter-system coordination
bull consequent MAC design for packet-oriented transmission including two-layered resource scheduling and short radio interface delays
bull resource allocation targeting interference avoidance by coordinated scheduling across base stations and relay nodes or using joint (spatial) precoding over distributed antennas
bull physical layer design using generalised multi-carrier (GMC) in different configurations to ensure low complexity high spectral efficiency and high granularity of resource elements
bull a spatial multi-user link adaptation concept allowing scalability in link adaptation and multi-user optimisation and being able to adapt to a wide range of deployments operational scenarios propagation channel service requirements and terminal capabilities
bull novel multi-user precoding techniques developed within WINNER
bull support of self-organised synchronisation of terminals and base station
bull optimisation techniques for overhead and control signalling
A detailed discussion of these key elements is provided in the conceptual part of this document The remainder of Chapter 1 is dedicated to introducing the overall WINNER system concept in order to provide the necessary framework and nomenclature
13 Top-down overview of the WINNER system concept
131 Services protocols and design A challenging task in the concept development work is to ensure that the different key components can be embedded into one single radio interface concept that is technically sound for a ubiquitous radio system and its multiple deployment scenarios A fundamental principle is to study important problems from different perspectives in a systematic manner taking advantage of the large variety of technical competence that is available in the different working groups Consequently the radio interface concept development work is carried out from service-oriented protocol and design perspective The main differences between these three perspectives are that they all represent different levels of abstractions and technical details as illustrated in Figure 11 The studies of technical details and the development of abstractions are performed in parallel and complement each other
The service-oriented view is based on a top-down system engineering approach A system consists of layers and each system layer provides services towards the layer above Services and their users are first identified starting from the highest layer Identified services are broken into service components and the
WINNER D210 v10
Page 25 (180)
external behaviour of these components (as seen by the users) are modelled with high-level abstractions or provided service access point (PSAP) state-machines1 The main goal of this type of representation is to describe services without touching any technical details The resulting hierarchical structure of these behavioural descriptions is referred to as a service specification [WIND76] The service specification describes the system at the highest level of abstraction
Level of abstraction
Level of technical details
Radio interface design
Radio interface design
Protocol architecture
Protocol architecture
Layer-to-layer and
peer-to-peer
communication
Service specification
Service specification
Layer-to-layer
communication
Entity-to-entity
communication
Figure 11 The three views on radio interface concept studies
The service specification is further mapped to a service architecture that explains the provided services thus providing the starting point for the protocol view The service architecture describes the details of provided services by defining service access point (SAP) interfaces between layers One single PSAP state-machine may be mapped onto one or several SAPs eg (highly-abstract) packet transfer services (as described by the service specification) may be explained with multiple SAPs that are aimed for different purposes such as point-to-point and point-to-multipoint communication The definition of these interfaces is followed by a description of protocol architecture that is a set of radio protocols and protocol layers that implements the service architecture
Protocols are in turn defined as set of rules and formats that govern the communication between protocol peer-entities2 ie communicating parties at the same level over the air Even though the placement of control functions and the formal description of protocols is currently under discussions there is a general consensus concerning the overall protocol structure and protocol layers Currently the overall structure consists of radio resource control (RRC) radio link control (RLC) medium access control (MAC) and Physical (PHY) protocol layers The RRC protocol is used by the radio resource management functions RLC protocol provides reliable packet transfer over the radio interface The MAC protocol arbitrates access to the shared medium and associates each destination with a unique address The PHY protocol is responsible for transferring information over a physical link As the vision is to connect the radio interface to an Ambient Network [AN05] upper layers handle the rest of the functionalities
The radio protocol architecture is shown in Figure 12 where SAPs are illustrated with circles and proto-col instances are illustrated with rectangles For further information about protocols and service-oriented descriptions see [WIND76 WIND35 WIND32 WIND31]
It should be emphasised that the radio protocol architecture is a very general description about the communication of two nodes over the air In order to ensure that the radio interface architecture can support all envisioned key technologies and reach the desired performance design and implementation related studies are important Of particular interest is to gain knowledge about the technical feasibility of envisioned key technologies for lower layers The design view describes the radio interface with the high-est level of technical details and it addresses problems that are related to radio interface functions and
1 In WP7 UML 20 is used to describe these state-machines 2 This should not be confused with the notion of peer-to-peer communication that later on (throughout this
deliverable) refers to direct communication between physical nodes
WINNER D210 v10
Page 26 (180)
detailed algorithmic solutions Since the main focus of this deliverable is on those lower layer protocols and functions and the evaluation of their performance the design perspective is consistently used throughout this document
PHY
RLCRLC
RLCRLC
RLC
MAC
RRC
rdquoTransportrdquo channels
Chunk rdquolayersrdquo
Packet transfer services
L1PHY
L2MAC
L2RLC
L3RRC
Figure 12 WINNER radio protocol layers and interfaces
132 System layers modes and parameterisation There are four system layers in the WINNER system concept according to the description in [WIND76] These layers are further divided into user plane and control plane The services that need to operate on individual data units (IP packets or lower layer PDUs) have been placed in the user plane The control plane services operate on longer time scales and control the operation of the user plane services by way of control signalling
1321 The system layers The functional role of each system layer is as follows
IP convergence (IPC) layer
The user plane of the IPC layer receives IP packets from the user of the WINNER RAN maps them into flows and performs header compression and decompression The control plane is responsible for RAN association functions as well as macro-mobility (IP level mobility)
Radio link control (RLC) layer
The user plane of the RLC layer provides reliable packet transfer over the radio interface It also performs confidentiality protection and packet prioritisation in order to meet the quality-of-service (QoS) goals The control plane takes care of flow establishment and release location services load spectrum and micro-mobility control These radio resource management (RRM) functions of the control plane will be described in Chapter 4 and Appendix D
Medium access control (MAC) layer
The MAC user plane provides the service ldquoradio packet transferrdquo ie transmission and reception of packets over the radio interface An important part of this service is the scheduling of packets The control plane provides the ldquoMAC radio resource controlrdquo service ie acceptance and execution of control messages from higher layers that specify required transmission parameters and boundary conditions Furthermore it implements ldquoMAC control feedbackrdquo ie messaging that supports the flow control the QoS control and the spectrum assignment and other functions at the RLC system layer There is a tight inter-layer interaction between MAC and physical layers and this is crucial for the performance of the WINNER system Some functions such as encoding and decoding that are traditionally placed in the physical layer are in the WINNER system concept placed in the MAC system layer The MAC system layer is outlined in Chapter 3 and Appendix C
WINNER D210 v10
Page 27 (180)
Physical (PHY) layer
The PHY system layer handles the physical transmission of flows and of measurements and control signalling directly related to the radio interface The PHY system layer is not separated into user plane and control plane since it is assumed that all control functionality for the PHY layer resided within the control plane of the MAC system layer The design of the PHY system layer is one of the major topics of this document It is described in Chapter 2 and Appendix B
1322 Physical layer modes and flexible parameterisations The WINNER architecture should be unified yet flexible enough to handle deployments from wide area coverage to high capacity hot spots A basic goal is that the WINNER radio interface should present a unified set of services to higher layers yet include some specific parts that provide the required flexibil-ity To provide flexibility and convergence in a structured way the definition of modes is helpful
A physical layer mode (PLM) can be defined where there is a significant impact (discontinuity in adap-tation) of PHY functionality on the radio interface concept Two PLMs have been defined
bull Frequency division duplex (FDD) transmission performed over paired bands and supporting half-duplex FDD terminals
bull Time division duplex (TDD) transmission over unpaired band
Although any PLM can be configured for any kind of deployment in this document the FDD mode is evaluated primarily in wide-area cellular deployment scenarios using frequency bands of different width The TDD PLM has so far primarily been evaluated in short-range cellular deployment
A system mode represents a specific combination of physical layer modes and MAC modes (Section 83 of [WIND76]) All higher layer functions are designed to be mode-independent (generic) and form the unified interface of the WINNER system
There are three MAC modes within the concept
bull FDD cellular MAC
bull TDD cellular MAC
bull MAC for peer-to-peer transmission at present designed using the TDD physical layer mode
The combinations of PHY and MAC modes thus define three WINNER system modes
Parameterisations within modes provide further flexibility and adaptability Both PLMs use generalised multi-carrier (GMC) transmission which includes CP-OFDM and serial modulation as special cases (Section 222) Multiple access is realised in frequency time space and in particular cases also in the code domain Further details are provided in Section 316
The basic time-frequency unit for resource partitioning is denoted a chunk It consists of a rectangular time-frequency area (see Figure 13 a) that contains payload symbols and pilot symbols It may also contain control symbols that are placed within the chunks to minimise feedback delay (in-chunk control signalling) The number of offered payload bits per chunk depends on the utilised modulation-coding formats and on the chunk sizes In transmission using multiple antennas the time-frequency resource defined by the chunk may be reused by spatial multiplexing A chunk layer represents the spatial dimen-sion (Figure 13 b)
The chunks and chunk layers are pre-assigned to different types of data flows on a super-frame time scale (Section 314 and Appendix C11) They are then used in a flexible way to optimise the transmission performance For example
bull The antenna resources can be used differently for different flows tofrom user terminals
bull Different users may use different variants of GMC as depicted in Figure 14 For example in uplinks power-constrained users may use single-carrier waveforms within their assigned transmission resources while other terminals use CP-OFDM A prerequisite for attaining both efficiency and flexibility is efficient synchronisation of all transmissions within a cell (Appendix B4)
The coming chapters will describe the concepts used to combine the desired flexibility with the equally desired high efficiency two goals that are often contradictory and challenging to combine
WINNER D210 v10
Page 28 (180)
Tchunk
BWch
unk
nsymb OFDM symbols
n sub
sub
- ca
rrie
rs
Chunk
Chunk
time frequ
ency
Layer 1 Layer 2
Layer 3 Layer 4
layer
a) b)
Figure 13 a) Multi-carrier downlink physical channel structure and chunks b) Chunk layers obtained by spatial reuse
tim e
O ne chunk
U se rs E F G H IF D M A
U se r C se ria l m o d u la tio n
U se r D se ria l m o d u la tio n
U se r A O F D M
U se r B O F D M
O ne sub-carrie r
Figure 14 Use of different variants of GMC modulation by different uplink users
14 Scope of this document The radio interface is embedded in the overall WINNER system concept which defines system layers services functional architecture and protocols as outlined above While [WIND76] focuses on the func-tional architecture of the WINNER system concept and [WIND35] describes protocols and deployment concepts the present report has another focus The design of the lower layers of the radio interface to enable high performance and a preliminary evaluation of the resulting performance
WINNER D210 v10
Page 29 (180)
2 Physical Layer The design of the physical layer implements several innovative features of the WINNER concept
bull A slotted time-frequency chunk pattern that can be adjusted to different propagation scenarios The chunk and frame durations are short which is a basic requirement for a low transmission delay over the radio interface
bull A transmission chain based on generalised multi-carrier (GMC) which enables flexible switching between multi-carrier modulation and (frequency-domain generated) serial modulation
bull A flexible spatial processing is integrated into the transmission and reception chains
bull A scattered pilot grid that supports efficient channel estimation also on chunk basis at very low overhead The cyclic prefix is used to achieve coarse intra-cell synchronisation Additionally training symbols at the beginning of the super-frame enable inter-cell synchronisation also in cases where no global timing reference (eg GPS) is available
bull Efficient means have been developed for compressing the channel quality information feedback required for adaptive transmission and the channel state information required for some multi-antenna schemes These methods reduce the required feedback overhead to reasonable levels
The purpose of this chapter is to present a concise summary of the current selection of technologies for different parts of the WINNER physical layer To provide the rationale behind this selection a detailed assessment is given in Appendix B (concept details) and Appendix F (simulation results) including a summary of the results from previous deliverables [WIND21 WIND22 WIND23 WIND24 WIND27]
21 Forward error correction Among the large number of possible options for forward error correction identified in [WIND21] three techniques have been identified as main candidates for the WINNER system [WIND23] convolutional codes (CC) parallel concatenated convolutional codes (PCCC Turbo Codes) and low-density parity-check codes (LDPCC) More specifically Duo-Binary Turbo-Codes (DBTC) and Block-LDPC Codes (BLDPCC) are able to provide excellent performance at medium to large block sizes (200 information bits and beyond) while taking implementation simplicity (eg parallelisation memory requirements) into account already in the code design phase BLDPCC outperform DBTC at large block lengths andor high code rates (for a detailed assessment please refer to Appendix B2) The use of convolutional codes is currently considered for block lengths below 200 information bits However DBTC show very good performance also in this regime so that CC might eventually not be needed to implement channel coding in the WINNER radio interface
Table B1 in Appendix B summarises the relative merits of the three candidate technologies with respect to the most relevant assessment criteria Details on the assessment can be found in [WIND23] and Appendix B2 Note that while the discussion on FEC schemes forms part of the PHY chapters coding in the WINNER system will be mainly implemented in the MAC system layer (MAC-2 sub-layer) as detailed in the Chapter 3 Only convolutional coding as a part of the (spatial) link adaptation within individual chunks will form part of the PHY system layer
In situations where the channel coding gain (using reasonable code rates eg 13 and above) is not suffi-cient to support reliable transmission additional spreading can be used to provide reasonable SINR values This avoids further decoding complexity as would be the case for low-rate channel codes It is however understood that this comes at the expense of lower achievable data rates
WINNER D210 v10
Page 30 (180)
22 Modulation and space-time-frequency processing
221 General resource allocation strategy The overriding principle for allocating the total available resources is to strive primarily for orthogonal use of time-frequency resources Non-orthogonality for example in the form of CDMA SDMA or contention-based signalling is allowed only within carefully prescribed subsets of the total resources designed to limit interference with other parts of the resource pool Furthermore some resources have to be reserved as guard bandsguard spaces to preserve the orthogonality Extension of the orthogonality from single cellssectors to clusters of neighbouring sectors can be done for example by
bull interference avoidance scheduling between cells or
bull joint (spatial) precoding (and detection) over sectors [SWW+04 LWZ04]
For the spatial dimension non-orthogonality is unavoidable spatial reuse of time-frequency resources will always create some interference The general time-frequency space transmission chain outlined in Appendix B1 provides means to tailor and control such interference as outlined in Appendix C17
222 Modulation technique Block signal processing in the frequency domain at both transmitter and receiver using efficient fast (inverse) Fourier transform (IFFTFFT) operations is a natural choice for future high bit rate wireless radio interfaces as signal processing complexity per data symbol rises only logarithmically with the channel delay spread [FK05] Furthermore frequency domain processing enables transmitters to easily and adaptively shape their spectrum occupancy in response to user data rate requirements user terminal capabilities and the availability of unoccupied spectrum It also enables flexible choice of bit rates modulation formats and multiple access schemes according to the current channel state and user need
The generalised multi-carrier (GMC) technique [WIND21 WIND23] will be used for modulation in WINNER as it is essential for providing the flexibility needed to fulfil the ldquoalways bestrdquo principle also on the physical layer It enables to accommodate a plurality of multi-carrier modulationmultiple access schemes such as different flavours of OFDM (CP-OFDM IOTA-OFDM PRP-OFDM) FMT and MC-CDMA as well as the following serial modulation schemes single carrier single carrier DS-CDMA and IFDMA This is done by selection of an appropriate mapping strategy (data symbols to subcarriers) guard interval design and (frequency domain) filtering The GMC approach is also extremely useful in generating multi-band signals for spectrum flexibility [WIND22]
A small set of the above stated modulation technique options will be sufficient to efficiently adapt the WINNER system to the most relevant deployment scenarios outlined in Appendix A1 This restriction will also keep the complexity of the WINNER radio interface in terms of implementation options at a reasonable level To enable the choice of appropriate techniques their relative merits have been thoroughly studied [WIND21 WIND22 WIND23] The results of this assessment work are summarised in Table B3 and the following options have been selected for use in the WINNER system
bull GMC configured as standard CP-OFDM
o for downlink transmission in the TDD and FDD modes
o for uplink transmission when terminal power consumption is not a limiting factor
bull GMC configured as serial modulation (DFT precoded CP-OFDM)
o for uplink transmission in the power limited wide-area case
The above specifications define only the modulation technique ndash the choice of appropriate multiple access schemes for the different modes is discussed in Chapter 3 For adaptive transmission chunk-based OFDMA will be used for non-frequency adaptive transmission MC-CDMA in conjunction with FDMATDMA is the preferred option while for the serially modulated uplink FDMATDMA is envisioned (eg DFT-precoded block OFDMA or IFDMA)
The specific parameterisation of these transmission techniques is governed by the physical channel conditions as outlined in [WIND23] Based on this methodology appropriate parameters have been selected and are summarised in Table 21 Non-differential M-QAM modulation (with BPSK as a special case) is proposed for the use in the WINNER system since channel state information can be made available to the receiver at relatively low pilot overhead in all scenarios as detailed in Section 23 For the wide-area scenario modulation formats up to 64-QAM are proposed while for short-range transmission
WINNER D210 v10
Page 31 (180)
even 256-QAM appears to be feasible Gray mapping is proposed as it is a natural choice for the bit labelling facilitating the calculation of soft output at the detector with low complexity The use of other labellings (in combination with a weaker outer code) is also under investigation in the context of iterative equalisation andor channel estimation
223 Modulation parameters The configuration presented below was used for investigations during the last part of WINNER Phase I Note that the real WINNER system will be required to support several different configurations (parameter sets) in order to effectively adapt to differing channel conditions and fulfil the ldquoalways-bestrdquo objective The parameters listed below are examples for such parameter settings which can be used to study the relative merits of different techniques They are however not claimed to be optimal and refined sets of parameters might be used for Phase II A framework for deriving appropriate parameter sets can be found in [WIND23] The range of reasonable values is much wider for the TDD mode than for the FDD mode where parameter ranges are more severely constrained by assumed channel delay spreads and vehicular velocities [WIND23] in the wide-area scenario All uplink transmissions are embedded in the super-frame and are assumed to be fine-synchronised The assumed centre frequencies are worst-case values The use of FFT sizes up to 2048 has been assumed to be reasonable from an implementation point of view
Table 21 Basic transmission parameters used for simulation of GMC based systems
Parameter FDD mode
(2times20 MHz)
TDD mode
Unitsnotes
Centre frequency 50 DL 42 UL 50 GHz
Duplexing method FDD (paired)
TDD
FFT BW 200 1000 MHz
Number of subcarriers in GMC 512 2048 Equals length of FFT
Subcarrier spacing 39062 48828 Hz
Symbol length
(Excluding cyclic prefix)
2560 2048 micros
Cyclic prefix length 320 128 micros
Total symbol length 2880 21763 micros
Number of subcarriers in use 416 1664 [-208208] and [-832832]
Subcarrier 0 not used
Signal BW 1625 8125 MHz
Chunk size in symbols 8times12 = 96 16times5 = 80 Subcarriers times Symbols
224 Transceiver structure Figure 21 and Figure 22 give a general overview of the envisaged structure for the transmitter and receiver in the WINNER system respectively The structure is the same for all cases of generalised multi-carrier transmission only requiring appropriate configuration for some components The user data is first segmented into flows which then are individually encoded segmented and mapped to chunks where modulation and space-time-frequency processing takes place (cf Appendix B1 for details) Afterwards the modulated chunks are assembled to raw (OFDM) symbols subjected to an IFFT the CP is added and the digital baseband data is finally forwarded to the RF processing
3 A small symbol roll-off time should be added to the OFDM symbol length to reduce the out-of-band power It is
here assumed to be included in the guard intervals
WINNER D210 v10
Page 32 (180)
For OFDM transmission the ldquoGMCrdquo preprocessing block in Figure 21 would only contain (optional) frequency domain filtering For serial modulation however it is necessary to subject the modulated symbols to a FFT prior to any frequency domain (spatial) processing ie modulation has to be done prior to the formation of chunks (spatial processing for single carrier transmission may also be done in the time domain) This operation will be done in the GMC processing block of Figure 21 a block of M modulated symbols that eventually will be turned into one or more chunks will be passed through an M-point FFT The M symbols are now in the frequency domain and are mapped into the specified chunk layers The remaining processing is equivalent to that for other GMC signals eg OFDM It should be emphasised that this approach somewhat reduces the flexibility of the system in the case of serial modulation as all chunks within one serially modulated block will have to undergo the same kind of spatial processing However as serial modulation is envisaged for uplink transmission from user terminals only it will anyway require only a quite basic configuration of the generic spatial processing chain described in detail in Appendix B1 so this limitation is not very severe
Figure 21 Overview of transmitter structure
The corresponding receiver structure is depicted in Figure 22 Optional feedback between soft-input soft-output decoder and space-time equaliser and channel estimator enable iterative detectionTurbo equalisation (TEQ) and iterative channel estimation (ICE) techniques detailed in [WIND21 WIND23] (cf also the results presented in Appendix F3) Serial modulation based transmission (frequency domain based single carrier as well as IFDMA) requires an IFFT in addition to the FFT in order to support frequency domain equalisation
IFFT CP
FECSub-flow
Segm
entation
Π
hellip
FEC Π
Substream
segmentation and chunk m
apping
Individually encoded flows
Chunk Layers
Pilot insertion
(scattered amp continuous pilots)
hellip
helliphellip
Assem
bly of chunks to raw sym
bol data
To
RF
Pilot insertion
(pilot symbols)
SP
GM
C
Modulation
Spatial processing (precoding dispersion etc)
Interleaving
Processing for generalised multi-carrier signals eg FFT for
frequency domain based serial modulation optional filtering
MOD
MOD
WINNER D210 v10
Page 33 (180)
Figure 22 Overview of receiver structure
225 Space-time-frequency processing Spatial processing provides performance gain via spatial diversity spatial multiplexing SDMA and enhanced interference management Spatial diversity adds reliability by transmitting multiple copies of the same data over (potentially) uncorrelated channels Therefore diversity efficiently copes with the detrimental effects of fading on the system performance On the other hand independent fading in a multi-antenna system can also be seen as a beneficial effect that can lead to a substantial increase of the achievable data rate by performing spatial multiplexing ie transmitting independent data over the uncorrelated spatial channels to one user terminal A significant contribution to high spectral efficiency is interference avoidance by spatial processing eg based on multi-user precoding at the transmitter in the downlink The use of beamforming (adaptive or non-adaptive) makes it possible to schedule multiple users on the same time-frequency resource (chunk) within a cell or across multiple cells and separate them by the SDMA properties of the multi-antenna channel When channel knowledge is available at the transmitter it is also possible to distribute complexity between transmitter and receiver in a very flexible manner Precoding techniques for example allow keeping receiver complexity low Note that although first investigations are based on traditional cell layouts with sector antennas precoding with distributed antennas (using a central processing unit and separated radio heads) is seen as a particular deployment form of the proposed WINNER multi-antenna concept that can be of additional benefit for the overall goal of an interference-avoidance radio interface concept
The WINNER multi-antenna concept is a generic architecture that aims at performing multi-user spatial domain link adaptation based on the following basic components (linear) dispersion codes directive transmission (beamforming) per stream rate control and multi-user precoding [WIND27 DAO05] This architecture allows fostering the spatial processing gains introduced above in flexible combinations as required by different scenarios ie different combinations of physical layer mode link direction transport channel type deployment propagation conditions cell load traffic type BS antenna configuration and terminal capabilities A generic spatial processing chain that implements the WINNER multi-antenna concept is detailed in Appendix B1
From
RF
STF-EQ
FFT CP
Segm
entation into chunks
DEC Π-1
DEC Π-1
Sub-flow
assembly
Chunk Layers
STF-EQ
helliphellip hellip
hellip
Channel estimation
In-band
pilots
Pilot
symbols
TEQ
ICE
Chunk dem
apping and substream assem
bly
GM
C
Space-Time-Frequency Demapping and Equalizing
Decoding
De-Interleaving
WINNER D210 v10
Page 34 (180)
23 Pilot grid design for channel estimation and synchronisation
231 Synchronisation For synchronisation we have to distinguish between coarse synchronisation (acquisition) where all other relevant system parameters are still unknown and fine synchronisation (tracking) where a previous coarse estimate is further improved and adapted to variations of eg the local oscillator Furthermore there are three quantities which have to be synchronised in an OFDM system
bull OFDM symbol and frame timing
bull Carrier frequency
bull Sampling rate
The choice of an appropriate synchronisation strategy for the radio interface is based on several criteria
bull Robustness expressed in the lock in probability ie the probability of successful acquisition
bull Residual synchronisation offsets in the steady state
bull Time required to achieve synchronisation
bull Required overhead
With respect to synchronisation the scenarios in which the WINNER radio interface is to operate can be distinguished as follows
bull Hot spot mainly indoor environment with no significant interference from adjacent BSs
bull Wireless network with global reference time All BSs operate synchronised governed by a global reference clock which may be provided by the Global Positioning System (GPS) or the European Satellite Navigation System (Galileo)
bull Synchronised wireless network without timing reference If no global timing reference is available synchronisation of the network can be achieved in a self-organised way Since coordinated operation of a wireless network essentially requires BSs to be synchronised it is generally believed that the attainable system capacity of a synchronised wireless network exceeds a non-synchronised network
bull Uncoordinated wireless network BSs operate non-synchronised In this case the UT needs to be able to distinguish between several signals in order to identify the closest BS
For synchronisation purposes different types of pilots are foreseen for the WINNER system concept
bull Two sets of training symbols (uplink and downlink) consisting of three OFDM symbols are included in the super-frame preamble for self organised inter- and intra-cell synchronisation The structure of the training symbols and the related synchronisation algorithms are described in Appendix B41
bull Continual pilot subcarriers (or tones) They may serve various purposes such as phase noise compensation tracking of carrier and sampling frequency offset (see [WIND23] Section 6252) In combination with cyclic prefix based synchronisation differential modulation of the pilot tones allows establishing frame synchronisation as well as to detect frequency offsets of a multiple of the subcarrier spacing [SFF+99]
Within the WINNER framework a synchronisation concept that can synchronise a wireless network in a self-organised way has been identified in [WIND21] The algorithm relies on dedicated set of training symbols inserted in the super frame preamble In Appendix B41 its basic principles are summarised and some enhancements are presented Simulation results reported in [WIND23] show that both frequency and time synchronisation of all BSs within the cellular network can be achieved after 20 super-frames with remaining frequency offset of about 1 of the subcarrier spacing and time offset of about 10 of the guard interval respectively Since the duration of one super-frame is 8x12 and 8x30 OFDM symbols for the WINNER FDD and TDD modes respectively the time to synchronise for this algorithm totals to about 110 ms for 20 super-frames which may be too long for some applications
For hot spots or for networks with access to a global timing reference synchronisation utilizing the cyclic prefix in combination with continual pilot tones is considered to be an appropriate choice [WIND21 WIND23] This approach is in particular attractive for OFDM systems with a large number of subcarriers in terms of pilot overhead and performance [BBB+99] It is demonstrated in Appendix F41 that reliable
WINNER D210 v10
Page 35 (180)
acquisition can be achieved within 12 OFDM symbols at SNR gt -4 dB Furthermore a scattered pilot grid predominantly used for channel estimation (see Appendix B42) can be used to achieve acquisition in a non-synchronised wireless network However numerical results in Appendix F41 suggest that the carrier frequency offset must not exceed half of the subcarrier spacing for this algorithm to work
A timing advance strategy which compensates for the propagation delays between signals transmitted from UTs to their assigned BS during uplink is proposed in Appendix B41 The proposed ranging process enables the UTs to estimate the propagation delays of their signals by utilising individual synchronisation tones This information is subsequently used for a time advanced transmission during uplink providing a time aligned arrival of different usersrsquo signals at the BS If the synchronisation tones are retransmitted by the UTs after the ranging process is finished they may further be used for a fine estimation of the carrier frequency offset at the BS
232 Channel estimation For channel estimation purposes the following types of pilots are foreseen
bull A scattered pilot grid is used for OFDM channel estimation and channel prediction For the pilot grids presented in B42 the pilot overhead is 25 and 4 per spatial stream for the WINNER TDD and FDD mode respectively In Appendix F41 it is shown that a scattered pilot grid could also be utilised for acquisition in a non-synchronised wireless network
bull In OFDM uplinks that use adaptive transmission channels from many users have to be estimated and predicted in each chunk Methods based on simultaneous pilot transmission from all candidate terminals (overlapping pilots) can then be used to limit the pilot overhead fraction in the uplink [WIND24]
bull For uplink (frequency domain generated) serial modulation pilot patterns may be generated in the frequency domain in either of two ways The first way is to use a scattered pilot grid equivalent to OFDM Alternatively pilot patterns for serial modulation in the uplink may be generated in the time domain in the form of short training blocks time-multiplexed with data blocks Both techniques are described in Appendices B42 and F31 respectively
For multi-antenna transmission a combination of dedicated pilots per flow common pilots per cellsector common pilots per antenna and common pilots per beam are required as described in Appendix B42 Interference estimates per chunk layer or averaged over chunk layers may be obtained as by-products of the pilot-based channel estimation The residual ie the signal component that cannot be explained through the known pilots and the channel model is used as interference estimate
Channel estimation by interpolation in time and frequency based on a scattered pilot grid is considered to be an efficient solution for an OFDM-based radio interface [WIND21 WIND23] In Appendix B42 a generic framework for the pilot design of GMC signals is described To this end a scattered pilot grid is applicable to any GMC signal Alternatively short time domain training symbols can be implemented for single carrier signals on the uplink
During the start of communication interpolation techniques with limited information about the channel conditions must be used An unbiased channel estimation scheme which does not require any information about the channel statistics is proposed and evaluated in Appendix F34 A robust interpolation filter which only assumes knowledge about the CP duration and the maximum velocity expected in a certain environment is another possible choice cf results in [WIND23] and Appendix F32 During operation statistical knowledge about the power delay profile and the Doppler spectrum is accumulated Channel interpolation utilizing this knowledge can improve performance significantly (see Appendix F33)
Especially in case of dedicated pilots purely pilot aided techniques may have severe limitations Conventional channel estimation by interpolation may then require a pilot boost andor a significant degree of over-sampling Advanced solutions such as iterative channel estimation aim to make a pilot boost redundant at the expense of increased complexity cf results in [WIND23] and Appendix F32 If an iterative receiver structure is already in place iterative channel estimation offers a good compromise between performance and complexity
Adaptive transmission requires channel prediction for use in the resource allocation Channel prediction can be based on common pilot symbols that are also used for other purposes It should utilise the channel correlation in time and frequency In Appendix B52 the results obtained by using Kalman state-space algorithms in the frequency domain for prediction are outlined Similar results are obtained with time-domain extrapolation of channel taps With these methods adaptive transmission becomes possible in the WINNER system at vehicular velocities The channel prediction accuracy estimates (covariances) are furthermore important inputs in the design of the link adaptation and resource scheduling schemes
WINNER D210 v10
Page 36 (180)
3 Medium Access Control (MAC) Layer The WINNER medium access control (MAC) system layer is designed as three MACs (modes)
bull FDD cellular MAC including multiple-access multi-hop and multi-antenna aspects
bull TDD cellular MAC including multiple-access multi-hop and multi-antenna aspects
bull MAC for peer-to-peer transmission at present based on the TDD physical layer mode
The first two have a largely identical design and are described briefly in the section below with additional details in Appendix C1 See also [WIND76] The peer-to-peer MAC is outlined in Section 32 with further details in Appendix C2
31 Medium access control for FDD and TDD cellular transmission
311 Goals and design principles The cellular MAC design supports and enables several innovative features of the WINNER system
bull The super-frame is designed with pilots that support self-organised synchronisation of all involved base stations relay nodes and user-terminals Having a synchronised network enables an improved spectral efficiency in two ways it makes large guard-bands unnecessary and simplifies interference-avoidance scheduling between cells and relay nodes
bull MACs for FDD and TDD cellular transmission support fast transmission and very low re-transmission delays over the RI These properties are key to attaining high spectral efficiency via adaptive schemes [WIND24] reliable communication through efficient re-transmission and high data rates for TCPIP traffic
bull Adaptive transmission is integrated into the design on all time scales Up to moderate vehicular velocities link adaptation and scheduling can be performed with fine granularity in the frequency domain (OFDMATDMA) This provides multi-user scheduling gains for mobile as well as stationary terminals For higher velocities the transmission only adapts to the path loss and shadow fading On a super-frame time scale the resource partitioning can adapt to the traffic demand over different transport channels
bull Multi-antenna transmission can be adjusted in a very flexible way per flow to obtain an appropriate balance between different objectives Obtaining multiplexing gains to boost throughput achieving robustness via diversity transmission and obtaining SDMA gains by transmitting flows to different user terminals over different spatial channels
bull Operation in spectrum shared with other operators who all use the same physical-layer WINNER mode [WIND63] will be an integral part of the design Operation in dedicated bands is seen as a special case of this situation Such single-system shared spectrum use has the potential of both improving the flexibility and simultaneously increasing the throughputspectral efficiency
bull The super-frame and the resource partitioning are designed to work efficiently in conjunction with inter-cell interference-avoidance schemes They are also designed for relay-enhanced cells so that base stations and a set of relay nodes can share the total spectral resources efficiently
In the design of the adaptive transmission system the different reaction times and control time scales of various control functions have been an important guiding principle The slower control functions have been placed as RRM functions in the control plane of the RLC system layer (see Appendix D1) The faster control functions are located in the MAC control plane while the fastest ones which directly control data flows are located in the MAC user plane To minimise transmission time delays due to communication between nodes a complete MAC layer is assumed to be implemented at each base station (BS) and at each relay node (RN) Thus all antenna resources belonging to a BS or a RN can be controlled tightly by the MAC system layer Cooperative multi-antenna transmission and distributed antenna systems are supported when all antennas are regarded as encompassing one BSRN
312 Control of relay-enhanced cells The MAC system layer is designed to work in relay-enhanced cells (REC) in which a set of nodes (RNs or BS) are linked to each other over the air (Nodes here refer to logical nodes cf [WIND35]) The BS but not the RNs has a fixed connection to the RAN The RNs may be used for improving the coverage
WINNER D210 v10
Page 37 (180)
within the cell or for extending the range of the cell Each RN is connected to one but not more BSs Some or all UTs may communicate directly with the BS If RNs are present some UTs may transmit toreceive from these RNs The MAC implemented in each RN controls those transmissions Thus the RNs essentially control separate sub-cells The MAC system layer controls flows over a single hop Flow QoS control over links spanning multiple hops is the responsibility of the RLC layer
While both heterogeneous and homogenous relaying is under consideration the cellular MAC design has focused on the more challenging case of homogenous relaying where RNs and BS use the same PLM and share spectral resources The total time-frequency resources are partitioned into parts used by the BS shared parts and parts used by RNs This partitioning is computed by RRM functions at a central location in cooperation with the MAC that is implemented at the BS It is then signalled to all RNs and UTs
313 The MAC services and tasks The MAC system layer for FDD and the TDD cellular transmission has a MAC protocol implemented in its user plane It also contains resource allocation and planning functions in its control plane It should provide the following services to the RLC system layer
bull Radio packet transfer ie transmission and reception over the radio interface of packets belonging to any of the transport channels defined below
bull MAC radio-resource control ie acceptance and execution of control messages
bull MAC control feedback ie messaging from MAC to RLC that supports the flow control the QoS control and the spectrum assignment and other functions at the RLC system layer
The WINNER transport channels are defined as being the interfaces between the RLC protocol layer (in the RLC system layer user plane) and the MAC protocol layer (in the MAC system layer user plane) They define the basic types of radio-packet transfer that are provided
bull Broadcast channel (BCH) for broadcasting system information from RLC and higher layers to all terminals inside the coverage area of the cell
bull Contention-based random access channel (RAC) for initial access to a BS or RN and also for BS-to-BS control signalling in the TDD mode
bull Contention-based direct access channel (DAC) for contention-based uplink data transfer
bull Common data channel (CDC) for scheduled point-to-multipoint communication
bull Targeted data channel (TDC) for scheduled point-to-point communication
bull Targeted control channel (TCC) for control-plane generated control messages
MAC flow control and resource allocation is performed two time scales That of the slot (half frame) and that of the super-frame (Section 314 below)4
bull Time-frequency resource partitioning and spatial scheme control is planned on a time scale of the super-frame (5ndash10 ms) The allocation to different transport channels is adjusted on this time scale based on the aggregated demand within each transport channel Unused chunks enable flexible spectrum use between WINNER operatorsusers and adaptive interference avoidance between neighbouring cells and parts of cells
bull Resource scheduling (RS) is performed on the time scale of the slot (034 ms) The scheduled flows are allocated to time-frequency-spatial resources in one of two ways Adaptive RS utilises the frequency-selective fading This requires processing of CSICQI feedback from the PHY layer Non-frequency adaptive RS uses a diversity-based transmission within the frame
Adaptive resource scheduling and support for adaptive transmission is a major feature of the design discussed further in Appendix C16 Detailed transmission schemes for adaptive transmission in both FDD and TDD modes have been presented in Section 31 of [WIND24] Key enabling features are here the use of chunks of appropriate granularity the use of in-frame control signalling to obtain tight feedback loops the use of channel prediction to enable adaptive transmission at vehicular velocities (Appendix B52) and appropriate schemes for compressing feedback information (Appendix B53) 4 We say that a function in a certain system layer works on a given time scale if the reaction time on a control
message need not be smaller than the time indicated by the time scale Thus the required adaptation speed of a given function that is distributed among different physical nodes is given by this time scale
WINNER D210 v10
Page 38 (180)
314 The chunk slot frame and super-frame structure As outlined in Section 1322 the basic time-frequency unit for resource allocation is the chunk During the later part of WINNER Phase I the transmission parameter examples outlined in Table 21 have been used for simulation purposes In the FDD physical layer modes chunks then comprise 8 subcarriers by 12 OFDM symbols or 3125 kHz times 3456 micros In the TDD physical layer mode the chunk dimension is 16 subcarriers by 5 OFDM symbols or 78125 kHz times 1080 micros Using the parameter sets of Table 21 an FDD downlinkuplink with 20 MHz FFT bandwidth is divided into 52 chunks on the 1625 MHz signal bandwidth A 40 MHz FFT bandwidth accommodates 104 chunks The TDD PLM with 100 MHz FFT bandwidth has 104 chunks on 8125 MHz signal bandwidth Please see Appendix C3 for a discussion on chunk dimensioning 5
The chunks are organised into frames In the TDD mode each frame consists of a downlink transmission interval followed by an uplink transmission interval denoted slots or time-slots In FDD the frame is also split into two slots Half-duplex terminals may be separated into two groups where one group has downlink transmission in the first slot and transmits in uplinks in the other while the other group uses the opposite scheme (Appendix C12) FDD base stations use full duplex
The frame duration has been set equal in the two PLMs to facilitate inter-mode cooperation With a frame duration of 6912 micros an FDD frame consists of two chunk durations with one chunk per slot A TDD frame consists of in total 6 chunks and two duplex guard intervals organised into a downlink slot and an uplink slot With downlink-uplink asymmetry 11 the TDD slot thus consists of three downlink chunks followed by three uplink chunks See the figure below The asymmetry ration could be varied from 51 to 15 but to provide sufficient time for signalling and scheduling calculations during the uplink slot in adaptive transmission it should not be set larger than 21
The super-frame (SF) is a time-frequency unit that contains pre-specified resources for all transport channels Figure 32 illustrates its preliminary design comprising of a preamble followed by nf frames Here nf = 8 resulting in super-frames of approximate duration 56 ms (It could be extended to eg 16 frames if required) The available number of chunks in the frequency direction could vary with the geographical location It is assumed that for the FDD DL and UL as well as for TDD there exist frequency bands that are available everywhere The preamble is transmitted in those commonly available bands The remainder of the super-frame may use other spectral areas that are available at some locations or to some operators but not to others All of these spectral areas are spanned by one FFT at the receiver and are at present assumed to span at most 100 MHz
Duplex guard time 192 micros
7812 KHz
03456 ms for 11 asymmetry
03456 ms chunk duration
15 OFDM symbols 12 OFDM symbols
Time Time
f f
8 subcarriers
16 subcarriers
20 MHz and 40 MHz FDD mode
100 MHz TDD mode
96 symbols 80 symb 3125 KHz
80 symb 80 symb
Figure 31 Summary of assumed chunk sizes in the two physical layer modes The figures show a slot (half of the frame) in each case assuming 11 TDD asymmetry
5 Note that the dimensions used here differ from the ones assumed in earlier deliverables such as [WIND24] in two
ways 1) The FDD chunk width in frequency has been doubled since the earlier narrower size contained few symbols and thus incurred a higher pilot and control overhead 2) In the TDD mode the chunks have been made shorter The TDD frame now contains six instead of two chunks This enables terminals to concentrate their transmission and reception in time and go into short power saving micro-sleep intervals in-between
WINNER D210 v10
Page 39 (180)
The subsequent main part of the super-frame is shared by the contention-based direct access channel (DAC) the scheduled data channels CDC and TDC and their related control signalling It also contains time-frequency-spatial resources that are not to be used due to interference avoidance constraints The resource partitioning (allocation) is performed in terms of chunks It is performed on a super-frame basis but it may be changed between super-frames The DAC resource is used both for the DAC channel and for the peer-to-peer transmission described in Section 32 below It is organised as a constant set of frequencies over the whole super-frame to enable the use of carrier-sense multiple access contention based transmission The resource partitioning is described in more detail in Appendix C11
RA
C (U
LD
L)D
L S
ynch
UL
Syn
ch
BC
H (D
L)
Freq
uenc
yFull System
Ban dw
idth
1664
Sub
-Car
riers
= 10
4 C
hunk
s
Figure 32 WINNER MAC super-frame example consisting of 8 TDD frames with asymmetry 11 a preamble and the DAC for contention based peer-to-peer communication The frame for TDD
cellular transmission with its chunk-based substructure has been enlarged
The super-frame is synchronous in all BS and RN In the FDD mode one super-frame is of course required in each of the paired bands The preamble has the following structure
bull At the beginning of each super-frame there are two synchronisation slots Self-organising synchronisation of terminals and network nodes as described in [WIND23] and Appendix B41 can be used on a super-frame basis by this design In the second slot each base stationrelay node transmits on four OFDM symbols The first the T-pilot is used for coarse synchronisation In the remaining three symbols each BS transmits on two adjacent subcarriers with the others set to zero On reception they are used for updating the UT synchronisations The first slot of three OFDM symbols the next super-frame is the uplink synchronisation slot Here all terminals transmit on the two adjacent subcarriers that were received strongest ie those that were used by the BSRN closest to them This part of the iteration is used for self-organizing synchronisation of the base stations and relay nodes which receive uplink synchronisation symbols from terminals at other BS that in turn synchronise to those BS In the FDD mode the UL synch slot is in the UL super-frame and the DL synch slot is in the DL super-frame
bull In-between these synchronisation slots a short timeslot over the whole band is reserved for the contention-based random access channel (RAC) plus a guard time This channel enables initial access to a BS or RN Placing the RAC and its guard time in-between the synchronisation slots gives the RAP sufficient time to process the uplink synch signal and adjust its synchronisation before transmitting the downlink synchronisation signal The RAC time-slot is in TDD system modes also used for BS-to-BS and RN-to-BS over-the-air control signalling
bull Subsequently a set of OFDM symbols carries the downlink preamble control transmission It contains the broadcast control channel (BCH) messages from the RLC layer It also contains a control message that specifies the overall resource allocation used within this super-frame
WINNER D210 v10
Page 40 (180)
315 Overview of main functions
MAC Services Control plane
interface
PHY Services
MAC Control
Feedback
MAC Radio Resource Control
Special Transmit Control
Signalling
PHY Measure-
ments
Constraint Processor
Flow State Controller
Spatial Scheme Controller
Resource Partitioning
Resource Scheduler (RS)
Non-frequency adaptive resource
scheduling
Adaptive resource sched
MAC CONTROL PLANE
Space-time-frequency link adaptation and scheduling
Queue state control
Transfer control Control of MAC-5 - MAC-1 protocols
Pre-config
Spatial scheme Selection
Constraint combining
Spectrum assignment negotiation support
RN assigment
DAC a ssignm
TDC adaptive assigment
MAC USER PLANE
Flow setup
Flow term
Calibration
Measure- ments
Non- frequency adaptive Transfer
BCH SF Control Tr
Transmit control proc (+ protocols)
Measurement proc (+ protocols)
Figure 33 FDD and TDD cellular MAC control functions Services and main function blocks
The MAC layer is subdivided into a control plane and a user plane The PHY layer is not subdivided in that way as all essential control functions for the physical layer reside in the MAC The main MAC control function blocks are illustrated in Figure 33 Control functions that directly control packet transmission on a slot time scale reside in the user plane Slower functions reside in the control plane
bull Resource partitioning Partitions the super-frame into sets used for adaptive non-frequency adaptive and DAC transmission as well as into chunks reserved for use by RNs BS-to-RN relay links and as guards for interference avoidance with respect to other cells and operators
bull Spatial scheme control The appropriate spatial transmit scheme is determined for each flow and it is held fixed within a super-frame It is influenced by many parameters including PLM deployment transport channel type cell load traffic type BS antenna configuration terminal capabilities propagation channel and interference conditions Further support functions related to spatial processing like calibration are invoked if required
bull Flow setup and termination performs flow context establishment and release over one hop supervised by the RRM flow establishment and release functionalities in the RLC system layer
bull Constraint processor Combines constraints on the use of chunks and chunk layers These arise from interference between user terminals interference avoidance scheduling with neighbouring cells and spectrum sharing between operators The output is in the form of chunk masks that define restricted use of a super-framersquos chunks The constraint processor also processes measurements that support the RRM spectrum assignmentnegotiation at the RLC system layer
bull Flow state controller Controls the segmentation and FEC codingdecoding of packets and monitors the states of RS queues It also controls the activesemi-activepassive state of flows
bull Resource scheduler (RS) Includes adaptive and non-frequency adaptive scheduling algorithms and control of spatial link adaptation Power control in both uplinks and downlinks is performed under the control of the resource scheduler and is integrated into the optimisation of the transmission parameters The MAC RS cooperates with the RLS layer flow scheduler Sect 41
WINNER D210 v10
Page 41 (180)
MAC Services User plane interface
PHY Services
Radio Packet
Transfer
Radio Packet
Transfer
Adaptive Transfer
BCH SF Control Tr
Adaptive Transfer
RAC Transfer
DAC Transfer
Non-frequency Adaptive Transfer
Non- frequency adaptive Transfer
DAC Transfer
(MAC-4) Add CRC
RTU
Per-flow queuing of FEC blocks
in RSB
(MAC-3) Optional segmentation
Encoding block
(MAC-2) FEC coding FEC block
(MAC-4) CRC check ACKNACK
Soft combining at received
retransmission
(MAC-5) Reassembly of MAC SDU
(MAC-2) De-interleaving
and FEC decoding
Resource Mapping
Map on chunk layers for adaptive transmission
Map on set of chunk layers for non-frequency adaptive transmission
Map on resources reserved for DAC
Map BCH packets into SF preamble symbols
BCH RAC
BCH (in UT) RAC
TDC DAC CDC (in UT)
MAC USER PLANE Transmitting MAC entity
Receiving MAC entity
DAC
(MAC-5) Optional
segmentation TDC
TDC CDC
BCH SF Control Tr
RAC Transfer
(MAC-3) Reassembly
of enc blocks
TDC CDC DAC
TDC CDC DAC
BCH
RAC
SLC Cache (per-flow queues)
Figure 34 FDD and TDD cellular MAC User-plane services and packet processing
The data flows in the user plane shown in Figure 34 are processed by three groups of functions
bull Transmission Segmentation encoding and buffering The flow state controller supervises this sequence Protocol sub-layers MAC-1ndashMAC-5 control the transmission and are parameterised to describe the different retransmission options (HARQ) A MAC SDU is drained from the SLC Cache TDC or DAC packets may be retransmitted Retransmission can be an option also for CDC point-to-multipoint flows The TDC CDC or DAC packet is optionally segmented A CRC sequence is added resulting in a Retransmission unit (RTU) The RTU may optionally be segmented into encoding blocks that are encoded separately Coding and interleaving results in FEC blocks which are buffered in the RS buffer on the transmitter side in one or several queues per flow There they remain until acknowledged or dropped BCH and RAC-packets are transmitted in the super-frame preamble without retransmission
bull Resource mapping At transmission bits from TDC flows are mapped either on chunks reserved for adaptive transmission or on the sets of chunks intended for non-frequency adaptive transmission CDC (multicast) flows should use non-frequency adaptive transmission DAC packets are mapped on the contention-based physical channel For TDC and CDC puncturing of the buffered FEC block may be performed and only a part of a FEC block may be transmitted in a scheduling round that comprises a time-slot
bull Reception Decoding and reassembly The flow state controller supervises the reception De-interleaving and FEC decoding is first performed for received FEC blocks belonging to TDC CDC or DAC packets followed by the (optional) re-assembly of the RTU Then the retransmission unit is optionally checked for transmission errors and a retransmission may be requested The MAC SDU is finally re-assembled BCH and RAC packets are received separately in the super-frame preamble and then decoded
WINNER D210 v10
Page 42 (180)
316 Resource mapping and multiple access In [WIND26] different multiple access (MA) techniques were assessed for multi-carrier as well as for single-carrier transmission Subsequently a set of schemes has been selected as baseline choices for use within the WINNER system Several of the initially considered schemes turned out to useful The key distinguishing feature for selecting MA scheme turned out to be not the deployment scenario but instead the use of adaptive or non-frequency adaptive transmission which place different demands on the utilised resources The multiple access schemes will therefore differ for different flows Flows scheduled for adaptive and non-frequency adaptive transmissions are mapped onto the separate sets of chunks earmarked for these two purposes by the SF resource partitioning (Figure 35) The mappings use different MA schemes
bull Adaptive transmission (DLUL) uses chunk-based TDMAOFDMA Flows are mapped onto individual chunk layers with individual link adaptation per chunk layer The mapping is exclusive within the cells ie each chunk layer carries data from only one flow
Chunks are designed to work well for adaptive transmission See Appendix C3 for a background on the reasoning used for dimensioning the chunk sizes In a non-frequency adaptive transmission that is based on channel averaging there would be a problem in attaining sufficient frequency diversity when transmitting small packets when the packets are mapped directly onto chunks A small RTU or control packet may fill only one chunk Two schemes that increase the diversity significantly are selected
bull In non-frequency adaptive downlinks MC-CDMA is used within the assigned set of chunks In the downlink spreading may thus be used to code-multiplex the flows onto sets of chunks assigned for non-frequency adaptive transmission When code multiplexing is used spreading is performed only within chunks to minimise non-orthogonality of the received signals Orthogonal signalling (TDMA per OFDM symbol or FDMAIFDMA per subcarrier without code-multiplexing) are special cases of the scheme They may be used when appropriate
bull In non-frequency adaptive uplinks TDMAOFDMA is used on an OFDM symbol basis For non-frequency adaptive transmission in the uplink code multiplexing is not used to avoid the need for multi-user detection Instead TDMA is used on an OFDM symbol basis Several uplink flows with small FEC blocks may share one OFDM symbol (OFDMA) to improve the rate matching (Figure 35 middle part) Either OFDM or frequency-domain generated serial modulation can be used in the uplinks
Compared to chunk-based OFDMATDMA these schemes provide increased frequency diversity and resources of shorter duration The shorter time duration (mapping on individual OFDM symbolsGMC slots) provides increased opportunities for terminals to go into power-saving micro-sleep intervals
Time Time Time
FDMA TDMA MC-CDMA
Frequency
Frequency
Frequency Chunk for for non-frequency adaptive transmission
Chunk for adaptive transmission
Mappings for one flow
Figure 35 Illustration of the mapping of one flow on the chunks earmarked for non-frequency adaptive transmission when using FDMA TDMA or MC-CDMA within the set of chunks
The selected multiple access schemes have been evaluated and compared to several alternatives in Appendix G A summary of relevant results is given below and an additional discussion can be found in Section 533
WINNER D210 v10
Page 43 (180)
For the case of adaptive transmission a gain was not surprisingly found when concentrating the transmitted packets to individual chunks instead of spreading them out over the slot Spreading them out over all frequencies by eg MC-CDMA or TDMA would average away the channel variability Lowering the cannel variability reduces potential multi-user scheduling gain In Appendix G41 (single-carrier) TDMA that allocates the whole 20 MHz band to only one user is found to result in a reduced multi-user scheduling gain See also Section 3153 in [WIND24] where OFMD-based TDMA was compared to TDMAOFDMA
The chunk sizes have been designed to be appropriate for the transmission scenarios used with reasonably flat channels within chunks Therefore as shown in Appendix G43 very little can be gained by sharing chunk layers between flows if the throughput is to be maximised As shown in Appendix G14 and Section 33 of [WIND24] chunk sharing can be of advantage in a special case There are many flows that have the very strict delay requirements and a guaranteed throughput in each slot (034 ms) While such delay constraints are extreme for user data they are applicable for retransmissions and for time-critical control information Appropriate transmission schemes for these will be studied in WINNER II
For non-frequency adaptive transmission G42 illustrates the improved performance obtained by paritioning the transmission over a set of resources whose channels have high diversity As noted above different methods can be used MC-CDMA symbol-based TDMA or subcarrier-based OFDMA The performance differences between them were investigated and were found to be rather small Of these schemes MC-CDMA provides the highest diversity In Appendix G11 it is concluded that MC-CDMA outperformed OFDMA in terms of cell throughput for all considered loads and scheduling algorithms In Appendix G12 MC-CDMA provides some advantage while in Appendix G13 OFDMA is found to provide slightly superior performance Explanations for these differences are discussed in Section 533
None of the so far performed investigations added the effect of spatial diversity schemes It can be expected that the additional use of spatial diversity will lessen the requirement for frequency diversity This would simplify the resource partitioning problem (Appendix C11) that includes selecting appropriate sets of chunks for adaptive and non-frequency adaptive transmission
32 Medium access control for peer-to-peer transmission The WINNER system supports peer-to-peer (P2P) and peer-to-multi-peer (PMP) transmission between user terminals under the control of a master device as illustrated in Figure 36 The role of the master will be taken by the base station while the terminals act as slaves All user terminals participating in the peer-to-peer communication are synchronised in time to the masterrsquos clock and use the contention-based direct access channel (DAC) to exchange user data with their peers and control information with the master In the absence of a BS a user terminal can also take on the master responsibility if it is equipped with some additional network management functions
Figure 36 Network topologies for peer-to-peer communication
321 MAC architecture for P2P transmission In the WINNER system peer-to-peer transmission between user terminals is at present designed to be provided by the TDD physical layer mode Other alternatives will be considered at later stages In Section
BS
UT
UT
UT
UT
control
data
UT
UT
P2P
PMP
BS
UTUT
UTUT
UTUT
UTUT
control
data
control
data
UTUT
UTUT
P2P
PMP
WINNER D210 v10
Page 44 (180)
31 and Appendix C1 a MAC is specified for controlling this physical layer in cellular deployment scenarios Although it supports the exchange of user data between UTs via a base station it does not allow the direct data transfer between terminals To enable P2P communication some new services and functions have to be added to the control- and user-plane of the basic TDD cellular MAC (see Figure 37)
The MAC layer services for P2P transmission are integral part of the radio_resource_control and radio_packet_transfer service The P2P-specific services are provided to higher layers at the MAC_P2P_CONTROL and MAC_P2P_USER service access point (SAP)
The MAC layer services are implemented by adding P2P-specific protocol functions to the main function blocks of the TDD cellular MAC In the control plane of the MAC the resource partitioning unit has to comprise the DAC assignment function for controlling the allocation and release of radio resources The flow setup and termination unit is extended with functions required to setup and terminate P2P data flows over the DAC These include functions for transmitting and receiving DAC-specific broadcast control information attaching and detaching UTs to the service provided by the P2P-DAC and setting-up and terminating synchronous P2P-flows between UTs In the flow state controller functions are provided for controlling the transmission and reception of radio packets over the DAC The control of packet segmentation FEC coding and retransmission is executed by these functions The flow state controller also contains functions required to give UTs random access to the P2P-DAC for transmitting control messages to the BS and exchanging P2P data in a contention-based manner between peer terminals In the user plane of the MAC additional functions are provided to multiplex control information and user data onto the DAC and to extract control information and user data from a received decoded radio packet Note that other MAC functions not directly related to the P2P-DAC service are not shown in Figure 37
322 Frame structure of DAC for P2P transmission The direct access channel is embedded into the super-frame structure of the TDD physical layer mode as shown in Figure 32 Successive DAC frames are thus always separated by a preamble that is used to keep time synchronisation between the master and all user terminals involved in P2P transmission
As shown in Figure 38 a DAC frame is further subdivided in three parts namely the control period the contention-access period and the guaranteed-access period The length of the control period is given by the duration of a TDD DLUL frame of a scheduled targetcommon data channel (TDCCDC) The length of each access period takes on a multiple value of the basic time slot size of 03452 ms and may dynamically change from super-frame to super-frame
bull The control period (CTP) is composed of two time slots for exchanging MAC control information between the BS and UTs The first slot is formatted such that firstly beacon frames
Figure 37 MAC services and functions for peer-to-peer transmission
RadioResourceControl
RadioPacket
Transfer
MAC_P2P_CONTROL SAP MAC_P2P_USER SAP
Control Plane User Plane
segmen-tation
DAC Transfer
add CRC for retrans-
mission
FEC coding
resource mapping to
DAC
reassembly
FEC decoding
multiplex to DAC frame
retrans-mission
de-multiplex from DAC
frame
Resource Partitioning
DAC assignment
DAC P2P Flow Setup and Termination
P2P-DAC beacon control
attach detach to P2P-DAC
setupterminatesynchronous
P2P-flow
Flow State Controller
P2P-DAC transfer control
P2P-DACchannel
access control
MAC-P2P Services
MAC-P2P Functions
PHY Services
RadioResourceControl
RadioPacket
Transfer
MAC_P2P_CONTROL SAP MAC_P2P_USER SAP
Control Plane User Plane
segmen-tation
DAC Transfer
add CRC for retrans-
mission
FEC coding
resource mapping to
DAC
reassembly
FEC decoding
multiplex to DAC frame
retrans-mission
de-multiplex from DAC
frame
Resource Partitioning
DAC assignment
DAC P2P Flow Setup and Termination
P2P-DAC beacon control
attach detach to P2P-DAC
setupterminatesynchronous
P2P-flow
Flow State Controller
P2P-DAC transfer control
P2P-DACchannel
access control
MAC-P2P Services
MAC-P2P Functions
PHY Services
WINNER D210 v10
Page 45 (180)
can be broadcasted from the BS to the UTs to announce the format of the current DAC frame and to communicate management information to the terminals and secondly send DL MAC commands from the BS to a dedicated user terminal In the second time slot user terminals can send UL commands to the BS and exchange MAC protocol messages with peers Random channel access for the involved terminals is provided by using a time-slotted ALOHA protocol
bull The contention-access period (CAP) may be used to asynchronously transmit protocol messages andor small amount of user data peer-to-peer between user terminals Since several UTs can simultaneously access the CAP the possible contention for medium access is resolved by using a carrier sense multiple access protocol with collision avoidance (CSMA-CA)
bull The guaranteed-access period (GAP) consists of time slots of fixed length and is used for asynchronous and synchronous P2P transmission between user terminals Channel access in the GAP of the DAC frame is based on a TDMA method in which one or several time slots can be allocated to two or more UTs for peer-to-peer communication For synchronous transmission time slots are allocated to the UTs on a regular basis in successive DAC frames without limit in time while for asynchronous transmission a sequence of consecutive time slots is allocated to start at any arbitrary time instant the transfer of a fixed amount of data The time slot allocations in the current DAC frame and their usage are broadcasted in the beacon field of the control period
Figure 38 DAC frame structure for peer-to-peer transmission
8 TDD frames = 8 x 06912 ms = 553 ms
contention access period (CAP) guaranteed access period (GAP)
bea
con
asynchronous and synchronous
P2P data transmission
asynchronous P2P data and
P2P command transmission
Time slot 03452 msTime
DL
com
mand
UL
com
mand
control
period (CTP)
DL UL
8 TDD frames = 8 x 06912 ms = 553 ms
contention access period (CAP) guaranteed access period (GAP)
bea
con
asynchronous and synchronous
P2P data transmission
asynchronous P2P data and
P2P command transmission
Time slot 03452 msTime
DL
com
mand
UL
com
mand
control
period (CTP)
DL UL
WINNER D210 v10
Page 46 (180)
4 Radio Resource Management (RRM) and Radio Resource Control (RRC)
41 RRM functions Although the term radio resource management (RRM) is often used as a general term for numerous algorithms and protocols used to govern the radio resources it is in the context of WINNER reserved to denote the control functions implemented in the RLC system layer control plane Other functions related to management of radio resources such as scheduling link adaptation and power control were described within the MAC chapter (Chapter 4) The overall goal is to utilise the given radio resources in an efficient manner The WINNER RRM framework handles flows rather than UTs A flow is a packet stream from one source to one or several destinations classified by QoS requirements source and destination(s) One of the WINNER RRM advantages is that it handles the handover process per flow rather than per UT Therefore a UT might sendreceive traffic over different cells and routes that match best the requirements of the specific flow Additionally it includes functionalities for coordinated spectrum sharing with other radio access networks using the same radio access technology as well as for spectrum sharing with other radio access technologies Finally unlike in existing systems admission control is not responsible for only admitting a new or handover flow to a new cell but also for selecting the best cell among a group of candidate cells that are nominated by the micro mobility functionality A summary of the RRM functionalities studied herein can be found below while more details are given in Appendix D
Spectrum control Spectrum control coordinates flexible spectrum use between multiple WINNER RANs and spectrum sharing with radio access systems using some other radio access technology (RAT) To have more tractable problems spectrum control is divided into two components namely spectrum sharing coordinating spectrum sharing with systems using other RAT and spectrum assignment providing flexible spectrum use between WINNER RANs Spectrum sharing controls the access to the spectrum in frequency bands which are shared with other RATs which are probably legacy systems Spectrum assignment is divided further into long-term spectrum assignment providing slowly varying spectrum assignments for large geographical areas and Short-term Spectrum Assignment providing short-term local variations to the large-scale solution The detailed implementation of these functionalities remains an open issue and further development will be carried out in Phase II
Service level control (SLC) The SLC performs the management between flows of the same user andor between different users and is specific for a population of users (eg the population within one cell or sector) The SLC provides means to allocate network resources to the traffic associated with the different applications and end-user services (ie not radio interface services) The service differentiation is exercised through three different (and parallel) service components namely flow Conditioning flow queuing and flow scheduling The SLC also comprises a flow monitoring service component to provide feedback on eg load predictions The flow scheduling controls the resource scheduler and the interaction between these two schedulers is assumed to work as follows The flow scheduling should ensure that a sufficient amount of packets are residing in the SLC cache to enable high multi-user gains (ie based on predictions about the current rate the flow scheduling aims at keeping the overall SLC cache content at some predetermined level eg corresponding to what (on average) may be transmitted within 5 ms) At the same time the resource scheduler must guarantee that it will (to the furthest extent possible) transmit the packets in the SLC cache within a small amount of time eg in less than 10 ms Otherwise the resource scheduler could create head-of-line blocking and too much delay Effectively this means that the ultimate decision about if and when (within a few ms timeframe) a packet is transmitted lies with the flow scheduling since the resource scheduler sooner or later has to schedule the packets assigned to it This also means that service classes are transparent to the resource scheduler Nevertheless the interface between SLC and RS is still under investigation eg the resource scheduler may also be made aware of the service classes (or at least some priorities of the different flows) to support work-conserving packet pre-emption (ie that a higher priority packet can pre-empt the transmission of a lower priority packet destined for the same node) as well as to give preferential treatment of eg network control signalling packets
WINNER D210 v10
Page 47 (180)
ModeRAN selection Algorithms for the selection of one or several modesRANs to serve a particular flowuser The mode selection can be made on different time scales These include per call or session (slow selection) per packet (fast selection) or triggered by non-traffic related events like changes in radio conditions (mode re-selection) More frequent mode selection leads to larger potential capacity and quality gains (through exploitation of ldquomode-selection diversityrdquo) but can increase signalling load In some cases mode selection will require user interaction or be dictated by an application (also referred to as slow selection or even re-selection) The mode selection can either be controlled by a node in the fixed part of the network a base station a relay node or by the user terminal If one operator runs the network this operator likely prefers network controlled mode selection If the network is run by different operators terminal based mode selection is more likely
Handover
Algorithms for handover between two cells of the samedifferent mode (intra-system) as well as different radio access systems (inter-system) are studied In order to allow for a seamless handover within the WINNER RAN BSs and RNs of the same or different mode can announce their presence to the UTs by broadcasting control messages using orthogonal resources This scheme is especially helpful for the handover between WINNER FDD and TDD as it allows the UTs to be aware of the presence of BSs and RNs that operate at a different mode without disrupting their normal operation to ldquosniffrdquo other parts of the spectrum The case of an inter-system handover between WINNER and legacy RANs is expected to take place either due to loss of coverage of the current system or in case of overlapping coverage due to useroperator preferences or traffic congestion One solution could be to extend the inter-system handover based on the common RRM (CRRM) framework defined in the 3GPP Another approach could be location-based handover where user terminals (UTs) make use of foreign measurements and location information An inter-system handover is performed with the assistance of the cooperative RRM (CoopRRM) entity
Admission control (AC)
The AC ensures that the admittance of a new flow into a resource constrained network does not violate the service commitments made by the network to already admitted flows The decision is based on information such as load prediction statistics of current flows resource restrictions and physical layer measurements It is assumed that flow statistics will include
bull throughput per flow in previous super-frame
bull time-frequency-spatial resource use per flow
bull spare capacity within cell in previous super-frame
bull path loss estimate and
bull interference estimates
In case of limited resources in the candidate cells a number of different actions may be taken
bull reduce requests for connectionflow in question andor for lower priority flows
bull resource re-partitioning
bull lower load in (interference from) neighbouring cells
bull handover flows (cellmodeRAN)
bull drop flows
In the case of multiple RANs and multiple technologies the admission control must take into account the individual characteristics of each technology in order to make the final decision about admitting or rejecting a user in the network
Load control The load control algorithm is triggered in order to ensure that the system is in stable state It calculates the predicted load per cell based on information such as load prediction statistics of current flows and resource restrictions In particular
WINNER D210 v10
Page 48 (180)
bull The preventive load control takes care so that the network does not get overloaded and remains stable and attempts to improve the system performance by distributing userssessionsresources among cellssectors
bull The reactive load control attempts to bring the load back to stable regions as fast as possible
bull The load sharing aims to distribute the load (the offered traffic) andor resources between ldquoresource ownersrdquo (BSs and RNs) such that the resources are efficiently utilised
Potential actions for a ldquocongested cellrdquo are taken Examples are
bull interaction with the service level controller and restriction of incoming traffic
bull denial of new flow requests
bull change of TDD asymmetry factor
bull reduction of requests (eg bit rates) for flows (within limits as specified in the flow QoS specification)
bull attainment of more resources by resource re-partitioning or lower load in (ie lower interference from) neighbouring cells
bull handover of flows to another cellmodeRAN
bull dropping of flow(s)
Routing
Algorithms for the selection of the appropriate routepath per flow It is expected that several paths to a BS will exist due to the deployment of relays From the architecture perspective two basic routing strategies are envisioned in multi-hop systems centralised or distributed Under the centralised strategy route determination is performed in a central controller which normally possesses powerful processing capability and has knowledge on global network status so that sophisticated routing algorithms could be adopted to optimise the system performance With the distributed strategy individual network nodes from the source to the destination jointly perform route determination This strategy could function when no central controller is reachable but its performance is normally limited by network nodesrsquo processing capability and knowledge on network status
42 WINNER RRM architecture As previously described the WINNER radio interface will encompass a number of modes each of them targeted and optimised for a specific deployment scenario (and possibly also user scenario) Nevertheless many of the RRM functions may be shared between the different WINNER modes (eg admission control) Hence the RRM functions could be classified within the three following categories
1) Mode -specific RRM functions These are targeted and optimised for a specific mode and deployment scenario in terms of using different parameters specific to the current mode used In the MAC system layer they include scheduling power control and link adaptation In the RLC control plane they include intra-mode handover and routing
2) Generic RRM functions These are shared between the different WINNER modes or used for their coordination and include spectrum assignment service level control mode selection buffer management traffic policing admission control congestion control and inter-mode handover
3) Cooperative RRM functions which are used for the cooperation of the WINNER system with legacy RANs such as UMTS and WLAN and reside in the Cooperative RRM (CoopRRM) entity These include spectrum sharing inter-system handover admission control congestion control and RAN selection
It is very likely that an overlap between the generic and mode-specific RRM functions will exist where the generic part will administrate the mode-specific part For efficient management of the resources the location of the RRM functions within the network architecture is an essential issue as it can affect the performance of the network due to extensive signalling and delays In a centralised RRM architecture a central entity monitors and makes decisions regarding the allocation of the resources and it is usually located in a node at the RAN while user terminals have minimal role For example in UMTS most of the RRM functionalities are located in the Radio Network Controller (RNC) In addition terminals and Node B also contribute to parts of RRM in terms of power and load control In a distributed RRM architecture the decision entities for each resource management function are located in different nodes including the
WINNER D210 v10
Page 49 (180)
user terminal Furthermore in a hybrid approach different decision levels of the same RRM functionality that work at different time scales are located in different nodes
It is envisaged that for the WINNER system with the multiple operating modes the hybrid approach will be suitable In particular extensive delays in the decision making and signalling overload can be avoided by bringing some of the control plane functions closer to the BSs physical nodes Clearly this adds more complexity to the BSs physical nodes and therefore increases their cost However assuming different types of BSs for the wide-area and short-range scenarios we could restrict the extra functionality to the wide-area BSs (BSwa) In particular the WINNER vision is that the cells of the different modes will coexist and overlap either completely or partially This feature could be used in favour of the RRM architecture as the mode generic control plane functions that concern the coordination of the different modesBSs could be moved to the BSwa making the BSwa responsible for the control and allocation of resources per wide-area cell including all short-range BSs (BSsr) that fall within its coverage A requirement for such an approach would be the definition of a communication link between the BSwa and BSsr This link could be either wired or wireless (eg part of the FDD mode interface) More discussion on the RRM architecture can be found in Appendix D
43 Radio resource control The RRC provides the signalling for these RRM functions control measurements and reports Examples of RRC functionalities are
bull Broadcast of information related to the network
bull Control of broadcast
bull Establishment maintenance and release of an RRC connection between the UT and WINNER RAN
bull Assignment establishment reconfiguration and release of PHY resources
bull Feature discovery (antenna configuration relays etc)
bull Control of requested QoS
bull Measurement reporting and control of the reporting
bull Power control (slow)
bull Paging
bull Initial cell selection and cell re-selection
bull RRC message integrity protection
bull Timing advance
bull Control of synchronisation
bull Scanning of PHY resources
bull Control of masterslave mode (P2P)
The RRM measurements may be performed regularly upon request or triggered by some event To achieve the best possible performance the time period of the measurements should be chosen such that it may track the variations of the measured quantity However since some quantities (like a fading radio channel) undergo not only short-term but also long-term variations lower measurement frequencies may still be useful Moreover the measurement frequency may be adaptive adjusting the time period according to the variation of the measured quantity Similarly as for the measurements the reporting of the measurements can be performed periodically upon request or be event triggered The measurement reporting strategy that will be studied further in Phase II should not be selected independent of the measurement strategy We may distinguish between the case in which the measurement data itself is reported to the network and the case in which the measurement data is processed in the UT and only a RRM command is reported back to the network Further details are given in Appendix D
431 RRC states In order for WINNER to be harmonised with the 3GPP LTE work the same RRC states are proposed
WINNER D210 v10
Page 50 (180)
Dormant
Idle Detached
Active
Dormant
Idle Detached
Active
Figure 41 RRC states
These are
bull UT Detached
o The location of the UT is not known by the network (eg UT is switched off or operating on another RAT system)
bull UT Idle
o UT performs periodic search for higher priority RAN
o UT performs cell selection and reselection
o UT monitors broadcast and paging channels
o Inherently power saving state
o UT is handled by radio access network gateway (RANG)
bull UT Active (identical to the UTRAN CELL_DCH state [3GPP-TS25331])
o UT is transmittingreceiving data on traffic channels
o UT monitors the directedcommon control channels continuously
o There is a power saving sub-state within the Active state This is the dormant sub-state where the UT is ready to transmit or receive data on traffic channels and monitors the control channels discontinuously
o UT is handled by BS
WINNER D210 v10
Page 51 (180)
5 Assessment Overview
51 General Assessment of the performance of the developed system concept is an important aspect of the WINNER project In the case of WINNER the assessment work has been carried out to some extent by theoretical analysis but mostly by computer simulations In WP2 different kinds of simulations are required
bull link level simulations where the performance of the transmission and reception schemes under study are simulated with the selected fading channel models
bull multi-link simulations where multiple radio interface links are simulated simultaneously and thus effects of interference between users can be studied in detail
bull system level simulations where a coarser view of the physical layer is taken and higher level system functionalities are studied
At the link level simulation activities have been focusing on the following topics
bull channel coding schemes
bull novel modulation techniques
bull channel estimation
bull synchronisation
bull link adaptive transmission schemes
On the system and multi-link level the number of simulation alternatives is significantly higher Emphasis has been put on
bull multiple access technologies (TDMA FDMA CDMA SDMA and combinations thereof)
bull resource scheduling (frequencytime adaptive or non-adaptive)
bull spatial processing
bull multi-user detection
In addition implementation impact in terms of computational complexity and RF requirements are vital to consider The outline of the rest of this chapter is as follows In Section 52 the main challenges in performing the assessment work are discussed in Section 53 performance results implementation impact and performance-complexity trade-offs are discussed and in Section 54 comparisons with requirements and design targets from Section 11 and Appendix A are made
52 Challenges In the assessment work within WINNER WP2 there are two major challenges discussed in the following along with the strategies used to cope with them
1 There are a huge number of details and possible combinations of different functionalities In order to carry out a comprehensive assessment of the system concept all realistically possible combinations would have to be assessed and the associated performance checked However for a complex system as WINNER a fully comprehensive assessment is simply not possible to carry out with any reasonable amount of resources It is thus important to carefully select the areas on which the assessment work is focused The broad experience in designing communication systems that the WINNER personnel possesses helps significantly in this focusing and different partners have taken on to study different key aspects Also earlier results in previous WINNER deliverables are reused whenever possible to obtain as broad and accurate assessment as possible of the system capabilities
2 As different partners provide results it means that special emphasis needs to be put on the calibration and cross-verification of the simulation environments in order to ensure that system components are modelled in a similar manner in different simulators At link level the calibration is a straightforward operation and easy to carry out In the system level simulators the calibration is a much more challenging task due to significantly higher complexity larger number of parameters and larger number of issues (eg radio propagation related traffic
WINNER D210 v10
Page 52 (180)
models functionalities of the system etc) that need to be modelled Moreover the setup of one gigantic system simulator covering all aspects of a system in one study is simply not feasible Hence smaller system simulators dedicated to a specific topic studied by a partner can often provide more technical insight This fact is clearly reflected in the evaluation results in the appendices Link level results (Appendix F) from different partners are typically jointly presented in the same graphs whenever appropriate whereas multilink and system level results (Appendix G) from different partners are normally presented in different sections each with its own topic A detailed set of common simulation assumptions have been specified (Appendix E) to make the different studies as comparable as possible but nevertheless comparisons of absolute system-level performance between different partners cannot normally be directly made as the results may be sensitive to several details in the modelling approach
53 Summary of results ndash performance and complexity This section summarises major findings regarding performance and implementation issues the details of which can be found in the appendices of the present deliverable (primarily Appendix F and Appendix G) and in earlier WINNER deliverables It should be noted that many additional results not directly discussed here can be found in the deliverables [WIND23] [WIND24] and [WIND26]
531 Analogue RF In analogue RF implementation no major showstoppers have been identified With the assumed SNR requirement of 30 dB the RF sections of handheld terminals can be constructed using high-end components of today and the required components are expected to be available for the mass market when WINNER systems are to be deployed Zero-IF RF architecture seems to be the most promising solution Power consumption of analogue parts is generally expected to be within acceptable limits but with some restrictions for the use of higher order modulation schemes in combination with the large signal bandwidths and multiple antenna techniques However it is clear that power consumption in user terminals can become a limiting factor since the development of battery and heat dissipation technologies is not expected to be as rapid as the development of other analogue parts or the digital processing technologies
The requirements for the asynchronous TDD network (where interference between UL and DL on adjacent carriers may be substantial) with TDMA were found technically unfeasible taking into account the significant performance degradation and loss of area coverage To overcome this problem either synchronised networks or channel specific RF filtering should be used The latter is costly spectrally inefficient and unattractive to handheld terminals due to large size Therefore synchronised networks for TDD operation are strongly preferred
European and international electromagnetic field (EMF) exposure requirements and standards [HP98][OJEC99][CENELEC01] will be possible to fulfil for user terminals with the uplink output power levels used in the evaluations in this deliverable (200 mW for handheld device and 400 mW for laptop) and with designs and intended use similar to those of existing 2G3G terminals With downlink power levels and antenna installations similar to those used for 2G3G the EMF exposure requirements and standards [HP98][OJE99][CENELEC02] for radio base stations will also be fulfilled
532 Digital baseband In the following subsections the different components of a transmitterreceiver chain are first discussed individually An assessment of the overall link throughput is then provided followed by a subsection focusing further on multi-antenna aspects
5321 Forward error correction Decoding of the error control code is typically a dominant factor in the digital baseband processing complexity especially for single antenna systems On the other hand advanced forward error correction schemes based on iterative decoding provide substantial improvements in link layer performance
In this report the performance and complexity of two main candidate techniques DBTC and BLDPCC have been compared in detail (cf Appendices B2 and F2) The main finding is that DBTC provides best performance when the block length of the code is small while BLDPCC provides better performance at large block lengths The threshold block length where the advantage changes from one code to the other depends on the code rate DBTC show good performance already at block sizes around 100 information bits so CC might not be required for error control coding in the WINNER radio interface This is subject of further study The performance differences are in many cases rather small (lt05 dB) and other factors
WINNER D210 v10
Page 53 (180)
than performance may also affect the selection of coding technique BLDPCC show slightly lower (maximum) decoding complexity than DBTC ndash and provides the inherent capability to reduce power consumption when channel conditions are good
Overall the assessment showed that even for these advanced coding schemes decoders are expected to be implementable for data rates of 300 Mbps and beyond (see Appendix B21) in particular given the predicted increase in semiconductor computational power and the advances in parallelisation of decoding techniques The peak data rates of 1 Gbps can be somewhat challenging not only due to the power consumption but also due to increased clock rates at which the limits of the digital processing hardware (with respect to scaling and clocking limits current leakage heat dissipation etc) become more and more visible For these reasons solutions like lower complexity codes and even analogue decoding should be kept in mind Encoding of the error control code is of negligible complexity for all considered coding schemes
DBTC and BLDPCC represent the state of the art and such techniques are also under discussion in multiple standardisation activities [3GPP-WG142][80211n04][80211n-05][80216e-05] and have in some cases already been standardised [DVB00] Since basically all advanced coding schemes now come very close to the performance limits predicted by coding theory the coding schemes in these systems can be expected to have similar performance (and complexity) as those selected for the WINNER radio interface
5322 Modulation A variety of modulationdemodulation techniques have been investigated and good performance has been found to be achievable with low or moderate complexity already in previous deliverables [WIND21 WIND22 WIND23] However the selection of an appropriate modulation technique depends on a large number of aspects beyond complexity and basic performance as for example flexibility achievable spectral efficiency robustness to RF imperfections requirements on the RF (HPA backoff) and last but not least also on their suitability for implementation of different multiple access schemes and spatial processing methods Aspects directly related to physical layer performance and RF aspects of modulation schemes have been assessed in [WIND21 WIND22 WIND23] and are therefore treated in less detail here Based on the assessment of modulation techniques summarised in Appendix B31 GMC transmission configured as CP-OFDM (for DL transmission and for UL transmission in short-range scenarios) and serial modulation (mostly for the UL in wide-area scenarios) are the preferred options for the WINNER radio interface See also Appendix G71 for a comparison of single carrier and CP-OFDM on theUL The employed multiple access schemes are presented in Chapter 3 and evaluated in Appendix G
CP-OFDM is a well-established technique that is in use in a large number of systems such as DVB-S DVB-T and IEEE 80211 (WiFi) It is currently also under discussion for the use in 3GPP LTE and IEEE 80216e Serial modulationsingle carrier is under discussion in 3GPP LTE due to its advantages for uplink transmission from (power constrained) user terminals
5323 Synchronisation and channel estimation The choice of an appropriate synchronisation strategy for the WINNER radio interface is based on several criteria such as robustness residual synchronisation offsets acquisition delay and required overhead Two different types of pilots are foreseen for the WINNER system concept time and frequency multiplexed pilots in the form of OFDM training symbols and continuous pilot subcarriers respectively In combination with cyclic prefix based synchronisation differential modulation of continuous pilot subcarriers allows to establish frame synchronisation as well as to detect arbitrary frequency offsets (see Appendix F41 for details) Additionally a set of training symbols are included in the super-frame preamble for self organised inter- and intra-cell synchronisation (cf Appendix B41) A timing advance strategy is proposed enabling a time aligned arrival of different usersrsquo signals at the BS
Channel estimation by interpolation in time and frequency based on a scattered pilot grid is considered to be an efficient solution for the WINNER radio interface In Appendix B42 a generic framework for the pilot design of GMC signals is described The pilot overhead is only 25 and 4 per spatial stream for the WINNER TDD and FDD mode respectively For multi-antenna transmission dedicated pilots per flow common pilots per cellsector common pilots per antenna and common pilots per beam are required depending on the spatial scheme selected Especially in case of dedicated pilots purely pilot aided techniques may have severe limitations requiring a pilot boost andor a significant degree of over-sampling Advanced solutions such as iterative channel estimation aim to make a pilot boost redundant at the expense of increased complexity
WINNER D210 v10
Page 54 (180)
Adaptive transmission with respect to resource and physical layer processing requires channel prediction which can be based on common pilot symbols that are also used for other purposes Adaptive transmission becomes possible in the WINNER system at vehicular velocities The channel prediction accuracy estimates (covariances) are furthermore important inputs in the design of the link adaptation and resource scheduling schemes See Section 31 of [WIND24] for their use and impact
5324 Physical layer throughput The overall link level performance is assessed in Appendix F1 with throughput simulations for different scenarios and different physical layer parameters The focus is on the throughput achievable with a standard CP-OFDM system using different modulationcoding schemes under the assumption of ideal channel estimation and synchronisation The results are presented for the SISO case both for FDD and TDD as well as for the 2x2 MIMO case for FDD and the 4x4 MIMO case for TDD The obtained throughput figures indicate that at an S(I)NR between 20 to 25 dB a spectral efficiency for the single link of 3 bitsHz is achievable in the SISO case when considering the WINNER A1C2 NLOS tapped delay line channel models for the TDD and FDD mode respectively For the MIMO case a link spectral efficiency of 45 and 9 bitsHz in the 2x2 and 4x4 MIMO case respectively can be achieved at a target S(I)NR of 25 dB (using the same channel models)
At a bandwidth of 100 MHz the target of 1 Gbps at short ranges in isolated cells appears hence to be achievable For the wide area case achievable spectral efficiencies (and data rates) depend very much on the interference situation ndash cf the multi-link and system level results in the following section
5325 Multi-antenna processing The spatial processing aspects of the WINNER radio interface concept are described in Appendix B1 There the mapping of the data bits to the available space-time-frequency resources is described in detail Impacts of multiple transmit andor receive antennas to the physical layer (eg to synchronisation channel estimation) can be seen throughout the Appendix B Use of two antennas in the terminal is envisaged to be the baseline case as it provides substantial gains compared to single antenna at only moderate extra complexity
As multi-antenna transmission and reception is a fundamental part of the WINNER radio interface concept assessment results related to it are dispersed over the link- and system-level assessment appendices ie Appendix F and Appendix G The results verify that multi-antenna processing is one of the key technologies in reaching the stringent targets set for the WINNER system
Transmit beamforming and receive diversity are essential techniques to ensure coverage and high system throughput in the downlink Especially in wide-area scenarios with high number of active users fixed beam techniques offer high performance gains with low complexity and control overhead Average sector throughput increases by up to a factor of 3 for 8 transmit antennas (Appendices G15 and G24) The increased complexity of adaptive beams is easily justified in cases of few active users and SDMA where substantial sector throughput gain can be observed (Appendix G22) or for delay-sensitive flows (Appendix G21) Given an identical number of antenna elements spatial multiplexing can be used to increase the user peak data rates (Appendix F1) at approximately identical sector throughput ie at the expense of reduced inherent fairness (Appendix G24) The use of spatial diversity must always be considered in the context of other sources of diversity already exploited and therefore might provide only marginal additional gain (Appendix G24) Local area scenarios allow applying advanced spatial processing techniques based on short-term CSI and multi-user precoding like the SMMSE technique developed within WINNER Initial results in Appendix G25 shows that such techniques have the potential to meet the requirements of 4 bitssHz user throughput mentioned in Appendix A14 From multi-antenna receiver complexity point of view OFDMA is preferred over MC-CDMA (Appendix G23)
In downlinks (Appendix G23 Appendix G24) as well as uplinks one can note significant gains in throughput when going from one to two antennas at the user terminals MMSE combination in receivers can be seen to outperform MRC significantly (Appendix G23) The corresponding gain in sector throughput compared to the single receive antenna case is in the order of 35 for MRC and an additional 15 for MMSEIRC (Appendix G24)
The receiver complexity increase is considerable when compared to single antenna systems (factor of about 30 for a 4x4 system when spatial multiplexing is used) but still acceptable when compared to the decoding complexity of error control codes especially if higher order modulation is considered The evaluations show that the multi-antenna methods studied are feasible and practical with some restrictions on in which environments and specific system modes these methods should be used
WINNER D210 v10
Page 55 (180)
For the uplink base station receive diversity significantly improves sector throughput and enhances user data rates Performance improves with larger antenna separation and IRC with a lower number of antennas may give similar performance as MRC with a larger number of antennas (Appendix G51) In most of the cases SDMA using single-stream beamforming per user is the best solution to benefit from the spatial degrees of freedom (Appendix G52)
On the total system design there are still several open questions In particular the impact of simultaneous use of several complex techniques has not been analysed thoroughly For example the concurrent use of different multi-antenna technologies advanced coding methods fast link adaptation and scheduling can result in a challenging overall computational complexity even considering the expected advances in digital processing technologies
533 Multiple access Starting from the initial assessment of multiple access schemes in [WIND26] a further refined assessment has been performed for the most promising candidates by means of multi-link and system simulations In contrast to previous multiple access oriented simulation campaigns inter-cell interference one of the most important aspects when aiming at a frequency reuse one deployment is now modelled more properly However it should be stressed that still many simplifying simulation assumptions had to applied to keep simulation setup and run-time manageable Some aspects of the results have been highlighted in Section 316
Simulation results with focus on comparative or absolute performance assessments of multiple access schemes can be found in Appendix G1 and Appendix G4 for downlink and uplink respectively Regarding the downlink emphasis has been placed in comparing interleaved OFDMATDMA and MC-CDMATDMA as the most promising multiple access candidates for non-frequency-adaptively scheduled flows Results obtained in Appendix G11 indicate that OFDMATDMA performs slightly worse than MC-CDMATDMA if spreading is applied within one chunk only Spreading within a chunk enables low complex user separation at the UTs without performance penalties due to the flat fading characteristic of each chunk The decreased chunk granularity allows for a larger frequency diversity gain than with OFDMATDMA that explains its performance advantage If spreading is applied across several chunks as analysed in Appendices G12 and G13 MC-CDMA suffers from imperfect user separation at the UT with increasing load and OFDMA performs similar or slightly better in that case In addition equalisation considerably increases the complexity of MC-CDMA for the UT
Performance assessment of adaptive chunk based OFDMATDMA revealed the high multi-user diversity gains obtainable by frequency adaptive resource scheduling Considering a score-based scheduler that already takes fairness constraints into account the average cell throughput was increased by a factor of 16 see Appendix G11 compared to non-frequency adaptive scheduling However no traffic-model specific delay constraints have been taken into account yet since full queues were used as a baseline assumption throughout all simulations
In a wide-area scenario OFDMATDMASDMA has been proven to provide large system capacity gains by a factor of 2 compared to pure OFDMATDMA with beamforming using eight antennas in both cases see Appendix G15 Larger gains with more antennas are likely to be achieved From a complexity point of view adaptive OFDMATDMASDMA with beamforming supports simple UT receiver processing without the need for multiple antennas andor complex multi-user detection
Regarding the uplink similar studies were performed including pure TDMA MC-CDMA was not considered as viable multiple access scheme for the uplink due to the resulting high BS complexity From the UT perspective TDMA is attractive since it supports the use of single carrier transmission with lower peak to average power ratio and thus higher power efficiency than multi-carrier transmission In Appendix G41 it is shown that even TDMA allows for a multi-user diversity gain by adaptively scheduling in time albeit with much lower performance potential than adaptive scheduling in frequency
Frequency offset errors among UTs can be suppressed to around 1 of the subcarrier spacing by the UL-DL synchronisation scheme outlined in Appendix B41 and investigated in [WIND23] Therefore chunk based OFDMATDMA was chosen to be the main multiple access candidate for adaptively scheduled flows in the uplink as well as in the downlink Moreover it is highlighted in Appendix G43 that ndash although theoretically optimal ndash sharing the subcarriers does not yield any perceivable capacity gain Hence adding an additional CDMA component to OFDMA would only increase the system complexity
Even the synchronisation of a self-organised OFDM network is technically feasible with a reasonable overhead If relaying techniques are an integral part of the system design a single hop network can be extended to a multi-hop network without too high impact on implementation complexity at the user
WINNER D210 v10
Page 56 (180)
terminals On deployment costs no final conclusions can be made yet since the density of base stations and relay nodes depend crucially on the actual frequency allocation The restrictions due to the delay introduced by RNrsquos forwarding process the additional signalling overhead or the combination of duplex schemes at the two links at a RN require a more detailed analysis
The interference from other cells should be taken into account in the design of multiple access schemes and in the resource partitioning of the super-frame In frequency reuse 1 networks schemes for interference avoidance or reuse partitioning between cells (WP3 deliverables eg [WIND32] and [WIND35]) which in effect increase the reuse factor to between 1 and 2 are important for optimising the spectral efficiency The effect of introducing interference avoidance (RRM) is illustrated in the results of Appendix G12 It should be noted that the delay differences between cells are likely to exceed the OFDM symbol guard intervals Therefore reuse partitioning that allocates different sets of frequencies to different cells eg in their outer regions [WIND32] should not be performed without guard intervals in frequency As illustrated by Appendix G73 the overhead due to such guard intervals can be held at reasonable levels
534 Radio protocols As noted in Chapter 1 system design and protocol specification is an iterative procedure an initial design is needed in order to select an adequate protocol architecture which in turn may lead to a refined system design In Phase I of WINNER key protocol technologies have been identified and assessed but the final performance evaluations and subsequent choices for the WINNER RI can only be made when the consolidated and refined system concept is available Therefore in the following we focus on a brief but more general discussion about complexity and overhead aspects of different protocol technologies6
The complexity increase in the design of radio protocols is mainly due to the required measurements signalling overhead and due to the implementation of baseband processing at the base station It has been shown that the enhanced MAC protocols can provide high throughput and low delays at a feasible amount of complexity and overhead
The coordination between base stations is needed particularly in heavy traffic load situations and will increase performance in medium load situations A promising framework for inter-cell interference management and integrated load sharing with reasonable balance between performance and complexity is to perform the coordination hierarchically at different time scales with the lowest level working on the fastest time scale by assigning constraints on resources to distributed schedulers in the cells In addition self-organised radio resource management techniques which do not require signalling overheads or cause delays can be used and are particularly well suited for multi-hop networks where delays can be a problem
The multi-mode system concept introduces additional complexity both in the design of protocols and associated algorithms as well as hardware implementation In general modularity of system design helps to reduce the computational complexity but many of the implementation specific issues can be assessed only after the spectrum allocation is known
54 Comparison of performance results with requirements and design targets In Section 11 and Appendix A a number of requirements and design targets were listed This section assesses to what extent the present radio-interface concept can meet these targets This assessment is based on results from all appendices and also from previous WP2 deliverables but in particular on the multi-link and system-level assessments summarised in Appendix G
This kind of assessment faces several types of difficulties First several of the requirements have to be made more precise before they can be compared in a meaningful way with performance results Second one should be very careful when using the present simulations to assess absolute network performance figures The used models and assumptions are crucial for the outcome Moreover at this stage most evaluationssimulations are neglecting many imperfections eg estimations errors and delays Accounting for these imperfections may have a large impact on absolute performance figures Still the results may be used to indicate the performance potential of the technology
The assessments are based on the following assumptions summarised from Appendix A and Appendix E
6 See WP3 deliverables for first assessments in different deployment concepts
WINNER D210 v10
Page 57 (180)
bull Deployment Sites with three sectors (cells) as described in Appendix E deployed without use of relay nodes Max 8 antenna elements per base station sector and (mostly) two antenna element per UT
bull Duplexing and bandwidths Three types of radio bandwidths are considered FDD with paired 20 MHz and 40 MHz bands and TDD on one 100 MHz band Data rates per link refer to downlinks in TDD or half-duplex FDD both with activity factor 2 (reception half of the time)
bull Overhead The overhead due to guard bands and cyclic prefixes has been taken into account in all simulations Overhead due to pilots and downlink control signalling has been specified to around 20 in multi-link and system-level simulations see Appendix E31 and is taken into account in these results In the link-level results this overhead is not taken into account and has to be added separately The MAC layer adds some overhead due to CRC codes sequence numbers for retransmission units and non-perfectly filled chunks That MAC overhead has not been investigated and is therefore not taken into account below
bull Restrictions Perfect channel estimation will be assumed unless otherwise indicated and the results refer to downlinks Full queue models are used for the downlink flows
Requirements stated in Section 11
R33 A consistent and ubiquitous data rate per link of 5 Mbits above Layer 2
Assume a single user in the cell of interest and fully loaded neighbouring cells that generate interference Due to the activity factor for TDD or half-duplex FDD the requirement corresponds to 10 Mbits downlink cell throughput with one user at the cell edge This requirement is attained without problems in the considered 40 MHz FDD and 100 MHz TDD modes
For 20 MHz FDD downlinks relevant investigations are found in Appendix G24 for 700 m cell radius In the lower left Figure G16 the CDF value for 10 Mbits active radio link rate is around 015 for one BS antenna and a UT that uses two antennas with IRC This means that some but not all users at the cell edge would attain the performance Using fixed beamforming with 4 or 8 antennas at the BS the target would be attained with high probability see the lower left Figure G18 Results for larger cell sizes (not shown) indicate that the requirement can be fulfilled for cell radii above 2500 m with 8 BS antennas and 2 UT antennas At least two users at the cell edge (one in each slot of the FDD frame) can thus be provided at least 5 Mbits in rural deployment using the 20 MHz FDD mode
R32 A sustainable average high end data rate per link of 50 Mbits above Layer 2
With the same reasoning as above this requirement corresponds to an active radio link rate of 100 Mbits for a user on average over all locations in the sector
For 100 MHz TDD the requirement is fulfilled in short-range scenarios Considering 40 MHz FDD by scaling up the results for 20 MHz of Figure G17 we see that the result becomes attainable by using 8 BS antennas with grid-of-beams or adaptive beamforming and two UT antennas up to a cell radius of 1400 m by using non-frequency adaptive transmission based on turbo coding
For 20 MHz FDD the goal seems unattainable with non-frequency adaptive transmission With many users in the cell adaptive transmission and multi-user scheduling would boost the aggregate sector throughput but this would not enable an individual user to attain 50 Mbits on average over its location Thus the larger bandwidths of 40 MHz FDD or 100 MHz TDD seem to be required
R36 Peak spectral efficiency in connected sites of 10 bitssHz in wide area deploym for high load
The ldquopeakrdquo spectral efficiency normally refers to the maximum sector throughput allowed by the modulation coding and antenna design It is therefore not a function of the load of the system With 3-sector sites this requirement means 333 bitssHzsector The 20 downlink overhead margin raises the requirement to 416 bitssHzsector This figure is attained since 64-QAM transmission is allowed
R37 Peak spectral efficiency in isolated (non-contiguous) sites of 25 bitssHz
It is noted in Appendix F1 from the results in Figure F4 that this goal is attainable with diversity-based 4x4 MIMO in 3-sector sites but only at high SINRs of at least 30 dB
WINNER D210 v10
Page 58 (180)
R312 User speeds ranging from 0ndash500 kmh should be supported
The short OFDM symbol length used for evaluation provides reasonable robustness against the effect of channel variability within symbols but the performance for the highest vehicular velocities and relay links to moving relays in trains remains to be investigated
The OFDM pilot grid for non-frequency adaptive SISO transmission has been scaled to be appropriate up to 250 kmh (Appendix B42) Speeds up to 500 kmh and the use of beamforming (eg following a moving train) would require extra pilot overhead but no dramatic effects are expected
R34 A maximum delay over the radio interface of 1 ms at Layer 2
The delay over the radio interface is interpreted as the delay from arrival of a packet to the MAC layer to the earliest instance the packet can be received and decoded With the tightly designed MAC feedback loops delays of 07ndash17 ms are attained see Appendix C15 The target round-trip delay of 2 ms (Table A6) can be fulfilled since the decoding time for reasonably sized encoding blocks and retransmission units (at or below 1520 bytes) should be 01 ms or below according to Table B2
ITU-R 100 Mbps peak aggregate useful data rate for mobile access
This is a data rate as seen from the base station not the individual terminals It is here interpreted as the cellsector throughput Thus the terminal activity factor does not affect the assessment
This data rate is difficult to attain using 20 MHz FDD It could be attained in a rural site with many users in the cell by using max throughput scheduling and SDMA with four beams see upper left part of Figure G10 However that strategy would starve users not located close to the BS A better indication of the attainable performance for 20 MHz FDD downlinks are the 75 Mbps attained in Figure G10 when using proportional fair scheduling and SDMA with four beams
With many users in the cell experiments with adaptive beamforming in Appendix G21 (that use all 512 subcarriers) provide CDF curves in Figure G11 They show that the goal is almost attained when using the TrackingPSF mean-approach The average data rate with 416 subcarriers would be (416512)110 Mbps = 89 Mbps with 60 users per 1-km cell 8 BS antennas 1 UT antenna Note that with many users per sector the average throughput per user would of course be much lower (right-hand Figure G11)
ITU-R 1 Gbps peak aggregate useful data rate for local area
The results in Appendix G25 indicate that this target is attainable even when channel estimation errors are considered but only in short-range cells (50 m range) with MIMO links that use large numbers of transmit antennas and four receiver antennas
Design targets stated in Appendix A
Throughput per link targets for rural and metropolitan area deployment
The target 1 bitsHz corresponds to 40 Mbps on active links on 20 MHz half-duplex It can be regarded as fulfilled when using 20 MHz FDD up to 25 km cell radius if we have only one user per sector See Appendix G24 Figure G17 The target 05 bitsHz (at 70 kmh) was found to be attainable in Appendix F1
Results in Appendix G11 G15 G21 and G22 show that the requirements for low and medium terminal velocities are well fulfilled with multiple users per cell in particular when using multiple antennas Terminal velocities of 250 kmh have not been evaluated
Throughput per link targets for local area deployment
The target high-end throughput per link of 4 bitsHz per sector is attained for the A1 LOS and A1 NLOS channel models at 50 m distance according to Appendix G43 It is also attained for the B1 LOS channel model for 10 users all being at 150 m distance with OFDMA maximum throughput scheduling It is not attained at 150 m with a B1 NLOS model These results are for adaptive uplinks
WINNER D210 v10
Page 59 (180)
6 Conclusions and Outlook An overview of the current status of the WINNER radio interface concept was presented in Chapters 1ndash4 with an emphasis on novelties compared to existing systems Throughout the work design and functionalities that allow or facilitate operation in shared spectrum and interoperation between WINNER networks and different RATs deserved special focus
The design view was consistently used in this deliverable motivated by its focus on the lower layers and the need to enable direct assessments in terms of performance simulations and implementation impact analysis Service and protocol views and more information on higher layers can be found in the final deliverables of WP7 and WP3 An overview of simulations investigating different system components as well as the whole system was given in Chapter 5 Also comparisons were made with requirements from [WIND71] and other design targets defined within WP2 It was concluded that with reasonable assumptions about missing information (yet to be determined by political legal economic and other factors and decisions) and within the uncertainties of the simulations these requirements and design targets could be fulfilled The analyses of implementation impact in this and previous deliverables revealed no major critical issues that would prevent a cost-efficient implementation of the system at the time of deployment in 8ndash10 years More technical detail both regarding concept and assessments is provided in the appendices and in earlier deliverables
An important objective of Phase II is to further enhance and refine this initial concept to a level of detail needed to build a prototype within the project and to serve as input to the standardisation process that is expected to follow after World Radiocommunication Conference 2007 (WRC-07)
WINNER D210 v10
Page 60 (180)
Appendix A Requirements and Design Targets This appendix presents design targets for different scenarios as discussed in Section 11 A few scenario-independent targets and general assumptions about spectrum etc are also listed at the end
A1 Targets for different scenarios
A11 Scenarios Depending on the scenario being considered different subsets of the system requirements will be relevant In the following discussion we therefore distinguish between the three application scenarios that have been identified for WINNER (respective characteristics listed in sub-bullets)
bull Rural area o medium traffic demand o cellular large cells o range (coverage) issues
bull Metropolitan area o high traffic demand o cellular midsize cells o range (coverage) issues (to some extent)
bull Local area o high data rate demand high traffic demand o cellularisolated cellspeer-to-peer small cells o indooroutdoor
Rural area and metropolitan area will sometimes be referred to collectively as examples of ldquowide-areardquo scenarios Similarly local area will sometimes be referred to as ldquoshort rangerdquo For each scenario technical targets will be summarised in the following sections
A12 Rural area In the rural-area scenario coverage and high UT speeds are the main challenges for the radio interface Cell radii of 2 km and more will likely be desirable The system requirements state an average cell throughput of 50 Mbits in 100 MHz bandwidth and a cell border (ubiquitous) throughput of 5 Mbits Either FDD paired bands or TDD may be used half-duplex is assumed for terminals also in the former case for complexity reasons For maximum efficiency frequency 1-reuse is generally assumed but tech-niques discussed in eg Section 52 in [WIND32] may be used to create a higher effective reuse for users at the cell border The bit rates mentioned here will only be possible to guarantee at low and moderate speeds cf [WIND24] and Appendix B52
Requirements on downlink are summarised in Table A1 All bit rates refer to throughput above the MAC layer and full queues are assumed The cell range is only introduced as a reference point for the throughput values and the actual coverage areas might be different (at the expense of reduced throughput per link) For the uplink the lower output power of the terminal will reduce the possible bit rates see Table A2 Dual-antenna terminals are considered to be the baseline case Relaying may be needed to reach the tabulated targets the feeder links connecting base station and relay node are then normally assumed to use the same spectrum
Table A1 Targets for Rural Area (Downlink)
Reference cell range
UT velocity Throughput per link (cell average single user in cell)
2 km 0 kmh 70 kmh 120 kmh 250 kmh
1 bitsHz 05 bitsHz 05 bitsHz 01 bitsHz
WINNER D210 v10
Page 61 (180)
Table A2 Targets for Rural Area (Uplink)
Reference cell range
UT velocity Throughput per link (cell average single user in cell)
2 km 0 kmh 70 kmh
01 bitsHz 005 bitsHz
A13 Metropolitan area For metropolitan area spectral efficiency and inter-cell interference become more important considera-tions whereas extremely high UT speeds are less common Coverage may sometimes still be an issue but the maximum cell size is smaller than for the rural-area scenario and the performance difference between UL and DL is typically expected to be less significant Relays may be needed also in this scenario In order to maximise spectral efficiency MIMO preferably with fast feedback will likely be an important feature Requirements are summarised in Table A3 The throughput is given per link and with 3-sector sites and half-duplex for the UT it should be multiplied with 3times2=6 to obtain the corresponding value per site
Table A3 Targets for Metropolitan Area (Downlink)
Reference cell range
UT velocity Throughput per link (cell average single user in cell)
1000 m 0 kmh 70 kmh
1 bitsHz 05 bitsHz
A14 Local area Local area communication includes cellular systems as well as non-contiguous (isolated) sites and peer-to-peer communication In the cellular case the short-range requirements in Table A4 apply For non-contiguous cells inter-cell interference is not an issue and the highest spectral efficiency 25 bitssHzsite should be achievable With 3 sectors and half-duplex this corresponds to approximately 4 bitssHzlink (see Table A5)
Table A4 Targets for Local Area (Cellular)
Environment Reference cell range
UT velocity Throughput per link (cell average single user in cell)
Outdoor 100 m lt10 kmh 50 kmh
1 bitsHz 05 bitsHz
Indoor 30 m lt10 kmh 1 bitsHz
Table A5 Targets for Local Area (Isolated Cells and Peer-to-Peer)
Environment Reference cell range
UT velocity Throughput per link (cell average single user in cell)
Outdoor 100 m lt10 kmh 4 bitsHz
Indoor 30 m lt10 kmh 4 bitsHz
A2 Additional targets To be able to handle new delay sensitive applications and link adaptation efficiently it is essential to have a low delay over the radio interface The targets of Table A6 are assumed
WINNER D210 v10
Page 62 (180)
Table A6 Delay targets
Basic radio interface delays (physical layer single hop)
ndashRound-trip time
lt 2 ms
Packet channel establishment (minimum)
ndash UT originated ndash BS originated
lt 5 ms lt 2 ms
RAN-UT-RAN delay 4 ms
A3 System assumptions The preferred spectrum range for WINNER systems is below 6 GHz and for research purpose the target band is 34ndash50 GHz A bandwidth allocation of 100 MHz per carrier should be seen as an upper limit Such wide bands are not feasible in the current mobile bands therefore new bands should be identified The defined target bands are among the current candidate bands in ITU
Operation in spectrum shared with other operators that use the same physical layer WINNER mode will be an integral part of the design Operation in dedicated bands is seen as a special case of this situation Operation in isolated cells will be seen as a special case of cellular transmission (see also Appendix A14)
WINNER D210 v10
Page 63 (180)
Appendix B Physical Layer The purpose of this chapter is to provide more detail on the assessment of different physical layer candidate technologies which eventually lead to the design decisions presented in Chapter 2 of this report It also gives the rationale behind the parameterisation of different system components if not yet provided in previous deliverables [WIND23]
Appendix B1 contains a detailed description of the generic WINNER spatial processing framework along with some example configurations of it The provided figures illustrate in more detail the structure of the space-time-frequency processing sub-block of the generic transceiver architecture depicted in Figure 21 of Chapter 2 Extending on the framework for the assessment of coding techniques from [WIND23] Appendix B2 provides a detailed comparison of the most promising FEC schemes considered for the use in WINNER Duo-Binary Turbo Codes and Block-LDPC Codes Appendix B3 presents a short comparison of the different modulation techniques investigated during WINNER Phase I [WIND21 WIND22 WIND23] as well as a short summary of their merits and drawbacks Afterwards Appendix B4 covers the topic of pilot design for channel estimation and synchronisation The WINNER plot grid is presented including a discussion of different core requirements for channel estimation (chunk based channel estimation extension to the MIMO case etc) Finally Appendix B5 contains information related to link adaptation a comparison of different bit- and power loading algorithms details on the prediction horizons for channel quality prediction and methods for the compression of feedback for channel state information
B1 Spatial processing and space-time-frequency mapping Figure B1 shows a generic transmitter chain implementing the WINNER multi-antenna concept7 The segmentation stage shown corresponds to the MAC-3 sub-layer introduced in Section 315 which allows splitting one RTU into k encoding blocks that undergo individual forward error correction FECk and interleaving Πk Spatial reuse of a chunk adds a third dimension referred to as a chunk layer and presented along the vertical axis of Figure B1 The (maximum) number of layers l in chunk c denoted Qc can be different for different chunks The mapping of FEC blocks to chunk layers is performed by the resource scheduler In adaptive transmission each chunk layer carries data from one flow only In non-frequency adaptive transmission code-multiplexing may be used in downlinks The chunk layers may stem from the different RTUs of different flows in the case of SDMA or from the same flow in case of per stream rate control and multi-level coding Note that the number of layers in a chunk may be arbitrary in relation to the number of physical antennas denoted MT
The bits of chunk layer cl are first modulated onto Sc modulated layers The number of modulated layers is inferior or equal to the number of chunk layers Scle Qc Typically they are equal that is each chunk layer is modulated independently However for the case of multi-level coding several chunk layers are modulated onto the same modulated layer The modulated layers are then subject to an optional non-linear precoding8 The precoded modulated layers are then dispersed onto virtual antenna chunks with a dispersion code A virtual antenna chunk is a three-dimensional entity which spans MT virtual transmit antennas in space nsymb OFDM symbols in time and nsub subcarriers in frequency To simplify the presentation it is assumed that the number of virtual antennas is equal to the actual number of physical antennas If the underlying dispersion code encodes the signal over less or more dimensions appropriate zero padding and puncturing in the spatial dimension is assumed Typically a linear dispersion code is assumed but by allowing non-linear dispersion codes also schemes such as various forms of space-timefrequency trellis-coded modulation may be represented in the generic processing [WIND21 WIND23 WIND26 WIND27]9
7 Figure 21 shows the overall transmitter structure Here a detailed view of the spatial processing (SP) block in
Figure 21is given (GMC and pilot insertion aspects are neglected for readability) 8 The non-linear precoding proposed in [WIND27] is based on Tomlinson-Harashima precoding however the non-
linear precoding block can also include more general lattice coding techniques Such techniques allow approaching the optimal dirty paper coding and can be used to improve the performance of a MIMO single link
9 If some form of coding and modulation is performed by the dispersion code the outer code is probably relatively weak and the modulator essentially bypasses the encoded bits
WINNER D210 v10
Page 64 (180)
segmentation codingchunk layer multiplexing chunk processing OFDM
link adaptation and resource assignment
spac
efre
q
Seg FECk Πk
Res
ourc
e S
ched
uler
Mod NLP DC P BF
ant s
ummati
on
OFDM proc
essin
g
FEC forward error codingMod modulationNLP non-linear precodingDC linear dispersion codeP power allocationBF beamforming
segmentation codingchunk layer multiplexing chunk processing OFDM
link adaptation and resource assignment
spac
esp
ace
freq
Seg FECk ΠkSeg FECk ΠkFECk Πk
Res
ourc
e S
ched
uler
Mod NLP DC P BF
ant s
ummati
on
OFDM proc
essin
g
FEC forward error codingMod modulationNLP non-linear precodingDC linear dispersion codeP power allocationBF beamforming
Figure B1 Overview of the generic PHY processing chain
The virtual antenna chunk of each layer is then subject to power allocation and linear precoding which means that each virtual antenna chunk of each layer is mapped onto a physical antenna chunk Each element of the three-dimensional antenna chunk is a linear combination of the elements of the layerrsquos virtual antenna chunk The term linear precoding covers techniques such as closed-loop transmit diversity linear multi-user precoding and long-term beamforming and also antenna or beam selection and hopping as well as random beamforming that may be employed by opportunistic beamforming approaches For cases with multi-user optimisation the linear precoding and the power of virtual antenna chunks are optimised jointly Finally the layersrsquo antenna chunks are summed over the antennas to form a three-dimensional antenna chunk which is passed to assembly and OFDM modulation per antenna
The MAC function spatial scheme selection and link adaptation will select and configure the blocks of this generic chain to implement the most favourable spatial processing scheme for each flow A few illustrative example configurations are given in the following In case of open-loop space-time coding (using an LDC eg the well-known Alamouti-code) all data undergo identical FEC and modulation The LDC then maps the symbols onto the antenna chunk (Figure B2) For PARC however segmentation is performed first to allow for individual FEC and modulation of the sub-flows which are mapped to different chunk layers (Figure B3) Figure B4 shows the processing for SMMSE where the LDC implements purely a multiplexing onto virtual antenna chunks The power allocation and linear precoding (BF) is then optimised across all SDMA users according to the SMMSE algorithm [WIND27]
segmentation codingchunk layer multiplexing chunk processing OFDM
link adaptation and resource assignment
spac
efre
q
FECk Πk
Res
ourc
e Sc
hedu
ler
Mod
LDC
P
OFDM proc
essin
g
one userflow P
P
segmentation codingchunk layer multiplexing chunk processing OFDM
link adaptation and resource assignment
spac
esp
ace
freq
FECk Πk
Res
ourc
e Sc
hedu
ler
Mod
LDC
P
OFDM proc
essin
g
one userflow P
P
FEC forward error codingMod modulationNLP non-linear precodingLDC linear dispersion codeP power allocationBF beamforming
Figure B2 Example configuration for open-loop space-time coding
WINNER D210 v10
Page 65 (180)
segmentation codingchunk layer multiplexing chunk processing OFDM
link adaptation and resource assignment
Seg
spac
efre
q
FECk Πk
Res
ourc
e S
ched
uler
Mod P
OFDM proc
essin
g
one userflow
segmentation codingchunk layer multiplexing chunk processing OFDM
link adaptation and resource assignment
Seg
spac
esp
ace
freq
FECk ΠkFECk Πk
Res
ourc
e S
ched
uler
Mod P
OFDM proc
essin
g
one userflow
FEC forward error codingMod modulationNLP non-linear precodingLDC linear dispersion codeP power allocationBF beamforming
Figure B3 Example configuration for PARC
segmentation codingchunk layer multiplexing chunk processing OFDM
link adaptation and resource assignment
spac
efre
q
FECk Πk
Res
ourc
e S
ched
uler
Mod
BF
OFDM proc
essin
g
one userflow LDC
P
P
P
segmentation codingchunk layer multiplexing chunk processing OFDM
link adaptation and resource assignment
spac
esp
ace
freq
FECk Πk
Res
ourc
e S
ched
uler
Mod
BF
OFDM proc
essin
g
one userflow LDC
P
P
P
LDC
P
P
P
FEC forward error codingMod modulationNLP non-linear precodingLDC linear dispersion codeP power allocationBF beamforming
Figure B4 Example configuration for SMMSE
Apart from the generic processing chain and example configurations a lean baseline configuration is defined which serves as basic implementation guideline and benchmark It is based on the following simplifications
bull no segmentation (MAC-3 sub-layer) ie one RTU is encoded as a single FEC block
bull independent processing of each chunk layer ie each modulated layer stems from a single chunk layer
bull no non-linear precoding
bull linear dispersion codes that generate a set of virtual antenna streams out of each chunk layer
bull pure spatial linear precoding (beamforming) ie for a given chunk layer cl symbol t and subcarrier f the elements xcl(tf) of the antenna chunk are obtained by
)ft()ft( lclclc aFx =
where acl(tf) is an MT times 1 column vector holding the corresponding element of the virtual antenna Note that Fcl is identical for all symbols within one chunk layer and each column of Fcl can be viewed as transmit weight vector
Relaying is an integrated part of the WINNER system Investigations that combine relaying and spatial processing have been performed in [WIND27] It has been shown that FRN based on decode-and-forward can benefit from different kinds of spatial processing In-depth investigations and system design that tighly integrates relaying and spatial processing are foreseen in Phase II including more sophisticated concepts like cooperative relays [AY05]
WINNER D210 v10
Page 66 (180)
B2 Forward error correction A large number of possible options for forward error correction have been identified and discussed in [WIND21] With the advent of iterative decoding very powerful concatenated error correction schemes have been devised which exhibit a decoding complexity that is linear in the block length ndash a key requirement for inclusion into any practical wireless communications system Of the plurality of possible concatenated codes parallel concatenated convolutional codes and low-density parity-check codes have been selected as main candidate technologies as they showed the best trade-off between performance and implementation complexity Of these two general classes of codes Duo-Binary Turbo Codes and (Quasi-Cyclic) Block LDPCC (QC-BLDPCC) are considered for the use in the WINNER system since they provide the necessary amount of flexibility in terms of block lengths and code rates However iterative decoding schemes suffer from quite low performance at short block lengths Therefore convolutional codes are used with short block lengths below 200 information bits The domain of suitability (for a target BLER of 1) of all candidates is summarised in Figure B5 below (cf Appendix F2 for details)
Figure B5 Domain of suitability of DBTC and BLDPCC for a target BLER of 1
Table B1 summarises the assessment of these three candidate technologies
Table B1 Assessment of the most promising FEC techniques
CC10 DBTC BLDPCC
Short blocks - lt05 dB lt1 dB
Medium blocks lt1ndash15 dB - lt02ndash04 dB
Performance11
Large blocks lt2ndash25 dB lt02 dB -
Code structure Very low Low Medium Memory Requirements
Decoding Low Medium Medium
Encoding complexity lt 10 opsinfo bit
Decoding complexity ~ 2500 opsinfo bit lt1700 opsinfo bit lt1200 opsinfo bit
Maturity High Medium Medium
10 Memory 8 convolutional code soft Viterbi decoding 11 Loss with respect to the best technique at codeword sizes 50 576 4308 bits (AWGN BPSK target BLER 1)
0 500 1000 1500 2000 2500 3000 3500 4000 4500 5000
DBTC
DBTC
DBTC
BLDPCC
BLDPCC
BLDPCC
Codeword Size (bits)
Rc=12
Rc=23
Rc=34
CC
CC
CC
WINNER D210 v10
Page 67 (180)
DBTC show very good performance already at quite low block sizes (around 128 information bits) and may eventually be used instead of CC in such scenarios LDPCC are favoured over DBTC for large block sizes due to their superior error correction performance in this regime (lower required bit SNR to achieve BLER of 1 [WIND23]) All codes show the same high degree of flexibility in terms of block sizes and code rates (cf Appendix B21) and support the construction of rate compatible code sets (cf Appendix B22) It should be emphasised that the impact of selection of one or another of the proposed FEC technique on the overall system concept is rather limited as soft-input soft-output versions of decoder algorithms exist for all investigated techniques ndash the en-decoding sub-blocks can hence be regarded as a ldquoblack boxrdquo by the rest of the system
B21 Implementation issues flexibility parallelisation throughput An important practical issue when dealing with coding schemes for adaptive radio interfaces is the flexibility in terms of block sizes and code rates One typical way of constructing good LDPCC is to first optimise the error correction performance of the code ensemble for the target code rate (eg optimise the degree distribution using EXIT chart analysis) and then generate one specific code using construction algorithms that ensure low error floors (eg the progressive edge growth algorithms) The disadvantage of this approach (for practical implementation) is that a new code needs to be designed for each block length and rate Structured LDPC codes and especially Quasi-Cyclic and Block LDPC Codes [MY05 MYK05] on the other hand have been shown to have good performance and high flexibility in terms of code rates and block sizes at the same time The general idea is to base the construction of the LDPCC on different basic elements usually shifted andor rotated versions of the identity matrix Adaptation to different block lengths is easily done by expanding elements of the basic matrix (eg by replacing each ldquo1rdquo in the parity check matrix with an identity matrix and each ldquo0rdquo with an all-zeros matrix) Different code rates are obtained by appending more elements to the matrix in only one dimension (ie add more variable nodes but no check nodes) The decoder must obviously be designed to support such changes of the code structure The inherent parallelism of LDPCC is then exploited by allocating Variable Node Units (VNU) and Check Node Units (CNU) to groups of variable and check nodes respectively for processing of the decoding algorithm The degree of parallelism is dictated by the number of elements in each unit The throughput of such a semi-parallel decoder architecture can be expressed as follows
ckcb Fz
PITPRnD sdot+
sdotsdot= (B1)
where Fck denotes the clock frequency (nbmb) are the dimensions of the base model matrix Rc is the code rate and IT is the iteration number The degree of parallelism P is bounded as 1lt=Plt=z where z is the expansion factor Note that in this architecture the total number of VNUs and CNUs is Pnb and Pmb respectively [LZ05] Current technology does not allow yet exploiting this degree of parallelism in full at reasonable cost Nevertheless the flexibility of such architectures is quite attractive from a design point of view as it allows to scale and to tune the hardware cost very easily depending on the target throughput Such semi-parallel architectures are currently being investigated throughout the whole industry (some first complexity estimates can be found in [ZZ05]) As always when dealing with LDPCC the number of iterations IT can vary between an average number required for convergence and a maximum number which represents the worst case decoding delay (and strongly influences the error-correction performance)
Duo-Binary Turbo Codes [WIND21 WIND23] differ from classical PCCC by the fact that the information bits are encoded pair wise The internal inter-leaver is based on an algorithmic permutation defined by a single equation This PCCC can hence be adjusted to any frame size by modifying only four values which parameterise the internal interleaver implying a high flexibility of this type of PCCC As the mother code rate of the Duo-Binary Turbo Code is frac12 (instead of 13 for classical PCCC) it is inherently more robust to puncturing Duo-Binary PCCC not only achieve very good performance for long block lengths but also perform well at smaller block sizes and have been standardised in DVB with block lengths as small as 128 bits The performance has also been improved at low error rates thanks to the improved internal interleaver The decoder can be designed to decode 2 information bits per clock cycle and its throughput can hence be obtained by means of the following relation
ckFITPD sdot= (B2)
The throughput is independent of the code rate as code rates higher than 05 are obtained by puncturing
WINNER D210 v10
Page 68 (180)
For the throughput analysis we consider a clock frequency Fck of 200 MHz to be achievable which corresponds to a technology of 013 microm and beyond [THB04] By tuning the degree of parallelism P and the (maximum) number of iterations IT we can match the requested decoderrsquos throughput to the system requirements Table B2 below summarises the achievable throughput exemplarily for the case of a code raet Rc=05
Table B2 Achievable throughput for rate 05 DBTC and BLDPCC (200 MHz clock frequency)
Code Parallelism level Number of iterations Bit rate (decoded Mbitss)
6 8 150
12 8 300
4 5 160
DBTC
8 5 320
2 50 (flooding schedule) 192
4 50 384
1 20 (shuffled decoding) 240
BLDPCC
2 20 480
It can thus be concluded that a parallelism level of 12 for DBTC (when using 8 internal decoder iterations) and 4 for BLDPCC (using a standard flooding schedule and corresponding to 192 VNUs and 96 CNUs) is sufficient to achieve a throughput of 300 Mbps (and beyond) We conclude that both coding candidates can offer a suitable throughput It is however known that the inherent parallelism of BLDPCC can be attractive from a designer point of view as it allows tuning whole hardwaresoftware implementation to the cost and performance constraints Although very high data rates are theoretically achievable by BLDPC decoders technology constraints still limit the degree of parallelism affordable and thus the data rates To give the full picture the respective gate count (and thus area estimation) for DBTC and BLDPCC need to be considered As these figures depend very much on the target architecture and a number of other parameters this assessment will be done in the next phase of WINNER
B22 Rate compatible code sets for HARQ-II Hybrid automatic repeat request (HARQ) schemes combine the reliability of FEC with the throughput of ARQ Especially type II HARQ schemes also denoted as incremental redundancy (IR) provide an improved throughput and have for example been successfully employed in HSDPA To construct an efficient IR scheme a set of rate-compatible (RC) codes is needed This is a sequence of nested codes providing a range of different code rates It can be constructed eg by puncturing a low rate mother code A special case of IR is chase combining where the FEC codeword is repeated and soft combining is applied to the received code bits This is equivalent to using an outer repetition code (eg by additional spreading cf [WIND23]) which can be used when the channel SNR is insufficient to support successful decoding even at the lowest (mother) code rate
For the detection of a decoding failure an error detecting code is required This can either be implemented by an additional outer cyclic redundancy check (CRC) or is already inherently included in the code itself ndash like in the case of LDPCC The length of the CRC is determined by the desired probability of an undetected error which converges asymptotically as 2-b where b is the number of the CRC parity bits (cf [3GPP-TR25212] where a maximum CRC length of 24 bits is used)
Rate compatible punctured code sets are well known for CC and PCCC [RM00] but can also be created both for DBTC and BLDPCC For the performance of punctured LDPCC it is decisive that the number of punctured variable bits connected to each check node is minimised If a check node is connected to two punctured bits there will be only zero messages in the first iteration and the information of this parity check equation is lost Therefore best results can be achieved by puncturing only degree 2 variable nodes In most LDPC construction methods the redundancy part consists (almost) only of degree 2 variables Often it has a dual diagonal form Therefore it is possible to puncture only redundancy bits Figure F8 illustrates that the performance of rate compatible punctured DBTC and BLDPCCs is quite similar We
WINNER D210 v10
Page 69 (180)
hence conclude that rate compatible punctured codes can be constructed for all FEC techniques that are currently considered for use in the WINNER system
B23 Low-density parity-check codes decoding options The standard algorithm for decoding of LDPC codes is the so-called ldquobelief propagation algorithmrdquo (BPA) of which several good approximations exist In fact it has been shown in [CF02] that close-to-optimal error correction performance can be achieved by a corrected version of the so-called Min-Sum algorithm (MSA) The basic idea of the MSA is essentially the application of the maxLog approximation to BPA decoding Similar to the case when using maxLogMAP decoding of PCCC this comes at a performance loss in the order of 05 dB (on AWGN channels cf [WIND23]) This loss can be dramatically reduced by appropriate scaling of the extrinsic messages to compensate for the over-estimation of extrinsic information (this approach has been also applied in Turbo decoding [VF00]) This corrected version of the MinSum algorithm will in the following be denoted as ldquoMin-Sumrdquo Calculating variable and check node messages during decoding then only involves simple sum and minimum operations respectively plus a scaling of the check node messages In theory the scaling factor α needs to be optimised for each code and SNR by means of Density Evolution (DE) or Monte-Carlo simulation to achieve optimal results However Monte-Carlo simulations showed that choosing α=08 as proposed in [CF02] results in very good performance independent of the SNR operation point for the BLDPCC considered for use in WINNER The ldquoMinSumrdquo algorithm is therefore considered to give the best performance-complexity trade-off for LDPC decoders
However in the case of irregular LDPCC even using the MinSum with optimal correction still not fills the gap wrt true belief propagation decoding Therefore further investigations have been carried out recently leading to new sub-optimal decoding algorithms [GBD03 JVS+03] that could be good candidates in terms of complexityperformance trade-off and memory savings Bit-Flipping Algorithms [BR04 ZF04 ZB04 KLF01 ZF04] on the other hand might be considered an option for very low-end terminals where a loss in performance might be acceptable when large savings in decoding complexity can be achieved A drawback of such approaches is the absence of reliability information at the output of the decoder However since low-end terminals will most probably not use iterative equalisation andor channel estimation techniques this appears to be no significant limitation
B24 Scheduling of the decoder The decoder for LDPCC is a message-passing algorithm operating on the Tanner graph [WIND21] which is equivalent to the structure of the parity-check matrix of the code In the standard schedule of the BPA which is often denoted as flooding schedule first all check node are updated and then all variable nodes are updated An alternative is shuffled scheduling [KF98 MB01 ZF05 YNA01 MS02] also known as layered decoding Here the BP decoder uses not only the messages from the last iteration but uses also the information of the updates from the current iteration This leads to a considerable increase in convergence speed One can discern horizontal and vertical shuffling The vertical shuffling schedule operates along the variable nodes all check nodes connected to the current variable node are updated and the current variable node is updated The horizontal schedule operates along the check nodes the current check node is updated and all the variable nodes connected this check node are also updated Simulations show that both methods increase the convergence speed roughly by a factor of two for both maximum and average number of iterations However the operation count of a single iteration of the BP decoder is increased compared to the flooding schedule In vertical shuffling each check node is updated dc times per iteration while in horizontal shuffling each variable node is updated dv times per iteration (dv and dc is the degree of the respective node) As the check node update is more complex than the variable node update horizontal scheduling should be preferred It is possible to perform group-wise shuffling ie updates are performed on a group of nodes before the nodes of the other type are updated This is especially suited for quasi-cyclic block LDPC codes as nodes within one block do not exchange messages anyway Group-wise shuffling also enables semi-parallel decoding and reduces the required memory [MS02] For the LDPCC considered in the WINNER framework investigations showed that the performance of group-wise horizontal shuffling with 20 iterations is equivalent to that of the flooding schedule with 50 iterations (consistent with the speedup factors reported in [ZF05]) In the assessment of complexityperformance trade-off (cf Appendix F2) results will be given in terms of flooding scheduling as reference point for any other comparison
WINNER D210 v10
Page 70 (180)
B3 Modulation
B31 Assessment of modulation techniques As outlined in Section 22 supporting bandwidths of up to 100 MHz and enabling the ldquoalways bestrdquo principle translates into the following main requirements for the selected modulation technique efficient equalisation of frequency selective channels high granularity and the possibility to adapt transmission parameters to different environment conditions (delay spread Doppler spread available spectrum) user requirements (data rate delay) and user terminal capabilities (maximum transmit power antenna configuration etc) Frequency domain signal processing and more specifically the generalised multi-carrier concept are very elegant means of providing the required flexibility Among the large number of modulation techniques that can be accommodated in the GMC framework (cf Section 22) the following have been assessed in more detail during WINNER Phase I different ldquoflavoursrdquo of OFDM (CP-OFDM IOTA-OFDM PRP-OFDM) MC-CDMA and FMT as well as serial modulation and IFDMA (or FDOSS) Table B3 summarises the assessment of these modulation techniques Although several transmission technologies are also related to multiple access the discussion here focuses solely on the modulation aspect The benefits and drawbacks of the main candidate technologies CP-OFDM and CP based frequency domain generated serial modulation are discussed in the following section
Table B3 Assessment of most promising modulation techniques
Serial modulation
IFDMA CP-OFDM
PRP- OFDM
MC- CDMA
FMT-FDMA12 (NBWB)
IOTA-OFDM
Required IBO
Typically 2ndash3dB lower than for multi-carrier techniques
High (6ndash9 dB[WIND22])
Tx complexity
IFFT FFT
Low IFFT (addt spreading for MC-CDMA)
Rx complexity
FFT
IFFT
FFT FFT postfix suppr
FFT addt de-spreading13
FFT FFT
Filtering complexity
Low Low14 High (poly-phase filtering)
Equalisation Issues
May require DFETEQ for higher order modulation15
acquisition delay
Spectrum flexibility
+ - + + o+ -+ +
Robustness wrt ICI
+ - - - - +- +
Required guard bandsperiods
Similar requirements (~10 for GI ~20 for guard bands under the current assumptions)
+16 +16
Maturity O O + O O O O
12 The specific merits of FMT-FDMA depend very much on the modulation format chosen within the sub-bands 13 May also require multi-user detection in environments where the delay spread is large 14 It is possible to run multi-carrier based transmission without any additional filtering resulting in substantial
spectral side-lobes Additional filtering is often required to meet spectral mask requirements 15 Noise enhancement in linear (MMSE) FDE may cause error floors for higher order modulation (16QAM) when
using high code rates [WIND23] the issue can be overcome by using decision feedbackTurbo equalisation 16 Cyclic prefix can be omitted However additional pilots would then be required to achieve coarse synchronisation
WINNER D210 v10
Page 71 (180)
Interleaved Frequency Division Multiple Access (IFDMA) [WIND23 Section 5214] can be interpreted both as a serial modulation (FDOSS) [WIND21 Section 415][ChC00 DFL+04] and a multi carrier modulation scheme [GRC02] thus combining many of the advantages of the two approaches As a special case of frequency domain based serial modulation (using interleaved assignment of subcarriers) it enables the same high frequency diversity and low peak to average power ratio It also facilitates low complexity signal generation [FCS04] and user separation (as for OFDMA) On the other hand IFDMA and OFDMA exhibit a similar sensitivity to frequency offsets
Multi-Carrier Code Division Multiple Access (MC-CDMA) has been considered extensively in [WIND21 Section 45][WIND23 Section 5213][WIND26] Since it provides high frequency diversity and good granularity also for low data rate transmission MC-CDMA is proposed for the use with frequency non-adaptive transmission Detection complexity will be low when using MC-CDMA only within one chunk (ie under time and frequency non-selective fading) Complexity can however become an issue in environments with high delay spreads (high frequency diversity) and in conjunction with spatial processing Low-complexity techniques such as Pre-Detection SUD have been proposed together with linear (ZF MMSE) and non-linear multi-user detection that achieve good performance at the cost of higher receiver complexity
IOTA-OFDM [WIND21 Section 412][WIND23 Section 5212] [LGA01][JDL+04] and Filtered Multi Tone (FMT) [WIND21 Section 411][CFO+03][CEO02] modulation use prototype functionsfilters to guarantee good localisation of the subcarrier spectra in the frequency (and time) domain Thus high robustness to inter-carrier interference (eg arising due to time and frequency errors as well as to Doppler effects) is achieved without requiring the insertion of a cyclic prefix ndash leading to a higher spectral efficiency However the cyclic prefix is used in WINNER to achieve coarse synchronisation and the introduced overhead is below 10 for both the TDD and the FDD mode When using IOTA-OFDM or FMT an overhead would have to be invested for synchronisation pilots ndash thus reducing the potential gains in spectral efficiency
Wideband FMT with high subcarrier spacing (and hence frequency selective fading per sub-channel) is a valid alternative to traditional (time domain based) single carrier transmission over the whole bandwidth allowing a higher flexibility and granularity in the usage of the broadband channel The same (or higher) flexibility can be achieved by using frequency domain based serial modulation ndash wideband FMT is a special case of this scheme with block subcarrier assignment and a specific type of filtering
Using a Pseudo Random Postfix (PRP) as guard interval [WIND21 Section 46ndash410] [WIND23 Section 5211][MDC+04 MBL+05][MCD05] provides means to estimate andor track the channel impulse response without adding any overhead in terms of learning symbols andor pilot tones ndash allowing for increased spectral efficiency However in order to achieve a high precision (low MSE) of the channel estimates a delay of several OFDM symbols in the radio interface may have to be accepted This is especially the case for higher order modulation with high requirements on the channel estimation (cf results in Appendix F35) Moreover the scheme is less applicable for uplink scenarios where postfixes of different users superimpose at the base station Since low delay is a very important requirement for the WINNER radio interface and the overhead required for a scattered pilot grid is quite low (cf Appendix B42) this solution has been selected for channel estimation and tracking in WINNER instead
To summarise CP-OFDM is the preferred solution for the downlink (and the uplink when terminal power consumption is not an issue) as the spectral efficiency gains from using other techniques are currently considered not to justify the increase in implementation complexity (eg poly-phase filtering) andor delay (for the case of PRP-OFDM) Frequency domain based serial modulation is preferred for uplink transmission due to its low PAPR and as it enables to flexibly switch between interleaved (IFDMA) and block subcarrier assignment (wideband FMT) according to need
B32 OFDM vs single carrier Serial and parallel modulations have generally similar BER performance on frequency-selective channels when used with coding and other enhancements like iterative detection or adaptive loading Note however that linear FDE receivers become limited by noise enhancement at high SNR OFDM systems therefore yield better performance than serially modulated systems when considering transmission with higher order modulation and only linear equalisers OFDM has been (and is) in use in a number of wireless communications standards (eg IEEE 80211 and DVB systems) The main advantage of this technique is its implementation simplicity at least from a baseband perspective very low complexity equalisation algorithms are available and channel estimation and tracking is straightforward and of low arithmetical complexity if pilotlearning symbols based approaches (or derivates) are applied
Concerning the trade-offs between OFDM and serial modulation the main issues are the following ones
WINNER D210 v10
Page 72 (180)
i) the OFDM time domain signal is characterised by an inherent high peak-to-average-power ratio (PAPR) which is challenging for the RF implementation of HPAs (high power amplifiers) [FK05 WIND22 WIND23] The power backoff required by OFDM or other multi-carrier modulation approaches is typically 2 to 3 dB higher than for serial modulation even when PAPR-reduction methods are applied (for both systems cf [WIND23]) Serial modulation thus allows the use of cheaper power amplifiers Furthermore if a serial modulation system and a parallel system are required to use the same type of HPA and have the same maximum spectrum sidelobe levels the parallel systemrsquos average allowed transmit power will be lower resulting in lower received power and correspondingly higher bit error rate and lower coverage [WIND23] This constitutes the main motivation for the use of serial modulation in the uplink where terminal battery duration terminal cost and coverage are critical issues Furthermore generation of serial modulation by the generalised multi-carrier approach is equivalent to generation of OFDM or OFDMA that has been precoded by a FFT operation Thus serial (single carrier) modulation itself can be considered as just a form of OFDM to which a very effective PAPR reduction method has been applied
ii) OFDM is sensitive to time and frequency synchronisation offsets However efficient algorithms (of relatively low computational complexity) are available which assure a sufficiently precise synchronisation in both time and frequency From a practical point of view synchronisation issues are not a main limiting factor of OFDM
iii) OFDM is in general sensitive to higher levels of inter-carrier-interference (ICI) (resulting eg from high Doppler environments phase noise frequency offset etc) which lead to a degradation of the system performance A suitable design of the OFDM parameters (in particular the subcarrier spacing) is required in order to avoid this problem Assuming reasonable design parameters OFDM is also applicable to high mobility scenarios Phase noise on the other hand can be a limiting factor especially when high carrier frequencies andor low cost implementations are targeted Serial modulation is less sensitive to such self-interference effects [WIND23]
B33 Guard interval design The main purpose of the guard interval is obviously to limit inter-symbol-interference (ISI) for all block transmission based GMC schemes [WIND23] Therefore the amount of signal energy contained in the channel taps that exceed the guard interval length (resulting from a long channel impulse response potential inter-cell interference time synchronisation errors and filter impulse responses) should be low enough to avoid error floors in the transmission (ie be some dB below the thermalADC noise floor) There are efficient methods to minimise the ICI (eg timing-advanced transmission in up-link) which can be used to considerably reduce the guard interval length and thus increase spectral efficiency The guard interval length is often chosen to be a fraction 12n of the raw symbol length although this is not strictly necessary from the implementation perspective It should however be an integer multiple of the sampling interval [WIND23] Additionally to avoiding ISI the cyclic prefix in CP-OFDM turns the linear convolution into a set of parallel attenuations in the discrete frequency domain thus enabling simple single tap equalisation and contributing significantly to the receiver simplicity of OFDM systems
B34 Modulation alphabets and bit mapping Non-differential M-PSK and M-QAM modulation will be used in the WINNER system as channel state information can be made available to the receiver at relatively low pilot overhead in all scenarios (cf Sections 23 and B4) For the wide-area scenario modulation formats up to 64-QAM are proposed while for short-range transmission even 256-QAM appears to be feasible
As a baseline case Gray mapping is assumed It provides the highest amount of mutual information when no a-priori knowledge is available however it shows little gain when additional a-priori knowledge becomes available Since decoder and detectorchannel estimator EXIT transfer curves must be matched in order to achieve good performance it should evidently be used with a strong outer code mostly in non-iterative setups Note that the use of Gray mapping facilitates the calculation of soft output at the detector at low complexity if the standard maxLog approximation is used The selection of other mappings is useful in with the context of iterative equalisationchannel estimation mostly in conjunction with a weaker outer code Ideally the mapping and the channel encoder should be chosen jointly in order to maximise the gain achieved after several iterations In practice rapid changes of the propagation environment may render this optimisation unfeasible A robust solution shall then be preferred at the price of a loss of optimality Optimised bit labellings (used with a low memory CC) in Appendix F in the context of iterative channel estimation
WINNER D210 v10
Page 73 (180)
B4 Pilot design for channel estimation and synchronisation
B41 Intra- and inter-cell synchronisation using dedicated training symbols A synchronisation approach is proposed that enables both intra- and inter-cell synchronisation in a self-organised way without relying on any external reference eg GPS The approach assumes a cellular OFDM network where the terminals in every cell BSs or UTs are allowed to receive and transmit over the whole system frequency band at the same time during synchronisation
The approach proposed in this section is based on the acquisition of the coarse intra-cell time synchronisation by means of a DL synchronisation pilot referred to as T-pilot The T-pilot is sent in DL by all BSs inside the network at the beginning of each super-frame It is proposed to build the T-pilot for each cell as a specific Gold code This pilot structure has been proved to be robust against both inter-cell interference and multi-path fading [CSB05] However the correlation of T-pilots is sensitive to carrier frequency offsets as shown in Appendix F41
In order to improve the achieved accuracy the DL T-pilot is followed by at least two F-pilots that is two OFDM symbols The frequency and time offsets can be estimated simultaneously in the frequency domain (post FFT) as the phase rotation between two adjacent OFDM symbols on the same subcarrier in the same OFDM symbol and as the phase difference between two adjacent subcarriers respectively The phase rotation method requires the time and frequency offsets to be within one half of the OFDM symbol period and within one half of the subcarrier spacing respectively This condition is assumed to have been guaranteed at the beginning of the fine synchronisation by the initial coarse synchronisation
In order to achieve inter-cell synchronisation two methods can be considered which are described in the following
The first referred to as DL-UL synchronisation assumes that all UTs within a certain cell which have become mutually synchronised during the DL phase transmit UL sync signals which are in turn received and analysed by all BSs within range A synchronisation signal structure was proposed in [WIND23] that can be used in UL for the inter-cell synchronisation as well as alternative to the one described above for the DL fine intra-cell synchronisation This signal consists of three adjacent OFDM symbols during which each BS in DL transmits only on a single pair of adjacent subcarriers with the maximum power as described in [WIND21] Section 954 The DL-UL method has been shown to provide very high accuracy in [WIND23] for both intra- and inter-cell synchronisation More precisely in 20 super-frames both frequency and time synchronisation between all BSs within the cellular network can be achieved with remaining frequency offset of about 1 of the subcarrier spacing and time offset of about 10 of the guard interval respectively
According to the second method referred to as DL-only the inter-cell synchronisation is obtained without relying on UL sync signals Each UT continues to listen to the sync signals sent in DL by all other BSs measures itself the relative time and frequency offsets with respect to its own BS and feed back this information to its own BS Each BS adjusts then its clock and its oscillator according to the offset measurements signalled by the UTs within its cell An advantage of this method is that it can rely also on UTs in sleep mode since it does not require continual transmission of pilots on the UL but only the occasional feedback signalling Also for the DL-only method a very accurate convergence of the inter-cell synchronisation can be achieved under the assumption of ideal UL feedback Performance is similar to that of the DL-UL method reported in [WIND23] A proper design of such feedback signalling and the comparison of the involved overhead with respect to the DL-UL method described above should be subject of further investigation
Since the DL only synchronisation uses relative measurements the influence of the propagation delay might become smaller One additional advantage of the DL only synchronisation is that it relies on DL pilots There is an additional degree of flexibility adjacent BSs can also receive this pilots it they are able to receive DL signals and do not transmit during the pilot OFDM symbol Without changing the pilot structure the system is able to switch dynamically between UT-aided synchronisation and synchronisation based on measurements at the BS BS based synchronisation is useful in some deployment scenarios when the B2B link will give better receive signal level than the receive level at the UT (eg LOS conditions between BS) This flexibility can be conveniently exploited in TDD systems while the complexity would increase in FDD since the BS has to be able to receive DL signals Therefore it is suggested as an option in the system concept
WINNER D210 v10
Page 74 (180)
For the above described inter-cell synchronisation schemes there exists a drift of the achieved common time offset due to the propagation delay In the following a differentiated timing adaptation is proposed which can completely avoid the timing drift of stations
The idea of this method has been first proposed in [ER01] and [WER03] The systematic timing drift results from the fact that with each acquired time offset not only the actual difference of the node timings is acquired but also the distance-dependant propagation delay
In contrast to other timing adaptation methods the differentiated method only initiates a timing adaptation if a negative time offset is acquired If a positive observed time offset is acquired no timing adaptation is initiated except the case that the positive time offset is over a threshold which causes loss of synchronisation Since a positive time offset at a first station corresponds to a negative time offset at a second station the time offset will be compensated by the second station
Estimation of the propagation delays in intra-cell synchronisation Especially in the wide-area scenario large propagation delays may be observed A time-aligned arrival of signals from different UTs which is required for a joint spatio-temporal processing at the BS can be enabled if the UTs estimate their propagation delays during a so called lsquoranging processrsquo and use this information afterwards to transmit their data alligned to a common timing reference
The proposed ranging process requires two different pilot signals (T- and F-pilots) and consists of three phases an initial downlink phase a succeeding uplink phase and another final downlink phase depicted in Figure B1 where one BS and two UTs are considered The letters r and t denote the reception and the transmission status of each communication device The process is described as follows Initially the BS transmits a beacon signal which enables the UTs to perform a coarse synchronisation For this beacon signal a signal like the T-pilot introduced within the proposal above may be employed After the reception of the beacon signal each UT transmits its individual pilot which consists of a single frequency tone selected from a predefined set of equally spaced tones Each UT uses a different pilot tone At the BS the single user pilots are separated by filtering the received signal in he time domain
After a specific user pilot has been detected it is immediately retransmitted by the BS This retransmitted pilot then is detected at the dedicated UT in the same way as it is done at the BS From the temporal difference between the transmission of the UTrsquos pilot and the reception of its retransmission the UT may deduce the propagation delay
Within the simulations at an SNR of 0 dB hardly any values lying outside the range of the CIR length occurred hence the ranging process can be regarded as being robust and reliable
Figure B1 Detailed scheme of the ranging process
If the UTs retransmit their individual synchronisation tones (F-pilots) in advance by the estimated propagation delay after the ranging process has been finished a fine estimation of the carrier frequency offset may be carried out at the BS The single synchronisation tones which arrive aligned in time at the
WINNER D210 v10
Page 75 (180)
BS now are again separated by applying the filtering process from above and by averaging the slope of the phase of each separated tone information on each userrsquos carrier frequency offset may be obtained
B42 Pilot grid for generalised multi-carrier (GMC) Channel estimation by interpolation in time and frequency is considered to be an efficient solution for an OFDM-based radio interface [WIND21 WIND23] Generally a scattered pilot grid can be implemented for any GMC signal in the frequency domain on both the downlink and the uplink While blind channel estimation schemes require little or no pilot overhead their application may critically depends on the assumptions on the chosen transmission scheme With a large variety of adaptive algorithms in time frequency and space to choose from the flexibility of the WINNER radio interface might be severely compromised by exclusively relying on blind schemes Moreover as the pilot overhead of the considered pilot aided techniques is in the range of 2 to 5 per spatial stream the potential benefit of blind channel estimation techniques is limited On the other hand for highly dispersive channels andor high-end terminals blind or semi-blind schemes might provide a performance improvement and could therefore be considered as optional enhancements
In the following a generic framework for the pilot design of GMC signals is described Two types of frequency domain pilots and one type of time domain pilots are options the frequency expanding technique (FET) and Frequency domain superimposed pilots (FDSP) FET preserves and rearranges data-carrying subcarriers to accommodate pilots while FDSP obliterates data-carrying subcarriers where pilots are to be inserted Applied to OFDM FET is equivalent to a scattered pilot grid where data symbols are inserted at subcarriers where no pilots are present FDSP on the other hand can be viewed as a puncturing of the data symbols So data symbols are inserted on all subcarriers and subsequently pilots are superimposed This effectively results in an increased code rate
Frequency domain pilots for the WINNER radio interface Pilots are used for implementing certain physical layer support functions eg connection setup synchronisation mobility support power control CQI measurements and most importantly channel esti-mation Two types of channel estimation must be distinguished channel estimation for data reception (where the pilots are send at the same time) and channel estimation for adaptive transmit processing based on return link feedback or measurements (where an additional extrapolationprediction in time is required see also Appendix B52) In order to realise an efficient system the same pilots should be reused for different support functions Spatial processing however limits the potential reuse of pilots and brings along additional requirements [WIND27] In particular we need to distinguish
bull Dedicated pilots may be required if user-specific transmit processing (ie a user-specific adaptation of amplitude and phase) is applied to the data symbols These pilots are subject to the same transmit processing as the data symbols and therefore allow the receiver to estimate the effective channel HU sdot fU of user U The use of dedicated pilots for other purposes like CQI measurements is limited since they contain a power allocation specific (in most of the cases) to another user In time the interpolation is constrained by TDMA ie to the chunk duration in adaptive downlink transmission Regarding the interpolation in frequency two different types of dedicated pilots can be distinguished
o Full-band dedicated pilots having identical weights for all chunks in frequency dimension dedicated to a particular user Therefore interpolation over these chunks is possible
o Chunk-specific dedicated pilots where different weights are applied to each chunk and no interpolation in frequency domain is possible This is usually the case for user-specific transmit processing based on short-term CSI and or in case FDMA on chunk basis is used
bull Common pilots have the property not to include user-specific transmit processing and thus the interpolation in frequency is restricted by the specific channel estimation algorithm (ie related to the estimator complexity) and not by chunk specific constraints In case of user-specific transmit processing the amplitude and phase of common pilot deviates from those of the data symbols and therefore the receiver cannot detect those based on common pilots Different variants of common pilots exist eg
o A common pilot per cellsector which is transmitted omnidirectionally (ie not subject to beamforming) and normally used to support mobility-related functions It allows obtaining an unweighted channel coefficient h
WINNER D210 v10
Page 76 (180)
o Common pilots per antenna are used to obtain the unweighted channel matrix H which describes the propagation channel between any combination of transmit and receive antennas in the MIMO case
o Common pilots per beam are useful to estimate the effective channel (including the beamforming weights) and perform CQI measurements for the associated beam for fixed beamforming approaches Note that measurements on such pilots in neighbouring beams could then be used for beam handover Also the common pilots per beam benefit from the beamforming gain which reduces the transmit power required for a target channel estimation error and coverage area
Due to the fact that common pilots can be used by several users they are appealing for the downlink processing since the overall energy to perform the associated functions has only to be spent once and the pilot symbols can be spread over all resources Also they provide a basis for un-biased CQI measure-ments However certain user-specific spatial processing techniques require dedicated pilots
Multi-user precoding techniques are assumed to impose the most stringent requirement on channel estimation since high accuracy prediction of the downlink channel need to be obtained based on uplink measurements A performance degradation of 2 dB due to imperfect channel estimation requires a pilot SINR of 20 dB and channel estimator gains between 13 dB and 17 dB [WIND27] In Appendix F33 results for the channel estimator gains of the WINNER pilot specifications are presented It is shown that with pilot aided techniques the required gains of 13 to 17 dB can only be achieved with sophisticated post-processing for instance by an iterative channel estimation scheme
A careful radio interface design must balance the number of users that can be scheduled in the downlink with the number of users that can be estimated based on the uplink pilots in the TDD PLM The competition bands and the activesemi-active flow states that are discussed in Appendix C1 are tools for performing this trade-off Simulations for the linear precoding technique (SMMSE) have shown that in order to obtain sufficient SDMA and spatial multiplexing gain around 9 orthogonal pilots17 would be required per competition band
Since the requirements regarding pilot type number of pilots and pilot SNR are varying considerably a modular and scalable MIMO-pilot design should be adopted For example a combination of common pilots and additional dedicated pilots per chunk according to the requirements of the spatial processing scheme is conceivable
Common pilot symbolsDedicated pilot symbols
5 O
FDM
sym
bols
12 OFD
M sym
bols
TDD mode FDD mode
Additional pilots for non-adaptive transmissionPilots for 2nd spatial layerWith 2 spatial
layers
Df = 8
Df = 4
16 subcarriers8 subcarriers
Dt = 11
Common pilot symbolsDedicated pilot symbols
5 O
FDM
sym
bols
12 OFD
M sym
bols
TDD mode FDD mode
Additional pilots for non-adaptive transmissionPilots for 2nd spatial layerWith 2 spatial
layers
Df = 8
Df = 4
16 subcarriers8 subcarriers
Dt = 11
Figure B6 Frequency domain pilot grids for GMC signals
17 Corresponding to an average of 34 users according to the assumed user population (20 with 1 antenna 40 with
2 antenna and 40 with 4 antenna
WINNER D210 v10
Page 77 (180)
Figure B6 shows the pilot grid arrangement for the WINNER TDD and FDD modes The placement of pilot symbol within a chunk is based on the following rules (based on the framework from [WIND21 WIND23])
bull For common pilots a reasonable over-sampling factor in frequency direction would be 20mdash100 On the other hand the chunk dimension also imposes constraints on the pilot spacing To this end a constant number of common pilots per chunk is desirable For the TDD and FDD modes this translates to a pilot spacing of Df=8 and Df=4 respectively
bull For dedicated pilots the over-sampling factor should be at least 100 which also results in a pilot spacing of Df=8 and Df=4 for the TDD and FDD modes respectively
bull For channel estimation in time direction the number of available pilots is limited by the fact that half duplex FDD or TDD a mobile terminal is not able to transmit and receive at the same time Therefore the same guidelines for common and dedicated pilots apply
o For adaptive transmission the mobility of UTs must follow certain constraints which gives upper bounds on the maximum Doppler frequency This results in a total of 2 and 4 pilots per chunk for the TDD and FDD modes
o For non-frequency-adaptive transmission in the FDD mode two additional pilots are inserted in time direction to support mobile velocities up to 250 kmh totalling to 6 pilots per chunk For the TDD mode no additional pilots are necessary if at least 2 chunks per frame are used
In order to be able to estimate the channel from different antennas orthogonal pilots are required and the following principle design guidelines are possible
bull transmit pilots in frequency-multiplex (different subcarriers of one chunk) as indicated in Figure B6
bull transmit pilots in time-multiplex (consecutively on one subcarrier)
Additional code multiplexing of pilots in time as well as frequency multiplex is possible In existing MIMO-OFDM real-time test-beds code-multiplexing using Hadamard sequences on consecutive pilot symbols of one subcarrier has been extensively used and verified [MKK+05 JFH+05 JHF04] A similar design has also been proposed for fixed grid of beam techniques in WINNER (see Section 3222 of [WIND27] There each antenna is identified by an orthogonal sequence reused on all pilot subcarriers but additionally scrambled in the frequency domain Such overlapping pilot-based techniques have also been studied for adaptive uplink transmission see Appendix B52 and [WIND24] Section 311 Advantages are that the power on pilot carriers is not enhanced compared to the power of data ie the transmit spectrum is flat Moreover the reconstructed pilots can be reused for the carrier phase tracking at the receiver if the sequence is additionally stretched along the time direction over the chunk The pilot overheads of the pilot arrangements in Figure B6 per spatial stream per chunk are summarised in Table B4 The pilot overhead is defined as the ratio of the number of pilot symbols per chunk Npilot to the number of data symbols per chunk Ndata The chunk sizes are 96 and 80 symbols for the FDD and TDD modes
Table B4 Pilot symbol overheads per spatial stream per chunk
FDD mode TDD mode Tx mode
Pilots data
Non adaptive Adaptive Non adaptive Adaptive
pilots per chunk 6 4 2 2
Pilot overhead NpilotsNdata 75 5 25 25
The pro and cons of the pilot design principles in the WINNER framework are for further study This is particularly true for the various proposed MIMO schemes The assessment of channel estimation schemes for uplink single carrier signals is studied in Appendix F31 The performance of OFDM channel estimation schemes for common and dedicated pilots using the pilot grids in Figure B6 is evaluated in Appendix F32
WINNER D210 v10
Page 78 (180)
B5 Adaptive transmission
B51 Bit and power loading algorithms If channel quality information is available on each subcarrier (or chunk) is it possible to increase the performance of the radio link andor save power by performing bit andor power loading for each subcarrier (chunk) This single-user link adaptation can be used as an element in the solution of the complete multi-user adaptation and scheduling problem There are many different algorithms that realise so called water-filling concept in a multi-carrier transmission Most of them originate from the asymmetric digital subscriber line (ADSL) technology
Depending on their application existing bit and power loading algorithms can be divided into two groups
1 Algorithms that maximise the number of transmitted bits with a given total power and required BER constraints (variable bit rate)
2 Algorithms that minimise the BER with a given throughput and transmitted power constraints (fixed bit rate)
For most algorithms the average computational complexity of the analysed algorithms is proportional to O(N log(N)) where N represents the number of subcarriers (or chunks) being adaptively loaded The assessment presented in [WIND24] focused mainly on the Hughes-Hartogs (HH) algorithm [Hug91 Bin90] However from the complexity point of view this algorithm seems to be unsuitable for practical implementations (see Appendix B511) The complexity of Campellorsquos implementation [Cam98][Cam99] on the other hand is proportional only to O(N) Therefore this algorithm might be considered as a favourite one from the complexity point of view In practice however also other algorithms are much faster than the HH algorithm eg the one by Chow Cioffi and Bingham [CCB95] or the Fischer and Huber [FH96] algorithm The computational complexity may depend on the application and the channel transfer function as well Note that of the discussed algorithms only the Hughes-Hartogs and the Campello algorithm are optimum in the data rate maximisation sense For additional details please see the following discussion on complexity and implementation issues and the details given in Appendix F5
B511 Hughes-Hartogs optimum algorithm
The Hughes-Hartogs bit and power loading algorithm is a part of the ADSL modem US patent [Hug91] A detailed description of the steps of the algorithm is included in [WIND24] in the form described in [Bin90] The HH algorithm does not realise the water-pouring principle in its classical sense but it is an optimum solution for a multi-carrier transmission using QAM constellations and symbol-by-symbol detection since it spends the transmitted power in the most effective way However this procedure has high computational requirements because an extensive sorting and searching has to be performed in each step of the loop Since the average running time of the algorithm is proportional to the product of the total number of loaded bits loaded (fractional bits for coded transmission) and the number of subcarriers (chunks) it seems to be unsuitable to be implemented in systems with high data rates high granularity and a high number of subcarriers (chunks) to be adapted
B512 Chow Cioffi and Bingham algorithm This algorithm proposed by Chow Cioffi and Bingham in [CCB95] offers significant implementation advantages over the previously mentioned Hughes-Hartogs algorithm whilst the performance degradation is negligible as compared to the optimal solution Although this algorithm might be slightly sub-optimal it converges much faster as compared to the HH algorithm This is due to a limited number of internal iterations needed The authors have found that 10 iterations are sufficient to ensure the convergence of the algorithm The worst case running time of this procedure is proportional to
)2( cc NNMaxItersO +sdot (B3)
where MaxIters is the maximum number of iterations and Nc is the number of subcarriers (chunks) This figure is much lower than the average running time of the HH algorithm (see Appendix B511) Moreover the worst case running time of the CCB algorithm does not depend on the granularity of loaded bits so it is suitable for a joint code and modulation adaptation
WINNER D210 v10
Page 79 (180)
B513 Fischer and Huber algorithm
In this algorithm presented in [FH96] the data rate and power are assigned to each subcarrier to minimise the error probability The Fisher and Huber algorithm has a very low complexity even lower than that of the Chow Cioffi and Bingham algorithm According to what the authors claim the achievable performance is higher or at least comparable to the performance of the CCB algorithm However in the WINNER system case this seems to be a bit too optimistic assumption (see Appendix F5) One of the advantages of the algorithm from the implementation point of view is that the logarithms of the subcariersrsquo (chunksrsquo) noise variances are calculated only once in the beginning and stored in a memory In the main loop only additions and one division by an integer have to be performed for each subcarrier (chunk)
B514 Chunk-based single-user link adaptation in the adaptive resource scheduling framework
Adaptive transmission and scheduling in the WINNER AI concept is assumed to take place within the framework outlined in Appendix C16 For each chunk (layer) each candidate user terminal predicts the channel quality (SINR) Modulation levels inner code rates (typically using convolutional coding) and possibly power adjustments together comprise the link adaptation They are pre-computed for all chunks and all candidate flowsuser terminals This adjustment should take not only the predicted channel gain into account but also its accuracy That problem can be solved by averaging over the pdf of the power prediction error when adjusting the rate limits [FSE+04] [SF04] and Section 22 of [WIND24] Furthermore the interference level must be predicted Interference prediction remains a major research problem for WINNER II and it involves both the SDMA interference within the cell and the interference from other cells and operators
The link adaptation will in general work together with an outer code (turbo or LDPC)An appropriate criterion for the link adaptation would then be to target a constant SINR per bit This would essentially convert the fading channel into something closer to an AWGN channel as seen from the outer code
The pre-calculated chunk capacities (bits per payload symbol) that result from the link adaptation for each chunk layer and each flow form one set of inputs to the adaptive resource scheduler The scheduler uses them together with information on the queue levels and the flow priorities to allocate the next slot
B52 Channel quality prediction for adaptive transmission Adaptive transmission always involves a closed feedback loop and thus incurs a delay The allocation decision will be based on outdated channel quality information While most WINNER terminals are expected to be stationary or slowly moving this will create a problem for faster moving terminals It would be advantageous with a scheme that allows the vast majority of WINNER terminals including many of those moving at vehicular velocities to utilise adaptive transmission The situation can be improved markedly by introducing a channel predictor In [WIND24] it is shown that this enables prediction of the channel power at sufficient quality over time delays consistent with realisable feedback loops at vehicular velocities and 5 GHz carrier frequencies Adaptive transmission at vehicular velocities would not be possible if the present channel state is just extrapolated A special problem is prediction in the uplink Since several terminals will then be in competition for the whole or a part of the bandwidth they have to send pilots over the whole of this band The overhead due to these pilots would increase proportionally with the number of active terminals To prevent this overhead from becoming too large a simultaneous transmission of the pilots overlapping pilots is preferred This technique requires the terminals to be sufficiently well synchronised in time and frequency It also requires estimation of a multiple-input single-output channel based on these overlapping pilots Orthogonal symbol sequences would be used as pilots spread out over different frequencies in several chunks It should be noted that after propagation through different frequency-selective channels the received signals would no longer be orthogonal
Channel prediction can be performed in the time-domain for the impulse response [Ekm02] [SEA01] or in the frequency domain for the channel gains In [WIND24] frequency domain prediction is investi-gated It utilises the correlation between neighbouring subcarriers and the time-domain correlation between subsequent OFDM symbols in a state space model [SA03] Control symbols are used in the decision directed mode for improving the estimates Figure B7 below shows the results expressed in normalised prediction error MSE as a function of the SNR and the prediction horizon scaled in wavelengths The result is for downlink predictions for the FDD mode in cellular deployment assuming a full duplex FDD terminal that listens continuously on the downlink pilots The Urban Macro channel model has been used Note the large dependence of the performance on the SINR
WINNER D210 v10
Page 80 (180)
Figure B7 FDD downlink prediction accuracy in terms of the normalised channel prediction MSE as a function of the prediction horizon scaled in carrier wavelengths and the SNR Results for FDD
downlink over Urban Macro channels using a Kalman algorithm that utilises 8 subcarriers
Adaptive transmission tofrom a terminal will be feasible up to a maximal velocity for a given SINR or equivalently down to a limiting SINR at a given velocity For combinations of velocities and SINRs beyond such a boundary non-frequency-adaptive transmission must be used In [WIND24] a preliminary finding is that the normalised prediction error level 015 indicates the location of this boundary rather well when using adaptive convolutional coding combined with BPSK or M-QAM Based on this one may calculate the approximate SNR boundaries for different velocities different predictor designs and different designs of the adaptation feedback loops The results in Figure B7 are for the adaptation loop designs presented in Section 31 of [WIND24] For the FDD mode it is based on downlink channel prediction 25 slots ahead at the terminals In uplinks channel prediction is based on overlapping pilots at the base station For the short-range TDD modes the prediction is assumed to be performed by the user terminals (A scheme that moves the predictor to the base station is of course also possible) The required prediction horizons to the far end of the predicted chunk scaled in the carrier wavelength λc at 5 GHz are also shown in Table B5 For further results please see Section 31 of [WIND24] or [SFS+05]
Table B5 SINR limits for cases where the accuracy limit 150~2 =σ allows the use of adaptive transmission exemplified for three terminal velocities for a 5 GHz carrier frequency Also shown
are required prediction horizons in carrier wavelengths From [WIND24] Table 32
30 kmh 50 kmh 70 kmh
TDD downlink (prediction horizon 2 slots) lt 0 dB (0094 λc) 5 dB (0156 λc) 10 dB (0219 λc)
TDD uplink (prediction horizon 3 slots) 5 dB (0150 λc) 15 dB (025 λc) gt 25 dB (035 λc)
FDD downlink (Figure B7) lt 0 dB (0117 λc) 6 dB (0195 λc) 125 dB (0273 λc)
FDD uplink 2 users in competition band 0 dB (0117 λc) 7 dB (0195 λc) 15 dB (0273 λc)
FDD uplink 8 users in competition band 35 dB (0117 λc) 11 dB (0195 λc) 20 dB (0273 λc)
In these examples adaptive transmission can be expected to work in the widest variety of situations in the proposed wide-area FDD downlinks and short-range TDD downlinks while it works in the narrowest range of circumstances in the proposed short-range TDD uplink that requires the longest prediction hori-
WINNER D210 v10
Page 81 (180)
zon The case of wide-area FDD uplinks using overlapping pilots falls somewhere in-between The performance deteriorates with the number of simultaneous users that transmit overlapping pilots but this deterioration is not severe
B53 Compression of channel state feedback for adaptive transmission This section contains a brief summary of results from Section 314 in [WIND24] and and additional results on multi-antenna systems Assume that one or several clients within a terminal are in competition for a sub-bandwidth of the total band comprising N chunks (one-antenna SISO transmission is assumed here) K active terminals compete for this competition band Assume that each terminal feeds back a proposed code and modulation rate for each chunk For a scheme with r rates each terminal then needs to feed back N log2(r) bits per chunk duration Tchunk For K users the required total feedback data rate is then
chunkf TrKNR )(log2= [bits]
For a 40 MHz FDD downlink with N = 104 chunks and with r = 8 code and modulation rates we would have a feedback overhead of 925 kbits per active user Expressed in another way for each chunk for which K downlink users compete K log2(r) feedback bits would have to be transmitted in the following uplink chunk The FDD mode chunks of Appendix C3 contain 96 symbols With around 80 non-pilot symbols per uplink chunk K = 8 active terminals with r = 8 would consume 2480 = 30 of the uplink bandwidth for control signalling if one feedback bitfeedback symbol can be used on average The situation described here is clearly unacceptable Fortunately there are several ways in which the required feedback rate can be reduced significantly
The channel gains and SNRs at adjacent chunks will be highly correlated (If they were not the chunk widths would have been selected too wide and we would have severe problems with channel variability within the chunks) This correlation can be utilised to reduce the feedback rate The channels are also correlated in time Furthermore it is likely that in most cells except those situated close to major roads the large majority of terminals will not travel at vehicular speeds but rather be stationary For those terminals very little feedback is required
In Section 314 of [WIND24] several principles for compression are introduces and evaluated Lossless compression of the modulation-coding rates could for the considered ITU Vehicular A and Pedestrian A channels be performed at rates close to 091 bitschunk and 035 bitschunks respectively
Significantly lower feedback rates can be attained by using lossy compression of the SINR This method provides the added benefits that SINR-values not only suggested rates are fed back This enables the scheduler to select intelligently among users who would have suggested the same rates for a given chunk The net effect is that lossy compression of SINR values is superior to lossless compression of suggested modulation-coding rates It enables us to attain both lower feedback data rates and a higher performance in terms of the attained spectral efficiency when performing multi-user scheduling The suggested coder uses transform coding (discrete cosine transform DCT) to compress the SINR data in the frequency direction It combines this with sub-sampling in the time direction to obtain a further compression due to the temporal correlation Motivations for these design choices are discussed in [WIND24] The resulting algorithm is summarised by Figure B8 and Figure B9 below
FFTRx
Cal
cula
tech
unk
SN
R
DC
T
Sca
lar
Qua
ntiz
ers
104 104 104
Sub
-sa
mpl
ing
Tx feedback
FFTRx
Cal
cula
tech
unk
SN
R
DC
T
Sca
lar
Qua
ntiz
ers
104 104 104
Sub
-sa
mpl
ing
Tx feedback
Figure B8 A block diagram of feedback handling in the terminal
Q-1
Receivedfeedback
Ups
ampl
ing
IDC
T
104 104104
ChunkSNR
Sche
dulin
g
Q-1
Receivedfeedback
Ups
ampl
ing
IDC
T
104 104104
ChunkSNR
Sche
dulin
g
Figure B9 Block diagram of feedback handling at the base station
WINNER D210 v10
Page 82 (180)
With the discussed compression of SINR predictions only 025 bitschunk are required for the Vehicular A channels and 012 bitschunk for the Pedestrian A channels when all users travel at 50 kmh and the modulation-coding scheme uses r = 8 rates If the mobile speed is reduced it will be possible to further sub-sample the coded feedback information For example at 5 kmh it would be possible to reduce the feedback information further by a factor of 10 With a feedback rate of 025 bitschunk over the Vehicular A channel we would only need 4 bits per chunk to accommodate 16 vehicular 50 kmh users per competition band in addition to many more stationary users Uplink feedback with only four 4-QAM symbols per chunk that use rate frac12 coding is adequate for this
For multiple antenna systems the required feedback rate will of course increase proportionally with the number of virtual antenna streams for which the channel quality feedback is required If not only real-valued channel quality SINR values but channel state information in the form of complex-valued matri-ces is required this will increase the feedback requirements quite substantially In [KBLS06] a method is described that can significantly reduce the required CQI feedback using vector quantisation techniques
An example of a system with four transmit antennas and one receive antennas that would need 32 bits if all four complex gains were represented by 8 bits each Using an optimised quantiser it is possible to use only one or two bits and still reach a significant portion of the performance for perfect CSI Especially for scenarios where long-term CSI is available at the transmitter this additional information can be efficiently exploited by combining a fixed quantisation scheme for the short-term CSI with a linear transformation that only depends on the long-term CSI The resulting feedback requirement may still be high for adaptive multi-user transmission However further reductions can be expected by utilizing the temporal correlation as was outlined for the SISO case above
WINNER D210 v10
Page 83 (180)
Appendix C MAC System Layer Functions This appendix gives more details on the services and functions within the MAC modes that were presented in Chapter 3 Appendix C1 below gives brief descriptions of the resource and transmission control functions for in the two cellular MACs The functional architecture of the peer-to-peer MAC is outlined in Appendix C2
The functional description of the PHY system layer is important for understanding the transmission but it has been left out from this report to save space It can be found in Section 552 of [WIND76]
C1 Functional architecture of the WINNER medium access control for FDD and TDD cellular transmission The presently assumed design of the MAC system layer for FDD and TDD cellular transmission was outlined in Section 31 see Figure 33 and Figure 34 The implementations of these two MAC modes are common to about 90 and their interfaces to higher layers are identical They will therefore be described together below with mode-specific differences indicated when they appear
The description follows the presentation in Section 54 of [WIND76] Since the delivery of [WIND76] the design has been refined and modified on several points As compared to the presentation in [WIND76] the design has been modified as follows
1 The PHY control signalling is under current investigation It has been re-organised so that a major part of the transmit control processing is executed by the MAC system layer As outlined by Figure 33 three special PHY services can be invoked transferring control packets
a Transmission together with the BCH packets in the super-frame preamble b Use of non-frequency adaptive transmission c Use of special time-frequency resources earmarked for control transmission via the
service Special Transmit Control Signalling PHY service In addition piggybacking of control bits in ordinary packets may also be used
2 Measurements are as before provided as a PHY layer service They may also be provided in
further processed form as a MAC system layer service The partitioning of processing of measurements is under current discussion and will continue to be investigated in WINNER II
3 The transport channel TCC for control flows has provisionally been added to aid investigations
on the design of protocols that supports all required control messaging 4 Antenna calibration has been added as a function within the spatial scheme controller
The sections below describe all the main control functions that are introduced in Figure 33 Appendix C15 summarises how different transport channels are handled as illustrated by Figure 34 The resource scheduler (Appendix C16) is a crucial system element of the WINNER design it is in a sense the ldquospider in the netrdquo of the whole design Appendix C17 provides additional discussion on the problem of SDMA and spatial user partitioning Finally Appendix C18 summarises the time scales on which the different functions work
C11 MAC radio resource control Resource partitioning and constraint combining The problem that the resource partitioning has to solve is the structural preparation of the next super-frame outlined in Section 314 The time-frequency chunk is the basic unit for subdividing the radio resources The partitioning of the super-frame between different transport channels will be performed with chunk granularity Reuse partitioning between cells is supported18 It must be performed with guard-bands due to the non-orthogonality introduced by large time delays See Appendix G73 It has to be performed in terms of wider frequency resource units since the guard bands would otherwise represent too large an overhead The resource partitioning may be changed on a super-frame basis but most parameters will typically stay unchanged over longer time horizons In TDD one single super-frame is to be defined In FDD separate uplink and downlink super-frames are to be specified see Annex A31 of [WIND35] The uplink and downlink super-frames will normally use differing allocations
18 See Section 52 in [WIND32]
WINNER D210 v10
Page 84 (180)
The resources of the next super-frame are allocated and subdivided in the following sequence bull First all constraints on the use of chunks are updated by the Constraint combining function of
the constraint processor at the BS It receives control inputs from the RLC on restrictions due to spectrum sharing and interference avoidance with neighbouring base stations At the BS the spatial properties of the restrictions are re-calculated in terms of BS antenna transmission properties19
The subsequent steps are performed by the Resource partitioning function that is implemented in the MAC control plane at the base station
bull DAC assignment A (nonzero) set of consecutive chunks is reserved for DAC (contention-based traffic) In the TDD mode these resources may also be used for peer-to-peer traffic This assignment is placed in the frequency region that is assumed available everywhere (Figure 32)
bull RN assignment In cells that include relay nodes sets of chunk beams are reserved exclusively for transmission between these RNs and UTs Each set is reserved either for single RNs or for a group of RNs that will create little mutual interference Furthermore resources may be allocated for use in the relay links between BSs and RNs
bull TDC adaptive transmission assignment The remaining chunks are divided for use by adaptively and non-frequency adaptively scheduled flows respectively This division is based on the history of the previous traffic demand
bull The set of chunks reserved for adaptive transmission may be further divided into competition bands where one stream normally uses only a single band These competition band allocations are updated if required
The super-frame has now been constructed Control messages that specify the allocation are transmitted from the BS at two instances In the case of two-hop relaying the resource partitioning information is thereby distributed to all the participating UTs at the beginning of the following super-frame
bull The RN partitioning is transmitted from the BS to the RNs over the relay link in chunks that are reserved for control signalling within the present super-frame
The remaining control information is transmitted by the BS to the UTs This is done during the downlink control part within the preamble of the super-frame being defined In the here-considered case of two-hop relaying it is the next super-frame Simultaneously each RN transmits the RN assignment to the UTs under its control For more details please see Section 634 of [WIND35]
C12 MAC radio resource control Flow setup and termination New uplink and downlink flows are established by the Flow establishment RRM function in the RLC system layer It requires the detailed setup of a flow context over each involved hop That flow context establishment is executed by the MAC flow setup function Flow context release is initiated by the RLC and is executed by the MAC Flow termination function In the case of per stream rate control (PSRC) see Appendix B1 several queues per flow are used
When a new downlink flow is established it is given a local flow address that is unique within the cell Its destination UT (or UTs in the case of CDC point-to-multipoint flows) is notified and a resource scheduling buffer queue is initialised
In the FDD mode flows tofrom half-duplex terminals are assigned to one of four groups Group 1 transmits in the downlink the first half of the frame and in the uplink during the latter half Group 2 transmitsreceives in the opposite way Group 3 contains half-duplex terminals that have adaptable and flexible uplink and downlink transmission periods Full-duplex terminals belong to Group 4
TDC flows are initially assigned either for adaptive or for non-frequency adaptive transmission by the flow setup controller The choice is based on the capability of the terminal the average SINR and the velocity of the terminal The choice is also affected by the potentially available spatial schemes and their CSI and CQI requirements The initial assignment may be changed later if the circumstances change Flow setup in relay-enhanced cells is discussed further in Section 635 of [WIND35]
19 In a grid-of-beams implementation constraints on the transmit power used in each beam may be used In the
general case constraints on the transmit covariance matrix may be used
WINNER D210 v10
Page 85 (180)
C13 MAC radio resource control Spatial scheme pre-configuration and selection A base station or relay node can have one or multiple antennas These antennas can be localised or may constitute a distributed antenna system eg comprising all antenna elements within a building A general spatial processing scheme for MIMO transmission and spatial domain link adaptation has been defined [WIND27] It includes multiplexing diversity-based transmission fixed beamforming and adaptive beamforming as special cases see Appendix B1 The spatial scheme controller performs a baseline spatial scheme selection process It is invoked to select an appropriate spatial transmit scheme for the newly established flow This selection is based on the terminal capabilities the BS antenna capabilities and the choice of adaptive and non-frequency adaptive transmission In addition the interference properties of other flows and their demand for spatial channels influence the decision Also for already established flows the spatial processing scheme can be changed by the Spatial Scheme Controller To reduce the complexity of this process a split in two functions and temporal layering is used
bull Spatial scheme pre-configuration performs static and long-term trigger-based assignments These assignments serve as inputs and constraints to the next step
bull Spatial scheme selection determines the dispersion code (degrees of spatial diversity and spatial multiplexing) the possible use of per stream rate control and the possible use of and type of precoding
staticdecisions and
constraints
Spatial SchemePreconfiguration
Spatial SchemeSelection
long-termdecisions and
constraints
each superframe
several superframescell configuration update
staticdecisions and
constraints
Spatial SchemePreconfiguration
Spatial SchemeSelection
long-termdecisions and
constraints
each superframe
several superframescell configuration update
Figure C1 Overview of temporal layering of the MAC functionalities Spatial scheme pre-configuration and selection within the spatial scheme controller
The Figure C1 above illustrates these functions and the different time scales at which they operate The static part of the spatial scheme pre-configuration evaluates all parameters decisions and constraints that can only be changed with an update of the basic cell configuration including the physical layer mode type of deployment (cellular isolated hot spot) cell range and the base station (BS) antenna configuration Furthermore mapping tables indicating the possible spatial schemes for each transport channel and terminal capability as well as a list of possible combinations of dispersion code PSRC and precoding type can be generated at this stage
The long-term part of the spatial scheme pre-configuration evaluates all parameters decisions and constraints that normally change on time scales greater than one super-frame or issues that cannot be decided on a per-flow basis like the overall selection of a scheme that applies to all users of a cell (eg configuration of a fixed beam approach or multi-user precoding) Slowly varying parameters include user distribution user speed quality of CQICSI information the flowsrsquo QoS parameter and long-term channel characteristics like average SINR long-term channel rank and eigenvalues Also certain flow-specific decision will be long-term oriented eg the decision between long-term and short-term spatial processing
Spatial scheme selection performs the remaining decisions based on decision criteria that change on a short-term basis include eg number of active users cell load (due to packet-oriented transmissions) and the short-term channel characteristics The spatial scheme selection considers these parameters and adapts the spatial scheme per flow under the constraints set by the spatial scheme pre-configuration
An important additional part of the Spatial Scheme Controller is the calibration function Calibration is required to relate a desired spatial distribution of energy in space to specific transmit weights and to allow exploitation of channel reciprocity in the TDD mode despite of RF front-end imperfections The calibration function checks the calibration status of a link with the particular requirements of the selected spatial processing technique and triggers the corresponding calibration procedure if required Calibration
WINNER D210 v10
Page 86 (180)
is therefore invoked at flow setup and each time either the selected spatial scheme is altered or the calibration status changes (eg temporal expiry)
C14 MAC control feedback The definition of service primitives for the MAC Control Feedback service is driven completely by the demand for such feedback from the RLC system layer and the IP Convergence layer In principle all outputs from the main function blocks and even internal states of these function blocks could be made visible to upper layers to enable various forms of inter-layer interaction The set of required feedback parameters is under discussion It includes SLC Cache levels (see below) as well as resource use per flow
C15 Radio packet transfer Transmission and reception The transmission control is performed in cooperation with the QoS control of the RLC system layer A Service Level Controller (SLC) Cache with per-flow queues for all downlink TDC CDC and DAC flows is assumed to be implemented within the MAC at each BS and RN For uplink flows corresponding buffers are present at each RN and UT The RLC layer Service level controller and flow scheduler (Section 41 and Appendix D12) controls the inflows to the BS SLC Cache and monitors its state The outflow from the SLC Cache is under control of a MAC - For BS-to-UT downlinks and BS-to-RN relay links the MAC at the BS controls the transmission - For UT-to-RN uplinks the MAC at the RN controls the transmission - For UT-to-BS uplinks the MAC at the BS controls the transmission Packet transmission and reception will be handled differently for the five transport channels BCH packets and RAC packets are encoded at transmission and decoded at reception but are not processed further by the MAC layer TDC CDC and DAC packets are processed by a more elaborate transmit and receive sequence that is divided into five protocol sub-layers as illustrated by Figure 34 MAC-5 Performs optional segmentation and reassembly of MAC SDUs (ie RLC PDUs) MAC-5 also performs flow identification at reception MAC-4 Sender adds CRC resulting in a retransmission unit (RTU) Receiver checks CRC and may ask for retransmission in case of error The retransmission mechanism is denoted MAC retransmission MAC-3 Sender performs optional segmentation of RTUs into encoding blocks The receiver then performs reassembly of received blocks into RTUs MAC-2 Coding of each encoding block results in an FEC block (forward-error-correction coded block) that is saved in the appropriate RSB queue The receiver decodes each FEC block It may also perform (soft) combination with retransmitted FEC blocks This encoding decoding will in the following be referred to as the outer code Encoding and decoding schemes have been discussed in Appendix B2 MAC-1 Performs puncturing of FEC blocks and resource mapping onto assigned chunks Resource mapping is a separate main function of the MAC user plane The protocol sub-layers MAC-5ndashMAC-2 may all be transparent ie their functions are optional Special cases of this transmission sequence accommodate all retransmission schemes and segmentation strategies that are at present under consideration The design outlined above performs segmentation and encoding before the mapping onto chunks It thus decouples the segment size used for retransmission from the chunk size It also decouples the code block size from the chunk size in a practical way These factors are also important when the WINNER radio interface concept is used as a test-bed to compare and evaluate different combinations of MAC retransmission strategies and coding schemes
For BCH the mapping onto super-frame control symbols is controlled by the Resource partitioning function For TDC CDC and DAC the Transfer control function supervises both transmission and reception The transmission control is focused at fast transfer via the physical layer
bull For adaptively allocated TDC downlink flows a transmission can be initiated during the downlink part of frame j and then be performed during the downlink slot of frame j+1
bull For adaptively allocated TDC uplink flows a transmission can by requested during frame j prepared and scheduled during frame j+1 and then be performed in the uplink slot of frame j+2
WINNER D210 v10
Page 87 (180)
bull For non-frequency adaptively allocated TDC and CDC downlink flows the scheduling can be determined during frame j An allocation table is transmitted in the first DL OFDM symbol of frame j+1 The transmission can then be performed either within frame j+1 or during frame j+2
bull For non-frequency adaptively allocated TDC uplink flows the transmission is initiated during frame j and is then performed in the uplink slot of frame j+1
Thus the delay from initiation of a transmission to its completion is 10ndash25 frames (07ndash17 ms) over one hop Multi-hop transmission will add to the total delay The roundtrip delay until a MAC retransmission can be performed depends on the decoding delay The computation speed estimates presented in Table B2 in Appendix B21 is around 200 kbitms The additional decoding delay for the outer code should then not exceed 01 ms for RTU sizes of interest (up to 1520 bytes)
The transmission of packets belonging to the different transport channels is summarised below
TDC (downlinks and uplinks) Packets in scheduled Targeted Data Channel flows are optionally segmented and then coded using the transmission sequence outlined above The FEC blocks are buffered by per-flow queuing in the resource scheduling buffer Scheduling and the subsequent mapping is then performed by either the adaptive or the non-frequency adaptive resource scheduling algorithm depending on the assignment of the flow Thereafter transmission proceeds using the PHY Adaptive transfer or Non-frequency adaptive transfer services At reception complete FEC blocks are delivered to the MAC In downlinks the MAC at the BS or RN controls the transmission In uplinks packet transmissions are initiated by UT requests The MAC at the BSRN with which the UT communicates controls the subsequent scheduling transmission and retransmission
CDC (downlinks only) The point-to-multipoint transmission has to deal with a wide variety of channels and directions to the destination users This complicates the adjustment of the transmission parameters and the use of beamforming To reduce the problems a CDC flow may be partitioned into separate copies targeted flows which are destined to specific groups (clusters) of users in different directionswithin different beams A CDC flow is processed through the MAC-5ndashMAC-2 protocol layers The resulting FEC blocks are copied into one or several queues in the RSB one queue for each targeted flow Scheduling and mapping of each targeted flow then proceed by non-frequency adaptive transmission with transmission parameters that are adjusted in a conservative way The transmission uses the PHY Non-frequency adaptive transfer service At reception complete FEC blocks are delivered to the MAC where they are decoded Packets (MAC SDUs) are finally recombined if segmentation was used A reliable multicast service may utilise retransmission The retransmissions could be triggered by NACKs from any of the destination users of a targeted flow Schemes that combine this mechanism with ACKs from the terminal with worst channel are also possible
DAC (uplinks only) Contention-based transmission is potentially the best way of transmitting uplink flows that have small packets with a low packet arrival rate The main current proposal for contention-based transmission is a scheme that uses carrier-sense multiple access and therefore requires a constant set of frequencies to be assigned exclusively during the whole super-frame When an uplink packet destined for contention-based transmission is drained from the SLC Cache at the UT it is prepared for possible retransmission and then coded The same function blockssub-layers as for TDC and CDC transmission are used but the parameter settings may be different The FEC blocks are transmitted by using the PHY contention-based transfer service Received DAC FEC blocks are decoded and the RTUs are possibly retransmitted if an error is detected
BCH (downlinks only) The BCH packets contain control signalling from higher layers The range of their reliable reception places an upper bound on the size of the cell These downlink broadcast channel packets are combined with super-frame control information The combined packets are low-rate encoded in the MAC combined with space-time-frequency (inner) encoding performed at the PHY layer Transmission and reception proceeds via the PHY BCH and SF control transfer service Retransmission cannot be used Adjacent BS and RN should use orthogonal time-frequency sets within this timeslot for their downlink preamble control transmission to limit their mutual interference
RAC (uplinks and for TDD BS-to-BSRN) The Random access channel can be used for initial access to a BS or RN by the UTs eg after handover RAC packets are coded and then transmitted in the reserved time-slot of the super-frame preamble in a contention-based manner Transmission and reception proceeds via the PHY RAC transfer service The MAC protocol and transmission strategy for this channel has not yet been defined
The RAC time-slot can in TDD systems can also be used for BS-to-BS and RN-to-BS over-the-air control signalling A BS or RN involved in this transmission would use the RAC for transmission in a few super-frames while it listens for reception in the others
WINNER D210 v10
Page 88 (180)
C16 Resource scheduling The Resource scheduler determines the resource mapping for TDC and CDC flows It utilises two scheduling algorithms
bull The Adaptive resource scheduler used for high-performance TDC transmission
bull The Non-frequency adaptive resource scheduler used for all CDC flows and as a fallback alternative for TDC flows It is also foreseen to be used for parts of the control signalling
These algorithms take priorities from the RLC Service Level Controller into account as well as the queue levels in the RSB and the SLC Cache
In addition the resource scheduler contains several support functions Spatial link adaptation Uplink slow power control Active set selection RS parameterisation and Allocation Statistics that will not be discussed further here
bull The adaptive resource scheduling and transmission uses predictions of channel quality information (CQI) to utilise the small-scale and frequency-selective variations of the channel for different terminals The scheduler assigns a set of chunk layers (see Section 132) within the frame to each flow After scheduling the RSB queues are drained with bit-level resolution The bits from each flow are mapped onto the assigned chunk layers This mapping is exclusive ie several flows do not share a chunk layer The transmission parameters within each chunk layer are adjusted individually through link adaptation to the frequency-selective channel of the selected user This link adaptation may use combinations of adaptive modulation (inner) coding that is adjusted to each chunk and power control The link adaptation can be designed to provide a target SINR per bit for the FEC blocs that are coded with the (outer) FEC code It then converts the fading channel into something approximating an AWGN channel as seen by the outer code Link adaptation may be combined with spatial multiplexing for example in the form of per-stream rate control where different FEC blocks of one flow are mapped to different chunk layers By selecting the best resources for each flow multi-user scheduling gains can be realised The scheduling algorithm should take into account the channel quality information of each user in each chunk layer the RLC flow transmission requirementspriorities and the queue levels Timely channel quality information requires the SINR within each chunk layer and for each candidate terminal to be predicted with relatively high accuracy The most advanced multi-antenna transmit schemes furthermore require the whole MIMO channel gain matrix to be known at the transmitter This is denoted full channel state information (CSI)
bull Non-frequency adaptive resource scheduling and transmission is instead based on averaging strategies Such transmission schemes are designed to combat and reduce the effect of the variability of the SINR by interleaving space-time-frequency coding and diversity combining Non-frequency adaptive transmission is required when fast channel feedback is unreliable due to eg a high terminal velocity or a low SINR [WIND24] or when the terminal does not support adaptive transmission It is also required for point-to-multipoint communication belonging to the common data channel (CDC) flows The non-frequency adaptive transmission slowly adapts to the shadow fading but it averages over the frequency selective (small-scale) fading It requires the FEC blocks to be mapped on a set of chunks that are widely dispersed in frequency and if possible on different antennas to maximise the effectiveness of the coding and interleaving
Figure C2 below gives an overview of the downlink transmission of scheduled flows Among other things this figure illustrates that two scheduling entities control the flows and have to cooperate The Flow scheduler at the RLC system layer is part of the Service level controller (Section 41 and Appendix D12) The Resource scheduler at the MAC system layer works on a faster time scale and takes the channel properties into account The adaptive RS uses detailed knowledge of the available resources the non-frequency adaptive RS has to work with more crude measurements of the average channel qualities In the present design these SLC and the RS interact in a very simple way The SLC fills the SCL Cache while the RS is responsible for draining it The SCL furthermore reports priorities of each flow to the RS Only a few priority levels are used The RS drains the queues and allocates the transmission resources in a way that optimises a criterion that takes the queue levels and the priorities into account Existing algorithms with very low computational complexity can be used to solve the resource scheduling problem when formulated in this way See eg Chapters 6 and 7 in [Eri04] These algorithms have computational complexity that grows linearly with the number of scheduled resources and linearly with the number of scheduled flows Execution times below 01 ms can be attained which is consistent with the very fast transmission strategies outlined in Appendix C15 above
WINNER D210 v10
Page 89 (180)
Service Level Controller
Resouce Scheduler
Packet Processing
IFFT beamforming pulse shaping
Tchunk
Optional SLC buffer
Time
Virtual antennalayer Frequency
RLC
MAC
PHY
CQI CSI Buffer levels CQI errors
Antenna 1 Antenna N
Non-frequency-adaptive Resource Scheduler
Adaptive Resource Scheduler
Map on dispersed chunks Map on optimal chunks
Constraint Processing
(= End-to-end ARQ buffer)
- Scheduled Mapping onto chunks and layers - Link adaptation
Segmentation FEC Coding
SLC cache at BS
Per-flow flow control - Inter-flow fairness - Service constraints - Total delay contraints
Resource scheduling buffer
at BS or RN
TDC CDC
Flow classification Convergence layer
Spectrum mapping
and assignment
Figure C2 Data flows and some control functions in downlinks of the scheduled data channels
Adaptive transmission requires prediction of the channel quality due to the transmission control loop delay In [WIND24] summarised in Appendix B52 the predictability and attainable prediction accuracy is investigated as a function of the SINR and the terminal velocity The effect of the prediction errors on the attainable adaptive transmission performance and on attainable multi-user scheduling gain was investigated Fast adaptation control loops are a part of the WINNER design With correspondingly low delays adaptive transmission was found feasible at vehicular velocities at 5 GHz carrier frequencies A SINR and velocity-dependent boundary delineates when adaptive or non-frequency adaptive transmission is the best alternative (Appendix B52) This decision is taken at flow setup and may be changed later
Both downlink and uplink power control is supervised by the Resource scheduler and is integrated into the optimisation of the transmission parameters
A novel framework had been developed for handling the spatial dimension of the multi-user scheduling and link adaptation problem It integrates various SDMA (spatial division multiple access) strategies into the total solution
WINNER D210 v10
Page 90 (180)
[yes][no]
exit conditions could also be based on some quality metric instead of a fixed number of iterations
x stands for either adaptive or non-frequency adpative
This message determines the active set for the next frame
Upd
ate_
cons
train
ts(F
cbS
cb)
Spa
tial_
sche
me(
flow
num
ber)
su_la gtmax_su_la
mu_la gtmax_mu_la
su_la=su_la+1
RSB
_sta
tus(
Que
ue_s
tate
s_CD
C
Que
ue_s
tate
s_TD
C)
Upd
ate_
mea
sure
men
ts(C
QI_
pred
ictio
ns)
MAC_URSB
MAC_CSpatial Scheme SelectionMAC_CConstraint Processing
PHYMeasurements
mu_la=mu_la+1su_la = 0
Spatial userpartitioning
[yes]
[no]
Upd
ate_
flow
_sta
tes(
RS_a
ctiv
e_se
t_D
LU
L)
MAC_UQueue State Control
Channel-adaptivemulti-userscheduling
send
_enc
oded
_bits
(poi
nter
num
ber_
of_b
its)
PHYx TransferSend
PHYTransmit Control Signaling
Active setselection for
frame j+1
Preliminary spatialsingle-user link
adapatation
Link adaptation
Resource Mappingfor all flows in
frame j+1
Figure C3 Resource scheduling sequence overview (adaptive and non-frequency adaptive)
As outlined by Figure C3 above adaptive multi-antenna link adaptation and scheduling is separated into four steps to limit the computational complexity so that a fast feedback loop is obtained
1) Spatial user partitioning ie separation of users into spatially well separated sets
2) Preliminary single-user link adaptation for each potential user and potential resource
3) Channel-adaptive multi-user scheduling within the sets of spatially highly-interfering terminals using the chunk capacities calculated in step 2 (In case of non-frequency adaptive transmission only slow adaptation to the shadow fading is used)
4) Final link adaptation resource mapping and transmission of the selected flows using either the link adaptation parameters that were determined in step 2 or iteratively refined schemes
The sequence can be iterated a few times to improve the estimate of the spatial inter-set interference
Step 1 the spatial user partitioning will be discussed in more detail in Appendix C17 below Step 2 the single-user link adaptation was discussed briefly in Appendix B514
The channel-adaptive multi-user scheduling should in general be designed to take queue levels into account as discussed above In the simulation evaluation investigations presented in Appendix G below the simplification of a full queue model was used The following simple resource scheduling strategies were used in most of the investigations on adaptive transmission
bull Round robin ie periodic allocation to all flows
bull Max rate scheduling ie giving the resource to the flow that can have the highest throughput
bull Score-based scheduling [Bon04] a modified proportional fair strategy
To reflect the bursty nature of packet flows and to limit the transmission overhead each adaptively allocated TDC flow shifts between the following states
bull Passive The flow has an empty RSB queue and no packet in the SLC Cache Minimal transmission control signalling is required Terminals may be in micro-sleep mode except during specified control transmission time-slots
bull Semi-active This state is only used for adaptively allocated TDC flows The flow has segments in queue but is not eligible for scheduling during the present frame
bull Active The flow is eligible for scheduling during the present frame The full transmission control loop is up and running
WINNER D210 v10
Page 91 (180)
The transition between these three states and the corresponding PHY control messaging is governed by the Queue state control function within the Flow state controller and the active set selection in the RS The queue state is updated every slot (half-frame)
In cells with few flows all flows with packets to transmit will be in the active state In cells with many flows assigned for adaptive transmission the access to the active state can be restricted to limit several types of complexity and overhead The scheduling computational complexity the downlink control overhead the channel prediction complexity and the CQI and CSI feedback signalling overhead
C17 SDMA and spatial user partitioning The task of spatial user partitioning is to separate the user terminals into spatial sets with low mutual interference The aim is to group the user terminals so that their correlation matrix (power at receiver i resulting from a downlink transmission to terminal j) becomes approximately block diagonal Highly interfering terminals are placed into the same spatial sets members of pairs with mutual interference below a pre-defined threshold can be placed in different sets Once such spatial sets are established we can use SDMA for flows of different sets Such groups of flows that share a chunk are called (spatial user) groupings Other multiple access schemes (such as TDMA FDMA) are used to avoid interference when transmitting tofrom users within the same set The sets can be thought of as (generalised) beams They are reached by using specific spatial precoding (beamforming) weights
The spatial user partitioning allows controlling the interference generated by SDMA by setting appropriate interference thresholds during the generation of the spatial sets Therefore the allowed SDMA interference can be considered in the overall interference prediction used for in resource scheduling in the individual spatial sets To a first approximation we can therefore assume that the subsequent multi-user scheduling can be performed independently within each spatial set of terminals This reduces the computational complexity drastically spatial user partitioning reduces the problem of multi-user multi-antenna scheduling to that of performing chunk-adaptive multi-user scheduling within the individual sets
The procedure to obtain such spatial sets depends on the amount of channel knowledge at the transmitter If channel state information (CSI) is available at the transmitter the spatial sets can be generated by calculating the mutual correlation between users If only a channel quality indicator (CQI) is available so-called opportunistic or grid-of-beams beamforming approaches are used
As the number of users increases it becomes increasingly complex to find spatial sets with good separation properties and testing all possible terminal combinations must be avoided20 We may then partition the time-frequency resources into two or more groups and assign subsets of users to each group These subsets of user terminals are called orthogonal groups If this grouping is performed properly it simplifies the task of forming well-separated spatial sets within each orthogonal group Different criteria to form orthogonal groups are conceivable eg
bull For fixed beamforming the users associated to beams that can be transmitted concurrently with inter-beam interference below a pre-defined threshold can form one orthogonal group
bull For adaptive precoding terminals can be grouped according to their SINR requirements (ie according to their target data rates and interference suppression capabilities) This allows using different SDMA interference thresholds in the different groups It therefore improves the overall opportunities for SDMA (which would otherwise be limited over all resources by the weakest terminal)
The SDMA decision must be integrated in the overall resource allocation process ie the decision must integrate the priorities due to QoS contracts and the opportunities and constraints due to the spatial channel characteristics The numbers of users served concurrently by SDMA is a parameter which has a significant impact on the performance the throughput gain offered by serving multiple users at the same time comes at the expense of serving each user with a smaller fraction of the available transmit power
An example of the use of SDMA and spatial user partitioning is given in Appendix G22 Furthermore a specific algorithm for creating spatial groupings is discussed in more detail below
20 The complexity is especially severe in cases where CSI is used at the TX for precoding because the precoding solution depends on the combination (and possibly also on the user ordering) to be tested and again differs for every chunk
WINNER D210 v10
Page 92 (180)
Low Complexity Space-Time-Frequency User Partitioning for MIMO Systems with SDMA
The algorithm was originally derived for a precoding technique that forces the interference to be zero between all users that are served simultaneous via SDMA Even if no interference is present spatial scheduling is of crucial importance If users with spatially correlated channel subspaces are served jointly this leads to inefficient precoding matrices and a drop in the strength of the equivalent channel after precoding The goal of the algorithm is therefore to group together users with uncorrelated channels The precoding technique under investigation allowed the use of an efficient approximation technique based on orthogonal projection matrices to calculate the capacity after precoding which serves as a scheduling metric The capacity estimate also allows to inherently consider the effect of different group sizes since it includes the transmit power In the case of precoding where interference is not fully suppressed the problem of correlated subspaces will lead to a slight reduction in link quality and to an increase in interference Since the latter is dual to the drop in link quality in the zero forcing case the proposed solution is also applicable in the non-ZF case as shown in [FDGH05b]
An iterative method for forming these groupings presented in [FDGH05a] will be described briefly
For any users g out of G users a rough estimate ( )Sgη is calculated that represents the spectral efficiency
that would result if that user were allowed to transmit in the selected way It approximates the inter-layer interference effect and can be calculated by a simplified projection scheme see [FDGH05a] [FDGH05b] The equivalent channel of user g is represented by its channel matrix after an orthogonal projection into the null-space of a joint channel matrix containing all G usersrsquo channels except that of the grsquoth The resulting chunk throughput when transmitting to all users in the grouping is simply estimated as the sum of the G individual terms ( )S
gη
The iterative tree-based scheme for forming appropriate groupings can now be explained as follows Let us start with a situation where all users are part of one spatial set ie each use forms a separate grouping with only one member (lowest row in Figure C4) SDMA would then not be used at all within the cell First the user with the best metric is identified In the figure it is user number 1 Then one user at a time is added to it and the metric sum of the combination is calculated The combination with the highest metric sum is kept as candidate user groupings with size 2 The algorithm is repeated to test and form a grouping of size 3 It proceeds in this way up to the maximum allowed group size When done the
grouping of size G with the highest metric sum GC (or highest capacity if higher accuracy is desired) out of all candidate groupings (marked in red for G = 3 in the example in Figure C4) is chosen To reduce complexity even further the solution can be tracked in time Instead of calculating the entire tree the sorting starts with the previously found solution and proceeds eg one level up in the tree and two levels down again updating also the previous solution The sub-grouping is then selected only from three new candidates Going top-down in the tree is achieved by testing one by one which user to delete from the grouping in order for the remaining group to have maximum sum metric
Figure C4 In a system with 5 users candidate user grouping are built by adding one user at a time and keeping the grouping with highest sum metric Finally the grouping with highest sum metric
(eg the one marked in red) out of all candidate groupings (marked in yellow) is used
11 22 33 44 55
1 21 2 33 44 55
33 551 24
1 2 34 5
1 2 34
55
Trac
king
win
dow
11 22 33 44 55
1 21 2 33 44 55
33 551 24
1 2 34 5
1 2 34
55
Trac
king
win
dow
WINNER D210 v10
Page 93 (180)
C18 Timing of the execution of the main MAC functions
The main functions of the control plane (C) and the user plane (U) are executed on the following time scales
Executed once every super-frame
- Constraint combining (C) - Resource partitioning (C)
- Spatial scheme selection (C)
- Coding resource mapping and PHY transmission of RAC and BCH flows (U)
- Reception from PHY and decoding of RAC and BCH FEC blocks (U)
The execution of the following functions is trigger-based when required
- Flow setup control (C)
- Flow release control (C)
- Spatial scheme pre-configuration (long-term decisions and constraints) (C)
- Calibration in the spatial scheme controller (C)
- Support functions within the resource scheduler (U)
Executed every slot (half-frame in FDD UL DL period of frame in TDD)
- Queue state control (U) - Resource scheduling (U)
- Coding segmentation resource mapping and PHY transmission of TDC and CDC flows (U)
- Reception from PHY decoding and reassembly of TDC and CDC FEC blocks (U)
C2 Functional architecture for peer-to-peer MAC C21 MAC services provided for peer-to-peer transmission The Radio_Resource_Control service for P2P transmission is used to start maintain and stop the operation of a P2P-DAC in the BS User terminals which intend transmitting peer-to-peer have to attach to the channel before transferring data using this service Detaching terminals from the DAC is another service that is provided If a UT intends to transmit data packets synchronously the service provides functions to create and terminate a synchronous data flow The primitives of type req request ind indication rsp response and cnf confirm that are provided to use this service at higher layers are summarised in Table C1
Table C1 Overview on MAC_P2P_CONTROL primitives for P2P transmission
Name req ind rsp cnf
MAC_P2P_CONTROL_START_DAC - -
MAC_P2P_CONTROL_STOP_DAC - - -
MAC_P2P_CONTROL_ATTACH_TO_DAC
MAC_P2P_CONTROL_ATTACH_INFO - - -
MAC_P2P_CONTROL_DETACH_FROM_DAC -
MAC_P2P_CONTROL_CREATE_SYNC_FLOW - -
MAC_P2P_CONTROL_TERMINATE_SYNC_FLOW - -
After the P2P-DAC has been configured appropriately and the UTs involved in P2PPMP transmission have been attached the Radio_Packet_Transfer service for P2P transmission can be used to exchange
WINNER D210 v10
Page 94 (180)
segmented packets either asynchronously or synchronously between peer terminals The primitives which are provided to use this service at higher layers are summarised in Table C2
Table C2 Overview on MAC_P2P_USER primitives for P2P transmission
Name req ind rsp cnf
MAC_P2P_USER_SYNC_DATA -
MAC_P2P_USER_ASYNC_DATA -
C22 MAC functions provided for peer-to-peer transmission DAC-P2P flow setup data transfer and flow termination
Figure C5 shows the state-transition diagram implemented in the P2P-DAC flow setup and termination unit of the base station (see Figure 37) After radio resources have been allocated for the DAC the service primitive START_DACreq triggers the execution of the P2P-DAC initialisation function and the transition to state P2P-DAC_ACTIVE In this state the P2P-DAC beaconresource control function is continuously executed to control the operation of the DAC by broadcasting beacons with the appropriate information about the available DAC service and the current DAC frame structure This control function is terminated by executing the P2P-DAC terminate function after receiving a STOP_DACreq
The state-transition diagram in Figure C6 illustrates how the various protocol functions of the P2P-MAC interact with each other in the UT to setup a P2P-DAC flow control the data transfer and terminate the flow
After being synchronised to the BS the user starts the P2P-DAC attach function by sending an ATTACH_TO_DACreq primitive to the flow setup and termination unit This function conveys to the BS information about the UT and the BS assigns to the UT a unique identifier for efficient addressing After its successful completion a confirmation is sent to the user before the finite-state machine transits to state ATTACHED A UT can detach from the DAC at any time by executing the P2P-DAC detach function
In the state ATTACHED the user can request an asynchronous transfer of a radio packet in the CAP or GAP to the peer UT by sending a USER_ASYNC_DATAreq This initiates the execution of the P2P-DAC asynchronous transfer control function If the packet should be transmitted in the GAP the UT informs the BS with an UL command of the pending transmission request If resources are available the BS schedules time slots for the transfer request and announces the availability of the time slots for the requested P2P transfer in the beacon The transfer control function then controls segmentation retransmission and multiplexing of the segmented radio packet onto the assigned time slots If the packet should be transmitted in the CAP the request is forwarded to the P2P-DAC channel access control function After completing the data transfer the successful transfer is confirmed and the finite-state machine returns to state ATTACHED
Before radio packets can be synchronously transferred between peer UTs a service user has to request the execution of P2P-flow setup function by sending a CREATE_P2P_FLOWreq This procedure establishes a synchronous P2P-flow by exchanging protocol messages between the UTs and the BS If time slots are
Figure C5 State-transition diagram of P2P-DAC flow setup and termination in the base station
WINNER D210 v10
Page 95 (180)
periodically available for the requested data transfer the BS assigns a unique index to the newly created flow After the successful completion of the procedure a confirmation is sent to the user and the finite-state machine transits to state P2P-FLOW_ESTABLISHED A UT can terminate a P2P-flow by executing the P2P-flow termination function
In the state P2P-FLOW_ESTABLISHED the user can request a synchronous transfer of radio packet on the pre-established P2P-flow by sending the USER_SYNC_DATAreq primitive This primitive initiates the execution the P2P-DAC synchronous transfer control function which controls segmentation retransmission and the multiplexing of the segmented data to the pre-allocated time slots of the DAC frame After the completion of the data transfer the transfer is confirmed and the finite-state machine returns to state P2P-FLOW_ESTABLISHED
Figure C6 State-transition diagram of P2P-DAC flow setup transfer control and flow termination in the user terminal
P2P-DAC channel access control functions The P2P-DAC channel access control functions give UTs random access to the P2P-DAC for transmitting control messages to the BS and exchanging protocol messages or small amount of user data between peers
A UT which is synchronised to the P2P-DAC can transmit command frames to the BS in the UL command time slot by using a slotted ALOHA access protocol The access to the time slot is controlled by a contention window that is maintained by each UT The size of the window is defined as cw(a)=min2a+1256 where a represents the number of retransmission attempts already made by the UT The UT chooses a uniformly distributed random value r within the interval [1cw(a)] and starts the access after r DAC frames After receiving a response from the BS indicating successful command reception the parameter is reset to zero
A UT which is attached to the P2P-DAC can asynchronously transmit control messages or a small amount of data to a peer UT in the contention-access period Since no establishment of a synchronous P2P flow is required this method leads to a faster access and data transfer The basic medium access mechanism used in the CAP is the well-known carrier-sense multiple access scheme with collision avoidance A UT with a pending data transmit-request senses the state of the wireless medium before it can transmit If the medium is idle longer than a pre-defined time interval it can proceed with the transmission Otherwise it first waits until the medium becomes free then generates a random backoff time before it tries to transmit in order to minimise the risk of collisions with transmit request issued by other terminals
WINNER D210 v10
Page 96 (180)
C3 Chunk definition The scaling of chunks in the WINNER system is based on the following general considerations
bull The appropriate frequency extent of a chunk should be determined by analysing the balance between two factors 1) The performance loss due to channel variability within the chunk which is decreased with narrow chunks This factor depends on the typical channel power delay profile which is in turn related to the cell size and the deployment scenario 2) The required control overhead and feedback rate with adaptive transmission which is decreased with wide chunks
bull The appropriate time duration of a chunk is determined by the following factors 1) Short chunks lead to a small overall radio interface delay 2) Short chunks enable the design of feedback loops for adaptive transmission also for fast fading channels 3) Short chunks may contain so few payload symbols that the overhead due to pilots and in-band control symbols becomes prohibi-tive 4) Long chunks may contain too many payload symbols Transmission of small FEC blocks will then become problematic since flows are in general mapped exclusively to flows in adaptive transmission without chunk-sharing
The chunk definitions found below are specified for the (frequency) adaptive transmission mode which will be used whenever precise channel quality information is available at the transmitter to steer link adaptation on a fine granularity level Within chunks allocated for non-frequency adaptive transmission there is a potential need for a more fine-grained rate matching Solutions to solve this problem are outlined in Section 316
The chunk width is set to 8 subcarriers or 3125 KHz in the FDD mode and to 16 subcarriers or 7812 KHz in the TDD mode The motivation for this difference in chunk widths is that the FDD mode has in WINNER phase I been evaluated in rural area and metropolitan area deployments with rather high delay spread and frequency selectivity in the channels see Table F1 in Appendix F The TDD mode has been evaluated primarily in short-range deployments with less delay spread in the channel models and thus less frequency selectivity
Thus the usable 416 subcarriers in the FDD mode are partitioned into 52 chunks the usable 1664 subcarriers in the TDD mode are partitioned into 104 chunks The radio interface delay requirement of 1 ms [WIND71] can be interpreted as a requirement on the slot duration of the FDD transmission and the uplink and downlink slot lengths of the TDD transmission by the following reasoning The shortest control loop for a transmission consists of a request response and transmission Each such sequence should have duration of approximately 1 ms The chunk durations Tchunk of the FDD mode will therefore be set to 12 OFDM symbols plus guard times or 3456 micros The frame of the half-duplex FDD system consists of a downlink chunk followed by an uplink chunk with duration Tframe = 2 Tchunk = 6912 micros The frame of the TDD mode consists of a downlink period + duplex guard time + uplink period + duplex guard time This frame duration is set equal to the FDD frame duration of 6912 micros to simplify inter-mode cooperation The TDD chunk duration is set to 5 OFDM symbols plus guard times = 1088 micros The duplex guard time is set to 192 micros Each TDD frame contains 6 chunks plus two duplex guard times With asymmetry 11 each frame contains three uplink chunks and three downlink chunks
A chunk thus contains 96 symbols in the FDD cellular mode when used for CP-OFDM transmission and 80 symbols in the TDD cellular mode See Figure 31
WINNER D210 v10
Page 97 (180)
Appendix D Radio Resource Management (RRM) and Radio Resource Control (RRC)
D1 RRM functions
D11 Spectrum control
Spectrum Sharing Spectrum Sharing controls the access to the spectrum in frequency bands which are shared with other RATs which are probably the ones used by legacy systems Depending on the regulatory rules governing the shared bands different scenarios for spectrum sharing are possible
Horizontal sharing The involved systems in the shared frequency band have equal regulatory status ie no system has priority over the other(s) in accessing the spectrum
bull Horizontal sharing without coordination No signalling is required between the involved systems as eg nowadays on the ISM band Since QoS cannot be guaranteed for any system this possibility is not considered in further detail
bull Horizontal sharing with coordination The involved systems coordinate their spectrum access based on a set of predefined rules (spectrum etiquette) that all systems adhere to This requires capabilities for signalling or at least detection of the other systems
Vertical sharing In this modality sharing is performed with clearly established priorities The primary system has preference in accessing the spectrum and the secondary system(s) may only use the spectrum as long as they do not cause harmful interference towards the primary
The most important as well as complex service component is the one where WINNER is the secondary system which controls the emissions from the WINNER system to avoid harmful interference towards legacy systems This function first has to reliably identify the ldquowhite spacesrdquo ie unused spectrum and then determines the transmit constraints of the WINNER system The identification of the white spaces can be based on measurements and it can be significantly assisted with information provided by a spectrum database or a central radio controller Based on the available and measured information constraints for the transmit parameters are determined and signalled to the constraint processing function in the MAC layer
Spectrum Assignment Spectrum Assignment periodically reassigns a portion of the available spectral resources between multiple WINNER RANs In contrast to the conventional fixed spectrum assignment herein it allows dynamical balancing of spectral resources between networks As a result spectral resources available for a network can be adjusted according to eg changes on the operatorsrsquo customer base (or market shares) Spectrum assignment also facilitates introduction of operators with relatively small customer base or network coverage area In addition spectral resources can be re-assigned according to the variations on the aggregate loads on the networks hence enhancing the overall use of spectrum over all networks
Long-term Spectrum Assignment The spectral resources assigned to the networks are defined in terms of chunks and hence separation between networks can be done either in frequency (eg in FDD mode) or both in time and frequency One principle for the re-assignment assumed in the following is to keep the spectral resources assigned to the networks as orthogonal as possible In other words the resources are separated in time frequency or space so that interference between networks is minimised This prevents the need for extensive coordination (or tight coupling) between networks for complicated interference management over multiple networks as well as for strict limitations to the operation of RRM within networks The principle likely favours TDD bands where orthogonal resource allocations are efficiently obtained in time This is due to the synchronisation between networks required also with the conventional fixed spectrum assignment due to the adjacent channel interference Other principles assumed in the following are
bull The spectrum assignment functionality is distributed to all networks and re-assignments any negotiated between networks without any central controller
WINNER D210 v10
Page 98 (180)
bull Central database containing relevant information on spectrum priorities as well as on fairness and cost metrics enables higher layer control on the spectrum assignment through the priorities and fairnesscost metrics It also enables simple introduction of new networks
bull Spectral resources are divided into two categories resources assigned with a priority and common pool resources
o The purpose of resources assigned with a priority to a certain network is to guarantee basic operation of the network under all circumstances A network can release some of the priority assigned resources for other networks but it can retrieve the resource in the next negotiation phase In other words it has incontestable priority to the resource
o Common pool resources can be reserved by any network
bull Fairness and cost metrics are used in the negotiation of assignments to achieve fair and efficient allocation solution
bull Spectral resource assignments vary geographically although spatially contiguous assignments are preferred to avoid unnecessary interference between networks To facilitate smooth spatial transition in the assignments it is envisaged that long-term assignment specifies for large geographical areas with spatial granularity of several cells (sets of cells) and short-term assignment optimises the border regions further with cell-wise resource assignments
bull Spectral resource re-assignment is done periodically and at a slow rate (ie several minutes)
It may be preferable that resources in the common pool are assigned to a network for multiple spectrum assignment periods at a time In other words not all common pool resources are re-assigned at each period This results in a smoother spectrum assignment adaptation and probably reduced need for the priority assigned spectral resources A simple solution may be that assignments have a common duration of multiple assignment periods and a resource can be released during the assignment
Short-term Spectrum Assignment The short-term spectrum assignment complements the main spectrum assignment by providing short-term and local ie cell-specific variations to the spectrum assignments covering large geographical areas Hence it enables 1) faster adaptation to the local traffic load variations and 2) geographically more accurate spectrum assignments In the part of faster adaptation to load variations it provides complementary method for inter-network load sharing The assessment of the true benefits of this approach in comparison to plain load sharing remains to be done in WINNER II
The re-assignments of spectral resources are performed in the time scale of several seconds To limit the induced complexity the functionality resorts to only simple inter-network signalling Functionality requests resources from other WINNER RANs after triggered by the long-term spectrum assignment or preventive load control In the case of a resource request from other RANs the functionality rejects accepts or partially accepts the request based on information from load prediction and MAC control feedback on the overlapping and neighbouring cells Inter-network signalling is performed either over the air or through the core network For the over the air signalling RAC is used through the MAC radio packet transfer service The constraint information is updated based on the decisions and sent to appropriate MAC layer
D12 Service level control (SLC) The SLC has the overall responsibility of adjusting inter-flow fairness and assuring the fulfilment of service level contract agreements and total delay constraints In particular
bull it may perform by requesting resources from several BSs that may utilise different WINNER modes
bull it works on a slow time scale characterised by the packet arrival rates
bull it may allocate resources belonging to several modesbase stations
The SLC forwards packets to SLC cache (Figure C2) based on a predicted sum rate and QoS requirements which could be derived by the queue levels feedbacked by the SLC cache The SLC cache is kept rather small corresponding to few frames while separate queues are allocated for each flow Furthermore the SLC assigns static priorities per flow and RS schedules based on priority queuing time and channel state
The service differentiation is exercised through the following service components while an example is given in Figure D1
WINNER D210 v10
Page 99 (180)
bull Flow Conditioning The traffic of each flow is conditioned to ensure that it complies with the corresponding profile definition in particular the defined maximum traffic rate
bull Flow Queuing In WINNER it is assumed that separate queues are allocated for each flow Packets in respective queue may get dropped during transient phases of congestion
bull Flow Scheduling Flow scheduling may be considered as management between flows and determines the order in which PDUs will be forwarded to the SLC cache buffer residing at the MAC layer and works on a time scale characterised by the packet arrival rates
bull Flow Monitoring The main aim for flow monitoring is to (as the name suggests) monitor the flow and provide feedback on flow traffic predictions to any other function that may require this information
Flow-1 Flow-LApps belonging to service class 1
Decision based on intra-class policy inter-class policy and age of packet
Flow-1 Flow-N
Per Flow Queuing+Active QueueManagement
Flow scheduling
SLC Cache(Drained by RS)
Flow-M Flow-NApps belonging to service class L
MAC
RLC
Aggregate of Marked Packets
Network Control Packets
Flow Conditioning(eg through Leaky or Token Bucket
IPC
Feedback on Queue Levels
Figure D1 Example of flow conditioning flow queuing and flow scheduling
D13 ModeRAN selection The different architecture alternatives may be expected to differ in what decision variables are available and according to the way different available modes are used We have above defined
1 fast selection - which is a quasi-simultaneous operation of modes and will have to be performed in both the BS and the UT the decision variables and boundary conditions are expected to be set by RRM but the selection decision has to be taken by MAC (Figure D2)
2 slow selection - which is an RRM function to control alternative operation of modes the process perhaps bearing many similarities to the RAN selection
3 re-selection - which is an RRMRRC function to handle changing radio conditions availability of modes
WINNER D210 v10
Page 100 (180)
Application s
TCP UDP
IPvX
Multi-Mode Layer 2
Layer 1Mode 1
Layer 1Mode 2
IP Convergence Flow identification
Destination Identification
End-to-End Automatic Repeat
reQuest (ARQ)
Hop-by-Hop ARQ
Mode 2
ResourceScheduling
Mode 2
Hop-by-Hop ARQ
Mode 1
Resource Scheduling
Mode 1
Segmentationand
Reassembly (SAR)
(Inter -mode)-Scheduling =
fast mode selection
L2 M
odes
Con
verg
ence
Man
ager
RR
MR
RC P
aram
eter
izatio
n fo
r fas
t mod
e se
lect
ion
RR
MR
RC c
ontro
l for
slo
w m
ode
sele
ctio
n an
d re
-sel
ectio
n
Data FlowParameterization Composition and Status Information
Interaction
Figure D2 User plane data flow and fast mode selection (not shown slow mode selection and re-selection performed by RRMRRC)
According to the variant of mode selection applied a subset of the decision variables can be used
bull Mode availability - which subset of the modes that a terminal can support is in fact available at the current location
bull Service ndash the mode which is most efficient for the service in question is selected
bull Signal strength ndash the mode from which the strongest signal is received is selected This is a simple version of the more sophisticated selection parameter radio resource cost discussed below
bull Radio resource consumption ndash the mode for which the least relative amount of radio resources (eg power codes timeslots etc) is required to support the users is selected
bull System load ndash the mode with the least relative load is selected This does not necessarily improve capacity but improves user quality at loads below the capacity limit and avoids reallocations as the load approaches the capacity limit
bull Packet size ndash the mode which is most efficient for the packet size in question is selected
bull Price ndash the mode for which the price for supporting the user is lowest is selected This is especially interesting in case the different modes are run by different operators and the decision is taken by the end-user or the terminal
The RAN selection algorithm selects the most suitable RAT for attending the service requests of UTs Of importance here are the RATrsquos preferences for the requested service according to the QoS offered by each RAT and the balance among the radio resources occupation of the different RATs achieved by a suitable traffic load balance among them The algorithm is based on the availability of a list for all the available RATs capable to provide the service This list is made based on QoS information A decisive factor for prioritising a RAT over another RAT will be the user preference [WIND41] [WIND42]
D14 Handover The general rules for handover between the WINNER modes are expected to be mode availability and terminal mobility For example UTs with high mobility are expected to always be connected with the wide area cell even if they are in the vicinity of the short range cell Also the triggers for handover and their thresholds between the two modes will depend on the deployment scenario ie extension of coverage and increase of spectral efficiency as well as on the relaying concept In case of an inter-system handover this is expected to take place either when there is loss of coverage of the current system or in the case of overlapping coverage due to useroperator preferences or traffic congestion Example of handover triggers are given in [WIND41] [WIND42]
WINNER D210 v10
Page 101 (180)
Intra-system handover Since the wide area cell is going to exist as an umbrella over the short range cell there is a need for making the UT aware that it has the option of changing to TDD mode In order to allow for a seamless handover within the WINNER RAN BSs and RNs of the same or different mode can announce their presence to the UTs by broadcasting control messages using orthogonal resources This scheme is especially helpful for the handover between WINNER FDD and TDD as it allows the UTs to be aware of the presence of BSs and RNs that operate at a different mode without disrupting their normal operation to ldquosniffrdquo other parts of the spectrum Further information can be found at [WIND43] [WIND44]
Inter-system handover
Location-based Vertical Handover (VHO) In a homogeneous system the scanning of other possible connections is triggered by the condition of the link since an ongoing connection with good performance makes such a procedure dispensable For a vertical handover continuous surveillance is mandatory At the moment this can only be handled by the terminal itself because no entity exists for the integration and information exchange of different networks Therefore the mobile must scan all other possible RATs The autonomous gathering of information by means of scanning may impact both the own and other transmissions Therefore it makes sense to look for alternative ways of gaining respective measurement results Since the need for own measurements shall be reduced as much as possible another way of gathering the relevant information is to employ measurement reports which have been collected by other active UTs within the same or within other systems Information gathering within the same system thereby is required for horizontal handover (HHO) preparation whereas for VHO information gathering between different types of systems is needed However information may also be used to control other mechanisms such as appropriate physical mode selection for link adaptation (LA) or (joint) Radio Resource Management (RRM) In all cases the location-based VHO in combination with the Hybrid Information System (HIS) offers a great economic potential since participating devices can minimise or even avoid self-driven scanning procedures The principle of the HIS presumes that each system collects data about the current link state within the covered cell and provides this information on request to mobiles that are willing to change their connection within the same system (HHO) or different systems (VHO) [WIND41] [WIND42] [WIND43] [WIND44]
CRRM based VHO Another approach for an inter-system handover is based on the CRRM framework defined in the 3GPP [3GPP-TR25891] which allows the exchange of load information between UMTS and GSM networks The proposed algorithm takes in a first step only load criteria into account but in a second step will include also service criteria [WIND41] [WIND42] These algorithms can be extended to WINNER inter-mode handovers [WIND43] [WIND44]
D15 Admission control Admission control schemes are the decision making part of networks with the objective of providing to users services with guaranteed quality in order to reduce the network congestion and call dropping probabilities and achieve as much as possible resource utilisation An example of an admission control algorithm for the selection of the appropriate RAT in the case of RAN cooperation is summarised below [WIND41] [WIND42] [WIND43] [WIND44]
bull The algorithm makes a list of the candidate serving networks and candidate cells for each network The lists contain the candidate networks and cells capable of providing the requested flow service and they are ordered in such a way that better fulfils its requirements in each network
bull If there is only one RAT available in the flowrsquos location area and the flow can be served by that RAT then it is selected otherwise (if the flow cannot be served by that RAT) the flow will be rejected
After selecting the target RAT the algorithm checks if the flow is new or from handover (which means that the flow was already going on in a RAT and for some reason it was decided to change its RAT) If it is a new flow then if there are other flows waiting in the queue it will be rejected (or it will select another RAT if there is one in its list) otherwise it goes to the next step The next step of the algorithm is to check (no matter if it is a handover or new flow) if there are sufficient resources in that network for the flow to be served If there are sufficient resources the flow will be admitted to the target RATmode If the resources of the target RAN are insufficient it will be first checked if the flow can be served by another RATmode If the flow is new and has low priority then it is rejected in this RAN and itrsquos checked if another one can serve it and if none is available the flow is rejected If the flow is from handover or a new - high prioritised it is not rejected in the target RAT but it is first checked if it can be served by another
WINNER D210 v10
Page 102 (180)
RAT (suitable for it) If not it is checked if there is a possibility that other ongoing flows can perform a handover to another suitable network If this action does not also gain the needed resources for the flow then it is checked if degrading the QoS of some ongoing flows (in this RAT) with low priority (where ldquolowrdquo is relative to the priority that the flow has) is possible and enough to admit the flow
If the flow is new and has high priority it will be checked if degrading the QoS (ie lowering the bit rate at a tolerant level) of some low priority flows will gain the needed resources and if yes then the flow is admitted otherwise it is rejected
If it is a handover flow then it is also checked if low priority flows can degrade their QoS as much as it needs to admit the flow If this canrsquot be done the handover flow will enter the handover queue in a position related to its priority that means that it will enter in front of flows with lower priority The flow will remain in the queue until o The needed resources become available (ie by completion of other flows) o The flow leaves the cell ie the user moves to another cell or the flow is completed o The flow is terminated due to timeout
The admission control algorithm for the cooperation between B3G and legacy RANs aims to maximise the number of admitted or in-flow traffic sources supported over the RANs while guaranteeing their QoS requirements and ensuring that the new connection does not affect the QoS of the ongoing connections The decisions to accept or reject a new connection are based on different criteria taking into account each RATrsquos nature
D16 Load control Reactive load control is used to face a situation where the networks are in a overload situation and the usersrsquo QoS is at risk due to increase of the interference mobility aspects low bandwidth availability etc When already admitted users cannot satisfy their guaranteed QoS to their services for a specific percentage of time then the network is considered to be in an overloadcongestion situation Herein we describe am example of a reactive load control mechanism that is monitoring WINNER as well as legacy RANs and if an overload situation occurs it tries to decrease the load of the network performing several actions and especially trying to make the RANs cooperate ie by forcing users to perform handovers The reactive load control algorithm is divided into three phases [WIND41] [WIND42] [WIND43] [WIND44]
1) Detection phase The algorithm continuously monitors the networks and periodically checks the load of the networks in order to detect a overload situation in anyone of them It is considered that a network is overloaded if the load factor is over a certain pre-defined threshold during a certain amount of time
2) Resolution phase This is the phase that the algorithm is trying to resolve the problem that causes the overload situation At first as it is obvious we must drop all the incoming flows (new and handover) as they will increase more the load of the network so admission control is forced to reject the flow requests for that network Then in case flow conditioning is not used the algorithm checks if the overload situation is caused due to users that violate their QoS restrictions in terms of bit rate which means that it tries to find if there are flows that transmit with more bit rate than they should according to the service agreements made between the network and the user If such flows exist then the algorithm drops their bit rate to the value that exists in the service agreements After restoring the bit rate of the users to the agreed there is a check if the network is still in a congestion situation and if so the algorithm performs a number of actions which include handover of flows decreasing of their bit rate or even selective dropping of flows
3) Then the algorithm enters the recovery phase where we try to restore the transmission rate to the flows which rate was decreased in the second step of the resolution phase A recovery algorithm is necessary because we cannot leave the flows with a bit rate that violates the QoS service agreements The problem here is that if we restore the flowsrsquo bit rate incautiously the network could fall once again in a overload situation and thatrsquos why we must be very careful to that For all the flows that we have decreased their bit rate we check (separately) if we can restore their transmission rate without causing congestion again by computing the amount of load needed in order to restore the transmission rate
D17 Routing
The overall picture of the routing in multi-hop cellular networks (MCNs) is depicted in Figure D3 From the architecture perspective two basic routing strategies are envisioned in multi-hop systems centralised or distributed Under the centralised strategy route determination is performed in a central controller which normally possesses powerful processing capability and has knowledge on global network status so that sophisticated routing algorithms could be adopted to optimise the system performance With the
WINNER D210 v10
Page 103 (180)
distributed strategy individual network nodes from the source to the destination jointly perform route determination This strategy could function when no central controller is reachable but its performance is normally limited by network nodesrsquo processing capability and knowledge on network status
Figure D3 Routing in MCNs
In terms of protocol nature the routing algorithms in conventional multi-hop networks such as ad-hoc networks can be mainly broken down into two categories proactive routing and reactive routing With proactive routing schemes network nodes continuously evaluate the topology of the network so that when a packet needs to be forwarded the route is already known and can be immediately used Reactive schemes on the other hand invoke a route determination procedure on demand only Thus when a route is needed some sort of global search procedure is employed in order to find a suitable route to the destination The protocol nature of the routings in MCNs could be both proactive and reactive but being applied at different circumstances for instance reactive routing is be used for idle users whereas proactive routing is applied for active user Nevertheless further studies will be carried out on this issue
For both proactive and reactive routing schemes for ad-hoc networks topologyroute information is normally preserved in routing tables The difference is for proactive routing the table contains up-to-date and complete topology information whereas for reactive routing a route is only created in the table when needed For the routing in MCNs likewise routing tables are also supposed existing at BSs RNs and UTs to keep the necessary routing information for respective nodes This will be further explained in the later part of this section The routing in MCNs is responsible for a number of basic tasks such as routetopology discovery (NB route discovery is normally for reactive routing schemes whereas topology discovery is for proactive ones) and route table updatingmaintenance etc
Decision criteria In the literature various criteria have been proposed for the routing criteria in MCNs such as distance pathloss and transmission power etc For each user these routing algorithms intend to find and choose the route with the least distance pathloss or transmission power etc In our recent work [LHYT01] and [LHYT02] a novel routing criterion named the Load Cost Indicator (LCI) is proposed
ζroute i = Croute i R route i
Where ζroute i is the LCI of route i Croute i represents the consumed capacity of the transmission on route i and R route i is the transmission data rate on route i Apparently such a criterion reflects the consumed system capacity when delivering unit amount of traffic on a particular route Given a certain system capacity constraint if every user employs the route with the least LCI among all its possible routes the system throughput can be maximised
Routing tables As mentioned earlier like in ad-hoc networks in MCNs routing tables are also supposed existing at individual network nodes including BSs RNs and UTs Nevertheless due to the fact that the BS is the common source for all the downstream [WIND25] flows and meanwhile the common destination for all the upstream flows in one radio cell the routing tables in MCNs are much simpler than their counterparts in ad-hoc network moreover for packet delivering purposes an BS only needs to keep downstream routing tabletables a UT only needs to have upstream routing tabletables whereas a RN needs to have both downstream and upstream routing tables Nevertheless as mentioned earlier the routing is envisioned to be centralised (BS-based) in MCNs in another word the route table calculation
WINNER D210 v10
Page 104 (180)
for all the nodes within one cell is to be performed by the BS hence BS actually has the knowledge of the up-to-date route tables at individual nodes within the cell
D2 RRM architecture Intuitively the problem of optimising resources is better posed when doing it in a common fashion rather than regarding separately cellsmodes When information about interference induced by surrounding cells and about the amount of spectrum resources in other modes is available (CRRM approach) algorithms perform better and the usage efficiency is increased This also applies when considering not only surrounding cells but also different radio networks operating simultaneously ie JRRM approach
Benefits of centralised RRM are achieved at the expense of a higher computational complexity since the algorithms have to deal with a higher number of degrees of freedom and involve a larger interchange of information among network agents thus increasing the signalling Time restrictions on signalling are also to be considered Centralised RRM algorithms have been proven to perform worse than distributed ones when delay introduced by signalling is larger than few seconds (5 s)
D21 Location of WINNER functions A first approach regarding the WINNER RRM architecture is shown in Figure D4 According to this approach the mode specific functions are located at the BS and RN while the mode generic user plane ones are located at the RANG logical node All the control plane functionalities are located at the Access Control Server (ACS) logical node A disadvantage of such an RRM architecture would be the possible overload of the system due to increased signalling directed to the ACS node leading to delays
The service level controller (SLC) regarding the downlink is foreseen to be located at some distance from the BSs such as at RANG It has the overall responsibility for adjusting inter-flow fairness assuring the fulfilment of service level contract agreements and total delay constraints It may perform by requesting resources from several BSs that may utilise different WINNER modes working on a slower time scale and may allocate resources belonging to several modesbase stations As buffer management and traffic policing could impose constrains on the service load controller they could be located at the same node After flow classification the service level controller will direct packets of a flow to one specific queue within a buffer residing in an BS or RN On the other hand the flow scheduling of the SLC for the uplink direction will be located at the BS or even the RN The resource schedulers link adaptation and power control should always be located close to the BSs to minimise delays
However all mode generic control plane and cooperative functionalities are located at the ACS logical node In this almost centralised approach the problem of optimising resources is better posed as it is done in a common fashion rather than regarding separately cellsmodesRANs The main disadvantage of such an RRM architecture is the higher computational complexity since the algorithms have to deal with a higher number of degrees of freedom and involve a larger interchange of information leading to the possible overload of the system due to increased signalling directed to the ACS node leading to delays
WINNER D210 v10
Page 105 (180)
bullSchedulingbullService Level Control (uplink)bullShort Term Spectrum AssignmentbullLink AdaptationbullPower Control
bullService Level Control (downlink)bullFlow Establishment amp ReleasebullBuffer ManagementbullTraffic Policing
bullModeRAN SelectionbullHandoverbullAdmission ControlbullLoad Control bullLong Term Spectrum AssignmentbullSpectrum SharingbullRouting
Radio AccessNetwork RANG
AP
RN RN
UT
ARExternal IP
Network
bullSchedulingbullService Level Control (uplink)bullShort Term Spectrum AssignmentbullLink AdaptationbullPower Control
bullService Level Control (downlink)bullFlow Establishment amp ReleasebullBuffer ManagementbullTraffic Policing
bullModeRAN SelectionbullHandoverbullAdmission ControlbullLoad Control bullLong Term Spectrum AssignmentbullSpectrum SharingbullRouting
Radio AccessNetwork RANGRANG
AP
RN RN
AP
RN RN
UTUT
ARExternal IP
Network
Figure D4 WINNER RRM Architecture
It is envisaged that for the WINNER system with the multiple operating modes the hybrid approach would be suitable In particular in order to avoid extensive delays in the decision making and signalling overload a solution could be to bring some of the control plane functions closer to the BS physical nodes adding more complexity to the BS physical nodes and therefore increasing their cost However assuming different types of BSs for the wide-area and short-range scenarios we could restrict the extra functionality to the wide-area BSs (BSwa) In particular the ACS node would comprise mainly the RRM functions needed for the cooperation of the WINNER system with legacy RANs (handling user admission control to the WINNER system) and the coordination of the BSwa (if necessary) where a more comprehensive status of the system is required On the other hand the mode generic related control functions would be located at the BSwa (handling flow admission control) reducing the amount of signalling information required and allowing for faster decisions since the resources are controlled at a cell level For the BSwa to be able to make decisions on mode selection re-selection handover admission control congestion control and spectrum mapping between the BSsr that fall within its cell as well as between it and the BSsr several information are required to be transmitted periodically or upon request from the BSsr to the BSwa These include BSsr id and cell id current load max load power information handover statistics per RN and BSsr (successful drop rate etc) number of RNs attached to BSsr (in case of mobile RNs) CELLsr range (this can be change in case of mobile relays leavingjoining)Furthermore some of the mode specific RRM functions such as scheduling might reside at the RNs performing at different time scales as it is envisioned to have RNs with different functionality layers (layers 123)
D3 RRC functionalities
D31 Measurements and reports To choose the most suitable modeRAT a fundamental aspect is to assess the quality that different modesRATs will provide to the users This quality indication is basically obtained from measurements on the current and target networks RRM mechanisms in B3G systems will be able to use more metrics and information as inputs than the current RRM algorithms since information will be exchanged between networks and new metrics are becoming available
Current handover mechanisms are only based on received power either in cellular systems or in WLAN networks Congestion control algorithms in UMTS use mainly power measurements and service attributes to control access and load On the contrary in B3G systems various metrics coming from all the networks available can be used as inputs of any type of RRM algorithms
Some of these new metrics or information foreseen as useful to improve the RRM performance are listed below
bull Cell load free capacity
bull Location
WINNER D210 v10
Page 106 (180)
bull Velocity direction
bull Users environment (indoor outdoor etc)
bull Terminal capabilities
bull Handover statistics
Other information concerning the link connection includes Price of per bit in the link Security setup and encryption used in the link ARQ status of the link etc
Measurements can be performed either in the base stations or in the user terminal Usually RRM decisions are taken by the network therefore mechanisms must exist to report measurements from base station or terminal to the network The reporting may be periodic event-triggered or on demand
The WINNER system should at least provide to the RRM (orand cooperative RRM) entity
bull Signal strength measurements performed by either terminals or base stations on the WINNER RAN but also on legacy RANs when necessary
bull Transmitted power measurements performed by either UTs or BSs
bull Quality measurements
bull Cell load measurements (eg power measurements L2 buffer load indeed the exact definition of load for the WINNER system must be investigated and will depend on the chosen radio interface)
bull A beacon that terminals on other systems can listen to and measure eg in order to prepare for a handover to WINNER
The possibility for a terminal in a WINNER system to measure the received signal strength of base stationsbase stations of legacy systems should be foreseen when defining the WINNER system Alternatively the RRM entity in WINNER should have access to these measurements on legacy systems Moreover the possibility to exchange load information between WINNER and legacy systems should also be anticipated (eg exchanged between cooperative RRM entities)
WINNER inter-system handover should be consistent with the inter-system HO already defined in legacy systems In particular the inter-system handover procedure between UMTS and another RAT is already specified by the 3GPP Some of the specifications are applicable to any RAT while others are RAT specific (eg specified measurements on GSM are applicable to GSM only) Therefore the WINNER design must fulfil all the requirements that are mentioned in the 3GPP specifications for every RAT and the 3GPP will need to do some specifications dedicated to the WINNER system [WIND41] [WIND42] [WIND43]
D32 Other functions Feature discovery
Both the antenna configuration and relaying issues can be perceived jointly in context of the space-time coded cooperative transmission where virtual antenna arrays are created for the purposes of enhancing the overall WINNER system performance However the question arises how to configure the virtual antenna array and which space time code to select in order to meet the requested Quality of Service Answering this question renders it necessary to investigate the problem of efficient exploitation of the additional information about links provided by the routing protocol Since the target WINNER routing protocol is not established the Multi-Constrained Optimised Link State Routing protocol (MC-OLSR) candidate solution will be used during simulations This protocol which was proposed in [WIND31] and [WIND32] will be expanded with the cooperative relaying functionality which in turn was investigated in [WIND24] where the Adaptive approach to antenna selection and space-time coding was analysed
RRCRRM and cooperative transmission
RRM is connected with RNs assignment transmit power control etc Proper RNs assignment in for the purposes of cooperative relaying in WINNER is very important because it directly affects the transmission parameters and therefore the attainable QoS level When at least coarse channel parameters between the transmitting node and the relaying ones are known it is possible to create the virtual antenna array VAA in a more optimum way To this end the selected RRC functionalities were identified which along the flow of control information are presented in Figure D5
WINNER D210 v10
Page 107 (180)
RRC
Relay Routing Path Calculation
Channel Quality Measurements
Virtual Antenna Configuration
Space-Time Code Selection
QoS Requirements
Figure D5 RRC and cooperative relaying
Here the Radio Resource Control service exploits the Channel Quality Measurements and Relay Routing Path Calculation functionalities in order to perform the space-time coded cooperative relaying in an optimum way It is then of prime importance to identify
ndash how to efficiently exploit the routing information provided by the routing protocol (eg the MC-OLSR protocol)
ndash how to perform routing so that cooperative relaying could be efficiently exploited
ndash how to configure the virtual antenna arrays and which space time code to select so that the requested Quality of Service could be met
There is also a question on how the resource partitioning between BS and RNs should be performed In case of the MC-OLSR enhanced with cooperative relaying it is assumed the control is BS-centralised which means that resources are managed and assigned by BSs
WINNER D210 v10
Page 108 (180)
Appendix E Assessments Assumptions
E1 Overview This chapter summarises baseline simulations assumptions and parameters applied in link multi-link and system-level oriented simulations Four prioritised deployment scenarios A1 B1 C2 and D1 identified in [WIND72] are addressed Additionally the B3 scenario is considered for link level investigations For scenarios A1 B1 and B3 (collectively referred to as ldquoshort-rangerdquo scenarios) evaluations are performed using the TDD cellular system mode and for scenarios C2 and D1 evaluations are performed using the FDD cellular system mode A rough characterisation of these scenarios is given in Table E1 below
Table E1 Basis scenarios considered
Scenario identifier Deployment PHY
mode Mobility [kmh]
BS height
[m]
UT height
[m]
Traffic density
A1 In building
small office residential
TDD 100 MHz 0ndash5 2 1 high
B1 Hotspot
Typical urban micro cell
TDD 100 MHz
0ndash70 eg 10 (below RT21)
15 high
B3 Hotspot
Indoor TDD 100 MHz 0ndash5
C2 Metropolitan
Typical urban macro cell
FDD 2times20 MHz 0ndash70
eg 32 (above
RT) 15 medium
to high
D1 Rural
Rural Macro cell
FDD 2times20 MHz 0-200
eg 45 (above
RT) 15 low
It should be stressed that the selected assumptions models and parameters reflect a compromise taking into account the latest system design aspects the realisable simulator capabilities as well as the open issues to be addressed They only served as baseline assumption slightly different settings may have been used in the end Moreover not every detail is covered especially with respect to system level simulations in order to keep the simulator setup feasible for many partners
E2 Basic parameters for link level evaluations For performance evaluation of different link level parts (mainly modulation schemes channel estimation and synchronisation) the system parameters fixed in Table 21 have been used for simulation As channel models one ldquorepresentativerdquo example (ie a channel having a reasonable delay spread) has been selected for each the FDD and TDD case based on the tapped delay line models provided in [WIND54] The model C2 NLOS has been selected for simulations with the FDD system parameters while the B3 NLOS model was the baseline comparison case for the TDD system parameters Additionally the A1 NLOS model was used in some simulations as an example for a channel providing a high degree of spatial diversity (ie suitable for achieving high spectral efficiency when using spatial multiplexing techniques) For channel coding the memory 6 convolutional code was used as a baseline case (gains of around 2 dB are expected when using better codes for large block lenghts cf Appendix F2) More advanced coding schemes were used in Appendix F1 in order to demonstrate the potential performance of the coding within the WINNER physical and MAC layers For the (relative) performance assessment of different coding techniques simple BPSK transmission over an AWGN channel was used (without OFDM modulationdemodulation) as the relative merits of different coding techniques proved to be relatively independent of the channel and modulation technique [WIND23]
21 RT = rooftop
WINNER D210 v10
Page 109 (180)
E3 Basic parameters for multi-link and system level evaluations
E31 Mode specific parameters
FDD mode (used in wide area simulations) Parameter DL UL Centre frequency 50 GHz 42 GHz Bandwidthchannelisation 20 MHz paired ULDL Duplex scheme (T+F)DD Transmission technique OFDM
∆f=20 MHz512 = 390625 Hz rarr TN =256 micros fc=k∆f kisin[-208208] kne0 TG=32 micros rarr T=TN + TG =288 micros
a) single carrier (continuous) Pulse period T = 256 micros416 = 6154 ns pulse shaping square root raised cosine with roll-off β=0231 b) single carrier (block oriented) same pulse as in a) block length 416 symbols rarr TN = 256 micros guard length TG=32 micros
Number of sectors 3 1 Antenna configuration WA1
BS | A1 |
Antenna configuration WA2 (ULA)
BS | | | | | | | | (05λ)
A1 | A2 | | (05λ) A3 | | | | (05λ)
Antenna gain 15 dBi 0 dBi Frame length 6912 micros (=2 DL chunks) chunk size 8 subcarriers times 12 OFDM symbols unspecified overhead (parameter estimation signalling)
19 out of 96 resource elements of each chunk
unspecified
TDD mode (used inshort range simulations)
Parameter DL UL Centre frequency 50 GHz Bandwidthchannelisation 100 MHz Duplex scheme TDD Transmission technique OFDM
∆f=100 MHz2048 = 48828125 Hz rarr TN =2048 micros
fc=k∆f kisin[-832832] kne0 TG=128 micros
rarr T=TN + TG =2176 micros Number of sectors 1 1 Antenna configuration SA1
BS | A1 |
Antenna configuration SA2 (ULA)
BS | | | | | | | | (05λ)
A1 | A2 | | (05λ) A3 | | | | (05λ)
Antenna gain 8 dBi 0 dBi Frame length 6912 micros (3 DL chunks + 3 UL chunks + 2 times duplex guard time)
duplex guard time = 192 micros chunk size 16 subcarriers times 5 OFDM symbols virtual overhead for parameter estimation
15 out of 80 resource elements of each chunk
unspecified
WINNER D210 v10
Page 110 (180)
E32 Common to all modes
Parameter DL UL Coder convolutional coder Interleaver random bit interleaver Modulation formats BPSK QPSK 16-QAM 64-QAM Spreading codes Walsh-Hadamard (WH) WH (synchronous UL)
Gold (asynchronous UL) Medium access scheme frequency adapative scheduling rarr OFDMATDMA
frequency non adaptive scheduling rarr OFDMATDMAMC-CDMA Channel estimation at Rx perfect Synchronisation perfect channel measurement accuracy for adaptive processing
perfect
delay between CQI measurement and its application
1 Frame
Equalisation (if required) MMSE Demodulation ML based soft output demodulation
If equaliser is present apply ML criterion to equaliser output signal noise spectral density -174 dBmHz noise figure 7 dB (at MT) 5 dB (at BS) Resource assignment strategies
non-adaptive mode round robin adaptive mode score-based opportunistic scheduling
Link adaptation strategies
non-adaptive mode adaptive coding and modulation based on average CSI (across all sub-channels)
adaptive mode adaptive modulation and coding per chunk based on instantaneous CSI
(H)ARQ none power control no perfect azimuth pattern of antenna elements ]dB[25
7012min)(
2
⎥⎥⎦
⎤
⎢⎢⎣
⎡⎟⎠⎞
⎜⎝⎛minus=
θθA
θ3dB= 70o
omni directional
correlation of shadow fading between sectors
same site full ie use same value different site no
correlation of fast fading between sectors
same site use same bulk parameters but redraw delays AoAs AoDs hellip different site no
WINNER D210 v10
Page 111 (180)
E4 Scenario parameters Parameter A1 B1 C2 D1
channel modelling WINNER-I interim channel models see WP5 deliverables Average BS transmit power 1 W 4 W 20 W per sector
Average UT transmit power 200 mW
Cell radius R unspecified 1 km Cellular structure hexagonal grid see Figure E1 Number of cells to be simulated 19 three sector sites
frequency reuse distance
isolated cell only
unspecified
number of users variable parameter but constant for any simulation run and snapshot user distribution uniform within cell area uniform within 19-cell area user location update random drop of users in every snapshot
within each snapshot users virtually remain at fixed positions even in case of velocity |v| gt 0 kmh
Traffic model full queue assumption (holds for any user) Mobility model (only affects fast fading)
anglev sim U(02π) vx sim η(mσ 2) vy sim η(mσ 2) |v|= (vx
2+vy2)05
mobility model parameter
M1 m1= 1 kmh σ1= 16 kmh
M1 m1= 1 kmh σ1= 16 kmh M2 m2= 5 kmh σ2= 12 kmh
M1 m1= 1 kmh σ1= 16 kmh M2 m2= 25 kmh σ2= 15 kmh
M1 m1= 1 kmh σ1= 16 kmh M2 m2= 55 kmh σ2= 29 kmh
Distribution of user characteristics considering cases SA1WA1 (SISO)22
M1 100 A1 100
M1 80 M2 20 A1 100
M1 50 M2 50 A1 100
M1 40 M2 60 A1 100
Distribution of user characteristics considering cases SA2WA2 (MIMO)7
M1 100 A1 20 A2 40 A3 30
M1 80 M2 20 A1 20 A2 40 A3 30
M1 50 M2 50 A1 50 A2 30 A3 20
M1 40 M2 60 A1 50 A2 30 A3 20
Figure E1 Example sketch of cellular scenario with 19 three-sector sites
22 No correlation between mobility transmit power and antenna parameters is taken into account so far
WINNER D210 v10
Page 112 (180)
Appendix F Link-Level Assessments The merits of different coding modulation channel estimation and link adaptation techniques have already been assessed in a number of previous WINNER deliverables most notably [WIND22 WIND23WIND24WIND26WIND27] Therefore this chapter contains mainly assessment results necessary to justify the WINNER system design decisions reported in Chapter 2 of this report Thus Appendix F2 presents a detailed comparison of the complexity and performance of Duo-Binary Turbo Codes and Block-LDPC codes as these have been identified as the most promising FEC candidate technologies More detail on the assessment methodology and other coding techniques (CC standard PCCC and PEG-based LDPCC) can be found in [WIND23] Appendices F3 and F4 provide detail on the performance of different channel estimation and synchronisation techniques to back up the results from Appendix B4 in terms of the amount of pilots required to achieve a CSI of sufficient quality at the receiver Finally in Appendix F5 results for the performance of different bit-and power-loading algorithms are presented Another purpose of this chapter is to present results that give insight into the overall performance of the WINNER physical layer ndash Appendix F1 serves that purpose
F1 Link layer performance Throughput In order to assess whether the performance of the WINNER physical layer is sufficient to live up to the requirements stated in Section 11 and in order to provide first results that allow for an estimation of the SNRs required to achieve different spectral efficiencies the performance of a single user CP-OFDM system using advanved coding (3GPP Turbo Code 8 iterations maxLogMAP decoding) has been evaluated This setup can be considered as an example of a single user served in the non-frequency-adaptive mode (where MC-CDMA with spreading factor 1 reduces to CP-OFDM) Note that the protocol overhead (super-frame structure in-band signalling pilot subcarriers) as well as SNR penalties due to imperfect channel estimation synchronisation are not included in this assessment The overhead due to guard bands on the other hand is included The overall throughput of a single link will hence be slightly lower than the figures given in the following plots and the required SNR will be slightly higher The activity factor for FDD is not included in the throughput figures an appropriate scaling must be included for all cases where the activity factor is smaller than 1
Table F1 Summary of parameters for WINNER channel models
Scenario identifier Deployment PHY mode
UT speed [kmh]
Delay Spread [ns]
Composite angular
Spread at BSMT
[degrees]
A1 In building
small office residential
TDD 100 MHz 3 24 232391
B1 Hotspot
Typical urban micro cell
TDD 100 MHz 3 90 124364
B3 Hotspot
Indoor TDD 100 MHz 3 30 3187
C2 Metropolitan
Typical urban macro cell
FDD 2x20 MHz 70 310 853
D1 Rural
Rural Macro cell
FDD 2x20 MHz 70 28 224179
Table F1 summarises some relevant parameters for the used WINNER tapped delay line models Scenario A1 and B3 provide roughly the same amount of frequency diversity However the angular spread at the BS is very small for the B3 and C2 models ndash in contrast to most other results presented in this chapter the scenario A1 has therefore been selected for TDD mode evaluations Although both wide area cases (metropolitan and rural) have been simulated the focus in the present section is on the
WINNER D210 v10
Page 113 (180)
metropolitan area where the larger traffic demands can be expected In this scenario the high correlation between BS antennas is expected to significantly affect the gains achievable by using spatial multiplexing techniques as is confirmed by the results in Figure F3
Figure F1 below shows the performance of a SISO system with the parameters from Table 21 for FDD mode operation (20 MHz bandwidth the used channel model is the clustered delay line model C2 NLOS from [WIND54]) A SNR beyond 20 dB is required to achieve a spectral efficiency of 3 bitsHz Taking a duplex activity factor of 05 and an overhead of 20 into account the spectral efficiency design target of 05 bitsHzlink in the downlink (see 70 kmh in Appendix A13) corresponds to about 25 Mbits which with dual-antenna terminals as baseline (roughly 3 dB gain in this scenario) and assuming a loss of 1 dB from non-ideal channel estimation requires a SINR of around 9 dB A simple link budget (using pathloss models and other parameters listed in Appendix E23) based on this SINR requirement gives a maximum cell range very close to 1000 m without indoor-to-outdoor coverage This indicates that the above-mentioned cell-average of 05 bitssHzlink with single user should be possible to obtain with some margin even without relays
Turning to the rural area scenario simulations (not shown) together with a link budget24 show that the spectral efficiency target of 05 bitsHzlink at 70 kmh can be reached with good margin (up to a cell range of well above 3 km) For the uplink the targets are somewhat tougher but should still be reachable (in particular with relays)
-5 0 5 10 15 20 250
10
20
30
40
50
60
70
SNR [dB]
Thro
ughp
ut [M
Bit
s]
16-QAMRc = 12
BPSKRc = 12
4-QAMRc = 12
64-QAMRc = 12
64-QAMRc = 34
Figure F1 Throughput of CP-OFDM-based FDD mode system (20 MHz SISO C2 NLOS)
Figure F2 depicts the TDD mode case (100 MHz bandwidth again for a SISO setup) ndash data rates are evidently higher while spectral efficiency figures are comparable as could be expected from the system definition in Table 21 The channel model used is A1 NLOS from [WIND54] Achieving the target spectral efficiency of 4 bitsHz (cf Appendix A14) with half-duplex and 20 overhead corresponding to about 1000 Mbits seems to be difficult without the use of some form of spatial multiplexingspatial diversity techniques to be further discussed in the following
23 Noise bandwidth 16 MHz noise figure 7 dB on DL (5 dB on UL) transmit antenna gain 15 dB output power 20
W Based on the shadow fading standard deviation of 57 dB a shadow fading margin of 35 dB was assumed by scaling the results in [SGF95]
24 Here the shadow fading standard deviation is 8 dB and a margin of 5 dB was used cf [SGF95]
WINNER D210 v10
Page 114 (180)
-5 0 5 10 15 20 250
50
100
150
200
250
300
350
SNR [dB]
Thro
ughp
ut [M
Bit
s]
16-QAMRc = 12
BPSKRc = 12
256-QAMRc = 12
4-QAMRc = 12
64-QAMRc = 12
Figure F2 Throughput of CP-OFDM-based TDD mode system (100 MHz SISO A1 NLOS)
Figure F3 and Figure F4 show the performance for the spatial multiplexing case for both FDD and TDD mode operation For the FDD system a 2x2 MIMO setup was selected while a 4x4 MIMO setup was used for the TDD case where more spatial diversity is expected to be available (cf the higher angular spread at the base station in Table F1)
0 5 10 15 20 25 300
10
20
30
40
50
60
70
80
90
SNR [dB]
Thro
ughp
ut [M
Bit
s]
16-QAMlinear16-QAMmlBPSKlinearBPSKml4-QAMlinear4-QAMml64-QAMlinear64-QAMml
Figure F3 Throughput of CP-OFDM-based FDD mode system (20 MHz 2x2 MIMO C2 NLOS)
WINNER D210 v10
Page 115 (180)
For both setups the performance was evaluated when using a simple linear MMSE equaliser and also when using a high performance equaliser (ML detection where possible otherwise Sphere Detection with a sufficient number of full length candidates) Taking the results for the latter receiver architecture and comparing then the MIMO with the SISO case allows for identifying the performance losses due to antenna correlation (the throughput would roughly scale with the number of transmitreceive antennas in a completely uncorrelated scenario) Comparing the results of the linear and the MLSphere detector allows for identifying how much gains can be achieved by using advanced receiver architectures as compared to the simplest one As is evident a SNR in excess of 30 dB would be required to run the maximum modulationcoding schemes investigated for the SISO case in Figure F1 and Figure F2 Consequently the maximum spectral efficiency does not scale fully with the number of antennas which can be attributed to the limited amount of spatial diversity A spectral efficiency of around 4 bitsHz is achieved at SNR=25 dB for the 2x2 MIMO FDD case when using a high performance detector The gains at lower SNRs which are expected in multi-cell environments are substantially lower More specifically at a SNR of 4 dB the spectral efficiency is not increased with respect to the SISO case
For the 4x4 MIMO TDD case a spectral efficiency of 12 bitsHz is achieved at SNR=30 dB At a bandwidth of 100 MHz this would with an activity factor close to 1 allow achieving the target peak data rate of 1 Gpbs cited in Section 11 With half-duplex and 20 overhead the design target spectral efficiency of 4 bitsHz (cf Appendix A14) can also be achieved at about 30 dB
-5 0 5 10 15 20 25 300
200
400
600
800
1000
1200
SNR [dB]
Thro
ughp
ut [M
Bit
s]
16-QAMlinear16-QAMsphereBPSKlinearBPSKml256-QAMlinear4-QAMlinear4-QAMml64-QAMlinear64-QAMsphere
Figure F4 Throughput of CP-OFDM-based TDD mode system (100 MHz 4x4 MIMO A1 NLOS)
WINNER D210 v10
Page 116 (180)
F2 Forward error correction In this part the two main channel coding candidates Duo-Binary Turbo-Codes and Quasi-Cyclic Block-LDPCC are investigated their performance compared and finally first results on the complexityperformance trade-off are given In order to cover a wide range of applications 5 different block lengths have been selected 576 1152 1728 2304 and 4308 coded bits together with 3 different code rates Rc = 12 23 and 34 The assessment in this section follows the framework from [WIND23] For details on cycle count and energy consumption figures please refer to [WIND23] The performance comparison is done for BSPK transmission over the AWGN channel The (relative) assessment however is expected to be similar for a wide range of channels as was confirmed by the assessment done in [WIND23] for different types of Rayleigh fading channels
F21 Performance comparison The performance comparison (cf Figure F5) underlines the fact that the selection of an appropriate coding technique depends crucially on the target block length For code rate 05 DBTC outperform BLDPCC for block lengths up to 1728 (02 dB gain over BLDPCC for N = 576) Then LDPCC start progressively to outperform DBTC (01 dB better for N = 4308) In general the performance loss by going from large to small block sizes is lower for DBTC than for BLDPCC The threshold (in terms of block length) that separates these two regimes however depends on the code rate When increasing the code rate to Rc = 34 a block length of 1152 is sufficient for the BDLPCC to achieve the same performance as the DBTC and the difference observed for N = 576 is very small (cf Figure F7)
08 1 12 14 16 18 2 22 2410-3
10-2
10-1
100
EbN0 [dB]
BLE
R
DBTC vs QC-BLDPCC BPSK Rc=12 AWGN
BLDPC N=576BLDPC N=1152BLDPC N=1728BLDPC N=2304BLDPC N=4308DBTC N=576DBTC N=1152DBTC N=1728DBTC N=2304DBTC N=4308
DBTC Max-Log-MAPBLDPC LLR-BP 50 Iter
Figure F5 Performance comparison between DBTC and QC-BLDPCC Rc=12
F22 Complexity-performance trade-off Relying on the computational complexity assessment introduced in [WIND23] and [3GPP-WG142] together with the relative cost of operations given by Table 51 from [WIND23] the energy consumption and cycle counts were computed for both DBTC and BLDPCC For the sake of clarity we restricted the presentation of results to two extreme block length cases N = 2304 and N = 576 respectively In the case of DBTC only the Max-Log-MAP decoder with scaling of extrinsic information (factor 05 in the first
02dB 01dB01d
WINNER D210 v10
Page 117 (180)
075 in the 2nd to 7th and 1 in the last iteration) is used as it has been proven to give performance similar to Log-MAP decoding at attractive reduction in complexity Similarly the MinSum algorithm (MSA) provides the best trade-off for LDPC decoding as illustrated by the results in Appendix F24 Additionally alternative schedulings (shuffled decoding) should be used as they lead to faster convergence of the decoding algorithm and (same performance at roughly half the iterations cf results in Appendix F25)
In the sequel we tried to keep similar notations already introduced into [WIND23] Due to comparison between different packet lengths minor modifications have been proposed Packet length of N = 2304 bits are represented by purple coloured markers and those of N = 576 bits by blue coloured markers Concerning DBTC the triplet ldquo(mx iy lgMPz)rdquo indicates the memory size lsquoxrsquo of constituent encoders the number of maximum iterations lsquoyrsquo and maxLogMAP (lsquoz=0rsquo) or logMAP (lsquoz=1rsquo) decoding algorithm respectively In the present investigation only the maxLogMAP decoding algorithm will be considered for Duo-Binary Turbo-Code and its marker will be a diamond Due to simple operations only the edge colour will be green (energy cost=cycle count) The marker face colour represents the considered packet length In the case of block LDPC codes we have to differentiate also the number of iterations A circle marker denotes the maximum complexity (maximum number of iterations 20 in the considered setup) A triangle marker is used for the average complexity (average number of iterations) Energy and Cycles are distinguished then by the use of non-filled or filled marker respectively
15 16 17 18 19 2 21 220
200
400
600
800
1000
1200
1400
1600
1800
BLDPCC (MSAmax=20)N=576
EbN0 [dB] Required for BLER 1
Rela
tive
Cycl
eE
nerg
y
BLDPCC (MSAmax=20)N=2304
BLDPCC (MSAmax=20)N=2304
BLDPCC (MSAavg)N=2304
BLDPCC (MSAavg)N=2304
DBTC (m3i8lgMP0)N=2304
DBTC (m3i8lgMP0)N=576
DBTC Vs BLDPCC N=576 N=2304 Rc=05 AWGN
BLDPCC (MSAavg)N=576
BLDPCC (MSAmax=20)N=576
BLDPCC (MSAavg)N=576
Figure F6 Complexity-performance trade-off for QC-LDPCC and DBTC Rc=12
For the case of Rc=12 depicted in Figure F6 above Duo-Binary Turbo-Codes offer a better complexity-performance trade-off than block LDPC codes with low block size (N = 576) as they perform better at only slightly more energy consumption (wrt the maximum iteration case for BLDPCC) However for a higher block length (N = 2304) BLDPCC become more suitable since their energy consumption saving is achieved at the expense of only minor performance degradation These two trends are reinforced throughout the remaining results cf Figure F7 below Indeed the higher the coding rate the less energycycles are required by BLDPCC (provided that the high code rate is achieved by using a code of a different rate rather than puncturing the rate 12 code) It might be worth mentioning that DBTC still outperform BLDPCC for lower block length but their higher energy consumption in the present case of 8 internal decoder iterations seems to be the price to be paid for such performance
WINNER D210 v10
Page 118 (180)
26 27 28 29 3 31 32 33 34 350
200
400
600
800
1000
1200
1400
1600
1800
EbN0 [dB] Required for BLER 1
Rela
tive
Cycl
eE
nerg
y
DBTC Vs BLDPCC N=576 N=2304 Rc=075 AWGN
DBTC (m3i8lgMP0)N=2304
DBTC (m3i8lgMP0)N=576
BLDPCC (MSAmax=20)N=2304
BLDPCC (MSAmax=20)N=2304
BLDPCC (MSAmax=20)N=576
BLDPCC (MSAmax=20)N=576
BLDPCC (MSAavg)N=2304
BLDPCC (MSAavg) N=2304
BLDPCC (MSAavg) N=576
BLDPCC (MSAavg) N=576
Figure F7 Complexity-performance trade-off for QC-LDPCC and DBTC Rc=34
This complexityperformance trade-off is a necessary step towards fair comparison of these two main channel coding candidates DBTC and BLDPCC Although these results are quite informative they are not yet sufficient for any further technological decision Indeed the number of gates and the memory size requirements together with performance robustness to quantisation (fixed point simulations) still have to be investigated still Based on current assessment and know-how these two channel coding techniques look more like complementary than concurrent solutions (wrt block length) The next phase of WINNER (Phase II) should give additional answers and lead to in-depth understanding and comparison of both technologies by focusing more and more onto architecture and implementation aspect
F23 Performance comparison of rate compatible punctured codes The performance of rate compatible punctured standard PCCCs and LDPCCs can be considered to be equal LDPCC show better performance at high SNR which however is less relevant for HARQ as negligible number of retransmissions are needed in this SNR regime Figure F8 shows exemplary the performance of constructed BLDPCC punctured BLDPCC and DBTC for two block lengths (the mother code rate of the punctured codes was Rc = 12) Note that the average number of iterations of punctured LDPCC is about twice as large as that of the constructed LDPCC
F24 BLDPCC performance comparison of major decoding algorithms In recent years a lot of different LDPC decoding algorithms have been proposed in literature Our target in this part is thus to compare the most important ones ndash Belief Propagation [Gal63] A-Min [JVS+03] Lambda-Min [GBD03] Min-Sum and its corrected version [CF02] To do so we have assessed their performance for different block lengths and code rates As a summary of the performance-complexity trade-off Figure F9 depicts the decoding complexity over the bit SNR required to achieve BLER 1 for the example code rate 05 and two different code block lengths (again purple for N=2304 and blue for N=576) The advantage of the MinSum can be emphasised quite clearly as it leads to good performance at low cost expense
WINNER D210 v10
Page 119 (180)
0 05 1 15 2 25 3 3510-3
10-2
10-1
100Puncturing Block LDPC SEUK exact BP decoder max 50 iterations
EbN
0
BLE
R
punctured BLDPC R=066 N=1728 constructed BLDPC R=066 N=1728DBTC R=066 N=1728punctured BLDPC R=075 N=2304constructed BLDPC N=2304DBTC R=075 N=2304
Figure F8 Rate-compatible puncturing of block LDPC
14 16 18 2 22 24 260
1000
2000
3000
4000
5000
6000
7000
8000
9000
10000
BPA
BPA
EbN0 [dB] required for BLER 1
Rel
ativ
e C
ycle
Ene
rgy
DBTC vs BLDPCC N=576 N=2304 Rc=05 AWGN
BPA
BPA
MSAMSA
AMA
AMA
AMA
AMA
LMA 2
LMA 2
LMA 2
LMA 2
LMA 3
LMA 3
LMA 3
LMA 3
Figure F9 Complexity-performance trade-off for different LDPC decoding algorithms Rc=12
F25 Performance when using different decoding schedules Figure F10 illustrates that the same performance can be achieved by using either a maximum of 50 iterations and flooding decoding or a maximum of 20 iterations and shuffled decoding (cf Appendix B24)
WINNER D210 v10
Page 120 (180)
0 05 1 15 2 25 3 35 410-3
10-2
10-1
100Horizontal shuffling vs flooding schedule Block LDPC Z=12 N=576
EbN0 [dB]
BLE
R
flooding R=05shuffling R=05flooding R=066shuffling R=066flooding R=075shuffling R=075
05 1 15 2 25 3 3510-3
10-2
10-1
100Horizontal shuffling vs flooding schedule Block LDPC Z=48 N=2304
EbN0 [dB]
BLE
R
flooding R=05shuffling R=05flooding R=066shuffling R=066flooding R=075shuffling R=075
Figure F10 Scheduling of BPA decoder for block LDPC of lengths N=576 N=2304 Horizontal (group 48) shuffling with max 20 iterations vs flooding schedule with max 50
iterations
F26 Base model matrices for BLDPC codes The BLDPCC investigated in this document are relying on the following base model matrices in conjunction with the appropriate expansion process They constitute the current state-of-the-art when it comes to (LDPC) code construction in the WINNER project and will be the starting point of investigations in WINNER Phase II The three base model matrices in Figure F11 - Figure F13 correspond to the three code rates Rc=12 Rc=23 and Rc=34 respectively
Figure F11 (24 48) Base model matrix Rc=12
WINNER D210 v10
Page 121 (180)
Figure F12 (16 48) Base model matrix Rc=23
Figure F13 (12 48) Base model matrix Rc=34
WINNER D210 v10
Page 122 (180)
F3 Channel estimation
F31 Uplink single carrier As mentioned in Appendix B42 time domain or two types of frequency domain pilots are options for channel estimation for uplink single carrier In comparative simulations the C2 urban macro channel was used with parameters from Table 21 for frequency domain generation of a single carrier signal A classical Doppler spectrum was assumed to generate channel realisations with UT speed of 50 kmh The coding used was a rate 12 convolutional code with memory 6 Random bit interleaving was also included In the receiver a linear MMSE symbol based equaliser and an iterative soft decision feedback equaliser [TB04] were tested The soft Viterbi algorithm was used in the decoder The time domain multiplexed pilot signal was a 64-symbol Chu sequence which has a uniform envelope and power spectrum The FET frequency domain pilots were formed from the FFT of a 52-point Chu sequence the FFT components were mapped to the pilot grid every 8th frequency of every 5th block This grid was found to be more effective for the SC system than the FDD grid of Figure B6 used for the OFDM-PACE system and had approximately the same overhead For FDSP since no extra subcarriers are used for pilots a more liberal grid was used with pilot subcarrier spacing of 8 and pilot block spacing of 2 For blocks with pilots least square (LS) estimator was used for lsquorawrsquo channel estimation followed by an FFT interpolator in frequency domain Linear LS line fitting was used for channel estimates for blocks without pilots25 This approach is suboptimal but relatively simple Simulation results were obtained by averaging the block error rate (BLER) over 10000 frames There were 12 blocks (and thus 12 correlated channel realisations) per half-frame (slot)
The iterative soft decision feedback equaliser (SDFE) is a simplified version of a frequency domain turbo equaliser [TB04] Its iterative process does not include decoding or channel estimation One or two iterations are generally sufficient to yield a significant performance improvement over linear equalisation on severely dispersive channels It is more effective than a conventional hard decision DFE and avoids its error propagation problem at the expense of slightly higher complexity SDFE brings the performance of the FDSP technique closer to that of the linearly-equalised FET and TDM techniques at the expense of some extra receiver complexity
Other considerations also influence the choice of a channel estimation pilot scheme for serial modulation The prime advantage of serial modulation over OFDM is its lower PAPR and hence lower transmit power backoff requirement The PAPR is not affected by the addition of a Chu sequence time domain pilot signal but the addition of frequency domain pilots amounts to the transmission of several parallel waveforms and thus increases the PAPR somewhat Furthermore it can be shown that the PAPR is also increased in the FET approach due to the rearrangement and expansion of the signal spectrum to accommodate the added pilots Measurements of the power backoff required to confine the transmitted spectrum to a given spectral mask indicate that the backoff is still less than that of a comparable OFDM signal but the margin is slightly reduced for FDSP and more so for FET Another consideration is overhead the FET and TDM techniques both incur higher overhead than the FDSP technique
Figure F14 shows block error rate performance curves for TDM FET and FDSP pilot techniques as well as for the case of no pilots and perfect channel state information Figure F14 (a) shows the results for linear equalisation and Figure F14 (b) shows results for the soft iterative DFE with two iterations The 1rsquos and zeroes in the legend indicate which blocks have pilots and P indicates the number of pilots per block eg [100000000001] indicates pilots in every 11th block and P=104 indicates 104 pilots in a set of 416 used subcarriers ndash equivalent to the pilot grid scheme of Figure B6
25 For MS speed lt=70 kmh we assume the channel varies linearly within one frame
WINNER D210 v10
Page 123 (180)
0 2 4 6 8 10 12 1410-3
10-2
10-1
100
SNR [dB]
BLE
R
SC Rc = 12 K=7 Scenario C2 v=50kmh LE
TDM[100000000001] P=64TDM[101010101001] P=64FET[100000000001] P=52FET[100000000001] P=104FET[100001000010] P=52FET[101010101001] P=52FDSP[100000000001] P=52FDSP[101010101001] P=52Known CSI with LE
0 2 4 6 8 10 12 1410-3
10-2
10-1
100
SNR[dB]
BLE
R
SC Rc=12 K=7 Scenario C2 v=50kmh soft DFE
TDM[100000000001] P=64TDM[101010101001] P=64FET[100000000001] P=52FET[100000000001] P=104FET[100001000010] P=52FET[101010101001] P=52FDSP[100000000001] P=52FDSP[101010101001] P=52Known CSI with LEKnown CSI with Soft DFE
(a) (b)
Figure F14 Block error rates for linear (a) and soft DFE equalisers (b)
Table F2 summarises the SNR degradations relative to known channel for OFDM from Figure F15 and also the total overhead The total overhead includes pilots cyclic prefix and unused subcarriers in the FFT blocks The extra backoff is with respect to the power backoff required for the OFDM system The power backoff in each case was determined so to accommodate the transmitted spectrum emerging from a power amplifier modelled by a Rapp model [Rap91] with parameter p=2 The table also includes the OFDM-PACE and the iterative channel estimation OFDM-ICE scheme Iterative channel estimation schemes could also be applied for single carrier but were not evaluated here
WINNER D210 v10
Page 124 (180)
Table F2 Comparison of performance pilot overhead and required power backoff for three different pilot schemes for linear equalisation and soft decision feedback equalisation and for
OFDM Channel is C2 with wide area FDD signal parameters
Pilot schemes SNR degradation
BLER=10-2 relative to SNR=86 dB for OFDM with perfect CSI (dB)
Total overhead26 ()
Power backoff to satisfy spectral mask relative to OFDM (dB)
Power penalty relative to OFDM with perfect CSI (dB) and no pilots
(col 2+col 4)
LE27 SDFE28 LE SDFE
SC-TDM29 37 27 285 -30 07 -03
SC-FET30 36 24 296 -11 25 13
SC-FDSP31 39 29 278 -15 24 14
OFDM - PACE32 17 294 0 17
OFDM - ICE(8)33 0 294 0 0
The calculated overheads which are a direct measure of modulation inefficiency for the various schemes are similar Most of the overhead is contributed by cyclic prefix and unused subcarriers rather than by pilots The tablersquos last column shows the power penalty due to the combination of SNR degradation and required transmitter power backoff for a given power amplifier We see that single carrier with time division pilots give the least power penalty The single carrier frequency domain pilots and OFDM schemes are about 1 to 2 dB worse (due to their increased backoff requirements) The single carrier frequency domain pilot schemes have roughly the same power penalties as those of OFDM-PACE when the receiver uses the soft iterative DFE and would likely have similar penalties as OFDM-ICE if iterative channel estimation were added The major power backoff advantage of single carrier is best realised when time domain pilots are used for channel estimation
F32 Pilot-aided and iterative channel estimation for OFDM In this section pilot-aided (PACE) and iterative channel estimation (ICE) is evaluated for non-adaptive OFDM transmission in both FDD and TDD mode [WIND21 WIND23] The pilot-aided technique relies
26 Total overhead =
(1 )CP pilot GI CP GIp p
FFT CP pilot t FFT CP
N N N N NN N N N N
α α+ + +
sdot + minus+ + +
Where NCP cyclic prefix length=64 Npilot number of pilot symbols per block=52 64 or 104 NGI number of unused subcarriers in each FFT block=96 NFFT FFT block length=512 Npilott number of time domain pilot symbols (if any)=0 or 128 αp fraction of blocks with overhead-causing pilots=111
27 Linear frequency domain equaliser 28 Soft iterative decision feedback equaliser with 2 iterations 29 Single carrier with 64-symbol time domain-multiplexed pilot sequences Pilot sequence inserted every 11th block 30 Single carrier with frequency domain pilots inserted every 8th frequency in every 5th block 31 Single carrier with frequency domain pilots replacing data at every 8th frequency in every second block 32 OFDM with frequency domain pilots inserted every 4th frequency in every 11th block Results from Figure F15 33 Iterative channel estimation using 2 turbo iterations
WINNER D210 v10
Page 125 (180)
on common pilots proposed in Appendix B42 scattered over the whole available bandwidth or solely from dedicated pilots of one chunk
The pilot grid used for simulations is in line with the general pilot grid pattern suggested in Appendix B42 For Wiener filtering a robust filter design is selected for each mode according to the specifications of the ldquomismatched Wiener interpolation filter (WIF) in Appendix F33 While the actual velocity for the typical urban macro channel model C2 is set to 50 kmh a UT velocity of 100 kmh was assumed to generate the filter coefficients in time direction For the correlation in frequency direction a mismatched filter assuming a maximum delay of the channel τmax equal to the CP duration is used
For the case of QPSK modulation we consider channel estimation with common pilots using the full bandwidth and with dedicated pilots for chunk-based channel estimation The allocation of chunks to users is performed in a round-robin manner In the numerical simulations the channel encoder is a memory 6 CC with generator polynomials (133171) in octal form At the base station each data stream corresponding to a given user is iteratively decoded Figure F15 shows the BLER performance achieved with PACE or ICE respectively in the TDD and the FDD mode when channel estimation is carried out at the chunk level or using the full available bandwidth The results are summarised in Table F3 For ICE with common pilots no performance loss relative to perfect channel knowledge is observed For chunk based channel estimation with dedicated pilots ICE turns out to be particularly effective Generally the performance loss relative to perfect channel knowledge is greater in the FDD mode In this transmission scenario the user mobility and a higher frequency selectivity of the channel render channel estimation more difficult than for the TDD case
Table F3 SNR degradation of several channel estimation techniques with respect to the case of perfect channel knowledge at the receiver
Transmission mode SNR Degradation BLER = 10-2
Channel model
mobility Chunk-based -
PACE Chunk-based -
ICE Full BW -
PACE Full BW ndash
ICE
TDD B3 no mobility 28 dB 09 dB 12 dB 0 dB
FDD C2 100 kmh 34 dB 11 dB 17 dB 0 dB
0 2 4 6 8 10 12 1410-3
10-2
10-1
100
SNR [dB]
BLE
R
Perfect CSIChunk-based - PACEChunk-based - ICE 3 iterFull BW - PACEFull BW - ICE 2 iter
0 2 4 6 8 10 12 1410-3
10-2
10-1
100
SNR [dB]
BLE
R
Perfect CSIChunk-based - PACEChunk-based - ICE 3 iterFull BW - PACEFull BW - ICE 2 iter
Figure F15 BLER performance for PACE or ICE at the chunk level or using the full data
bandwidth with QPSK modulation Left SISO TDD mode channel B3 NLOS no mobility right SISO FDD mode channel C2 NLOS UT velocity 50 kmh
Figure F16 depicts the BLER performance achieved with PACE or ICE with higher-order modulation alphabets (16-64-QAM) Apart the parameters for common pilots using the full bandwidth from the previous figures apply For both 16 and 64-QAM ICE approaches the performance of a receiver with perfect channel knowledge For 16-QAM the SNR loss with PACE at BLER = 10-2 varies from 13 dB to 17 dB respectively for the TDD and the FDD mode With 64-QAM the performance degradation caused by channel estimation errors induced by PACE ranges from 12 dB in the TDD mode to 22 dB in the FD mode The SNR degradation for PACE remains almost constant over the range of BLER considered for the evaluation of the channel estimation performance
WINNER D210 v10
Page 126 (180)
0 5 10 15 2010-3
10-2
10-1
100
SNR [dB]
BLE
R
SR - Perfect CSISR - PACESR - ICE 2 iterWA - Perfect CSIWA - PACEWA - ICE 2 iter
5 10 15 20 25 3010-3
10-2
10-1
100
SNR [dB]
BLE
R
SO - Perfect CSISO - PACESO - ICE 2 iterWA - Perfect CSIWA - PACEWA - ICE 2 iter
Figure F16 BLER performance of PACE and ICE after 2 turbo iterations with 16-QAM modulation (left) and 64-QAM modulation (right) for the short-range (SR) TDD mode and the
wide-area (WA) FDD mode
F33 Design of the channel estimation unit For pilot aided channel estimation (PACE) two cascaded FIR interpolation filters are used one operating in frequency direction for interpolation over subcarriers of one OFDM symbol and the other operating in time for interpolation over OFDM symbols of a certain subcarrier as described in [WIND21] section 621 The performance of the interpolation filter depends on the amount of knowledge of the channel statistics these are
bull A Wiener interpolation filter (WIF) which is perfectly matched to the channel statistics The power delay profile (PDP) and the Doppler power spectrum (DPS) are assumed to be perfectly known
bull A WIF with ldquomatched pass-bandrdquo Knowledge about the maximum delay of the channel
maxτ and the maximum Doppler frequency maxDf are assumed However within [0 maxτ ] and [ maxDfminus maxDf ] the PDP and DPS are assumed to be unknown and uniformly distributed For the results the WINNER B3 and C2 channel models were used for the TDD and FDD mode respectively
bull A mismatched WIF where the maximum channel delay is assumed to be equal to the CP duration and the maximum Doppler frequency is set to the maximum value of expected mobile velocities For the TDD mode pedestrian velocities of 10 kmh while for the FDD mode velocities up to 100 kmh are assumed corresponding to a normalised Doppler frequency of
4max 10 minus=Df and maxDf =0013 respectively
In all cases perfect knowledge of the SINR at the receiver was assumed as it is expected that this information is needed also by other parts of the WINNER system
WINNER D210 v10
Page 127 (180)
0 10 20 30 40-5
0
5
10
15
20
SNR [dB]
Est
imat
or g
ain
G [d
B]
mismatched WIF γw=40 dB
mismatched WIFmatched pass-band WIFperfectly matched WIFMMSE Mf=16 Mt=5
ICEno feedback errors (16x5)
common pilots (16x1)PACE
PACEdedicated pilots (2x1)
Figure F17 Estimator gain vs SNR for dedicated and common pilots of various channel estimation techniques Also shown is the estimator gain in case all symbols per chunk can be used as pilots
which can be viewed as a lower bound for ICE if decision feedback errors are negligible
For certain MIMO techniques utilizing short term channel knowledge at the transmitter the degradation due to channel estimation errors is very severe (see Appendix B42) There estimator gains in the range of 13 to 17 dB are required The estimator gain is a measure for the quality of the channel estimate and is defined as 1(MSESNR) Figure F17 shows the estimator gains for dedicated and common pilots of the three considered channel estimation techniques PACE with dedicated pilots cannot achieve the required gains even for a perfectly matched filter If all symbols within a chunk can be utilised as pilots estimator gains exceeding 13 dB are possible This may be achieved by ICE in case decision feedback errors are negligible a realistic assumptions in the high SNR regime
0 10 20 30 40-15
-10
-5
0
5
10
SNR [dB]
Est
imat
or g
ain
G [d
B]
PACE dedicated pilots (2x1)
Sb = 0dB
Sb = 3dB
Sb = 6dB
Sb = 10dB
mismatched WIF
matched passband WIF
Figure F18 Estimator gain vs SNR for dedicated pilots for various pilot boosts
Unfortunately even with excessive pilot boosts the estimator gains for dedicated pilots are not sufficient as shown in Figure F18 So some post processing of the PACE channel estimates appears necessary
F34 Unbiased channel interpolation Unbiased interpolation is used in the bootstrap phase of the communication It is based on the relation between the delay and frequency-domain channel coefficients in OFDM systems (see [JFH+05]) Solutions are needed for full-spectrum (down-link) and at chunk level for up-link and dedicated pilots Here we report on the full-spectrum approach while chunk-level concepts are still under development
It is assumed that all subcarriers can be used for pilot or data transmission and that a sparse regular pilot grid is used Figure F19 (left) shows the reconstructed frequency response using a pilot spacing of 16 subcarriers in the short-range scenario (SNR = 20 dB) If the channel delays approach the CP length this is
WINNER D210 v10
Page 128 (180)
the theoretical maximum pilot spacing according to the sampling theorem Figure F19 (right) shows the estimator gain achieved with linear unbiased interpolation It depends on both SNR and delay spread (measured in taps 1 tap = 10 ns) The lower the SNR and the smaller the delay spread are the less taps are detected and hence the more noisy taps can be removed
Figure F19 Left Results for unbiased interpolation over the full spectrum (blue true channel red channel with noise open dots estimates on sparse pilot grid green interpolated frequency
response) Right Estimator gain with noise reduction in time domain
F35 Channel estimation using the guard interval mdash pseudo-random-postfix OFDM PRP-OFDM simulations were performed for the FDD parameter set presented in Table 21 Channel propagation conditions are used as defined in scenario C2 NLOS PRP-OFDM requires a significant number of OFDM symbols per frame in order to provide high SNR CIR estimates Since the parameter set defines a relatively short frame of 12 OFDM symbols only the simulation results focus on QPSK constellations PRP-OFDM will be shown to enable the system to work efficiently in a high mobility context (up to 144 kmh is considered here) if QPSK constellations are applied Due to the short frame length a significant error floor can be observed for 16-QAM transmission (which requires good channel estimates) which is improved (but not completely removed) by iterative interference suppressions (IIS) Any scenario with a frame-length smaller than 12 OFDM symbols is not considered for the use with PRP-OFDM (due to the insufficient CIR estimation MSE)
Simulations are performed taking 11 OFDM symbols into account for CIR estimation The frame to be decoded is assumed to be preceded by (dummy) PRP-OFDM symbols that are not decoded but whose postfix sequences are exploited for CIR estimation The results of PRP-OFDM are compared to a standard CP-OFDM system where the CIR estimation is assumed to be performed on 2 OFDM learning symbols at the beginning of the frame just after synchronisation No channel tracking is performed in this case The simulation results in Figure F20 show that a considerable error floor is present for standard CP-OFDM system for the mobility scenarios For PRP-OFDM this error floor disappears in the BLER range of interest and only an offset in SNR remains (approx 2 dB offset comparing 0 kmh vs 144 kmh) As a conclusion it can be stated that in combination with the chosen system and simulation parameters PRP-OFDM is useful in high mobility scenarios applying lower order constellations (QPSK in this example) Higher order constellations (QAM16 and higher) require larger observation window sizes for the CIR estimation and thus longer frames In the QPSK context PRP-OFDM leads to very acceptable system performance results at UT velocities as high as 144 kmh and beyond the performance loss at 144 kmh is limited to approximately 2 dB compared to the static case
WINNER D210 v10
Page 129 (180)
Figure F20 PRP-OFDM 11 Symbols CIR Estimation QPSK BLER simulation results
The simulation results show that PRP-OFDM can be used in the downlink to reduce the overhead required for channel estimation by using the guard interval for this purpose However the drawbacks namely the introduced delay (especially for higher order modulation) and the inability to extend this scheme to the uplink case are currently considered to outweigh the benefits Therefore CP-OFDM relying on a scattered pilot grid is currently the preferred solution
F4 Synchronisation
F41 Synchronisation without utilizing an explicit training symbol In [BSB97] a blind algorithm for symbol timing and frequency offset estimation was proposed which utilises the guard interval having the great advantage that it does not require any overhead in form of training data The basic idea is that the cyclic prefix is identical to the original part of the GMC block from which it is copied Correlation of the cyclic prefix with its original part results in a correlation peak The magnitude of the correlator output peaks at the beginning of an OFDM symbol while its phase at this time instant is proportional to the carrier frequency offset ∆f The algorithm detailed in [BSB97] is the maximum likelihood (ML) estimate in an AWGN channel For the ML estimate knowledge of the SNR is necessary which is impractical for acquisition when usually no information about the received signal is available The ML metric consists of the correlation metric ρ of the cyclic prefix with its original part as well as a metric which accounts for the signal power φ
Three different variants of the CP based synchronisation are compared
bull The ML estimator proposed in [BSB97]
bull An estimator which only uses the correlation metric ρ labelled ldquoCORrdquo Utilizing only ρ approaches the ML estimate at low SNR [LC02]
bull An estimator which uses the difference φρ minus approaches the ML estimate at high SNR [LC02] This approach is named ldquonorm CORrdquo since it is normalised by the power of the received signal
WINNER D210 v10
Page 130 (180)
Unfortunately the performance of this approach degrades in a frequency selective channel since the time dispersive channel impulse response reduces the ISI free part of the guard interval Computer simulations have been carried out for the WINNER FDD mode with channel model C2 and system parameters taken from Table 21 For the TDD mode the performance is expected to be better since CP correlation typically performs better if the number of subcarriers is large
Since the time and frequency offset will be constant during some OFDM symbols averaging over several estimates considerably improves the performance [BBB+99] This simple averaging of the correlation metric is a highly effective means to increase the robustness as well as accuracy of the CP based acquisition In the simulations averaging was performed over 12 OFDM symbols ie one OFDM frame
For channel model C2 the mean estimated timing offset is splTTE 6 asymp∆ which implies that the timing estimator is biased Unfortunately a positive mean will cause ISI and should therefore be avoided The bias may be compensated by a fine timing synchronisation unit operating in the frequency domain
The standard deviation of the time and frequency offsets is shown in Figure F21 Averaging the correlation metric of the CP based algorithm significantly improves the accuracy of the time and frequency estimates as shown in Figure F21 For cross-correlation based synchronisation averaging is only possible over the two OFDM symbols which carry pilot symbols Thus this technique cannot benefit from averaging to the same extend as CP based synchronisation While the combination of the CP based and the cross-correlation approach are possible [LWB+02] the cross-correlation approach cannot substantially improve the synchronisation accuracy Hence cross-correlation based synchronisation is applicable mainly in case that BSs are not synchronised
-5 0 5 10100
101
102
SNR [dB]
std(
∆ T
T spl)
MLCORNorm CORCC
withoutaveraging
withaveraging
-5 0 5 10
10-3
10-2
10-1
SNR [dB]
std(
∆ f c T
)
MLCORNorm COR
withaveraging
withoutaveraging
Figure F21 Standard deviation of the estimated time and frequency offset against the SNR (a) standard deviation of the time offset (left side CC = cross-correlator) and (b) standard deviation of
the frequency offset (right side)
WINNER D210 v10
Page 131 (180)
-5 0 5 1010-3
10-2
10-1
100
SNR [dB]
PFD
MLCORNorm COR
withaveraging
withoutaveraging
-5 0 5 1010-3
10-2
10-1
100
SNR [dB]
PFD
CC ∆ fc T = 0
CC ∆ fc T = 05
CC ∆ fc T = 10
Figure F22 Probability of false detection PFD against the SNR for (a) the CP correlator (left side) and (b) the cross-correlator (CC) using the scattered pilot grid of Figure B6 (right side)
Of particular interest is the performance of the algorithm at low SNR We define a false detection if the timing estimate is outside the window [-NCP2 NCP2] In Figure F22 the probability of false detection PFD of the CP correlator is plotted against the SNR (left side) It is seen that PFD is significantly reduced by averaging over 12 OFDM symbols The probability of false detection can be further reduced by averaging over more OFDM symbols For the simple COR synchronisation scheme the improvement through averaging is most significant
On the right hand side of Figure F22 PFD is shown for the cross-correlation (CC) based synchronisation scheme using the scattered pilot grid of the WINNER FDD mode It is seen that the detection probability of the OFDM symbol timing severely degrades if a carrier frequency offset is present For synchronisation in a wireless network time synchronisation for non-synchronised BSs is possible if adjacent BS use different pilot sequences However since the cross-correlator is sensitive to frequency offsets BSs should be either time or frequency synchronised Comparing the CP-based auto-correlation with the cross-correlation technique the CP correlation with averaging appears favourable Only for not time synchronised BSs the CC technique is a valid option It should be noted however that this statement depends on the chosen pilot grid For a smaller pilot spacing the performance of the CC technique is expected to improve
To conclude synchronisation by correlating the cyclic prefix (CP) with its original part is robust even at very low SNR provided that the correlation metric is sufficiently averaged Averaging over 12 OFDM symbols mitigates false detection for SNRge0 dB Since COR is the technique with the least complexity it can be concluded that averaging combined with COR is an appropriate choice due to its simplicity low overhead high accuracy and reliability Cross-correlation synchronisation utilizing a scattered pilot grid predominantly used for channel estimation can be used for synchronisation of a network where BSs are not time synchronised However BSs need to be frequency synchronised for this algorithm to work
WINNER D210 v10
Page 132 (180)
F5 Performance of selected bit and power loading algorithms In [WIND24] a set of various aspects of the adaptive link-level transmission using Hughes-Hartogs optimum bit-loading algorithm was assessed However as mentioned in Appendix B51 the HH approach is not ideal from the complexity point of view Therefore the following simulation results present a performance comparison between the HH algorithm and two others suboptimum less complex implementations by Chow Cioffi and Bingham and by Fischer and Huber
The presented bit error rate results have been obtained using a Monte-Carlo method by transmitting 100 million information bits per one particular SNR value This gives a sufficient precision to estimate bit error rates in the order of 10-5
A limited power constraint equal to the value of 1 [W] times the number of used subcarriers Nu = 1664 has been assumed in all evaluations Moreover a constant number of information bits have been loaded in each OFDM symbol ie
)(log2 MRNB ui sdotsdot= (F1)
where Nu means number of used subcarriers R represents the code rate and M is the constellation size In order to compare the performance of the evaluated loading algorithms the actual power loaded on each subcarrier has been normalised so the following criterion is fulfilled
summinus
=
=1
0arg
uN
ietti PP
where Pi is the power loaded on the ith subcarrier after normalisation and Ptarget is the total power limit
Figure F23 presents the simulation results for indoor scenario A1 NLOS channel model for a velocity v = 5 kmh The suboptimum less complex CCB and FH bit and power loading algorithms are compared to the Hughes-Hartogs approach All three algorithms have used the target BER setting equal to 10-4 The mean number of information bits transmitted in each OFDM symbol has been set to 2 Nu = 3328 The maximum number of iterations of the CCB algorithm has been limited to 10 (see Appendix B512) For comparison purposes an extra curve for non-adaptive transmission with fixed code rate and constellation size is depicted The overall bit rate of this fixed transmission is the same as in the adaptive cases
0 5 10 15 2010-3
10-2
10-1
100
SNR[dB]
BLE
R
WINNER A1 NLOS Channel Model SISO v = 5 kmh
Fixed R=34 QPSK AWGNAdaptive CCB BERtar=10-4
Adaptive FH BERtar=10-4
Adaptive HH BERtar=10-4
Figure F23 Performance comparison of the HH CCB and FH bit and power loading algorithms (short-range scenario A1 NLOS channel model SISO case v = 5 kmh)
WINNER D210 v10
Page 133 (180)
Similar simulation results are shown in Figure F24 Here slight different parameters have been chosen for comparison The channel model is B3 NLOS (short-range hotspot scenario) however the velocity has been set to the same value v = 5 kmh The mean number of information bits transmitted in one OFDM symbol is equal to 15 Nu = 2496 which is adequate for a transmission of a whole OFDM symbol using the code rate R = frac34 and QPSK constellation on each used subcarrier
0 5 10 15 2010-3
10-2
10-1
100
SNR[dB]
BLE
RWINNER B3 NLOS Channel Model SISO v = 5 kmh
Fixed R=12 16-QAM AWGNAdaptive CCB BERtar=10-4
Adaptive FH BERtar=10-4
Adaptive HH BERtar=10-4
Figure F24 Performance comparison of the HH CCB and FH bit and power loading algorithms (short-range scenario B3 LOS channel model SISO case v = 5 kmh)
Having looked at the results presented above one can conclude that the Fischer and Huber approach has only slightly worse performance than the Chow Cioffi and Bingham solution in a coded transmission over wireless channel models As expected Hughes-Hartogs bit and power loading algorithm performs best but it has the highest computational complexity In general the observed performance degradation of the suboptimum algorithms is so small that it can be neglected in this case
WINNER D210 v10
Page 134 (180)
Appendix G Multi-Link and System-Level Assessments Multi-link and system level simulations have been set up in order to study those techniques which directly or indirectly influence the level of interference at the receivers Basically these are multiple access radio resource management spatial processing at transmitter synchronisation of multiple transmitters (in case of a synchronised network) and power allocationcontrol Another class of techniques which has to be studied by means of system or multi-link simulations is related to receiver processing and the ability to cope with or to combat interference This class typically comprises the large set of single user and multi-user detection algorithm with or without the aid of multiple antennas and iterative processing Even synchronisation belongs to this class of receiver techniques provided there is a potential crosstalk from other simultaneously transmitting stations
This discussion reveals the huge amount of different topics which can and have to be assessed by means of multi-link or system level simulations Within WINNER Phase I emphasis has been placed on the evaluation of different multiple access schemes for up- and downlink partly in combination with various spatial processing options It is a continuation of the work being done in [WIND26] and [WIND27] focusing now on the most promising candidates and using more elaborated simulation environments For non-frequency-adaptively scheduled flows in the downlink the multiple access candidates are chunk based OFDMATDMA and MC-CDMATDMA and a comparison can be found in Appendix G11 The subcarrier interleaved variants of these two multiple access schemes are considered in Appendix G12 Regarding frequency-adaptively scheduled flows chunk based OFDMATDMA was identified as the most promising approach due the highest flexibility in allocating resources to users The additional SDMA gain using grid of fixed beams in a wide-area scenario is addressed in Appendix G14 In the same context spatial processing gains using more sophisticated adaptive beamforming approaches are analysed in Appendix G21 and Appendix G22 For non-adaptively scheduled flows a comparison of beamforming diversity and multiplexing is performed in Appendix G24 Moreover as in Appendix G23 the impact of multiple antennas at the UT and associated combining techniques on system performance is studied The absolute performance of linear multi-user SMMSE precoding is assessed in Appendix G25 for the short-range scenario considering again non-frequency-adaptively scheduled flows Taking realistic system impairments into account the required number of antennas to achieve an average sector throughput of 1 Gbits is identified
The preferred medium access candidates considered for the uplink are pretty much the same as for the downlink including additionally symbol based TDMA Compared to OFDMATDMA pure TDMA is beneficial from terminal power consumption point of view and it is less susceptible to frequency offsets among terminals However the impact of synchronisation errors is not yet included when comparing OFDMATDMA and OFDMTDMA in Appendix G44 The absolute performance of OFDMTDMA and ODFMATDMA with adaptive scheduling is assessed in Appendix G41 and Appendix G43 respectively Considering a short-range scenario in Appendix G43 the optimum resource allocation and bit loading scheme for OFDMATDMA with respect to sum capacity is compared to low complexity solutions
The impact of spatial diversity at the BS for various antenna configurations is analysed in Appendix G51 An information theoretic approach with respect to optimum spatial processing at the UT using two transmit antennas can be found Appendix G52
Other main results are related to multi-user detectionseparation at the receiver This holds not only for base stations but also for user terminals if MC-CDMA is applied Corresponding results considering different receiver structures without and with multiple antennas at the UT can be found in Appendix G31 and Appendix G32 respectively From the base station perspective receiver structures for SISO DS-CDMA and MIMO single carrier are presented and compared in Appendix G61 and Appendix G62
Other investigations which are not directly related to updownlink multiple access spatial processing or detection are part of Appendix G7 In Appendix G71 a comparison of OFDM and single carrier (with cyclic prefix) based uplinks is performed taking the increased power backoff constraint of OFDM into account Appendix G72 deals with low rate channel coding as a means to enable service to users at cell edge even in case of frequency reuse 1 Appendix G73 focuses on the crosstalk which is induced in an OFDM receiver if signals from different base station suffer from transmission delay differences larger than the guard interval Two resource partitioning schemes among base stations are compared with this respect TDMA and FDMA In Appendix G74 conventional and self-organised RRM is compared with respect to system throughput considering several options how to cope with varying interference
WINNER D210 v10
Page 135 (180)
conditions from newly arriving users Finally Performance results of a protocol which utilises and exploits the benefits of distributed antennas are presented in Appendix G75
It should be stressed that simulation results are provided by different partners using uncalibrated implementations and to a certain extent differing simulation assumptions Consequently results are not directly comparable unless otherwise noted (ie when they are from the same partner) Every contribution starts with a summary of the applied simulation assumptions different from those defined in Appendix E followed by a discussion of the simulation results and corresponding conclusions
For illustrative purposes the main set of medium access schemes which have been studied in greater detail by means of multi-link or system level simulation is depicted in Figure G1 Note that in the section headings the term TDMA has been omitted in most cases for the sake of brevity
chunknt symbols
n f s
ubca
rrie
rs
time
frequ
ency
codespace
Chunk based OFDMATDMA
Chunk basedMC-CDMATDMA
Interleaved OFDMATDMA= IFDMATDMA
Interleaved MC-CDMATDMA
Chunk basedOFDMATDMASDMA
TDMAChunk interleaved
OFDMATDMA
Figure G1 Illustration of considered GMC-based medium access schemes
G1 Downlink multiple access
G11 Comparison of non-adaptive OFDMA MC-CDMA and adaptive OFDMA
Simulation Assumptions Simulator System simulator using AWGN look-up tables and effective SINR mapping
Combined snap-shot dynamic mode gt100 runs of 14 s each simulated Scenario wide area cellular frequency reuse 1 single antenna BS and UT Channel modelling C2 NLOS clustered delay line Interference modelling Central cell mode with simplified inter-cell interference model (two tiers of
fully loaded sectors) Cell radius 900 m MCS 6 QPSKr=13QPSKr12QPSK r2316-QAM r=12 16-QAM r34
64-QAMr=23 BLER target lt01 FEC Punctured convolutional coding (561753)oct with memory 8
Codeword length fixed size of 480 data symbols corresponding to 320ndash1920 payload bits depending on MCS used
HARQ Chase combining maximum 6 retransmissions Type of feedback Non-freq adaptive Best MCS fed back by each terminal
Freq adaptive One SINR per chunk AckNack messages explicitly fed back in all cases Delay 1 chunk duration
Overhead Total overhead of 23 taken into account in TX-power and resources Mobile speed 30 kmh same for all mobiles - results in almost perfect link adaptation
WINNER D210 v10
Page 136 (180)
With the OFDMA variant considered here each user scheduled for transmission is assigned a subset of 6 chunks (out of 48) thus serving 8 users per chunk duration TDMA is applied in each of the two successive chunks forming a frame Thus 16 users are served in total in one FDD frame In the frequency non-adaptive case the 6 chunks of the 8 selected users are simply interleaved in frequency to provide a diversity gain for the channel decoder Note that in this case the link adaptation could also be pre-calculated at the terminal and best MCS feedback would be sufficient In the frequency-adaptive case the 8 users select their preferred 6 chunks in a fair way This requires an increased feedback using one SINR value per chunk for each user Link adaptation is then performed explicitly by the base station after chunk allocation
In case of MC-CDMA spreading is performed within the chunks only using a spreading factor of 8 Hence the whole available bandwidth is shared by 8 users simultaneously MC-CDMA requires only a feedback of the best MCS for each user in the cell assuming that link adaptation is pre-calculated at the terminals Based on this feedback time-domain scheduling (selecting 16 simultaneous users) and link adaptation is performed at the base-station
The simulation results in Figure G2 and Figure G3 firstly show a comparison of different scheduling algorithms in the non-frequency adaptive case using MC-CDMA An evaluation of these scheduling algorithms for pure TDMA and lower system bandwidth (5 MHz) was already presented in earlier WINNER deliverables The major difference compared to earlier results is the fact that with MC-CDMA using a spreading factor of 8 and half-duplex FDD 16 users are scheduled in parallel instead of just a single user Since the gains obtained from multi-user diversity depend on the number of users competing for the resource it is not surprising that the channel dependent schedulers Score Based and Maximum SINR achieve much lower gains in cell throughput compared to Round Robin (Figure G2) than was found in the earlier studies for a comparable number of users
40 users 80 users0
5
10
15
20
25
Mbi
ts
Average service throughput per cell
Round RobinScore BasedMaximum SINR
0 05 1 150
01
02
03
04
05
06
07
08
09
1
Mbits
Pro
b( a
v u
ser t
hrou
ghpu
t lt X
)
CDF of average user throughput
Round RobinScore BasedMaximum SINR
40 users
80 users
40 users 80 users0
5
10
15
20
25
Mbi
ts
Average service throughput per cell
Round RobinScore BasedMaximum SINR
0 05 1 150
01
02
03
04
05
06
07
08
09
1
Mbits
Pro
b( a
v u
ser t
hrou
ghpu
t lt X
)
CDF of average user throughput
Round RobinScore BasedMaximum SINR
40 users
80 users
Figure G2 Throughput for MC-CDMA vs number of userscell
100 200 300 400 500 600 700 800 9000
05
1
15
Mbi
ts
Distance [m]
80 users cell
100 200 300 400 500 600 700 800 9000
05
1
15
Distance [m]
Mbi
ts
40 users cell
Round RobinScore BasedMaximum SINR
Figure G3 Av user throughput vs distance (only scheduled users considered)
WINNER D210 v10
Page 137 (180)
Note also that the cell throughput for the fair score-based scheduler is limited by the low rate users at the cell border (Figure G3) similar to Round Robin In contrast the Maximum SINR scheduler artificially reduces the coverage by serving only users close to the cell centre Note from Figure G2 that for Maximum SINR scheduling around 30 (58) of the 40 (80) users in the cell are not served For Round Robin and score-based scheduling this number is slightly lower than 20 for both system loads Hence the single antenna configuration and the MCSs used for these first results do not provide satisfactory coverage and the use of multiple antennas and advanced coding strategies (eg Turbo Coding) does appear mandatory
In Figure G4 and Figure G5 MC-CDMA and OFDMA are compared for the frequency adaptive and the frequency non-adaptive case In the frequency non-adaptive case MC-CDMA outperforms OFDMA in terms of cell and user throughput for all considered loads and scheduling algorithms This is due to the frequency diversity advantage of MC-CDMA achieved by spreading the coded block over the whole bandwidth
40 users 80 users0
5
10
15
20
25
Mbi
ts
Average service throughput per cell
Round Robin MC-CDMAScore Based MC-CDMARound Robin OFDMAScore Based OFDMA NonFreqScore Based OFDMA FreqAdapt
0 05 1 150
01
02
03
04
05
06
07
08
09
1
Mbits
Pro
b( a
v u
ser t
hrou
ghpu
t lt X
)
CDF of average user throughput
Score Based MC-CDMAScore Based OFDMA NonFreqScore Based OFDMA FreqAdapt
40 users
80 users
40 users 80 users0
5
10
15
20
25
Mbi
ts
Average service throughput per cell
Round Robin MC-CDMAScore Based MC-CDMARound Robin OFDMAScore Based OFDMA NonFreqScore Based OFDMA FreqAdapt
0 05 1 150
01
02
03
04
05
06
07
08
09
1
Mbits
Pro
b( a
v u
ser t
hrou
ghpu
t lt X
)
CDF of average user throughput
Score Based MC-CDMAScore Based OFDMA NonFreqScore Based OFDMA FreqAdapt
40 users
80 users
Figure G4 Throughput for MC-CDMA and OFDMA vs nb of userscell
100 200 300 400 500 600 700 800 9000
05
1
15
Mbi
ts
D is tanc e [m ]
80 us ers c ell
100 200 300 400 500 600 700 800 9000
05
1
15
Dis tanc e [m ]
Mbi
ts
40 us ers c ell
S c ore B as ed M C-CDM AS c ore B as ed O FDM A NonFreqS c ore B as ed O FDM A F reqA dapt
Figure G5 Av user throughput vs distance (only scheduled users considered)
In the frequency-adaptive case where the base station can use feedback on chunk level for adaptive chunk allocation OFDMA achieves high gains in user and cell throughput However the gain is to a certain extent limited by the constraint that a fixed amount of chunks (6 in this case) is assigned to each user scheduled for transmission The percentage of un-served users decreases by adaptive transmission to around 12 (Figure G4) and the user throughput increases within the whole cell range (Figure G5) However the observation that overall coverage is unsatisfactory still holds in the frequency adaptive case
The following main conclusions can be drawn from the results
WINNER D210 v10
Page 138 (180)
bull Multi-user diversity gains from fast scheduling can only be obtained when a strong TDMA component on sub-frame level is kept in the multiple access scheme Only a limited number of users should be served simultaneously depending on delay constraints and required throughputs
bull In the considered single antenna system configuration the cell coverage is unsatisfactory The use of advanced antenna techniques (MIMO) and improved coding schemes (eg Turbo Coding) is mandatory to achieve satisfactory wide area coverage
bull OFDMA achieves high performance gains in the frequency adaptive mode when a reliable feedback of the channel quality per chunk eg SINR is available for all users competing for the resource
bull In the non-frequency adaptive case MC-CDMA outperforms OFDMA thanks to the better frequency diversity obtained by spreading the symbols over the whole bandwidth However the differences are rather small and will probably vanish if other sources of diversity are available34
G12 Comparison of non-adaptive subcarrier interleaved OFDMA and MC-CDMA
Simulation Assumptions Simulator multi-link level Scenario Short range cellular single antenna BS and UT Channel modelling IEEE 80211n including path loss and shadowing Interference modelling Whole tier of interfering cells around desired cell each cell generates own
transmit signal and signal is transmitted through independent channel Cell radius 300 m Link adaptation QPSK r=12 FEC Convolutional coding (561753)oct with memory 8
Codeword length 3328 spreading type Walsh-Hadamard spreading length 8
Despreading MMSE based Mobile speed 3 kmh
The simulation results in Figure G6 left plot show a direct comparison between subcarrier interleaved OFDMA and subcarrier interleaved MC-CDMA in a cellular environment in terms of BER In case of OFDMA each user gets exclusively 208 subcarriers out of 1664 allowing a maximum number of 8 users to be served simultaneously With MC-CDMA the data of each user is spread over 8 subcarriers leading to multiple access interference Since the number of active users the maximum number of users the data symbols per user and the frame size are equal the comparison of the medium access variants is regarded as fair The resource load of OFDMA is defined by the ratio of the number of allocated subcarriers relating to the number of available subcarriers In MC-CDMA the resource load is given by the ratio of the number of active users relating to maximum number of users which could be served using all available codes In the case of OFDMA an RRM over three cells can avoid a double allocation of subcarriers up to a resource load of 13 Otherwise the subcarriers are randomly allocated Three scenarios are investigated determined by the distance of the UTs to the base station d0=(150 200 300) In the inner part of the cell (d0=150 m) MC-CDMA outperforms OFDMA for resource loads smaller than 075 due to enhanced frequency diversity but the difference is rather small if translated into throughput The benefit of MC-CDMA reduces with increasing resource load because the multiple access interference increases Since the inter-cellular interference is small in the inner part of the cell the RRM for OFDMA does not enhance the performance dramatically In contrast the RRM improves drastically the performances for OFDMA in the outer parts of the cell (d0 gt200 m) for lower resource loads indicating that RRM is an important means for throughput enhancements at the cell edge especially if the system is not fully loaded (which is mostly the case in a real system) MC-CDMA always outperforms pure ODFMA in all three scenarios for resource loads lower than 06
34 The actual WINNER system concept offers additional sources of diversity in the spatial domain A comparison of
the additional benefit of MC-CDMA against the increased complexity in particular in conjunction with MIMO techniques is for further study
WINNER D210 v10
Page 139 (180)
0 02 04 06 08 110-6
10-4
10-2
100
resource load
BE
R
OFDMA with RRMOFDMA wo RRMMC-CDMA
d0=300m
d0=200m
d0=150m
0 50 100 150 200 250 300
10-6
10-4
10-2
100
distance [m]
BE
R
MC-CDMA RL=10OFDMA wo RRM RL=10OFDMA with RRM RL=10OFDMA wo RRM RL=05OFDMA with RRM RL=05MC-CDMA RL=05OFDMA wo RRM RL=0125MC-CDMA RL=0125OFDMA with RRM RL=0125
Figure G6 BER versus resource load for different UT distances (left plot) and BER versus UT distance for different resource loads (right plot) considering interleaved MC-CDMA and OFDMA
The right plot of Figure G6 shows the BER versus the mobile distance to the desired base station Three different resource loads for an OFDMA and MC-CDMA system are investigated Due to the avoidance of inter-cellular interference by using the RRM for OFDMA the BER with a resource load of 0125 is nearly zero in the whole cell MC-CDMA can utilise the whole frequency diversity and therefore MC-CDMA outperforms pure OFDMA in the scenarios with resource load 0125 and 05 in the whole cell area OFDMA slightly exceeds the MC-CDMA performance in the fully-loaded scenario because the multiple access interference is the major degradation factor of MC-CDMA
To sum up at low resource loads (smaller than 06) MC-CDMA performs always better than pure OFDMA due to the higher frequency diversity but the differences are small and will probably disappear if further sources of diversity are exploited see footnote 34 on page 138 However the enhanced interference suppression opportunities with smart RRM allow a large performance gain for lower bounds The RRM shows a lower bound for the OFDMA system without any channel knowledge at the transmitter side At high loads both techniques show similar performances
G13 Comparison of non-adaptive OFDMA MC-CDMA and TDMA
Simulation Assumptions Simulator Multi-cell link level Scenario Wide area single-antenna BS and UT cell radius 1000 m Channel modelling C2 generic channel model (D54) including path loss + shadowing Interference modelling Whole tier of interfering cells around desired cell MCS 2 4-QAM r=12 16-QAM r=12 FEC Convolutional coding (561753)oct with memory 8
Codeword length 1664 Spreading Type Walsh-Hadamard spreading length 8 Channel allocation for each codeword
TDMA ndash 4-QAM 416 carriers times 2 symbols TDMA ndash 16-QAM 416 carriers times 1 symbol OFDMA ndash 4-QAM 32 adjacent carriers times 26 symbols OFDMA ndash 16-QAM 32 adjacent carriers times 13 symbols MC-CDMA ndash 4-QAM 416 carriers times 16 symbols MC-CDMA ndash 16-QAM 416 carriers times 8 symbols Spreading is performed across 8 adjacent subcarriers
Simulations have been conducted in order to compare the performance of OFDMATDMA MC-CDMATDMA and pure TDMA which can be regarded as a special case of MC-CDMA with spreading factor 1 Figure G7 presents the throughput results for a fully loaded scenario ie where all resources are used for data transmission and 14 loaded scenario Resources are allocated to UTs of different cells randomly that is no interference avoidance scheme is used The results show that all considered multiple access schemes have very similar performances In fully loaded case OFDMA is slightly better than MC-CDMA due to inter-code interference in CDMA In 14 load case MC-CDMA is slightly better than the others confirming the results obtained in G12 It can also be seen that OFDMA is a little better than TDMA in both cases This is due to OFDMA taking more advantage of the time diversity provided by the channel conditions used in the simulation However no spatial diversity has been taken into account yet
WINNER D210 v10
Page 140 (180)
which may further reduce the performance differences between OFDMTDMA OFDMA and MC-CDMA (see also footnote 34 on page 138)
0 5 10 15 20 25 3002
03
04
05
06
07
08
09
1
data rate [Mbits]
prob
(use
r thr
oupu
t lt a
bsci
ssa)
4QAM TDMA16QAM TDMA4QAM OFDMA16QAM OFDMA4QAM MC-CDMA16QAM MC-CDMA
0 2 4 6 8 100
01
02
03
04
05
06
07
08
09
1
data rate [Mbits]
prob
(use
r thr
oupu
t lt a
bsci
ssa)
4QAM TDMA16QAM TDMA4QAM OFDMA16QAM OFDMA4QAM MC-CDMA16QAM MC-CDMA
0 5 10 15 20 25 3002
03
04
05
06
07
08
09
1
data rate [Mbits]
prob
(use
r thr
oupu
t lt a
bsci
ssa)
4QAM TDMA16QAM TDMA4QAM OFDMA16QAM OFDMA4QAM MC-CDMA16QAM MC-CDMA
0 2 4 6 8 100
01
02
03
04
05
06
07
08
09
1
data rate [Mbits]
prob
(use
r thr
oupu
t lt a
bsci
ssa)
4QAM TDMA16QAM TDMA4QAM OFDMA16QAM OFDMA4QAM MC-CDMA16QAM MC-CDMA
Figure G7 Performance comparison of OFDMA MC-CDMA and TDMA in fully loaded case (right plot) and non-fully loaded case (left plot)
Figure G8 presents throughput results obtained for various reuse factors using OFDMTDMA although the general conclusions stand for other MA schemes Four tiers of interfering cells are used for the simulation The results show that only about 77 of the cell has been sufficiently covered therefore stronger MCS are required to cover users at the cell edge These results support the suggestion in [WIND32] to cover different areas of the cell with different reuse factors Approximately 37 of the cell can be covered by reuse 1 A further 28 of the cell can be covered by reuse 3 Reuse 7 can be used in approximately 12 of the cell
0 5 10 15 20 25 300
01
02
03
04
05
06
07
08
09
1
data rate [Mbits]
prob
(use
r thr
oupu
t lt a
bsci
ssa)
4QAM RR116QAM RR14QAM RR316QAM RR34QAM RR716QAM RR7
Figure G8 Throughput for different reuse factors for OFDMTDMA
G14 Impact of chunk sharing on the performance of adaptive OFDMATDMA
Simulation Assumptions Simulator Link level Scenario wide area MT = 1 MR = 1 mobility 50 kmh for all mobiles Channel modelling C2 clustered delay line Interference modelling no inter-cell interference MCS 4 4-QAM 16-QAM 64-QAM 256-QAM
adaptive bit and power loading FEC no
An algorithm to perform adaptive user-to-subcarrier allocation with bit and power loading has been proposed in [WIND26] for the downlink of a multi-carrier CDMA systems with spreading both in time and in frequency The algorithm yields an optimisation of the subcarrier sharing that enables a considerable performance gain with respect to OFDMA systems where each subcarrier is exclusively
WINNER D210 v10
Page 141 (180)
assigned to one user [WIND23] In order to implement subcarrier sharing other sharing techniques like TDMA or FDMA can be used as well Although chunk-wise resource allocation already implicitly provides time sharing in an OFDMA system we show that a considerable performance gain can be achieved through further chunk sharing in case that the number of users competing for resources is quite high (K=32 in this case) and the time constraints for serving all these users is very stringent (one chunk duration=3346micros) Sharing of a chunk by different data flows can be implemented in many different ways in particular
CDMA ndash all nsub nsymb time-frequency bins of a chunk or a subset thereof are simultaneously utilised by a number of data flows To decrease message delays it would be advantageous to perform pure frequency-domain spreading by which in frequency-selective fading CDMA can provide diversity gain even with single-user detection However in an adaptive system no room for diversity is left
TDMA ndash each flow utilises all subcarriers of a chunk during ρkqnsymb OFDM symbol periods
FDMA ndash flow k utilises ρkqnsub subcarriers during the nsymb OFDM symbol periods of a chunk Some kind of frequency hopping per chunk can be advantageous in severe frequency selective channels
Figure G9 illustrates the impact of chunk sharing and chunk size variations on BER performance Here Sf denotes the spreading factor and S the number of users sharing a chunk Under the specific conditions considered chunk sharing with nsub=4 and Sf=S=4 yields a significant performance improvement with respect to exclusive user-to-chunk assignment ie nsub=4 and Sf=S=1
-6 -4 -2 0 2 4 6 8 10 12 1410
-4
10-3
10-2
10-1
100
Relative transmitter power dB
BE
R
nsub=Sf=1S=4FDMA
nsub=Sf=4S=4FDMA
nsub=Sf=1S=1FDMA
nsub=4Sf=S=1FDMA
nsub=2Sf=S=1FDMA
nsub=2=Sf=S=2FDMA
Figure G9 Gain of chunk sharingchunk size considering 32 users competing for 416 subcarriers with a granularity nsub= 1 to 4 and nsymb=12 35
It is reasonable to expect that the achievable gain decreases by relaxing the constraint on the number of users to be served within one chunk duration ie by decreasing the demand on granularity as it had been previously shown in [WIND26] with reference to single subcarrier sharing Moreover from the figure it can be inferred that the gain of chunk sharing increases with the number of subcarriers constituting the chunk at BER=10-3 a gain of 2 dB is achieved for nsub=2 and 6 dB for nsub=4 respectively Furthermore it can be observed that by optimizing the transmission scheme over sub-bands of size nsubgt1 the transmitter power needed to achieve a given BER increases (by 1 dB for nsub=4) Indeed increasing the chunk size reduces the performance of link adaptation due to the effect of channel-to-noise ratio averaging But on the other hand it also reduces the amount of feedback information which was not taken into account here
We note that results for S le 4 have been plotted since preliminary results had shown that increasing S further does not provide any improvement Finally all curves refer to the case of FDMA sharing since it had also been proven that the performance of TDMA and CDMA chunk-sharing is essentially the same
35 It should be noted that the fairly large gains seen here apply only to specific situations with very strict delay
requirements as eg control signalling for scheduling and retransmissions for highly prioritised services
WINNER D210 v10
Page 142 (180)
from which it can be inferred that CDMA is not affected by the loss of orthogonality among codes within one chunk
G15 Comparison of adaptive OFDMA and OFDMASDMA using GoBs
Simulation Assumptions Simulator System level simulator 30 Frames per snapshot 20 snapshots per simulation Scenario wide area MT = 8 MR = 1 cell radius 1000 m all UTs move at 3 kmh
frequency reuse 1 336 carrier per sector frequency reuse 3 112 carrier per sector frequency reuse 7 48 carrier per sector Tx power per carrier is set to 125 mW in all cases
Channel modelling C2 and D1 generic channel model (according to D54) Interference modelling Full modelling using wrap around technique MCS 6 BPSK r=13 BPSK r=23 QPSK r=23 16-QAM r=23
64-QAM r=23 64-QAM r=89 FEC punctured convolutional coding (133171145)oct with memory 6
codeword length variable ndash one codeword always fills one chunk Type of feedback For each user and chunk MCS and corresponding throughput value Feedback delay 0 Beamforming Chebychev tapering with 25 dB side lobe suppression using either eight grids
with one beam each (1 beam case) 4 grids with two beams each (2 beam case) or 2 grids with 4 beams each (4 beam case)
A simple grid of fixed beam (GoB) is considered in order to investigate the potential SDMA gains achievable under wide-area scenario conditions The basic approach used here is to form beams simultaneously from all BS allowing the UT to measure and feedback some kind of CQI as eg SINR per chunk and beam see [WIND27] Based on this feedback resources are allocated to the UTs adaptively (opportunistically) Proportional fair scheduling (PFS) is applied to take fairness constraints into account Considering synchronised cells and leaving the beam pattern and corresponding power allocation constant at all base stations during measurement phase and payload phase leads to predictable inter-cell interference conditions and hence supports short term adaptivity36
System simulation results for channel model D1 comparing average sector throughput for single antenna base stations (SISO) and multi-antenna base stations forming one two or four beams on each chunk are shown on the left side of Figure G10 Note that the SISO and the one beam case are associated with chunk based OFDMATDMA and the two and four beam case with chunk based OFDMATDMASDMA respectively Two main conclusions can be drawn out of these plots Firstly a fixed frequency reuse of one is always beneficial with respect to the cell throughput even if fairness (deducible from the right two plots in Figure G10) is taken into account This holds also for the SISO case which may be explained by different (in the simulation uncorrelated) shadow and fast fading characteristics for any BSharrUT link leaving sufficient variability to be exploited by adaptive scheduling Secondly increasing the number of beams leads to an increasing sector throughput indicating that SDMA is a viable option
36 Predictable SINR conditions are even more challenging for adaptive spatial processing The measurement phase
and the corresponding feedback signalling can be implemented as additional time-multiplexed parts of the super-frame not shown in Figure 32 The detailed layout of these phases within the super-frame is for further study
WINNER D210 v10
Page 143 (180)
0 5 10 15 20 25 30 350
20
40
60
80
100
120
max SISO rate
number of users
aver
age
sect
or th
roug
hput
[Mbi
ts]
channel model D1 reuse 1
SISO PFS1 beam PFS2 beams PFS4 beams PFS4 beams max thrpt
0 5 10 15 20
0
02
04
06
08
1
data rate [Mbits]
prob
(use
r thr
ough
put lt
abs
ciss
a)
16 user channel model D1 reuse 1
SISO PFS1 beam PFS2 beams PFS4 beams PFS4 beams max thrpt
0 5 10 15 20 25 30 3510
20
30
40
50
60
70
max SISO rate
number of users
aver
age
sect
or th
roug
hput
[Mbi
ts]
channel model D1 reuse 3
SISO PFS1 beam PFS2 beams PFS4 beams PFS4 beams max thrpt
0 5 10 15 20
0
02
04
06
08
1
data rate [Mbits]
prob
(use
r thr
ough
put lt
abs
ciss
a)
16 user channel model D1 reuse 3
SISO PFS1 beam PFS2 beams PFS4 beams PFS4 beams max thrpt
Figure G10 average sector throughput and CDF of user throughput for channel model D1 with varying number of beams in different reuse scenarios zero feedback delay
Further exemplary simulations have been performed in order to assess the impact of various system parameters as feedback delay amount of feedback and number of antennas at the UT starting from the parameter setting [4beams channel model D1 reuse 1 prop fair scheduling 16 users] Figures are omitted for the sake of brevity but basically it turns out that in case of channel model D1 the system is quite robust with respect to feedback delays For example a delay of 64 OFDM symbols between measurement and payload phase in a scenario where all UTs move at 70 kmh (corresponding to a Doppler normalised delay fDtdelay=06) led to an average sector throughput loss of around 16 The relatively small loss is mainly due to high LOS probability associated with this channel model In case of channel model C2 (NLOS only) however the average sector throughput loss is substantially higher and amounts to 67 under the same conditions
Regarding the amount of feedback a considerable performance loss can be observed when CQI information is fed back for less than around 35 percent of all chunks But this threshold depends to a certain degree on the number of different grids and how they are mapped to the chunks In this simulation only two different grids each with four beams were considered causing a certain periodicity in frequency direction
Increasing the number of antennas at the UT provides significant system performance gains of around 25 (2 antennas) and 50 (4 antennas) using maximal ratio combining (MRC) Even larger gains are expected if the combiner accounts for the interference characteristics (IRC) as described in G24 Of course further investigations a required to study the interaction of the parameters presented
Realizing SDMA by GoBs requires a relatively low angle of departure spread to keep intra-cell interference ie intra-beam interference small The more beams are formed the more stringent this requirement is Channel model C2 has a much larger angle of departure spread than D1 and therefore the performance gain achieved by SDMA are considerable smaller In fact forming four beams yields approximately the same performance as with two beams
To sum up using grids of beams in combination with opportunistic scheduling is a simple but yet efficient and robust solution to realise SDMA gains with low complexity even in reuse case 1 provided
WINNER D210 v10
Page 144 (180)
that the angle of departure spread is sufficiently small as for scenario D1 In scenario C2 the SDMA gain with GoBs is limited to a factor of around 15 compared to pure beamforming
G2 Downlink spatial processing
G21 Comparison of fixed and tracking based beamforming
Simulation Assumptions Simulator System simulator 200 snapshots snapshot duration 250 chunks Scenario Wide area cellular MT = 8 MR = 1 frequency reuse 1 all 512 carriers used
cell radius 1 km Channel modelling C2 WIMI generic channel model Interference modelling Full interference modelling Multiple access adaptive OFDMATDMA MCS No MCS a successful transmission occurs when the predicted transmission
rate is lower than the actual capacity of the equivalent channel FEC No FEC Type of feedback 8 bits feedback per user per chunk SNR in case of OBF complex gain in
case of adaptive beamforming with channel tracking Feedback delay 2 chunk duration Overhead 19 out of 96 resource elements for each chunk Mobile speed Pedestrian (M1) 50 of users Vehicular (M2) 50 of users Beamforming OBF 1 varying beam spanning a grid of 40 fixed beams
In an environment where the NLOS (or fading) component of the channel is dominant with respect to the LOS component (typically C2 environment in WIMI) the performances of fixed beamforming and long-term CSI based beamforming techniques degrade due to the large angle of departure spread of the channel In this case short-term CSI based adaptive beamforming techniques are better suited to exploit the multi-antenna gain The main limitation when using these techniques in a wide-area scenario is the high signalling overhead needed for the feedback of the CSI from the mobile end to the BS In order to reduce the signalling overhead and still preserve the multi-antenna gain an adaptive beamforming technique based on channel tracking (TrackBF) is considered
With this approach the beamforming vectors are determined according to the maximum ratio combining solution ie )(ˆ)(ˆ)(
H nnn kk hhw = using the estimated (tracked) channel )(ˆ n
kh of the scheduled user
k It is assumed that the complex gain αk(n)=hk(n)w(n) is fed back and used to track the channel at the BS via Kalman filtering [GA93] In addition to the channel the Kalman filter gives an estimate of the covariance matrix ))(ˆ)(())(ˆ)(E()( H nnnnn kkkkk hhhhC minusminus= which is a measure of the quality of the channel estimation and is used to predict the transmission rate for user k The scheduling decision is then made using the Proportional Fair Scheduler (PFS)
The proposed technique has the same reduced complexity and feedback requirements as the existing Opportunistic Beamforming (OBF) [VTL02] approach which is implemented here using a varying beam w(n) that spans a grid of 40 fixed beams and where the resulting gain αk(n)=|hk(n)w(n)| or the associated SNR is fed back This technique is used as a benchmark for comparison
Results show both the TrackBF and OBF enhance the performance over the SISO case by exploiting the multiple transmit antennas advantage (Figure G11) In terms of mean cell throughput the TrackBF and OBF improve the performance by 47 and 16 respectively over the SISO case Moreover the TrackBF outperforms the OBF in terms of throughput and fairness the latter is reflected by the lower probability of high inter-packet delays (Figure G12) As expected the TrackBF performs much better for pedestrian users than for vehicular users (Figure G11) The performance degradation in the case of vehicular users is related to the poor channel tracking quality due to high mobility
WINNER D210 v10
Page 145 (180)
0 50 100 150 2000
02
04
06
08
1
Cell Throughput Mbits
Pro
b(C
ell T
hrou
ghpu
t lt a
bsci
ssa)
Cell Throughput Tc = 1000 K = 60 per cell
TrackingPFS mean = 110Mbits
Opportunistic BFPFS mean = 87Mb
SISOPFS mean = 75Mbits
0 2 4 6 8 100
02
04
06
08
1
User Throughput Mbits
Pro
b(U
ser T
hrou
ghpu
t lt a
bsci
ssa)
User Throughput K = 60 per cell
TrackingPFS Pedestrian(M1)Opportunistic BFPFS Pedestrian(M1)TrackingPFS Vehicular(M2)Opportunistic BFPFS Vehicular(M2)
Figure G11 CDF of cell throughput (left plot) and user throughput (right plot) for SISO adaptive beamforming with tracking and OBF with fixed grid of beams 20 users per sector
100 101 10210-4
10-3
10-2
10-1
Inter-packet delay in chunk duration
Pro
b(de
lay
gt ab
scis
sa)
Inter-packet delay distribution K = 60 per cell
TrackingPFSOpportunistic BFPFS
Figure G12 inter-packet delay distribution 20 users per sector
G22 Comparison of various adaptive beamforming techniques
Simulation Assumptions Simulator Multi-link one sector 1000 frames simulation time with 100 drops Scenario wide area cellular MT = 8 MR = 1 ULA Channel modelling SCME no path loss no shadowing Interference modelling Only Intra-cell interference by full simulation of all links Mulitple access adaptive OFDMATDMA(SDMA) OFDM parameters 20 MHz bandwidth 512 subcarriers (406 used) MCS 1 16-QAM r=12 FEC Conv coding (561753)oct with memory 8 Codeword length 2 chunks Feedback delay 1 frame CQI feedback either beam selection info or covariance matrix Overhead None Mobile speed 50 kmh same for all mobiles
In these investigations several beamforming techniques plus SDMA are studied in a wide-area scenario on multi-link level Scheduling is done chunk based in a score-based proportional fair way one chunk occupies 8 subcarriers times 12 OFDM symbols Coding and scheduling is always performed for groups of two consecutive chunks
The first beamforming technique is a grid of fixed beams (GOB) with 8 beams Non-neighboured beams share the same time-frequency resources A feedback of the strongest beam and a corresponding CQI value are assumed Inside each beam the CQI value is used for the scheduling score calculation
WINNER D210 v10
Page 146 (180)
-20 -10 0 10 20 300
20
40
60
80
100
120
SNR [dB]
aver
age
sect
or th
roug
hput
[Mbi
ts] 32 users
-20 -10 0 10 20 300
20
40
60
80
100
120
SNR [dB]
16 users
-20 -10 0 10 20 300
20
40
60
80
100
120
SNR [dB]
aver
age
sect
or th
roug
hput
[Mbi
ts] 8 users
-20 -10 0 10 20 300
20
40
60
80
100
120
4 users
SNR [dB]
MU ABSU ABGOBAB 1str4 str maxSISO
Figure G13 Score based suburban macro
-20 -10 0 10 20 300
20
40
60
80
100
120
SNR [dB]
aver
age
sect
or th
roug
hput
[Mbi
ts] 32 users
-20 -10 0 10 20 300
20
40
60
80
100
120
SNR [dB]
16 users
-20 -10 0 10 20 300
20
40
60
80
100
120
SNR [dB]
aver
age
sect
or th
roug
hput
[Mbi
ts] 8 users
-20 -10 0 10 20 300
20
40
60
80
100
120
4 users
SNR [dB]
4 str maxMU ABSU ABGOBSISOAB 1 str
Figure G14 Score based urban macro
The second technique is adaptive beams with single-user optimised antenna weights (AB SU) based on Eigenbeamforming (see [HBD00]) For SDMA the selection of users is done successively The user with the highest score is selected first All spatially separable users are candidates for scheduling From these candidates the user with the highest score is selected This process is repeated until there are no more spatially separable users or the maximum number of desired spatial streams is reached The transmitter relies on feedback of CQI information (to calculate the score) and the spatial covariance matrix to calculate the antenna weights and to decide on spatial separation
WINNER D210 v10
Page 147 (180)
The third technique is adaptive beams with multi-user optimised antenna weights (AB MU) The user selection is done as above additionally the antenna weights are altered to achieve mutual interference suppression by multiplying the Eigenbeam weights by an inverted interference covariance matrix
As a reference case also results for SISO and adaptive beams without SDMA (AB 1str) are shown The figures above show the average total sector throughput over the SNR for the different investigated techniques lsquo4 str maxrsquo refers to the maximum which can be achieved by a 4-stream SDMA with the given MCS GOB is hard limited by these four streams adaptive beams have a soft limit
It can be concluded that multi-user optimised adaptive beams always outperform the other two SDMA schemes The relative sector throughput gain versus GOB increases with decreasing number of users This is caused by more degrees of freedom in user selection and better mutual interference suppression But it relies on the knowledge of the long-term covariance matrix (meaning a higher feedback rate is necessary if no UL CSI can be used) Single user optimised adaptive beams are characterised by a reduced computational complexity compared to AB MU They always outperform GOB with few users On the other hand with high load (more streams) and a larger demand of spatial separation (eg Round Robin instead of score based or a scenario with more angular spread) they can even be outperformed by GOB So in total they are questionable to be used in conjunction with SDMA GOB inherently carry benefits by their simple feedback and scheduling and their orthogonal design being a simple form of multi-user optimisation
SDMA in general shows increasing gains with increasing number of active users (due to increased chances of spatial separability) and decreasing angular spread SDMA has a large potential for increasing cell throughput and is a promising candidate for a wide-area scenario
G23 Comparison of maximal ratio and interference rejection combining at UT
Simulation Assumptions Simulator Multi-link Scenario wide area downlink MT = 1 MR = 2 Channel modelling WINNER channel model C2 NLOS no path loss no shadowing Interference modelling One Inter-cell interference with DIR of 6 dB Multiple access Non-adaptive OFDMTDMA MC-CDMATDMA OFDM parameters 20 MHz bandwidth 512 subcarriers (406 used) MCS QPSK r=12 16QAM r=13 FEC 3GPP 12 and 13 Turbo coding Mobile speed 50 kmh for all terminals
When frequency reuse one is assumed in downlink at wide area mode inter-cell interference or co-channel interference will degrade system performance However multiple antennas at receiver can be used to mitigate the interference
Here 1x2 OFDM and 1x2 multi-carrier CDMA systems are considered in downlink for wide area For multi-carrier CDMA spreading factor and the number of Walsh-Hadarmard codes are both equal to 8 One inter-cell interference with dominant interference ratio (DIR) of 6 dB is generated QPSK with 3GPP 12 Turbo coding and 16QAM with 13 Turbo coding are used At receiver two combining methods are considered One is maximum ratio combining (MRC) and another is interference rejection combining (IRC) which is also referred to here as miminum mean square error combining (MMSEC)
Simulation results are shown in Figure G15 No matter which MCS and receiver algorithm is used the performance for 1x2 OFDM and multi-carrier CDMA are very similar However receiver complexity of multi-carrier CDMA is larger than that of OFDM system On the other hand MMSE combining provides significant gains over MRC combining under interference scenario Therefore receive antenna processing eg MMSE combining is a very efficient means to suppress inter-cell interference
WINNER D210 v10
Page 148 (180)
-7 -6 -5 -4 -3 -2 -1 0 1 210
-4
10-3
10-2
10-1
100
SINR (dB)
Err
or R
ate
BER OFDM-MRCBER OFDM-MMSECBER CDMA-MRCBER CDMA-MMSECFER OFDM-MRCFER OFDM-MMSECFER CDMA-MRCFER CDMA-MMSEC
-8 -6 -4 -2 0 210
-3
10-2
10-1
100
SINR (dB)
Err
or R
ate
BER OFDM-MRCBER OFDM-MMSECBER CDMA-MRCBER CDMA-MMSECFER OFDM-MRCFER OFDM-MMSECFER CDMA-MRCFER CDMA-MMSEC
Figure G15 Performance of 1 times 2 MRC and MMSEC considering OFDMTDMA and MC-CDMATDMA with QPSK modulation and 12 turbo coding (left plot) and 16QAM modulation
and 13 turbo coding (right plot)
G24 Comparison of beamforming diversity and multiplexing
Simulation Assumptions Simulator System 19 three-sector sites full interference modelling using wrap-around Scenario Wide area cellular on average 10 userssector frequency reuse 1
MT le 8 MR le 2 varying cell radius Channel model C2 NLOS WINNER interim channel model (WIMI) MCS Modulation schemes QPSK 16QAM and 64QAM
Channel code rates 110 13 12 23 34 and 89
FEC
Turbo code combined with Layer 1 code block segmentation (up to 5114 bits per block) and rate matching codeword length from 998 (QPSK rate 110) to 26624 bits (64QAM rate 89) rate 17 mother code (polynomials feedback 013 feedforward 015 017 011)
FeedbackOverhead Chunk SINR after receiver processing zero delay no overhead
A non-frequency adaptive downlink based on OFDMTDMA is evaluated in a multi-cell wide-area scenario in order to assess the value of different components of the WINNER multiple-antenna concept Performance is compared for different cell sizes and in terms of average sector throughput and active radio link data rates The latter measure is the (average) user throughput when scheduled for transmission Since round robin TDMA scheduling is applied the active radio link rate may be used to assess the fairness in the network Furthermore because many idealised assumptions are made one should not focus on the absolute performance figures but rather on the relative performance
The upper left plot in Figure G16 depicts the average sector throughput in a network using a single downlink transmit antenna Compared to single antenna reception terminal receive diversity may improve performance significantly MRC provides an average throughput gain of 35 in an interference limited scenario Interference rejection combining (IRC) referred to as optimum combining in [Win84] which suppresses inter-cell interference by taking the spatial colour into account on a per carrier basis adds another 10ndash15 The lower left plot shows the distributions of the active radio link rates for a cell radius of 700 m and as can be seen performance is improved for all users
Transmit diversity may be realised by using linear dispersion codes In here Alamoutirsquos orthogonal design is considered with two transmit antennas separated 20 wavelengths The terminals use one or two receive antennas and as a reference single antenna transmission is also considered In the upper right plot of Figure G16 the sector throughput is shown and in the lower right plot the distributions of the data rates are shown for a cell radius of 700 m With receive diversity terminals suppress inter-cell interference taking the structure of the interference into account The results indicate that compared to single-antenna transmission the gain of transmit diversity with Alamoutirsquos design is slightly below 10 with receive diversity and slightly above 10 without receive diversity It can also be seen that transmit diversity does not improve data rates for the lower percentiles but rather for the high percentiles We note that there is inherently a substantial amount of frequency diversity available in the channel which may explain the
WINNER D210 v10
Page 149 (180)
marginal improvement and the present evaluation does not illustrate potential benefits of reduced channel quality variations for non-ideal link adaptation
100 m 1 km 10 km0
10
20
30
40
50
60
cell radius
aver
age
sect
or th
roug
hput
[Mbi
ts]
MRX = 2 IRCMRX = 2 MRCMRX = 1
0 20 40 60 800
010203040506070809
1
prob
(use
r thr
ough
put lt
abs
ciss
a)
active radio link rate [Mbits]
100 m 1 km 10 km0
10
20
30
40
50
60
cell radius
aver
age
sect
or th
roug
hput
[Mbi
ts]
MTX = 2 MRX = 2MTX = 2 MRX = 1MTX = 1 MRX = 2MTX = 1 MRX = 1
0 20 40 60 800
010203040506070809
1
prob
(use
r thr
ough
put lt
abs
ciss
a)
active radio link rate [Mbits]
Figure G16 Average sector throughput and data rate distributions for spatial diversity techniques The data rate distributions are depicted for a cell radius of 700 m
Beamforming solutions provide a directivity gain and change the interference situation in the network Beamforming can be accomplished eg by creating a fixed grid of beams (GOB) and using the beam with the lowest pathloss at transmission An alternative is to form user-specific beams based on the transmit covariance matrix of the channel In here the eigenvector associated with the largest eigenvalue of the transmit covariance matrix is used and this is referred to as eigenbeamforming (EBF) The left plot in Figure G17 depicts the sector throughput with downlink beamforming based on a GOB and EBF respectively using two four and eight base station antennas With GOB the antennas are used to form four eight and 16 fixed beams respectively Terminals have two receive antennas for IRC The results indicate that in the studied scenario EBF provides only a marginal performance improvement compared to a solution using a GOB Thus heavily quantised knowledge of the transmit covariance matrix here in terms of a preferred beam may be enough to capture most of the available gain Increasing the number of antennas gives throughput improvements in the order of around 30 when going from two to four antennas and another 20-25 when increasing the number of base station antennas to eight The enhancement is generally higher at large cell sizes To the right in Figure G17 results with EBF and one and two terminal receive antennas for IRC are shown The gain of terminal receive diversity in terms of sector throughput is here in the range 35ndash50 The gain typically decreases when the number of base station antennas increases illustrating that benefits not necessarily are additive
To the left in Figure G18 performance with beamforming (EBF) at the base station combined with terminal receive diversity is shown The upper left plot shows the average sector throughput and the lower left plot is the corresponding data rate distributions in a deployment with 700 m cell radius As can be seen the combination of beamforming and terminal receive diversity really improves the fairness and the lower percentiles of the data rates A fraction of the users may even become modulation limited With eight base station antennas used for beamforming throughput has increased more than threefold compared to single antenna transmission and reception and more than twofold compared to single antenna transmission combined with dual terminal receive diversity
WINNER D210 v10
Page 150 (180)
100 m 1 km 10 km0
20
40
60
80
100
120
cell radius
aver
age
sect
or th
roug
hput
[Mbi
ts]
EBFGOB
100 m 1 km 10 km0
20
40
60
80
100
120
cell radius
aver
age
sect
or th
roug
hput
[Mbi
ts]
MRX = 2MRX = 1
Figure G17 Average sector throughput with beamforming comparing eigenbeamforming with grid of beams (left) and comparison of terminal receive diversity with single antenna reception
(right)
100 m 1 km 10 km0
20
40
60
80
100
120
cell radius
aver
age
sect
or th
roug
hput
[Mbi
ts]
MTX = 8 MRX = 2MTX = 4 MRX = 2MTX = 2 MRX = 2MTX = 1 MRX = 1
0 50 100 1500
010203040506070809
1
prob
(use
r thr
ough
put lt
abs
ciss
a)
active radio link rate [Mbits]
100 m 1 km 10 km0
20
40
60
80
100
120
cell radius
aver
age
sect
or th
roug
hput
[Mbi
ts]
MTX = 2x4 MRX = 2 PSRCMTX = 2x2 MRX = 2 PSRCMTX = 2x1 MRX = 2 PARCMTX = 1 MRX = 1
0 50 100 1500
010203040506070809
1
prob
(use
r thr
ough
put lt
abs
ciss
a)
active radio link rate [Mbits]
Figure G18 Performance comparison of conventional beamforming with single stream transmission (left) and dual stream transmission (right) The data rate distributions are for cell
radius 700 m
To achieve very high peak data rates though one may have to consider the use of spatial multiplexing For this purpose per antenna rate control (PARC) is considered With two streams one channel coded block is transmitted from each (virtual) antenna and IRC in combination with successive interference cancellation after channel decoding is employed at the receiver side The performance of such dual stream transmission is depicted to the right in Figure G18 together with the corresponding single antenna results In this case both PARC with two antennas separated 20 wavelengths as well as the combination with EBF referred to as per stream rate control (PSRC) for four and eight antennas are considered For PSRC antennas are divided into two groups (uniform linear sub-arrays) separated 20 wavelengths within each group the element separation is half a wavelength and the two eigenvectors associated with the two largest eigenvalues of the transmit covariance matrix are used to transmit the two streams with the same
WINNER D210 v10
Page 151 (180)
power As can be seen from the lower plots in Figure G18 which show the data rate distributions for cell radius 700 m dual stream transmission does indeed increase peak data rates and for PSRC with eight transmit antennas the fraction of the users benefiting from this is non-negligible However on average dual stream transmission provide a throughput that is slightly below or similar to that of conventional single-stream beamforming with same number of antenna elements An interpretation of the rate distributions is that the increase of peak data rates comes at the expense of a reduced fairness
In summary the results indicate that transmit beamforming and terminal receive diversity are essential components to ensure good coverage of high data rates and high system throughput For beamforming with no SDMA component eigenbeamforming gives a small performance advantage compared to a grid of beams In interference limited scenarios terminal receive diversity with interference suppression gives a non-negligible performance improvement compared to maximum ratio combining The results further indicate that in the studied scenario transmit diversity using Alamoutirsquos orthogonal design gives only a marginal performance improvement compared to single antenna transmission One possible explanation of the limited gain is that the wideband channel inherently provides a large amount of frequency diversity Finally spatial multiplexing can be used to increase the peak data rates and may be successfully combined with beamforming Compared to a deployment using conventional beamforming this increase of peak data rates comes at the cost of reduced fairness although the average throughput is similar
G25 Performance of SMMSE precoding
Simulation Assumptions Simulator System level simulator 1000 snapshots 1 frame per snapshot Scenario Short range MT = 8 16 24 MR = 1 2 4 Round Robin scheduling Channel modelling A1 B1 WIMI generic channel model Multiple access Non-adaptive OFDMATDMASDMA Number of active users
variable parameter depends on the number of pilots available and the number of antennas at the user terminals
Channel estimation error modelling
Channel estimation error is modelled as a zero mean complex Gaussian variable and the variance is inversely proportional to the average receive SNR The assumed estimator gain is about GN=13 dB37
Cell radius 30 m in A1 scenario and 550 m in B1 scenario virtual overhead for parameter estimation
14 or 20 out of 80 resource elements of each chunk
SDMASMUX One spatial stream per user Maximum number of users multiplexed is fixed
SMMSE precoding is a promising spatial processing candidate for the WINNER system concept [VH04] [VH05a] [VH05b] [WIND27] In order to assess its performance for varying antenna configurations under realistic impairments system simulations have been set up for the short range isolated cell scenario
Modelling of impairments with respect to transmitterreceiver inequalities are performed according to
( ) ( ) ( )( ) ( )( ) 1~~ minus= k
BSTULkk
MSDLk KHKH
where ( )ULkH~ and ( )DLkH~ denote the uplink and downlink channel matrix respectively The terms KMS
(k) and KBS(k) represent the perturbations introduced by the transmitter and the receiver front-ends
These matrices are diagonal if we assume that the front-ends have only non-linear imperfections which implies that these matrices can be inverted and that their products are commutative The amplitude of KMS
(k) and (KBS(k))-1 is modelled as a truncated random Gaussian variable with mean 10 and variance
0007 and 00008 respectively The phase is uniformly distributed in the interval [-87o 87o] and [-30o 30o] see [BCK03]
The average number of users in the system and the overhead per chunk depends on the number of pilots multiplexed for the channel estimation from the different antennas In the proposal for the channel estimation it is assumed that we can estimate the channel from 3 antennas in the short-term adaptive mode or 6 in the long-term adaptive mode per one chunk In our simulations we rely on the assumption that the channel or the second order statistics of the channel are constant over one frame Since there are 3 time slots in the frame we multiplex in every time slot pilots from different antennas regardless of whether these antennas are located at the same terminal or not We assume that one user transmits using only one 37 Practically the estimator gain may vary depending on the number of users antennas and on the preamble design
and if correlation in frequency domain is corrected or not see [WIND21]
WINNER D210 v10
Page 152 (180)
fourth of the available bandwidth Thus the maximum number of different antennas that can be estimated in the short-term adaptive mode is 36 and the average number of users considered in the system simulations was 127 In the long-term adaptive mode the maximum number of antennas that can be estimated amounts to 72 and the average number of users considered was 27
Let us define the average correlation matrix of the ith user in the kth chunk as
( ) ( ) ( )sum=j
jki
Hjki
chunk
ki N
1 HHR
and its singular-value decomposition (SVD) as ( ) ( ) ( ) ( )Hki
ki
ki
ki VQVR = where ( )jk
iH is the ith user
channel matrix in the kth chunk The MU MIMO precoding is now performed on the equivalent channel defined as follows
( ) ( ) ( ) Hki
ki
ki VQH 21=
(
By using the equivalent channel ( )kiH
( we facilitate easier adaptation from perfect CSI to the second-
order CSI
The following notation is used to describe the simulated system MTKmaxNpilots where MT is the number of antennas at the BS Kmax is the maximum number of spatial streams per chunk and Npilots is the number of different antennas that can be estimated per chunk
0 500 1000 1500 20000
02
04
06
08
1
data rate [Mbits]
Pro
b(C
ell T
hrou
ghpu
t lt a
bsci
ssa)
cell throughput
833164316762466
0 20 40 60 80
0
02
04
06
08
1
data rate [Mbits]
Pro
b(U
ser T
hrou
ghpu
t lt a
bsci
ssa)
user throughput
83316431676data4
Figure G19 Cell and user throughput performance of SMMSE in A1 scenario
200 400 600 800 1000 1200 14000
02
04
06
08
1
data rate [Mbits]
Pro
b(C
ell T
hrou
ghpu
t lt a
bsci
ssa)
cell throughput
8431676
0 20 40 60 80
0
02
04
06
08
1
data rate [Mbits]
Pro
b(U
ser T
hrou
ghpu
t lt a
bsci
ssa)
user throughput
8431676
Figure G20 Cell and user throughput performance of SMMSE in B1 scenario
Simulation results for the A1 and B1 scenario are plotted in Figure G19 and Figure G20 In the A1 scenario the initial assumption of having 8 antennas at the BS has been shown not to be sufficient to provide 1 Gbps as a target cell throughput By increasing the pilot overhead we are able to estimate more usersrsquo channel matrices Significant cell throughput improvements can only be achieved by increasing the number of antennas at the BS as well as the number of users that are spatially multiplexed The 90 user
WINNER D210 v10
Page 153 (180)
throughput is almost constant as mobile terminals move away from the BS The 50 user throughput loss due to the increase of the distance from the BS is less than 10 Mbps
Similar as in the A1 scenario in the B1 scenario the target throughput of 600 Mbps is achieved by increasing the number of antennas at the BS and the number of users that are spatially multiplexed The values necessary to reach the target cell throughput are smaller than in A1 scenario
Hence Multi-user MIMO precoding is a powerful tool to provide the required celluser throughput It exploits the available CSI at the BS allowing very good use of the available resources in the spatial domain Benefits are limited by the overhead needed to acquire the necessary information (CSI) It was shown that this trade-off is justified and it results in high throughput gains
In order to achieve 1 Gbps in an indoor scenario we should multiplex as many users as possible with large number of antennas at the BS The maximum allowable number of users depends on the number of pilots that are multiplexed per one chunk The reduction of throughput caused by the increased pilot overhead is compensated for by SDMASMUX or higher order constellation sizes
G3 Downlink multi-user detection
G31 Comparison of receiver structures for SISO MC-CDMA Simulation Assumptions
Simulator Single-link Scenario Short range isolated cell single antenna BS and UT Channel modelling B1 clustered delay line and Independent Rayleigh Interference modelling no spreading type Walsh-Hadamard spreading length 8 MCS 1 4-QAM FEC Convolutional coding (561753)oct with memory 8
Codeword length 3328 bit
The physical layer simulation layout follows the generic WINNER transmitter structure ie the user information bits are encoded using a terminated (561753)oct rate frac12 convolutional code (3GPP) The codebits are randomly interleaved and assigned to complex valued 4-QAM data symbols using Gray mapping These user data symbols are then spread using a 8x8 Walsh-Hadamard spreading matrix which yields the data chips The chips are assigned to the used subcarriers of an OFDM symbol The codeword length ie the frame length of one transmission entity is chosen such that one terminated convolutional codeword finally forms one OFDM symbol This means contemporarily that one OFDM symbol contains exactly one userrsquos data and the user multiplexing is done in time direction ie different OFDM symbols are assigned to different users
Path loss and shadowing effects are not considered within these investigations In addition we assume that the channel is almost constant during one OFDM symbolrsquos period ie inter-carrier interference is negligible
Figure G21 show the bit error rates (BER) and the block error rate (BLER) versus the signal-to-noise ratio (SNR) respectively The SNR is defined as the ratio of the average user signal power and the variance of the complex valued additive white Gaussian noise (AWGN) in each subcarrier Solid lines show the error performances for the WINNER B1 NLOS scenario where the chips of one Walsh-Hadamard spreading entity are distributed over the whole available bandwidth This is achieved by using a subcarrier block interleaver of size 8x208 Due to multiple access interference (MAI) there is a loss of about 23 dB at a BER of 10-4 for single user detection (SUD) using MMSE equalisation compared to the interference free (perfect IC) case where we assume and subtract MAI perfectly To combat MAI at the receiver we use a soft parallel interference canceller (SPIC) as described in the WINNER deliverable D26 [WIND26] The BLER performance of the SPIC with 5 iterations almost reaches the perfect IC bound as it can be seen from Figure G21 right plot For comparison we show results for an independent Rayleigh fading channel which provides maximum (frequency) diversity and the B1 NLOS without subcarrier interleaving Due to an increased MAI the gap between the perfect IC and the SUD performance is even higher compared to B1 NLOS If however we skip the subcarrier interleaver for the B1 NLOS scenario we observe almost no MAI since chips are spread over adjacent subcarriers which due to strong correlation maintain orthogonality of the spreading sequences quite well This results in a negligible difference of SUD and perfect IC error performances In this case we cannot benefit from the more complex SPIC receiver
WINNER D210 v10
Page 154 (180)
0 2 4 6 810-6
10-4
10-2
100
SNR [dB]
BE
R
0 2 4 6 810-3
10-2
10-1
100
SNR [dB]
FER
BLE
R
Figure G21 BER and BLER vs SNR for B1 NLOS and independent Rayleigh fading
G32 Comparison of receiver structures for MIMO MC-CDMA
Simulation Assumptions Simulator link-level Scenario short range MT = 4 MR = 4 Channel modelling B3NLOS WIMI Multiple access MC-CDMATDMA MCS 1 QPSK r=12 FEC punctured turbo coding (1513)oct with memory 4
codeword length fixed size of 6656
A downlink MIMO MC-CDMA system is considered where K users are active in each cell The desired user is located in the central cell The spreading factor (in frequency domain) is G (reducing to OFDM iff G=1) The input data bits are encoded by the single antenna turbo code (TC) or by space-frequency turbo-coded modulation (SFTuCM) which is designed for two transmit antennas We divide the available transmit antennas into independent layers denoted as J=MTJ0 where J0 is the number of antennas associated with the encoder For the single antenna turbo code J0=1 whereas J0=2 in the SFTuCM case A vertical layering structure is applied where the encoded and modulation mapped symbols are multiplexed for J transmit antenna groups By doing so the spatial diversity gain the space-time coding gain (in case of SFTuCM) and spatial multiplexing gain can be achieved simultaneously The MMSE based detectors for the multiple antenna MC-CDMA approach considered herein are relying on the techniques presented in [WIND23 WIND26] In order to achieve better spatial receiver diversity compared to linear receiver the principle of iterative detection and decoding (IDD) can be employed with the considered symbol level SF-MMSE receiver The soft interference cancellation with IDD is considered herein
Figure G22 Performance of layered MIMO MC-CDMA systems
WINNER D210 v10
Page 155 (180)
The simulation performance of the MC-CDMA based downlink with G=K=8 and MR = MT =4 is shown in Figure G22 The scenarios B3 with NLOS clustered delay line model was considered The system with SFTuCM and group-wise layering outperforms the system with turbo-coded system The soft co-antenna interference (CAI) cancellation is shown to possess the ability to further improve the performance Our results indicate that the considered OFDM and MC-CDMA systems are feasible candidates for future cellular high data rate downlink packet transmission For the SFTuCM coded systems the complexity is at the same level as the turbo-coded systems
G4 Uplink multiple access
G41 Performance of single carrier based adaptive TDMA Simulation Assumptions
Simulator Multi-link Scenario Wide area single-cell SISO perfect synch and long-term power control Channel modelling ITU-IV Channel A MCS Uncoded BPSK 4QAM 8PSK 16QAM 32CrossQAM 64QAM
128CrossQAM and 256QAM Uplink spectrum 44 GHz carrier frequency and 25 MHz bandwidth Single-carrier parameters Symbol time 4923 ns Square-root-raised-cosine roll-off factor 0231 Data block size 416 symbols and guard period 256 micros covers most multi-path delay spread Frame size 16 Data blocks (time slots) individually allocated to TDMA users
Performance results for an adaptive TDMA block-based single-carrier uplink are provided This uplink performs multi-user adaptive scheduling to the small scale fading for the individual users and also link adaptation of the scheduled users Thus it is time-adaptive towards the small-scale fading but not frequency-adaptive since it uses single-carrier transmission The aim of the investigation is to show the potential multi-user diversity gains that can be obtained The results are extended simulation results to the work in [WOSS05] where an analytical performance analysis and more details of the design and assumptions behind the investigated uplink can be found The cyclic prefix of each Data block (time slot) is designed to cover most of the multi-path delay spread Thus no inter-Data block ISI is assumed and the FD-DFE [FA02] performs equalisation of the ISI among symbols within each Data block only
0 5 10 15 200
05
1
15
2
25
3
35
4
45
Number of users
Spe
ctra
l Effi
cien
cy [b
itss
Hz]
Analysis 10 dBAnalysis 16 dBAnalysis 19 dBSimulation 10 dBSimulation 16 dBSimulation 19 dB
Figure G23 Multi-user diversity gains for the adaptive TDMA single-carrier uplink
In the simulations results in Figure G23 all users have the same average SNR and the user speed is 50 kmh for all users The scheduler performs max throughput scheduling based on equalised user SNR Perfect estimation and prediction of the impulse responses of each time-slot of each user are assumed Thus the results are upper bounds on the attainable spectral efficiency Note also that Figure G23 does not include overhead related to channel estimation and prediction (approx 15) In addition only the signalling bandwidth is taken into account ie the spectral roll-off (231) is not compensated for As seen there is a multi-user diversity gain for this uplink However compared to the multi-user diversity gains for systems with more narrow bandwidths as investigated in [WOSS05] the gain is smaller The reason for this is the channel averaging caused by the frequency diversity for the wideband channels This
WINNER D210 v10
Page 156 (180)
makes the variability of the instantaneous channels from the individual users to be smaller which in turn limits the obtainable amount of multi-user diversity gain
A fair comparison between the investigated adaptive TDMA single-carrier uplink and an adaptive TDMAOFDMA uplink has to take especially the pilot overhead feedback information rate subcarrier frequency offset and peak-to-average power ratio (PAPR) mitigation into account Preliminary results not shown here indicate that for a 5 MHz wide uplink channel there is at least 3 dB gain for the adaptive TDMAOFDMA uplink with 2 frequency offset of the subcarrier spacing compared to the adaptive TDMA single-carrier uplink and before PAPR mitigation loss Thus an adaptive multi-carrier based TDMAOFDMA uplink seems more promising as an adaptive uplink for the WINNER system concept
G42 Comparison of IFDMA and chunk based OFDMA
Simulation Assumptions Simulator Link level Scenario wide area MT = 1 MR = 1 mobility 70 kmh for all mobiles single user
considerations Channel modelling COST 207 TU Interference modelling no inter-cell interference OFDM parameter Number of used subcarrier = 512 subcarrier distance = 390625 kHz
guard period = 7 micros MCS 1 QPSK r=12 FEC convolutional coding (133171)oct with memory 6
Codeword length fixed size of 1000 bits
The purpose was to investigate the impact of frequency diversity on performance for IFDMA with interleaved subcarrier allocation compared to DFT-precoded OFDMA with block-wise subcarrier allocation As expected for coded transmission over a very frequency selective mobile radio channel as the one assumed IFDMA shows significant better performance compared to DFT-precoded block OFDMA for a number of subcarriers per user Qgt1 This is due to the fact that in IFDMA the subcarriers are equidistantly distributed over the total bandwidth of 20 MHz whereas for DFT-precoded OFDMA only a fraction of the bandwidth is used for transmission For Q=1 ie each user gets only a single subcarrier both schemes exhibits the same performance and cannot exploit frequency diversity
-5 0 5 10 15 20 25
10-3
10-2
10-1
100
SNR [dB]
BE
R
OFDM Q=1OFDM Q=4OFDM Q=16IFDMA Q=1IFDMA Q=4IFDMA Q=16
Figure G24 BER comparison for IFDMA and DFT-precoded block OFDMA for various number of allocated subcarriers per user Q
The SNR gains of IFDMA compared to DFT-precoded block OFDMA at BER=10-3 for an interleaving depth of about 250micros is still 55 dB at a not too low data-rate ie 625 Kbits It is expected that also for transmission using block codes and for the use of the WINNER channel model the same effect can be shown However further studies are required to assess the impact of real channel estimation as well as imperfectly synchronised and power controlled UTrsquos for either case which might reduce the interleaving gain considerably
WINNER D210 v10
Page 157 (180)
G43 Performance of adaptive OFDMA Simulation Assumptions
Simulator Multi-link Scenario Short range isolated cell single antenna BS and UT Channel modelling A1 LOS NLOS B1 LOS NLOS including path loss and shadow fading Cell radius 50 m for A1 150 m for B1 MCS 4 BPSK 4 16 64 QAM generally considered by SNR gap approximation
and SNR gap Γ = 5 dB FEC convolutional coding (561753)oct with memory 8 code rate 12
Codeword length 240 times (number of bits per symbol) not relevant for results User distribution ( ) KkrKkdk 110middot)1()1(91 cell K=minusminus+=
The performance of frequency adaptive OFDMA (subcarrier based and chunk based) is evaluated by multi-link simulations The considered adaptive OFDMA scheme maximises the sum rate of all users under individual transmit power constraints for which an extremely simple and efficient algorithm for adaptive chunk allocation is found to perform well The adaptive scheme is appropriate for the uplink in the short-range case where the channel is quasi-static and CSI is available at the transmitter
We consider the effects of the channel estimation and prediction by a simple Gaussian error model The largest prediction horizon for the TDD mode is L = 1 ms [WIND24] Table 31) In the B1 scenario the fastest users move at an average speed of v = 5 kmh (see Appendix E3) the carrier frequency is fc = 5 GHz which gives a prediction horizon in fractions of wavelength of 020=λ= cvLl This prediction horizon is rather short in comparison to those considered in [WIND24] Section 313 and it is thus expected that the CSI feedback delay has no significant effects for the A1 and B1 scenario The channel predictor estimates the power gain 2
nn hg = Due to channel estimation errors and the inevitable feedback delay the estimation is slightly degraded In the following we consider this effect by the simple model ( )nnn gg η+= 1ˆ where nη is )0( 2
eσΝ distributed and 2eσ denotes the normalised estimation and
prediction error The instantaneous SNR is given by 002 NpgNph nnnnn ==γ and the estimated SNR
is ( )nnnnn Npg η+γ==γ 1ˆˆ 0 For the simulation of the BER for the selected MCS first the SNR nγ is selected and then for each codeword an estimated SNR is generated The final BER is averaged over many codewords
In Table G1 the minimum SNR for a target BER of 4b 10minus=P for each MCS is given The SNR gap Γ
denotes the additional required SNR in comparison to the Shannon limit to reach the same bit rate at the target BER ( ) )12(1log minmin2 minusγ=ΓrArrΓγ+= RR The average SNR gap for 0102 =σe is
dB5asympΓ which will be used in the following to consider the effects of realistic adaptive modulation and coding
Table G1 Minimum SNR for selected modulation scheme
02 =σe 0102 =σe code rate modulation SNR γmin SNR gap Γ SNR γmin SNR gap Γ 05 BPSK 05 dB 43 dB 09 dB 47 dB 1 QPSK 35 dB 35 dB 39 dB 39 dB 2 16-QAM 95 dB 47 dB 99 dB 51 dB 3 64-QAM 146 dB 61 dB 148 dB 63 dB
Adaptation Problem and Key Design Criteria The multiple-access scheme has to adapt to the traffic and the QoS requirements as well as to the channel of multiple users Since joint adaptation to all parameters would result in an impractically complex optimisation problem it seems wise to separate the problem into two adaptation steps
1 Scheduling Adaptation to traffic and QoS requirements like bit rate delay queue length and userserviceflow priorities including ldquofairnessrdquo
2 Adaptation to the channel state ie the channel gain to noise ratio
The priorities of users services or flows as well as the exact definition of fairness will depend mainly on the operatorrsquos adopted strategy and business model The scheduling strategy hence must be flexible and is not only dictated by technical arguments In the following we present an adaptive scheme which adapts
WINNER D210 v10
Page 158 (180)
to the channel only and offers to the scheduler the possibility to operate near the border of the channel capacity region The limits of this region are established in [Yu02] and [Tse98] however no algorithm which is simple enough for practical implementation and achieves all border points of the capacity region is known In [PI05] the scheduling region which is achievable with a relatively simple algorithm and which may yield a good approximation to the true capacity region is outlined
The cell capacity for the uplink can be computed by the iterative water-filling (IWF) algorithm [Yu04] which can be adapted easily to OFDMA [Pfl05 PI05] This algorithm computes the optimum power allocation for all users The rate obtained with this algorithm corresponds to the Shannon capacity which can serve as an upper bound A more realistic rate is obtained by considering an SNR gap of Γ = 5 dB which takes into account the considered link adaptation schemes
Figure G25 depicts the sum rates achieved with the optimum IWF algorithm for all four short-range scenarios with and without considering the SNR gap As was also observed in [PI05] ndash although theoretically optimum ndash sharing the subcarriers does not yield any perceivable capacity gain In other words adding an additional CDMA or TDMA component to OFDMA will only increase the system complexity but not give any capacity gain38
0 10 20 30 40 500
100
200
300
400
500
600
700
num ber of users K
sum
rate
[Mbi
ts]
A1 LOS
sum rate Γ=0dBsum rate Γ=5dBno subchannel sharingsubchannel sharing
0 10 20 30 40 500
100
200
300
400
500
600
700
num ber of users K
sum
rate
[Mbi
ts]
A1 NLOS
0 10 20 30 40 500
100
200
300
400
500
600
num ber of users K
sum
rate
[Mbi
ts]
B1 LOS
0 10 20 30 40 500
50
100
150
200
num ber of users K
sum
rate
[Mbi
ts]
B1 NLOS
Figure G25 Uplink cell capacity for OFDMA with N = 1664 subcarriers and constant user density in the cell The performance loss due to allowing only one user per subcarrier is negligible for all
considered cases
In the TDD mode nsub = 16 subcarriers are grouped into one chunk The application of the IWF algorithm to chunks instead of subcarriers is straightforward and the maximum sum rates achieved with a chunk-based (ie with subcarrier groups) OFDMA scheme is given in Figure G26 Naturally the cell capacity of chunk-based OFDMA is inferior but the system complexity as well as the algorithm run-times are significantly lower For practical implementations the complexity of the IWF algorithm might be an obstacle but fortunately there is a low-complexity alternative The XP algorithm [Ace05] (see also [PI05]) is an extremely simple and efficient method for adaptive subcarrier allocation which attains nearly the same sum rate as the optimum IWF algorithm In Figure G26 the sum rate for a fixed subcarrier allocation is given as a reference The subcarrier allocation for this case is given by
38 Note that this statement holds for the short-range uplink and for the sum rate optimisation criterion This does not
contradict the results obtained in eg [Tri04]
WINNER D210 v10
Page 159 (180)
( ) 11mod +minus= fa Kf where af denotes the user allocated to subcarrier f For each user single-user water-filling is performed on his set of subcarriers to compute the resulting sum rate Surprisingly for the lsquoA1 LOSrsquo scenario this simple non-adaptive subcarrier allocation performs close to the optimum solution and even better than the XP algorithm while for the lsquoB1 LOSrsquo case it comes with a significant capacity penalty
0 10 20 30 40 500
100
200
300
400
500
600
700
num ber of users K
sum
rate
[Mbi
ts]
A1 LOS
0 10 20 30 40 500
100
200
300
400
500
600
700
num ber of users K
sum
rate
[Mbi
ts]
A1 NLOS
0 10 20 30 40 500
100
200
300
400
500
600
num ber of users K
sum
rate
[Mbi
ts]
B1 LOS
0 10 20 30 40 500
50
100
150
200
num ber of users K
sum
rate
[Mbi
ts]
B1 NLOS
IWFXPFixed allocation
Figure G26 Sum rate achieved with chunk-based OFDMA (Γ=5 dB) The optimum IWF (iterative water-filling) algorithm achieves the highest rate while the rate achieved with the low-complexity
XP algorithm [Ace05] is only slightly lower
Conclusions The considered adaptive OFDMA scheme maximises the sum rate of all users under individual transmit power constraints It is appropriate for the uplink in the short-range case where the channel is quasi-static and CSI is available at the transmitter The achievable gain is rather low compared to non-adaptive subcarrier allocation if LOS conditions prevail However in NLOS conditions with sufficient frequency-selectivity considerable performance improvements can be obtained
The considered optimisation criterion consciously excludes fairness issues since different notions of fairness exist and these may depend on the operatorsrsquo preferences ldquoFairnessrdquo and other QoS-related constraints can be included by a traffic-aware scheduler which selects for each Frame the appropriate subset of active users
The simulation results show the achievable sum rate per cell or sector in the uplink when both terminal and base station have one antenna The sum rates for an SNR gap of Γ = 0 dB are strict upper bounds while the rates for Γ = 5 dB consider the effect of realistic modulation and coding schemes
G44 Comparison of adaptive OFDMA and OFDM-TDMA
Simulation Assumptions Simulator Multi-link 8 Frames per snapshot 6000 snapshots Scenario Short range isolated cell single antenna BS and UT no power control Channel modelling A1 LOS and NLOS clustered delay line model Cell radius 100 m and 200 m MCS 5 BPSK r=13 BPSK r=23 QPSK r=23 16-QAM r=23 64-QAM
WINNER D210 v10
Page 160 (180)
r=89 FEC Punctured convolutional coding (133171145)oct with memory 6
codeword length variable ndash one codeword always fills one chunk (OFDMA) or one symbol (TDMA)
Type of feedback Average SINR per chunk (OFDMA) or symbol (OFDM-TDMA) Feedback delay 1 Frame Overhead Chunkrsquos overhead 175 tail of CC duplex time Mobile speed anglev sim U(02π) vx sim η(mσ 2) vy sim η(mσ 2) |v|= (vx
2+vy2)05
m = 1 kmh σ = 16 kmh
The performance of OFDMA and TDMA is assessed for the uplink considering several scheduling variants Common to all these variants is a two step approach in the first step a decision is taken which 8 users (out of 40 or 80 users) will be served and in the second step it is decided how many and what resources are assigned to the selected users
In case of Round Robin (RR) both users and resources are sequentially selected and linked With the MaxSNR1 approach the 8 users with the highest SNR are selected in the first step Then equal amount of resources are allocated to these users in a round robin manner With MaxSNR2 users are selected via round robin but the resource allocation is performed according to the maximum rate sharing principle Step one is the same for the fair rate (FR) scheduler but in step two each user gets a fraction of the resources which is inversely proportional to the userrsquos transmission rate In the second version (FR2) the resource assignment decision is made to maximise the overall frame throughput
Note that very simple link adaptation based on the average SNR was applied using reference curves from AWGN link level simulations Since such a model is suboptimum for TDMA (where the codeword suffers from frequency-selectivity) the comparison of both MA schemes is to a certain extent unfair
Independent encoding of each chunk with tail as considered in case of OFDMA increases the overhead and causes the overall throughput to decrease This factor is more significant for low quality channels (large distances between the UT and BS) when low order modulations and strong coding schemes are applied The measured loss with Round Robin scheduling is about 37 for 100 meter cells and about 69 for 200 meter cells on average however users at the cell edge experience a throughput loss higher than 7 and 11 respectively
The calculated average cell throughput obtained with RR scheduling for 100 meter cell radius and 40 users is equal to 7138 Mbps for OFDMA and 7335 for TDMA The MaxSNR1 scheduling algorithm adaptively selects the users to be served and thus offers an increase of the overall cell throughput to 14784 Mbps and 15315 Mbps respectively It should be stressed that similar results are obtained for both OFDMA and TDMA since no fully adaptive scheduling has been applied one part of the chain ie either user selection or resource assignment is always based on round robin For the MaxSNR2 algorithm the average cell throughput is about 7 Mbps lower than for MaxSNR1 and for Fair Rate scheduling the average cell throughput for OFDMA is equal to 4667 Mbps only Scheduling of users on the equal time sharing base (RR MaxSNR2 FR) slightly decreases the overall cell throughput for higher number of allocated users (by about 02 - 04 for 80 allocated users) Increase of the cell radius from 100 m to 200 m decreases the average cellrsquos throughput by about 50 for RR 19 for MaxSNR1 17 for MaxSNR2 and 68 for FR scheduling
0
5
10
15
20
25
0 20 40 60 80 100 120 140 160 180 200
distance [m]
Ave
rage
use
rs th
roug
hput
[Mbp
s]
RR TDMARR FDMAMaxSNR1 FDMAMaxSNR1 TDMAFR1 FDMAFR2 FDMA
0
20
40
60
80
100
120
140
160
0 20 40 60 80 100 120 140 160 180 200
distance [m]
Ave
rage
use
rs th
roug
hput
[Mbp
s]
MaxSNR2 FDMAMaxSNR2 TDMAMaxSNR1 FDMAMaxSNR1 TDMA
Figure G27 Average userrsquos throughput vs distance for different scheduling variants considering 40 users throughput figures are averaged across served users only
WINNER D210 v10
Page 161 (180)
Simulation results showing the average user throughput versus distance with the different scheduling algorithms discussed are shown in Figure G27 The average user throughput obtained with FR (left plot) drops very slightly with distance (in contrast to RR) however the price to be paid is its lower overall throughput Application of the FR2 increases the overall throughput only slightly compared to FR In case of MaxSNR1 the average throughput drops for the middle range users but compared to fair rate scheduling a much higher user throughput is achieved As depicted in the right plot of Figure G27 MaxSNR2 scheduling achieves dramatically higher throughput values for users located close to the base station than MaxSNR1 albeit at the expense of serving some users not at all (mainly those far away from the BS)
Results presented to far reveal the large impact of scheduling algorithms on cell throughput and fairness The two step scheduling approach considered here enables a trade-off between both aspects Further refinement is required to be able to exploit the multi-user-diversity potential of chunk based OFDMA and compare the results to the well known class of proportional fair scheduling algorithms
G5 Uplink spatial processing
G51 Performance of spatial diversity Simulation Assumptions
Simulator System 19 three-sector sites full interference modelling using wrap-around Scenario cellular on average 10 userssector frequency reuse 1
MT = 1 MR le 8 varying cell radius Channel model C2 NLOS WINNER interim channel model (WIMI) MCS Modulation schemes QPSK 16QAM and 64QAM
Channel code rates 110 13 12 23 34 and 89
FEC
Turbo code combined with Layer 1 code block segmentation (up to 5114 bits per block) and rate matching codeword length from 998 (QPSK rate 110) to 26624 bits (64QAM rate 89) rate 17 mother code (polynomials feedback 013 feedforward 015 017 011)
FeedbackOverhead Chunk SINR after receiver processing zero delay no overhead
A non-frequency adaptive uplink based on OFDM is considered The performance of the uplink access method is evaluated using different number of base station antennas in order to demonstrate the importance of antenna diversity Performance is compared for different cell sizes and in terms of average sector throughput and active radio link data rates The latter measure is the (average) user throughput when scheduled for transmission Since round robin TDMA scheduling is applied the active radio link data rate may be used to assess the fairness in the network Furthermore because many idealised assumptions are made one should not focus on the absolute performance figures but rather on the relative performance
Figure G28 shows the average uplink throughput for different number of base station antennas and for different diversity combining schemes namely MRC and IRC The antenna element spacing at the base station is half a wavelength (left) and four wavelengths (right) With tightly spaced antennas the gain of multiple antennas at the base station and MRC is in the order of 35ndash50 80ndash110 and 130-220 for two four and eight antennas respectively IRC which performs inter-cell interference suppression provides an additional gain of up to 10 20 and 25 With a wider antenna separation the diversity gain is enhanced even further and in particular the gain of IRC over MRC is more evident In interference-limited deployments the performance with four antennas and IRC is comparable to the performance with eight antennas and MRC
The lower plots depict uplink data rate distributions in a deployment in which cells have a radius of 700 m The distributions indicate that in order to provide high uplink data rates to a large fraction of the user population multiple base stations receive antennas are a very useful means
In summary base station receive diversity may significantly improve the uplink performance Such solutions increase total throughput and enhances data rates for all users Performance improves as expected with larger antenna separation and the results further indicate that IRC with a lower number of antennas may give similar performance as MRC with a larger number of antennas It should be kept in mind however that the inter-cell interference suppression gains of IRC relative to MRC may be smaller when estimation errors are considered
WINNER D210 v10
Page 162 (180)
100 m 1 km 10 km0
20
40
60
80
cell radius
aver
age
sect
or th
roug
hput
[Mbi
ts]
IRC (05 λ)MRC (05 λ)
0 20 40 60 800
010203040506070809
1
prob
(use
r thr
ough
put lt
abs
ciss
a)
active radio link rate [Mbits]
100 m 1 km 10 km0
20
40
60
80
active radio link rate [Mbits]
aver
age
sect
or th
roug
hput
[Mbi
ts]
IRC (4 λ)MRC (4 λ)
0 20 40 60 800
010203040506070809
1
prob
(use
r thr
ough
put lt
abs
ciss
a)
active radio link rate [Mbits]
Figure G28 Average uplink throughput and active radio link distributions for different number of base station receive antennas combining schemes and antenna element separations
G52 Linear precoding concepts with long term channel state information In the wide-area scenario the instantaneous CSI is not available at the transmitters due to the high mobility Therefore linear precoding is performed at the mobiles based on long-term CSI Long-term CSI are either the channel mean components (first moment of the channels ndash mean feedback) or the channel correlation matrices (second moment of the channels ndash covariance feedback) In general there are two ways to obtain long-term CSI implicit or explicit feedback
In TDD mode under the reciprocity assumption the downlink channel estimation can be reused for uplink transmission After estimation of the channel during downlink transmission the instantaneous channel at time t+τ that is seen by the mobile is modelled by the sum of the estimated channel matrix and a noise matrix This channel can be interpreted as an MIMO channel with effective LOS component The K factor corresponds to the quality of the channel estimate In the explicit form of mean-feedback the base station performs channel estimation averages over many blocks and transmits the mean matrix back over a control channel
In FDD mode the receiver estimates the correlation matrix on the set of carriers used for downlink transmission [BM04] There are two key issues regarding the efficiency of estimating the covariance matrix in this way The covariance must vary slowly enough ie the estimate is still valid when the base station is sending to user k There must be enough carriers in the set to well approximate the actual covariance matrix The explicit covariance feedback scenario is similar to the explicit mean feedback scenario discussed before The base collects the necessary channel statistics and feeds back the channel covariance matrix to the mobiles
Let assume the multi-user linear MMSE multi-user receiver is used at the base station Then the performance criterion is the average total sum MSE [JB03] The corresponding programming problem is given by minimizing the total sum MSE under individual power constraints Beamforming of user k on carrier n with the eigenvectors of the transmit covariance matrix power allocation of user k on carrier n with the eigenvalues of the transmit covariance matrix and resource allocation is described by the individual MSE of user k on carrier n
WINNER D210 v10
Page 163 (180)
If implicit feedback is used then the optimal beamforming directions of all users correspond to the eigenvectors of the effective LOS-component for mean feedback or the eigenvectors of the channel transmit correlation matrix for covariance feedback The resulting power allocation problem is characterised by the range in which a single-beam per user achieves the sum performance For sum capacity the analysis was performed in [SU05] The theoretical results and the corresponding SCME channel model results are shown in Figure G29
0 05 1 15 20
02
04
06
08
1
12
P λ11
P λ 1
2
MIMO 2x2
K=1K=2K=3K=4K=10
micmac
-2 -1 0 1 205
1
15
2
25
P λ1
ε
MIMO 2x2
K=1K=2K=3K=5K=10
Beamforming NOT optimal
Beamformingoptimal
Beamformingoptimal
Umi Uma Sma
Figure G29 Beamforming optimality range for covariance and mean feedback in theory and
WINNER SCME channel models (micro urban [umi] macro urban [uma] and macro suburban [sma])
Here P is the total transmit power M is the largest mean component λ11 and λ12 are the largest and second largest eigenvalue of the transmit correlation matrix of user one The term ε represents the beamforming condition function ie if ε gt 1 then beamforming is optimal Observe that for two transmit and two receive antennas single stream beamforming is optimal for two and more users Other antenna configurations are to be analyzed
G6 Uplink multi-user detection
G61 Comparison of receiver structures for DS-CDMA
Simulation Assumptions Simulator Multi-link Scenario wide area cellular frequency reuse 1 single antenna BS and UT average
(slow) power control Channel modelling C2 NLOS WIMI Interference modelling Interference generated by neighbour cells active users (6 cells surrounding
the cell of interest) Assume same number of active users in all cells MCS 1 BPSK FEC convolutional coding (561753)oct with memory 8 code rate 12
Codeword length 702 bits spreading Walsh-Hadamard spreading length 16 Cyclic Prefix length 52 chips (block oriented transmission) Overhead Total overhead of 23 taken into account in TX-power and resources Mobile speed 50 1 kmh 50 25 kmh User spatial distribution
( ) KkrKkdk 110middot)1()1(91 cell K=minusminus+=
The focus has been placed on evaluating performance of various reduced complexity receivers for the uplink in the wide area non-frequency adaptive WINNER mode for single carrier DS-CDMA where the multi-carrier approach could encounter important challenges Two transmission schemes are compared a time domain processing receiver based on conventional RAKE receiver and a frequency domain processing receiver that makes use of cyclic prefix (CP) In both cases several iterative implementations of the multi-user detector are investigated Motivated by complexity constraints the focus is on linear multi-user detectors The complexity of the MMSE receiver is dominated by the calculation of the MMSE filter which requires a large matrix inversion Rather than direct matrix inversion we use iterative methods for solution of linear systems concentrating on the Successive Over-relaxation (SOR) method associated with serial interference cancellation and the Chebyshev method associated with parallel
WINNER D210 v10
Page 164 (180)
interference cancellation The details and formulation of multi-user receiver in either domain and the proposed reduced complexity methods for the implementation of a linear multi-user receiver can be found in [IN05][WIND26]
-4 -2 0 2 4 6 810
-4
10-3
10-2
10-1
100
EbN0 (dB)
Bit
Erro
r Rat
e
MF(no intercell interf)MMSE(no intercell interf)MMSE-SOR 6 iter(no intercell interf)MMSE(intercell interf)MMSE-SOR 6 iter(intercell interf)
Figure G30 BER performance of a low complexity frequency domain MMSE receiver in presence
of inter-cell interference
Based on link level simulations results in terms on convergence and performance for single cell scenario where results showed that convergence of the iterative implementation of the TD receiver is substantially slower than for the FD receiver being in both cases faster for the SOR iterative implementation of the MMSE filter than for the first order Chebyshev iterative implementation we focus on the FD receiver and SOR implementation of the MMSE detector for the multi-cell multi-link evaluation Shown in Figure G30 is the coded BER performance of FD receiver in presence of inter-cell interference compare to no inter-cell interference for a 50 loaded system where the performance for the iterative implementation of the MMSE detector is shown for 6 iterations Similar results have been obtained for other system loads
To conclude it is feasible to achieve MMSE performance with a reduced complexity implementation with only a few iterations required Yet the single carrier DS-CDMA approach will require a multi-user detector
G62 Comparison of receiver structures for MIMO single carrier
Simulation Assumptions Simulator multi-link Scenario wide area isolated cell MT = 2 4 MR = 4 1ndash4 users Channel modelling C2 NLOSWIMI Interference modelling no inter-cell interference Multiple access TDMASDMA MCS 1 QPSK r=12 (SM-MIMO with turbo coding)
1 BPSK r=13 (ST-WNRA) FEC punctured turbo coding (1513)oct with memory 4
space-time weighted non-binary repeat accumulate coding codeword length fixed size of 1664 bits
Serial modulation for wide area uplink was investigated for the case of single-input-single-output (SISO) transmission with non iterative and iterative frequency domain receivers in [WIND21 WIND23] In order to further enhance uplink performance link-adaptation and MIMO techniques are the focus of further study In this section only MIMO techniques are considered further information about different link adaptation techniques can be found in [WIND23] By using at least one of these key technologies bandwidth efficiency can be enhanced and transmission power of terminal can be reduced As a result of this improved uplink performance turns into larger coverage and higher data rates The goal of this section is to introduce two MIMO techniques for wide area uplink with serially modulated multipointpoint to point transmission Channel state information is not required at the transmitter and iterative frequency domain processing is performed at the receiver
WINNER D210 v10
Page 165 (180)
Figure G31 Transmitter block diagram of space-time weighted nonbinary repeat accumulate (ST-WNRA) coded multipointpoint-to-point MIMO for serially modulated MIMO transmission
Figure G31 illustrates the transmitter block diagram of ST-WNRA coded MIMO The ST-WNRA encoder consists of two main parts a repeater and the concatenation of a weighter and an accumulator The function of the repeater is to provide coding gain and the concatenation of the weighter and accumulator is to provide full rank over the whole encoded data Therefore ST-WNRA codes can provide full transmit antenna diversity for any number of transmitter antennas in single user flat fading channels with low encoding and decoding complexity The full transmit antenna diversity can be only obtained by using BPSK as underlying modulation method because the full rank property is only retained in the binary field The interested reader is referred to [OY03] for more in-depth information about ST-WNRA codes The maximum achievable diversity order with ST-WNRA codes using the proposed iterative frequency domain reception is given as MT times L times MR where MT L and MR are the number transmit antennas the number of multi-paths and the number of receiver antennas respectively Since ST-WNRA is a pure diversity based MIMO technique the maximum transmission rate is constrained to one However the transmission rate can be enhanced by using a multilevel approach that is briefly described in the next subsection Finally it should be noticed that ST-WNRA codes are more flexible compared to other space-time codes that provide both coding and diversity gain eg space-time trellis and space-time turbo codes Flexibility is an important factor when capability to support for any number of transmitter antennas and short frame lengths is required
Figure G32 Transmitter block diagram of spatially multiplexed vertically encoded multipointpoint-to-point MIMO for serially modulated transmission
Figure G32 presents the transmitter block diagram for the well-known vertically encoded spatially multiplexed MIMO transmission In this scheme the input bit stream undergoes temporal encoding modulation and interleaving after it is demultiplexed into NT streams transmitted for individual antennas Obviously the purpose of this technique is just to maximise multiplexing gain Therefore the maximum achievable diversity order by using convolutionalturbo codes and with the proposed iterative frequency domain reception is given as L times MR Further details of this scheme can be found from [SD01]
The parameters used in the simulations are as follows for ST-WNRA multi-user MIMO the channel is typical urban C2 2 transmit antennas per user 4 receive antennas repetition rate 3 3 decoder iterations 4 equaliser iterations the number of users ranges from 1 to 4 Iterative frequency domain joint-over-antenna multi-user MIMO receiver is used For spatially multiplexed turbo-coded multi-user MIMO the parameters are the same except for the code rate being frac12 (generator polynomials (1513)) QPSK modulation
Figure G33 presents the simulation results of ST-WNRA and spatially multiplexed vertically turbo-coded multi-user MIMO ST-WNRA outperforms spatially multiplexed vertically coded MIMO However the maximum spectral efficiency in the case of ST-WNRA is 266 bitHzs whereas with spatially multiplexed case it is 8 bitHzs The results also show that with joint-over-antenna signal detection technique the same diversity order is maintained for each of the users Only a parallel shift is observed when the number of users is increased This is due to fact that joint-over-antenna technique can preserve the degrees of freedom for the joint-detection of interference and the signal of interest
Encoder πB
Modulator πS
SP
GI
GI
D
Symbol toBPSK
Mapper
Repeater
Weighter π πIGI
GI
ST-WNRA
SP
WINNER D210 v10
Page 166 (180)
BLE
R
Figure G33 BLER performance vs SNR of serially modulated multi-user MIMO transmission in typical urban C2 Scenario (each user has 2 transmitter antennas and base station has 4 receiver
antennas number of users U = 1234)
G7 Other topics
G71 OFDM versus single carrier based uplinks
Simulation Assumptions Simulator System 19 three-sector sites full interference modelling using wrap-around Scenario cellular on average 10 userssector frequency reuse 1
MT = 1 MR = 4 varying cell radius Channel model C2 NLOS WINNER interim channel model (WIMI) MCS Modulation schemes QPSK 16-QAM and 64-QAM
Channel code rates 110 13 12 23 34 and 89
FEC
Turbo code combined with Layer 1 code block segmentation (up to 5114 bits per block) and rate matching codeword length from 998 (QPSK rate 110) to 26624 bits (64QAM rate 89) rate 17 mother code (polynomials feedback 013 feedforward 015 017 011)
FeedbackOverhead Chunk SINR after receiver processing zero delay no overhead
A non-frequency adaptive uplink based on OFDM or single-carrier transmission is considered The impact of the high PAPR of the OFDM signal is coarsely modelled by introducing a power backoff factor that reduces the maximum terminal output power In case single-carrier transmission is considered a linear MMSE frequency domain equaliser (FDE) is assumed to be used in the base station receiver Performance is compared for different cell sizes and in terms of average sector throughput and active radio link data rates The active radio link data rate is the (average) user throughput when scheduled for transmission Since round robin TDMA scheduling is applied the active radio link rate may be used to assess the fairness in the network Because many idealised assumptions are made one should not focus on the absolute performance figures but rather on the relative performance
Investigations of single-carrier and multi-carrier modulation techniques in Appendix B indicate that the PAPR of an OFDM signal and the required power backoff is typically 2ndash3 dB higher than that of a single-carrier signal To capture the high PAPR of the OFDM signal OFDM transmission is in here modelled with a power backoff (pbo) of 2 dB As a reference case OFDM transmission without any power backoff (0 dB) is studied as well In the left part of Figure G34 the performance of an uplink access scheme using OFDM transmission is compared to a single-carrier transmission scheme in terms of average sector throughput Base stations are equipped with four antennas separated four wavelengths and IRC is used to suppress inter-cell interference The results indicate that in interference limited scenarios
WINNER D210 v10
Page 167 (180)
ie for small cells OFDM has a small performance advantage thanks to the absence of inter-symbol interference Note further that in such interference limited deployments the OFDM power backoff is of limited importance In large cell deployments in which noise rather than interference limits performance single-carrier transmission provides better performance thanks to the higher output power (compared to OFDM with a 2 dB power backoff) The right plot shows data rate distributions for cell radius 700 m The plot indicates that compared to OFDM with a 2 dB power backoff single-carrier transmission provides a small but uniform increase of data rates
100 m 1 km 10 km0
10
20
30
40
50
60
cell radius
aver
age
sect
or th
roug
hput
[Mbi
ts]
OFDM pbo = 0 dBOFDM pbo = 2 dBSC MMSE FDE
0 20 40 60 800
010203040506070809
1
prob
(use
r thr
ough
put lt
abs
ciss
a)
active radio link rate [Mbits]
OFDM pbo = 0 dBOFDM pbo = 2 dBSC MMSE FDE
Figure G34 Average sector throughput for OFDM and single-carrier transmission (left) and an example of the corresponding data rate distributions (right) The distributions are depicted for cell
size 700 m
In summary the results show that if accounting for the high PAPR of the OFDM signal here by introducing an OFDM power backoff penalty of 2 dB OFDM has a small performance advantage in interference limited scenarios while the single-carrier transmission scheme using a linear MMSE frequency domain equaliser at the receiver provides better performance in noise limited deployments
G72 Performance of low rate channel coding for one-cell frequency reuse
Simulation Assumptions Link level Inter-cell interference is modelled by Gaussian noise
Simulator System level 19 cells 3 sectorscell full inter-cell interference modelling using wrap-around
Scenario Wide area cellular frequency reuse 1 single antenna BS and UT Channel model Metropolitan channel model defined in D53 Mobile speed 4 kmh for all users Channel coding Turbo code ARQ Chase combining Maximum number of retransmissions M = 0 1 3 Scheduling (for system level) Proportional fair scheduling 4 userssector Full buffer model Channel estimation Real (Weighted subcarrier coherent averaging)
First using the link level simulation optimum minimum coding rate of a very-low-rate Turbo coding and spreading factor value that achieves one-cell frequency reuse in a multi-cell environment in the downlink OFDM is investigated The required average signal-to-interference plus noise power ratio (SINR) to satisfy an average packetblock error rate (BLER) of 10-2 is plotted in Figure G35 (left) as a function of the reciprocal of the coding rate 1R
In the figure QPSK modulation is employed and Q denotes the spreading factor As shown in the figure the required average SINR is reduced with increasing ratio QR which indicates that the suppression of severe inter-cell interference from the surrounding cells is in principle possible however at the expense of throughput Moreover under the same QR conditions the required average SINR is reduced with decreasing code rate R up to approximately 16 to 18 Therefore we see that the minimum coding rate providing a distinct channel coding gain is approximately R = 16 to 18 Figure G35 (right) shows the required SINR for the average residual BLER of 10-3 as a function of the product of 1R and Q Assuming real-time traffic with a rigid delay requirement we take into account hybrid ARQ with Chase combining
WINNER D210 v10
Page 168 (180)
Req
uire
d av
erag
e re
ceiv
ed S
INR
for a
vera
ge B
LER
= 1
0-2 [d
B]
-20
-15
-10
-5
0
5
10
M = 0M = 1M = 3
Req
uire
d av
erag
e (in
stan
tene
ous)
rece
ived
SIN
R
for a
vera
ge re
sidu
al P
ER =
10-3
(dB
)
Spreading factor Q1
Channel coding rate R12 14 18
2 4 8 16 32 64 128
1
5
Instantaneous
Average
1
5
-20
-15
-10
-5
0
5
10
M = 0M = 1M = 3
Req
uire
d av
erag
e (in
stan
tene
ous)
rece
ived
SIN
R
for a
vera
ge re
sidu
al P
ER =
10-3
(dB
)
Spreading factor Q1
Channel coding rate R12 14 18
2 4 8 16 32 64 128
1
5
Instantaneous
Average
1
5
for a
vera
ge re
sidu
al B
LER
= 1
0-3 [d
B]
Req
uire
d av
erag
ein
stan
tane
ous r
ecei
ved
SIN
R
Figure G35 Optimum minimum channel coding rate (left) and required coding rate and spreading factor for achieving one-cell frequency reuse (right)
Furthermore we assumed two extremely different packet call times a very long call time where the received SINR is approximated by the average SINR (denoted as Average) and a very short call time during one packet frame duration where the received SINR is approximated by the instantaneous SINR (denoted as Instantaneous) In the figure the dotted lines indicate the SINR values corresponding to the 1 and 5-point of CDF of the SINR ie cell-edge conditions in a multi-cell environment On the horizontal axis we first decrease the coding rate from R = 12 to 18 maintaining Q = 1 Next in order to achieve QR gt 8 we further increase the Q value with a fixed R = 18 As shown in the figure according to the increase in the QR value the required SINR value is significantly improved This is due to the effect of the improved processing gain associated with channel coding and spreading Furthermore assuming the same QR value on the horizontal axis increasing M brings about a reduction in the required average SINR since the time diversity gain from the hybrid ARQ improves the received SINR of a packet From the figure in order to satisfy the SINR value at the 1 and 5-point of CDF the required coding rate and the spreading factor becomes (R Q) = (18 8 - 16) (18 4 - 8) and (18 2 - 4) for M = 0 1 and 3 in the case of average SINR and (18 8 - 32) (18 4 - 16) and (18 2 - 8) for M = 0 1 and 3 in the case of instantaneous SINR Consequently we conclude that the spreading is inevitable to achieve one-cell frequency reuse together with the low-rate channel coding such as R = 18
MCS sets with low-rate channel coding and spreading MCS sets without low-rate channel coding and spreading MCS sets with low-rate channel coding and spreading MCS sets without low-rate channel coding and spreading
0
02
04
06
08
1
0 5 106 1 107 15 107 2 107
Cum
ulat
ive
dist
ribut
ion
User throughput (bps)
Without hybrid ARQ
0
02
04
06
08
1
0 5 106 1 107 15 107 2 107
Cum
ulat
ive
dist
ribut
ion
User throughput (bps)
0
02
04
06
08
1
0 5 106 1 107 15 107 2 107
Cum
ulat
ive
distr
ibut
ion
User throughput (bps)
With hybrid ARQ(Max retransmissions M = 1)
With hybrid ARQ(Max retransmissions M = 3)
0
02
04
06
08
1
0 5 106 1 107 15 107 2 107
Cum
ulat
ive
distr
ibut
ion
User throughput (bps)
Without hybrid ARQ
0
02
04
06
08
1
0 5 106 1 107 15 107 2 107
Cum
ulat
ive
dist
ribut
ion
User throughput (bps)
0
02
04
06
08
1
0 5 106 1 107 15 107 2 107
Cum
ulat
ive
distr
ibut
ion
User throughput (bps)
With hybrid ARQ(Max retransmissions M = 1)
With hybrid ARQ(Max retransmissions M = 3)
Figure G36 Effect of low rate channel coding and required channel coding rate and spreading on user throughput in a multi-cell environment
Next the effect of low rate channel coding together with spreading is evaluated in a multi-cellular environment using system level simulations In the simulations two sets of modulation and coding schemes (MCS) are used one with and one without spreading The first set comprises QPSK with code rate and spreading factor (R Q) = (18 16) (18 8) (18 4) (18 2) (18 1) (14 1) (12 1) (23 1) as
WINNER D210 v10
Page 169 (180)
well as 16-QAM with (R Q) = (12 1) (23 1) and (34 1) The second set includes QPSK with code rate R=12 and 23 as well as 16-QAM with rate R= frac12 23 and frac34
As shown in Figure G36 the user throughput performance is improved by employing the MCS set with low-rate channel coding and spreading compared to those without low-rate channel coding and spreading For example the MCS set with low-rate channel coding and spreading maintains approximately 600 kbps and 750 kbps user throughput at 5 and 10-point of CDF respectively In case of hybrid ARQ with more than one retransmission however the benefit of low rate channel coding and spreading is negligible
G73 Comparison of FDMA and TDMA based resource partitioning among BS
Simulation Assumptions Simulator Link level Scenario wide area cellular frequency reuse 7 single antenna BS and UT Channel modelling WSSUS Rayleigh fading with exponential power delay profile
Okumara-Hata path loss model Interference modelling AWGN Cell radius Up to 2 km OFDM parameter 512 used subcarriers subcarrier distance 390625 kHz guard period 64 micros MCS QPSK FEC no coding Mobile speed 30 kmh same for all mobiles - results in almost perfect link adaptation
In a wide area OFDM cellular systems even with perfect inter-cell time synchronisation time offsets between users in different cells due to propagation delays induce significant inter-cell interference This appears in form of inter-carrieradjacent band interference if different cells are assigned adjacent portions of the available bandwidth eg in a block-FDMA fashion and in form of inter-symbol interference if different cells are assigned the whole transmission bandwidth in successive periods of time eg slot-TDMA In order to avoidreduce such interference guard bands and guard periods can be introduced in FDMA and in TDMA respectively The aim of this analysis is that of deriving which of the two approaches is the most spectrally efficient under currently envisaged system parameters and requirements
In a first step the performance degradation due to time offsets in block FDMA inter-cell allocation with and without guard bands is evaluated A worst case scenario is considered in which there are only two cells and two users which are assigned interleaved blocks of adjacent subcarriers Moreover equal receive power and time offsets up to frac12 OFDM symbol are assumed Results are reported in Figure G37 left plot in terms of uncoded BER (rawBER) for blocks of 8 and 64 subcarriers at different values of time offsets ranging from 5 micros to 16micros (cell radius of 15 and 48 km respectively) It can be inferred that there is high performance degradation when the time offset is equal to or higher than the guard interval For some time offsets the rawBER curve saturates before 10-2 As it is reasonably expected significantly better performance is obtained with larger block size because the effect of inter-carrier interference is larger at the block border Hence for smaller blocks almost all subcarriers might be interfered
A better overview is offered by Figure G37 left plot which compares the dependency of the SNR degradation on the different values of time offsets The SNR degradation has been computed at a rawBER of 10-177 corresponding to coded BER of 10-3 which represents the considered QoS criterion for VoIP The SNR degradation for the block size of 8 subcarriers is visibly much higher than for blocks of 64 subcarriers At a time offset of 6 micros we have a loss in power efficiency of 12 dB39 Figure G37 right plot shows the comparison of SNR degradation with and without guard bands The introduction of guard sub-bands leads to a significant improvement For time offsets larger than 5micros in particular the SNR degradation saturates
To compare the spectral efficiency of the two inter-cell allocation schemes the power efficiency loss in the block-FDMA case has to be translated into a figure of spectral efficiency loss Given the not too high values involved we can resort to a simple rule of thumb derived from 2G and 3G experience according to which a 45 dB loss in power efficiency corresponds to 50 spectral efficiency loss In Table G2 results
39 Note that for block size of 8 sub-carriers the SNR degradation curve has not been plotted for time offset values larger than 6 micros since the rawBER curve saturates before reaching the value corresponding to the required QoS
WINNER D210 v10
Page 170 (180)
in terms of power and spectral efficiency loss are reported for block-FDMA with blocks of 64 subcarriers for cell radius of 2 km and reuse factor 7 with and without guard bands of 8 subcarriers
0 5 10 15 20 25 30
10-3
10-2
10-1
100
SNR [dB]
raw
BE
R
Block of 8 and 64 subcarriers QAM4
8-Sc t shift 08-Sc t shift 100 = 5us8-Sc t shift 120 = 6us8-Sc t shift 320 = 16us64-Sc t shift 064-Sc t shift 100 = 5us64-Sc t shift 120 = 6us64-Sc t shift 320 = 16us
0 5 10 15 20 25 30-2
0
2
4
6
8
time offset [micros]
SN
R d
egra
datio
n [d
B]
Block of 64 8 guard ScBlock of 64 no guard ScBlock of 8 no guard Sc
Figure G37 left plot raw BER for different sizes of block of subcarriers and different values of time offsets right plot Dependency of SNR degradation on time offset for block of 8 subcarriers
and for block of 64 subcarriers with and without guard band
In slot-TDMA the insertion of guard periods between any pair of time-slots assigned to different cells represents an overhead which induces spectral efficiency loss and can be computed as follows The total time consumed as guard time is given by the number of time slots multiplied by the length of the guard period that is at least equal to the maximum time offset For TDD and HD-FDD the number of time slots assigned to different cells is 2 times the reuse factor The maximum time offset to be taken into account depends on the considered scenario For example with reuse factor 16 in a macro-cellular deployment scenario with antennas above rooftop the link of interest can be affected by interference from the second ring of interfering cells which implies a propagation delay corresponding to four times the cell radius The resulting overhead is then given by the ratio between the total guard time and the frame duration Results are reported in Table G3 for different reuse factors
Table G2 Power and spectral efficiency loss for block-FDMA with blocks of 64 subcarriers with reuse factor 7 with and without guard bands of 8 subcarriers
Reuse Factor Additional Guard Bands Overhead []
Power Efficiency Loss [dB]
Spectral Efficiency Loss []
Total Loss []
7 0 628 698 698 7 125 180 201 326
Table G3 Overhead due to guard periods in slot-TDMA with reuse factor 5 and 7
Reuse Factor Frame Length [ms]
Number of Time Slots
Total Guard Time [micros]
Overhead []
5 07 10 133 19 7 07 14 186 gt100
From simulation results it can be derived that it would be recommended to assign blocks of at least 64 adjacent subcarriers to different cells in order to keep the performance degradation to a reasonable level (up to 1 dB) For a reuse factor 7 and cell radius of 2 km the spectral efficiency would be doubled through the insertion of guard bands of eight subcarriers Moreover it has been explained how the use of the slot-TDMA inter-cell allocation approach is restricted by the assumption of very short frame length For the currently assumed frame length of 07 ms the overhead due to the insertion of guard periods could result to be unacceptable (larger than 100 for reuse factor 7) Since the overhead depends on the number of slots which is determined by the reuse factor a reuse factor up to 6 would be acceptable while for reuse factors larger or equal to 7 it would be preferable to use block-FDMA
We note that although the results of this section have been derived under the assumption of reuse factor larger than 1 they remain valid in case of single-frequency network with interference-avoidance-based
WINNER D210 v10
Page 171 (180)
dynamic resource management Indeed in the latter case a reuse factor is implicitly implied by the size of the smallest resource units assigned to different cells
G74 Comparison of conventional and self-organised RRM in cellular networks
Simulation Assumptions Simulator System level Scenario Short range cellular frequency reuse 1 single antenna BS and UT Channel modelling Generic channel model including path loss + shadow fading Interference modelling Inter-cell interference 49-cell network (wrap-around) Cell radius 300 m Link adaptation Adaptive MCS selection based on estimated SINR values MCS BPSK QPSK 16QAM 64QAM 256QAM all with 12 coding rate FEC Convolutional coding (133 171)oct with memory 6 codeword length 2160 Type of feedback Only in link setup phase measured signal power resource candidate with
corresponding interference values Feedback delay 1 frame Overhead 1 OFDM symbol per frame Mobile speed Stationary
Instead of the conventional frequency planning a self-organised radio resource management (SO-RRM) scheme has been proposed for WINNER There is no pre-planning on frequency bands The whole bandwidth is accessible anywhere Each BS based on the ULDL signal power and interference values measured at both the BS and the UT does the resource allocation independently There is no direct communication between BSs The resources with highest possible SINR values are allocated to the new UT and suitable PHY modes are selected in accordance with those values
With the SO-RRM scheme a very flexible resource allocation can be realised which means an adaptive reuse distance is implied based on the respective interference situation of each resource in the network This scheme also facilitates high bandwidth efficiency in the hotspot case
Anti-dropping solutions
The long-term interference situation of a user changes when a new co-channel interferer is accepted into the network A BS accepts a new UT when the observed ULDL SINR is sufficient for the required transmission Meanwhile it introduces a new interferer to the network The updated interference at an existing UT may violate the requirements of its current PHY mode for transmission which results in a potential dropping In most systems the dropping rate dominates the system capacity
Two alternative solutions can be adopted against the dropping
- ldquoReallocationrdquo as a passive way that the scheduling algorithm reacts when channel degradation is observed during data transmission When a reallocation is activated new resources are allocated by implementing the similar procedure for new users
- ldquoSecurity Marginrdquo as an alternative active method The main idea of this method is to add a security margin into the threshold for the MCS selection in order to increase the tolerance for the possible degradation of SINR which is caused by new interferers The value of such a security margin depends on many aspects Generally a low margin does not help much in the dropping performance while a high margin achieves a large tolerance at the cost of efficiency Therefore a balance should be made
Comparison between SO-RRM and conventional RRM
A 49-cell network is considered The ldquowrap aroundrdquo technique [80220-05] is implemented in order to allow data collection from all cells within the network For the system level simulation the channel is assumed time invariant Each user has the same date rate and BLER requirements
A simulation starts with a blank system Users arrive at the network one by one whose locations follow a predefined distribution The BS starts the resource allocation scheme and allocates suitable resources to the UT A blocking occurs when a BS cannot find sufficient resources to serve its new UT A dropping occurs when a current transmission is destroyed be a new UT which means either the security margin is insufficient when the active anti-dropping solution is applied or the reallocation of resources fails in the case of the passive anti-dropping solution The ldquoSystem Capacityrdquo is used as the criterion of system level performance A system capacity of N is defined as that a blocking or dropping in the system happens at the first time when the (N+1) UT joins the network
WINNER D210 v10
Page 172 (180)
Both uniform and non-uniform distributions of users are considered In the non-uniform case a hotspot is defined in the central cell Inside each cell the users are always uniformly distributed A ldquohotspot fractionrdquo ρ is defined to quantitatively describe the user distribution as the number of users in the hotspot cell relating to the number of users in all cells
Comparison between SO-RRM and conventional RRM The performances of five schemes are plotted in Figure G38 The ldquooptimised security marginrdquo means that the applied margin is chosen with which the system has the highest capacity Generally it can be concluded from the results that the SO-RRM is better than the conventional RRM at the same situation The latter has good performance for uniform user distribution However its inflexibility induces a remarkable loss of spectrum efficiency with non-uniform user distribution where not all resources are accessible when many users are out of service
With the SO-RRM all resources are accessible in each cell It shows its robustness to the variance of user distribution In the cases where there are no anti-dropping solutions applied or the security is applied the performance of SO-RRM has a performance close to the conventional RRM with a uniform-like user distribution However with higher fraction of users located at the hotspot cell the flexibility of SO-RRM starts showing its efficiency When all users are located in the hotspot a 7 times higher number of users can be served
It is also observed that reallocation improves the system capacity with any user distribution In a system with uniform user distribution an increase of 60 can be achieved A passive solution gains at the cost of reallocation efforts This benefit decreases when the hotspot fraction gets higher which means a low necessity of reallocation
0 02 04 06 08 10
100
200
300
400
500
600
700
Hotspot Fraction ρ
Sys
tem
Cap
acity
SO-RRM with reallocationSO-RRM with optimized security marginSO-RRM without anti-droppingConventional RRM with optimized security marginConventional RRM without anti-dropping
Figure G38 Comparison of system performances with different RRM schemes
The effect of a security margin varies for different user distribution and different resource management schemes In a system with uniform user distribution or a system with low hotspot faction the margin is effective in the performance improvement However when the fraction of users in the hotspot increases the margin brings less improvement and even lowers the system capacity In a system with a high hotspot fraction the probability of a new user located outside the central cell is very low That is it happens rarely that an existing transmission suffers from an outage that is caused by the new co-channel interferer In this situation the security margin is only an obstacle
G75 VAA technology with adaptive pre-selection aided by MC-OLSR protocol
Simulation Assumptions Simulator Combined system and link level simulator Scenario Short range using virtual antenna arrays MT = 1 MR = 1 cell radius = 320 m
mobile speed 5 kmh VAA size = 2 Channel modelling B1 clustered delay line Interference modelling no inter-cell interference MCS 1 QPSK FEC no
WINNER D210 v10
Page 173 (180)
This issue was analysed in context of radio resource control and management and more specifically the optimum pre-selection and assignment of the relay nodes at the system level for the purposes of enhancing the space-time coded cooperative transmission with the use of virtual antenna arrays (VAA) [DGA04] at the link level was investigated To this end the MC-OLSR protocol enhanced with cooperative relaying was exploited and this work was performed on the basis of the Adaptive approach to antenna selection and space-time coding analysed in [WIND24] and the Multi-Constrained Optimised Link State Routing protocol (MC-OLSR) proposed in [WIND31] and [WIND32] respectively In the example depicted in Figure G39 VAA is constituted by RN 1 and RN 2 whereas the nodes 0 (BS) and 9 (UT) are the source and destination ones respectively
The performance comparison between the conventional and the space-time coded cooperative transmission with the use of virtual antenna arrays when the adaptive pre-selection mechanism aided by the MC-OLSR protocol is active is presented in Figure G39 There is a noticeable improvement in the region of higher SNR values however the BER curves start more or less from the same point The reason for this situation is that if there are transmission errors between the BS and the first-hop RNs they propagate and diminish the performance of the cooperative transmission during the second hop This proves the necessity for further joint cross-layer optimisation
0
2
22
1
3 4
5
6 7
8
9
10
11 12 13
23
14
15
16
17
18
19 20 21
24
0 10 20 3010-5
10-4
10-3
10-2
10-1
100
SNR [dB]
BE
R
CONV MC-OLSRVAA MC-OLSR
Figure G39 Space-time coded VAA technology ndash scenario and performance
WINNER D210 v10
Page 174 (180)
References [3GPP-TR25212] 3GPP TSG RAN ldquoHigh speed downlink packet access Physical layer aspectsrdquo TR
25212
[3GPP-WG142] 3GPP TSG RAN WG142 ZTE CATT RITT Huawei ldquoComparison of Structured LDPC Codes and 3GPP Turbo-Codesrdquo R1-050840
[3GPP-TS25331] 3GPP TS 25331 RRC Protocol Specification
[3GPP-TR25891] 3GPP TR 25891 ldquoImprovement of RRM across RNS and RNSBSS (post-Rel-5)rdquo Release 6 v030 (draft version) 22003
[80211n04] IEEE 80211n ldquoStructured LDPC Codes as an Advanced Coding Scheme for 80211nrdquo IEEE Doc 80211-04884r0 August 2004
[80211n-05] IEEE doc 80211-05150r1 ldquoWWiSE IEEE 80211n Proposalrdquo 2005
[80216-04] IEEE Std 80216-2004 ldquoAir Interface for Fixed Broadband Wireless Access Systemsrdquo
[80216e-05] IEEE doc 80216e-05006r2 ldquoLDPC coding for OFDMA PHYrdquo available online from httpwwwieee802org16tge
[80216e05b] IEEE P80216eD8 2005 ldquoAir Interface for Fixed and Mobile Broadband Wireless Access Systemsrdquo
[80220-05] ldquoIEEE 80220 Evaluation Criteriardquo September 2005
[Ace05] M Acentildea S Pfletschinger ldquoA computationally efficient algorithm for throughput maximization in OFDMArdquo 10th International OFDM-Workshop Hamburg Germany Aug-Sept 2005
[AN05] IST-Project IST-2002-507134 ldquoAmbient Networksrdquo httpwwwambient-networksorg
[AY05] A Adinoyi and H Yanikomeroglu ldquoPractical cooperative communication through fixed relaysrdquo accepted to Wireless World Radio Forum December 2005
[BBB+99] J J Beek P Boumlrjesson M L Boucheret D Landstroumlm J Arenas P Oumldling C Oumlstberg M Wahlqvist and S Wilson ldquoA Time and Frequency Synchronization Scheme for Multi-user OFDMrdquo IEEE Journal of Selected Areas on Communications vol 17 pp 1900-1914 Nov 1999
[BCK03] A Bourdoux B Come N Khaled ldquoNon-reciprocal transceivers in OFDMSDMA systems Impact and mitigationrdquo RAWCON 2003 Boston August 2003
[Bin90] J A C Bingham ldquoMulticarrier modulation for data transmission an idea whose time has comerdquo IEEE Communications Magazine Vol 28 pp 5-14 May 1990
[BM04] G Barriac U Madhow ldquoSpace Time Communication for OFDM with Implicit Channel Feedbackrdquo IEEE Trans on Information Theory vol 50 pp3111-3129 Dec 2004
[Bon04] T Bonald ldquoA score-based opportunistic scheduler for fading radio channelsrdquo European Wireless Conference Barcelona Feb 2004
[BR04] L Bazzi and T J Richardson ldquoExact Thresholds and Optimal Codes for the Binary-Symmetric Channel and Gallagerrsquos Decoding Algorithm Ardquo IEEE Trans on Info Theory vol 50 no 9 Sept 2004
[BSB97] J J Beek M Sandell and P Boumlrjesson ldquoML estimation of time and frequency offset in OFDM systemsrdquo IEEE Transactions in Signal Processing vol 45 pp 999-1008 July 1997
[Cam98] J Campello ldquoOptimal discrete bit loading for multicarrier modulation systemsrdquo Proceedings of International Symposium on Information Theory p 193 August 1998
[Cam99] J Campello ldquoPractical bit loading for DMTrdquo Proceedings of ICC 99 Vancouver Canada pp 801-805 June 1999
WINNER D210 v10
Page 175 (180)
[CCB95] P S Chow J M Cioffi J A C Bingham ldquoA practical discrete multitone transceiver loading algorithm for data transmission over spectrally shaped shannelsrdquo IEEE Trans Commun Vol 43 pp 773-775 April 1995
[CENELEC01] EN 50360 ldquoProduct standard to demonstrate the compliance of mobile phones with basic restrictions related to human exposure to electromagnetic fields (300 MHz - 3 GHz)rdquo European Committee for Electrotechnical Standardization (CENELEC) July 2001
[CENELEC02] EN 50385 ldquoProduct standard to demonstrate the compliance of radio base stations and fixed terminal stations for wireless telecommunication systems with the basic restrictions or the reference levels related to human exposure to radio frequency electromagnetic fields (110 MHz - 40 GHz) - General publicrdquo European Committee for Electrotechnical Standardization (CENELEC) European Standard August 2002
[CEO02] G Cherubini E Elefthriou and S Oelcer ldquoFiltered Multi Tone Modulation for very High Speed Digital Subscriber Linesrdquo IEEE Journ On Select Areas on Commun vol 20 n5 pp 1016-1028 June 2002
[CF02] J Chen and MPC Fossorier ldquoNear Optimum Universal Belief Propagation Based Decoding of Low-Density Parity Check Codesrdquo IEEE Transactions on Communications Vol 50 No 3 March 2002
[CFO+03] E Costa A Filippi S Ometto M Weckerle E Schulz ldquoAsynchronous uplink transmis-sion in FMT-FDMA systemsrdquo in Proc IEEE International Symposium on Personal Indoor and Mobile Radio Communications (PIMRC) Bejing China 2003
[ChC00] M Chang K-C Chen ldquoFrequency-Domain Approach to Multiuser Detection in DS-CDMArdquo IEEE Comm Letters vol 4 no 11 pp 331-333 Nov 2000
[CSB05] E Costa P Slanina V Bochnicka E Schulz G Spano Greco Downlink based Intra- and Inter-cell Time and Frequency Synchronisation in OFDM Cellular Systems Proceedings of World Wireless Congress 2005 San Francisco May 2005
[DAO05] M Doumlttling D Asteacutely and M Olsson ldquoA Multi-User Spatial Domain Link Adaptation Concept for Beyond 3G Systemsrdquo ProcPIMRC 2005 Berlin Germany September 2005
[DFL+04] R Dinis D Falconer Chan Tong Lam et al ldquoA Multiple Access Scheme for the Uplink of Broadband Wireless Systemsrdquo Globecom 2004
[DGA04] M Dohler A Gkelias H Aghvami ldquoA Resource Allocation Strategy for Distributed MIMO Multi-Hop Communication Systemsrdquo IEEE Communications Letters Volume 8 Issue 2 February 2004 pp 99-101
[DVB00] Interaction channel for satellite distribution systems ETSI EN 301 790 V122 pp 21-24 Dec 2000
[Ekm02] T Ekman Prediction of Mobile Radio Channels Modelling and Design PhD Th Signals and Syst Uppsala UnivhttpwwwsignaluusePublicationsabstractsa023html
[ER01] A Ebner and H Rohling A Self-Organized Radio Network for Automotive Applications Proceedings of the 8th World Congress on Intelligent Transport Systems Sydney Australia October 2001
[Eri04] NC Ericsson Revenue Maximization in Resource Allocation Applications in Wireless Communication Networks PhD Thesis Signals and Systems Uppsala Univ Oct 2004 httpwwwsignaluusePublicationsabstractsa043html
[FSE+04] S Falahati A Svensson T Ekman and M Sternad Adaptive modulation systems for predicted wireless channels IEEE Trans on Communications vol 52 Feb 2004 pp 307-316
[FA02] David D Falconer and S Lek Ariyavisitakul Broadband Wireless Using Single Carrier and Frequency Domain Equalization Proceedings WPMC 2002 pp 27 - 36 vol1 Honolulu USA Oct 2002
WINNER D210 v10
Page 176 (180)
[FCS04] A Filippi E Costa E Schulz ldquoLow Complexity Interleaved Sub-carrier Allocation in OFDM Multiple Access Systemsrdquo in Proc IEEE VTCrsquo04 Los Angeles California USA Sept 2004
[FDGH05a] M Fuchs G Del Galdo and M Haardt A novel tree-based scheduling algorithm for the downlink of multi-user MIMO systems with ZF beamforming In Proc IEEE Int Conf Acoust Speech Signal Processing(ICASSP) volume 3 pages 1121ndash1124 Philadelphia PA March 2005
[FDGH05b] M Fuchs G Del Galdo and M Haardt Low complexity space-time-frequency scheduling for MIMO systems with SDMA Submitted to IEEE Transactions on Vehicular Technology September 2005
[FH96] R F H Fischer J B Huber ldquoA new loading algorithm for discrete multitone transmissionrdquo Proceedings of GLOBECOM 96 London UK pp 724-728 November 1996
[FK05] D Falconer S Kaiser editors ldquoBroadband frequency Domain-Based Air Interfaces for Future-Generation Wireless Systemsrdquo WWRF Working Group 4 White Paper Version 016 Feb 18 2005
[GA93] Mohinder S Grewal and Angus P Andrews (1993) ldquoKalman Filtering Theory and Practicerdquo Upper Saddle River NJ USA Prentice Hall
[Gal63] R G Gallager ldquoLow-Density Parity-Check codesrdquo PhD Thesis Cambridge
[GBD03] F Guilloud E Boutillon and J-L Danger ldquoλ-Min Decoding Algorithm of Regular and Irregular LDPC Codesrdquo 3rd International Symposium on Turbo-Codes amp Related Topics
[GRC02] D Galda H Rohling E Costa H Haas E Schulz ldquoA Low Complexity Transmitter Structure for OFDM-FDMA Uplink Systemsrdquo in Proc VTC Spring 2002 pp 1737-1741 2002
[HBD00] JS Hammerschmidt C Brunner C Drewes Eigenbeamforming - a novel concept in array signal processing Proc VDEITG European Wireless Conference DresdenGermany Sept 2000
[HP98] Guidelines for limiting exposure to time-varying electric magnetic and electromagnetic fields (up to 300 GHz) International Commission on Non-Ionizing Radiation Protection Health Physics vol 74 no 4 pp 494-522 April 1998
[Hug91] D Hughes-Hartogs ldquoEnsemble modem structure for imperfect transmission mediardquo US Patent No 5054034 October 1991
[IN05] C Ibars M Navarro Reduced complexity iterative multiuser detector for beyond 3G CDMA systems IST Mobile amp Communication Summit 2005 (IST 2005) Dresden (Germany) June 19-23 2005
[JB03] E A Jorswieck and H Boche ldquoTransmission Strategies for the MIMO MAC with MMSE Receiver Average MSE Optimization and Achievable Individual MSE Regionrdquo IEEE Trans On Signal Processing vol 51 pp 2872-2881 Nov 2003
[JDL+04] JP Javaudin C Dubuc D Lacroix M Earnshaw An OFDM Evolution to the UMTS High Speed Downlink Packet Access in Proc of VTC Fall 2004 Los Angeles USA 26-29 September 2004
[JFH+05] V Jungnickel A Forck T Haustein SSchiffermuumlller C von Helmolt F Luhn M Pollock C Juchems M Lampe S Eichinger W Zirwas E Schulz ldquo1 Gbits MIMO-OFDM Transmission Experimentsrdquo Proc IEEE VTC Fall 2005 Dallas Texas
[JVS+03] C Jones E Valles M Smith and J Villasenor ldquoApproximate-Min Constraint Node Updating for LDPC Code Decodingrdquo IEEE MILCOM 2003
[KBLS06] T T Kim M Bengtsson E G Larsson and M Skoglund ldquoCombining Short-Term and Long-Term Channel State Information over Correlated MIMO Channelsrdquo Submitted to ICASSP 2006
WINNER D210 v10
Page 177 (180)
[KF98] F R Kschischang B J Frey ldquoIterative Decoding of Compound Codes by Probabilistic Propagation in Graphical Modelsrdquo Journal on Select Areas Commun pp 219-230 1998
[KLF01] Y Kou S Lin and M Fossorier ldquoLow Density parity-check codes based on finite geometries A rediscovery and morerdquo IEEE Trans Inform Theory vol 47 pp 2711-2736 Nov 2001
[LC02] D Lee and K Cheun ldquoCoarse Symbol Synchronization Algorithms for OFDM Systems in Multipath Channelsrdquo IEEE Communication Letters pp 446-448 Vol 6 no 10 Oct 2002
[LGA01] D Lacroix N Goudard M Alard OFDM with guard interval versus OFDMOffsetQAM for high data rate UMTS downlink transmission in Proc of VTC Fall 2001 October 2001 Atlantic City USA
[LHYT01] Y Liu R Hoshyar X Yang R Tafazolli Joint Routing and Packet Scheduling for Enhanced Uplink UTRA-FDD with Fixed Relay Stations in Proc IEEE Vehicular Technology Conference Dallas Texas USA September 2005
[LHYT02] Y Liu R Hoshyar X Yang R Tafazolli An Integrated Radio Resource Allocation Framework for Enhanced Uplink UTRA-FDD with Fixed Relay Stations 14th IST Mobile and Wireless communications Summit Dresden Germany June 2005
[LWB+02] D Landstroumlm S K Wilson J-J van de Beek P Oumldling and PO Bjoumlrjesson ldquoSymbol time offset estimation in coherent OFDM Systemsrdquo IEEE Transactions on Communications vol 50 pages 545-549 Apr 2002
[LWZ04] Y Liu T Weber W Zirwas Uplink performance investigations of the service area basd beyond 3G system JOINT in Proc Kleinheubacher Berichte Kleinheubach Germany October 2004 MS No KH2004-A-0051
[LZ05] T Lestable and E Zimmermann ldquoLDPC Codes Options for Next Generation Wireless Systemsrdquo Wireless World Research Forum (WWRF) WG5 San-Diego 2005
[MB01] Y Mao A H Banihashemi ldquoDecoding Low-Density Parity-Check Codes with Probabilistic Schedulingrdquo Comm Letters 5415-416 Oct 2001
[MBL+05] M Muck P Bernardin P Labbe X Miet D Pannicke and J Schoenthier ldquoPrototyping of a hybrid 5GHz60GHz OFDM WLAN system in the framework of IST-BroadWayrdquo Wireless World Research Forum 13th meeting Mar 2-3 2005 Jeju Island Korea
[MCD05] M Muck M de Courville P Duhamel rdquoA Pseudo Random Postfix OFDM modulator - Semi-blind channel estimation and equalizationrdquo accepted by IEEE Transactions on Signal Processing 2005
[MKK+05] N Maeda T Kataoka H Kawai K Higuchi J Kawamoto M Sawahashi ldquoExperiments on Real-Time 1-Gbps Packet Transmission Using Antenna-Independent AMC in MIMO-OFDM Broadband Packet Radio Accessrdquo Proc IEEE VTC Fall 2005 Dallas Texas
[MS02] M M Mansour and N R Shanbhag ldquoLow-Power VLSI Decoder Architectures for LDPC Codesrdquo IEEE ISLPED 2002
[MY05] S Myung and K Yang ldquoA Combining Method of Quasi-Cyclic LDPC Codes by The Chinese Remainder Theoremrdquo IEEE Comm Letters Vol9 N9 Sept 2005
[MYK05] S Myung K Yang and J Kim ldquoQuasi-Cyclic LDPC Codes for Fast Encodingrdquo IEEE Trans on Info Theory August 2005
[OJEC99] 1999519EC EU Council Recommendation of 12 July 1999 on the limitation of exposure of the general public to electromagnetic fields (0 Hz to 300 GHz) Official Journal of the European Communities July 1999
[OY03] J-E Oh K Yang ldquoSpace-time codes with full antenna diversity using weighted nonbi-nary repeat-accumulate codesrdquo IEEE Trans Commun vol 51 pp 1773ndash1778 Nov 2003
WINNER D210 v10
Page 178 (180)
[Pfl05] S Pfletschinger ldquoFrom cell capacity to subcarrier allocation in multi-user OFDMrdquo IST Mobile amp Wireless Communications Summit Dresden (Germany) 19 ndash 23 June 2005
[PI05] S Pfletschinger and C Ibars ldquoFrom cell capacity to subcarrier allocation in OFDMArdquo submitted to European Transactions on Telecommunications Sept 2005
[Rap91] C Rapp ldquoEffects of HPA-Nonlinearity on a 4-DPSKOFDM Signal for a Digital Sound Broadcasting Systemrdquo Proc 2nd European Conf on Satellite Comms Liege Oct 1991 pp 179-184
[RM00] D M Rowitch LB Milstein ldquoOn the performance of hybrid FECARQ systems using rate compatible punctured Turbo (RCPT) codesrdquo IEEE Trans on Comm vol 48 no 6 pp 948-958 June 2000
[SA03] M Sternad and D Aronsson ldquoChannel estimation and prediction for adaptive OFDM downlinks IEEE VTC 2003-Fall Orlando October 2003
[SD01] A Stefanov T Duman ldquoTurbo-coded modulation for systems with transmit and receive antenna diversity over block fading channels System model decoding approaches and practical considerationsrdquo IEEE J Select Areas Commun vol 19 no 5 pp 958ndash968 May 2001
[SEA01] M Sternad T Ekman and A Ahleacuten ldquoPower prediction on broadband channelsrdquo IEEE Vehicular Technology Conference VTC01-Spring Rhodes Greece May 6-9 2001
[SFF+99] M Speth S Fechtel G Fock and H Meyr ldquoOptimum Receiver Design for Wireless Broadband Systems Using OFDM-Part Irdquo IEEE Transactions on Communications vol 47 pp 1668-1677 Nov 1999
[SF04] M Sternad S Falahati ldquoMaximizing throughput with adaptive M-QAM based on imperfect channel predictionsrdquo IEEE PIMRC 2004 Barcelona Sept 2004
[SFS05] M Sternad S Falahati T Svensson and D Aronsson rdquoAdaptive TDMAOFDMA for wide-area coverage and vehicular velocitiesrdquo IST Summit Dresden July 2005
[SGF95] Johan Skoumlld Bjoumlrn Gudmundson Jan Faumlrjh ldquoPerformance and Characteristics of GSM-based PCSrdquo VTC 1995
[SU05] A Soysal and S Ulukus ldquoTransmit Directions and Optimality of Beamforming in MIMO-MAC with Partial CSI at the Transmittersrdquo Proc of CISS Jan 2005
[SW02] A Springer R Weigel The Physical Layer of the Universal Mobile Telecommunications System Berlin Heidelberg New York Springer 2002
[SWW+04] E Schulz M Weckerle T Weber M Meurer The OFDM based beyond 3G air inter-face JOINT featuring interference reduction by joint detection and joint transmission in Proc 8th WWRF Meeting Beijing China Feb 2004 pp 1-11
[TB04] S Tomasin and N Benvenuto ldquoA Reduced Complexity Block Iterative DFE for Dispersive Wireless Applicationsrdquo Proc VTC 2004 fall pp 1693-1697
[THB04] J Tousch M-H Hamon and J Benko ldquoTurbo-Codes Complexity Estimatesrdquo IEEE 80211n Proposal 1385-r1 Nov 2004
[Tse98] DNC Tse and SV Hanly ldquoMultiaccess fading channelsmdashPart I Polymatroid structure optimal resource allocation and throughput capacitiesrdquo IEEE Trans Information Theory vol 44 no 7 pp 2796-2815 Nov 1998
[Vai92] PP Vaidjanathan Multirate Systems and Filter Banks Englewood Cliffs NJ Prentice Hall
[VF00] J Vogt and A Finger ldquoImproving the Max-Log-MAP turbo decoderrdquo IEEE Electronincs Letters vol 36 no 23 pp 1937ndash1939 2000
[VH04] V Stankovic and M Haardt ldquoMulti-user MIMO downlink precoding for users with multiple antennasrdquo in Proc Of the 12-th Meeting of the Wireless World Research Forum (WWRF) Toronto Canada Nov 2004
WINNER D210 v10
Page 179 (180)
[VH05a] V Standovic and M Haardt ldquoMulti-user MIMO downlink beamforming over correlated MIMO channelsrdquo in Proc International ITGIEEE Workshop on Smart Antennas (WSA05) Duisburg Germany April 2005
[VH05b] V Stankovic and M Haardt ldquoImproved diversity on the uplink of multi-user MIMO systemrdquo in Proc European Conference on Wireless Technology (ECWT 2005) Paris France October 2005
[VTL02] P Viswanath DNC Tse and R Laroia ldquoOpportunistic beamforming using dumb antennasrdquo IEEE Transactions on Information Theory vol 48(6) June 2002
[WER03] L Wischhof A Ebner H Rohling M Lott and R Halfmann SOTIS -A Self-Organizing Traffic Information System Proceedings of the 57th IEEE Vehicular Technology Conference (VTC 03 Spring) Jeju Korea 2003
[Win84] JH Winters ldquoOptimum Combining in Digital Mobile Radio with Cochannel Interferencerdquo in IEEE Journal on Selected Areas in Communications Vol SAC-2 No 4 July 1984
[WIND21] IST-2003-507581 WINNER ldquoD21 Identification of Radio-Link Technologiesrdquo June 2004
[WIND22] IST-2003-507581 WINNER ldquoD22 Feasibility of multi-bandwidth transmissionsrdquo October 2004
[WIND23] IST-2003-507581 WINNER ldquoD23 Assessment of Radio-Link Technologiesrdquo February 2005
[WIND24] IST-2003-507581 WINNER ldquoD24 Assessment of adaptive transmission technologiesrdquo February 2005
[WIND25] IST-2003-507581 WINNER ldquoD25 Duplex arrangements for future broadband radio interfacerdquo October 2004
[WIND26] IST-2003-507581 WINNER ldquoD26 Assessment of multiple access technologiesrdquo October 2004
[WIND27] IST-2003-507581 WINNER ldquoD27 Assessment of Advanced Beamforming and MIMO Technologiesrdquo February 2005
[WIND31] IST-2003-507581 WINNER ldquoD31 Description of identified new relay based radio network deployment concepts and first assessment of comparison against benchmarks of well known deployment concepts using enhanced radio interface technologiesrdquo Oct 2004
[WIND32] IST-2003-507581 WINNER ldquoD32 Description of identified new relay based radio network deployment concepts and first assessment by comparison against benchmarks of well known deployment concepts using enhanced radio interface technologiesrdquo February 2005
[WIND35] IST-2003-507581 WINNER ldquoD35 Proposal of the best suited deployment concepts chosen for the identified scenariosrdquo December 2005
[WIND41] IST-2003-507581 WINNER ldquoD41 Identification and definition of cooperation schemes between RANs ndashfirst draftrdquo June 2004
[WIND42] IST-2003-507581 WINNER ldquoD42 Impact of cooperation schemes between RANs ndashfirst draftrdquo February 2005
[WIND43] IST-2003-507581 WINNER ldquoD41 Identification and definition of cooperation schemes between RANs ndashfinal deliverablerdquo June 2005
[WIND44] IST-2003-507581 WINNER ldquoD44 Impact of cooperation schemes between RANs ndash final deliverablerdquo November 2005
[WIND54] IST-2003-507581 WINNER ldquoD54 Final Report on Link Level and System Level Channel Modelsrdquo September 2005
WINNER D210 v10
Page 180 (180)
[WIND63] IST-2003-507581 WINNER ldquoD63 WINNER Spectrum Aspects Assesment reportrdquo December 2005
[WIND71] IST-2003-507581 WINNER ldquoD71 System requirementsrdquo July 2004
[WIND72] IST-2003-507581 WINNER ldquoD72 System Assessment Criteria Specificationldquo July 2004
[WIND76] IST-2003-507581 WINNER ldquoD76 WINNER System Concept Descriptionrdquo October 2005
[WOSS05] Wei Wang Tony Ottosson Tommy Svensson Arne Svensson Mikael Sternad rdquoEvaluations of a 4G Uplink System Based on Adaptive Single-Carrier TDMArdquo Proceedings IEEE Vehicular Technology Conference Fall Dallas Texas USA Sep 2005
[YNA01] E Yeo B Nikolie and V Anantharam ldquoHigh Throughput Low-Density Parity-Check Decoder Architecturesrdquo IEEE Globecom 2001
[Yu02] W Yu and JM Cioffi ldquoFDMA capacity of Gaussian multiple-access channels with ISIrdquo IEEE Trans Commun vol 50 no 1 pp 102-111 Jan 2002
[Yu04] W Yu W Rhee S Boyd JM Cioffi ldquoIterative water-filling for Gaussian vector multiple-access channelsrdquo IEEE Trans Information Theory Jan 2004
[ZB04] P Zarrinkhat and A H Banihashemi ldquoThreshold Values and Convergence Properties of Majority-Based Algorithms for Decoding Regular Low-Density Parity-Check codesrdquo IEEE Trans on Comm vol 52 no 12 Dec 2004
[ZF04] J Zhang and M Fossorier ldquoA Modified Weighted Bit-Flipping Decoding of Low-Density Parity-Check Codesrdquo IEEE Comm Letters vol 8 no 3 March 2004
[ZF05] J Zhang M Fossorier lsquoShuffled iterative decodingrsquo IEEE Trans on Comm Vol 53 No 2 February 2005
[ZZ05] H Zhong and T Zhang lsquoBlock-LDPC A Practical LDPC Coding System Design Approachrsquo IEEE Trans on Circ And Syst-I Reg Papers Vol 52 N 4 April 2005
WINNER D210 v10
Page 3 (180)
The medium access control (MAC) system layer of the proposed WINNER radio interface allocates the time-frequency-spatial resources to packet flows Its key element is a resource scheduler which is assumed to be physically located close to or within each base station and relay node Functionality for handling and formulating constraints on the allocation to be performed by the resource scheduler is also parts of the MAC system layer Packets arrive at the MAC in different transport channels intended for control broadcast contention-based traffic scheduled point-to-point and scheduled point-to-multipoint traffic The MAC performs resource allocation on two time scales
(1) Resource partitioning on a time scale of the super-frame (5ndash10 ms) The overall allocation of time-frequency-spatial resources to different transport channels is adjusted on this time scale based on the aggregated demand within each transport channel Unused guard chunks used for interference avoidance and spectrum sharing are also reserved
(2) Resource scheduling for the scheduled flows on the time scale of the slot (034 ms) The scheduled flows are allocated to time-frequency-spatial resources available for this purpose in the super-frame There are two options (algorithm variants) for performing resource scheduling adaptive allocation and non-frequency-adaptive allocation With adaptive allocation individual time-frequency chunks can be allocated to different flows Fast link adaptation is performed within each chunk based on predictions of the channel quality This method offers maximal performance and a high potential for multi-user diversity gains but it cannot be used at high interference levels and high vehicular velocities A general framework for adaptive resource scheduling is outlined that enables the allocation to be performed with reasonable complexity With non-frequency-adaptive allocation bits from each flow are allocated onto sets of chunks that are dispersed in frequency Coding and interleaving is used here to combat frequency selective fading Link adaptation may be performed with respect to shadow fading but not with respect to frequency-selective fading This method is required for control signalling and is the primary method in the case of point-to-multipoint transmission It offers a robust option for scheduled flows and also serves as a fallback solution for adaptive scheduling The resource scheduling (adaptive as well as non-frequency adaptive) is fast offering around 1 ms minimum delay over the radio interface
The user plane of the MAC system layer can be outlined as follows for the downlink The arriving packets are separated into retransmission units that are coded The coded blocks denoted FEC blocks are buffered with per-flow queuing The scheduler allocates resources to flows and then drains the queues with bit-level granularity to fill the allocated chunks Contention-based uplink transmission and peer-to-peer communication use a separate set of subcarriers Cell-wide broadcast messages utilise a set of broadcast OFDM symbols that are located in the preamble of each super-frame
The choice of multiple access method is intimately connected to the problems of resource partitioning and resource scheduling For adaptively allocated flows TDMAOFDMA is used In the baseline design individual chunks are exclusively allocated to flows For non-frequency-adaptively allocated flows mapping a flow on a set of chunks would provide insufficient diversity for small packets The preferred options for solving this problem are presented The problem of integrating SDMA with the studied time-frequency based multiple access schemes is also discussed
Radio resource management (RRM) has the overall goal of utilising the given radio resources in an effi-cient manner The RRM functions are divided into mode-specific RRM functions that are targeted and optimised for a specific system mode and deployment scenario mode-generic RRM functions that are shared between the different WINNER system modes or used for their coordination and cooperative RRM functions which are used for the cooperation of the WINNER system with legacy RANs such as UMTS (including 3GPP long-term evolution) and WLAN An initial set of algorithms for the RRM functions studied within the WINNER framework is described including spectrum mapping and allocation service level controller mode and RAN selection handover admission control load sharingcongestion control and routing The location of these RRM algorithms within the RAN architecture is an essential issue It is envisioned that for the WINNER system with its multiple system modes a hybrid (hierarchical) approach could be suitable where different decision levels of the same RRM functionality that work at different time scales are located in different nodes Finally a first approach to the RRC signalling and a survey of required measurements reports is presented
Extensive performance assessments of the current WINNER concept and variants thereof have been performed through simulations Results are presented for link multi-link and system levels The insight obtained by such simulations supports important system design choices allows identification of favourable configurations of the radio interface and allowed initial system performance estimation Comparisons with other systems and technologies are made where appropriate Implementation impact and performance-complexity trade-offs have been analysed in depth in earlier WINNER deliverables and an overview is contained in this deliverable including electromagnetic field (EMF) exposure aspects
WINNER D210 v10
Page 4 (180)
Authors Partner Name Phone Fax E-mail
AAU Albena Mihovska Phone +45 96358639
Fax +45 98151583
E-mail albenakomaucdk
ACL Thorsten Wild Phone +49 711 821 35762
Fax +49 711 821 32185
E-mail thorstenwildalcatelde
CTH Tommy Svensson Phone +46 31 772 1823
Fax +46 31 772 1782
E-mail tommysvenssons2chalmersse
CTHUU Mikael Sternad Phone +46 704 250 354
Fax +46 18 555096
E-mail mikaelsternadsignaluuse
CTTC Monica Navarro Phone +34 93 645 2915
Fax +34 93 645 2901
E-mail monicanavarrocttces
Stephan Pfletschinger E-mail stephanpfletschingercttces
CU David Falconer Phone +1 613 520 5722
Fax +1 613 520 5727
E-mail ddfscecarletonca
Chan Tong Lam E-mail lamcsangamscecarletonca
Florence Danilo-Lemoine Phone +1 613 520 2600 ext 5691
Fax +1 613 520 5727
E-mail fdaniloscecarletonca
WINNER D210 v10
Page 5 (180)
DLR Armin Dammann Phone +49 8153 28 2871
Fax +49 8153 28 1871
E-mail armindammanndlrde
Simon Plass Phone +49 8153 28 2874
Fax +49 8153 28 1871
E-mail simonplassdlrde
DoCoMo Gunther Auer Phone +49 89 5682 4219
Fax +49 89 5682 4301
E-mail auerdocomolab-eurocom
Jeacuterocircme Bonnet Phone +49 89 5682 4229
Fax +49 89 5682 4301
E-mail bonnetdocomolab-eurocom
EAB David Asteacutely Phone +46 8 585 301 49
Fax +46 8 585 314 80
E-mail davidastelyericssoncom
Johan Axnaumls Phone +46 8 404 38 59
Fax +46 8 585 314 80
E-mail johanaxnasericssoncom
Niklas Johansson Phone +46 8 508 77860
Fax +46 8 7575720
E-mail niklasjJohanssonericssoncom
Goumlran Klang Phone +46 8 404 4794
Fax +46 8 585 314 80
E-mail gorannklangericssoncom
Magnus Olsson Phone +46 8 585 307 74
Fax +46 8 585 314 80
E-mail magnusaolssonericssoncom
Per Skillermark Phone +46 8 58531922
Fax +46 8 7575720
E-mail perskillermarkericssoncom
Kai-Erik Sunell Phone +46 8 757 35 61
Fax +46 8 585 314 80
E-mail kai-eriksunellericssoncom
WINNER D210 v10
Page 6 (180)
FTRampD Marie-Heacutelegravene Hamon Phone +33 2 99 12 48 73
Fax +33 2 99 12 40 98
E-mail mhelenehamonfrancetelecomcom
Rodolphe Legouable E-mail rodolphelegouablefrancetelecomcom
Mylegravene Pischella Phone +33 1 452 98 963
Fax +33 1 452 94 194
E-mail mylenepischellafrancetelecomcom
Thomas Saumllzer E-mail thomassalzerfrancetelecomcom
IBM Pedro Coronel Phone +41 1 724 8532
Fax +41 1 724 8955
E-mail pcozurichibmcom
Wolfgang Schott Phone +41 1 724 8476
Fax +41 1 724 8955
E-mail sctzurichibmcom
KTH Mats Bengtsson Phone +46 8 790 8463
Fax +46 8 790 7260
E-mail matsbengtssons3kthse
LUK Angeliki Alexiou Phone +44 1793 776620
Fax +44 1793 776725
E-mail alexioulucentcom Abdelkader Medles Phone +44 1793 776783
Fax +44 1793 776725
E-mail medleslucentcom
MOT Markus Muck Phone +33 1 6935 2573
Fax +33 1 6935 7701
E-mail MarkusMuckmotorolacom
WINNER D210 v10
Page 7 (180)
NTUA Elias Tragos Phone +302107721511
Fax +302107722534
E-mail etragostelecomntuagr
NOK Carl Eklund Phone +358 50 4836566
Fax +358 7180 36067
E-mail carleklundnokiacom
Kari Kalliojaumlrvi Phone +358 50 4836232
Fax +358 7180 35935
E-mail karikalliojarvinokiacom
Antti Sorri Phone +358 50 4821294
Fax +358 7180 36857
E-mail anttisorrinokiacom
Samuli Visuri Phone +358 50 4868219
Fax +358 7180 36857
E-mail samulivisurinokiacom
NOKCH Yong Teng Phone +86 10 65392828 2753
Fax +86 10 84210576
E-mail yongtengnokiacom
RWTH Ole Klein Phone +49 241 80 28575
Fax +49 241 80 22242
E-mail olekleincomnetsrwth-aachende
Ralf Pabst Phone +49 241 80 25828
Fax +49 241 80 22242
E-mail pabcomnetsrwth-aachende
PRL Keith Roberts Phone +44 1293 815754
Fax +44 1293 815024
E-mail keithrobertsphilipscom
WINNER D210 v10
Page 8 (180)
PUT Zbigniew Dlugaszewski Phone +48 61 665 3916
Fax +48 61 665 2572
E-mail zdlugaszetputpoznanpl
Adam Piatyszek Phone +48 61 665 3936
Fax +48 61 665 2572
E-mail adampiatyszeketputpoznanpl
Michal Wodczak Phone +48 61 665 3913
Fax +48 61 665 2572
E-mail mwodczaketputpoznanpl
SEUK Thierry Lestable Phone +44 1784 428600 Ext720
Fax +44 1784 428624
E-mail thierrylestablesamsungcom
Vaia Sdralia Phone +44 1784 428600
Fax +44 1784 428629
E-mail vaiasdraliasamsungcom
SM Elena Costa Phone +49 89 636 44812
Fax +49 89 636 45591
E-mail elenacostasiemenscom
Martin Doumlttling Phone +49 89 636 73331
Fax +49 89 636 1373331
E-mail martindoettlingsiemenscom
Joumlrn von Haumlfen Phone +49 89 636 46228
Fax +49 89 722 13034834
E-mail joernvon_haefensiemenscom
Eiman Mohyeldin Phone +49 89 636 45340
Fax +49 89 636 45591
E-mail eimanmohyeldinsiemenscom
SMBenQ Mobile Karsten Bruumlninghaus Phone +49 2842 95 1742
Fax +49 2842 95 3387
E-mail karstenbrueninghausbenqcom
WINNER D210 v10
Page 9 (180)
SMRMR Bill lsquoXinqunrsquo Liu Phone +44 1794 833547
Fax +44 1794 833586
E-mail xinqunliurokecouk
David Thomas Phone +44 1794 833431
Fax +44 1794 833433
E-mail davidThomasrokecouk
SMTUB Eduard A Jorswieck Phone +49 30 31002860
Fax +49 30 31002863
E-mail jorseycstu-berlinde
Volker Jungnickel Phone +49 30 31002768
Fax +49 30 31002647
E-mail volkerjungnickelmktu-berlinde
Malte Schellmann Phone +49 30 31002770
Fax +49 30 31002647
E-mail malteschellmanntu-berlinde
Aydin Sezgin Phone +49 30 31002868
Fax +49 30 31002863
E-mail aydinsezginmktu-berlinde
SMTUD Tobias Frank Phone +49 6151 16 3769
Fax +49 6151 16 53 94
E-mail tobiasfranknttu-darmstadtde
SMTUHH Ting Chen Phone +49 40 42878 2165
Fax +49 40 42878 2281
E-mail tchentu-harburgde
Rainer Gruumlnheid Phone +49 40 42878 2166
Fax +49 40 42878 2281
E-mail gruenheidtu-harburgde
WINNER D210 v10
Page 10 (180)
SMUU Stephan Stiglmayr Phone +49 731 50-31531
Fax +49 731 50-31509
E-mail stephanstiglmayre-technikuni-ulmde
TID Emilio Mino Phone +34 91 3374428
Fax +34 91 3374212
E-mail eminotides
TUD Ernesto Zimmermann Phone +49 351 463 34958
Fax +49 351 463 37255
E-mail zimmereifnettu-dresdende
TUI Martin Fuchs Phone +49 3677 69 1156
Fax +49 3677 691195
E-mail martinfuchstu-ilmenaude
Veljko Stankovic Phone +49 3677 69 1156
Fax +49 3677 691195
E-mail veljkostankovictu-ilmenaude
Martin Haardt Phone +49 3677 69 2613
Fax +49 3677 691195
E-mail martinhaardttu-ilmenaude
UniS Mohammad Abaii Phone +44 1483 683609
Fax +44 1483 686011
E-mail MAbaiisurreyacuk
Yajian Liu Phone +44 1483 686015
Fax +44 1483 686011
WINNER D210 v10
Page 11 (180)
UOULU Kari Hooli Phone +358 8 553 2883
Fax +358 8 553 2845
E-mail karihoolieeoulufi
Juha Karjalainen Phone +358 8 553 7637
E-mail JuhaKarjalaineneeoulufi
Zexian Li Phone +358 8 553 2877
E-mail zexianlieeoulufi
WINNER D210 v10
Page 12 (180)
Table of Contents
Terminology Acronyms and Abbreviations 17
Mathematical Symbols and Notation 22
1 Introduction and Radio Interface Structure 23 11 Requirements and design targets 23 12 Key components of the radio interface 24 13 Top-down overview of the WINNER system concept 24
131 Services protocols and design 24 132 System layers modes and parameterisation 26
14 Scope of this document 28
2 Physical Layer 29 21 Forward error correction 29 22 Modulation and space-time-frequency processing 30
221 General resource allocation strategy 30 222 Modulation technique 30 223 Modulation parameters 31 224 Transceiver structure 31 225 Space-time-frequency processing 33
23 Pilot grid design for channel estimation and synchronisation 34 231 Synchronisation 34 232 Channel estimation 35
3 Medium Access Control (MAC) Layer 36 31 Medium access control for FDD and TDD cellular transmission 36
311 Goals and design principles 36 312 Control of relay-enhanced cells 36 313 The MAC services and tasks 37 314 The chunk slot frame and super-frame structure 38 315 Overview of main functions 40 316 Resource mapping and multiple access 42
32 Medium access control for peer-to-peer transmission 43 321 MAC architecture for P2P transmission 43 322 Frame structure of DAC for P2P transmission 44
4 Radio Resource Management (RRM) and Radio Resource Control (RRC) 46 41 RRM functions 46 42 WINNER RRM architecture 48
WINNER D210 v10
Page 13 (180)
43 Radio resource control 49 431 RRC states 49
5 Assessment Overview 51 51 General 51 52 Challenges 51 53 Summary of results ndash performance and complexity 52
531 Analogue RF 52 532 Digital baseband 52 533 Multiple access 55 534 Radio protocols 56
54 Comparison of performance results with requirements and design targets 56
6 Conclusions and Outlook 59
Appendix A Requirements and Design Targets 60 A1 Targets for different scenarios 60
A11 Scenarios 60 A12 Rural area 60 A13 Metropolitan area 61 A14 Local area 61
A2 Additional targets 61 A3 System assumptions 62
Appendix B Physical Layer 63 B1 Spatial processing and space-time-frequency mapping 63 B2 Forward error correction 66
B21 Implementation issues flexibility parallelisation throughput 67 B22 Rate compatible code sets for HARQ-II 68 B23 Low-density parity-check codes decoding options 69 B24 Scheduling of the decoder 69
B3 Modulation 70 B31 Assessment of modulation techniques 70 B32 OFDM vs single carrier 71 B33 Guard interval design 72 B34 Modulation alphabets and bit mapping 72
B4 Pilot design for channel estimation and synchronisation 73 B41 Intra- and inter-cell synchronisation using dedicated training symbols 73 B42 Pilot grid for generalised multi-carrier (GMC) 75
B5 Adaptive transmission 78 B51 Bit and power loading algorithms 78 B52 Channel quality prediction for adaptive transmission 79
WINNER D210 v10
Page 14 (180)
B53 Compression of channel state feedback for adaptive transmission 81
Appendix C MAC System Layer Functions 83 C1 Functional architecture of the WINNER medium access control for FDD and TDD cellular
transmission 83 C11 MAC radio resource control Resource partitioning and constraint combining 83 C12 MAC radio resource control Flow setup and termination 84 C13 MAC radio resource control Spatial scheme pre-configuration and selection 85 C14 MAC control feedback 86 C15 Radio packet transfer Transmission and reception 86 C16 Resource scheduling 88 C17 SDMA and spatial user partitioning 91 C18 Timing of the execution of the main MAC functions 93
C2 Functional architecture for peer-to-peer MAC 93 P2P-DAC channel access control functions 95
C3 Chunk definition 96
Appendix D Radio Resource Management (RRM) and Radio Resource Control (RRC) 97 D1 RRM functions 97
D11 Spectrum control 97 D12 Service level control (SLC) 98 D13 ModeRAN selection 99 D14 Handover 100 D15 Admission control 101 D16 Load control 102 D17 Routing 102
D2 RRM architecture 104 D21 Location of WINNER functions 104
D3 RRC functionalities 105 D31 Measurements and reports 105 D32 Other functions 106
Appendix E Assessments Assumptions 108 E1 Overview 108 E2 Basic parameters for link level evaluations 108 E3 Basic parameters for multi-link and system level evaluations 109
E31 Mode specific parameters 109 E32 Common to all modes 110
E4 Scenario parameters 111
Appendix F Link-Level Assessments 112 F1 Link layer performance Throughput 112
WINNER D210 v10
Page 15 (180)
F2 Forward error correction 116 F21 Performance comparison 116 F22 Complexity-performance trade-off 116 F23 Performance comparison of rate compatible punctured codes 118 F24 BLDPCC performance comparison of major decoding algorithms 118 F25 Performance when using different decoding schedules 119 F26 Base model matrices for BLDPC codes 120
F3 Channel estimation 122 F31 Uplink single carrier 122 F32 Pilot-aided and iterative channel estimation for OFDM 124 F33 Design of the channel estimation unit 126 F34 Unbiased channel interpolation 127 F35 Channel estimation using the guard interval mdash pseudo-random-postfix OFDM 128
F4 Synchronisation 129 F41 Synchronisation without utilizing an explicit training symbol 129
F5 Performance of selected bit and power loading algorithms 132
Appendix G Multi-Link and System-Level Assessments 134 G1 Downlink multiple access 135
G11 Comparison of non-adaptive OFDMA MC-CDMA and adaptive OFDMA 135 G12 Comparison of non-adaptive subcarrier interleaved OFDMA and MC-CDMA 138 G13 Comparison of non-adaptive OFDMA MC-CDMA and TDMA 139 G14 Impact of chunk sharing on the performance of adaptive OFDMATDMA 140 G15 Comparison of adaptive OFDMA and OFDMASDMA using GoBs 142
G2 Downlink spatial processing 144 G21 Comparison of fixed and tracking based beamforming 144 G22 Comparison of various adaptive beamforming techniques 145 G23 Comparison of maximal ratio and interference rejection combining at UT 147 G24 Comparison of beamforming diversity and multiplexing 148 G25 Performance of SMMSE precoding 151
G3 Downlink multi-user detection 153 G31 Comparison of receiver structures for SISO MC-CDMA 153 G32 Comparison of receiver structures for MIMO MC-CDMA 154
G4 Uplink multiple access 155 G41 Performance of single carrier based adaptive TDMA 155 G42 Comparison of IFDMA and chunk based OFDMA 156 G43 Performance of adaptive OFDMA 157 G44 Comparison of adaptive OFDMA and OFDM-TDMA 159
G5 Uplink spatial processing 161 G51 Performance of spatial diversity 161 G52 Linear precoding concepts with long term channel state information 162
WINNER D210 v10
Page 16 (180)
G6 Uplink multi-user detection 163 G61 Comparison of receiver structures for DS-CDMA 163 G62 Comparison of receiver structures for MIMO single carrier 164
G7 Other topics 166 G71 OFDM versus single carrier based uplinks 166 G72 Performance of low rate channel coding for one-cell frequency reuse 167 G73 Comparison of FDMA and TDMA based resource partitioning among BS 169 G74 Comparison of conventional and self-organised RRM in cellular networks 171 G75 VAA technology with adaptive pre-selection aided by MC-OLSR protocol 172
References 174
WINNER D210 v10
Page 17 (180)
Terminology Acronyms and Abbreviations In this chapter abbreviations are explained and fundamental terms are listed which are not commonly used andor have specific meaning throughout the document A short explanation or a reference to the corresponding section that defines this term is given where appropriate
Term Description
AC Admission Control
ACS Access Control Server
AMA Alpha-Min Algorithm
BCH Broadcast (Transport) Channel
BICM Bit Interleaved Coded Modulation
BLDPCC Block Low-Density Parity-Check Code
BPA Belief Propagation Algorithm
BPSK Binary Phase Shift Keying
BS Base Station A stationary network element serving relay nodes or user terminals Base stations are interconnected with network elements belonging to the RAN
BSsr Short-range BS
BSwa Wide-area BS
CAI Co-Antenna Interference
CAP Contention Access Period in peer-to-peer MAC
CC Convolutional Code
CCI Co-Channel Interference
CDC Common Data (Transport) Channel for point-to-multipoint communication
CDMA Code Division Multiple Access
Cell A cell is defined by the geographical coverage area of a broadcast channel originating from a base station A BS may control several cells A cell uses a single PLM on a particular carrier frequency See also REC
Chunk Basic time-frequency resource unit for OFDM links consisting of a rectangular time-frequency area that comprises nsymb of subsequent OFDM symbols and nsub of adjacent subcarriers
Chunk layer A time-frequency chunk within one spatial channel (layer)
CoopRRM Cooperative Radio Resource Management
CP Cyclic Prefix
CQI Channel Quality Information measurement required for (spatial) link adaptation containing condensed information about the channel eg signal-to-interference and noise ratio
CRC Cyclic Redundancy Check
CRRM Common Radio Resource Management
CSI Channel State Information measurement required for spatial link adaptation containing detailed information about the channel eg complex-valued channel gain matrix correlation matrix
CSMACD Carrier-Sense Multiple Access Collision Detect
CTP Control Period of DAC physical channel in P2P MAC
WINNER D210 v10
Page 18 (180)
Term Description
DAC Contention-Based Direct Access (Transport) Channel
DBTC Duo-Binary Turbo Code
DCT Discrete Cosine Transform
DFE Decision Feedback Equalisation
DS-CDMA Direct Sequence Code Division Multiple Access
DVB Digital Video Broadcasting
DVB-S Digital Video Broadcasting ndash Satellite
DVB-T Digital Video Broadcasting ndash Terrestrial
FDD Frequency Division Duplexing
FDMA Frequency Division Multiple Access
FDOSS Frequency Domain Orthogonal Signature Sequences
FD-DFE Frequency-Domain Decision-Feedback Equalisation
FEC Forward Error Correction (Coding)
FEC block FEC coded transmission block with whole or part of RTU as payload
FER Frame Error Rate
FFT Fast Fourier Transform
Flow Packet stream from one source to one or several destinations
FMT Filtered Multi-Tone
Frame Timeslot consisting of one uplink and one downlink transmission slot
GAP Guaranteed Access Period slotted part of DAC physical channel in P2P MAC
GI Guard Interval
GMC Generalised Multi-Carrier
GPS Global Positioning System
HARQ Hybrid Automatic Repeat Request
HHO Horizontal Handover handover to other cell within the same system
HIS Hybrid Information System
HPA High Power Amplifier
HSDPA High-Speed Downlink Packet Access
IBO Input Backoff (to transmit HPA due to PAPR)
ICE Iterative Channel Estimation
ICI Inter-Carrier interference
IDCT Inverse Discrete Cosine Transform
IDD Iterative Detection and Decoding
IF Intermediate Frequency
IFDMA Interleaved Frequency Division Multiple Access
IFFT Inverse Fast Fourier Transform
IOTA Isotropic Orthogonal Transform Algorithm
IP Internet Protocol
WINNER D210 v10
Page 19 (180)
Term Description
IR Incremental Redundancy
ITU International Telecommunication Union
ISI Inter-Symbol Interference
LA Link Adaptation
LDC Linear Dispersion Code
LDPCC Low-Density Parity-Check Code
Link A link is a radio connection between two network elements of the WINNER access system It subdivides into relay links between base station and relay nodes or between relays and the user link between the user terminal and the radio access point
LLR Log-Likelihood Ratio
LT Long-Term
LTE Long-Term Evolution of 3GPP
MAC Media Access Control Name used both to denote a system layer (MACSL) and a protocol layer (MACPL) that is implemented in the MAC system layer user plane
MAI Multiple Access Interference
MC-CDMA Multi-Carrier Code Division Multiple Access
MCN Multi-hop Cellular Network cellular network that includes relay nodes
MIMO Multiple Input Multiple Output
MMSE Minimum Mean Square Error
MSA Min-Sum Algorithm
MU Multi-User
OBF Opportunistic Beamforming
OFDM Orthogonal Frequency Division Multiplexing
OFDMA Orthogonal Frequency Division Multiple Access
P2P Peer-to-Peer transmission
PACE Pilot-Aided Channel Estimation
PAPR Peak-to-Average Power Ratio
PARC Per Antenna Rate Control
PCCC Parallel Concatenated Convolutional Code (Turbo Code)
PDP Power Delay Profile
PDU Protocol Data Unit
PHY Physical Layer Name used both to denote a system layer (PHYSL) and a protocol layer (PHYPL)
PHY mode Basic physical layer transmission strategy currently two modes are defined TDD and FDD Also denoted PLM Physical Layer Mode
Physical channel A set of chunk layers onto which the resource scheduler in the MAC system layer maps data associated with one sub-flow
PLM Physical Layer Mode see PHY mode
PLMN Public Land Mobile Network
PMP Peer-to-Multi-Peer transmission
WINNER D210 v10
Page 20 (180)
Term Description
PRP Pseudo-Random-Postfix
PSAP Provided Service Access Point
PSRC Per Stream Rate Control
QoS Quality of Service
QAM Quadrature Amplitude Modulation
QC-BLDPCC Quasi-Cyclic Block Low-Density Parity-Check Code
RAC Contention-Based Random Access (Transport) Channel
RAN Radio Access Network
RANG Radio Access Network Gateway
RAP Radio Access Point common term that encompasses both base stations and relay nodes
RAT Radio Access Technology
RC Rate-Compatible
REC Relay-enhanced cell The geographical area covered by one broadcast channel from a single base station plus the broadcast channels from its connected relay nodes
RF Radio Frequency
RI Radio Interface
RLC Radio Link Control Name used both to denotes a system layer (RLCSL) and a protocol layer RLCPL) that is implemented in the RLC system layer user plane
RN Relay Node A network element serving other RN or UT in a given geographical area via its radio access capabilities It is wirelessly connected to a base station another relay node andor a user terminal and forwards data packets between these network elements
RNC Radio Network Controller
RRC Radio Resource Control Protocol that provides the signalling for control and feedback messages
RRM Radio Resource Management Control functions implemented in the RLC system layer control plane
RSB Resource Scheduling Buffer
RTU Retransmission Unit packets upon which HARQ is performed
RUP Reuse Partitioning
SAP Service Access Point
SC Single Carrier
SDMA Spatial Division Multiple Access
SDU Service Data Unit
SDFE Soft Decision Feedback Equalisation
Sector Azimuth angle partition of a base station coverage area In the system-level simulations of this document each sector constitutes a separate cell
SF Super-Frame
SF preamble Initial part of super-frame transmitted cell-wide in spectrum available everywhere
SF-MMSE Space-Frequency MMSE
WINNER D210 v10
Page 21 (180)
Term Description
SFTuCM Space-Frequency Turbo Coded Modulation
SINR Signal-to-Interference-and-Noise ratio
SISO Single-Input Single-Output
Site A location with co-located antenna element that belong to one base station
SLC Service Level Control
Slot short form of Timeslot see below
SMMSE Successive Minimum Mean Square Error precoding
SNR Signal-to-Noise Ratio
SO-RRM Self-Organised Radio Resource Management
SPIC Soft Parallel Interference Canceller
ST-WNRA Space-Time Weighted Nonbinary Repeat Accumulate (Code)
Sub-flow Data stream after segmentation consisting of FEC blocks
SUD Single User Detection
Super-frame Timeslot spanning whole band with place for flows from all transport channels contains also synchronisation symbols and nf frames
System Mode Specific combinations of algorithm assignations or ranges of algorithm assignations may be referred to as modes The two main considered physical layer modes (PLM) are based on and denoted FDD and TDD A System mode is a PL mode combined with a MAC mode
Targeted Flow CDC packet stream to a subset of the multicast receivers within the cell
TC Turbo Code
TCP Transmission Control Protocol
TDC Targeted Data (Transport) Channel for point-to-point communication
TDD Time Division Duplexing
TDMA Time Division Multiple Access
TEQ Turbo Equalisation
(Time)slot Time unit of one contiguous uplink or downlink transmission in FDD or TDD
Transport channel Interface between the RLC and the MAC layer user planes
UMTS Universal Mobile Telecommunication System
UT User Terminal A physical network element used by the end user to access a service or set of services
UTRAN UMTS Terrestrial Radio Access Network
VAA Virtual Antenna Array
VHO Vertical Handover handover between different systems
WLAN Wireless Local Area Network
ZF Zero Forcing
WINNER D210 v10
Page 22 (180)
Mathematical Symbols and Notation
Symbol Description acl(tf) virtual antenna chunk for chunk c layer l symbol t and subcarrier f Bi information bits to be transmitted f subcarrier Fcl precoding matrix for chunk c and layer l K number of users Mr number of receive antennas Mt number of transmit antennas Ndata number of data symbols per chunk nf number of frames per super-frame nsub number of subcarriers per chunk nsymb OFDM symbols per chunk Qc number of spatial layers in chunk c Rmin minimum coding rate
Sc number of modulated layers in chunk c
t time (OFDM symbol)
Tchunk chunk duration
TOi time-out Tslot MAC slot duration
xcl(tf) antenna chunk for chunk c layer l symbol t and subcarrier f
WINNER D210 v10
Page 23 (180)
1 Introduction and Radio Interface Structure The definition of a new radio interface (RI) concept is an inherently iterative process determined not only by pure technical considerations but also by regulatory and other decisions or restrictions The technical and regulatory processes are mutually dependent From a design perspective this is clearly a problem since the regulatory framework is needed to provide an optimised solution On the other hand the regulatory process requires technical arguments and indications to define the system and spectrum framework
This is the prevailing situation under which the new WINNER system and in particular the new WINNER radio interface is developed It therefore provides solutions for different system frameworks and a wide range of possible spectrum allocations This document describes the general WP2 RI concept and current mainstream assumptions based on a consolidation process of previous WINNER deliverables and results Key technology concepts are assessed against the requirements and assessment criteria derived from WP7 work System design choices are guided by technical strategic and economic aspects Technical assessment criteria include system performance implementation aspects terminal and system complexity scalability and flexibility Also of major concern is the interworking with legacy radio technologies and efficient implementation of multi-standard equipment in particular OFDM-based systems eg like the one discussed in 3GPP long-term evolution (LTE)
The overall requirements design targets and key components for the WINNER RI are given in Chapter 1 Chapter 1 also provides some background to the system framework as far as required for the remainder of this document in the form of a top-down survey The contribution of this deliverable is discussed in the framework of the overall system concept work including service specification service architecture protocols and system design Thereafter Chapters 2ndash4 provide a detailed bottom-up discussion of the system design The physical layer design including transceiver diagrams coding modulation spatial processing synchronisation and channel estimation is explained in Chapter 2 Chapter 3 shows the functional design and architecture for the cellular medium access control (MAC) system layer and the MAC for peer-to-peer direct communications Chapter 4 does the same for radio resource management (RRM) and radio resource control (RRC) Chapter 5 gives an overview on key assessments performed to support design choices to exemplify favourable configurations of the RI and to obtain initial performance estimation For brevity these chapters focus on major results and key components further rationale and detail is provided in dedicated appendices for each topic
11 Requirements and design targets The WINNER system should fulfil the ITU-R Recommendation M1645 about systems beyond IMT-2000 (ie beyond 3G) In particular 100 Mbps peak aggregate useful data rate for mobile access and 1 Gbps for local area are assumed for these systems Peak data rates do not however give any indication on the quality of service experienced by one user and a set of amendments and extended system requirements are presented in [WIND71] A number of them are directly relevant to the radio interface
bull R36 Peak spectral efficiency in connected sites of 10 bitsHzsite in wide-area deployments for high load
bull R37 Peak spectral efficiency in isolated (non-contiguous) sites of 25 bitsHzsite
bull R32 A sustainable average ldquohigh endrdquo data rate per link of 50 Mbits above Layer 2
bull R33 A consistent and ubiquitous data rate per link of 5 Mbits above Layer 2
bull R312 User speeds ranging from 0ndash500 kmh should be supported
bull R34 A maximum delay over the radio interface of 1 ms at Layer 2
bull R67 Maximum bandwidth per radio link 100 MHz
Although providing useful indications these system requirements do not provide sufficient information to completely specify required capabilities and performance of the radio interface The reason is that several fundamental pieces of information eg the traffic intensity for which the system is to be designed the admission and congestion strategies the maximum allowed output power from different types of network nodes in different environments spectrum availability etc are not yet established ndash but crucial to calculate absolute numbers of many key parameters This uncertainty is unavoidable since most of the missing parameters are determined by pending political legal and strategic decisions of different regulating bodies and in the end by the network operator
WINNER D210 v10
Page 24 (180)
Nevertheless in order to develop an adequate system concept technical design targets and guidelines for the radio interface are needed at an early stage Therefore a number of scenarios believed to be relevant for the WINNER system have been identified and for each scenario a set of more technically oriented targets with details about bit rates and other parameters have been specified The scenarios and targets are summarised in Appendix A In Chapter 5 and its associated appendices (Appendix E Appendix F and Appendix G) comparisons of simulation results with these design targets are made In addition direct comparisons with the requirements are made to the extent possible In the latter case several additional assumptions about missing parameters are needed and there are many simplified conditions and uncertainties that must be borne in mind when interpreting such results as further discussed in Chapter 5
12 Key components of the radio interface In order to meet the requirements discussed above the WINNER radio interface has been designed as a packet-oriented user-centric always-best concept It defines a scalable and flexible radio interface based on adaptive and compatible system modes tailored to particular situations such as the radio environment the usage scenario the economic model etc The always-best solution is enabled by several innovative key components such as
bull a flexible multi-mode protocol architecture enabling efficient interworking between different system modes
bull relay-enhanced cells as an integrated part of the concept
bull design and support for operation in shared spectrum and inter-system coordination
bull consequent MAC design for packet-oriented transmission including two-layered resource scheduling and short radio interface delays
bull resource allocation targeting interference avoidance by coordinated scheduling across base stations and relay nodes or using joint (spatial) precoding over distributed antennas
bull physical layer design using generalised multi-carrier (GMC) in different configurations to ensure low complexity high spectral efficiency and high granularity of resource elements
bull a spatial multi-user link adaptation concept allowing scalability in link adaptation and multi-user optimisation and being able to adapt to a wide range of deployments operational scenarios propagation channel service requirements and terminal capabilities
bull novel multi-user precoding techniques developed within WINNER
bull support of self-organised synchronisation of terminals and base station
bull optimisation techniques for overhead and control signalling
A detailed discussion of these key elements is provided in the conceptual part of this document The remainder of Chapter 1 is dedicated to introducing the overall WINNER system concept in order to provide the necessary framework and nomenclature
13 Top-down overview of the WINNER system concept
131 Services protocols and design A challenging task in the concept development work is to ensure that the different key components can be embedded into one single radio interface concept that is technically sound for a ubiquitous radio system and its multiple deployment scenarios A fundamental principle is to study important problems from different perspectives in a systematic manner taking advantage of the large variety of technical competence that is available in the different working groups Consequently the radio interface concept development work is carried out from service-oriented protocol and design perspective The main differences between these three perspectives are that they all represent different levels of abstractions and technical details as illustrated in Figure 11 The studies of technical details and the development of abstractions are performed in parallel and complement each other
The service-oriented view is based on a top-down system engineering approach A system consists of layers and each system layer provides services towards the layer above Services and their users are first identified starting from the highest layer Identified services are broken into service components and the
WINNER D210 v10
Page 25 (180)
external behaviour of these components (as seen by the users) are modelled with high-level abstractions or provided service access point (PSAP) state-machines1 The main goal of this type of representation is to describe services without touching any technical details The resulting hierarchical structure of these behavioural descriptions is referred to as a service specification [WIND76] The service specification describes the system at the highest level of abstraction
Level of abstraction
Level of technical details
Radio interface design
Radio interface design
Protocol architecture
Protocol architecture
Layer-to-layer and
peer-to-peer
communication
Service specification
Service specification
Layer-to-layer
communication
Entity-to-entity
communication
Figure 11 The three views on radio interface concept studies
The service specification is further mapped to a service architecture that explains the provided services thus providing the starting point for the protocol view The service architecture describes the details of provided services by defining service access point (SAP) interfaces between layers One single PSAP state-machine may be mapped onto one or several SAPs eg (highly-abstract) packet transfer services (as described by the service specification) may be explained with multiple SAPs that are aimed for different purposes such as point-to-point and point-to-multipoint communication The definition of these interfaces is followed by a description of protocol architecture that is a set of radio protocols and protocol layers that implements the service architecture
Protocols are in turn defined as set of rules and formats that govern the communication between protocol peer-entities2 ie communicating parties at the same level over the air Even though the placement of control functions and the formal description of protocols is currently under discussions there is a general consensus concerning the overall protocol structure and protocol layers Currently the overall structure consists of radio resource control (RRC) radio link control (RLC) medium access control (MAC) and Physical (PHY) protocol layers The RRC protocol is used by the radio resource management functions RLC protocol provides reliable packet transfer over the radio interface The MAC protocol arbitrates access to the shared medium and associates each destination with a unique address The PHY protocol is responsible for transferring information over a physical link As the vision is to connect the radio interface to an Ambient Network [AN05] upper layers handle the rest of the functionalities
The radio protocol architecture is shown in Figure 12 where SAPs are illustrated with circles and proto-col instances are illustrated with rectangles For further information about protocols and service-oriented descriptions see [WIND76 WIND35 WIND32 WIND31]
It should be emphasised that the radio protocol architecture is a very general description about the communication of two nodes over the air In order to ensure that the radio interface architecture can support all envisioned key technologies and reach the desired performance design and implementation related studies are important Of particular interest is to gain knowledge about the technical feasibility of envisioned key technologies for lower layers The design view describes the radio interface with the high-est level of technical details and it addresses problems that are related to radio interface functions and
1 In WP7 UML 20 is used to describe these state-machines 2 This should not be confused with the notion of peer-to-peer communication that later on (throughout this
deliverable) refers to direct communication between physical nodes
WINNER D210 v10
Page 26 (180)
detailed algorithmic solutions Since the main focus of this deliverable is on those lower layer protocols and functions and the evaluation of their performance the design perspective is consistently used throughout this document
PHY
RLCRLC
RLCRLC
RLC
MAC
RRC
rdquoTransportrdquo channels
Chunk rdquolayersrdquo
Packet transfer services
L1PHY
L2MAC
L2RLC
L3RRC
Figure 12 WINNER radio protocol layers and interfaces
132 System layers modes and parameterisation There are four system layers in the WINNER system concept according to the description in [WIND76] These layers are further divided into user plane and control plane The services that need to operate on individual data units (IP packets or lower layer PDUs) have been placed in the user plane The control plane services operate on longer time scales and control the operation of the user plane services by way of control signalling
1321 The system layers The functional role of each system layer is as follows
IP convergence (IPC) layer
The user plane of the IPC layer receives IP packets from the user of the WINNER RAN maps them into flows and performs header compression and decompression The control plane is responsible for RAN association functions as well as macro-mobility (IP level mobility)
Radio link control (RLC) layer
The user plane of the RLC layer provides reliable packet transfer over the radio interface It also performs confidentiality protection and packet prioritisation in order to meet the quality-of-service (QoS) goals The control plane takes care of flow establishment and release location services load spectrum and micro-mobility control These radio resource management (RRM) functions of the control plane will be described in Chapter 4 and Appendix D
Medium access control (MAC) layer
The MAC user plane provides the service ldquoradio packet transferrdquo ie transmission and reception of packets over the radio interface An important part of this service is the scheduling of packets The control plane provides the ldquoMAC radio resource controlrdquo service ie acceptance and execution of control messages from higher layers that specify required transmission parameters and boundary conditions Furthermore it implements ldquoMAC control feedbackrdquo ie messaging that supports the flow control the QoS control and the spectrum assignment and other functions at the RLC system layer There is a tight inter-layer interaction between MAC and physical layers and this is crucial for the performance of the WINNER system Some functions such as encoding and decoding that are traditionally placed in the physical layer are in the WINNER system concept placed in the MAC system layer The MAC system layer is outlined in Chapter 3 and Appendix C
WINNER D210 v10
Page 27 (180)
Physical (PHY) layer
The PHY system layer handles the physical transmission of flows and of measurements and control signalling directly related to the radio interface The PHY system layer is not separated into user plane and control plane since it is assumed that all control functionality for the PHY layer resided within the control plane of the MAC system layer The design of the PHY system layer is one of the major topics of this document It is described in Chapter 2 and Appendix B
1322 Physical layer modes and flexible parameterisations The WINNER architecture should be unified yet flexible enough to handle deployments from wide area coverage to high capacity hot spots A basic goal is that the WINNER radio interface should present a unified set of services to higher layers yet include some specific parts that provide the required flexibil-ity To provide flexibility and convergence in a structured way the definition of modes is helpful
A physical layer mode (PLM) can be defined where there is a significant impact (discontinuity in adap-tation) of PHY functionality on the radio interface concept Two PLMs have been defined
bull Frequency division duplex (FDD) transmission performed over paired bands and supporting half-duplex FDD terminals
bull Time division duplex (TDD) transmission over unpaired band
Although any PLM can be configured for any kind of deployment in this document the FDD mode is evaluated primarily in wide-area cellular deployment scenarios using frequency bands of different width The TDD PLM has so far primarily been evaluated in short-range cellular deployment
A system mode represents a specific combination of physical layer modes and MAC modes (Section 83 of [WIND76]) All higher layer functions are designed to be mode-independent (generic) and form the unified interface of the WINNER system
There are three MAC modes within the concept
bull FDD cellular MAC
bull TDD cellular MAC
bull MAC for peer-to-peer transmission at present designed using the TDD physical layer mode
The combinations of PHY and MAC modes thus define three WINNER system modes
Parameterisations within modes provide further flexibility and adaptability Both PLMs use generalised multi-carrier (GMC) transmission which includes CP-OFDM and serial modulation as special cases (Section 222) Multiple access is realised in frequency time space and in particular cases also in the code domain Further details are provided in Section 316
The basic time-frequency unit for resource partitioning is denoted a chunk It consists of a rectangular time-frequency area (see Figure 13 a) that contains payload symbols and pilot symbols It may also contain control symbols that are placed within the chunks to minimise feedback delay (in-chunk control signalling) The number of offered payload bits per chunk depends on the utilised modulation-coding formats and on the chunk sizes In transmission using multiple antennas the time-frequency resource defined by the chunk may be reused by spatial multiplexing A chunk layer represents the spatial dimen-sion (Figure 13 b)
The chunks and chunk layers are pre-assigned to different types of data flows on a super-frame time scale (Section 314 and Appendix C11) They are then used in a flexible way to optimise the transmission performance For example
bull The antenna resources can be used differently for different flows tofrom user terminals
bull Different users may use different variants of GMC as depicted in Figure 14 For example in uplinks power-constrained users may use single-carrier waveforms within their assigned transmission resources while other terminals use CP-OFDM A prerequisite for attaining both efficiency and flexibility is efficient synchronisation of all transmissions within a cell (Appendix B4)
The coming chapters will describe the concepts used to combine the desired flexibility with the equally desired high efficiency two goals that are often contradictory and challenging to combine
WINNER D210 v10
Page 28 (180)
Tchunk
BWch
unk
nsymb OFDM symbols
n sub
sub
- ca
rrie
rs
Chunk
Chunk
time frequ
ency
Layer 1 Layer 2
Layer 3 Layer 4
layer
a) b)
Figure 13 a) Multi-carrier downlink physical channel structure and chunks b) Chunk layers obtained by spatial reuse
tim e
O ne chunk
U se rs E F G H IF D M A
U se r C se ria l m o d u la tio n
U se r D se ria l m o d u la tio n
U se r A O F D M
U se r B O F D M
O ne sub-carrie r
Figure 14 Use of different variants of GMC modulation by different uplink users
14 Scope of this document The radio interface is embedded in the overall WINNER system concept which defines system layers services functional architecture and protocols as outlined above While [WIND76] focuses on the func-tional architecture of the WINNER system concept and [WIND35] describes protocols and deployment concepts the present report has another focus The design of the lower layers of the radio interface to enable high performance and a preliminary evaluation of the resulting performance
WINNER D210 v10
Page 29 (180)
2 Physical Layer The design of the physical layer implements several innovative features of the WINNER concept
bull A slotted time-frequency chunk pattern that can be adjusted to different propagation scenarios The chunk and frame durations are short which is a basic requirement for a low transmission delay over the radio interface
bull A transmission chain based on generalised multi-carrier (GMC) which enables flexible switching between multi-carrier modulation and (frequency-domain generated) serial modulation
bull A flexible spatial processing is integrated into the transmission and reception chains
bull A scattered pilot grid that supports efficient channel estimation also on chunk basis at very low overhead The cyclic prefix is used to achieve coarse intra-cell synchronisation Additionally training symbols at the beginning of the super-frame enable inter-cell synchronisation also in cases where no global timing reference (eg GPS) is available
bull Efficient means have been developed for compressing the channel quality information feedback required for adaptive transmission and the channel state information required for some multi-antenna schemes These methods reduce the required feedback overhead to reasonable levels
The purpose of this chapter is to present a concise summary of the current selection of technologies for different parts of the WINNER physical layer To provide the rationale behind this selection a detailed assessment is given in Appendix B (concept details) and Appendix F (simulation results) including a summary of the results from previous deliverables [WIND21 WIND22 WIND23 WIND24 WIND27]
21 Forward error correction Among the large number of possible options for forward error correction identified in [WIND21] three techniques have been identified as main candidates for the WINNER system [WIND23] convolutional codes (CC) parallel concatenated convolutional codes (PCCC Turbo Codes) and low-density parity-check codes (LDPCC) More specifically Duo-Binary Turbo-Codes (DBTC) and Block-LDPC Codes (BLDPCC) are able to provide excellent performance at medium to large block sizes (200 information bits and beyond) while taking implementation simplicity (eg parallelisation memory requirements) into account already in the code design phase BLDPCC outperform DBTC at large block lengths andor high code rates (for a detailed assessment please refer to Appendix B2) The use of convolutional codes is currently considered for block lengths below 200 information bits However DBTC show very good performance also in this regime so that CC might eventually not be needed to implement channel coding in the WINNER radio interface
Table B1 in Appendix B summarises the relative merits of the three candidate technologies with respect to the most relevant assessment criteria Details on the assessment can be found in [WIND23] and Appendix B2 Note that while the discussion on FEC schemes forms part of the PHY chapters coding in the WINNER system will be mainly implemented in the MAC system layer (MAC-2 sub-layer) as detailed in the Chapter 3 Only convolutional coding as a part of the (spatial) link adaptation within individual chunks will form part of the PHY system layer
In situations where the channel coding gain (using reasonable code rates eg 13 and above) is not suffi-cient to support reliable transmission additional spreading can be used to provide reasonable SINR values This avoids further decoding complexity as would be the case for low-rate channel codes It is however understood that this comes at the expense of lower achievable data rates
WINNER D210 v10
Page 30 (180)
22 Modulation and space-time-frequency processing
221 General resource allocation strategy The overriding principle for allocating the total available resources is to strive primarily for orthogonal use of time-frequency resources Non-orthogonality for example in the form of CDMA SDMA or contention-based signalling is allowed only within carefully prescribed subsets of the total resources designed to limit interference with other parts of the resource pool Furthermore some resources have to be reserved as guard bandsguard spaces to preserve the orthogonality Extension of the orthogonality from single cellssectors to clusters of neighbouring sectors can be done for example by
bull interference avoidance scheduling between cells or
bull joint (spatial) precoding (and detection) over sectors [SWW+04 LWZ04]
For the spatial dimension non-orthogonality is unavoidable spatial reuse of time-frequency resources will always create some interference The general time-frequency space transmission chain outlined in Appendix B1 provides means to tailor and control such interference as outlined in Appendix C17
222 Modulation technique Block signal processing in the frequency domain at both transmitter and receiver using efficient fast (inverse) Fourier transform (IFFTFFT) operations is a natural choice for future high bit rate wireless radio interfaces as signal processing complexity per data symbol rises only logarithmically with the channel delay spread [FK05] Furthermore frequency domain processing enables transmitters to easily and adaptively shape their spectrum occupancy in response to user data rate requirements user terminal capabilities and the availability of unoccupied spectrum It also enables flexible choice of bit rates modulation formats and multiple access schemes according to the current channel state and user need
The generalised multi-carrier (GMC) technique [WIND21 WIND23] will be used for modulation in WINNER as it is essential for providing the flexibility needed to fulfil the ldquoalways bestrdquo principle also on the physical layer It enables to accommodate a plurality of multi-carrier modulationmultiple access schemes such as different flavours of OFDM (CP-OFDM IOTA-OFDM PRP-OFDM) FMT and MC-CDMA as well as the following serial modulation schemes single carrier single carrier DS-CDMA and IFDMA This is done by selection of an appropriate mapping strategy (data symbols to subcarriers) guard interval design and (frequency domain) filtering The GMC approach is also extremely useful in generating multi-band signals for spectrum flexibility [WIND22]
A small set of the above stated modulation technique options will be sufficient to efficiently adapt the WINNER system to the most relevant deployment scenarios outlined in Appendix A1 This restriction will also keep the complexity of the WINNER radio interface in terms of implementation options at a reasonable level To enable the choice of appropriate techniques their relative merits have been thoroughly studied [WIND21 WIND22 WIND23] The results of this assessment work are summarised in Table B3 and the following options have been selected for use in the WINNER system
bull GMC configured as standard CP-OFDM
o for downlink transmission in the TDD and FDD modes
o for uplink transmission when terminal power consumption is not a limiting factor
bull GMC configured as serial modulation (DFT precoded CP-OFDM)
o for uplink transmission in the power limited wide-area case
The above specifications define only the modulation technique ndash the choice of appropriate multiple access schemes for the different modes is discussed in Chapter 3 For adaptive transmission chunk-based OFDMA will be used for non-frequency adaptive transmission MC-CDMA in conjunction with FDMATDMA is the preferred option while for the serially modulated uplink FDMATDMA is envisioned (eg DFT-precoded block OFDMA or IFDMA)
The specific parameterisation of these transmission techniques is governed by the physical channel conditions as outlined in [WIND23] Based on this methodology appropriate parameters have been selected and are summarised in Table 21 Non-differential M-QAM modulation (with BPSK as a special case) is proposed for the use in the WINNER system since channel state information can be made available to the receiver at relatively low pilot overhead in all scenarios as detailed in Section 23 For the wide-area scenario modulation formats up to 64-QAM are proposed while for short-range transmission
WINNER D210 v10
Page 31 (180)
even 256-QAM appears to be feasible Gray mapping is proposed as it is a natural choice for the bit labelling facilitating the calculation of soft output at the detector with low complexity The use of other labellings (in combination with a weaker outer code) is also under investigation in the context of iterative equalisation andor channel estimation
223 Modulation parameters The configuration presented below was used for investigations during the last part of WINNER Phase I Note that the real WINNER system will be required to support several different configurations (parameter sets) in order to effectively adapt to differing channel conditions and fulfil the ldquoalways-bestrdquo objective The parameters listed below are examples for such parameter settings which can be used to study the relative merits of different techniques They are however not claimed to be optimal and refined sets of parameters might be used for Phase II A framework for deriving appropriate parameter sets can be found in [WIND23] The range of reasonable values is much wider for the TDD mode than for the FDD mode where parameter ranges are more severely constrained by assumed channel delay spreads and vehicular velocities [WIND23] in the wide-area scenario All uplink transmissions are embedded in the super-frame and are assumed to be fine-synchronised The assumed centre frequencies are worst-case values The use of FFT sizes up to 2048 has been assumed to be reasonable from an implementation point of view
Table 21 Basic transmission parameters used for simulation of GMC based systems
Parameter FDD mode
(2times20 MHz)
TDD mode
Unitsnotes
Centre frequency 50 DL 42 UL 50 GHz
Duplexing method FDD (paired)
TDD
FFT BW 200 1000 MHz
Number of subcarriers in GMC 512 2048 Equals length of FFT
Subcarrier spacing 39062 48828 Hz
Symbol length
(Excluding cyclic prefix)
2560 2048 micros
Cyclic prefix length 320 128 micros
Total symbol length 2880 21763 micros
Number of subcarriers in use 416 1664 [-208208] and [-832832]
Subcarrier 0 not used
Signal BW 1625 8125 MHz
Chunk size in symbols 8times12 = 96 16times5 = 80 Subcarriers times Symbols
224 Transceiver structure Figure 21 and Figure 22 give a general overview of the envisaged structure for the transmitter and receiver in the WINNER system respectively The structure is the same for all cases of generalised multi-carrier transmission only requiring appropriate configuration for some components The user data is first segmented into flows which then are individually encoded segmented and mapped to chunks where modulation and space-time-frequency processing takes place (cf Appendix B1 for details) Afterwards the modulated chunks are assembled to raw (OFDM) symbols subjected to an IFFT the CP is added and the digital baseband data is finally forwarded to the RF processing
3 A small symbol roll-off time should be added to the OFDM symbol length to reduce the out-of-band power It is
here assumed to be included in the guard intervals
WINNER D210 v10
Page 32 (180)
For OFDM transmission the ldquoGMCrdquo preprocessing block in Figure 21 would only contain (optional) frequency domain filtering For serial modulation however it is necessary to subject the modulated symbols to a FFT prior to any frequency domain (spatial) processing ie modulation has to be done prior to the formation of chunks (spatial processing for single carrier transmission may also be done in the time domain) This operation will be done in the GMC processing block of Figure 21 a block of M modulated symbols that eventually will be turned into one or more chunks will be passed through an M-point FFT The M symbols are now in the frequency domain and are mapped into the specified chunk layers The remaining processing is equivalent to that for other GMC signals eg OFDM It should be emphasised that this approach somewhat reduces the flexibility of the system in the case of serial modulation as all chunks within one serially modulated block will have to undergo the same kind of spatial processing However as serial modulation is envisaged for uplink transmission from user terminals only it will anyway require only a quite basic configuration of the generic spatial processing chain described in detail in Appendix B1 so this limitation is not very severe
Figure 21 Overview of transmitter structure
The corresponding receiver structure is depicted in Figure 22 Optional feedback between soft-input soft-output decoder and space-time equaliser and channel estimator enable iterative detectionTurbo equalisation (TEQ) and iterative channel estimation (ICE) techniques detailed in [WIND21 WIND23] (cf also the results presented in Appendix F3) Serial modulation based transmission (frequency domain based single carrier as well as IFDMA) requires an IFFT in addition to the FFT in order to support frequency domain equalisation
IFFT CP
FECSub-flow
Segm
entation
Π
hellip
FEC Π
Substream
segmentation and chunk m
apping
Individually encoded flows
Chunk Layers
Pilot insertion
(scattered amp continuous pilots)
hellip
helliphellip
Assem
bly of chunks to raw sym
bol data
To
RF
Pilot insertion
(pilot symbols)
SP
GM
C
Modulation
Spatial processing (precoding dispersion etc)
Interleaving
Processing for generalised multi-carrier signals eg FFT for
frequency domain based serial modulation optional filtering
MOD
MOD
WINNER D210 v10
Page 33 (180)
Figure 22 Overview of receiver structure
225 Space-time-frequency processing Spatial processing provides performance gain via spatial diversity spatial multiplexing SDMA and enhanced interference management Spatial diversity adds reliability by transmitting multiple copies of the same data over (potentially) uncorrelated channels Therefore diversity efficiently copes with the detrimental effects of fading on the system performance On the other hand independent fading in a multi-antenna system can also be seen as a beneficial effect that can lead to a substantial increase of the achievable data rate by performing spatial multiplexing ie transmitting independent data over the uncorrelated spatial channels to one user terminal A significant contribution to high spectral efficiency is interference avoidance by spatial processing eg based on multi-user precoding at the transmitter in the downlink The use of beamforming (adaptive or non-adaptive) makes it possible to schedule multiple users on the same time-frequency resource (chunk) within a cell or across multiple cells and separate them by the SDMA properties of the multi-antenna channel When channel knowledge is available at the transmitter it is also possible to distribute complexity between transmitter and receiver in a very flexible manner Precoding techniques for example allow keeping receiver complexity low Note that although first investigations are based on traditional cell layouts with sector antennas precoding with distributed antennas (using a central processing unit and separated radio heads) is seen as a particular deployment form of the proposed WINNER multi-antenna concept that can be of additional benefit for the overall goal of an interference-avoidance radio interface concept
The WINNER multi-antenna concept is a generic architecture that aims at performing multi-user spatial domain link adaptation based on the following basic components (linear) dispersion codes directive transmission (beamforming) per stream rate control and multi-user precoding [WIND27 DAO05] This architecture allows fostering the spatial processing gains introduced above in flexible combinations as required by different scenarios ie different combinations of physical layer mode link direction transport channel type deployment propagation conditions cell load traffic type BS antenna configuration and terminal capabilities A generic spatial processing chain that implements the WINNER multi-antenna concept is detailed in Appendix B1
From
RF
STF-EQ
FFT CP
Segm
entation into chunks
DEC Π-1
DEC Π-1
Sub-flow
assembly
Chunk Layers
STF-EQ
helliphellip hellip
hellip
Channel estimation
In-band
pilots
Pilot
symbols
TEQ
ICE
Chunk dem
apping and substream assem
bly
GM
C
Space-Time-Frequency Demapping and Equalizing
Decoding
De-Interleaving
WINNER D210 v10
Page 34 (180)
23 Pilot grid design for channel estimation and synchronisation
231 Synchronisation For synchronisation we have to distinguish between coarse synchronisation (acquisition) where all other relevant system parameters are still unknown and fine synchronisation (tracking) where a previous coarse estimate is further improved and adapted to variations of eg the local oscillator Furthermore there are three quantities which have to be synchronised in an OFDM system
bull OFDM symbol and frame timing
bull Carrier frequency
bull Sampling rate
The choice of an appropriate synchronisation strategy for the radio interface is based on several criteria
bull Robustness expressed in the lock in probability ie the probability of successful acquisition
bull Residual synchronisation offsets in the steady state
bull Time required to achieve synchronisation
bull Required overhead
With respect to synchronisation the scenarios in which the WINNER radio interface is to operate can be distinguished as follows
bull Hot spot mainly indoor environment with no significant interference from adjacent BSs
bull Wireless network with global reference time All BSs operate synchronised governed by a global reference clock which may be provided by the Global Positioning System (GPS) or the European Satellite Navigation System (Galileo)
bull Synchronised wireless network without timing reference If no global timing reference is available synchronisation of the network can be achieved in a self-organised way Since coordinated operation of a wireless network essentially requires BSs to be synchronised it is generally believed that the attainable system capacity of a synchronised wireless network exceeds a non-synchronised network
bull Uncoordinated wireless network BSs operate non-synchronised In this case the UT needs to be able to distinguish between several signals in order to identify the closest BS
For synchronisation purposes different types of pilots are foreseen for the WINNER system concept
bull Two sets of training symbols (uplink and downlink) consisting of three OFDM symbols are included in the super-frame preamble for self organised inter- and intra-cell synchronisation The structure of the training symbols and the related synchronisation algorithms are described in Appendix B41
bull Continual pilot subcarriers (or tones) They may serve various purposes such as phase noise compensation tracking of carrier and sampling frequency offset (see [WIND23] Section 6252) In combination with cyclic prefix based synchronisation differential modulation of the pilot tones allows establishing frame synchronisation as well as to detect frequency offsets of a multiple of the subcarrier spacing [SFF+99]
Within the WINNER framework a synchronisation concept that can synchronise a wireless network in a self-organised way has been identified in [WIND21] The algorithm relies on dedicated set of training symbols inserted in the super frame preamble In Appendix B41 its basic principles are summarised and some enhancements are presented Simulation results reported in [WIND23] show that both frequency and time synchronisation of all BSs within the cellular network can be achieved after 20 super-frames with remaining frequency offset of about 1 of the subcarrier spacing and time offset of about 10 of the guard interval respectively Since the duration of one super-frame is 8x12 and 8x30 OFDM symbols for the WINNER FDD and TDD modes respectively the time to synchronise for this algorithm totals to about 110 ms for 20 super-frames which may be too long for some applications
For hot spots or for networks with access to a global timing reference synchronisation utilizing the cyclic prefix in combination with continual pilot tones is considered to be an appropriate choice [WIND21 WIND23] This approach is in particular attractive for OFDM systems with a large number of subcarriers in terms of pilot overhead and performance [BBB+99] It is demonstrated in Appendix F41 that reliable
WINNER D210 v10
Page 35 (180)
acquisition can be achieved within 12 OFDM symbols at SNR gt -4 dB Furthermore a scattered pilot grid predominantly used for channel estimation (see Appendix B42) can be used to achieve acquisition in a non-synchronised wireless network However numerical results in Appendix F41 suggest that the carrier frequency offset must not exceed half of the subcarrier spacing for this algorithm to work
A timing advance strategy which compensates for the propagation delays between signals transmitted from UTs to their assigned BS during uplink is proposed in Appendix B41 The proposed ranging process enables the UTs to estimate the propagation delays of their signals by utilising individual synchronisation tones This information is subsequently used for a time advanced transmission during uplink providing a time aligned arrival of different usersrsquo signals at the BS If the synchronisation tones are retransmitted by the UTs after the ranging process is finished they may further be used for a fine estimation of the carrier frequency offset at the BS
232 Channel estimation For channel estimation purposes the following types of pilots are foreseen
bull A scattered pilot grid is used for OFDM channel estimation and channel prediction For the pilot grids presented in B42 the pilot overhead is 25 and 4 per spatial stream for the WINNER TDD and FDD mode respectively In Appendix F41 it is shown that a scattered pilot grid could also be utilised for acquisition in a non-synchronised wireless network
bull In OFDM uplinks that use adaptive transmission channels from many users have to be estimated and predicted in each chunk Methods based on simultaneous pilot transmission from all candidate terminals (overlapping pilots) can then be used to limit the pilot overhead fraction in the uplink [WIND24]
bull For uplink (frequency domain generated) serial modulation pilot patterns may be generated in the frequency domain in either of two ways The first way is to use a scattered pilot grid equivalent to OFDM Alternatively pilot patterns for serial modulation in the uplink may be generated in the time domain in the form of short training blocks time-multiplexed with data blocks Both techniques are described in Appendices B42 and F31 respectively
For multi-antenna transmission a combination of dedicated pilots per flow common pilots per cellsector common pilots per antenna and common pilots per beam are required as described in Appendix B42 Interference estimates per chunk layer or averaged over chunk layers may be obtained as by-products of the pilot-based channel estimation The residual ie the signal component that cannot be explained through the known pilots and the channel model is used as interference estimate
Channel estimation by interpolation in time and frequency based on a scattered pilot grid is considered to be an efficient solution for an OFDM-based radio interface [WIND21 WIND23] In Appendix B42 a generic framework for the pilot design of GMC signals is described To this end a scattered pilot grid is applicable to any GMC signal Alternatively short time domain training symbols can be implemented for single carrier signals on the uplink
During the start of communication interpolation techniques with limited information about the channel conditions must be used An unbiased channel estimation scheme which does not require any information about the channel statistics is proposed and evaluated in Appendix F34 A robust interpolation filter which only assumes knowledge about the CP duration and the maximum velocity expected in a certain environment is another possible choice cf results in [WIND23] and Appendix F32 During operation statistical knowledge about the power delay profile and the Doppler spectrum is accumulated Channel interpolation utilizing this knowledge can improve performance significantly (see Appendix F33)
Especially in case of dedicated pilots purely pilot aided techniques may have severe limitations Conventional channel estimation by interpolation may then require a pilot boost andor a significant degree of over-sampling Advanced solutions such as iterative channel estimation aim to make a pilot boost redundant at the expense of increased complexity cf results in [WIND23] and Appendix F32 If an iterative receiver structure is already in place iterative channel estimation offers a good compromise between performance and complexity
Adaptive transmission requires channel prediction for use in the resource allocation Channel prediction can be based on common pilot symbols that are also used for other purposes It should utilise the channel correlation in time and frequency In Appendix B52 the results obtained by using Kalman state-space algorithms in the frequency domain for prediction are outlined Similar results are obtained with time-domain extrapolation of channel taps With these methods adaptive transmission becomes possible in the WINNER system at vehicular velocities The channel prediction accuracy estimates (covariances) are furthermore important inputs in the design of the link adaptation and resource scheduling schemes
WINNER D210 v10
Page 36 (180)
3 Medium Access Control (MAC) Layer The WINNER medium access control (MAC) system layer is designed as three MACs (modes)
bull FDD cellular MAC including multiple-access multi-hop and multi-antenna aspects
bull TDD cellular MAC including multiple-access multi-hop and multi-antenna aspects
bull MAC for peer-to-peer transmission at present based on the TDD physical layer mode
The first two have a largely identical design and are described briefly in the section below with additional details in Appendix C1 See also [WIND76] The peer-to-peer MAC is outlined in Section 32 with further details in Appendix C2
31 Medium access control for FDD and TDD cellular transmission
311 Goals and design principles The cellular MAC design supports and enables several innovative features of the WINNER system
bull The super-frame is designed with pilots that support self-organised synchronisation of all involved base stations relay nodes and user-terminals Having a synchronised network enables an improved spectral efficiency in two ways it makes large guard-bands unnecessary and simplifies interference-avoidance scheduling between cells and relay nodes
bull MACs for FDD and TDD cellular transmission support fast transmission and very low re-transmission delays over the RI These properties are key to attaining high spectral efficiency via adaptive schemes [WIND24] reliable communication through efficient re-transmission and high data rates for TCPIP traffic
bull Adaptive transmission is integrated into the design on all time scales Up to moderate vehicular velocities link adaptation and scheduling can be performed with fine granularity in the frequency domain (OFDMATDMA) This provides multi-user scheduling gains for mobile as well as stationary terminals For higher velocities the transmission only adapts to the path loss and shadow fading On a super-frame time scale the resource partitioning can adapt to the traffic demand over different transport channels
bull Multi-antenna transmission can be adjusted in a very flexible way per flow to obtain an appropriate balance between different objectives Obtaining multiplexing gains to boost throughput achieving robustness via diversity transmission and obtaining SDMA gains by transmitting flows to different user terminals over different spatial channels
bull Operation in spectrum shared with other operators who all use the same physical-layer WINNER mode [WIND63] will be an integral part of the design Operation in dedicated bands is seen as a special case of this situation Such single-system shared spectrum use has the potential of both improving the flexibility and simultaneously increasing the throughputspectral efficiency
bull The super-frame and the resource partitioning are designed to work efficiently in conjunction with inter-cell interference-avoidance schemes They are also designed for relay-enhanced cells so that base stations and a set of relay nodes can share the total spectral resources efficiently
In the design of the adaptive transmission system the different reaction times and control time scales of various control functions have been an important guiding principle The slower control functions have been placed as RRM functions in the control plane of the RLC system layer (see Appendix D1) The faster control functions are located in the MAC control plane while the fastest ones which directly control data flows are located in the MAC user plane To minimise transmission time delays due to communication between nodes a complete MAC layer is assumed to be implemented at each base station (BS) and at each relay node (RN) Thus all antenna resources belonging to a BS or a RN can be controlled tightly by the MAC system layer Cooperative multi-antenna transmission and distributed antenna systems are supported when all antennas are regarded as encompassing one BSRN
312 Control of relay-enhanced cells The MAC system layer is designed to work in relay-enhanced cells (REC) in which a set of nodes (RNs or BS) are linked to each other over the air (Nodes here refer to logical nodes cf [WIND35]) The BS but not the RNs has a fixed connection to the RAN The RNs may be used for improving the coverage
WINNER D210 v10
Page 37 (180)
within the cell or for extending the range of the cell Each RN is connected to one but not more BSs Some or all UTs may communicate directly with the BS If RNs are present some UTs may transmit toreceive from these RNs The MAC implemented in each RN controls those transmissions Thus the RNs essentially control separate sub-cells The MAC system layer controls flows over a single hop Flow QoS control over links spanning multiple hops is the responsibility of the RLC layer
While both heterogeneous and homogenous relaying is under consideration the cellular MAC design has focused on the more challenging case of homogenous relaying where RNs and BS use the same PLM and share spectral resources The total time-frequency resources are partitioned into parts used by the BS shared parts and parts used by RNs This partitioning is computed by RRM functions at a central location in cooperation with the MAC that is implemented at the BS It is then signalled to all RNs and UTs
313 The MAC services and tasks The MAC system layer for FDD and the TDD cellular transmission has a MAC protocol implemented in its user plane It also contains resource allocation and planning functions in its control plane It should provide the following services to the RLC system layer
bull Radio packet transfer ie transmission and reception over the radio interface of packets belonging to any of the transport channels defined below
bull MAC radio-resource control ie acceptance and execution of control messages
bull MAC control feedback ie messaging from MAC to RLC that supports the flow control the QoS control and the spectrum assignment and other functions at the RLC system layer
The WINNER transport channels are defined as being the interfaces between the RLC protocol layer (in the RLC system layer user plane) and the MAC protocol layer (in the MAC system layer user plane) They define the basic types of radio-packet transfer that are provided
bull Broadcast channel (BCH) for broadcasting system information from RLC and higher layers to all terminals inside the coverage area of the cell
bull Contention-based random access channel (RAC) for initial access to a BS or RN and also for BS-to-BS control signalling in the TDD mode
bull Contention-based direct access channel (DAC) for contention-based uplink data transfer
bull Common data channel (CDC) for scheduled point-to-multipoint communication
bull Targeted data channel (TDC) for scheduled point-to-point communication
bull Targeted control channel (TCC) for control-plane generated control messages
MAC flow control and resource allocation is performed two time scales That of the slot (half frame) and that of the super-frame (Section 314 below)4
bull Time-frequency resource partitioning and spatial scheme control is planned on a time scale of the super-frame (5ndash10 ms) The allocation to different transport channels is adjusted on this time scale based on the aggregated demand within each transport channel Unused chunks enable flexible spectrum use between WINNER operatorsusers and adaptive interference avoidance between neighbouring cells and parts of cells
bull Resource scheduling (RS) is performed on the time scale of the slot (034 ms) The scheduled flows are allocated to time-frequency-spatial resources in one of two ways Adaptive RS utilises the frequency-selective fading This requires processing of CSICQI feedback from the PHY layer Non-frequency adaptive RS uses a diversity-based transmission within the frame
Adaptive resource scheduling and support for adaptive transmission is a major feature of the design discussed further in Appendix C16 Detailed transmission schemes for adaptive transmission in both FDD and TDD modes have been presented in Section 31 of [WIND24] Key enabling features are here the use of chunks of appropriate granularity the use of in-frame control signalling to obtain tight feedback loops the use of channel prediction to enable adaptive transmission at vehicular velocities (Appendix B52) and appropriate schemes for compressing feedback information (Appendix B53) 4 We say that a function in a certain system layer works on a given time scale if the reaction time on a control
message need not be smaller than the time indicated by the time scale Thus the required adaptation speed of a given function that is distributed among different physical nodes is given by this time scale
WINNER D210 v10
Page 38 (180)
314 The chunk slot frame and super-frame structure As outlined in Section 1322 the basic time-frequency unit for resource allocation is the chunk During the later part of WINNER Phase I the transmission parameter examples outlined in Table 21 have been used for simulation purposes In the FDD physical layer modes chunks then comprise 8 subcarriers by 12 OFDM symbols or 3125 kHz times 3456 micros In the TDD physical layer mode the chunk dimension is 16 subcarriers by 5 OFDM symbols or 78125 kHz times 1080 micros Using the parameter sets of Table 21 an FDD downlinkuplink with 20 MHz FFT bandwidth is divided into 52 chunks on the 1625 MHz signal bandwidth A 40 MHz FFT bandwidth accommodates 104 chunks The TDD PLM with 100 MHz FFT bandwidth has 104 chunks on 8125 MHz signal bandwidth Please see Appendix C3 for a discussion on chunk dimensioning 5
The chunks are organised into frames In the TDD mode each frame consists of a downlink transmission interval followed by an uplink transmission interval denoted slots or time-slots In FDD the frame is also split into two slots Half-duplex terminals may be separated into two groups where one group has downlink transmission in the first slot and transmits in uplinks in the other while the other group uses the opposite scheme (Appendix C12) FDD base stations use full duplex
The frame duration has been set equal in the two PLMs to facilitate inter-mode cooperation With a frame duration of 6912 micros an FDD frame consists of two chunk durations with one chunk per slot A TDD frame consists of in total 6 chunks and two duplex guard intervals organised into a downlink slot and an uplink slot With downlink-uplink asymmetry 11 the TDD slot thus consists of three downlink chunks followed by three uplink chunks See the figure below The asymmetry ration could be varied from 51 to 15 but to provide sufficient time for signalling and scheduling calculations during the uplink slot in adaptive transmission it should not be set larger than 21
The super-frame (SF) is a time-frequency unit that contains pre-specified resources for all transport channels Figure 32 illustrates its preliminary design comprising of a preamble followed by nf frames Here nf = 8 resulting in super-frames of approximate duration 56 ms (It could be extended to eg 16 frames if required) The available number of chunks in the frequency direction could vary with the geographical location It is assumed that for the FDD DL and UL as well as for TDD there exist frequency bands that are available everywhere The preamble is transmitted in those commonly available bands The remainder of the super-frame may use other spectral areas that are available at some locations or to some operators but not to others All of these spectral areas are spanned by one FFT at the receiver and are at present assumed to span at most 100 MHz
Duplex guard time 192 micros
7812 KHz
03456 ms for 11 asymmetry
03456 ms chunk duration
15 OFDM symbols 12 OFDM symbols
Time Time
f f
8 subcarriers
16 subcarriers
20 MHz and 40 MHz FDD mode
100 MHz TDD mode
96 symbols 80 symb 3125 KHz
80 symb 80 symb
Figure 31 Summary of assumed chunk sizes in the two physical layer modes The figures show a slot (half of the frame) in each case assuming 11 TDD asymmetry
5 Note that the dimensions used here differ from the ones assumed in earlier deliverables such as [WIND24] in two
ways 1) The FDD chunk width in frequency has been doubled since the earlier narrower size contained few symbols and thus incurred a higher pilot and control overhead 2) In the TDD mode the chunks have been made shorter The TDD frame now contains six instead of two chunks This enables terminals to concentrate their transmission and reception in time and go into short power saving micro-sleep intervals in-between
WINNER D210 v10
Page 39 (180)
The subsequent main part of the super-frame is shared by the contention-based direct access channel (DAC) the scheduled data channels CDC and TDC and their related control signalling It also contains time-frequency-spatial resources that are not to be used due to interference avoidance constraints The resource partitioning (allocation) is performed in terms of chunks It is performed on a super-frame basis but it may be changed between super-frames The DAC resource is used both for the DAC channel and for the peer-to-peer transmission described in Section 32 below It is organised as a constant set of frequencies over the whole super-frame to enable the use of carrier-sense multiple access contention based transmission The resource partitioning is described in more detail in Appendix C11
RA
C (U
LD
L)D
L S
ynch
UL
Syn
ch
BC
H (D
L)
Freq
uenc
yFull System
Ban dw
idth
1664
Sub
-Car
riers
= 10
4 C
hunk
s
Figure 32 WINNER MAC super-frame example consisting of 8 TDD frames with asymmetry 11 a preamble and the DAC for contention based peer-to-peer communication The frame for TDD
cellular transmission with its chunk-based substructure has been enlarged
The super-frame is synchronous in all BS and RN In the FDD mode one super-frame is of course required in each of the paired bands The preamble has the following structure
bull At the beginning of each super-frame there are two synchronisation slots Self-organising synchronisation of terminals and network nodes as described in [WIND23] and Appendix B41 can be used on a super-frame basis by this design In the second slot each base stationrelay node transmits on four OFDM symbols The first the T-pilot is used for coarse synchronisation In the remaining three symbols each BS transmits on two adjacent subcarriers with the others set to zero On reception they are used for updating the UT synchronisations The first slot of three OFDM symbols the next super-frame is the uplink synchronisation slot Here all terminals transmit on the two adjacent subcarriers that were received strongest ie those that were used by the BSRN closest to them This part of the iteration is used for self-organizing synchronisation of the base stations and relay nodes which receive uplink synchronisation symbols from terminals at other BS that in turn synchronise to those BS In the FDD mode the UL synch slot is in the UL super-frame and the DL synch slot is in the DL super-frame
bull In-between these synchronisation slots a short timeslot over the whole band is reserved for the contention-based random access channel (RAC) plus a guard time This channel enables initial access to a BS or RN Placing the RAC and its guard time in-between the synchronisation slots gives the RAP sufficient time to process the uplink synch signal and adjust its synchronisation before transmitting the downlink synchronisation signal The RAC time-slot is in TDD system modes also used for BS-to-BS and RN-to-BS over-the-air control signalling
bull Subsequently a set of OFDM symbols carries the downlink preamble control transmission It contains the broadcast control channel (BCH) messages from the RLC layer It also contains a control message that specifies the overall resource allocation used within this super-frame
WINNER D210 v10
Page 40 (180)
315 Overview of main functions
MAC Services Control plane
interface
PHY Services
MAC Control
Feedback
MAC Radio Resource Control
Special Transmit Control
Signalling
PHY Measure-
ments
Constraint Processor
Flow State Controller
Spatial Scheme Controller
Resource Partitioning
Resource Scheduler (RS)
Non-frequency adaptive resource
scheduling
Adaptive resource sched
MAC CONTROL PLANE
Space-time-frequency link adaptation and scheduling
Queue state control
Transfer control Control of MAC-5 - MAC-1 protocols
Pre-config
Spatial scheme Selection
Constraint combining
Spectrum assignment negotiation support
RN assigment
DAC a ssignm
TDC adaptive assigment
MAC USER PLANE
Flow setup
Flow term
Calibration
Measure- ments
Non- frequency adaptive Transfer
BCH SF Control Tr
Transmit control proc (+ protocols)
Measurement proc (+ protocols)
Figure 33 FDD and TDD cellular MAC control functions Services and main function blocks
The MAC layer is subdivided into a control plane and a user plane The PHY layer is not subdivided in that way as all essential control functions for the physical layer reside in the MAC The main MAC control function blocks are illustrated in Figure 33 Control functions that directly control packet transmission on a slot time scale reside in the user plane Slower functions reside in the control plane
bull Resource partitioning Partitions the super-frame into sets used for adaptive non-frequency adaptive and DAC transmission as well as into chunks reserved for use by RNs BS-to-RN relay links and as guards for interference avoidance with respect to other cells and operators
bull Spatial scheme control The appropriate spatial transmit scheme is determined for each flow and it is held fixed within a super-frame It is influenced by many parameters including PLM deployment transport channel type cell load traffic type BS antenna configuration terminal capabilities propagation channel and interference conditions Further support functions related to spatial processing like calibration are invoked if required
bull Flow setup and termination performs flow context establishment and release over one hop supervised by the RRM flow establishment and release functionalities in the RLC system layer
bull Constraint processor Combines constraints on the use of chunks and chunk layers These arise from interference between user terminals interference avoidance scheduling with neighbouring cells and spectrum sharing between operators The output is in the form of chunk masks that define restricted use of a super-framersquos chunks The constraint processor also processes measurements that support the RRM spectrum assignmentnegotiation at the RLC system layer
bull Flow state controller Controls the segmentation and FEC codingdecoding of packets and monitors the states of RS queues It also controls the activesemi-activepassive state of flows
bull Resource scheduler (RS) Includes adaptive and non-frequency adaptive scheduling algorithms and control of spatial link adaptation Power control in both uplinks and downlinks is performed under the control of the resource scheduler and is integrated into the optimisation of the transmission parameters The MAC RS cooperates with the RLS layer flow scheduler Sect 41
WINNER D210 v10
Page 41 (180)
MAC Services User plane interface
PHY Services
Radio Packet
Transfer
Radio Packet
Transfer
Adaptive Transfer
BCH SF Control Tr
Adaptive Transfer
RAC Transfer
DAC Transfer
Non-frequency Adaptive Transfer
Non- frequency adaptive Transfer
DAC Transfer
(MAC-4) Add CRC
RTU
Per-flow queuing of FEC blocks
in RSB
(MAC-3) Optional segmentation
Encoding block
(MAC-2) FEC coding FEC block
(MAC-4) CRC check ACKNACK
Soft combining at received
retransmission
(MAC-5) Reassembly of MAC SDU
(MAC-2) De-interleaving
and FEC decoding
Resource Mapping
Map on chunk layers for adaptive transmission
Map on set of chunk layers for non-frequency adaptive transmission
Map on resources reserved for DAC
Map BCH packets into SF preamble symbols
BCH RAC
BCH (in UT) RAC
TDC DAC CDC (in UT)
MAC USER PLANE Transmitting MAC entity
Receiving MAC entity
DAC
(MAC-5) Optional
segmentation TDC
TDC CDC
BCH SF Control Tr
RAC Transfer
(MAC-3) Reassembly
of enc blocks
TDC CDC DAC
TDC CDC DAC
BCH
RAC
SLC Cache (per-flow queues)
Figure 34 FDD and TDD cellular MAC User-plane services and packet processing
The data flows in the user plane shown in Figure 34 are processed by three groups of functions
bull Transmission Segmentation encoding and buffering The flow state controller supervises this sequence Protocol sub-layers MAC-1ndashMAC-5 control the transmission and are parameterised to describe the different retransmission options (HARQ) A MAC SDU is drained from the SLC Cache TDC or DAC packets may be retransmitted Retransmission can be an option also for CDC point-to-multipoint flows The TDC CDC or DAC packet is optionally segmented A CRC sequence is added resulting in a Retransmission unit (RTU) The RTU may optionally be segmented into encoding blocks that are encoded separately Coding and interleaving results in FEC blocks which are buffered in the RS buffer on the transmitter side in one or several queues per flow There they remain until acknowledged or dropped BCH and RAC-packets are transmitted in the super-frame preamble without retransmission
bull Resource mapping At transmission bits from TDC flows are mapped either on chunks reserved for adaptive transmission or on the sets of chunks intended for non-frequency adaptive transmission CDC (multicast) flows should use non-frequency adaptive transmission DAC packets are mapped on the contention-based physical channel For TDC and CDC puncturing of the buffered FEC block may be performed and only a part of a FEC block may be transmitted in a scheduling round that comprises a time-slot
bull Reception Decoding and reassembly The flow state controller supervises the reception De-interleaving and FEC decoding is first performed for received FEC blocks belonging to TDC CDC or DAC packets followed by the (optional) re-assembly of the RTU Then the retransmission unit is optionally checked for transmission errors and a retransmission may be requested The MAC SDU is finally re-assembled BCH and RAC packets are received separately in the super-frame preamble and then decoded
WINNER D210 v10
Page 42 (180)
316 Resource mapping and multiple access In [WIND26] different multiple access (MA) techniques were assessed for multi-carrier as well as for single-carrier transmission Subsequently a set of schemes has been selected as baseline choices for use within the WINNER system Several of the initially considered schemes turned out to useful The key distinguishing feature for selecting MA scheme turned out to be not the deployment scenario but instead the use of adaptive or non-frequency adaptive transmission which place different demands on the utilised resources The multiple access schemes will therefore differ for different flows Flows scheduled for adaptive and non-frequency adaptive transmissions are mapped onto the separate sets of chunks earmarked for these two purposes by the SF resource partitioning (Figure 35) The mappings use different MA schemes
bull Adaptive transmission (DLUL) uses chunk-based TDMAOFDMA Flows are mapped onto individual chunk layers with individual link adaptation per chunk layer The mapping is exclusive within the cells ie each chunk layer carries data from only one flow
Chunks are designed to work well for adaptive transmission See Appendix C3 for a background on the reasoning used for dimensioning the chunk sizes In a non-frequency adaptive transmission that is based on channel averaging there would be a problem in attaining sufficient frequency diversity when transmitting small packets when the packets are mapped directly onto chunks A small RTU or control packet may fill only one chunk Two schemes that increase the diversity significantly are selected
bull In non-frequency adaptive downlinks MC-CDMA is used within the assigned set of chunks In the downlink spreading may thus be used to code-multiplex the flows onto sets of chunks assigned for non-frequency adaptive transmission When code multiplexing is used spreading is performed only within chunks to minimise non-orthogonality of the received signals Orthogonal signalling (TDMA per OFDM symbol or FDMAIFDMA per subcarrier without code-multiplexing) are special cases of the scheme They may be used when appropriate
bull In non-frequency adaptive uplinks TDMAOFDMA is used on an OFDM symbol basis For non-frequency adaptive transmission in the uplink code multiplexing is not used to avoid the need for multi-user detection Instead TDMA is used on an OFDM symbol basis Several uplink flows with small FEC blocks may share one OFDM symbol (OFDMA) to improve the rate matching (Figure 35 middle part) Either OFDM or frequency-domain generated serial modulation can be used in the uplinks
Compared to chunk-based OFDMATDMA these schemes provide increased frequency diversity and resources of shorter duration The shorter time duration (mapping on individual OFDM symbolsGMC slots) provides increased opportunities for terminals to go into power-saving micro-sleep intervals
Time Time Time
FDMA TDMA MC-CDMA
Frequency
Frequency
Frequency Chunk for for non-frequency adaptive transmission
Chunk for adaptive transmission
Mappings for one flow
Figure 35 Illustration of the mapping of one flow on the chunks earmarked for non-frequency adaptive transmission when using FDMA TDMA or MC-CDMA within the set of chunks
The selected multiple access schemes have been evaluated and compared to several alternatives in Appendix G A summary of relevant results is given below and an additional discussion can be found in Section 533
WINNER D210 v10
Page 43 (180)
For the case of adaptive transmission a gain was not surprisingly found when concentrating the transmitted packets to individual chunks instead of spreading them out over the slot Spreading them out over all frequencies by eg MC-CDMA or TDMA would average away the channel variability Lowering the cannel variability reduces potential multi-user scheduling gain In Appendix G41 (single-carrier) TDMA that allocates the whole 20 MHz band to only one user is found to result in a reduced multi-user scheduling gain See also Section 3153 in [WIND24] where OFMD-based TDMA was compared to TDMAOFDMA
The chunk sizes have been designed to be appropriate for the transmission scenarios used with reasonably flat channels within chunks Therefore as shown in Appendix G43 very little can be gained by sharing chunk layers between flows if the throughput is to be maximised As shown in Appendix G14 and Section 33 of [WIND24] chunk sharing can be of advantage in a special case There are many flows that have the very strict delay requirements and a guaranteed throughput in each slot (034 ms) While such delay constraints are extreme for user data they are applicable for retransmissions and for time-critical control information Appropriate transmission schemes for these will be studied in WINNER II
For non-frequency adaptive transmission G42 illustrates the improved performance obtained by paritioning the transmission over a set of resources whose channels have high diversity As noted above different methods can be used MC-CDMA symbol-based TDMA or subcarrier-based OFDMA The performance differences between them were investigated and were found to be rather small Of these schemes MC-CDMA provides the highest diversity In Appendix G11 it is concluded that MC-CDMA outperformed OFDMA in terms of cell throughput for all considered loads and scheduling algorithms In Appendix G12 MC-CDMA provides some advantage while in Appendix G13 OFDMA is found to provide slightly superior performance Explanations for these differences are discussed in Section 533
None of the so far performed investigations added the effect of spatial diversity schemes It can be expected that the additional use of spatial diversity will lessen the requirement for frequency diversity This would simplify the resource partitioning problem (Appendix C11) that includes selecting appropriate sets of chunks for adaptive and non-frequency adaptive transmission
32 Medium access control for peer-to-peer transmission The WINNER system supports peer-to-peer (P2P) and peer-to-multi-peer (PMP) transmission between user terminals under the control of a master device as illustrated in Figure 36 The role of the master will be taken by the base station while the terminals act as slaves All user terminals participating in the peer-to-peer communication are synchronised in time to the masterrsquos clock and use the contention-based direct access channel (DAC) to exchange user data with their peers and control information with the master In the absence of a BS a user terminal can also take on the master responsibility if it is equipped with some additional network management functions
Figure 36 Network topologies for peer-to-peer communication
321 MAC architecture for P2P transmission In the WINNER system peer-to-peer transmission between user terminals is at present designed to be provided by the TDD physical layer mode Other alternatives will be considered at later stages In Section
BS
UT
UT
UT
UT
control
data
UT
UT
P2P
PMP
BS
UTUT
UTUT
UTUT
UTUT
control
data
control
data
UTUT
UTUT
P2P
PMP
WINNER D210 v10
Page 44 (180)
31 and Appendix C1 a MAC is specified for controlling this physical layer in cellular deployment scenarios Although it supports the exchange of user data between UTs via a base station it does not allow the direct data transfer between terminals To enable P2P communication some new services and functions have to be added to the control- and user-plane of the basic TDD cellular MAC (see Figure 37)
The MAC layer services for P2P transmission are integral part of the radio_resource_control and radio_packet_transfer service The P2P-specific services are provided to higher layers at the MAC_P2P_CONTROL and MAC_P2P_USER service access point (SAP)
The MAC layer services are implemented by adding P2P-specific protocol functions to the main function blocks of the TDD cellular MAC In the control plane of the MAC the resource partitioning unit has to comprise the DAC assignment function for controlling the allocation and release of radio resources The flow setup and termination unit is extended with functions required to setup and terminate P2P data flows over the DAC These include functions for transmitting and receiving DAC-specific broadcast control information attaching and detaching UTs to the service provided by the P2P-DAC and setting-up and terminating synchronous P2P-flows between UTs In the flow state controller functions are provided for controlling the transmission and reception of radio packets over the DAC The control of packet segmentation FEC coding and retransmission is executed by these functions The flow state controller also contains functions required to give UTs random access to the P2P-DAC for transmitting control messages to the BS and exchanging P2P data in a contention-based manner between peer terminals In the user plane of the MAC additional functions are provided to multiplex control information and user data onto the DAC and to extract control information and user data from a received decoded radio packet Note that other MAC functions not directly related to the P2P-DAC service are not shown in Figure 37
322 Frame structure of DAC for P2P transmission The direct access channel is embedded into the super-frame structure of the TDD physical layer mode as shown in Figure 32 Successive DAC frames are thus always separated by a preamble that is used to keep time synchronisation between the master and all user terminals involved in P2P transmission
As shown in Figure 38 a DAC frame is further subdivided in three parts namely the control period the contention-access period and the guaranteed-access period The length of the control period is given by the duration of a TDD DLUL frame of a scheduled targetcommon data channel (TDCCDC) The length of each access period takes on a multiple value of the basic time slot size of 03452 ms and may dynamically change from super-frame to super-frame
bull The control period (CTP) is composed of two time slots for exchanging MAC control information between the BS and UTs The first slot is formatted such that firstly beacon frames
Figure 37 MAC services and functions for peer-to-peer transmission
RadioResourceControl
RadioPacket
Transfer
MAC_P2P_CONTROL SAP MAC_P2P_USER SAP
Control Plane User Plane
segmen-tation
DAC Transfer
add CRC for retrans-
mission
FEC coding
resource mapping to
DAC
reassembly
FEC decoding
multiplex to DAC frame
retrans-mission
de-multiplex from DAC
frame
Resource Partitioning
DAC assignment
DAC P2P Flow Setup and Termination
P2P-DAC beacon control
attach detach to P2P-DAC
setupterminatesynchronous
P2P-flow
Flow State Controller
P2P-DAC transfer control
P2P-DACchannel
access control
MAC-P2P Services
MAC-P2P Functions
PHY Services
RadioResourceControl
RadioPacket
Transfer
MAC_P2P_CONTROL SAP MAC_P2P_USER SAP
Control Plane User Plane
segmen-tation
DAC Transfer
add CRC for retrans-
mission
FEC coding
resource mapping to
DAC
reassembly
FEC decoding
multiplex to DAC frame
retrans-mission
de-multiplex from DAC
frame
Resource Partitioning
DAC assignment
DAC P2P Flow Setup and Termination
P2P-DAC beacon control
attach detach to P2P-DAC
setupterminatesynchronous
P2P-flow
Flow State Controller
P2P-DAC transfer control
P2P-DACchannel
access control
MAC-P2P Services
MAC-P2P Functions
PHY Services
WINNER D210 v10
Page 45 (180)
can be broadcasted from the BS to the UTs to announce the format of the current DAC frame and to communicate management information to the terminals and secondly send DL MAC commands from the BS to a dedicated user terminal In the second time slot user terminals can send UL commands to the BS and exchange MAC protocol messages with peers Random channel access for the involved terminals is provided by using a time-slotted ALOHA protocol
bull The contention-access period (CAP) may be used to asynchronously transmit protocol messages andor small amount of user data peer-to-peer between user terminals Since several UTs can simultaneously access the CAP the possible contention for medium access is resolved by using a carrier sense multiple access protocol with collision avoidance (CSMA-CA)
bull The guaranteed-access period (GAP) consists of time slots of fixed length and is used for asynchronous and synchronous P2P transmission between user terminals Channel access in the GAP of the DAC frame is based on a TDMA method in which one or several time slots can be allocated to two or more UTs for peer-to-peer communication For synchronous transmission time slots are allocated to the UTs on a regular basis in successive DAC frames without limit in time while for asynchronous transmission a sequence of consecutive time slots is allocated to start at any arbitrary time instant the transfer of a fixed amount of data The time slot allocations in the current DAC frame and their usage are broadcasted in the beacon field of the control period
Figure 38 DAC frame structure for peer-to-peer transmission
8 TDD frames = 8 x 06912 ms = 553 ms
contention access period (CAP) guaranteed access period (GAP)
bea
con
asynchronous and synchronous
P2P data transmission
asynchronous P2P data and
P2P command transmission
Time slot 03452 msTime
DL
com
mand
UL
com
mand
control
period (CTP)
DL UL
8 TDD frames = 8 x 06912 ms = 553 ms
contention access period (CAP) guaranteed access period (GAP)
bea
con
asynchronous and synchronous
P2P data transmission
asynchronous P2P data and
P2P command transmission
Time slot 03452 msTime
DL
com
mand
UL
com
mand
control
period (CTP)
DL UL
WINNER D210 v10
Page 46 (180)
4 Radio Resource Management (RRM) and Radio Resource Control (RRC)
41 RRM functions Although the term radio resource management (RRM) is often used as a general term for numerous algorithms and protocols used to govern the radio resources it is in the context of WINNER reserved to denote the control functions implemented in the RLC system layer control plane Other functions related to management of radio resources such as scheduling link adaptation and power control were described within the MAC chapter (Chapter 4) The overall goal is to utilise the given radio resources in an efficient manner The WINNER RRM framework handles flows rather than UTs A flow is a packet stream from one source to one or several destinations classified by QoS requirements source and destination(s) One of the WINNER RRM advantages is that it handles the handover process per flow rather than per UT Therefore a UT might sendreceive traffic over different cells and routes that match best the requirements of the specific flow Additionally it includes functionalities for coordinated spectrum sharing with other radio access networks using the same radio access technology as well as for spectrum sharing with other radio access technologies Finally unlike in existing systems admission control is not responsible for only admitting a new or handover flow to a new cell but also for selecting the best cell among a group of candidate cells that are nominated by the micro mobility functionality A summary of the RRM functionalities studied herein can be found below while more details are given in Appendix D
Spectrum control Spectrum control coordinates flexible spectrum use between multiple WINNER RANs and spectrum sharing with radio access systems using some other radio access technology (RAT) To have more tractable problems spectrum control is divided into two components namely spectrum sharing coordinating spectrum sharing with systems using other RAT and spectrum assignment providing flexible spectrum use between WINNER RANs Spectrum sharing controls the access to the spectrum in frequency bands which are shared with other RATs which are probably legacy systems Spectrum assignment is divided further into long-term spectrum assignment providing slowly varying spectrum assignments for large geographical areas and Short-term Spectrum Assignment providing short-term local variations to the large-scale solution The detailed implementation of these functionalities remains an open issue and further development will be carried out in Phase II
Service level control (SLC) The SLC performs the management between flows of the same user andor between different users and is specific for a population of users (eg the population within one cell or sector) The SLC provides means to allocate network resources to the traffic associated with the different applications and end-user services (ie not radio interface services) The service differentiation is exercised through three different (and parallel) service components namely flow Conditioning flow queuing and flow scheduling The SLC also comprises a flow monitoring service component to provide feedback on eg load predictions The flow scheduling controls the resource scheduler and the interaction between these two schedulers is assumed to work as follows The flow scheduling should ensure that a sufficient amount of packets are residing in the SLC cache to enable high multi-user gains (ie based on predictions about the current rate the flow scheduling aims at keeping the overall SLC cache content at some predetermined level eg corresponding to what (on average) may be transmitted within 5 ms) At the same time the resource scheduler must guarantee that it will (to the furthest extent possible) transmit the packets in the SLC cache within a small amount of time eg in less than 10 ms Otherwise the resource scheduler could create head-of-line blocking and too much delay Effectively this means that the ultimate decision about if and when (within a few ms timeframe) a packet is transmitted lies with the flow scheduling since the resource scheduler sooner or later has to schedule the packets assigned to it This also means that service classes are transparent to the resource scheduler Nevertheless the interface between SLC and RS is still under investigation eg the resource scheduler may also be made aware of the service classes (or at least some priorities of the different flows) to support work-conserving packet pre-emption (ie that a higher priority packet can pre-empt the transmission of a lower priority packet destined for the same node) as well as to give preferential treatment of eg network control signalling packets
WINNER D210 v10
Page 47 (180)
ModeRAN selection Algorithms for the selection of one or several modesRANs to serve a particular flowuser The mode selection can be made on different time scales These include per call or session (slow selection) per packet (fast selection) or triggered by non-traffic related events like changes in radio conditions (mode re-selection) More frequent mode selection leads to larger potential capacity and quality gains (through exploitation of ldquomode-selection diversityrdquo) but can increase signalling load In some cases mode selection will require user interaction or be dictated by an application (also referred to as slow selection or even re-selection) The mode selection can either be controlled by a node in the fixed part of the network a base station a relay node or by the user terminal If one operator runs the network this operator likely prefers network controlled mode selection If the network is run by different operators terminal based mode selection is more likely
Handover
Algorithms for handover between two cells of the samedifferent mode (intra-system) as well as different radio access systems (inter-system) are studied In order to allow for a seamless handover within the WINNER RAN BSs and RNs of the same or different mode can announce their presence to the UTs by broadcasting control messages using orthogonal resources This scheme is especially helpful for the handover between WINNER FDD and TDD as it allows the UTs to be aware of the presence of BSs and RNs that operate at a different mode without disrupting their normal operation to ldquosniffrdquo other parts of the spectrum The case of an inter-system handover between WINNER and legacy RANs is expected to take place either due to loss of coverage of the current system or in case of overlapping coverage due to useroperator preferences or traffic congestion One solution could be to extend the inter-system handover based on the common RRM (CRRM) framework defined in the 3GPP Another approach could be location-based handover where user terminals (UTs) make use of foreign measurements and location information An inter-system handover is performed with the assistance of the cooperative RRM (CoopRRM) entity
Admission control (AC)
The AC ensures that the admittance of a new flow into a resource constrained network does not violate the service commitments made by the network to already admitted flows The decision is based on information such as load prediction statistics of current flows resource restrictions and physical layer measurements It is assumed that flow statistics will include
bull throughput per flow in previous super-frame
bull time-frequency-spatial resource use per flow
bull spare capacity within cell in previous super-frame
bull path loss estimate and
bull interference estimates
In case of limited resources in the candidate cells a number of different actions may be taken
bull reduce requests for connectionflow in question andor for lower priority flows
bull resource re-partitioning
bull lower load in (interference from) neighbouring cells
bull handover flows (cellmodeRAN)
bull drop flows
In the case of multiple RANs and multiple technologies the admission control must take into account the individual characteristics of each technology in order to make the final decision about admitting or rejecting a user in the network
Load control The load control algorithm is triggered in order to ensure that the system is in stable state It calculates the predicted load per cell based on information such as load prediction statistics of current flows and resource restrictions In particular
WINNER D210 v10
Page 48 (180)
bull The preventive load control takes care so that the network does not get overloaded and remains stable and attempts to improve the system performance by distributing userssessionsresources among cellssectors
bull The reactive load control attempts to bring the load back to stable regions as fast as possible
bull The load sharing aims to distribute the load (the offered traffic) andor resources between ldquoresource ownersrdquo (BSs and RNs) such that the resources are efficiently utilised
Potential actions for a ldquocongested cellrdquo are taken Examples are
bull interaction with the service level controller and restriction of incoming traffic
bull denial of new flow requests
bull change of TDD asymmetry factor
bull reduction of requests (eg bit rates) for flows (within limits as specified in the flow QoS specification)
bull attainment of more resources by resource re-partitioning or lower load in (ie lower interference from) neighbouring cells
bull handover of flows to another cellmodeRAN
bull dropping of flow(s)
Routing
Algorithms for the selection of the appropriate routepath per flow It is expected that several paths to a BS will exist due to the deployment of relays From the architecture perspective two basic routing strategies are envisioned in multi-hop systems centralised or distributed Under the centralised strategy route determination is performed in a central controller which normally possesses powerful processing capability and has knowledge on global network status so that sophisticated routing algorithms could be adopted to optimise the system performance With the distributed strategy individual network nodes from the source to the destination jointly perform route determination This strategy could function when no central controller is reachable but its performance is normally limited by network nodesrsquo processing capability and knowledge on network status
42 WINNER RRM architecture As previously described the WINNER radio interface will encompass a number of modes each of them targeted and optimised for a specific deployment scenario (and possibly also user scenario) Nevertheless many of the RRM functions may be shared between the different WINNER modes (eg admission control) Hence the RRM functions could be classified within the three following categories
1) Mode -specific RRM functions These are targeted and optimised for a specific mode and deployment scenario in terms of using different parameters specific to the current mode used In the MAC system layer they include scheduling power control and link adaptation In the RLC control plane they include intra-mode handover and routing
2) Generic RRM functions These are shared between the different WINNER modes or used for their coordination and include spectrum assignment service level control mode selection buffer management traffic policing admission control congestion control and inter-mode handover
3) Cooperative RRM functions which are used for the cooperation of the WINNER system with legacy RANs such as UMTS and WLAN and reside in the Cooperative RRM (CoopRRM) entity These include spectrum sharing inter-system handover admission control congestion control and RAN selection
It is very likely that an overlap between the generic and mode-specific RRM functions will exist where the generic part will administrate the mode-specific part For efficient management of the resources the location of the RRM functions within the network architecture is an essential issue as it can affect the performance of the network due to extensive signalling and delays In a centralised RRM architecture a central entity monitors and makes decisions regarding the allocation of the resources and it is usually located in a node at the RAN while user terminals have minimal role For example in UMTS most of the RRM functionalities are located in the Radio Network Controller (RNC) In addition terminals and Node B also contribute to parts of RRM in terms of power and load control In a distributed RRM architecture the decision entities for each resource management function are located in different nodes including the
WINNER D210 v10
Page 49 (180)
user terminal Furthermore in a hybrid approach different decision levels of the same RRM functionality that work at different time scales are located in different nodes
It is envisaged that for the WINNER system with the multiple operating modes the hybrid approach will be suitable In particular extensive delays in the decision making and signalling overload can be avoided by bringing some of the control plane functions closer to the BSs physical nodes Clearly this adds more complexity to the BSs physical nodes and therefore increases their cost However assuming different types of BSs for the wide-area and short-range scenarios we could restrict the extra functionality to the wide-area BSs (BSwa) In particular the WINNER vision is that the cells of the different modes will coexist and overlap either completely or partially This feature could be used in favour of the RRM architecture as the mode generic control plane functions that concern the coordination of the different modesBSs could be moved to the BSwa making the BSwa responsible for the control and allocation of resources per wide-area cell including all short-range BSs (BSsr) that fall within its coverage A requirement for such an approach would be the definition of a communication link between the BSwa and BSsr This link could be either wired or wireless (eg part of the FDD mode interface) More discussion on the RRM architecture can be found in Appendix D
43 Radio resource control The RRC provides the signalling for these RRM functions control measurements and reports Examples of RRC functionalities are
bull Broadcast of information related to the network
bull Control of broadcast
bull Establishment maintenance and release of an RRC connection between the UT and WINNER RAN
bull Assignment establishment reconfiguration and release of PHY resources
bull Feature discovery (antenna configuration relays etc)
bull Control of requested QoS
bull Measurement reporting and control of the reporting
bull Power control (slow)
bull Paging
bull Initial cell selection and cell re-selection
bull RRC message integrity protection
bull Timing advance
bull Control of synchronisation
bull Scanning of PHY resources
bull Control of masterslave mode (P2P)
The RRM measurements may be performed regularly upon request or triggered by some event To achieve the best possible performance the time period of the measurements should be chosen such that it may track the variations of the measured quantity However since some quantities (like a fading radio channel) undergo not only short-term but also long-term variations lower measurement frequencies may still be useful Moreover the measurement frequency may be adaptive adjusting the time period according to the variation of the measured quantity Similarly as for the measurements the reporting of the measurements can be performed periodically upon request or be event triggered The measurement reporting strategy that will be studied further in Phase II should not be selected independent of the measurement strategy We may distinguish between the case in which the measurement data itself is reported to the network and the case in which the measurement data is processed in the UT and only a RRM command is reported back to the network Further details are given in Appendix D
431 RRC states In order for WINNER to be harmonised with the 3GPP LTE work the same RRC states are proposed
WINNER D210 v10
Page 50 (180)
Dormant
Idle Detached
Active
Dormant
Idle Detached
Active
Figure 41 RRC states
These are
bull UT Detached
o The location of the UT is not known by the network (eg UT is switched off or operating on another RAT system)
bull UT Idle
o UT performs periodic search for higher priority RAN
o UT performs cell selection and reselection
o UT monitors broadcast and paging channels
o Inherently power saving state
o UT is handled by radio access network gateway (RANG)
bull UT Active (identical to the UTRAN CELL_DCH state [3GPP-TS25331])
o UT is transmittingreceiving data on traffic channels
o UT monitors the directedcommon control channels continuously
o There is a power saving sub-state within the Active state This is the dormant sub-state where the UT is ready to transmit or receive data on traffic channels and monitors the control channels discontinuously
o UT is handled by BS
WINNER D210 v10
Page 51 (180)
5 Assessment Overview
51 General Assessment of the performance of the developed system concept is an important aspect of the WINNER project In the case of WINNER the assessment work has been carried out to some extent by theoretical analysis but mostly by computer simulations In WP2 different kinds of simulations are required
bull link level simulations where the performance of the transmission and reception schemes under study are simulated with the selected fading channel models
bull multi-link simulations where multiple radio interface links are simulated simultaneously and thus effects of interference between users can be studied in detail
bull system level simulations where a coarser view of the physical layer is taken and higher level system functionalities are studied
At the link level simulation activities have been focusing on the following topics
bull channel coding schemes
bull novel modulation techniques
bull channel estimation
bull synchronisation
bull link adaptive transmission schemes
On the system and multi-link level the number of simulation alternatives is significantly higher Emphasis has been put on
bull multiple access technologies (TDMA FDMA CDMA SDMA and combinations thereof)
bull resource scheduling (frequencytime adaptive or non-adaptive)
bull spatial processing
bull multi-user detection
In addition implementation impact in terms of computational complexity and RF requirements are vital to consider The outline of the rest of this chapter is as follows In Section 52 the main challenges in performing the assessment work are discussed in Section 53 performance results implementation impact and performance-complexity trade-offs are discussed and in Section 54 comparisons with requirements and design targets from Section 11 and Appendix A are made
52 Challenges In the assessment work within WINNER WP2 there are two major challenges discussed in the following along with the strategies used to cope with them
1 There are a huge number of details and possible combinations of different functionalities In order to carry out a comprehensive assessment of the system concept all realistically possible combinations would have to be assessed and the associated performance checked However for a complex system as WINNER a fully comprehensive assessment is simply not possible to carry out with any reasonable amount of resources It is thus important to carefully select the areas on which the assessment work is focused The broad experience in designing communication systems that the WINNER personnel possesses helps significantly in this focusing and different partners have taken on to study different key aspects Also earlier results in previous WINNER deliverables are reused whenever possible to obtain as broad and accurate assessment as possible of the system capabilities
2 As different partners provide results it means that special emphasis needs to be put on the calibration and cross-verification of the simulation environments in order to ensure that system components are modelled in a similar manner in different simulators At link level the calibration is a straightforward operation and easy to carry out In the system level simulators the calibration is a much more challenging task due to significantly higher complexity larger number of parameters and larger number of issues (eg radio propagation related traffic
WINNER D210 v10
Page 52 (180)
models functionalities of the system etc) that need to be modelled Moreover the setup of one gigantic system simulator covering all aspects of a system in one study is simply not feasible Hence smaller system simulators dedicated to a specific topic studied by a partner can often provide more technical insight This fact is clearly reflected in the evaluation results in the appendices Link level results (Appendix F) from different partners are typically jointly presented in the same graphs whenever appropriate whereas multilink and system level results (Appendix G) from different partners are normally presented in different sections each with its own topic A detailed set of common simulation assumptions have been specified (Appendix E) to make the different studies as comparable as possible but nevertheless comparisons of absolute system-level performance between different partners cannot normally be directly made as the results may be sensitive to several details in the modelling approach
53 Summary of results ndash performance and complexity This section summarises major findings regarding performance and implementation issues the details of which can be found in the appendices of the present deliverable (primarily Appendix F and Appendix G) and in earlier WINNER deliverables It should be noted that many additional results not directly discussed here can be found in the deliverables [WIND23] [WIND24] and [WIND26]
531 Analogue RF In analogue RF implementation no major showstoppers have been identified With the assumed SNR requirement of 30 dB the RF sections of handheld terminals can be constructed using high-end components of today and the required components are expected to be available for the mass market when WINNER systems are to be deployed Zero-IF RF architecture seems to be the most promising solution Power consumption of analogue parts is generally expected to be within acceptable limits but with some restrictions for the use of higher order modulation schemes in combination with the large signal bandwidths and multiple antenna techniques However it is clear that power consumption in user terminals can become a limiting factor since the development of battery and heat dissipation technologies is not expected to be as rapid as the development of other analogue parts or the digital processing technologies
The requirements for the asynchronous TDD network (where interference between UL and DL on adjacent carriers may be substantial) with TDMA were found technically unfeasible taking into account the significant performance degradation and loss of area coverage To overcome this problem either synchronised networks or channel specific RF filtering should be used The latter is costly spectrally inefficient and unattractive to handheld terminals due to large size Therefore synchronised networks for TDD operation are strongly preferred
European and international electromagnetic field (EMF) exposure requirements and standards [HP98][OJEC99][CENELEC01] will be possible to fulfil for user terminals with the uplink output power levels used in the evaluations in this deliverable (200 mW for handheld device and 400 mW for laptop) and with designs and intended use similar to those of existing 2G3G terminals With downlink power levels and antenna installations similar to those used for 2G3G the EMF exposure requirements and standards [HP98][OJE99][CENELEC02] for radio base stations will also be fulfilled
532 Digital baseband In the following subsections the different components of a transmitterreceiver chain are first discussed individually An assessment of the overall link throughput is then provided followed by a subsection focusing further on multi-antenna aspects
5321 Forward error correction Decoding of the error control code is typically a dominant factor in the digital baseband processing complexity especially for single antenna systems On the other hand advanced forward error correction schemes based on iterative decoding provide substantial improvements in link layer performance
In this report the performance and complexity of two main candidate techniques DBTC and BLDPCC have been compared in detail (cf Appendices B2 and F2) The main finding is that DBTC provides best performance when the block length of the code is small while BLDPCC provides better performance at large block lengths The threshold block length where the advantage changes from one code to the other depends on the code rate DBTC show good performance already at block sizes around 100 information bits so CC might not be required for error control coding in the WINNER radio interface This is subject of further study The performance differences are in many cases rather small (lt05 dB) and other factors
WINNER D210 v10
Page 53 (180)
than performance may also affect the selection of coding technique BLDPCC show slightly lower (maximum) decoding complexity than DBTC ndash and provides the inherent capability to reduce power consumption when channel conditions are good
Overall the assessment showed that even for these advanced coding schemes decoders are expected to be implementable for data rates of 300 Mbps and beyond (see Appendix B21) in particular given the predicted increase in semiconductor computational power and the advances in parallelisation of decoding techniques The peak data rates of 1 Gbps can be somewhat challenging not only due to the power consumption but also due to increased clock rates at which the limits of the digital processing hardware (with respect to scaling and clocking limits current leakage heat dissipation etc) become more and more visible For these reasons solutions like lower complexity codes and even analogue decoding should be kept in mind Encoding of the error control code is of negligible complexity for all considered coding schemes
DBTC and BLDPCC represent the state of the art and such techniques are also under discussion in multiple standardisation activities [3GPP-WG142][80211n04][80211n-05][80216e-05] and have in some cases already been standardised [DVB00] Since basically all advanced coding schemes now come very close to the performance limits predicted by coding theory the coding schemes in these systems can be expected to have similar performance (and complexity) as those selected for the WINNER radio interface
5322 Modulation A variety of modulationdemodulation techniques have been investigated and good performance has been found to be achievable with low or moderate complexity already in previous deliverables [WIND21 WIND22 WIND23] However the selection of an appropriate modulation technique depends on a large number of aspects beyond complexity and basic performance as for example flexibility achievable spectral efficiency robustness to RF imperfections requirements on the RF (HPA backoff) and last but not least also on their suitability for implementation of different multiple access schemes and spatial processing methods Aspects directly related to physical layer performance and RF aspects of modulation schemes have been assessed in [WIND21 WIND22 WIND23] and are therefore treated in less detail here Based on the assessment of modulation techniques summarised in Appendix B31 GMC transmission configured as CP-OFDM (for DL transmission and for UL transmission in short-range scenarios) and serial modulation (mostly for the UL in wide-area scenarios) are the preferred options for the WINNER radio interface See also Appendix G71 for a comparison of single carrier and CP-OFDM on theUL The employed multiple access schemes are presented in Chapter 3 and evaluated in Appendix G
CP-OFDM is a well-established technique that is in use in a large number of systems such as DVB-S DVB-T and IEEE 80211 (WiFi) It is currently also under discussion for the use in 3GPP LTE and IEEE 80216e Serial modulationsingle carrier is under discussion in 3GPP LTE due to its advantages for uplink transmission from (power constrained) user terminals
5323 Synchronisation and channel estimation The choice of an appropriate synchronisation strategy for the WINNER radio interface is based on several criteria such as robustness residual synchronisation offsets acquisition delay and required overhead Two different types of pilots are foreseen for the WINNER system concept time and frequency multiplexed pilots in the form of OFDM training symbols and continuous pilot subcarriers respectively In combination with cyclic prefix based synchronisation differential modulation of continuous pilot subcarriers allows to establish frame synchronisation as well as to detect arbitrary frequency offsets (see Appendix F41 for details) Additionally a set of training symbols are included in the super-frame preamble for self organised inter- and intra-cell synchronisation (cf Appendix B41) A timing advance strategy is proposed enabling a time aligned arrival of different usersrsquo signals at the BS
Channel estimation by interpolation in time and frequency based on a scattered pilot grid is considered to be an efficient solution for the WINNER radio interface In Appendix B42 a generic framework for the pilot design of GMC signals is described The pilot overhead is only 25 and 4 per spatial stream for the WINNER TDD and FDD mode respectively For multi-antenna transmission dedicated pilots per flow common pilots per cellsector common pilots per antenna and common pilots per beam are required depending on the spatial scheme selected Especially in case of dedicated pilots purely pilot aided techniques may have severe limitations requiring a pilot boost andor a significant degree of over-sampling Advanced solutions such as iterative channel estimation aim to make a pilot boost redundant at the expense of increased complexity
WINNER D210 v10
Page 54 (180)
Adaptive transmission with respect to resource and physical layer processing requires channel prediction which can be based on common pilot symbols that are also used for other purposes Adaptive transmission becomes possible in the WINNER system at vehicular velocities The channel prediction accuracy estimates (covariances) are furthermore important inputs in the design of the link adaptation and resource scheduling schemes See Section 31 of [WIND24] for their use and impact
5324 Physical layer throughput The overall link level performance is assessed in Appendix F1 with throughput simulations for different scenarios and different physical layer parameters The focus is on the throughput achievable with a standard CP-OFDM system using different modulationcoding schemes under the assumption of ideal channel estimation and synchronisation The results are presented for the SISO case both for FDD and TDD as well as for the 2x2 MIMO case for FDD and the 4x4 MIMO case for TDD The obtained throughput figures indicate that at an S(I)NR between 20 to 25 dB a spectral efficiency for the single link of 3 bitsHz is achievable in the SISO case when considering the WINNER A1C2 NLOS tapped delay line channel models for the TDD and FDD mode respectively For the MIMO case a link spectral efficiency of 45 and 9 bitsHz in the 2x2 and 4x4 MIMO case respectively can be achieved at a target S(I)NR of 25 dB (using the same channel models)
At a bandwidth of 100 MHz the target of 1 Gbps at short ranges in isolated cells appears hence to be achievable For the wide area case achievable spectral efficiencies (and data rates) depend very much on the interference situation ndash cf the multi-link and system level results in the following section
5325 Multi-antenna processing The spatial processing aspects of the WINNER radio interface concept are described in Appendix B1 There the mapping of the data bits to the available space-time-frequency resources is described in detail Impacts of multiple transmit andor receive antennas to the physical layer (eg to synchronisation channel estimation) can be seen throughout the Appendix B Use of two antennas in the terminal is envisaged to be the baseline case as it provides substantial gains compared to single antenna at only moderate extra complexity
As multi-antenna transmission and reception is a fundamental part of the WINNER radio interface concept assessment results related to it are dispersed over the link- and system-level assessment appendices ie Appendix F and Appendix G The results verify that multi-antenna processing is one of the key technologies in reaching the stringent targets set for the WINNER system
Transmit beamforming and receive diversity are essential techniques to ensure coverage and high system throughput in the downlink Especially in wide-area scenarios with high number of active users fixed beam techniques offer high performance gains with low complexity and control overhead Average sector throughput increases by up to a factor of 3 for 8 transmit antennas (Appendices G15 and G24) The increased complexity of adaptive beams is easily justified in cases of few active users and SDMA where substantial sector throughput gain can be observed (Appendix G22) or for delay-sensitive flows (Appendix G21) Given an identical number of antenna elements spatial multiplexing can be used to increase the user peak data rates (Appendix F1) at approximately identical sector throughput ie at the expense of reduced inherent fairness (Appendix G24) The use of spatial diversity must always be considered in the context of other sources of diversity already exploited and therefore might provide only marginal additional gain (Appendix G24) Local area scenarios allow applying advanced spatial processing techniques based on short-term CSI and multi-user precoding like the SMMSE technique developed within WINNER Initial results in Appendix G25 shows that such techniques have the potential to meet the requirements of 4 bitssHz user throughput mentioned in Appendix A14 From multi-antenna receiver complexity point of view OFDMA is preferred over MC-CDMA (Appendix G23)
In downlinks (Appendix G23 Appendix G24) as well as uplinks one can note significant gains in throughput when going from one to two antennas at the user terminals MMSE combination in receivers can be seen to outperform MRC significantly (Appendix G23) The corresponding gain in sector throughput compared to the single receive antenna case is in the order of 35 for MRC and an additional 15 for MMSEIRC (Appendix G24)
The receiver complexity increase is considerable when compared to single antenna systems (factor of about 30 for a 4x4 system when spatial multiplexing is used) but still acceptable when compared to the decoding complexity of error control codes especially if higher order modulation is considered The evaluations show that the multi-antenna methods studied are feasible and practical with some restrictions on in which environments and specific system modes these methods should be used
WINNER D210 v10
Page 55 (180)
For the uplink base station receive diversity significantly improves sector throughput and enhances user data rates Performance improves with larger antenna separation and IRC with a lower number of antennas may give similar performance as MRC with a larger number of antennas (Appendix G51) In most of the cases SDMA using single-stream beamforming per user is the best solution to benefit from the spatial degrees of freedom (Appendix G52)
On the total system design there are still several open questions In particular the impact of simultaneous use of several complex techniques has not been analysed thoroughly For example the concurrent use of different multi-antenna technologies advanced coding methods fast link adaptation and scheduling can result in a challenging overall computational complexity even considering the expected advances in digital processing technologies
533 Multiple access Starting from the initial assessment of multiple access schemes in [WIND26] a further refined assessment has been performed for the most promising candidates by means of multi-link and system simulations In contrast to previous multiple access oriented simulation campaigns inter-cell interference one of the most important aspects when aiming at a frequency reuse one deployment is now modelled more properly However it should be stressed that still many simplifying simulation assumptions had to applied to keep simulation setup and run-time manageable Some aspects of the results have been highlighted in Section 316
Simulation results with focus on comparative or absolute performance assessments of multiple access schemes can be found in Appendix G1 and Appendix G4 for downlink and uplink respectively Regarding the downlink emphasis has been placed in comparing interleaved OFDMATDMA and MC-CDMATDMA as the most promising multiple access candidates for non-frequency-adaptively scheduled flows Results obtained in Appendix G11 indicate that OFDMATDMA performs slightly worse than MC-CDMATDMA if spreading is applied within one chunk only Spreading within a chunk enables low complex user separation at the UTs without performance penalties due to the flat fading characteristic of each chunk The decreased chunk granularity allows for a larger frequency diversity gain than with OFDMATDMA that explains its performance advantage If spreading is applied across several chunks as analysed in Appendices G12 and G13 MC-CDMA suffers from imperfect user separation at the UT with increasing load and OFDMA performs similar or slightly better in that case In addition equalisation considerably increases the complexity of MC-CDMA for the UT
Performance assessment of adaptive chunk based OFDMATDMA revealed the high multi-user diversity gains obtainable by frequency adaptive resource scheduling Considering a score-based scheduler that already takes fairness constraints into account the average cell throughput was increased by a factor of 16 see Appendix G11 compared to non-frequency adaptive scheduling However no traffic-model specific delay constraints have been taken into account yet since full queues were used as a baseline assumption throughout all simulations
In a wide-area scenario OFDMATDMASDMA has been proven to provide large system capacity gains by a factor of 2 compared to pure OFDMATDMA with beamforming using eight antennas in both cases see Appendix G15 Larger gains with more antennas are likely to be achieved From a complexity point of view adaptive OFDMATDMASDMA with beamforming supports simple UT receiver processing without the need for multiple antennas andor complex multi-user detection
Regarding the uplink similar studies were performed including pure TDMA MC-CDMA was not considered as viable multiple access scheme for the uplink due to the resulting high BS complexity From the UT perspective TDMA is attractive since it supports the use of single carrier transmission with lower peak to average power ratio and thus higher power efficiency than multi-carrier transmission In Appendix G41 it is shown that even TDMA allows for a multi-user diversity gain by adaptively scheduling in time albeit with much lower performance potential than adaptive scheduling in frequency
Frequency offset errors among UTs can be suppressed to around 1 of the subcarrier spacing by the UL-DL synchronisation scheme outlined in Appendix B41 and investigated in [WIND23] Therefore chunk based OFDMATDMA was chosen to be the main multiple access candidate for adaptively scheduled flows in the uplink as well as in the downlink Moreover it is highlighted in Appendix G43 that ndash although theoretically optimal ndash sharing the subcarriers does not yield any perceivable capacity gain Hence adding an additional CDMA component to OFDMA would only increase the system complexity
Even the synchronisation of a self-organised OFDM network is technically feasible with a reasonable overhead If relaying techniques are an integral part of the system design a single hop network can be extended to a multi-hop network without too high impact on implementation complexity at the user
WINNER D210 v10
Page 56 (180)
terminals On deployment costs no final conclusions can be made yet since the density of base stations and relay nodes depend crucially on the actual frequency allocation The restrictions due to the delay introduced by RNrsquos forwarding process the additional signalling overhead or the combination of duplex schemes at the two links at a RN require a more detailed analysis
The interference from other cells should be taken into account in the design of multiple access schemes and in the resource partitioning of the super-frame In frequency reuse 1 networks schemes for interference avoidance or reuse partitioning between cells (WP3 deliverables eg [WIND32] and [WIND35]) which in effect increase the reuse factor to between 1 and 2 are important for optimising the spectral efficiency The effect of introducing interference avoidance (RRM) is illustrated in the results of Appendix G12 It should be noted that the delay differences between cells are likely to exceed the OFDM symbol guard intervals Therefore reuse partitioning that allocates different sets of frequencies to different cells eg in their outer regions [WIND32] should not be performed without guard intervals in frequency As illustrated by Appendix G73 the overhead due to such guard intervals can be held at reasonable levels
534 Radio protocols As noted in Chapter 1 system design and protocol specification is an iterative procedure an initial design is needed in order to select an adequate protocol architecture which in turn may lead to a refined system design In Phase I of WINNER key protocol technologies have been identified and assessed but the final performance evaluations and subsequent choices for the WINNER RI can only be made when the consolidated and refined system concept is available Therefore in the following we focus on a brief but more general discussion about complexity and overhead aspects of different protocol technologies6
The complexity increase in the design of radio protocols is mainly due to the required measurements signalling overhead and due to the implementation of baseband processing at the base station It has been shown that the enhanced MAC protocols can provide high throughput and low delays at a feasible amount of complexity and overhead
The coordination between base stations is needed particularly in heavy traffic load situations and will increase performance in medium load situations A promising framework for inter-cell interference management and integrated load sharing with reasonable balance between performance and complexity is to perform the coordination hierarchically at different time scales with the lowest level working on the fastest time scale by assigning constraints on resources to distributed schedulers in the cells In addition self-organised radio resource management techniques which do not require signalling overheads or cause delays can be used and are particularly well suited for multi-hop networks where delays can be a problem
The multi-mode system concept introduces additional complexity both in the design of protocols and associated algorithms as well as hardware implementation In general modularity of system design helps to reduce the computational complexity but many of the implementation specific issues can be assessed only after the spectrum allocation is known
54 Comparison of performance results with requirements and design targets In Section 11 and Appendix A a number of requirements and design targets were listed This section assesses to what extent the present radio-interface concept can meet these targets This assessment is based on results from all appendices and also from previous WP2 deliverables but in particular on the multi-link and system-level assessments summarised in Appendix G
This kind of assessment faces several types of difficulties First several of the requirements have to be made more precise before they can be compared in a meaningful way with performance results Second one should be very careful when using the present simulations to assess absolute network performance figures The used models and assumptions are crucial for the outcome Moreover at this stage most evaluationssimulations are neglecting many imperfections eg estimations errors and delays Accounting for these imperfections may have a large impact on absolute performance figures Still the results may be used to indicate the performance potential of the technology
The assessments are based on the following assumptions summarised from Appendix A and Appendix E
6 See WP3 deliverables for first assessments in different deployment concepts
WINNER D210 v10
Page 57 (180)
bull Deployment Sites with three sectors (cells) as described in Appendix E deployed without use of relay nodes Max 8 antenna elements per base station sector and (mostly) two antenna element per UT
bull Duplexing and bandwidths Three types of radio bandwidths are considered FDD with paired 20 MHz and 40 MHz bands and TDD on one 100 MHz band Data rates per link refer to downlinks in TDD or half-duplex FDD both with activity factor 2 (reception half of the time)
bull Overhead The overhead due to guard bands and cyclic prefixes has been taken into account in all simulations Overhead due to pilots and downlink control signalling has been specified to around 20 in multi-link and system-level simulations see Appendix E31 and is taken into account in these results In the link-level results this overhead is not taken into account and has to be added separately The MAC layer adds some overhead due to CRC codes sequence numbers for retransmission units and non-perfectly filled chunks That MAC overhead has not been investigated and is therefore not taken into account below
bull Restrictions Perfect channel estimation will be assumed unless otherwise indicated and the results refer to downlinks Full queue models are used for the downlink flows
Requirements stated in Section 11
R33 A consistent and ubiquitous data rate per link of 5 Mbits above Layer 2
Assume a single user in the cell of interest and fully loaded neighbouring cells that generate interference Due to the activity factor for TDD or half-duplex FDD the requirement corresponds to 10 Mbits downlink cell throughput with one user at the cell edge This requirement is attained without problems in the considered 40 MHz FDD and 100 MHz TDD modes
For 20 MHz FDD downlinks relevant investigations are found in Appendix G24 for 700 m cell radius In the lower left Figure G16 the CDF value for 10 Mbits active radio link rate is around 015 for one BS antenna and a UT that uses two antennas with IRC This means that some but not all users at the cell edge would attain the performance Using fixed beamforming with 4 or 8 antennas at the BS the target would be attained with high probability see the lower left Figure G18 Results for larger cell sizes (not shown) indicate that the requirement can be fulfilled for cell radii above 2500 m with 8 BS antennas and 2 UT antennas At least two users at the cell edge (one in each slot of the FDD frame) can thus be provided at least 5 Mbits in rural deployment using the 20 MHz FDD mode
R32 A sustainable average high end data rate per link of 50 Mbits above Layer 2
With the same reasoning as above this requirement corresponds to an active radio link rate of 100 Mbits for a user on average over all locations in the sector
For 100 MHz TDD the requirement is fulfilled in short-range scenarios Considering 40 MHz FDD by scaling up the results for 20 MHz of Figure G17 we see that the result becomes attainable by using 8 BS antennas with grid-of-beams or adaptive beamforming and two UT antennas up to a cell radius of 1400 m by using non-frequency adaptive transmission based on turbo coding
For 20 MHz FDD the goal seems unattainable with non-frequency adaptive transmission With many users in the cell adaptive transmission and multi-user scheduling would boost the aggregate sector throughput but this would not enable an individual user to attain 50 Mbits on average over its location Thus the larger bandwidths of 40 MHz FDD or 100 MHz TDD seem to be required
R36 Peak spectral efficiency in connected sites of 10 bitssHz in wide area deploym for high load
The ldquopeakrdquo spectral efficiency normally refers to the maximum sector throughput allowed by the modulation coding and antenna design It is therefore not a function of the load of the system With 3-sector sites this requirement means 333 bitssHzsector The 20 downlink overhead margin raises the requirement to 416 bitssHzsector This figure is attained since 64-QAM transmission is allowed
R37 Peak spectral efficiency in isolated (non-contiguous) sites of 25 bitssHz
It is noted in Appendix F1 from the results in Figure F4 that this goal is attainable with diversity-based 4x4 MIMO in 3-sector sites but only at high SINRs of at least 30 dB
WINNER D210 v10
Page 58 (180)
R312 User speeds ranging from 0ndash500 kmh should be supported
The short OFDM symbol length used for evaluation provides reasonable robustness against the effect of channel variability within symbols but the performance for the highest vehicular velocities and relay links to moving relays in trains remains to be investigated
The OFDM pilot grid for non-frequency adaptive SISO transmission has been scaled to be appropriate up to 250 kmh (Appendix B42) Speeds up to 500 kmh and the use of beamforming (eg following a moving train) would require extra pilot overhead but no dramatic effects are expected
R34 A maximum delay over the radio interface of 1 ms at Layer 2
The delay over the radio interface is interpreted as the delay from arrival of a packet to the MAC layer to the earliest instance the packet can be received and decoded With the tightly designed MAC feedback loops delays of 07ndash17 ms are attained see Appendix C15 The target round-trip delay of 2 ms (Table A6) can be fulfilled since the decoding time for reasonably sized encoding blocks and retransmission units (at or below 1520 bytes) should be 01 ms or below according to Table B2
ITU-R 100 Mbps peak aggregate useful data rate for mobile access
This is a data rate as seen from the base station not the individual terminals It is here interpreted as the cellsector throughput Thus the terminal activity factor does not affect the assessment
This data rate is difficult to attain using 20 MHz FDD It could be attained in a rural site with many users in the cell by using max throughput scheduling and SDMA with four beams see upper left part of Figure G10 However that strategy would starve users not located close to the BS A better indication of the attainable performance for 20 MHz FDD downlinks are the 75 Mbps attained in Figure G10 when using proportional fair scheduling and SDMA with four beams
With many users in the cell experiments with adaptive beamforming in Appendix G21 (that use all 512 subcarriers) provide CDF curves in Figure G11 They show that the goal is almost attained when using the TrackingPSF mean-approach The average data rate with 416 subcarriers would be (416512)110 Mbps = 89 Mbps with 60 users per 1-km cell 8 BS antennas 1 UT antenna Note that with many users per sector the average throughput per user would of course be much lower (right-hand Figure G11)
ITU-R 1 Gbps peak aggregate useful data rate for local area
The results in Appendix G25 indicate that this target is attainable even when channel estimation errors are considered but only in short-range cells (50 m range) with MIMO links that use large numbers of transmit antennas and four receiver antennas
Design targets stated in Appendix A
Throughput per link targets for rural and metropolitan area deployment
The target 1 bitsHz corresponds to 40 Mbps on active links on 20 MHz half-duplex It can be regarded as fulfilled when using 20 MHz FDD up to 25 km cell radius if we have only one user per sector See Appendix G24 Figure G17 The target 05 bitsHz (at 70 kmh) was found to be attainable in Appendix F1
Results in Appendix G11 G15 G21 and G22 show that the requirements for low and medium terminal velocities are well fulfilled with multiple users per cell in particular when using multiple antennas Terminal velocities of 250 kmh have not been evaluated
Throughput per link targets for local area deployment
The target high-end throughput per link of 4 bitsHz per sector is attained for the A1 LOS and A1 NLOS channel models at 50 m distance according to Appendix G43 It is also attained for the B1 LOS channel model for 10 users all being at 150 m distance with OFDMA maximum throughput scheduling It is not attained at 150 m with a B1 NLOS model These results are for adaptive uplinks
WINNER D210 v10
Page 59 (180)
6 Conclusions and Outlook An overview of the current status of the WINNER radio interface concept was presented in Chapters 1ndash4 with an emphasis on novelties compared to existing systems Throughout the work design and functionalities that allow or facilitate operation in shared spectrum and interoperation between WINNER networks and different RATs deserved special focus
The design view was consistently used in this deliverable motivated by its focus on the lower layers and the need to enable direct assessments in terms of performance simulations and implementation impact analysis Service and protocol views and more information on higher layers can be found in the final deliverables of WP7 and WP3 An overview of simulations investigating different system components as well as the whole system was given in Chapter 5 Also comparisons were made with requirements from [WIND71] and other design targets defined within WP2 It was concluded that with reasonable assumptions about missing information (yet to be determined by political legal economic and other factors and decisions) and within the uncertainties of the simulations these requirements and design targets could be fulfilled The analyses of implementation impact in this and previous deliverables revealed no major critical issues that would prevent a cost-efficient implementation of the system at the time of deployment in 8ndash10 years More technical detail both regarding concept and assessments is provided in the appendices and in earlier deliverables
An important objective of Phase II is to further enhance and refine this initial concept to a level of detail needed to build a prototype within the project and to serve as input to the standardisation process that is expected to follow after World Radiocommunication Conference 2007 (WRC-07)
WINNER D210 v10
Page 60 (180)
Appendix A Requirements and Design Targets This appendix presents design targets for different scenarios as discussed in Section 11 A few scenario-independent targets and general assumptions about spectrum etc are also listed at the end
A1 Targets for different scenarios
A11 Scenarios Depending on the scenario being considered different subsets of the system requirements will be relevant In the following discussion we therefore distinguish between the three application scenarios that have been identified for WINNER (respective characteristics listed in sub-bullets)
bull Rural area o medium traffic demand o cellular large cells o range (coverage) issues
bull Metropolitan area o high traffic demand o cellular midsize cells o range (coverage) issues (to some extent)
bull Local area o high data rate demand high traffic demand o cellularisolated cellspeer-to-peer small cells o indooroutdoor
Rural area and metropolitan area will sometimes be referred to collectively as examples of ldquowide-areardquo scenarios Similarly local area will sometimes be referred to as ldquoshort rangerdquo For each scenario technical targets will be summarised in the following sections
A12 Rural area In the rural-area scenario coverage and high UT speeds are the main challenges for the radio interface Cell radii of 2 km and more will likely be desirable The system requirements state an average cell throughput of 50 Mbits in 100 MHz bandwidth and a cell border (ubiquitous) throughput of 5 Mbits Either FDD paired bands or TDD may be used half-duplex is assumed for terminals also in the former case for complexity reasons For maximum efficiency frequency 1-reuse is generally assumed but tech-niques discussed in eg Section 52 in [WIND32] may be used to create a higher effective reuse for users at the cell border The bit rates mentioned here will only be possible to guarantee at low and moderate speeds cf [WIND24] and Appendix B52
Requirements on downlink are summarised in Table A1 All bit rates refer to throughput above the MAC layer and full queues are assumed The cell range is only introduced as a reference point for the throughput values and the actual coverage areas might be different (at the expense of reduced throughput per link) For the uplink the lower output power of the terminal will reduce the possible bit rates see Table A2 Dual-antenna terminals are considered to be the baseline case Relaying may be needed to reach the tabulated targets the feeder links connecting base station and relay node are then normally assumed to use the same spectrum
Table A1 Targets for Rural Area (Downlink)
Reference cell range
UT velocity Throughput per link (cell average single user in cell)
2 km 0 kmh 70 kmh 120 kmh 250 kmh
1 bitsHz 05 bitsHz 05 bitsHz 01 bitsHz
WINNER D210 v10
Page 61 (180)
Table A2 Targets for Rural Area (Uplink)
Reference cell range
UT velocity Throughput per link (cell average single user in cell)
2 km 0 kmh 70 kmh
01 bitsHz 005 bitsHz
A13 Metropolitan area For metropolitan area spectral efficiency and inter-cell interference become more important considera-tions whereas extremely high UT speeds are less common Coverage may sometimes still be an issue but the maximum cell size is smaller than for the rural-area scenario and the performance difference between UL and DL is typically expected to be less significant Relays may be needed also in this scenario In order to maximise spectral efficiency MIMO preferably with fast feedback will likely be an important feature Requirements are summarised in Table A3 The throughput is given per link and with 3-sector sites and half-duplex for the UT it should be multiplied with 3times2=6 to obtain the corresponding value per site
Table A3 Targets for Metropolitan Area (Downlink)
Reference cell range
UT velocity Throughput per link (cell average single user in cell)
1000 m 0 kmh 70 kmh
1 bitsHz 05 bitsHz
A14 Local area Local area communication includes cellular systems as well as non-contiguous (isolated) sites and peer-to-peer communication In the cellular case the short-range requirements in Table A4 apply For non-contiguous cells inter-cell interference is not an issue and the highest spectral efficiency 25 bitssHzsite should be achievable With 3 sectors and half-duplex this corresponds to approximately 4 bitssHzlink (see Table A5)
Table A4 Targets for Local Area (Cellular)
Environment Reference cell range
UT velocity Throughput per link (cell average single user in cell)
Outdoor 100 m lt10 kmh 50 kmh
1 bitsHz 05 bitsHz
Indoor 30 m lt10 kmh 1 bitsHz
Table A5 Targets for Local Area (Isolated Cells and Peer-to-Peer)
Environment Reference cell range
UT velocity Throughput per link (cell average single user in cell)
Outdoor 100 m lt10 kmh 4 bitsHz
Indoor 30 m lt10 kmh 4 bitsHz
A2 Additional targets To be able to handle new delay sensitive applications and link adaptation efficiently it is essential to have a low delay over the radio interface The targets of Table A6 are assumed
WINNER D210 v10
Page 62 (180)
Table A6 Delay targets
Basic radio interface delays (physical layer single hop)
ndashRound-trip time
lt 2 ms
Packet channel establishment (minimum)
ndash UT originated ndash BS originated
lt 5 ms lt 2 ms
RAN-UT-RAN delay 4 ms
A3 System assumptions The preferred spectrum range for WINNER systems is below 6 GHz and for research purpose the target band is 34ndash50 GHz A bandwidth allocation of 100 MHz per carrier should be seen as an upper limit Such wide bands are not feasible in the current mobile bands therefore new bands should be identified The defined target bands are among the current candidate bands in ITU
Operation in spectrum shared with other operators that use the same physical layer WINNER mode will be an integral part of the design Operation in dedicated bands is seen as a special case of this situation Operation in isolated cells will be seen as a special case of cellular transmission (see also Appendix A14)
WINNER D210 v10
Page 63 (180)
Appendix B Physical Layer The purpose of this chapter is to provide more detail on the assessment of different physical layer candidate technologies which eventually lead to the design decisions presented in Chapter 2 of this report It also gives the rationale behind the parameterisation of different system components if not yet provided in previous deliverables [WIND23]
Appendix B1 contains a detailed description of the generic WINNER spatial processing framework along with some example configurations of it The provided figures illustrate in more detail the structure of the space-time-frequency processing sub-block of the generic transceiver architecture depicted in Figure 21 of Chapter 2 Extending on the framework for the assessment of coding techniques from [WIND23] Appendix B2 provides a detailed comparison of the most promising FEC schemes considered for the use in WINNER Duo-Binary Turbo Codes and Block-LDPC Codes Appendix B3 presents a short comparison of the different modulation techniques investigated during WINNER Phase I [WIND21 WIND22 WIND23] as well as a short summary of their merits and drawbacks Afterwards Appendix B4 covers the topic of pilot design for channel estimation and synchronisation The WINNER plot grid is presented including a discussion of different core requirements for channel estimation (chunk based channel estimation extension to the MIMO case etc) Finally Appendix B5 contains information related to link adaptation a comparison of different bit- and power loading algorithms details on the prediction horizons for channel quality prediction and methods for the compression of feedback for channel state information
B1 Spatial processing and space-time-frequency mapping Figure B1 shows a generic transmitter chain implementing the WINNER multi-antenna concept7 The segmentation stage shown corresponds to the MAC-3 sub-layer introduced in Section 315 which allows splitting one RTU into k encoding blocks that undergo individual forward error correction FECk and interleaving Πk Spatial reuse of a chunk adds a third dimension referred to as a chunk layer and presented along the vertical axis of Figure B1 The (maximum) number of layers l in chunk c denoted Qc can be different for different chunks The mapping of FEC blocks to chunk layers is performed by the resource scheduler In adaptive transmission each chunk layer carries data from one flow only In non-frequency adaptive transmission code-multiplexing may be used in downlinks The chunk layers may stem from the different RTUs of different flows in the case of SDMA or from the same flow in case of per stream rate control and multi-level coding Note that the number of layers in a chunk may be arbitrary in relation to the number of physical antennas denoted MT
The bits of chunk layer cl are first modulated onto Sc modulated layers The number of modulated layers is inferior or equal to the number of chunk layers Scle Qc Typically they are equal that is each chunk layer is modulated independently However for the case of multi-level coding several chunk layers are modulated onto the same modulated layer The modulated layers are then subject to an optional non-linear precoding8 The precoded modulated layers are then dispersed onto virtual antenna chunks with a dispersion code A virtual antenna chunk is a three-dimensional entity which spans MT virtual transmit antennas in space nsymb OFDM symbols in time and nsub subcarriers in frequency To simplify the presentation it is assumed that the number of virtual antennas is equal to the actual number of physical antennas If the underlying dispersion code encodes the signal over less or more dimensions appropriate zero padding and puncturing in the spatial dimension is assumed Typically a linear dispersion code is assumed but by allowing non-linear dispersion codes also schemes such as various forms of space-timefrequency trellis-coded modulation may be represented in the generic processing [WIND21 WIND23 WIND26 WIND27]9
7 Figure 21 shows the overall transmitter structure Here a detailed view of the spatial processing (SP) block in
Figure 21is given (GMC and pilot insertion aspects are neglected for readability) 8 The non-linear precoding proposed in [WIND27] is based on Tomlinson-Harashima precoding however the non-
linear precoding block can also include more general lattice coding techniques Such techniques allow approaching the optimal dirty paper coding and can be used to improve the performance of a MIMO single link
9 If some form of coding and modulation is performed by the dispersion code the outer code is probably relatively weak and the modulator essentially bypasses the encoded bits
WINNER D210 v10
Page 64 (180)
segmentation codingchunk layer multiplexing chunk processing OFDM
link adaptation and resource assignment
spac
efre
q
Seg FECk Πk
Res
ourc
e S
ched
uler
Mod NLP DC P BF
ant s
ummati
on
OFDM proc
essin
g
FEC forward error codingMod modulationNLP non-linear precodingDC linear dispersion codeP power allocationBF beamforming
segmentation codingchunk layer multiplexing chunk processing OFDM
link adaptation and resource assignment
spac
esp
ace
freq
Seg FECk ΠkSeg FECk ΠkFECk Πk
Res
ourc
e S
ched
uler
Mod NLP DC P BF
ant s
ummati
on
OFDM proc
essin
g
FEC forward error codingMod modulationNLP non-linear precodingDC linear dispersion codeP power allocationBF beamforming
Figure B1 Overview of the generic PHY processing chain
The virtual antenna chunk of each layer is then subject to power allocation and linear precoding which means that each virtual antenna chunk of each layer is mapped onto a physical antenna chunk Each element of the three-dimensional antenna chunk is a linear combination of the elements of the layerrsquos virtual antenna chunk The term linear precoding covers techniques such as closed-loop transmit diversity linear multi-user precoding and long-term beamforming and also antenna or beam selection and hopping as well as random beamforming that may be employed by opportunistic beamforming approaches For cases with multi-user optimisation the linear precoding and the power of virtual antenna chunks are optimised jointly Finally the layersrsquo antenna chunks are summed over the antennas to form a three-dimensional antenna chunk which is passed to assembly and OFDM modulation per antenna
The MAC function spatial scheme selection and link adaptation will select and configure the blocks of this generic chain to implement the most favourable spatial processing scheme for each flow A few illustrative example configurations are given in the following In case of open-loop space-time coding (using an LDC eg the well-known Alamouti-code) all data undergo identical FEC and modulation The LDC then maps the symbols onto the antenna chunk (Figure B2) For PARC however segmentation is performed first to allow for individual FEC and modulation of the sub-flows which are mapped to different chunk layers (Figure B3) Figure B4 shows the processing for SMMSE where the LDC implements purely a multiplexing onto virtual antenna chunks The power allocation and linear precoding (BF) is then optimised across all SDMA users according to the SMMSE algorithm [WIND27]
segmentation codingchunk layer multiplexing chunk processing OFDM
link adaptation and resource assignment
spac
efre
q
FECk Πk
Res
ourc
e Sc
hedu
ler
Mod
LDC
P
OFDM proc
essin
g
one userflow P
P
segmentation codingchunk layer multiplexing chunk processing OFDM
link adaptation and resource assignment
spac
esp
ace
freq
FECk Πk
Res
ourc
e Sc
hedu
ler
Mod
LDC
P
OFDM proc
essin
g
one userflow P
P
FEC forward error codingMod modulationNLP non-linear precodingLDC linear dispersion codeP power allocationBF beamforming
Figure B2 Example configuration for open-loop space-time coding
WINNER D210 v10
Page 65 (180)
segmentation codingchunk layer multiplexing chunk processing OFDM
link adaptation and resource assignment
Seg
spac
efre
q
FECk Πk
Res
ourc
e S
ched
uler
Mod P
OFDM proc
essin
g
one userflow
segmentation codingchunk layer multiplexing chunk processing OFDM
link adaptation and resource assignment
Seg
spac
esp
ace
freq
FECk ΠkFECk Πk
Res
ourc
e S
ched
uler
Mod P
OFDM proc
essin
g
one userflow
FEC forward error codingMod modulationNLP non-linear precodingLDC linear dispersion codeP power allocationBF beamforming
Figure B3 Example configuration for PARC
segmentation codingchunk layer multiplexing chunk processing OFDM
link adaptation and resource assignment
spac
efre
q
FECk Πk
Res
ourc
e S
ched
uler
Mod
BF
OFDM proc
essin
g
one userflow LDC
P
P
P
segmentation codingchunk layer multiplexing chunk processing OFDM
link adaptation and resource assignment
spac
esp
ace
freq
FECk Πk
Res
ourc
e S
ched
uler
Mod
BF
OFDM proc
essin
g
one userflow LDC
P
P
P
LDC
P
P
P
FEC forward error codingMod modulationNLP non-linear precodingLDC linear dispersion codeP power allocationBF beamforming
Figure B4 Example configuration for SMMSE
Apart from the generic processing chain and example configurations a lean baseline configuration is defined which serves as basic implementation guideline and benchmark It is based on the following simplifications
bull no segmentation (MAC-3 sub-layer) ie one RTU is encoded as a single FEC block
bull independent processing of each chunk layer ie each modulated layer stems from a single chunk layer
bull no non-linear precoding
bull linear dispersion codes that generate a set of virtual antenna streams out of each chunk layer
bull pure spatial linear precoding (beamforming) ie for a given chunk layer cl symbol t and subcarrier f the elements xcl(tf) of the antenna chunk are obtained by
)ft()ft( lclclc aFx =
where acl(tf) is an MT times 1 column vector holding the corresponding element of the virtual antenna Note that Fcl is identical for all symbols within one chunk layer and each column of Fcl can be viewed as transmit weight vector
Relaying is an integrated part of the WINNER system Investigations that combine relaying and spatial processing have been performed in [WIND27] It has been shown that FRN based on decode-and-forward can benefit from different kinds of spatial processing In-depth investigations and system design that tighly integrates relaying and spatial processing are foreseen in Phase II including more sophisticated concepts like cooperative relays [AY05]
WINNER D210 v10
Page 66 (180)
B2 Forward error correction A large number of possible options for forward error correction have been identified and discussed in [WIND21] With the advent of iterative decoding very powerful concatenated error correction schemes have been devised which exhibit a decoding complexity that is linear in the block length ndash a key requirement for inclusion into any practical wireless communications system Of the plurality of possible concatenated codes parallel concatenated convolutional codes and low-density parity-check codes have been selected as main candidate technologies as they showed the best trade-off between performance and implementation complexity Of these two general classes of codes Duo-Binary Turbo Codes and (Quasi-Cyclic) Block LDPCC (QC-BLDPCC) are considered for the use in the WINNER system since they provide the necessary amount of flexibility in terms of block lengths and code rates However iterative decoding schemes suffer from quite low performance at short block lengths Therefore convolutional codes are used with short block lengths below 200 information bits The domain of suitability (for a target BLER of 1) of all candidates is summarised in Figure B5 below (cf Appendix F2 for details)
Figure B5 Domain of suitability of DBTC and BLDPCC for a target BLER of 1
Table B1 summarises the assessment of these three candidate technologies
Table B1 Assessment of the most promising FEC techniques
CC10 DBTC BLDPCC
Short blocks - lt05 dB lt1 dB
Medium blocks lt1ndash15 dB - lt02ndash04 dB
Performance11
Large blocks lt2ndash25 dB lt02 dB -
Code structure Very low Low Medium Memory Requirements
Decoding Low Medium Medium
Encoding complexity lt 10 opsinfo bit
Decoding complexity ~ 2500 opsinfo bit lt1700 opsinfo bit lt1200 opsinfo bit
Maturity High Medium Medium
10 Memory 8 convolutional code soft Viterbi decoding 11 Loss with respect to the best technique at codeword sizes 50 576 4308 bits (AWGN BPSK target BLER 1)
0 500 1000 1500 2000 2500 3000 3500 4000 4500 5000
DBTC
DBTC
DBTC
BLDPCC
BLDPCC
BLDPCC
Codeword Size (bits)
Rc=12
Rc=23
Rc=34
CC
CC
CC
WINNER D210 v10
Page 67 (180)
DBTC show very good performance already at quite low block sizes (around 128 information bits) and may eventually be used instead of CC in such scenarios LDPCC are favoured over DBTC for large block sizes due to their superior error correction performance in this regime (lower required bit SNR to achieve BLER of 1 [WIND23]) All codes show the same high degree of flexibility in terms of block sizes and code rates (cf Appendix B21) and support the construction of rate compatible code sets (cf Appendix B22) It should be emphasised that the impact of selection of one or another of the proposed FEC technique on the overall system concept is rather limited as soft-input soft-output versions of decoder algorithms exist for all investigated techniques ndash the en-decoding sub-blocks can hence be regarded as a ldquoblack boxrdquo by the rest of the system
B21 Implementation issues flexibility parallelisation throughput An important practical issue when dealing with coding schemes for adaptive radio interfaces is the flexibility in terms of block sizes and code rates One typical way of constructing good LDPCC is to first optimise the error correction performance of the code ensemble for the target code rate (eg optimise the degree distribution using EXIT chart analysis) and then generate one specific code using construction algorithms that ensure low error floors (eg the progressive edge growth algorithms) The disadvantage of this approach (for practical implementation) is that a new code needs to be designed for each block length and rate Structured LDPC codes and especially Quasi-Cyclic and Block LDPC Codes [MY05 MYK05] on the other hand have been shown to have good performance and high flexibility in terms of code rates and block sizes at the same time The general idea is to base the construction of the LDPCC on different basic elements usually shifted andor rotated versions of the identity matrix Adaptation to different block lengths is easily done by expanding elements of the basic matrix (eg by replacing each ldquo1rdquo in the parity check matrix with an identity matrix and each ldquo0rdquo with an all-zeros matrix) Different code rates are obtained by appending more elements to the matrix in only one dimension (ie add more variable nodes but no check nodes) The decoder must obviously be designed to support such changes of the code structure The inherent parallelism of LDPCC is then exploited by allocating Variable Node Units (VNU) and Check Node Units (CNU) to groups of variable and check nodes respectively for processing of the decoding algorithm The degree of parallelism is dictated by the number of elements in each unit The throughput of such a semi-parallel decoder architecture can be expressed as follows
ckcb Fz
PITPRnD sdot+
sdotsdot= (B1)
where Fck denotes the clock frequency (nbmb) are the dimensions of the base model matrix Rc is the code rate and IT is the iteration number The degree of parallelism P is bounded as 1lt=Plt=z where z is the expansion factor Note that in this architecture the total number of VNUs and CNUs is Pnb and Pmb respectively [LZ05] Current technology does not allow yet exploiting this degree of parallelism in full at reasonable cost Nevertheless the flexibility of such architectures is quite attractive from a design point of view as it allows to scale and to tune the hardware cost very easily depending on the target throughput Such semi-parallel architectures are currently being investigated throughout the whole industry (some first complexity estimates can be found in [ZZ05]) As always when dealing with LDPCC the number of iterations IT can vary between an average number required for convergence and a maximum number which represents the worst case decoding delay (and strongly influences the error-correction performance)
Duo-Binary Turbo Codes [WIND21 WIND23] differ from classical PCCC by the fact that the information bits are encoded pair wise The internal inter-leaver is based on an algorithmic permutation defined by a single equation This PCCC can hence be adjusted to any frame size by modifying only four values which parameterise the internal interleaver implying a high flexibility of this type of PCCC As the mother code rate of the Duo-Binary Turbo Code is frac12 (instead of 13 for classical PCCC) it is inherently more robust to puncturing Duo-Binary PCCC not only achieve very good performance for long block lengths but also perform well at smaller block sizes and have been standardised in DVB with block lengths as small as 128 bits The performance has also been improved at low error rates thanks to the improved internal interleaver The decoder can be designed to decode 2 information bits per clock cycle and its throughput can hence be obtained by means of the following relation
ckFITPD sdot= (B2)
The throughput is independent of the code rate as code rates higher than 05 are obtained by puncturing
WINNER D210 v10
Page 68 (180)
For the throughput analysis we consider a clock frequency Fck of 200 MHz to be achievable which corresponds to a technology of 013 microm and beyond [THB04] By tuning the degree of parallelism P and the (maximum) number of iterations IT we can match the requested decoderrsquos throughput to the system requirements Table B2 below summarises the achievable throughput exemplarily for the case of a code raet Rc=05
Table B2 Achievable throughput for rate 05 DBTC and BLDPCC (200 MHz clock frequency)
Code Parallelism level Number of iterations Bit rate (decoded Mbitss)
6 8 150
12 8 300
4 5 160
DBTC
8 5 320
2 50 (flooding schedule) 192
4 50 384
1 20 (shuffled decoding) 240
BLDPCC
2 20 480
It can thus be concluded that a parallelism level of 12 for DBTC (when using 8 internal decoder iterations) and 4 for BLDPCC (using a standard flooding schedule and corresponding to 192 VNUs and 96 CNUs) is sufficient to achieve a throughput of 300 Mbps (and beyond) We conclude that both coding candidates can offer a suitable throughput It is however known that the inherent parallelism of BLDPCC can be attractive from a designer point of view as it allows tuning whole hardwaresoftware implementation to the cost and performance constraints Although very high data rates are theoretically achievable by BLDPC decoders technology constraints still limit the degree of parallelism affordable and thus the data rates To give the full picture the respective gate count (and thus area estimation) for DBTC and BLDPCC need to be considered As these figures depend very much on the target architecture and a number of other parameters this assessment will be done in the next phase of WINNER
B22 Rate compatible code sets for HARQ-II Hybrid automatic repeat request (HARQ) schemes combine the reliability of FEC with the throughput of ARQ Especially type II HARQ schemes also denoted as incremental redundancy (IR) provide an improved throughput and have for example been successfully employed in HSDPA To construct an efficient IR scheme a set of rate-compatible (RC) codes is needed This is a sequence of nested codes providing a range of different code rates It can be constructed eg by puncturing a low rate mother code A special case of IR is chase combining where the FEC codeword is repeated and soft combining is applied to the received code bits This is equivalent to using an outer repetition code (eg by additional spreading cf [WIND23]) which can be used when the channel SNR is insufficient to support successful decoding even at the lowest (mother) code rate
For the detection of a decoding failure an error detecting code is required This can either be implemented by an additional outer cyclic redundancy check (CRC) or is already inherently included in the code itself ndash like in the case of LDPCC The length of the CRC is determined by the desired probability of an undetected error which converges asymptotically as 2-b where b is the number of the CRC parity bits (cf [3GPP-TR25212] where a maximum CRC length of 24 bits is used)
Rate compatible punctured code sets are well known for CC and PCCC [RM00] but can also be created both for DBTC and BLDPCC For the performance of punctured LDPCC it is decisive that the number of punctured variable bits connected to each check node is minimised If a check node is connected to two punctured bits there will be only zero messages in the first iteration and the information of this parity check equation is lost Therefore best results can be achieved by puncturing only degree 2 variable nodes In most LDPC construction methods the redundancy part consists (almost) only of degree 2 variables Often it has a dual diagonal form Therefore it is possible to puncture only redundancy bits Figure F8 illustrates that the performance of rate compatible punctured DBTC and BLDPCCs is quite similar We
WINNER D210 v10
Page 69 (180)
hence conclude that rate compatible punctured codes can be constructed for all FEC techniques that are currently considered for use in the WINNER system
B23 Low-density parity-check codes decoding options The standard algorithm for decoding of LDPC codes is the so-called ldquobelief propagation algorithmrdquo (BPA) of which several good approximations exist In fact it has been shown in [CF02] that close-to-optimal error correction performance can be achieved by a corrected version of the so-called Min-Sum algorithm (MSA) The basic idea of the MSA is essentially the application of the maxLog approximation to BPA decoding Similar to the case when using maxLogMAP decoding of PCCC this comes at a performance loss in the order of 05 dB (on AWGN channels cf [WIND23]) This loss can be dramatically reduced by appropriate scaling of the extrinsic messages to compensate for the over-estimation of extrinsic information (this approach has been also applied in Turbo decoding [VF00]) This corrected version of the MinSum algorithm will in the following be denoted as ldquoMin-Sumrdquo Calculating variable and check node messages during decoding then only involves simple sum and minimum operations respectively plus a scaling of the check node messages In theory the scaling factor α needs to be optimised for each code and SNR by means of Density Evolution (DE) or Monte-Carlo simulation to achieve optimal results However Monte-Carlo simulations showed that choosing α=08 as proposed in [CF02] results in very good performance independent of the SNR operation point for the BLDPCC considered for use in WINNER The ldquoMinSumrdquo algorithm is therefore considered to give the best performance-complexity trade-off for LDPC decoders
However in the case of irregular LDPCC even using the MinSum with optimal correction still not fills the gap wrt true belief propagation decoding Therefore further investigations have been carried out recently leading to new sub-optimal decoding algorithms [GBD03 JVS+03] that could be good candidates in terms of complexityperformance trade-off and memory savings Bit-Flipping Algorithms [BR04 ZF04 ZB04 KLF01 ZF04] on the other hand might be considered an option for very low-end terminals where a loss in performance might be acceptable when large savings in decoding complexity can be achieved A drawback of such approaches is the absence of reliability information at the output of the decoder However since low-end terminals will most probably not use iterative equalisation andor channel estimation techniques this appears to be no significant limitation
B24 Scheduling of the decoder The decoder for LDPCC is a message-passing algorithm operating on the Tanner graph [WIND21] which is equivalent to the structure of the parity-check matrix of the code In the standard schedule of the BPA which is often denoted as flooding schedule first all check node are updated and then all variable nodes are updated An alternative is shuffled scheduling [KF98 MB01 ZF05 YNA01 MS02] also known as layered decoding Here the BP decoder uses not only the messages from the last iteration but uses also the information of the updates from the current iteration This leads to a considerable increase in convergence speed One can discern horizontal and vertical shuffling The vertical shuffling schedule operates along the variable nodes all check nodes connected to the current variable node are updated and the current variable node is updated The horizontal schedule operates along the check nodes the current check node is updated and all the variable nodes connected this check node are also updated Simulations show that both methods increase the convergence speed roughly by a factor of two for both maximum and average number of iterations However the operation count of a single iteration of the BP decoder is increased compared to the flooding schedule In vertical shuffling each check node is updated dc times per iteration while in horizontal shuffling each variable node is updated dv times per iteration (dv and dc is the degree of the respective node) As the check node update is more complex than the variable node update horizontal scheduling should be preferred It is possible to perform group-wise shuffling ie updates are performed on a group of nodes before the nodes of the other type are updated This is especially suited for quasi-cyclic block LDPC codes as nodes within one block do not exchange messages anyway Group-wise shuffling also enables semi-parallel decoding and reduces the required memory [MS02] For the LDPCC considered in the WINNER framework investigations showed that the performance of group-wise horizontal shuffling with 20 iterations is equivalent to that of the flooding schedule with 50 iterations (consistent with the speedup factors reported in [ZF05]) In the assessment of complexityperformance trade-off (cf Appendix F2) results will be given in terms of flooding scheduling as reference point for any other comparison
WINNER D210 v10
Page 70 (180)
B3 Modulation
B31 Assessment of modulation techniques As outlined in Section 22 supporting bandwidths of up to 100 MHz and enabling the ldquoalways bestrdquo principle translates into the following main requirements for the selected modulation technique efficient equalisation of frequency selective channels high granularity and the possibility to adapt transmission parameters to different environment conditions (delay spread Doppler spread available spectrum) user requirements (data rate delay) and user terminal capabilities (maximum transmit power antenna configuration etc) Frequency domain signal processing and more specifically the generalised multi-carrier concept are very elegant means of providing the required flexibility Among the large number of modulation techniques that can be accommodated in the GMC framework (cf Section 22) the following have been assessed in more detail during WINNER Phase I different ldquoflavoursrdquo of OFDM (CP-OFDM IOTA-OFDM PRP-OFDM) MC-CDMA and FMT as well as serial modulation and IFDMA (or FDOSS) Table B3 summarises the assessment of these modulation techniques Although several transmission technologies are also related to multiple access the discussion here focuses solely on the modulation aspect The benefits and drawbacks of the main candidate technologies CP-OFDM and CP based frequency domain generated serial modulation are discussed in the following section
Table B3 Assessment of most promising modulation techniques
Serial modulation
IFDMA CP-OFDM
PRP- OFDM
MC- CDMA
FMT-FDMA12 (NBWB)
IOTA-OFDM
Required IBO
Typically 2ndash3dB lower than for multi-carrier techniques
High (6ndash9 dB[WIND22])
Tx complexity
IFFT FFT
Low IFFT (addt spreading for MC-CDMA)
Rx complexity
FFT
IFFT
FFT FFT postfix suppr
FFT addt de-spreading13
FFT FFT
Filtering complexity
Low Low14 High (poly-phase filtering)
Equalisation Issues
May require DFETEQ for higher order modulation15
acquisition delay
Spectrum flexibility
+ - + + o+ -+ +
Robustness wrt ICI
+ - - - - +- +
Required guard bandsperiods
Similar requirements (~10 for GI ~20 for guard bands under the current assumptions)
+16 +16
Maturity O O + O O O O
12 The specific merits of FMT-FDMA depend very much on the modulation format chosen within the sub-bands 13 May also require multi-user detection in environments where the delay spread is large 14 It is possible to run multi-carrier based transmission without any additional filtering resulting in substantial
spectral side-lobes Additional filtering is often required to meet spectral mask requirements 15 Noise enhancement in linear (MMSE) FDE may cause error floors for higher order modulation (16QAM) when
using high code rates [WIND23] the issue can be overcome by using decision feedbackTurbo equalisation 16 Cyclic prefix can be omitted However additional pilots would then be required to achieve coarse synchronisation
WINNER D210 v10
Page 71 (180)
Interleaved Frequency Division Multiple Access (IFDMA) [WIND23 Section 5214] can be interpreted both as a serial modulation (FDOSS) [WIND21 Section 415][ChC00 DFL+04] and a multi carrier modulation scheme [GRC02] thus combining many of the advantages of the two approaches As a special case of frequency domain based serial modulation (using interleaved assignment of subcarriers) it enables the same high frequency diversity and low peak to average power ratio It also facilitates low complexity signal generation [FCS04] and user separation (as for OFDMA) On the other hand IFDMA and OFDMA exhibit a similar sensitivity to frequency offsets
Multi-Carrier Code Division Multiple Access (MC-CDMA) has been considered extensively in [WIND21 Section 45][WIND23 Section 5213][WIND26] Since it provides high frequency diversity and good granularity also for low data rate transmission MC-CDMA is proposed for the use with frequency non-adaptive transmission Detection complexity will be low when using MC-CDMA only within one chunk (ie under time and frequency non-selective fading) Complexity can however become an issue in environments with high delay spreads (high frequency diversity) and in conjunction with spatial processing Low-complexity techniques such as Pre-Detection SUD have been proposed together with linear (ZF MMSE) and non-linear multi-user detection that achieve good performance at the cost of higher receiver complexity
IOTA-OFDM [WIND21 Section 412][WIND23 Section 5212] [LGA01][JDL+04] and Filtered Multi Tone (FMT) [WIND21 Section 411][CFO+03][CEO02] modulation use prototype functionsfilters to guarantee good localisation of the subcarrier spectra in the frequency (and time) domain Thus high robustness to inter-carrier interference (eg arising due to time and frequency errors as well as to Doppler effects) is achieved without requiring the insertion of a cyclic prefix ndash leading to a higher spectral efficiency However the cyclic prefix is used in WINNER to achieve coarse synchronisation and the introduced overhead is below 10 for both the TDD and the FDD mode When using IOTA-OFDM or FMT an overhead would have to be invested for synchronisation pilots ndash thus reducing the potential gains in spectral efficiency
Wideband FMT with high subcarrier spacing (and hence frequency selective fading per sub-channel) is a valid alternative to traditional (time domain based) single carrier transmission over the whole bandwidth allowing a higher flexibility and granularity in the usage of the broadband channel The same (or higher) flexibility can be achieved by using frequency domain based serial modulation ndash wideband FMT is a special case of this scheme with block subcarrier assignment and a specific type of filtering
Using a Pseudo Random Postfix (PRP) as guard interval [WIND21 Section 46ndash410] [WIND23 Section 5211][MDC+04 MBL+05][MCD05] provides means to estimate andor track the channel impulse response without adding any overhead in terms of learning symbols andor pilot tones ndash allowing for increased spectral efficiency However in order to achieve a high precision (low MSE) of the channel estimates a delay of several OFDM symbols in the radio interface may have to be accepted This is especially the case for higher order modulation with high requirements on the channel estimation (cf results in Appendix F35) Moreover the scheme is less applicable for uplink scenarios where postfixes of different users superimpose at the base station Since low delay is a very important requirement for the WINNER radio interface and the overhead required for a scattered pilot grid is quite low (cf Appendix B42) this solution has been selected for channel estimation and tracking in WINNER instead
To summarise CP-OFDM is the preferred solution for the downlink (and the uplink when terminal power consumption is not an issue) as the spectral efficiency gains from using other techniques are currently considered not to justify the increase in implementation complexity (eg poly-phase filtering) andor delay (for the case of PRP-OFDM) Frequency domain based serial modulation is preferred for uplink transmission due to its low PAPR and as it enables to flexibly switch between interleaved (IFDMA) and block subcarrier assignment (wideband FMT) according to need
B32 OFDM vs single carrier Serial and parallel modulations have generally similar BER performance on frequency-selective channels when used with coding and other enhancements like iterative detection or adaptive loading Note however that linear FDE receivers become limited by noise enhancement at high SNR OFDM systems therefore yield better performance than serially modulated systems when considering transmission with higher order modulation and only linear equalisers OFDM has been (and is) in use in a number of wireless communications standards (eg IEEE 80211 and DVB systems) The main advantage of this technique is its implementation simplicity at least from a baseband perspective very low complexity equalisation algorithms are available and channel estimation and tracking is straightforward and of low arithmetical complexity if pilotlearning symbols based approaches (or derivates) are applied
Concerning the trade-offs between OFDM and serial modulation the main issues are the following ones
WINNER D210 v10
Page 72 (180)
i) the OFDM time domain signal is characterised by an inherent high peak-to-average-power ratio (PAPR) which is challenging for the RF implementation of HPAs (high power amplifiers) [FK05 WIND22 WIND23] The power backoff required by OFDM or other multi-carrier modulation approaches is typically 2 to 3 dB higher than for serial modulation even when PAPR-reduction methods are applied (for both systems cf [WIND23]) Serial modulation thus allows the use of cheaper power amplifiers Furthermore if a serial modulation system and a parallel system are required to use the same type of HPA and have the same maximum spectrum sidelobe levels the parallel systemrsquos average allowed transmit power will be lower resulting in lower received power and correspondingly higher bit error rate and lower coverage [WIND23] This constitutes the main motivation for the use of serial modulation in the uplink where terminal battery duration terminal cost and coverage are critical issues Furthermore generation of serial modulation by the generalised multi-carrier approach is equivalent to generation of OFDM or OFDMA that has been precoded by a FFT operation Thus serial (single carrier) modulation itself can be considered as just a form of OFDM to which a very effective PAPR reduction method has been applied
ii) OFDM is sensitive to time and frequency synchronisation offsets However efficient algorithms (of relatively low computational complexity) are available which assure a sufficiently precise synchronisation in both time and frequency From a practical point of view synchronisation issues are not a main limiting factor of OFDM
iii) OFDM is in general sensitive to higher levels of inter-carrier-interference (ICI) (resulting eg from high Doppler environments phase noise frequency offset etc) which lead to a degradation of the system performance A suitable design of the OFDM parameters (in particular the subcarrier spacing) is required in order to avoid this problem Assuming reasonable design parameters OFDM is also applicable to high mobility scenarios Phase noise on the other hand can be a limiting factor especially when high carrier frequencies andor low cost implementations are targeted Serial modulation is less sensitive to such self-interference effects [WIND23]
B33 Guard interval design The main purpose of the guard interval is obviously to limit inter-symbol-interference (ISI) for all block transmission based GMC schemes [WIND23] Therefore the amount of signal energy contained in the channel taps that exceed the guard interval length (resulting from a long channel impulse response potential inter-cell interference time synchronisation errors and filter impulse responses) should be low enough to avoid error floors in the transmission (ie be some dB below the thermalADC noise floor) There are efficient methods to minimise the ICI (eg timing-advanced transmission in up-link) which can be used to considerably reduce the guard interval length and thus increase spectral efficiency The guard interval length is often chosen to be a fraction 12n of the raw symbol length although this is not strictly necessary from the implementation perspective It should however be an integer multiple of the sampling interval [WIND23] Additionally to avoiding ISI the cyclic prefix in CP-OFDM turns the linear convolution into a set of parallel attenuations in the discrete frequency domain thus enabling simple single tap equalisation and contributing significantly to the receiver simplicity of OFDM systems
B34 Modulation alphabets and bit mapping Non-differential M-PSK and M-QAM modulation will be used in the WINNER system as channel state information can be made available to the receiver at relatively low pilot overhead in all scenarios (cf Sections 23 and B4) For the wide-area scenario modulation formats up to 64-QAM are proposed while for short-range transmission even 256-QAM appears to be feasible
As a baseline case Gray mapping is assumed It provides the highest amount of mutual information when no a-priori knowledge is available however it shows little gain when additional a-priori knowledge becomes available Since decoder and detectorchannel estimator EXIT transfer curves must be matched in order to achieve good performance it should evidently be used with a strong outer code mostly in non-iterative setups Note that the use of Gray mapping facilitates the calculation of soft output at the detector at low complexity if the standard maxLog approximation is used The selection of other mappings is useful in with the context of iterative equalisationchannel estimation mostly in conjunction with a weaker outer code Ideally the mapping and the channel encoder should be chosen jointly in order to maximise the gain achieved after several iterations In practice rapid changes of the propagation environment may render this optimisation unfeasible A robust solution shall then be preferred at the price of a loss of optimality Optimised bit labellings (used with a low memory CC) in Appendix F in the context of iterative channel estimation
WINNER D210 v10
Page 73 (180)
B4 Pilot design for channel estimation and synchronisation
B41 Intra- and inter-cell synchronisation using dedicated training symbols A synchronisation approach is proposed that enables both intra- and inter-cell synchronisation in a self-organised way without relying on any external reference eg GPS The approach assumes a cellular OFDM network where the terminals in every cell BSs or UTs are allowed to receive and transmit over the whole system frequency band at the same time during synchronisation
The approach proposed in this section is based on the acquisition of the coarse intra-cell time synchronisation by means of a DL synchronisation pilot referred to as T-pilot The T-pilot is sent in DL by all BSs inside the network at the beginning of each super-frame It is proposed to build the T-pilot for each cell as a specific Gold code This pilot structure has been proved to be robust against both inter-cell interference and multi-path fading [CSB05] However the correlation of T-pilots is sensitive to carrier frequency offsets as shown in Appendix F41
In order to improve the achieved accuracy the DL T-pilot is followed by at least two F-pilots that is two OFDM symbols The frequency and time offsets can be estimated simultaneously in the frequency domain (post FFT) as the phase rotation between two adjacent OFDM symbols on the same subcarrier in the same OFDM symbol and as the phase difference between two adjacent subcarriers respectively The phase rotation method requires the time and frequency offsets to be within one half of the OFDM symbol period and within one half of the subcarrier spacing respectively This condition is assumed to have been guaranteed at the beginning of the fine synchronisation by the initial coarse synchronisation
In order to achieve inter-cell synchronisation two methods can be considered which are described in the following
The first referred to as DL-UL synchronisation assumes that all UTs within a certain cell which have become mutually synchronised during the DL phase transmit UL sync signals which are in turn received and analysed by all BSs within range A synchronisation signal structure was proposed in [WIND23] that can be used in UL for the inter-cell synchronisation as well as alternative to the one described above for the DL fine intra-cell synchronisation This signal consists of three adjacent OFDM symbols during which each BS in DL transmits only on a single pair of adjacent subcarriers with the maximum power as described in [WIND21] Section 954 The DL-UL method has been shown to provide very high accuracy in [WIND23] for both intra- and inter-cell synchronisation More precisely in 20 super-frames both frequency and time synchronisation between all BSs within the cellular network can be achieved with remaining frequency offset of about 1 of the subcarrier spacing and time offset of about 10 of the guard interval respectively
According to the second method referred to as DL-only the inter-cell synchronisation is obtained without relying on UL sync signals Each UT continues to listen to the sync signals sent in DL by all other BSs measures itself the relative time and frequency offsets with respect to its own BS and feed back this information to its own BS Each BS adjusts then its clock and its oscillator according to the offset measurements signalled by the UTs within its cell An advantage of this method is that it can rely also on UTs in sleep mode since it does not require continual transmission of pilots on the UL but only the occasional feedback signalling Also for the DL-only method a very accurate convergence of the inter-cell synchronisation can be achieved under the assumption of ideal UL feedback Performance is similar to that of the DL-UL method reported in [WIND23] A proper design of such feedback signalling and the comparison of the involved overhead with respect to the DL-UL method described above should be subject of further investigation
Since the DL only synchronisation uses relative measurements the influence of the propagation delay might become smaller One additional advantage of the DL only synchronisation is that it relies on DL pilots There is an additional degree of flexibility adjacent BSs can also receive this pilots it they are able to receive DL signals and do not transmit during the pilot OFDM symbol Without changing the pilot structure the system is able to switch dynamically between UT-aided synchronisation and synchronisation based on measurements at the BS BS based synchronisation is useful in some deployment scenarios when the B2B link will give better receive signal level than the receive level at the UT (eg LOS conditions between BS) This flexibility can be conveniently exploited in TDD systems while the complexity would increase in FDD since the BS has to be able to receive DL signals Therefore it is suggested as an option in the system concept
WINNER D210 v10
Page 74 (180)
For the above described inter-cell synchronisation schemes there exists a drift of the achieved common time offset due to the propagation delay In the following a differentiated timing adaptation is proposed which can completely avoid the timing drift of stations
The idea of this method has been first proposed in [ER01] and [WER03] The systematic timing drift results from the fact that with each acquired time offset not only the actual difference of the node timings is acquired but also the distance-dependant propagation delay
In contrast to other timing adaptation methods the differentiated method only initiates a timing adaptation if a negative time offset is acquired If a positive observed time offset is acquired no timing adaptation is initiated except the case that the positive time offset is over a threshold which causes loss of synchronisation Since a positive time offset at a first station corresponds to a negative time offset at a second station the time offset will be compensated by the second station
Estimation of the propagation delays in intra-cell synchronisation Especially in the wide-area scenario large propagation delays may be observed A time-aligned arrival of signals from different UTs which is required for a joint spatio-temporal processing at the BS can be enabled if the UTs estimate their propagation delays during a so called lsquoranging processrsquo and use this information afterwards to transmit their data alligned to a common timing reference
The proposed ranging process requires two different pilot signals (T- and F-pilots) and consists of three phases an initial downlink phase a succeeding uplink phase and another final downlink phase depicted in Figure B1 where one BS and two UTs are considered The letters r and t denote the reception and the transmission status of each communication device The process is described as follows Initially the BS transmits a beacon signal which enables the UTs to perform a coarse synchronisation For this beacon signal a signal like the T-pilot introduced within the proposal above may be employed After the reception of the beacon signal each UT transmits its individual pilot which consists of a single frequency tone selected from a predefined set of equally spaced tones Each UT uses a different pilot tone At the BS the single user pilots are separated by filtering the received signal in he time domain
After a specific user pilot has been detected it is immediately retransmitted by the BS This retransmitted pilot then is detected at the dedicated UT in the same way as it is done at the BS From the temporal difference between the transmission of the UTrsquos pilot and the reception of its retransmission the UT may deduce the propagation delay
Within the simulations at an SNR of 0 dB hardly any values lying outside the range of the CIR length occurred hence the ranging process can be regarded as being robust and reliable
Figure B1 Detailed scheme of the ranging process
If the UTs retransmit their individual synchronisation tones (F-pilots) in advance by the estimated propagation delay after the ranging process has been finished a fine estimation of the carrier frequency offset may be carried out at the BS The single synchronisation tones which arrive aligned in time at the
WINNER D210 v10
Page 75 (180)
BS now are again separated by applying the filtering process from above and by averaging the slope of the phase of each separated tone information on each userrsquos carrier frequency offset may be obtained
B42 Pilot grid for generalised multi-carrier (GMC) Channel estimation by interpolation in time and frequency is considered to be an efficient solution for an OFDM-based radio interface [WIND21 WIND23] Generally a scattered pilot grid can be implemented for any GMC signal in the frequency domain on both the downlink and the uplink While blind channel estimation schemes require little or no pilot overhead their application may critically depends on the assumptions on the chosen transmission scheme With a large variety of adaptive algorithms in time frequency and space to choose from the flexibility of the WINNER radio interface might be severely compromised by exclusively relying on blind schemes Moreover as the pilot overhead of the considered pilot aided techniques is in the range of 2 to 5 per spatial stream the potential benefit of blind channel estimation techniques is limited On the other hand for highly dispersive channels andor high-end terminals blind or semi-blind schemes might provide a performance improvement and could therefore be considered as optional enhancements
In the following a generic framework for the pilot design of GMC signals is described Two types of frequency domain pilots and one type of time domain pilots are options the frequency expanding technique (FET) and Frequency domain superimposed pilots (FDSP) FET preserves and rearranges data-carrying subcarriers to accommodate pilots while FDSP obliterates data-carrying subcarriers where pilots are to be inserted Applied to OFDM FET is equivalent to a scattered pilot grid where data symbols are inserted at subcarriers where no pilots are present FDSP on the other hand can be viewed as a puncturing of the data symbols So data symbols are inserted on all subcarriers and subsequently pilots are superimposed This effectively results in an increased code rate
Frequency domain pilots for the WINNER radio interface Pilots are used for implementing certain physical layer support functions eg connection setup synchronisation mobility support power control CQI measurements and most importantly channel esti-mation Two types of channel estimation must be distinguished channel estimation for data reception (where the pilots are send at the same time) and channel estimation for adaptive transmit processing based on return link feedback or measurements (where an additional extrapolationprediction in time is required see also Appendix B52) In order to realise an efficient system the same pilots should be reused for different support functions Spatial processing however limits the potential reuse of pilots and brings along additional requirements [WIND27] In particular we need to distinguish
bull Dedicated pilots may be required if user-specific transmit processing (ie a user-specific adaptation of amplitude and phase) is applied to the data symbols These pilots are subject to the same transmit processing as the data symbols and therefore allow the receiver to estimate the effective channel HU sdot fU of user U The use of dedicated pilots for other purposes like CQI measurements is limited since they contain a power allocation specific (in most of the cases) to another user In time the interpolation is constrained by TDMA ie to the chunk duration in adaptive downlink transmission Regarding the interpolation in frequency two different types of dedicated pilots can be distinguished
o Full-band dedicated pilots having identical weights for all chunks in frequency dimension dedicated to a particular user Therefore interpolation over these chunks is possible
o Chunk-specific dedicated pilots where different weights are applied to each chunk and no interpolation in frequency domain is possible This is usually the case for user-specific transmit processing based on short-term CSI and or in case FDMA on chunk basis is used
bull Common pilots have the property not to include user-specific transmit processing and thus the interpolation in frequency is restricted by the specific channel estimation algorithm (ie related to the estimator complexity) and not by chunk specific constraints In case of user-specific transmit processing the amplitude and phase of common pilot deviates from those of the data symbols and therefore the receiver cannot detect those based on common pilots Different variants of common pilots exist eg
o A common pilot per cellsector which is transmitted omnidirectionally (ie not subject to beamforming) and normally used to support mobility-related functions It allows obtaining an unweighted channel coefficient h
WINNER D210 v10
Page 76 (180)
o Common pilots per antenna are used to obtain the unweighted channel matrix H which describes the propagation channel between any combination of transmit and receive antennas in the MIMO case
o Common pilots per beam are useful to estimate the effective channel (including the beamforming weights) and perform CQI measurements for the associated beam for fixed beamforming approaches Note that measurements on such pilots in neighbouring beams could then be used for beam handover Also the common pilots per beam benefit from the beamforming gain which reduces the transmit power required for a target channel estimation error and coverage area
Due to the fact that common pilots can be used by several users they are appealing for the downlink processing since the overall energy to perform the associated functions has only to be spent once and the pilot symbols can be spread over all resources Also they provide a basis for un-biased CQI measure-ments However certain user-specific spatial processing techniques require dedicated pilots
Multi-user precoding techniques are assumed to impose the most stringent requirement on channel estimation since high accuracy prediction of the downlink channel need to be obtained based on uplink measurements A performance degradation of 2 dB due to imperfect channel estimation requires a pilot SINR of 20 dB and channel estimator gains between 13 dB and 17 dB [WIND27] In Appendix F33 results for the channel estimator gains of the WINNER pilot specifications are presented It is shown that with pilot aided techniques the required gains of 13 to 17 dB can only be achieved with sophisticated post-processing for instance by an iterative channel estimation scheme
A careful radio interface design must balance the number of users that can be scheduled in the downlink with the number of users that can be estimated based on the uplink pilots in the TDD PLM The competition bands and the activesemi-active flow states that are discussed in Appendix C1 are tools for performing this trade-off Simulations for the linear precoding technique (SMMSE) have shown that in order to obtain sufficient SDMA and spatial multiplexing gain around 9 orthogonal pilots17 would be required per competition band
Since the requirements regarding pilot type number of pilots and pilot SNR are varying considerably a modular and scalable MIMO-pilot design should be adopted For example a combination of common pilots and additional dedicated pilots per chunk according to the requirements of the spatial processing scheme is conceivable
Common pilot symbolsDedicated pilot symbols
5 O
FDM
sym
bols
12 OFD
M sym
bols
TDD mode FDD mode
Additional pilots for non-adaptive transmissionPilots for 2nd spatial layerWith 2 spatial
layers
Df = 8
Df = 4
16 subcarriers8 subcarriers
Dt = 11
Common pilot symbolsDedicated pilot symbols
5 O
FDM
sym
bols
12 OFD
M sym
bols
TDD mode FDD mode
Additional pilots for non-adaptive transmissionPilots for 2nd spatial layerWith 2 spatial
layers
Df = 8
Df = 4
16 subcarriers8 subcarriers
Dt = 11
Figure B6 Frequency domain pilot grids for GMC signals
17 Corresponding to an average of 34 users according to the assumed user population (20 with 1 antenna 40 with
2 antenna and 40 with 4 antenna
WINNER D210 v10
Page 77 (180)
Figure B6 shows the pilot grid arrangement for the WINNER TDD and FDD modes The placement of pilot symbol within a chunk is based on the following rules (based on the framework from [WIND21 WIND23])
bull For common pilots a reasonable over-sampling factor in frequency direction would be 20mdash100 On the other hand the chunk dimension also imposes constraints on the pilot spacing To this end a constant number of common pilots per chunk is desirable For the TDD and FDD modes this translates to a pilot spacing of Df=8 and Df=4 respectively
bull For dedicated pilots the over-sampling factor should be at least 100 which also results in a pilot spacing of Df=8 and Df=4 for the TDD and FDD modes respectively
bull For channel estimation in time direction the number of available pilots is limited by the fact that half duplex FDD or TDD a mobile terminal is not able to transmit and receive at the same time Therefore the same guidelines for common and dedicated pilots apply
o For adaptive transmission the mobility of UTs must follow certain constraints which gives upper bounds on the maximum Doppler frequency This results in a total of 2 and 4 pilots per chunk for the TDD and FDD modes
o For non-frequency-adaptive transmission in the FDD mode two additional pilots are inserted in time direction to support mobile velocities up to 250 kmh totalling to 6 pilots per chunk For the TDD mode no additional pilots are necessary if at least 2 chunks per frame are used
In order to be able to estimate the channel from different antennas orthogonal pilots are required and the following principle design guidelines are possible
bull transmit pilots in frequency-multiplex (different subcarriers of one chunk) as indicated in Figure B6
bull transmit pilots in time-multiplex (consecutively on one subcarrier)
Additional code multiplexing of pilots in time as well as frequency multiplex is possible In existing MIMO-OFDM real-time test-beds code-multiplexing using Hadamard sequences on consecutive pilot symbols of one subcarrier has been extensively used and verified [MKK+05 JFH+05 JHF04] A similar design has also been proposed for fixed grid of beam techniques in WINNER (see Section 3222 of [WIND27] There each antenna is identified by an orthogonal sequence reused on all pilot subcarriers but additionally scrambled in the frequency domain Such overlapping pilot-based techniques have also been studied for adaptive uplink transmission see Appendix B52 and [WIND24] Section 311 Advantages are that the power on pilot carriers is not enhanced compared to the power of data ie the transmit spectrum is flat Moreover the reconstructed pilots can be reused for the carrier phase tracking at the receiver if the sequence is additionally stretched along the time direction over the chunk The pilot overheads of the pilot arrangements in Figure B6 per spatial stream per chunk are summarised in Table B4 The pilot overhead is defined as the ratio of the number of pilot symbols per chunk Npilot to the number of data symbols per chunk Ndata The chunk sizes are 96 and 80 symbols for the FDD and TDD modes
Table B4 Pilot symbol overheads per spatial stream per chunk
FDD mode TDD mode Tx mode
Pilots data
Non adaptive Adaptive Non adaptive Adaptive
pilots per chunk 6 4 2 2
Pilot overhead NpilotsNdata 75 5 25 25
The pro and cons of the pilot design principles in the WINNER framework are for further study This is particularly true for the various proposed MIMO schemes The assessment of channel estimation schemes for uplink single carrier signals is studied in Appendix F31 The performance of OFDM channel estimation schemes for common and dedicated pilots using the pilot grids in Figure B6 is evaluated in Appendix F32
WINNER D210 v10
Page 78 (180)
B5 Adaptive transmission
B51 Bit and power loading algorithms If channel quality information is available on each subcarrier (or chunk) is it possible to increase the performance of the radio link andor save power by performing bit andor power loading for each subcarrier (chunk) This single-user link adaptation can be used as an element in the solution of the complete multi-user adaptation and scheduling problem There are many different algorithms that realise so called water-filling concept in a multi-carrier transmission Most of them originate from the asymmetric digital subscriber line (ADSL) technology
Depending on their application existing bit and power loading algorithms can be divided into two groups
1 Algorithms that maximise the number of transmitted bits with a given total power and required BER constraints (variable bit rate)
2 Algorithms that minimise the BER with a given throughput and transmitted power constraints (fixed bit rate)
For most algorithms the average computational complexity of the analysed algorithms is proportional to O(N log(N)) where N represents the number of subcarriers (or chunks) being adaptively loaded The assessment presented in [WIND24] focused mainly on the Hughes-Hartogs (HH) algorithm [Hug91 Bin90] However from the complexity point of view this algorithm seems to be unsuitable for practical implementations (see Appendix B511) The complexity of Campellorsquos implementation [Cam98][Cam99] on the other hand is proportional only to O(N) Therefore this algorithm might be considered as a favourite one from the complexity point of view In practice however also other algorithms are much faster than the HH algorithm eg the one by Chow Cioffi and Bingham [CCB95] or the Fischer and Huber [FH96] algorithm The computational complexity may depend on the application and the channel transfer function as well Note that of the discussed algorithms only the Hughes-Hartogs and the Campello algorithm are optimum in the data rate maximisation sense For additional details please see the following discussion on complexity and implementation issues and the details given in Appendix F5
B511 Hughes-Hartogs optimum algorithm
The Hughes-Hartogs bit and power loading algorithm is a part of the ADSL modem US patent [Hug91] A detailed description of the steps of the algorithm is included in [WIND24] in the form described in [Bin90] The HH algorithm does not realise the water-pouring principle in its classical sense but it is an optimum solution for a multi-carrier transmission using QAM constellations and symbol-by-symbol detection since it spends the transmitted power in the most effective way However this procedure has high computational requirements because an extensive sorting and searching has to be performed in each step of the loop Since the average running time of the algorithm is proportional to the product of the total number of loaded bits loaded (fractional bits for coded transmission) and the number of subcarriers (chunks) it seems to be unsuitable to be implemented in systems with high data rates high granularity and a high number of subcarriers (chunks) to be adapted
B512 Chow Cioffi and Bingham algorithm This algorithm proposed by Chow Cioffi and Bingham in [CCB95] offers significant implementation advantages over the previously mentioned Hughes-Hartogs algorithm whilst the performance degradation is negligible as compared to the optimal solution Although this algorithm might be slightly sub-optimal it converges much faster as compared to the HH algorithm This is due to a limited number of internal iterations needed The authors have found that 10 iterations are sufficient to ensure the convergence of the algorithm The worst case running time of this procedure is proportional to
)2( cc NNMaxItersO +sdot (B3)
where MaxIters is the maximum number of iterations and Nc is the number of subcarriers (chunks) This figure is much lower than the average running time of the HH algorithm (see Appendix B511) Moreover the worst case running time of the CCB algorithm does not depend on the granularity of loaded bits so it is suitable for a joint code and modulation adaptation
WINNER D210 v10
Page 79 (180)
B513 Fischer and Huber algorithm
In this algorithm presented in [FH96] the data rate and power are assigned to each subcarrier to minimise the error probability The Fisher and Huber algorithm has a very low complexity even lower than that of the Chow Cioffi and Bingham algorithm According to what the authors claim the achievable performance is higher or at least comparable to the performance of the CCB algorithm However in the WINNER system case this seems to be a bit too optimistic assumption (see Appendix F5) One of the advantages of the algorithm from the implementation point of view is that the logarithms of the subcariersrsquo (chunksrsquo) noise variances are calculated only once in the beginning and stored in a memory In the main loop only additions and one division by an integer have to be performed for each subcarrier (chunk)
B514 Chunk-based single-user link adaptation in the adaptive resource scheduling framework
Adaptive transmission and scheduling in the WINNER AI concept is assumed to take place within the framework outlined in Appendix C16 For each chunk (layer) each candidate user terminal predicts the channel quality (SINR) Modulation levels inner code rates (typically using convolutional coding) and possibly power adjustments together comprise the link adaptation They are pre-computed for all chunks and all candidate flowsuser terminals This adjustment should take not only the predicted channel gain into account but also its accuracy That problem can be solved by averaging over the pdf of the power prediction error when adjusting the rate limits [FSE+04] [SF04] and Section 22 of [WIND24] Furthermore the interference level must be predicted Interference prediction remains a major research problem for WINNER II and it involves both the SDMA interference within the cell and the interference from other cells and operators
The link adaptation will in general work together with an outer code (turbo or LDPC)An appropriate criterion for the link adaptation would then be to target a constant SINR per bit This would essentially convert the fading channel into something closer to an AWGN channel as seen from the outer code
The pre-calculated chunk capacities (bits per payload symbol) that result from the link adaptation for each chunk layer and each flow form one set of inputs to the adaptive resource scheduler The scheduler uses them together with information on the queue levels and the flow priorities to allocate the next slot
B52 Channel quality prediction for adaptive transmission Adaptive transmission always involves a closed feedback loop and thus incurs a delay The allocation decision will be based on outdated channel quality information While most WINNER terminals are expected to be stationary or slowly moving this will create a problem for faster moving terminals It would be advantageous with a scheme that allows the vast majority of WINNER terminals including many of those moving at vehicular velocities to utilise adaptive transmission The situation can be improved markedly by introducing a channel predictor In [WIND24] it is shown that this enables prediction of the channel power at sufficient quality over time delays consistent with realisable feedback loops at vehicular velocities and 5 GHz carrier frequencies Adaptive transmission at vehicular velocities would not be possible if the present channel state is just extrapolated A special problem is prediction in the uplink Since several terminals will then be in competition for the whole or a part of the bandwidth they have to send pilots over the whole of this band The overhead due to these pilots would increase proportionally with the number of active terminals To prevent this overhead from becoming too large a simultaneous transmission of the pilots overlapping pilots is preferred This technique requires the terminals to be sufficiently well synchronised in time and frequency It also requires estimation of a multiple-input single-output channel based on these overlapping pilots Orthogonal symbol sequences would be used as pilots spread out over different frequencies in several chunks It should be noted that after propagation through different frequency-selective channels the received signals would no longer be orthogonal
Channel prediction can be performed in the time-domain for the impulse response [Ekm02] [SEA01] or in the frequency domain for the channel gains In [WIND24] frequency domain prediction is investi-gated It utilises the correlation between neighbouring subcarriers and the time-domain correlation between subsequent OFDM symbols in a state space model [SA03] Control symbols are used in the decision directed mode for improving the estimates Figure B7 below shows the results expressed in normalised prediction error MSE as a function of the SNR and the prediction horizon scaled in wavelengths The result is for downlink predictions for the FDD mode in cellular deployment assuming a full duplex FDD terminal that listens continuously on the downlink pilots The Urban Macro channel model has been used Note the large dependence of the performance on the SINR
WINNER D210 v10
Page 80 (180)
Figure B7 FDD downlink prediction accuracy in terms of the normalised channel prediction MSE as a function of the prediction horizon scaled in carrier wavelengths and the SNR Results for FDD
downlink over Urban Macro channels using a Kalman algorithm that utilises 8 subcarriers
Adaptive transmission tofrom a terminal will be feasible up to a maximal velocity for a given SINR or equivalently down to a limiting SINR at a given velocity For combinations of velocities and SINRs beyond such a boundary non-frequency-adaptive transmission must be used In [WIND24] a preliminary finding is that the normalised prediction error level 015 indicates the location of this boundary rather well when using adaptive convolutional coding combined with BPSK or M-QAM Based on this one may calculate the approximate SNR boundaries for different velocities different predictor designs and different designs of the adaptation feedback loops The results in Figure B7 are for the adaptation loop designs presented in Section 31 of [WIND24] For the FDD mode it is based on downlink channel prediction 25 slots ahead at the terminals In uplinks channel prediction is based on overlapping pilots at the base station For the short-range TDD modes the prediction is assumed to be performed by the user terminals (A scheme that moves the predictor to the base station is of course also possible) The required prediction horizons to the far end of the predicted chunk scaled in the carrier wavelength λc at 5 GHz are also shown in Table B5 For further results please see Section 31 of [WIND24] or [SFS+05]
Table B5 SINR limits for cases where the accuracy limit 150~2 =σ allows the use of adaptive transmission exemplified for three terminal velocities for a 5 GHz carrier frequency Also shown
are required prediction horizons in carrier wavelengths From [WIND24] Table 32
30 kmh 50 kmh 70 kmh
TDD downlink (prediction horizon 2 slots) lt 0 dB (0094 λc) 5 dB (0156 λc) 10 dB (0219 λc)
TDD uplink (prediction horizon 3 slots) 5 dB (0150 λc) 15 dB (025 λc) gt 25 dB (035 λc)
FDD downlink (Figure B7) lt 0 dB (0117 λc) 6 dB (0195 λc) 125 dB (0273 λc)
FDD uplink 2 users in competition band 0 dB (0117 λc) 7 dB (0195 λc) 15 dB (0273 λc)
FDD uplink 8 users in competition band 35 dB (0117 λc) 11 dB (0195 λc) 20 dB (0273 λc)
In these examples adaptive transmission can be expected to work in the widest variety of situations in the proposed wide-area FDD downlinks and short-range TDD downlinks while it works in the narrowest range of circumstances in the proposed short-range TDD uplink that requires the longest prediction hori-
WINNER D210 v10
Page 81 (180)
zon The case of wide-area FDD uplinks using overlapping pilots falls somewhere in-between The performance deteriorates with the number of simultaneous users that transmit overlapping pilots but this deterioration is not severe
B53 Compression of channel state feedback for adaptive transmission This section contains a brief summary of results from Section 314 in [WIND24] and and additional results on multi-antenna systems Assume that one or several clients within a terminal are in competition for a sub-bandwidth of the total band comprising N chunks (one-antenna SISO transmission is assumed here) K active terminals compete for this competition band Assume that each terminal feeds back a proposed code and modulation rate for each chunk For a scheme with r rates each terminal then needs to feed back N log2(r) bits per chunk duration Tchunk For K users the required total feedback data rate is then
chunkf TrKNR )(log2= [bits]
For a 40 MHz FDD downlink with N = 104 chunks and with r = 8 code and modulation rates we would have a feedback overhead of 925 kbits per active user Expressed in another way for each chunk for which K downlink users compete K log2(r) feedback bits would have to be transmitted in the following uplink chunk The FDD mode chunks of Appendix C3 contain 96 symbols With around 80 non-pilot symbols per uplink chunk K = 8 active terminals with r = 8 would consume 2480 = 30 of the uplink bandwidth for control signalling if one feedback bitfeedback symbol can be used on average The situation described here is clearly unacceptable Fortunately there are several ways in which the required feedback rate can be reduced significantly
The channel gains and SNRs at adjacent chunks will be highly correlated (If they were not the chunk widths would have been selected too wide and we would have severe problems with channel variability within the chunks) This correlation can be utilised to reduce the feedback rate The channels are also correlated in time Furthermore it is likely that in most cells except those situated close to major roads the large majority of terminals will not travel at vehicular speeds but rather be stationary For those terminals very little feedback is required
In Section 314 of [WIND24] several principles for compression are introduces and evaluated Lossless compression of the modulation-coding rates could for the considered ITU Vehicular A and Pedestrian A channels be performed at rates close to 091 bitschunk and 035 bitschunks respectively
Significantly lower feedback rates can be attained by using lossy compression of the SINR This method provides the added benefits that SINR-values not only suggested rates are fed back This enables the scheduler to select intelligently among users who would have suggested the same rates for a given chunk The net effect is that lossy compression of SINR values is superior to lossless compression of suggested modulation-coding rates It enables us to attain both lower feedback data rates and a higher performance in terms of the attained spectral efficiency when performing multi-user scheduling The suggested coder uses transform coding (discrete cosine transform DCT) to compress the SINR data in the frequency direction It combines this with sub-sampling in the time direction to obtain a further compression due to the temporal correlation Motivations for these design choices are discussed in [WIND24] The resulting algorithm is summarised by Figure B8 and Figure B9 below
FFTRx
Cal
cula
tech
unk
SN
R
DC
T
Sca
lar
Qua
ntiz
ers
104 104 104
Sub
-sa
mpl
ing
Tx feedback
FFTRx
Cal
cula
tech
unk
SN
R
DC
T
Sca
lar
Qua
ntiz
ers
104 104 104
Sub
-sa
mpl
ing
Tx feedback
Figure B8 A block diagram of feedback handling in the terminal
Q-1
Receivedfeedback
Ups
ampl
ing
IDC
T
104 104104
ChunkSNR
Sche
dulin
g
Q-1
Receivedfeedback
Ups
ampl
ing
IDC
T
104 104104
ChunkSNR
Sche
dulin
g
Figure B9 Block diagram of feedback handling at the base station
WINNER D210 v10
Page 82 (180)
With the discussed compression of SINR predictions only 025 bitschunk are required for the Vehicular A channels and 012 bitschunk for the Pedestrian A channels when all users travel at 50 kmh and the modulation-coding scheme uses r = 8 rates If the mobile speed is reduced it will be possible to further sub-sample the coded feedback information For example at 5 kmh it would be possible to reduce the feedback information further by a factor of 10 With a feedback rate of 025 bitschunk over the Vehicular A channel we would only need 4 bits per chunk to accommodate 16 vehicular 50 kmh users per competition band in addition to many more stationary users Uplink feedback with only four 4-QAM symbols per chunk that use rate frac12 coding is adequate for this
For multiple antenna systems the required feedback rate will of course increase proportionally with the number of virtual antenna streams for which the channel quality feedback is required If not only real-valued channel quality SINR values but channel state information in the form of complex-valued matri-ces is required this will increase the feedback requirements quite substantially In [KBLS06] a method is described that can significantly reduce the required CQI feedback using vector quantisation techniques
An example of a system with four transmit antennas and one receive antennas that would need 32 bits if all four complex gains were represented by 8 bits each Using an optimised quantiser it is possible to use only one or two bits and still reach a significant portion of the performance for perfect CSI Especially for scenarios where long-term CSI is available at the transmitter this additional information can be efficiently exploited by combining a fixed quantisation scheme for the short-term CSI with a linear transformation that only depends on the long-term CSI The resulting feedback requirement may still be high for adaptive multi-user transmission However further reductions can be expected by utilizing the temporal correlation as was outlined for the SISO case above
WINNER D210 v10
Page 83 (180)
Appendix C MAC System Layer Functions This appendix gives more details on the services and functions within the MAC modes that were presented in Chapter 3 Appendix C1 below gives brief descriptions of the resource and transmission control functions for in the two cellular MACs The functional architecture of the peer-to-peer MAC is outlined in Appendix C2
The functional description of the PHY system layer is important for understanding the transmission but it has been left out from this report to save space It can be found in Section 552 of [WIND76]
C1 Functional architecture of the WINNER medium access control for FDD and TDD cellular transmission The presently assumed design of the MAC system layer for FDD and TDD cellular transmission was outlined in Section 31 see Figure 33 and Figure 34 The implementations of these two MAC modes are common to about 90 and their interfaces to higher layers are identical They will therefore be described together below with mode-specific differences indicated when they appear
The description follows the presentation in Section 54 of [WIND76] Since the delivery of [WIND76] the design has been refined and modified on several points As compared to the presentation in [WIND76] the design has been modified as follows
1 The PHY control signalling is under current investigation It has been re-organised so that a major part of the transmit control processing is executed by the MAC system layer As outlined by Figure 33 three special PHY services can be invoked transferring control packets
a Transmission together with the BCH packets in the super-frame preamble b Use of non-frequency adaptive transmission c Use of special time-frequency resources earmarked for control transmission via the
service Special Transmit Control Signalling PHY service In addition piggybacking of control bits in ordinary packets may also be used
2 Measurements are as before provided as a PHY layer service They may also be provided in
further processed form as a MAC system layer service The partitioning of processing of measurements is under current discussion and will continue to be investigated in WINNER II
3 The transport channel TCC for control flows has provisionally been added to aid investigations
on the design of protocols that supports all required control messaging 4 Antenna calibration has been added as a function within the spatial scheme controller
The sections below describe all the main control functions that are introduced in Figure 33 Appendix C15 summarises how different transport channels are handled as illustrated by Figure 34 The resource scheduler (Appendix C16) is a crucial system element of the WINNER design it is in a sense the ldquospider in the netrdquo of the whole design Appendix C17 provides additional discussion on the problem of SDMA and spatial user partitioning Finally Appendix C18 summarises the time scales on which the different functions work
C11 MAC radio resource control Resource partitioning and constraint combining The problem that the resource partitioning has to solve is the structural preparation of the next super-frame outlined in Section 314 The time-frequency chunk is the basic unit for subdividing the radio resources The partitioning of the super-frame between different transport channels will be performed with chunk granularity Reuse partitioning between cells is supported18 It must be performed with guard-bands due to the non-orthogonality introduced by large time delays See Appendix G73 It has to be performed in terms of wider frequency resource units since the guard bands would otherwise represent too large an overhead The resource partitioning may be changed on a super-frame basis but most parameters will typically stay unchanged over longer time horizons In TDD one single super-frame is to be defined In FDD separate uplink and downlink super-frames are to be specified see Annex A31 of [WIND35] The uplink and downlink super-frames will normally use differing allocations
18 See Section 52 in [WIND32]
WINNER D210 v10
Page 84 (180)
The resources of the next super-frame are allocated and subdivided in the following sequence bull First all constraints on the use of chunks are updated by the Constraint combining function of
the constraint processor at the BS It receives control inputs from the RLC on restrictions due to spectrum sharing and interference avoidance with neighbouring base stations At the BS the spatial properties of the restrictions are re-calculated in terms of BS antenna transmission properties19
The subsequent steps are performed by the Resource partitioning function that is implemented in the MAC control plane at the base station
bull DAC assignment A (nonzero) set of consecutive chunks is reserved for DAC (contention-based traffic) In the TDD mode these resources may also be used for peer-to-peer traffic This assignment is placed in the frequency region that is assumed available everywhere (Figure 32)
bull RN assignment In cells that include relay nodes sets of chunk beams are reserved exclusively for transmission between these RNs and UTs Each set is reserved either for single RNs or for a group of RNs that will create little mutual interference Furthermore resources may be allocated for use in the relay links between BSs and RNs
bull TDC adaptive transmission assignment The remaining chunks are divided for use by adaptively and non-frequency adaptively scheduled flows respectively This division is based on the history of the previous traffic demand
bull The set of chunks reserved for adaptive transmission may be further divided into competition bands where one stream normally uses only a single band These competition band allocations are updated if required
The super-frame has now been constructed Control messages that specify the allocation are transmitted from the BS at two instances In the case of two-hop relaying the resource partitioning information is thereby distributed to all the participating UTs at the beginning of the following super-frame
bull The RN partitioning is transmitted from the BS to the RNs over the relay link in chunks that are reserved for control signalling within the present super-frame
The remaining control information is transmitted by the BS to the UTs This is done during the downlink control part within the preamble of the super-frame being defined In the here-considered case of two-hop relaying it is the next super-frame Simultaneously each RN transmits the RN assignment to the UTs under its control For more details please see Section 634 of [WIND35]
C12 MAC radio resource control Flow setup and termination New uplink and downlink flows are established by the Flow establishment RRM function in the RLC system layer It requires the detailed setup of a flow context over each involved hop That flow context establishment is executed by the MAC flow setup function Flow context release is initiated by the RLC and is executed by the MAC Flow termination function In the case of per stream rate control (PSRC) see Appendix B1 several queues per flow are used
When a new downlink flow is established it is given a local flow address that is unique within the cell Its destination UT (or UTs in the case of CDC point-to-multipoint flows) is notified and a resource scheduling buffer queue is initialised
In the FDD mode flows tofrom half-duplex terminals are assigned to one of four groups Group 1 transmits in the downlink the first half of the frame and in the uplink during the latter half Group 2 transmitsreceives in the opposite way Group 3 contains half-duplex terminals that have adaptable and flexible uplink and downlink transmission periods Full-duplex terminals belong to Group 4
TDC flows are initially assigned either for adaptive or for non-frequency adaptive transmission by the flow setup controller The choice is based on the capability of the terminal the average SINR and the velocity of the terminal The choice is also affected by the potentially available spatial schemes and their CSI and CQI requirements The initial assignment may be changed later if the circumstances change Flow setup in relay-enhanced cells is discussed further in Section 635 of [WIND35]
19 In a grid-of-beams implementation constraints on the transmit power used in each beam may be used In the
general case constraints on the transmit covariance matrix may be used
WINNER D210 v10
Page 85 (180)
C13 MAC radio resource control Spatial scheme pre-configuration and selection A base station or relay node can have one or multiple antennas These antennas can be localised or may constitute a distributed antenna system eg comprising all antenna elements within a building A general spatial processing scheme for MIMO transmission and spatial domain link adaptation has been defined [WIND27] It includes multiplexing diversity-based transmission fixed beamforming and adaptive beamforming as special cases see Appendix B1 The spatial scheme controller performs a baseline spatial scheme selection process It is invoked to select an appropriate spatial transmit scheme for the newly established flow This selection is based on the terminal capabilities the BS antenna capabilities and the choice of adaptive and non-frequency adaptive transmission In addition the interference properties of other flows and their demand for spatial channels influence the decision Also for already established flows the spatial processing scheme can be changed by the Spatial Scheme Controller To reduce the complexity of this process a split in two functions and temporal layering is used
bull Spatial scheme pre-configuration performs static and long-term trigger-based assignments These assignments serve as inputs and constraints to the next step
bull Spatial scheme selection determines the dispersion code (degrees of spatial diversity and spatial multiplexing) the possible use of per stream rate control and the possible use of and type of precoding
staticdecisions and
constraints
Spatial SchemePreconfiguration
Spatial SchemeSelection
long-termdecisions and
constraints
each superframe
several superframescell configuration update
staticdecisions and
constraints
Spatial SchemePreconfiguration
Spatial SchemeSelection
long-termdecisions and
constraints
each superframe
several superframescell configuration update
Figure C1 Overview of temporal layering of the MAC functionalities Spatial scheme pre-configuration and selection within the spatial scheme controller
The Figure C1 above illustrates these functions and the different time scales at which they operate The static part of the spatial scheme pre-configuration evaluates all parameters decisions and constraints that can only be changed with an update of the basic cell configuration including the physical layer mode type of deployment (cellular isolated hot spot) cell range and the base station (BS) antenna configuration Furthermore mapping tables indicating the possible spatial schemes for each transport channel and terminal capability as well as a list of possible combinations of dispersion code PSRC and precoding type can be generated at this stage
The long-term part of the spatial scheme pre-configuration evaluates all parameters decisions and constraints that normally change on time scales greater than one super-frame or issues that cannot be decided on a per-flow basis like the overall selection of a scheme that applies to all users of a cell (eg configuration of a fixed beam approach or multi-user precoding) Slowly varying parameters include user distribution user speed quality of CQICSI information the flowsrsquo QoS parameter and long-term channel characteristics like average SINR long-term channel rank and eigenvalues Also certain flow-specific decision will be long-term oriented eg the decision between long-term and short-term spatial processing
Spatial scheme selection performs the remaining decisions based on decision criteria that change on a short-term basis include eg number of active users cell load (due to packet-oriented transmissions) and the short-term channel characteristics The spatial scheme selection considers these parameters and adapts the spatial scheme per flow under the constraints set by the spatial scheme pre-configuration
An important additional part of the Spatial Scheme Controller is the calibration function Calibration is required to relate a desired spatial distribution of energy in space to specific transmit weights and to allow exploitation of channel reciprocity in the TDD mode despite of RF front-end imperfections The calibration function checks the calibration status of a link with the particular requirements of the selected spatial processing technique and triggers the corresponding calibration procedure if required Calibration
WINNER D210 v10
Page 86 (180)
is therefore invoked at flow setup and each time either the selected spatial scheme is altered or the calibration status changes (eg temporal expiry)
C14 MAC control feedback The definition of service primitives for the MAC Control Feedback service is driven completely by the demand for such feedback from the RLC system layer and the IP Convergence layer In principle all outputs from the main function blocks and even internal states of these function blocks could be made visible to upper layers to enable various forms of inter-layer interaction The set of required feedback parameters is under discussion It includes SLC Cache levels (see below) as well as resource use per flow
C15 Radio packet transfer Transmission and reception The transmission control is performed in cooperation with the QoS control of the RLC system layer A Service Level Controller (SLC) Cache with per-flow queues for all downlink TDC CDC and DAC flows is assumed to be implemented within the MAC at each BS and RN For uplink flows corresponding buffers are present at each RN and UT The RLC layer Service level controller and flow scheduler (Section 41 and Appendix D12) controls the inflows to the BS SLC Cache and monitors its state The outflow from the SLC Cache is under control of a MAC - For BS-to-UT downlinks and BS-to-RN relay links the MAC at the BS controls the transmission - For UT-to-RN uplinks the MAC at the RN controls the transmission - For UT-to-BS uplinks the MAC at the BS controls the transmission Packet transmission and reception will be handled differently for the five transport channels BCH packets and RAC packets are encoded at transmission and decoded at reception but are not processed further by the MAC layer TDC CDC and DAC packets are processed by a more elaborate transmit and receive sequence that is divided into five protocol sub-layers as illustrated by Figure 34 MAC-5 Performs optional segmentation and reassembly of MAC SDUs (ie RLC PDUs) MAC-5 also performs flow identification at reception MAC-4 Sender adds CRC resulting in a retransmission unit (RTU) Receiver checks CRC and may ask for retransmission in case of error The retransmission mechanism is denoted MAC retransmission MAC-3 Sender performs optional segmentation of RTUs into encoding blocks The receiver then performs reassembly of received blocks into RTUs MAC-2 Coding of each encoding block results in an FEC block (forward-error-correction coded block) that is saved in the appropriate RSB queue The receiver decodes each FEC block It may also perform (soft) combination with retransmitted FEC blocks This encoding decoding will in the following be referred to as the outer code Encoding and decoding schemes have been discussed in Appendix B2 MAC-1 Performs puncturing of FEC blocks and resource mapping onto assigned chunks Resource mapping is a separate main function of the MAC user plane The protocol sub-layers MAC-5ndashMAC-2 may all be transparent ie their functions are optional Special cases of this transmission sequence accommodate all retransmission schemes and segmentation strategies that are at present under consideration The design outlined above performs segmentation and encoding before the mapping onto chunks It thus decouples the segment size used for retransmission from the chunk size It also decouples the code block size from the chunk size in a practical way These factors are also important when the WINNER radio interface concept is used as a test-bed to compare and evaluate different combinations of MAC retransmission strategies and coding schemes
For BCH the mapping onto super-frame control symbols is controlled by the Resource partitioning function For TDC CDC and DAC the Transfer control function supervises both transmission and reception The transmission control is focused at fast transfer via the physical layer
bull For adaptively allocated TDC downlink flows a transmission can be initiated during the downlink part of frame j and then be performed during the downlink slot of frame j+1
bull For adaptively allocated TDC uplink flows a transmission can by requested during frame j prepared and scheduled during frame j+1 and then be performed in the uplink slot of frame j+2
WINNER D210 v10
Page 87 (180)
bull For non-frequency adaptively allocated TDC and CDC downlink flows the scheduling can be determined during frame j An allocation table is transmitted in the first DL OFDM symbol of frame j+1 The transmission can then be performed either within frame j+1 or during frame j+2
bull For non-frequency adaptively allocated TDC uplink flows the transmission is initiated during frame j and is then performed in the uplink slot of frame j+1
Thus the delay from initiation of a transmission to its completion is 10ndash25 frames (07ndash17 ms) over one hop Multi-hop transmission will add to the total delay The roundtrip delay until a MAC retransmission can be performed depends on the decoding delay The computation speed estimates presented in Table B2 in Appendix B21 is around 200 kbitms The additional decoding delay for the outer code should then not exceed 01 ms for RTU sizes of interest (up to 1520 bytes)
The transmission of packets belonging to the different transport channels is summarised below
TDC (downlinks and uplinks) Packets in scheduled Targeted Data Channel flows are optionally segmented and then coded using the transmission sequence outlined above The FEC blocks are buffered by per-flow queuing in the resource scheduling buffer Scheduling and the subsequent mapping is then performed by either the adaptive or the non-frequency adaptive resource scheduling algorithm depending on the assignment of the flow Thereafter transmission proceeds using the PHY Adaptive transfer or Non-frequency adaptive transfer services At reception complete FEC blocks are delivered to the MAC In downlinks the MAC at the BS or RN controls the transmission In uplinks packet transmissions are initiated by UT requests The MAC at the BSRN with which the UT communicates controls the subsequent scheduling transmission and retransmission
CDC (downlinks only) The point-to-multipoint transmission has to deal with a wide variety of channels and directions to the destination users This complicates the adjustment of the transmission parameters and the use of beamforming To reduce the problems a CDC flow may be partitioned into separate copies targeted flows which are destined to specific groups (clusters) of users in different directionswithin different beams A CDC flow is processed through the MAC-5ndashMAC-2 protocol layers The resulting FEC blocks are copied into one or several queues in the RSB one queue for each targeted flow Scheduling and mapping of each targeted flow then proceed by non-frequency adaptive transmission with transmission parameters that are adjusted in a conservative way The transmission uses the PHY Non-frequency adaptive transfer service At reception complete FEC blocks are delivered to the MAC where they are decoded Packets (MAC SDUs) are finally recombined if segmentation was used A reliable multicast service may utilise retransmission The retransmissions could be triggered by NACKs from any of the destination users of a targeted flow Schemes that combine this mechanism with ACKs from the terminal with worst channel are also possible
DAC (uplinks only) Contention-based transmission is potentially the best way of transmitting uplink flows that have small packets with a low packet arrival rate The main current proposal for contention-based transmission is a scheme that uses carrier-sense multiple access and therefore requires a constant set of frequencies to be assigned exclusively during the whole super-frame When an uplink packet destined for contention-based transmission is drained from the SLC Cache at the UT it is prepared for possible retransmission and then coded The same function blockssub-layers as for TDC and CDC transmission are used but the parameter settings may be different The FEC blocks are transmitted by using the PHY contention-based transfer service Received DAC FEC blocks are decoded and the RTUs are possibly retransmitted if an error is detected
BCH (downlinks only) The BCH packets contain control signalling from higher layers The range of their reliable reception places an upper bound on the size of the cell These downlink broadcast channel packets are combined with super-frame control information The combined packets are low-rate encoded in the MAC combined with space-time-frequency (inner) encoding performed at the PHY layer Transmission and reception proceeds via the PHY BCH and SF control transfer service Retransmission cannot be used Adjacent BS and RN should use orthogonal time-frequency sets within this timeslot for their downlink preamble control transmission to limit their mutual interference
RAC (uplinks and for TDD BS-to-BSRN) The Random access channel can be used for initial access to a BS or RN by the UTs eg after handover RAC packets are coded and then transmitted in the reserved time-slot of the super-frame preamble in a contention-based manner Transmission and reception proceeds via the PHY RAC transfer service The MAC protocol and transmission strategy for this channel has not yet been defined
The RAC time-slot can in TDD systems can also be used for BS-to-BS and RN-to-BS over-the-air control signalling A BS or RN involved in this transmission would use the RAC for transmission in a few super-frames while it listens for reception in the others
WINNER D210 v10
Page 88 (180)
C16 Resource scheduling The Resource scheduler determines the resource mapping for TDC and CDC flows It utilises two scheduling algorithms
bull The Adaptive resource scheduler used for high-performance TDC transmission
bull The Non-frequency adaptive resource scheduler used for all CDC flows and as a fallback alternative for TDC flows It is also foreseen to be used for parts of the control signalling
These algorithms take priorities from the RLC Service Level Controller into account as well as the queue levels in the RSB and the SLC Cache
In addition the resource scheduler contains several support functions Spatial link adaptation Uplink slow power control Active set selection RS parameterisation and Allocation Statistics that will not be discussed further here
bull The adaptive resource scheduling and transmission uses predictions of channel quality information (CQI) to utilise the small-scale and frequency-selective variations of the channel for different terminals The scheduler assigns a set of chunk layers (see Section 132) within the frame to each flow After scheduling the RSB queues are drained with bit-level resolution The bits from each flow are mapped onto the assigned chunk layers This mapping is exclusive ie several flows do not share a chunk layer The transmission parameters within each chunk layer are adjusted individually through link adaptation to the frequency-selective channel of the selected user This link adaptation may use combinations of adaptive modulation (inner) coding that is adjusted to each chunk and power control The link adaptation can be designed to provide a target SINR per bit for the FEC blocs that are coded with the (outer) FEC code It then converts the fading channel into something approximating an AWGN channel as seen by the outer code Link adaptation may be combined with spatial multiplexing for example in the form of per-stream rate control where different FEC blocks of one flow are mapped to different chunk layers By selecting the best resources for each flow multi-user scheduling gains can be realised The scheduling algorithm should take into account the channel quality information of each user in each chunk layer the RLC flow transmission requirementspriorities and the queue levels Timely channel quality information requires the SINR within each chunk layer and for each candidate terminal to be predicted with relatively high accuracy The most advanced multi-antenna transmit schemes furthermore require the whole MIMO channel gain matrix to be known at the transmitter This is denoted full channel state information (CSI)
bull Non-frequency adaptive resource scheduling and transmission is instead based on averaging strategies Such transmission schemes are designed to combat and reduce the effect of the variability of the SINR by interleaving space-time-frequency coding and diversity combining Non-frequency adaptive transmission is required when fast channel feedback is unreliable due to eg a high terminal velocity or a low SINR [WIND24] or when the terminal does not support adaptive transmission It is also required for point-to-multipoint communication belonging to the common data channel (CDC) flows The non-frequency adaptive transmission slowly adapts to the shadow fading but it averages over the frequency selective (small-scale) fading It requires the FEC blocks to be mapped on a set of chunks that are widely dispersed in frequency and if possible on different antennas to maximise the effectiveness of the coding and interleaving
Figure C2 below gives an overview of the downlink transmission of scheduled flows Among other things this figure illustrates that two scheduling entities control the flows and have to cooperate The Flow scheduler at the RLC system layer is part of the Service level controller (Section 41 and Appendix D12) The Resource scheduler at the MAC system layer works on a faster time scale and takes the channel properties into account The adaptive RS uses detailed knowledge of the available resources the non-frequency adaptive RS has to work with more crude measurements of the average channel qualities In the present design these SLC and the RS interact in a very simple way The SLC fills the SCL Cache while the RS is responsible for draining it The SCL furthermore reports priorities of each flow to the RS Only a few priority levels are used The RS drains the queues and allocates the transmission resources in a way that optimises a criterion that takes the queue levels and the priorities into account Existing algorithms with very low computational complexity can be used to solve the resource scheduling problem when formulated in this way See eg Chapters 6 and 7 in [Eri04] These algorithms have computational complexity that grows linearly with the number of scheduled resources and linearly with the number of scheduled flows Execution times below 01 ms can be attained which is consistent with the very fast transmission strategies outlined in Appendix C15 above
WINNER D210 v10
Page 89 (180)
Service Level Controller
Resouce Scheduler
Packet Processing
IFFT beamforming pulse shaping
Tchunk
Optional SLC buffer
Time
Virtual antennalayer Frequency
RLC
MAC
PHY
CQI CSI Buffer levels CQI errors
Antenna 1 Antenna N
Non-frequency-adaptive Resource Scheduler
Adaptive Resource Scheduler
Map on dispersed chunks Map on optimal chunks
Constraint Processing
(= End-to-end ARQ buffer)
- Scheduled Mapping onto chunks and layers - Link adaptation
Segmentation FEC Coding
SLC cache at BS
Per-flow flow control - Inter-flow fairness - Service constraints - Total delay contraints
Resource scheduling buffer
at BS or RN
TDC CDC
Flow classification Convergence layer
Spectrum mapping
and assignment
Figure C2 Data flows and some control functions in downlinks of the scheduled data channels
Adaptive transmission requires prediction of the channel quality due to the transmission control loop delay In [WIND24] summarised in Appendix B52 the predictability and attainable prediction accuracy is investigated as a function of the SINR and the terminal velocity The effect of the prediction errors on the attainable adaptive transmission performance and on attainable multi-user scheduling gain was investigated Fast adaptation control loops are a part of the WINNER design With correspondingly low delays adaptive transmission was found feasible at vehicular velocities at 5 GHz carrier frequencies A SINR and velocity-dependent boundary delineates when adaptive or non-frequency adaptive transmission is the best alternative (Appendix B52) This decision is taken at flow setup and may be changed later
Both downlink and uplink power control is supervised by the Resource scheduler and is integrated into the optimisation of the transmission parameters
A novel framework had been developed for handling the spatial dimension of the multi-user scheduling and link adaptation problem It integrates various SDMA (spatial division multiple access) strategies into the total solution
WINNER D210 v10
Page 90 (180)
[yes][no]
exit conditions could also be based on some quality metric instead of a fixed number of iterations
x stands for either adaptive or non-frequency adpative
This message determines the active set for the next frame
Upd
ate_
cons
train
ts(F
cbS
cb)
Spa
tial_
sche
me(
flow
num
ber)
su_la gtmax_su_la
mu_la gtmax_mu_la
su_la=su_la+1
RSB
_sta
tus(
Que
ue_s
tate
s_CD
C
Que
ue_s
tate
s_TD
C)
Upd
ate_
mea
sure
men
ts(C
QI_
pred
ictio
ns)
MAC_URSB
MAC_CSpatial Scheme SelectionMAC_CConstraint Processing
PHYMeasurements
mu_la=mu_la+1su_la = 0
Spatial userpartitioning
[yes]
[no]
Upd
ate_
flow
_sta
tes(
RS_a
ctiv
e_se
t_D
LU
L)
MAC_UQueue State Control
Channel-adaptivemulti-userscheduling
send
_enc
oded
_bits
(poi
nter
num
ber_
of_b
its)
PHYx TransferSend
PHYTransmit Control Signaling
Active setselection for
frame j+1
Preliminary spatialsingle-user link
adapatation
Link adaptation
Resource Mappingfor all flows in
frame j+1
Figure C3 Resource scheduling sequence overview (adaptive and non-frequency adaptive)
As outlined by Figure C3 above adaptive multi-antenna link adaptation and scheduling is separated into four steps to limit the computational complexity so that a fast feedback loop is obtained
1) Spatial user partitioning ie separation of users into spatially well separated sets
2) Preliminary single-user link adaptation for each potential user and potential resource
3) Channel-adaptive multi-user scheduling within the sets of spatially highly-interfering terminals using the chunk capacities calculated in step 2 (In case of non-frequency adaptive transmission only slow adaptation to the shadow fading is used)
4) Final link adaptation resource mapping and transmission of the selected flows using either the link adaptation parameters that were determined in step 2 or iteratively refined schemes
The sequence can be iterated a few times to improve the estimate of the spatial inter-set interference
Step 1 the spatial user partitioning will be discussed in more detail in Appendix C17 below Step 2 the single-user link adaptation was discussed briefly in Appendix B514
The channel-adaptive multi-user scheduling should in general be designed to take queue levels into account as discussed above In the simulation evaluation investigations presented in Appendix G below the simplification of a full queue model was used The following simple resource scheduling strategies were used in most of the investigations on adaptive transmission
bull Round robin ie periodic allocation to all flows
bull Max rate scheduling ie giving the resource to the flow that can have the highest throughput
bull Score-based scheduling [Bon04] a modified proportional fair strategy
To reflect the bursty nature of packet flows and to limit the transmission overhead each adaptively allocated TDC flow shifts between the following states
bull Passive The flow has an empty RSB queue and no packet in the SLC Cache Minimal transmission control signalling is required Terminals may be in micro-sleep mode except during specified control transmission time-slots
bull Semi-active This state is only used for adaptively allocated TDC flows The flow has segments in queue but is not eligible for scheduling during the present frame
bull Active The flow is eligible for scheduling during the present frame The full transmission control loop is up and running
WINNER D210 v10
Page 91 (180)
The transition between these three states and the corresponding PHY control messaging is governed by the Queue state control function within the Flow state controller and the active set selection in the RS The queue state is updated every slot (half-frame)
In cells with few flows all flows with packets to transmit will be in the active state In cells with many flows assigned for adaptive transmission the access to the active state can be restricted to limit several types of complexity and overhead The scheduling computational complexity the downlink control overhead the channel prediction complexity and the CQI and CSI feedback signalling overhead
C17 SDMA and spatial user partitioning The task of spatial user partitioning is to separate the user terminals into spatial sets with low mutual interference The aim is to group the user terminals so that their correlation matrix (power at receiver i resulting from a downlink transmission to terminal j) becomes approximately block diagonal Highly interfering terminals are placed into the same spatial sets members of pairs with mutual interference below a pre-defined threshold can be placed in different sets Once such spatial sets are established we can use SDMA for flows of different sets Such groups of flows that share a chunk are called (spatial user) groupings Other multiple access schemes (such as TDMA FDMA) are used to avoid interference when transmitting tofrom users within the same set The sets can be thought of as (generalised) beams They are reached by using specific spatial precoding (beamforming) weights
The spatial user partitioning allows controlling the interference generated by SDMA by setting appropriate interference thresholds during the generation of the spatial sets Therefore the allowed SDMA interference can be considered in the overall interference prediction used for in resource scheduling in the individual spatial sets To a first approximation we can therefore assume that the subsequent multi-user scheduling can be performed independently within each spatial set of terminals This reduces the computational complexity drastically spatial user partitioning reduces the problem of multi-user multi-antenna scheduling to that of performing chunk-adaptive multi-user scheduling within the individual sets
The procedure to obtain such spatial sets depends on the amount of channel knowledge at the transmitter If channel state information (CSI) is available at the transmitter the spatial sets can be generated by calculating the mutual correlation between users If only a channel quality indicator (CQI) is available so-called opportunistic or grid-of-beams beamforming approaches are used
As the number of users increases it becomes increasingly complex to find spatial sets with good separation properties and testing all possible terminal combinations must be avoided20 We may then partition the time-frequency resources into two or more groups and assign subsets of users to each group These subsets of user terminals are called orthogonal groups If this grouping is performed properly it simplifies the task of forming well-separated spatial sets within each orthogonal group Different criteria to form orthogonal groups are conceivable eg
bull For fixed beamforming the users associated to beams that can be transmitted concurrently with inter-beam interference below a pre-defined threshold can form one orthogonal group
bull For adaptive precoding terminals can be grouped according to their SINR requirements (ie according to their target data rates and interference suppression capabilities) This allows using different SDMA interference thresholds in the different groups It therefore improves the overall opportunities for SDMA (which would otherwise be limited over all resources by the weakest terminal)
The SDMA decision must be integrated in the overall resource allocation process ie the decision must integrate the priorities due to QoS contracts and the opportunities and constraints due to the spatial channel characteristics The numbers of users served concurrently by SDMA is a parameter which has a significant impact on the performance the throughput gain offered by serving multiple users at the same time comes at the expense of serving each user with a smaller fraction of the available transmit power
An example of the use of SDMA and spatial user partitioning is given in Appendix G22 Furthermore a specific algorithm for creating spatial groupings is discussed in more detail below
20 The complexity is especially severe in cases where CSI is used at the TX for precoding because the precoding solution depends on the combination (and possibly also on the user ordering) to be tested and again differs for every chunk
WINNER D210 v10
Page 92 (180)
Low Complexity Space-Time-Frequency User Partitioning for MIMO Systems with SDMA
The algorithm was originally derived for a precoding technique that forces the interference to be zero between all users that are served simultaneous via SDMA Even if no interference is present spatial scheduling is of crucial importance If users with spatially correlated channel subspaces are served jointly this leads to inefficient precoding matrices and a drop in the strength of the equivalent channel after precoding The goal of the algorithm is therefore to group together users with uncorrelated channels The precoding technique under investigation allowed the use of an efficient approximation technique based on orthogonal projection matrices to calculate the capacity after precoding which serves as a scheduling metric The capacity estimate also allows to inherently consider the effect of different group sizes since it includes the transmit power In the case of precoding where interference is not fully suppressed the problem of correlated subspaces will lead to a slight reduction in link quality and to an increase in interference Since the latter is dual to the drop in link quality in the zero forcing case the proposed solution is also applicable in the non-ZF case as shown in [FDGH05b]
An iterative method for forming these groupings presented in [FDGH05a] will be described briefly
For any users g out of G users a rough estimate ( )Sgη is calculated that represents the spectral efficiency
that would result if that user were allowed to transmit in the selected way It approximates the inter-layer interference effect and can be calculated by a simplified projection scheme see [FDGH05a] [FDGH05b] The equivalent channel of user g is represented by its channel matrix after an orthogonal projection into the null-space of a joint channel matrix containing all G usersrsquo channels except that of the grsquoth The resulting chunk throughput when transmitting to all users in the grouping is simply estimated as the sum of the G individual terms ( )S
gη
The iterative tree-based scheme for forming appropriate groupings can now be explained as follows Let us start with a situation where all users are part of one spatial set ie each use forms a separate grouping with only one member (lowest row in Figure C4) SDMA would then not be used at all within the cell First the user with the best metric is identified In the figure it is user number 1 Then one user at a time is added to it and the metric sum of the combination is calculated The combination with the highest metric sum is kept as candidate user groupings with size 2 The algorithm is repeated to test and form a grouping of size 3 It proceeds in this way up to the maximum allowed group size When done the
grouping of size G with the highest metric sum GC (or highest capacity if higher accuracy is desired) out of all candidate groupings (marked in red for G = 3 in the example in Figure C4) is chosen To reduce complexity even further the solution can be tracked in time Instead of calculating the entire tree the sorting starts with the previously found solution and proceeds eg one level up in the tree and two levels down again updating also the previous solution The sub-grouping is then selected only from three new candidates Going top-down in the tree is achieved by testing one by one which user to delete from the grouping in order for the remaining group to have maximum sum metric
Figure C4 In a system with 5 users candidate user grouping are built by adding one user at a time and keeping the grouping with highest sum metric Finally the grouping with highest sum metric
(eg the one marked in red) out of all candidate groupings (marked in yellow) is used
11 22 33 44 55
1 21 2 33 44 55
33 551 24
1 2 34 5
1 2 34
55
Trac
king
win
dow
11 22 33 44 55
1 21 2 33 44 55
33 551 24
1 2 34 5
1 2 34
55
Trac
king
win
dow
WINNER D210 v10
Page 93 (180)
C18 Timing of the execution of the main MAC functions
The main functions of the control plane (C) and the user plane (U) are executed on the following time scales
Executed once every super-frame
- Constraint combining (C) - Resource partitioning (C)
- Spatial scheme selection (C)
- Coding resource mapping and PHY transmission of RAC and BCH flows (U)
- Reception from PHY and decoding of RAC and BCH FEC blocks (U)
The execution of the following functions is trigger-based when required
- Flow setup control (C)
- Flow release control (C)
- Spatial scheme pre-configuration (long-term decisions and constraints) (C)
- Calibration in the spatial scheme controller (C)
- Support functions within the resource scheduler (U)
Executed every slot (half-frame in FDD UL DL period of frame in TDD)
- Queue state control (U) - Resource scheduling (U)
- Coding segmentation resource mapping and PHY transmission of TDC and CDC flows (U)
- Reception from PHY decoding and reassembly of TDC and CDC FEC blocks (U)
C2 Functional architecture for peer-to-peer MAC C21 MAC services provided for peer-to-peer transmission The Radio_Resource_Control service for P2P transmission is used to start maintain and stop the operation of a P2P-DAC in the BS User terminals which intend transmitting peer-to-peer have to attach to the channel before transferring data using this service Detaching terminals from the DAC is another service that is provided If a UT intends to transmit data packets synchronously the service provides functions to create and terminate a synchronous data flow The primitives of type req request ind indication rsp response and cnf confirm that are provided to use this service at higher layers are summarised in Table C1
Table C1 Overview on MAC_P2P_CONTROL primitives for P2P transmission
Name req ind rsp cnf
MAC_P2P_CONTROL_START_DAC - -
MAC_P2P_CONTROL_STOP_DAC - - -
MAC_P2P_CONTROL_ATTACH_TO_DAC
MAC_P2P_CONTROL_ATTACH_INFO - - -
MAC_P2P_CONTROL_DETACH_FROM_DAC -
MAC_P2P_CONTROL_CREATE_SYNC_FLOW - -
MAC_P2P_CONTROL_TERMINATE_SYNC_FLOW - -
After the P2P-DAC has been configured appropriately and the UTs involved in P2PPMP transmission have been attached the Radio_Packet_Transfer service for P2P transmission can be used to exchange
WINNER D210 v10
Page 94 (180)
segmented packets either asynchronously or synchronously between peer terminals The primitives which are provided to use this service at higher layers are summarised in Table C2
Table C2 Overview on MAC_P2P_USER primitives for P2P transmission
Name req ind rsp cnf
MAC_P2P_USER_SYNC_DATA -
MAC_P2P_USER_ASYNC_DATA -
C22 MAC functions provided for peer-to-peer transmission DAC-P2P flow setup data transfer and flow termination
Figure C5 shows the state-transition diagram implemented in the P2P-DAC flow setup and termination unit of the base station (see Figure 37) After radio resources have been allocated for the DAC the service primitive START_DACreq triggers the execution of the P2P-DAC initialisation function and the transition to state P2P-DAC_ACTIVE In this state the P2P-DAC beaconresource control function is continuously executed to control the operation of the DAC by broadcasting beacons with the appropriate information about the available DAC service and the current DAC frame structure This control function is terminated by executing the P2P-DAC terminate function after receiving a STOP_DACreq
The state-transition diagram in Figure C6 illustrates how the various protocol functions of the P2P-MAC interact with each other in the UT to setup a P2P-DAC flow control the data transfer and terminate the flow
After being synchronised to the BS the user starts the P2P-DAC attach function by sending an ATTACH_TO_DACreq primitive to the flow setup and termination unit This function conveys to the BS information about the UT and the BS assigns to the UT a unique identifier for efficient addressing After its successful completion a confirmation is sent to the user before the finite-state machine transits to state ATTACHED A UT can detach from the DAC at any time by executing the P2P-DAC detach function
In the state ATTACHED the user can request an asynchronous transfer of a radio packet in the CAP or GAP to the peer UT by sending a USER_ASYNC_DATAreq This initiates the execution of the P2P-DAC asynchronous transfer control function If the packet should be transmitted in the GAP the UT informs the BS with an UL command of the pending transmission request If resources are available the BS schedules time slots for the transfer request and announces the availability of the time slots for the requested P2P transfer in the beacon The transfer control function then controls segmentation retransmission and multiplexing of the segmented radio packet onto the assigned time slots If the packet should be transmitted in the CAP the request is forwarded to the P2P-DAC channel access control function After completing the data transfer the successful transfer is confirmed and the finite-state machine returns to state ATTACHED
Before radio packets can be synchronously transferred between peer UTs a service user has to request the execution of P2P-flow setup function by sending a CREATE_P2P_FLOWreq This procedure establishes a synchronous P2P-flow by exchanging protocol messages between the UTs and the BS If time slots are
Figure C5 State-transition diagram of P2P-DAC flow setup and termination in the base station
WINNER D210 v10
Page 95 (180)
periodically available for the requested data transfer the BS assigns a unique index to the newly created flow After the successful completion of the procedure a confirmation is sent to the user and the finite-state machine transits to state P2P-FLOW_ESTABLISHED A UT can terminate a P2P-flow by executing the P2P-flow termination function
In the state P2P-FLOW_ESTABLISHED the user can request a synchronous transfer of radio packet on the pre-established P2P-flow by sending the USER_SYNC_DATAreq primitive This primitive initiates the execution the P2P-DAC synchronous transfer control function which controls segmentation retransmission and the multiplexing of the segmented data to the pre-allocated time slots of the DAC frame After the completion of the data transfer the transfer is confirmed and the finite-state machine returns to state P2P-FLOW_ESTABLISHED
Figure C6 State-transition diagram of P2P-DAC flow setup transfer control and flow termination in the user terminal
P2P-DAC channel access control functions The P2P-DAC channel access control functions give UTs random access to the P2P-DAC for transmitting control messages to the BS and exchanging protocol messages or small amount of user data between peers
A UT which is synchronised to the P2P-DAC can transmit command frames to the BS in the UL command time slot by using a slotted ALOHA access protocol The access to the time slot is controlled by a contention window that is maintained by each UT The size of the window is defined as cw(a)=min2a+1256 where a represents the number of retransmission attempts already made by the UT The UT chooses a uniformly distributed random value r within the interval [1cw(a)] and starts the access after r DAC frames After receiving a response from the BS indicating successful command reception the parameter is reset to zero
A UT which is attached to the P2P-DAC can asynchronously transmit control messages or a small amount of data to a peer UT in the contention-access period Since no establishment of a synchronous P2P flow is required this method leads to a faster access and data transfer The basic medium access mechanism used in the CAP is the well-known carrier-sense multiple access scheme with collision avoidance A UT with a pending data transmit-request senses the state of the wireless medium before it can transmit If the medium is idle longer than a pre-defined time interval it can proceed with the transmission Otherwise it first waits until the medium becomes free then generates a random backoff time before it tries to transmit in order to minimise the risk of collisions with transmit request issued by other terminals
WINNER D210 v10
Page 96 (180)
C3 Chunk definition The scaling of chunks in the WINNER system is based on the following general considerations
bull The appropriate frequency extent of a chunk should be determined by analysing the balance between two factors 1) The performance loss due to channel variability within the chunk which is decreased with narrow chunks This factor depends on the typical channel power delay profile which is in turn related to the cell size and the deployment scenario 2) The required control overhead and feedback rate with adaptive transmission which is decreased with wide chunks
bull The appropriate time duration of a chunk is determined by the following factors 1) Short chunks lead to a small overall radio interface delay 2) Short chunks enable the design of feedback loops for adaptive transmission also for fast fading channels 3) Short chunks may contain so few payload symbols that the overhead due to pilots and in-band control symbols becomes prohibi-tive 4) Long chunks may contain too many payload symbols Transmission of small FEC blocks will then become problematic since flows are in general mapped exclusively to flows in adaptive transmission without chunk-sharing
The chunk definitions found below are specified for the (frequency) adaptive transmission mode which will be used whenever precise channel quality information is available at the transmitter to steer link adaptation on a fine granularity level Within chunks allocated for non-frequency adaptive transmission there is a potential need for a more fine-grained rate matching Solutions to solve this problem are outlined in Section 316
The chunk width is set to 8 subcarriers or 3125 KHz in the FDD mode and to 16 subcarriers or 7812 KHz in the TDD mode The motivation for this difference in chunk widths is that the FDD mode has in WINNER phase I been evaluated in rural area and metropolitan area deployments with rather high delay spread and frequency selectivity in the channels see Table F1 in Appendix F The TDD mode has been evaluated primarily in short-range deployments with less delay spread in the channel models and thus less frequency selectivity
Thus the usable 416 subcarriers in the FDD mode are partitioned into 52 chunks the usable 1664 subcarriers in the TDD mode are partitioned into 104 chunks The radio interface delay requirement of 1 ms [WIND71] can be interpreted as a requirement on the slot duration of the FDD transmission and the uplink and downlink slot lengths of the TDD transmission by the following reasoning The shortest control loop for a transmission consists of a request response and transmission Each such sequence should have duration of approximately 1 ms The chunk durations Tchunk of the FDD mode will therefore be set to 12 OFDM symbols plus guard times or 3456 micros The frame of the half-duplex FDD system consists of a downlink chunk followed by an uplink chunk with duration Tframe = 2 Tchunk = 6912 micros The frame of the TDD mode consists of a downlink period + duplex guard time + uplink period + duplex guard time This frame duration is set equal to the FDD frame duration of 6912 micros to simplify inter-mode cooperation The TDD chunk duration is set to 5 OFDM symbols plus guard times = 1088 micros The duplex guard time is set to 192 micros Each TDD frame contains 6 chunks plus two duplex guard times With asymmetry 11 each frame contains three uplink chunks and three downlink chunks
A chunk thus contains 96 symbols in the FDD cellular mode when used for CP-OFDM transmission and 80 symbols in the TDD cellular mode See Figure 31
WINNER D210 v10
Page 97 (180)
Appendix D Radio Resource Management (RRM) and Radio Resource Control (RRC)
D1 RRM functions
D11 Spectrum control
Spectrum Sharing Spectrum Sharing controls the access to the spectrum in frequency bands which are shared with other RATs which are probably the ones used by legacy systems Depending on the regulatory rules governing the shared bands different scenarios for spectrum sharing are possible
Horizontal sharing The involved systems in the shared frequency band have equal regulatory status ie no system has priority over the other(s) in accessing the spectrum
bull Horizontal sharing without coordination No signalling is required between the involved systems as eg nowadays on the ISM band Since QoS cannot be guaranteed for any system this possibility is not considered in further detail
bull Horizontal sharing with coordination The involved systems coordinate their spectrum access based on a set of predefined rules (spectrum etiquette) that all systems adhere to This requires capabilities for signalling or at least detection of the other systems
Vertical sharing In this modality sharing is performed with clearly established priorities The primary system has preference in accessing the spectrum and the secondary system(s) may only use the spectrum as long as they do not cause harmful interference towards the primary
The most important as well as complex service component is the one where WINNER is the secondary system which controls the emissions from the WINNER system to avoid harmful interference towards legacy systems This function first has to reliably identify the ldquowhite spacesrdquo ie unused spectrum and then determines the transmit constraints of the WINNER system The identification of the white spaces can be based on measurements and it can be significantly assisted with information provided by a spectrum database or a central radio controller Based on the available and measured information constraints for the transmit parameters are determined and signalled to the constraint processing function in the MAC layer
Spectrum Assignment Spectrum Assignment periodically reassigns a portion of the available spectral resources between multiple WINNER RANs In contrast to the conventional fixed spectrum assignment herein it allows dynamical balancing of spectral resources between networks As a result spectral resources available for a network can be adjusted according to eg changes on the operatorsrsquo customer base (or market shares) Spectrum assignment also facilitates introduction of operators with relatively small customer base or network coverage area In addition spectral resources can be re-assigned according to the variations on the aggregate loads on the networks hence enhancing the overall use of spectrum over all networks
Long-term Spectrum Assignment The spectral resources assigned to the networks are defined in terms of chunks and hence separation between networks can be done either in frequency (eg in FDD mode) or both in time and frequency One principle for the re-assignment assumed in the following is to keep the spectral resources assigned to the networks as orthogonal as possible In other words the resources are separated in time frequency or space so that interference between networks is minimised This prevents the need for extensive coordination (or tight coupling) between networks for complicated interference management over multiple networks as well as for strict limitations to the operation of RRM within networks The principle likely favours TDD bands where orthogonal resource allocations are efficiently obtained in time This is due to the synchronisation between networks required also with the conventional fixed spectrum assignment due to the adjacent channel interference Other principles assumed in the following are
bull The spectrum assignment functionality is distributed to all networks and re-assignments any negotiated between networks without any central controller
WINNER D210 v10
Page 98 (180)
bull Central database containing relevant information on spectrum priorities as well as on fairness and cost metrics enables higher layer control on the spectrum assignment through the priorities and fairnesscost metrics It also enables simple introduction of new networks
bull Spectral resources are divided into two categories resources assigned with a priority and common pool resources
o The purpose of resources assigned with a priority to a certain network is to guarantee basic operation of the network under all circumstances A network can release some of the priority assigned resources for other networks but it can retrieve the resource in the next negotiation phase In other words it has incontestable priority to the resource
o Common pool resources can be reserved by any network
bull Fairness and cost metrics are used in the negotiation of assignments to achieve fair and efficient allocation solution
bull Spectral resource assignments vary geographically although spatially contiguous assignments are preferred to avoid unnecessary interference between networks To facilitate smooth spatial transition in the assignments it is envisaged that long-term assignment specifies for large geographical areas with spatial granularity of several cells (sets of cells) and short-term assignment optimises the border regions further with cell-wise resource assignments
bull Spectral resource re-assignment is done periodically and at a slow rate (ie several minutes)
It may be preferable that resources in the common pool are assigned to a network for multiple spectrum assignment periods at a time In other words not all common pool resources are re-assigned at each period This results in a smoother spectrum assignment adaptation and probably reduced need for the priority assigned spectral resources A simple solution may be that assignments have a common duration of multiple assignment periods and a resource can be released during the assignment
Short-term Spectrum Assignment The short-term spectrum assignment complements the main spectrum assignment by providing short-term and local ie cell-specific variations to the spectrum assignments covering large geographical areas Hence it enables 1) faster adaptation to the local traffic load variations and 2) geographically more accurate spectrum assignments In the part of faster adaptation to load variations it provides complementary method for inter-network load sharing The assessment of the true benefits of this approach in comparison to plain load sharing remains to be done in WINNER II
The re-assignments of spectral resources are performed in the time scale of several seconds To limit the induced complexity the functionality resorts to only simple inter-network signalling Functionality requests resources from other WINNER RANs after triggered by the long-term spectrum assignment or preventive load control In the case of a resource request from other RANs the functionality rejects accepts or partially accepts the request based on information from load prediction and MAC control feedback on the overlapping and neighbouring cells Inter-network signalling is performed either over the air or through the core network For the over the air signalling RAC is used through the MAC radio packet transfer service The constraint information is updated based on the decisions and sent to appropriate MAC layer
D12 Service level control (SLC) The SLC has the overall responsibility of adjusting inter-flow fairness and assuring the fulfilment of service level contract agreements and total delay constraints In particular
bull it may perform by requesting resources from several BSs that may utilise different WINNER modes
bull it works on a slow time scale characterised by the packet arrival rates
bull it may allocate resources belonging to several modesbase stations
The SLC forwards packets to SLC cache (Figure C2) based on a predicted sum rate and QoS requirements which could be derived by the queue levels feedbacked by the SLC cache The SLC cache is kept rather small corresponding to few frames while separate queues are allocated for each flow Furthermore the SLC assigns static priorities per flow and RS schedules based on priority queuing time and channel state
The service differentiation is exercised through the following service components while an example is given in Figure D1
WINNER D210 v10
Page 99 (180)
bull Flow Conditioning The traffic of each flow is conditioned to ensure that it complies with the corresponding profile definition in particular the defined maximum traffic rate
bull Flow Queuing In WINNER it is assumed that separate queues are allocated for each flow Packets in respective queue may get dropped during transient phases of congestion
bull Flow Scheduling Flow scheduling may be considered as management between flows and determines the order in which PDUs will be forwarded to the SLC cache buffer residing at the MAC layer and works on a time scale characterised by the packet arrival rates
bull Flow Monitoring The main aim for flow monitoring is to (as the name suggests) monitor the flow and provide feedback on flow traffic predictions to any other function that may require this information
Flow-1 Flow-LApps belonging to service class 1
Decision based on intra-class policy inter-class policy and age of packet
Flow-1 Flow-N
Per Flow Queuing+Active QueueManagement
Flow scheduling
SLC Cache(Drained by RS)
Flow-M Flow-NApps belonging to service class L
MAC
RLC
Aggregate of Marked Packets
Network Control Packets
Flow Conditioning(eg through Leaky or Token Bucket
IPC
Feedback on Queue Levels
Figure D1 Example of flow conditioning flow queuing and flow scheduling
D13 ModeRAN selection The different architecture alternatives may be expected to differ in what decision variables are available and according to the way different available modes are used We have above defined
1 fast selection - which is a quasi-simultaneous operation of modes and will have to be performed in both the BS and the UT the decision variables and boundary conditions are expected to be set by RRM but the selection decision has to be taken by MAC (Figure D2)
2 slow selection - which is an RRM function to control alternative operation of modes the process perhaps bearing many similarities to the RAN selection
3 re-selection - which is an RRMRRC function to handle changing radio conditions availability of modes
WINNER D210 v10
Page 100 (180)
Application s
TCP UDP
IPvX
Multi-Mode Layer 2
Layer 1Mode 1
Layer 1Mode 2
IP Convergence Flow identification
Destination Identification
End-to-End Automatic Repeat
reQuest (ARQ)
Hop-by-Hop ARQ
Mode 2
ResourceScheduling
Mode 2
Hop-by-Hop ARQ
Mode 1
Resource Scheduling
Mode 1
Segmentationand
Reassembly (SAR)
(Inter -mode)-Scheduling =
fast mode selection
L2 M
odes
Con
verg
ence
Man
ager
RR
MR
RC P
aram
eter
izatio
n fo
r fas
t mod
e se
lect
ion
RR
MR
RC c
ontro
l for
slo
w m
ode
sele
ctio
n an
d re
-sel
ectio
n
Data FlowParameterization Composition and Status Information
Interaction
Figure D2 User plane data flow and fast mode selection (not shown slow mode selection and re-selection performed by RRMRRC)
According to the variant of mode selection applied a subset of the decision variables can be used
bull Mode availability - which subset of the modes that a terminal can support is in fact available at the current location
bull Service ndash the mode which is most efficient for the service in question is selected
bull Signal strength ndash the mode from which the strongest signal is received is selected This is a simple version of the more sophisticated selection parameter radio resource cost discussed below
bull Radio resource consumption ndash the mode for which the least relative amount of radio resources (eg power codes timeslots etc) is required to support the users is selected
bull System load ndash the mode with the least relative load is selected This does not necessarily improve capacity but improves user quality at loads below the capacity limit and avoids reallocations as the load approaches the capacity limit
bull Packet size ndash the mode which is most efficient for the packet size in question is selected
bull Price ndash the mode for which the price for supporting the user is lowest is selected This is especially interesting in case the different modes are run by different operators and the decision is taken by the end-user or the terminal
The RAN selection algorithm selects the most suitable RAT for attending the service requests of UTs Of importance here are the RATrsquos preferences for the requested service according to the QoS offered by each RAT and the balance among the radio resources occupation of the different RATs achieved by a suitable traffic load balance among them The algorithm is based on the availability of a list for all the available RATs capable to provide the service This list is made based on QoS information A decisive factor for prioritising a RAT over another RAT will be the user preference [WIND41] [WIND42]
D14 Handover The general rules for handover between the WINNER modes are expected to be mode availability and terminal mobility For example UTs with high mobility are expected to always be connected with the wide area cell even if they are in the vicinity of the short range cell Also the triggers for handover and their thresholds between the two modes will depend on the deployment scenario ie extension of coverage and increase of spectral efficiency as well as on the relaying concept In case of an inter-system handover this is expected to take place either when there is loss of coverage of the current system or in the case of overlapping coverage due to useroperator preferences or traffic congestion Example of handover triggers are given in [WIND41] [WIND42]
WINNER D210 v10
Page 101 (180)
Intra-system handover Since the wide area cell is going to exist as an umbrella over the short range cell there is a need for making the UT aware that it has the option of changing to TDD mode In order to allow for a seamless handover within the WINNER RAN BSs and RNs of the same or different mode can announce their presence to the UTs by broadcasting control messages using orthogonal resources This scheme is especially helpful for the handover between WINNER FDD and TDD as it allows the UTs to be aware of the presence of BSs and RNs that operate at a different mode without disrupting their normal operation to ldquosniffrdquo other parts of the spectrum Further information can be found at [WIND43] [WIND44]
Inter-system handover
Location-based Vertical Handover (VHO) In a homogeneous system the scanning of other possible connections is triggered by the condition of the link since an ongoing connection with good performance makes such a procedure dispensable For a vertical handover continuous surveillance is mandatory At the moment this can only be handled by the terminal itself because no entity exists for the integration and information exchange of different networks Therefore the mobile must scan all other possible RATs The autonomous gathering of information by means of scanning may impact both the own and other transmissions Therefore it makes sense to look for alternative ways of gaining respective measurement results Since the need for own measurements shall be reduced as much as possible another way of gathering the relevant information is to employ measurement reports which have been collected by other active UTs within the same or within other systems Information gathering within the same system thereby is required for horizontal handover (HHO) preparation whereas for VHO information gathering between different types of systems is needed However information may also be used to control other mechanisms such as appropriate physical mode selection for link adaptation (LA) or (joint) Radio Resource Management (RRM) In all cases the location-based VHO in combination with the Hybrid Information System (HIS) offers a great economic potential since participating devices can minimise or even avoid self-driven scanning procedures The principle of the HIS presumes that each system collects data about the current link state within the covered cell and provides this information on request to mobiles that are willing to change their connection within the same system (HHO) or different systems (VHO) [WIND41] [WIND42] [WIND43] [WIND44]
CRRM based VHO Another approach for an inter-system handover is based on the CRRM framework defined in the 3GPP [3GPP-TR25891] which allows the exchange of load information between UMTS and GSM networks The proposed algorithm takes in a first step only load criteria into account but in a second step will include also service criteria [WIND41] [WIND42] These algorithms can be extended to WINNER inter-mode handovers [WIND43] [WIND44]
D15 Admission control Admission control schemes are the decision making part of networks with the objective of providing to users services with guaranteed quality in order to reduce the network congestion and call dropping probabilities and achieve as much as possible resource utilisation An example of an admission control algorithm for the selection of the appropriate RAT in the case of RAN cooperation is summarised below [WIND41] [WIND42] [WIND43] [WIND44]
bull The algorithm makes a list of the candidate serving networks and candidate cells for each network The lists contain the candidate networks and cells capable of providing the requested flow service and they are ordered in such a way that better fulfils its requirements in each network
bull If there is only one RAT available in the flowrsquos location area and the flow can be served by that RAT then it is selected otherwise (if the flow cannot be served by that RAT) the flow will be rejected
After selecting the target RAT the algorithm checks if the flow is new or from handover (which means that the flow was already going on in a RAT and for some reason it was decided to change its RAT) If it is a new flow then if there are other flows waiting in the queue it will be rejected (or it will select another RAT if there is one in its list) otherwise it goes to the next step The next step of the algorithm is to check (no matter if it is a handover or new flow) if there are sufficient resources in that network for the flow to be served If there are sufficient resources the flow will be admitted to the target RATmode If the resources of the target RAN are insufficient it will be first checked if the flow can be served by another RATmode If the flow is new and has low priority then it is rejected in this RAN and itrsquos checked if another one can serve it and if none is available the flow is rejected If the flow is from handover or a new - high prioritised it is not rejected in the target RAT but it is first checked if it can be served by another
WINNER D210 v10
Page 102 (180)
RAT (suitable for it) If not it is checked if there is a possibility that other ongoing flows can perform a handover to another suitable network If this action does not also gain the needed resources for the flow then it is checked if degrading the QoS of some ongoing flows (in this RAT) with low priority (where ldquolowrdquo is relative to the priority that the flow has) is possible and enough to admit the flow
If the flow is new and has high priority it will be checked if degrading the QoS (ie lowering the bit rate at a tolerant level) of some low priority flows will gain the needed resources and if yes then the flow is admitted otherwise it is rejected
If it is a handover flow then it is also checked if low priority flows can degrade their QoS as much as it needs to admit the flow If this canrsquot be done the handover flow will enter the handover queue in a position related to its priority that means that it will enter in front of flows with lower priority The flow will remain in the queue until o The needed resources become available (ie by completion of other flows) o The flow leaves the cell ie the user moves to another cell or the flow is completed o The flow is terminated due to timeout
The admission control algorithm for the cooperation between B3G and legacy RANs aims to maximise the number of admitted or in-flow traffic sources supported over the RANs while guaranteeing their QoS requirements and ensuring that the new connection does not affect the QoS of the ongoing connections The decisions to accept or reject a new connection are based on different criteria taking into account each RATrsquos nature
D16 Load control Reactive load control is used to face a situation where the networks are in a overload situation and the usersrsquo QoS is at risk due to increase of the interference mobility aspects low bandwidth availability etc When already admitted users cannot satisfy their guaranteed QoS to their services for a specific percentage of time then the network is considered to be in an overloadcongestion situation Herein we describe am example of a reactive load control mechanism that is monitoring WINNER as well as legacy RANs and if an overload situation occurs it tries to decrease the load of the network performing several actions and especially trying to make the RANs cooperate ie by forcing users to perform handovers The reactive load control algorithm is divided into three phases [WIND41] [WIND42] [WIND43] [WIND44]
1) Detection phase The algorithm continuously monitors the networks and periodically checks the load of the networks in order to detect a overload situation in anyone of them It is considered that a network is overloaded if the load factor is over a certain pre-defined threshold during a certain amount of time
2) Resolution phase This is the phase that the algorithm is trying to resolve the problem that causes the overload situation At first as it is obvious we must drop all the incoming flows (new and handover) as they will increase more the load of the network so admission control is forced to reject the flow requests for that network Then in case flow conditioning is not used the algorithm checks if the overload situation is caused due to users that violate their QoS restrictions in terms of bit rate which means that it tries to find if there are flows that transmit with more bit rate than they should according to the service agreements made between the network and the user If such flows exist then the algorithm drops their bit rate to the value that exists in the service agreements After restoring the bit rate of the users to the agreed there is a check if the network is still in a congestion situation and if so the algorithm performs a number of actions which include handover of flows decreasing of their bit rate or even selective dropping of flows
3) Then the algorithm enters the recovery phase where we try to restore the transmission rate to the flows which rate was decreased in the second step of the resolution phase A recovery algorithm is necessary because we cannot leave the flows with a bit rate that violates the QoS service agreements The problem here is that if we restore the flowsrsquo bit rate incautiously the network could fall once again in a overload situation and thatrsquos why we must be very careful to that For all the flows that we have decreased their bit rate we check (separately) if we can restore their transmission rate without causing congestion again by computing the amount of load needed in order to restore the transmission rate
D17 Routing
The overall picture of the routing in multi-hop cellular networks (MCNs) is depicted in Figure D3 From the architecture perspective two basic routing strategies are envisioned in multi-hop systems centralised or distributed Under the centralised strategy route determination is performed in a central controller which normally possesses powerful processing capability and has knowledge on global network status so that sophisticated routing algorithms could be adopted to optimise the system performance With the
WINNER D210 v10
Page 103 (180)
distributed strategy individual network nodes from the source to the destination jointly perform route determination This strategy could function when no central controller is reachable but its performance is normally limited by network nodesrsquo processing capability and knowledge on network status
Figure D3 Routing in MCNs
In terms of protocol nature the routing algorithms in conventional multi-hop networks such as ad-hoc networks can be mainly broken down into two categories proactive routing and reactive routing With proactive routing schemes network nodes continuously evaluate the topology of the network so that when a packet needs to be forwarded the route is already known and can be immediately used Reactive schemes on the other hand invoke a route determination procedure on demand only Thus when a route is needed some sort of global search procedure is employed in order to find a suitable route to the destination The protocol nature of the routings in MCNs could be both proactive and reactive but being applied at different circumstances for instance reactive routing is be used for idle users whereas proactive routing is applied for active user Nevertheless further studies will be carried out on this issue
For both proactive and reactive routing schemes for ad-hoc networks topologyroute information is normally preserved in routing tables The difference is for proactive routing the table contains up-to-date and complete topology information whereas for reactive routing a route is only created in the table when needed For the routing in MCNs likewise routing tables are also supposed existing at BSs RNs and UTs to keep the necessary routing information for respective nodes This will be further explained in the later part of this section The routing in MCNs is responsible for a number of basic tasks such as routetopology discovery (NB route discovery is normally for reactive routing schemes whereas topology discovery is for proactive ones) and route table updatingmaintenance etc
Decision criteria In the literature various criteria have been proposed for the routing criteria in MCNs such as distance pathloss and transmission power etc For each user these routing algorithms intend to find and choose the route with the least distance pathloss or transmission power etc In our recent work [LHYT01] and [LHYT02] a novel routing criterion named the Load Cost Indicator (LCI) is proposed
ζroute i = Croute i R route i
Where ζroute i is the LCI of route i Croute i represents the consumed capacity of the transmission on route i and R route i is the transmission data rate on route i Apparently such a criterion reflects the consumed system capacity when delivering unit amount of traffic on a particular route Given a certain system capacity constraint if every user employs the route with the least LCI among all its possible routes the system throughput can be maximised
Routing tables As mentioned earlier like in ad-hoc networks in MCNs routing tables are also supposed existing at individual network nodes including BSs RNs and UTs Nevertheless due to the fact that the BS is the common source for all the downstream [WIND25] flows and meanwhile the common destination for all the upstream flows in one radio cell the routing tables in MCNs are much simpler than their counterparts in ad-hoc network moreover for packet delivering purposes an BS only needs to keep downstream routing tabletables a UT only needs to have upstream routing tabletables whereas a RN needs to have both downstream and upstream routing tables Nevertheless as mentioned earlier the routing is envisioned to be centralised (BS-based) in MCNs in another word the route table calculation
WINNER D210 v10
Page 104 (180)
for all the nodes within one cell is to be performed by the BS hence BS actually has the knowledge of the up-to-date route tables at individual nodes within the cell
D2 RRM architecture Intuitively the problem of optimising resources is better posed when doing it in a common fashion rather than regarding separately cellsmodes When information about interference induced by surrounding cells and about the amount of spectrum resources in other modes is available (CRRM approach) algorithms perform better and the usage efficiency is increased This also applies when considering not only surrounding cells but also different radio networks operating simultaneously ie JRRM approach
Benefits of centralised RRM are achieved at the expense of a higher computational complexity since the algorithms have to deal with a higher number of degrees of freedom and involve a larger interchange of information among network agents thus increasing the signalling Time restrictions on signalling are also to be considered Centralised RRM algorithms have been proven to perform worse than distributed ones when delay introduced by signalling is larger than few seconds (5 s)
D21 Location of WINNER functions A first approach regarding the WINNER RRM architecture is shown in Figure D4 According to this approach the mode specific functions are located at the BS and RN while the mode generic user plane ones are located at the RANG logical node All the control plane functionalities are located at the Access Control Server (ACS) logical node A disadvantage of such an RRM architecture would be the possible overload of the system due to increased signalling directed to the ACS node leading to delays
The service level controller (SLC) regarding the downlink is foreseen to be located at some distance from the BSs such as at RANG It has the overall responsibility for adjusting inter-flow fairness assuring the fulfilment of service level contract agreements and total delay constraints It may perform by requesting resources from several BSs that may utilise different WINNER modes working on a slower time scale and may allocate resources belonging to several modesbase stations As buffer management and traffic policing could impose constrains on the service load controller they could be located at the same node After flow classification the service level controller will direct packets of a flow to one specific queue within a buffer residing in an BS or RN On the other hand the flow scheduling of the SLC for the uplink direction will be located at the BS or even the RN The resource schedulers link adaptation and power control should always be located close to the BSs to minimise delays
However all mode generic control plane and cooperative functionalities are located at the ACS logical node In this almost centralised approach the problem of optimising resources is better posed as it is done in a common fashion rather than regarding separately cellsmodesRANs The main disadvantage of such an RRM architecture is the higher computational complexity since the algorithms have to deal with a higher number of degrees of freedom and involve a larger interchange of information leading to the possible overload of the system due to increased signalling directed to the ACS node leading to delays
WINNER D210 v10
Page 105 (180)
bullSchedulingbullService Level Control (uplink)bullShort Term Spectrum AssignmentbullLink AdaptationbullPower Control
bullService Level Control (downlink)bullFlow Establishment amp ReleasebullBuffer ManagementbullTraffic Policing
bullModeRAN SelectionbullHandoverbullAdmission ControlbullLoad Control bullLong Term Spectrum AssignmentbullSpectrum SharingbullRouting
Radio AccessNetwork RANG
AP
RN RN
UT
ARExternal IP
Network
bullSchedulingbullService Level Control (uplink)bullShort Term Spectrum AssignmentbullLink AdaptationbullPower Control
bullService Level Control (downlink)bullFlow Establishment amp ReleasebullBuffer ManagementbullTraffic Policing
bullModeRAN SelectionbullHandoverbullAdmission ControlbullLoad Control bullLong Term Spectrum AssignmentbullSpectrum SharingbullRouting
Radio AccessNetwork RANGRANG
AP
RN RN
AP
RN RN
UTUT
ARExternal IP
Network
Figure D4 WINNER RRM Architecture
It is envisaged that for the WINNER system with the multiple operating modes the hybrid approach would be suitable In particular in order to avoid extensive delays in the decision making and signalling overload a solution could be to bring some of the control plane functions closer to the BS physical nodes adding more complexity to the BS physical nodes and therefore increasing their cost However assuming different types of BSs for the wide-area and short-range scenarios we could restrict the extra functionality to the wide-area BSs (BSwa) In particular the ACS node would comprise mainly the RRM functions needed for the cooperation of the WINNER system with legacy RANs (handling user admission control to the WINNER system) and the coordination of the BSwa (if necessary) where a more comprehensive status of the system is required On the other hand the mode generic related control functions would be located at the BSwa (handling flow admission control) reducing the amount of signalling information required and allowing for faster decisions since the resources are controlled at a cell level For the BSwa to be able to make decisions on mode selection re-selection handover admission control congestion control and spectrum mapping between the BSsr that fall within its cell as well as between it and the BSsr several information are required to be transmitted periodically or upon request from the BSsr to the BSwa These include BSsr id and cell id current load max load power information handover statistics per RN and BSsr (successful drop rate etc) number of RNs attached to BSsr (in case of mobile RNs) CELLsr range (this can be change in case of mobile relays leavingjoining)Furthermore some of the mode specific RRM functions such as scheduling might reside at the RNs performing at different time scales as it is envisioned to have RNs with different functionality layers (layers 123)
D3 RRC functionalities
D31 Measurements and reports To choose the most suitable modeRAT a fundamental aspect is to assess the quality that different modesRATs will provide to the users This quality indication is basically obtained from measurements on the current and target networks RRM mechanisms in B3G systems will be able to use more metrics and information as inputs than the current RRM algorithms since information will be exchanged between networks and new metrics are becoming available
Current handover mechanisms are only based on received power either in cellular systems or in WLAN networks Congestion control algorithms in UMTS use mainly power measurements and service attributes to control access and load On the contrary in B3G systems various metrics coming from all the networks available can be used as inputs of any type of RRM algorithms
Some of these new metrics or information foreseen as useful to improve the RRM performance are listed below
bull Cell load free capacity
bull Location
WINNER D210 v10
Page 106 (180)
bull Velocity direction
bull Users environment (indoor outdoor etc)
bull Terminal capabilities
bull Handover statistics
Other information concerning the link connection includes Price of per bit in the link Security setup and encryption used in the link ARQ status of the link etc
Measurements can be performed either in the base stations or in the user terminal Usually RRM decisions are taken by the network therefore mechanisms must exist to report measurements from base station or terminal to the network The reporting may be periodic event-triggered or on demand
The WINNER system should at least provide to the RRM (orand cooperative RRM) entity
bull Signal strength measurements performed by either terminals or base stations on the WINNER RAN but also on legacy RANs when necessary
bull Transmitted power measurements performed by either UTs or BSs
bull Quality measurements
bull Cell load measurements (eg power measurements L2 buffer load indeed the exact definition of load for the WINNER system must be investigated and will depend on the chosen radio interface)
bull A beacon that terminals on other systems can listen to and measure eg in order to prepare for a handover to WINNER
The possibility for a terminal in a WINNER system to measure the received signal strength of base stationsbase stations of legacy systems should be foreseen when defining the WINNER system Alternatively the RRM entity in WINNER should have access to these measurements on legacy systems Moreover the possibility to exchange load information between WINNER and legacy systems should also be anticipated (eg exchanged between cooperative RRM entities)
WINNER inter-system handover should be consistent with the inter-system HO already defined in legacy systems In particular the inter-system handover procedure between UMTS and another RAT is already specified by the 3GPP Some of the specifications are applicable to any RAT while others are RAT specific (eg specified measurements on GSM are applicable to GSM only) Therefore the WINNER design must fulfil all the requirements that are mentioned in the 3GPP specifications for every RAT and the 3GPP will need to do some specifications dedicated to the WINNER system [WIND41] [WIND42] [WIND43]
D32 Other functions Feature discovery
Both the antenna configuration and relaying issues can be perceived jointly in context of the space-time coded cooperative transmission where virtual antenna arrays are created for the purposes of enhancing the overall WINNER system performance However the question arises how to configure the virtual antenna array and which space time code to select in order to meet the requested Quality of Service Answering this question renders it necessary to investigate the problem of efficient exploitation of the additional information about links provided by the routing protocol Since the target WINNER routing protocol is not established the Multi-Constrained Optimised Link State Routing protocol (MC-OLSR) candidate solution will be used during simulations This protocol which was proposed in [WIND31] and [WIND32] will be expanded with the cooperative relaying functionality which in turn was investigated in [WIND24] where the Adaptive approach to antenna selection and space-time coding was analysed
RRCRRM and cooperative transmission
RRM is connected with RNs assignment transmit power control etc Proper RNs assignment in for the purposes of cooperative relaying in WINNER is very important because it directly affects the transmission parameters and therefore the attainable QoS level When at least coarse channel parameters between the transmitting node and the relaying ones are known it is possible to create the virtual antenna array VAA in a more optimum way To this end the selected RRC functionalities were identified which along the flow of control information are presented in Figure D5
WINNER D210 v10
Page 107 (180)
RRC
Relay Routing Path Calculation
Channel Quality Measurements
Virtual Antenna Configuration
Space-Time Code Selection
QoS Requirements
Figure D5 RRC and cooperative relaying
Here the Radio Resource Control service exploits the Channel Quality Measurements and Relay Routing Path Calculation functionalities in order to perform the space-time coded cooperative relaying in an optimum way It is then of prime importance to identify
ndash how to efficiently exploit the routing information provided by the routing protocol (eg the MC-OLSR protocol)
ndash how to perform routing so that cooperative relaying could be efficiently exploited
ndash how to configure the virtual antenna arrays and which space time code to select so that the requested Quality of Service could be met
There is also a question on how the resource partitioning between BS and RNs should be performed In case of the MC-OLSR enhanced with cooperative relaying it is assumed the control is BS-centralised which means that resources are managed and assigned by BSs
WINNER D210 v10
Page 108 (180)
Appendix E Assessments Assumptions
E1 Overview This chapter summarises baseline simulations assumptions and parameters applied in link multi-link and system-level oriented simulations Four prioritised deployment scenarios A1 B1 C2 and D1 identified in [WIND72] are addressed Additionally the B3 scenario is considered for link level investigations For scenarios A1 B1 and B3 (collectively referred to as ldquoshort-rangerdquo scenarios) evaluations are performed using the TDD cellular system mode and for scenarios C2 and D1 evaluations are performed using the FDD cellular system mode A rough characterisation of these scenarios is given in Table E1 below
Table E1 Basis scenarios considered
Scenario identifier Deployment PHY
mode Mobility [kmh]
BS height
[m]
UT height
[m]
Traffic density
A1 In building
small office residential
TDD 100 MHz 0ndash5 2 1 high
B1 Hotspot
Typical urban micro cell
TDD 100 MHz
0ndash70 eg 10 (below RT21)
15 high
B3 Hotspot
Indoor TDD 100 MHz 0ndash5
C2 Metropolitan
Typical urban macro cell
FDD 2times20 MHz 0ndash70
eg 32 (above
RT) 15 medium
to high
D1 Rural
Rural Macro cell
FDD 2times20 MHz 0-200
eg 45 (above
RT) 15 low
It should be stressed that the selected assumptions models and parameters reflect a compromise taking into account the latest system design aspects the realisable simulator capabilities as well as the open issues to be addressed They only served as baseline assumption slightly different settings may have been used in the end Moreover not every detail is covered especially with respect to system level simulations in order to keep the simulator setup feasible for many partners
E2 Basic parameters for link level evaluations For performance evaluation of different link level parts (mainly modulation schemes channel estimation and synchronisation) the system parameters fixed in Table 21 have been used for simulation As channel models one ldquorepresentativerdquo example (ie a channel having a reasonable delay spread) has been selected for each the FDD and TDD case based on the tapped delay line models provided in [WIND54] The model C2 NLOS has been selected for simulations with the FDD system parameters while the B3 NLOS model was the baseline comparison case for the TDD system parameters Additionally the A1 NLOS model was used in some simulations as an example for a channel providing a high degree of spatial diversity (ie suitable for achieving high spectral efficiency when using spatial multiplexing techniques) For channel coding the memory 6 convolutional code was used as a baseline case (gains of around 2 dB are expected when using better codes for large block lenghts cf Appendix F2) More advanced coding schemes were used in Appendix F1 in order to demonstrate the potential performance of the coding within the WINNER physical and MAC layers For the (relative) performance assessment of different coding techniques simple BPSK transmission over an AWGN channel was used (without OFDM modulationdemodulation) as the relative merits of different coding techniques proved to be relatively independent of the channel and modulation technique [WIND23]
21 RT = rooftop
WINNER D210 v10
Page 109 (180)
E3 Basic parameters for multi-link and system level evaluations
E31 Mode specific parameters
FDD mode (used in wide area simulations) Parameter DL UL Centre frequency 50 GHz 42 GHz Bandwidthchannelisation 20 MHz paired ULDL Duplex scheme (T+F)DD Transmission technique OFDM
∆f=20 MHz512 = 390625 Hz rarr TN =256 micros fc=k∆f kisin[-208208] kne0 TG=32 micros rarr T=TN + TG =288 micros
a) single carrier (continuous) Pulse period T = 256 micros416 = 6154 ns pulse shaping square root raised cosine with roll-off β=0231 b) single carrier (block oriented) same pulse as in a) block length 416 symbols rarr TN = 256 micros guard length TG=32 micros
Number of sectors 3 1 Antenna configuration WA1
BS | A1 |
Antenna configuration WA2 (ULA)
BS | | | | | | | | (05λ)
A1 | A2 | | (05λ) A3 | | | | (05λ)
Antenna gain 15 dBi 0 dBi Frame length 6912 micros (=2 DL chunks) chunk size 8 subcarriers times 12 OFDM symbols unspecified overhead (parameter estimation signalling)
19 out of 96 resource elements of each chunk
unspecified
TDD mode (used inshort range simulations)
Parameter DL UL Centre frequency 50 GHz Bandwidthchannelisation 100 MHz Duplex scheme TDD Transmission technique OFDM
∆f=100 MHz2048 = 48828125 Hz rarr TN =2048 micros
fc=k∆f kisin[-832832] kne0 TG=128 micros
rarr T=TN + TG =2176 micros Number of sectors 1 1 Antenna configuration SA1
BS | A1 |
Antenna configuration SA2 (ULA)
BS | | | | | | | | (05λ)
A1 | A2 | | (05λ) A3 | | | | (05λ)
Antenna gain 8 dBi 0 dBi Frame length 6912 micros (3 DL chunks + 3 UL chunks + 2 times duplex guard time)
duplex guard time = 192 micros chunk size 16 subcarriers times 5 OFDM symbols virtual overhead for parameter estimation
15 out of 80 resource elements of each chunk
unspecified
WINNER D210 v10
Page 110 (180)
E32 Common to all modes
Parameter DL UL Coder convolutional coder Interleaver random bit interleaver Modulation formats BPSK QPSK 16-QAM 64-QAM Spreading codes Walsh-Hadamard (WH) WH (synchronous UL)
Gold (asynchronous UL) Medium access scheme frequency adapative scheduling rarr OFDMATDMA
frequency non adaptive scheduling rarr OFDMATDMAMC-CDMA Channel estimation at Rx perfect Synchronisation perfect channel measurement accuracy for adaptive processing
perfect
delay between CQI measurement and its application
1 Frame
Equalisation (if required) MMSE Demodulation ML based soft output demodulation
If equaliser is present apply ML criterion to equaliser output signal noise spectral density -174 dBmHz noise figure 7 dB (at MT) 5 dB (at BS) Resource assignment strategies
non-adaptive mode round robin adaptive mode score-based opportunistic scheduling
Link adaptation strategies
non-adaptive mode adaptive coding and modulation based on average CSI (across all sub-channels)
adaptive mode adaptive modulation and coding per chunk based on instantaneous CSI
(H)ARQ none power control no perfect azimuth pattern of antenna elements ]dB[25
7012min)(
2
⎥⎥⎦
⎤
⎢⎢⎣
⎡⎟⎠⎞
⎜⎝⎛minus=
θθA
θ3dB= 70o
omni directional
correlation of shadow fading between sectors
same site full ie use same value different site no
correlation of fast fading between sectors
same site use same bulk parameters but redraw delays AoAs AoDs hellip different site no
WINNER D210 v10
Page 111 (180)
E4 Scenario parameters Parameter A1 B1 C2 D1
channel modelling WINNER-I interim channel models see WP5 deliverables Average BS transmit power 1 W 4 W 20 W per sector
Average UT transmit power 200 mW
Cell radius R unspecified 1 km Cellular structure hexagonal grid see Figure E1 Number of cells to be simulated 19 three sector sites
frequency reuse distance
isolated cell only
unspecified
number of users variable parameter but constant for any simulation run and snapshot user distribution uniform within cell area uniform within 19-cell area user location update random drop of users in every snapshot
within each snapshot users virtually remain at fixed positions even in case of velocity |v| gt 0 kmh
Traffic model full queue assumption (holds for any user) Mobility model (only affects fast fading)
anglev sim U(02π) vx sim η(mσ 2) vy sim η(mσ 2) |v|= (vx
2+vy2)05
mobility model parameter
M1 m1= 1 kmh σ1= 16 kmh
M1 m1= 1 kmh σ1= 16 kmh M2 m2= 5 kmh σ2= 12 kmh
M1 m1= 1 kmh σ1= 16 kmh M2 m2= 25 kmh σ2= 15 kmh
M1 m1= 1 kmh σ1= 16 kmh M2 m2= 55 kmh σ2= 29 kmh
Distribution of user characteristics considering cases SA1WA1 (SISO)22
M1 100 A1 100
M1 80 M2 20 A1 100
M1 50 M2 50 A1 100
M1 40 M2 60 A1 100
Distribution of user characteristics considering cases SA2WA2 (MIMO)7
M1 100 A1 20 A2 40 A3 30
M1 80 M2 20 A1 20 A2 40 A3 30
M1 50 M2 50 A1 50 A2 30 A3 20
M1 40 M2 60 A1 50 A2 30 A3 20
Figure E1 Example sketch of cellular scenario with 19 three-sector sites
22 No correlation between mobility transmit power and antenna parameters is taken into account so far
WINNER D210 v10
Page 112 (180)
Appendix F Link-Level Assessments The merits of different coding modulation channel estimation and link adaptation techniques have already been assessed in a number of previous WINNER deliverables most notably [WIND22 WIND23WIND24WIND26WIND27] Therefore this chapter contains mainly assessment results necessary to justify the WINNER system design decisions reported in Chapter 2 of this report Thus Appendix F2 presents a detailed comparison of the complexity and performance of Duo-Binary Turbo Codes and Block-LDPC codes as these have been identified as the most promising FEC candidate technologies More detail on the assessment methodology and other coding techniques (CC standard PCCC and PEG-based LDPCC) can be found in [WIND23] Appendices F3 and F4 provide detail on the performance of different channel estimation and synchronisation techniques to back up the results from Appendix B4 in terms of the amount of pilots required to achieve a CSI of sufficient quality at the receiver Finally in Appendix F5 results for the performance of different bit-and power-loading algorithms are presented Another purpose of this chapter is to present results that give insight into the overall performance of the WINNER physical layer ndash Appendix F1 serves that purpose
F1 Link layer performance Throughput In order to assess whether the performance of the WINNER physical layer is sufficient to live up to the requirements stated in Section 11 and in order to provide first results that allow for an estimation of the SNRs required to achieve different spectral efficiencies the performance of a single user CP-OFDM system using advanved coding (3GPP Turbo Code 8 iterations maxLogMAP decoding) has been evaluated This setup can be considered as an example of a single user served in the non-frequency-adaptive mode (where MC-CDMA with spreading factor 1 reduces to CP-OFDM) Note that the protocol overhead (super-frame structure in-band signalling pilot subcarriers) as well as SNR penalties due to imperfect channel estimation synchronisation are not included in this assessment The overhead due to guard bands on the other hand is included The overall throughput of a single link will hence be slightly lower than the figures given in the following plots and the required SNR will be slightly higher The activity factor for FDD is not included in the throughput figures an appropriate scaling must be included for all cases where the activity factor is smaller than 1
Table F1 Summary of parameters for WINNER channel models
Scenario identifier Deployment PHY mode
UT speed [kmh]
Delay Spread [ns]
Composite angular
Spread at BSMT
[degrees]
A1 In building
small office residential
TDD 100 MHz 3 24 232391
B1 Hotspot
Typical urban micro cell
TDD 100 MHz 3 90 124364
B3 Hotspot
Indoor TDD 100 MHz 3 30 3187
C2 Metropolitan
Typical urban macro cell
FDD 2x20 MHz 70 310 853
D1 Rural
Rural Macro cell
FDD 2x20 MHz 70 28 224179
Table F1 summarises some relevant parameters for the used WINNER tapped delay line models Scenario A1 and B3 provide roughly the same amount of frequency diversity However the angular spread at the BS is very small for the B3 and C2 models ndash in contrast to most other results presented in this chapter the scenario A1 has therefore been selected for TDD mode evaluations Although both wide area cases (metropolitan and rural) have been simulated the focus in the present section is on the
WINNER D210 v10
Page 113 (180)
metropolitan area where the larger traffic demands can be expected In this scenario the high correlation between BS antennas is expected to significantly affect the gains achievable by using spatial multiplexing techniques as is confirmed by the results in Figure F3
Figure F1 below shows the performance of a SISO system with the parameters from Table 21 for FDD mode operation (20 MHz bandwidth the used channel model is the clustered delay line model C2 NLOS from [WIND54]) A SNR beyond 20 dB is required to achieve a spectral efficiency of 3 bitsHz Taking a duplex activity factor of 05 and an overhead of 20 into account the spectral efficiency design target of 05 bitsHzlink in the downlink (see 70 kmh in Appendix A13) corresponds to about 25 Mbits which with dual-antenna terminals as baseline (roughly 3 dB gain in this scenario) and assuming a loss of 1 dB from non-ideal channel estimation requires a SINR of around 9 dB A simple link budget (using pathloss models and other parameters listed in Appendix E23) based on this SINR requirement gives a maximum cell range very close to 1000 m without indoor-to-outdoor coverage This indicates that the above-mentioned cell-average of 05 bitssHzlink with single user should be possible to obtain with some margin even without relays
Turning to the rural area scenario simulations (not shown) together with a link budget24 show that the spectral efficiency target of 05 bitsHzlink at 70 kmh can be reached with good margin (up to a cell range of well above 3 km) For the uplink the targets are somewhat tougher but should still be reachable (in particular with relays)
-5 0 5 10 15 20 250
10
20
30
40
50
60
70
SNR [dB]
Thro
ughp
ut [M
Bit
s]
16-QAMRc = 12
BPSKRc = 12
4-QAMRc = 12
64-QAMRc = 12
64-QAMRc = 34
Figure F1 Throughput of CP-OFDM-based FDD mode system (20 MHz SISO C2 NLOS)
Figure F2 depicts the TDD mode case (100 MHz bandwidth again for a SISO setup) ndash data rates are evidently higher while spectral efficiency figures are comparable as could be expected from the system definition in Table 21 The channel model used is A1 NLOS from [WIND54] Achieving the target spectral efficiency of 4 bitsHz (cf Appendix A14) with half-duplex and 20 overhead corresponding to about 1000 Mbits seems to be difficult without the use of some form of spatial multiplexingspatial diversity techniques to be further discussed in the following
23 Noise bandwidth 16 MHz noise figure 7 dB on DL (5 dB on UL) transmit antenna gain 15 dB output power 20
W Based on the shadow fading standard deviation of 57 dB a shadow fading margin of 35 dB was assumed by scaling the results in [SGF95]
24 Here the shadow fading standard deviation is 8 dB and a margin of 5 dB was used cf [SGF95]
WINNER D210 v10
Page 114 (180)
-5 0 5 10 15 20 250
50
100
150
200
250
300
350
SNR [dB]
Thro
ughp
ut [M
Bit
s]
16-QAMRc = 12
BPSKRc = 12
256-QAMRc = 12
4-QAMRc = 12
64-QAMRc = 12
Figure F2 Throughput of CP-OFDM-based TDD mode system (100 MHz SISO A1 NLOS)
Figure F3 and Figure F4 show the performance for the spatial multiplexing case for both FDD and TDD mode operation For the FDD system a 2x2 MIMO setup was selected while a 4x4 MIMO setup was used for the TDD case where more spatial diversity is expected to be available (cf the higher angular spread at the base station in Table F1)
0 5 10 15 20 25 300
10
20
30
40
50
60
70
80
90
SNR [dB]
Thro
ughp
ut [M
Bit
s]
16-QAMlinear16-QAMmlBPSKlinearBPSKml4-QAMlinear4-QAMml64-QAMlinear64-QAMml
Figure F3 Throughput of CP-OFDM-based FDD mode system (20 MHz 2x2 MIMO C2 NLOS)
WINNER D210 v10
Page 115 (180)
For both setups the performance was evaluated when using a simple linear MMSE equaliser and also when using a high performance equaliser (ML detection where possible otherwise Sphere Detection with a sufficient number of full length candidates) Taking the results for the latter receiver architecture and comparing then the MIMO with the SISO case allows for identifying the performance losses due to antenna correlation (the throughput would roughly scale with the number of transmitreceive antennas in a completely uncorrelated scenario) Comparing the results of the linear and the MLSphere detector allows for identifying how much gains can be achieved by using advanced receiver architectures as compared to the simplest one As is evident a SNR in excess of 30 dB would be required to run the maximum modulationcoding schemes investigated for the SISO case in Figure F1 and Figure F2 Consequently the maximum spectral efficiency does not scale fully with the number of antennas which can be attributed to the limited amount of spatial diversity A spectral efficiency of around 4 bitsHz is achieved at SNR=25 dB for the 2x2 MIMO FDD case when using a high performance detector The gains at lower SNRs which are expected in multi-cell environments are substantially lower More specifically at a SNR of 4 dB the spectral efficiency is not increased with respect to the SISO case
For the 4x4 MIMO TDD case a spectral efficiency of 12 bitsHz is achieved at SNR=30 dB At a bandwidth of 100 MHz this would with an activity factor close to 1 allow achieving the target peak data rate of 1 Gpbs cited in Section 11 With half-duplex and 20 overhead the design target spectral efficiency of 4 bitsHz (cf Appendix A14) can also be achieved at about 30 dB
-5 0 5 10 15 20 25 300
200
400
600
800
1000
1200
SNR [dB]
Thro
ughp
ut [M
Bit
s]
16-QAMlinear16-QAMsphereBPSKlinearBPSKml256-QAMlinear4-QAMlinear4-QAMml64-QAMlinear64-QAMsphere
Figure F4 Throughput of CP-OFDM-based TDD mode system (100 MHz 4x4 MIMO A1 NLOS)
WINNER D210 v10
Page 116 (180)
F2 Forward error correction In this part the two main channel coding candidates Duo-Binary Turbo-Codes and Quasi-Cyclic Block-LDPCC are investigated their performance compared and finally first results on the complexityperformance trade-off are given In order to cover a wide range of applications 5 different block lengths have been selected 576 1152 1728 2304 and 4308 coded bits together with 3 different code rates Rc = 12 23 and 34 The assessment in this section follows the framework from [WIND23] For details on cycle count and energy consumption figures please refer to [WIND23] The performance comparison is done for BSPK transmission over the AWGN channel The (relative) assessment however is expected to be similar for a wide range of channels as was confirmed by the assessment done in [WIND23] for different types of Rayleigh fading channels
F21 Performance comparison The performance comparison (cf Figure F5) underlines the fact that the selection of an appropriate coding technique depends crucially on the target block length For code rate 05 DBTC outperform BLDPCC for block lengths up to 1728 (02 dB gain over BLDPCC for N = 576) Then LDPCC start progressively to outperform DBTC (01 dB better for N = 4308) In general the performance loss by going from large to small block sizes is lower for DBTC than for BLDPCC The threshold (in terms of block length) that separates these two regimes however depends on the code rate When increasing the code rate to Rc = 34 a block length of 1152 is sufficient for the BDLPCC to achieve the same performance as the DBTC and the difference observed for N = 576 is very small (cf Figure F7)
08 1 12 14 16 18 2 22 2410-3
10-2
10-1
100
EbN0 [dB]
BLE
R
DBTC vs QC-BLDPCC BPSK Rc=12 AWGN
BLDPC N=576BLDPC N=1152BLDPC N=1728BLDPC N=2304BLDPC N=4308DBTC N=576DBTC N=1152DBTC N=1728DBTC N=2304DBTC N=4308
DBTC Max-Log-MAPBLDPC LLR-BP 50 Iter
Figure F5 Performance comparison between DBTC and QC-BLDPCC Rc=12
F22 Complexity-performance trade-off Relying on the computational complexity assessment introduced in [WIND23] and [3GPP-WG142] together with the relative cost of operations given by Table 51 from [WIND23] the energy consumption and cycle counts were computed for both DBTC and BLDPCC For the sake of clarity we restricted the presentation of results to two extreme block length cases N = 2304 and N = 576 respectively In the case of DBTC only the Max-Log-MAP decoder with scaling of extrinsic information (factor 05 in the first
02dB 01dB01d
WINNER D210 v10
Page 117 (180)
075 in the 2nd to 7th and 1 in the last iteration) is used as it has been proven to give performance similar to Log-MAP decoding at attractive reduction in complexity Similarly the MinSum algorithm (MSA) provides the best trade-off for LDPC decoding as illustrated by the results in Appendix F24 Additionally alternative schedulings (shuffled decoding) should be used as they lead to faster convergence of the decoding algorithm and (same performance at roughly half the iterations cf results in Appendix F25)
In the sequel we tried to keep similar notations already introduced into [WIND23] Due to comparison between different packet lengths minor modifications have been proposed Packet length of N = 2304 bits are represented by purple coloured markers and those of N = 576 bits by blue coloured markers Concerning DBTC the triplet ldquo(mx iy lgMPz)rdquo indicates the memory size lsquoxrsquo of constituent encoders the number of maximum iterations lsquoyrsquo and maxLogMAP (lsquoz=0rsquo) or logMAP (lsquoz=1rsquo) decoding algorithm respectively In the present investigation only the maxLogMAP decoding algorithm will be considered for Duo-Binary Turbo-Code and its marker will be a diamond Due to simple operations only the edge colour will be green (energy cost=cycle count) The marker face colour represents the considered packet length In the case of block LDPC codes we have to differentiate also the number of iterations A circle marker denotes the maximum complexity (maximum number of iterations 20 in the considered setup) A triangle marker is used for the average complexity (average number of iterations) Energy and Cycles are distinguished then by the use of non-filled or filled marker respectively
15 16 17 18 19 2 21 220
200
400
600
800
1000
1200
1400
1600
1800
BLDPCC (MSAmax=20)N=576
EbN0 [dB] Required for BLER 1
Rela
tive
Cycl
eE
nerg
y
BLDPCC (MSAmax=20)N=2304
BLDPCC (MSAmax=20)N=2304
BLDPCC (MSAavg)N=2304
BLDPCC (MSAavg)N=2304
DBTC (m3i8lgMP0)N=2304
DBTC (m3i8lgMP0)N=576
DBTC Vs BLDPCC N=576 N=2304 Rc=05 AWGN
BLDPCC (MSAavg)N=576
BLDPCC (MSAmax=20)N=576
BLDPCC (MSAavg)N=576
Figure F6 Complexity-performance trade-off for QC-LDPCC and DBTC Rc=12
For the case of Rc=12 depicted in Figure F6 above Duo-Binary Turbo-Codes offer a better complexity-performance trade-off than block LDPC codes with low block size (N = 576) as they perform better at only slightly more energy consumption (wrt the maximum iteration case for BLDPCC) However for a higher block length (N = 2304) BLDPCC become more suitable since their energy consumption saving is achieved at the expense of only minor performance degradation These two trends are reinforced throughout the remaining results cf Figure F7 below Indeed the higher the coding rate the less energycycles are required by BLDPCC (provided that the high code rate is achieved by using a code of a different rate rather than puncturing the rate 12 code) It might be worth mentioning that DBTC still outperform BLDPCC for lower block length but their higher energy consumption in the present case of 8 internal decoder iterations seems to be the price to be paid for such performance
WINNER D210 v10
Page 118 (180)
26 27 28 29 3 31 32 33 34 350
200
400
600
800
1000
1200
1400
1600
1800
EbN0 [dB] Required for BLER 1
Rela
tive
Cycl
eE
nerg
y
DBTC Vs BLDPCC N=576 N=2304 Rc=075 AWGN
DBTC (m3i8lgMP0)N=2304
DBTC (m3i8lgMP0)N=576
BLDPCC (MSAmax=20)N=2304
BLDPCC (MSAmax=20)N=2304
BLDPCC (MSAmax=20)N=576
BLDPCC (MSAmax=20)N=576
BLDPCC (MSAavg)N=2304
BLDPCC (MSAavg) N=2304
BLDPCC (MSAavg) N=576
BLDPCC (MSAavg) N=576
Figure F7 Complexity-performance trade-off for QC-LDPCC and DBTC Rc=34
This complexityperformance trade-off is a necessary step towards fair comparison of these two main channel coding candidates DBTC and BLDPCC Although these results are quite informative they are not yet sufficient for any further technological decision Indeed the number of gates and the memory size requirements together with performance robustness to quantisation (fixed point simulations) still have to be investigated still Based on current assessment and know-how these two channel coding techniques look more like complementary than concurrent solutions (wrt block length) The next phase of WINNER (Phase II) should give additional answers and lead to in-depth understanding and comparison of both technologies by focusing more and more onto architecture and implementation aspect
F23 Performance comparison of rate compatible punctured codes The performance of rate compatible punctured standard PCCCs and LDPCCs can be considered to be equal LDPCC show better performance at high SNR which however is less relevant for HARQ as negligible number of retransmissions are needed in this SNR regime Figure F8 shows exemplary the performance of constructed BLDPCC punctured BLDPCC and DBTC for two block lengths (the mother code rate of the punctured codes was Rc = 12) Note that the average number of iterations of punctured LDPCC is about twice as large as that of the constructed LDPCC
F24 BLDPCC performance comparison of major decoding algorithms In recent years a lot of different LDPC decoding algorithms have been proposed in literature Our target in this part is thus to compare the most important ones ndash Belief Propagation [Gal63] A-Min [JVS+03] Lambda-Min [GBD03] Min-Sum and its corrected version [CF02] To do so we have assessed their performance for different block lengths and code rates As a summary of the performance-complexity trade-off Figure F9 depicts the decoding complexity over the bit SNR required to achieve BLER 1 for the example code rate 05 and two different code block lengths (again purple for N=2304 and blue for N=576) The advantage of the MinSum can be emphasised quite clearly as it leads to good performance at low cost expense
WINNER D210 v10
Page 119 (180)
0 05 1 15 2 25 3 3510-3
10-2
10-1
100Puncturing Block LDPC SEUK exact BP decoder max 50 iterations
EbN
0
BLE
R
punctured BLDPC R=066 N=1728 constructed BLDPC R=066 N=1728DBTC R=066 N=1728punctured BLDPC R=075 N=2304constructed BLDPC N=2304DBTC R=075 N=2304
Figure F8 Rate-compatible puncturing of block LDPC
14 16 18 2 22 24 260
1000
2000
3000
4000
5000
6000
7000
8000
9000
10000
BPA
BPA
EbN0 [dB] required for BLER 1
Rel
ativ
e C
ycle
Ene
rgy
DBTC vs BLDPCC N=576 N=2304 Rc=05 AWGN
BPA
BPA
MSAMSA
AMA
AMA
AMA
AMA
LMA 2
LMA 2
LMA 2
LMA 2
LMA 3
LMA 3
LMA 3
LMA 3
Figure F9 Complexity-performance trade-off for different LDPC decoding algorithms Rc=12
F25 Performance when using different decoding schedules Figure F10 illustrates that the same performance can be achieved by using either a maximum of 50 iterations and flooding decoding or a maximum of 20 iterations and shuffled decoding (cf Appendix B24)
WINNER D210 v10
Page 120 (180)
0 05 1 15 2 25 3 35 410-3
10-2
10-1
100Horizontal shuffling vs flooding schedule Block LDPC Z=12 N=576
EbN0 [dB]
BLE
R
flooding R=05shuffling R=05flooding R=066shuffling R=066flooding R=075shuffling R=075
05 1 15 2 25 3 3510-3
10-2
10-1
100Horizontal shuffling vs flooding schedule Block LDPC Z=48 N=2304
EbN0 [dB]
BLE
R
flooding R=05shuffling R=05flooding R=066shuffling R=066flooding R=075shuffling R=075
Figure F10 Scheduling of BPA decoder for block LDPC of lengths N=576 N=2304 Horizontal (group 48) shuffling with max 20 iterations vs flooding schedule with max 50
iterations
F26 Base model matrices for BLDPC codes The BLDPCC investigated in this document are relying on the following base model matrices in conjunction with the appropriate expansion process They constitute the current state-of-the-art when it comes to (LDPC) code construction in the WINNER project and will be the starting point of investigations in WINNER Phase II The three base model matrices in Figure F11 - Figure F13 correspond to the three code rates Rc=12 Rc=23 and Rc=34 respectively
Figure F11 (24 48) Base model matrix Rc=12
WINNER D210 v10
Page 121 (180)
Figure F12 (16 48) Base model matrix Rc=23
Figure F13 (12 48) Base model matrix Rc=34
WINNER D210 v10
Page 122 (180)
F3 Channel estimation
F31 Uplink single carrier As mentioned in Appendix B42 time domain or two types of frequency domain pilots are options for channel estimation for uplink single carrier In comparative simulations the C2 urban macro channel was used with parameters from Table 21 for frequency domain generation of a single carrier signal A classical Doppler spectrum was assumed to generate channel realisations with UT speed of 50 kmh The coding used was a rate 12 convolutional code with memory 6 Random bit interleaving was also included In the receiver a linear MMSE symbol based equaliser and an iterative soft decision feedback equaliser [TB04] were tested The soft Viterbi algorithm was used in the decoder The time domain multiplexed pilot signal was a 64-symbol Chu sequence which has a uniform envelope and power spectrum The FET frequency domain pilots were formed from the FFT of a 52-point Chu sequence the FFT components were mapped to the pilot grid every 8th frequency of every 5th block This grid was found to be more effective for the SC system than the FDD grid of Figure B6 used for the OFDM-PACE system and had approximately the same overhead For FDSP since no extra subcarriers are used for pilots a more liberal grid was used with pilot subcarrier spacing of 8 and pilot block spacing of 2 For blocks with pilots least square (LS) estimator was used for lsquorawrsquo channel estimation followed by an FFT interpolator in frequency domain Linear LS line fitting was used for channel estimates for blocks without pilots25 This approach is suboptimal but relatively simple Simulation results were obtained by averaging the block error rate (BLER) over 10000 frames There were 12 blocks (and thus 12 correlated channel realisations) per half-frame (slot)
The iterative soft decision feedback equaliser (SDFE) is a simplified version of a frequency domain turbo equaliser [TB04] Its iterative process does not include decoding or channel estimation One or two iterations are generally sufficient to yield a significant performance improvement over linear equalisation on severely dispersive channels It is more effective than a conventional hard decision DFE and avoids its error propagation problem at the expense of slightly higher complexity SDFE brings the performance of the FDSP technique closer to that of the linearly-equalised FET and TDM techniques at the expense of some extra receiver complexity
Other considerations also influence the choice of a channel estimation pilot scheme for serial modulation The prime advantage of serial modulation over OFDM is its lower PAPR and hence lower transmit power backoff requirement The PAPR is not affected by the addition of a Chu sequence time domain pilot signal but the addition of frequency domain pilots amounts to the transmission of several parallel waveforms and thus increases the PAPR somewhat Furthermore it can be shown that the PAPR is also increased in the FET approach due to the rearrangement and expansion of the signal spectrum to accommodate the added pilots Measurements of the power backoff required to confine the transmitted spectrum to a given spectral mask indicate that the backoff is still less than that of a comparable OFDM signal but the margin is slightly reduced for FDSP and more so for FET Another consideration is overhead the FET and TDM techniques both incur higher overhead than the FDSP technique
Figure F14 shows block error rate performance curves for TDM FET and FDSP pilot techniques as well as for the case of no pilots and perfect channel state information Figure F14 (a) shows the results for linear equalisation and Figure F14 (b) shows results for the soft iterative DFE with two iterations The 1rsquos and zeroes in the legend indicate which blocks have pilots and P indicates the number of pilots per block eg [100000000001] indicates pilots in every 11th block and P=104 indicates 104 pilots in a set of 416 used subcarriers ndash equivalent to the pilot grid scheme of Figure B6
25 For MS speed lt=70 kmh we assume the channel varies linearly within one frame
WINNER D210 v10
Page 123 (180)
0 2 4 6 8 10 12 1410-3
10-2
10-1
100
SNR [dB]
BLE
R
SC Rc = 12 K=7 Scenario C2 v=50kmh LE
TDM[100000000001] P=64TDM[101010101001] P=64FET[100000000001] P=52FET[100000000001] P=104FET[100001000010] P=52FET[101010101001] P=52FDSP[100000000001] P=52FDSP[101010101001] P=52Known CSI with LE
0 2 4 6 8 10 12 1410-3
10-2
10-1
100
SNR[dB]
BLE
R
SC Rc=12 K=7 Scenario C2 v=50kmh soft DFE
TDM[100000000001] P=64TDM[101010101001] P=64FET[100000000001] P=52FET[100000000001] P=104FET[100001000010] P=52FET[101010101001] P=52FDSP[100000000001] P=52FDSP[101010101001] P=52Known CSI with LEKnown CSI with Soft DFE
(a) (b)
Figure F14 Block error rates for linear (a) and soft DFE equalisers (b)
Table F2 summarises the SNR degradations relative to known channel for OFDM from Figure F15 and also the total overhead The total overhead includes pilots cyclic prefix and unused subcarriers in the FFT blocks The extra backoff is with respect to the power backoff required for the OFDM system The power backoff in each case was determined so to accommodate the transmitted spectrum emerging from a power amplifier modelled by a Rapp model [Rap91] with parameter p=2 The table also includes the OFDM-PACE and the iterative channel estimation OFDM-ICE scheme Iterative channel estimation schemes could also be applied for single carrier but were not evaluated here
WINNER D210 v10
Page 124 (180)
Table F2 Comparison of performance pilot overhead and required power backoff for three different pilot schemes for linear equalisation and soft decision feedback equalisation and for
OFDM Channel is C2 with wide area FDD signal parameters
Pilot schemes SNR degradation
BLER=10-2 relative to SNR=86 dB for OFDM with perfect CSI (dB)
Total overhead26 ()
Power backoff to satisfy spectral mask relative to OFDM (dB)
Power penalty relative to OFDM with perfect CSI (dB) and no pilots
(col 2+col 4)
LE27 SDFE28 LE SDFE
SC-TDM29 37 27 285 -30 07 -03
SC-FET30 36 24 296 -11 25 13
SC-FDSP31 39 29 278 -15 24 14
OFDM - PACE32 17 294 0 17
OFDM - ICE(8)33 0 294 0 0
The calculated overheads which are a direct measure of modulation inefficiency for the various schemes are similar Most of the overhead is contributed by cyclic prefix and unused subcarriers rather than by pilots The tablersquos last column shows the power penalty due to the combination of SNR degradation and required transmitter power backoff for a given power amplifier We see that single carrier with time division pilots give the least power penalty The single carrier frequency domain pilots and OFDM schemes are about 1 to 2 dB worse (due to their increased backoff requirements) The single carrier frequency domain pilot schemes have roughly the same power penalties as those of OFDM-PACE when the receiver uses the soft iterative DFE and would likely have similar penalties as OFDM-ICE if iterative channel estimation were added The major power backoff advantage of single carrier is best realised when time domain pilots are used for channel estimation
F32 Pilot-aided and iterative channel estimation for OFDM In this section pilot-aided (PACE) and iterative channel estimation (ICE) is evaluated for non-adaptive OFDM transmission in both FDD and TDD mode [WIND21 WIND23] The pilot-aided technique relies
26 Total overhead =
(1 )CP pilot GI CP GIp p
FFT CP pilot t FFT CP
N N N N NN N N N N
α α+ + +
sdot + minus+ + +
Where NCP cyclic prefix length=64 Npilot number of pilot symbols per block=52 64 or 104 NGI number of unused subcarriers in each FFT block=96 NFFT FFT block length=512 Npilott number of time domain pilot symbols (if any)=0 or 128 αp fraction of blocks with overhead-causing pilots=111
27 Linear frequency domain equaliser 28 Soft iterative decision feedback equaliser with 2 iterations 29 Single carrier with 64-symbol time domain-multiplexed pilot sequences Pilot sequence inserted every 11th block 30 Single carrier with frequency domain pilots inserted every 8th frequency in every 5th block 31 Single carrier with frequency domain pilots replacing data at every 8th frequency in every second block 32 OFDM with frequency domain pilots inserted every 4th frequency in every 11th block Results from Figure F15 33 Iterative channel estimation using 2 turbo iterations
WINNER D210 v10
Page 125 (180)
on common pilots proposed in Appendix B42 scattered over the whole available bandwidth or solely from dedicated pilots of one chunk
The pilot grid used for simulations is in line with the general pilot grid pattern suggested in Appendix B42 For Wiener filtering a robust filter design is selected for each mode according to the specifications of the ldquomismatched Wiener interpolation filter (WIF) in Appendix F33 While the actual velocity for the typical urban macro channel model C2 is set to 50 kmh a UT velocity of 100 kmh was assumed to generate the filter coefficients in time direction For the correlation in frequency direction a mismatched filter assuming a maximum delay of the channel τmax equal to the CP duration is used
For the case of QPSK modulation we consider channel estimation with common pilots using the full bandwidth and with dedicated pilots for chunk-based channel estimation The allocation of chunks to users is performed in a round-robin manner In the numerical simulations the channel encoder is a memory 6 CC with generator polynomials (133171) in octal form At the base station each data stream corresponding to a given user is iteratively decoded Figure F15 shows the BLER performance achieved with PACE or ICE respectively in the TDD and the FDD mode when channel estimation is carried out at the chunk level or using the full available bandwidth The results are summarised in Table F3 For ICE with common pilots no performance loss relative to perfect channel knowledge is observed For chunk based channel estimation with dedicated pilots ICE turns out to be particularly effective Generally the performance loss relative to perfect channel knowledge is greater in the FDD mode In this transmission scenario the user mobility and a higher frequency selectivity of the channel render channel estimation more difficult than for the TDD case
Table F3 SNR degradation of several channel estimation techniques with respect to the case of perfect channel knowledge at the receiver
Transmission mode SNR Degradation BLER = 10-2
Channel model
mobility Chunk-based -
PACE Chunk-based -
ICE Full BW -
PACE Full BW ndash
ICE
TDD B3 no mobility 28 dB 09 dB 12 dB 0 dB
FDD C2 100 kmh 34 dB 11 dB 17 dB 0 dB
0 2 4 6 8 10 12 1410-3
10-2
10-1
100
SNR [dB]
BLE
R
Perfect CSIChunk-based - PACEChunk-based - ICE 3 iterFull BW - PACEFull BW - ICE 2 iter
0 2 4 6 8 10 12 1410-3
10-2
10-1
100
SNR [dB]
BLE
R
Perfect CSIChunk-based - PACEChunk-based - ICE 3 iterFull BW - PACEFull BW - ICE 2 iter
Figure F15 BLER performance for PACE or ICE at the chunk level or using the full data
bandwidth with QPSK modulation Left SISO TDD mode channel B3 NLOS no mobility right SISO FDD mode channel C2 NLOS UT velocity 50 kmh
Figure F16 depicts the BLER performance achieved with PACE or ICE with higher-order modulation alphabets (16-64-QAM) Apart the parameters for common pilots using the full bandwidth from the previous figures apply For both 16 and 64-QAM ICE approaches the performance of a receiver with perfect channel knowledge For 16-QAM the SNR loss with PACE at BLER = 10-2 varies from 13 dB to 17 dB respectively for the TDD and the FDD mode With 64-QAM the performance degradation caused by channel estimation errors induced by PACE ranges from 12 dB in the TDD mode to 22 dB in the FD mode The SNR degradation for PACE remains almost constant over the range of BLER considered for the evaluation of the channel estimation performance
WINNER D210 v10
Page 126 (180)
0 5 10 15 2010-3
10-2
10-1
100
SNR [dB]
BLE
R
SR - Perfect CSISR - PACESR - ICE 2 iterWA - Perfect CSIWA - PACEWA - ICE 2 iter
5 10 15 20 25 3010-3
10-2
10-1
100
SNR [dB]
BLE
R
SO - Perfect CSISO - PACESO - ICE 2 iterWA - Perfect CSIWA - PACEWA - ICE 2 iter
Figure F16 BLER performance of PACE and ICE after 2 turbo iterations with 16-QAM modulation (left) and 64-QAM modulation (right) for the short-range (SR) TDD mode and the
wide-area (WA) FDD mode
F33 Design of the channel estimation unit For pilot aided channel estimation (PACE) two cascaded FIR interpolation filters are used one operating in frequency direction for interpolation over subcarriers of one OFDM symbol and the other operating in time for interpolation over OFDM symbols of a certain subcarrier as described in [WIND21] section 621 The performance of the interpolation filter depends on the amount of knowledge of the channel statistics these are
bull A Wiener interpolation filter (WIF) which is perfectly matched to the channel statistics The power delay profile (PDP) and the Doppler power spectrum (DPS) are assumed to be perfectly known
bull A WIF with ldquomatched pass-bandrdquo Knowledge about the maximum delay of the channel
maxτ and the maximum Doppler frequency maxDf are assumed However within [0 maxτ ] and [ maxDfminus maxDf ] the PDP and DPS are assumed to be unknown and uniformly distributed For the results the WINNER B3 and C2 channel models were used for the TDD and FDD mode respectively
bull A mismatched WIF where the maximum channel delay is assumed to be equal to the CP duration and the maximum Doppler frequency is set to the maximum value of expected mobile velocities For the TDD mode pedestrian velocities of 10 kmh while for the FDD mode velocities up to 100 kmh are assumed corresponding to a normalised Doppler frequency of
4max 10 minus=Df and maxDf =0013 respectively
In all cases perfect knowledge of the SINR at the receiver was assumed as it is expected that this information is needed also by other parts of the WINNER system
WINNER D210 v10
Page 127 (180)
0 10 20 30 40-5
0
5
10
15
20
SNR [dB]
Est
imat
or g
ain
G [d
B]
mismatched WIF γw=40 dB
mismatched WIFmatched pass-band WIFperfectly matched WIFMMSE Mf=16 Mt=5
ICEno feedback errors (16x5)
common pilots (16x1)PACE
PACEdedicated pilots (2x1)
Figure F17 Estimator gain vs SNR for dedicated and common pilots of various channel estimation techniques Also shown is the estimator gain in case all symbols per chunk can be used as pilots
which can be viewed as a lower bound for ICE if decision feedback errors are negligible
For certain MIMO techniques utilizing short term channel knowledge at the transmitter the degradation due to channel estimation errors is very severe (see Appendix B42) There estimator gains in the range of 13 to 17 dB are required The estimator gain is a measure for the quality of the channel estimate and is defined as 1(MSESNR) Figure F17 shows the estimator gains for dedicated and common pilots of the three considered channel estimation techniques PACE with dedicated pilots cannot achieve the required gains even for a perfectly matched filter If all symbols within a chunk can be utilised as pilots estimator gains exceeding 13 dB are possible This may be achieved by ICE in case decision feedback errors are negligible a realistic assumptions in the high SNR regime
0 10 20 30 40-15
-10
-5
0
5
10
SNR [dB]
Est
imat
or g
ain
G [d
B]
PACE dedicated pilots (2x1)
Sb = 0dB
Sb = 3dB
Sb = 6dB
Sb = 10dB
mismatched WIF
matched passband WIF
Figure F18 Estimator gain vs SNR for dedicated pilots for various pilot boosts
Unfortunately even with excessive pilot boosts the estimator gains for dedicated pilots are not sufficient as shown in Figure F18 So some post processing of the PACE channel estimates appears necessary
F34 Unbiased channel interpolation Unbiased interpolation is used in the bootstrap phase of the communication It is based on the relation between the delay and frequency-domain channel coefficients in OFDM systems (see [JFH+05]) Solutions are needed for full-spectrum (down-link) and at chunk level for up-link and dedicated pilots Here we report on the full-spectrum approach while chunk-level concepts are still under development
It is assumed that all subcarriers can be used for pilot or data transmission and that a sparse regular pilot grid is used Figure F19 (left) shows the reconstructed frequency response using a pilot spacing of 16 subcarriers in the short-range scenario (SNR = 20 dB) If the channel delays approach the CP length this is
WINNER D210 v10
Page 128 (180)
the theoretical maximum pilot spacing according to the sampling theorem Figure F19 (right) shows the estimator gain achieved with linear unbiased interpolation It depends on both SNR and delay spread (measured in taps 1 tap = 10 ns) The lower the SNR and the smaller the delay spread are the less taps are detected and hence the more noisy taps can be removed
Figure F19 Left Results for unbiased interpolation over the full spectrum (blue true channel red channel with noise open dots estimates on sparse pilot grid green interpolated frequency
response) Right Estimator gain with noise reduction in time domain
F35 Channel estimation using the guard interval mdash pseudo-random-postfix OFDM PRP-OFDM simulations were performed for the FDD parameter set presented in Table 21 Channel propagation conditions are used as defined in scenario C2 NLOS PRP-OFDM requires a significant number of OFDM symbols per frame in order to provide high SNR CIR estimates Since the parameter set defines a relatively short frame of 12 OFDM symbols only the simulation results focus on QPSK constellations PRP-OFDM will be shown to enable the system to work efficiently in a high mobility context (up to 144 kmh is considered here) if QPSK constellations are applied Due to the short frame length a significant error floor can be observed for 16-QAM transmission (which requires good channel estimates) which is improved (but not completely removed) by iterative interference suppressions (IIS) Any scenario with a frame-length smaller than 12 OFDM symbols is not considered for the use with PRP-OFDM (due to the insufficient CIR estimation MSE)
Simulations are performed taking 11 OFDM symbols into account for CIR estimation The frame to be decoded is assumed to be preceded by (dummy) PRP-OFDM symbols that are not decoded but whose postfix sequences are exploited for CIR estimation The results of PRP-OFDM are compared to a standard CP-OFDM system where the CIR estimation is assumed to be performed on 2 OFDM learning symbols at the beginning of the frame just after synchronisation No channel tracking is performed in this case The simulation results in Figure F20 show that a considerable error floor is present for standard CP-OFDM system for the mobility scenarios For PRP-OFDM this error floor disappears in the BLER range of interest and only an offset in SNR remains (approx 2 dB offset comparing 0 kmh vs 144 kmh) As a conclusion it can be stated that in combination with the chosen system and simulation parameters PRP-OFDM is useful in high mobility scenarios applying lower order constellations (QPSK in this example) Higher order constellations (QAM16 and higher) require larger observation window sizes for the CIR estimation and thus longer frames In the QPSK context PRP-OFDM leads to very acceptable system performance results at UT velocities as high as 144 kmh and beyond the performance loss at 144 kmh is limited to approximately 2 dB compared to the static case
WINNER D210 v10
Page 129 (180)
Figure F20 PRP-OFDM 11 Symbols CIR Estimation QPSK BLER simulation results
The simulation results show that PRP-OFDM can be used in the downlink to reduce the overhead required for channel estimation by using the guard interval for this purpose However the drawbacks namely the introduced delay (especially for higher order modulation) and the inability to extend this scheme to the uplink case are currently considered to outweigh the benefits Therefore CP-OFDM relying on a scattered pilot grid is currently the preferred solution
F4 Synchronisation
F41 Synchronisation without utilizing an explicit training symbol In [BSB97] a blind algorithm for symbol timing and frequency offset estimation was proposed which utilises the guard interval having the great advantage that it does not require any overhead in form of training data The basic idea is that the cyclic prefix is identical to the original part of the GMC block from which it is copied Correlation of the cyclic prefix with its original part results in a correlation peak The magnitude of the correlator output peaks at the beginning of an OFDM symbol while its phase at this time instant is proportional to the carrier frequency offset ∆f The algorithm detailed in [BSB97] is the maximum likelihood (ML) estimate in an AWGN channel For the ML estimate knowledge of the SNR is necessary which is impractical for acquisition when usually no information about the received signal is available The ML metric consists of the correlation metric ρ of the cyclic prefix with its original part as well as a metric which accounts for the signal power φ
Three different variants of the CP based synchronisation are compared
bull The ML estimator proposed in [BSB97]
bull An estimator which only uses the correlation metric ρ labelled ldquoCORrdquo Utilizing only ρ approaches the ML estimate at low SNR [LC02]
bull An estimator which uses the difference φρ minus approaches the ML estimate at high SNR [LC02] This approach is named ldquonorm CORrdquo since it is normalised by the power of the received signal
WINNER D210 v10
Page 130 (180)
Unfortunately the performance of this approach degrades in a frequency selective channel since the time dispersive channel impulse response reduces the ISI free part of the guard interval Computer simulations have been carried out for the WINNER FDD mode with channel model C2 and system parameters taken from Table 21 For the TDD mode the performance is expected to be better since CP correlation typically performs better if the number of subcarriers is large
Since the time and frequency offset will be constant during some OFDM symbols averaging over several estimates considerably improves the performance [BBB+99] This simple averaging of the correlation metric is a highly effective means to increase the robustness as well as accuracy of the CP based acquisition In the simulations averaging was performed over 12 OFDM symbols ie one OFDM frame
For channel model C2 the mean estimated timing offset is splTTE 6 asymp∆ which implies that the timing estimator is biased Unfortunately a positive mean will cause ISI and should therefore be avoided The bias may be compensated by a fine timing synchronisation unit operating in the frequency domain
The standard deviation of the time and frequency offsets is shown in Figure F21 Averaging the correlation metric of the CP based algorithm significantly improves the accuracy of the time and frequency estimates as shown in Figure F21 For cross-correlation based synchronisation averaging is only possible over the two OFDM symbols which carry pilot symbols Thus this technique cannot benefit from averaging to the same extend as CP based synchronisation While the combination of the CP based and the cross-correlation approach are possible [LWB+02] the cross-correlation approach cannot substantially improve the synchronisation accuracy Hence cross-correlation based synchronisation is applicable mainly in case that BSs are not synchronised
-5 0 5 10100
101
102
SNR [dB]
std(
∆ T
T spl)
MLCORNorm CORCC
withoutaveraging
withaveraging
-5 0 5 10
10-3
10-2
10-1
SNR [dB]
std(
∆ f c T
)
MLCORNorm COR
withaveraging
withoutaveraging
Figure F21 Standard deviation of the estimated time and frequency offset against the SNR (a) standard deviation of the time offset (left side CC = cross-correlator) and (b) standard deviation of
the frequency offset (right side)
WINNER D210 v10
Page 131 (180)
-5 0 5 1010-3
10-2
10-1
100
SNR [dB]
PFD
MLCORNorm COR
withaveraging
withoutaveraging
-5 0 5 1010-3
10-2
10-1
100
SNR [dB]
PFD
CC ∆ fc T = 0
CC ∆ fc T = 05
CC ∆ fc T = 10
Figure F22 Probability of false detection PFD against the SNR for (a) the CP correlator (left side) and (b) the cross-correlator (CC) using the scattered pilot grid of Figure B6 (right side)
Of particular interest is the performance of the algorithm at low SNR We define a false detection if the timing estimate is outside the window [-NCP2 NCP2] In Figure F22 the probability of false detection PFD of the CP correlator is plotted against the SNR (left side) It is seen that PFD is significantly reduced by averaging over 12 OFDM symbols The probability of false detection can be further reduced by averaging over more OFDM symbols For the simple COR synchronisation scheme the improvement through averaging is most significant
On the right hand side of Figure F22 PFD is shown for the cross-correlation (CC) based synchronisation scheme using the scattered pilot grid of the WINNER FDD mode It is seen that the detection probability of the OFDM symbol timing severely degrades if a carrier frequency offset is present For synchronisation in a wireless network time synchronisation for non-synchronised BSs is possible if adjacent BS use different pilot sequences However since the cross-correlator is sensitive to frequency offsets BSs should be either time or frequency synchronised Comparing the CP-based auto-correlation with the cross-correlation technique the CP correlation with averaging appears favourable Only for not time synchronised BSs the CC technique is a valid option It should be noted however that this statement depends on the chosen pilot grid For a smaller pilot spacing the performance of the CC technique is expected to improve
To conclude synchronisation by correlating the cyclic prefix (CP) with its original part is robust even at very low SNR provided that the correlation metric is sufficiently averaged Averaging over 12 OFDM symbols mitigates false detection for SNRge0 dB Since COR is the technique with the least complexity it can be concluded that averaging combined with COR is an appropriate choice due to its simplicity low overhead high accuracy and reliability Cross-correlation synchronisation utilizing a scattered pilot grid predominantly used for channel estimation can be used for synchronisation of a network where BSs are not time synchronised However BSs need to be frequency synchronised for this algorithm to work
WINNER D210 v10
Page 132 (180)
F5 Performance of selected bit and power loading algorithms In [WIND24] a set of various aspects of the adaptive link-level transmission using Hughes-Hartogs optimum bit-loading algorithm was assessed However as mentioned in Appendix B51 the HH approach is not ideal from the complexity point of view Therefore the following simulation results present a performance comparison between the HH algorithm and two others suboptimum less complex implementations by Chow Cioffi and Bingham and by Fischer and Huber
The presented bit error rate results have been obtained using a Monte-Carlo method by transmitting 100 million information bits per one particular SNR value This gives a sufficient precision to estimate bit error rates in the order of 10-5
A limited power constraint equal to the value of 1 [W] times the number of used subcarriers Nu = 1664 has been assumed in all evaluations Moreover a constant number of information bits have been loaded in each OFDM symbol ie
)(log2 MRNB ui sdotsdot= (F1)
where Nu means number of used subcarriers R represents the code rate and M is the constellation size In order to compare the performance of the evaluated loading algorithms the actual power loaded on each subcarrier has been normalised so the following criterion is fulfilled
summinus
=
=1
0arg
uN
ietti PP
where Pi is the power loaded on the ith subcarrier after normalisation and Ptarget is the total power limit
Figure F23 presents the simulation results for indoor scenario A1 NLOS channel model for a velocity v = 5 kmh The suboptimum less complex CCB and FH bit and power loading algorithms are compared to the Hughes-Hartogs approach All three algorithms have used the target BER setting equal to 10-4 The mean number of information bits transmitted in each OFDM symbol has been set to 2 Nu = 3328 The maximum number of iterations of the CCB algorithm has been limited to 10 (see Appendix B512) For comparison purposes an extra curve for non-adaptive transmission with fixed code rate and constellation size is depicted The overall bit rate of this fixed transmission is the same as in the adaptive cases
0 5 10 15 2010-3
10-2
10-1
100
SNR[dB]
BLE
R
WINNER A1 NLOS Channel Model SISO v = 5 kmh
Fixed R=34 QPSK AWGNAdaptive CCB BERtar=10-4
Adaptive FH BERtar=10-4
Adaptive HH BERtar=10-4
Figure F23 Performance comparison of the HH CCB and FH bit and power loading algorithms (short-range scenario A1 NLOS channel model SISO case v = 5 kmh)
WINNER D210 v10
Page 133 (180)
Similar simulation results are shown in Figure F24 Here slight different parameters have been chosen for comparison The channel model is B3 NLOS (short-range hotspot scenario) however the velocity has been set to the same value v = 5 kmh The mean number of information bits transmitted in one OFDM symbol is equal to 15 Nu = 2496 which is adequate for a transmission of a whole OFDM symbol using the code rate R = frac34 and QPSK constellation on each used subcarrier
0 5 10 15 2010-3
10-2
10-1
100
SNR[dB]
BLE
RWINNER B3 NLOS Channel Model SISO v = 5 kmh
Fixed R=12 16-QAM AWGNAdaptive CCB BERtar=10-4
Adaptive FH BERtar=10-4
Adaptive HH BERtar=10-4
Figure F24 Performance comparison of the HH CCB and FH bit and power loading algorithms (short-range scenario B3 LOS channel model SISO case v = 5 kmh)
Having looked at the results presented above one can conclude that the Fischer and Huber approach has only slightly worse performance than the Chow Cioffi and Bingham solution in a coded transmission over wireless channel models As expected Hughes-Hartogs bit and power loading algorithm performs best but it has the highest computational complexity In general the observed performance degradation of the suboptimum algorithms is so small that it can be neglected in this case
WINNER D210 v10
Page 134 (180)
Appendix G Multi-Link and System-Level Assessments Multi-link and system level simulations have been set up in order to study those techniques which directly or indirectly influence the level of interference at the receivers Basically these are multiple access radio resource management spatial processing at transmitter synchronisation of multiple transmitters (in case of a synchronised network) and power allocationcontrol Another class of techniques which has to be studied by means of system or multi-link simulations is related to receiver processing and the ability to cope with or to combat interference This class typically comprises the large set of single user and multi-user detection algorithm with or without the aid of multiple antennas and iterative processing Even synchronisation belongs to this class of receiver techniques provided there is a potential crosstalk from other simultaneously transmitting stations
This discussion reveals the huge amount of different topics which can and have to be assessed by means of multi-link or system level simulations Within WINNER Phase I emphasis has been placed on the evaluation of different multiple access schemes for up- and downlink partly in combination with various spatial processing options It is a continuation of the work being done in [WIND26] and [WIND27] focusing now on the most promising candidates and using more elaborated simulation environments For non-frequency-adaptively scheduled flows in the downlink the multiple access candidates are chunk based OFDMATDMA and MC-CDMATDMA and a comparison can be found in Appendix G11 The subcarrier interleaved variants of these two multiple access schemes are considered in Appendix G12 Regarding frequency-adaptively scheduled flows chunk based OFDMATDMA was identified as the most promising approach due the highest flexibility in allocating resources to users The additional SDMA gain using grid of fixed beams in a wide-area scenario is addressed in Appendix G14 In the same context spatial processing gains using more sophisticated adaptive beamforming approaches are analysed in Appendix G21 and Appendix G22 For non-adaptively scheduled flows a comparison of beamforming diversity and multiplexing is performed in Appendix G24 Moreover as in Appendix G23 the impact of multiple antennas at the UT and associated combining techniques on system performance is studied The absolute performance of linear multi-user SMMSE precoding is assessed in Appendix G25 for the short-range scenario considering again non-frequency-adaptively scheduled flows Taking realistic system impairments into account the required number of antennas to achieve an average sector throughput of 1 Gbits is identified
The preferred medium access candidates considered for the uplink are pretty much the same as for the downlink including additionally symbol based TDMA Compared to OFDMATDMA pure TDMA is beneficial from terminal power consumption point of view and it is less susceptible to frequency offsets among terminals However the impact of synchronisation errors is not yet included when comparing OFDMATDMA and OFDMTDMA in Appendix G44 The absolute performance of OFDMTDMA and ODFMATDMA with adaptive scheduling is assessed in Appendix G41 and Appendix G43 respectively Considering a short-range scenario in Appendix G43 the optimum resource allocation and bit loading scheme for OFDMATDMA with respect to sum capacity is compared to low complexity solutions
The impact of spatial diversity at the BS for various antenna configurations is analysed in Appendix G51 An information theoretic approach with respect to optimum spatial processing at the UT using two transmit antennas can be found Appendix G52
Other main results are related to multi-user detectionseparation at the receiver This holds not only for base stations but also for user terminals if MC-CDMA is applied Corresponding results considering different receiver structures without and with multiple antennas at the UT can be found in Appendix G31 and Appendix G32 respectively From the base station perspective receiver structures for SISO DS-CDMA and MIMO single carrier are presented and compared in Appendix G61 and Appendix G62
Other investigations which are not directly related to updownlink multiple access spatial processing or detection are part of Appendix G7 In Appendix G71 a comparison of OFDM and single carrier (with cyclic prefix) based uplinks is performed taking the increased power backoff constraint of OFDM into account Appendix G72 deals with low rate channel coding as a means to enable service to users at cell edge even in case of frequency reuse 1 Appendix G73 focuses on the crosstalk which is induced in an OFDM receiver if signals from different base station suffer from transmission delay differences larger than the guard interval Two resource partitioning schemes among base stations are compared with this respect TDMA and FDMA In Appendix G74 conventional and self-organised RRM is compared with respect to system throughput considering several options how to cope with varying interference
WINNER D210 v10
Page 135 (180)
conditions from newly arriving users Finally Performance results of a protocol which utilises and exploits the benefits of distributed antennas are presented in Appendix G75
It should be stressed that simulation results are provided by different partners using uncalibrated implementations and to a certain extent differing simulation assumptions Consequently results are not directly comparable unless otherwise noted (ie when they are from the same partner) Every contribution starts with a summary of the applied simulation assumptions different from those defined in Appendix E followed by a discussion of the simulation results and corresponding conclusions
For illustrative purposes the main set of medium access schemes which have been studied in greater detail by means of multi-link or system level simulation is depicted in Figure G1 Note that in the section headings the term TDMA has been omitted in most cases for the sake of brevity
chunknt symbols
n f s
ubca
rrie
rs
time
frequ
ency
codespace
Chunk based OFDMATDMA
Chunk basedMC-CDMATDMA
Interleaved OFDMATDMA= IFDMATDMA
Interleaved MC-CDMATDMA
Chunk basedOFDMATDMASDMA
TDMAChunk interleaved
OFDMATDMA
Figure G1 Illustration of considered GMC-based medium access schemes
G1 Downlink multiple access
G11 Comparison of non-adaptive OFDMA MC-CDMA and adaptive OFDMA
Simulation Assumptions Simulator System simulator using AWGN look-up tables and effective SINR mapping
Combined snap-shot dynamic mode gt100 runs of 14 s each simulated Scenario wide area cellular frequency reuse 1 single antenna BS and UT Channel modelling C2 NLOS clustered delay line Interference modelling Central cell mode with simplified inter-cell interference model (two tiers of
fully loaded sectors) Cell radius 900 m MCS 6 QPSKr=13QPSKr12QPSK r2316-QAM r=12 16-QAM r34
64-QAMr=23 BLER target lt01 FEC Punctured convolutional coding (561753)oct with memory 8
Codeword length fixed size of 480 data symbols corresponding to 320ndash1920 payload bits depending on MCS used
HARQ Chase combining maximum 6 retransmissions Type of feedback Non-freq adaptive Best MCS fed back by each terminal
Freq adaptive One SINR per chunk AckNack messages explicitly fed back in all cases Delay 1 chunk duration
Overhead Total overhead of 23 taken into account in TX-power and resources Mobile speed 30 kmh same for all mobiles - results in almost perfect link adaptation
WINNER D210 v10
Page 136 (180)
With the OFDMA variant considered here each user scheduled for transmission is assigned a subset of 6 chunks (out of 48) thus serving 8 users per chunk duration TDMA is applied in each of the two successive chunks forming a frame Thus 16 users are served in total in one FDD frame In the frequency non-adaptive case the 6 chunks of the 8 selected users are simply interleaved in frequency to provide a diversity gain for the channel decoder Note that in this case the link adaptation could also be pre-calculated at the terminal and best MCS feedback would be sufficient In the frequency-adaptive case the 8 users select their preferred 6 chunks in a fair way This requires an increased feedback using one SINR value per chunk for each user Link adaptation is then performed explicitly by the base station after chunk allocation
In case of MC-CDMA spreading is performed within the chunks only using a spreading factor of 8 Hence the whole available bandwidth is shared by 8 users simultaneously MC-CDMA requires only a feedback of the best MCS for each user in the cell assuming that link adaptation is pre-calculated at the terminals Based on this feedback time-domain scheduling (selecting 16 simultaneous users) and link adaptation is performed at the base-station
The simulation results in Figure G2 and Figure G3 firstly show a comparison of different scheduling algorithms in the non-frequency adaptive case using MC-CDMA An evaluation of these scheduling algorithms for pure TDMA and lower system bandwidth (5 MHz) was already presented in earlier WINNER deliverables The major difference compared to earlier results is the fact that with MC-CDMA using a spreading factor of 8 and half-duplex FDD 16 users are scheduled in parallel instead of just a single user Since the gains obtained from multi-user diversity depend on the number of users competing for the resource it is not surprising that the channel dependent schedulers Score Based and Maximum SINR achieve much lower gains in cell throughput compared to Round Robin (Figure G2) than was found in the earlier studies for a comparable number of users
40 users 80 users0
5
10
15
20
25
Mbi
ts
Average service throughput per cell
Round RobinScore BasedMaximum SINR
0 05 1 150
01
02
03
04
05
06
07
08
09
1
Mbits
Pro
b( a
v u
ser t
hrou
ghpu
t lt X
)
CDF of average user throughput
Round RobinScore BasedMaximum SINR
40 users
80 users
40 users 80 users0
5
10
15
20
25
Mbi
ts
Average service throughput per cell
Round RobinScore BasedMaximum SINR
0 05 1 150
01
02
03
04
05
06
07
08
09
1
Mbits
Pro
b( a
v u
ser t
hrou
ghpu
t lt X
)
CDF of average user throughput
Round RobinScore BasedMaximum SINR
40 users
80 users
Figure G2 Throughput for MC-CDMA vs number of userscell
100 200 300 400 500 600 700 800 9000
05
1
15
Mbi
ts
Distance [m]
80 users cell
100 200 300 400 500 600 700 800 9000
05
1
15
Distance [m]
Mbi
ts
40 users cell
Round RobinScore BasedMaximum SINR
Figure G3 Av user throughput vs distance (only scheduled users considered)
WINNER D210 v10
Page 137 (180)
Note also that the cell throughput for the fair score-based scheduler is limited by the low rate users at the cell border (Figure G3) similar to Round Robin In contrast the Maximum SINR scheduler artificially reduces the coverage by serving only users close to the cell centre Note from Figure G2 that for Maximum SINR scheduling around 30 (58) of the 40 (80) users in the cell are not served For Round Robin and score-based scheduling this number is slightly lower than 20 for both system loads Hence the single antenna configuration and the MCSs used for these first results do not provide satisfactory coverage and the use of multiple antennas and advanced coding strategies (eg Turbo Coding) does appear mandatory
In Figure G4 and Figure G5 MC-CDMA and OFDMA are compared for the frequency adaptive and the frequency non-adaptive case In the frequency non-adaptive case MC-CDMA outperforms OFDMA in terms of cell and user throughput for all considered loads and scheduling algorithms This is due to the frequency diversity advantage of MC-CDMA achieved by spreading the coded block over the whole bandwidth
40 users 80 users0
5
10
15
20
25
Mbi
ts
Average service throughput per cell
Round Robin MC-CDMAScore Based MC-CDMARound Robin OFDMAScore Based OFDMA NonFreqScore Based OFDMA FreqAdapt
0 05 1 150
01
02
03
04
05
06
07
08
09
1
Mbits
Pro
b( a
v u
ser t
hrou
ghpu
t lt X
)
CDF of average user throughput
Score Based MC-CDMAScore Based OFDMA NonFreqScore Based OFDMA FreqAdapt
40 users
80 users
40 users 80 users0
5
10
15
20
25
Mbi
ts
Average service throughput per cell
Round Robin MC-CDMAScore Based MC-CDMARound Robin OFDMAScore Based OFDMA NonFreqScore Based OFDMA FreqAdapt
0 05 1 150
01
02
03
04
05
06
07
08
09
1
Mbits
Pro
b( a
v u
ser t
hrou
ghpu
t lt X
)
CDF of average user throughput
Score Based MC-CDMAScore Based OFDMA NonFreqScore Based OFDMA FreqAdapt
40 users
80 users
Figure G4 Throughput for MC-CDMA and OFDMA vs nb of userscell
100 200 300 400 500 600 700 800 9000
05
1
15
Mbi
ts
D is tanc e [m ]
80 us ers c ell
100 200 300 400 500 600 700 800 9000
05
1
15
Dis tanc e [m ]
Mbi
ts
40 us ers c ell
S c ore B as ed M C-CDM AS c ore B as ed O FDM A NonFreqS c ore B as ed O FDM A F reqA dapt
Figure G5 Av user throughput vs distance (only scheduled users considered)
In the frequency-adaptive case where the base station can use feedback on chunk level for adaptive chunk allocation OFDMA achieves high gains in user and cell throughput However the gain is to a certain extent limited by the constraint that a fixed amount of chunks (6 in this case) is assigned to each user scheduled for transmission The percentage of un-served users decreases by adaptive transmission to around 12 (Figure G4) and the user throughput increases within the whole cell range (Figure G5) However the observation that overall coverage is unsatisfactory still holds in the frequency adaptive case
The following main conclusions can be drawn from the results
WINNER D210 v10
Page 138 (180)
bull Multi-user diversity gains from fast scheduling can only be obtained when a strong TDMA component on sub-frame level is kept in the multiple access scheme Only a limited number of users should be served simultaneously depending on delay constraints and required throughputs
bull In the considered single antenna system configuration the cell coverage is unsatisfactory The use of advanced antenna techniques (MIMO) and improved coding schemes (eg Turbo Coding) is mandatory to achieve satisfactory wide area coverage
bull OFDMA achieves high performance gains in the frequency adaptive mode when a reliable feedback of the channel quality per chunk eg SINR is available for all users competing for the resource
bull In the non-frequency adaptive case MC-CDMA outperforms OFDMA thanks to the better frequency diversity obtained by spreading the symbols over the whole bandwidth However the differences are rather small and will probably vanish if other sources of diversity are available34
G12 Comparison of non-adaptive subcarrier interleaved OFDMA and MC-CDMA
Simulation Assumptions Simulator multi-link level Scenario Short range cellular single antenna BS and UT Channel modelling IEEE 80211n including path loss and shadowing Interference modelling Whole tier of interfering cells around desired cell each cell generates own
transmit signal and signal is transmitted through independent channel Cell radius 300 m Link adaptation QPSK r=12 FEC Convolutional coding (561753)oct with memory 8
Codeword length 3328 spreading type Walsh-Hadamard spreading length 8
Despreading MMSE based Mobile speed 3 kmh
The simulation results in Figure G6 left plot show a direct comparison between subcarrier interleaved OFDMA and subcarrier interleaved MC-CDMA in a cellular environment in terms of BER In case of OFDMA each user gets exclusively 208 subcarriers out of 1664 allowing a maximum number of 8 users to be served simultaneously With MC-CDMA the data of each user is spread over 8 subcarriers leading to multiple access interference Since the number of active users the maximum number of users the data symbols per user and the frame size are equal the comparison of the medium access variants is regarded as fair The resource load of OFDMA is defined by the ratio of the number of allocated subcarriers relating to the number of available subcarriers In MC-CDMA the resource load is given by the ratio of the number of active users relating to maximum number of users which could be served using all available codes In the case of OFDMA an RRM over three cells can avoid a double allocation of subcarriers up to a resource load of 13 Otherwise the subcarriers are randomly allocated Three scenarios are investigated determined by the distance of the UTs to the base station d0=(150 200 300) In the inner part of the cell (d0=150 m) MC-CDMA outperforms OFDMA for resource loads smaller than 075 due to enhanced frequency diversity but the difference is rather small if translated into throughput The benefit of MC-CDMA reduces with increasing resource load because the multiple access interference increases Since the inter-cellular interference is small in the inner part of the cell the RRM for OFDMA does not enhance the performance dramatically In contrast the RRM improves drastically the performances for OFDMA in the outer parts of the cell (d0 gt200 m) for lower resource loads indicating that RRM is an important means for throughput enhancements at the cell edge especially if the system is not fully loaded (which is mostly the case in a real system) MC-CDMA always outperforms pure ODFMA in all three scenarios for resource loads lower than 06
34 The actual WINNER system concept offers additional sources of diversity in the spatial domain A comparison of
the additional benefit of MC-CDMA against the increased complexity in particular in conjunction with MIMO techniques is for further study
WINNER D210 v10
Page 139 (180)
0 02 04 06 08 110-6
10-4
10-2
100
resource load
BE
R
OFDMA with RRMOFDMA wo RRMMC-CDMA
d0=300m
d0=200m
d0=150m
0 50 100 150 200 250 300
10-6
10-4
10-2
100
distance [m]
BE
R
MC-CDMA RL=10OFDMA wo RRM RL=10OFDMA with RRM RL=10OFDMA wo RRM RL=05OFDMA with RRM RL=05MC-CDMA RL=05OFDMA wo RRM RL=0125MC-CDMA RL=0125OFDMA with RRM RL=0125
Figure G6 BER versus resource load for different UT distances (left plot) and BER versus UT distance for different resource loads (right plot) considering interleaved MC-CDMA and OFDMA
The right plot of Figure G6 shows the BER versus the mobile distance to the desired base station Three different resource loads for an OFDMA and MC-CDMA system are investigated Due to the avoidance of inter-cellular interference by using the RRM for OFDMA the BER with a resource load of 0125 is nearly zero in the whole cell MC-CDMA can utilise the whole frequency diversity and therefore MC-CDMA outperforms pure OFDMA in the scenarios with resource load 0125 and 05 in the whole cell area OFDMA slightly exceeds the MC-CDMA performance in the fully-loaded scenario because the multiple access interference is the major degradation factor of MC-CDMA
To sum up at low resource loads (smaller than 06) MC-CDMA performs always better than pure OFDMA due to the higher frequency diversity but the differences are small and will probably disappear if further sources of diversity are exploited see footnote 34 on page 138 However the enhanced interference suppression opportunities with smart RRM allow a large performance gain for lower bounds The RRM shows a lower bound for the OFDMA system without any channel knowledge at the transmitter side At high loads both techniques show similar performances
G13 Comparison of non-adaptive OFDMA MC-CDMA and TDMA
Simulation Assumptions Simulator Multi-cell link level Scenario Wide area single-antenna BS and UT cell radius 1000 m Channel modelling C2 generic channel model (D54) including path loss + shadowing Interference modelling Whole tier of interfering cells around desired cell MCS 2 4-QAM r=12 16-QAM r=12 FEC Convolutional coding (561753)oct with memory 8
Codeword length 1664 Spreading Type Walsh-Hadamard spreading length 8 Channel allocation for each codeword
TDMA ndash 4-QAM 416 carriers times 2 symbols TDMA ndash 16-QAM 416 carriers times 1 symbol OFDMA ndash 4-QAM 32 adjacent carriers times 26 symbols OFDMA ndash 16-QAM 32 adjacent carriers times 13 symbols MC-CDMA ndash 4-QAM 416 carriers times 16 symbols MC-CDMA ndash 16-QAM 416 carriers times 8 symbols Spreading is performed across 8 adjacent subcarriers
Simulations have been conducted in order to compare the performance of OFDMATDMA MC-CDMATDMA and pure TDMA which can be regarded as a special case of MC-CDMA with spreading factor 1 Figure G7 presents the throughput results for a fully loaded scenario ie where all resources are used for data transmission and 14 loaded scenario Resources are allocated to UTs of different cells randomly that is no interference avoidance scheme is used The results show that all considered multiple access schemes have very similar performances In fully loaded case OFDMA is slightly better than MC-CDMA due to inter-code interference in CDMA In 14 load case MC-CDMA is slightly better than the others confirming the results obtained in G12 It can also be seen that OFDMA is a little better than TDMA in both cases This is due to OFDMA taking more advantage of the time diversity provided by the channel conditions used in the simulation However no spatial diversity has been taken into account yet
WINNER D210 v10
Page 140 (180)
which may further reduce the performance differences between OFDMTDMA OFDMA and MC-CDMA (see also footnote 34 on page 138)
0 5 10 15 20 25 3002
03
04
05
06
07
08
09
1
data rate [Mbits]
prob
(use
r thr
oupu
t lt a
bsci
ssa)
4QAM TDMA16QAM TDMA4QAM OFDMA16QAM OFDMA4QAM MC-CDMA16QAM MC-CDMA
0 2 4 6 8 100
01
02
03
04
05
06
07
08
09
1
data rate [Mbits]
prob
(use
r thr
oupu
t lt a
bsci
ssa)
4QAM TDMA16QAM TDMA4QAM OFDMA16QAM OFDMA4QAM MC-CDMA16QAM MC-CDMA
0 5 10 15 20 25 3002
03
04
05
06
07
08
09
1
data rate [Mbits]
prob
(use
r thr
oupu
t lt a
bsci
ssa)
4QAM TDMA16QAM TDMA4QAM OFDMA16QAM OFDMA4QAM MC-CDMA16QAM MC-CDMA
0 2 4 6 8 100
01
02
03
04
05
06
07
08
09
1
data rate [Mbits]
prob
(use
r thr
oupu
t lt a
bsci
ssa)
4QAM TDMA16QAM TDMA4QAM OFDMA16QAM OFDMA4QAM MC-CDMA16QAM MC-CDMA
Figure G7 Performance comparison of OFDMA MC-CDMA and TDMA in fully loaded case (right plot) and non-fully loaded case (left plot)
Figure G8 presents throughput results obtained for various reuse factors using OFDMTDMA although the general conclusions stand for other MA schemes Four tiers of interfering cells are used for the simulation The results show that only about 77 of the cell has been sufficiently covered therefore stronger MCS are required to cover users at the cell edge These results support the suggestion in [WIND32] to cover different areas of the cell with different reuse factors Approximately 37 of the cell can be covered by reuse 1 A further 28 of the cell can be covered by reuse 3 Reuse 7 can be used in approximately 12 of the cell
0 5 10 15 20 25 300
01
02
03
04
05
06
07
08
09
1
data rate [Mbits]
prob
(use
r thr
oupu
t lt a
bsci
ssa)
4QAM RR116QAM RR14QAM RR316QAM RR34QAM RR716QAM RR7
Figure G8 Throughput for different reuse factors for OFDMTDMA
G14 Impact of chunk sharing on the performance of adaptive OFDMATDMA
Simulation Assumptions Simulator Link level Scenario wide area MT = 1 MR = 1 mobility 50 kmh for all mobiles Channel modelling C2 clustered delay line Interference modelling no inter-cell interference MCS 4 4-QAM 16-QAM 64-QAM 256-QAM
adaptive bit and power loading FEC no
An algorithm to perform adaptive user-to-subcarrier allocation with bit and power loading has been proposed in [WIND26] for the downlink of a multi-carrier CDMA systems with spreading both in time and in frequency The algorithm yields an optimisation of the subcarrier sharing that enables a considerable performance gain with respect to OFDMA systems where each subcarrier is exclusively
WINNER D210 v10
Page 141 (180)
assigned to one user [WIND23] In order to implement subcarrier sharing other sharing techniques like TDMA or FDMA can be used as well Although chunk-wise resource allocation already implicitly provides time sharing in an OFDMA system we show that a considerable performance gain can be achieved through further chunk sharing in case that the number of users competing for resources is quite high (K=32 in this case) and the time constraints for serving all these users is very stringent (one chunk duration=3346micros) Sharing of a chunk by different data flows can be implemented in many different ways in particular
CDMA ndash all nsub nsymb time-frequency bins of a chunk or a subset thereof are simultaneously utilised by a number of data flows To decrease message delays it would be advantageous to perform pure frequency-domain spreading by which in frequency-selective fading CDMA can provide diversity gain even with single-user detection However in an adaptive system no room for diversity is left
TDMA ndash each flow utilises all subcarriers of a chunk during ρkqnsymb OFDM symbol periods
FDMA ndash flow k utilises ρkqnsub subcarriers during the nsymb OFDM symbol periods of a chunk Some kind of frequency hopping per chunk can be advantageous in severe frequency selective channels
Figure G9 illustrates the impact of chunk sharing and chunk size variations on BER performance Here Sf denotes the spreading factor and S the number of users sharing a chunk Under the specific conditions considered chunk sharing with nsub=4 and Sf=S=4 yields a significant performance improvement with respect to exclusive user-to-chunk assignment ie nsub=4 and Sf=S=1
-6 -4 -2 0 2 4 6 8 10 12 1410
-4
10-3
10-2
10-1
100
Relative transmitter power dB
BE
R
nsub=Sf=1S=4FDMA
nsub=Sf=4S=4FDMA
nsub=Sf=1S=1FDMA
nsub=4Sf=S=1FDMA
nsub=2Sf=S=1FDMA
nsub=2=Sf=S=2FDMA
Figure G9 Gain of chunk sharingchunk size considering 32 users competing for 416 subcarriers with a granularity nsub= 1 to 4 and nsymb=12 35
It is reasonable to expect that the achievable gain decreases by relaxing the constraint on the number of users to be served within one chunk duration ie by decreasing the demand on granularity as it had been previously shown in [WIND26] with reference to single subcarrier sharing Moreover from the figure it can be inferred that the gain of chunk sharing increases with the number of subcarriers constituting the chunk at BER=10-3 a gain of 2 dB is achieved for nsub=2 and 6 dB for nsub=4 respectively Furthermore it can be observed that by optimizing the transmission scheme over sub-bands of size nsubgt1 the transmitter power needed to achieve a given BER increases (by 1 dB for nsub=4) Indeed increasing the chunk size reduces the performance of link adaptation due to the effect of channel-to-noise ratio averaging But on the other hand it also reduces the amount of feedback information which was not taken into account here
We note that results for S le 4 have been plotted since preliminary results had shown that increasing S further does not provide any improvement Finally all curves refer to the case of FDMA sharing since it had also been proven that the performance of TDMA and CDMA chunk-sharing is essentially the same
35 It should be noted that the fairly large gains seen here apply only to specific situations with very strict delay
requirements as eg control signalling for scheduling and retransmissions for highly prioritised services
WINNER D210 v10
Page 142 (180)
from which it can be inferred that CDMA is not affected by the loss of orthogonality among codes within one chunk
G15 Comparison of adaptive OFDMA and OFDMASDMA using GoBs
Simulation Assumptions Simulator System level simulator 30 Frames per snapshot 20 snapshots per simulation Scenario wide area MT = 8 MR = 1 cell radius 1000 m all UTs move at 3 kmh
frequency reuse 1 336 carrier per sector frequency reuse 3 112 carrier per sector frequency reuse 7 48 carrier per sector Tx power per carrier is set to 125 mW in all cases
Channel modelling C2 and D1 generic channel model (according to D54) Interference modelling Full modelling using wrap around technique MCS 6 BPSK r=13 BPSK r=23 QPSK r=23 16-QAM r=23
64-QAM r=23 64-QAM r=89 FEC punctured convolutional coding (133171145)oct with memory 6
codeword length variable ndash one codeword always fills one chunk Type of feedback For each user and chunk MCS and corresponding throughput value Feedback delay 0 Beamforming Chebychev tapering with 25 dB side lobe suppression using either eight grids
with one beam each (1 beam case) 4 grids with two beams each (2 beam case) or 2 grids with 4 beams each (4 beam case)
A simple grid of fixed beam (GoB) is considered in order to investigate the potential SDMA gains achievable under wide-area scenario conditions The basic approach used here is to form beams simultaneously from all BS allowing the UT to measure and feedback some kind of CQI as eg SINR per chunk and beam see [WIND27] Based on this feedback resources are allocated to the UTs adaptively (opportunistically) Proportional fair scheduling (PFS) is applied to take fairness constraints into account Considering synchronised cells and leaving the beam pattern and corresponding power allocation constant at all base stations during measurement phase and payload phase leads to predictable inter-cell interference conditions and hence supports short term adaptivity36
System simulation results for channel model D1 comparing average sector throughput for single antenna base stations (SISO) and multi-antenna base stations forming one two or four beams on each chunk are shown on the left side of Figure G10 Note that the SISO and the one beam case are associated with chunk based OFDMATDMA and the two and four beam case with chunk based OFDMATDMASDMA respectively Two main conclusions can be drawn out of these plots Firstly a fixed frequency reuse of one is always beneficial with respect to the cell throughput even if fairness (deducible from the right two plots in Figure G10) is taken into account This holds also for the SISO case which may be explained by different (in the simulation uncorrelated) shadow and fast fading characteristics for any BSharrUT link leaving sufficient variability to be exploited by adaptive scheduling Secondly increasing the number of beams leads to an increasing sector throughput indicating that SDMA is a viable option
36 Predictable SINR conditions are even more challenging for adaptive spatial processing The measurement phase
and the corresponding feedback signalling can be implemented as additional time-multiplexed parts of the super-frame not shown in Figure 32 The detailed layout of these phases within the super-frame is for further study
WINNER D210 v10
Page 143 (180)
0 5 10 15 20 25 30 350
20
40
60
80
100
120
max SISO rate
number of users
aver
age
sect
or th
roug
hput
[Mbi
ts]
channel model D1 reuse 1
SISO PFS1 beam PFS2 beams PFS4 beams PFS4 beams max thrpt
0 5 10 15 20
0
02
04
06
08
1
data rate [Mbits]
prob
(use
r thr
ough
put lt
abs
ciss
a)
16 user channel model D1 reuse 1
SISO PFS1 beam PFS2 beams PFS4 beams PFS4 beams max thrpt
0 5 10 15 20 25 30 3510
20
30
40
50
60
70
max SISO rate
number of users
aver
age
sect
or th
roug
hput
[Mbi
ts]
channel model D1 reuse 3
SISO PFS1 beam PFS2 beams PFS4 beams PFS4 beams max thrpt
0 5 10 15 20
0
02
04
06
08
1
data rate [Mbits]
prob
(use
r thr
ough
put lt
abs
ciss
a)
16 user channel model D1 reuse 3
SISO PFS1 beam PFS2 beams PFS4 beams PFS4 beams max thrpt
Figure G10 average sector throughput and CDF of user throughput for channel model D1 with varying number of beams in different reuse scenarios zero feedback delay
Further exemplary simulations have been performed in order to assess the impact of various system parameters as feedback delay amount of feedback and number of antennas at the UT starting from the parameter setting [4beams channel model D1 reuse 1 prop fair scheduling 16 users] Figures are omitted for the sake of brevity but basically it turns out that in case of channel model D1 the system is quite robust with respect to feedback delays For example a delay of 64 OFDM symbols between measurement and payload phase in a scenario where all UTs move at 70 kmh (corresponding to a Doppler normalised delay fDtdelay=06) led to an average sector throughput loss of around 16 The relatively small loss is mainly due to high LOS probability associated with this channel model In case of channel model C2 (NLOS only) however the average sector throughput loss is substantially higher and amounts to 67 under the same conditions
Regarding the amount of feedback a considerable performance loss can be observed when CQI information is fed back for less than around 35 percent of all chunks But this threshold depends to a certain degree on the number of different grids and how they are mapped to the chunks In this simulation only two different grids each with four beams were considered causing a certain periodicity in frequency direction
Increasing the number of antennas at the UT provides significant system performance gains of around 25 (2 antennas) and 50 (4 antennas) using maximal ratio combining (MRC) Even larger gains are expected if the combiner accounts for the interference characteristics (IRC) as described in G24 Of course further investigations a required to study the interaction of the parameters presented
Realizing SDMA by GoBs requires a relatively low angle of departure spread to keep intra-cell interference ie intra-beam interference small The more beams are formed the more stringent this requirement is Channel model C2 has a much larger angle of departure spread than D1 and therefore the performance gain achieved by SDMA are considerable smaller In fact forming four beams yields approximately the same performance as with two beams
To sum up using grids of beams in combination with opportunistic scheduling is a simple but yet efficient and robust solution to realise SDMA gains with low complexity even in reuse case 1 provided
WINNER D210 v10
Page 144 (180)
that the angle of departure spread is sufficiently small as for scenario D1 In scenario C2 the SDMA gain with GoBs is limited to a factor of around 15 compared to pure beamforming
G2 Downlink spatial processing
G21 Comparison of fixed and tracking based beamforming
Simulation Assumptions Simulator System simulator 200 snapshots snapshot duration 250 chunks Scenario Wide area cellular MT = 8 MR = 1 frequency reuse 1 all 512 carriers used
cell radius 1 km Channel modelling C2 WIMI generic channel model Interference modelling Full interference modelling Multiple access adaptive OFDMATDMA MCS No MCS a successful transmission occurs when the predicted transmission
rate is lower than the actual capacity of the equivalent channel FEC No FEC Type of feedback 8 bits feedback per user per chunk SNR in case of OBF complex gain in
case of adaptive beamforming with channel tracking Feedback delay 2 chunk duration Overhead 19 out of 96 resource elements for each chunk Mobile speed Pedestrian (M1) 50 of users Vehicular (M2) 50 of users Beamforming OBF 1 varying beam spanning a grid of 40 fixed beams
In an environment where the NLOS (or fading) component of the channel is dominant with respect to the LOS component (typically C2 environment in WIMI) the performances of fixed beamforming and long-term CSI based beamforming techniques degrade due to the large angle of departure spread of the channel In this case short-term CSI based adaptive beamforming techniques are better suited to exploit the multi-antenna gain The main limitation when using these techniques in a wide-area scenario is the high signalling overhead needed for the feedback of the CSI from the mobile end to the BS In order to reduce the signalling overhead and still preserve the multi-antenna gain an adaptive beamforming technique based on channel tracking (TrackBF) is considered
With this approach the beamforming vectors are determined according to the maximum ratio combining solution ie )(ˆ)(ˆ)(
H nnn kk hhw = using the estimated (tracked) channel )(ˆ n
kh of the scheduled user
k It is assumed that the complex gain αk(n)=hk(n)w(n) is fed back and used to track the channel at the BS via Kalman filtering [GA93] In addition to the channel the Kalman filter gives an estimate of the covariance matrix ))(ˆ)(())(ˆ)(E()( H nnnnn kkkkk hhhhC minusminus= which is a measure of the quality of the channel estimation and is used to predict the transmission rate for user k The scheduling decision is then made using the Proportional Fair Scheduler (PFS)
The proposed technique has the same reduced complexity and feedback requirements as the existing Opportunistic Beamforming (OBF) [VTL02] approach which is implemented here using a varying beam w(n) that spans a grid of 40 fixed beams and where the resulting gain αk(n)=|hk(n)w(n)| or the associated SNR is fed back This technique is used as a benchmark for comparison
Results show both the TrackBF and OBF enhance the performance over the SISO case by exploiting the multiple transmit antennas advantage (Figure G11) In terms of mean cell throughput the TrackBF and OBF improve the performance by 47 and 16 respectively over the SISO case Moreover the TrackBF outperforms the OBF in terms of throughput and fairness the latter is reflected by the lower probability of high inter-packet delays (Figure G12) As expected the TrackBF performs much better for pedestrian users than for vehicular users (Figure G11) The performance degradation in the case of vehicular users is related to the poor channel tracking quality due to high mobility
WINNER D210 v10
Page 145 (180)
0 50 100 150 2000
02
04
06
08
1
Cell Throughput Mbits
Pro
b(C
ell T
hrou
ghpu
t lt a
bsci
ssa)
Cell Throughput Tc = 1000 K = 60 per cell
TrackingPFS mean = 110Mbits
Opportunistic BFPFS mean = 87Mb
SISOPFS mean = 75Mbits
0 2 4 6 8 100
02
04
06
08
1
User Throughput Mbits
Pro
b(U
ser T
hrou
ghpu
t lt a
bsci
ssa)
User Throughput K = 60 per cell
TrackingPFS Pedestrian(M1)Opportunistic BFPFS Pedestrian(M1)TrackingPFS Vehicular(M2)Opportunistic BFPFS Vehicular(M2)
Figure G11 CDF of cell throughput (left plot) and user throughput (right plot) for SISO adaptive beamforming with tracking and OBF with fixed grid of beams 20 users per sector
100 101 10210-4
10-3
10-2
10-1
Inter-packet delay in chunk duration
Pro
b(de
lay
gt ab
scis
sa)
Inter-packet delay distribution K = 60 per cell
TrackingPFSOpportunistic BFPFS
Figure G12 inter-packet delay distribution 20 users per sector
G22 Comparison of various adaptive beamforming techniques
Simulation Assumptions Simulator Multi-link one sector 1000 frames simulation time with 100 drops Scenario wide area cellular MT = 8 MR = 1 ULA Channel modelling SCME no path loss no shadowing Interference modelling Only Intra-cell interference by full simulation of all links Mulitple access adaptive OFDMATDMA(SDMA) OFDM parameters 20 MHz bandwidth 512 subcarriers (406 used) MCS 1 16-QAM r=12 FEC Conv coding (561753)oct with memory 8 Codeword length 2 chunks Feedback delay 1 frame CQI feedback either beam selection info or covariance matrix Overhead None Mobile speed 50 kmh same for all mobiles
In these investigations several beamforming techniques plus SDMA are studied in a wide-area scenario on multi-link level Scheduling is done chunk based in a score-based proportional fair way one chunk occupies 8 subcarriers times 12 OFDM symbols Coding and scheduling is always performed for groups of two consecutive chunks
The first beamforming technique is a grid of fixed beams (GOB) with 8 beams Non-neighboured beams share the same time-frequency resources A feedback of the strongest beam and a corresponding CQI value are assumed Inside each beam the CQI value is used for the scheduling score calculation
WINNER D210 v10
Page 146 (180)
-20 -10 0 10 20 300
20
40
60
80
100
120
SNR [dB]
aver
age
sect
or th
roug
hput
[Mbi
ts] 32 users
-20 -10 0 10 20 300
20
40
60
80
100
120
SNR [dB]
16 users
-20 -10 0 10 20 300
20
40
60
80
100
120
SNR [dB]
aver
age
sect
or th
roug
hput
[Mbi
ts] 8 users
-20 -10 0 10 20 300
20
40
60
80
100
120
4 users
SNR [dB]
MU ABSU ABGOBAB 1str4 str maxSISO
Figure G13 Score based suburban macro
-20 -10 0 10 20 300
20
40
60
80
100
120
SNR [dB]
aver
age
sect
or th
roug
hput
[Mbi
ts] 32 users
-20 -10 0 10 20 300
20
40
60
80
100
120
SNR [dB]
16 users
-20 -10 0 10 20 300
20
40
60
80
100
120
SNR [dB]
aver
age
sect
or th
roug
hput
[Mbi
ts] 8 users
-20 -10 0 10 20 300
20
40
60
80
100
120
4 users
SNR [dB]
4 str maxMU ABSU ABGOBSISOAB 1 str
Figure G14 Score based urban macro
The second technique is adaptive beams with single-user optimised antenna weights (AB SU) based on Eigenbeamforming (see [HBD00]) For SDMA the selection of users is done successively The user with the highest score is selected first All spatially separable users are candidates for scheduling From these candidates the user with the highest score is selected This process is repeated until there are no more spatially separable users or the maximum number of desired spatial streams is reached The transmitter relies on feedback of CQI information (to calculate the score) and the spatial covariance matrix to calculate the antenna weights and to decide on spatial separation
WINNER D210 v10
Page 147 (180)
The third technique is adaptive beams with multi-user optimised antenna weights (AB MU) The user selection is done as above additionally the antenna weights are altered to achieve mutual interference suppression by multiplying the Eigenbeam weights by an inverted interference covariance matrix
As a reference case also results for SISO and adaptive beams without SDMA (AB 1str) are shown The figures above show the average total sector throughput over the SNR for the different investigated techniques lsquo4 str maxrsquo refers to the maximum which can be achieved by a 4-stream SDMA with the given MCS GOB is hard limited by these four streams adaptive beams have a soft limit
It can be concluded that multi-user optimised adaptive beams always outperform the other two SDMA schemes The relative sector throughput gain versus GOB increases with decreasing number of users This is caused by more degrees of freedom in user selection and better mutual interference suppression But it relies on the knowledge of the long-term covariance matrix (meaning a higher feedback rate is necessary if no UL CSI can be used) Single user optimised adaptive beams are characterised by a reduced computational complexity compared to AB MU They always outperform GOB with few users On the other hand with high load (more streams) and a larger demand of spatial separation (eg Round Robin instead of score based or a scenario with more angular spread) they can even be outperformed by GOB So in total they are questionable to be used in conjunction with SDMA GOB inherently carry benefits by their simple feedback and scheduling and their orthogonal design being a simple form of multi-user optimisation
SDMA in general shows increasing gains with increasing number of active users (due to increased chances of spatial separability) and decreasing angular spread SDMA has a large potential for increasing cell throughput and is a promising candidate for a wide-area scenario
G23 Comparison of maximal ratio and interference rejection combining at UT
Simulation Assumptions Simulator Multi-link Scenario wide area downlink MT = 1 MR = 2 Channel modelling WINNER channel model C2 NLOS no path loss no shadowing Interference modelling One Inter-cell interference with DIR of 6 dB Multiple access Non-adaptive OFDMTDMA MC-CDMATDMA OFDM parameters 20 MHz bandwidth 512 subcarriers (406 used) MCS QPSK r=12 16QAM r=13 FEC 3GPP 12 and 13 Turbo coding Mobile speed 50 kmh for all terminals
When frequency reuse one is assumed in downlink at wide area mode inter-cell interference or co-channel interference will degrade system performance However multiple antennas at receiver can be used to mitigate the interference
Here 1x2 OFDM and 1x2 multi-carrier CDMA systems are considered in downlink for wide area For multi-carrier CDMA spreading factor and the number of Walsh-Hadarmard codes are both equal to 8 One inter-cell interference with dominant interference ratio (DIR) of 6 dB is generated QPSK with 3GPP 12 Turbo coding and 16QAM with 13 Turbo coding are used At receiver two combining methods are considered One is maximum ratio combining (MRC) and another is interference rejection combining (IRC) which is also referred to here as miminum mean square error combining (MMSEC)
Simulation results are shown in Figure G15 No matter which MCS and receiver algorithm is used the performance for 1x2 OFDM and multi-carrier CDMA are very similar However receiver complexity of multi-carrier CDMA is larger than that of OFDM system On the other hand MMSE combining provides significant gains over MRC combining under interference scenario Therefore receive antenna processing eg MMSE combining is a very efficient means to suppress inter-cell interference
WINNER D210 v10
Page 148 (180)
-7 -6 -5 -4 -3 -2 -1 0 1 210
-4
10-3
10-2
10-1
100
SINR (dB)
Err
or R
ate
BER OFDM-MRCBER OFDM-MMSECBER CDMA-MRCBER CDMA-MMSECFER OFDM-MRCFER OFDM-MMSECFER CDMA-MRCFER CDMA-MMSEC
-8 -6 -4 -2 0 210
-3
10-2
10-1
100
SINR (dB)
Err
or R
ate
BER OFDM-MRCBER OFDM-MMSECBER CDMA-MRCBER CDMA-MMSECFER OFDM-MRCFER OFDM-MMSECFER CDMA-MRCFER CDMA-MMSEC
Figure G15 Performance of 1 times 2 MRC and MMSEC considering OFDMTDMA and MC-CDMATDMA with QPSK modulation and 12 turbo coding (left plot) and 16QAM modulation
and 13 turbo coding (right plot)
G24 Comparison of beamforming diversity and multiplexing
Simulation Assumptions Simulator System 19 three-sector sites full interference modelling using wrap-around Scenario Wide area cellular on average 10 userssector frequency reuse 1
MT le 8 MR le 2 varying cell radius Channel model C2 NLOS WINNER interim channel model (WIMI) MCS Modulation schemes QPSK 16QAM and 64QAM
Channel code rates 110 13 12 23 34 and 89
FEC
Turbo code combined with Layer 1 code block segmentation (up to 5114 bits per block) and rate matching codeword length from 998 (QPSK rate 110) to 26624 bits (64QAM rate 89) rate 17 mother code (polynomials feedback 013 feedforward 015 017 011)
FeedbackOverhead Chunk SINR after receiver processing zero delay no overhead
A non-frequency adaptive downlink based on OFDMTDMA is evaluated in a multi-cell wide-area scenario in order to assess the value of different components of the WINNER multiple-antenna concept Performance is compared for different cell sizes and in terms of average sector throughput and active radio link data rates The latter measure is the (average) user throughput when scheduled for transmission Since round robin TDMA scheduling is applied the active radio link rate may be used to assess the fairness in the network Furthermore because many idealised assumptions are made one should not focus on the absolute performance figures but rather on the relative performance
The upper left plot in Figure G16 depicts the average sector throughput in a network using a single downlink transmit antenna Compared to single antenna reception terminal receive diversity may improve performance significantly MRC provides an average throughput gain of 35 in an interference limited scenario Interference rejection combining (IRC) referred to as optimum combining in [Win84] which suppresses inter-cell interference by taking the spatial colour into account on a per carrier basis adds another 10ndash15 The lower left plot shows the distributions of the active radio link rates for a cell radius of 700 m and as can be seen performance is improved for all users
Transmit diversity may be realised by using linear dispersion codes In here Alamoutirsquos orthogonal design is considered with two transmit antennas separated 20 wavelengths The terminals use one or two receive antennas and as a reference single antenna transmission is also considered In the upper right plot of Figure G16 the sector throughput is shown and in the lower right plot the distributions of the data rates are shown for a cell radius of 700 m With receive diversity terminals suppress inter-cell interference taking the structure of the interference into account The results indicate that compared to single-antenna transmission the gain of transmit diversity with Alamoutirsquos design is slightly below 10 with receive diversity and slightly above 10 without receive diversity It can also be seen that transmit diversity does not improve data rates for the lower percentiles but rather for the high percentiles We note that there is inherently a substantial amount of frequency diversity available in the channel which may explain the
WINNER D210 v10
Page 149 (180)
marginal improvement and the present evaluation does not illustrate potential benefits of reduced channel quality variations for non-ideal link adaptation
100 m 1 km 10 km0
10
20
30
40
50
60
cell radius
aver
age
sect
or th
roug
hput
[Mbi
ts]
MRX = 2 IRCMRX = 2 MRCMRX = 1
0 20 40 60 800
010203040506070809
1
prob
(use
r thr
ough
put lt
abs
ciss
a)
active radio link rate [Mbits]
100 m 1 km 10 km0
10
20
30
40
50
60
cell radius
aver
age
sect
or th
roug
hput
[Mbi
ts]
MTX = 2 MRX = 2MTX = 2 MRX = 1MTX = 1 MRX = 2MTX = 1 MRX = 1
0 20 40 60 800
010203040506070809
1
prob
(use
r thr
ough
put lt
abs
ciss
a)
active radio link rate [Mbits]
Figure G16 Average sector throughput and data rate distributions for spatial diversity techniques The data rate distributions are depicted for a cell radius of 700 m
Beamforming solutions provide a directivity gain and change the interference situation in the network Beamforming can be accomplished eg by creating a fixed grid of beams (GOB) and using the beam with the lowest pathloss at transmission An alternative is to form user-specific beams based on the transmit covariance matrix of the channel In here the eigenvector associated with the largest eigenvalue of the transmit covariance matrix is used and this is referred to as eigenbeamforming (EBF) The left plot in Figure G17 depicts the sector throughput with downlink beamforming based on a GOB and EBF respectively using two four and eight base station antennas With GOB the antennas are used to form four eight and 16 fixed beams respectively Terminals have two receive antennas for IRC The results indicate that in the studied scenario EBF provides only a marginal performance improvement compared to a solution using a GOB Thus heavily quantised knowledge of the transmit covariance matrix here in terms of a preferred beam may be enough to capture most of the available gain Increasing the number of antennas gives throughput improvements in the order of around 30 when going from two to four antennas and another 20-25 when increasing the number of base station antennas to eight The enhancement is generally higher at large cell sizes To the right in Figure G17 results with EBF and one and two terminal receive antennas for IRC are shown The gain of terminal receive diversity in terms of sector throughput is here in the range 35ndash50 The gain typically decreases when the number of base station antennas increases illustrating that benefits not necessarily are additive
To the left in Figure G18 performance with beamforming (EBF) at the base station combined with terminal receive diversity is shown The upper left plot shows the average sector throughput and the lower left plot is the corresponding data rate distributions in a deployment with 700 m cell radius As can be seen the combination of beamforming and terminal receive diversity really improves the fairness and the lower percentiles of the data rates A fraction of the users may even become modulation limited With eight base station antennas used for beamforming throughput has increased more than threefold compared to single antenna transmission and reception and more than twofold compared to single antenna transmission combined with dual terminal receive diversity
WINNER D210 v10
Page 150 (180)
100 m 1 km 10 km0
20
40
60
80
100
120
cell radius
aver
age
sect
or th
roug
hput
[Mbi
ts]
EBFGOB
100 m 1 km 10 km0
20
40
60
80
100
120
cell radius
aver
age
sect
or th
roug
hput
[Mbi
ts]
MRX = 2MRX = 1
Figure G17 Average sector throughput with beamforming comparing eigenbeamforming with grid of beams (left) and comparison of terminal receive diversity with single antenna reception
(right)
100 m 1 km 10 km0
20
40
60
80
100
120
cell radius
aver
age
sect
or th
roug
hput
[Mbi
ts]
MTX = 8 MRX = 2MTX = 4 MRX = 2MTX = 2 MRX = 2MTX = 1 MRX = 1
0 50 100 1500
010203040506070809
1
prob
(use
r thr
ough
put lt
abs
ciss
a)
active radio link rate [Mbits]
100 m 1 km 10 km0
20
40
60
80
100
120
cell radius
aver
age
sect
or th
roug
hput
[Mbi
ts]
MTX = 2x4 MRX = 2 PSRCMTX = 2x2 MRX = 2 PSRCMTX = 2x1 MRX = 2 PARCMTX = 1 MRX = 1
0 50 100 1500
010203040506070809
1
prob
(use
r thr
ough
put lt
abs
ciss
a)
active radio link rate [Mbits]
Figure G18 Performance comparison of conventional beamforming with single stream transmission (left) and dual stream transmission (right) The data rate distributions are for cell
radius 700 m
To achieve very high peak data rates though one may have to consider the use of spatial multiplexing For this purpose per antenna rate control (PARC) is considered With two streams one channel coded block is transmitted from each (virtual) antenna and IRC in combination with successive interference cancellation after channel decoding is employed at the receiver side The performance of such dual stream transmission is depicted to the right in Figure G18 together with the corresponding single antenna results In this case both PARC with two antennas separated 20 wavelengths as well as the combination with EBF referred to as per stream rate control (PSRC) for four and eight antennas are considered For PSRC antennas are divided into two groups (uniform linear sub-arrays) separated 20 wavelengths within each group the element separation is half a wavelength and the two eigenvectors associated with the two largest eigenvalues of the transmit covariance matrix are used to transmit the two streams with the same
WINNER D210 v10
Page 151 (180)
power As can be seen from the lower plots in Figure G18 which show the data rate distributions for cell radius 700 m dual stream transmission does indeed increase peak data rates and for PSRC with eight transmit antennas the fraction of the users benefiting from this is non-negligible However on average dual stream transmission provide a throughput that is slightly below or similar to that of conventional single-stream beamforming with same number of antenna elements An interpretation of the rate distributions is that the increase of peak data rates comes at the expense of a reduced fairness
In summary the results indicate that transmit beamforming and terminal receive diversity are essential components to ensure good coverage of high data rates and high system throughput For beamforming with no SDMA component eigenbeamforming gives a small performance advantage compared to a grid of beams In interference limited scenarios terminal receive diversity with interference suppression gives a non-negligible performance improvement compared to maximum ratio combining The results further indicate that in the studied scenario transmit diversity using Alamoutirsquos orthogonal design gives only a marginal performance improvement compared to single antenna transmission One possible explanation of the limited gain is that the wideband channel inherently provides a large amount of frequency diversity Finally spatial multiplexing can be used to increase the peak data rates and may be successfully combined with beamforming Compared to a deployment using conventional beamforming this increase of peak data rates comes at the cost of reduced fairness although the average throughput is similar
G25 Performance of SMMSE precoding
Simulation Assumptions Simulator System level simulator 1000 snapshots 1 frame per snapshot Scenario Short range MT = 8 16 24 MR = 1 2 4 Round Robin scheduling Channel modelling A1 B1 WIMI generic channel model Multiple access Non-adaptive OFDMATDMASDMA Number of active users
variable parameter depends on the number of pilots available and the number of antennas at the user terminals
Channel estimation error modelling
Channel estimation error is modelled as a zero mean complex Gaussian variable and the variance is inversely proportional to the average receive SNR The assumed estimator gain is about GN=13 dB37
Cell radius 30 m in A1 scenario and 550 m in B1 scenario virtual overhead for parameter estimation
14 or 20 out of 80 resource elements of each chunk
SDMASMUX One spatial stream per user Maximum number of users multiplexed is fixed
SMMSE precoding is a promising spatial processing candidate for the WINNER system concept [VH04] [VH05a] [VH05b] [WIND27] In order to assess its performance for varying antenna configurations under realistic impairments system simulations have been set up for the short range isolated cell scenario
Modelling of impairments with respect to transmitterreceiver inequalities are performed according to
( ) ( ) ( )( ) ( )( ) 1~~ minus= k
BSTULkk
MSDLk KHKH
where ( )ULkH~ and ( )DLkH~ denote the uplink and downlink channel matrix respectively The terms KMS
(k) and KBS(k) represent the perturbations introduced by the transmitter and the receiver front-ends
These matrices are diagonal if we assume that the front-ends have only non-linear imperfections which implies that these matrices can be inverted and that their products are commutative The amplitude of KMS
(k) and (KBS(k))-1 is modelled as a truncated random Gaussian variable with mean 10 and variance
0007 and 00008 respectively The phase is uniformly distributed in the interval [-87o 87o] and [-30o 30o] see [BCK03]
The average number of users in the system and the overhead per chunk depends on the number of pilots multiplexed for the channel estimation from the different antennas In the proposal for the channel estimation it is assumed that we can estimate the channel from 3 antennas in the short-term adaptive mode or 6 in the long-term adaptive mode per one chunk In our simulations we rely on the assumption that the channel or the second order statistics of the channel are constant over one frame Since there are 3 time slots in the frame we multiplex in every time slot pilots from different antennas regardless of whether these antennas are located at the same terminal or not We assume that one user transmits using only one 37 Practically the estimator gain may vary depending on the number of users antennas and on the preamble design
and if correlation in frequency domain is corrected or not see [WIND21]
WINNER D210 v10
Page 152 (180)
fourth of the available bandwidth Thus the maximum number of different antennas that can be estimated in the short-term adaptive mode is 36 and the average number of users considered in the system simulations was 127 In the long-term adaptive mode the maximum number of antennas that can be estimated amounts to 72 and the average number of users considered was 27
Let us define the average correlation matrix of the ith user in the kth chunk as
( ) ( ) ( )sum=j
jki
Hjki
chunk
ki N
1 HHR
and its singular-value decomposition (SVD) as ( ) ( ) ( ) ( )Hki
ki
ki
ki VQVR = where ( )jk
iH is the ith user
channel matrix in the kth chunk The MU MIMO precoding is now performed on the equivalent channel defined as follows
( ) ( ) ( ) Hki
ki
ki VQH 21=
(
By using the equivalent channel ( )kiH
( we facilitate easier adaptation from perfect CSI to the second-
order CSI
The following notation is used to describe the simulated system MTKmaxNpilots where MT is the number of antennas at the BS Kmax is the maximum number of spatial streams per chunk and Npilots is the number of different antennas that can be estimated per chunk
0 500 1000 1500 20000
02
04
06
08
1
data rate [Mbits]
Pro
b(C
ell T
hrou
ghpu
t lt a
bsci
ssa)
cell throughput
833164316762466
0 20 40 60 80
0
02
04
06
08
1
data rate [Mbits]
Pro
b(U
ser T
hrou
ghpu
t lt a
bsci
ssa)
user throughput
83316431676data4
Figure G19 Cell and user throughput performance of SMMSE in A1 scenario
200 400 600 800 1000 1200 14000
02
04
06
08
1
data rate [Mbits]
Pro
b(C
ell T
hrou
ghpu
t lt a
bsci
ssa)
cell throughput
8431676
0 20 40 60 80
0
02
04
06
08
1
data rate [Mbits]
Pro
b(U
ser T
hrou
ghpu
t lt a
bsci
ssa)
user throughput
8431676
Figure G20 Cell and user throughput performance of SMMSE in B1 scenario
Simulation results for the A1 and B1 scenario are plotted in Figure G19 and Figure G20 In the A1 scenario the initial assumption of having 8 antennas at the BS has been shown not to be sufficient to provide 1 Gbps as a target cell throughput By increasing the pilot overhead we are able to estimate more usersrsquo channel matrices Significant cell throughput improvements can only be achieved by increasing the number of antennas at the BS as well as the number of users that are spatially multiplexed The 90 user
WINNER D210 v10
Page 153 (180)
throughput is almost constant as mobile terminals move away from the BS The 50 user throughput loss due to the increase of the distance from the BS is less than 10 Mbps
Similar as in the A1 scenario in the B1 scenario the target throughput of 600 Mbps is achieved by increasing the number of antennas at the BS and the number of users that are spatially multiplexed The values necessary to reach the target cell throughput are smaller than in A1 scenario
Hence Multi-user MIMO precoding is a powerful tool to provide the required celluser throughput It exploits the available CSI at the BS allowing very good use of the available resources in the spatial domain Benefits are limited by the overhead needed to acquire the necessary information (CSI) It was shown that this trade-off is justified and it results in high throughput gains
In order to achieve 1 Gbps in an indoor scenario we should multiplex as many users as possible with large number of antennas at the BS The maximum allowable number of users depends on the number of pilots that are multiplexed per one chunk The reduction of throughput caused by the increased pilot overhead is compensated for by SDMASMUX or higher order constellation sizes
G3 Downlink multi-user detection
G31 Comparison of receiver structures for SISO MC-CDMA Simulation Assumptions
Simulator Single-link Scenario Short range isolated cell single antenna BS and UT Channel modelling B1 clustered delay line and Independent Rayleigh Interference modelling no spreading type Walsh-Hadamard spreading length 8 MCS 1 4-QAM FEC Convolutional coding (561753)oct with memory 8
Codeword length 3328 bit
The physical layer simulation layout follows the generic WINNER transmitter structure ie the user information bits are encoded using a terminated (561753)oct rate frac12 convolutional code (3GPP) The codebits are randomly interleaved and assigned to complex valued 4-QAM data symbols using Gray mapping These user data symbols are then spread using a 8x8 Walsh-Hadamard spreading matrix which yields the data chips The chips are assigned to the used subcarriers of an OFDM symbol The codeword length ie the frame length of one transmission entity is chosen such that one terminated convolutional codeword finally forms one OFDM symbol This means contemporarily that one OFDM symbol contains exactly one userrsquos data and the user multiplexing is done in time direction ie different OFDM symbols are assigned to different users
Path loss and shadowing effects are not considered within these investigations In addition we assume that the channel is almost constant during one OFDM symbolrsquos period ie inter-carrier interference is negligible
Figure G21 show the bit error rates (BER) and the block error rate (BLER) versus the signal-to-noise ratio (SNR) respectively The SNR is defined as the ratio of the average user signal power and the variance of the complex valued additive white Gaussian noise (AWGN) in each subcarrier Solid lines show the error performances for the WINNER B1 NLOS scenario where the chips of one Walsh-Hadamard spreading entity are distributed over the whole available bandwidth This is achieved by using a subcarrier block interleaver of size 8x208 Due to multiple access interference (MAI) there is a loss of about 23 dB at a BER of 10-4 for single user detection (SUD) using MMSE equalisation compared to the interference free (perfect IC) case where we assume and subtract MAI perfectly To combat MAI at the receiver we use a soft parallel interference canceller (SPIC) as described in the WINNER deliverable D26 [WIND26] The BLER performance of the SPIC with 5 iterations almost reaches the perfect IC bound as it can be seen from Figure G21 right plot For comparison we show results for an independent Rayleigh fading channel which provides maximum (frequency) diversity and the B1 NLOS without subcarrier interleaving Due to an increased MAI the gap between the perfect IC and the SUD performance is even higher compared to B1 NLOS If however we skip the subcarrier interleaver for the B1 NLOS scenario we observe almost no MAI since chips are spread over adjacent subcarriers which due to strong correlation maintain orthogonality of the spreading sequences quite well This results in a negligible difference of SUD and perfect IC error performances In this case we cannot benefit from the more complex SPIC receiver
WINNER D210 v10
Page 154 (180)
0 2 4 6 810-6
10-4
10-2
100
SNR [dB]
BE
R
0 2 4 6 810-3
10-2
10-1
100
SNR [dB]
FER
BLE
R
Figure G21 BER and BLER vs SNR for B1 NLOS and independent Rayleigh fading
G32 Comparison of receiver structures for MIMO MC-CDMA
Simulation Assumptions Simulator link-level Scenario short range MT = 4 MR = 4 Channel modelling B3NLOS WIMI Multiple access MC-CDMATDMA MCS 1 QPSK r=12 FEC punctured turbo coding (1513)oct with memory 4
codeword length fixed size of 6656
A downlink MIMO MC-CDMA system is considered where K users are active in each cell The desired user is located in the central cell The spreading factor (in frequency domain) is G (reducing to OFDM iff G=1) The input data bits are encoded by the single antenna turbo code (TC) or by space-frequency turbo-coded modulation (SFTuCM) which is designed for two transmit antennas We divide the available transmit antennas into independent layers denoted as J=MTJ0 where J0 is the number of antennas associated with the encoder For the single antenna turbo code J0=1 whereas J0=2 in the SFTuCM case A vertical layering structure is applied where the encoded and modulation mapped symbols are multiplexed for J transmit antenna groups By doing so the spatial diversity gain the space-time coding gain (in case of SFTuCM) and spatial multiplexing gain can be achieved simultaneously The MMSE based detectors for the multiple antenna MC-CDMA approach considered herein are relying on the techniques presented in [WIND23 WIND26] In order to achieve better spatial receiver diversity compared to linear receiver the principle of iterative detection and decoding (IDD) can be employed with the considered symbol level SF-MMSE receiver The soft interference cancellation with IDD is considered herein
Figure G22 Performance of layered MIMO MC-CDMA systems
WINNER D210 v10
Page 155 (180)
The simulation performance of the MC-CDMA based downlink with G=K=8 and MR = MT =4 is shown in Figure G22 The scenarios B3 with NLOS clustered delay line model was considered The system with SFTuCM and group-wise layering outperforms the system with turbo-coded system The soft co-antenna interference (CAI) cancellation is shown to possess the ability to further improve the performance Our results indicate that the considered OFDM and MC-CDMA systems are feasible candidates for future cellular high data rate downlink packet transmission For the SFTuCM coded systems the complexity is at the same level as the turbo-coded systems
G4 Uplink multiple access
G41 Performance of single carrier based adaptive TDMA Simulation Assumptions
Simulator Multi-link Scenario Wide area single-cell SISO perfect synch and long-term power control Channel modelling ITU-IV Channel A MCS Uncoded BPSK 4QAM 8PSK 16QAM 32CrossQAM 64QAM
128CrossQAM and 256QAM Uplink spectrum 44 GHz carrier frequency and 25 MHz bandwidth Single-carrier parameters Symbol time 4923 ns Square-root-raised-cosine roll-off factor 0231 Data block size 416 symbols and guard period 256 micros covers most multi-path delay spread Frame size 16 Data blocks (time slots) individually allocated to TDMA users
Performance results for an adaptive TDMA block-based single-carrier uplink are provided This uplink performs multi-user adaptive scheduling to the small scale fading for the individual users and also link adaptation of the scheduled users Thus it is time-adaptive towards the small-scale fading but not frequency-adaptive since it uses single-carrier transmission The aim of the investigation is to show the potential multi-user diversity gains that can be obtained The results are extended simulation results to the work in [WOSS05] where an analytical performance analysis and more details of the design and assumptions behind the investigated uplink can be found The cyclic prefix of each Data block (time slot) is designed to cover most of the multi-path delay spread Thus no inter-Data block ISI is assumed and the FD-DFE [FA02] performs equalisation of the ISI among symbols within each Data block only
0 5 10 15 200
05
1
15
2
25
3
35
4
45
Number of users
Spe
ctra
l Effi
cien
cy [b
itss
Hz]
Analysis 10 dBAnalysis 16 dBAnalysis 19 dBSimulation 10 dBSimulation 16 dBSimulation 19 dB
Figure G23 Multi-user diversity gains for the adaptive TDMA single-carrier uplink
In the simulations results in Figure G23 all users have the same average SNR and the user speed is 50 kmh for all users The scheduler performs max throughput scheduling based on equalised user SNR Perfect estimation and prediction of the impulse responses of each time-slot of each user are assumed Thus the results are upper bounds on the attainable spectral efficiency Note also that Figure G23 does not include overhead related to channel estimation and prediction (approx 15) In addition only the signalling bandwidth is taken into account ie the spectral roll-off (231) is not compensated for As seen there is a multi-user diversity gain for this uplink However compared to the multi-user diversity gains for systems with more narrow bandwidths as investigated in [WOSS05] the gain is smaller The reason for this is the channel averaging caused by the frequency diversity for the wideband channels This
WINNER D210 v10
Page 156 (180)
makes the variability of the instantaneous channels from the individual users to be smaller which in turn limits the obtainable amount of multi-user diversity gain
A fair comparison between the investigated adaptive TDMA single-carrier uplink and an adaptive TDMAOFDMA uplink has to take especially the pilot overhead feedback information rate subcarrier frequency offset and peak-to-average power ratio (PAPR) mitigation into account Preliminary results not shown here indicate that for a 5 MHz wide uplink channel there is at least 3 dB gain for the adaptive TDMAOFDMA uplink with 2 frequency offset of the subcarrier spacing compared to the adaptive TDMA single-carrier uplink and before PAPR mitigation loss Thus an adaptive multi-carrier based TDMAOFDMA uplink seems more promising as an adaptive uplink for the WINNER system concept
G42 Comparison of IFDMA and chunk based OFDMA
Simulation Assumptions Simulator Link level Scenario wide area MT = 1 MR = 1 mobility 70 kmh for all mobiles single user
considerations Channel modelling COST 207 TU Interference modelling no inter-cell interference OFDM parameter Number of used subcarrier = 512 subcarrier distance = 390625 kHz
guard period = 7 micros MCS 1 QPSK r=12 FEC convolutional coding (133171)oct with memory 6
Codeword length fixed size of 1000 bits
The purpose was to investigate the impact of frequency diversity on performance for IFDMA with interleaved subcarrier allocation compared to DFT-precoded OFDMA with block-wise subcarrier allocation As expected for coded transmission over a very frequency selective mobile radio channel as the one assumed IFDMA shows significant better performance compared to DFT-precoded block OFDMA for a number of subcarriers per user Qgt1 This is due to the fact that in IFDMA the subcarriers are equidistantly distributed over the total bandwidth of 20 MHz whereas for DFT-precoded OFDMA only a fraction of the bandwidth is used for transmission For Q=1 ie each user gets only a single subcarrier both schemes exhibits the same performance and cannot exploit frequency diversity
-5 0 5 10 15 20 25
10-3
10-2
10-1
100
SNR [dB]
BE
R
OFDM Q=1OFDM Q=4OFDM Q=16IFDMA Q=1IFDMA Q=4IFDMA Q=16
Figure G24 BER comparison for IFDMA and DFT-precoded block OFDMA for various number of allocated subcarriers per user Q
The SNR gains of IFDMA compared to DFT-precoded block OFDMA at BER=10-3 for an interleaving depth of about 250micros is still 55 dB at a not too low data-rate ie 625 Kbits It is expected that also for transmission using block codes and for the use of the WINNER channel model the same effect can be shown However further studies are required to assess the impact of real channel estimation as well as imperfectly synchronised and power controlled UTrsquos for either case which might reduce the interleaving gain considerably
WINNER D210 v10
Page 157 (180)
G43 Performance of adaptive OFDMA Simulation Assumptions
Simulator Multi-link Scenario Short range isolated cell single antenna BS and UT Channel modelling A1 LOS NLOS B1 LOS NLOS including path loss and shadow fading Cell radius 50 m for A1 150 m for B1 MCS 4 BPSK 4 16 64 QAM generally considered by SNR gap approximation
and SNR gap Γ = 5 dB FEC convolutional coding (561753)oct with memory 8 code rate 12
Codeword length 240 times (number of bits per symbol) not relevant for results User distribution ( ) KkrKkdk 110middot)1()1(91 cell K=minusminus+=
The performance of frequency adaptive OFDMA (subcarrier based and chunk based) is evaluated by multi-link simulations The considered adaptive OFDMA scheme maximises the sum rate of all users under individual transmit power constraints for which an extremely simple and efficient algorithm for adaptive chunk allocation is found to perform well The adaptive scheme is appropriate for the uplink in the short-range case where the channel is quasi-static and CSI is available at the transmitter
We consider the effects of the channel estimation and prediction by a simple Gaussian error model The largest prediction horizon for the TDD mode is L = 1 ms [WIND24] Table 31) In the B1 scenario the fastest users move at an average speed of v = 5 kmh (see Appendix E3) the carrier frequency is fc = 5 GHz which gives a prediction horizon in fractions of wavelength of 020=λ= cvLl This prediction horizon is rather short in comparison to those considered in [WIND24] Section 313 and it is thus expected that the CSI feedback delay has no significant effects for the A1 and B1 scenario The channel predictor estimates the power gain 2
nn hg = Due to channel estimation errors and the inevitable feedback delay the estimation is slightly degraded In the following we consider this effect by the simple model ( )nnn gg η+= 1ˆ where nη is )0( 2
eσΝ distributed and 2eσ denotes the normalised estimation and
prediction error The instantaneous SNR is given by 002 NpgNph nnnnn ==γ and the estimated SNR
is ( )nnnnn Npg η+γ==γ 1ˆˆ 0 For the simulation of the BER for the selected MCS first the SNR nγ is selected and then for each codeword an estimated SNR is generated The final BER is averaged over many codewords
In Table G1 the minimum SNR for a target BER of 4b 10minus=P for each MCS is given The SNR gap Γ
denotes the additional required SNR in comparison to the Shannon limit to reach the same bit rate at the target BER ( ) )12(1log minmin2 minusγ=ΓrArrΓγ+= RR The average SNR gap for 0102 =σe is
dB5asympΓ which will be used in the following to consider the effects of realistic adaptive modulation and coding
Table G1 Minimum SNR for selected modulation scheme
02 =σe 0102 =σe code rate modulation SNR γmin SNR gap Γ SNR γmin SNR gap Γ 05 BPSK 05 dB 43 dB 09 dB 47 dB 1 QPSK 35 dB 35 dB 39 dB 39 dB 2 16-QAM 95 dB 47 dB 99 dB 51 dB 3 64-QAM 146 dB 61 dB 148 dB 63 dB
Adaptation Problem and Key Design Criteria The multiple-access scheme has to adapt to the traffic and the QoS requirements as well as to the channel of multiple users Since joint adaptation to all parameters would result in an impractically complex optimisation problem it seems wise to separate the problem into two adaptation steps
1 Scheduling Adaptation to traffic and QoS requirements like bit rate delay queue length and userserviceflow priorities including ldquofairnessrdquo
2 Adaptation to the channel state ie the channel gain to noise ratio
The priorities of users services or flows as well as the exact definition of fairness will depend mainly on the operatorrsquos adopted strategy and business model The scheduling strategy hence must be flexible and is not only dictated by technical arguments In the following we present an adaptive scheme which adapts
WINNER D210 v10
Page 158 (180)
to the channel only and offers to the scheduler the possibility to operate near the border of the channel capacity region The limits of this region are established in [Yu02] and [Tse98] however no algorithm which is simple enough for practical implementation and achieves all border points of the capacity region is known In [PI05] the scheduling region which is achievable with a relatively simple algorithm and which may yield a good approximation to the true capacity region is outlined
The cell capacity for the uplink can be computed by the iterative water-filling (IWF) algorithm [Yu04] which can be adapted easily to OFDMA [Pfl05 PI05] This algorithm computes the optimum power allocation for all users The rate obtained with this algorithm corresponds to the Shannon capacity which can serve as an upper bound A more realistic rate is obtained by considering an SNR gap of Γ = 5 dB which takes into account the considered link adaptation schemes
Figure G25 depicts the sum rates achieved with the optimum IWF algorithm for all four short-range scenarios with and without considering the SNR gap As was also observed in [PI05] ndash although theoretically optimum ndash sharing the subcarriers does not yield any perceivable capacity gain In other words adding an additional CDMA or TDMA component to OFDMA will only increase the system complexity but not give any capacity gain38
0 10 20 30 40 500
100
200
300
400
500
600
700
num ber of users K
sum
rate
[Mbi
ts]
A1 LOS
sum rate Γ=0dBsum rate Γ=5dBno subchannel sharingsubchannel sharing
0 10 20 30 40 500
100
200
300
400
500
600
700
num ber of users K
sum
rate
[Mbi
ts]
A1 NLOS
0 10 20 30 40 500
100
200
300
400
500
600
num ber of users K
sum
rate
[Mbi
ts]
B1 LOS
0 10 20 30 40 500
50
100
150
200
num ber of users K
sum
rate
[Mbi
ts]
B1 NLOS
Figure G25 Uplink cell capacity for OFDMA with N = 1664 subcarriers and constant user density in the cell The performance loss due to allowing only one user per subcarrier is negligible for all
considered cases
In the TDD mode nsub = 16 subcarriers are grouped into one chunk The application of the IWF algorithm to chunks instead of subcarriers is straightforward and the maximum sum rates achieved with a chunk-based (ie with subcarrier groups) OFDMA scheme is given in Figure G26 Naturally the cell capacity of chunk-based OFDMA is inferior but the system complexity as well as the algorithm run-times are significantly lower For practical implementations the complexity of the IWF algorithm might be an obstacle but fortunately there is a low-complexity alternative The XP algorithm [Ace05] (see also [PI05]) is an extremely simple and efficient method for adaptive subcarrier allocation which attains nearly the same sum rate as the optimum IWF algorithm In Figure G26 the sum rate for a fixed subcarrier allocation is given as a reference The subcarrier allocation for this case is given by
38 Note that this statement holds for the short-range uplink and for the sum rate optimisation criterion This does not
contradict the results obtained in eg [Tri04]
WINNER D210 v10
Page 159 (180)
( ) 11mod +minus= fa Kf where af denotes the user allocated to subcarrier f For each user single-user water-filling is performed on his set of subcarriers to compute the resulting sum rate Surprisingly for the lsquoA1 LOSrsquo scenario this simple non-adaptive subcarrier allocation performs close to the optimum solution and even better than the XP algorithm while for the lsquoB1 LOSrsquo case it comes with a significant capacity penalty
0 10 20 30 40 500
100
200
300
400
500
600
700
num ber of users K
sum
rate
[Mbi
ts]
A1 LOS
0 10 20 30 40 500
100
200
300
400
500
600
700
num ber of users K
sum
rate
[Mbi
ts]
A1 NLOS
0 10 20 30 40 500
100
200
300
400
500
600
num ber of users K
sum
rate
[Mbi
ts]
B1 LOS
0 10 20 30 40 500
50
100
150
200
num ber of users K
sum
rate
[Mbi
ts]
B1 NLOS
IWFXPFixed allocation
Figure G26 Sum rate achieved with chunk-based OFDMA (Γ=5 dB) The optimum IWF (iterative water-filling) algorithm achieves the highest rate while the rate achieved with the low-complexity
XP algorithm [Ace05] is only slightly lower
Conclusions The considered adaptive OFDMA scheme maximises the sum rate of all users under individual transmit power constraints It is appropriate for the uplink in the short-range case where the channel is quasi-static and CSI is available at the transmitter The achievable gain is rather low compared to non-adaptive subcarrier allocation if LOS conditions prevail However in NLOS conditions with sufficient frequency-selectivity considerable performance improvements can be obtained
The considered optimisation criterion consciously excludes fairness issues since different notions of fairness exist and these may depend on the operatorsrsquo preferences ldquoFairnessrdquo and other QoS-related constraints can be included by a traffic-aware scheduler which selects for each Frame the appropriate subset of active users
The simulation results show the achievable sum rate per cell or sector in the uplink when both terminal and base station have one antenna The sum rates for an SNR gap of Γ = 0 dB are strict upper bounds while the rates for Γ = 5 dB consider the effect of realistic modulation and coding schemes
G44 Comparison of adaptive OFDMA and OFDM-TDMA
Simulation Assumptions Simulator Multi-link 8 Frames per snapshot 6000 snapshots Scenario Short range isolated cell single antenna BS and UT no power control Channel modelling A1 LOS and NLOS clustered delay line model Cell radius 100 m and 200 m MCS 5 BPSK r=13 BPSK r=23 QPSK r=23 16-QAM r=23 64-QAM
WINNER D210 v10
Page 160 (180)
r=89 FEC Punctured convolutional coding (133171145)oct with memory 6
codeword length variable ndash one codeword always fills one chunk (OFDMA) or one symbol (TDMA)
Type of feedback Average SINR per chunk (OFDMA) or symbol (OFDM-TDMA) Feedback delay 1 Frame Overhead Chunkrsquos overhead 175 tail of CC duplex time Mobile speed anglev sim U(02π) vx sim η(mσ 2) vy sim η(mσ 2) |v|= (vx
2+vy2)05
m = 1 kmh σ = 16 kmh
The performance of OFDMA and TDMA is assessed for the uplink considering several scheduling variants Common to all these variants is a two step approach in the first step a decision is taken which 8 users (out of 40 or 80 users) will be served and in the second step it is decided how many and what resources are assigned to the selected users
In case of Round Robin (RR) both users and resources are sequentially selected and linked With the MaxSNR1 approach the 8 users with the highest SNR are selected in the first step Then equal amount of resources are allocated to these users in a round robin manner With MaxSNR2 users are selected via round robin but the resource allocation is performed according to the maximum rate sharing principle Step one is the same for the fair rate (FR) scheduler but in step two each user gets a fraction of the resources which is inversely proportional to the userrsquos transmission rate In the second version (FR2) the resource assignment decision is made to maximise the overall frame throughput
Note that very simple link adaptation based on the average SNR was applied using reference curves from AWGN link level simulations Since such a model is suboptimum for TDMA (where the codeword suffers from frequency-selectivity) the comparison of both MA schemes is to a certain extent unfair
Independent encoding of each chunk with tail as considered in case of OFDMA increases the overhead and causes the overall throughput to decrease This factor is more significant for low quality channels (large distances between the UT and BS) when low order modulations and strong coding schemes are applied The measured loss with Round Robin scheduling is about 37 for 100 meter cells and about 69 for 200 meter cells on average however users at the cell edge experience a throughput loss higher than 7 and 11 respectively
The calculated average cell throughput obtained with RR scheduling for 100 meter cell radius and 40 users is equal to 7138 Mbps for OFDMA and 7335 for TDMA The MaxSNR1 scheduling algorithm adaptively selects the users to be served and thus offers an increase of the overall cell throughput to 14784 Mbps and 15315 Mbps respectively It should be stressed that similar results are obtained for both OFDMA and TDMA since no fully adaptive scheduling has been applied one part of the chain ie either user selection or resource assignment is always based on round robin For the MaxSNR2 algorithm the average cell throughput is about 7 Mbps lower than for MaxSNR1 and for Fair Rate scheduling the average cell throughput for OFDMA is equal to 4667 Mbps only Scheduling of users on the equal time sharing base (RR MaxSNR2 FR) slightly decreases the overall cell throughput for higher number of allocated users (by about 02 - 04 for 80 allocated users) Increase of the cell radius from 100 m to 200 m decreases the average cellrsquos throughput by about 50 for RR 19 for MaxSNR1 17 for MaxSNR2 and 68 for FR scheduling
0
5
10
15
20
25
0 20 40 60 80 100 120 140 160 180 200
distance [m]
Ave
rage
use
rs th
roug
hput
[Mbp
s]
RR TDMARR FDMAMaxSNR1 FDMAMaxSNR1 TDMAFR1 FDMAFR2 FDMA
0
20
40
60
80
100
120
140
160
0 20 40 60 80 100 120 140 160 180 200
distance [m]
Ave
rage
use
rs th
roug
hput
[Mbp
s]
MaxSNR2 FDMAMaxSNR2 TDMAMaxSNR1 FDMAMaxSNR1 TDMA
Figure G27 Average userrsquos throughput vs distance for different scheduling variants considering 40 users throughput figures are averaged across served users only
WINNER D210 v10
Page 161 (180)
Simulation results showing the average user throughput versus distance with the different scheduling algorithms discussed are shown in Figure G27 The average user throughput obtained with FR (left plot) drops very slightly with distance (in contrast to RR) however the price to be paid is its lower overall throughput Application of the FR2 increases the overall throughput only slightly compared to FR In case of MaxSNR1 the average throughput drops for the middle range users but compared to fair rate scheduling a much higher user throughput is achieved As depicted in the right plot of Figure G27 MaxSNR2 scheduling achieves dramatically higher throughput values for users located close to the base station than MaxSNR1 albeit at the expense of serving some users not at all (mainly those far away from the BS)
Results presented to far reveal the large impact of scheduling algorithms on cell throughput and fairness The two step scheduling approach considered here enables a trade-off between both aspects Further refinement is required to be able to exploit the multi-user-diversity potential of chunk based OFDMA and compare the results to the well known class of proportional fair scheduling algorithms
G5 Uplink spatial processing
G51 Performance of spatial diversity Simulation Assumptions
Simulator System 19 three-sector sites full interference modelling using wrap-around Scenario cellular on average 10 userssector frequency reuse 1
MT = 1 MR le 8 varying cell radius Channel model C2 NLOS WINNER interim channel model (WIMI) MCS Modulation schemes QPSK 16QAM and 64QAM
Channel code rates 110 13 12 23 34 and 89
FEC
Turbo code combined with Layer 1 code block segmentation (up to 5114 bits per block) and rate matching codeword length from 998 (QPSK rate 110) to 26624 bits (64QAM rate 89) rate 17 mother code (polynomials feedback 013 feedforward 015 017 011)
FeedbackOverhead Chunk SINR after receiver processing zero delay no overhead
A non-frequency adaptive uplink based on OFDM is considered The performance of the uplink access method is evaluated using different number of base station antennas in order to demonstrate the importance of antenna diversity Performance is compared for different cell sizes and in terms of average sector throughput and active radio link data rates The latter measure is the (average) user throughput when scheduled for transmission Since round robin TDMA scheduling is applied the active radio link data rate may be used to assess the fairness in the network Furthermore because many idealised assumptions are made one should not focus on the absolute performance figures but rather on the relative performance
Figure G28 shows the average uplink throughput for different number of base station antennas and for different diversity combining schemes namely MRC and IRC The antenna element spacing at the base station is half a wavelength (left) and four wavelengths (right) With tightly spaced antennas the gain of multiple antennas at the base station and MRC is in the order of 35ndash50 80ndash110 and 130-220 for two four and eight antennas respectively IRC which performs inter-cell interference suppression provides an additional gain of up to 10 20 and 25 With a wider antenna separation the diversity gain is enhanced even further and in particular the gain of IRC over MRC is more evident In interference-limited deployments the performance with four antennas and IRC is comparable to the performance with eight antennas and MRC
The lower plots depict uplink data rate distributions in a deployment in which cells have a radius of 700 m The distributions indicate that in order to provide high uplink data rates to a large fraction of the user population multiple base stations receive antennas are a very useful means
In summary base station receive diversity may significantly improve the uplink performance Such solutions increase total throughput and enhances data rates for all users Performance improves as expected with larger antenna separation and the results further indicate that IRC with a lower number of antennas may give similar performance as MRC with a larger number of antennas It should be kept in mind however that the inter-cell interference suppression gains of IRC relative to MRC may be smaller when estimation errors are considered
WINNER D210 v10
Page 162 (180)
100 m 1 km 10 km0
20
40
60
80
cell radius
aver
age
sect
or th
roug
hput
[Mbi
ts]
IRC (05 λ)MRC (05 λ)
0 20 40 60 800
010203040506070809
1
prob
(use
r thr
ough
put lt
abs
ciss
a)
active radio link rate [Mbits]
100 m 1 km 10 km0
20
40
60
80
active radio link rate [Mbits]
aver
age
sect
or th
roug
hput
[Mbi
ts]
IRC (4 λ)MRC (4 λ)
0 20 40 60 800
010203040506070809
1
prob
(use
r thr
ough
put lt
abs
ciss
a)
active radio link rate [Mbits]
Figure G28 Average uplink throughput and active radio link distributions for different number of base station receive antennas combining schemes and antenna element separations
G52 Linear precoding concepts with long term channel state information In the wide-area scenario the instantaneous CSI is not available at the transmitters due to the high mobility Therefore linear precoding is performed at the mobiles based on long-term CSI Long-term CSI are either the channel mean components (first moment of the channels ndash mean feedback) or the channel correlation matrices (second moment of the channels ndash covariance feedback) In general there are two ways to obtain long-term CSI implicit or explicit feedback
In TDD mode under the reciprocity assumption the downlink channel estimation can be reused for uplink transmission After estimation of the channel during downlink transmission the instantaneous channel at time t+τ that is seen by the mobile is modelled by the sum of the estimated channel matrix and a noise matrix This channel can be interpreted as an MIMO channel with effective LOS component The K factor corresponds to the quality of the channel estimate In the explicit form of mean-feedback the base station performs channel estimation averages over many blocks and transmits the mean matrix back over a control channel
In FDD mode the receiver estimates the correlation matrix on the set of carriers used for downlink transmission [BM04] There are two key issues regarding the efficiency of estimating the covariance matrix in this way The covariance must vary slowly enough ie the estimate is still valid when the base station is sending to user k There must be enough carriers in the set to well approximate the actual covariance matrix The explicit covariance feedback scenario is similar to the explicit mean feedback scenario discussed before The base collects the necessary channel statistics and feeds back the channel covariance matrix to the mobiles
Let assume the multi-user linear MMSE multi-user receiver is used at the base station Then the performance criterion is the average total sum MSE [JB03] The corresponding programming problem is given by minimizing the total sum MSE under individual power constraints Beamforming of user k on carrier n with the eigenvectors of the transmit covariance matrix power allocation of user k on carrier n with the eigenvalues of the transmit covariance matrix and resource allocation is described by the individual MSE of user k on carrier n
WINNER D210 v10
Page 163 (180)
If implicit feedback is used then the optimal beamforming directions of all users correspond to the eigenvectors of the effective LOS-component for mean feedback or the eigenvectors of the channel transmit correlation matrix for covariance feedback The resulting power allocation problem is characterised by the range in which a single-beam per user achieves the sum performance For sum capacity the analysis was performed in [SU05] The theoretical results and the corresponding SCME channel model results are shown in Figure G29
0 05 1 15 20
02
04
06
08
1
12
P λ11
P λ 1
2
MIMO 2x2
K=1K=2K=3K=4K=10
micmac
-2 -1 0 1 205
1
15
2
25
P λ1
ε
MIMO 2x2
K=1K=2K=3K=5K=10
Beamforming NOT optimal
Beamformingoptimal
Beamformingoptimal
Umi Uma Sma
Figure G29 Beamforming optimality range for covariance and mean feedback in theory and
WINNER SCME channel models (micro urban [umi] macro urban [uma] and macro suburban [sma])
Here P is the total transmit power M is the largest mean component λ11 and λ12 are the largest and second largest eigenvalue of the transmit correlation matrix of user one The term ε represents the beamforming condition function ie if ε gt 1 then beamforming is optimal Observe that for two transmit and two receive antennas single stream beamforming is optimal for two and more users Other antenna configurations are to be analyzed
G6 Uplink multi-user detection
G61 Comparison of receiver structures for DS-CDMA
Simulation Assumptions Simulator Multi-link Scenario wide area cellular frequency reuse 1 single antenna BS and UT average
(slow) power control Channel modelling C2 NLOS WIMI Interference modelling Interference generated by neighbour cells active users (6 cells surrounding
the cell of interest) Assume same number of active users in all cells MCS 1 BPSK FEC convolutional coding (561753)oct with memory 8 code rate 12
Codeword length 702 bits spreading Walsh-Hadamard spreading length 16 Cyclic Prefix length 52 chips (block oriented transmission) Overhead Total overhead of 23 taken into account in TX-power and resources Mobile speed 50 1 kmh 50 25 kmh User spatial distribution
( ) KkrKkdk 110middot)1()1(91 cell K=minusminus+=
The focus has been placed on evaluating performance of various reduced complexity receivers for the uplink in the wide area non-frequency adaptive WINNER mode for single carrier DS-CDMA where the multi-carrier approach could encounter important challenges Two transmission schemes are compared a time domain processing receiver based on conventional RAKE receiver and a frequency domain processing receiver that makes use of cyclic prefix (CP) In both cases several iterative implementations of the multi-user detector are investigated Motivated by complexity constraints the focus is on linear multi-user detectors The complexity of the MMSE receiver is dominated by the calculation of the MMSE filter which requires a large matrix inversion Rather than direct matrix inversion we use iterative methods for solution of linear systems concentrating on the Successive Over-relaxation (SOR) method associated with serial interference cancellation and the Chebyshev method associated with parallel
WINNER D210 v10
Page 164 (180)
interference cancellation The details and formulation of multi-user receiver in either domain and the proposed reduced complexity methods for the implementation of a linear multi-user receiver can be found in [IN05][WIND26]
-4 -2 0 2 4 6 810
-4
10-3
10-2
10-1
100
EbN0 (dB)
Bit
Erro
r Rat
e
MF(no intercell interf)MMSE(no intercell interf)MMSE-SOR 6 iter(no intercell interf)MMSE(intercell interf)MMSE-SOR 6 iter(intercell interf)
Figure G30 BER performance of a low complexity frequency domain MMSE receiver in presence
of inter-cell interference
Based on link level simulations results in terms on convergence and performance for single cell scenario where results showed that convergence of the iterative implementation of the TD receiver is substantially slower than for the FD receiver being in both cases faster for the SOR iterative implementation of the MMSE filter than for the first order Chebyshev iterative implementation we focus on the FD receiver and SOR implementation of the MMSE detector for the multi-cell multi-link evaluation Shown in Figure G30 is the coded BER performance of FD receiver in presence of inter-cell interference compare to no inter-cell interference for a 50 loaded system where the performance for the iterative implementation of the MMSE detector is shown for 6 iterations Similar results have been obtained for other system loads
To conclude it is feasible to achieve MMSE performance with a reduced complexity implementation with only a few iterations required Yet the single carrier DS-CDMA approach will require a multi-user detector
G62 Comparison of receiver structures for MIMO single carrier
Simulation Assumptions Simulator multi-link Scenario wide area isolated cell MT = 2 4 MR = 4 1ndash4 users Channel modelling C2 NLOSWIMI Interference modelling no inter-cell interference Multiple access TDMASDMA MCS 1 QPSK r=12 (SM-MIMO with turbo coding)
1 BPSK r=13 (ST-WNRA) FEC punctured turbo coding (1513)oct with memory 4
space-time weighted non-binary repeat accumulate coding codeword length fixed size of 1664 bits
Serial modulation for wide area uplink was investigated for the case of single-input-single-output (SISO) transmission with non iterative and iterative frequency domain receivers in [WIND21 WIND23] In order to further enhance uplink performance link-adaptation and MIMO techniques are the focus of further study In this section only MIMO techniques are considered further information about different link adaptation techniques can be found in [WIND23] By using at least one of these key technologies bandwidth efficiency can be enhanced and transmission power of terminal can be reduced As a result of this improved uplink performance turns into larger coverage and higher data rates The goal of this section is to introduce two MIMO techniques for wide area uplink with serially modulated multipointpoint to point transmission Channel state information is not required at the transmitter and iterative frequency domain processing is performed at the receiver
WINNER D210 v10
Page 165 (180)
Figure G31 Transmitter block diagram of space-time weighted nonbinary repeat accumulate (ST-WNRA) coded multipointpoint-to-point MIMO for serially modulated MIMO transmission
Figure G31 illustrates the transmitter block diagram of ST-WNRA coded MIMO The ST-WNRA encoder consists of two main parts a repeater and the concatenation of a weighter and an accumulator The function of the repeater is to provide coding gain and the concatenation of the weighter and accumulator is to provide full rank over the whole encoded data Therefore ST-WNRA codes can provide full transmit antenna diversity for any number of transmitter antennas in single user flat fading channels with low encoding and decoding complexity The full transmit antenna diversity can be only obtained by using BPSK as underlying modulation method because the full rank property is only retained in the binary field The interested reader is referred to [OY03] for more in-depth information about ST-WNRA codes The maximum achievable diversity order with ST-WNRA codes using the proposed iterative frequency domain reception is given as MT times L times MR where MT L and MR are the number transmit antennas the number of multi-paths and the number of receiver antennas respectively Since ST-WNRA is a pure diversity based MIMO technique the maximum transmission rate is constrained to one However the transmission rate can be enhanced by using a multilevel approach that is briefly described in the next subsection Finally it should be noticed that ST-WNRA codes are more flexible compared to other space-time codes that provide both coding and diversity gain eg space-time trellis and space-time turbo codes Flexibility is an important factor when capability to support for any number of transmitter antennas and short frame lengths is required
Figure G32 Transmitter block diagram of spatially multiplexed vertically encoded multipointpoint-to-point MIMO for serially modulated transmission
Figure G32 presents the transmitter block diagram for the well-known vertically encoded spatially multiplexed MIMO transmission In this scheme the input bit stream undergoes temporal encoding modulation and interleaving after it is demultiplexed into NT streams transmitted for individual antennas Obviously the purpose of this technique is just to maximise multiplexing gain Therefore the maximum achievable diversity order by using convolutionalturbo codes and with the proposed iterative frequency domain reception is given as L times MR Further details of this scheme can be found from [SD01]
The parameters used in the simulations are as follows for ST-WNRA multi-user MIMO the channel is typical urban C2 2 transmit antennas per user 4 receive antennas repetition rate 3 3 decoder iterations 4 equaliser iterations the number of users ranges from 1 to 4 Iterative frequency domain joint-over-antenna multi-user MIMO receiver is used For spatially multiplexed turbo-coded multi-user MIMO the parameters are the same except for the code rate being frac12 (generator polynomials (1513)) QPSK modulation
Figure G33 presents the simulation results of ST-WNRA and spatially multiplexed vertically turbo-coded multi-user MIMO ST-WNRA outperforms spatially multiplexed vertically coded MIMO However the maximum spectral efficiency in the case of ST-WNRA is 266 bitHzs whereas with spatially multiplexed case it is 8 bitHzs The results also show that with joint-over-antenna signal detection technique the same diversity order is maintained for each of the users Only a parallel shift is observed when the number of users is increased This is due to fact that joint-over-antenna technique can preserve the degrees of freedom for the joint-detection of interference and the signal of interest
Encoder πB
Modulator πS
SP
GI
GI
D
Symbol toBPSK
Mapper
Repeater
Weighter π πIGI
GI
ST-WNRA
SP
WINNER D210 v10
Page 166 (180)
BLE
R
Figure G33 BLER performance vs SNR of serially modulated multi-user MIMO transmission in typical urban C2 Scenario (each user has 2 transmitter antennas and base station has 4 receiver
antennas number of users U = 1234)
G7 Other topics
G71 OFDM versus single carrier based uplinks
Simulation Assumptions Simulator System 19 three-sector sites full interference modelling using wrap-around Scenario cellular on average 10 userssector frequency reuse 1
MT = 1 MR = 4 varying cell radius Channel model C2 NLOS WINNER interim channel model (WIMI) MCS Modulation schemes QPSK 16-QAM and 64-QAM
Channel code rates 110 13 12 23 34 and 89
FEC
Turbo code combined with Layer 1 code block segmentation (up to 5114 bits per block) and rate matching codeword length from 998 (QPSK rate 110) to 26624 bits (64QAM rate 89) rate 17 mother code (polynomials feedback 013 feedforward 015 017 011)
FeedbackOverhead Chunk SINR after receiver processing zero delay no overhead
A non-frequency adaptive uplink based on OFDM or single-carrier transmission is considered The impact of the high PAPR of the OFDM signal is coarsely modelled by introducing a power backoff factor that reduces the maximum terminal output power In case single-carrier transmission is considered a linear MMSE frequency domain equaliser (FDE) is assumed to be used in the base station receiver Performance is compared for different cell sizes and in terms of average sector throughput and active radio link data rates The active radio link data rate is the (average) user throughput when scheduled for transmission Since round robin TDMA scheduling is applied the active radio link rate may be used to assess the fairness in the network Because many idealised assumptions are made one should not focus on the absolute performance figures but rather on the relative performance
Investigations of single-carrier and multi-carrier modulation techniques in Appendix B indicate that the PAPR of an OFDM signal and the required power backoff is typically 2ndash3 dB higher than that of a single-carrier signal To capture the high PAPR of the OFDM signal OFDM transmission is in here modelled with a power backoff (pbo) of 2 dB As a reference case OFDM transmission without any power backoff (0 dB) is studied as well In the left part of Figure G34 the performance of an uplink access scheme using OFDM transmission is compared to a single-carrier transmission scheme in terms of average sector throughput Base stations are equipped with four antennas separated four wavelengths and IRC is used to suppress inter-cell interference The results indicate that in interference limited scenarios
WINNER D210 v10
Page 167 (180)
ie for small cells OFDM has a small performance advantage thanks to the absence of inter-symbol interference Note further that in such interference limited deployments the OFDM power backoff is of limited importance In large cell deployments in which noise rather than interference limits performance single-carrier transmission provides better performance thanks to the higher output power (compared to OFDM with a 2 dB power backoff) The right plot shows data rate distributions for cell radius 700 m The plot indicates that compared to OFDM with a 2 dB power backoff single-carrier transmission provides a small but uniform increase of data rates
100 m 1 km 10 km0
10
20
30
40
50
60
cell radius
aver
age
sect
or th
roug
hput
[Mbi
ts]
OFDM pbo = 0 dBOFDM pbo = 2 dBSC MMSE FDE
0 20 40 60 800
010203040506070809
1
prob
(use
r thr
ough
put lt
abs
ciss
a)
active radio link rate [Mbits]
OFDM pbo = 0 dBOFDM pbo = 2 dBSC MMSE FDE
Figure G34 Average sector throughput for OFDM and single-carrier transmission (left) and an example of the corresponding data rate distributions (right) The distributions are depicted for cell
size 700 m
In summary the results show that if accounting for the high PAPR of the OFDM signal here by introducing an OFDM power backoff penalty of 2 dB OFDM has a small performance advantage in interference limited scenarios while the single-carrier transmission scheme using a linear MMSE frequency domain equaliser at the receiver provides better performance in noise limited deployments
G72 Performance of low rate channel coding for one-cell frequency reuse
Simulation Assumptions Link level Inter-cell interference is modelled by Gaussian noise
Simulator System level 19 cells 3 sectorscell full inter-cell interference modelling using wrap-around
Scenario Wide area cellular frequency reuse 1 single antenna BS and UT Channel model Metropolitan channel model defined in D53 Mobile speed 4 kmh for all users Channel coding Turbo code ARQ Chase combining Maximum number of retransmissions M = 0 1 3 Scheduling (for system level) Proportional fair scheduling 4 userssector Full buffer model Channel estimation Real (Weighted subcarrier coherent averaging)
First using the link level simulation optimum minimum coding rate of a very-low-rate Turbo coding and spreading factor value that achieves one-cell frequency reuse in a multi-cell environment in the downlink OFDM is investigated The required average signal-to-interference plus noise power ratio (SINR) to satisfy an average packetblock error rate (BLER) of 10-2 is plotted in Figure G35 (left) as a function of the reciprocal of the coding rate 1R
In the figure QPSK modulation is employed and Q denotes the spreading factor As shown in the figure the required average SINR is reduced with increasing ratio QR which indicates that the suppression of severe inter-cell interference from the surrounding cells is in principle possible however at the expense of throughput Moreover under the same QR conditions the required average SINR is reduced with decreasing code rate R up to approximately 16 to 18 Therefore we see that the minimum coding rate providing a distinct channel coding gain is approximately R = 16 to 18 Figure G35 (right) shows the required SINR for the average residual BLER of 10-3 as a function of the product of 1R and Q Assuming real-time traffic with a rigid delay requirement we take into account hybrid ARQ with Chase combining
WINNER D210 v10
Page 168 (180)
Req
uire
d av
erag
e re
ceiv
ed S
INR
for a
vera
ge B
LER
= 1
0-2 [d
B]
-20
-15
-10
-5
0
5
10
M = 0M = 1M = 3
Req
uire
d av
erag
e (in
stan
tene
ous)
rece
ived
SIN
R
for a
vera
ge re
sidu
al P
ER =
10-3
(dB
)
Spreading factor Q1
Channel coding rate R12 14 18
2 4 8 16 32 64 128
1
5
Instantaneous
Average
1
5
-20
-15
-10
-5
0
5
10
M = 0M = 1M = 3
Req
uire
d av
erag
e (in
stan
tene
ous)
rece
ived
SIN
R
for a
vera
ge re
sidu
al P
ER =
10-3
(dB
)
Spreading factor Q1
Channel coding rate R12 14 18
2 4 8 16 32 64 128
1
5
Instantaneous
Average
1
5
for a
vera
ge re
sidu
al B
LER
= 1
0-3 [d
B]
Req
uire
d av
erag
ein
stan
tane
ous r
ecei
ved
SIN
R
Figure G35 Optimum minimum channel coding rate (left) and required coding rate and spreading factor for achieving one-cell frequency reuse (right)
Furthermore we assumed two extremely different packet call times a very long call time where the received SINR is approximated by the average SINR (denoted as Average) and a very short call time during one packet frame duration where the received SINR is approximated by the instantaneous SINR (denoted as Instantaneous) In the figure the dotted lines indicate the SINR values corresponding to the 1 and 5-point of CDF of the SINR ie cell-edge conditions in a multi-cell environment On the horizontal axis we first decrease the coding rate from R = 12 to 18 maintaining Q = 1 Next in order to achieve QR gt 8 we further increase the Q value with a fixed R = 18 As shown in the figure according to the increase in the QR value the required SINR value is significantly improved This is due to the effect of the improved processing gain associated with channel coding and spreading Furthermore assuming the same QR value on the horizontal axis increasing M brings about a reduction in the required average SINR since the time diversity gain from the hybrid ARQ improves the received SINR of a packet From the figure in order to satisfy the SINR value at the 1 and 5-point of CDF the required coding rate and the spreading factor becomes (R Q) = (18 8 - 16) (18 4 - 8) and (18 2 - 4) for M = 0 1 and 3 in the case of average SINR and (18 8 - 32) (18 4 - 16) and (18 2 - 8) for M = 0 1 and 3 in the case of instantaneous SINR Consequently we conclude that the spreading is inevitable to achieve one-cell frequency reuse together with the low-rate channel coding such as R = 18
MCS sets with low-rate channel coding and spreading MCS sets without low-rate channel coding and spreading MCS sets with low-rate channel coding and spreading MCS sets without low-rate channel coding and spreading
0
02
04
06
08
1
0 5 106 1 107 15 107 2 107
Cum
ulat
ive
dist
ribut
ion
User throughput (bps)
Without hybrid ARQ
0
02
04
06
08
1
0 5 106 1 107 15 107 2 107
Cum
ulat
ive
dist
ribut
ion
User throughput (bps)
0
02
04
06
08
1
0 5 106 1 107 15 107 2 107
Cum
ulat
ive
distr
ibut
ion
User throughput (bps)
With hybrid ARQ(Max retransmissions M = 1)
With hybrid ARQ(Max retransmissions M = 3)
0
02
04
06
08
1
0 5 106 1 107 15 107 2 107
Cum
ulat
ive
distr
ibut
ion
User throughput (bps)
Without hybrid ARQ
0
02
04
06
08
1
0 5 106 1 107 15 107 2 107
Cum
ulat
ive
dist
ribut
ion
User throughput (bps)
0
02
04
06
08
1
0 5 106 1 107 15 107 2 107
Cum
ulat
ive
distr
ibut
ion
User throughput (bps)
With hybrid ARQ(Max retransmissions M = 1)
With hybrid ARQ(Max retransmissions M = 3)
Figure G36 Effect of low rate channel coding and required channel coding rate and spreading on user throughput in a multi-cell environment
Next the effect of low rate channel coding together with spreading is evaluated in a multi-cellular environment using system level simulations In the simulations two sets of modulation and coding schemes (MCS) are used one with and one without spreading The first set comprises QPSK with code rate and spreading factor (R Q) = (18 16) (18 8) (18 4) (18 2) (18 1) (14 1) (12 1) (23 1) as
WINNER D210 v10
Page 169 (180)
well as 16-QAM with (R Q) = (12 1) (23 1) and (34 1) The second set includes QPSK with code rate R=12 and 23 as well as 16-QAM with rate R= frac12 23 and frac34
As shown in Figure G36 the user throughput performance is improved by employing the MCS set with low-rate channel coding and spreading compared to those without low-rate channel coding and spreading For example the MCS set with low-rate channel coding and spreading maintains approximately 600 kbps and 750 kbps user throughput at 5 and 10-point of CDF respectively In case of hybrid ARQ with more than one retransmission however the benefit of low rate channel coding and spreading is negligible
G73 Comparison of FDMA and TDMA based resource partitioning among BS
Simulation Assumptions Simulator Link level Scenario wide area cellular frequency reuse 7 single antenna BS and UT Channel modelling WSSUS Rayleigh fading with exponential power delay profile
Okumara-Hata path loss model Interference modelling AWGN Cell radius Up to 2 km OFDM parameter 512 used subcarriers subcarrier distance 390625 kHz guard period 64 micros MCS QPSK FEC no coding Mobile speed 30 kmh same for all mobiles - results in almost perfect link adaptation
In a wide area OFDM cellular systems even with perfect inter-cell time synchronisation time offsets between users in different cells due to propagation delays induce significant inter-cell interference This appears in form of inter-carrieradjacent band interference if different cells are assigned adjacent portions of the available bandwidth eg in a block-FDMA fashion and in form of inter-symbol interference if different cells are assigned the whole transmission bandwidth in successive periods of time eg slot-TDMA In order to avoidreduce such interference guard bands and guard periods can be introduced in FDMA and in TDMA respectively The aim of this analysis is that of deriving which of the two approaches is the most spectrally efficient under currently envisaged system parameters and requirements
In a first step the performance degradation due to time offsets in block FDMA inter-cell allocation with and without guard bands is evaluated A worst case scenario is considered in which there are only two cells and two users which are assigned interleaved blocks of adjacent subcarriers Moreover equal receive power and time offsets up to frac12 OFDM symbol are assumed Results are reported in Figure G37 left plot in terms of uncoded BER (rawBER) for blocks of 8 and 64 subcarriers at different values of time offsets ranging from 5 micros to 16micros (cell radius of 15 and 48 km respectively) It can be inferred that there is high performance degradation when the time offset is equal to or higher than the guard interval For some time offsets the rawBER curve saturates before 10-2 As it is reasonably expected significantly better performance is obtained with larger block size because the effect of inter-carrier interference is larger at the block border Hence for smaller blocks almost all subcarriers might be interfered
A better overview is offered by Figure G37 left plot which compares the dependency of the SNR degradation on the different values of time offsets The SNR degradation has been computed at a rawBER of 10-177 corresponding to coded BER of 10-3 which represents the considered QoS criterion for VoIP The SNR degradation for the block size of 8 subcarriers is visibly much higher than for blocks of 64 subcarriers At a time offset of 6 micros we have a loss in power efficiency of 12 dB39 Figure G37 right plot shows the comparison of SNR degradation with and without guard bands The introduction of guard sub-bands leads to a significant improvement For time offsets larger than 5micros in particular the SNR degradation saturates
To compare the spectral efficiency of the two inter-cell allocation schemes the power efficiency loss in the block-FDMA case has to be translated into a figure of spectral efficiency loss Given the not too high values involved we can resort to a simple rule of thumb derived from 2G and 3G experience according to which a 45 dB loss in power efficiency corresponds to 50 spectral efficiency loss In Table G2 results
39 Note that for block size of 8 sub-carriers the SNR degradation curve has not been plotted for time offset values larger than 6 micros since the rawBER curve saturates before reaching the value corresponding to the required QoS
WINNER D210 v10
Page 170 (180)
in terms of power and spectral efficiency loss are reported for block-FDMA with blocks of 64 subcarriers for cell radius of 2 km and reuse factor 7 with and without guard bands of 8 subcarriers
0 5 10 15 20 25 30
10-3
10-2
10-1
100
SNR [dB]
raw
BE
R
Block of 8 and 64 subcarriers QAM4
8-Sc t shift 08-Sc t shift 100 = 5us8-Sc t shift 120 = 6us8-Sc t shift 320 = 16us64-Sc t shift 064-Sc t shift 100 = 5us64-Sc t shift 120 = 6us64-Sc t shift 320 = 16us
0 5 10 15 20 25 30-2
0
2
4
6
8
time offset [micros]
SN
R d
egra
datio
n [d
B]
Block of 64 8 guard ScBlock of 64 no guard ScBlock of 8 no guard Sc
Figure G37 left plot raw BER for different sizes of block of subcarriers and different values of time offsets right plot Dependency of SNR degradation on time offset for block of 8 subcarriers
and for block of 64 subcarriers with and without guard band
In slot-TDMA the insertion of guard periods between any pair of time-slots assigned to different cells represents an overhead which induces spectral efficiency loss and can be computed as follows The total time consumed as guard time is given by the number of time slots multiplied by the length of the guard period that is at least equal to the maximum time offset For TDD and HD-FDD the number of time slots assigned to different cells is 2 times the reuse factor The maximum time offset to be taken into account depends on the considered scenario For example with reuse factor 16 in a macro-cellular deployment scenario with antennas above rooftop the link of interest can be affected by interference from the second ring of interfering cells which implies a propagation delay corresponding to four times the cell radius The resulting overhead is then given by the ratio between the total guard time and the frame duration Results are reported in Table G3 for different reuse factors
Table G2 Power and spectral efficiency loss for block-FDMA with blocks of 64 subcarriers with reuse factor 7 with and without guard bands of 8 subcarriers
Reuse Factor Additional Guard Bands Overhead []
Power Efficiency Loss [dB]
Spectral Efficiency Loss []
Total Loss []
7 0 628 698 698 7 125 180 201 326
Table G3 Overhead due to guard periods in slot-TDMA with reuse factor 5 and 7
Reuse Factor Frame Length [ms]
Number of Time Slots
Total Guard Time [micros]
Overhead []
5 07 10 133 19 7 07 14 186 gt100
From simulation results it can be derived that it would be recommended to assign blocks of at least 64 adjacent subcarriers to different cells in order to keep the performance degradation to a reasonable level (up to 1 dB) For a reuse factor 7 and cell radius of 2 km the spectral efficiency would be doubled through the insertion of guard bands of eight subcarriers Moreover it has been explained how the use of the slot-TDMA inter-cell allocation approach is restricted by the assumption of very short frame length For the currently assumed frame length of 07 ms the overhead due to the insertion of guard periods could result to be unacceptable (larger than 100 for reuse factor 7) Since the overhead depends on the number of slots which is determined by the reuse factor a reuse factor up to 6 would be acceptable while for reuse factors larger or equal to 7 it would be preferable to use block-FDMA
We note that although the results of this section have been derived under the assumption of reuse factor larger than 1 they remain valid in case of single-frequency network with interference-avoidance-based
WINNER D210 v10
Page 171 (180)
dynamic resource management Indeed in the latter case a reuse factor is implicitly implied by the size of the smallest resource units assigned to different cells
G74 Comparison of conventional and self-organised RRM in cellular networks
Simulation Assumptions Simulator System level Scenario Short range cellular frequency reuse 1 single antenna BS and UT Channel modelling Generic channel model including path loss + shadow fading Interference modelling Inter-cell interference 49-cell network (wrap-around) Cell radius 300 m Link adaptation Adaptive MCS selection based on estimated SINR values MCS BPSK QPSK 16QAM 64QAM 256QAM all with 12 coding rate FEC Convolutional coding (133 171)oct with memory 6 codeword length 2160 Type of feedback Only in link setup phase measured signal power resource candidate with
corresponding interference values Feedback delay 1 frame Overhead 1 OFDM symbol per frame Mobile speed Stationary
Instead of the conventional frequency planning a self-organised radio resource management (SO-RRM) scheme has been proposed for WINNER There is no pre-planning on frequency bands The whole bandwidth is accessible anywhere Each BS based on the ULDL signal power and interference values measured at both the BS and the UT does the resource allocation independently There is no direct communication between BSs The resources with highest possible SINR values are allocated to the new UT and suitable PHY modes are selected in accordance with those values
With the SO-RRM scheme a very flexible resource allocation can be realised which means an adaptive reuse distance is implied based on the respective interference situation of each resource in the network This scheme also facilitates high bandwidth efficiency in the hotspot case
Anti-dropping solutions
The long-term interference situation of a user changes when a new co-channel interferer is accepted into the network A BS accepts a new UT when the observed ULDL SINR is sufficient for the required transmission Meanwhile it introduces a new interferer to the network The updated interference at an existing UT may violate the requirements of its current PHY mode for transmission which results in a potential dropping In most systems the dropping rate dominates the system capacity
Two alternative solutions can be adopted against the dropping
- ldquoReallocationrdquo as a passive way that the scheduling algorithm reacts when channel degradation is observed during data transmission When a reallocation is activated new resources are allocated by implementing the similar procedure for new users
- ldquoSecurity Marginrdquo as an alternative active method The main idea of this method is to add a security margin into the threshold for the MCS selection in order to increase the tolerance for the possible degradation of SINR which is caused by new interferers The value of such a security margin depends on many aspects Generally a low margin does not help much in the dropping performance while a high margin achieves a large tolerance at the cost of efficiency Therefore a balance should be made
Comparison between SO-RRM and conventional RRM
A 49-cell network is considered The ldquowrap aroundrdquo technique [80220-05] is implemented in order to allow data collection from all cells within the network For the system level simulation the channel is assumed time invariant Each user has the same date rate and BLER requirements
A simulation starts with a blank system Users arrive at the network one by one whose locations follow a predefined distribution The BS starts the resource allocation scheme and allocates suitable resources to the UT A blocking occurs when a BS cannot find sufficient resources to serve its new UT A dropping occurs when a current transmission is destroyed be a new UT which means either the security margin is insufficient when the active anti-dropping solution is applied or the reallocation of resources fails in the case of the passive anti-dropping solution The ldquoSystem Capacityrdquo is used as the criterion of system level performance A system capacity of N is defined as that a blocking or dropping in the system happens at the first time when the (N+1) UT joins the network
WINNER D210 v10
Page 172 (180)
Both uniform and non-uniform distributions of users are considered In the non-uniform case a hotspot is defined in the central cell Inside each cell the users are always uniformly distributed A ldquohotspot fractionrdquo ρ is defined to quantitatively describe the user distribution as the number of users in the hotspot cell relating to the number of users in all cells
Comparison between SO-RRM and conventional RRM The performances of five schemes are plotted in Figure G38 The ldquooptimised security marginrdquo means that the applied margin is chosen with which the system has the highest capacity Generally it can be concluded from the results that the SO-RRM is better than the conventional RRM at the same situation The latter has good performance for uniform user distribution However its inflexibility induces a remarkable loss of spectrum efficiency with non-uniform user distribution where not all resources are accessible when many users are out of service
With the SO-RRM all resources are accessible in each cell It shows its robustness to the variance of user distribution In the cases where there are no anti-dropping solutions applied or the security is applied the performance of SO-RRM has a performance close to the conventional RRM with a uniform-like user distribution However with higher fraction of users located at the hotspot cell the flexibility of SO-RRM starts showing its efficiency When all users are located in the hotspot a 7 times higher number of users can be served
It is also observed that reallocation improves the system capacity with any user distribution In a system with uniform user distribution an increase of 60 can be achieved A passive solution gains at the cost of reallocation efforts This benefit decreases when the hotspot fraction gets higher which means a low necessity of reallocation
0 02 04 06 08 10
100
200
300
400
500
600
700
Hotspot Fraction ρ
Sys
tem
Cap
acity
SO-RRM with reallocationSO-RRM with optimized security marginSO-RRM without anti-droppingConventional RRM with optimized security marginConventional RRM without anti-dropping
Figure G38 Comparison of system performances with different RRM schemes
The effect of a security margin varies for different user distribution and different resource management schemes In a system with uniform user distribution or a system with low hotspot faction the margin is effective in the performance improvement However when the fraction of users in the hotspot increases the margin brings less improvement and even lowers the system capacity In a system with a high hotspot fraction the probability of a new user located outside the central cell is very low That is it happens rarely that an existing transmission suffers from an outage that is caused by the new co-channel interferer In this situation the security margin is only an obstacle
G75 VAA technology with adaptive pre-selection aided by MC-OLSR protocol
Simulation Assumptions Simulator Combined system and link level simulator Scenario Short range using virtual antenna arrays MT = 1 MR = 1 cell radius = 320 m
mobile speed 5 kmh VAA size = 2 Channel modelling B1 clustered delay line Interference modelling no inter-cell interference MCS 1 QPSK FEC no
WINNER D210 v10
Page 173 (180)
This issue was analysed in context of radio resource control and management and more specifically the optimum pre-selection and assignment of the relay nodes at the system level for the purposes of enhancing the space-time coded cooperative transmission with the use of virtual antenna arrays (VAA) [DGA04] at the link level was investigated To this end the MC-OLSR protocol enhanced with cooperative relaying was exploited and this work was performed on the basis of the Adaptive approach to antenna selection and space-time coding analysed in [WIND24] and the Multi-Constrained Optimised Link State Routing protocol (MC-OLSR) proposed in [WIND31] and [WIND32] respectively In the example depicted in Figure G39 VAA is constituted by RN 1 and RN 2 whereas the nodes 0 (BS) and 9 (UT) are the source and destination ones respectively
The performance comparison between the conventional and the space-time coded cooperative transmission with the use of virtual antenna arrays when the adaptive pre-selection mechanism aided by the MC-OLSR protocol is active is presented in Figure G39 There is a noticeable improvement in the region of higher SNR values however the BER curves start more or less from the same point The reason for this situation is that if there are transmission errors between the BS and the first-hop RNs they propagate and diminish the performance of the cooperative transmission during the second hop This proves the necessity for further joint cross-layer optimisation
0
2
22
1
3 4
5
6 7
8
9
10
11 12 13
23
14
15
16
17
18
19 20 21
24
0 10 20 3010-5
10-4
10-3
10-2
10-1
100
SNR [dB]
BE
R
CONV MC-OLSRVAA MC-OLSR
Figure G39 Space-time coded VAA technology ndash scenario and performance
WINNER D210 v10
Page 174 (180)
References [3GPP-TR25212] 3GPP TSG RAN ldquoHigh speed downlink packet access Physical layer aspectsrdquo TR
25212
[3GPP-WG142] 3GPP TSG RAN WG142 ZTE CATT RITT Huawei ldquoComparison of Structured LDPC Codes and 3GPP Turbo-Codesrdquo R1-050840
[3GPP-TS25331] 3GPP TS 25331 RRC Protocol Specification
[3GPP-TR25891] 3GPP TR 25891 ldquoImprovement of RRM across RNS and RNSBSS (post-Rel-5)rdquo Release 6 v030 (draft version) 22003
[80211n04] IEEE 80211n ldquoStructured LDPC Codes as an Advanced Coding Scheme for 80211nrdquo IEEE Doc 80211-04884r0 August 2004
[80211n-05] IEEE doc 80211-05150r1 ldquoWWiSE IEEE 80211n Proposalrdquo 2005
[80216-04] IEEE Std 80216-2004 ldquoAir Interface for Fixed Broadband Wireless Access Systemsrdquo
[80216e-05] IEEE doc 80216e-05006r2 ldquoLDPC coding for OFDMA PHYrdquo available online from httpwwwieee802org16tge
[80216e05b] IEEE P80216eD8 2005 ldquoAir Interface for Fixed and Mobile Broadband Wireless Access Systemsrdquo
[80220-05] ldquoIEEE 80220 Evaluation Criteriardquo September 2005
[Ace05] M Acentildea S Pfletschinger ldquoA computationally efficient algorithm for throughput maximization in OFDMArdquo 10th International OFDM-Workshop Hamburg Germany Aug-Sept 2005
[AN05] IST-Project IST-2002-507134 ldquoAmbient Networksrdquo httpwwwambient-networksorg
[AY05] A Adinoyi and H Yanikomeroglu ldquoPractical cooperative communication through fixed relaysrdquo accepted to Wireless World Radio Forum December 2005
[BBB+99] J J Beek P Boumlrjesson M L Boucheret D Landstroumlm J Arenas P Oumldling C Oumlstberg M Wahlqvist and S Wilson ldquoA Time and Frequency Synchronization Scheme for Multi-user OFDMrdquo IEEE Journal of Selected Areas on Communications vol 17 pp 1900-1914 Nov 1999
[BCK03] A Bourdoux B Come N Khaled ldquoNon-reciprocal transceivers in OFDMSDMA systems Impact and mitigationrdquo RAWCON 2003 Boston August 2003
[Bin90] J A C Bingham ldquoMulticarrier modulation for data transmission an idea whose time has comerdquo IEEE Communications Magazine Vol 28 pp 5-14 May 1990
[BM04] G Barriac U Madhow ldquoSpace Time Communication for OFDM with Implicit Channel Feedbackrdquo IEEE Trans on Information Theory vol 50 pp3111-3129 Dec 2004
[Bon04] T Bonald ldquoA score-based opportunistic scheduler for fading radio channelsrdquo European Wireless Conference Barcelona Feb 2004
[BR04] L Bazzi and T J Richardson ldquoExact Thresholds and Optimal Codes for the Binary-Symmetric Channel and Gallagerrsquos Decoding Algorithm Ardquo IEEE Trans on Info Theory vol 50 no 9 Sept 2004
[BSB97] J J Beek M Sandell and P Boumlrjesson ldquoML estimation of time and frequency offset in OFDM systemsrdquo IEEE Transactions in Signal Processing vol 45 pp 999-1008 July 1997
[Cam98] J Campello ldquoOptimal discrete bit loading for multicarrier modulation systemsrdquo Proceedings of International Symposium on Information Theory p 193 August 1998
[Cam99] J Campello ldquoPractical bit loading for DMTrdquo Proceedings of ICC 99 Vancouver Canada pp 801-805 June 1999
WINNER D210 v10
Page 175 (180)
[CCB95] P S Chow J M Cioffi J A C Bingham ldquoA practical discrete multitone transceiver loading algorithm for data transmission over spectrally shaped shannelsrdquo IEEE Trans Commun Vol 43 pp 773-775 April 1995
[CENELEC01] EN 50360 ldquoProduct standard to demonstrate the compliance of mobile phones with basic restrictions related to human exposure to electromagnetic fields (300 MHz - 3 GHz)rdquo European Committee for Electrotechnical Standardization (CENELEC) July 2001
[CENELEC02] EN 50385 ldquoProduct standard to demonstrate the compliance of radio base stations and fixed terminal stations for wireless telecommunication systems with the basic restrictions or the reference levels related to human exposure to radio frequency electromagnetic fields (110 MHz - 40 GHz) - General publicrdquo European Committee for Electrotechnical Standardization (CENELEC) European Standard August 2002
[CEO02] G Cherubini E Elefthriou and S Oelcer ldquoFiltered Multi Tone Modulation for very High Speed Digital Subscriber Linesrdquo IEEE Journ On Select Areas on Commun vol 20 n5 pp 1016-1028 June 2002
[CF02] J Chen and MPC Fossorier ldquoNear Optimum Universal Belief Propagation Based Decoding of Low-Density Parity Check Codesrdquo IEEE Transactions on Communications Vol 50 No 3 March 2002
[CFO+03] E Costa A Filippi S Ometto M Weckerle E Schulz ldquoAsynchronous uplink transmis-sion in FMT-FDMA systemsrdquo in Proc IEEE International Symposium on Personal Indoor and Mobile Radio Communications (PIMRC) Bejing China 2003
[ChC00] M Chang K-C Chen ldquoFrequency-Domain Approach to Multiuser Detection in DS-CDMArdquo IEEE Comm Letters vol 4 no 11 pp 331-333 Nov 2000
[CSB05] E Costa P Slanina V Bochnicka E Schulz G Spano Greco Downlink based Intra- and Inter-cell Time and Frequency Synchronisation in OFDM Cellular Systems Proceedings of World Wireless Congress 2005 San Francisco May 2005
[DAO05] M Doumlttling D Asteacutely and M Olsson ldquoA Multi-User Spatial Domain Link Adaptation Concept for Beyond 3G Systemsrdquo ProcPIMRC 2005 Berlin Germany September 2005
[DFL+04] R Dinis D Falconer Chan Tong Lam et al ldquoA Multiple Access Scheme for the Uplink of Broadband Wireless Systemsrdquo Globecom 2004
[DGA04] M Dohler A Gkelias H Aghvami ldquoA Resource Allocation Strategy for Distributed MIMO Multi-Hop Communication Systemsrdquo IEEE Communications Letters Volume 8 Issue 2 February 2004 pp 99-101
[DVB00] Interaction channel for satellite distribution systems ETSI EN 301 790 V122 pp 21-24 Dec 2000
[Ekm02] T Ekman Prediction of Mobile Radio Channels Modelling and Design PhD Th Signals and Syst Uppsala UnivhttpwwwsignaluusePublicationsabstractsa023html
[ER01] A Ebner and H Rohling A Self-Organized Radio Network for Automotive Applications Proceedings of the 8th World Congress on Intelligent Transport Systems Sydney Australia October 2001
[Eri04] NC Ericsson Revenue Maximization in Resource Allocation Applications in Wireless Communication Networks PhD Thesis Signals and Systems Uppsala Univ Oct 2004 httpwwwsignaluusePublicationsabstractsa043html
[FSE+04] S Falahati A Svensson T Ekman and M Sternad Adaptive modulation systems for predicted wireless channels IEEE Trans on Communications vol 52 Feb 2004 pp 307-316
[FA02] David D Falconer and S Lek Ariyavisitakul Broadband Wireless Using Single Carrier and Frequency Domain Equalization Proceedings WPMC 2002 pp 27 - 36 vol1 Honolulu USA Oct 2002
WINNER D210 v10
Page 176 (180)
[FCS04] A Filippi E Costa E Schulz ldquoLow Complexity Interleaved Sub-carrier Allocation in OFDM Multiple Access Systemsrdquo in Proc IEEE VTCrsquo04 Los Angeles California USA Sept 2004
[FDGH05a] M Fuchs G Del Galdo and M Haardt A novel tree-based scheduling algorithm for the downlink of multi-user MIMO systems with ZF beamforming In Proc IEEE Int Conf Acoust Speech Signal Processing(ICASSP) volume 3 pages 1121ndash1124 Philadelphia PA March 2005
[FDGH05b] M Fuchs G Del Galdo and M Haardt Low complexity space-time-frequency scheduling for MIMO systems with SDMA Submitted to IEEE Transactions on Vehicular Technology September 2005
[FH96] R F H Fischer J B Huber ldquoA new loading algorithm for discrete multitone transmissionrdquo Proceedings of GLOBECOM 96 London UK pp 724-728 November 1996
[FK05] D Falconer S Kaiser editors ldquoBroadband frequency Domain-Based Air Interfaces for Future-Generation Wireless Systemsrdquo WWRF Working Group 4 White Paper Version 016 Feb 18 2005
[GA93] Mohinder S Grewal and Angus P Andrews (1993) ldquoKalman Filtering Theory and Practicerdquo Upper Saddle River NJ USA Prentice Hall
[Gal63] R G Gallager ldquoLow-Density Parity-Check codesrdquo PhD Thesis Cambridge
[GBD03] F Guilloud E Boutillon and J-L Danger ldquoλ-Min Decoding Algorithm of Regular and Irregular LDPC Codesrdquo 3rd International Symposium on Turbo-Codes amp Related Topics
[GRC02] D Galda H Rohling E Costa H Haas E Schulz ldquoA Low Complexity Transmitter Structure for OFDM-FDMA Uplink Systemsrdquo in Proc VTC Spring 2002 pp 1737-1741 2002
[HBD00] JS Hammerschmidt C Brunner C Drewes Eigenbeamforming - a novel concept in array signal processing Proc VDEITG European Wireless Conference DresdenGermany Sept 2000
[HP98] Guidelines for limiting exposure to time-varying electric magnetic and electromagnetic fields (up to 300 GHz) International Commission on Non-Ionizing Radiation Protection Health Physics vol 74 no 4 pp 494-522 April 1998
[Hug91] D Hughes-Hartogs ldquoEnsemble modem structure for imperfect transmission mediardquo US Patent No 5054034 October 1991
[IN05] C Ibars M Navarro Reduced complexity iterative multiuser detector for beyond 3G CDMA systems IST Mobile amp Communication Summit 2005 (IST 2005) Dresden (Germany) June 19-23 2005
[JB03] E A Jorswieck and H Boche ldquoTransmission Strategies for the MIMO MAC with MMSE Receiver Average MSE Optimization and Achievable Individual MSE Regionrdquo IEEE Trans On Signal Processing vol 51 pp 2872-2881 Nov 2003
[JDL+04] JP Javaudin C Dubuc D Lacroix M Earnshaw An OFDM Evolution to the UMTS High Speed Downlink Packet Access in Proc of VTC Fall 2004 Los Angeles USA 26-29 September 2004
[JFH+05] V Jungnickel A Forck T Haustein SSchiffermuumlller C von Helmolt F Luhn M Pollock C Juchems M Lampe S Eichinger W Zirwas E Schulz ldquo1 Gbits MIMO-OFDM Transmission Experimentsrdquo Proc IEEE VTC Fall 2005 Dallas Texas
[JVS+03] C Jones E Valles M Smith and J Villasenor ldquoApproximate-Min Constraint Node Updating for LDPC Code Decodingrdquo IEEE MILCOM 2003
[KBLS06] T T Kim M Bengtsson E G Larsson and M Skoglund ldquoCombining Short-Term and Long-Term Channel State Information over Correlated MIMO Channelsrdquo Submitted to ICASSP 2006
WINNER D210 v10
Page 177 (180)
[KF98] F R Kschischang B J Frey ldquoIterative Decoding of Compound Codes by Probabilistic Propagation in Graphical Modelsrdquo Journal on Select Areas Commun pp 219-230 1998
[KLF01] Y Kou S Lin and M Fossorier ldquoLow Density parity-check codes based on finite geometries A rediscovery and morerdquo IEEE Trans Inform Theory vol 47 pp 2711-2736 Nov 2001
[LC02] D Lee and K Cheun ldquoCoarse Symbol Synchronization Algorithms for OFDM Systems in Multipath Channelsrdquo IEEE Communication Letters pp 446-448 Vol 6 no 10 Oct 2002
[LGA01] D Lacroix N Goudard M Alard OFDM with guard interval versus OFDMOffsetQAM for high data rate UMTS downlink transmission in Proc of VTC Fall 2001 October 2001 Atlantic City USA
[LHYT01] Y Liu R Hoshyar X Yang R Tafazolli Joint Routing and Packet Scheduling for Enhanced Uplink UTRA-FDD with Fixed Relay Stations in Proc IEEE Vehicular Technology Conference Dallas Texas USA September 2005
[LHYT02] Y Liu R Hoshyar X Yang R Tafazolli An Integrated Radio Resource Allocation Framework for Enhanced Uplink UTRA-FDD with Fixed Relay Stations 14th IST Mobile and Wireless communications Summit Dresden Germany June 2005
[LWB+02] D Landstroumlm S K Wilson J-J van de Beek P Oumldling and PO Bjoumlrjesson ldquoSymbol time offset estimation in coherent OFDM Systemsrdquo IEEE Transactions on Communications vol 50 pages 545-549 Apr 2002
[LWZ04] Y Liu T Weber W Zirwas Uplink performance investigations of the service area basd beyond 3G system JOINT in Proc Kleinheubacher Berichte Kleinheubach Germany October 2004 MS No KH2004-A-0051
[LZ05] T Lestable and E Zimmermann ldquoLDPC Codes Options for Next Generation Wireless Systemsrdquo Wireless World Research Forum (WWRF) WG5 San-Diego 2005
[MB01] Y Mao A H Banihashemi ldquoDecoding Low-Density Parity-Check Codes with Probabilistic Schedulingrdquo Comm Letters 5415-416 Oct 2001
[MBL+05] M Muck P Bernardin P Labbe X Miet D Pannicke and J Schoenthier ldquoPrototyping of a hybrid 5GHz60GHz OFDM WLAN system in the framework of IST-BroadWayrdquo Wireless World Research Forum 13th meeting Mar 2-3 2005 Jeju Island Korea
[MCD05] M Muck M de Courville P Duhamel rdquoA Pseudo Random Postfix OFDM modulator - Semi-blind channel estimation and equalizationrdquo accepted by IEEE Transactions on Signal Processing 2005
[MKK+05] N Maeda T Kataoka H Kawai K Higuchi J Kawamoto M Sawahashi ldquoExperiments on Real-Time 1-Gbps Packet Transmission Using Antenna-Independent AMC in MIMO-OFDM Broadband Packet Radio Accessrdquo Proc IEEE VTC Fall 2005 Dallas Texas
[MS02] M M Mansour and N R Shanbhag ldquoLow-Power VLSI Decoder Architectures for LDPC Codesrdquo IEEE ISLPED 2002
[MY05] S Myung and K Yang ldquoA Combining Method of Quasi-Cyclic LDPC Codes by The Chinese Remainder Theoremrdquo IEEE Comm Letters Vol9 N9 Sept 2005
[MYK05] S Myung K Yang and J Kim ldquoQuasi-Cyclic LDPC Codes for Fast Encodingrdquo IEEE Trans on Info Theory August 2005
[OJEC99] 1999519EC EU Council Recommendation of 12 July 1999 on the limitation of exposure of the general public to electromagnetic fields (0 Hz to 300 GHz) Official Journal of the European Communities July 1999
[OY03] J-E Oh K Yang ldquoSpace-time codes with full antenna diversity using weighted nonbi-nary repeat-accumulate codesrdquo IEEE Trans Commun vol 51 pp 1773ndash1778 Nov 2003
WINNER D210 v10
Page 178 (180)
[Pfl05] S Pfletschinger ldquoFrom cell capacity to subcarrier allocation in multi-user OFDMrdquo IST Mobile amp Wireless Communications Summit Dresden (Germany) 19 ndash 23 June 2005
[PI05] S Pfletschinger and C Ibars ldquoFrom cell capacity to subcarrier allocation in OFDMArdquo submitted to European Transactions on Telecommunications Sept 2005
[Rap91] C Rapp ldquoEffects of HPA-Nonlinearity on a 4-DPSKOFDM Signal for a Digital Sound Broadcasting Systemrdquo Proc 2nd European Conf on Satellite Comms Liege Oct 1991 pp 179-184
[RM00] D M Rowitch LB Milstein ldquoOn the performance of hybrid FECARQ systems using rate compatible punctured Turbo (RCPT) codesrdquo IEEE Trans on Comm vol 48 no 6 pp 948-958 June 2000
[SA03] M Sternad and D Aronsson ldquoChannel estimation and prediction for adaptive OFDM downlinks IEEE VTC 2003-Fall Orlando October 2003
[SD01] A Stefanov T Duman ldquoTurbo-coded modulation for systems with transmit and receive antenna diversity over block fading channels System model decoding approaches and practical considerationsrdquo IEEE J Select Areas Commun vol 19 no 5 pp 958ndash968 May 2001
[SEA01] M Sternad T Ekman and A Ahleacuten ldquoPower prediction on broadband channelsrdquo IEEE Vehicular Technology Conference VTC01-Spring Rhodes Greece May 6-9 2001
[SFF+99] M Speth S Fechtel G Fock and H Meyr ldquoOptimum Receiver Design for Wireless Broadband Systems Using OFDM-Part Irdquo IEEE Transactions on Communications vol 47 pp 1668-1677 Nov 1999
[SF04] M Sternad S Falahati ldquoMaximizing throughput with adaptive M-QAM based on imperfect channel predictionsrdquo IEEE PIMRC 2004 Barcelona Sept 2004
[SFS05] M Sternad S Falahati T Svensson and D Aronsson rdquoAdaptive TDMAOFDMA for wide-area coverage and vehicular velocitiesrdquo IST Summit Dresden July 2005
[SGF95] Johan Skoumlld Bjoumlrn Gudmundson Jan Faumlrjh ldquoPerformance and Characteristics of GSM-based PCSrdquo VTC 1995
[SU05] A Soysal and S Ulukus ldquoTransmit Directions and Optimality of Beamforming in MIMO-MAC with Partial CSI at the Transmittersrdquo Proc of CISS Jan 2005
[SW02] A Springer R Weigel The Physical Layer of the Universal Mobile Telecommunications System Berlin Heidelberg New York Springer 2002
[SWW+04] E Schulz M Weckerle T Weber M Meurer The OFDM based beyond 3G air inter-face JOINT featuring interference reduction by joint detection and joint transmission in Proc 8th WWRF Meeting Beijing China Feb 2004 pp 1-11
[TB04] S Tomasin and N Benvenuto ldquoA Reduced Complexity Block Iterative DFE for Dispersive Wireless Applicationsrdquo Proc VTC 2004 fall pp 1693-1697
[THB04] J Tousch M-H Hamon and J Benko ldquoTurbo-Codes Complexity Estimatesrdquo IEEE 80211n Proposal 1385-r1 Nov 2004
[Tse98] DNC Tse and SV Hanly ldquoMultiaccess fading channelsmdashPart I Polymatroid structure optimal resource allocation and throughput capacitiesrdquo IEEE Trans Information Theory vol 44 no 7 pp 2796-2815 Nov 1998
[Vai92] PP Vaidjanathan Multirate Systems and Filter Banks Englewood Cliffs NJ Prentice Hall
[VF00] J Vogt and A Finger ldquoImproving the Max-Log-MAP turbo decoderrdquo IEEE Electronincs Letters vol 36 no 23 pp 1937ndash1939 2000
[VH04] V Stankovic and M Haardt ldquoMulti-user MIMO downlink precoding for users with multiple antennasrdquo in Proc Of the 12-th Meeting of the Wireless World Research Forum (WWRF) Toronto Canada Nov 2004
WINNER D210 v10
Page 179 (180)
[VH05a] V Standovic and M Haardt ldquoMulti-user MIMO downlink beamforming over correlated MIMO channelsrdquo in Proc International ITGIEEE Workshop on Smart Antennas (WSA05) Duisburg Germany April 2005
[VH05b] V Stankovic and M Haardt ldquoImproved diversity on the uplink of multi-user MIMO systemrdquo in Proc European Conference on Wireless Technology (ECWT 2005) Paris France October 2005
[VTL02] P Viswanath DNC Tse and R Laroia ldquoOpportunistic beamforming using dumb antennasrdquo IEEE Transactions on Information Theory vol 48(6) June 2002
[WER03] L Wischhof A Ebner H Rohling M Lott and R Halfmann SOTIS -A Self-Organizing Traffic Information System Proceedings of the 57th IEEE Vehicular Technology Conference (VTC 03 Spring) Jeju Korea 2003
[Win84] JH Winters ldquoOptimum Combining in Digital Mobile Radio with Cochannel Interferencerdquo in IEEE Journal on Selected Areas in Communications Vol SAC-2 No 4 July 1984
[WIND21] IST-2003-507581 WINNER ldquoD21 Identification of Radio-Link Technologiesrdquo June 2004
[WIND22] IST-2003-507581 WINNER ldquoD22 Feasibility of multi-bandwidth transmissionsrdquo October 2004
[WIND23] IST-2003-507581 WINNER ldquoD23 Assessment of Radio-Link Technologiesrdquo February 2005
[WIND24] IST-2003-507581 WINNER ldquoD24 Assessment of adaptive transmission technologiesrdquo February 2005
[WIND25] IST-2003-507581 WINNER ldquoD25 Duplex arrangements for future broadband radio interfacerdquo October 2004
[WIND26] IST-2003-507581 WINNER ldquoD26 Assessment of multiple access technologiesrdquo October 2004
[WIND27] IST-2003-507581 WINNER ldquoD27 Assessment of Advanced Beamforming and MIMO Technologiesrdquo February 2005
[WIND31] IST-2003-507581 WINNER ldquoD31 Description of identified new relay based radio network deployment concepts and first assessment of comparison against benchmarks of well known deployment concepts using enhanced radio interface technologiesrdquo Oct 2004
[WIND32] IST-2003-507581 WINNER ldquoD32 Description of identified new relay based radio network deployment concepts and first assessment by comparison against benchmarks of well known deployment concepts using enhanced radio interface technologiesrdquo February 2005
[WIND35] IST-2003-507581 WINNER ldquoD35 Proposal of the best suited deployment concepts chosen for the identified scenariosrdquo December 2005
[WIND41] IST-2003-507581 WINNER ldquoD41 Identification and definition of cooperation schemes between RANs ndashfirst draftrdquo June 2004
[WIND42] IST-2003-507581 WINNER ldquoD42 Impact of cooperation schemes between RANs ndashfirst draftrdquo February 2005
[WIND43] IST-2003-507581 WINNER ldquoD41 Identification and definition of cooperation schemes between RANs ndashfinal deliverablerdquo June 2005
[WIND44] IST-2003-507581 WINNER ldquoD44 Impact of cooperation schemes between RANs ndash final deliverablerdquo November 2005
[WIND54] IST-2003-507581 WINNER ldquoD54 Final Report on Link Level and System Level Channel Modelsrdquo September 2005
WINNER D210 v10
Page 180 (180)
[WIND63] IST-2003-507581 WINNER ldquoD63 WINNER Spectrum Aspects Assesment reportrdquo December 2005
[WIND71] IST-2003-507581 WINNER ldquoD71 System requirementsrdquo July 2004
[WIND72] IST-2003-507581 WINNER ldquoD72 System Assessment Criteria Specificationldquo July 2004
[WIND76] IST-2003-507581 WINNER ldquoD76 WINNER System Concept Descriptionrdquo October 2005
[WOSS05] Wei Wang Tony Ottosson Tommy Svensson Arne Svensson Mikael Sternad rdquoEvaluations of a 4G Uplink System Based on Adaptive Single-Carrier TDMArdquo Proceedings IEEE Vehicular Technology Conference Fall Dallas Texas USA Sep 2005
[YNA01] E Yeo B Nikolie and V Anantharam ldquoHigh Throughput Low-Density Parity-Check Decoder Architecturesrdquo IEEE Globecom 2001
[Yu02] W Yu and JM Cioffi ldquoFDMA capacity of Gaussian multiple-access channels with ISIrdquo IEEE Trans Commun vol 50 no 1 pp 102-111 Jan 2002
[Yu04] W Yu W Rhee S Boyd JM Cioffi ldquoIterative water-filling for Gaussian vector multiple-access channelsrdquo IEEE Trans Information Theory Jan 2004
[ZB04] P Zarrinkhat and A H Banihashemi ldquoThreshold Values and Convergence Properties of Majority-Based Algorithms for Decoding Regular Low-Density Parity-Check codesrdquo IEEE Trans on Comm vol 52 no 12 Dec 2004
[ZF04] J Zhang and M Fossorier ldquoA Modified Weighted Bit-Flipping Decoding of Low-Density Parity-Check Codesrdquo IEEE Comm Letters vol 8 no 3 March 2004
[ZF05] J Zhang M Fossorier lsquoShuffled iterative decodingrsquo IEEE Trans on Comm Vol 53 No 2 February 2005
[ZZ05] H Zhong and T Zhang lsquoBlock-LDPC A Practical LDPC Coding System Design Approachrsquo IEEE Trans on Circ And Syst-I Reg Papers Vol 52 N 4 April 2005

WINNER D210 v10
Page 4 (180)
Authors Partner Name Phone Fax E-mail
AAU Albena Mihovska Phone +45 96358639
Fax +45 98151583
E-mail albenakomaucdk
ACL Thorsten Wild Phone +49 711 821 35762
Fax +49 711 821 32185
E-mail thorstenwildalcatelde
CTH Tommy Svensson Phone +46 31 772 1823
Fax +46 31 772 1782
E-mail tommysvenssons2chalmersse
CTHUU Mikael Sternad Phone +46 704 250 354
Fax +46 18 555096
E-mail mikaelsternadsignaluuse
CTTC Monica Navarro Phone +34 93 645 2915
Fax +34 93 645 2901
E-mail monicanavarrocttces
Stephan Pfletschinger E-mail stephanpfletschingercttces
CU David Falconer Phone +1 613 520 5722
Fax +1 613 520 5727
E-mail ddfscecarletonca
Chan Tong Lam E-mail lamcsangamscecarletonca
Florence Danilo-Lemoine Phone +1 613 520 2600 ext 5691
Fax +1 613 520 5727
E-mail fdaniloscecarletonca
WINNER D210 v10
Page 5 (180)
DLR Armin Dammann Phone +49 8153 28 2871
Fax +49 8153 28 1871
E-mail armindammanndlrde
Simon Plass Phone +49 8153 28 2874
Fax +49 8153 28 1871
E-mail simonplassdlrde
DoCoMo Gunther Auer Phone +49 89 5682 4219
Fax +49 89 5682 4301
E-mail auerdocomolab-eurocom
Jeacuterocircme Bonnet Phone +49 89 5682 4229
Fax +49 89 5682 4301
E-mail bonnetdocomolab-eurocom
EAB David Asteacutely Phone +46 8 585 301 49
Fax +46 8 585 314 80
E-mail davidastelyericssoncom
Johan Axnaumls Phone +46 8 404 38 59
Fax +46 8 585 314 80
E-mail johanaxnasericssoncom
Niklas Johansson Phone +46 8 508 77860
Fax +46 8 7575720
E-mail niklasjJohanssonericssoncom
Goumlran Klang Phone +46 8 404 4794
Fax +46 8 585 314 80
E-mail gorannklangericssoncom
Magnus Olsson Phone +46 8 585 307 74
Fax +46 8 585 314 80
E-mail magnusaolssonericssoncom
Per Skillermark Phone +46 8 58531922
Fax +46 8 7575720
E-mail perskillermarkericssoncom
Kai-Erik Sunell Phone +46 8 757 35 61
Fax +46 8 585 314 80
E-mail kai-eriksunellericssoncom
WINNER D210 v10
Page 6 (180)
FTRampD Marie-Heacutelegravene Hamon Phone +33 2 99 12 48 73
Fax +33 2 99 12 40 98
E-mail mhelenehamonfrancetelecomcom
Rodolphe Legouable E-mail rodolphelegouablefrancetelecomcom
Mylegravene Pischella Phone +33 1 452 98 963
Fax +33 1 452 94 194
E-mail mylenepischellafrancetelecomcom
Thomas Saumllzer E-mail thomassalzerfrancetelecomcom
IBM Pedro Coronel Phone +41 1 724 8532
Fax +41 1 724 8955
E-mail pcozurichibmcom
Wolfgang Schott Phone +41 1 724 8476
Fax +41 1 724 8955
E-mail sctzurichibmcom
KTH Mats Bengtsson Phone +46 8 790 8463
Fax +46 8 790 7260
E-mail matsbengtssons3kthse
LUK Angeliki Alexiou Phone +44 1793 776620
Fax +44 1793 776725
E-mail alexioulucentcom Abdelkader Medles Phone +44 1793 776783
Fax +44 1793 776725
E-mail medleslucentcom
MOT Markus Muck Phone +33 1 6935 2573
Fax +33 1 6935 7701
E-mail MarkusMuckmotorolacom
WINNER D210 v10
Page 7 (180)
NTUA Elias Tragos Phone +302107721511
Fax +302107722534
E-mail etragostelecomntuagr
NOK Carl Eklund Phone +358 50 4836566
Fax +358 7180 36067
E-mail carleklundnokiacom
Kari Kalliojaumlrvi Phone +358 50 4836232
Fax +358 7180 35935
E-mail karikalliojarvinokiacom
Antti Sorri Phone +358 50 4821294
Fax +358 7180 36857
E-mail anttisorrinokiacom
Samuli Visuri Phone +358 50 4868219
Fax +358 7180 36857
E-mail samulivisurinokiacom
NOKCH Yong Teng Phone +86 10 65392828 2753
Fax +86 10 84210576
E-mail yongtengnokiacom
RWTH Ole Klein Phone +49 241 80 28575
Fax +49 241 80 22242
E-mail olekleincomnetsrwth-aachende
Ralf Pabst Phone +49 241 80 25828
Fax +49 241 80 22242
E-mail pabcomnetsrwth-aachende
PRL Keith Roberts Phone +44 1293 815754
Fax +44 1293 815024
E-mail keithrobertsphilipscom
WINNER D210 v10
Page 8 (180)
PUT Zbigniew Dlugaszewski Phone +48 61 665 3916
Fax +48 61 665 2572
E-mail zdlugaszetputpoznanpl
Adam Piatyszek Phone +48 61 665 3936
Fax +48 61 665 2572
E-mail adampiatyszeketputpoznanpl
Michal Wodczak Phone +48 61 665 3913
Fax +48 61 665 2572
E-mail mwodczaketputpoznanpl
SEUK Thierry Lestable Phone +44 1784 428600 Ext720
Fax +44 1784 428624
E-mail thierrylestablesamsungcom
Vaia Sdralia Phone +44 1784 428600
Fax +44 1784 428629
E-mail vaiasdraliasamsungcom
SM Elena Costa Phone +49 89 636 44812
Fax +49 89 636 45591
E-mail elenacostasiemenscom
Martin Doumlttling Phone +49 89 636 73331
Fax +49 89 636 1373331
E-mail martindoettlingsiemenscom
Joumlrn von Haumlfen Phone +49 89 636 46228
Fax +49 89 722 13034834
E-mail joernvon_haefensiemenscom
Eiman Mohyeldin Phone +49 89 636 45340
Fax +49 89 636 45591
E-mail eimanmohyeldinsiemenscom
SMBenQ Mobile Karsten Bruumlninghaus Phone +49 2842 95 1742
Fax +49 2842 95 3387
E-mail karstenbrueninghausbenqcom
WINNER D210 v10
Page 9 (180)
SMRMR Bill lsquoXinqunrsquo Liu Phone +44 1794 833547
Fax +44 1794 833586
E-mail xinqunliurokecouk
David Thomas Phone +44 1794 833431
Fax +44 1794 833433
E-mail davidThomasrokecouk
SMTUB Eduard A Jorswieck Phone +49 30 31002860
Fax +49 30 31002863
E-mail jorseycstu-berlinde
Volker Jungnickel Phone +49 30 31002768
Fax +49 30 31002647
E-mail volkerjungnickelmktu-berlinde
Malte Schellmann Phone +49 30 31002770
Fax +49 30 31002647
E-mail malteschellmanntu-berlinde
Aydin Sezgin Phone +49 30 31002868
Fax +49 30 31002863
E-mail aydinsezginmktu-berlinde
SMTUD Tobias Frank Phone +49 6151 16 3769
Fax +49 6151 16 53 94
E-mail tobiasfranknttu-darmstadtde
SMTUHH Ting Chen Phone +49 40 42878 2165
Fax +49 40 42878 2281
E-mail tchentu-harburgde
Rainer Gruumlnheid Phone +49 40 42878 2166
Fax +49 40 42878 2281
E-mail gruenheidtu-harburgde
WINNER D210 v10
Page 10 (180)
SMUU Stephan Stiglmayr Phone +49 731 50-31531
Fax +49 731 50-31509
E-mail stephanstiglmayre-technikuni-ulmde
TID Emilio Mino Phone +34 91 3374428
Fax +34 91 3374212
E-mail eminotides
TUD Ernesto Zimmermann Phone +49 351 463 34958
Fax +49 351 463 37255
E-mail zimmereifnettu-dresdende
TUI Martin Fuchs Phone +49 3677 69 1156
Fax +49 3677 691195
E-mail martinfuchstu-ilmenaude
Veljko Stankovic Phone +49 3677 69 1156
Fax +49 3677 691195
E-mail veljkostankovictu-ilmenaude
Martin Haardt Phone +49 3677 69 2613
Fax +49 3677 691195
E-mail martinhaardttu-ilmenaude
UniS Mohammad Abaii Phone +44 1483 683609
Fax +44 1483 686011
E-mail MAbaiisurreyacuk
Yajian Liu Phone +44 1483 686015
Fax +44 1483 686011
WINNER D210 v10
Page 11 (180)
UOULU Kari Hooli Phone +358 8 553 2883
Fax +358 8 553 2845
E-mail karihoolieeoulufi
Juha Karjalainen Phone +358 8 553 7637
E-mail JuhaKarjalaineneeoulufi
Zexian Li Phone +358 8 553 2877
E-mail zexianlieeoulufi
WINNER D210 v10
Page 12 (180)
Table of Contents
Terminology Acronyms and Abbreviations 17
Mathematical Symbols and Notation 22
1 Introduction and Radio Interface Structure 23 11 Requirements and design targets 23 12 Key components of the radio interface 24 13 Top-down overview of the WINNER system concept 24
131 Services protocols and design 24 132 System layers modes and parameterisation 26
14 Scope of this document 28
2 Physical Layer 29 21 Forward error correction 29 22 Modulation and space-time-frequency processing 30
221 General resource allocation strategy 30 222 Modulation technique 30 223 Modulation parameters 31 224 Transceiver structure 31 225 Space-time-frequency processing 33
23 Pilot grid design for channel estimation and synchronisation 34 231 Synchronisation 34 232 Channel estimation 35
3 Medium Access Control (MAC) Layer 36 31 Medium access control for FDD and TDD cellular transmission 36
311 Goals and design principles 36 312 Control of relay-enhanced cells 36 313 The MAC services and tasks 37 314 The chunk slot frame and super-frame structure 38 315 Overview of main functions 40 316 Resource mapping and multiple access 42
32 Medium access control for peer-to-peer transmission 43 321 MAC architecture for P2P transmission 43 322 Frame structure of DAC for P2P transmission 44
4 Radio Resource Management (RRM) and Radio Resource Control (RRC) 46 41 RRM functions 46 42 WINNER RRM architecture 48
WINNER D210 v10
Page 13 (180)
43 Radio resource control 49 431 RRC states 49
5 Assessment Overview 51 51 General 51 52 Challenges 51 53 Summary of results ndash performance and complexity 52
531 Analogue RF 52 532 Digital baseband 52 533 Multiple access 55 534 Radio protocols 56
54 Comparison of performance results with requirements and design targets 56
6 Conclusions and Outlook 59
Appendix A Requirements and Design Targets 60 A1 Targets for different scenarios 60
A11 Scenarios 60 A12 Rural area 60 A13 Metropolitan area 61 A14 Local area 61
A2 Additional targets 61 A3 System assumptions 62
Appendix B Physical Layer 63 B1 Spatial processing and space-time-frequency mapping 63 B2 Forward error correction 66
B21 Implementation issues flexibility parallelisation throughput 67 B22 Rate compatible code sets for HARQ-II 68 B23 Low-density parity-check codes decoding options 69 B24 Scheduling of the decoder 69
B3 Modulation 70 B31 Assessment of modulation techniques 70 B32 OFDM vs single carrier 71 B33 Guard interval design 72 B34 Modulation alphabets and bit mapping 72
B4 Pilot design for channel estimation and synchronisation 73 B41 Intra- and inter-cell synchronisation using dedicated training symbols 73 B42 Pilot grid for generalised multi-carrier (GMC) 75
B5 Adaptive transmission 78 B51 Bit and power loading algorithms 78 B52 Channel quality prediction for adaptive transmission 79
WINNER D210 v10
Page 14 (180)
B53 Compression of channel state feedback for adaptive transmission 81
Appendix C MAC System Layer Functions 83 C1 Functional architecture of the WINNER medium access control for FDD and TDD cellular
transmission 83 C11 MAC radio resource control Resource partitioning and constraint combining 83 C12 MAC radio resource control Flow setup and termination 84 C13 MAC radio resource control Spatial scheme pre-configuration and selection 85 C14 MAC control feedback 86 C15 Radio packet transfer Transmission and reception 86 C16 Resource scheduling 88 C17 SDMA and spatial user partitioning 91 C18 Timing of the execution of the main MAC functions 93
C2 Functional architecture for peer-to-peer MAC 93 P2P-DAC channel access control functions 95
C3 Chunk definition 96
Appendix D Radio Resource Management (RRM) and Radio Resource Control (RRC) 97 D1 RRM functions 97
D11 Spectrum control 97 D12 Service level control (SLC) 98 D13 ModeRAN selection 99 D14 Handover 100 D15 Admission control 101 D16 Load control 102 D17 Routing 102
D2 RRM architecture 104 D21 Location of WINNER functions 104
D3 RRC functionalities 105 D31 Measurements and reports 105 D32 Other functions 106
Appendix E Assessments Assumptions 108 E1 Overview 108 E2 Basic parameters for link level evaluations 108 E3 Basic parameters for multi-link and system level evaluations 109
E31 Mode specific parameters 109 E32 Common to all modes 110
E4 Scenario parameters 111
Appendix F Link-Level Assessments 112 F1 Link layer performance Throughput 112
WINNER D210 v10
Page 15 (180)
F2 Forward error correction 116 F21 Performance comparison 116 F22 Complexity-performance trade-off 116 F23 Performance comparison of rate compatible punctured codes 118 F24 BLDPCC performance comparison of major decoding algorithms 118 F25 Performance when using different decoding schedules 119 F26 Base model matrices for BLDPC codes 120
F3 Channel estimation 122 F31 Uplink single carrier 122 F32 Pilot-aided and iterative channel estimation for OFDM 124 F33 Design of the channel estimation unit 126 F34 Unbiased channel interpolation 127 F35 Channel estimation using the guard interval mdash pseudo-random-postfix OFDM 128
F4 Synchronisation 129 F41 Synchronisation without utilizing an explicit training symbol 129
F5 Performance of selected bit and power loading algorithms 132
Appendix G Multi-Link and System-Level Assessments 134 G1 Downlink multiple access 135
G11 Comparison of non-adaptive OFDMA MC-CDMA and adaptive OFDMA 135 G12 Comparison of non-adaptive subcarrier interleaved OFDMA and MC-CDMA 138 G13 Comparison of non-adaptive OFDMA MC-CDMA and TDMA 139 G14 Impact of chunk sharing on the performance of adaptive OFDMATDMA 140 G15 Comparison of adaptive OFDMA and OFDMASDMA using GoBs 142
G2 Downlink spatial processing 144 G21 Comparison of fixed and tracking based beamforming 144 G22 Comparison of various adaptive beamforming techniques 145 G23 Comparison of maximal ratio and interference rejection combining at UT 147 G24 Comparison of beamforming diversity and multiplexing 148 G25 Performance of SMMSE precoding 151
G3 Downlink multi-user detection 153 G31 Comparison of receiver structures for SISO MC-CDMA 153 G32 Comparison of receiver structures for MIMO MC-CDMA 154
G4 Uplink multiple access 155 G41 Performance of single carrier based adaptive TDMA 155 G42 Comparison of IFDMA and chunk based OFDMA 156 G43 Performance of adaptive OFDMA 157 G44 Comparison of adaptive OFDMA and OFDM-TDMA 159
G5 Uplink spatial processing 161 G51 Performance of spatial diversity 161 G52 Linear precoding concepts with long term channel state information 162
WINNER D210 v10
Page 16 (180)
G6 Uplink multi-user detection 163 G61 Comparison of receiver structures for DS-CDMA 163 G62 Comparison of receiver structures for MIMO single carrier 164
G7 Other topics 166 G71 OFDM versus single carrier based uplinks 166 G72 Performance of low rate channel coding for one-cell frequency reuse 167 G73 Comparison of FDMA and TDMA based resource partitioning among BS 169 G74 Comparison of conventional and self-organised RRM in cellular networks 171 G75 VAA technology with adaptive pre-selection aided by MC-OLSR protocol 172
References 174
WINNER D210 v10
Page 17 (180)
Terminology Acronyms and Abbreviations In this chapter abbreviations are explained and fundamental terms are listed which are not commonly used andor have specific meaning throughout the document A short explanation or a reference to the corresponding section that defines this term is given where appropriate
Term Description
AC Admission Control
ACS Access Control Server
AMA Alpha-Min Algorithm
BCH Broadcast (Transport) Channel
BICM Bit Interleaved Coded Modulation
BLDPCC Block Low-Density Parity-Check Code
BPA Belief Propagation Algorithm
BPSK Binary Phase Shift Keying
BS Base Station A stationary network element serving relay nodes or user terminals Base stations are interconnected with network elements belonging to the RAN
BSsr Short-range BS
BSwa Wide-area BS
CAI Co-Antenna Interference
CAP Contention Access Period in peer-to-peer MAC
CC Convolutional Code
CCI Co-Channel Interference
CDC Common Data (Transport) Channel for point-to-multipoint communication
CDMA Code Division Multiple Access
Cell A cell is defined by the geographical coverage area of a broadcast channel originating from a base station A BS may control several cells A cell uses a single PLM on a particular carrier frequency See also REC
Chunk Basic time-frequency resource unit for OFDM links consisting of a rectangular time-frequency area that comprises nsymb of subsequent OFDM symbols and nsub of adjacent subcarriers
Chunk layer A time-frequency chunk within one spatial channel (layer)
CoopRRM Cooperative Radio Resource Management
CP Cyclic Prefix
CQI Channel Quality Information measurement required for (spatial) link adaptation containing condensed information about the channel eg signal-to-interference and noise ratio
CRC Cyclic Redundancy Check
CRRM Common Radio Resource Management
CSI Channel State Information measurement required for spatial link adaptation containing detailed information about the channel eg complex-valued channel gain matrix correlation matrix
CSMACD Carrier-Sense Multiple Access Collision Detect
CTP Control Period of DAC physical channel in P2P MAC
WINNER D210 v10
Page 18 (180)
Term Description
DAC Contention-Based Direct Access (Transport) Channel
DBTC Duo-Binary Turbo Code
DCT Discrete Cosine Transform
DFE Decision Feedback Equalisation
DS-CDMA Direct Sequence Code Division Multiple Access
DVB Digital Video Broadcasting
DVB-S Digital Video Broadcasting ndash Satellite
DVB-T Digital Video Broadcasting ndash Terrestrial
FDD Frequency Division Duplexing
FDMA Frequency Division Multiple Access
FDOSS Frequency Domain Orthogonal Signature Sequences
FD-DFE Frequency-Domain Decision-Feedback Equalisation
FEC Forward Error Correction (Coding)
FEC block FEC coded transmission block with whole or part of RTU as payload
FER Frame Error Rate
FFT Fast Fourier Transform
Flow Packet stream from one source to one or several destinations
FMT Filtered Multi-Tone
Frame Timeslot consisting of one uplink and one downlink transmission slot
GAP Guaranteed Access Period slotted part of DAC physical channel in P2P MAC
GI Guard Interval
GMC Generalised Multi-Carrier
GPS Global Positioning System
HARQ Hybrid Automatic Repeat Request
HHO Horizontal Handover handover to other cell within the same system
HIS Hybrid Information System
HPA High Power Amplifier
HSDPA High-Speed Downlink Packet Access
IBO Input Backoff (to transmit HPA due to PAPR)
ICE Iterative Channel Estimation
ICI Inter-Carrier interference
IDCT Inverse Discrete Cosine Transform
IDD Iterative Detection and Decoding
IF Intermediate Frequency
IFDMA Interleaved Frequency Division Multiple Access
IFFT Inverse Fast Fourier Transform
IOTA Isotropic Orthogonal Transform Algorithm
IP Internet Protocol
WINNER D210 v10
Page 19 (180)
Term Description
IR Incremental Redundancy
ITU International Telecommunication Union
ISI Inter-Symbol Interference
LA Link Adaptation
LDC Linear Dispersion Code
LDPCC Low-Density Parity-Check Code
Link A link is a radio connection between two network elements of the WINNER access system It subdivides into relay links between base station and relay nodes or between relays and the user link between the user terminal and the radio access point
LLR Log-Likelihood Ratio
LT Long-Term
LTE Long-Term Evolution of 3GPP
MAC Media Access Control Name used both to denote a system layer (MACSL) and a protocol layer (MACPL) that is implemented in the MAC system layer user plane
MAI Multiple Access Interference
MC-CDMA Multi-Carrier Code Division Multiple Access
MCN Multi-hop Cellular Network cellular network that includes relay nodes
MIMO Multiple Input Multiple Output
MMSE Minimum Mean Square Error
MSA Min-Sum Algorithm
MU Multi-User
OBF Opportunistic Beamforming
OFDM Orthogonal Frequency Division Multiplexing
OFDMA Orthogonal Frequency Division Multiple Access
P2P Peer-to-Peer transmission
PACE Pilot-Aided Channel Estimation
PAPR Peak-to-Average Power Ratio
PARC Per Antenna Rate Control
PCCC Parallel Concatenated Convolutional Code (Turbo Code)
PDP Power Delay Profile
PDU Protocol Data Unit
PHY Physical Layer Name used both to denote a system layer (PHYSL) and a protocol layer (PHYPL)
PHY mode Basic physical layer transmission strategy currently two modes are defined TDD and FDD Also denoted PLM Physical Layer Mode
Physical channel A set of chunk layers onto which the resource scheduler in the MAC system layer maps data associated with one sub-flow
PLM Physical Layer Mode see PHY mode
PLMN Public Land Mobile Network
PMP Peer-to-Multi-Peer transmission
WINNER D210 v10
Page 20 (180)
Term Description
PRP Pseudo-Random-Postfix
PSAP Provided Service Access Point
PSRC Per Stream Rate Control
QoS Quality of Service
QAM Quadrature Amplitude Modulation
QC-BLDPCC Quasi-Cyclic Block Low-Density Parity-Check Code
RAC Contention-Based Random Access (Transport) Channel
RAN Radio Access Network
RANG Radio Access Network Gateway
RAP Radio Access Point common term that encompasses both base stations and relay nodes
RAT Radio Access Technology
RC Rate-Compatible
REC Relay-enhanced cell The geographical area covered by one broadcast channel from a single base station plus the broadcast channels from its connected relay nodes
RF Radio Frequency
RI Radio Interface
RLC Radio Link Control Name used both to denotes a system layer (RLCSL) and a protocol layer RLCPL) that is implemented in the RLC system layer user plane
RN Relay Node A network element serving other RN or UT in a given geographical area via its radio access capabilities It is wirelessly connected to a base station another relay node andor a user terminal and forwards data packets between these network elements
RNC Radio Network Controller
RRC Radio Resource Control Protocol that provides the signalling for control and feedback messages
RRM Radio Resource Management Control functions implemented in the RLC system layer control plane
RSB Resource Scheduling Buffer
RTU Retransmission Unit packets upon which HARQ is performed
RUP Reuse Partitioning
SAP Service Access Point
SC Single Carrier
SDMA Spatial Division Multiple Access
SDU Service Data Unit
SDFE Soft Decision Feedback Equalisation
Sector Azimuth angle partition of a base station coverage area In the system-level simulations of this document each sector constitutes a separate cell
SF Super-Frame
SF preamble Initial part of super-frame transmitted cell-wide in spectrum available everywhere
SF-MMSE Space-Frequency MMSE
WINNER D210 v10
Page 21 (180)
Term Description
SFTuCM Space-Frequency Turbo Coded Modulation
SINR Signal-to-Interference-and-Noise ratio
SISO Single-Input Single-Output
Site A location with co-located antenna element that belong to one base station
SLC Service Level Control
Slot short form of Timeslot see below
SMMSE Successive Minimum Mean Square Error precoding
SNR Signal-to-Noise Ratio
SO-RRM Self-Organised Radio Resource Management
SPIC Soft Parallel Interference Canceller
ST-WNRA Space-Time Weighted Nonbinary Repeat Accumulate (Code)
Sub-flow Data stream after segmentation consisting of FEC blocks
SUD Single User Detection
Super-frame Timeslot spanning whole band with place for flows from all transport channels contains also synchronisation symbols and nf frames
System Mode Specific combinations of algorithm assignations or ranges of algorithm assignations may be referred to as modes The two main considered physical layer modes (PLM) are based on and denoted FDD and TDD A System mode is a PL mode combined with a MAC mode
Targeted Flow CDC packet stream to a subset of the multicast receivers within the cell
TC Turbo Code
TCP Transmission Control Protocol
TDC Targeted Data (Transport) Channel for point-to-point communication
TDD Time Division Duplexing
TDMA Time Division Multiple Access
TEQ Turbo Equalisation
(Time)slot Time unit of one contiguous uplink or downlink transmission in FDD or TDD
Transport channel Interface between the RLC and the MAC layer user planes
UMTS Universal Mobile Telecommunication System
UT User Terminal A physical network element used by the end user to access a service or set of services
UTRAN UMTS Terrestrial Radio Access Network
VAA Virtual Antenna Array
VHO Vertical Handover handover between different systems
WLAN Wireless Local Area Network
ZF Zero Forcing
WINNER D210 v10
Page 22 (180)
Mathematical Symbols and Notation
Symbol Description acl(tf) virtual antenna chunk for chunk c layer l symbol t and subcarrier f Bi information bits to be transmitted f subcarrier Fcl precoding matrix for chunk c and layer l K number of users Mr number of receive antennas Mt number of transmit antennas Ndata number of data symbols per chunk nf number of frames per super-frame nsub number of subcarriers per chunk nsymb OFDM symbols per chunk Qc number of spatial layers in chunk c Rmin minimum coding rate
Sc number of modulated layers in chunk c
t time (OFDM symbol)
Tchunk chunk duration
TOi time-out Tslot MAC slot duration
xcl(tf) antenna chunk for chunk c layer l symbol t and subcarrier f
WINNER D210 v10
Page 23 (180)
1 Introduction and Radio Interface Structure The definition of a new radio interface (RI) concept is an inherently iterative process determined not only by pure technical considerations but also by regulatory and other decisions or restrictions The technical and regulatory processes are mutually dependent From a design perspective this is clearly a problem since the regulatory framework is needed to provide an optimised solution On the other hand the regulatory process requires technical arguments and indications to define the system and spectrum framework
This is the prevailing situation under which the new WINNER system and in particular the new WINNER radio interface is developed It therefore provides solutions for different system frameworks and a wide range of possible spectrum allocations This document describes the general WP2 RI concept and current mainstream assumptions based on a consolidation process of previous WINNER deliverables and results Key technology concepts are assessed against the requirements and assessment criteria derived from WP7 work System design choices are guided by technical strategic and economic aspects Technical assessment criteria include system performance implementation aspects terminal and system complexity scalability and flexibility Also of major concern is the interworking with legacy radio technologies and efficient implementation of multi-standard equipment in particular OFDM-based systems eg like the one discussed in 3GPP long-term evolution (LTE)
The overall requirements design targets and key components for the WINNER RI are given in Chapter 1 Chapter 1 also provides some background to the system framework as far as required for the remainder of this document in the form of a top-down survey The contribution of this deliverable is discussed in the framework of the overall system concept work including service specification service architecture protocols and system design Thereafter Chapters 2ndash4 provide a detailed bottom-up discussion of the system design The physical layer design including transceiver diagrams coding modulation spatial processing synchronisation and channel estimation is explained in Chapter 2 Chapter 3 shows the functional design and architecture for the cellular medium access control (MAC) system layer and the MAC for peer-to-peer direct communications Chapter 4 does the same for radio resource management (RRM) and radio resource control (RRC) Chapter 5 gives an overview on key assessments performed to support design choices to exemplify favourable configurations of the RI and to obtain initial performance estimation For brevity these chapters focus on major results and key components further rationale and detail is provided in dedicated appendices for each topic
11 Requirements and design targets The WINNER system should fulfil the ITU-R Recommendation M1645 about systems beyond IMT-2000 (ie beyond 3G) In particular 100 Mbps peak aggregate useful data rate for mobile access and 1 Gbps for local area are assumed for these systems Peak data rates do not however give any indication on the quality of service experienced by one user and a set of amendments and extended system requirements are presented in [WIND71] A number of them are directly relevant to the radio interface
bull R36 Peak spectral efficiency in connected sites of 10 bitsHzsite in wide-area deployments for high load
bull R37 Peak spectral efficiency in isolated (non-contiguous) sites of 25 bitsHzsite
bull R32 A sustainable average ldquohigh endrdquo data rate per link of 50 Mbits above Layer 2
bull R33 A consistent and ubiquitous data rate per link of 5 Mbits above Layer 2
bull R312 User speeds ranging from 0ndash500 kmh should be supported
bull R34 A maximum delay over the radio interface of 1 ms at Layer 2
bull R67 Maximum bandwidth per radio link 100 MHz
Although providing useful indications these system requirements do not provide sufficient information to completely specify required capabilities and performance of the radio interface The reason is that several fundamental pieces of information eg the traffic intensity for which the system is to be designed the admission and congestion strategies the maximum allowed output power from different types of network nodes in different environments spectrum availability etc are not yet established ndash but crucial to calculate absolute numbers of many key parameters This uncertainty is unavoidable since most of the missing parameters are determined by pending political legal and strategic decisions of different regulating bodies and in the end by the network operator
WINNER D210 v10
Page 24 (180)
Nevertheless in order to develop an adequate system concept technical design targets and guidelines for the radio interface are needed at an early stage Therefore a number of scenarios believed to be relevant for the WINNER system have been identified and for each scenario a set of more technically oriented targets with details about bit rates and other parameters have been specified The scenarios and targets are summarised in Appendix A In Chapter 5 and its associated appendices (Appendix E Appendix F and Appendix G) comparisons of simulation results with these design targets are made In addition direct comparisons with the requirements are made to the extent possible In the latter case several additional assumptions about missing parameters are needed and there are many simplified conditions and uncertainties that must be borne in mind when interpreting such results as further discussed in Chapter 5
12 Key components of the radio interface In order to meet the requirements discussed above the WINNER radio interface has been designed as a packet-oriented user-centric always-best concept It defines a scalable and flexible radio interface based on adaptive and compatible system modes tailored to particular situations such as the radio environment the usage scenario the economic model etc The always-best solution is enabled by several innovative key components such as
bull a flexible multi-mode protocol architecture enabling efficient interworking between different system modes
bull relay-enhanced cells as an integrated part of the concept
bull design and support for operation in shared spectrum and inter-system coordination
bull consequent MAC design for packet-oriented transmission including two-layered resource scheduling and short radio interface delays
bull resource allocation targeting interference avoidance by coordinated scheduling across base stations and relay nodes or using joint (spatial) precoding over distributed antennas
bull physical layer design using generalised multi-carrier (GMC) in different configurations to ensure low complexity high spectral efficiency and high granularity of resource elements
bull a spatial multi-user link adaptation concept allowing scalability in link adaptation and multi-user optimisation and being able to adapt to a wide range of deployments operational scenarios propagation channel service requirements and terminal capabilities
bull novel multi-user precoding techniques developed within WINNER
bull support of self-organised synchronisation of terminals and base station
bull optimisation techniques for overhead and control signalling
A detailed discussion of these key elements is provided in the conceptual part of this document The remainder of Chapter 1 is dedicated to introducing the overall WINNER system concept in order to provide the necessary framework and nomenclature
13 Top-down overview of the WINNER system concept
131 Services protocols and design A challenging task in the concept development work is to ensure that the different key components can be embedded into one single radio interface concept that is technically sound for a ubiquitous radio system and its multiple deployment scenarios A fundamental principle is to study important problems from different perspectives in a systematic manner taking advantage of the large variety of technical competence that is available in the different working groups Consequently the radio interface concept development work is carried out from service-oriented protocol and design perspective The main differences between these three perspectives are that they all represent different levels of abstractions and technical details as illustrated in Figure 11 The studies of technical details and the development of abstractions are performed in parallel and complement each other
The service-oriented view is based on a top-down system engineering approach A system consists of layers and each system layer provides services towards the layer above Services and their users are first identified starting from the highest layer Identified services are broken into service components and the
WINNER D210 v10
Page 25 (180)
external behaviour of these components (as seen by the users) are modelled with high-level abstractions or provided service access point (PSAP) state-machines1 The main goal of this type of representation is to describe services without touching any technical details The resulting hierarchical structure of these behavioural descriptions is referred to as a service specification [WIND76] The service specification describes the system at the highest level of abstraction
Level of abstraction
Level of technical details
Radio interface design
Radio interface design
Protocol architecture
Protocol architecture
Layer-to-layer and
peer-to-peer
communication
Service specification
Service specification
Layer-to-layer
communication
Entity-to-entity
communication
Figure 11 The three views on radio interface concept studies
The service specification is further mapped to a service architecture that explains the provided services thus providing the starting point for the protocol view The service architecture describes the details of provided services by defining service access point (SAP) interfaces between layers One single PSAP state-machine may be mapped onto one or several SAPs eg (highly-abstract) packet transfer services (as described by the service specification) may be explained with multiple SAPs that are aimed for different purposes such as point-to-point and point-to-multipoint communication The definition of these interfaces is followed by a description of protocol architecture that is a set of radio protocols and protocol layers that implements the service architecture
Protocols are in turn defined as set of rules and formats that govern the communication between protocol peer-entities2 ie communicating parties at the same level over the air Even though the placement of control functions and the formal description of protocols is currently under discussions there is a general consensus concerning the overall protocol structure and protocol layers Currently the overall structure consists of radio resource control (RRC) radio link control (RLC) medium access control (MAC) and Physical (PHY) protocol layers The RRC protocol is used by the radio resource management functions RLC protocol provides reliable packet transfer over the radio interface The MAC protocol arbitrates access to the shared medium and associates each destination with a unique address The PHY protocol is responsible for transferring information over a physical link As the vision is to connect the radio interface to an Ambient Network [AN05] upper layers handle the rest of the functionalities
The radio protocol architecture is shown in Figure 12 where SAPs are illustrated with circles and proto-col instances are illustrated with rectangles For further information about protocols and service-oriented descriptions see [WIND76 WIND35 WIND32 WIND31]
It should be emphasised that the radio protocol architecture is a very general description about the communication of two nodes over the air In order to ensure that the radio interface architecture can support all envisioned key technologies and reach the desired performance design and implementation related studies are important Of particular interest is to gain knowledge about the technical feasibility of envisioned key technologies for lower layers The design view describes the radio interface with the high-est level of technical details and it addresses problems that are related to radio interface functions and
1 In WP7 UML 20 is used to describe these state-machines 2 This should not be confused with the notion of peer-to-peer communication that later on (throughout this
deliverable) refers to direct communication between physical nodes
WINNER D210 v10
Page 26 (180)
detailed algorithmic solutions Since the main focus of this deliverable is on those lower layer protocols and functions and the evaluation of their performance the design perspective is consistently used throughout this document
PHY
RLCRLC
RLCRLC
RLC
MAC
RRC
rdquoTransportrdquo channels
Chunk rdquolayersrdquo
Packet transfer services
L1PHY
L2MAC
L2RLC
L3RRC
Figure 12 WINNER radio protocol layers and interfaces
132 System layers modes and parameterisation There are four system layers in the WINNER system concept according to the description in [WIND76] These layers are further divided into user plane and control plane The services that need to operate on individual data units (IP packets or lower layer PDUs) have been placed in the user plane The control plane services operate on longer time scales and control the operation of the user plane services by way of control signalling
1321 The system layers The functional role of each system layer is as follows
IP convergence (IPC) layer
The user plane of the IPC layer receives IP packets from the user of the WINNER RAN maps them into flows and performs header compression and decompression The control plane is responsible for RAN association functions as well as macro-mobility (IP level mobility)
Radio link control (RLC) layer
The user plane of the RLC layer provides reliable packet transfer over the radio interface It also performs confidentiality protection and packet prioritisation in order to meet the quality-of-service (QoS) goals The control plane takes care of flow establishment and release location services load spectrum and micro-mobility control These radio resource management (RRM) functions of the control plane will be described in Chapter 4 and Appendix D
Medium access control (MAC) layer
The MAC user plane provides the service ldquoradio packet transferrdquo ie transmission and reception of packets over the radio interface An important part of this service is the scheduling of packets The control plane provides the ldquoMAC radio resource controlrdquo service ie acceptance and execution of control messages from higher layers that specify required transmission parameters and boundary conditions Furthermore it implements ldquoMAC control feedbackrdquo ie messaging that supports the flow control the QoS control and the spectrum assignment and other functions at the RLC system layer There is a tight inter-layer interaction between MAC and physical layers and this is crucial for the performance of the WINNER system Some functions such as encoding and decoding that are traditionally placed in the physical layer are in the WINNER system concept placed in the MAC system layer The MAC system layer is outlined in Chapter 3 and Appendix C
WINNER D210 v10
Page 27 (180)
Physical (PHY) layer
The PHY system layer handles the physical transmission of flows and of measurements and control signalling directly related to the radio interface The PHY system layer is not separated into user plane and control plane since it is assumed that all control functionality for the PHY layer resided within the control plane of the MAC system layer The design of the PHY system layer is one of the major topics of this document It is described in Chapter 2 and Appendix B
1322 Physical layer modes and flexible parameterisations The WINNER architecture should be unified yet flexible enough to handle deployments from wide area coverage to high capacity hot spots A basic goal is that the WINNER radio interface should present a unified set of services to higher layers yet include some specific parts that provide the required flexibil-ity To provide flexibility and convergence in a structured way the definition of modes is helpful
A physical layer mode (PLM) can be defined where there is a significant impact (discontinuity in adap-tation) of PHY functionality on the radio interface concept Two PLMs have been defined
bull Frequency division duplex (FDD) transmission performed over paired bands and supporting half-duplex FDD terminals
bull Time division duplex (TDD) transmission over unpaired band
Although any PLM can be configured for any kind of deployment in this document the FDD mode is evaluated primarily in wide-area cellular deployment scenarios using frequency bands of different width The TDD PLM has so far primarily been evaluated in short-range cellular deployment
A system mode represents a specific combination of physical layer modes and MAC modes (Section 83 of [WIND76]) All higher layer functions are designed to be mode-independent (generic) and form the unified interface of the WINNER system
There are three MAC modes within the concept
bull FDD cellular MAC
bull TDD cellular MAC
bull MAC for peer-to-peer transmission at present designed using the TDD physical layer mode
The combinations of PHY and MAC modes thus define three WINNER system modes
Parameterisations within modes provide further flexibility and adaptability Both PLMs use generalised multi-carrier (GMC) transmission which includes CP-OFDM and serial modulation as special cases (Section 222) Multiple access is realised in frequency time space and in particular cases also in the code domain Further details are provided in Section 316
The basic time-frequency unit for resource partitioning is denoted a chunk It consists of a rectangular time-frequency area (see Figure 13 a) that contains payload symbols and pilot symbols It may also contain control symbols that are placed within the chunks to minimise feedback delay (in-chunk control signalling) The number of offered payload bits per chunk depends on the utilised modulation-coding formats and on the chunk sizes In transmission using multiple antennas the time-frequency resource defined by the chunk may be reused by spatial multiplexing A chunk layer represents the spatial dimen-sion (Figure 13 b)
The chunks and chunk layers are pre-assigned to different types of data flows on a super-frame time scale (Section 314 and Appendix C11) They are then used in a flexible way to optimise the transmission performance For example
bull The antenna resources can be used differently for different flows tofrom user terminals
bull Different users may use different variants of GMC as depicted in Figure 14 For example in uplinks power-constrained users may use single-carrier waveforms within their assigned transmission resources while other terminals use CP-OFDM A prerequisite for attaining both efficiency and flexibility is efficient synchronisation of all transmissions within a cell (Appendix B4)
The coming chapters will describe the concepts used to combine the desired flexibility with the equally desired high efficiency two goals that are often contradictory and challenging to combine
WINNER D210 v10
Page 28 (180)
Tchunk
BWch
unk
nsymb OFDM symbols
n sub
sub
- ca
rrie
rs
Chunk
Chunk
time frequ
ency
Layer 1 Layer 2
Layer 3 Layer 4
layer
a) b)
Figure 13 a) Multi-carrier downlink physical channel structure and chunks b) Chunk layers obtained by spatial reuse
tim e
O ne chunk
U se rs E F G H IF D M A
U se r C se ria l m o d u la tio n
U se r D se ria l m o d u la tio n
U se r A O F D M
U se r B O F D M
O ne sub-carrie r
Figure 14 Use of different variants of GMC modulation by different uplink users
14 Scope of this document The radio interface is embedded in the overall WINNER system concept which defines system layers services functional architecture and protocols as outlined above While [WIND76] focuses on the func-tional architecture of the WINNER system concept and [WIND35] describes protocols and deployment concepts the present report has another focus The design of the lower layers of the radio interface to enable high performance and a preliminary evaluation of the resulting performance
WINNER D210 v10
Page 29 (180)
2 Physical Layer The design of the physical layer implements several innovative features of the WINNER concept
bull A slotted time-frequency chunk pattern that can be adjusted to different propagation scenarios The chunk and frame durations are short which is a basic requirement for a low transmission delay over the radio interface
bull A transmission chain based on generalised multi-carrier (GMC) which enables flexible switching between multi-carrier modulation and (frequency-domain generated) serial modulation
bull A flexible spatial processing is integrated into the transmission and reception chains
bull A scattered pilot grid that supports efficient channel estimation also on chunk basis at very low overhead The cyclic prefix is used to achieve coarse intra-cell synchronisation Additionally training symbols at the beginning of the super-frame enable inter-cell synchronisation also in cases where no global timing reference (eg GPS) is available
bull Efficient means have been developed for compressing the channel quality information feedback required for adaptive transmission and the channel state information required for some multi-antenna schemes These methods reduce the required feedback overhead to reasonable levels
The purpose of this chapter is to present a concise summary of the current selection of technologies for different parts of the WINNER physical layer To provide the rationale behind this selection a detailed assessment is given in Appendix B (concept details) and Appendix F (simulation results) including a summary of the results from previous deliverables [WIND21 WIND22 WIND23 WIND24 WIND27]
21 Forward error correction Among the large number of possible options for forward error correction identified in [WIND21] three techniques have been identified as main candidates for the WINNER system [WIND23] convolutional codes (CC) parallel concatenated convolutional codes (PCCC Turbo Codes) and low-density parity-check codes (LDPCC) More specifically Duo-Binary Turbo-Codes (DBTC) and Block-LDPC Codes (BLDPCC) are able to provide excellent performance at medium to large block sizes (200 information bits and beyond) while taking implementation simplicity (eg parallelisation memory requirements) into account already in the code design phase BLDPCC outperform DBTC at large block lengths andor high code rates (for a detailed assessment please refer to Appendix B2) The use of convolutional codes is currently considered for block lengths below 200 information bits However DBTC show very good performance also in this regime so that CC might eventually not be needed to implement channel coding in the WINNER radio interface
Table B1 in Appendix B summarises the relative merits of the three candidate technologies with respect to the most relevant assessment criteria Details on the assessment can be found in [WIND23] and Appendix B2 Note that while the discussion on FEC schemes forms part of the PHY chapters coding in the WINNER system will be mainly implemented in the MAC system layer (MAC-2 sub-layer) as detailed in the Chapter 3 Only convolutional coding as a part of the (spatial) link adaptation within individual chunks will form part of the PHY system layer
In situations where the channel coding gain (using reasonable code rates eg 13 and above) is not suffi-cient to support reliable transmission additional spreading can be used to provide reasonable SINR values This avoids further decoding complexity as would be the case for low-rate channel codes It is however understood that this comes at the expense of lower achievable data rates
WINNER D210 v10
Page 30 (180)
22 Modulation and space-time-frequency processing
221 General resource allocation strategy The overriding principle for allocating the total available resources is to strive primarily for orthogonal use of time-frequency resources Non-orthogonality for example in the form of CDMA SDMA or contention-based signalling is allowed only within carefully prescribed subsets of the total resources designed to limit interference with other parts of the resource pool Furthermore some resources have to be reserved as guard bandsguard spaces to preserve the orthogonality Extension of the orthogonality from single cellssectors to clusters of neighbouring sectors can be done for example by
bull interference avoidance scheduling between cells or
bull joint (spatial) precoding (and detection) over sectors [SWW+04 LWZ04]
For the spatial dimension non-orthogonality is unavoidable spatial reuse of time-frequency resources will always create some interference The general time-frequency space transmission chain outlined in Appendix B1 provides means to tailor and control such interference as outlined in Appendix C17
222 Modulation technique Block signal processing in the frequency domain at both transmitter and receiver using efficient fast (inverse) Fourier transform (IFFTFFT) operations is a natural choice for future high bit rate wireless radio interfaces as signal processing complexity per data symbol rises only logarithmically with the channel delay spread [FK05] Furthermore frequency domain processing enables transmitters to easily and adaptively shape their spectrum occupancy in response to user data rate requirements user terminal capabilities and the availability of unoccupied spectrum It also enables flexible choice of bit rates modulation formats and multiple access schemes according to the current channel state and user need
The generalised multi-carrier (GMC) technique [WIND21 WIND23] will be used for modulation in WINNER as it is essential for providing the flexibility needed to fulfil the ldquoalways bestrdquo principle also on the physical layer It enables to accommodate a plurality of multi-carrier modulationmultiple access schemes such as different flavours of OFDM (CP-OFDM IOTA-OFDM PRP-OFDM) FMT and MC-CDMA as well as the following serial modulation schemes single carrier single carrier DS-CDMA and IFDMA This is done by selection of an appropriate mapping strategy (data symbols to subcarriers) guard interval design and (frequency domain) filtering The GMC approach is also extremely useful in generating multi-band signals for spectrum flexibility [WIND22]
A small set of the above stated modulation technique options will be sufficient to efficiently adapt the WINNER system to the most relevant deployment scenarios outlined in Appendix A1 This restriction will also keep the complexity of the WINNER radio interface in terms of implementation options at a reasonable level To enable the choice of appropriate techniques their relative merits have been thoroughly studied [WIND21 WIND22 WIND23] The results of this assessment work are summarised in Table B3 and the following options have been selected for use in the WINNER system
bull GMC configured as standard CP-OFDM
o for downlink transmission in the TDD and FDD modes
o for uplink transmission when terminal power consumption is not a limiting factor
bull GMC configured as serial modulation (DFT precoded CP-OFDM)
o for uplink transmission in the power limited wide-area case
The above specifications define only the modulation technique ndash the choice of appropriate multiple access schemes for the different modes is discussed in Chapter 3 For adaptive transmission chunk-based OFDMA will be used for non-frequency adaptive transmission MC-CDMA in conjunction with FDMATDMA is the preferred option while for the serially modulated uplink FDMATDMA is envisioned (eg DFT-precoded block OFDMA or IFDMA)
The specific parameterisation of these transmission techniques is governed by the physical channel conditions as outlined in [WIND23] Based on this methodology appropriate parameters have been selected and are summarised in Table 21 Non-differential M-QAM modulation (with BPSK as a special case) is proposed for the use in the WINNER system since channel state information can be made available to the receiver at relatively low pilot overhead in all scenarios as detailed in Section 23 For the wide-area scenario modulation formats up to 64-QAM are proposed while for short-range transmission
WINNER D210 v10
Page 31 (180)
even 256-QAM appears to be feasible Gray mapping is proposed as it is a natural choice for the bit labelling facilitating the calculation of soft output at the detector with low complexity The use of other labellings (in combination with a weaker outer code) is also under investigation in the context of iterative equalisation andor channel estimation
223 Modulation parameters The configuration presented below was used for investigations during the last part of WINNER Phase I Note that the real WINNER system will be required to support several different configurations (parameter sets) in order to effectively adapt to differing channel conditions and fulfil the ldquoalways-bestrdquo objective The parameters listed below are examples for such parameter settings which can be used to study the relative merits of different techniques They are however not claimed to be optimal and refined sets of parameters might be used for Phase II A framework for deriving appropriate parameter sets can be found in [WIND23] The range of reasonable values is much wider for the TDD mode than for the FDD mode where parameter ranges are more severely constrained by assumed channel delay spreads and vehicular velocities [WIND23] in the wide-area scenario All uplink transmissions are embedded in the super-frame and are assumed to be fine-synchronised The assumed centre frequencies are worst-case values The use of FFT sizes up to 2048 has been assumed to be reasonable from an implementation point of view
Table 21 Basic transmission parameters used for simulation of GMC based systems
Parameter FDD mode
(2times20 MHz)
TDD mode
Unitsnotes
Centre frequency 50 DL 42 UL 50 GHz
Duplexing method FDD (paired)
TDD
FFT BW 200 1000 MHz
Number of subcarriers in GMC 512 2048 Equals length of FFT
Subcarrier spacing 39062 48828 Hz
Symbol length
(Excluding cyclic prefix)
2560 2048 micros
Cyclic prefix length 320 128 micros
Total symbol length 2880 21763 micros
Number of subcarriers in use 416 1664 [-208208] and [-832832]
Subcarrier 0 not used
Signal BW 1625 8125 MHz
Chunk size in symbols 8times12 = 96 16times5 = 80 Subcarriers times Symbols
224 Transceiver structure Figure 21 and Figure 22 give a general overview of the envisaged structure for the transmitter and receiver in the WINNER system respectively The structure is the same for all cases of generalised multi-carrier transmission only requiring appropriate configuration for some components The user data is first segmented into flows which then are individually encoded segmented and mapped to chunks where modulation and space-time-frequency processing takes place (cf Appendix B1 for details) Afterwards the modulated chunks are assembled to raw (OFDM) symbols subjected to an IFFT the CP is added and the digital baseband data is finally forwarded to the RF processing
3 A small symbol roll-off time should be added to the OFDM symbol length to reduce the out-of-band power It is
here assumed to be included in the guard intervals
WINNER D210 v10
Page 32 (180)
For OFDM transmission the ldquoGMCrdquo preprocessing block in Figure 21 would only contain (optional) frequency domain filtering For serial modulation however it is necessary to subject the modulated symbols to a FFT prior to any frequency domain (spatial) processing ie modulation has to be done prior to the formation of chunks (spatial processing for single carrier transmission may also be done in the time domain) This operation will be done in the GMC processing block of Figure 21 a block of M modulated symbols that eventually will be turned into one or more chunks will be passed through an M-point FFT The M symbols are now in the frequency domain and are mapped into the specified chunk layers The remaining processing is equivalent to that for other GMC signals eg OFDM It should be emphasised that this approach somewhat reduces the flexibility of the system in the case of serial modulation as all chunks within one serially modulated block will have to undergo the same kind of spatial processing However as serial modulation is envisaged for uplink transmission from user terminals only it will anyway require only a quite basic configuration of the generic spatial processing chain described in detail in Appendix B1 so this limitation is not very severe
Figure 21 Overview of transmitter structure
The corresponding receiver structure is depicted in Figure 22 Optional feedback between soft-input soft-output decoder and space-time equaliser and channel estimator enable iterative detectionTurbo equalisation (TEQ) and iterative channel estimation (ICE) techniques detailed in [WIND21 WIND23] (cf also the results presented in Appendix F3) Serial modulation based transmission (frequency domain based single carrier as well as IFDMA) requires an IFFT in addition to the FFT in order to support frequency domain equalisation
IFFT CP
FECSub-flow
Segm
entation
Π
hellip
FEC Π
Substream
segmentation and chunk m
apping
Individually encoded flows
Chunk Layers
Pilot insertion
(scattered amp continuous pilots)
hellip
helliphellip
Assem
bly of chunks to raw sym
bol data
To
RF
Pilot insertion
(pilot symbols)
SP
GM
C
Modulation
Spatial processing (precoding dispersion etc)
Interleaving
Processing for generalised multi-carrier signals eg FFT for
frequency domain based serial modulation optional filtering
MOD
MOD
WINNER D210 v10
Page 33 (180)
Figure 22 Overview of receiver structure
225 Space-time-frequency processing Spatial processing provides performance gain via spatial diversity spatial multiplexing SDMA and enhanced interference management Spatial diversity adds reliability by transmitting multiple copies of the same data over (potentially) uncorrelated channels Therefore diversity efficiently copes with the detrimental effects of fading on the system performance On the other hand independent fading in a multi-antenna system can also be seen as a beneficial effect that can lead to a substantial increase of the achievable data rate by performing spatial multiplexing ie transmitting independent data over the uncorrelated spatial channels to one user terminal A significant contribution to high spectral efficiency is interference avoidance by spatial processing eg based on multi-user precoding at the transmitter in the downlink The use of beamforming (adaptive or non-adaptive) makes it possible to schedule multiple users on the same time-frequency resource (chunk) within a cell or across multiple cells and separate them by the SDMA properties of the multi-antenna channel When channel knowledge is available at the transmitter it is also possible to distribute complexity between transmitter and receiver in a very flexible manner Precoding techniques for example allow keeping receiver complexity low Note that although first investigations are based on traditional cell layouts with sector antennas precoding with distributed antennas (using a central processing unit and separated radio heads) is seen as a particular deployment form of the proposed WINNER multi-antenna concept that can be of additional benefit for the overall goal of an interference-avoidance radio interface concept
The WINNER multi-antenna concept is a generic architecture that aims at performing multi-user spatial domain link adaptation based on the following basic components (linear) dispersion codes directive transmission (beamforming) per stream rate control and multi-user precoding [WIND27 DAO05] This architecture allows fostering the spatial processing gains introduced above in flexible combinations as required by different scenarios ie different combinations of physical layer mode link direction transport channel type deployment propagation conditions cell load traffic type BS antenna configuration and terminal capabilities A generic spatial processing chain that implements the WINNER multi-antenna concept is detailed in Appendix B1
From
RF
STF-EQ
FFT CP
Segm
entation into chunks
DEC Π-1
DEC Π-1
Sub-flow
assembly
Chunk Layers
STF-EQ
helliphellip hellip
hellip
Channel estimation
In-band
pilots
Pilot
symbols
TEQ
ICE
Chunk dem
apping and substream assem
bly
GM
C
Space-Time-Frequency Demapping and Equalizing
Decoding
De-Interleaving
WINNER D210 v10
Page 34 (180)
23 Pilot grid design for channel estimation and synchronisation
231 Synchronisation For synchronisation we have to distinguish between coarse synchronisation (acquisition) where all other relevant system parameters are still unknown and fine synchronisation (tracking) where a previous coarse estimate is further improved and adapted to variations of eg the local oscillator Furthermore there are three quantities which have to be synchronised in an OFDM system
bull OFDM symbol and frame timing
bull Carrier frequency
bull Sampling rate
The choice of an appropriate synchronisation strategy for the radio interface is based on several criteria
bull Robustness expressed in the lock in probability ie the probability of successful acquisition
bull Residual synchronisation offsets in the steady state
bull Time required to achieve synchronisation
bull Required overhead
With respect to synchronisation the scenarios in which the WINNER radio interface is to operate can be distinguished as follows
bull Hot spot mainly indoor environment with no significant interference from adjacent BSs
bull Wireless network with global reference time All BSs operate synchronised governed by a global reference clock which may be provided by the Global Positioning System (GPS) or the European Satellite Navigation System (Galileo)
bull Synchronised wireless network without timing reference If no global timing reference is available synchronisation of the network can be achieved in a self-organised way Since coordinated operation of a wireless network essentially requires BSs to be synchronised it is generally believed that the attainable system capacity of a synchronised wireless network exceeds a non-synchronised network
bull Uncoordinated wireless network BSs operate non-synchronised In this case the UT needs to be able to distinguish between several signals in order to identify the closest BS
For synchronisation purposes different types of pilots are foreseen for the WINNER system concept
bull Two sets of training symbols (uplink and downlink) consisting of three OFDM symbols are included in the super-frame preamble for self organised inter- and intra-cell synchronisation The structure of the training symbols and the related synchronisation algorithms are described in Appendix B41
bull Continual pilot subcarriers (or tones) They may serve various purposes such as phase noise compensation tracking of carrier and sampling frequency offset (see [WIND23] Section 6252) In combination with cyclic prefix based synchronisation differential modulation of the pilot tones allows establishing frame synchronisation as well as to detect frequency offsets of a multiple of the subcarrier spacing [SFF+99]
Within the WINNER framework a synchronisation concept that can synchronise a wireless network in a self-organised way has been identified in [WIND21] The algorithm relies on dedicated set of training symbols inserted in the super frame preamble In Appendix B41 its basic principles are summarised and some enhancements are presented Simulation results reported in [WIND23] show that both frequency and time synchronisation of all BSs within the cellular network can be achieved after 20 super-frames with remaining frequency offset of about 1 of the subcarrier spacing and time offset of about 10 of the guard interval respectively Since the duration of one super-frame is 8x12 and 8x30 OFDM symbols for the WINNER FDD and TDD modes respectively the time to synchronise for this algorithm totals to about 110 ms for 20 super-frames which may be too long for some applications
For hot spots or for networks with access to a global timing reference synchronisation utilizing the cyclic prefix in combination with continual pilot tones is considered to be an appropriate choice [WIND21 WIND23] This approach is in particular attractive for OFDM systems with a large number of subcarriers in terms of pilot overhead and performance [BBB+99] It is demonstrated in Appendix F41 that reliable
WINNER D210 v10
Page 35 (180)
acquisition can be achieved within 12 OFDM symbols at SNR gt -4 dB Furthermore a scattered pilot grid predominantly used for channel estimation (see Appendix B42) can be used to achieve acquisition in a non-synchronised wireless network However numerical results in Appendix F41 suggest that the carrier frequency offset must not exceed half of the subcarrier spacing for this algorithm to work
A timing advance strategy which compensates for the propagation delays between signals transmitted from UTs to their assigned BS during uplink is proposed in Appendix B41 The proposed ranging process enables the UTs to estimate the propagation delays of their signals by utilising individual synchronisation tones This information is subsequently used for a time advanced transmission during uplink providing a time aligned arrival of different usersrsquo signals at the BS If the synchronisation tones are retransmitted by the UTs after the ranging process is finished they may further be used for a fine estimation of the carrier frequency offset at the BS
232 Channel estimation For channel estimation purposes the following types of pilots are foreseen
bull A scattered pilot grid is used for OFDM channel estimation and channel prediction For the pilot grids presented in B42 the pilot overhead is 25 and 4 per spatial stream for the WINNER TDD and FDD mode respectively In Appendix F41 it is shown that a scattered pilot grid could also be utilised for acquisition in a non-synchronised wireless network
bull In OFDM uplinks that use adaptive transmission channels from many users have to be estimated and predicted in each chunk Methods based on simultaneous pilot transmission from all candidate terminals (overlapping pilots) can then be used to limit the pilot overhead fraction in the uplink [WIND24]
bull For uplink (frequency domain generated) serial modulation pilot patterns may be generated in the frequency domain in either of two ways The first way is to use a scattered pilot grid equivalent to OFDM Alternatively pilot patterns for serial modulation in the uplink may be generated in the time domain in the form of short training blocks time-multiplexed with data blocks Both techniques are described in Appendices B42 and F31 respectively
For multi-antenna transmission a combination of dedicated pilots per flow common pilots per cellsector common pilots per antenna and common pilots per beam are required as described in Appendix B42 Interference estimates per chunk layer or averaged over chunk layers may be obtained as by-products of the pilot-based channel estimation The residual ie the signal component that cannot be explained through the known pilots and the channel model is used as interference estimate
Channel estimation by interpolation in time and frequency based on a scattered pilot grid is considered to be an efficient solution for an OFDM-based radio interface [WIND21 WIND23] In Appendix B42 a generic framework for the pilot design of GMC signals is described To this end a scattered pilot grid is applicable to any GMC signal Alternatively short time domain training symbols can be implemented for single carrier signals on the uplink
During the start of communication interpolation techniques with limited information about the channel conditions must be used An unbiased channel estimation scheme which does not require any information about the channel statistics is proposed and evaluated in Appendix F34 A robust interpolation filter which only assumes knowledge about the CP duration and the maximum velocity expected in a certain environment is another possible choice cf results in [WIND23] and Appendix F32 During operation statistical knowledge about the power delay profile and the Doppler spectrum is accumulated Channel interpolation utilizing this knowledge can improve performance significantly (see Appendix F33)
Especially in case of dedicated pilots purely pilot aided techniques may have severe limitations Conventional channel estimation by interpolation may then require a pilot boost andor a significant degree of over-sampling Advanced solutions such as iterative channel estimation aim to make a pilot boost redundant at the expense of increased complexity cf results in [WIND23] and Appendix F32 If an iterative receiver structure is already in place iterative channel estimation offers a good compromise between performance and complexity
Adaptive transmission requires channel prediction for use in the resource allocation Channel prediction can be based on common pilot symbols that are also used for other purposes It should utilise the channel correlation in time and frequency In Appendix B52 the results obtained by using Kalman state-space algorithms in the frequency domain for prediction are outlined Similar results are obtained with time-domain extrapolation of channel taps With these methods adaptive transmission becomes possible in the WINNER system at vehicular velocities The channel prediction accuracy estimates (covariances) are furthermore important inputs in the design of the link adaptation and resource scheduling schemes
WINNER D210 v10
Page 36 (180)
3 Medium Access Control (MAC) Layer The WINNER medium access control (MAC) system layer is designed as three MACs (modes)
bull FDD cellular MAC including multiple-access multi-hop and multi-antenna aspects
bull TDD cellular MAC including multiple-access multi-hop and multi-antenna aspects
bull MAC for peer-to-peer transmission at present based on the TDD physical layer mode
The first two have a largely identical design and are described briefly in the section below with additional details in Appendix C1 See also [WIND76] The peer-to-peer MAC is outlined in Section 32 with further details in Appendix C2
31 Medium access control for FDD and TDD cellular transmission
311 Goals and design principles The cellular MAC design supports and enables several innovative features of the WINNER system
bull The super-frame is designed with pilots that support self-organised synchronisation of all involved base stations relay nodes and user-terminals Having a synchronised network enables an improved spectral efficiency in two ways it makes large guard-bands unnecessary and simplifies interference-avoidance scheduling between cells and relay nodes
bull MACs for FDD and TDD cellular transmission support fast transmission and very low re-transmission delays over the RI These properties are key to attaining high spectral efficiency via adaptive schemes [WIND24] reliable communication through efficient re-transmission and high data rates for TCPIP traffic
bull Adaptive transmission is integrated into the design on all time scales Up to moderate vehicular velocities link adaptation and scheduling can be performed with fine granularity in the frequency domain (OFDMATDMA) This provides multi-user scheduling gains for mobile as well as stationary terminals For higher velocities the transmission only adapts to the path loss and shadow fading On a super-frame time scale the resource partitioning can adapt to the traffic demand over different transport channels
bull Multi-antenna transmission can be adjusted in a very flexible way per flow to obtain an appropriate balance between different objectives Obtaining multiplexing gains to boost throughput achieving robustness via diversity transmission and obtaining SDMA gains by transmitting flows to different user terminals over different spatial channels
bull Operation in spectrum shared with other operators who all use the same physical-layer WINNER mode [WIND63] will be an integral part of the design Operation in dedicated bands is seen as a special case of this situation Such single-system shared spectrum use has the potential of both improving the flexibility and simultaneously increasing the throughputspectral efficiency
bull The super-frame and the resource partitioning are designed to work efficiently in conjunction with inter-cell interference-avoidance schemes They are also designed for relay-enhanced cells so that base stations and a set of relay nodes can share the total spectral resources efficiently
In the design of the adaptive transmission system the different reaction times and control time scales of various control functions have been an important guiding principle The slower control functions have been placed as RRM functions in the control plane of the RLC system layer (see Appendix D1) The faster control functions are located in the MAC control plane while the fastest ones which directly control data flows are located in the MAC user plane To minimise transmission time delays due to communication between nodes a complete MAC layer is assumed to be implemented at each base station (BS) and at each relay node (RN) Thus all antenna resources belonging to a BS or a RN can be controlled tightly by the MAC system layer Cooperative multi-antenna transmission and distributed antenna systems are supported when all antennas are regarded as encompassing one BSRN
312 Control of relay-enhanced cells The MAC system layer is designed to work in relay-enhanced cells (REC) in which a set of nodes (RNs or BS) are linked to each other over the air (Nodes here refer to logical nodes cf [WIND35]) The BS but not the RNs has a fixed connection to the RAN The RNs may be used for improving the coverage
WINNER D210 v10
Page 37 (180)
within the cell or for extending the range of the cell Each RN is connected to one but not more BSs Some or all UTs may communicate directly with the BS If RNs are present some UTs may transmit toreceive from these RNs The MAC implemented in each RN controls those transmissions Thus the RNs essentially control separate sub-cells The MAC system layer controls flows over a single hop Flow QoS control over links spanning multiple hops is the responsibility of the RLC layer
While both heterogeneous and homogenous relaying is under consideration the cellular MAC design has focused on the more challenging case of homogenous relaying where RNs and BS use the same PLM and share spectral resources The total time-frequency resources are partitioned into parts used by the BS shared parts and parts used by RNs This partitioning is computed by RRM functions at a central location in cooperation with the MAC that is implemented at the BS It is then signalled to all RNs and UTs
313 The MAC services and tasks The MAC system layer for FDD and the TDD cellular transmission has a MAC protocol implemented in its user plane It also contains resource allocation and planning functions in its control plane It should provide the following services to the RLC system layer
bull Radio packet transfer ie transmission and reception over the radio interface of packets belonging to any of the transport channels defined below
bull MAC radio-resource control ie acceptance and execution of control messages
bull MAC control feedback ie messaging from MAC to RLC that supports the flow control the QoS control and the spectrum assignment and other functions at the RLC system layer
The WINNER transport channels are defined as being the interfaces between the RLC protocol layer (in the RLC system layer user plane) and the MAC protocol layer (in the MAC system layer user plane) They define the basic types of radio-packet transfer that are provided
bull Broadcast channel (BCH) for broadcasting system information from RLC and higher layers to all terminals inside the coverage area of the cell
bull Contention-based random access channel (RAC) for initial access to a BS or RN and also for BS-to-BS control signalling in the TDD mode
bull Contention-based direct access channel (DAC) for contention-based uplink data transfer
bull Common data channel (CDC) for scheduled point-to-multipoint communication
bull Targeted data channel (TDC) for scheduled point-to-point communication
bull Targeted control channel (TCC) for control-plane generated control messages
MAC flow control and resource allocation is performed two time scales That of the slot (half frame) and that of the super-frame (Section 314 below)4
bull Time-frequency resource partitioning and spatial scheme control is planned on a time scale of the super-frame (5ndash10 ms) The allocation to different transport channels is adjusted on this time scale based on the aggregated demand within each transport channel Unused chunks enable flexible spectrum use between WINNER operatorsusers and adaptive interference avoidance between neighbouring cells and parts of cells
bull Resource scheduling (RS) is performed on the time scale of the slot (034 ms) The scheduled flows are allocated to time-frequency-spatial resources in one of two ways Adaptive RS utilises the frequency-selective fading This requires processing of CSICQI feedback from the PHY layer Non-frequency adaptive RS uses a diversity-based transmission within the frame
Adaptive resource scheduling and support for adaptive transmission is a major feature of the design discussed further in Appendix C16 Detailed transmission schemes for adaptive transmission in both FDD and TDD modes have been presented in Section 31 of [WIND24] Key enabling features are here the use of chunks of appropriate granularity the use of in-frame control signalling to obtain tight feedback loops the use of channel prediction to enable adaptive transmission at vehicular velocities (Appendix B52) and appropriate schemes for compressing feedback information (Appendix B53) 4 We say that a function in a certain system layer works on a given time scale if the reaction time on a control
message need not be smaller than the time indicated by the time scale Thus the required adaptation speed of a given function that is distributed among different physical nodes is given by this time scale
WINNER D210 v10
Page 38 (180)
314 The chunk slot frame and super-frame structure As outlined in Section 1322 the basic time-frequency unit for resource allocation is the chunk During the later part of WINNER Phase I the transmission parameter examples outlined in Table 21 have been used for simulation purposes In the FDD physical layer modes chunks then comprise 8 subcarriers by 12 OFDM symbols or 3125 kHz times 3456 micros In the TDD physical layer mode the chunk dimension is 16 subcarriers by 5 OFDM symbols or 78125 kHz times 1080 micros Using the parameter sets of Table 21 an FDD downlinkuplink with 20 MHz FFT bandwidth is divided into 52 chunks on the 1625 MHz signal bandwidth A 40 MHz FFT bandwidth accommodates 104 chunks The TDD PLM with 100 MHz FFT bandwidth has 104 chunks on 8125 MHz signal bandwidth Please see Appendix C3 for a discussion on chunk dimensioning 5
The chunks are organised into frames In the TDD mode each frame consists of a downlink transmission interval followed by an uplink transmission interval denoted slots or time-slots In FDD the frame is also split into two slots Half-duplex terminals may be separated into two groups where one group has downlink transmission in the first slot and transmits in uplinks in the other while the other group uses the opposite scheme (Appendix C12) FDD base stations use full duplex
The frame duration has been set equal in the two PLMs to facilitate inter-mode cooperation With a frame duration of 6912 micros an FDD frame consists of two chunk durations with one chunk per slot A TDD frame consists of in total 6 chunks and two duplex guard intervals organised into a downlink slot and an uplink slot With downlink-uplink asymmetry 11 the TDD slot thus consists of three downlink chunks followed by three uplink chunks See the figure below The asymmetry ration could be varied from 51 to 15 but to provide sufficient time for signalling and scheduling calculations during the uplink slot in adaptive transmission it should not be set larger than 21
The super-frame (SF) is a time-frequency unit that contains pre-specified resources for all transport channels Figure 32 illustrates its preliminary design comprising of a preamble followed by nf frames Here nf = 8 resulting in super-frames of approximate duration 56 ms (It could be extended to eg 16 frames if required) The available number of chunks in the frequency direction could vary with the geographical location It is assumed that for the FDD DL and UL as well as for TDD there exist frequency bands that are available everywhere The preamble is transmitted in those commonly available bands The remainder of the super-frame may use other spectral areas that are available at some locations or to some operators but not to others All of these spectral areas are spanned by one FFT at the receiver and are at present assumed to span at most 100 MHz
Duplex guard time 192 micros
7812 KHz
03456 ms for 11 asymmetry
03456 ms chunk duration
15 OFDM symbols 12 OFDM symbols
Time Time
f f
8 subcarriers
16 subcarriers
20 MHz and 40 MHz FDD mode
100 MHz TDD mode
96 symbols 80 symb 3125 KHz
80 symb 80 symb
Figure 31 Summary of assumed chunk sizes in the two physical layer modes The figures show a slot (half of the frame) in each case assuming 11 TDD asymmetry
5 Note that the dimensions used here differ from the ones assumed in earlier deliverables such as [WIND24] in two
ways 1) The FDD chunk width in frequency has been doubled since the earlier narrower size contained few symbols and thus incurred a higher pilot and control overhead 2) In the TDD mode the chunks have been made shorter The TDD frame now contains six instead of two chunks This enables terminals to concentrate their transmission and reception in time and go into short power saving micro-sleep intervals in-between
WINNER D210 v10
Page 39 (180)
The subsequent main part of the super-frame is shared by the contention-based direct access channel (DAC) the scheduled data channels CDC and TDC and their related control signalling It also contains time-frequency-spatial resources that are not to be used due to interference avoidance constraints The resource partitioning (allocation) is performed in terms of chunks It is performed on a super-frame basis but it may be changed between super-frames The DAC resource is used both for the DAC channel and for the peer-to-peer transmission described in Section 32 below It is organised as a constant set of frequencies over the whole super-frame to enable the use of carrier-sense multiple access contention based transmission The resource partitioning is described in more detail in Appendix C11
RA
C (U
LD
L)D
L S
ynch
UL
Syn
ch
BC
H (D
L)
Freq
uenc
yFull System
Ban dw
idth
1664
Sub
-Car
riers
= 10
4 C
hunk
s
Figure 32 WINNER MAC super-frame example consisting of 8 TDD frames with asymmetry 11 a preamble and the DAC for contention based peer-to-peer communication The frame for TDD
cellular transmission with its chunk-based substructure has been enlarged
The super-frame is synchronous in all BS and RN In the FDD mode one super-frame is of course required in each of the paired bands The preamble has the following structure
bull At the beginning of each super-frame there are two synchronisation slots Self-organising synchronisation of terminals and network nodes as described in [WIND23] and Appendix B41 can be used on a super-frame basis by this design In the second slot each base stationrelay node transmits on four OFDM symbols The first the T-pilot is used for coarse synchronisation In the remaining three symbols each BS transmits on two adjacent subcarriers with the others set to zero On reception they are used for updating the UT synchronisations The first slot of three OFDM symbols the next super-frame is the uplink synchronisation slot Here all terminals transmit on the two adjacent subcarriers that were received strongest ie those that were used by the BSRN closest to them This part of the iteration is used for self-organizing synchronisation of the base stations and relay nodes which receive uplink synchronisation symbols from terminals at other BS that in turn synchronise to those BS In the FDD mode the UL synch slot is in the UL super-frame and the DL synch slot is in the DL super-frame
bull In-between these synchronisation slots a short timeslot over the whole band is reserved for the contention-based random access channel (RAC) plus a guard time This channel enables initial access to a BS or RN Placing the RAC and its guard time in-between the synchronisation slots gives the RAP sufficient time to process the uplink synch signal and adjust its synchronisation before transmitting the downlink synchronisation signal The RAC time-slot is in TDD system modes also used for BS-to-BS and RN-to-BS over-the-air control signalling
bull Subsequently a set of OFDM symbols carries the downlink preamble control transmission It contains the broadcast control channel (BCH) messages from the RLC layer It also contains a control message that specifies the overall resource allocation used within this super-frame
WINNER D210 v10
Page 40 (180)
315 Overview of main functions
MAC Services Control plane
interface
PHY Services
MAC Control
Feedback
MAC Radio Resource Control
Special Transmit Control
Signalling
PHY Measure-
ments
Constraint Processor
Flow State Controller
Spatial Scheme Controller
Resource Partitioning
Resource Scheduler (RS)
Non-frequency adaptive resource
scheduling
Adaptive resource sched
MAC CONTROL PLANE
Space-time-frequency link adaptation and scheduling
Queue state control
Transfer control Control of MAC-5 - MAC-1 protocols
Pre-config
Spatial scheme Selection
Constraint combining
Spectrum assignment negotiation support
RN assigment
DAC a ssignm
TDC adaptive assigment
MAC USER PLANE
Flow setup
Flow term
Calibration
Measure- ments
Non- frequency adaptive Transfer
BCH SF Control Tr
Transmit control proc (+ protocols)
Measurement proc (+ protocols)
Figure 33 FDD and TDD cellular MAC control functions Services and main function blocks
The MAC layer is subdivided into a control plane and a user plane The PHY layer is not subdivided in that way as all essential control functions for the physical layer reside in the MAC The main MAC control function blocks are illustrated in Figure 33 Control functions that directly control packet transmission on a slot time scale reside in the user plane Slower functions reside in the control plane
bull Resource partitioning Partitions the super-frame into sets used for adaptive non-frequency adaptive and DAC transmission as well as into chunks reserved for use by RNs BS-to-RN relay links and as guards for interference avoidance with respect to other cells and operators
bull Spatial scheme control The appropriate spatial transmit scheme is determined for each flow and it is held fixed within a super-frame It is influenced by many parameters including PLM deployment transport channel type cell load traffic type BS antenna configuration terminal capabilities propagation channel and interference conditions Further support functions related to spatial processing like calibration are invoked if required
bull Flow setup and termination performs flow context establishment and release over one hop supervised by the RRM flow establishment and release functionalities in the RLC system layer
bull Constraint processor Combines constraints on the use of chunks and chunk layers These arise from interference between user terminals interference avoidance scheduling with neighbouring cells and spectrum sharing between operators The output is in the form of chunk masks that define restricted use of a super-framersquos chunks The constraint processor also processes measurements that support the RRM spectrum assignmentnegotiation at the RLC system layer
bull Flow state controller Controls the segmentation and FEC codingdecoding of packets and monitors the states of RS queues It also controls the activesemi-activepassive state of flows
bull Resource scheduler (RS) Includes adaptive and non-frequency adaptive scheduling algorithms and control of spatial link adaptation Power control in both uplinks and downlinks is performed under the control of the resource scheduler and is integrated into the optimisation of the transmission parameters The MAC RS cooperates with the RLS layer flow scheduler Sect 41
WINNER D210 v10
Page 41 (180)
MAC Services User plane interface
PHY Services
Radio Packet
Transfer
Radio Packet
Transfer
Adaptive Transfer
BCH SF Control Tr
Adaptive Transfer
RAC Transfer
DAC Transfer
Non-frequency Adaptive Transfer
Non- frequency adaptive Transfer
DAC Transfer
(MAC-4) Add CRC
RTU
Per-flow queuing of FEC blocks
in RSB
(MAC-3) Optional segmentation
Encoding block
(MAC-2) FEC coding FEC block
(MAC-4) CRC check ACKNACK
Soft combining at received
retransmission
(MAC-5) Reassembly of MAC SDU
(MAC-2) De-interleaving
and FEC decoding
Resource Mapping
Map on chunk layers for adaptive transmission
Map on set of chunk layers for non-frequency adaptive transmission
Map on resources reserved for DAC
Map BCH packets into SF preamble symbols
BCH RAC
BCH (in UT) RAC
TDC DAC CDC (in UT)
MAC USER PLANE Transmitting MAC entity
Receiving MAC entity
DAC
(MAC-5) Optional
segmentation TDC
TDC CDC
BCH SF Control Tr
RAC Transfer
(MAC-3) Reassembly
of enc blocks
TDC CDC DAC
TDC CDC DAC
BCH
RAC
SLC Cache (per-flow queues)
Figure 34 FDD and TDD cellular MAC User-plane services and packet processing
The data flows in the user plane shown in Figure 34 are processed by three groups of functions
bull Transmission Segmentation encoding and buffering The flow state controller supervises this sequence Protocol sub-layers MAC-1ndashMAC-5 control the transmission and are parameterised to describe the different retransmission options (HARQ) A MAC SDU is drained from the SLC Cache TDC or DAC packets may be retransmitted Retransmission can be an option also for CDC point-to-multipoint flows The TDC CDC or DAC packet is optionally segmented A CRC sequence is added resulting in a Retransmission unit (RTU) The RTU may optionally be segmented into encoding blocks that are encoded separately Coding and interleaving results in FEC blocks which are buffered in the RS buffer on the transmitter side in one or several queues per flow There they remain until acknowledged or dropped BCH and RAC-packets are transmitted in the super-frame preamble without retransmission
bull Resource mapping At transmission bits from TDC flows are mapped either on chunks reserved for adaptive transmission or on the sets of chunks intended for non-frequency adaptive transmission CDC (multicast) flows should use non-frequency adaptive transmission DAC packets are mapped on the contention-based physical channel For TDC and CDC puncturing of the buffered FEC block may be performed and only a part of a FEC block may be transmitted in a scheduling round that comprises a time-slot
bull Reception Decoding and reassembly The flow state controller supervises the reception De-interleaving and FEC decoding is first performed for received FEC blocks belonging to TDC CDC or DAC packets followed by the (optional) re-assembly of the RTU Then the retransmission unit is optionally checked for transmission errors and a retransmission may be requested The MAC SDU is finally re-assembled BCH and RAC packets are received separately in the super-frame preamble and then decoded
WINNER D210 v10
Page 42 (180)
316 Resource mapping and multiple access In [WIND26] different multiple access (MA) techniques were assessed for multi-carrier as well as for single-carrier transmission Subsequently a set of schemes has been selected as baseline choices for use within the WINNER system Several of the initially considered schemes turned out to useful The key distinguishing feature for selecting MA scheme turned out to be not the deployment scenario but instead the use of adaptive or non-frequency adaptive transmission which place different demands on the utilised resources The multiple access schemes will therefore differ for different flows Flows scheduled for adaptive and non-frequency adaptive transmissions are mapped onto the separate sets of chunks earmarked for these two purposes by the SF resource partitioning (Figure 35) The mappings use different MA schemes
bull Adaptive transmission (DLUL) uses chunk-based TDMAOFDMA Flows are mapped onto individual chunk layers with individual link adaptation per chunk layer The mapping is exclusive within the cells ie each chunk layer carries data from only one flow
Chunks are designed to work well for adaptive transmission See Appendix C3 for a background on the reasoning used for dimensioning the chunk sizes In a non-frequency adaptive transmission that is based on channel averaging there would be a problem in attaining sufficient frequency diversity when transmitting small packets when the packets are mapped directly onto chunks A small RTU or control packet may fill only one chunk Two schemes that increase the diversity significantly are selected
bull In non-frequency adaptive downlinks MC-CDMA is used within the assigned set of chunks In the downlink spreading may thus be used to code-multiplex the flows onto sets of chunks assigned for non-frequency adaptive transmission When code multiplexing is used spreading is performed only within chunks to minimise non-orthogonality of the received signals Orthogonal signalling (TDMA per OFDM symbol or FDMAIFDMA per subcarrier without code-multiplexing) are special cases of the scheme They may be used when appropriate
bull In non-frequency adaptive uplinks TDMAOFDMA is used on an OFDM symbol basis For non-frequency adaptive transmission in the uplink code multiplexing is not used to avoid the need for multi-user detection Instead TDMA is used on an OFDM symbol basis Several uplink flows with small FEC blocks may share one OFDM symbol (OFDMA) to improve the rate matching (Figure 35 middle part) Either OFDM or frequency-domain generated serial modulation can be used in the uplinks
Compared to chunk-based OFDMATDMA these schemes provide increased frequency diversity and resources of shorter duration The shorter time duration (mapping on individual OFDM symbolsGMC slots) provides increased opportunities for terminals to go into power-saving micro-sleep intervals
Time Time Time
FDMA TDMA MC-CDMA
Frequency
Frequency
Frequency Chunk for for non-frequency adaptive transmission
Chunk for adaptive transmission
Mappings for one flow
Figure 35 Illustration of the mapping of one flow on the chunks earmarked for non-frequency adaptive transmission when using FDMA TDMA or MC-CDMA within the set of chunks
The selected multiple access schemes have been evaluated and compared to several alternatives in Appendix G A summary of relevant results is given below and an additional discussion can be found in Section 533
WINNER D210 v10
Page 43 (180)
For the case of adaptive transmission a gain was not surprisingly found when concentrating the transmitted packets to individual chunks instead of spreading them out over the slot Spreading them out over all frequencies by eg MC-CDMA or TDMA would average away the channel variability Lowering the cannel variability reduces potential multi-user scheduling gain In Appendix G41 (single-carrier) TDMA that allocates the whole 20 MHz band to only one user is found to result in a reduced multi-user scheduling gain See also Section 3153 in [WIND24] where OFMD-based TDMA was compared to TDMAOFDMA
The chunk sizes have been designed to be appropriate for the transmission scenarios used with reasonably flat channels within chunks Therefore as shown in Appendix G43 very little can be gained by sharing chunk layers between flows if the throughput is to be maximised As shown in Appendix G14 and Section 33 of [WIND24] chunk sharing can be of advantage in a special case There are many flows that have the very strict delay requirements and a guaranteed throughput in each slot (034 ms) While such delay constraints are extreme for user data they are applicable for retransmissions and for time-critical control information Appropriate transmission schemes for these will be studied in WINNER II
For non-frequency adaptive transmission G42 illustrates the improved performance obtained by paritioning the transmission over a set of resources whose channels have high diversity As noted above different methods can be used MC-CDMA symbol-based TDMA or subcarrier-based OFDMA The performance differences between them were investigated and were found to be rather small Of these schemes MC-CDMA provides the highest diversity In Appendix G11 it is concluded that MC-CDMA outperformed OFDMA in terms of cell throughput for all considered loads and scheduling algorithms In Appendix G12 MC-CDMA provides some advantage while in Appendix G13 OFDMA is found to provide slightly superior performance Explanations for these differences are discussed in Section 533
None of the so far performed investigations added the effect of spatial diversity schemes It can be expected that the additional use of spatial diversity will lessen the requirement for frequency diversity This would simplify the resource partitioning problem (Appendix C11) that includes selecting appropriate sets of chunks for adaptive and non-frequency adaptive transmission
32 Medium access control for peer-to-peer transmission The WINNER system supports peer-to-peer (P2P) and peer-to-multi-peer (PMP) transmission between user terminals under the control of a master device as illustrated in Figure 36 The role of the master will be taken by the base station while the terminals act as slaves All user terminals participating in the peer-to-peer communication are synchronised in time to the masterrsquos clock and use the contention-based direct access channel (DAC) to exchange user data with their peers and control information with the master In the absence of a BS a user terminal can also take on the master responsibility if it is equipped with some additional network management functions
Figure 36 Network topologies for peer-to-peer communication
321 MAC architecture for P2P transmission In the WINNER system peer-to-peer transmission between user terminals is at present designed to be provided by the TDD physical layer mode Other alternatives will be considered at later stages In Section
BS
UT
UT
UT
UT
control
data
UT
UT
P2P
PMP
BS
UTUT
UTUT
UTUT
UTUT
control
data
control
data
UTUT
UTUT
P2P
PMP
WINNER D210 v10
Page 44 (180)
31 and Appendix C1 a MAC is specified for controlling this physical layer in cellular deployment scenarios Although it supports the exchange of user data between UTs via a base station it does not allow the direct data transfer between terminals To enable P2P communication some new services and functions have to be added to the control- and user-plane of the basic TDD cellular MAC (see Figure 37)
The MAC layer services for P2P transmission are integral part of the radio_resource_control and radio_packet_transfer service The P2P-specific services are provided to higher layers at the MAC_P2P_CONTROL and MAC_P2P_USER service access point (SAP)
The MAC layer services are implemented by adding P2P-specific protocol functions to the main function blocks of the TDD cellular MAC In the control plane of the MAC the resource partitioning unit has to comprise the DAC assignment function for controlling the allocation and release of radio resources The flow setup and termination unit is extended with functions required to setup and terminate P2P data flows over the DAC These include functions for transmitting and receiving DAC-specific broadcast control information attaching and detaching UTs to the service provided by the P2P-DAC and setting-up and terminating synchronous P2P-flows between UTs In the flow state controller functions are provided for controlling the transmission and reception of radio packets over the DAC The control of packet segmentation FEC coding and retransmission is executed by these functions The flow state controller also contains functions required to give UTs random access to the P2P-DAC for transmitting control messages to the BS and exchanging P2P data in a contention-based manner between peer terminals In the user plane of the MAC additional functions are provided to multiplex control information and user data onto the DAC and to extract control information and user data from a received decoded radio packet Note that other MAC functions not directly related to the P2P-DAC service are not shown in Figure 37
322 Frame structure of DAC for P2P transmission The direct access channel is embedded into the super-frame structure of the TDD physical layer mode as shown in Figure 32 Successive DAC frames are thus always separated by a preamble that is used to keep time synchronisation between the master and all user terminals involved in P2P transmission
As shown in Figure 38 a DAC frame is further subdivided in three parts namely the control period the contention-access period and the guaranteed-access period The length of the control period is given by the duration of a TDD DLUL frame of a scheduled targetcommon data channel (TDCCDC) The length of each access period takes on a multiple value of the basic time slot size of 03452 ms and may dynamically change from super-frame to super-frame
bull The control period (CTP) is composed of two time slots for exchanging MAC control information between the BS and UTs The first slot is formatted such that firstly beacon frames
Figure 37 MAC services and functions for peer-to-peer transmission
RadioResourceControl
RadioPacket
Transfer
MAC_P2P_CONTROL SAP MAC_P2P_USER SAP
Control Plane User Plane
segmen-tation
DAC Transfer
add CRC for retrans-
mission
FEC coding
resource mapping to
DAC
reassembly
FEC decoding
multiplex to DAC frame
retrans-mission
de-multiplex from DAC
frame
Resource Partitioning
DAC assignment
DAC P2P Flow Setup and Termination
P2P-DAC beacon control
attach detach to P2P-DAC
setupterminatesynchronous
P2P-flow
Flow State Controller
P2P-DAC transfer control
P2P-DACchannel
access control
MAC-P2P Services
MAC-P2P Functions
PHY Services
RadioResourceControl
RadioPacket
Transfer
MAC_P2P_CONTROL SAP MAC_P2P_USER SAP
Control Plane User Plane
segmen-tation
DAC Transfer
add CRC for retrans-
mission
FEC coding
resource mapping to
DAC
reassembly
FEC decoding
multiplex to DAC frame
retrans-mission
de-multiplex from DAC
frame
Resource Partitioning
DAC assignment
DAC P2P Flow Setup and Termination
P2P-DAC beacon control
attach detach to P2P-DAC
setupterminatesynchronous
P2P-flow
Flow State Controller
P2P-DAC transfer control
P2P-DACchannel
access control
MAC-P2P Services
MAC-P2P Functions
PHY Services
WINNER D210 v10
Page 45 (180)
can be broadcasted from the BS to the UTs to announce the format of the current DAC frame and to communicate management information to the terminals and secondly send DL MAC commands from the BS to a dedicated user terminal In the second time slot user terminals can send UL commands to the BS and exchange MAC protocol messages with peers Random channel access for the involved terminals is provided by using a time-slotted ALOHA protocol
bull The contention-access period (CAP) may be used to asynchronously transmit protocol messages andor small amount of user data peer-to-peer between user terminals Since several UTs can simultaneously access the CAP the possible contention for medium access is resolved by using a carrier sense multiple access protocol with collision avoidance (CSMA-CA)
bull The guaranteed-access period (GAP) consists of time slots of fixed length and is used for asynchronous and synchronous P2P transmission between user terminals Channel access in the GAP of the DAC frame is based on a TDMA method in which one or several time slots can be allocated to two or more UTs for peer-to-peer communication For synchronous transmission time slots are allocated to the UTs on a regular basis in successive DAC frames without limit in time while for asynchronous transmission a sequence of consecutive time slots is allocated to start at any arbitrary time instant the transfer of a fixed amount of data The time slot allocations in the current DAC frame and their usage are broadcasted in the beacon field of the control period
Figure 38 DAC frame structure for peer-to-peer transmission
8 TDD frames = 8 x 06912 ms = 553 ms
contention access period (CAP) guaranteed access period (GAP)
bea
con
asynchronous and synchronous
P2P data transmission
asynchronous P2P data and
P2P command transmission
Time slot 03452 msTime
DL
com
mand
UL
com
mand
control
period (CTP)
DL UL
8 TDD frames = 8 x 06912 ms = 553 ms
contention access period (CAP) guaranteed access period (GAP)
bea
con
asynchronous and synchronous
P2P data transmission
asynchronous P2P data and
P2P command transmission
Time slot 03452 msTime
DL
com
mand
UL
com
mand
control
period (CTP)
DL UL
WINNER D210 v10
Page 46 (180)
4 Radio Resource Management (RRM) and Radio Resource Control (RRC)
41 RRM functions Although the term radio resource management (RRM) is often used as a general term for numerous algorithms and protocols used to govern the radio resources it is in the context of WINNER reserved to denote the control functions implemented in the RLC system layer control plane Other functions related to management of radio resources such as scheduling link adaptation and power control were described within the MAC chapter (Chapter 4) The overall goal is to utilise the given radio resources in an efficient manner The WINNER RRM framework handles flows rather than UTs A flow is a packet stream from one source to one or several destinations classified by QoS requirements source and destination(s) One of the WINNER RRM advantages is that it handles the handover process per flow rather than per UT Therefore a UT might sendreceive traffic over different cells and routes that match best the requirements of the specific flow Additionally it includes functionalities for coordinated spectrum sharing with other radio access networks using the same radio access technology as well as for spectrum sharing with other radio access technologies Finally unlike in existing systems admission control is not responsible for only admitting a new or handover flow to a new cell but also for selecting the best cell among a group of candidate cells that are nominated by the micro mobility functionality A summary of the RRM functionalities studied herein can be found below while more details are given in Appendix D
Spectrum control Spectrum control coordinates flexible spectrum use between multiple WINNER RANs and spectrum sharing with radio access systems using some other radio access technology (RAT) To have more tractable problems spectrum control is divided into two components namely spectrum sharing coordinating spectrum sharing with systems using other RAT and spectrum assignment providing flexible spectrum use between WINNER RANs Spectrum sharing controls the access to the spectrum in frequency bands which are shared with other RATs which are probably legacy systems Spectrum assignment is divided further into long-term spectrum assignment providing slowly varying spectrum assignments for large geographical areas and Short-term Spectrum Assignment providing short-term local variations to the large-scale solution The detailed implementation of these functionalities remains an open issue and further development will be carried out in Phase II
Service level control (SLC) The SLC performs the management between flows of the same user andor between different users and is specific for a population of users (eg the population within one cell or sector) The SLC provides means to allocate network resources to the traffic associated with the different applications and end-user services (ie not radio interface services) The service differentiation is exercised through three different (and parallel) service components namely flow Conditioning flow queuing and flow scheduling The SLC also comprises a flow monitoring service component to provide feedback on eg load predictions The flow scheduling controls the resource scheduler and the interaction between these two schedulers is assumed to work as follows The flow scheduling should ensure that a sufficient amount of packets are residing in the SLC cache to enable high multi-user gains (ie based on predictions about the current rate the flow scheduling aims at keeping the overall SLC cache content at some predetermined level eg corresponding to what (on average) may be transmitted within 5 ms) At the same time the resource scheduler must guarantee that it will (to the furthest extent possible) transmit the packets in the SLC cache within a small amount of time eg in less than 10 ms Otherwise the resource scheduler could create head-of-line blocking and too much delay Effectively this means that the ultimate decision about if and when (within a few ms timeframe) a packet is transmitted lies with the flow scheduling since the resource scheduler sooner or later has to schedule the packets assigned to it This also means that service classes are transparent to the resource scheduler Nevertheless the interface between SLC and RS is still under investigation eg the resource scheduler may also be made aware of the service classes (or at least some priorities of the different flows) to support work-conserving packet pre-emption (ie that a higher priority packet can pre-empt the transmission of a lower priority packet destined for the same node) as well as to give preferential treatment of eg network control signalling packets
WINNER D210 v10
Page 47 (180)
ModeRAN selection Algorithms for the selection of one or several modesRANs to serve a particular flowuser The mode selection can be made on different time scales These include per call or session (slow selection) per packet (fast selection) or triggered by non-traffic related events like changes in radio conditions (mode re-selection) More frequent mode selection leads to larger potential capacity and quality gains (through exploitation of ldquomode-selection diversityrdquo) but can increase signalling load In some cases mode selection will require user interaction or be dictated by an application (also referred to as slow selection or even re-selection) The mode selection can either be controlled by a node in the fixed part of the network a base station a relay node or by the user terminal If one operator runs the network this operator likely prefers network controlled mode selection If the network is run by different operators terminal based mode selection is more likely
Handover
Algorithms for handover between two cells of the samedifferent mode (intra-system) as well as different radio access systems (inter-system) are studied In order to allow for a seamless handover within the WINNER RAN BSs and RNs of the same or different mode can announce their presence to the UTs by broadcasting control messages using orthogonal resources This scheme is especially helpful for the handover between WINNER FDD and TDD as it allows the UTs to be aware of the presence of BSs and RNs that operate at a different mode without disrupting their normal operation to ldquosniffrdquo other parts of the spectrum The case of an inter-system handover between WINNER and legacy RANs is expected to take place either due to loss of coverage of the current system or in case of overlapping coverage due to useroperator preferences or traffic congestion One solution could be to extend the inter-system handover based on the common RRM (CRRM) framework defined in the 3GPP Another approach could be location-based handover where user terminals (UTs) make use of foreign measurements and location information An inter-system handover is performed with the assistance of the cooperative RRM (CoopRRM) entity
Admission control (AC)
The AC ensures that the admittance of a new flow into a resource constrained network does not violate the service commitments made by the network to already admitted flows The decision is based on information such as load prediction statistics of current flows resource restrictions and physical layer measurements It is assumed that flow statistics will include
bull throughput per flow in previous super-frame
bull time-frequency-spatial resource use per flow
bull spare capacity within cell in previous super-frame
bull path loss estimate and
bull interference estimates
In case of limited resources in the candidate cells a number of different actions may be taken
bull reduce requests for connectionflow in question andor for lower priority flows
bull resource re-partitioning
bull lower load in (interference from) neighbouring cells
bull handover flows (cellmodeRAN)
bull drop flows
In the case of multiple RANs and multiple technologies the admission control must take into account the individual characteristics of each technology in order to make the final decision about admitting or rejecting a user in the network
Load control The load control algorithm is triggered in order to ensure that the system is in stable state It calculates the predicted load per cell based on information such as load prediction statistics of current flows and resource restrictions In particular
WINNER D210 v10
Page 48 (180)
bull The preventive load control takes care so that the network does not get overloaded and remains stable and attempts to improve the system performance by distributing userssessionsresources among cellssectors
bull The reactive load control attempts to bring the load back to stable regions as fast as possible
bull The load sharing aims to distribute the load (the offered traffic) andor resources between ldquoresource ownersrdquo (BSs and RNs) such that the resources are efficiently utilised
Potential actions for a ldquocongested cellrdquo are taken Examples are
bull interaction with the service level controller and restriction of incoming traffic
bull denial of new flow requests
bull change of TDD asymmetry factor
bull reduction of requests (eg bit rates) for flows (within limits as specified in the flow QoS specification)
bull attainment of more resources by resource re-partitioning or lower load in (ie lower interference from) neighbouring cells
bull handover of flows to another cellmodeRAN
bull dropping of flow(s)
Routing
Algorithms for the selection of the appropriate routepath per flow It is expected that several paths to a BS will exist due to the deployment of relays From the architecture perspective two basic routing strategies are envisioned in multi-hop systems centralised or distributed Under the centralised strategy route determination is performed in a central controller which normally possesses powerful processing capability and has knowledge on global network status so that sophisticated routing algorithms could be adopted to optimise the system performance With the distributed strategy individual network nodes from the source to the destination jointly perform route determination This strategy could function when no central controller is reachable but its performance is normally limited by network nodesrsquo processing capability and knowledge on network status
42 WINNER RRM architecture As previously described the WINNER radio interface will encompass a number of modes each of them targeted and optimised for a specific deployment scenario (and possibly also user scenario) Nevertheless many of the RRM functions may be shared between the different WINNER modes (eg admission control) Hence the RRM functions could be classified within the three following categories
1) Mode -specific RRM functions These are targeted and optimised for a specific mode and deployment scenario in terms of using different parameters specific to the current mode used In the MAC system layer they include scheduling power control and link adaptation In the RLC control plane they include intra-mode handover and routing
2) Generic RRM functions These are shared between the different WINNER modes or used for their coordination and include spectrum assignment service level control mode selection buffer management traffic policing admission control congestion control and inter-mode handover
3) Cooperative RRM functions which are used for the cooperation of the WINNER system with legacy RANs such as UMTS and WLAN and reside in the Cooperative RRM (CoopRRM) entity These include spectrum sharing inter-system handover admission control congestion control and RAN selection
It is very likely that an overlap between the generic and mode-specific RRM functions will exist where the generic part will administrate the mode-specific part For efficient management of the resources the location of the RRM functions within the network architecture is an essential issue as it can affect the performance of the network due to extensive signalling and delays In a centralised RRM architecture a central entity monitors and makes decisions regarding the allocation of the resources and it is usually located in a node at the RAN while user terminals have minimal role For example in UMTS most of the RRM functionalities are located in the Radio Network Controller (RNC) In addition terminals and Node B also contribute to parts of RRM in terms of power and load control In a distributed RRM architecture the decision entities for each resource management function are located in different nodes including the
WINNER D210 v10
Page 49 (180)
user terminal Furthermore in a hybrid approach different decision levels of the same RRM functionality that work at different time scales are located in different nodes
It is envisaged that for the WINNER system with the multiple operating modes the hybrid approach will be suitable In particular extensive delays in the decision making and signalling overload can be avoided by bringing some of the control plane functions closer to the BSs physical nodes Clearly this adds more complexity to the BSs physical nodes and therefore increases their cost However assuming different types of BSs for the wide-area and short-range scenarios we could restrict the extra functionality to the wide-area BSs (BSwa) In particular the WINNER vision is that the cells of the different modes will coexist and overlap either completely or partially This feature could be used in favour of the RRM architecture as the mode generic control plane functions that concern the coordination of the different modesBSs could be moved to the BSwa making the BSwa responsible for the control and allocation of resources per wide-area cell including all short-range BSs (BSsr) that fall within its coverage A requirement for such an approach would be the definition of a communication link between the BSwa and BSsr This link could be either wired or wireless (eg part of the FDD mode interface) More discussion on the RRM architecture can be found in Appendix D
43 Radio resource control The RRC provides the signalling for these RRM functions control measurements and reports Examples of RRC functionalities are
bull Broadcast of information related to the network
bull Control of broadcast
bull Establishment maintenance and release of an RRC connection between the UT and WINNER RAN
bull Assignment establishment reconfiguration and release of PHY resources
bull Feature discovery (antenna configuration relays etc)
bull Control of requested QoS
bull Measurement reporting and control of the reporting
bull Power control (slow)
bull Paging
bull Initial cell selection and cell re-selection
bull RRC message integrity protection
bull Timing advance
bull Control of synchronisation
bull Scanning of PHY resources
bull Control of masterslave mode (P2P)
The RRM measurements may be performed regularly upon request or triggered by some event To achieve the best possible performance the time period of the measurements should be chosen such that it may track the variations of the measured quantity However since some quantities (like a fading radio channel) undergo not only short-term but also long-term variations lower measurement frequencies may still be useful Moreover the measurement frequency may be adaptive adjusting the time period according to the variation of the measured quantity Similarly as for the measurements the reporting of the measurements can be performed periodically upon request or be event triggered The measurement reporting strategy that will be studied further in Phase II should not be selected independent of the measurement strategy We may distinguish between the case in which the measurement data itself is reported to the network and the case in which the measurement data is processed in the UT and only a RRM command is reported back to the network Further details are given in Appendix D
431 RRC states In order for WINNER to be harmonised with the 3GPP LTE work the same RRC states are proposed
WINNER D210 v10
Page 50 (180)
Dormant
Idle Detached
Active
Dormant
Idle Detached
Active
Figure 41 RRC states
These are
bull UT Detached
o The location of the UT is not known by the network (eg UT is switched off or operating on another RAT system)
bull UT Idle
o UT performs periodic search for higher priority RAN
o UT performs cell selection and reselection
o UT monitors broadcast and paging channels
o Inherently power saving state
o UT is handled by radio access network gateway (RANG)
bull UT Active (identical to the UTRAN CELL_DCH state [3GPP-TS25331])
o UT is transmittingreceiving data on traffic channels
o UT monitors the directedcommon control channels continuously
o There is a power saving sub-state within the Active state This is the dormant sub-state where the UT is ready to transmit or receive data on traffic channels and monitors the control channels discontinuously
o UT is handled by BS
WINNER D210 v10
Page 51 (180)
5 Assessment Overview
51 General Assessment of the performance of the developed system concept is an important aspect of the WINNER project In the case of WINNER the assessment work has been carried out to some extent by theoretical analysis but mostly by computer simulations In WP2 different kinds of simulations are required
bull link level simulations where the performance of the transmission and reception schemes under study are simulated with the selected fading channel models
bull multi-link simulations where multiple radio interface links are simulated simultaneously and thus effects of interference between users can be studied in detail
bull system level simulations where a coarser view of the physical layer is taken and higher level system functionalities are studied
At the link level simulation activities have been focusing on the following topics
bull channel coding schemes
bull novel modulation techniques
bull channel estimation
bull synchronisation
bull link adaptive transmission schemes
On the system and multi-link level the number of simulation alternatives is significantly higher Emphasis has been put on
bull multiple access technologies (TDMA FDMA CDMA SDMA and combinations thereof)
bull resource scheduling (frequencytime adaptive or non-adaptive)
bull spatial processing
bull multi-user detection
In addition implementation impact in terms of computational complexity and RF requirements are vital to consider The outline of the rest of this chapter is as follows In Section 52 the main challenges in performing the assessment work are discussed in Section 53 performance results implementation impact and performance-complexity trade-offs are discussed and in Section 54 comparisons with requirements and design targets from Section 11 and Appendix A are made
52 Challenges In the assessment work within WINNER WP2 there are two major challenges discussed in the following along with the strategies used to cope with them
1 There are a huge number of details and possible combinations of different functionalities In order to carry out a comprehensive assessment of the system concept all realistically possible combinations would have to be assessed and the associated performance checked However for a complex system as WINNER a fully comprehensive assessment is simply not possible to carry out with any reasonable amount of resources It is thus important to carefully select the areas on which the assessment work is focused The broad experience in designing communication systems that the WINNER personnel possesses helps significantly in this focusing and different partners have taken on to study different key aspects Also earlier results in previous WINNER deliverables are reused whenever possible to obtain as broad and accurate assessment as possible of the system capabilities
2 As different partners provide results it means that special emphasis needs to be put on the calibration and cross-verification of the simulation environments in order to ensure that system components are modelled in a similar manner in different simulators At link level the calibration is a straightforward operation and easy to carry out In the system level simulators the calibration is a much more challenging task due to significantly higher complexity larger number of parameters and larger number of issues (eg radio propagation related traffic
WINNER D210 v10
Page 52 (180)
models functionalities of the system etc) that need to be modelled Moreover the setup of one gigantic system simulator covering all aspects of a system in one study is simply not feasible Hence smaller system simulators dedicated to a specific topic studied by a partner can often provide more technical insight This fact is clearly reflected in the evaluation results in the appendices Link level results (Appendix F) from different partners are typically jointly presented in the same graphs whenever appropriate whereas multilink and system level results (Appendix G) from different partners are normally presented in different sections each with its own topic A detailed set of common simulation assumptions have been specified (Appendix E) to make the different studies as comparable as possible but nevertheless comparisons of absolute system-level performance between different partners cannot normally be directly made as the results may be sensitive to several details in the modelling approach
53 Summary of results ndash performance and complexity This section summarises major findings regarding performance and implementation issues the details of which can be found in the appendices of the present deliverable (primarily Appendix F and Appendix G) and in earlier WINNER deliverables It should be noted that many additional results not directly discussed here can be found in the deliverables [WIND23] [WIND24] and [WIND26]
531 Analogue RF In analogue RF implementation no major showstoppers have been identified With the assumed SNR requirement of 30 dB the RF sections of handheld terminals can be constructed using high-end components of today and the required components are expected to be available for the mass market when WINNER systems are to be deployed Zero-IF RF architecture seems to be the most promising solution Power consumption of analogue parts is generally expected to be within acceptable limits but with some restrictions for the use of higher order modulation schemes in combination with the large signal bandwidths and multiple antenna techniques However it is clear that power consumption in user terminals can become a limiting factor since the development of battery and heat dissipation technologies is not expected to be as rapid as the development of other analogue parts or the digital processing technologies
The requirements for the asynchronous TDD network (where interference between UL and DL on adjacent carriers may be substantial) with TDMA were found technically unfeasible taking into account the significant performance degradation and loss of area coverage To overcome this problem either synchronised networks or channel specific RF filtering should be used The latter is costly spectrally inefficient and unattractive to handheld terminals due to large size Therefore synchronised networks for TDD operation are strongly preferred
European and international electromagnetic field (EMF) exposure requirements and standards [HP98][OJEC99][CENELEC01] will be possible to fulfil for user terminals with the uplink output power levels used in the evaluations in this deliverable (200 mW for handheld device and 400 mW for laptop) and with designs and intended use similar to those of existing 2G3G terminals With downlink power levels and antenna installations similar to those used for 2G3G the EMF exposure requirements and standards [HP98][OJE99][CENELEC02] for radio base stations will also be fulfilled
532 Digital baseband In the following subsections the different components of a transmitterreceiver chain are first discussed individually An assessment of the overall link throughput is then provided followed by a subsection focusing further on multi-antenna aspects
5321 Forward error correction Decoding of the error control code is typically a dominant factor in the digital baseband processing complexity especially for single antenna systems On the other hand advanced forward error correction schemes based on iterative decoding provide substantial improvements in link layer performance
In this report the performance and complexity of two main candidate techniques DBTC and BLDPCC have been compared in detail (cf Appendices B2 and F2) The main finding is that DBTC provides best performance when the block length of the code is small while BLDPCC provides better performance at large block lengths The threshold block length where the advantage changes from one code to the other depends on the code rate DBTC show good performance already at block sizes around 100 information bits so CC might not be required for error control coding in the WINNER radio interface This is subject of further study The performance differences are in many cases rather small (lt05 dB) and other factors
WINNER D210 v10
Page 53 (180)
than performance may also affect the selection of coding technique BLDPCC show slightly lower (maximum) decoding complexity than DBTC ndash and provides the inherent capability to reduce power consumption when channel conditions are good
Overall the assessment showed that even for these advanced coding schemes decoders are expected to be implementable for data rates of 300 Mbps and beyond (see Appendix B21) in particular given the predicted increase in semiconductor computational power and the advances in parallelisation of decoding techniques The peak data rates of 1 Gbps can be somewhat challenging not only due to the power consumption but also due to increased clock rates at which the limits of the digital processing hardware (with respect to scaling and clocking limits current leakage heat dissipation etc) become more and more visible For these reasons solutions like lower complexity codes and even analogue decoding should be kept in mind Encoding of the error control code is of negligible complexity for all considered coding schemes
DBTC and BLDPCC represent the state of the art and such techniques are also under discussion in multiple standardisation activities [3GPP-WG142][80211n04][80211n-05][80216e-05] and have in some cases already been standardised [DVB00] Since basically all advanced coding schemes now come very close to the performance limits predicted by coding theory the coding schemes in these systems can be expected to have similar performance (and complexity) as those selected for the WINNER radio interface
5322 Modulation A variety of modulationdemodulation techniques have been investigated and good performance has been found to be achievable with low or moderate complexity already in previous deliverables [WIND21 WIND22 WIND23] However the selection of an appropriate modulation technique depends on a large number of aspects beyond complexity and basic performance as for example flexibility achievable spectral efficiency robustness to RF imperfections requirements on the RF (HPA backoff) and last but not least also on their suitability for implementation of different multiple access schemes and spatial processing methods Aspects directly related to physical layer performance and RF aspects of modulation schemes have been assessed in [WIND21 WIND22 WIND23] and are therefore treated in less detail here Based on the assessment of modulation techniques summarised in Appendix B31 GMC transmission configured as CP-OFDM (for DL transmission and for UL transmission in short-range scenarios) and serial modulation (mostly for the UL in wide-area scenarios) are the preferred options for the WINNER radio interface See also Appendix G71 for a comparison of single carrier and CP-OFDM on theUL The employed multiple access schemes are presented in Chapter 3 and evaluated in Appendix G
CP-OFDM is a well-established technique that is in use in a large number of systems such as DVB-S DVB-T and IEEE 80211 (WiFi) It is currently also under discussion for the use in 3GPP LTE and IEEE 80216e Serial modulationsingle carrier is under discussion in 3GPP LTE due to its advantages for uplink transmission from (power constrained) user terminals
5323 Synchronisation and channel estimation The choice of an appropriate synchronisation strategy for the WINNER radio interface is based on several criteria such as robustness residual synchronisation offsets acquisition delay and required overhead Two different types of pilots are foreseen for the WINNER system concept time and frequency multiplexed pilots in the form of OFDM training symbols and continuous pilot subcarriers respectively In combination with cyclic prefix based synchronisation differential modulation of continuous pilot subcarriers allows to establish frame synchronisation as well as to detect arbitrary frequency offsets (see Appendix F41 for details) Additionally a set of training symbols are included in the super-frame preamble for self organised inter- and intra-cell synchronisation (cf Appendix B41) A timing advance strategy is proposed enabling a time aligned arrival of different usersrsquo signals at the BS
Channel estimation by interpolation in time and frequency based on a scattered pilot grid is considered to be an efficient solution for the WINNER radio interface In Appendix B42 a generic framework for the pilot design of GMC signals is described The pilot overhead is only 25 and 4 per spatial stream for the WINNER TDD and FDD mode respectively For multi-antenna transmission dedicated pilots per flow common pilots per cellsector common pilots per antenna and common pilots per beam are required depending on the spatial scheme selected Especially in case of dedicated pilots purely pilot aided techniques may have severe limitations requiring a pilot boost andor a significant degree of over-sampling Advanced solutions such as iterative channel estimation aim to make a pilot boost redundant at the expense of increased complexity
WINNER D210 v10
Page 54 (180)
Adaptive transmission with respect to resource and physical layer processing requires channel prediction which can be based on common pilot symbols that are also used for other purposes Adaptive transmission becomes possible in the WINNER system at vehicular velocities The channel prediction accuracy estimates (covariances) are furthermore important inputs in the design of the link adaptation and resource scheduling schemes See Section 31 of [WIND24] for their use and impact
5324 Physical layer throughput The overall link level performance is assessed in Appendix F1 with throughput simulations for different scenarios and different physical layer parameters The focus is on the throughput achievable with a standard CP-OFDM system using different modulationcoding schemes under the assumption of ideal channel estimation and synchronisation The results are presented for the SISO case both for FDD and TDD as well as for the 2x2 MIMO case for FDD and the 4x4 MIMO case for TDD The obtained throughput figures indicate that at an S(I)NR between 20 to 25 dB a spectral efficiency for the single link of 3 bitsHz is achievable in the SISO case when considering the WINNER A1C2 NLOS tapped delay line channel models for the TDD and FDD mode respectively For the MIMO case a link spectral efficiency of 45 and 9 bitsHz in the 2x2 and 4x4 MIMO case respectively can be achieved at a target S(I)NR of 25 dB (using the same channel models)
At a bandwidth of 100 MHz the target of 1 Gbps at short ranges in isolated cells appears hence to be achievable For the wide area case achievable spectral efficiencies (and data rates) depend very much on the interference situation ndash cf the multi-link and system level results in the following section
5325 Multi-antenna processing The spatial processing aspects of the WINNER radio interface concept are described in Appendix B1 There the mapping of the data bits to the available space-time-frequency resources is described in detail Impacts of multiple transmit andor receive antennas to the physical layer (eg to synchronisation channel estimation) can be seen throughout the Appendix B Use of two antennas in the terminal is envisaged to be the baseline case as it provides substantial gains compared to single antenna at only moderate extra complexity
As multi-antenna transmission and reception is a fundamental part of the WINNER radio interface concept assessment results related to it are dispersed over the link- and system-level assessment appendices ie Appendix F and Appendix G The results verify that multi-antenna processing is one of the key technologies in reaching the stringent targets set for the WINNER system
Transmit beamforming and receive diversity are essential techniques to ensure coverage and high system throughput in the downlink Especially in wide-area scenarios with high number of active users fixed beam techniques offer high performance gains with low complexity and control overhead Average sector throughput increases by up to a factor of 3 for 8 transmit antennas (Appendices G15 and G24) The increased complexity of adaptive beams is easily justified in cases of few active users and SDMA where substantial sector throughput gain can be observed (Appendix G22) or for delay-sensitive flows (Appendix G21) Given an identical number of antenna elements spatial multiplexing can be used to increase the user peak data rates (Appendix F1) at approximately identical sector throughput ie at the expense of reduced inherent fairness (Appendix G24) The use of spatial diversity must always be considered in the context of other sources of diversity already exploited and therefore might provide only marginal additional gain (Appendix G24) Local area scenarios allow applying advanced spatial processing techniques based on short-term CSI and multi-user precoding like the SMMSE technique developed within WINNER Initial results in Appendix G25 shows that such techniques have the potential to meet the requirements of 4 bitssHz user throughput mentioned in Appendix A14 From multi-antenna receiver complexity point of view OFDMA is preferred over MC-CDMA (Appendix G23)
In downlinks (Appendix G23 Appendix G24) as well as uplinks one can note significant gains in throughput when going from one to two antennas at the user terminals MMSE combination in receivers can be seen to outperform MRC significantly (Appendix G23) The corresponding gain in sector throughput compared to the single receive antenna case is in the order of 35 for MRC and an additional 15 for MMSEIRC (Appendix G24)
The receiver complexity increase is considerable when compared to single antenna systems (factor of about 30 for a 4x4 system when spatial multiplexing is used) but still acceptable when compared to the decoding complexity of error control codes especially if higher order modulation is considered The evaluations show that the multi-antenna methods studied are feasible and practical with some restrictions on in which environments and specific system modes these methods should be used
WINNER D210 v10
Page 55 (180)
For the uplink base station receive diversity significantly improves sector throughput and enhances user data rates Performance improves with larger antenna separation and IRC with a lower number of antennas may give similar performance as MRC with a larger number of antennas (Appendix G51) In most of the cases SDMA using single-stream beamforming per user is the best solution to benefit from the spatial degrees of freedom (Appendix G52)
On the total system design there are still several open questions In particular the impact of simultaneous use of several complex techniques has not been analysed thoroughly For example the concurrent use of different multi-antenna technologies advanced coding methods fast link adaptation and scheduling can result in a challenging overall computational complexity even considering the expected advances in digital processing technologies
533 Multiple access Starting from the initial assessment of multiple access schemes in [WIND26] a further refined assessment has been performed for the most promising candidates by means of multi-link and system simulations In contrast to previous multiple access oriented simulation campaigns inter-cell interference one of the most important aspects when aiming at a frequency reuse one deployment is now modelled more properly However it should be stressed that still many simplifying simulation assumptions had to applied to keep simulation setup and run-time manageable Some aspects of the results have been highlighted in Section 316
Simulation results with focus on comparative or absolute performance assessments of multiple access schemes can be found in Appendix G1 and Appendix G4 for downlink and uplink respectively Regarding the downlink emphasis has been placed in comparing interleaved OFDMATDMA and MC-CDMATDMA as the most promising multiple access candidates for non-frequency-adaptively scheduled flows Results obtained in Appendix G11 indicate that OFDMATDMA performs slightly worse than MC-CDMATDMA if spreading is applied within one chunk only Spreading within a chunk enables low complex user separation at the UTs without performance penalties due to the flat fading characteristic of each chunk The decreased chunk granularity allows for a larger frequency diversity gain than with OFDMATDMA that explains its performance advantage If spreading is applied across several chunks as analysed in Appendices G12 and G13 MC-CDMA suffers from imperfect user separation at the UT with increasing load and OFDMA performs similar or slightly better in that case In addition equalisation considerably increases the complexity of MC-CDMA for the UT
Performance assessment of adaptive chunk based OFDMATDMA revealed the high multi-user diversity gains obtainable by frequency adaptive resource scheduling Considering a score-based scheduler that already takes fairness constraints into account the average cell throughput was increased by a factor of 16 see Appendix G11 compared to non-frequency adaptive scheduling However no traffic-model specific delay constraints have been taken into account yet since full queues were used as a baseline assumption throughout all simulations
In a wide-area scenario OFDMATDMASDMA has been proven to provide large system capacity gains by a factor of 2 compared to pure OFDMATDMA with beamforming using eight antennas in both cases see Appendix G15 Larger gains with more antennas are likely to be achieved From a complexity point of view adaptive OFDMATDMASDMA with beamforming supports simple UT receiver processing without the need for multiple antennas andor complex multi-user detection
Regarding the uplink similar studies were performed including pure TDMA MC-CDMA was not considered as viable multiple access scheme for the uplink due to the resulting high BS complexity From the UT perspective TDMA is attractive since it supports the use of single carrier transmission with lower peak to average power ratio and thus higher power efficiency than multi-carrier transmission In Appendix G41 it is shown that even TDMA allows for a multi-user diversity gain by adaptively scheduling in time albeit with much lower performance potential than adaptive scheduling in frequency
Frequency offset errors among UTs can be suppressed to around 1 of the subcarrier spacing by the UL-DL synchronisation scheme outlined in Appendix B41 and investigated in [WIND23] Therefore chunk based OFDMATDMA was chosen to be the main multiple access candidate for adaptively scheduled flows in the uplink as well as in the downlink Moreover it is highlighted in Appendix G43 that ndash although theoretically optimal ndash sharing the subcarriers does not yield any perceivable capacity gain Hence adding an additional CDMA component to OFDMA would only increase the system complexity
Even the synchronisation of a self-organised OFDM network is technically feasible with a reasonable overhead If relaying techniques are an integral part of the system design a single hop network can be extended to a multi-hop network without too high impact on implementation complexity at the user
WINNER D210 v10
Page 56 (180)
terminals On deployment costs no final conclusions can be made yet since the density of base stations and relay nodes depend crucially on the actual frequency allocation The restrictions due to the delay introduced by RNrsquos forwarding process the additional signalling overhead or the combination of duplex schemes at the two links at a RN require a more detailed analysis
The interference from other cells should be taken into account in the design of multiple access schemes and in the resource partitioning of the super-frame In frequency reuse 1 networks schemes for interference avoidance or reuse partitioning between cells (WP3 deliverables eg [WIND32] and [WIND35]) which in effect increase the reuse factor to between 1 and 2 are important for optimising the spectral efficiency The effect of introducing interference avoidance (RRM) is illustrated in the results of Appendix G12 It should be noted that the delay differences between cells are likely to exceed the OFDM symbol guard intervals Therefore reuse partitioning that allocates different sets of frequencies to different cells eg in their outer regions [WIND32] should not be performed without guard intervals in frequency As illustrated by Appendix G73 the overhead due to such guard intervals can be held at reasonable levels
534 Radio protocols As noted in Chapter 1 system design and protocol specification is an iterative procedure an initial design is needed in order to select an adequate protocol architecture which in turn may lead to a refined system design In Phase I of WINNER key protocol technologies have been identified and assessed but the final performance evaluations and subsequent choices for the WINNER RI can only be made when the consolidated and refined system concept is available Therefore in the following we focus on a brief but more general discussion about complexity and overhead aspects of different protocol technologies6
The complexity increase in the design of radio protocols is mainly due to the required measurements signalling overhead and due to the implementation of baseband processing at the base station It has been shown that the enhanced MAC protocols can provide high throughput and low delays at a feasible amount of complexity and overhead
The coordination between base stations is needed particularly in heavy traffic load situations and will increase performance in medium load situations A promising framework for inter-cell interference management and integrated load sharing with reasonable balance between performance and complexity is to perform the coordination hierarchically at different time scales with the lowest level working on the fastest time scale by assigning constraints on resources to distributed schedulers in the cells In addition self-organised radio resource management techniques which do not require signalling overheads or cause delays can be used and are particularly well suited for multi-hop networks where delays can be a problem
The multi-mode system concept introduces additional complexity both in the design of protocols and associated algorithms as well as hardware implementation In general modularity of system design helps to reduce the computational complexity but many of the implementation specific issues can be assessed only after the spectrum allocation is known
54 Comparison of performance results with requirements and design targets In Section 11 and Appendix A a number of requirements and design targets were listed This section assesses to what extent the present radio-interface concept can meet these targets This assessment is based on results from all appendices and also from previous WP2 deliverables but in particular on the multi-link and system-level assessments summarised in Appendix G
This kind of assessment faces several types of difficulties First several of the requirements have to be made more precise before they can be compared in a meaningful way with performance results Second one should be very careful when using the present simulations to assess absolute network performance figures The used models and assumptions are crucial for the outcome Moreover at this stage most evaluationssimulations are neglecting many imperfections eg estimations errors and delays Accounting for these imperfections may have a large impact on absolute performance figures Still the results may be used to indicate the performance potential of the technology
The assessments are based on the following assumptions summarised from Appendix A and Appendix E
6 See WP3 deliverables for first assessments in different deployment concepts
WINNER D210 v10
Page 57 (180)
bull Deployment Sites with three sectors (cells) as described in Appendix E deployed without use of relay nodes Max 8 antenna elements per base station sector and (mostly) two antenna element per UT
bull Duplexing and bandwidths Three types of radio bandwidths are considered FDD with paired 20 MHz and 40 MHz bands and TDD on one 100 MHz band Data rates per link refer to downlinks in TDD or half-duplex FDD both with activity factor 2 (reception half of the time)
bull Overhead The overhead due to guard bands and cyclic prefixes has been taken into account in all simulations Overhead due to pilots and downlink control signalling has been specified to around 20 in multi-link and system-level simulations see Appendix E31 and is taken into account in these results In the link-level results this overhead is not taken into account and has to be added separately The MAC layer adds some overhead due to CRC codes sequence numbers for retransmission units and non-perfectly filled chunks That MAC overhead has not been investigated and is therefore not taken into account below
bull Restrictions Perfect channel estimation will be assumed unless otherwise indicated and the results refer to downlinks Full queue models are used for the downlink flows
Requirements stated in Section 11
R33 A consistent and ubiquitous data rate per link of 5 Mbits above Layer 2
Assume a single user in the cell of interest and fully loaded neighbouring cells that generate interference Due to the activity factor for TDD or half-duplex FDD the requirement corresponds to 10 Mbits downlink cell throughput with one user at the cell edge This requirement is attained without problems in the considered 40 MHz FDD and 100 MHz TDD modes
For 20 MHz FDD downlinks relevant investigations are found in Appendix G24 for 700 m cell radius In the lower left Figure G16 the CDF value for 10 Mbits active radio link rate is around 015 for one BS antenna and a UT that uses two antennas with IRC This means that some but not all users at the cell edge would attain the performance Using fixed beamforming with 4 or 8 antennas at the BS the target would be attained with high probability see the lower left Figure G18 Results for larger cell sizes (not shown) indicate that the requirement can be fulfilled for cell radii above 2500 m with 8 BS antennas and 2 UT antennas At least two users at the cell edge (one in each slot of the FDD frame) can thus be provided at least 5 Mbits in rural deployment using the 20 MHz FDD mode
R32 A sustainable average high end data rate per link of 50 Mbits above Layer 2
With the same reasoning as above this requirement corresponds to an active radio link rate of 100 Mbits for a user on average over all locations in the sector
For 100 MHz TDD the requirement is fulfilled in short-range scenarios Considering 40 MHz FDD by scaling up the results for 20 MHz of Figure G17 we see that the result becomes attainable by using 8 BS antennas with grid-of-beams or adaptive beamforming and two UT antennas up to a cell radius of 1400 m by using non-frequency adaptive transmission based on turbo coding
For 20 MHz FDD the goal seems unattainable with non-frequency adaptive transmission With many users in the cell adaptive transmission and multi-user scheduling would boost the aggregate sector throughput but this would not enable an individual user to attain 50 Mbits on average over its location Thus the larger bandwidths of 40 MHz FDD or 100 MHz TDD seem to be required
R36 Peak spectral efficiency in connected sites of 10 bitssHz in wide area deploym for high load
The ldquopeakrdquo spectral efficiency normally refers to the maximum sector throughput allowed by the modulation coding and antenna design It is therefore not a function of the load of the system With 3-sector sites this requirement means 333 bitssHzsector The 20 downlink overhead margin raises the requirement to 416 bitssHzsector This figure is attained since 64-QAM transmission is allowed
R37 Peak spectral efficiency in isolated (non-contiguous) sites of 25 bitssHz
It is noted in Appendix F1 from the results in Figure F4 that this goal is attainable with diversity-based 4x4 MIMO in 3-sector sites but only at high SINRs of at least 30 dB
WINNER D210 v10
Page 58 (180)
R312 User speeds ranging from 0ndash500 kmh should be supported
The short OFDM symbol length used for evaluation provides reasonable robustness against the effect of channel variability within symbols but the performance for the highest vehicular velocities and relay links to moving relays in trains remains to be investigated
The OFDM pilot grid for non-frequency adaptive SISO transmission has been scaled to be appropriate up to 250 kmh (Appendix B42) Speeds up to 500 kmh and the use of beamforming (eg following a moving train) would require extra pilot overhead but no dramatic effects are expected
R34 A maximum delay over the radio interface of 1 ms at Layer 2
The delay over the radio interface is interpreted as the delay from arrival of a packet to the MAC layer to the earliest instance the packet can be received and decoded With the tightly designed MAC feedback loops delays of 07ndash17 ms are attained see Appendix C15 The target round-trip delay of 2 ms (Table A6) can be fulfilled since the decoding time for reasonably sized encoding blocks and retransmission units (at or below 1520 bytes) should be 01 ms or below according to Table B2
ITU-R 100 Mbps peak aggregate useful data rate for mobile access
This is a data rate as seen from the base station not the individual terminals It is here interpreted as the cellsector throughput Thus the terminal activity factor does not affect the assessment
This data rate is difficult to attain using 20 MHz FDD It could be attained in a rural site with many users in the cell by using max throughput scheduling and SDMA with four beams see upper left part of Figure G10 However that strategy would starve users not located close to the BS A better indication of the attainable performance for 20 MHz FDD downlinks are the 75 Mbps attained in Figure G10 when using proportional fair scheduling and SDMA with four beams
With many users in the cell experiments with adaptive beamforming in Appendix G21 (that use all 512 subcarriers) provide CDF curves in Figure G11 They show that the goal is almost attained when using the TrackingPSF mean-approach The average data rate with 416 subcarriers would be (416512)110 Mbps = 89 Mbps with 60 users per 1-km cell 8 BS antennas 1 UT antenna Note that with many users per sector the average throughput per user would of course be much lower (right-hand Figure G11)
ITU-R 1 Gbps peak aggregate useful data rate for local area
The results in Appendix G25 indicate that this target is attainable even when channel estimation errors are considered but only in short-range cells (50 m range) with MIMO links that use large numbers of transmit antennas and four receiver antennas
Design targets stated in Appendix A
Throughput per link targets for rural and metropolitan area deployment
The target 1 bitsHz corresponds to 40 Mbps on active links on 20 MHz half-duplex It can be regarded as fulfilled when using 20 MHz FDD up to 25 km cell radius if we have only one user per sector See Appendix G24 Figure G17 The target 05 bitsHz (at 70 kmh) was found to be attainable in Appendix F1
Results in Appendix G11 G15 G21 and G22 show that the requirements for low and medium terminal velocities are well fulfilled with multiple users per cell in particular when using multiple antennas Terminal velocities of 250 kmh have not been evaluated
Throughput per link targets for local area deployment
The target high-end throughput per link of 4 bitsHz per sector is attained for the A1 LOS and A1 NLOS channel models at 50 m distance according to Appendix G43 It is also attained for the B1 LOS channel model for 10 users all being at 150 m distance with OFDMA maximum throughput scheduling It is not attained at 150 m with a B1 NLOS model These results are for adaptive uplinks
WINNER D210 v10
Page 59 (180)
6 Conclusions and Outlook An overview of the current status of the WINNER radio interface concept was presented in Chapters 1ndash4 with an emphasis on novelties compared to existing systems Throughout the work design and functionalities that allow or facilitate operation in shared spectrum and interoperation between WINNER networks and different RATs deserved special focus
The design view was consistently used in this deliverable motivated by its focus on the lower layers and the need to enable direct assessments in terms of performance simulations and implementation impact analysis Service and protocol views and more information on higher layers can be found in the final deliverables of WP7 and WP3 An overview of simulations investigating different system components as well as the whole system was given in Chapter 5 Also comparisons were made with requirements from [WIND71] and other design targets defined within WP2 It was concluded that with reasonable assumptions about missing information (yet to be determined by political legal economic and other factors and decisions) and within the uncertainties of the simulations these requirements and design targets could be fulfilled The analyses of implementation impact in this and previous deliverables revealed no major critical issues that would prevent a cost-efficient implementation of the system at the time of deployment in 8ndash10 years More technical detail both regarding concept and assessments is provided in the appendices and in earlier deliverables
An important objective of Phase II is to further enhance and refine this initial concept to a level of detail needed to build a prototype within the project and to serve as input to the standardisation process that is expected to follow after World Radiocommunication Conference 2007 (WRC-07)
WINNER D210 v10
Page 60 (180)
Appendix A Requirements and Design Targets This appendix presents design targets for different scenarios as discussed in Section 11 A few scenario-independent targets and general assumptions about spectrum etc are also listed at the end
A1 Targets for different scenarios
A11 Scenarios Depending on the scenario being considered different subsets of the system requirements will be relevant In the following discussion we therefore distinguish between the three application scenarios that have been identified for WINNER (respective characteristics listed in sub-bullets)
bull Rural area o medium traffic demand o cellular large cells o range (coverage) issues
bull Metropolitan area o high traffic demand o cellular midsize cells o range (coverage) issues (to some extent)
bull Local area o high data rate demand high traffic demand o cellularisolated cellspeer-to-peer small cells o indooroutdoor
Rural area and metropolitan area will sometimes be referred to collectively as examples of ldquowide-areardquo scenarios Similarly local area will sometimes be referred to as ldquoshort rangerdquo For each scenario technical targets will be summarised in the following sections
A12 Rural area In the rural-area scenario coverage and high UT speeds are the main challenges for the radio interface Cell radii of 2 km and more will likely be desirable The system requirements state an average cell throughput of 50 Mbits in 100 MHz bandwidth and a cell border (ubiquitous) throughput of 5 Mbits Either FDD paired bands or TDD may be used half-duplex is assumed for terminals also in the former case for complexity reasons For maximum efficiency frequency 1-reuse is generally assumed but tech-niques discussed in eg Section 52 in [WIND32] may be used to create a higher effective reuse for users at the cell border The bit rates mentioned here will only be possible to guarantee at low and moderate speeds cf [WIND24] and Appendix B52
Requirements on downlink are summarised in Table A1 All bit rates refer to throughput above the MAC layer and full queues are assumed The cell range is only introduced as a reference point for the throughput values and the actual coverage areas might be different (at the expense of reduced throughput per link) For the uplink the lower output power of the terminal will reduce the possible bit rates see Table A2 Dual-antenna terminals are considered to be the baseline case Relaying may be needed to reach the tabulated targets the feeder links connecting base station and relay node are then normally assumed to use the same spectrum
Table A1 Targets for Rural Area (Downlink)
Reference cell range
UT velocity Throughput per link (cell average single user in cell)
2 km 0 kmh 70 kmh 120 kmh 250 kmh
1 bitsHz 05 bitsHz 05 bitsHz 01 bitsHz
WINNER D210 v10
Page 61 (180)
Table A2 Targets for Rural Area (Uplink)
Reference cell range
UT velocity Throughput per link (cell average single user in cell)
2 km 0 kmh 70 kmh
01 bitsHz 005 bitsHz
A13 Metropolitan area For metropolitan area spectral efficiency and inter-cell interference become more important considera-tions whereas extremely high UT speeds are less common Coverage may sometimes still be an issue but the maximum cell size is smaller than for the rural-area scenario and the performance difference between UL and DL is typically expected to be less significant Relays may be needed also in this scenario In order to maximise spectral efficiency MIMO preferably with fast feedback will likely be an important feature Requirements are summarised in Table A3 The throughput is given per link and with 3-sector sites and half-duplex for the UT it should be multiplied with 3times2=6 to obtain the corresponding value per site
Table A3 Targets for Metropolitan Area (Downlink)
Reference cell range
UT velocity Throughput per link (cell average single user in cell)
1000 m 0 kmh 70 kmh
1 bitsHz 05 bitsHz
A14 Local area Local area communication includes cellular systems as well as non-contiguous (isolated) sites and peer-to-peer communication In the cellular case the short-range requirements in Table A4 apply For non-contiguous cells inter-cell interference is not an issue and the highest spectral efficiency 25 bitssHzsite should be achievable With 3 sectors and half-duplex this corresponds to approximately 4 bitssHzlink (see Table A5)
Table A4 Targets for Local Area (Cellular)
Environment Reference cell range
UT velocity Throughput per link (cell average single user in cell)
Outdoor 100 m lt10 kmh 50 kmh
1 bitsHz 05 bitsHz
Indoor 30 m lt10 kmh 1 bitsHz
Table A5 Targets for Local Area (Isolated Cells and Peer-to-Peer)
Environment Reference cell range
UT velocity Throughput per link (cell average single user in cell)
Outdoor 100 m lt10 kmh 4 bitsHz
Indoor 30 m lt10 kmh 4 bitsHz
A2 Additional targets To be able to handle new delay sensitive applications and link adaptation efficiently it is essential to have a low delay over the radio interface The targets of Table A6 are assumed
WINNER D210 v10
Page 62 (180)
Table A6 Delay targets
Basic radio interface delays (physical layer single hop)
ndashRound-trip time
lt 2 ms
Packet channel establishment (minimum)
ndash UT originated ndash BS originated
lt 5 ms lt 2 ms
RAN-UT-RAN delay 4 ms
A3 System assumptions The preferred spectrum range for WINNER systems is below 6 GHz and for research purpose the target band is 34ndash50 GHz A bandwidth allocation of 100 MHz per carrier should be seen as an upper limit Such wide bands are not feasible in the current mobile bands therefore new bands should be identified The defined target bands are among the current candidate bands in ITU
Operation in spectrum shared with other operators that use the same physical layer WINNER mode will be an integral part of the design Operation in dedicated bands is seen as a special case of this situation Operation in isolated cells will be seen as a special case of cellular transmission (see also Appendix A14)
WINNER D210 v10
Page 63 (180)
Appendix B Physical Layer The purpose of this chapter is to provide more detail on the assessment of different physical layer candidate technologies which eventually lead to the design decisions presented in Chapter 2 of this report It also gives the rationale behind the parameterisation of different system components if not yet provided in previous deliverables [WIND23]
Appendix B1 contains a detailed description of the generic WINNER spatial processing framework along with some example configurations of it The provided figures illustrate in more detail the structure of the space-time-frequency processing sub-block of the generic transceiver architecture depicted in Figure 21 of Chapter 2 Extending on the framework for the assessment of coding techniques from [WIND23] Appendix B2 provides a detailed comparison of the most promising FEC schemes considered for the use in WINNER Duo-Binary Turbo Codes and Block-LDPC Codes Appendix B3 presents a short comparison of the different modulation techniques investigated during WINNER Phase I [WIND21 WIND22 WIND23] as well as a short summary of their merits and drawbacks Afterwards Appendix B4 covers the topic of pilot design for channel estimation and synchronisation The WINNER plot grid is presented including a discussion of different core requirements for channel estimation (chunk based channel estimation extension to the MIMO case etc) Finally Appendix B5 contains information related to link adaptation a comparison of different bit- and power loading algorithms details on the prediction horizons for channel quality prediction and methods for the compression of feedback for channel state information
B1 Spatial processing and space-time-frequency mapping Figure B1 shows a generic transmitter chain implementing the WINNER multi-antenna concept7 The segmentation stage shown corresponds to the MAC-3 sub-layer introduced in Section 315 which allows splitting one RTU into k encoding blocks that undergo individual forward error correction FECk and interleaving Πk Spatial reuse of a chunk adds a third dimension referred to as a chunk layer and presented along the vertical axis of Figure B1 The (maximum) number of layers l in chunk c denoted Qc can be different for different chunks The mapping of FEC blocks to chunk layers is performed by the resource scheduler In adaptive transmission each chunk layer carries data from one flow only In non-frequency adaptive transmission code-multiplexing may be used in downlinks The chunk layers may stem from the different RTUs of different flows in the case of SDMA or from the same flow in case of per stream rate control and multi-level coding Note that the number of layers in a chunk may be arbitrary in relation to the number of physical antennas denoted MT
The bits of chunk layer cl are first modulated onto Sc modulated layers The number of modulated layers is inferior or equal to the number of chunk layers Scle Qc Typically they are equal that is each chunk layer is modulated independently However for the case of multi-level coding several chunk layers are modulated onto the same modulated layer The modulated layers are then subject to an optional non-linear precoding8 The precoded modulated layers are then dispersed onto virtual antenna chunks with a dispersion code A virtual antenna chunk is a three-dimensional entity which spans MT virtual transmit antennas in space nsymb OFDM symbols in time and nsub subcarriers in frequency To simplify the presentation it is assumed that the number of virtual antennas is equal to the actual number of physical antennas If the underlying dispersion code encodes the signal over less or more dimensions appropriate zero padding and puncturing in the spatial dimension is assumed Typically a linear dispersion code is assumed but by allowing non-linear dispersion codes also schemes such as various forms of space-timefrequency trellis-coded modulation may be represented in the generic processing [WIND21 WIND23 WIND26 WIND27]9
7 Figure 21 shows the overall transmitter structure Here a detailed view of the spatial processing (SP) block in
Figure 21is given (GMC and pilot insertion aspects are neglected for readability) 8 The non-linear precoding proposed in [WIND27] is based on Tomlinson-Harashima precoding however the non-
linear precoding block can also include more general lattice coding techniques Such techniques allow approaching the optimal dirty paper coding and can be used to improve the performance of a MIMO single link
9 If some form of coding and modulation is performed by the dispersion code the outer code is probably relatively weak and the modulator essentially bypasses the encoded bits
WINNER D210 v10
Page 64 (180)
segmentation codingchunk layer multiplexing chunk processing OFDM
link adaptation and resource assignment
spac
efre
q
Seg FECk Πk
Res
ourc
e S
ched
uler
Mod NLP DC P BF
ant s
ummati
on
OFDM proc
essin
g
FEC forward error codingMod modulationNLP non-linear precodingDC linear dispersion codeP power allocationBF beamforming
segmentation codingchunk layer multiplexing chunk processing OFDM
link adaptation and resource assignment
spac
esp
ace
freq
Seg FECk ΠkSeg FECk ΠkFECk Πk
Res
ourc
e S
ched
uler
Mod NLP DC P BF
ant s
ummati
on
OFDM proc
essin
g
FEC forward error codingMod modulationNLP non-linear precodingDC linear dispersion codeP power allocationBF beamforming
Figure B1 Overview of the generic PHY processing chain
The virtual antenna chunk of each layer is then subject to power allocation and linear precoding which means that each virtual antenna chunk of each layer is mapped onto a physical antenna chunk Each element of the three-dimensional antenna chunk is a linear combination of the elements of the layerrsquos virtual antenna chunk The term linear precoding covers techniques such as closed-loop transmit diversity linear multi-user precoding and long-term beamforming and also antenna or beam selection and hopping as well as random beamforming that may be employed by opportunistic beamforming approaches For cases with multi-user optimisation the linear precoding and the power of virtual antenna chunks are optimised jointly Finally the layersrsquo antenna chunks are summed over the antennas to form a three-dimensional antenna chunk which is passed to assembly and OFDM modulation per antenna
The MAC function spatial scheme selection and link adaptation will select and configure the blocks of this generic chain to implement the most favourable spatial processing scheme for each flow A few illustrative example configurations are given in the following In case of open-loop space-time coding (using an LDC eg the well-known Alamouti-code) all data undergo identical FEC and modulation The LDC then maps the symbols onto the antenna chunk (Figure B2) For PARC however segmentation is performed first to allow for individual FEC and modulation of the sub-flows which are mapped to different chunk layers (Figure B3) Figure B4 shows the processing for SMMSE where the LDC implements purely a multiplexing onto virtual antenna chunks The power allocation and linear precoding (BF) is then optimised across all SDMA users according to the SMMSE algorithm [WIND27]
segmentation codingchunk layer multiplexing chunk processing OFDM
link adaptation and resource assignment
spac
efre
q
FECk Πk
Res
ourc
e Sc
hedu
ler
Mod
LDC
P
OFDM proc
essin
g
one userflow P
P
segmentation codingchunk layer multiplexing chunk processing OFDM
link adaptation and resource assignment
spac
esp
ace
freq
FECk Πk
Res
ourc
e Sc
hedu
ler
Mod
LDC
P
OFDM proc
essin
g
one userflow P
P
FEC forward error codingMod modulationNLP non-linear precodingLDC linear dispersion codeP power allocationBF beamforming
Figure B2 Example configuration for open-loop space-time coding
WINNER D210 v10
Page 65 (180)
segmentation codingchunk layer multiplexing chunk processing OFDM
link adaptation and resource assignment
Seg
spac
efre
q
FECk Πk
Res
ourc
e S
ched
uler
Mod P
OFDM proc
essin
g
one userflow
segmentation codingchunk layer multiplexing chunk processing OFDM
link adaptation and resource assignment
Seg
spac
esp
ace
freq
FECk ΠkFECk Πk
Res
ourc
e S
ched
uler
Mod P
OFDM proc
essin
g
one userflow
FEC forward error codingMod modulationNLP non-linear precodingLDC linear dispersion codeP power allocationBF beamforming
Figure B3 Example configuration for PARC
segmentation codingchunk layer multiplexing chunk processing OFDM
link adaptation and resource assignment
spac
efre
q
FECk Πk
Res
ourc
e S
ched
uler
Mod
BF
OFDM proc
essin
g
one userflow LDC
P
P
P
segmentation codingchunk layer multiplexing chunk processing OFDM
link adaptation and resource assignment
spac
esp
ace
freq
FECk Πk
Res
ourc
e S
ched
uler
Mod
BF
OFDM proc
essin
g
one userflow LDC
P
P
P
LDC
P
P
P
FEC forward error codingMod modulationNLP non-linear precodingLDC linear dispersion codeP power allocationBF beamforming
Figure B4 Example configuration for SMMSE
Apart from the generic processing chain and example configurations a lean baseline configuration is defined which serves as basic implementation guideline and benchmark It is based on the following simplifications
bull no segmentation (MAC-3 sub-layer) ie one RTU is encoded as a single FEC block
bull independent processing of each chunk layer ie each modulated layer stems from a single chunk layer
bull no non-linear precoding
bull linear dispersion codes that generate a set of virtual antenna streams out of each chunk layer
bull pure spatial linear precoding (beamforming) ie for a given chunk layer cl symbol t and subcarrier f the elements xcl(tf) of the antenna chunk are obtained by
)ft()ft( lclclc aFx =
where acl(tf) is an MT times 1 column vector holding the corresponding element of the virtual antenna Note that Fcl is identical for all symbols within one chunk layer and each column of Fcl can be viewed as transmit weight vector
Relaying is an integrated part of the WINNER system Investigations that combine relaying and spatial processing have been performed in [WIND27] It has been shown that FRN based on decode-and-forward can benefit from different kinds of spatial processing In-depth investigations and system design that tighly integrates relaying and spatial processing are foreseen in Phase II including more sophisticated concepts like cooperative relays [AY05]
WINNER D210 v10
Page 66 (180)
B2 Forward error correction A large number of possible options for forward error correction have been identified and discussed in [WIND21] With the advent of iterative decoding very powerful concatenated error correction schemes have been devised which exhibit a decoding complexity that is linear in the block length ndash a key requirement for inclusion into any practical wireless communications system Of the plurality of possible concatenated codes parallel concatenated convolutional codes and low-density parity-check codes have been selected as main candidate technologies as they showed the best trade-off between performance and implementation complexity Of these two general classes of codes Duo-Binary Turbo Codes and (Quasi-Cyclic) Block LDPCC (QC-BLDPCC) are considered for the use in the WINNER system since they provide the necessary amount of flexibility in terms of block lengths and code rates However iterative decoding schemes suffer from quite low performance at short block lengths Therefore convolutional codes are used with short block lengths below 200 information bits The domain of suitability (for a target BLER of 1) of all candidates is summarised in Figure B5 below (cf Appendix F2 for details)
Figure B5 Domain of suitability of DBTC and BLDPCC for a target BLER of 1
Table B1 summarises the assessment of these three candidate technologies
Table B1 Assessment of the most promising FEC techniques
CC10 DBTC BLDPCC
Short blocks - lt05 dB lt1 dB
Medium blocks lt1ndash15 dB - lt02ndash04 dB
Performance11
Large blocks lt2ndash25 dB lt02 dB -
Code structure Very low Low Medium Memory Requirements
Decoding Low Medium Medium
Encoding complexity lt 10 opsinfo bit
Decoding complexity ~ 2500 opsinfo bit lt1700 opsinfo bit lt1200 opsinfo bit
Maturity High Medium Medium
10 Memory 8 convolutional code soft Viterbi decoding 11 Loss with respect to the best technique at codeword sizes 50 576 4308 bits (AWGN BPSK target BLER 1)
0 500 1000 1500 2000 2500 3000 3500 4000 4500 5000
DBTC
DBTC
DBTC
BLDPCC
BLDPCC
BLDPCC
Codeword Size (bits)
Rc=12
Rc=23
Rc=34
CC
CC
CC
WINNER D210 v10
Page 67 (180)
DBTC show very good performance already at quite low block sizes (around 128 information bits) and may eventually be used instead of CC in such scenarios LDPCC are favoured over DBTC for large block sizes due to their superior error correction performance in this regime (lower required bit SNR to achieve BLER of 1 [WIND23]) All codes show the same high degree of flexibility in terms of block sizes and code rates (cf Appendix B21) and support the construction of rate compatible code sets (cf Appendix B22) It should be emphasised that the impact of selection of one or another of the proposed FEC technique on the overall system concept is rather limited as soft-input soft-output versions of decoder algorithms exist for all investigated techniques ndash the en-decoding sub-blocks can hence be regarded as a ldquoblack boxrdquo by the rest of the system
B21 Implementation issues flexibility parallelisation throughput An important practical issue when dealing with coding schemes for adaptive radio interfaces is the flexibility in terms of block sizes and code rates One typical way of constructing good LDPCC is to first optimise the error correction performance of the code ensemble for the target code rate (eg optimise the degree distribution using EXIT chart analysis) and then generate one specific code using construction algorithms that ensure low error floors (eg the progressive edge growth algorithms) The disadvantage of this approach (for practical implementation) is that a new code needs to be designed for each block length and rate Structured LDPC codes and especially Quasi-Cyclic and Block LDPC Codes [MY05 MYK05] on the other hand have been shown to have good performance and high flexibility in terms of code rates and block sizes at the same time The general idea is to base the construction of the LDPCC on different basic elements usually shifted andor rotated versions of the identity matrix Adaptation to different block lengths is easily done by expanding elements of the basic matrix (eg by replacing each ldquo1rdquo in the parity check matrix with an identity matrix and each ldquo0rdquo with an all-zeros matrix) Different code rates are obtained by appending more elements to the matrix in only one dimension (ie add more variable nodes but no check nodes) The decoder must obviously be designed to support such changes of the code structure The inherent parallelism of LDPCC is then exploited by allocating Variable Node Units (VNU) and Check Node Units (CNU) to groups of variable and check nodes respectively for processing of the decoding algorithm The degree of parallelism is dictated by the number of elements in each unit The throughput of such a semi-parallel decoder architecture can be expressed as follows
ckcb Fz
PITPRnD sdot+
sdotsdot= (B1)
where Fck denotes the clock frequency (nbmb) are the dimensions of the base model matrix Rc is the code rate and IT is the iteration number The degree of parallelism P is bounded as 1lt=Plt=z where z is the expansion factor Note that in this architecture the total number of VNUs and CNUs is Pnb and Pmb respectively [LZ05] Current technology does not allow yet exploiting this degree of parallelism in full at reasonable cost Nevertheless the flexibility of such architectures is quite attractive from a design point of view as it allows to scale and to tune the hardware cost very easily depending on the target throughput Such semi-parallel architectures are currently being investigated throughout the whole industry (some first complexity estimates can be found in [ZZ05]) As always when dealing with LDPCC the number of iterations IT can vary between an average number required for convergence and a maximum number which represents the worst case decoding delay (and strongly influences the error-correction performance)
Duo-Binary Turbo Codes [WIND21 WIND23] differ from classical PCCC by the fact that the information bits are encoded pair wise The internal inter-leaver is based on an algorithmic permutation defined by a single equation This PCCC can hence be adjusted to any frame size by modifying only four values which parameterise the internal interleaver implying a high flexibility of this type of PCCC As the mother code rate of the Duo-Binary Turbo Code is frac12 (instead of 13 for classical PCCC) it is inherently more robust to puncturing Duo-Binary PCCC not only achieve very good performance for long block lengths but also perform well at smaller block sizes and have been standardised in DVB with block lengths as small as 128 bits The performance has also been improved at low error rates thanks to the improved internal interleaver The decoder can be designed to decode 2 information bits per clock cycle and its throughput can hence be obtained by means of the following relation
ckFITPD sdot= (B2)
The throughput is independent of the code rate as code rates higher than 05 are obtained by puncturing
WINNER D210 v10
Page 68 (180)
For the throughput analysis we consider a clock frequency Fck of 200 MHz to be achievable which corresponds to a technology of 013 microm and beyond [THB04] By tuning the degree of parallelism P and the (maximum) number of iterations IT we can match the requested decoderrsquos throughput to the system requirements Table B2 below summarises the achievable throughput exemplarily for the case of a code raet Rc=05
Table B2 Achievable throughput for rate 05 DBTC and BLDPCC (200 MHz clock frequency)
Code Parallelism level Number of iterations Bit rate (decoded Mbitss)
6 8 150
12 8 300
4 5 160
DBTC
8 5 320
2 50 (flooding schedule) 192
4 50 384
1 20 (shuffled decoding) 240
BLDPCC
2 20 480
It can thus be concluded that a parallelism level of 12 for DBTC (when using 8 internal decoder iterations) and 4 for BLDPCC (using a standard flooding schedule and corresponding to 192 VNUs and 96 CNUs) is sufficient to achieve a throughput of 300 Mbps (and beyond) We conclude that both coding candidates can offer a suitable throughput It is however known that the inherent parallelism of BLDPCC can be attractive from a designer point of view as it allows tuning whole hardwaresoftware implementation to the cost and performance constraints Although very high data rates are theoretically achievable by BLDPC decoders technology constraints still limit the degree of parallelism affordable and thus the data rates To give the full picture the respective gate count (and thus area estimation) for DBTC and BLDPCC need to be considered As these figures depend very much on the target architecture and a number of other parameters this assessment will be done in the next phase of WINNER
B22 Rate compatible code sets for HARQ-II Hybrid automatic repeat request (HARQ) schemes combine the reliability of FEC with the throughput of ARQ Especially type II HARQ schemes also denoted as incremental redundancy (IR) provide an improved throughput and have for example been successfully employed in HSDPA To construct an efficient IR scheme a set of rate-compatible (RC) codes is needed This is a sequence of nested codes providing a range of different code rates It can be constructed eg by puncturing a low rate mother code A special case of IR is chase combining where the FEC codeword is repeated and soft combining is applied to the received code bits This is equivalent to using an outer repetition code (eg by additional spreading cf [WIND23]) which can be used when the channel SNR is insufficient to support successful decoding even at the lowest (mother) code rate
For the detection of a decoding failure an error detecting code is required This can either be implemented by an additional outer cyclic redundancy check (CRC) or is already inherently included in the code itself ndash like in the case of LDPCC The length of the CRC is determined by the desired probability of an undetected error which converges asymptotically as 2-b where b is the number of the CRC parity bits (cf [3GPP-TR25212] where a maximum CRC length of 24 bits is used)
Rate compatible punctured code sets are well known for CC and PCCC [RM00] but can also be created both for DBTC and BLDPCC For the performance of punctured LDPCC it is decisive that the number of punctured variable bits connected to each check node is minimised If a check node is connected to two punctured bits there will be only zero messages in the first iteration and the information of this parity check equation is lost Therefore best results can be achieved by puncturing only degree 2 variable nodes In most LDPC construction methods the redundancy part consists (almost) only of degree 2 variables Often it has a dual diagonal form Therefore it is possible to puncture only redundancy bits Figure F8 illustrates that the performance of rate compatible punctured DBTC and BLDPCCs is quite similar We
WINNER D210 v10
Page 69 (180)
hence conclude that rate compatible punctured codes can be constructed for all FEC techniques that are currently considered for use in the WINNER system
B23 Low-density parity-check codes decoding options The standard algorithm for decoding of LDPC codes is the so-called ldquobelief propagation algorithmrdquo (BPA) of which several good approximations exist In fact it has been shown in [CF02] that close-to-optimal error correction performance can be achieved by a corrected version of the so-called Min-Sum algorithm (MSA) The basic idea of the MSA is essentially the application of the maxLog approximation to BPA decoding Similar to the case when using maxLogMAP decoding of PCCC this comes at a performance loss in the order of 05 dB (on AWGN channels cf [WIND23]) This loss can be dramatically reduced by appropriate scaling of the extrinsic messages to compensate for the over-estimation of extrinsic information (this approach has been also applied in Turbo decoding [VF00]) This corrected version of the MinSum algorithm will in the following be denoted as ldquoMin-Sumrdquo Calculating variable and check node messages during decoding then only involves simple sum and minimum operations respectively plus a scaling of the check node messages In theory the scaling factor α needs to be optimised for each code and SNR by means of Density Evolution (DE) or Monte-Carlo simulation to achieve optimal results However Monte-Carlo simulations showed that choosing α=08 as proposed in [CF02] results in very good performance independent of the SNR operation point for the BLDPCC considered for use in WINNER The ldquoMinSumrdquo algorithm is therefore considered to give the best performance-complexity trade-off for LDPC decoders
However in the case of irregular LDPCC even using the MinSum with optimal correction still not fills the gap wrt true belief propagation decoding Therefore further investigations have been carried out recently leading to new sub-optimal decoding algorithms [GBD03 JVS+03] that could be good candidates in terms of complexityperformance trade-off and memory savings Bit-Flipping Algorithms [BR04 ZF04 ZB04 KLF01 ZF04] on the other hand might be considered an option for very low-end terminals where a loss in performance might be acceptable when large savings in decoding complexity can be achieved A drawback of such approaches is the absence of reliability information at the output of the decoder However since low-end terminals will most probably not use iterative equalisation andor channel estimation techniques this appears to be no significant limitation
B24 Scheduling of the decoder The decoder for LDPCC is a message-passing algorithm operating on the Tanner graph [WIND21] which is equivalent to the structure of the parity-check matrix of the code In the standard schedule of the BPA which is often denoted as flooding schedule first all check node are updated and then all variable nodes are updated An alternative is shuffled scheduling [KF98 MB01 ZF05 YNA01 MS02] also known as layered decoding Here the BP decoder uses not only the messages from the last iteration but uses also the information of the updates from the current iteration This leads to a considerable increase in convergence speed One can discern horizontal and vertical shuffling The vertical shuffling schedule operates along the variable nodes all check nodes connected to the current variable node are updated and the current variable node is updated The horizontal schedule operates along the check nodes the current check node is updated and all the variable nodes connected this check node are also updated Simulations show that both methods increase the convergence speed roughly by a factor of two for both maximum and average number of iterations However the operation count of a single iteration of the BP decoder is increased compared to the flooding schedule In vertical shuffling each check node is updated dc times per iteration while in horizontal shuffling each variable node is updated dv times per iteration (dv and dc is the degree of the respective node) As the check node update is more complex than the variable node update horizontal scheduling should be preferred It is possible to perform group-wise shuffling ie updates are performed on a group of nodes before the nodes of the other type are updated This is especially suited for quasi-cyclic block LDPC codes as nodes within one block do not exchange messages anyway Group-wise shuffling also enables semi-parallel decoding and reduces the required memory [MS02] For the LDPCC considered in the WINNER framework investigations showed that the performance of group-wise horizontal shuffling with 20 iterations is equivalent to that of the flooding schedule with 50 iterations (consistent with the speedup factors reported in [ZF05]) In the assessment of complexityperformance trade-off (cf Appendix F2) results will be given in terms of flooding scheduling as reference point for any other comparison
WINNER D210 v10
Page 70 (180)
B3 Modulation
B31 Assessment of modulation techniques As outlined in Section 22 supporting bandwidths of up to 100 MHz and enabling the ldquoalways bestrdquo principle translates into the following main requirements for the selected modulation technique efficient equalisation of frequency selective channels high granularity and the possibility to adapt transmission parameters to different environment conditions (delay spread Doppler spread available spectrum) user requirements (data rate delay) and user terminal capabilities (maximum transmit power antenna configuration etc) Frequency domain signal processing and more specifically the generalised multi-carrier concept are very elegant means of providing the required flexibility Among the large number of modulation techniques that can be accommodated in the GMC framework (cf Section 22) the following have been assessed in more detail during WINNER Phase I different ldquoflavoursrdquo of OFDM (CP-OFDM IOTA-OFDM PRP-OFDM) MC-CDMA and FMT as well as serial modulation and IFDMA (or FDOSS) Table B3 summarises the assessment of these modulation techniques Although several transmission technologies are also related to multiple access the discussion here focuses solely on the modulation aspect The benefits and drawbacks of the main candidate technologies CP-OFDM and CP based frequency domain generated serial modulation are discussed in the following section
Table B3 Assessment of most promising modulation techniques
Serial modulation
IFDMA CP-OFDM
PRP- OFDM
MC- CDMA
FMT-FDMA12 (NBWB)
IOTA-OFDM
Required IBO
Typically 2ndash3dB lower than for multi-carrier techniques
High (6ndash9 dB[WIND22])
Tx complexity
IFFT FFT
Low IFFT (addt spreading for MC-CDMA)
Rx complexity
FFT
IFFT
FFT FFT postfix suppr
FFT addt de-spreading13
FFT FFT
Filtering complexity
Low Low14 High (poly-phase filtering)
Equalisation Issues
May require DFETEQ for higher order modulation15
acquisition delay
Spectrum flexibility
+ - + + o+ -+ +
Robustness wrt ICI
+ - - - - +- +
Required guard bandsperiods
Similar requirements (~10 for GI ~20 for guard bands under the current assumptions)
+16 +16
Maturity O O + O O O O
12 The specific merits of FMT-FDMA depend very much on the modulation format chosen within the sub-bands 13 May also require multi-user detection in environments where the delay spread is large 14 It is possible to run multi-carrier based transmission without any additional filtering resulting in substantial
spectral side-lobes Additional filtering is often required to meet spectral mask requirements 15 Noise enhancement in linear (MMSE) FDE may cause error floors for higher order modulation (16QAM) when
using high code rates [WIND23] the issue can be overcome by using decision feedbackTurbo equalisation 16 Cyclic prefix can be omitted However additional pilots would then be required to achieve coarse synchronisation
WINNER D210 v10
Page 71 (180)
Interleaved Frequency Division Multiple Access (IFDMA) [WIND23 Section 5214] can be interpreted both as a serial modulation (FDOSS) [WIND21 Section 415][ChC00 DFL+04] and a multi carrier modulation scheme [GRC02] thus combining many of the advantages of the two approaches As a special case of frequency domain based serial modulation (using interleaved assignment of subcarriers) it enables the same high frequency diversity and low peak to average power ratio It also facilitates low complexity signal generation [FCS04] and user separation (as for OFDMA) On the other hand IFDMA and OFDMA exhibit a similar sensitivity to frequency offsets
Multi-Carrier Code Division Multiple Access (MC-CDMA) has been considered extensively in [WIND21 Section 45][WIND23 Section 5213][WIND26] Since it provides high frequency diversity and good granularity also for low data rate transmission MC-CDMA is proposed for the use with frequency non-adaptive transmission Detection complexity will be low when using MC-CDMA only within one chunk (ie under time and frequency non-selective fading) Complexity can however become an issue in environments with high delay spreads (high frequency diversity) and in conjunction with spatial processing Low-complexity techniques such as Pre-Detection SUD have been proposed together with linear (ZF MMSE) and non-linear multi-user detection that achieve good performance at the cost of higher receiver complexity
IOTA-OFDM [WIND21 Section 412][WIND23 Section 5212] [LGA01][JDL+04] and Filtered Multi Tone (FMT) [WIND21 Section 411][CFO+03][CEO02] modulation use prototype functionsfilters to guarantee good localisation of the subcarrier spectra in the frequency (and time) domain Thus high robustness to inter-carrier interference (eg arising due to time and frequency errors as well as to Doppler effects) is achieved without requiring the insertion of a cyclic prefix ndash leading to a higher spectral efficiency However the cyclic prefix is used in WINNER to achieve coarse synchronisation and the introduced overhead is below 10 for both the TDD and the FDD mode When using IOTA-OFDM or FMT an overhead would have to be invested for synchronisation pilots ndash thus reducing the potential gains in spectral efficiency
Wideband FMT with high subcarrier spacing (and hence frequency selective fading per sub-channel) is a valid alternative to traditional (time domain based) single carrier transmission over the whole bandwidth allowing a higher flexibility and granularity in the usage of the broadband channel The same (or higher) flexibility can be achieved by using frequency domain based serial modulation ndash wideband FMT is a special case of this scheme with block subcarrier assignment and a specific type of filtering
Using a Pseudo Random Postfix (PRP) as guard interval [WIND21 Section 46ndash410] [WIND23 Section 5211][MDC+04 MBL+05][MCD05] provides means to estimate andor track the channel impulse response without adding any overhead in terms of learning symbols andor pilot tones ndash allowing for increased spectral efficiency However in order to achieve a high precision (low MSE) of the channel estimates a delay of several OFDM symbols in the radio interface may have to be accepted This is especially the case for higher order modulation with high requirements on the channel estimation (cf results in Appendix F35) Moreover the scheme is less applicable for uplink scenarios where postfixes of different users superimpose at the base station Since low delay is a very important requirement for the WINNER radio interface and the overhead required for a scattered pilot grid is quite low (cf Appendix B42) this solution has been selected for channel estimation and tracking in WINNER instead
To summarise CP-OFDM is the preferred solution for the downlink (and the uplink when terminal power consumption is not an issue) as the spectral efficiency gains from using other techniques are currently considered not to justify the increase in implementation complexity (eg poly-phase filtering) andor delay (for the case of PRP-OFDM) Frequency domain based serial modulation is preferred for uplink transmission due to its low PAPR and as it enables to flexibly switch between interleaved (IFDMA) and block subcarrier assignment (wideband FMT) according to need
B32 OFDM vs single carrier Serial and parallel modulations have generally similar BER performance on frequency-selective channels when used with coding and other enhancements like iterative detection or adaptive loading Note however that linear FDE receivers become limited by noise enhancement at high SNR OFDM systems therefore yield better performance than serially modulated systems when considering transmission with higher order modulation and only linear equalisers OFDM has been (and is) in use in a number of wireless communications standards (eg IEEE 80211 and DVB systems) The main advantage of this technique is its implementation simplicity at least from a baseband perspective very low complexity equalisation algorithms are available and channel estimation and tracking is straightforward and of low arithmetical complexity if pilotlearning symbols based approaches (or derivates) are applied
Concerning the trade-offs between OFDM and serial modulation the main issues are the following ones
WINNER D210 v10
Page 72 (180)
i) the OFDM time domain signal is characterised by an inherent high peak-to-average-power ratio (PAPR) which is challenging for the RF implementation of HPAs (high power amplifiers) [FK05 WIND22 WIND23] The power backoff required by OFDM or other multi-carrier modulation approaches is typically 2 to 3 dB higher than for serial modulation even when PAPR-reduction methods are applied (for both systems cf [WIND23]) Serial modulation thus allows the use of cheaper power amplifiers Furthermore if a serial modulation system and a parallel system are required to use the same type of HPA and have the same maximum spectrum sidelobe levels the parallel systemrsquos average allowed transmit power will be lower resulting in lower received power and correspondingly higher bit error rate and lower coverage [WIND23] This constitutes the main motivation for the use of serial modulation in the uplink where terminal battery duration terminal cost and coverage are critical issues Furthermore generation of serial modulation by the generalised multi-carrier approach is equivalent to generation of OFDM or OFDMA that has been precoded by a FFT operation Thus serial (single carrier) modulation itself can be considered as just a form of OFDM to which a very effective PAPR reduction method has been applied
ii) OFDM is sensitive to time and frequency synchronisation offsets However efficient algorithms (of relatively low computational complexity) are available which assure a sufficiently precise synchronisation in both time and frequency From a practical point of view synchronisation issues are not a main limiting factor of OFDM
iii) OFDM is in general sensitive to higher levels of inter-carrier-interference (ICI) (resulting eg from high Doppler environments phase noise frequency offset etc) which lead to a degradation of the system performance A suitable design of the OFDM parameters (in particular the subcarrier spacing) is required in order to avoid this problem Assuming reasonable design parameters OFDM is also applicable to high mobility scenarios Phase noise on the other hand can be a limiting factor especially when high carrier frequencies andor low cost implementations are targeted Serial modulation is less sensitive to such self-interference effects [WIND23]
B33 Guard interval design The main purpose of the guard interval is obviously to limit inter-symbol-interference (ISI) for all block transmission based GMC schemes [WIND23] Therefore the amount of signal energy contained in the channel taps that exceed the guard interval length (resulting from a long channel impulse response potential inter-cell interference time synchronisation errors and filter impulse responses) should be low enough to avoid error floors in the transmission (ie be some dB below the thermalADC noise floor) There are efficient methods to minimise the ICI (eg timing-advanced transmission in up-link) which can be used to considerably reduce the guard interval length and thus increase spectral efficiency The guard interval length is often chosen to be a fraction 12n of the raw symbol length although this is not strictly necessary from the implementation perspective It should however be an integer multiple of the sampling interval [WIND23] Additionally to avoiding ISI the cyclic prefix in CP-OFDM turns the linear convolution into a set of parallel attenuations in the discrete frequency domain thus enabling simple single tap equalisation and contributing significantly to the receiver simplicity of OFDM systems
B34 Modulation alphabets and bit mapping Non-differential M-PSK and M-QAM modulation will be used in the WINNER system as channel state information can be made available to the receiver at relatively low pilot overhead in all scenarios (cf Sections 23 and B4) For the wide-area scenario modulation formats up to 64-QAM are proposed while for short-range transmission even 256-QAM appears to be feasible
As a baseline case Gray mapping is assumed It provides the highest amount of mutual information when no a-priori knowledge is available however it shows little gain when additional a-priori knowledge becomes available Since decoder and detectorchannel estimator EXIT transfer curves must be matched in order to achieve good performance it should evidently be used with a strong outer code mostly in non-iterative setups Note that the use of Gray mapping facilitates the calculation of soft output at the detector at low complexity if the standard maxLog approximation is used The selection of other mappings is useful in with the context of iterative equalisationchannel estimation mostly in conjunction with a weaker outer code Ideally the mapping and the channel encoder should be chosen jointly in order to maximise the gain achieved after several iterations In practice rapid changes of the propagation environment may render this optimisation unfeasible A robust solution shall then be preferred at the price of a loss of optimality Optimised bit labellings (used with a low memory CC) in Appendix F in the context of iterative channel estimation
WINNER D210 v10
Page 73 (180)
B4 Pilot design for channel estimation and synchronisation
B41 Intra- and inter-cell synchronisation using dedicated training symbols A synchronisation approach is proposed that enables both intra- and inter-cell synchronisation in a self-organised way without relying on any external reference eg GPS The approach assumes a cellular OFDM network where the terminals in every cell BSs or UTs are allowed to receive and transmit over the whole system frequency band at the same time during synchronisation
The approach proposed in this section is based on the acquisition of the coarse intra-cell time synchronisation by means of a DL synchronisation pilot referred to as T-pilot The T-pilot is sent in DL by all BSs inside the network at the beginning of each super-frame It is proposed to build the T-pilot for each cell as a specific Gold code This pilot structure has been proved to be robust against both inter-cell interference and multi-path fading [CSB05] However the correlation of T-pilots is sensitive to carrier frequency offsets as shown in Appendix F41
In order to improve the achieved accuracy the DL T-pilot is followed by at least two F-pilots that is two OFDM symbols The frequency and time offsets can be estimated simultaneously in the frequency domain (post FFT) as the phase rotation between two adjacent OFDM symbols on the same subcarrier in the same OFDM symbol and as the phase difference between two adjacent subcarriers respectively The phase rotation method requires the time and frequency offsets to be within one half of the OFDM symbol period and within one half of the subcarrier spacing respectively This condition is assumed to have been guaranteed at the beginning of the fine synchronisation by the initial coarse synchronisation
In order to achieve inter-cell synchronisation two methods can be considered which are described in the following
The first referred to as DL-UL synchronisation assumes that all UTs within a certain cell which have become mutually synchronised during the DL phase transmit UL sync signals which are in turn received and analysed by all BSs within range A synchronisation signal structure was proposed in [WIND23] that can be used in UL for the inter-cell synchronisation as well as alternative to the one described above for the DL fine intra-cell synchronisation This signal consists of three adjacent OFDM symbols during which each BS in DL transmits only on a single pair of adjacent subcarriers with the maximum power as described in [WIND21] Section 954 The DL-UL method has been shown to provide very high accuracy in [WIND23] for both intra- and inter-cell synchronisation More precisely in 20 super-frames both frequency and time synchronisation between all BSs within the cellular network can be achieved with remaining frequency offset of about 1 of the subcarrier spacing and time offset of about 10 of the guard interval respectively
According to the second method referred to as DL-only the inter-cell synchronisation is obtained without relying on UL sync signals Each UT continues to listen to the sync signals sent in DL by all other BSs measures itself the relative time and frequency offsets with respect to its own BS and feed back this information to its own BS Each BS adjusts then its clock and its oscillator according to the offset measurements signalled by the UTs within its cell An advantage of this method is that it can rely also on UTs in sleep mode since it does not require continual transmission of pilots on the UL but only the occasional feedback signalling Also for the DL-only method a very accurate convergence of the inter-cell synchronisation can be achieved under the assumption of ideal UL feedback Performance is similar to that of the DL-UL method reported in [WIND23] A proper design of such feedback signalling and the comparison of the involved overhead with respect to the DL-UL method described above should be subject of further investigation
Since the DL only synchronisation uses relative measurements the influence of the propagation delay might become smaller One additional advantage of the DL only synchronisation is that it relies on DL pilots There is an additional degree of flexibility adjacent BSs can also receive this pilots it they are able to receive DL signals and do not transmit during the pilot OFDM symbol Without changing the pilot structure the system is able to switch dynamically between UT-aided synchronisation and synchronisation based on measurements at the BS BS based synchronisation is useful in some deployment scenarios when the B2B link will give better receive signal level than the receive level at the UT (eg LOS conditions between BS) This flexibility can be conveniently exploited in TDD systems while the complexity would increase in FDD since the BS has to be able to receive DL signals Therefore it is suggested as an option in the system concept
WINNER D210 v10
Page 74 (180)
For the above described inter-cell synchronisation schemes there exists a drift of the achieved common time offset due to the propagation delay In the following a differentiated timing adaptation is proposed which can completely avoid the timing drift of stations
The idea of this method has been first proposed in [ER01] and [WER03] The systematic timing drift results from the fact that with each acquired time offset not only the actual difference of the node timings is acquired but also the distance-dependant propagation delay
In contrast to other timing adaptation methods the differentiated method only initiates a timing adaptation if a negative time offset is acquired If a positive observed time offset is acquired no timing adaptation is initiated except the case that the positive time offset is over a threshold which causes loss of synchronisation Since a positive time offset at a first station corresponds to a negative time offset at a second station the time offset will be compensated by the second station
Estimation of the propagation delays in intra-cell synchronisation Especially in the wide-area scenario large propagation delays may be observed A time-aligned arrival of signals from different UTs which is required for a joint spatio-temporal processing at the BS can be enabled if the UTs estimate their propagation delays during a so called lsquoranging processrsquo and use this information afterwards to transmit their data alligned to a common timing reference
The proposed ranging process requires two different pilot signals (T- and F-pilots) and consists of three phases an initial downlink phase a succeeding uplink phase and another final downlink phase depicted in Figure B1 where one BS and two UTs are considered The letters r and t denote the reception and the transmission status of each communication device The process is described as follows Initially the BS transmits a beacon signal which enables the UTs to perform a coarse synchronisation For this beacon signal a signal like the T-pilot introduced within the proposal above may be employed After the reception of the beacon signal each UT transmits its individual pilot which consists of a single frequency tone selected from a predefined set of equally spaced tones Each UT uses a different pilot tone At the BS the single user pilots are separated by filtering the received signal in he time domain
After a specific user pilot has been detected it is immediately retransmitted by the BS This retransmitted pilot then is detected at the dedicated UT in the same way as it is done at the BS From the temporal difference between the transmission of the UTrsquos pilot and the reception of its retransmission the UT may deduce the propagation delay
Within the simulations at an SNR of 0 dB hardly any values lying outside the range of the CIR length occurred hence the ranging process can be regarded as being robust and reliable
Figure B1 Detailed scheme of the ranging process
If the UTs retransmit their individual synchronisation tones (F-pilots) in advance by the estimated propagation delay after the ranging process has been finished a fine estimation of the carrier frequency offset may be carried out at the BS The single synchronisation tones which arrive aligned in time at the
WINNER D210 v10
Page 75 (180)
BS now are again separated by applying the filtering process from above and by averaging the slope of the phase of each separated tone information on each userrsquos carrier frequency offset may be obtained
B42 Pilot grid for generalised multi-carrier (GMC) Channel estimation by interpolation in time and frequency is considered to be an efficient solution for an OFDM-based radio interface [WIND21 WIND23] Generally a scattered pilot grid can be implemented for any GMC signal in the frequency domain on both the downlink and the uplink While blind channel estimation schemes require little or no pilot overhead their application may critically depends on the assumptions on the chosen transmission scheme With a large variety of adaptive algorithms in time frequency and space to choose from the flexibility of the WINNER radio interface might be severely compromised by exclusively relying on blind schemes Moreover as the pilot overhead of the considered pilot aided techniques is in the range of 2 to 5 per spatial stream the potential benefit of blind channel estimation techniques is limited On the other hand for highly dispersive channels andor high-end terminals blind or semi-blind schemes might provide a performance improvement and could therefore be considered as optional enhancements
In the following a generic framework for the pilot design of GMC signals is described Two types of frequency domain pilots and one type of time domain pilots are options the frequency expanding technique (FET) and Frequency domain superimposed pilots (FDSP) FET preserves and rearranges data-carrying subcarriers to accommodate pilots while FDSP obliterates data-carrying subcarriers where pilots are to be inserted Applied to OFDM FET is equivalent to a scattered pilot grid where data symbols are inserted at subcarriers where no pilots are present FDSP on the other hand can be viewed as a puncturing of the data symbols So data symbols are inserted on all subcarriers and subsequently pilots are superimposed This effectively results in an increased code rate
Frequency domain pilots for the WINNER radio interface Pilots are used for implementing certain physical layer support functions eg connection setup synchronisation mobility support power control CQI measurements and most importantly channel esti-mation Two types of channel estimation must be distinguished channel estimation for data reception (where the pilots are send at the same time) and channel estimation for adaptive transmit processing based on return link feedback or measurements (where an additional extrapolationprediction in time is required see also Appendix B52) In order to realise an efficient system the same pilots should be reused for different support functions Spatial processing however limits the potential reuse of pilots and brings along additional requirements [WIND27] In particular we need to distinguish
bull Dedicated pilots may be required if user-specific transmit processing (ie a user-specific adaptation of amplitude and phase) is applied to the data symbols These pilots are subject to the same transmit processing as the data symbols and therefore allow the receiver to estimate the effective channel HU sdot fU of user U The use of dedicated pilots for other purposes like CQI measurements is limited since they contain a power allocation specific (in most of the cases) to another user In time the interpolation is constrained by TDMA ie to the chunk duration in adaptive downlink transmission Regarding the interpolation in frequency two different types of dedicated pilots can be distinguished
o Full-band dedicated pilots having identical weights for all chunks in frequency dimension dedicated to a particular user Therefore interpolation over these chunks is possible
o Chunk-specific dedicated pilots where different weights are applied to each chunk and no interpolation in frequency domain is possible This is usually the case for user-specific transmit processing based on short-term CSI and or in case FDMA on chunk basis is used
bull Common pilots have the property not to include user-specific transmit processing and thus the interpolation in frequency is restricted by the specific channel estimation algorithm (ie related to the estimator complexity) and not by chunk specific constraints In case of user-specific transmit processing the amplitude and phase of common pilot deviates from those of the data symbols and therefore the receiver cannot detect those based on common pilots Different variants of common pilots exist eg
o A common pilot per cellsector which is transmitted omnidirectionally (ie not subject to beamforming) and normally used to support mobility-related functions It allows obtaining an unweighted channel coefficient h
WINNER D210 v10
Page 76 (180)
o Common pilots per antenna are used to obtain the unweighted channel matrix H which describes the propagation channel between any combination of transmit and receive antennas in the MIMO case
o Common pilots per beam are useful to estimate the effective channel (including the beamforming weights) and perform CQI measurements for the associated beam for fixed beamforming approaches Note that measurements on such pilots in neighbouring beams could then be used for beam handover Also the common pilots per beam benefit from the beamforming gain which reduces the transmit power required for a target channel estimation error and coverage area
Due to the fact that common pilots can be used by several users they are appealing for the downlink processing since the overall energy to perform the associated functions has only to be spent once and the pilot symbols can be spread over all resources Also they provide a basis for un-biased CQI measure-ments However certain user-specific spatial processing techniques require dedicated pilots
Multi-user precoding techniques are assumed to impose the most stringent requirement on channel estimation since high accuracy prediction of the downlink channel need to be obtained based on uplink measurements A performance degradation of 2 dB due to imperfect channel estimation requires a pilot SINR of 20 dB and channel estimator gains between 13 dB and 17 dB [WIND27] In Appendix F33 results for the channel estimator gains of the WINNER pilot specifications are presented It is shown that with pilot aided techniques the required gains of 13 to 17 dB can only be achieved with sophisticated post-processing for instance by an iterative channel estimation scheme
A careful radio interface design must balance the number of users that can be scheduled in the downlink with the number of users that can be estimated based on the uplink pilots in the TDD PLM The competition bands and the activesemi-active flow states that are discussed in Appendix C1 are tools for performing this trade-off Simulations for the linear precoding technique (SMMSE) have shown that in order to obtain sufficient SDMA and spatial multiplexing gain around 9 orthogonal pilots17 would be required per competition band
Since the requirements regarding pilot type number of pilots and pilot SNR are varying considerably a modular and scalable MIMO-pilot design should be adopted For example a combination of common pilots and additional dedicated pilots per chunk according to the requirements of the spatial processing scheme is conceivable
Common pilot symbolsDedicated pilot symbols
5 O
FDM
sym
bols
12 OFD
M sym
bols
TDD mode FDD mode
Additional pilots for non-adaptive transmissionPilots for 2nd spatial layerWith 2 spatial
layers
Df = 8
Df = 4
16 subcarriers8 subcarriers
Dt = 11
Common pilot symbolsDedicated pilot symbols
5 O
FDM
sym
bols
12 OFD
M sym
bols
TDD mode FDD mode
Additional pilots for non-adaptive transmissionPilots for 2nd spatial layerWith 2 spatial
layers
Df = 8
Df = 4
16 subcarriers8 subcarriers
Dt = 11
Figure B6 Frequency domain pilot grids for GMC signals
17 Corresponding to an average of 34 users according to the assumed user population (20 with 1 antenna 40 with
2 antenna and 40 with 4 antenna
WINNER D210 v10
Page 77 (180)
Figure B6 shows the pilot grid arrangement for the WINNER TDD and FDD modes The placement of pilot symbol within a chunk is based on the following rules (based on the framework from [WIND21 WIND23])
bull For common pilots a reasonable over-sampling factor in frequency direction would be 20mdash100 On the other hand the chunk dimension also imposes constraints on the pilot spacing To this end a constant number of common pilots per chunk is desirable For the TDD and FDD modes this translates to a pilot spacing of Df=8 and Df=4 respectively
bull For dedicated pilots the over-sampling factor should be at least 100 which also results in a pilot spacing of Df=8 and Df=4 for the TDD and FDD modes respectively
bull For channel estimation in time direction the number of available pilots is limited by the fact that half duplex FDD or TDD a mobile terminal is not able to transmit and receive at the same time Therefore the same guidelines for common and dedicated pilots apply
o For adaptive transmission the mobility of UTs must follow certain constraints which gives upper bounds on the maximum Doppler frequency This results in a total of 2 and 4 pilots per chunk for the TDD and FDD modes
o For non-frequency-adaptive transmission in the FDD mode two additional pilots are inserted in time direction to support mobile velocities up to 250 kmh totalling to 6 pilots per chunk For the TDD mode no additional pilots are necessary if at least 2 chunks per frame are used
In order to be able to estimate the channel from different antennas orthogonal pilots are required and the following principle design guidelines are possible
bull transmit pilots in frequency-multiplex (different subcarriers of one chunk) as indicated in Figure B6
bull transmit pilots in time-multiplex (consecutively on one subcarrier)
Additional code multiplexing of pilots in time as well as frequency multiplex is possible In existing MIMO-OFDM real-time test-beds code-multiplexing using Hadamard sequences on consecutive pilot symbols of one subcarrier has been extensively used and verified [MKK+05 JFH+05 JHF04] A similar design has also been proposed for fixed grid of beam techniques in WINNER (see Section 3222 of [WIND27] There each antenna is identified by an orthogonal sequence reused on all pilot subcarriers but additionally scrambled in the frequency domain Such overlapping pilot-based techniques have also been studied for adaptive uplink transmission see Appendix B52 and [WIND24] Section 311 Advantages are that the power on pilot carriers is not enhanced compared to the power of data ie the transmit spectrum is flat Moreover the reconstructed pilots can be reused for the carrier phase tracking at the receiver if the sequence is additionally stretched along the time direction over the chunk The pilot overheads of the pilot arrangements in Figure B6 per spatial stream per chunk are summarised in Table B4 The pilot overhead is defined as the ratio of the number of pilot symbols per chunk Npilot to the number of data symbols per chunk Ndata The chunk sizes are 96 and 80 symbols for the FDD and TDD modes
Table B4 Pilot symbol overheads per spatial stream per chunk
FDD mode TDD mode Tx mode
Pilots data
Non adaptive Adaptive Non adaptive Adaptive
pilots per chunk 6 4 2 2
Pilot overhead NpilotsNdata 75 5 25 25
The pro and cons of the pilot design principles in the WINNER framework are for further study This is particularly true for the various proposed MIMO schemes The assessment of channel estimation schemes for uplink single carrier signals is studied in Appendix F31 The performance of OFDM channel estimation schemes for common and dedicated pilots using the pilot grids in Figure B6 is evaluated in Appendix F32
WINNER D210 v10
Page 78 (180)
B5 Adaptive transmission
B51 Bit and power loading algorithms If channel quality information is available on each subcarrier (or chunk) is it possible to increase the performance of the radio link andor save power by performing bit andor power loading for each subcarrier (chunk) This single-user link adaptation can be used as an element in the solution of the complete multi-user adaptation and scheduling problem There are many different algorithms that realise so called water-filling concept in a multi-carrier transmission Most of them originate from the asymmetric digital subscriber line (ADSL) technology
Depending on their application existing bit and power loading algorithms can be divided into two groups
1 Algorithms that maximise the number of transmitted bits with a given total power and required BER constraints (variable bit rate)
2 Algorithms that minimise the BER with a given throughput and transmitted power constraints (fixed bit rate)
For most algorithms the average computational complexity of the analysed algorithms is proportional to O(N log(N)) where N represents the number of subcarriers (or chunks) being adaptively loaded The assessment presented in [WIND24] focused mainly on the Hughes-Hartogs (HH) algorithm [Hug91 Bin90] However from the complexity point of view this algorithm seems to be unsuitable for practical implementations (see Appendix B511) The complexity of Campellorsquos implementation [Cam98][Cam99] on the other hand is proportional only to O(N) Therefore this algorithm might be considered as a favourite one from the complexity point of view In practice however also other algorithms are much faster than the HH algorithm eg the one by Chow Cioffi and Bingham [CCB95] or the Fischer and Huber [FH96] algorithm The computational complexity may depend on the application and the channel transfer function as well Note that of the discussed algorithms only the Hughes-Hartogs and the Campello algorithm are optimum in the data rate maximisation sense For additional details please see the following discussion on complexity and implementation issues and the details given in Appendix F5
B511 Hughes-Hartogs optimum algorithm
The Hughes-Hartogs bit and power loading algorithm is a part of the ADSL modem US patent [Hug91] A detailed description of the steps of the algorithm is included in [WIND24] in the form described in [Bin90] The HH algorithm does not realise the water-pouring principle in its classical sense but it is an optimum solution for a multi-carrier transmission using QAM constellations and symbol-by-symbol detection since it spends the transmitted power in the most effective way However this procedure has high computational requirements because an extensive sorting and searching has to be performed in each step of the loop Since the average running time of the algorithm is proportional to the product of the total number of loaded bits loaded (fractional bits for coded transmission) and the number of subcarriers (chunks) it seems to be unsuitable to be implemented in systems with high data rates high granularity and a high number of subcarriers (chunks) to be adapted
B512 Chow Cioffi and Bingham algorithm This algorithm proposed by Chow Cioffi and Bingham in [CCB95] offers significant implementation advantages over the previously mentioned Hughes-Hartogs algorithm whilst the performance degradation is negligible as compared to the optimal solution Although this algorithm might be slightly sub-optimal it converges much faster as compared to the HH algorithm This is due to a limited number of internal iterations needed The authors have found that 10 iterations are sufficient to ensure the convergence of the algorithm The worst case running time of this procedure is proportional to
)2( cc NNMaxItersO +sdot (B3)
where MaxIters is the maximum number of iterations and Nc is the number of subcarriers (chunks) This figure is much lower than the average running time of the HH algorithm (see Appendix B511) Moreover the worst case running time of the CCB algorithm does not depend on the granularity of loaded bits so it is suitable for a joint code and modulation adaptation
WINNER D210 v10
Page 79 (180)
B513 Fischer and Huber algorithm
In this algorithm presented in [FH96] the data rate and power are assigned to each subcarrier to minimise the error probability The Fisher and Huber algorithm has a very low complexity even lower than that of the Chow Cioffi and Bingham algorithm According to what the authors claim the achievable performance is higher or at least comparable to the performance of the CCB algorithm However in the WINNER system case this seems to be a bit too optimistic assumption (see Appendix F5) One of the advantages of the algorithm from the implementation point of view is that the logarithms of the subcariersrsquo (chunksrsquo) noise variances are calculated only once in the beginning and stored in a memory In the main loop only additions and one division by an integer have to be performed for each subcarrier (chunk)
B514 Chunk-based single-user link adaptation in the adaptive resource scheduling framework
Adaptive transmission and scheduling in the WINNER AI concept is assumed to take place within the framework outlined in Appendix C16 For each chunk (layer) each candidate user terminal predicts the channel quality (SINR) Modulation levels inner code rates (typically using convolutional coding) and possibly power adjustments together comprise the link adaptation They are pre-computed for all chunks and all candidate flowsuser terminals This adjustment should take not only the predicted channel gain into account but also its accuracy That problem can be solved by averaging over the pdf of the power prediction error when adjusting the rate limits [FSE+04] [SF04] and Section 22 of [WIND24] Furthermore the interference level must be predicted Interference prediction remains a major research problem for WINNER II and it involves both the SDMA interference within the cell and the interference from other cells and operators
The link adaptation will in general work together with an outer code (turbo or LDPC)An appropriate criterion for the link adaptation would then be to target a constant SINR per bit This would essentially convert the fading channel into something closer to an AWGN channel as seen from the outer code
The pre-calculated chunk capacities (bits per payload symbol) that result from the link adaptation for each chunk layer and each flow form one set of inputs to the adaptive resource scheduler The scheduler uses them together with information on the queue levels and the flow priorities to allocate the next slot
B52 Channel quality prediction for adaptive transmission Adaptive transmission always involves a closed feedback loop and thus incurs a delay The allocation decision will be based on outdated channel quality information While most WINNER terminals are expected to be stationary or slowly moving this will create a problem for faster moving terminals It would be advantageous with a scheme that allows the vast majority of WINNER terminals including many of those moving at vehicular velocities to utilise adaptive transmission The situation can be improved markedly by introducing a channel predictor In [WIND24] it is shown that this enables prediction of the channel power at sufficient quality over time delays consistent with realisable feedback loops at vehicular velocities and 5 GHz carrier frequencies Adaptive transmission at vehicular velocities would not be possible if the present channel state is just extrapolated A special problem is prediction in the uplink Since several terminals will then be in competition for the whole or a part of the bandwidth they have to send pilots over the whole of this band The overhead due to these pilots would increase proportionally with the number of active terminals To prevent this overhead from becoming too large a simultaneous transmission of the pilots overlapping pilots is preferred This technique requires the terminals to be sufficiently well synchronised in time and frequency It also requires estimation of a multiple-input single-output channel based on these overlapping pilots Orthogonal symbol sequences would be used as pilots spread out over different frequencies in several chunks It should be noted that after propagation through different frequency-selective channels the received signals would no longer be orthogonal
Channel prediction can be performed in the time-domain for the impulse response [Ekm02] [SEA01] or in the frequency domain for the channel gains In [WIND24] frequency domain prediction is investi-gated It utilises the correlation between neighbouring subcarriers and the time-domain correlation between subsequent OFDM symbols in a state space model [SA03] Control symbols are used in the decision directed mode for improving the estimates Figure B7 below shows the results expressed in normalised prediction error MSE as a function of the SNR and the prediction horizon scaled in wavelengths The result is for downlink predictions for the FDD mode in cellular deployment assuming a full duplex FDD terminal that listens continuously on the downlink pilots The Urban Macro channel model has been used Note the large dependence of the performance on the SINR
WINNER D210 v10
Page 80 (180)
Figure B7 FDD downlink prediction accuracy in terms of the normalised channel prediction MSE as a function of the prediction horizon scaled in carrier wavelengths and the SNR Results for FDD
downlink over Urban Macro channels using a Kalman algorithm that utilises 8 subcarriers
Adaptive transmission tofrom a terminal will be feasible up to a maximal velocity for a given SINR or equivalently down to a limiting SINR at a given velocity For combinations of velocities and SINRs beyond such a boundary non-frequency-adaptive transmission must be used In [WIND24] a preliminary finding is that the normalised prediction error level 015 indicates the location of this boundary rather well when using adaptive convolutional coding combined with BPSK or M-QAM Based on this one may calculate the approximate SNR boundaries for different velocities different predictor designs and different designs of the adaptation feedback loops The results in Figure B7 are for the adaptation loop designs presented in Section 31 of [WIND24] For the FDD mode it is based on downlink channel prediction 25 slots ahead at the terminals In uplinks channel prediction is based on overlapping pilots at the base station For the short-range TDD modes the prediction is assumed to be performed by the user terminals (A scheme that moves the predictor to the base station is of course also possible) The required prediction horizons to the far end of the predicted chunk scaled in the carrier wavelength λc at 5 GHz are also shown in Table B5 For further results please see Section 31 of [WIND24] or [SFS+05]
Table B5 SINR limits for cases where the accuracy limit 150~2 =σ allows the use of adaptive transmission exemplified for three terminal velocities for a 5 GHz carrier frequency Also shown
are required prediction horizons in carrier wavelengths From [WIND24] Table 32
30 kmh 50 kmh 70 kmh
TDD downlink (prediction horizon 2 slots) lt 0 dB (0094 λc) 5 dB (0156 λc) 10 dB (0219 λc)
TDD uplink (prediction horizon 3 slots) 5 dB (0150 λc) 15 dB (025 λc) gt 25 dB (035 λc)
FDD downlink (Figure B7) lt 0 dB (0117 λc) 6 dB (0195 λc) 125 dB (0273 λc)
FDD uplink 2 users in competition band 0 dB (0117 λc) 7 dB (0195 λc) 15 dB (0273 λc)
FDD uplink 8 users in competition band 35 dB (0117 λc) 11 dB (0195 λc) 20 dB (0273 λc)
In these examples adaptive transmission can be expected to work in the widest variety of situations in the proposed wide-area FDD downlinks and short-range TDD downlinks while it works in the narrowest range of circumstances in the proposed short-range TDD uplink that requires the longest prediction hori-
WINNER D210 v10
Page 81 (180)
zon The case of wide-area FDD uplinks using overlapping pilots falls somewhere in-between The performance deteriorates with the number of simultaneous users that transmit overlapping pilots but this deterioration is not severe
B53 Compression of channel state feedback for adaptive transmission This section contains a brief summary of results from Section 314 in [WIND24] and and additional results on multi-antenna systems Assume that one or several clients within a terminal are in competition for a sub-bandwidth of the total band comprising N chunks (one-antenna SISO transmission is assumed here) K active terminals compete for this competition band Assume that each terminal feeds back a proposed code and modulation rate for each chunk For a scheme with r rates each terminal then needs to feed back N log2(r) bits per chunk duration Tchunk For K users the required total feedback data rate is then
chunkf TrKNR )(log2= [bits]
For a 40 MHz FDD downlink with N = 104 chunks and with r = 8 code and modulation rates we would have a feedback overhead of 925 kbits per active user Expressed in another way for each chunk for which K downlink users compete K log2(r) feedback bits would have to be transmitted in the following uplink chunk The FDD mode chunks of Appendix C3 contain 96 symbols With around 80 non-pilot symbols per uplink chunk K = 8 active terminals with r = 8 would consume 2480 = 30 of the uplink bandwidth for control signalling if one feedback bitfeedback symbol can be used on average The situation described here is clearly unacceptable Fortunately there are several ways in which the required feedback rate can be reduced significantly
The channel gains and SNRs at adjacent chunks will be highly correlated (If they were not the chunk widths would have been selected too wide and we would have severe problems with channel variability within the chunks) This correlation can be utilised to reduce the feedback rate The channels are also correlated in time Furthermore it is likely that in most cells except those situated close to major roads the large majority of terminals will not travel at vehicular speeds but rather be stationary For those terminals very little feedback is required
In Section 314 of [WIND24] several principles for compression are introduces and evaluated Lossless compression of the modulation-coding rates could for the considered ITU Vehicular A and Pedestrian A channels be performed at rates close to 091 bitschunk and 035 bitschunks respectively
Significantly lower feedback rates can be attained by using lossy compression of the SINR This method provides the added benefits that SINR-values not only suggested rates are fed back This enables the scheduler to select intelligently among users who would have suggested the same rates for a given chunk The net effect is that lossy compression of SINR values is superior to lossless compression of suggested modulation-coding rates It enables us to attain both lower feedback data rates and a higher performance in terms of the attained spectral efficiency when performing multi-user scheduling The suggested coder uses transform coding (discrete cosine transform DCT) to compress the SINR data in the frequency direction It combines this with sub-sampling in the time direction to obtain a further compression due to the temporal correlation Motivations for these design choices are discussed in [WIND24] The resulting algorithm is summarised by Figure B8 and Figure B9 below
FFTRx
Cal
cula
tech
unk
SN
R
DC
T
Sca
lar
Qua
ntiz
ers
104 104 104
Sub
-sa
mpl
ing
Tx feedback
FFTRx
Cal
cula
tech
unk
SN
R
DC
T
Sca
lar
Qua
ntiz
ers
104 104 104
Sub
-sa
mpl
ing
Tx feedback
Figure B8 A block diagram of feedback handling in the terminal
Q-1
Receivedfeedback
Ups
ampl
ing
IDC
T
104 104104
ChunkSNR
Sche
dulin
g
Q-1
Receivedfeedback
Ups
ampl
ing
IDC
T
104 104104
ChunkSNR
Sche
dulin
g
Figure B9 Block diagram of feedback handling at the base station
WINNER D210 v10
Page 82 (180)
With the discussed compression of SINR predictions only 025 bitschunk are required for the Vehicular A channels and 012 bitschunk for the Pedestrian A channels when all users travel at 50 kmh and the modulation-coding scheme uses r = 8 rates If the mobile speed is reduced it will be possible to further sub-sample the coded feedback information For example at 5 kmh it would be possible to reduce the feedback information further by a factor of 10 With a feedback rate of 025 bitschunk over the Vehicular A channel we would only need 4 bits per chunk to accommodate 16 vehicular 50 kmh users per competition band in addition to many more stationary users Uplink feedback with only four 4-QAM symbols per chunk that use rate frac12 coding is adequate for this
For multiple antenna systems the required feedback rate will of course increase proportionally with the number of virtual antenna streams for which the channel quality feedback is required If not only real-valued channel quality SINR values but channel state information in the form of complex-valued matri-ces is required this will increase the feedback requirements quite substantially In [KBLS06] a method is described that can significantly reduce the required CQI feedback using vector quantisation techniques
An example of a system with four transmit antennas and one receive antennas that would need 32 bits if all four complex gains were represented by 8 bits each Using an optimised quantiser it is possible to use only one or two bits and still reach a significant portion of the performance for perfect CSI Especially for scenarios where long-term CSI is available at the transmitter this additional information can be efficiently exploited by combining a fixed quantisation scheme for the short-term CSI with a linear transformation that only depends on the long-term CSI The resulting feedback requirement may still be high for adaptive multi-user transmission However further reductions can be expected by utilizing the temporal correlation as was outlined for the SISO case above
WINNER D210 v10
Page 83 (180)
Appendix C MAC System Layer Functions This appendix gives more details on the services and functions within the MAC modes that were presented in Chapter 3 Appendix C1 below gives brief descriptions of the resource and transmission control functions for in the two cellular MACs The functional architecture of the peer-to-peer MAC is outlined in Appendix C2
The functional description of the PHY system layer is important for understanding the transmission but it has been left out from this report to save space It can be found in Section 552 of [WIND76]
C1 Functional architecture of the WINNER medium access control for FDD and TDD cellular transmission The presently assumed design of the MAC system layer for FDD and TDD cellular transmission was outlined in Section 31 see Figure 33 and Figure 34 The implementations of these two MAC modes are common to about 90 and their interfaces to higher layers are identical They will therefore be described together below with mode-specific differences indicated when they appear
The description follows the presentation in Section 54 of [WIND76] Since the delivery of [WIND76] the design has been refined and modified on several points As compared to the presentation in [WIND76] the design has been modified as follows
1 The PHY control signalling is under current investigation It has been re-organised so that a major part of the transmit control processing is executed by the MAC system layer As outlined by Figure 33 three special PHY services can be invoked transferring control packets
a Transmission together with the BCH packets in the super-frame preamble b Use of non-frequency adaptive transmission c Use of special time-frequency resources earmarked for control transmission via the
service Special Transmit Control Signalling PHY service In addition piggybacking of control bits in ordinary packets may also be used
2 Measurements are as before provided as a PHY layer service They may also be provided in
further processed form as a MAC system layer service The partitioning of processing of measurements is under current discussion and will continue to be investigated in WINNER II
3 The transport channel TCC for control flows has provisionally been added to aid investigations
on the design of protocols that supports all required control messaging 4 Antenna calibration has been added as a function within the spatial scheme controller
The sections below describe all the main control functions that are introduced in Figure 33 Appendix C15 summarises how different transport channels are handled as illustrated by Figure 34 The resource scheduler (Appendix C16) is a crucial system element of the WINNER design it is in a sense the ldquospider in the netrdquo of the whole design Appendix C17 provides additional discussion on the problem of SDMA and spatial user partitioning Finally Appendix C18 summarises the time scales on which the different functions work
C11 MAC radio resource control Resource partitioning and constraint combining The problem that the resource partitioning has to solve is the structural preparation of the next super-frame outlined in Section 314 The time-frequency chunk is the basic unit for subdividing the radio resources The partitioning of the super-frame between different transport channels will be performed with chunk granularity Reuse partitioning between cells is supported18 It must be performed with guard-bands due to the non-orthogonality introduced by large time delays See Appendix G73 It has to be performed in terms of wider frequency resource units since the guard bands would otherwise represent too large an overhead The resource partitioning may be changed on a super-frame basis but most parameters will typically stay unchanged over longer time horizons In TDD one single super-frame is to be defined In FDD separate uplink and downlink super-frames are to be specified see Annex A31 of [WIND35] The uplink and downlink super-frames will normally use differing allocations
18 See Section 52 in [WIND32]
WINNER D210 v10
Page 84 (180)
The resources of the next super-frame are allocated and subdivided in the following sequence bull First all constraints on the use of chunks are updated by the Constraint combining function of
the constraint processor at the BS It receives control inputs from the RLC on restrictions due to spectrum sharing and interference avoidance with neighbouring base stations At the BS the spatial properties of the restrictions are re-calculated in terms of BS antenna transmission properties19
The subsequent steps are performed by the Resource partitioning function that is implemented in the MAC control plane at the base station
bull DAC assignment A (nonzero) set of consecutive chunks is reserved for DAC (contention-based traffic) In the TDD mode these resources may also be used for peer-to-peer traffic This assignment is placed in the frequency region that is assumed available everywhere (Figure 32)
bull RN assignment In cells that include relay nodes sets of chunk beams are reserved exclusively for transmission between these RNs and UTs Each set is reserved either for single RNs or for a group of RNs that will create little mutual interference Furthermore resources may be allocated for use in the relay links between BSs and RNs
bull TDC adaptive transmission assignment The remaining chunks are divided for use by adaptively and non-frequency adaptively scheduled flows respectively This division is based on the history of the previous traffic demand
bull The set of chunks reserved for adaptive transmission may be further divided into competition bands where one stream normally uses only a single band These competition band allocations are updated if required
The super-frame has now been constructed Control messages that specify the allocation are transmitted from the BS at two instances In the case of two-hop relaying the resource partitioning information is thereby distributed to all the participating UTs at the beginning of the following super-frame
bull The RN partitioning is transmitted from the BS to the RNs over the relay link in chunks that are reserved for control signalling within the present super-frame
The remaining control information is transmitted by the BS to the UTs This is done during the downlink control part within the preamble of the super-frame being defined In the here-considered case of two-hop relaying it is the next super-frame Simultaneously each RN transmits the RN assignment to the UTs under its control For more details please see Section 634 of [WIND35]
C12 MAC radio resource control Flow setup and termination New uplink and downlink flows are established by the Flow establishment RRM function in the RLC system layer It requires the detailed setup of a flow context over each involved hop That flow context establishment is executed by the MAC flow setup function Flow context release is initiated by the RLC and is executed by the MAC Flow termination function In the case of per stream rate control (PSRC) see Appendix B1 several queues per flow are used
When a new downlink flow is established it is given a local flow address that is unique within the cell Its destination UT (or UTs in the case of CDC point-to-multipoint flows) is notified and a resource scheduling buffer queue is initialised
In the FDD mode flows tofrom half-duplex terminals are assigned to one of four groups Group 1 transmits in the downlink the first half of the frame and in the uplink during the latter half Group 2 transmitsreceives in the opposite way Group 3 contains half-duplex terminals that have adaptable and flexible uplink and downlink transmission periods Full-duplex terminals belong to Group 4
TDC flows are initially assigned either for adaptive or for non-frequency adaptive transmission by the flow setup controller The choice is based on the capability of the terminal the average SINR and the velocity of the terminal The choice is also affected by the potentially available spatial schemes and their CSI and CQI requirements The initial assignment may be changed later if the circumstances change Flow setup in relay-enhanced cells is discussed further in Section 635 of [WIND35]
19 In a grid-of-beams implementation constraints on the transmit power used in each beam may be used In the
general case constraints on the transmit covariance matrix may be used
WINNER D210 v10
Page 85 (180)
C13 MAC radio resource control Spatial scheme pre-configuration and selection A base station or relay node can have one or multiple antennas These antennas can be localised or may constitute a distributed antenna system eg comprising all antenna elements within a building A general spatial processing scheme for MIMO transmission and spatial domain link adaptation has been defined [WIND27] It includes multiplexing diversity-based transmission fixed beamforming and adaptive beamforming as special cases see Appendix B1 The spatial scheme controller performs a baseline spatial scheme selection process It is invoked to select an appropriate spatial transmit scheme for the newly established flow This selection is based on the terminal capabilities the BS antenna capabilities and the choice of adaptive and non-frequency adaptive transmission In addition the interference properties of other flows and their demand for spatial channels influence the decision Also for already established flows the spatial processing scheme can be changed by the Spatial Scheme Controller To reduce the complexity of this process a split in two functions and temporal layering is used
bull Spatial scheme pre-configuration performs static and long-term trigger-based assignments These assignments serve as inputs and constraints to the next step
bull Spatial scheme selection determines the dispersion code (degrees of spatial diversity and spatial multiplexing) the possible use of per stream rate control and the possible use of and type of precoding
staticdecisions and
constraints
Spatial SchemePreconfiguration
Spatial SchemeSelection
long-termdecisions and
constraints
each superframe
several superframescell configuration update
staticdecisions and
constraints
Spatial SchemePreconfiguration
Spatial SchemeSelection
long-termdecisions and
constraints
each superframe
several superframescell configuration update
Figure C1 Overview of temporal layering of the MAC functionalities Spatial scheme pre-configuration and selection within the spatial scheme controller
The Figure C1 above illustrates these functions and the different time scales at which they operate The static part of the spatial scheme pre-configuration evaluates all parameters decisions and constraints that can only be changed with an update of the basic cell configuration including the physical layer mode type of deployment (cellular isolated hot spot) cell range and the base station (BS) antenna configuration Furthermore mapping tables indicating the possible spatial schemes for each transport channel and terminal capability as well as a list of possible combinations of dispersion code PSRC and precoding type can be generated at this stage
The long-term part of the spatial scheme pre-configuration evaluates all parameters decisions and constraints that normally change on time scales greater than one super-frame or issues that cannot be decided on a per-flow basis like the overall selection of a scheme that applies to all users of a cell (eg configuration of a fixed beam approach or multi-user precoding) Slowly varying parameters include user distribution user speed quality of CQICSI information the flowsrsquo QoS parameter and long-term channel characteristics like average SINR long-term channel rank and eigenvalues Also certain flow-specific decision will be long-term oriented eg the decision between long-term and short-term spatial processing
Spatial scheme selection performs the remaining decisions based on decision criteria that change on a short-term basis include eg number of active users cell load (due to packet-oriented transmissions) and the short-term channel characteristics The spatial scheme selection considers these parameters and adapts the spatial scheme per flow under the constraints set by the spatial scheme pre-configuration
An important additional part of the Spatial Scheme Controller is the calibration function Calibration is required to relate a desired spatial distribution of energy in space to specific transmit weights and to allow exploitation of channel reciprocity in the TDD mode despite of RF front-end imperfections The calibration function checks the calibration status of a link with the particular requirements of the selected spatial processing technique and triggers the corresponding calibration procedure if required Calibration
WINNER D210 v10
Page 86 (180)
is therefore invoked at flow setup and each time either the selected spatial scheme is altered or the calibration status changes (eg temporal expiry)
C14 MAC control feedback The definition of service primitives for the MAC Control Feedback service is driven completely by the demand for such feedback from the RLC system layer and the IP Convergence layer In principle all outputs from the main function blocks and even internal states of these function blocks could be made visible to upper layers to enable various forms of inter-layer interaction The set of required feedback parameters is under discussion It includes SLC Cache levels (see below) as well as resource use per flow
C15 Radio packet transfer Transmission and reception The transmission control is performed in cooperation with the QoS control of the RLC system layer A Service Level Controller (SLC) Cache with per-flow queues for all downlink TDC CDC and DAC flows is assumed to be implemented within the MAC at each BS and RN For uplink flows corresponding buffers are present at each RN and UT The RLC layer Service level controller and flow scheduler (Section 41 and Appendix D12) controls the inflows to the BS SLC Cache and monitors its state The outflow from the SLC Cache is under control of a MAC - For BS-to-UT downlinks and BS-to-RN relay links the MAC at the BS controls the transmission - For UT-to-RN uplinks the MAC at the RN controls the transmission - For UT-to-BS uplinks the MAC at the BS controls the transmission Packet transmission and reception will be handled differently for the five transport channels BCH packets and RAC packets are encoded at transmission and decoded at reception but are not processed further by the MAC layer TDC CDC and DAC packets are processed by a more elaborate transmit and receive sequence that is divided into five protocol sub-layers as illustrated by Figure 34 MAC-5 Performs optional segmentation and reassembly of MAC SDUs (ie RLC PDUs) MAC-5 also performs flow identification at reception MAC-4 Sender adds CRC resulting in a retransmission unit (RTU) Receiver checks CRC and may ask for retransmission in case of error The retransmission mechanism is denoted MAC retransmission MAC-3 Sender performs optional segmentation of RTUs into encoding blocks The receiver then performs reassembly of received blocks into RTUs MAC-2 Coding of each encoding block results in an FEC block (forward-error-correction coded block) that is saved in the appropriate RSB queue The receiver decodes each FEC block It may also perform (soft) combination with retransmitted FEC blocks This encoding decoding will in the following be referred to as the outer code Encoding and decoding schemes have been discussed in Appendix B2 MAC-1 Performs puncturing of FEC blocks and resource mapping onto assigned chunks Resource mapping is a separate main function of the MAC user plane The protocol sub-layers MAC-5ndashMAC-2 may all be transparent ie their functions are optional Special cases of this transmission sequence accommodate all retransmission schemes and segmentation strategies that are at present under consideration The design outlined above performs segmentation and encoding before the mapping onto chunks It thus decouples the segment size used for retransmission from the chunk size It also decouples the code block size from the chunk size in a practical way These factors are also important when the WINNER radio interface concept is used as a test-bed to compare and evaluate different combinations of MAC retransmission strategies and coding schemes
For BCH the mapping onto super-frame control symbols is controlled by the Resource partitioning function For TDC CDC and DAC the Transfer control function supervises both transmission and reception The transmission control is focused at fast transfer via the physical layer
bull For adaptively allocated TDC downlink flows a transmission can be initiated during the downlink part of frame j and then be performed during the downlink slot of frame j+1
bull For adaptively allocated TDC uplink flows a transmission can by requested during frame j prepared and scheduled during frame j+1 and then be performed in the uplink slot of frame j+2
WINNER D210 v10
Page 87 (180)
bull For non-frequency adaptively allocated TDC and CDC downlink flows the scheduling can be determined during frame j An allocation table is transmitted in the first DL OFDM symbol of frame j+1 The transmission can then be performed either within frame j+1 or during frame j+2
bull For non-frequency adaptively allocated TDC uplink flows the transmission is initiated during frame j and is then performed in the uplink slot of frame j+1
Thus the delay from initiation of a transmission to its completion is 10ndash25 frames (07ndash17 ms) over one hop Multi-hop transmission will add to the total delay The roundtrip delay until a MAC retransmission can be performed depends on the decoding delay The computation speed estimates presented in Table B2 in Appendix B21 is around 200 kbitms The additional decoding delay for the outer code should then not exceed 01 ms for RTU sizes of interest (up to 1520 bytes)
The transmission of packets belonging to the different transport channels is summarised below
TDC (downlinks and uplinks) Packets in scheduled Targeted Data Channel flows are optionally segmented and then coded using the transmission sequence outlined above The FEC blocks are buffered by per-flow queuing in the resource scheduling buffer Scheduling and the subsequent mapping is then performed by either the adaptive or the non-frequency adaptive resource scheduling algorithm depending on the assignment of the flow Thereafter transmission proceeds using the PHY Adaptive transfer or Non-frequency adaptive transfer services At reception complete FEC blocks are delivered to the MAC In downlinks the MAC at the BS or RN controls the transmission In uplinks packet transmissions are initiated by UT requests The MAC at the BSRN with which the UT communicates controls the subsequent scheduling transmission and retransmission
CDC (downlinks only) The point-to-multipoint transmission has to deal with a wide variety of channels and directions to the destination users This complicates the adjustment of the transmission parameters and the use of beamforming To reduce the problems a CDC flow may be partitioned into separate copies targeted flows which are destined to specific groups (clusters) of users in different directionswithin different beams A CDC flow is processed through the MAC-5ndashMAC-2 protocol layers The resulting FEC blocks are copied into one or several queues in the RSB one queue for each targeted flow Scheduling and mapping of each targeted flow then proceed by non-frequency adaptive transmission with transmission parameters that are adjusted in a conservative way The transmission uses the PHY Non-frequency adaptive transfer service At reception complete FEC blocks are delivered to the MAC where they are decoded Packets (MAC SDUs) are finally recombined if segmentation was used A reliable multicast service may utilise retransmission The retransmissions could be triggered by NACKs from any of the destination users of a targeted flow Schemes that combine this mechanism with ACKs from the terminal with worst channel are also possible
DAC (uplinks only) Contention-based transmission is potentially the best way of transmitting uplink flows that have small packets with a low packet arrival rate The main current proposal for contention-based transmission is a scheme that uses carrier-sense multiple access and therefore requires a constant set of frequencies to be assigned exclusively during the whole super-frame When an uplink packet destined for contention-based transmission is drained from the SLC Cache at the UT it is prepared for possible retransmission and then coded The same function blockssub-layers as for TDC and CDC transmission are used but the parameter settings may be different The FEC blocks are transmitted by using the PHY contention-based transfer service Received DAC FEC blocks are decoded and the RTUs are possibly retransmitted if an error is detected
BCH (downlinks only) The BCH packets contain control signalling from higher layers The range of their reliable reception places an upper bound on the size of the cell These downlink broadcast channel packets are combined with super-frame control information The combined packets are low-rate encoded in the MAC combined with space-time-frequency (inner) encoding performed at the PHY layer Transmission and reception proceeds via the PHY BCH and SF control transfer service Retransmission cannot be used Adjacent BS and RN should use orthogonal time-frequency sets within this timeslot for their downlink preamble control transmission to limit their mutual interference
RAC (uplinks and for TDD BS-to-BSRN) The Random access channel can be used for initial access to a BS or RN by the UTs eg after handover RAC packets are coded and then transmitted in the reserved time-slot of the super-frame preamble in a contention-based manner Transmission and reception proceeds via the PHY RAC transfer service The MAC protocol and transmission strategy for this channel has not yet been defined
The RAC time-slot can in TDD systems can also be used for BS-to-BS and RN-to-BS over-the-air control signalling A BS or RN involved in this transmission would use the RAC for transmission in a few super-frames while it listens for reception in the others
WINNER D210 v10
Page 88 (180)
C16 Resource scheduling The Resource scheduler determines the resource mapping for TDC and CDC flows It utilises two scheduling algorithms
bull The Adaptive resource scheduler used for high-performance TDC transmission
bull The Non-frequency adaptive resource scheduler used for all CDC flows and as a fallback alternative for TDC flows It is also foreseen to be used for parts of the control signalling
These algorithms take priorities from the RLC Service Level Controller into account as well as the queue levels in the RSB and the SLC Cache
In addition the resource scheduler contains several support functions Spatial link adaptation Uplink slow power control Active set selection RS parameterisation and Allocation Statistics that will not be discussed further here
bull The adaptive resource scheduling and transmission uses predictions of channel quality information (CQI) to utilise the small-scale and frequency-selective variations of the channel for different terminals The scheduler assigns a set of chunk layers (see Section 132) within the frame to each flow After scheduling the RSB queues are drained with bit-level resolution The bits from each flow are mapped onto the assigned chunk layers This mapping is exclusive ie several flows do not share a chunk layer The transmission parameters within each chunk layer are adjusted individually through link adaptation to the frequency-selective channel of the selected user This link adaptation may use combinations of adaptive modulation (inner) coding that is adjusted to each chunk and power control The link adaptation can be designed to provide a target SINR per bit for the FEC blocs that are coded with the (outer) FEC code It then converts the fading channel into something approximating an AWGN channel as seen by the outer code Link adaptation may be combined with spatial multiplexing for example in the form of per-stream rate control where different FEC blocks of one flow are mapped to different chunk layers By selecting the best resources for each flow multi-user scheduling gains can be realised The scheduling algorithm should take into account the channel quality information of each user in each chunk layer the RLC flow transmission requirementspriorities and the queue levels Timely channel quality information requires the SINR within each chunk layer and for each candidate terminal to be predicted with relatively high accuracy The most advanced multi-antenna transmit schemes furthermore require the whole MIMO channel gain matrix to be known at the transmitter This is denoted full channel state information (CSI)
bull Non-frequency adaptive resource scheduling and transmission is instead based on averaging strategies Such transmission schemes are designed to combat and reduce the effect of the variability of the SINR by interleaving space-time-frequency coding and diversity combining Non-frequency adaptive transmission is required when fast channel feedback is unreliable due to eg a high terminal velocity or a low SINR [WIND24] or when the terminal does not support adaptive transmission It is also required for point-to-multipoint communication belonging to the common data channel (CDC) flows The non-frequency adaptive transmission slowly adapts to the shadow fading but it averages over the frequency selective (small-scale) fading It requires the FEC blocks to be mapped on a set of chunks that are widely dispersed in frequency and if possible on different antennas to maximise the effectiveness of the coding and interleaving
Figure C2 below gives an overview of the downlink transmission of scheduled flows Among other things this figure illustrates that two scheduling entities control the flows and have to cooperate The Flow scheduler at the RLC system layer is part of the Service level controller (Section 41 and Appendix D12) The Resource scheduler at the MAC system layer works on a faster time scale and takes the channel properties into account The adaptive RS uses detailed knowledge of the available resources the non-frequency adaptive RS has to work with more crude measurements of the average channel qualities In the present design these SLC and the RS interact in a very simple way The SLC fills the SCL Cache while the RS is responsible for draining it The SCL furthermore reports priorities of each flow to the RS Only a few priority levels are used The RS drains the queues and allocates the transmission resources in a way that optimises a criterion that takes the queue levels and the priorities into account Existing algorithms with very low computational complexity can be used to solve the resource scheduling problem when formulated in this way See eg Chapters 6 and 7 in [Eri04] These algorithms have computational complexity that grows linearly with the number of scheduled resources and linearly with the number of scheduled flows Execution times below 01 ms can be attained which is consistent with the very fast transmission strategies outlined in Appendix C15 above
WINNER D210 v10
Page 89 (180)
Service Level Controller
Resouce Scheduler
Packet Processing
IFFT beamforming pulse shaping
Tchunk
Optional SLC buffer
Time
Virtual antennalayer Frequency
RLC
MAC
PHY
CQI CSI Buffer levels CQI errors
Antenna 1 Antenna N
Non-frequency-adaptive Resource Scheduler
Adaptive Resource Scheduler
Map on dispersed chunks Map on optimal chunks
Constraint Processing
(= End-to-end ARQ buffer)
- Scheduled Mapping onto chunks and layers - Link adaptation
Segmentation FEC Coding
SLC cache at BS
Per-flow flow control - Inter-flow fairness - Service constraints - Total delay contraints
Resource scheduling buffer
at BS or RN
TDC CDC
Flow classification Convergence layer
Spectrum mapping
and assignment
Figure C2 Data flows and some control functions in downlinks of the scheduled data channels
Adaptive transmission requires prediction of the channel quality due to the transmission control loop delay In [WIND24] summarised in Appendix B52 the predictability and attainable prediction accuracy is investigated as a function of the SINR and the terminal velocity The effect of the prediction errors on the attainable adaptive transmission performance and on attainable multi-user scheduling gain was investigated Fast adaptation control loops are a part of the WINNER design With correspondingly low delays adaptive transmission was found feasible at vehicular velocities at 5 GHz carrier frequencies A SINR and velocity-dependent boundary delineates when adaptive or non-frequency adaptive transmission is the best alternative (Appendix B52) This decision is taken at flow setup and may be changed later
Both downlink and uplink power control is supervised by the Resource scheduler and is integrated into the optimisation of the transmission parameters
A novel framework had been developed for handling the spatial dimension of the multi-user scheduling and link adaptation problem It integrates various SDMA (spatial division multiple access) strategies into the total solution
WINNER D210 v10
Page 90 (180)
[yes][no]
exit conditions could also be based on some quality metric instead of a fixed number of iterations
x stands for either adaptive or non-frequency adpative
This message determines the active set for the next frame
Upd
ate_
cons
train
ts(F
cbS
cb)
Spa
tial_
sche
me(
flow
num
ber)
su_la gtmax_su_la
mu_la gtmax_mu_la
su_la=su_la+1
RSB
_sta
tus(
Que
ue_s
tate
s_CD
C
Que
ue_s
tate
s_TD
C)
Upd
ate_
mea
sure
men
ts(C
QI_
pred
ictio
ns)
MAC_URSB
MAC_CSpatial Scheme SelectionMAC_CConstraint Processing
PHYMeasurements
mu_la=mu_la+1su_la = 0
Spatial userpartitioning
[yes]
[no]
Upd
ate_
flow
_sta
tes(
RS_a
ctiv
e_se
t_D
LU
L)
MAC_UQueue State Control
Channel-adaptivemulti-userscheduling
send
_enc
oded
_bits
(poi
nter
num
ber_
of_b
its)
PHYx TransferSend
PHYTransmit Control Signaling
Active setselection for
frame j+1
Preliminary spatialsingle-user link
adapatation
Link adaptation
Resource Mappingfor all flows in
frame j+1
Figure C3 Resource scheduling sequence overview (adaptive and non-frequency adaptive)
As outlined by Figure C3 above adaptive multi-antenna link adaptation and scheduling is separated into four steps to limit the computational complexity so that a fast feedback loop is obtained
1) Spatial user partitioning ie separation of users into spatially well separated sets
2) Preliminary single-user link adaptation for each potential user and potential resource
3) Channel-adaptive multi-user scheduling within the sets of spatially highly-interfering terminals using the chunk capacities calculated in step 2 (In case of non-frequency adaptive transmission only slow adaptation to the shadow fading is used)
4) Final link adaptation resource mapping and transmission of the selected flows using either the link adaptation parameters that were determined in step 2 or iteratively refined schemes
The sequence can be iterated a few times to improve the estimate of the spatial inter-set interference
Step 1 the spatial user partitioning will be discussed in more detail in Appendix C17 below Step 2 the single-user link adaptation was discussed briefly in Appendix B514
The channel-adaptive multi-user scheduling should in general be designed to take queue levels into account as discussed above In the simulation evaluation investigations presented in Appendix G below the simplification of a full queue model was used The following simple resource scheduling strategies were used in most of the investigations on adaptive transmission
bull Round robin ie periodic allocation to all flows
bull Max rate scheduling ie giving the resource to the flow that can have the highest throughput
bull Score-based scheduling [Bon04] a modified proportional fair strategy
To reflect the bursty nature of packet flows and to limit the transmission overhead each adaptively allocated TDC flow shifts between the following states
bull Passive The flow has an empty RSB queue and no packet in the SLC Cache Minimal transmission control signalling is required Terminals may be in micro-sleep mode except during specified control transmission time-slots
bull Semi-active This state is only used for adaptively allocated TDC flows The flow has segments in queue but is not eligible for scheduling during the present frame
bull Active The flow is eligible for scheduling during the present frame The full transmission control loop is up and running
WINNER D210 v10
Page 91 (180)
The transition between these three states and the corresponding PHY control messaging is governed by the Queue state control function within the Flow state controller and the active set selection in the RS The queue state is updated every slot (half-frame)
In cells with few flows all flows with packets to transmit will be in the active state In cells with many flows assigned for adaptive transmission the access to the active state can be restricted to limit several types of complexity and overhead The scheduling computational complexity the downlink control overhead the channel prediction complexity and the CQI and CSI feedback signalling overhead
C17 SDMA and spatial user partitioning The task of spatial user partitioning is to separate the user terminals into spatial sets with low mutual interference The aim is to group the user terminals so that their correlation matrix (power at receiver i resulting from a downlink transmission to terminal j) becomes approximately block diagonal Highly interfering terminals are placed into the same spatial sets members of pairs with mutual interference below a pre-defined threshold can be placed in different sets Once such spatial sets are established we can use SDMA for flows of different sets Such groups of flows that share a chunk are called (spatial user) groupings Other multiple access schemes (such as TDMA FDMA) are used to avoid interference when transmitting tofrom users within the same set The sets can be thought of as (generalised) beams They are reached by using specific spatial precoding (beamforming) weights
The spatial user partitioning allows controlling the interference generated by SDMA by setting appropriate interference thresholds during the generation of the spatial sets Therefore the allowed SDMA interference can be considered in the overall interference prediction used for in resource scheduling in the individual spatial sets To a first approximation we can therefore assume that the subsequent multi-user scheduling can be performed independently within each spatial set of terminals This reduces the computational complexity drastically spatial user partitioning reduces the problem of multi-user multi-antenna scheduling to that of performing chunk-adaptive multi-user scheduling within the individual sets
The procedure to obtain such spatial sets depends on the amount of channel knowledge at the transmitter If channel state information (CSI) is available at the transmitter the spatial sets can be generated by calculating the mutual correlation between users If only a channel quality indicator (CQI) is available so-called opportunistic or grid-of-beams beamforming approaches are used
As the number of users increases it becomes increasingly complex to find spatial sets with good separation properties and testing all possible terminal combinations must be avoided20 We may then partition the time-frequency resources into two or more groups and assign subsets of users to each group These subsets of user terminals are called orthogonal groups If this grouping is performed properly it simplifies the task of forming well-separated spatial sets within each orthogonal group Different criteria to form orthogonal groups are conceivable eg
bull For fixed beamforming the users associated to beams that can be transmitted concurrently with inter-beam interference below a pre-defined threshold can form one orthogonal group
bull For adaptive precoding terminals can be grouped according to their SINR requirements (ie according to their target data rates and interference suppression capabilities) This allows using different SDMA interference thresholds in the different groups It therefore improves the overall opportunities for SDMA (which would otherwise be limited over all resources by the weakest terminal)
The SDMA decision must be integrated in the overall resource allocation process ie the decision must integrate the priorities due to QoS contracts and the opportunities and constraints due to the spatial channel characteristics The numbers of users served concurrently by SDMA is a parameter which has a significant impact on the performance the throughput gain offered by serving multiple users at the same time comes at the expense of serving each user with a smaller fraction of the available transmit power
An example of the use of SDMA and spatial user partitioning is given in Appendix G22 Furthermore a specific algorithm for creating spatial groupings is discussed in more detail below
20 The complexity is especially severe in cases where CSI is used at the TX for precoding because the precoding solution depends on the combination (and possibly also on the user ordering) to be tested and again differs for every chunk
WINNER D210 v10
Page 92 (180)
Low Complexity Space-Time-Frequency User Partitioning for MIMO Systems with SDMA
The algorithm was originally derived for a precoding technique that forces the interference to be zero between all users that are served simultaneous via SDMA Even if no interference is present spatial scheduling is of crucial importance If users with spatially correlated channel subspaces are served jointly this leads to inefficient precoding matrices and a drop in the strength of the equivalent channel after precoding The goal of the algorithm is therefore to group together users with uncorrelated channels The precoding technique under investigation allowed the use of an efficient approximation technique based on orthogonal projection matrices to calculate the capacity after precoding which serves as a scheduling metric The capacity estimate also allows to inherently consider the effect of different group sizes since it includes the transmit power In the case of precoding where interference is not fully suppressed the problem of correlated subspaces will lead to a slight reduction in link quality and to an increase in interference Since the latter is dual to the drop in link quality in the zero forcing case the proposed solution is also applicable in the non-ZF case as shown in [FDGH05b]
An iterative method for forming these groupings presented in [FDGH05a] will be described briefly
For any users g out of G users a rough estimate ( )Sgη is calculated that represents the spectral efficiency
that would result if that user were allowed to transmit in the selected way It approximates the inter-layer interference effect and can be calculated by a simplified projection scheme see [FDGH05a] [FDGH05b] The equivalent channel of user g is represented by its channel matrix after an orthogonal projection into the null-space of a joint channel matrix containing all G usersrsquo channels except that of the grsquoth The resulting chunk throughput when transmitting to all users in the grouping is simply estimated as the sum of the G individual terms ( )S
gη
The iterative tree-based scheme for forming appropriate groupings can now be explained as follows Let us start with a situation where all users are part of one spatial set ie each use forms a separate grouping with only one member (lowest row in Figure C4) SDMA would then not be used at all within the cell First the user with the best metric is identified In the figure it is user number 1 Then one user at a time is added to it and the metric sum of the combination is calculated The combination with the highest metric sum is kept as candidate user groupings with size 2 The algorithm is repeated to test and form a grouping of size 3 It proceeds in this way up to the maximum allowed group size When done the
grouping of size G with the highest metric sum GC (or highest capacity if higher accuracy is desired) out of all candidate groupings (marked in red for G = 3 in the example in Figure C4) is chosen To reduce complexity even further the solution can be tracked in time Instead of calculating the entire tree the sorting starts with the previously found solution and proceeds eg one level up in the tree and two levels down again updating also the previous solution The sub-grouping is then selected only from three new candidates Going top-down in the tree is achieved by testing one by one which user to delete from the grouping in order for the remaining group to have maximum sum metric
Figure C4 In a system with 5 users candidate user grouping are built by adding one user at a time and keeping the grouping with highest sum metric Finally the grouping with highest sum metric
(eg the one marked in red) out of all candidate groupings (marked in yellow) is used
11 22 33 44 55
1 21 2 33 44 55
33 551 24
1 2 34 5
1 2 34
55
Trac
king
win
dow
11 22 33 44 55
1 21 2 33 44 55
33 551 24
1 2 34 5
1 2 34
55
Trac
king
win
dow
WINNER D210 v10
Page 93 (180)
C18 Timing of the execution of the main MAC functions
The main functions of the control plane (C) and the user plane (U) are executed on the following time scales
Executed once every super-frame
- Constraint combining (C) - Resource partitioning (C)
- Spatial scheme selection (C)
- Coding resource mapping and PHY transmission of RAC and BCH flows (U)
- Reception from PHY and decoding of RAC and BCH FEC blocks (U)
The execution of the following functions is trigger-based when required
- Flow setup control (C)
- Flow release control (C)
- Spatial scheme pre-configuration (long-term decisions and constraints) (C)
- Calibration in the spatial scheme controller (C)
- Support functions within the resource scheduler (U)
Executed every slot (half-frame in FDD UL DL period of frame in TDD)
- Queue state control (U) - Resource scheduling (U)
- Coding segmentation resource mapping and PHY transmission of TDC and CDC flows (U)
- Reception from PHY decoding and reassembly of TDC and CDC FEC blocks (U)
C2 Functional architecture for peer-to-peer MAC C21 MAC services provided for peer-to-peer transmission The Radio_Resource_Control service for P2P transmission is used to start maintain and stop the operation of a P2P-DAC in the BS User terminals which intend transmitting peer-to-peer have to attach to the channel before transferring data using this service Detaching terminals from the DAC is another service that is provided If a UT intends to transmit data packets synchronously the service provides functions to create and terminate a synchronous data flow The primitives of type req request ind indication rsp response and cnf confirm that are provided to use this service at higher layers are summarised in Table C1
Table C1 Overview on MAC_P2P_CONTROL primitives for P2P transmission
Name req ind rsp cnf
MAC_P2P_CONTROL_START_DAC - -
MAC_P2P_CONTROL_STOP_DAC - - -
MAC_P2P_CONTROL_ATTACH_TO_DAC
MAC_P2P_CONTROL_ATTACH_INFO - - -
MAC_P2P_CONTROL_DETACH_FROM_DAC -
MAC_P2P_CONTROL_CREATE_SYNC_FLOW - -
MAC_P2P_CONTROL_TERMINATE_SYNC_FLOW - -
After the P2P-DAC has been configured appropriately and the UTs involved in P2PPMP transmission have been attached the Radio_Packet_Transfer service for P2P transmission can be used to exchange
WINNER D210 v10
Page 94 (180)
segmented packets either asynchronously or synchronously between peer terminals The primitives which are provided to use this service at higher layers are summarised in Table C2
Table C2 Overview on MAC_P2P_USER primitives for P2P transmission
Name req ind rsp cnf
MAC_P2P_USER_SYNC_DATA -
MAC_P2P_USER_ASYNC_DATA -
C22 MAC functions provided for peer-to-peer transmission DAC-P2P flow setup data transfer and flow termination
Figure C5 shows the state-transition diagram implemented in the P2P-DAC flow setup and termination unit of the base station (see Figure 37) After radio resources have been allocated for the DAC the service primitive START_DACreq triggers the execution of the P2P-DAC initialisation function and the transition to state P2P-DAC_ACTIVE In this state the P2P-DAC beaconresource control function is continuously executed to control the operation of the DAC by broadcasting beacons with the appropriate information about the available DAC service and the current DAC frame structure This control function is terminated by executing the P2P-DAC terminate function after receiving a STOP_DACreq
The state-transition diagram in Figure C6 illustrates how the various protocol functions of the P2P-MAC interact with each other in the UT to setup a P2P-DAC flow control the data transfer and terminate the flow
After being synchronised to the BS the user starts the P2P-DAC attach function by sending an ATTACH_TO_DACreq primitive to the flow setup and termination unit This function conveys to the BS information about the UT and the BS assigns to the UT a unique identifier for efficient addressing After its successful completion a confirmation is sent to the user before the finite-state machine transits to state ATTACHED A UT can detach from the DAC at any time by executing the P2P-DAC detach function
In the state ATTACHED the user can request an asynchronous transfer of a radio packet in the CAP or GAP to the peer UT by sending a USER_ASYNC_DATAreq This initiates the execution of the P2P-DAC asynchronous transfer control function If the packet should be transmitted in the GAP the UT informs the BS with an UL command of the pending transmission request If resources are available the BS schedules time slots for the transfer request and announces the availability of the time slots for the requested P2P transfer in the beacon The transfer control function then controls segmentation retransmission and multiplexing of the segmented radio packet onto the assigned time slots If the packet should be transmitted in the CAP the request is forwarded to the P2P-DAC channel access control function After completing the data transfer the successful transfer is confirmed and the finite-state machine returns to state ATTACHED
Before radio packets can be synchronously transferred between peer UTs a service user has to request the execution of P2P-flow setup function by sending a CREATE_P2P_FLOWreq This procedure establishes a synchronous P2P-flow by exchanging protocol messages between the UTs and the BS If time slots are
Figure C5 State-transition diagram of P2P-DAC flow setup and termination in the base station
WINNER D210 v10
Page 95 (180)
periodically available for the requested data transfer the BS assigns a unique index to the newly created flow After the successful completion of the procedure a confirmation is sent to the user and the finite-state machine transits to state P2P-FLOW_ESTABLISHED A UT can terminate a P2P-flow by executing the P2P-flow termination function
In the state P2P-FLOW_ESTABLISHED the user can request a synchronous transfer of radio packet on the pre-established P2P-flow by sending the USER_SYNC_DATAreq primitive This primitive initiates the execution the P2P-DAC synchronous transfer control function which controls segmentation retransmission and the multiplexing of the segmented data to the pre-allocated time slots of the DAC frame After the completion of the data transfer the transfer is confirmed and the finite-state machine returns to state P2P-FLOW_ESTABLISHED
Figure C6 State-transition diagram of P2P-DAC flow setup transfer control and flow termination in the user terminal
P2P-DAC channel access control functions The P2P-DAC channel access control functions give UTs random access to the P2P-DAC for transmitting control messages to the BS and exchanging protocol messages or small amount of user data between peers
A UT which is synchronised to the P2P-DAC can transmit command frames to the BS in the UL command time slot by using a slotted ALOHA access protocol The access to the time slot is controlled by a contention window that is maintained by each UT The size of the window is defined as cw(a)=min2a+1256 where a represents the number of retransmission attempts already made by the UT The UT chooses a uniformly distributed random value r within the interval [1cw(a)] and starts the access after r DAC frames After receiving a response from the BS indicating successful command reception the parameter is reset to zero
A UT which is attached to the P2P-DAC can asynchronously transmit control messages or a small amount of data to a peer UT in the contention-access period Since no establishment of a synchronous P2P flow is required this method leads to a faster access and data transfer The basic medium access mechanism used in the CAP is the well-known carrier-sense multiple access scheme with collision avoidance A UT with a pending data transmit-request senses the state of the wireless medium before it can transmit If the medium is idle longer than a pre-defined time interval it can proceed with the transmission Otherwise it first waits until the medium becomes free then generates a random backoff time before it tries to transmit in order to minimise the risk of collisions with transmit request issued by other terminals
WINNER D210 v10
Page 96 (180)
C3 Chunk definition The scaling of chunks in the WINNER system is based on the following general considerations
bull The appropriate frequency extent of a chunk should be determined by analysing the balance between two factors 1) The performance loss due to channel variability within the chunk which is decreased with narrow chunks This factor depends on the typical channel power delay profile which is in turn related to the cell size and the deployment scenario 2) The required control overhead and feedback rate with adaptive transmission which is decreased with wide chunks
bull The appropriate time duration of a chunk is determined by the following factors 1) Short chunks lead to a small overall radio interface delay 2) Short chunks enable the design of feedback loops for adaptive transmission also for fast fading channels 3) Short chunks may contain so few payload symbols that the overhead due to pilots and in-band control symbols becomes prohibi-tive 4) Long chunks may contain too many payload symbols Transmission of small FEC blocks will then become problematic since flows are in general mapped exclusively to flows in adaptive transmission without chunk-sharing
The chunk definitions found below are specified for the (frequency) adaptive transmission mode which will be used whenever precise channel quality information is available at the transmitter to steer link adaptation on a fine granularity level Within chunks allocated for non-frequency adaptive transmission there is a potential need for a more fine-grained rate matching Solutions to solve this problem are outlined in Section 316
The chunk width is set to 8 subcarriers or 3125 KHz in the FDD mode and to 16 subcarriers or 7812 KHz in the TDD mode The motivation for this difference in chunk widths is that the FDD mode has in WINNER phase I been evaluated in rural area and metropolitan area deployments with rather high delay spread and frequency selectivity in the channels see Table F1 in Appendix F The TDD mode has been evaluated primarily in short-range deployments with less delay spread in the channel models and thus less frequency selectivity
Thus the usable 416 subcarriers in the FDD mode are partitioned into 52 chunks the usable 1664 subcarriers in the TDD mode are partitioned into 104 chunks The radio interface delay requirement of 1 ms [WIND71] can be interpreted as a requirement on the slot duration of the FDD transmission and the uplink and downlink slot lengths of the TDD transmission by the following reasoning The shortest control loop for a transmission consists of a request response and transmission Each such sequence should have duration of approximately 1 ms The chunk durations Tchunk of the FDD mode will therefore be set to 12 OFDM symbols plus guard times or 3456 micros The frame of the half-duplex FDD system consists of a downlink chunk followed by an uplink chunk with duration Tframe = 2 Tchunk = 6912 micros The frame of the TDD mode consists of a downlink period + duplex guard time + uplink period + duplex guard time This frame duration is set equal to the FDD frame duration of 6912 micros to simplify inter-mode cooperation The TDD chunk duration is set to 5 OFDM symbols plus guard times = 1088 micros The duplex guard time is set to 192 micros Each TDD frame contains 6 chunks plus two duplex guard times With asymmetry 11 each frame contains three uplink chunks and three downlink chunks
A chunk thus contains 96 symbols in the FDD cellular mode when used for CP-OFDM transmission and 80 symbols in the TDD cellular mode See Figure 31
WINNER D210 v10
Page 97 (180)
Appendix D Radio Resource Management (RRM) and Radio Resource Control (RRC)
D1 RRM functions
D11 Spectrum control
Spectrum Sharing Spectrum Sharing controls the access to the spectrum in frequency bands which are shared with other RATs which are probably the ones used by legacy systems Depending on the regulatory rules governing the shared bands different scenarios for spectrum sharing are possible
Horizontal sharing The involved systems in the shared frequency band have equal regulatory status ie no system has priority over the other(s) in accessing the spectrum
bull Horizontal sharing without coordination No signalling is required between the involved systems as eg nowadays on the ISM band Since QoS cannot be guaranteed for any system this possibility is not considered in further detail
bull Horizontal sharing with coordination The involved systems coordinate their spectrum access based on a set of predefined rules (spectrum etiquette) that all systems adhere to This requires capabilities for signalling or at least detection of the other systems
Vertical sharing In this modality sharing is performed with clearly established priorities The primary system has preference in accessing the spectrum and the secondary system(s) may only use the spectrum as long as they do not cause harmful interference towards the primary
The most important as well as complex service component is the one where WINNER is the secondary system which controls the emissions from the WINNER system to avoid harmful interference towards legacy systems This function first has to reliably identify the ldquowhite spacesrdquo ie unused spectrum and then determines the transmit constraints of the WINNER system The identification of the white spaces can be based on measurements and it can be significantly assisted with information provided by a spectrum database or a central radio controller Based on the available and measured information constraints for the transmit parameters are determined and signalled to the constraint processing function in the MAC layer
Spectrum Assignment Spectrum Assignment periodically reassigns a portion of the available spectral resources between multiple WINNER RANs In contrast to the conventional fixed spectrum assignment herein it allows dynamical balancing of spectral resources between networks As a result spectral resources available for a network can be adjusted according to eg changes on the operatorsrsquo customer base (or market shares) Spectrum assignment also facilitates introduction of operators with relatively small customer base or network coverage area In addition spectral resources can be re-assigned according to the variations on the aggregate loads on the networks hence enhancing the overall use of spectrum over all networks
Long-term Spectrum Assignment The spectral resources assigned to the networks are defined in terms of chunks and hence separation between networks can be done either in frequency (eg in FDD mode) or both in time and frequency One principle for the re-assignment assumed in the following is to keep the spectral resources assigned to the networks as orthogonal as possible In other words the resources are separated in time frequency or space so that interference between networks is minimised This prevents the need for extensive coordination (or tight coupling) between networks for complicated interference management over multiple networks as well as for strict limitations to the operation of RRM within networks The principle likely favours TDD bands where orthogonal resource allocations are efficiently obtained in time This is due to the synchronisation between networks required also with the conventional fixed spectrum assignment due to the adjacent channel interference Other principles assumed in the following are
bull The spectrum assignment functionality is distributed to all networks and re-assignments any negotiated between networks without any central controller
WINNER D210 v10
Page 98 (180)
bull Central database containing relevant information on spectrum priorities as well as on fairness and cost metrics enables higher layer control on the spectrum assignment through the priorities and fairnesscost metrics It also enables simple introduction of new networks
bull Spectral resources are divided into two categories resources assigned with a priority and common pool resources
o The purpose of resources assigned with a priority to a certain network is to guarantee basic operation of the network under all circumstances A network can release some of the priority assigned resources for other networks but it can retrieve the resource in the next negotiation phase In other words it has incontestable priority to the resource
o Common pool resources can be reserved by any network
bull Fairness and cost metrics are used in the negotiation of assignments to achieve fair and efficient allocation solution
bull Spectral resource assignments vary geographically although spatially contiguous assignments are preferred to avoid unnecessary interference between networks To facilitate smooth spatial transition in the assignments it is envisaged that long-term assignment specifies for large geographical areas with spatial granularity of several cells (sets of cells) and short-term assignment optimises the border regions further with cell-wise resource assignments
bull Spectral resource re-assignment is done periodically and at a slow rate (ie several minutes)
It may be preferable that resources in the common pool are assigned to a network for multiple spectrum assignment periods at a time In other words not all common pool resources are re-assigned at each period This results in a smoother spectrum assignment adaptation and probably reduced need for the priority assigned spectral resources A simple solution may be that assignments have a common duration of multiple assignment periods and a resource can be released during the assignment
Short-term Spectrum Assignment The short-term spectrum assignment complements the main spectrum assignment by providing short-term and local ie cell-specific variations to the spectrum assignments covering large geographical areas Hence it enables 1) faster adaptation to the local traffic load variations and 2) geographically more accurate spectrum assignments In the part of faster adaptation to load variations it provides complementary method for inter-network load sharing The assessment of the true benefits of this approach in comparison to plain load sharing remains to be done in WINNER II
The re-assignments of spectral resources are performed in the time scale of several seconds To limit the induced complexity the functionality resorts to only simple inter-network signalling Functionality requests resources from other WINNER RANs after triggered by the long-term spectrum assignment or preventive load control In the case of a resource request from other RANs the functionality rejects accepts or partially accepts the request based on information from load prediction and MAC control feedback on the overlapping and neighbouring cells Inter-network signalling is performed either over the air or through the core network For the over the air signalling RAC is used through the MAC radio packet transfer service The constraint information is updated based on the decisions and sent to appropriate MAC layer
D12 Service level control (SLC) The SLC has the overall responsibility of adjusting inter-flow fairness and assuring the fulfilment of service level contract agreements and total delay constraints In particular
bull it may perform by requesting resources from several BSs that may utilise different WINNER modes
bull it works on a slow time scale characterised by the packet arrival rates
bull it may allocate resources belonging to several modesbase stations
The SLC forwards packets to SLC cache (Figure C2) based on a predicted sum rate and QoS requirements which could be derived by the queue levels feedbacked by the SLC cache The SLC cache is kept rather small corresponding to few frames while separate queues are allocated for each flow Furthermore the SLC assigns static priorities per flow and RS schedules based on priority queuing time and channel state
The service differentiation is exercised through the following service components while an example is given in Figure D1
WINNER D210 v10
Page 99 (180)
bull Flow Conditioning The traffic of each flow is conditioned to ensure that it complies with the corresponding profile definition in particular the defined maximum traffic rate
bull Flow Queuing In WINNER it is assumed that separate queues are allocated for each flow Packets in respective queue may get dropped during transient phases of congestion
bull Flow Scheduling Flow scheduling may be considered as management between flows and determines the order in which PDUs will be forwarded to the SLC cache buffer residing at the MAC layer and works on a time scale characterised by the packet arrival rates
bull Flow Monitoring The main aim for flow monitoring is to (as the name suggests) monitor the flow and provide feedback on flow traffic predictions to any other function that may require this information
Flow-1 Flow-LApps belonging to service class 1
Decision based on intra-class policy inter-class policy and age of packet
Flow-1 Flow-N
Per Flow Queuing+Active QueueManagement
Flow scheduling
SLC Cache(Drained by RS)
Flow-M Flow-NApps belonging to service class L
MAC
RLC
Aggregate of Marked Packets
Network Control Packets
Flow Conditioning(eg through Leaky or Token Bucket
IPC
Feedback on Queue Levels
Figure D1 Example of flow conditioning flow queuing and flow scheduling
D13 ModeRAN selection The different architecture alternatives may be expected to differ in what decision variables are available and according to the way different available modes are used We have above defined
1 fast selection - which is a quasi-simultaneous operation of modes and will have to be performed in both the BS and the UT the decision variables and boundary conditions are expected to be set by RRM but the selection decision has to be taken by MAC (Figure D2)
2 slow selection - which is an RRM function to control alternative operation of modes the process perhaps bearing many similarities to the RAN selection
3 re-selection - which is an RRMRRC function to handle changing radio conditions availability of modes
WINNER D210 v10
Page 100 (180)
Application s
TCP UDP
IPvX
Multi-Mode Layer 2
Layer 1Mode 1
Layer 1Mode 2
IP Convergence Flow identification
Destination Identification
End-to-End Automatic Repeat
reQuest (ARQ)
Hop-by-Hop ARQ
Mode 2
ResourceScheduling
Mode 2
Hop-by-Hop ARQ
Mode 1
Resource Scheduling
Mode 1
Segmentationand
Reassembly (SAR)
(Inter -mode)-Scheduling =
fast mode selection
L2 M
odes
Con
verg
ence
Man
ager
RR
MR
RC P
aram
eter
izatio
n fo
r fas
t mod
e se
lect
ion
RR
MR
RC c
ontro
l for
slo
w m
ode
sele
ctio
n an
d re
-sel
ectio
n
Data FlowParameterization Composition and Status Information
Interaction
Figure D2 User plane data flow and fast mode selection (not shown slow mode selection and re-selection performed by RRMRRC)
According to the variant of mode selection applied a subset of the decision variables can be used
bull Mode availability - which subset of the modes that a terminal can support is in fact available at the current location
bull Service ndash the mode which is most efficient for the service in question is selected
bull Signal strength ndash the mode from which the strongest signal is received is selected This is a simple version of the more sophisticated selection parameter radio resource cost discussed below
bull Radio resource consumption ndash the mode for which the least relative amount of radio resources (eg power codes timeslots etc) is required to support the users is selected
bull System load ndash the mode with the least relative load is selected This does not necessarily improve capacity but improves user quality at loads below the capacity limit and avoids reallocations as the load approaches the capacity limit
bull Packet size ndash the mode which is most efficient for the packet size in question is selected
bull Price ndash the mode for which the price for supporting the user is lowest is selected This is especially interesting in case the different modes are run by different operators and the decision is taken by the end-user or the terminal
The RAN selection algorithm selects the most suitable RAT for attending the service requests of UTs Of importance here are the RATrsquos preferences for the requested service according to the QoS offered by each RAT and the balance among the radio resources occupation of the different RATs achieved by a suitable traffic load balance among them The algorithm is based on the availability of a list for all the available RATs capable to provide the service This list is made based on QoS information A decisive factor for prioritising a RAT over another RAT will be the user preference [WIND41] [WIND42]
D14 Handover The general rules for handover between the WINNER modes are expected to be mode availability and terminal mobility For example UTs with high mobility are expected to always be connected with the wide area cell even if they are in the vicinity of the short range cell Also the triggers for handover and their thresholds between the two modes will depend on the deployment scenario ie extension of coverage and increase of spectral efficiency as well as on the relaying concept In case of an inter-system handover this is expected to take place either when there is loss of coverage of the current system or in the case of overlapping coverage due to useroperator preferences or traffic congestion Example of handover triggers are given in [WIND41] [WIND42]
WINNER D210 v10
Page 101 (180)
Intra-system handover Since the wide area cell is going to exist as an umbrella over the short range cell there is a need for making the UT aware that it has the option of changing to TDD mode In order to allow for a seamless handover within the WINNER RAN BSs and RNs of the same or different mode can announce their presence to the UTs by broadcasting control messages using orthogonal resources This scheme is especially helpful for the handover between WINNER FDD and TDD as it allows the UTs to be aware of the presence of BSs and RNs that operate at a different mode without disrupting their normal operation to ldquosniffrdquo other parts of the spectrum Further information can be found at [WIND43] [WIND44]
Inter-system handover
Location-based Vertical Handover (VHO) In a homogeneous system the scanning of other possible connections is triggered by the condition of the link since an ongoing connection with good performance makes such a procedure dispensable For a vertical handover continuous surveillance is mandatory At the moment this can only be handled by the terminal itself because no entity exists for the integration and information exchange of different networks Therefore the mobile must scan all other possible RATs The autonomous gathering of information by means of scanning may impact both the own and other transmissions Therefore it makes sense to look for alternative ways of gaining respective measurement results Since the need for own measurements shall be reduced as much as possible another way of gathering the relevant information is to employ measurement reports which have been collected by other active UTs within the same or within other systems Information gathering within the same system thereby is required for horizontal handover (HHO) preparation whereas for VHO information gathering between different types of systems is needed However information may also be used to control other mechanisms such as appropriate physical mode selection for link adaptation (LA) or (joint) Radio Resource Management (RRM) In all cases the location-based VHO in combination with the Hybrid Information System (HIS) offers a great economic potential since participating devices can minimise or even avoid self-driven scanning procedures The principle of the HIS presumes that each system collects data about the current link state within the covered cell and provides this information on request to mobiles that are willing to change their connection within the same system (HHO) or different systems (VHO) [WIND41] [WIND42] [WIND43] [WIND44]
CRRM based VHO Another approach for an inter-system handover is based on the CRRM framework defined in the 3GPP [3GPP-TR25891] which allows the exchange of load information between UMTS and GSM networks The proposed algorithm takes in a first step only load criteria into account but in a second step will include also service criteria [WIND41] [WIND42] These algorithms can be extended to WINNER inter-mode handovers [WIND43] [WIND44]
D15 Admission control Admission control schemes are the decision making part of networks with the objective of providing to users services with guaranteed quality in order to reduce the network congestion and call dropping probabilities and achieve as much as possible resource utilisation An example of an admission control algorithm for the selection of the appropriate RAT in the case of RAN cooperation is summarised below [WIND41] [WIND42] [WIND43] [WIND44]
bull The algorithm makes a list of the candidate serving networks and candidate cells for each network The lists contain the candidate networks and cells capable of providing the requested flow service and they are ordered in such a way that better fulfils its requirements in each network
bull If there is only one RAT available in the flowrsquos location area and the flow can be served by that RAT then it is selected otherwise (if the flow cannot be served by that RAT) the flow will be rejected
After selecting the target RAT the algorithm checks if the flow is new or from handover (which means that the flow was already going on in a RAT and for some reason it was decided to change its RAT) If it is a new flow then if there are other flows waiting in the queue it will be rejected (or it will select another RAT if there is one in its list) otherwise it goes to the next step The next step of the algorithm is to check (no matter if it is a handover or new flow) if there are sufficient resources in that network for the flow to be served If there are sufficient resources the flow will be admitted to the target RATmode If the resources of the target RAN are insufficient it will be first checked if the flow can be served by another RATmode If the flow is new and has low priority then it is rejected in this RAN and itrsquos checked if another one can serve it and if none is available the flow is rejected If the flow is from handover or a new - high prioritised it is not rejected in the target RAT but it is first checked if it can be served by another
WINNER D210 v10
Page 102 (180)
RAT (suitable for it) If not it is checked if there is a possibility that other ongoing flows can perform a handover to another suitable network If this action does not also gain the needed resources for the flow then it is checked if degrading the QoS of some ongoing flows (in this RAT) with low priority (where ldquolowrdquo is relative to the priority that the flow has) is possible and enough to admit the flow
If the flow is new and has high priority it will be checked if degrading the QoS (ie lowering the bit rate at a tolerant level) of some low priority flows will gain the needed resources and if yes then the flow is admitted otherwise it is rejected
If it is a handover flow then it is also checked if low priority flows can degrade their QoS as much as it needs to admit the flow If this canrsquot be done the handover flow will enter the handover queue in a position related to its priority that means that it will enter in front of flows with lower priority The flow will remain in the queue until o The needed resources become available (ie by completion of other flows) o The flow leaves the cell ie the user moves to another cell or the flow is completed o The flow is terminated due to timeout
The admission control algorithm for the cooperation between B3G and legacy RANs aims to maximise the number of admitted or in-flow traffic sources supported over the RANs while guaranteeing their QoS requirements and ensuring that the new connection does not affect the QoS of the ongoing connections The decisions to accept or reject a new connection are based on different criteria taking into account each RATrsquos nature
D16 Load control Reactive load control is used to face a situation where the networks are in a overload situation and the usersrsquo QoS is at risk due to increase of the interference mobility aspects low bandwidth availability etc When already admitted users cannot satisfy their guaranteed QoS to their services for a specific percentage of time then the network is considered to be in an overloadcongestion situation Herein we describe am example of a reactive load control mechanism that is monitoring WINNER as well as legacy RANs and if an overload situation occurs it tries to decrease the load of the network performing several actions and especially trying to make the RANs cooperate ie by forcing users to perform handovers The reactive load control algorithm is divided into three phases [WIND41] [WIND42] [WIND43] [WIND44]
1) Detection phase The algorithm continuously monitors the networks and periodically checks the load of the networks in order to detect a overload situation in anyone of them It is considered that a network is overloaded if the load factor is over a certain pre-defined threshold during a certain amount of time
2) Resolution phase This is the phase that the algorithm is trying to resolve the problem that causes the overload situation At first as it is obvious we must drop all the incoming flows (new and handover) as they will increase more the load of the network so admission control is forced to reject the flow requests for that network Then in case flow conditioning is not used the algorithm checks if the overload situation is caused due to users that violate their QoS restrictions in terms of bit rate which means that it tries to find if there are flows that transmit with more bit rate than they should according to the service agreements made between the network and the user If such flows exist then the algorithm drops their bit rate to the value that exists in the service agreements After restoring the bit rate of the users to the agreed there is a check if the network is still in a congestion situation and if so the algorithm performs a number of actions which include handover of flows decreasing of their bit rate or even selective dropping of flows
3) Then the algorithm enters the recovery phase where we try to restore the transmission rate to the flows which rate was decreased in the second step of the resolution phase A recovery algorithm is necessary because we cannot leave the flows with a bit rate that violates the QoS service agreements The problem here is that if we restore the flowsrsquo bit rate incautiously the network could fall once again in a overload situation and thatrsquos why we must be very careful to that For all the flows that we have decreased their bit rate we check (separately) if we can restore their transmission rate without causing congestion again by computing the amount of load needed in order to restore the transmission rate
D17 Routing
The overall picture of the routing in multi-hop cellular networks (MCNs) is depicted in Figure D3 From the architecture perspective two basic routing strategies are envisioned in multi-hop systems centralised or distributed Under the centralised strategy route determination is performed in a central controller which normally possesses powerful processing capability and has knowledge on global network status so that sophisticated routing algorithms could be adopted to optimise the system performance With the
WINNER D210 v10
Page 103 (180)
distributed strategy individual network nodes from the source to the destination jointly perform route determination This strategy could function when no central controller is reachable but its performance is normally limited by network nodesrsquo processing capability and knowledge on network status
Figure D3 Routing in MCNs
In terms of protocol nature the routing algorithms in conventional multi-hop networks such as ad-hoc networks can be mainly broken down into two categories proactive routing and reactive routing With proactive routing schemes network nodes continuously evaluate the topology of the network so that when a packet needs to be forwarded the route is already known and can be immediately used Reactive schemes on the other hand invoke a route determination procedure on demand only Thus when a route is needed some sort of global search procedure is employed in order to find a suitable route to the destination The protocol nature of the routings in MCNs could be both proactive and reactive but being applied at different circumstances for instance reactive routing is be used for idle users whereas proactive routing is applied for active user Nevertheless further studies will be carried out on this issue
For both proactive and reactive routing schemes for ad-hoc networks topologyroute information is normally preserved in routing tables The difference is for proactive routing the table contains up-to-date and complete topology information whereas for reactive routing a route is only created in the table when needed For the routing in MCNs likewise routing tables are also supposed existing at BSs RNs and UTs to keep the necessary routing information for respective nodes This will be further explained in the later part of this section The routing in MCNs is responsible for a number of basic tasks such as routetopology discovery (NB route discovery is normally for reactive routing schemes whereas topology discovery is for proactive ones) and route table updatingmaintenance etc
Decision criteria In the literature various criteria have been proposed for the routing criteria in MCNs such as distance pathloss and transmission power etc For each user these routing algorithms intend to find and choose the route with the least distance pathloss or transmission power etc In our recent work [LHYT01] and [LHYT02] a novel routing criterion named the Load Cost Indicator (LCI) is proposed
ζroute i = Croute i R route i
Where ζroute i is the LCI of route i Croute i represents the consumed capacity of the transmission on route i and R route i is the transmission data rate on route i Apparently such a criterion reflects the consumed system capacity when delivering unit amount of traffic on a particular route Given a certain system capacity constraint if every user employs the route with the least LCI among all its possible routes the system throughput can be maximised
Routing tables As mentioned earlier like in ad-hoc networks in MCNs routing tables are also supposed existing at individual network nodes including BSs RNs and UTs Nevertheless due to the fact that the BS is the common source for all the downstream [WIND25] flows and meanwhile the common destination for all the upstream flows in one radio cell the routing tables in MCNs are much simpler than their counterparts in ad-hoc network moreover for packet delivering purposes an BS only needs to keep downstream routing tabletables a UT only needs to have upstream routing tabletables whereas a RN needs to have both downstream and upstream routing tables Nevertheless as mentioned earlier the routing is envisioned to be centralised (BS-based) in MCNs in another word the route table calculation
WINNER D210 v10
Page 104 (180)
for all the nodes within one cell is to be performed by the BS hence BS actually has the knowledge of the up-to-date route tables at individual nodes within the cell
D2 RRM architecture Intuitively the problem of optimising resources is better posed when doing it in a common fashion rather than regarding separately cellsmodes When information about interference induced by surrounding cells and about the amount of spectrum resources in other modes is available (CRRM approach) algorithms perform better and the usage efficiency is increased This also applies when considering not only surrounding cells but also different radio networks operating simultaneously ie JRRM approach
Benefits of centralised RRM are achieved at the expense of a higher computational complexity since the algorithms have to deal with a higher number of degrees of freedom and involve a larger interchange of information among network agents thus increasing the signalling Time restrictions on signalling are also to be considered Centralised RRM algorithms have been proven to perform worse than distributed ones when delay introduced by signalling is larger than few seconds (5 s)
D21 Location of WINNER functions A first approach regarding the WINNER RRM architecture is shown in Figure D4 According to this approach the mode specific functions are located at the BS and RN while the mode generic user plane ones are located at the RANG logical node All the control plane functionalities are located at the Access Control Server (ACS) logical node A disadvantage of such an RRM architecture would be the possible overload of the system due to increased signalling directed to the ACS node leading to delays
The service level controller (SLC) regarding the downlink is foreseen to be located at some distance from the BSs such as at RANG It has the overall responsibility for adjusting inter-flow fairness assuring the fulfilment of service level contract agreements and total delay constraints It may perform by requesting resources from several BSs that may utilise different WINNER modes working on a slower time scale and may allocate resources belonging to several modesbase stations As buffer management and traffic policing could impose constrains on the service load controller they could be located at the same node After flow classification the service level controller will direct packets of a flow to one specific queue within a buffer residing in an BS or RN On the other hand the flow scheduling of the SLC for the uplink direction will be located at the BS or even the RN The resource schedulers link adaptation and power control should always be located close to the BSs to minimise delays
However all mode generic control plane and cooperative functionalities are located at the ACS logical node In this almost centralised approach the problem of optimising resources is better posed as it is done in a common fashion rather than regarding separately cellsmodesRANs The main disadvantage of such an RRM architecture is the higher computational complexity since the algorithms have to deal with a higher number of degrees of freedom and involve a larger interchange of information leading to the possible overload of the system due to increased signalling directed to the ACS node leading to delays
WINNER D210 v10
Page 105 (180)
bullSchedulingbullService Level Control (uplink)bullShort Term Spectrum AssignmentbullLink AdaptationbullPower Control
bullService Level Control (downlink)bullFlow Establishment amp ReleasebullBuffer ManagementbullTraffic Policing
bullModeRAN SelectionbullHandoverbullAdmission ControlbullLoad Control bullLong Term Spectrum AssignmentbullSpectrum SharingbullRouting
Radio AccessNetwork RANG
AP
RN RN
UT
ARExternal IP
Network
bullSchedulingbullService Level Control (uplink)bullShort Term Spectrum AssignmentbullLink AdaptationbullPower Control
bullService Level Control (downlink)bullFlow Establishment amp ReleasebullBuffer ManagementbullTraffic Policing
bullModeRAN SelectionbullHandoverbullAdmission ControlbullLoad Control bullLong Term Spectrum AssignmentbullSpectrum SharingbullRouting
Radio AccessNetwork RANGRANG
AP
RN RN
AP
RN RN
UTUT
ARExternal IP
Network
Figure D4 WINNER RRM Architecture
It is envisaged that for the WINNER system with the multiple operating modes the hybrid approach would be suitable In particular in order to avoid extensive delays in the decision making and signalling overload a solution could be to bring some of the control plane functions closer to the BS physical nodes adding more complexity to the BS physical nodes and therefore increasing their cost However assuming different types of BSs for the wide-area and short-range scenarios we could restrict the extra functionality to the wide-area BSs (BSwa) In particular the ACS node would comprise mainly the RRM functions needed for the cooperation of the WINNER system with legacy RANs (handling user admission control to the WINNER system) and the coordination of the BSwa (if necessary) where a more comprehensive status of the system is required On the other hand the mode generic related control functions would be located at the BSwa (handling flow admission control) reducing the amount of signalling information required and allowing for faster decisions since the resources are controlled at a cell level For the BSwa to be able to make decisions on mode selection re-selection handover admission control congestion control and spectrum mapping between the BSsr that fall within its cell as well as between it and the BSsr several information are required to be transmitted periodically or upon request from the BSsr to the BSwa These include BSsr id and cell id current load max load power information handover statistics per RN and BSsr (successful drop rate etc) number of RNs attached to BSsr (in case of mobile RNs) CELLsr range (this can be change in case of mobile relays leavingjoining)Furthermore some of the mode specific RRM functions such as scheduling might reside at the RNs performing at different time scales as it is envisioned to have RNs with different functionality layers (layers 123)
D3 RRC functionalities
D31 Measurements and reports To choose the most suitable modeRAT a fundamental aspect is to assess the quality that different modesRATs will provide to the users This quality indication is basically obtained from measurements on the current and target networks RRM mechanisms in B3G systems will be able to use more metrics and information as inputs than the current RRM algorithms since information will be exchanged between networks and new metrics are becoming available
Current handover mechanisms are only based on received power either in cellular systems or in WLAN networks Congestion control algorithms in UMTS use mainly power measurements and service attributes to control access and load On the contrary in B3G systems various metrics coming from all the networks available can be used as inputs of any type of RRM algorithms
Some of these new metrics or information foreseen as useful to improve the RRM performance are listed below
bull Cell load free capacity
bull Location
WINNER D210 v10
Page 106 (180)
bull Velocity direction
bull Users environment (indoor outdoor etc)
bull Terminal capabilities
bull Handover statistics
Other information concerning the link connection includes Price of per bit in the link Security setup and encryption used in the link ARQ status of the link etc
Measurements can be performed either in the base stations or in the user terminal Usually RRM decisions are taken by the network therefore mechanisms must exist to report measurements from base station or terminal to the network The reporting may be periodic event-triggered or on demand
The WINNER system should at least provide to the RRM (orand cooperative RRM) entity
bull Signal strength measurements performed by either terminals or base stations on the WINNER RAN but also on legacy RANs when necessary
bull Transmitted power measurements performed by either UTs or BSs
bull Quality measurements
bull Cell load measurements (eg power measurements L2 buffer load indeed the exact definition of load for the WINNER system must be investigated and will depend on the chosen radio interface)
bull A beacon that terminals on other systems can listen to and measure eg in order to prepare for a handover to WINNER
The possibility for a terminal in a WINNER system to measure the received signal strength of base stationsbase stations of legacy systems should be foreseen when defining the WINNER system Alternatively the RRM entity in WINNER should have access to these measurements on legacy systems Moreover the possibility to exchange load information between WINNER and legacy systems should also be anticipated (eg exchanged between cooperative RRM entities)
WINNER inter-system handover should be consistent with the inter-system HO already defined in legacy systems In particular the inter-system handover procedure between UMTS and another RAT is already specified by the 3GPP Some of the specifications are applicable to any RAT while others are RAT specific (eg specified measurements on GSM are applicable to GSM only) Therefore the WINNER design must fulfil all the requirements that are mentioned in the 3GPP specifications for every RAT and the 3GPP will need to do some specifications dedicated to the WINNER system [WIND41] [WIND42] [WIND43]
D32 Other functions Feature discovery
Both the antenna configuration and relaying issues can be perceived jointly in context of the space-time coded cooperative transmission where virtual antenna arrays are created for the purposes of enhancing the overall WINNER system performance However the question arises how to configure the virtual antenna array and which space time code to select in order to meet the requested Quality of Service Answering this question renders it necessary to investigate the problem of efficient exploitation of the additional information about links provided by the routing protocol Since the target WINNER routing protocol is not established the Multi-Constrained Optimised Link State Routing protocol (MC-OLSR) candidate solution will be used during simulations This protocol which was proposed in [WIND31] and [WIND32] will be expanded with the cooperative relaying functionality which in turn was investigated in [WIND24] where the Adaptive approach to antenna selection and space-time coding was analysed
RRCRRM and cooperative transmission
RRM is connected with RNs assignment transmit power control etc Proper RNs assignment in for the purposes of cooperative relaying in WINNER is very important because it directly affects the transmission parameters and therefore the attainable QoS level When at least coarse channel parameters between the transmitting node and the relaying ones are known it is possible to create the virtual antenna array VAA in a more optimum way To this end the selected RRC functionalities were identified which along the flow of control information are presented in Figure D5
WINNER D210 v10
Page 107 (180)
RRC
Relay Routing Path Calculation
Channel Quality Measurements
Virtual Antenna Configuration
Space-Time Code Selection
QoS Requirements
Figure D5 RRC and cooperative relaying
Here the Radio Resource Control service exploits the Channel Quality Measurements and Relay Routing Path Calculation functionalities in order to perform the space-time coded cooperative relaying in an optimum way It is then of prime importance to identify
ndash how to efficiently exploit the routing information provided by the routing protocol (eg the MC-OLSR protocol)
ndash how to perform routing so that cooperative relaying could be efficiently exploited
ndash how to configure the virtual antenna arrays and which space time code to select so that the requested Quality of Service could be met
There is also a question on how the resource partitioning between BS and RNs should be performed In case of the MC-OLSR enhanced with cooperative relaying it is assumed the control is BS-centralised which means that resources are managed and assigned by BSs
WINNER D210 v10
Page 108 (180)
Appendix E Assessments Assumptions
E1 Overview This chapter summarises baseline simulations assumptions and parameters applied in link multi-link and system-level oriented simulations Four prioritised deployment scenarios A1 B1 C2 and D1 identified in [WIND72] are addressed Additionally the B3 scenario is considered for link level investigations For scenarios A1 B1 and B3 (collectively referred to as ldquoshort-rangerdquo scenarios) evaluations are performed using the TDD cellular system mode and for scenarios C2 and D1 evaluations are performed using the FDD cellular system mode A rough characterisation of these scenarios is given in Table E1 below
Table E1 Basis scenarios considered
Scenario identifier Deployment PHY
mode Mobility [kmh]
BS height
[m]
UT height
[m]
Traffic density
A1 In building
small office residential
TDD 100 MHz 0ndash5 2 1 high
B1 Hotspot
Typical urban micro cell
TDD 100 MHz
0ndash70 eg 10 (below RT21)
15 high
B3 Hotspot
Indoor TDD 100 MHz 0ndash5
C2 Metropolitan
Typical urban macro cell
FDD 2times20 MHz 0ndash70
eg 32 (above
RT) 15 medium
to high
D1 Rural
Rural Macro cell
FDD 2times20 MHz 0-200
eg 45 (above
RT) 15 low
It should be stressed that the selected assumptions models and parameters reflect a compromise taking into account the latest system design aspects the realisable simulator capabilities as well as the open issues to be addressed They only served as baseline assumption slightly different settings may have been used in the end Moreover not every detail is covered especially with respect to system level simulations in order to keep the simulator setup feasible for many partners
E2 Basic parameters for link level evaluations For performance evaluation of different link level parts (mainly modulation schemes channel estimation and synchronisation) the system parameters fixed in Table 21 have been used for simulation As channel models one ldquorepresentativerdquo example (ie a channel having a reasonable delay spread) has been selected for each the FDD and TDD case based on the tapped delay line models provided in [WIND54] The model C2 NLOS has been selected for simulations with the FDD system parameters while the B3 NLOS model was the baseline comparison case for the TDD system parameters Additionally the A1 NLOS model was used in some simulations as an example for a channel providing a high degree of spatial diversity (ie suitable for achieving high spectral efficiency when using spatial multiplexing techniques) For channel coding the memory 6 convolutional code was used as a baseline case (gains of around 2 dB are expected when using better codes for large block lenghts cf Appendix F2) More advanced coding schemes were used in Appendix F1 in order to demonstrate the potential performance of the coding within the WINNER physical and MAC layers For the (relative) performance assessment of different coding techniques simple BPSK transmission over an AWGN channel was used (without OFDM modulationdemodulation) as the relative merits of different coding techniques proved to be relatively independent of the channel and modulation technique [WIND23]
21 RT = rooftop
WINNER D210 v10
Page 109 (180)
E3 Basic parameters for multi-link and system level evaluations
E31 Mode specific parameters
FDD mode (used in wide area simulations) Parameter DL UL Centre frequency 50 GHz 42 GHz Bandwidthchannelisation 20 MHz paired ULDL Duplex scheme (T+F)DD Transmission technique OFDM
∆f=20 MHz512 = 390625 Hz rarr TN =256 micros fc=k∆f kisin[-208208] kne0 TG=32 micros rarr T=TN + TG =288 micros
a) single carrier (continuous) Pulse period T = 256 micros416 = 6154 ns pulse shaping square root raised cosine with roll-off β=0231 b) single carrier (block oriented) same pulse as in a) block length 416 symbols rarr TN = 256 micros guard length TG=32 micros
Number of sectors 3 1 Antenna configuration WA1
BS | A1 |
Antenna configuration WA2 (ULA)
BS | | | | | | | | (05λ)
A1 | A2 | | (05λ) A3 | | | | (05λ)
Antenna gain 15 dBi 0 dBi Frame length 6912 micros (=2 DL chunks) chunk size 8 subcarriers times 12 OFDM symbols unspecified overhead (parameter estimation signalling)
19 out of 96 resource elements of each chunk
unspecified
TDD mode (used inshort range simulations)
Parameter DL UL Centre frequency 50 GHz Bandwidthchannelisation 100 MHz Duplex scheme TDD Transmission technique OFDM
∆f=100 MHz2048 = 48828125 Hz rarr TN =2048 micros
fc=k∆f kisin[-832832] kne0 TG=128 micros
rarr T=TN + TG =2176 micros Number of sectors 1 1 Antenna configuration SA1
BS | A1 |
Antenna configuration SA2 (ULA)
BS | | | | | | | | (05λ)
A1 | A2 | | (05λ) A3 | | | | (05λ)
Antenna gain 8 dBi 0 dBi Frame length 6912 micros (3 DL chunks + 3 UL chunks + 2 times duplex guard time)
duplex guard time = 192 micros chunk size 16 subcarriers times 5 OFDM symbols virtual overhead for parameter estimation
15 out of 80 resource elements of each chunk
unspecified
WINNER D210 v10
Page 110 (180)
E32 Common to all modes
Parameter DL UL Coder convolutional coder Interleaver random bit interleaver Modulation formats BPSK QPSK 16-QAM 64-QAM Spreading codes Walsh-Hadamard (WH) WH (synchronous UL)
Gold (asynchronous UL) Medium access scheme frequency adapative scheduling rarr OFDMATDMA
frequency non adaptive scheduling rarr OFDMATDMAMC-CDMA Channel estimation at Rx perfect Synchronisation perfect channel measurement accuracy for adaptive processing
perfect
delay between CQI measurement and its application
1 Frame
Equalisation (if required) MMSE Demodulation ML based soft output demodulation
If equaliser is present apply ML criterion to equaliser output signal noise spectral density -174 dBmHz noise figure 7 dB (at MT) 5 dB (at BS) Resource assignment strategies
non-adaptive mode round robin adaptive mode score-based opportunistic scheduling
Link adaptation strategies
non-adaptive mode adaptive coding and modulation based on average CSI (across all sub-channels)
adaptive mode adaptive modulation and coding per chunk based on instantaneous CSI
(H)ARQ none power control no perfect azimuth pattern of antenna elements ]dB[25
7012min)(
2
⎥⎥⎦
⎤
⎢⎢⎣
⎡⎟⎠⎞
⎜⎝⎛minus=
θθA
θ3dB= 70o
omni directional
correlation of shadow fading between sectors
same site full ie use same value different site no
correlation of fast fading between sectors
same site use same bulk parameters but redraw delays AoAs AoDs hellip different site no
WINNER D210 v10
Page 111 (180)
E4 Scenario parameters Parameter A1 B1 C2 D1
channel modelling WINNER-I interim channel models see WP5 deliverables Average BS transmit power 1 W 4 W 20 W per sector
Average UT transmit power 200 mW
Cell radius R unspecified 1 km Cellular structure hexagonal grid see Figure E1 Number of cells to be simulated 19 three sector sites
frequency reuse distance
isolated cell only
unspecified
number of users variable parameter but constant for any simulation run and snapshot user distribution uniform within cell area uniform within 19-cell area user location update random drop of users in every snapshot
within each snapshot users virtually remain at fixed positions even in case of velocity |v| gt 0 kmh
Traffic model full queue assumption (holds for any user) Mobility model (only affects fast fading)
anglev sim U(02π) vx sim η(mσ 2) vy sim η(mσ 2) |v|= (vx
2+vy2)05
mobility model parameter
M1 m1= 1 kmh σ1= 16 kmh
M1 m1= 1 kmh σ1= 16 kmh M2 m2= 5 kmh σ2= 12 kmh
M1 m1= 1 kmh σ1= 16 kmh M2 m2= 25 kmh σ2= 15 kmh
M1 m1= 1 kmh σ1= 16 kmh M2 m2= 55 kmh σ2= 29 kmh
Distribution of user characteristics considering cases SA1WA1 (SISO)22
M1 100 A1 100
M1 80 M2 20 A1 100
M1 50 M2 50 A1 100
M1 40 M2 60 A1 100
Distribution of user characteristics considering cases SA2WA2 (MIMO)7
M1 100 A1 20 A2 40 A3 30
M1 80 M2 20 A1 20 A2 40 A3 30
M1 50 M2 50 A1 50 A2 30 A3 20
M1 40 M2 60 A1 50 A2 30 A3 20
Figure E1 Example sketch of cellular scenario with 19 three-sector sites
22 No correlation between mobility transmit power and antenna parameters is taken into account so far
WINNER D210 v10
Page 112 (180)
Appendix F Link-Level Assessments The merits of different coding modulation channel estimation and link adaptation techniques have already been assessed in a number of previous WINNER deliverables most notably [WIND22 WIND23WIND24WIND26WIND27] Therefore this chapter contains mainly assessment results necessary to justify the WINNER system design decisions reported in Chapter 2 of this report Thus Appendix F2 presents a detailed comparison of the complexity and performance of Duo-Binary Turbo Codes and Block-LDPC codes as these have been identified as the most promising FEC candidate technologies More detail on the assessment methodology and other coding techniques (CC standard PCCC and PEG-based LDPCC) can be found in [WIND23] Appendices F3 and F4 provide detail on the performance of different channel estimation and synchronisation techniques to back up the results from Appendix B4 in terms of the amount of pilots required to achieve a CSI of sufficient quality at the receiver Finally in Appendix F5 results for the performance of different bit-and power-loading algorithms are presented Another purpose of this chapter is to present results that give insight into the overall performance of the WINNER physical layer ndash Appendix F1 serves that purpose
F1 Link layer performance Throughput In order to assess whether the performance of the WINNER physical layer is sufficient to live up to the requirements stated in Section 11 and in order to provide first results that allow for an estimation of the SNRs required to achieve different spectral efficiencies the performance of a single user CP-OFDM system using advanved coding (3GPP Turbo Code 8 iterations maxLogMAP decoding) has been evaluated This setup can be considered as an example of a single user served in the non-frequency-adaptive mode (where MC-CDMA with spreading factor 1 reduces to CP-OFDM) Note that the protocol overhead (super-frame structure in-band signalling pilot subcarriers) as well as SNR penalties due to imperfect channel estimation synchronisation are not included in this assessment The overhead due to guard bands on the other hand is included The overall throughput of a single link will hence be slightly lower than the figures given in the following plots and the required SNR will be slightly higher The activity factor for FDD is not included in the throughput figures an appropriate scaling must be included for all cases where the activity factor is smaller than 1
Table F1 Summary of parameters for WINNER channel models
Scenario identifier Deployment PHY mode
UT speed [kmh]
Delay Spread [ns]
Composite angular
Spread at BSMT
[degrees]
A1 In building
small office residential
TDD 100 MHz 3 24 232391
B1 Hotspot
Typical urban micro cell
TDD 100 MHz 3 90 124364
B3 Hotspot
Indoor TDD 100 MHz 3 30 3187
C2 Metropolitan
Typical urban macro cell
FDD 2x20 MHz 70 310 853
D1 Rural
Rural Macro cell
FDD 2x20 MHz 70 28 224179
Table F1 summarises some relevant parameters for the used WINNER tapped delay line models Scenario A1 and B3 provide roughly the same amount of frequency diversity However the angular spread at the BS is very small for the B3 and C2 models ndash in contrast to most other results presented in this chapter the scenario A1 has therefore been selected for TDD mode evaluations Although both wide area cases (metropolitan and rural) have been simulated the focus in the present section is on the
WINNER D210 v10
Page 113 (180)
metropolitan area where the larger traffic demands can be expected In this scenario the high correlation between BS antennas is expected to significantly affect the gains achievable by using spatial multiplexing techniques as is confirmed by the results in Figure F3
Figure F1 below shows the performance of a SISO system with the parameters from Table 21 for FDD mode operation (20 MHz bandwidth the used channel model is the clustered delay line model C2 NLOS from [WIND54]) A SNR beyond 20 dB is required to achieve a spectral efficiency of 3 bitsHz Taking a duplex activity factor of 05 and an overhead of 20 into account the spectral efficiency design target of 05 bitsHzlink in the downlink (see 70 kmh in Appendix A13) corresponds to about 25 Mbits which with dual-antenna terminals as baseline (roughly 3 dB gain in this scenario) and assuming a loss of 1 dB from non-ideal channel estimation requires a SINR of around 9 dB A simple link budget (using pathloss models and other parameters listed in Appendix E23) based on this SINR requirement gives a maximum cell range very close to 1000 m without indoor-to-outdoor coverage This indicates that the above-mentioned cell-average of 05 bitssHzlink with single user should be possible to obtain with some margin even without relays
Turning to the rural area scenario simulations (not shown) together with a link budget24 show that the spectral efficiency target of 05 bitsHzlink at 70 kmh can be reached with good margin (up to a cell range of well above 3 km) For the uplink the targets are somewhat tougher but should still be reachable (in particular with relays)
-5 0 5 10 15 20 250
10
20
30
40
50
60
70
SNR [dB]
Thro
ughp
ut [M
Bit
s]
16-QAMRc = 12
BPSKRc = 12
4-QAMRc = 12
64-QAMRc = 12
64-QAMRc = 34
Figure F1 Throughput of CP-OFDM-based FDD mode system (20 MHz SISO C2 NLOS)
Figure F2 depicts the TDD mode case (100 MHz bandwidth again for a SISO setup) ndash data rates are evidently higher while spectral efficiency figures are comparable as could be expected from the system definition in Table 21 The channel model used is A1 NLOS from [WIND54] Achieving the target spectral efficiency of 4 bitsHz (cf Appendix A14) with half-duplex and 20 overhead corresponding to about 1000 Mbits seems to be difficult without the use of some form of spatial multiplexingspatial diversity techniques to be further discussed in the following
23 Noise bandwidth 16 MHz noise figure 7 dB on DL (5 dB on UL) transmit antenna gain 15 dB output power 20
W Based on the shadow fading standard deviation of 57 dB a shadow fading margin of 35 dB was assumed by scaling the results in [SGF95]
24 Here the shadow fading standard deviation is 8 dB and a margin of 5 dB was used cf [SGF95]
WINNER D210 v10
Page 114 (180)
-5 0 5 10 15 20 250
50
100
150
200
250
300
350
SNR [dB]
Thro
ughp
ut [M
Bit
s]
16-QAMRc = 12
BPSKRc = 12
256-QAMRc = 12
4-QAMRc = 12
64-QAMRc = 12
Figure F2 Throughput of CP-OFDM-based TDD mode system (100 MHz SISO A1 NLOS)
Figure F3 and Figure F4 show the performance for the spatial multiplexing case for both FDD and TDD mode operation For the FDD system a 2x2 MIMO setup was selected while a 4x4 MIMO setup was used for the TDD case where more spatial diversity is expected to be available (cf the higher angular spread at the base station in Table F1)
0 5 10 15 20 25 300
10
20
30
40
50
60
70
80
90
SNR [dB]
Thro
ughp
ut [M
Bit
s]
16-QAMlinear16-QAMmlBPSKlinearBPSKml4-QAMlinear4-QAMml64-QAMlinear64-QAMml
Figure F3 Throughput of CP-OFDM-based FDD mode system (20 MHz 2x2 MIMO C2 NLOS)
WINNER D210 v10
Page 115 (180)
For both setups the performance was evaluated when using a simple linear MMSE equaliser and also when using a high performance equaliser (ML detection where possible otherwise Sphere Detection with a sufficient number of full length candidates) Taking the results for the latter receiver architecture and comparing then the MIMO with the SISO case allows for identifying the performance losses due to antenna correlation (the throughput would roughly scale with the number of transmitreceive antennas in a completely uncorrelated scenario) Comparing the results of the linear and the MLSphere detector allows for identifying how much gains can be achieved by using advanced receiver architectures as compared to the simplest one As is evident a SNR in excess of 30 dB would be required to run the maximum modulationcoding schemes investigated for the SISO case in Figure F1 and Figure F2 Consequently the maximum spectral efficiency does not scale fully with the number of antennas which can be attributed to the limited amount of spatial diversity A spectral efficiency of around 4 bitsHz is achieved at SNR=25 dB for the 2x2 MIMO FDD case when using a high performance detector The gains at lower SNRs which are expected in multi-cell environments are substantially lower More specifically at a SNR of 4 dB the spectral efficiency is not increased with respect to the SISO case
For the 4x4 MIMO TDD case a spectral efficiency of 12 bitsHz is achieved at SNR=30 dB At a bandwidth of 100 MHz this would with an activity factor close to 1 allow achieving the target peak data rate of 1 Gpbs cited in Section 11 With half-duplex and 20 overhead the design target spectral efficiency of 4 bitsHz (cf Appendix A14) can also be achieved at about 30 dB
-5 0 5 10 15 20 25 300
200
400
600
800
1000
1200
SNR [dB]
Thro
ughp
ut [M
Bit
s]
16-QAMlinear16-QAMsphereBPSKlinearBPSKml256-QAMlinear4-QAMlinear4-QAMml64-QAMlinear64-QAMsphere
Figure F4 Throughput of CP-OFDM-based TDD mode system (100 MHz 4x4 MIMO A1 NLOS)
WINNER D210 v10
Page 116 (180)
F2 Forward error correction In this part the two main channel coding candidates Duo-Binary Turbo-Codes and Quasi-Cyclic Block-LDPCC are investigated their performance compared and finally first results on the complexityperformance trade-off are given In order to cover a wide range of applications 5 different block lengths have been selected 576 1152 1728 2304 and 4308 coded bits together with 3 different code rates Rc = 12 23 and 34 The assessment in this section follows the framework from [WIND23] For details on cycle count and energy consumption figures please refer to [WIND23] The performance comparison is done for BSPK transmission over the AWGN channel The (relative) assessment however is expected to be similar for a wide range of channels as was confirmed by the assessment done in [WIND23] for different types of Rayleigh fading channels
F21 Performance comparison The performance comparison (cf Figure F5) underlines the fact that the selection of an appropriate coding technique depends crucially on the target block length For code rate 05 DBTC outperform BLDPCC for block lengths up to 1728 (02 dB gain over BLDPCC for N = 576) Then LDPCC start progressively to outperform DBTC (01 dB better for N = 4308) In general the performance loss by going from large to small block sizes is lower for DBTC than for BLDPCC The threshold (in terms of block length) that separates these two regimes however depends on the code rate When increasing the code rate to Rc = 34 a block length of 1152 is sufficient for the BDLPCC to achieve the same performance as the DBTC and the difference observed for N = 576 is very small (cf Figure F7)
08 1 12 14 16 18 2 22 2410-3
10-2
10-1
100
EbN0 [dB]
BLE
R
DBTC vs QC-BLDPCC BPSK Rc=12 AWGN
BLDPC N=576BLDPC N=1152BLDPC N=1728BLDPC N=2304BLDPC N=4308DBTC N=576DBTC N=1152DBTC N=1728DBTC N=2304DBTC N=4308
DBTC Max-Log-MAPBLDPC LLR-BP 50 Iter
Figure F5 Performance comparison between DBTC and QC-BLDPCC Rc=12
F22 Complexity-performance trade-off Relying on the computational complexity assessment introduced in [WIND23] and [3GPP-WG142] together with the relative cost of operations given by Table 51 from [WIND23] the energy consumption and cycle counts were computed for both DBTC and BLDPCC For the sake of clarity we restricted the presentation of results to two extreme block length cases N = 2304 and N = 576 respectively In the case of DBTC only the Max-Log-MAP decoder with scaling of extrinsic information (factor 05 in the first
02dB 01dB01d
WINNER D210 v10
Page 117 (180)
075 in the 2nd to 7th and 1 in the last iteration) is used as it has been proven to give performance similar to Log-MAP decoding at attractive reduction in complexity Similarly the MinSum algorithm (MSA) provides the best trade-off for LDPC decoding as illustrated by the results in Appendix F24 Additionally alternative schedulings (shuffled decoding) should be used as they lead to faster convergence of the decoding algorithm and (same performance at roughly half the iterations cf results in Appendix F25)
In the sequel we tried to keep similar notations already introduced into [WIND23] Due to comparison between different packet lengths minor modifications have been proposed Packet length of N = 2304 bits are represented by purple coloured markers and those of N = 576 bits by blue coloured markers Concerning DBTC the triplet ldquo(mx iy lgMPz)rdquo indicates the memory size lsquoxrsquo of constituent encoders the number of maximum iterations lsquoyrsquo and maxLogMAP (lsquoz=0rsquo) or logMAP (lsquoz=1rsquo) decoding algorithm respectively In the present investigation only the maxLogMAP decoding algorithm will be considered for Duo-Binary Turbo-Code and its marker will be a diamond Due to simple operations only the edge colour will be green (energy cost=cycle count) The marker face colour represents the considered packet length In the case of block LDPC codes we have to differentiate also the number of iterations A circle marker denotes the maximum complexity (maximum number of iterations 20 in the considered setup) A triangle marker is used for the average complexity (average number of iterations) Energy and Cycles are distinguished then by the use of non-filled or filled marker respectively
15 16 17 18 19 2 21 220
200
400
600
800
1000
1200
1400
1600
1800
BLDPCC (MSAmax=20)N=576
EbN0 [dB] Required for BLER 1
Rela
tive
Cycl
eE
nerg
y
BLDPCC (MSAmax=20)N=2304
BLDPCC (MSAmax=20)N=2304
BLDPCC (MSAavg)N=2304
BLDPCC (MSAavg)N=2304
DBTC (m3i8lgMP0)N=2304
DBTC (m3i8lgMP0)N=576
DBTC Vs BLDPCC N=576 N=2304 Rc=05 AWGN
BLDPCC (MSAavg)N=576
BLDPCC (MSAmax=20)N=576
BLDPCC (MSAavg)N=576
Figure F6 Complexity-performance trade-off for QC-LDPCC and DBTC Rc=12
For the case of Rc=12 depicted in Figure F6 above Duo-Binary Turbo-Codes offer a better complexity-performance trade-off than block LDPC codes with low block size (N = 576) as they perform better at only slightly more energy consumption (wrt the maximum iteration case for BLDPCC) However for a higher block length (N = 2304) BLDPCC become more suitable since their energy consumption saving is achieved at the expense of only minor performance degradation These two trends are reinforced throughout the remaining results cf Figure F7 below Indeed the higher the coding rate the less energycycles are required by BLDPCC (provided that the high code rate is achieved by using a code of a different rate rather than puncturing the rate 12 code) It might be worth mentioning that DBTC still outperform BLDPCC for lower block length but their higher energy consumption in the present case of 8 internal decoder iterations seems to be the price to be paid for such performance
WINNER D210 v10
Page 118 (180)
26 27 28 29 3 31 32 33 34 350
200
400
600
800
1000
1200
1400
1600
1800
EbN0 [dB] Required for BLER 1
Rela
tive
Cycl
eE
nerg
y
DBTC Vs BLDPCC N=576 N=2304 Rc=075 AWGN
DBTC (m3i8lgMP0)N=2304
DBTC (m3i8lgMP0)N=576
BLDPCC (MSAmax=20)N=2304
BLDPCC (MSAmax=20)N=2304
BLDPCC (MSAmax=20)N=576
BLDPCC (MSAmax=20)N=576
BLDPCC (MSAavg)N=2304
BLDPCC (MSAavg) N=2304
BLDPCC (MSAavg) N=576
BLDPCC (MSAavg) N=576
Figure F7 Complexity-performance trade-off for QC-LDPCC and DBTC Rc=34
This complexityperformance trade-off is a necessary step towards fair comparison of these two main channel coding candidates DBTC and BLDPCC Although these results are quite informative they are not yet sufficient for any further technological decision Indeed the number of gates and the memory size requirements together with performance robustness to quantisation (fixed point simulations) still have to be investigated still Based on current assessment and know-how these two channel coding techniques look more like complementary than concurrent solutions (wrt block length) The next phase of WINNER (Phase II) should give additional answers and lead to in-depth understanding and comparison of both technologies by focusing more and more onto architecture and implementation aspect
F23 Performance comparison of rate compatible punctured codes The performance of rate compatible punctured standard PCCCs and LDPCCs can be considered to be equal LDPCC show better performance at high SNR which however is less relevant for HARQ as negligible number of retransmissions are needed in this SNR regime Figure F8 shows exemplary the performance of constructed BLDPCC punctured BLDPCC and DBTC for two block lengths (the mother code rate of the punctured codes was Rc = 12) Note that the average number of iterations of punctured LDPCC is about twice as large as that of the constructed LDPCC
F24 BLDPCC performance comparison of major decoding algorithms In recent years a lot of different LDPC decoding algorithms have been proposed in literature Our target in this part is thus to compare the most important ones ndash Belief Propagation [Gal63] A-Min [JVS+03] Lambda-Min [GBD03] Min-Sum and its corrected version [CF02] To do so we have assessed their performance for different block lengths and code rates As a summary of the performance-complexity trade-off Figure F9 depicts the decoding complexity over the bit SNR required to achieve BLER 1 for the example code rate 05 and two different code block lengths (again purple for N=2304 and blue for N=576) The advantage of the MinSum can be emphasised quite clearly as it leads to good performance at low cost expense
WINNER D210 v10
Page 119 (180)
0 05 1 15 2 25 3 3510-3
10-2
10-1
100Puncturing Block LDPC SEUK exact BP decoder max 50 iterations
EbN
0
BLE
R
punctured BLDPC R=066 N=1728 constructed BLDPC R=066 N=1728DBTC R=066 N=1728punctured BLDPC R=075 N=2304constructed BLDPC N=2304DBTC R=075 N=2304
Figure F8 Rate-compatible puncturing of block LDPC
14 16 18 2 22 24 260
1000
2000
3000
4000
5000
6000
7000
8000
9000
10000
BPA
BPA
EbN0 [dB] required for BLER 1
Rel
ativ
e C
ycle
Ene
rgy
DBTC vs BLDPCC N=576 N=2304 Rc=05 AWGN
BPA
BPA
MSAMSA
AMA
AMA
AMA
AMA
LMA 2
LMA 2
LMA 2
LMA 2
LMA 3
LMA 3
LMA 3
LMA 3
Figure F9 Complexity-performance trade-off for different LDPC decoding algorithms Rc=12
F25 Performance when using different decoding schedules Figure F10 illustrates that the same performance can be achieved by using either a maximum of 50 iterations and flooding decoding or a maximum of 20 iterations and shuffled decoding (cf Appendix B24)
WINNER D210 v10
Page 120 (180)
0 05 1 15 2 25 3 35 410-3
10-2
10-1
100Horizontal shuffling vs flooding schedule Block LDPC Z=12 N=576
EbN0 [dB]
BLE
R
flooding R=05shuffling R=05flooding R=066shuffling R=066flooding R=075shuffling R=075
05 1 15 2 25 3 3510-3
10-2
10-1
100Horizontal shuffling vs flooding schedule Block LDPC Z=48 N=2304
EbN0 [dB]
BLE
R
flooding R=05shuffling R=05flooding R=066shuffling R=066flooding R=075shuffling R=075
Figure F10 Scheduling of BPA decoder for block LDPC of lengths N=576 N=2304 Horizontal (group 48) shuffling with max 20 iterations vs flooding schedule with max 50
iterations
F26 Base model matrices for BLDPC codes The BLDPCC investigated in this document are relying on the following base model matrices in conjunction with the appropriate expansion process They constitute the current state-of-the-art when it comes to (LDPC) code construction in the WINNER project and will be the starting point of investigations in WINNER Phase II The three base model matrices in Figure F11 - Figure F13 correspond to the three code rates Rc=12 Rc=23 and Rc=34 respectively
Figure F11 (24 48) Base model matrix Rc=12
WINNER D210 v10
Page 121 (180)
Figure F12 (16 48) Base model matrix Rc=23
Figure F13 (12 48) Base model matrix Rc=34
WINNER D210 v10
Page 122 (180)
F3 Channel estimation
F31 Uplink single carrier As mentioned in Appendix B42 time domain or two types of frequency domain pilots are options for channel estimation for uplink single carrier In comparative simulations the C2 urban macro channel was used with parameters from Table 21 for frequency domain generation of a single carrier signal A classical Doppler spectrum was assumed to generate channel realisations with UT speed of 50 kmh The coding used was a rate 12 convolutional code with memory 6 Random bit interleaving was also included In the receiver a linear MMSE symbol based equaliser and an iterative soft decision feedback equaliser [TB04] were tested The soft Viterbi algorithm was used in the decoder The time domain multiplexed pilot signal was a 64-symbol Chu sequence which has a uniform envelope and power spectrum The FET frequency domain pilots were formed from the FFT of a 52-point Chu sequence the FFT components were mapped to the pilot grid every 8th frequency of every 5th block This grid was found to be more effective for the SC system than the FDD grid of Figure B6 used for the OFDM-PACE system and had approximately the same overhead For FDSP since no extra subcarriers are used for pilots a more liberal grid was used with pilot subcarrier spacing of 8 and pilot block spacing of 2 For blocks with pilots least square (LS) estimator was used for lsquorawrsquo channel estimation followed by an FFT interpolator in frequency domain Linear LS line fitting was used for channel estimates for blocks without pilots25 This approach is suboptimal but relatively simple Simulation results were obtained by averaging the block error rate (BLER) over 10000 frames There were 12 blocks (and thus 12 correlated channel realisations) per half-frame (slot)
The iterative soft decision feedback equaliser (SDFE) is a simplified version of a frequency domain turbo equaliser [TB04] Its iterative process does not include decoding or channel estimation One or two iterations are generally sufficient to yield a significant performance improvement over linear equalisation on severely dispersive channels It is more effective than a conventional hard decision DFE and avoids its error propagation problem at the expense of slightly higher complexity SDFE brings the performance of the FDSP technique closer to that of the linearly-equalised FET and TDM techniques at the expense of some extra receiver complexity
Other considerations also influence the choice of a channel estimation pilot scheme for serial modulation The prime advantage of serial modulation over OFDM is its lower PAPR and hence lower transmit power backoff requirement The PAPR is not affected by the addition of a Chu sequence time domain pilot signal but the addition of frequency domain pilots amounts to the transmission of several parallel waveforms and thus increases the PAPR somewhat Furthermore it can be shown that the PAPR is also increased in the FET approach due to the rearrangement and expansion of the signal spectrum to accommodate the added pilots Measurements of the power backoff required to confine the transmitted spectrum to a given spectral mask indicate that the backoff is still less than that of a comparable OFDM signal but the margin is slightly reduced for FDSP and more so for FET Another consideration is overhead the FET and TDM techniques both incur higher overhead than the FDSP technique
Figure F14 shows block error rate performance curves for TDM FET and FDSP pilot techniques as well as for the case of no pilots and perfect channel state information Figure F14 (a) shows the results for linear equalisation and Figure F14 (b) shows results for the soft iterative DFE with two iterations The 1rsquos and zeroes in the legend indicate which blocks have pilots and P indicates the number of pilots per block eg [100000000001] indicates pilots in every 11th block and P=104 indicates 104 pilots in a set of 416 used subcarriers ndash equivalent to the pilot grid scheme of Figure B6
25 For MS speed lt=70 kmh we assume the channel varies linearly within one frame
WINNER D210 v10
Page 123 (180)
0 2 4 6 8 10 12 1410-3
10-2
10-1
100
SNR [dB]
BLE
R
SC Rc = 12 K=7 Scenario C2 v=50kmh LE
TDM[100000000001] P=64TDM[101010101001] P=64FET[100000000001] P=52FET[100000000001] P=104FET[100001000010] P=52FET[101010101001] P=52FDSP[100000000001] P=52FDSP[101010101001] P=52Known CSI with LE
0 2 4 6 8 10 12 1410-3
10-2
10-1
100
SNR[dB]
BLE
R
SC Rc=12 K=7 Scenario C2 v=50kmh soft DFE
TDM[100000000001] P=64TDM[101010101001] P=64FET[100000000001] P=52FET[100000000001] P=104FET[100001000010] P=52FET[101010101001] P=52FDSP[100000000001] P=52FDSP[101010101001] P=52Known CSI with LEKnown CSI with Soft DFE
(a) (b)
Figure F14 Block error rates for linear (a) and soft DFE equalisers (b)
Table F2 summarises the SNR degradations relative to known channel for OFDM from Figure F15 and also the total overhead The total overhead includes pilots cyclic prefix and unused subcarriers in the FFT blocks The extra backoff is with respect to the power backoff required for the OFDM system The power backoff in each case was determined so to accommodate the transmitted spectrum emerging from a power amplifier modelled by a Rapp model [Rap91] with parameter p=2 The table also includes the OFDM-PACE and the iterative channel estimation OFDM-ICE scheme Iterative channel estimation schemes could also be applied for single carrier but were not evaluated here
WINNER D210 v10
Page 124 (180)
Table F2 Comparison of performance pilot overhead and required power backoff for three different pilot schemes for linear equalisation and soft decision feedback equalisation and for
OFDM Channel is C2 with wide area FDD signal parameters
Pilot schemes SNR degradation
BLER=10-2 relative to SNR=86 dB for OFDM with perfect CSI (dB)
Total overhead26 ()
Power backoff to satisfy spectral mask relative to OFDM (dB)
Power penalty relative to OFDM with perfect CSI (dB) and no pilots
(col 2+col 4)
LE27 SDFE28 LE SDFE
SC-TDM29 37 27 285 -30 07 -03
SC-FET30 36 24 296 -11 25 13
SC-FDSP31 39 29 278 -15 24 14
OFDM - PACE32 17 294 0 17
OFDM - ICE(8)33 0 294 0 0
The calculated overheads which are a direct measure of modulation inefficiency for the various schemes are similar Most of the overhead is contributed by cyclic prefix and unused subcarriers rather than by pilots The tablersquos last column shows the power penalty due to the combination of SNR degradation and required transmitter power backoff for a given power amplifier We see that single carrier with time division pilots give the least power penalty The single carrier frequency domain pilots and OFDM schemes are about 1 to 2 dB worse (due to their increased backoff requirements) The single carrier frequency domain pilot schemes have roughly the same power penalties as those of OFDM-PACE when the receiver uses the soft iterative DFE and would likely have similar penalties as OFDM-ICE if iterative channel estimation were added The major power backoff advantage of single carrier is best realised when time domain pilots are used for channel estimation
F32 Pilot-aided and iterative channel estimation for OFDM In this section pilot-aided (PACE) and iterative channel estimation (ICE) is evaluated for non-adaptive OFDM transmission in both FDD and TDD mode [WIND21 WIND23] The pilot-aided technique relies
26 Total overhead =
(1 )CP pilot GI CP GIp p
FFT CP pilot t FFT CP
N N N N NN N N N N
α α+ + +
sdot + minus+ + +
Where NCP cyclic prefix length=64 Npilot number of pilot symbols per block=52 64 or 104 NGI number of unused subcarriers in each FFT block=96 NFFT FFT block length=512 Npilott number of time domain pilot symbols (if any)=0 or 128 αp fraction of blocks with overhead-causing pilots=111
27 Linear frequency domain equaliser 28 Soft iterative decision feedback equaliser with 2 iterations 29 Single carrier with 64-symbol time domain-multiplexed pilot sequences Pilot sequence inserted every 11th block 30 Single carrier with frequency domain pilots inserted every 8th frequency in every 5th block 31 Single carrier with frequency domain pilots replacing data at every 8th frequency in every second block 32 OFDM with frequency domain pilots inserted every 4th frequency in every 11th block Results from Figure F15 33 Iterative channel estimation using 2 turbo iterations
WINNER D210 v10
Page 125 (180)
on common pilots proposed in Appendix B42 scattered over the whole available bandwidth or solely from dedicated pilots of one chunk
The pilot grid used for simulations is in line with the general pilot grid pattern suggested in Appendix B42 For Wiener filtering a robust filter design is selected for each mode according to the specifications of the ldquomismatched Wiener interpolation filter (WIF) in Appendix F33 While the actual velocity for the typical urban macro channel model C2 is set to 50 kmh a UT velocity of 100 kmh was assumed to generate the filter coefficients in time direction For the correlation in frequency direction a mismatched filter assuming a maximum delay of the channel τmax equal to the CP duration is used
For the case of QPSK modulation we consider channel estimation with common pilots using the full bandwidth and with dedicated pilots for chunk-based channel estimation The allocation of chunks to users is performed in a round-robin manner In the numerical simulations the channel encoder is a memory 6 CC with generator polynomials (133171) in octal form At the base station each data stream corresponding to a given user is iteratively decoded Figure F15 shows the BLER performance achieved with PACE or ICE respectively in the TDD and the FDD mode when channel estimation is carried out at the chunk level or using the full available bandwidth The results are summarised in Table F3 For ICE with common pilots no performance loss relative to perfect channel knowledge is observed For chunk based channel estimation with dedicated pilots ICE turns out to be particularly effective Generally the performance loss relative to perfect channel knowledge is greater in the FDD mode In this transmission scenario the user mobility and a higher frequency selectivity of the channel render channel estimation more difficult than for the TDD case
Table F3 SNR degradation of several channel estimation techniques with respect to the case of perfect channel knowledge at the receiver
Transmission mode SNR Degradation BLER = 10-2
Channel model
mobility Chunk-based -
PACE Chunk-based -
ICE Full BW -
PACE Full BW ndash
ICE
TDD B3 no mobility 28 dB 09 dB 12 dB 0 dB
FDD C2 100 kmh 34 dB 11 dB 17 dB 0 dB
0 2 4 6 8 10 12 1410-3
10-2
10-1
100
SNR [dB]
BLE
R
Perfect CSIChunk-based - PACEChunk-based - ICE 3 iterFull BW - PACEFull BW - ICE 2 iter
0 2 4 6 8 10 12 1410-3
10-2
10-1
100
SNR [dB]
BLE
R
Perfect CSIChunk-based - PACEChunk-based - ICE 3 iterFull BW - PACEFull BW - ICE 2 iter
Figure F15 BLER performance for PACE or ICE at the chunk level or using the full data
bandwidth with QPSK modulation Left SISO TDD mode channel B3 NLOS no mobility right SISO FDD mode channel C2 NLOS UT velocity 50 kmh
Figure F16 depicts the BLER performance achieved with PACE or ICE with higher-order modulation alphabets (16-64-QAM) Apart the parameters for common pilots using the full bandwidth from the previous figures apply For both 16 and 64-QAM ICE approaches the performance of a receiver with perfect channel knowledge For 16-QAM the SNR loss with PACE at BLER = 10-2 varies from 13 dB to 17 dB respectively for the TDD and the FDD mode With 64-QAM the performance degradation caused by channel estimation errors induced by PACE ranges from 12 dB in the TDD mode to 22 dB in the FD mode The SNR degradation for PACE remains almost constant over the range of BLER considered for the evaluation of the channel estimation performance
WINNER D210 v10
Page 126 (180)
0 5 10 15 2010-3
10-2
10-1
100
SNR [dB]
BLE
R
SR - Perfect CSISR - PACESR - ICE 2 iterWA - Perfect CSIWA - PACEWA - ICE 2 iter
5 10 15 20 25 3010-3
10-2
10-1
100
SNR [dB]
BLE
R
SO - Perfect CSISO - PACESO - ICE 2 iterWA - Perfect CSIWA - PACEWA - ICE 2 iter
Figure F16 BLER performance of PACE and ICE after 2 turbo iterations with 16-QAM modulation (left) and 64-QAM modulation (right) for the short-range (SR) TDD mode and the
wide-area (WA) FDD mode
F33 Design of the channel estimation unit For pilot aided channel estimation (PACE) two cascaded FIR interpolation filters are used one operating in frequency direction for interpolation over subcarriers of one OFDM symbol and the other operating in time for interpolation over OFDM symbols of a certain subcarrier as described in [WIND21] section 621 The performance of the interpolation filter depends on the amount of knowledge of the channel statistics these are
bull A Wiener interpolation filter (WIF) which is perfectly matched to the channel statistics The power delay profile (PDP) and the Doppler power spectrum (DPS) are assumed to be perfectly known
bull A WIF with ldquomatched pass-bandrdquo Knowledge about the maximum delay of the channel
maxτ and the maximum Doppler frequency maxDf are assumed However within [0 maxτ ] and [ maxDfminus maxDf ] the PDP and DPS are assumed to be unknown and uniformly distributed For the results the WINNER B3 and C2 channel models were used for the TDD and FDD mode respectively
bull A mismatched WIF where the maximum channel delay is assumed to be equal to the CP duration and the maximum Doppler frequency is set to the maximum value of expected mobile velocities For the TDD mode pedestrian velocities of 10 kmh while for the FDD mode velocities up to 100 kmh are assumed corresponding to a normalised Doppler frequency of
4max 10 minus=Df and maxDf =0013 respectively
In all cases perfect knowledge of the SINR at the receiver was assumed as it is expected that this information is needed also by other parts of the WINNER system
WINNER D210 v10
Page 127 (180)
0 10 20 30 40-5
0
5
10
15
20
SNR [dB]
Est
imat
or g
ain
G [d
B]
mismatched WIF γw=40 dB
mismatched WIFmatched pass-band WIFperfectly matched WIFMMSE Mf=16 Mt=5
ICEno feedback errors (16x5)
common pilots (16x1)PACE
PACEdedicated pilots (2x1)
Figure F17 Estimator gain vs SNR for dedicated and common pilots of various channel estimation techniques Also shown is the estimator gain in case all symbols per chunk can be used as pilots
which can be viewed as a lower bound for ICE if decision feedback errors are negligible
For certain MIMO techniques utilizing short term channel knowledge at the transmitter the degradation due to channel estimation errors is very severe (see Appendix B42) There estimator gains in the range of 13 to 17 dB are required The estimator gain is a measure for the quality of the channel estimate and is defined as 1(MSESNR) Figure F17 shows the estimator gains for dedicated and common pilots of the three considered channel estimation techniques PACE with dedicated pilots cannot achieve the required gains even for a perfectly matched filter If all symbols within a chunk can be utilised as pilots estimator gains exceeding 13 dB are possible This may be achieved by ICE in case decision feedback errors are negligible a realistic assumptions in the high SNR regime
0 10 20 30 40-15
-10
-5
0
5
10
SNR [dB]
Est
imat
or g
ain
G [d
B]
PACE dedicated pilots (2x1)
Sb = 0dB
Sb = 3dB
Sb = 6dB
Sb = 10dB
mismatched WIF
matched passband WIF
Figure F18 Estimator gain vs SNR for dedicated pilots for various pilot boosts
Unfortunately even with excessive pilot boosts the estimator gains for dedicated pilots are not sufficient as shown in Figure F18 So some post processing of the PACE channel estimates appears necessary
F34 Unbiased channel interpolation Unbiased interpolation is used in the bootstrap phase of the communication It is based on the relation between the delay and frequency-domain channel coefficients in OFDM systems (see [JFH+05]) Solutions are needed for full-spectrum (down-link) and at chunk level for up-link and dedicated pilots Here we report on the full-spectrum approach while chunk-level concepts are still under development
It is assumed that all subcarriers can be used for pilot or data transmission and that a sparse regular pilot grid is used Figure F19 (left) shows the reconstructed frequency response using a pilot spacing of 16 subcarriers in the short-range scenario (SNR = 20 dB) If the channel delays approach the CP length this is
WINNER D210 v10
Page 128 (180)
the theoretical maximum pilot spacing according to the sampling theorem Figure F19 (right) shows the estimator gain achieved with linear unbiased interpolation It depends on both SNR and delay spread (measured in taps 1 tap = 10 ns) The lower the SNR and the smaller the delay spread are the less taps are detected and hence the more noisy taps can be removed
Figure F19 Left Results for unbiased interpolation over the full spectrum (blue true channel red channel with noise open dots estimates on sparse pilot grid green interpolated frequency
response) Right Estimator gain with noise reduction in time domain
F35 Channel estimation using the guard interval mdash pseudo-random-postfix OFDM PRP-OFDM simulations were performed for the FDD parameter set presented in Table 21 Channel propagation conditions are used as defined in scenario C2 NLOS PRP-OFDM requires a significant number of OFDM symbols per frame in order to provide high SNR CIR estimates Since the parameter set defines a relatively short frame of 12 OFDM symbols only the simulation results focus on QPSK constellations PRP-OFDM will be shown to enable the system to work efficiently in a high mobility context (up to 144 kmh is considered here) if QPSK constellations are applied Due to the short frame length a significant error floor can be observed for 16-QAM transmission (which requires good channel estimates) which is improved (but not completely removed) by iterative interference suppressions (IIS) Any scenario with a frame-length smaller than 12 OFDM symbols is not considered for the use with PRP-OFDM (due to the insufficient CIR estimation MSE)
Simulations are performed taking 11 OFDM symbols into account for CIR estimation The frame to be decoded is assumed to be preceded by (dummy) PRP-OFDM symbols that are not decoded but whose postfix sequences are exploited for CIR estimation The results of PRP-OFDM are compared to a standard CP-OFDM system where the CIR estimation is assumed to be performed on 2 OFDM learning symbols at the beginning of the frame just after synchronisation No channel tracking is performed in this case The simulation results in Figure F20 show that a considerable error floor is present for standard CP-OFDM system for the mobility scenarios For PRP-OFDM this error floor disappears in the BLER range of interest and only an offset in SNR remains (approx 2 dB offset comparing 0 kmh vs 144 kmh) As a conclusion it can be stated that in combination with the chosen system and simulation parameters PRP-OFDM is useful in high mobility scenarios applying lower order constellations (QPSK in this example) Higher order constellations (QAM16 and higher) require larger observation window sizes for the CIR estimation and thus longer frames In the QPSK context PRP-OFDM leads to very acceptable system performance results at UT velocities as high as 144 kmh and beyond the performance loss at 144 kmh is limited to approximately 2 dB compared to the static case
WINNER D210 v10
Page 129 (180)
Figure F20 PRP-OFDM 11 Symbols CIR Estimation QPSK BLER simulation results
The simulation results show that PRP-OFDM can be used in the downlink to reduce the overhead required for channel estimation by using the guard interval for this purpose However the drawbacks namely the introduced delay (especially for higher order modulation) and the inability to extend this scheme to the uplink case are currently considered to outweigh the benefits Therefore CP-OFDM relying on a scattered pilot grid is currently the preferred solution
F4 Synchronisation
F41 Synchronisation without utilizing an explicit training symbol In [BSB97] a blind algorithm for symbol timing and frequency offset estimation was proposed which utilises the guard interval having the great advantage that it does not require any overhead in form of training data The basic idea is that the cyclic prefix is identical to the original part of the GMC block from which it is copied Correlation of the cyclic prefix with its original part results in a correlation peak The magnitude of the correlator output peaks at the beginning of an OFDM symbol while its phase at this time instant is proportional to the carrier frequency offset ∆f The algorithm detailed in [BSB97] is the maximum likelihood (ML) estimate in an AWGN channel For the ML estimate knowledge of the SNR is necessary which is impractical for acquisition when usually no information about the received signal is available The ML metric consists of the correlation metric ρ of the cyclic prefix with its original part as well as a metric which accounts for the signal power φ
Three different variants of the CP based synchronisation are compared
bull The ML estimator proposed in [BSB97]
bull An estimator which only uses the correlation metric ρ labelled ldquoCORrdquo Utilizing only ρ approaches the ML estimate at low SNR [LC02]
bull An estimator which uses the difference φρ minus approaches the ML estimate at high SNR [LC02] This approach is named ldquonorm CORrdquo since it is normalised by the power of the received signal
WINNER D210 v10
Page 130 (180)
Unfortunately the performance of this approach degrades in a frequency selective channel since the time dispersive channel impulse response reduces the ISI free part of the guard interval Computer simulations have been carried out for the WINNER FDD mode with channel model C2 and system parameters taken from Table 21 For the TDD mode the performance is expected to be better since CP correlation typically performs better if the number of subcarriers is large
Since the time and frequency offset will be constant during some OFDM symbols averaging over several estimates considerably improves the performance [BBB+99] This simple averaging of the correlation metric is a highly effective means to increase the robustness as well as accuracy of the CP based acquisition In the simulations averaging was performed over 12 OFDM symbols ie one OFDM frame
For channel model C2 the mean estimated timing offset is splTTE 6 asymp∆ which implies that the timing estimator is biased Unfortunately a positive mean will cause ISI and should therefore be avoided The bias may be compensated by a fine timing synchronisation unit operating in the frequency domain
The standard deviation of the time and frequency offsets is shown in Figure F21 Averaging the correlation metric of the CP based algorithm significantly improves the accuracy of the time and frequency estimates as shown in Figure F21 For cross-correlation based synchronisation averaging is only possible over the two OFDM symbols which carry pilot symbols Thus this technique cannot benefit from averaging to the same extend as CP based synchronisation While the combination of the CP based and the cross-correlation approach are possible [LWB+02] the cross-correlation approach cannot substantially improve the synchronisation accuracy Hence cross-correlation based synchronisation is applicable mainly in case that BSs are not synchronised
-5 0 5 10100
101
102
SNR [dB]
std(
∆ T
T spl)
MLCORNorm CORCC
withoutaveraging
withaveraging
-5 0 5 10
10-3
10-2
10-1
SNR [dB]
std(
∆ f c T
)
MLCORNorm COR
withaveraging
withoutaveraging
Figure F21 Standard deviation of the estimated time and frequency offset against the SNR (a) standard deviation of the time offset (left side CC = cross-correlator) and (b) standard deviation of
the frequency offset (right side)
WINNER D210 v10
Page 131 (180)
-5 0 5 1010-3
10-2
10-1
100
SNR [dB]
PFD
MLCORNorm COR
withaveraging
withoutaveraging
-5 0 5 1010-3
10-2
10-1
100
SNR [dB]
PFD
CC ∆ fc T = 0
CC ∆ fc T = 05
CC ∆ fc T = 10
Figure F22 Probability of false detection PFD against the SNR for (a) the CP correlator (left side) and (b) the cross-correlator (CC) using the scattered pilot grid of Figure B6 (right side)
Of particular interest is the performance of the algorithm at low SNR We define a false detection if the timing estimate is outside the window [-NCP2 NCP2] In Figure F22 the probability of false detection PFD of the CP correlator is plotted against the SNR (left side) It is seen that PFD is significantly reduced by averaging over 12 OFDM symbols The probability of false detection can be further reduced by averaging over more OFDM symbols For the simple COR synchronisation scheme the improvement through averaging is most significant
On the right hand side of Figure F22 PFD is shown for the cross-correlation (CC) based synchronisation scheme using the scattered pilot grid of the WINNER FDD mode It is seen that the detection probability of the OFDM symbol timing severely degrades if a carrier frequency offset is present For synchronisation in a wireless network time synchronisation for non-synchronised BSs is possible if adjacent BS use different pilot sequences However since the cross-correlator is sensitive to frequency offsets BSs should be either time or frequency synchronised Comparing the CP-based auto-correlation with the cross-correlation technique the CP correlation with averaging appears favourable Only for not time synchronised BSs the CC technique is a valid option It should be noted however that this statement depends on the chosen pilot grid For a smaller pilot spacing the performance of the CC technique is expected to improve
To conclude synchronisation by correlating the cyclic prefix (CP) with its original part is robust even at very low SNR provided that the correlation metric is sufficiently averaged Averaging over 12 OFDM symbols mitigates false detection for SNRge0 dB Since COR is the technique with the least complexity it can be concluded that averaging combined with COR is an appropriate choice due to its simplicity low overhead high accuracy and reliability Cross-correlation synchronisation utilizing a scattered pilot grid predominantly used for channel estimation can be used for synchronisation of a network where BSs are not time synchronised However BSs need to be frequency synchronised for this algorithm to work
WINNER D210 v10
Page 132 (180)
F5 Performance of selected bit and power loading algorithms In [WIND24] a set of various aspects of the adaptive link-level transmission using Hughes-Hartogs optimum bit-loading algorithm was assessed However as mentioned in Appendix B51 the HH approach is not ideal from the complexity point of view Therefore the following simulation results present a performance comparison between the HH algorithm and two others suboptimum less complex implementations by Chow Cioffi and Bingham and by Fischer and Huber
The presented bit error rate results have been obtained using a Monte-Carlo method by transmitting 100 million information bits per one particular SNR value This gives a sufficient precision to estimate bit error rates in the order of 10-5
A limited power constraint equal to the value of 1 [W] times the number of used subcarriers Nu = 1664 has been assumed in all evaluations Moreover a constant number of information bits have been loaded in each OFDM symbol ie
)(log2 MRNB ui sdotsdot= (F1)
where Nu means number of used subcarriers R represents the code rate and M is the constellation size In order to compare the performance of the evaluated loading algorithms the actual power loaded on each subcarrier has been normalised so the following criterion is fulfilled
summinus
=
=1
0arg
uN
ietti PP
where Pi is the power loaded on the ith subcarrier after normalisation and Ptarget is the total power limit
Figure F23 presents the simulation results for indoor scenario A1 NLOS channel model for a velocity v = 5 kmh The suboptimum less complex CCB and FH bit and power loading algorithms are compared to the Hughes-Hartogs approach All three algorithms have used the target BER setting equal to 10-4 The mean number of information bits transmitted in each OFDM symbol has been set to 2 Nu = 3328 The maximum number of iterations of the CCB algorithm has been limited to 10 (see Appendix B512) For comparison purposes an extra curve for non-adaptive transmission with fixed code rate and constellation size is depicted The overall bit rate of this fixed transmission is the same as in the adaptive cases
0 5 10 15 2010-3
10-2
10-1
100
SNR[dB]
BLE
R
WINNER A1 NLOS Channel Model SISO v = 5 kmh
Fixed R=34 QPSK AWGNAdaptive CCB BERtar=10-4
Adaptive FH BERtar=10-4
Adaptive HH BERtar=10-4
Figure F23 Performance comparison of the HH CCB and FH bit and power loading algorithms (short-range scenario A1 NLOS channel model SISO case v = 5 kmh)
WINNER D210 v10
Page 133 (180)
Similar simulation results are shown in Figure F24 Here slight different parameters have been chosen for comparison The channel model is B3 NLOS (short-range hotspot scenario) however the velocity has been set to the same value v = 5 kmh The mean number of information bits transmitted in one OFDM symbol is equal to 15 Nu = 2496 which is adequate for a transmission of a whole OFDM symbol using the code rate R = frac34 and QPSK constellation on each used subcarrier
0 5 10 15 2010-3
10-2
10-1
100
SNR[dB]
BLE
RWINNER B3 NLOS Channel Model SISO v = 5 kmh
Fixed R=12 16-QAM AWGNAdaptive CCB BERtar=10-4
Adaptive FH BERtar=10-4
Adaptive HH BERtar=10-4
Figure F24 Performance comparison of the HH CCB and FH bit and power loading algorithms (short-range scenario B3 LOS channel model SISO case v = 5 kmh)
Having looked at the results presented above one can conclude that the Fischer and Huber approach has only slightly worse performance than the Chow Cioffi and Bingham solution in a coded transmission over wireless channel models As expected Hughes-Hartogs bit and power loading algorithm performs best but it has the highest computational complexity In general the observed performance degradation of the suboptimum algorithms is so small that it can be neglected in this case
WINNER D210 v10
Page 134 (180)
Appendix G Multi-Link and System-Level Assessments Multi-link and system level simulations have been set up in order to study those techniques which directly or indirectly influence the level of interference at the receivers Basically these are multiple access radio resource management spatial processing at transmitter synchronisation of multiple transmitters (in case of a synchronised network) and power allocationcontrol Another class of techniques which has to be studied by means of system or multi-link simulations is related to receiver processing and the ability to cope with or to combat interference This class typically comprises the large set of single user and multi-user detection algorithm with or without the aid of multiple antennas and iterative processing Even synchronisation belongs to this class of receiver techniques provided there is a potential crosstalk from other simultaneously transmitting stations
This discussion reveals the huge amount of different topics which can and have to be assessed by means of multi-link or system level simulations Within WINNER Phase I emphasis has been placed on the evaluation of different multiple access schemes for up- and downlink partly in combination with various spatial processing options It is a continuation of the work being done in [WIND26] and [WIND27] focusing now on the most promising candidates and using more elaborated simulation environments For non-frequency-adaptively scheduled flows in the downlink the multiple access candidates are chunk based OFDMATDMA and MC-CDMATDMA and a comparison can be found in Appendix G11 The subcarrier interleaved variants of these two multiple access schemes are considered in Appendix G12 Regarding frequency-adaptively scheduled flows chunk based OFDMATDMA was identified as the most promising approach due the highest flexibility in allocating resources to users The additional SDMA gain using grid of fixed beams in a wide-area scenario is addressed in Appendix G14 In the same context spatial processing gains using more sophisticated adaptive beamforming approaches are analysed in Appendix G21 and Appendix G22 For non-adaptively scheduled flows a comparison of beamforming diversity and multiplexing is performed in Appendix G24 Moreover as in Appendix G23 the impact of multiple antennas at the UT and associated combining techniques on system performance is studied The absolute performance of linear multi-user SMMSE precoding is assessed in Appendix G25 for the short-range scenario considering again non-frequency-adaptively scheduled flows Taking realistic system impairments into account the required number of antennas to achieve an average sector throughput of 1 Gbits is identified
The preferred medium access candidates considered for the uplink are pretty much the same as for the downlink including additionally symbol based TDMA Compared to OFDMATDMA pure TDMA is beneficial from terminal power consumption point of view and it is less susceptible to frequency offsets among terminals However the impact of synchronisation errors is not yet included when comparing OFDMATDMA and OFDMTDMA in Appendix G44 The absolute performance of OFDMTDMA and ODFMATDMA with adaptive scheduling is assessed in Appendix G41 and Appendix G43 respectively Considering a short-range scenario in Appendix G43 the optimum resource allocation and bit loading scheme for OFDMATDMA with respect to sum capacity is compared to low complexity solutions
The impact of spatial diversity at the BS for various antenna configurations is analysed in Appendix G51 An information theoretic approach with respect to optimum spatial processing at the UT using two transmit antennas can be found Appendix G52
Other main results are related to multi-user detectionseparation at the receiver This holds not only for base stations but also for user terminals if MC-CDMA is applied Corresponding results considering different receiver structures without and with multiple antennas at the UT can be found in Appendix G31 and Appendix G32 respectively From the base station perspective receiver structures for SISO DS-CDMA and MIMO single carrier are presented and compared in Appendix G61 and Appendix G62
Other investigations which are not directly related to updownlink multiple access spatial processing or detection are part of Appendix G7 In Appendix G71 a comparison of OFDM and single carrier (with cyclic prefix) based uplinks is performed taking the increased power backoff constraint of OFDM into account Appendix G72 deals with low rate channel coding as a means to enable service to users at cell edge even in case of frequency reuse 1 Appendix G73 focuses on the crosstalk which is induced in an OFDM receiver if signals from different base station suffer from transmission delay differences larger than the guard interval Two resource partitioning schemes among base stations are compared with this respect TDMA and FDMA In Appendix G74 conventional and self-organised RRM is compared with respect to system throughput considering several options how to cope with varying interference
WINNER D210 v10
Page 135 (180)
conditions from newly arriving users Finally Performance results of a protocol which utilises and exploits the benefits of distributed antennas are presented in Appendix G75
It should be stressed that simulation results are provided by different partners using uncalibrated implementations and to a certain extent differing simulation assumptions Consequently results are not directly comparable unless otherwise noted (ie when they are from the same partner) Every contribution starts with a summary of the applied simulation assumptions different from those defined in Appendix E followed by a discussion of the simulation results and corresponding conclusions
For illustrative purposes the main set of medium access schemes which have been studied in greater detail by means of multi-link or system level simulation is depicted in Figure G1 Note that in the section headings the term TDMA has been omitted in most cases for the sake of brevity
chunknt symbols
n f s
ubca
rrie
rs
time
frequ
ency
codespace
Chunk based OFDMATDMA
Chunk basedMC-CDMATDMA
Interleaved OFDMATDMA= IFDMATDMA
Interleaved MC-CDMATDMA
Chunk basedOFDMATDMASDMA
TDMAChunk interleaved
OFDMATDMA
Figure G1 Illustration of considered GMC-based medium access schemes
G1 Downlink multiple access
G11 Comparison of non-adaptive OFDMA MC-CDMA and adaptive OFDMA
Simulation Assumptions Simulator System simulator using AWGN look-up tables and effective SINR mapping
Combined snap-shot dynamic mode gt100 runs of 14 s each simulated Scenario wide area cellular frequency reuse 1 single antenna BS and UT Channel modelling C2 NLOS clustered delay line Interference modelling Central cell mode with simplified inter-cell interference model (two tiers of
fully loaded sectors) Cell radius 900 m MCS 6 QPSKr=13QPSKr12QPSK r2316-QAM r=12 16-QAM r34
64-QAMr=23 BLER target lt01 FEC Punctured convolutional coding (561753)oct with memory 8
Codeword length fixed size of 480 data symbols corresponding to 320ndash1920 payload bits depending on MCS used
HARQ Chase combining maximum 6 retransmissions Type of feedback Non-freq adaptive Best MCS fed back by each terminal
Freq adaptive One SINR per chunk AckNack messages explicitly fed back in all cases Delay 1 chunk duration
Overhead Total overhead of 23 taken into account in TX-power and resources Mobile speed 30 kmh same for all mobiles - results in almost perfect link adaptation
WINNER D210 v10
Page 136 (180)
With the OFDMA variant considered here each user scheduled for transmission is assigned a subset of 6 chunks (out of 48) thus serving 8 users per chunk duration TDMA is applied in each of the two successive chunks forming a frame Thus 16 users are served in total in one FDD frame In the frequency non-adaptive case the 6 chunks of the 8 selected users are simply interleaved in frequency to provide a diversity gain for the channel decoder Note that in this case the link adaptation could also be pre-calculated at the terminal and best MCS feedback would be sufficient In the frequency-adaptive case the 8 users select their preferred 6 chunks in a fair way This requires an increased feedback using one SINR value per chunk for each user Link adaptation is then performed explicitly by the base station after chunk allocation
In case of MC-CDMA spreading is performed within the chunks only using a spreading factor of 8 Hence the whole available bandwidth is shared by 8 users simultaneously MC-CDMA requires only a feedback of the best MCS for each user in the cell assuming that link adaptation is pre-calculated at the terminals Based on this feedback time-domain scheduling (selecting 16 simultaneous users) and link adaptation is performed at the base-station
The simulation results in Figure G2 and Figure G3 firstly show a comparison of different scheduling algorithms in the non-frequency adaptive case using MC-CDMA An evaluation of these scheduling algorithms for pure TDMA and lower system bandwidth (5 MHz) was already presented in earlier WINNER deliverables The major difference compared to earlier results is the fact that with MC-CDMA using a spreading factor of 8 and half-duplex FDD 16 users are scheduled in parallel instead of just a single user Since the gains obtained from multi-user diversity depend on the number of users competing for the resource it is not surprising that the channel dependent schedulers Score Based and Maximum SINR achieve much lower gains in cell throughput compared to Round Robin (Figure G2) than was found in the earlier studies for a comparable number of users
40 users 80 users0
5
10
15
20
25
Mbi
ts
Average service throughput per cell
Round RobinScore BasedMaximum SINR
0 05 1 150
01
02
03
04
05
06
07
08
09
1
Mbits
Pro
b( a
v u
ser t
hrou
ghpu
t lt X
)
CDF of average user throughput
Round RobinScore BasedMaximum SINR
40 users
80 users
40 users 80 users0
5
10
15
20
25
Mbi
ts
Average service throughput per cell
Round RobinScore BasedMaximum SINR
0 05 1 150
01
02
03
04
05
06
07
08
09
1
Mbits
Pro
b( a
v u
ser t
hrou
ghpu
t lt X
)
CDF of average user throughput
Round RobinScore BasedMaximum SINR
40 users
80 users
Figure G2 Throughput for MC-CDMA vs number of userscell
100 200 300 400 500 600 700 800 9000
05
1
15
Mbi
ts
Distance [m]
80 users cell
100 200 300 400 500 600 700 800 9000
05
1
15
Distance [m]
Mbi
ts
40 users cell
Round RobinScore BasedMaximum SINR
Figure G3 Av user throughput vs distance (only scheduled users considered)
WINNER D210 v10
Page 137 (180)
Note also that the cell throughput for the fair score-based scheduler is limited by the low rate users at the cell border (Figure G3) similar to Round Robin In contrast the Maximum SINR scheduler artificially reduces the coverage by serving only users close to the cell centre Note from Figure G2 that for Maximum SINR scheduling around 30 (58) of the 40 (80) users in the cell are not served For Round Robin and score-based scheduling this number is slightly lower than 20 for both system loads Hence the single antenna configuration and the MCSs used for these first results do not provide satisfactory coverage and the use of multiple antennas and advanced coding strategies (eg Turbo Coding) does appear mandatory
In Figure G4 and Figure G5 MC-CDMA and OFDMA are compared for the frequency adaptive and the frequency non-adaptive case In the frequency non-adaptive case MC-CDMA outperforms OFDMA in terms of cell and user throughput for all considered loads and scheduling algorithms This is due to the frequency diversity advantage of MC-CDMA achieved by spreading the coded block over the whole bandwidth
40 users 80 users0
5
10
15
20
25
Mbi
ts
Average service throughput per cell
Round Robin MC-CDMAScore Based MC-CDMARound Robin OFDMAScore Based OFDMA NonFreqScore Based OFDMA FreqAdapt
0 05 1 150
01
02
03
04
05
06
07
08
09
1
Mbits
Pro
b( a
v u
ser t
hrou
ghpu
t lt X
)
CDF of average user throughput
Score Based MC-CDMAScore Based OFDMA NonFreqScore Based OFDMA FreqAdapt
40 users
80 users
40 users 80 users0
5
10
15
20
25
Mbi
ts
Average service throughput per cell
Round Robin MC-CDMAScore Based MC-CDMARound Robin OFDMAScore Based OFDMA NonFreqScore Based OFDMA FreqAdapt
0 05 1 150
01
02
03
04
05
06
07
08
09
1
Mbits
Pro
b( a
v u
ser t
hrou
ghpu
t lt X
)
CDF of average user throughput
Score Based MC-CDMAScore Based OFDMA NonFreqScore Based OFDMA FreqAdapt
40 users
80 users
Figure G4 Throughput for MC-CDMA and OFDMA vs nb of userscell
100 200 300 400 500 600 700 800 9000
05
1
15
Mbi
ts
D is tanc e [m ]
80 us ers c ell
100 200 300 400 500 600 700 800 9000
05
1
15
Dis tanc e [m ]
Mbi
ts
40 us ers c ell
S c ore B as ed M C-CDM AS c ore B as ed O FDM A NonFreqS c ore B as ed O FDM A F reqA dapt
Figure G5 Av user throughput vs distance (only scheduled users considered)
In the frequency-adaptive case where the base station can use feedback on chunk level for adaptive chunk allocation OFDMA achieves high gains in user and cell throughput However the gain is to a certain extent limited by the constraint that a fixed amount of chunks (6 in this case) is assigned to each user scheduled for transmission The percentage of un-served users decreases by adaptive transmission to around 12 (Figure G4) and the user throughput increases within the whole cell range (Figure G5) However the observation that overall coverage is unsatisfactory still holds in the frequency adaptive case
The following main conclusions can be drawn from the results
WINNER D210 v10
Page 138 (180)
bull Multi-user diversity gains from fast scheduling can only be obtained when a strong TDMA component on sub-frame level is kept in the multiple access scheme Only a limited number of users should be served simultaneously depending on delay constraints and required throughputs
bull In the considered single antenna system configuration the cell coverage is unsatisfactory The use of advanced antenna techniques (MIMO) and improved coding schemes (eg Turbo Coding) is mandatory to achieve satisfactory wide area coverage
bull OFDMA achieves high performance gains in the frequency adaptive mode when a reliable feedback of the channel quality per chunk eg SINR is available for all users competing for the resource
bull In the non-frequency adaptive case MC-CDMA outperforms OFDMA thanks to the better frequency diversity obtained by spreading the symbols over the whole bandwidth However the differences are rather small and will probably vanish if other sources of diversity are available34
G12 Comparison of non-adaptive subcarrier interleaved OFDMA and MC-CDMA
Simulation Assumptions Simulator multi-link level Scenario Short range cellular single antenna BS and UT Channel modelling IEEE 80211n including path loss and shadowing Interference modelling Whole tier of interfering cells around desired cell each cell generates own
transmit signal and signal is transmitted through independent channel Cell radius 300 m Link adaptation QPSK r=12 FEC Convolutional coding (561753)oct with memory 8
Codeword length 3328 spreading type Walsh-Hadamard spreading length 8
Despreading MMSE based Mobile speed 3 kmh
The simulation results in Figure G6 left plot show a direct comparison between subcarrier interleaved OFDMA and subcarrier interleaved MC-CDMA in a cellular environment in terms of BER In case of OFDMA each user gets exclusively 208 subcarriers out of 1664 allowing a maximum number of 8 users to be served simultaneously With MC-CDMA the data of each user is spread over 8 subcarriers leading to multiple access interference Since the number of active users the maximum number of users the data symbols per user and the frame size are equal the comparison of the medium access variants is regarded as fair The resource load of OFDMA is defined by the ratio of the number of allocated subcarriers relating to the number of available subcarriers In MC-CDMA the resource load is given by the ratio of the number of active users relating to maximum number of users which could be served using all available codes In the case of OFDMA an RRM over three cells can avoid a double allocation of subcarriers up to a resource load of 13 Otherwise the subcarriers are randomly allocated Three scenarios are investigated determined by the distance of the UTs to the base station d0=(150 200 300) In the inner part of the cell (d0=150 m) MC-CDMA outperforms OFDMA for resource loads smaller than 075 due to enhanced frequency diversity but the difference is rather small if translated into throughput The benefit of MC-CDMA reduces with increasing resource load because the multiple access interference increases Since the inter-cellular interference is small in the inner part of the cell the RRM for OFDMA does not enhance the performance dramatically In contrast the RRM improves drastically the performances for OFDMA in the outer parts of the cell (d0 gt200 m) for lower resource loads indicating that RRM is an important means for throughput enhancements at the cell edge especially if the system is not fully loaded (which is mostly the case in a real system) MC-CDMA always outperforms pure ODFMA in all three scenarios for resource loads lower than 06
34 The actual WINNER system concept offers additional sources of diversity in the spatial domain A comparison of
the additional benefit of MC-CDMA against the increased complexity in particular in conjunction with MIMO techniques is for further study
WINNER D210 v10
Page 139 (180)
0 02 04 06 08 110-6
10-4
10-2
100
resource load
BE
R
OFDMA with RRMOFDMA wo RRMMC-CDMA
d0=300m
d0=200m
d0=150m
0 50 100 150 200 250 300
10-6
10-4
10-2
100
distance [m]
BE
R
MC-CDMA RL=10OFDMA wo RRM RL=10OFDMA with RRM RL=10OFDMA wo RRM RL=05OFDMA with RRM RL=05MC-CDMA RL=05OFDMA wo RRM RL=0125MC-CDMA RL=0125OFDMA with RRM RL=0125
Figure G6 BER versus resource load for different UT distances (left plot) and BER versus UT distance for different resource loads (right plot) considering interleaved MC-CDMA and OFDMA
The right plot of Figure G6 shows the BER versus the mobile distance to the desired base station Three different resource loads for an OFDMA and MC-CDMA system are investigated Due to the avoidance of inter-cellular interference by using the RRM for OFDMA the BER with a resource load of 0125 is nearly zero in the whole cell MC-CDMA can utilise the whole frequency diversity and therefore MC-CDMA outperforms pure OFDMA in the scenarios with resource load 0125 and 05 in the whole cell area OFDMA slightly exceeds the MC-CDMA performance in the fully-loaded scenario because the multiple access interference is the major degradation factor of MC-CDMA
To sum up at low resource loads (smaller than 06) MC-CDMA performs always better than pure OFDMA due to the higher frequency diversity but the differences are small and will probably disappear if further sources of diversity are exploited see footnote 34 on page 138 However the enhanced interference suppression opportunities with smart RRM allow a large performance gain for lower bounds The RRM shows a lower bound for the OFDMA system without any channel knowledge at the transmitter side At high loads both techniques show similar performances
G13 Comparison of non-adaptive OFDMA MC-CDMA and TDMA
Simulation Assumptions Simulator Multi-cell link level Scenario Wide area single-antenna BS and UT cell radius 1000 m Channel modelling C2 generic channel model (D54) including path loss + shadowing Interference modelling Whole tier of interfering cells around desired cell MCS 2 4-QAM r=12 16-QAM r=12 FEC Convolutional coding (561753)oct with memory 8
Codeword length 1664 Spreading Type Walsh-Hadamard spreading length 8 Channel allocation for each codeword
TDMA ndash 4-QAM 416 carriers times 2 symbols TDMA ndash 16-QAM 416 carriers times 1 symbol OFDMA ndash 4-QAM 32 adjacent carriers times 26 symbols OFDMA ndash 16-QAM 32 adjacent carriers times 13 symbols MC-CDMA ndash 4-QAM 416 carriers times 16 symbols MC-CDMA ndash 16-QAM 416 carriers times 8 symbols Spreading is performed across 8 adjacent subcarriers
Simulations have been conducted in order to compare the performance of OFDMATDMA MC-CDMATDMA and pure TDMA which can be regarded as a special case of MC-CDMA with spreading factor 1 Figure G7 presents the throughput results for a fully loaded scenario ie where all resources are used for data transmission and 14 loaded scenario Resources are allocated to UTs of different cells randomly that is no interference avoidance scheme is used The results show that all considered multiple access schemes have very similar performances In fully loaded case OFDMA is slightly better than MC-CDMA due to inter-code interference in CDMA In 14 load case MC-CDMA is slightly better than the others confirming the results obtained in G12 It can also be seen that OFDMA is a little better than TDMA in both cases This is due to OFDMA taking more advantage of the time diversity provided by the channel conditions used in the simulation However no spatial diversity has been taken into account yet
WINNER D210 v10
Page 140 (180)
which may further reduce the performance differences between OFDMTDMA OFDMA and MC-CDMA (see also footnote 34 on page 138)
0 5 10 15 20 25 3002
03
04
05
06
07
08
09
1
data rate [Mbits]
prob
(use
r thr
oupu
t lt a
bsci
ssa)
4QAM TDMA16QAM TDMA4QAM OFDMA16QAM OFDMA4QAM MC-CDMA16QAM MC-CDMA
0 2 4 6 8 100
01
02
03
04
05
06
07
08
09
1
data rate [Mbits]
prob
(use
r thr
oupu
t lt a
bsci
ssa)
4QAM TDMA16QAM TDMA4QAM OFDMA16QAM OFDMA4QAM MC-CDMA16QAM MC-CDMA
0 5 10 15 20 25 3002
03
04
05
06
07
08
09
1
data rate [Mbits]
prob
(use
r thr
oupu
t lt a
bsci
ssa)
4QAM TDMA16QAM TDMA4QAM OFDMA16QAM OFDMA4QAM MC-CDMA16QAM MC-CDMA
0 2 4 6 8 100
01
02
03
04
05
06
07
08
09
1
data rate [Mbits]
prob
(use
r thr
oupu
t lt a
bsci
ssa)
4QAM TDMA16QAM TDMA4QAM OFDMA16QAM OFDMA4QAM MC-CDMA16QAM MC-CDMA
Figure G7 Performance comparison of OFDMA MC-CDMA and TDMA in fully loaded case (right plot) and non-fully loaded case (left plot)
Figure G8 presents throughput results obtained for various reuse factors using OFDMTDMA although the general conclusions stand for other MA schemes Four tiers of interfering cells are used for the simulation The results show that only about 77 of the cell has been sufficiently covered therefore stronger MCS are required to cover users at the cell edge These results support the suggestion in [WIND32] to cover different areas of the cell with different reuse factors Approximately 37 of the cell can be covered by reuse 1 A further 28 of the cell can be covered by reuse 3 Reuse 7 can be used in approximately 12 of the cell
0 5 10 15 20 25 300
01
02
03
04
05
06
07
08
09
1
data rate [Mbits]
prob
(use
r thr
oupu
t lt a
bsci
ssa)
4QAM RR116QAM RR14QAM RR316QAM RR34QAM RR716QAM RR7
Figure G8 Throughput for different reuse factors for OFDMTDMA
G14 Impact of chunk sharing on the performance of adaptive OFDMATDMA
Simulation Assumptions Simulator Link level Scenario wide area MT = 1 MR = 1 mobility 50 kmh for all mobiles Channel modelling C2 clustered delay line Interference modelling no inter-cell interference MCS 4 4-QAM 16-QAM 64-QAM 256-QAM
adaptive bit and power loading FEC no
An algorithm to perform adaptive user-to-subcarrier allocation with bit and power loading has been proposed in [WIND26] for the downlink of a multi-carrier CDMA systems with spreading both in time and in frequency The algorithm yields an optimisation of the subcarrier sharing that enables a considerable performance gain with respect to OFDMA systems where each subcarrier is exclusively
WINNER D210 v10
Page 141 (180)
assigned to one user [WIND23] In order to implement subcarrier sharing other sharing techniques like TDMA or FDMA can be used as well Although chunk-wise resource allocation already implicitly provides time sharing in an OFDMA system we show that a considerable performance gain can be achieved through further chunk sharing in case that the number of users competing for resources is quite high (K=32 in this case) and the time constraints for serving all these users is very stringent (one chunk duration=3346micros) Sharing of a chunk by different data flows can be implemented in many different ways in particular
CDMA ndash all nsub nsymb time-frequency bins of a chunk or a subset thereof are simultaneously utilised by a number of data flows To decrease message delays it would be advantageous to perform pure frequency-domain spreading by which in frequency-selective fading CDMA can provide diversity gain even with single-user detection However in an adaptive system no room for diversity is left
TDMA ndash each flow utilises all subcarriers of a chunk during ρkqnsymb OFDM symbol periods
FDMA ndash flow k utilises ρkqnsub subcarriers during the nsymb OFDM symbol periods of a chunk Some kind of frequency hopping per chunk can be advantageous in severe frequency selective channels
Figure G9 illustrates the impact of chunk sharing and chunk size variations on BER performance Here Sf denotes the spreading factor and S the number of users sharing a chunk Under the specific conditions considered chunk sharing with nsub=4 and Sf=S=4 yields a significant performance improvement with respect to exclusive user-to-chunk assignment ie nsub=4 and Sf=S=1
-6 -4 -2 0 2 4 6 8 10 12 1410
-4
10-3
10-2
10-1
100
Relative transmitter power dB
BE
R
nsub=Sf=1S=4FDMA
nsub=Sf=4S=4FDMA
nsub=Sf=1S=1FDMA
nsub=4Sf=S=1FDMA
nsub=2Sf=S=1FDMA
nsub=2=Sf=S=2FDMA
Figure G9 Gain of chunk sharingchunk size considering 32 users competing for 416 subcarriers with a granularity nsub= 1 to 4 and nsymb=12 35
It is reasonable to expect that the achievable gain decreases by relaxing the constraint on the number of users to be served within one chunk duration ie by decreasing the demand on granularity as it had been previously shown in [WIND26] with reference to single subcarrier sharing Moreover from the figure it can be inferred that the gain of chunk sharing increases with the number of subcarriers constituting the chunk at BER=10-3 a gain of 2 dB is achieved for nsub=2 and 6 dB for nsub=4 respectively Furthermore it can be observed that by optimizing the transmission scheme over sub-bands of size nsubgt1 the transmitter power needed to achieve a given BER increases (by 1 dB for nsub=4) Indeed increasing the chunk size reduces the performance of link adaptation due to the effect of channel-to-noise ratio averaging But on the other hand it also reduces the amount of feedback information which was not taken into account here
We note that results for S le 4 have been plotted since preliminary results had shown that increasing S further does not provide any improvement Finally all curves refer to the case of FDMA sharing since it had also been proven that the performance of TDMA and CDMA chunk-sharing is essentially the same
35 It should be noted that the fairly large gains seen here apply only to specific situations with very strict delay
requirements as eg control signalling for scheduling and retransmissions for highly prioritised services
WINNER D210 v10
Page 142 (180)
from which it can be inferred that CDMA is not affected by the loss of orthogonality among codes within one chunk
G15 Comparison of adaptive OFDMA and OFDMASDMA using GoBs
Simulation Assumptions Simulator System level simulator 30 Frames per snapshot 20 snapshots per simulation Scenario wide area MT = 8 MR = 1 cell radius 1000 m all UTs move at 3 kmh
frequency reuse 1 336 carrier per sector frequency reuse 3 112 carrier per sector frequency reuse 7 48 carrier per sector Tx power per carrier is set to 125 mW in all cases
Channel modelling C2 and D1 generic channel model (according to D54) Interference modelling Full modelling using wrap around technique MCS 6 BPSK r=13 BPSK r=23 QPSK r=23 16-QAM r=23
64-QAM r=23 64-QAM r=89 FEC punctured convolutional coding (133171145)oct with memory 6
codeword length variable ndash one codeword always fills one chunk Type of feedback For each user and chunk MCS and corresponding throughput value Feedback delay 0 Beamforming Chebychev tapering with 25 dB side lobe suppression using either eight grids
with one beam each (1 beam case) 4 grids with two beams each (2 beam case) or 2 grids with 4 beams each (4 beam case)
A simple grid of fixed beam (GoB) is considered in order to investigate the potential SDMA gains achievable under wide-area scenario conditions The basic approach used here is to form beams simultaneously from all BS allowing the UT to measure and feedback some kind of CQI as eg SINR per chunk and beam see [WIND27] Based on this feedback resources are allocated to the UTs adaptively (opportunistically) Proportional fair scheduling (PFS) is applied to take fairness constraints into account Considering synchronised cells and leaving the beam pattern and corresponding power allocation constant at all base stations during measurement phase and payload phase leads to predictable inter-cell interference conditions and hence supports short term adaptivity36
System simulation results for channel model D1 comparing average sector throughput for single antenna base stations (SISO) and multi-antenna base stations forming one two or four beams on each chunk are shown on the left side of Figure G10 Note that the SISO and the one beam case are associated with chunk based OFDMATDMA and the two and four beam case with chunk based OFDMATDMASDMA respectively Two main conclusions can be drawn out of these plots Firstly a fixed frequency reuse of one is always beneficial with respect to the cell throughput even if fairness (deducible from the right two plots in Figure G10) is taken into account This holds also for the SISO case which may be explained by different (in the simulation uncorrelated) shadow and fast fading characteristics for any BSharrUT link leaving sufficient variability to be exploited by adaptive scheduling Secondly increasing the number of beams leads to an increasing sector throughput indicating that SDMA is a viable option
36 Predictable SINR conditions are even more challenging for adaptive spatial processing The measurement phase
and the corresponding feedback signalling can be implemented as additional time-multiplexed parts of the super-frame not shown in Figure 32 The detailed layout of these phases within the super-frame is for further study
WINNER D210 v10
Page 143 (180)
0 5 10 15 20 25 30 350
20
40
60
80
100
120
max SISO rate
number of users
aver
age
sect
or th
roug
hput
[Mbi
ts]
channel model D1 reuse 1
SISO PFS1 beam PFS2 beams PFS4 beams PFS4 beams max thrpt
0 5 10 15 20
0
02
04
06
08
1
data rate [Mbits]
prob
(use
r thr
ough
put lt
abs
ciss
a)
16 user channel model D1 reuse 1
SISO PFS1 beam PFS2 beams PFS4 beams PFS4 beams max thrpt
0 5 10 15 20 25 30 3510
20
30
40
50
60
70
max SISO rate
number of users
aver
age
sect
or th
roug
hput
[Mbi
ts]
channel model D1 reuse 3
SISO PFS1 beam PFS2 beams PFS4 beams PFS4 beams max thrpt
0 5 10 15 20
0
02
04
06
08
1
data rate [Mbits]
prob
(use
r thr
ough
put lt
abs
ciss
a)
16 user channel model D1 reuse 3
SISO PFS1 beam PFS2 beams PFS4 beams PFS4 beams max thrpt
Figure G10 average sector throughput and CDF of user throughput for channel model D1 with varying number of beams in different reuse scenarios zero feedback delay
Further exemplary simulations have been performed in order to assess the impact of various system parameters as feedback delay amount of feedback and number of antennas at the UT starting from the parameter setting [4beams channel model D1 reuse 1 prop fair scheduling 16 users] Figures are omitted for the sake of brevity but basically it turns out that in case of channel model D1 the system is quite robust with respect to feedback delays For example a delay of 64 OFDM symbols between measurement and payload phase in a scenario where all UTs move at 70 kmh (corresponding to a Doppler normalised delay fDtdelay=06) led to an average sector throughput loss of around 16 The relatively small loss is mainly due to high LOS probability associated with this channel model In case of channel model C2 (NLOS only) however the average sector throughput loss is substantially higher and amounts to 67 under the same conditions
Regarding the amount of feedback a considerable performance loss can be observed when CQI information is fed back for less than around 35 percent of all chunks But this threshold depends to a certain degree on the number of different grids and how they are mapped to the chunks In this simulation only two different grids each with four beams were considered causing a certain periodicity in frequency direction
Increasing the number of antennas at the UT provides significant system performance gains of around 25 (2 antennas) and 50 (4 antennas) using maximal ratio combining (MRC) Even larger gains are expected if the combiner accounts for the interference characteristics (IRC) as described in G24 Of course further investigations a required to study the interaction of the parameters presented
Realizing SDMA by GoBs requires a relatively low angle of departure spread to keep intra-cell interference ie intra-beam interference small The more beams are formed the more stringent this requirement is Channel model C2 has a much larger angle of departure spread than D1 and therefore the performance gain achieved by SDMA are considerable smaller In fact forming four beams yields approximately the same performance as with two beams
To sum up using grids of beams in combination with opportunistic scheduling is a simple but yet efficient and robust solution to realise SDMA gains with low complexity even in reuse case 1 provided
WINNER D210 v10
Page 144 (180)
that the angle of departure spread is sufficiently small as for scenario D1 In scenario C2 the SDMA gain with GoBs is limited to a factor of around 15 compared to pure beamforming
G2 Downlink spatial processing
G21 Comparison of fixed and tracking based beamforming
Simulation Assumptions Simulator System simulator 200 snapshots snapshot duration 250 chunks Scenario Wide area cellular MT = 8 MR = 1 frequency reuse 1 all 512 carriers used
cell radius 1 km Channel modelling C2 WIMI generic channel model Interference modelling Full interference modelling Multiple access adaptive OFDMATDMA MCS No MCS a successful transmission occurs when the predicted transmission
rate is lower than the actual capacity of the equivalent channel FEC No FEC Type of feedback 8 bits feedback per user per chunk SNR in case of OBF complex gain in
case of adaptive beamforming with channel tracking Feedback delay 2 chunk duration Overhead 19 out of 96 resource elements for each chunk Mobile speed Pedestrian (M1) 50 of users Vehicular (M2) 50 of users Beamforming OBF 1 varying beam spanning a grid of 40 fixed beams
In an environment where the NLOS (or fading) component of the channel is dominant with respect to the LOS component (typically C2 environment in WIMI) the performances of fixed beamforming and long-term CSI based beamforming techniques degrade due to the large angle of departure spread of the channel In this case short-term CSI based adaptive beamforming techniques are better suited to exploit the multi-antenna gain The main limitation when using these techniques in a wide-area scenario is the high signalling overhead needed for the feedback of the CSI from the mobile end to the BS In order to reduce the signalling overhead and still preserve the multi-antenna gain an adaptive beamforming technique based on channel tracking (TrackBF) is considered
With this approach the beamforming vectors are determined according to the maximum ratio combining solution ie )(ˆ)(ˆ)(
H nnn kk hhw = using the estimated (tracked) channel )(ˆ n
kh of the scheduled user
k It is assumed that the complex gain αk(n)=hk(n)w(n) is fed back and used to track the channel at the BS via Kalman filtering [GA93] In addition to the channel the Kalman filter gives an estimate of the covariance matrix ))(ˆ)(())(ˆ)(E()( H nnnnn kkkkk hhhhC minusminus= which is a measure of the quality of the channel estimation and is used to predict the transmission rate for user k The scheduling decision is then made using the Proportional Fair Scheduler (PFS)
The proposed technique has the same reduced complexity and feedback requirements as the existing Opportunistic Beamforming (OBF) [VTL02] approach which is implemented here using a varying beam w(n) that spans a grid of 40 fixed beams and where the resulting gain αk(n)=|hk(n)w(n)| or the associated SNR is fed back This technique is used as a benchmark for comparison
Results show both the TrackBF and OBF enhance the performance over the SISO case by exploiting the multiple transmit antennas advantage (Figure G11) In terms of mean cell throughput the TrackBF and OBF improve the performance by 47 and 16 respectively over the SISO case Moreover the TrackBF outperforms the OBF in terms of throughput and fairness the latter is reflected by the lower probability of high inter-packet delays (Figure G12) As expected the TrackBF performs much better for pedestrian users than for vehicular users (Figure G11) The performance degradation in the case of vehicular users is related to the poor channel tracking quality due to high mobility
WINNER D210 v10
Page 145 (180)
0 50 100 150 2000
02
04
06
08
1
Cell Throughput Mbits
Pro
b(C
ell T
hrou
ghpu
t lt a
bsci
ssa)
Cell Throughput Tc = 1000 K = 60 per cell
TrackingPFS mean = 110Mbits
Opportunistic BFPFS mean = 87Mb
SISOPFS mean = 75Mbits
0 2 4 6 8 100
02
04
06
08
1
User Throughput Mbits
Pro
b(U
ser T
hrou
ghpu
t lt a
bsci
ssa)
User Throughput K = 60 per cell
TrackingPFS Pedestrian(M1)Opportunistic BFPFS Pedestrian(M1)TrackingPFS Vehicular(M2)Opportunistic BFPFS Vehicular(M2)
Figure G11 CDF of cell throughput (left plot) and user throughput (right plot) for SISO adaptive beamforming with tracking and OBF with fixed grid of beams 20 users per sector
100 101 10210-4
10-3
10-2
10-1
Inter-packet delay in chunk duration
Pro
b(de
lay
gt ab
scis
sa)
Inter-packet delay distribution K = 60 per cell
TrackingPFSOpportunistic BFPFS
Figure G12 inter-packet delay distribution 20 users per sector
G22 Comparison of various adaptive beamforming techniques
Simulation Assumptions Simulator Multi-link one sector 1000 frames simulation time with 100 drops Scenario wide area cellular MT = 8 MR = 1 ULA Channel modelling SCME no path loss no shadowing Interference modelling Only Intra-cell interference by full simulation of all links Mulitple access adaptive OFDMATDMA(SDMA) OFDM parameters 20 MHz bandwidth 512 subcarriers (406 used) MCS 1 16-QAM r=12 FEC Conv coding (561753)oct with memory 8 Codeword length 2 chunks Feedback delay 1 frame CQI feedback either beam selection info or covariance matrix Overhead None Mobile speed 50 kmh same for all mobiles
In these investigations several beamforming techniques plus SDMA are studied in a wide-area scenario on multi-link level Scheduling is done chunk based in a score-based proportional fair way one chunk occupies 8 subcarriers times 12 OFDM symbols Coding and scheduling is always performed for groups of two consecutive chunks
The first beamforming technique is a grid of fixed beams (GOB) with 8 beams Non-neighboured beams share the same time-frequency resources A feedback of the strongest beam and a corresponding CQI value are assumed Inside each beam the CQI value is used for the scheduling score calculation
WINNER D210 v10
Page 146 (180)
-20 -10 0 10 20 300
20
40
60
80
100
120
SNR [dB]
aver
age
sect
or th
roug
hput
[Mbi
ts] 32 users
-20 -10 0 10 20 300
20
40
60
80
100
120
SNR [dB]
16 users
-20 -10 0 10 20 300
20
40
60
80
100
120
SNR [dB]
aver
age
sect
or th
roug
hput
[Mbi
ts] 8 users
-20 -10 0 10 20 300
20
40
60
80
100
120
4 users
SNR [dB]
MU ABSU ABGOBAB 1str4 str maxSISO
Figure G13 Score based suburban macro
-20 -10 0 10 20 300
20
40
60
80
100
120
SNR [dB]
aver
age
sect
or th
roug
hput
[Mbi
ts] 32 users
-20 -10 0 10 20 300
20
40
60
80
100
120
SNR [dB]
16 users
-20 -10 0 10 20 300
20
40
60
80
100
120
SNR [dB]
aver
age
sect
or th
roug
hput
[Mbi
ts] 8 users
-20 -10 0 10 20 300
20
40
60
80
100
120
4 users
SNR [dB]
4 str maxMU ABSU ABGOBSISOAB 1 str
Figure G14 Score based urban macro
The second technique is adaptive beams with single-user optimised antenna weights (AB SU) based on Eigenbeamforming (see [HBD00]) For SDMA the selection of users is done successively The user with the highest score is selected first All spatially separable users are candidates for scheduling From these candidates the user with the highest score is selected This process is repeated until there are no more spatially separable users or the maximum number of desired spatial streams is reached The transmitter relies on feedback of CQI information (to calculate the score) and the spatial covariance matrix to calculate the antenna weights and to decide on spatial separation
WINNER D210 v10
Page 147 (180)
The third technique is adaptive beams with multi-user optimised antenna weights (AB MU) The user selection is done as above additionally the antenna weights are altered to achieve mutual interference suppression by multiplying the Eigenbeam weights by an inverted interference covariance matrix
As a reference case also results for SISO and adaptive beams without SDMA (AB 1str) are shown The figures above show the average total sector throughput over the SNR for the different investigated techniques lsquo4 str maxrsquo refers to the maximum which can be achieved by a 4-stream SDMA with the given MCS GOB is hard limited by these four streams adaptive beams have a soft limit
It can be concluded that multi-user optimised adaptive beams always outperform the other two SDMA schemes The relative sector throughput gain versus GOB increases with decreasing number of users This is caused by more degrees of freedom in user selection and better mutual interference suppression But it relies on the knowledge of the long-term covariance matrix (meaning a higher feedback rate is necessary if no UL CSI can be used) Single user optimised adaptive beams are characterised by a reduced computational complexity compared to AB MU They always outperform GOB with few users On the other hand with high load (more streams) and a larger demand of spatial separation (eg Round Robin instead of score based or a scenario with more angular spread) they can even be outperformed by GOB So in total they are questionable to be used in conjunction with SDMA GOB inherently carry benefits by their simple feedback and scheduling and their orthogonal design being a simple form of multi-user optimisation
SDMA in general shows increasing gains with increasing number of active users (due to increased chances of spatial separability) and decreasing angular spread SDMA has a large potential for increasing cell throughput and is a promising candidate for a wide-area scenario
G23 Comparison of maximal ratio and interference rejection combining at UT
Simulation Assumptions Simulator Multi-link Scenario wide area downlink MT = 1 MR = 2 Channel modelling WINNER channel model C2 NLOS no path loss no shadowing Interference modelling One Inter-cell interference with DIR of 6 dB Multiple access Non-adaptive OFDMTDMA MC-CDMATDMA OFDM parameters 20 MHz bandwidth 512 subcarriers (406 used) MCS QPSK r=12 16QAM r=13 FEC 3GPP 12 and 13 Turbo coding Mobile speed 50 kmh for all terminals
When frequency reuse one is assumed in downlink at wide area mode inter-cell interference or co-channel interference will degrade system performance However multiple antennas at receiver can be used to mitigate the interference
Here 1x2 OFDM and 1x2 multi-carrier CDMA systems are considered in downlink for wide area For multi-carrier CDMA spreading factor and the number of Walsh-Hadarmard codes are both equal to 8 One inter-cell interference with dominant interference ratio (DIR) of 6 dB is generated QPSK with 3GPP 12 Turbo coding and 16QAM with 13 Turbo coding are used At receiver two combining methods are considered One is maximum ratio combining (MRC) and another is interference rejection combining (IRC) which is also referred to here as miminum mean square error combining (MMSEC)
Simulation results are shown in Figure G15 No matter which MCS and receiver algorithm is used the performance for 1x2 OFDM and multi-carrier CDMA are very similar However receiver complexity of multi-carrier CDMA is larger than that of OFDM system On the other hand MMSE combining provides significant gains over MRC combining under interference scenario Therefore receive antenna processing eg MMSE combining is a very efficient means to suppress inter-cell interference
WINNER D210 v10
Page 148 (180)
-7 -6 -5 -4 -3 -2 -1 0 1 210
-4
10-3
10-2
10-1
100
SINR (dB)
Err
or R
ate
BER OFDM-MRCBER OFDM-MMSECBER CDMA-MRCBER CDMA-MMSECFER OFDM-MRCFER OFDM-MMSECFER CDMA-MRCFER CDMA-MMSEC
-8 -6 -4 -2 0 210
-3
10-2
10-1
100
SINR (dB)
Err
or R
ate
BER OFDM-MRCBER OFDM-MMSECBER CDMA-MRCBER CDMA-MMSECFER OFDM-MRCFER OFDM-MMSECFER CDMA-MRCFER CDMA-MMSEC
Figure G15 Performance of 1 times 2 MRC and MMSEC considering OFDMTDMA and MC-CDMATDMA with QPSK modulation and 12 turbo coding (left plot) and 16QAM modulation
and 13 turbo coding (right plot)
G24 Comparison of beamforming diversity and multiplexing
Simulation Assumptions Simulator System 19 three-sector sites full interference modelling using wrap-around Scenario Wide area cellular on average 10 userssector frequency reuse 1
MT le 8 MR le 2 varying cell radius Channel model C2 NLOS WINNER interim channel model (WIMI) MCS Modulation schemes QPSK 16QAM and 64QAM
Channel code rates 110 13 12 23 34 and 89
FEC
Turbo code combined with Layer 1 code block segmentation (up to 5114 bits per block) and rate matching codeword length from 998 (QPSK rate 110) to 26624 bits (64QAM rate 89) rate 17 mother code (polynomials feedback 013 feedforward 015 017 011)
FeedbackOverhead Chunk SINR after receiver processing zero delay no overhead
A non-frequency adaptive downlink based on OFDMTDMA is evaluated in a multi-cell wide-area scenario in order to assess the value of different components of the WINNER multiple-antenna concept Performance is compared for different cell sizes and in terms of average sector throughput and active radio link data rates The latter measure is the (average) user throughput when scheduled for transmission Since round robin TDMA scheduling is applied the active radio link rate may be used to assess the fairness in the network Furthermore because many idealised assumptions are made one should not focus on the absolute performance figures but rather on the relative performance
The upper left plot in Figure G16 depicts the average sector throughput in a network using a single downlink transmit antenna Compared to single antenna reception terminal receive diversity may improve performance significantly MRC provides an average throughput gain of 35 in an interference limited scenario Interference rejection combining (IRC) referred to as optimum combining in [Win84] which suppresses inter-cell interference by taking the spatial colour into account on a per carrier basis adds another 10ndash15 The lower left plot shows the distributions of the active radio link rates for a cell radius of 700 m and as can be seen performance is improved for all users
Transmit diversity may be realised by using linear dispersion codes In here Alamoutirsquos orthogonal design is considered with two transmit antennas separated 20 wavelengths The terminals use one or two receive antennas and as a reference single antenna transmission is also considered In the upper right plot of Figure G16 the sector throughput is shown and in the lower right plot the distributions of the data rates are shown for a cell radius of 700 m With receive diversity terminals suppress inter-cell interference taking the structure of the interference into account The results indicate that compared to single-antenna transmission the gain of transmit diversity with Alamoutirsquos design is slightly below 10 with receive diversity and slightly above 10 without receive diversity It can also be seen that transmit diversity does not improve data rates for the lower percentiles but rather for the high percentiles We note that there is inherently a substantial amount of frequency diversity available in the channel which may explain the
WINNER D210 v10
Page 149 (180)
marginal improvement and the present evaluation does not illustrate potential benefits of reduced channel quality variations for non-ideal link adaptation
100 m 1 km 10 km0
10
20
30
40
50
60
cell radius
aver
age
sect
or th
roug
hput
[Mbi
ts]
MRX = 2 IRCMRX = 2 MRCMRX = 1
0 20 40 60 800
010203040506070809
1
prob
(use
r thr
ough
put lt
abs
ciss
a)
active radio link rate [Mbits]
100 m 1 km 10 km0
10
20
30
40
50
60
cell radius
aver
age
sect
or th
roug
hput
[Mbi
ts]
MTX = 2 MRX = 2MTX = 2 MRX = 1MTX = 1 MRX = 2MTX = 1 MRX = 1
0 20 40 60 800
010203040506070809
1
prob
(use
r thr
ough
put lt
abs
ciss
a)
active radio link rate [Mbits]
Figure G16 Average sector throughput and data rate distributions for spatial diversity techniques The data rate distributions are depicted for a cell radius of 700 m
Beamforming solutions provide a directivity gain and change the interference situation in the network Beamforming can be accomplished eg by creating a fixed grid of beams (GOB) and using the beam with the lowest pathloss at transmission An alternative is to form user-specific beams based on the transmit covariance matrix of the channel In here the eigenvector associated with the largest eigenvalue of the transmit covariance matrix is used and this is referred to as eigenbeamforming (EBF) The left plot in Figure G17 depicts the sector throughput with downlink beamforming based on a GOB and EBF respectively using two four and eight base station antennas With GOB the antennas are used to form four eight and 16 fixed beams respectively Terminals have two receive antennas for IRC The results indicate that in the studied scenario EBF provides only a marginal performance improvement compared to a solution using a GOB Thus heavily quantised knowledge of the transmit covariance matrix here in terms of a preferred beam may be enough to capture most of the available gain Increasing the number of antennas gives throughput improvements in the order of around 30 when going from two to four antennas and another 20-25 when increasing the number of base station antennas to eight The enhancement is generally higher at large cell sizes To the right in Figure G17 results with EBF and one and two terminal receive antennas for IRC are shown The gain of terminal receive diversity in terms of sector throughput is here in the range 35ndash50 The gain typically decreases when the number of base station antennas increases illustrating that benefits not necessarily are additive
To the left in Figure G18 performance with beamforming (EBF) at the base station combined with terminal receive diversity is shown The upper left plot shows the average sector throughput and the lower left plot is the corresponding data rate distributions in a deployment with 700 m cell radius As can be seen the combination of beamforming and terminal receive diversity really improves the fairness and the lower percentiles of the data rates A fraction of the users may even become modulation limited With eight base station antennas used for beamforming throughput has increased more than threefold compared to single antenna transmission and reception and more than twofold compared to single antenna transmission combined with dual terminal receive diversity
WINNER D210 v10
Page 150 (180)
100 m 1 km 10 km0
20
40
60
80
100
120
cell radius
aver
age
sect
or th
roug
hput
[Mbi
ts]
EBFGOB
100 m 1 km 10 km0
20
40
60
80
100
120
cell radius
aver
age
sect
or th
roug
hput
[Mbi
ts]
MRX = 2MRX = 1
Figure G17 Average sector throughput with beamforming comparing eigenbeamforming with grid of beams (left) and comparison of terminal receive diversity with single antenna reception
(right)
100 m 1 km 10 km0
20
40
60
80
100
120
cell radius
aver
age
sect
or th
roug
hput
[Mbi
ts]
MTX = 8 MRX = 2MTX = 4 MRX = 2MTX = 2 MRX = 2MTX = 1 MRX = 1
0 50 100 1500
010203040506070809
1
prob
(use
r thr
ough
put lt
abs
ciss
a)
active radio link rate [Mbits]
100 m 1 km 10 km0
20
40
60
80
100
120
cell radius
aver
age
sect
or th
roug
hput
[Mbi
ts]
MTX = 2x4 MRX = 2 PSRCMTX = 2x2 MRX = 2 PSRCMTX = 2x1 MRX = 2 PARCMTX = 1 MRX = 1
0 50 100 1500
010203040506070809
1
prob
(use
r thr
ough
put lt
abs
ciss
a)
active radio link rate [Mbits]
Figure G18 Performance comparison of conventional beamforming with single stream transmission (left) and dual stream transmission (right) The data rate distributions are for cell
radius 700 m
To achieve very high peak data rates though one may have to consider the use of spatial multiplexing For this purpose per antenna rate control (PARC) is considered With two streams one channel coded block is transmitted from each (virtual) antenna and IRC in combination with successive interference cancellation after channel decoding is employed at the receiver side The performance of such dual stream transmission is depicted to the right in Figure G18 together with the corresponding single antenna results In this case both PARC with two antennas separated 20 wavelengths as well as the combination with EBF referred to as per stream rate control (PSRC) for four and eight antennas are considered For PSRC antennas are divided into two groups (uniform linear sub-arrays) separated 20 wavelengths within each group the element separation is half a wavelength and the two eigenvectors associated with the two largest eigenvalues of the transmit covariance matrix are used to transmit the two streams with the same
WINNER D210 v10
Page 151 (180)
power As can be seen from the lower plots in Figure G18 which show the data rate distributions for cell radius 700 m dual stream transmission does indeed increase peak data rates and for PSRC with eight transmit antennas the fraction of the users benefiting from this is non-negligible However on average dual stream transmission provide a throughput that is slightly below or similar to that of conventional single-stream beamforming with same number of antenna elements An interpretation of the rate distributions is that the increase of peak data rates comes at the expense of a reduced fairness
In summary the results indicate that transmit beamforming and terminal receive diversity are essential components to ensure good coverage of high data rates and high system throughput For beamforming with no SDMA component eigenbeamforming gives a small performance advantage compared to a grid of beams In interference limited scenarios terminal receive diversity with interference suppression gives a non-negligible performance improvement compared to maximum ratio combining The results further indicate that in the studied scenario transmit diversity using Alamoutirsquos orthogonal design gives only a marginal performance improvement compared to single antenna transmission One possible explanation of the limited gain is that the wideband channel inherently provides a large amount of frequency diversity Finally spatial multiplexing can be used to increase the peak data rates and may be successfully combined with beamforming Compared to a deployment using conventional beamforming this increase of peak data rates comes at the cost of reduced fairness although the average throughput is similar
G25 Performance of SMMSE precoding
Simulation Assumptions Simulator System level simulator 1000 snapshots 1 frame per snapshot Scenario Short range MT = 8 16 24 MR = 1 2 4 Round Robin scheduling Channel modelling A1 B1 WIMI generic channel model Multiple access Non-adaptive OFDMATDMASDMA Number of active users
variable parameter depends on the number of pilots available and the number of antennas at the user terminals
Channel estimation error modelling
Channel estimation error is modelled as a zero mean complex Gaussian variable and the variance is inversely proportional to the average receive SNR The assumed estimator gain is about GN=13 dB37
Cell radius 30 m in A1 scenario and 550 m in B1 scenario virtual overhead for parameter estimation
14 or 20 out of 80 resource elements of each chunk
SDMASMUX One spatial stream per user Maximum number of users multiplexed is fixed
SMMSE precoding is a promising spatial processing candidate for the WINNER system concept [VH04] [VH05a] [VH05b] [WIND27] In order to assess its performance for varying antenna configurations under realistic impairments system simulations have been set up for the short range isolated cell scenario
Modelling of impairments with respect to transmitterreceiver inequalities are performed according to
( ) ( ) ( )( ) ( )( ) 1~~ minus= k
BSTULkk
MSDLk KHKH
where ( )ULkH~ and ( )DLkH~ denote the uplink and downlink channel matrix respectively The terms KMS
(k) and KBS(k) represent the perturbations introduced by the transmitter and the receiver front-ends
These matrices are diagonal if we assume that the front-ends have only non-linear imperfections which implies that these matrices can be inverted and that their products are commutative The amplitude of KMS
(k) and (KBS(k))-1 is modelled as a truncated random Gaussian variable with mean 10 and variance
0007 and 00008 respectively The phase is uniformly distributed in the interval [-87o 87o] and [-30o 30o] see [BCK03]
The average number of users in the system and the overhead per chunk depends on the number of pilots multiplexed for the channel estimation from the different antennas In the proposal for the channel estimation it is assumed that we can estimate the channel from 3 antennas in the short-term adaptive mode or 6 in the long-term adaptive mode per one chunk In our simulations we rely on the assumption that the channel or the second order statistics of the channel are constant over one frame Since there are 3 time slots in the frame we multiplex in every time slot pilots from different antennas regardless of whether these antennas are located at the same terminal or not We assume that one user transmits using only one 37 Practically the estimator gain may vary depending on the number of users antennas and on the preamble design
and if correlation in frequency domain is corrected or not see [WIND21]
WINNER D210 v10
Page 152 (180)
fourth of the available bandwidth Thus the maximum number of different antennas that can be estimated in the short-term adaptive mode is 36 and the average number of users considered in the system simulations was 127 In the long-term adaptive mode the maximum number of antennas that can be estimated amounts to 72 and the average number of users considered was 27
Let us define the average correlation matrix of the ith user in the kth chunk as
( ) ( ) ( )sum=j
jki
Hjki
chunk
ki N
1 HHR
and its singular-value decomposition (SVD) as ( ) ( ) ( ) ( )Hki
ki
ki
ki VQVR = where ( )jk
iH is the ith user
channel matrix in the kth chunk The MU MIMO precoding is now performed on the equivalent channel defined as follows
( ) ( ) ( ) Hki
ki
ki VQH 21=
(
By using the equivalent channel ( )kiH
( we facilitate easier adaptation from perfect CSI to the second-
order CSI
The following notation is used to describe the simulated system MTKmaxNpilots where MT is the number of antennas at the BS Kmax is the maximum number of spatial streams per chunk and Npilots is the number of different antennas that can be estimated per chunk
0 500 1000 1500 20000
02
04
06
08
1
data rate [Mbits]
Pro
b(C
ell T
hrou
ghpu
t lt a
bsci
ssa)
cell throughput
833164316762466
0 20 40 60 80
0
02
04
06
08
1
data rate [Mbits]
Pro
b(U
ser T
hrou
ghpu
t lt a
bsci
ssa)
user throughput
83316431676data4
Figure G19 Cell and user throughput performance of SMMSE in A1 scenario
200 400 600 800 1000 1200 14000
02
04
06
08
1
data rate [Mbits]
Pro
b(C
ell T
hrou
ghpu
t lt a
bsci
ssa)
cell throughput
8431676
0 20 40 60 80
0
02
04
06
08
1
data rate [Mbits]
Pro
b(U
ser T
hrou
ghpu
t lt a
bsci
ssa)
user throughput
8431676
Figure G20 Cell and user throughput performance of SMMSE in B1 scenario
Simulation results for the A1 and B1 scenario are plotted in Figure G19 and Figure G20 In the A1 scenario the initial assumption of having 8 antennas at the BS has been shown not to be sufficient to provide 1 Gbps as a target cell throughput By increasing the pilot overhead we are able to estimate more usersrsquo channel matrices Significant cell throughput improvements can only be achieved by increasing the number of antennas at the BS as well as the number of users that are spatially multiplexed The 90 user
WINNER D210 v10
Page 153 (180)
throughput is almost constant as mobile terminals move away from the BS The 50 user throughput loss due to the increase of the distance from the BS is less than 10 Mbps
Similar as in the A1 scenario in the B1 scenario the target throughput of 600 Mbps is achieved by increasing the number of antennas at the BS and the number of users that are spatially multiplexed The values necessary to reach the target cell throughput are smaller than in A1 scenario
Hence Multi-user MIMO precoding is a powerful tool to provide the required celluser throughput It exploits the available CSI at the BS allowing very good use of the available resources in the spatial domain Benefits are limited by the overhead needed to acquire the necessary information (CSI) It was shown that this trade-off is justified and it results in high throughput gains
In order to achieve 1 Gbps in an indoor scenario we should multiplex as many users as possible with large number of antennas at the BS The maximum allowable number of users depends on the number of pilots that are multiplexed per one chunk The reduction of throughput caused by the increased pilot overhead is compensated for by SDMASMUX or higher order constellation sizes
G3 Downlink multi-user detection
G31 Comparison of receiver structures for SISO MC-CDMA Simulation Assumptions
Simulator Single-link Scenario Short range isolated cell single antenna BS and UT Channel modelling B1 clustered delay line and Independent Rayleigh Interference modelling no spreading type Walsh-Hadamard spreading length 8 MCS 1 4-QAM FEC Convolutional coding (561753)oct with memory 8
Codeword length 3328 bit
The physical layer simulation layout follows the generic WINNER transmitter structure ie the user information bits are encoded using a terminated (561753)oct rate frac12 convolutional code (3GPP) The codebits are randomly interleaved and assigned to complex valued 4-QAM data symbols using Gray mapping These user data symbols are then spread using a 8x8 Walsh-Hadamard spreading matrix which yields the data chips The chips are assigned to the used subcarriers of an OFDM symbol The codeword length ie the frame length of one transmission entity is chosen such that one terminated convolutional codeword finally forms one OFDM symbol This means contemporarily that one OFDM symbol contains exactly one userrsquos data and the user multiplexing is done in time direction ie different OFDM symbols are assigned to different users
Path loss and shadowing effects are not considered within these investigations In addition we assume that the channel is almost constant during one OFDM symbolrsquos period ie inter-carrier interference is negligible
Figure G21 show the bit error rates (BER) and the block error rate (BLER) versus the signal-to-noise ratio (SNR) respectively The SNR is defined as the ratio of the average user signal power and the variance of the complex valued additive white Gaussian noise (AWGN) in each subcarrier Solid lines show the error performances for the WINNER B1 NLOS scenario where the chips of one Walsh-Hadamard spreading entity are distributed over the whole available bandwidth This is achieved by using a subcarrier block interleaver of size 8x208 Due to multiple access interference (MAI) there is a loss of about 23 dB at a BER of 10-4 for single user detection (SUD) using MMSE equalisation compared to the interference free (perfect IC) case where we assume and subtract MAI perfectly To combat MAI at the receiver we use a soft parallel interference canceller (SPIC) as described in the WINNER deliverable D26 [WIND26] The BLER performance of the SPIC with 5 iterations almost reaches the perfect IC bound as it can be seen from Figure G21 right plot For comparison we show results for an independent Rayleigh fading channel which provides maximum (frequency) diversity and the B1 NLOS without subcarrier interleaving Due to an increased MAI the gap between the perfect IC and the SUD performance is even higher compared to B1 NLOS If however we skip the subcarrier interleaver for the B1 NLOS scenario we observe almost no MAI since chips are spread over adjacent subcarriers which due to strong correlation maintain orthogonality of the spreading sequences quite well This results in a negligible difference of SUD and perfect IC error performances In this case we cannot benefit from the more complex SPIC receiver
WINNER D210 v10
Page 154 (180)
0 2 4 6 810-6
10-4
10-2
100
SNR [dB]
BE
R
0 2 4 6 810-3
10-2
10-1
100
SNR [dB]
FER
BLE
R
Figure G21 BER and BLER vs SNR for B1 NLOS and independent Rayleigh fading
G32 Comparison of receiver structures for MIMO MC-CDMA
Simulation Assumptions Simulator link-level Scenario short range MT = 4 MR = 4 Channel modelling B3NLOS WIMI Multiple access MC-CDMATDMA MCS 1 QPSK r=12 FEC punctured turbo coding (1513)oct with memory 4
codeword length fixed size of 6656
A downlink MIMO MC-CDMA system is considered where K users are active in each cell The desired user is located in the central cell The spreading factor (in frequency domain) is G (reducing to OFDM iff G=1) The input data bits are encoded by the single antenna turbo code (TC) or by space-frequency turbo-coded modulation (SFTuCM) which is designed for two transmit antennas We divide the available transmit antennas into independent layers denoted as J=MTJ0 where J0 is the number of antennas associated with the encoder For the single antenna turbo code J0=1 whereas J0=2 in the SFTuCM case A vertical layering structure is applied where the encoded and modulation mapped symbols are multiplexed for J transmit antenna groups By doing so the spatial diversity gain the space-time coding gain (in case of SFTuCM) and spatial multiplexing gain can be achieved simultaneously The MMSE based detectors for the multiple antenna MC-CDMA approach considered herein are relying on the techniques presented in [WIND23 WIND26] In order to achieve better spatial receiver diversity compared to linear receiver the principle of iterative detection and decoding (IDD) can be employed with the considered symbol level SF-MMSE receiver The soft interference cancellation with IDD is considered herein
Figure G22 Performance of layered MIMO MC-CDMA systems
WINNER D210 v10
Page 155 (180)
The simulation performance of the MC-CDMA based downlink with G=K=8 and MR = MT =4 is shown in Figure G22 The scenarios B3 with NLOS clustered delay line model was considered The system with SFTuCM and group-wise layering outperforms the system with turbo-coded system The soft co-antenna interference (CAI) cancellation is shown to possess the ability to further improve the performance Our results indicate that the considered OFDM and MC-CDMA systems are feasible candidates for future cellular high data rate downlink packet transmission For the SFTuCM coded systems the complexity is at the same level as the turbo-coded systems
G4 Uplink multiple access
G41 Performance of single carrier based adaptive TDMA Simulation Assumptions
Simulator Multi-link Scenario Wide area single-cell SISO perfect synch and long-term power control Channel modelling ITU-IV Channel A MCS Uncoded BPSK 4QAM 8PSK 16QAM 32CrossQAM 64QAM
128CrossQAM and 256QAM Uplink spectrum 44 GHz carrier frequency and 25 MHz bandwidth Single-carrier parameters Symbol time 4923 ns Square-root-raised-cosine roll-off factor 0231 Data block size 416 symbols and guard period 256 micros covers most multi-path delay spread Frame size 16 Data blocks (time slots) individually allocated to TDMA users
Performance results for an adaptive TDMA block-based single-carrier uplink are provided This uplink performs multi-user adaptive scheduling to the small scale fading for the individual users and also link adaptation of the scheduled users Thus it is time-adaptive towards the small-scale fading but not frequency-adaptive since it uses single-carrier transmission The aim of the investigation is to show the potential multi-user diversity gains that can be obtained The results are extended simulation results to the work in [WOSS05] where an analytical performance analysis and more details of the design and assumptions behind the investigated uplink can be found The cyclic prefix of each Data block (time slot) is designed to cover most of the multi-path delay spread Thus no inter-Data block ISI is assumed and the FD-DFE [FA02] performs equalisation of the ISI among symbols within each Data block only
0 5 10 15 200
05
1
15
2
25
3
35
4
45
Number of users
Spe
ctra
l Effi
cien
cy [b
itss
Hz]
Analysis 10 dBAnalysis 16 dBAnalysis 19 dBSimulation 10 dBSimulation 16 dBSimulation 19 dB
Figure G23 Multi-user diversity gains for the adaptive TDMA single-carrier uplink
In the simulations results in Figure G23 all users have the same average SNR and the user speed is 50 kmh for all users The scheduler performs max throughput scheduling based on equalised user SNR Perfect estimation and prediction of the impulse responses of each time-slot of each user are assumed Thus the results are upper bounds on the attainable spectral efficiency Note also that Figure G23 does not include overhead related to channel estimation and prediction (approx 15) In addition only the signalling bandwidth is taken into account ie the spectral roll-off (231) is not compensated for As seen there is a multi-user diversity gain for this uplink However compared to the multi-user diversity gains for systems with more narrow bandwidths as investigated in [WOSS05] the gain is smaller The reason for this is the channel averaging caused by the frequency diversity for the wideband channels This
WINNER D210 v10
Page 156 (180)
makes the variability of the instantaneous channels from the individual users to be smaller which in turn limits the obtainable amount of multi-user diversity gain
A fair comparison between the investigated adaptive TDMA single-carrier uplink and an adaptive TDMAOFDMA uplink has to take especially the pilot overhead feedback information rate subcarrier frequency offset and peak-to-average power ratio (PAPR) mitigation into account Preliminary results not shown here indicate that for a 5 MHz wide uplink channel there is at least 3 dB gain for the adaptive TDMAOFDMA uplink with 2 frequency offset of the subcarrier spacing compared to the adaptive TDMA single-carrier uplink and before PAPR mitigation loss Thus an adaptive multi-carrier based TDMAOFDMA uplink seems more promising as an adaptive uplink for the WINNER system concept
G42 Comparison of IFDMA and chunk based OFDMA
Simulation Assumptions Simulator Link level Scenario wide area MT = 1 MR = 1 mobility 70 kmh for all mobiles single user
considerations Channel modelling COST 207 TU Interference modelling no inter-cell interference OFDM parameter Number of used subcarrier = 512 subcarrier distance = 390625 kHz
guard period = 7 micros MCS 1 QPSK r=12 FEC convolutional coding (133171)oct with memory 6
Codeword length fixed size of 1000 bits
The purpose was to investigate the impact of frequency diversity on performance for IFDMA with interleaved subcarrier allocation compared to DFT-precoded OFDMA with block-wise subcarrier allocation As expected for coded transmission over a very frequency selective mobile radio channel as the one assumed IFDMA shows significant better performance compared to DFT-precoded block OFDMA for a number of subcarriers per user Qgt1 This is due to the fact that in IFDMA the subcarriers are equidistantly distributed over the total bandwidth of 20 MHz whereas for DFT-precoded OFDMA only a fraction of the bandwidth is used for transmission For Q=1 ie each user gets only a single subcarrier both schemes exhibits the same performance and cannot exploit frequency diversity
-5 0 5 10 15 20 25
10-3
10-2
10-1
100
SNR [dB]
BE
R
OFDM Q=1OFDM Q=4OFDM Q=16IFDMA Q=1IFDMA Q=4IFDMA Q=16
Figure G24 BER comparison for IFDMA and DFT-precoded block OFDMA for various number of allocated subcarriers per user Q
The SNR gains of IFDMA compared to DFT-precoded block OFDMA at BER=10-3 for an interleaving depth of about 250micros is still 55 dB at a not too low data-rate ie 625 Kbits It is expected that also for transmission using block codes and for the use of the WINNER channel model the same effect can be shown However further studies are required to assess the impact of real channel estimation as well as imperfectly synchronised and power controlled UTrsquos for either case which might reduce the interleaving gain considerably
WINNER D210 v10
Page 157 (180)
G43 Performance of adaptive OFDMA Simulation Assumptions
Simulator Multi-link Scenario Short range isolated cell single antenna BS and UT Channel modelling A1 LOS NLOS B1 LOS NLOS including path loss and shadow fading Cell radius 50 m for A1 150 m for B1 MCS 4 BPSK 4 16 64 QAM generally considered by SNR gap approximation
and SNR gap Γ = 5 dB FEC convolutional coding (561753)oct with memory 8 code rate 12
Codeword length 240 times (number of bits per symbol) not relevant for results User distribution ( ) KkrKkdk 110middot)1()1(91 cell K=minusminus+=
The performance of frequency adaptive OFDMA (subcarrier based and chunk based) is evaluated by multi-link simulations The considered adaptive OFDMA scheme maximises the sum rate of all users under individual transmit power constraints for which an extremely simple and efficient algorithm for adaptive chunk allocation is found to perform well The adaptive scheme is appropriate for the uplink in the short-range case where the channel is quasi-static and CSI is available at the transmitter
We consider the effects of the channel estimation and prediction by a simple Gaussian error model The largest prediction horizon for the TDD mode is L = 1 ms [WIND24] Table 31) In the B1 scenario the fastest users move at an average speed of v = 5 kmh (see Appendix E3) the carrier frequency is fc = 5 GHz which gives a prediction horizon in fractions of wavelength of 020=λ= cvLl This prediction horizon is rather short in comparison to those considered in [WIND24] Section 313 and it is thus expected that the CSI feedback delay has no significant effects for the A1 and B1 scenario The channel predictor estimates the power gain 2
nn hg = Due to channel estimation errors and the inevitable feedback delay the estimation is slightly degraded In the following we consider this effect by the simple model ( )nnn gg η+= 1ˆ where nη is )0( 2
eσΝ distributed and 2eσ denotes the normalised estimation and
prediction error The instantaneous SNR is given by 002 NpgNph nnnnn ==γ and the estimated SNR
is ( )nnnnn Npg η+γ==γ 1ˆˆ 0 For the simulation of the BER for the selected MCS first the SNR nγ is selected and then for each codeword an estimated SNR is generated The final BER is averaged over many codewords
In Table G1 the minimum SNR for a target BER of 4b 10minus=P for each MCS is given The SNR gap Γ
denotes the additional required SNR in comparison to the Shannon limit to reach the same bit rate at the target BER ( ) )12(1log minmin2 minusγ=ΓrArrΓγ+= RR The average SNR gap for 0102 =σe is
dB5asympΓ which will be used in the following to consider the effects of realistic adaptive modulation and coding
Table G1 Minimum SNR for selected modulation scheme
02 =σe 0102 =σe code rate modulation SNR γmin SNR gap Γ SNR γmin SNR gap Γ 05 BPSK 05 dB 43 dB 09 dB 47 dB 1 QPSK 35 dB 35 dB 39 dB 39 dB 2 16-QAM 95 dB 47 dB 99 dB 51 dB 3 64-QAM 146 dB 61 dB 148 dB 63 dB
Adaptation Problem and Key Design Criteria The multiple-access scheme has to adapt to the traffic and the QoS requirements as well as to the channel of multiple users Since joint adaptation to all parameters would result in an impractically complex optimisation problem it seems wise to separate the problem into two adaptation steps
1 Scheduling Adaptation to traffic and QoS requirements like bit rate delay queue length and userserviceflow priorities including ldquofairnessrdquo
2 Adaptation to the channel state ie the channel gain to noise ratio
The priorities of users services or flows as well as the exact definition of fairness will depend mainly on the operatorrsquos adopted strategy and business model The scheduling strategy hence must be flexible and is not only dictated by technical arguments In the following we present an adaptive scheme which adapts
WINNER D210 v10
Page 158 (180)
to the channel only and offers to the scheduler the possibility to operate near the border of the channel capacity region The limits of this region are established in [Yu02] and [Tse98] however no algorithm which is simple enough for practical implementation and achieves all border points of the capacity region is known In [PI05] the scheduling region which is achievable with a relatively simple algorithm and which may yield a good approximation to the true capacity region is outlined
The cell capacity for the uplink can be computed by the iterative water-filling (IWF) algorithm [Yu04] which can be adapted easily to OFDMA [Pfl05 PI05] This algorithm computes the optimum power allocation for all users The rate obtained with this algorithm corresponds to the Shannon capacity which can serve as an upper bound A more realistic rate is obtained by considering an SNR gap of Γ = 5 dB which takes into account the considered link adaptation schemes
Figure G25 depicts the sum rates achieved with the optimum IWF algorithm for all four short-range scenarios with and without considering the SNR gap As was also observed in [PI05] ndash although theoretically optimum ndash sharing the subcarriers does not yield any perceivable capacity gain In other words adding an additional CDMA or TDMA component to OFDMA will only increase the system complexity but not give any capacity gain38
0 10 20 30 40 500
100
200
300
400
500
600
700
num ber of users K
sum
rate
[Mbi
ts]
A1 LOS
sum rate Γ=0dBsum rate Γ=5dBno subchannel sharingsubchannel sharing
0 10 20 30 40 500
100
200
300
400
500
600
700
num ber of users K
sum
rate
[Mbi
ts]
A1 NLOS
0 10 20 30 40 500
100
200
300
400
500
600
num ber of users K
sum
rate
[Mbi
ts]
B1 LOS
0 10 20 30 40 500
50
100
150
200
num ber of users K
sum
rate
[Mbi
ts]
B1 NLOS
Figure G25 Uplink cell capacity for OFDMA with N = 1664 subcarriers and constant user density in the cell The performance loss due to allowing only one user per subcarrier is negligible for all
considered cases
In the TDD mode nsub = 16 subcarriers are grouped into one chunk The application of the IWF algorithm to chunks instead of subcarriers is straightforward and the maximum sum rates achieved with a chunk-based (ie with subcarrier groups) OFDMA scheme is given in Figure G26 Naturally the cell capacity of chunk-based OFDMA is inferior but the system complexity as well as the algorithm run-times are significantly lower For practical implementations the complexity of the IWF algorithm might be an obstacle but fortunately there is a low-complexity alternative The XP algorithm [Ace05] (see also [PI05]) is an extremely simple and efficient method for adaptive subcarrier allocation which attains nearly the same sum rate as the optimum IWF algorithm In Figure G26 the sum rate for a fixed subcarrier allocation is given as a reference The subcarrier allocation for this case is given by
38 Note that this statement holds for the short-range uplink and for the sum rate optimisation criterion This does not
contradict the results obtained in eg [Tri04]
WINNER D210 v10
Page 159 (180)
( ) 11mod +minus= fa Kf where af denotes the user allocated to subcarrier f For each user single-user water-filling is performed on his set of subcarriers to compute the resulting sum rate Surprisingly for the lsquoA1 LOSrsquo scenario this simple non-adaptive subcarrier allocation performs close to the optimum solution and even better than the XP algorithm while for the lsquoB1 LOSrsquo case it comes with a significant capacity penalty
0 10 20 30 40 500
100
200
300
400
500
600
700
num ber of users K
sum
rate
[Mbi
ts]
A1 LOS
0 10 20 30 40 500
100
200
300
400
500
600
700
num ber of users K
sum
rate
[Mbi
ts]
A1 NLOS
0 10 20 30 40 500
100
200
300
400
500
600
num ber of users K
sum
rate
[Mbi
ts]
B1 LOS
0 10 20 30 40 500
50
100
150
200
num ber of users K
sum
rate
[Mbi
ts]
B1 NLOS
IWFXPFixed allocation
Figure G26 Sum rate achieved with chunk-based OFDMA (Γ=5 dB) The optimum IWF (iterative water-filling) algorithm achieves the highest rate while the rate achieved with the low-complexity
XP algorithm [Ace05] is only slightly lower
Conclusions The considered adaptive OFDMA scheme maximises the sum rate of all users under individual transmit power constraints It is appropriate for the uplink in the short-range case where the channel is quasi-static and CSI is available at the transmitter The achievable gain is rather low compared to non-adaptive subcarrier allocation if LOS conditions prevail However in NLOS conditions with sufficient frequency-selectivity considerable performance improvements can be obtained
The considered optimisation criterion consciously excludes fairness issues since different notions of fairness exist and these may depend on the operatorsrsquo preferences ldquoFairnessrdquo and other QoS-related constraints can be included by a traffic-aware scheduler which selects for each Frame the appropriate subset of active users
The simulation results show the achievable sum rate per cell or sector in the uplink when both terminal and base station have one antenna The sum rates for an SNR gap of Γ = 0 dB are strict upper bounds while the rates for Γ = 5 dB consider the effect of realistic modulation and coding schemes
G44 Comparison of adaptive OFDMA and OFDM-TDMA
Simulation Assumptions Simulator Multi-link 8 Frames per snapshot 6000 snapshots Scenario Short range isolated cell single antenna BS and UT no power control Channel modelling A1 LOS and NLOS clustered delay line model Cell radius 100 m and 200 m MCS 5 BPSK r=13 BPSK r=23 QPSK r=23 16-QAM r=23 64-QAM
WINNER D210 v10
Page 160 (180)
r=89 FEC Punctured convolutional coding (133171145)oct with memory 6
codeword length variable ndash one codeword always fills one chunk (OFDMA) or one symbol (TDMA)
Type of feedback Average SINR per chunk (OFDMA) or symbol (OFDM-TDMA) Feedback delay 1 Frame Overhead Chunkrsquos overhead 175 tail of CC duplex time Mobile speed anglev sim U(02π) vx sim η(mσ 2) vy sim η(mσ 2) |v|= (vx
2+vy2)05
m = 1 kmh σ = 16 kmh
The performance of OFDMA and TDMA is assessed for the uplink considering several scheduling variants Common to all these variants is a two step approach in the first step a decision is taken which 8 users (out of 40 or 80 users) will be served and in the second step it is decided how many and what resources are assigned to the selected users
In case of Round Robin (RR) both users and resources are sequentially selected and linked With the MaxSNR1 approach the 8 users with the highest SNR are selected in the first step Then equal amount of resources are allocated to these users in a round robin manner With MaxSNR2 users are selected via round robin but the resource allocation is performed according to the maximum rate sharing principle Step one is the same for the fair rate (FR) scheduler but in step two each user gets a fraction of the resources which is inversely proportional to the userrsquos transmission rate In the second version (FR2) the resource assignment decision is made to maximise the overall frame throughput
Note that very simple link adaptation based on the average SNR was applied using reference curves from AWGN link level simulations Since such a model is suboptimum for TDMA (where the codeword suffers from frequency-selectivity) the comparison of both MA schemes is to a certain extent unfair
Independent encoding of each chunk with tail as considered in case of OFDMA increases the overhead and causes the overall throughput to decrease This factor is more significant for low quality channels (large distances between the UT and BS) when low order modulations and strong coding schemes are applied The measured loss with Round Robin scheduling is about 37 for 100 meter cells and about 69 for 200 meter cells on average however users at the cell edge experience a throughput loss higher than 7 and 11 respectively
The calculated average cell throughput obtained with RR scheduling for 100 meter cell radius and 40 users is equal to 7138 Mbps for OFDMA and 7335 for TDMA The MaxSNR1 scheduling algorithm adaptively selects the users to be served and thus offers an increase of the overall cell throughput to 14784 Mbps and 15315 Mbps respectively It should be stressed that similar results are obtained for both OFDMA and TDMA since no fully adaptive scheduling has been applied one part of the chain ie either user selection or resource assignment is always based on round robin For the MaxSNR2 algorithm the average cell throughput is about 7 Mbps lower than for MaxSNR1 and for Fair Rate scheduling the average cell throughput for OFDMA is equal to 4667 Mbps only Scheduling of users on the equal time sharing base (RR MaxSNR2 FR) slightly decreases the overall cell throughput for higher number of allocated users (by about 02 - 04 for 80 allocated users) Increase of the cell radius from 100 m to 200 m decreases the average cellrsquos throughput by about 50 for RR 19 for MaxSNR1 17 for MaxSNR2 and 68 for FR scheduling
0
5
10
15
20
25
0 20 40 60 80 100 120 140 160 180 200
distance [m]
Ave
rage
use
rs th
roug
hput
[Mbp
s]
RR TDMARR FDMAMaxSNR1 FDMAMaxSNR1 TDMAFR1 FDMAFR2 FDMA
0
20
40
60
80
100
120
140
160
0 20 40 60 80 100 120 140 160 180 200
distance [m]
Ave
rage
use
rs th
roug
hput
[Mbp
s]
MaxSNR2 FDMAMaxSNR2 TDMAMaxSNR1 FDMAMaxSNR1 TDMA
Figure G27 Average userrsquos throughput vs distance for different scheduling variants considering 40 users throughput figures are averaged across served users only
WINNER D210 v10
Page 161 (180)
Simulation results showing the average user throughput versus distance with the different scheduling algorithms discussed are shown in Figure G27 The average user throughput obtained with FR (left plot) drops very slightly with distance (in contrast to RR) however the price to be paid is its lower overall throughput Application of the FR2 increases the overall throughput only slightly compared to FR In case of MaxSNR1 the average throughput drops for the middle range users but compared to fair rate scheduling a much higher user throughput is achieved As depicted in the right plot of Figure G27 MaxSNR2 scheduling achieves dramatically higher throughput values for users located close to the base station than MaxSNR1 albeit at the expense of serving some users not at all (mainly those far away from the BS)
Results presented to far reveal the large impact of scheduling algorithms on cell throughput and fairness The two step scheduling approach considered here enables a trade-off between both aspects Further refinement is required to be able to exploit the multi-user-diversity potential of chunk based OFDMA and compare the results to the well known class of proportional fair scheduling algorithms
G5 Uplink spatial processing
G51 Performance of spatial diversity Simulation Assumptions
Simulator System 19 three-sector sites full interference modelling using wrap-around Scenario cellular on average 10 userssector frequency reuse 1
MT = 1 MR le 8 varying cell radius Channel model C2 NLOS WINNER interim channel model (WIMI) MCS Modulation schemes QPSK 16QAM and 64QAM
Channel code rates 110 13 12 23 34 and 89
FEC
Turbo code combined with Layer 1 code block segmentation (up to 5114 bits per block) and rate matching codeword length from 998 (QPSK rate 110) to 26624 bits (64QAM rate 89) rate 17 mother code (polynomials feedback 013 feedforward 015 017 011)
FeedbackOverhead Chunk SINR after receiver processing zero delay no overhead
A non-frequency adaptive uplink based on OFDM is considered The performance of the uplink access method is evaluated using different number of base station antennas in order to demonstrate the importance of antenna diversity Performance is compared for different cell sizes and in terms of average sector throughput and active radio link data rates The latter measure is the (average) user throughput when scheduled for transmission Since round robin TDMA scheduling is applied the active radio link data rate may be used to assess the fairness in the network Furthermore because many idealised assumptions are made one should not focus on the absolute performance figures but rather on the relative performance
Figure G28 shows the average uplink throughput for different number of base station antennas and for different diversity combining schemes namely MRC and IRC The antenna element spacing at the base station is half a wavelength (left) and four wavelengths (right) With tightly spaced antennas the gain of multiple antennas at the base station and MRC is in the order of 35ndash50 80ndash110 and 130-220 for two four and eight antennas respectively IRC which performs inter-cell interference suppression provides an additional gain of up to 10 20 and 25 With a wider antenna separation the diversity gain is enhanced even further and in particular the gain of IRC over MRC is more evident In interference-limited deployments the performance with four antennas and IRC is comparable to the performance with eight antennas and MRC
The lower plots depict uplink data rate distributions in a deployment in which cells have a radius of 700 m The distributions indicate that in order to provide high uplink data rates to a large fraction of the user population multiple base stations receive antennas are a very useful means
In summary base station receive diversity may significantly improve the uplink performance Such solutions increase total throughput and enhances data rates for all users Performance improves as expected with larger antenna separation and the results further indicate that IRC with a lower number of antennas may give similar performance as MRC with a larger number of antennas It should be kept in mind however that the inter-cell interference suppression gains of IRC relative to MRC may be smaller when estimation errors are considered
WINNER D210 v10
Page 162 (180)
100 m 1 km 10 km0
20
40
60
80
cell radius
aver
age
sect
or th
roug
hput
[Mbi
ts]
IRC (05 λ)MRC (05 λ)
0 20 40 60 800
010203040506070809
1
prob
(use
r thr
ough
put lt
abs
ciss
a)
active radio link rate [Mbits]
100 m 1 km 10 km0
20
40
60
80
active radio link rate [Mbits]
aver
age
sect
or th
roug
hput
[Mbi
ts]
IRC (4 λ)MRC (4 λ)
0 20 40 60 800
010203040506070809
1
prob
(use
r thr
ough
put lt
abs
ciss
a)
active radio link rate [Mbits]
Figure G28 Average uplink throughput and active radio link distributions for different number of base station receive antennas combining schemes and antenna element separations
G52 Linear precoding concepts with long term channel state information In the wide-area scenario the instantaneous CSI is not available at the transmitters due to the high mobility Therefore linear precoding is performed at the mobiles based on long-term CSI Long-term CSI are either the channel mean components (first moment of the channels ndash mean feedback) or the channel correlation matrices (second moment of the channels ndash covariance feedback) In general there are two ways to obtain long-term CSI implicit or explicit feedback
In TDD mode under the reciprocity assumption the downlink channel estimation can be reused for uplink transmission After estimation of the channel during downlink transmission the instantaneous channel at time t+τ that is seen by the mobile is modelled by the sum of the estimated channel matrix and a noise matrix This channel can be interpreted as an MIMO channel with effective LOS component The K factor corresponds to the quality of the channel estimate In the explicit form of mean-feedback the base station performs channel estimation averages over many blocks and transmits the mean matrix back over a control channel
In FDD mode the receiver estimates the correlation matrix on the set of carriers used for downlink transmission [BM04] There are two key issues regarding the efficiency of estimating the covariance matrix in this way The covariance must vary slowly enough ie the estimate is still valid when the base station is sending to user k There must be enough carriers in the set to well approximate the actual covariance matrix The explicit covariance feedback scenario is similar to the explicit mean feedback scenario discussed before The base collects the necessary channel statistics and feeds back the channel covariance matrix to the mobiles
Let assume the multi-user linear MMSE multi-user receiver is used at the base station Then the performance criterion is the average total sum MSE [JB03] The corresponding programming problem is given by minimizing the total sum MSE under individual power constraints Beamforming of user k on carrier n with the eigenvectors of the transmit covariance matrix power allocation of user k on carrier n with the eigenvalues of the transmit covariance matrix and resource allocation is described by the individual MSE of user k on carrier n
WINNER D210 v10
Page 163 (180)
If implicit feedback is used then the optimal beamforming directions of all users correspond to the eigenvectors of the effective LOS-component for mean feedback or the eigenvectors of the channel transmit correlation matrix for covariance feedback The resulting power allocation problem is characterised by the range in which a single-beam per user achieves the sum performance For sum capacity the analysis was performed in [SU05] The theoretical results and the corresponding SCME channel model results are shown in Figure G29
0 05 1 15 20
02
04
06
08
1
12
P λ11
P λ 1
2
MIMO 2x2
K=1K=2K=3K=4K=10
micmac
-2 -1 0 1 205
1
15
2
25
P λ1
ε
MIMO 2x2
K=1K=2K=3K=5K=10
Beamforming NOT optimal
Beamformingoptimal
Beamformingoptimal
Umi Uma Sma
Figure G29 Beamforming optimality range for covariance and mean feedback in theory and
WINNER SCME channel models (micro urban [umi] macro urban [uma] and macro suburban [sma])
Here P is the total transmit power M is the largest mean component λ11 and λ12 are the largest and second largest eigenvalue of the transmit correlation matrix of user one The term ε represents the beamforming condition function ie if ε gt 1 then beamforming is optimal Observe that for two transmit and two receive antennas single stream beamforming is optimal for two and more users Other antenna configurations are to be analyzed
G6 Uplink multi-user detection
G61 Comparison of receiver structures for DS-CDMA
Simulation Assumptions Simulator Multi-link Scenario wide area cellular frequency reuse 1 single antenna BS and UT average
(slow) power control Channel modelling C2 NLOS WIMI Interference modelling Interference generated by neighbour cells active users (6 cells surrounding
the cell of interest) Assume same number of active users in all cells MCS 1 BPSK FEC convolutional coding (561753)oct with memory 8 code rate 12
Codeword length 702 bits spreading Walsh-Hadamard spreading length 16 Cyclic Prefix length 52 chips (block oriented transmission) Overhead Total overhead of 23 taken into account in TX-power and resources Mobile speed 50 1 kmh 50 25 kmh User spatial distribution
( ) KkrKkdk 110middot)1()1(91 cell K=minusminus+=
The focus has been placed on evaluating performance of various reduced complexity receivers for the uplink in the wide area non-frequency adaptive WINNER mode for single carrier DS-CDMA where the multi-carrier approach could encounter important challenges Two transmission schemes are compared a time domain processing receiver based on conventional RAKE receiver and a frequency domain processing receiver that makes use of cyclic prefix (CP) In both cases several iterative implementations of the multi-user detector are investigated Motivated by complexity constraints the focus is on linear multi-user detectors The complexity of the MMSE receiver is dominated by the calculation of the MMSE filter which requires a large matrix inversion Rather than direct matrix inversion we use iterative methods for solution of linear systems concentrating on the Successive Over-relaxation (SOR) method associated with serial interference cancellation and the Chebyshev method associated with parallel
WINNER D210 v10
Page 164 (180)
interference cancellation The details and formulation of multi-user receiver in either domain and the proposed reduced complexity methods for the implementation of a linear multi-user receiver can be found in [IN05][WIND26]
-4 -2 0 2 4 6 810
-4
10-3
10-2
10-1
100
EbN0 (dB)
Bit
Erro
r Rat
e
MF(no intercell interf)MMSE(no intercell interf)MMSE-SOR 6 iter(no intercell interf)MMSE(intercell interf)MMSE-SOR 6 iter(intercell interf)
Figure G30 BER performance of a low complexity frequency domain MMSE receiver in presence
of inter-cell interference
Based on link level simulations results in terms on convergence and performance for single cell scenario where results showed that convergence of the iterative implementation of the TD receiver is substantially slower than for the FD receiver being in both cases faster for the SOR iterative implementation of the MMSE filter than for the first order Chebyshev iterative implementation we focus on the FD receiver and SOR implementation of the MMSE detector for the multi-cell multi-link evaluation Shown in Figure G30 is the coded BER performance of FD receiver in presence of inter-cell interference compare to no inter-cell interference for a 50 loaded system where the performance for the iterative implementation of the MMSE detector is shown for 6 iterations Similar results have been obtained for other system loads
To conclude it is feasible to achieve MMSE performance with a reduced complexity implementation with only a few iterations required Yet the single carrier DS-CDMA approach will require a multi-user detector
G62 Comparison of receiver structures for MIMO single carrier
Simulation Assumptions Simulator multi-link Scenario wide area isolated cell MT = 2 4 MR = 4 1ndash4 users Channel modelling C2 NLOSWIMI Interference modelling no inter-cell interference Multiple access TDMASDMA MCS 1 QPSK r=12 (SM-MIMO with turbo coding)
1 BPSK r=13 (ST-WNRA) FEC punctured turbo coding (1513)oct with memory 4
space-time weighted non-binary repeat accumulate coding codeword length fixed size of 1664 bits
Serial modulation for wide area uplink was investigated for the case of single-input-single-output (SISO) transmission with non iterative and iterative frequency domain receivers in [WIND21 WIND23] In order to further enhance uplink performance link-adaptation and MIMO techniques are the focus of further study In this section only MIMO techniques are considered further information about different link adaptation techniques can be found in [WIND23] By using at least one of these key technologies bandwidth efficiency can be enhanced and transmission power of terminal can be reduced As a result of this improved uplink performance turns into larger coverage and higher data rates The goal of this section is to introduce two MIMO techniques for wide area uplink with serially modulated multipointpoint to point transmission Channel state information is not required at the transmitter and iterative frequency domain processing is performed at the receiver
WINNER D210 v10
Page 165 (180)
Figure G31 Transmitter block diagram of space-time weighted nonbinary repeat accumulate (ST-WNRA) coded multipointpoint-to-point MIMO for serially modulated MIMO transmission
Figure G31 illustrates the transmitter block diagram of ST-WNRA coded MIMO The ST-WNRA encoder consists of two main parts a repeater and the concatenation of a weighter and an accumulator The function of the repeater is to provide coding gain and the concatenation of the weighter and accumulator is to provide full rank over the whole encoded data Therefore ST-WNRA codes can provide full transmit antenna diversity for any number of transmitter antennas in single user flat fading channels with low encoding and decoding complexity The full transmit antenna diversity can be only obtained by using BPSK as underlying modulation method because the full rank property is only retained in the binary field The interested reader is referred to [OY03] for more in-depth information about ST-WNRA codes The maximum achievable diversity order with ST-WNRA codes using the proposed iterative frequency domain reception is given as MT times L times MR where MT L and MR are the number transmit antennas the number of multi-paths and the number of receiver antennas respectively Since ST-WNRA is a pure diversity based MIMO technique the maximum transmission rate is constrained to one However the transmission rate can be enhanced by using a multilevel approach that is briefly described in the next subsection Finally it should be noticed that ST-WNRA codes are more flexible compared to other space-time codes that provide both coding and diversity gain eg space-time trellis and space-time turbo codes Flexibility is an important factor when capability to support for any number of transmitter antennas and short frame lengths is required
Figure G32 Transmitter block diagram of spatially multiplexed vertically encoded multipointpoint-to-point MIMO for serially modulated transmission
Figure G32 presents the transmitter block diagram for the well-known vertically encoded spatially multiplexed MIMO transmission In this scheme the input bit stream undergoes temporal encoding modulation and interleaving after it is demultiplexed into NT streams transmitted for individual antennas Obviously the purpose of this technique is just to maximise multiplexing gain Therefore the maximum achievable diversity order by using convolutionalturbo codes and with the proposed iterative frequency domain reception is given as L times MR Further details of this scheme can be found from [SD01]
The parameters used in the simulations are as follows for ST-WNRA multi-user MIMO the channel is typical urban C2 2 transmit antennas per user 4 receive antennas repetition rate 3 3 decoder iterations 4 equaliser iterations the number of users ranges from 1 to 4 Iterative frequency domain joint-over-antenna multi-user MIMO receiver is used For spatially multiplexed turbo-coded multi-user MIMO the parameters are the same except for the code rate being frac12 (generator polynomials (1513)) QPSK modulation
Figure G33 presents the simulation results of ST-WNRA and spatially multiplexed vertically turbo-coded multi-user MIMO ST-WNRA outperforms spatially multiplexed vertically coded MIMO However the maximum spectral efficiency in the case of ST-WNRA is 266 bitHzs whereas with spatially multiplexed case it is 8 bitHzs The results also show that with joint-over-antenna signal detection technique the same diversity order is maintained for each of the users Only a parallel shift is observed when the number of users is increased This is due to fact that joint-over-antenna technique can preserve the degrees of freedom for the joint-detection of interference and the signal of interest
Encoder πB
Modulator πS
SP
GI
GI
D
Symbol toBPSK
Mapper
Repeater
Weighter π πIGI
GI
ST-WNRA
SP
WINNER D210 v10
Page 166 (180)
BLE
R
Figure G33 BLER performance vs SNR of serially modulated multi-user MIMO transmission in typical urban C2 Scenario (each user has 2 transmitter antennas and base station has 4 receiver
antennas number of users U = 1234)
G7 Other topics
G71 OFDM versus single carrier based uplinks
Simulation Assumptions Simulator System 19 three-sector sites full interference modelling using wrap-around Scenario cellular on average 10 userssector frequency reuse 1
MT = 1 MR = 4 varying cell radius Channel model C2 NLOS WINNER interim channel model (WIMI) MCS Modulation schemes QPSK 16-QAM and 64-QAM
Channel code rates 110 13 12 23 34 and 89
FEC
Turbo code combined with Layer 1 code block segmentation (up to 5114 bits per block) and rate matching codeword length from 998 (QPSK rate 110) to 26624 bits (64QAM rate 89) rate 17 mother code (polynomials feedback 013 feedforward 015 017 011)
FeedbackOverhead Chunk SINR after receiver processing zero delay no overhead
A non-frequency adaptive uplink based on OFDM or single-carrier transmission is considered The impact of the high PAPR of the OFDM signal is coarsely modelled by introducing a power backoff factor that reduces the maximum terminal output power In case single-carrier transmission is considered a linear MMSE frequency domain equaliser (FDE) is assumed to be used in the base station receiver Performance is compared for different cell sizes and in terms of average sector throughput and active radio link data rates The active radio link data rate is the (average) user throughput when scheduled for transmission Since round robin TDMA scheduling is applied the active radio link rate may be used to assess the fairness in the network Because many idealised assumptions are made one should not focus on the absolute performance figures but rather on the relative performance
Investigations of single-carrier and multi-carrier modulation techniques in Appendix B indicate that the PAPR of an OFDM signal and the required power backoff is typically 2ndash3 dB higher than that of a single-carrier signal To capture the high PAPR of the OFDM signal OFDM transmission is in here modelled with a power backoff (pbo) of 2 dB As a reference case OFDM transmission without any power backoff (0 dB) is studied as well In the left part of Figure G34 the performance of an uplink access scheme using OFDM transmission is compared to a single-carrier transmission scheme in terms of average sector throughput Base stations are equipped with four antennas separated four wavelengths and IRC is used to suppress inter-cell interference The results indicate that in interference limited scenarios
WINNER D210 v10
Page 167 (180)
ie for small cells OFDM has a small performance advantage thanks to the absence of inter-symbol interference Note further that in such interference limited deployments the OFDM power backoff is of limited importance In large cell deployments in which noise rather than interference limits performance single-carrier transmission provides better performance thanks to the higher output power (compared to OFDM with a 2 dB power backoff) The right plot shows data rate distributions for cell radius 700 m The plot indicates that compared to OFDM with a 2 dB power backoff single-carrier transmission provides a small but uniform increase of data rates
100 m 1 km 10 km0
10
20
30
40
50
60
cell radius
aver
age
sect
or th
roug
hput
[Mbi
ts]
OFDM pbo = 0 dBOFDM pbo = 2 dBSC MMSE FDE
0 20 40 60 800
010203040506070809
1
prob
(use
r thr
ough
put lt
abs
ciss
a)
active radio link rate [Mbits]
OFDM pbo = 0 dBOFDM pbo = 2 dBSC MMSE FDE
Figure G34 Average sector throughput for OFDM and single-carrier transmission (left) and an example of the corresponding data rate distributions (right) The distributions are depicted for cell
size 700 m
In summary the results show that if accounting for the high PAPR of the OFDM signal here by introducing an OFDM power backoff penalty of 2 dB OFDM has a small performance advantage in interference limited scenarios while the single-carrier transmission scheme using a linear MMSE frequency domain equaliser at the receiver provides better performance in noise limited deployments
G72 Performance of low rate channel coding for one-cell frequency reuse
Simulation Assumptions Link level Inter-cell interference is modelled by Gaussian noise
Simulator System level 19 cells 3 sectorscell full inter-cell interference modelling using wrap-around
Scenario Wide area cellular frequency reuse 1 single antenna BS and UT Channel model Metropolitan channel model defined in D53 Mobile speed 4 kmh for all users Channel coding Turbo code ARQ Chase combining Maximum number of retransmissions M = 0 1 3 Scheduling (for system level) Proportional fair scheduling 4 userssector Full buffer model Channel estimation Real (Weighted subcarrier coherent averaging)
First using the link level simulation optimum minimum coding rate of a very-low-rate Turbo coding and spreading factor value that achieves one-cell frequency reuse in a multi-cell environment in the downlink OFDM is investigated The required average signal-to-interference plus noise power ratio (SINR) to satisfy an average packetblock error rate (BLER) of 10-2 is plotted in Figure G35 (left) as a function of the reciprocal of the coding rate 1R
In the figure QPSK modulation is employed and Q denotes the spreading factor As shown in the figure the required average SINR is reduced with increasing ratio QR which indicates that the suppression of severe inter-cell interference from the surrounding cells is in principle possible however at the expense of throughput Moreover under the same QR conditions the required average SINR is reduced with decreasing code rate R up to approximately 16 to 18 Therefore we see that the minimum coding rate providing a distinct channel coding gain is approximately R = 16 to 18 Figure G35 (right) shows the required SINR for the average residual BLER of 10-3 as a function of the product of 1R and Q Assuming real-time traffic with a rigid delay requirement we take into account hybrid ARQ with Chase combining
WINNER D210 v10
Page 168 (180)
Req
uire
d av
erag
e re
ceiv
ed S
INR
for a
vera
ge B
LER
= 1
0-2 [d
B]
-20
-15
-10
-5
0
5
10
M = 0M = 1M = 3
Req
uire
d av
erag
e (in
stan
tene
ous)
rece
ived
SIN
R
for a
vera
ge re
sidu
al P
ER =
10-3
(dB
)
Spreading factor Q1
Channel coding rate R12 14 18
2 4 8 16 32 64 128
1
5
Instantaneous
Average
1
5
-20
-15
-10
-5
0
5
10
M = 0M = 1M = 3
Req
uire
d av
erag
e (in
stan
tene
ous)
rece
ived
SIN
R
for a
vera
ge re
sidu
al P
ER =
10-3
(dB
)
Spreading factor Q1
Channel coding rate R12 14 18
2 4 8 16 32 64 128
1
5
Instantaneous
Average
1
5
for a
vera
ge re
sidu
al B
LER
= 1
0-3 [d
B]
Req
uire
d av
erag
ein
stan
tane
ous r
ecei
ved
SIN
R
Figure G35 Optimum minimum channel coding rate (left) and required coding rate and spreading factor for achieving one-cell frequency reuse (right)
Furthermore we assumed two extremely different packet call times a very long call time where the received SINR is approximated by the average SINR (denoted as Average) and a very short call time during one packet frame duration where the received SINR is approximated by the instantaneous SINR (denoted as Instantaneous) In the figure the dotted lines indicate the SINR values corresponding to the 1 and 5-point of CDF of the SINR ie cell-edge conditions in a multi-cell environment On the horizontal axis we first decrease the coding rate from R = 12 to 18 maintaining Q = 1 Next in order to achieve QR gt 8 we further increase the Q value with a fixed R = 18 As shown in the figure according to the increase in the QR value the required SINR value is significantly improved This is due to the effect of the improved processing gain associated with channel coding and spreading Furthermore assuming the same QR value on the horizontal axis increasing M brings about a reduction in the required average SINR since the time diversity gain from the hybrid ARQ improves the received SINR of a packet From the figure in order to satisfy the SINR value at the 1 and 5-point of CDF the required coding rate and the spreading factor becomes (R Q) = (18 8 - 16) (18 4 - 8) and (18 2 - 4) for M = 0 1 and 3 in the case of average SINR and (18 8 - 32) (18 4 - 16) and (18 2 - 8) for M = 0 1 and 3 in the case of instantaneous SINR Consequently we conclude that the spreading is inevitable to achieve one-cell frequency reuse together with the low-rate channel coding such as R = 18
MCS sets with low-rate channel coding and spreading MCS sets without low-rate channel coding and spreading MCS sets with low-rate channel coding and spreading MCS sets without low-rate channel coding and spreading
0
02
04
06
08
1
0 5 106 1 107 15 107 2 107
Cum
ulat
ive
dist
ribut
ion
User throughput (bps)
Without hybrid ARQ
0
02
04
06
08
1
0 5 106 1 107 15 107 2 107
Cum
ulat
ive
dist
ribut
ion
User throughput (bps)
0
02
04
06
08
1
0 5 106 1 107 15 107 2 107
Cum
ulat
ive
distr
ibut
ion
User throughput (bps)
With hybrid ARQ(Max retransmissions M = 1)
With hybrid ARQ(Max retransmissions M = 3)
0
02
04
06
08
1
0 5 106 1 107 15 107 2 107
Cum
ulat
ive
distr
ibut
ion
User throughput (bps)
Without hybrid ARQ
0
02
04
06
08
1
0 5 106 1 107 15 107 2 107
Cum
ulat
ive
dist
ribut
ion
User throughput (bps)
0
02
04
06
08
1
0 5 106 1 107 15 107 2 107
Cum
ulat
ive
distr
ibut
ion
User throughput (bps)
With hybrid ARQ(Max retransmissions M = 1)
With hybrid ARQ(Max retransmissions M = 3)
Figure G36 Effect of low rate channel coding and required channel coding rate and spreading on user throughput in a multi-cell environment
Next the effect of low rate channel coding together with spreading is evaluated in a multi-cellular environment using system level simulations In the simulations two sets of modulation and coding schemes (MCS) are used one with and one without spreading The first set comprises QPSK with code rate and spreading factor (R Q) = (18 16) (18 8) (18 4) (18 2) (18 1) (14 1) (12 1) (23 1) as
WINNER D210 v10
Page 169 (180)
well as 16-QAM with (R Q) = (12 1) (23 1) and (34 1) The second set includes QPSK with code rate R=12 and 23 as well as 16-QAM with rate R= frac12 23 and frac34
As shown in Figure G36 the user throughput performance is improved by employing the MCS set with low-rate channel coding and spreading compared to those without low-rate channel coding and spreading For example the MCS set with low-rate channel coding and spreading maintains approximately 600 kbps and 750 kbps user throughput at 5 and 10-point of CDF respectively In case of hybrid ARQ with more than one retransmission however the benefit of low rate channel coding and spreading is negligible
G73 Comparison of FDMA and TDMA based resource partitioning among BS
Simulation Assumptions Simulator Link level Scenario wide area cellular frequency reuse 7 single antenna BS and UT Channel modelling WSSUS Rayleigh fading with exponential power delay profile
Okumara-Hata path loss model Interference modelling AWGN Cell radius Up to 2 km OFDM parameter 512 used subcarriers subcarrier distance 390625 kHz guard period 64 micros MCS QPSK FEC no coding Mobile speed 30 kmh same for all mobiles - results in almost perfect link adaptation
In a wide area OFDM cellular systems even with perfect inter-cell time synchronisation time offsets between users in different cells due to propagation delays induce significant inter-cell interference This appears in form of inter-carrieradjacent band interference if different cells are assigned adjacent portions of the available bandwidth eg in a block-FDMA fashion and in form of inter-symbol interference if different cells are assigned the whole transmission bandwidth in successive periods of time eg slot-TDMA In order to avoidreduce such interference guard bands and guard periods can be introduced in FDMA and in TDMA respectively The aim of this analysis is that of deriving which of the two approaches is the most spectrally efficient under currently envisaged system parameters and requirements
In a first step the performance degradation due to time offsets in block FDMA inter-cell allocation with and without guard bands is evaluated A worst case scenario is considered in which there are only two cells and two users which are assigned interleaved blocks of adjacent subcarriers Moreover equal receive power and time offsets up to frac12 OFDM symbol are assumed Results are reported in Figure G37 left plot in terms of uncoded BER (rawBER) for blocks of 8 and 64 subcarriers at different values of time offsets ranging from 5 micros to 16micros (cell radius of 15 and 48 km respectively) It can be inferred that there is high performance degradation when the time offset is equal to or higher than the guard interval For some time offsets the rawBER curve saturates before 10-2 As it is reasonably expected significantly better performance is obtained with larger block size because the effect of inter-carrier interference is larger at the block border Hence for smaller blocks almost all subcarriers might be interfered
A better overview is offered by Figure G37 left plot which compares the dependency of the SNR degradation on the different values of time offsets The SNR degradation has been computed at a rawBER of 10-177 corresponding to coded BER of 10-3 which represents the considered QoS criterion for VoIP The SNR degradation for the block size of 8 subcarriers is visibly much higher than for blocks of 64 subcarriers At a time offset of 6 micros we have a loss in power efficiency of 12 dB39 Figure G37 right plot shows the comparison of SNR degradation with and without guard bands The introduction of guard sub-bands leads to a significant improvement For time offsets larger than 5micros in particular the SNR degradation saturates
To compare the spectral efficiency of the two inter-cell allocation schemes the power efficiency loss in the block-FDMA case has to be translated into a figure of spectral efficiency loss Given the not too high values involved we can resort to a simple rule of thumb derived from 2G and 3G experience according to which a 45 dB loss in power efficiency corresponds to 50 spectral efficiency loss In Table G2 results
39 Note that for block size of 8 sub-carriers the SNR degradation curve has not been plotted for time offset values larger than 6 micros since the rawBER curve saturates before reaching the value corresponding to the required QoS
WINNER D210 v10
Page 170 (180)
in terms of power and spectral efficiency loss are reported for block-FDMA with blocks of 64 subcarriers for cell radius of 2 km and reuse factor 7 with and without guard bands of 8 subcarriers
0 5 10 15 20 25 30
10-3
10-2
10-1
100
SNR [dB]
raw
BE
R
Block of 8 and 64 subcarriers QAM4
8-Sc t shift 08-Sc t shift 100 = 5us8-Sc t shift 120 = 6us8-Sc t shift 320 = 16us64-Sc t shift 064-Sc t shift 100 = 5us64-Sc t shift 120 = 6us64-Sc t shift 320 = 16us
0 5 10 15 20 25 30-2
0
2
4
6
8
time offset [micros]
SN
R d
egra
datio
n [d
B]
Block of 64 8 guard ScBlock of 64 no guard ScBlock of 8 no guard Sc
Figure G37 left plot raw BER for different sizes of block of subcarriers and different values of time offsets right plot Dependency of SNR degradation on time offset for block of 8 subcarriers
and for block of 64 subcarriers with and without guard band
In slot-TDMA the insertion of guard periods between any pair of time-slots assigned to different cells represents an overhead which induces spectral efficiency loss and can be computed as follows The total time consumed as guard time is given by the number of time slots multiplied by the length of the guard period that is at least equal to the maximum time offset For TDD and HD-FDD the number of time slots assigned to different cells is 2 times the reuse factor The maximum time offset to be taken into account depends on the considered scenario For example with reuse factor 16 in a macro-cellular deployment scenario with antennas above rooftop the link of interest can be affected by interference from the second ring of interfering cells which implies a propagation delay corresponding to four times the cell radius The resulting overhead is then given by the ratio between the total guard time and the frame duration Results are reported in Table G3 for different reuse factors
Table G2 Power and spectral efficiency loss for block-FDMA with blocks of 64 subcarriers with reuse factor 7 with and without guard bands of 8 subcarriers
Reuse Factor Additional Guard Bands Overhead []
Power Efficiency Loss [dB]
Spectral Efficiency Loss []
Total Loss []
7 0 628 698 698 7 125 180 201 326
Table G3 Overhead due to guard periods in slot-TDMA with reuse factor 5 and 7
Reuse Factor Frame Length [ms]
Number of Time Slots
Total Guard Time [micros]
Overhead []
5 07 10 133 19 7 07 14 186 gt100
From simulation results it can be derived that it would be recommended to assign blocks of at least 64 adjacent subcarriers to different cells in order to keep the performance degradation to a reasonable level (up to 1 dB) For a reuse factor 7 and cell radius of 2 km the spectral efficiency would be doubled through the insertion of guard bands of eight subcarriers Moreover it has been explained how the use of the slot-TDMA inter-cell allocation approach is restricted by the assumption of very short frame length For the currently assumed frame length of 07 ms the overhead due to the insertion of guard periods could result to be unacceptable (larger than 100 for reuse factor 7) Since the overhead depends on the number of slots which is determined by the reuse factor a reuse factor up to 6 would be acceptable while for reuse factors larger or equal to 7 it would be preferable to use block-FDMA
We note that although the results of this section have been derived under the assumption of reuse factor larger than 1 they remain valid in case of single-frequency network with interference-avoidance-based
WINNER D210 v10
Page 171 (180)
dynamic resource management Indeed in the latter case a reuse factor is implicitly implied by the size of the smallest resource units assigned to different cells
G74 Comparison of conventional and self-organised RRM in cellular networks
Simulation Assumptions Simulator System level Scenario Short range cellular frequency reuse 1 single antenna BS and UT Channel modelling Generic channel model including path loss + shadow fading Interference modelling Inter-cell interference 49-cell network (wrap-around) Cell radius 300 m Link adaptation Adaptive MCS selection based on estimated SINR values MCS BPSK QPSK 16QAM 64QAM 256QAM all with 12 coding rate FEC Convolutional coding (133 171)oct with memory 6 codeword length 2160 Type of feedback Only in link setup phase measured signal power resource candidate with
corresponding interference values Feedback delay 1 frame Overhead 1 OFDM symbol per frame Mobile speed Stationary
Instead of the conventional frequency planning a self-organised radio resource management (SO-RRM) scheme has been proposed for WINNER There is no pre-planning on frequency bands The whole bandwidth is accessible anywhere Each BS based on the ULDL signal power and interference values measured at both the BS and the UT does the resource allocation independently There is no direct communication between BSs The resources with highest possible SINR values are allocated to the new UT and suitable PHY modes are selected in accordance with those values
With the SO-RRM scheme a very flexible resource allocation can be realised which means an adaptive reuse distance is implied based on the respective interference situation of each resource in the network This scheme also facilitates high bandwidth efficiency in the hotspot case
Anti-dropping solutions
The long-term interference situation of a user changes when a new co-channel interferer is accepted into the network A BS accepts a new UT when the observed ULDL SINR is sufficient for the required transmission Meanwhile it introduces a new interferer to the network The updated interference at an existing UT may violate the requirements of its current PHY mode for transmission which results in a potential dropping In most systems the dropping rate dominates the system capacity
Two alternative solutions can be adopted against the dropping
- ldquoReallocationrdquo as a passive way that the scheduling algorithm reacts when channel degradation is observed during data transmission When a reallocation is activated new resources are allocated by implementing the similar procedure for new users
- ldquoSecurity Marginrdquo as an alternative active method The main idea of this method is to add a security margin into the threshold for the MCS selection in order to increase the tolerance for the possible degradation of SINR which is caused by new interferers The value of such a security margin depends on many aspects Generally a low margin does not help much in the dropping performance while a high margin achieves a large tolerance at the cost of efficiency Therefore a balance should be made
Comparison between SO-RRM and conventional RRM
A 49-cell network is considered The ldquowrap aroundrdquo technique [80220-05] is implemented in order to allow data collection from all cells within the network For the system level simulation the channel is assumed time invariant Each user has the same date rate and BLER requirements
A simulation starts with a blank system Users arrive at the network one by one whose locations follow a predefined distribution The BS starts the resource allocation scheme and allocates suitable resources to the UT A blocking occurs when a BS cannot find sufficient resources to serve its new UT A dropping occurs when a current transmission is destroyed be a new UT which means either the security margin is insufficient when the active anti-dropping solution is applied or the reallocation of resources fails in the case of the passive anti-dropping solution The ldquoSystem Capacityrdquo is used as the criterion of system level performance A system capacity of N is defined as that a blocking or dropping in the system happens at the first time when the (N+1) UT joins the network
WINNER D210 v10
Page 172 (180)
Both uniform and non-uniform distributions of users are considered In the non-uniform case a hotspot is defined in the central cell Inside each cell the users are always uniformly distributed A ldquohotspot fractionrdquo ρ is defined to quantitatively describe the user distribution as the number of users in the hotspot cell relating to the number of users in all cells
Comparison between SO-RRM and conventional RRM The performances of five schemes are plotted in Figure G38 The ldquooptimised security marginrdquo means that the applied margin is chosen with which the system has the highest capacity Generally it can be concluded from the results that the SO-RRM is better than the conventional RRM at the same situation The latter has good performance for uniform user distribution However its inflexibility induces a remarkable loss of spectrum efficiency with non-uniform user distribution where not all resources are accessible when many users are out of service
With the SO-RRM all resources are accessible in each cell It shows its robustness to the variance of user distribution In the cases where there are no anti-dropping solutions applied or the security is applied the performance of SO-RRM has a performance close to the conventional RRM with a uniform-like user distribution However with higher fraction of users located at the hotspot cell the flexibility of SO-RRM starts showing its efficiency When all users are located in the hotspot a 7 times higher number of users can be served
It is also observed that reallocation improves the system capacity with any user distribution In a system with uniform user distribution an increase of 60 can be achieved A passive solution gains at the cost of reallocation efforts This benefit decreases when the hotspot fraction gets higher which means a low necessity of reallocation
0 02 04 06 08 10
100
200
300
400
500
600
700
Hotspot Fraction ρ
Sys
tem
Cap
acity
SO-RRM with reallocationSO-RRM with optimized security marginSO-RRM without anti-droppingConventional RRM with optimized security marginConventional RRM without anti-dropping
Figure G38 Comparison of system performances with different RRM schemes
The effect of a security margin varies for different user distribution and different resource management schemes In a system with uniform user distribution or a system with low hotspot faction the margin is effective in the performance improvement However when the fraction of users in the hotspot increases the margin brings less improvement and even lowers the system capacity In a system with a high hotspot fraction the probability of a new user located outside the central cell is very low That is it happens rarely that an existing transmission suffers from an outage that is caused by the new co-channel interferer In this situation the security margin is only an obstacle
G75 VAA technology with adaptive pre-selection aided by MC-OLSR protocol
Simulation Assumptions Simulator Combined system and link level simulator Scenario Short range using virtual antenna arrays MT = 1 MR = 1 cell radius = 320 m
mobile speed 5 kmh VAA size = 2 Channel modelling B1 clustered delay line Interference modelling no inter-cell interference MCS 1 QPSK FEC no
WINNER D210 v10
Page 173 (180)
This issue was analysed in context of radio resource control and management and more specifically the optimum pre-selection and assignment of the relay nodes at the system level for the purposes of enhancing the space-time coded cooperative transmission with the use of virtual antenna arrays (VAA) [DGA04] at the link level was investigated To this end the MC-OLSR protocol enhanced with cooperative relaying was exploited and this work was performed on the basis of the Adaptive approach to antenna selection and space-time coding analysed in [WIND24] and the Multi-Constrained Optimised Link State Routing protocol (MC-OLSR) proposed in [WIND31] and [WIND32] respectively In the example depicted in Figure G39 VAA is constituted by RN 1 and RN 2 whereas the nodes 0 (BS) and 9 (UT) are the source and destination ones respectively
The performance comparison between the conventional and the space-time coded cooperative transmission with the use of virtual antenna arrays when the adaptive pre-selection mechanism aided by the MC-OLSR protocol is active is presented in Figure G39 There is a noticeable improvement in the region of higher SNR values however the BER curves start more or less from the same point The reason for this situation is that if there are transmission errors between the BS and the first-hop RNs they propagate and diminish the performance of the cooperative transmission during the second hop This proves the necessity for further joint cross-layer optimisation
0
2
22
1
3 4
5
6 7
8
9
10
11 12 13
23
14
15
16
17
18
19 20 21
24
0 10 20 3010-5
10-4
10-3
10-2
10-1
100
SNR [dB]
BE
R
CONV MC-OLSRVAA MC-OLSR
Figure G39 Space-time coded VAA technology ndash scenario and performance
WINNER D210 v10
Page 174 (180)
References [3GPP-TR25212] 3GPP TSG RAN ldquoHigh speed downlink packet access Physical layer aspectsrdquo TR
25212
[3GPP-WG142] 3GPP TSG RAN WG142 ZTE CATT RITT Huawei ldquoComparison of Structured LDPC Codes and 3GPP Turbo-Codesrdquo R1-050840
[3GPP-TS25331] 3GPP TS 25331 RRC Protocol Specification
[3GPP-TR25891] 3GPP TR 25891 ldquoImprovement of RRM across RNS and RNSBSS (post-Rel-5)rdquo Release 6 v030 (draft version) 22003
[80211n04] IEEE 80211n ldquoStructured LDPC Codes as an Advanced Coding Scheme for 80211nrdquo IEEE Doc 80211-04884r0 August 2004
[80211n-05] IEEE doc 80211-05150r1 ldquoWWiSE IEEE 80211n Proposalrdquo 2005
[80216-04] IEEE Std 80216-2004 ldquoAir Interface for Fixed Broadband Wireless Access Systemsrdquo
[80216e-05] IEEE doc 80216e-05006r2 ldquoLDPC coding for OFDMA PHYrdquo available online from httpwwwieee802org16tge
[80216e05b] IEEE P80216eD8 2005 ldquoAir Interface for Fixed and Mobile Broadband Wireless Access Systemsrdquo
[80220-05] ldquoIEEE 80220 Evaluation Criteriardquo September 2005
[Ace05] M Acentildea S Pfletschinger ldquoA computationally efficient algorithm for throughput maximization in OFDMArdquo 10th International OFDM-Workshop Hamburg Germany Aug-Sept 2005
[AN05] IST-Project IST-2002-507134 ldquoAmbient Networksrdquo httpwwwambient-networksorg
[AY05] A Adinoyi and H Yanikomeroglu ldquoPractical cooperative communication through fixed relaysrdquo accepted to Wireless World Radio Forum December 2005
[BBB+99] J J Beek P Boumlrjesson M L Boucheret D Landstroumlm J Arenas P Oumldling C Oumlstberg M Wahlqvist and S Wilson ldquoA Time and Frequency Synchronization Scheme for Multi-user OFDMrdquo IEEE Journal of Selected Areas on Communications vol 17 pp 1900-1914 Nov 1999
[BCK03] A Bourdoux B Come N Khaled ldquoNon-reciprocal transceivers in OFDMSDMA systems Impact and mitigationrdquo RAWCON 2003 Boston August 2003
[Bin90] J A C Bingham ldquoMulticarrier modulation for data transmission an idea whose time has comerdquo IEEE Communications Magazine Vol 28 pp 5-14 May 1990
[BM04] G Barriac U Madhow ldquoSpace Time Communication for OFDM with Implicit Channel Feedbackrdquo IEEE Trans on Information Theory vol 50 pp3111-3129 Dec 2004
[Bon04] T Bonald ldquoA score-based opportunistic scheduler for fading radio channelsrdquo European Wireless Conference Barcelona Feb 2004
[BR04] L Bazzi and T J Richardson ldquoExact Thresholds and Optimal Codes for the Binary-Symmetric Channel and Gallagerrsquos Decoding Algorithm Ardquo IEEE Trans on Info Theory vol 50 no 9 Sept 2004
[BSB97] J J Beek M Sandell and P Boumlrjesson ldquoML estimation of time and frequency offset in OFDM systemsrdquo IEEE Transactions in Signal Processing vol 45 pp 999-1008 July 1997
[Cam98] J Campello ldquoOptimal discrete bit loading for multicarrier modulation systemsrdquo Proceedings of International Symposium on Information Theory p 193 August 1998
[Cam99] J Campello ldquoPractical bit loading for DMTrdquo Proceedings of ICC 99 Vancouver Canada pp 801-805 June 1999
WINNER D210 v10
Page 175 (180)
[CCB95] P S Chow J M Cioffi J A C Bingham ldquoA practical discrete multitone transceiver loading algorithm for data transmission over spectrally shaped shannelsrdquo IEEE Trans Commun Vol 43 pp 773-775 April 1995
[CENELEC01] EN 50360 ldquoProduct standard to demonstrate the compliance of mobile phones with basic restrictions related to human exposure to electromagnetic fields (300 MHz - 3 GHz)rdquo European Committee for Electrotechnical Standardization (CENELEC) July 2001
[CENELEC02] EN 50385 ldquoProduct standard to demonstrate the compliance of radio base stations and fixed terminal stations for wireless telecommunication systems with the basic restrictions or the reference levels related to human exposure to radio frequency electromagnetic fields (110 MHz - 40 GHz) - General publicrdquo European Committee for Electrotechnical Standardization (CENELEC) European Standard August 2002
[CEO02] G Cherubini E Elefthriou and S Oelcer ldquoFiltered Multi Tone Modulation for very High Speed Digital Subscriber Linesrdquo IEEE Journ On Select Areas on Commun vol 20 n5 pp 1016-1028 June 2002
[CF02] J Chen and MPC Fossorier ldquoNear Optimum Universal Belief Propagation Based Decoding of Low-Density Parity Check Codesrdquo IEEE Transactions on Communications Vol 50 No 3 March 2002
[CFO+03] E Costa A Filippi S Ometto M Weckerle E Schulz ldquoAsynchronous uplink transmis-sion in FMT-FDMA systemsrdquo in Proc IEEE International Symposium on Personal Indoor and Mobile Radio Communications (PIMRC) Bejing China 2003
[ChC00] M Chang K-C Chen ldquoFrequency-Domain Approach to Multiuser Detection in DS-CDMArdquo IEEE Comm Letters vol 4 no 11 pp 331-333 Nov 2000
[CSB05] E Costa P Slanina V Bochnicka E Schulz G Spano Greco Downlink based Intra- and Inter-cell Time and Frequency Synchronisation in OFDM Cellular Systems Proceedings of World Wireless Congress 2005 San Francisco May 2005
[DAO05] M Doumlttling D Asteacutely and M Olsson ldquoA Multi-User Spatial Domain Link Adaptation Concept for Beyond 3G Systemsrdquo ProcPIMRC 2005 Berlin Germany September 2005
[DFL+04] R Dinis D Falconer Chan Tong Lam et al ldquoA Multiple Access Scheme for the Uplink of Broadband Wireless Systemsrdquo Globecom 2004
[DGA04] M Dohler A Gkelias H Aghvami ldquoA Resource Allocation Strategy for Distributed MIMO Multi-Hop Communication Systemsrdquo IEEE Communications Letters Volume 8 Issue 2 February 2004 pp 99-101
[DVB00] Interaction channel for satellite distribution systems ETSI EN 301 790 V122 pp 21-24 Dec 2000
[Ekm02] T Ekman Prediction of Mobile Radio Channels Modelling and Design PhD Th Signals and Syst Uppsala UnivhttpwwwsignaluusePublicationsabstractsa023html
[ER01] A Ebner and H Rohling A Self-Organized Radio Network for Automotive Applications Proceedings of the 8th World Congress on Intelligent Transport Systems Sydney Australia October 2001
[Eri04] NC Ericsson Revenue Maximization in Resource Allocation Applications in Wireless Communication Networks PhD Thesis Signals and Systems Uppsala Univ Oct 2004 httpwwwsignaluusePublicationsabstractsa043html
[FSE+04] S Falahati A Svensson T Ekman and M Sternad Adaptive modulation systems for predicted wireless channels IEEE Trans on Communications vol 52 Feb 2004 pp 307-316
[FA02] David D Falconer and S Lek Ariyavisitakul Broadband Wireless Using Single Carrier and Frequency Domain Equalization Proceedings WPMC 2002 pp 27 - 36 vol1 Honolulu USA Oct 2002
WINNER D210 v10
Page 176 (180)
[FCS04] A Filippi E Costa E Schulz ldquoLow Complexity Interleaved Sub-carrier Allocation in OFDM Multiple Access Systemsrdquo in Proc IEEE VTCrsquo04 Los Angeles California USA Sept 2004
[FDGH05a] M Fuchs G Del Galdo and M Haardt A novel tree-based scheduling algorithm for the downlink of multi-user MIMO systems with ZF beamforming In Proc IEEE Int Conf Acoust Speech Signal Processing(ICASSP) volume 3 pages 1121ndash1124 Philadelphia PA March 2005
[FDGH05b] M Fuchs G Del Galdo and M Haardt Low complexity space-time-frequency scheduling for MIMO systems with SDMA Submitted to IEEE Transactions on Vehicular Technology September 2005
[FH96] R F H Fischer J B Huber ldquoA new loading algorithm for discrete multitone transmissionrdquo Proceedings of GLOBECOM 96 London UK pp 724-728 November 1996
[FK05] D Falconer S Kaiser editors ldquoBroadband frequency Domain-Based Air Interfaces for Future-Generation Wireless Systemsrdquo WWRF Working Group 4 White Paper Version 016 Feb 18 2005
[GA93] Mohinder S Grewal and Angus P Andrews (1993) ldquoKalman Filtering Theory and Practicerdquo Upper Saddle River NJ USA Prentice Hall
[Gal63] R G Gallager ldquoLow-Density Parity-Check codesrdquo PhD Thesis Cambridge
[GBD03] F Guilloud E Boutillon and J-L Danger ldquoλ-Min Decoding Algorithm of Regular and Irregular LDPC Codesrdquo 3rd International Symposium on Turbo-Codes amp Related Topics
[GRC02] D Galda H Rohling E Costa H Haas E Schulz ldquoA Low Complexity Transmitter Structure for OFDM-FDMA Uplink Systemsrdquo in Proc VTC Spring 2002 pp 1737-1741 2002
[HBD00] JS Hammerschmidt C Brunner C Drewes Eigenbeamforming - a novel concept in array signal processing Proc VDEITG European Wireless Conference DresdenGermany Sept 2000
[HP98] Guidelines for limiting exposure to time-varying electric magnetic and electromagnetic fields (up to 300 GHz) International Commission on Non-Ionizing Radiation Protection Health Physics vol 74 no 4 pp 494-522 April 1998
[Hug91] D Hughes-Hartogs ldquoEnsemble modem structure for imperfect transmission mediardquo US Patent No 5054034 October 1991
[IN05] C Ibars M Navarro Reduced complexity iterative multiuser detector for beyond 3G CDMA systems IST Mobile amp Communication Summit 2005 (IST 2005) Dresden (Germany) June 19-23 2005
[JB03] E A Jorswieck and H Boche ldquoTransmission Strategies for the MIMO MAC with MMSE Receiver Average MSE Optimization and Achievable Individual MSE Regionrdquo IEEE Trans On Signal Processing vol 51 pp 2872-2881 Nov 2003
[JDL+04] JP Javaudin C Dubuc D Lacroix M Earnshaw An OFDM Evolution to the UMTS High Speed Downlink Packet Access in Proc of VTC Fall 2004 Los Angeles USA 26-29 September 2004
[JFH+05] V Jungnickel A Forck T Haustein SSchiffermuumlller C von Helmolt F Luhn M Pollock C Juchems M Lampe S Eichinger W Zirwas E Schulz ldquo1 Gbits MIMO-OFDM Transmission Experimentsrdquo Proc IEEE VTC Fall 2005 Dallas Texas
[JVS+03] C Jones E Valles M Smith and J Villasenor ldquoApproximate-Min Constraint Node Updating for LDPC Code Decodingrdquo IEEE MILCOM 2003
[KBLS06] T T Kim M Bengtsson E G Larsson and M Skoglund ldquoCombining Short-Term and Long-Term Channel State Information over Correlated MIMO Channelsrdquo Submitted to ICASSP 2006
WINNER D210 v10
Page 177 (180)
[KF98] F R Kschischang B J Frey ldquoIterative Decoding of Compound Codes by Probabilistic Propagation in Graphical Modelsrdquo Journal on Select Areas Commun pp 219-230 1998
[KLF01] Y Kou S Lin and M Fossorier ldquoLow Density parity-check codes based on finite geometries A rediscovery and morerdquo IEEE Trans Inform Theory vol 47 pp 2711-2736 Nov 2001
[LC02] D Lee and K Cheun ldquoCoarse Symbol Synchronization Algorithms for OFDM Systems in Multipath Channelsrdquo IEEE Communication Letters pp 446-448 Vol 6 no 10 Oct 2002
[LGA01] D Lacroix N Goudard M Alard OFDM with guard interval versus OFDMOffsetQAM for high data rate UMTS downlink transmission in Proc of VTC Fall 2001 October 2001 Atlantic City USA
[LHYT01] Y Liu R Hoshyar X Yang R Tafazolli Joint Routing and Packet Scheduling for Enhanced Uplink UTRA-FDD with Fixed Relay Stations in Proc IEEE Vehicular Technology Conference Dallas Texas USA September 2005
[LHYT02] Y Liu R Hoshyar X Yang R Tafazolli An Integrated Radio Resource Allocation Framework for Enhanced Uplink UTRA-FDD with Fixed Relay Stations 14th IST Mobile and Wireless communications Summit Dresden Germany June 2005
[LWB+02] D Landstroumlm S K Wilson J-J van de Beek P Oumldling and PO Bjoumlrjesson ldquoSymbol time offset estimation in coherent OFDM Systemsrdquo IEEE Transactions on Communications vol 50 pages 545-549 Apr 2002
[LWZ04] Y Liu T Weber W Zirwas Uplink performance investigations of the service area basd beyond 3G system JOINT in Proc Kleinheubacher Berichte Kleinheubach Germany October 2004 MS No KH2004-A-0051
[LZ05] T Lestable and E Zimmermann ldquoLDPC Codes Options for Next Generation Wireless Systemsrdquo Wireless World Research Forum (WWRF) WG5 San-Diego 2005
[MB01] Y Mao A H Banihashemi ldquoDecoding Low-Density Parity-Check Codes with Probabilistic Schedulingrdquo Comm Letters 5415-416 Oct 2001
[MBL+05] M Muck P Bernardin P Labbe X Miet D Pannicke and J Schoenthier ldquoPrototyping of a hybrid 5GHz60GHz OFDM WLAN system in the framework of IST-BroadWayrdquo Wireless World Research Forum 13th meeting Mar 2-3 2005 Jeju Island Korea
[MCD05] M Muck M de Courville P Duhamel rdquoA Pseudo Random Postfix OFDM modulator - Semi-blind channel estimation and equalizationrdquo accepted by IEEE Transactions on Signal Processing 2005
[MKK+05] N Maeda T Kataoka H Kawai K Higuchi J Kawamoto M Sawahashi ldquoExperiments on Real-Time 1-Gbps Packet Transmission Using Antenna-Independent AMC in MIMO-OFDM Broadband Packet Radio Accessrdquo Proc IEEE VTC Fall 2005 Dallas Texas
[MS02] M M Mansour and N R Shanbhag ldquoLow-Power VLSI Decoder Architectures for LDPC Codesrdquo IEEE ISLPED 2002
[MY05] S Myung and K Yang ldquoA Combining Method of Quasi-Cyclic LDPC Codes by The Chinese Remainder Theoremrdquo IEEE Comm Letters Vol9 N9 Sept 2005
[MYK05] S Myung K Yang and J Kim ldquoQuasi-Cyclic LDPC Codes for Fast Encodingrdquo IEEE Trans on Info Theory August 2005
[OJEC99] 1999519EC EU Council Recommendation of 12 July 1999 on the limitation of exposure of the general public to electromagnetic fields (0 Hz to 300 GHz) Official Journal of the European Communities July 1999
[OY03] J-E Oh K Yang ldquoSpace-time codes with full antenna diversity using weighted nonbi-nary repeat-accumulate codesrdquo IEEE Trans Commun vol 51 pp 1773ndash1778 Nov 2003
WINNER D210 v10
Page 178 (180)
[Pfl05] S Pfletschinger ldquoFrom cell capacity to subcarrier allocation in multi-user OFDMrdquo IST Mobile amp Wireless Communications Summit Dresden (Germany) 19 ndash 23 June 2005
[PI05] S Pfletschinger and C Ibars ldquoFrom cell capacity to subcarrier allocation in OFDMArdquo submitted to European Transactions on Telecommunications Sept 2005
[Rap91] C Rapp ldquoEffects of HPA-Nonlinearity on a 4-DPSKOFDM Signal for a Digital Sound Broadcasting Systemrdquo Proc 2nd European Conf on Satellite Comms Liege Oct 1991 pp 179-184
[RM00] D M Rowitch LB Milstein ldquoOn the performance of hybrid FECARQ systems using rate compatible punctured Turbo (RCPT) codesrdquo IEEE Trans on Comm vol 48 no 6 pp 948-958 June 2000
[SA03] M Sternad and D Aronsson ldquoChannel estimation and prediction for adaptive OFDM downlinks IEEE VTC 2003-Fall Orlando October 2003
[SD01] A Stefanov T Duman ldquoTurbo-coded modulation for systems with transmit and receive antenna diversity over block fading channels System model decoding approaches and practical considerationsrdquo IEEE J Select Areas Commun vol 19 no 5 pp 958ndash968 May 2001
[SEA01] M Sternad T Ekman and A Ahleacuten ldquoPower prediction on broadband channelsrdquo IEEE Vehicular Technology Conference VTC01-Spring Rhodes Greece May 6-9 2001
[SFF+99] M Speth S Fechtel G Fock and H Meyr ldquoOptimum Receiver Design for Wireless Broadband Systems Using OFDM-Part Irdquo IEEE Transactions on Communications vol 47 pp 1668-1677 Nov 1999
[SF04] M Sternad S Falahati ldquoMaximizing throughput with adaptive M-QAM based on imperfect channel predictionsrdquo IEEE PIMRC 2004 Barcelona Sept 2004
[SFS05] M Sternad S Falahati T Svensson and D Aronsson rdquoAdaptive TDMAOFDMA for wide-area coverage and vehicular velocitiesrdquo IST Summit Dresden July 2005
[SGF95] Johan Skoumlld Bjoumlrn Gudmundson Jan Faumlrjh ldquoPerformance and Characteristics of GSM-based PCSrdquo VTC 1995
[SU05] A Soysal and S Ulukus ldquoTransmit Directions and Optimality of Beamforming in MIMO-MAC with Partial CSI at the Transmittersrdquo Proc of CISS Jan 2005
[SW02] A Springer R Weigel The Physical Layer of the Universal Mobile Telecommunications System Berlin Heidelberg New York Springer 2002
[SWW+04] E Schulz M Weckerle T Weber M Meurer The OFDM based beyond 3G air inter-face JOINT featuring interference reduction by joint detection and joint transmission in Proc 8th WWRF Meeting Beijing China Feb 2004 pp 1-11
[TB04] S Tomasin and N Benvenuto ldquoA Reduced Complexity Block Iterative DFE for Dispersive Wireless Applicationsrdquo Proc VTC 2004 fall pp 1693-1697
[THB04] J Tousch M-H Hamon and J Benko ldquoTurbo-Codes Complexity Estimatesrdquo IEEE 80211n Proposal 1385-r1 Nov 2004
[Tse98] DNC Tse and SV Hanly ldquoMultiaccess fading channelsmdashPart I Polymatroid structure optimal resource allocation and throughput capacitiesrdquo IEEE Trans Information Theory vol 44 no 7 pp 2796-2815 Nov 1998
[Vai92] PP Vaidjanathan Multirate Systems and Filter Banks Englewood Cliffs NJ Prentice Hall
[VF00] J Vogt and A Finger ldquoImproving the Max-Log-MAP turbo decoderrdquo IEEE Electronincs Letters vol 36 no 23 pp 1937ndash1939 2000
[VH04] V Stankovic and M Haardt ldquoMulti-user MIMO downlink precoding for users with multiple antennasrdquo in Proc Of the 12-th Meeting of the Wireless World Research Forum (WWRF) Toronto Canada Nov 2004
WINNER D210 v10
Page 179 (180)
[VH05a] V Standovic and M Haardt ldquoMulti-user MIMO downlink beamforming over correlated MIMO channelsrdquo in Proc International ITGIEEE Workshop on Smart Antennas (WSA05) Duisburg Germany April 2005
[VH05b] V Stankovic and M Haardt ldquoImproved diversity on the uplink of multi-user MIMO systemrdquo in Proc European Conference on Wireless Technology (ECWT 2005) Paris France October 2005
[VTL02] P Viswanath DNC Tse and R Laroia ldquoOpportunistic beamforming using dumb antennasrdquo IEEE Transactions on Information Theory vol 48(6) June 2002
[WER03] L Wischhof A Ebner H Rohling M Lott and R Halfmann SOTIS -A Self-Organizing Traffic Information System Proceedings of the 57th IEEE Vehicular Technology Conference (VTC 03 Spring) Jeju Korea 2003
[Win84] JH Winters ldquoOptimum Combining in Digital Mobile Radio with Cochannel Interferencerdquo in IEEE Journal on Selected Areas in Communications Vol SAC-2 No 4 July 1984
[WIND21] IST-2003-507581 WINNER ldquoD21 Identification of Radio-Link Technologiesrdquo June 2004
[WIND22] IST-2003-507581 WINNER ldquoD22 Feasibility of multi-bandwidth transmissionsrdquo October 2004
[WIND23] IST-2003-507581 WINNER ldquoD23 Assessment of Radio-Link Technologiesrdquo February 2005
[WIND24] IST-2003-507581 WINNER ldquoD24 Assessment of adaptive transmission technologiesrdquo February 2005
[WIND25] IST-2003-507581 WINNER ldquoD25 Duplex arrangements for future broadband radio interfacerdquo October 2004
[WIND26] IST-2003-507581 WINNER ldquoD26 Assessment of multiple access technologiesrdquo October 2004
[WIND27] IST-2003-507581 WINNER ldquoD27 Assessment of Advanced Beamforming and MIMO Technologiesrdquo February 2005
[WIND31] IST-2003-507581 WINNER ldquoD31 Description of identified new relay based radio network deployment concepts and first assessment of comparison against benchmarks of well known deployment concepts using enhanced radio interface technologiesrdquo Oct 2004
[WIND32] IST-2003-507581 WINNER ldquoD32 Description of identified new relay based radio network deployment concepts and first assessment by comparison against benchmarks of well known deployment concepts using enhanced radio interface technologiesrdquo February 2005
[WIND35] IST-2003-507581 WINNER ldquoD35 Proposal of the best suited deployment concepts chosen for the identified scenariosrdquo December 2005
[WIND41] IST-2003-507581 WINNER ldquoD41 Identification and definition of cooperation schemes between RANs ndashfirst draftrdquo June 2004
[WIND42] IST-2003-507581 WINNER ldquoD42 Impact of cooperation schemes between RANs ndashfirst draftrdquo February 2005
[WIND43] IST-2003-507581 WINNER ldquoD41 Identification and definition of cooperation schemes between RANs ndashfinal deliverablerdquo June 2005
[WIND44] IST-2003-507581 WINNER ldquoD44 Impact of cooperation schemes between RANs ndash final deliverablerdquo November 2005
[WIND54] IST-2003-507581 WINNER ldquoD54 Final Report on Link Level and System Level Channel Modelsrdquo September 2005
WINNER D210 v10
Page 180 (180)
[WIND63] IST-2003-507581 WINNER ldquoD63 WINNER Spectrum Aspects Assesment reportrdquo December 2005
[WIND71] IST-2003-507581 WINNER ldquoD71 System requirementsrdquo July 2004
[WIND72] IST-2003-507581 WINNER ldquoD72 System Assessment Criteria Specificationldquo July 2004
[WIND76] IST-2003-507581 WINNER ldquoD76 WINNER System Concept Descriptionrdquo October 2005
[WOSS05] Wei Wang Tony Ottosson Tommy Svensson Arne Svensson Mikael Sternad rdquoEvaluations of a 4G Uplink System Based on Adaptive Single-Carrier TDMArdquo Proceedings IEEE Vehicular Technology Conference Fall Dallas Texas USA Sep 2005
[YNA01] E Yeo B Nikolie and V Anantharam ldquoHigh Throughput Low-Density Parity-Check Decoder Architecturesrdquo IEEE Globecom 2001
[Yu02] W Yu and JM Cioffi ldquoFDMA capacity of Gaussian multiple-access channels with ISIrdquo IEEE Trans Commun vol 50 no 1 pp 102-111 Jan 2002
[Yu04] W Yu W Rhee S Boyd JM Cioffi ldquoIterative water-filling for Gaussian vector multiple-access channelsrdquo IEEE Trans Information Theory Jan 2004
[ZB04] P Zarrinkhat and A H Banihashemi ldquoThreshold Values and Convergence Properties of Majority-Based Algorithms for Decoding Regular Low-Density Parity-Check codesrdquo IEEE Trans on Comm vol 52 no 12 Dec 2004
[ZF04] J Zhang and M Fossorier ldquoA Modified Weighted Bit-Flipping Decoding of Low-Density Parity-Check Codesrdquo IEEE Comm Letters vol 8 no 3 March 2004
[ZF05] J Zhang M Fossorier lsquoShuffled iterative decodingrsquo IEEE Trans on Comm Vol 53 No 2 February 2005
[ZZ05] H Zhong and T Zhang lsquoBlock-LDPC A Practical LDPC Coding System Design Approachrsquo IEEE Trans on Circ And Syst-I Reg Papers Vol 52 N 4 April 2005