ISSUES TO ADDRESS - Hacettepeyunus.hacettepe.edu.tr/.../Ppt/Chap10_PhaseEquilibriaDiagrams.pdf ·...
41
ISSUES TO ADDRESS... • When we combine two elements... what equilibrium state do we get? • In particular, if we specify... --a composition (e.g., wt%Cu - wt%Ni), and --a temperature (T) then... How many phases do we get? What is the composition of each phase? How much of each phase do we get? Phase B Phase A Nickel atom Copper atom CHAPTER 9: PHASE DIAGRAMS
-
Upload
phamnguyet -
Category
Documents
-
view
216 -
download
0
Transcript of ISSUES TO ADDRESS - Hacettepeyunus.hacettepe.edu.tr/.../Ppt/Chap10_PhaseEquilibriaDiagrams.pdf ·...

ISSUES TO ADDRESS...• When we combine two elements...
what equilibrium state do we get?• In particular, if we specify...
--a composition (e.g., wt%Cu - wt%Ni), and--a temperature (T)then...
How many phases do we get?What is the composition of each phase?How much of each phase do we get?
Phase BPhase A
Nickel atomCopper atom
CHAPTER 9: PHASE DIAGRAMS

Some Definitions
• An alloy is a combination, either in solution or compound, of two or more components(elements), at least one of which is a metal.
• An alloy with two components is called a binaryalloy; one with three is a ternary alloy; one with four is a quaternary alloy.
• The result is a material with properties differentfrom those of its components.
The microstructure of Fe-C alloy

• Components:The elements or compounds which are mixed initially (e.g., Al and Cu)
• Phases:The physically and chemically distinct material regions that result
(e.g., a and b).
Aluminum-CopperAlloy
α (darker phase)
β (lighter phase)
COMPONENTS AND PHASES
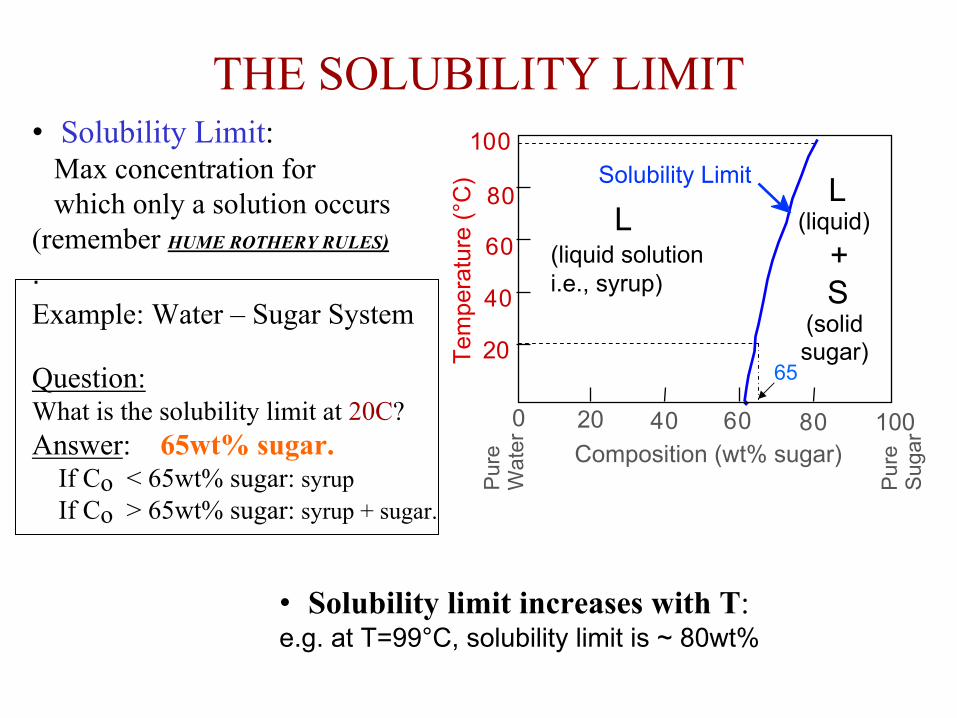
• Solubility Limit:Max concentration forwhich only a solution occurs
(remember HUME ROTHERY RULES)
.Example: Water – Sugar System
Question:What is the solubility limit at 20C?Answer: 65wt% sugar.
If Co < 65wt% sugar: syrupIf Co > 65wt% sugar: syrup + sugar.
• Solubility limit increases with T: e.g. at T=99°C, solubility limit is ~ 80wt%
Pur
e Su
gar
Tem
pera
ture
(°C
)
0 20 40 60 80 100Composition (wt% sugar)
L(liquid solution i.e., syrup)
Solubility Limit L (liquid)
+ S
(solid sugar)
6520
40
60
80
100
Pur
e W
ater
THE SOLUBILITY LIMIT

• Changing T can change number of phases: path A to B. • Changing Co can change number of phases: path B to D.
Water-Sugar (C12H22O11)system
A(70, 20)2 phases
B(100,70) 1 phase
D(100,90) 2 phases
EFFECT of T and COMPOSITION

Phase Diagrams• A phase diagram shows what phases are present and where the process
boundaries are within the composition space.
• Equilibrium phase diagrams represents relations between temperature, pressure, compositions and quantities of phases at equilibrium.
• Phase diagrams allows to predict phase transformations which occur during temperature change (e.g. upon cooling).
The following type of binary (contains only two component) systems will be discussed below:
- complete solubility: isomorphous- eutectic- with intermediate phases or compounds- involving eutectoid and peritectic reactions
Special attentions will be paid on the iron-iron carbide system

• Isomporhous system is characterized by complete liquid and solid solubilityof the components
• For this course:--binary systems: just 2 components.--independent variables: T and Co (P = 1atm is always used).
• PhaseDiagramfor Cu-Nisystem
• B - α and L
• A - α (FCC solid solution)
wt% Ni20 40 60 80 10001000
1100
1200
1300
1400
1500
1600T(°C)
L (liquid)
α (FCC solidsolution)
L + αliquidus
solidus
Binary Isomorphous Systems
• B
• A
Phase boundaries:liquidus and solidus lines
• C –L (homogeneous liquid solution)• C

• Rule 1: If we know T and Co, then we know:-the number and types of phases present.
• Examples:
wt% Ni20 40 60 80 1000
1000
1100
1200
1300
1400
1500
1600
T(°C
)
L (liquid)
α(FCC solidsolution)
L + αliquidus
solidus
A(1100,60)B
(125
0,35
) Cu-Niphase
diagram
A(1100°C, 60 wt%): 1 phase: α
B (1250, 35): 2 phases: L +α
PHASE DIAGRAMS: Number and Types of Phases Present

• Rule 2: If we know T and Co, thenwe know: the composition of each phase
• Examples:
wt% Ni20
1200
1300
T(°C
)
L
αL + α
liquidus
solidus
30 40 5 0
TC C
ATA
TB BTie line
L + α
433532CoCL Cα
Cu-Ni system
• at TC=1350 C, only one, Liquid phase exists with composition:35 wt % Ni – 65 % Cu
CO== 35wt%Ni
PHASE DIAGRAMS: Composition of Phases
• at TA=1175 C, again only one, solid phase exists with composition:35 wt % Ni – 65 % Cu
• at TB=1250 C, two phase(L and α) exist with compositions:L – 32 wt% Ni - 68%Cuα - 43 wt% Ni - 57%Cu
Tie line is an isotherm in the two-phase region.Intersects of this line with phase boundary lines (e.g.liquidus and solidus) give the compositions of the corresponding phases (e.g. liquid and solid solutions)

• Rule 3: If we know T and Co, then we know:-the amount of each phase (given in wt%).
Cu-Ni system• Examples:
At TB : Both α and L
At TC : Only Liquid (L) WL= 100 wt%, Wα=0
At TA : Only Solid ( α) WL = 0, Wα= 100%
Co = 35wt%Ni
WL = SR + S
Wα = RR + S
=
43 − 3543 − 32
= 73wt %
= 27wt%
PHASE DIAGRAMS: Weight Fractions of Phases
A
C
Lever rule: The fraction of one phase is computed by taking the length of tie line from the overall alloy composition to the phase boundary for the other phase, and dividing by the total tie line length.

wt% Ni20
1200
1300
30 40 501100
L (liquid)
α(solid)
L +
L + α
T(°C)
A
D
B
35Co
L: 35wt%Ni
α :46wt%NiC
E
L: 35wt%Ni
464332
24
35
36α: 43wt%Ni
L: 32wt%Ni
L: 24wt%Ni
α: 36wt%Ni
Microstructure Development:Equilibrium Cooling
αα
αα
α: 35wt%Ni
α
Example: Cu-Ni system-slow cooling along the line with Co = 35wt%Ni.
• Solidification in the solid + liquidphase occurs gradually upon cooling from the liquidus line. • The composition of the solid and the liquid change gradually during cooling (B→C→D, as can be determined by the tie-line method.) • Nuclei of the solid phase form and they grow to consume all the liquidat the solidus line.

Microstructure Development:Non-Equilibrium Cooling
Example: Cu-Ni system; Rapid cooling along the line with Co = 35wt%Ni.
• Solidification in the solid + liquid phase still occurs gradually. •The composition of the liquid phase evolves by relatively fast diffusion, following the equilibrium values that can be derived from the tie-line method. • However, diffusion in the solid state is slow. Hence, the new layers that solidify on top of the grains have the equilibrium composition at that temperature but once they are solid their composition essentially does not change. This lead to the formation of layered (cored) grains and to the invalidity of the tie-line method to determine the composition of the solid phase.
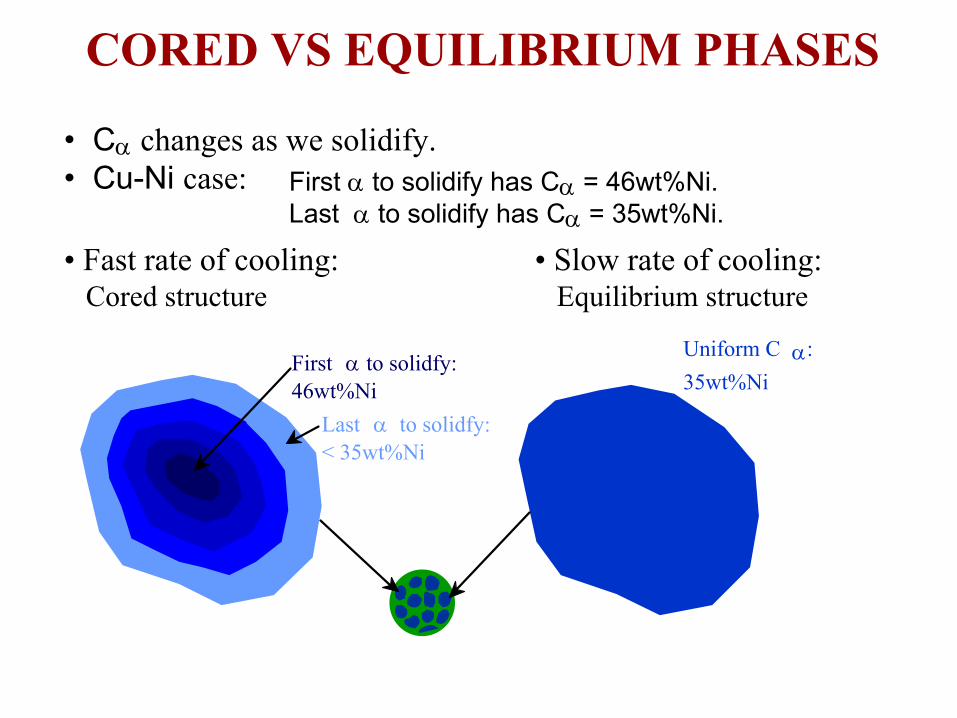
• Cα changes as we solidify.• Cu-Ni case:
• Fast rate of cooling:Cored structure
• Slow rate of cooling:Equilibrium structure
First α to solidify has Cα = 46wt%Ni.Last α to solidify has Cα = 35wt%Ni.
First α to solidfy: 46wt%Ni
Uniform C α: 35wt%Ni
Last α to solidfy: < 35wt%Ni
CORED VS EQUILIBRIUM PHASES
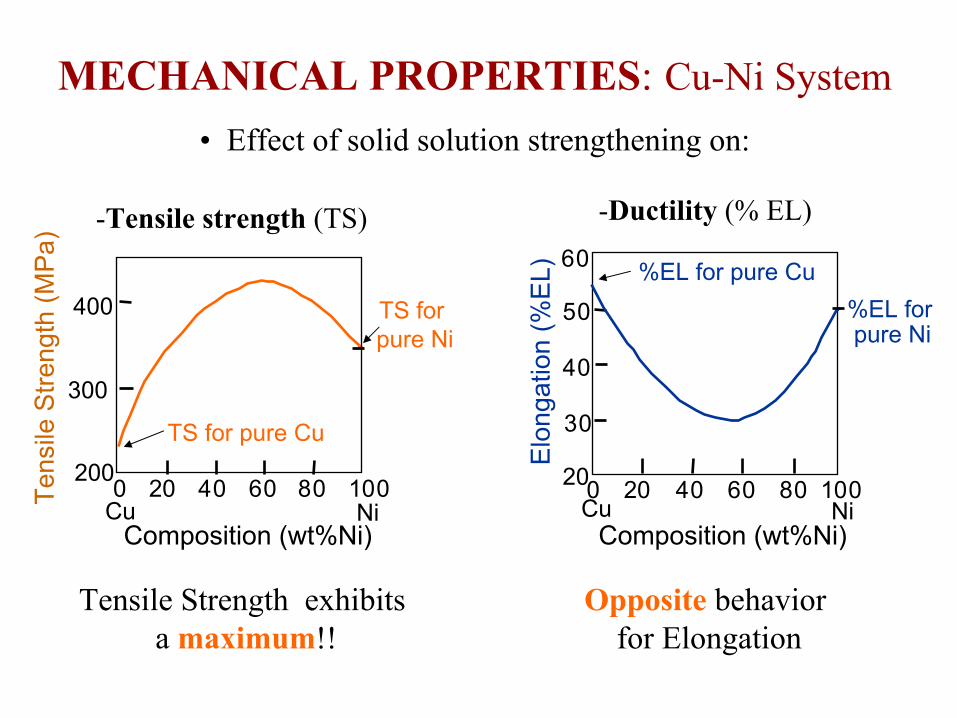
• Effect of solid solution strengthening on:
-Tensile strength (TS) -Ductility (% EL)
MECHANICAL PROPERTIES: Cu-Ni System
Elo
ngat
ion
(%E
L)Composition (wt%Ni)
Cu Ni0 20 40 60 80 10020
30
40
50
60
%EL for pure Ni
%EL for pure Cu
Tens
ile S
treng
th (M
Pa)
Composition (wt%Ni)Cu Ni0 20 40 60 80 100
200
300
400 TS forpure Ni
TS for pure Cu
Tensile Strength exhibitsa maximum!!
Opposite behaviorfor Elongation

Such systems are characterized by limiting components solubility and existing of a special composition (eutectic) with a minimum
melting point, TE (eutectic means easily melted) .
• 3 single phase regions: L, α and β• Limited solubility:
α: mostly Cuβ: mostly Ni
Example I: Cu-Ag system
L (liquid)
α L+α L+ββ
α+β
Composition, wt% Ag20 40 60 80 1000
200
1200T(°C)
400
600
800
1000
CE
TE8.0 71.9 91.2
BINARY-EUTECTIC SYSTEMS (1)
The specific features are:
• Solvus lines, BC and GH, separatesone solid solution from a mixture of solid solutions. • Solvus lines show limit of solubility
Solvus Solvus
EB G
CH
Liquidus
Solidus

Such systems are characterized by limiting components solubility and existing of a special composition (eutectic) with a minimum
melting point, TE (eutectic means easily melted) .
• TE : No liquid below TE
• CE : Composition with minimum melting TE
Example I: Cu-Ag system
L (liquid)
α L+αL+β
β
α+β
Composition, wt% Ag20 40 60 80 1000
200
1200T(°C)
400
800
600
1000
CE
TE8.0 71.9 91.2=779°C
BINARY-EUTECTIC SYSTEMS (2)
EB G
• Point E is an invariant point
• line BEG is the eutectic isotherm:3 phases can be in equilibrium alongeutectic isotherm
• Eutectic reaction:
)Ag%wt2.91()Ag.%wt0.8()Ag%wt9.71(L
)C()C()C(L
heating
cooling
EEheating
cooling
E
β+α ← →
β+α ← →
βα
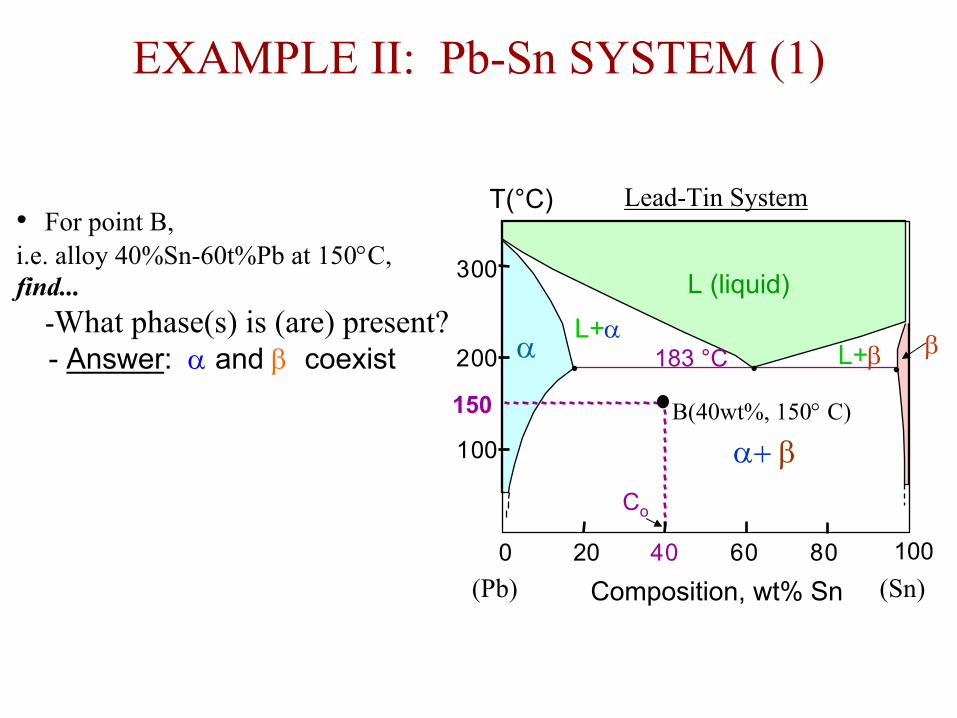
• For point B, i.e. alloy 40%Sn-60t%Pb at 150°C, find...
-What phase(s) is (are) present?- Answer: α and β coexist
EXAMPLE II: Pb-Sn SYSTEM (1)
L+αL+β
α+ β
200
T(°C)
20 40 60 80 1000
Co
300
100
β
L (liquid)
α 183 °C
150
Composition, wt% Sn(Pb) (Sn)
Lead-Tin System
B(40wt%, 150° C)

Pb-Sn system
Pb-Sn EUTECTIC SYSTEM (2)
L+αL+ β
α + β
200
T(°C)
18.3
20 40 60 80 1000Co
300
100
L (liquid)
α 183°C61.9 97.8
150
11 99
R S
β
• For point B, i.e. alloy 40%Sn-60t%Pb at 150°C, find...
-What are the compositions of the phases?
- Answer:
Cα = 11% Sn – 89wt% PbCβ = 99% Sn – 1wt% Pb
-What are the relative amountsof each phase?
-Answer:
W α = 59 88
= 67 wt %
W β = 29 88
= 33 wt % Composition, wt% Sn(Pb) (Sn)
B

L + α200
T(°C)
Co, wt% Sn10
2
200C1
300
100
L
α
30
L: C1 wt%Sn
αL
α: C1wt%Sn
α + β
400
(room T solubility limit)
T E(Pb-SnSystem)
• Composition range: a pure component (e.g. Pb) - its maximum solid solubilityat room (20°C) temperature (e.g. point B with CB=C1< 2wt% )
• Result:
T>TL=330 °C – liquid alloy with C1comp
TS< T<TL – very narrow region: solid a phase in liquid (L) and compositions of phases are defined by tie-line method;
T<TS - polycrystal of α grains with uniform composition of C1.
MICROSTRUCTURES IN EUTECTIC SYSTEMS: Equilibrium Cooling (1)
B
α: C2wt%SnL + α
200
T(°C)
wt% Sn10
18.3
200C2
300
100
L
α
30
L: C2wt%Sn
α + β
400
sol. limitat TE
2sol. limit at T room
Lα
αβ
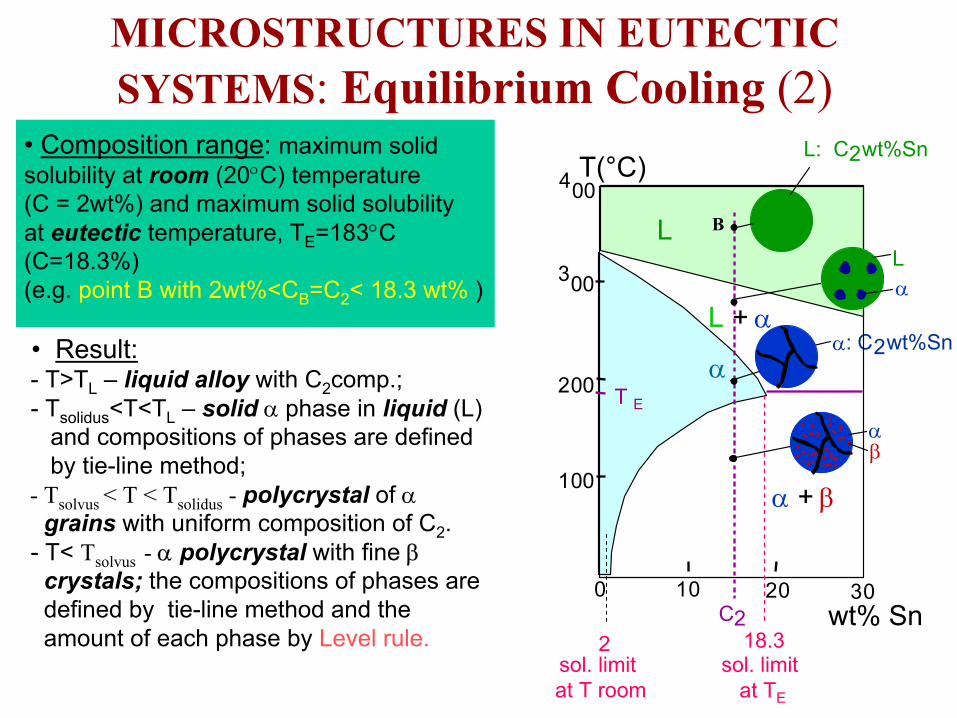
MICROSTRUCTURES IN EUTECTIC SYSTEMS: Equilibrium Cooling (2)
• Composition range: maximum solid solubility at room (20°C) temperature (C = 2wt%) and maximum solid solubility at eutectic temperature, TE=183°C (C=18.3%)(e.g. point B with 2wt%<CB=C2< 18.3 wt% )
• Result:- T>TL – liquid alloy with C2comp.;- Tsolidus<T<TL – solid α phase in liquid (L)
and compositions of phases are defined by tie-line method;
- Tsolvus < T < Tsolidus - polycrystal of αgrains with uniform composition of C2.
- T< Tsolvus - α polycrystal with fine βcrystals; the compositions of phases are defined by tie-line method and the amount of each phase by Level rule.
B
T E

L + α200
T(°C
)
wt% Sn20 400
300
100
L
α
60
L: CEwt%Sn
α + βα:18.3wt%Sn
β
0 80 100
L + β
CE18.3
97.8
61.9
=183°C
β: 97.8wt%Sn
Microstructure of Pb-Sn eutectic lamellae
• Composition range: C = CE
• Result:- T>TE : liquid with C = CE = 61.9 wt% Sn- T<TE: alternating layers of α and β crystals.
MICROSTRUCTURES IN EUTECTIC SYSTEMS: Equilibrium Cooling (3)
160 µm
B
T E
)Sn%wt8.97()Sn.%wt3.18()Sn%wt9.61(Lheating
cooling
β+α ← →

Eutectic β
L + α200
T(°C)
Composition, wt% Sn20 400
300
100
L
α
60
L: C3wt%Sn
α + β
β
0 80 100
L + β
C318.3
Lα
Lα
Primary α97.8
S1
S2
R1
R2Eutectic α
• Composition range: 18.3wt%Sn < C3 < 61.9wt%Sn(e.g. point B with CB = C3 40wt% Sn) • Just above TE:
WL = (1- Wα) ≈ 50wt%
Cα ≈ 18.3wt%SnCL ≈ 61.9wt%Sn
S1
R1+ S1
Wα = ≈ 50wt%
• Just below TE:
Cα ≈ 18.3wt%SnCβ ≈ 97.8wt%Sn
S2
R2+ S2
Wα = ≈ 73wt%
Wβ ≈ 27wt%
MICROSTRUCTURES IN EUTECTIC SYSTEMS: Equilibrium Cooling (4)
B
CE=61.9
T Eα crystals and α eutectic
microstructure
solid primary α phase in liquid
Results:

T(°C)
(Pb-SnSystem)
L + α200
Co, wt% Sn20 400
300
100
L
α
60
α + β
TE β
080 100
L + β
18.361.9
97.8
C
hypoeutectic hypereutectic
eutectichypereutectic: (illustration only)
160µm
Eutectic alloy
175µm
β
ββ
ββ
β
α
α
α
αα
α
hypoeutectic: less than eutectoid alloy
eutectic micro-constituent
HYPOEUTECTIC & HYPEREUTECTIC
C

Equilibrium Diagrams with Intermediate Phases
α and η are terminal solid solutions: exist near the concentration extremities of the phase diagram
β,γ,ε,δ are intermediate solid solutions (or intermediate phases)
new types (not eutectic) of invariant points (e.g. E, P) and corresponding reactions are shown below
Example: The Copper-Zinc System
α
η
β
γε
δ
E
P
Eutectoid and Peritectic Reactions
• point E (74 wt%Zn at 560°C): again (as in eutectic) three phasesare in equilibrium (δ,γ,ε)• but in this case upon cooling a solidphase transforms to two solid phases,so-called a eutectoid reaction:
)Zn%wt6.78()Zn.%wt5.69()Zn%wt74(heating
cooling
εγδ + ← →
Eutectoidisotherm
•point P (78.6 wt%Zn at 598°C):three phases are in equilibrium (δ,L,ε)• in this case upon heating a solidphase transforms to liquid and anothersolid phases: a peritectic reaction:
)Zn%wt6.78()Zn%wt88(L)Zn%wt76(heating
cooling
εδ ← →
+
How many peritectics do wehave for copper-zinc system?

Equilibrium Diagrams with Intermediate Compounds
Mg2Pb is a intermetalliccompound with a distinct chemical formula (not a solution)
for this specific example, the intermediate compound exists by itself only at this precise composition (region of its existence has infinite width-just a line!!)
the phase diagram in Mg-Pb system can be thought of a two simple eutectic diagrams joined back to back, one for Mg- Mg2Pb system and other Mg2Pb-Pbsystem
Example: Magnesium-Lead System
α
α+L
α+Mg2Pb
L+Mg2Pb
L
L+Mg2Pb
β+Mg2Pb
β+L
βMg2Pb
M

Types of Phase Transformations
• P melting at 598°C: ε ⇒ δ+L (peritectic reaction)occurs with changing of phase composition –incongruent phase transformation• Eutectic, eutectoid and peritectic reactions are examples of incongruent transformations
• γ solid solution at 1310°C and C = 44.9 wt% Ti melts without changing of the composition –congruent transformation• melting of pure metals, allotropictransformations are congruent

IRON-CARBON (Fe-C) System

IRON-CARBON (Fe-C) PHASE DIAGRAM•Iron are alloys with less than0.008 wt% of carbon
•Steels are carbon-iron alloys with carbon in the range 0.008 wt.% to2.14%.
• Cast irons contain 2.14 –6.7wt% of carbon
• Iron and carbons combined to form Fe-Fe3C at the 6.67 % C end of the diagram.
• Eutectoid: 0.76 wt%C, 727°C γ ⇔ α(0.022wt%C)+Fe3C
• Eutectic: 4.30 wt%C, 1147°C L ⇔ γ (2.14 wt%C)+Fe3C

PHASES in Fe-C SYSTEM
• Ferrite - (α ) alpha -iron, which is an interstitial solid solution of a small amount (up to 0.022wt%) of carbon dissolved in iron with a B.C.C.crystal structure. Possesses polymorphic transformation to γ−iron at 912CIt is the softest structure on the iron-iron carbide diagram. Magnetic below 768°C
• Austenite- (γ) gamma-iron: interstitial solid solution of carbon (up to 2.14wt%)
dissolved in iron with a (F.C.C) structure.Stable up to 1394 °C. Non-magnetic phase.
• δ−iron exists between 1394°C and 1538 °CIt may exist in combination with the melt to~ 0.5 %wt C, with austenite to ~ 0.18 %wt C and in a single phase state to ~0.10 %wt C. Delta iron has the B.C.C crystal structure and is magnetic
Cementite - iron carbide: chemical formula, Fe3C, contains 6.67 % wt C. It is a typicalhard and brittle interstitial compound of low tensile but high compressive strength. Its crystal structure is orthorhombic.Metastable phase: at~700 °C slowly (several years) decomposes to α-iron and carbon

Three significant regions can be made relative to the steel portion of the diagram: the eutectoid E, the hypoeutectoid A, and the hypereutectoid B.
Steel Microstructure
α-ferrite
austenite
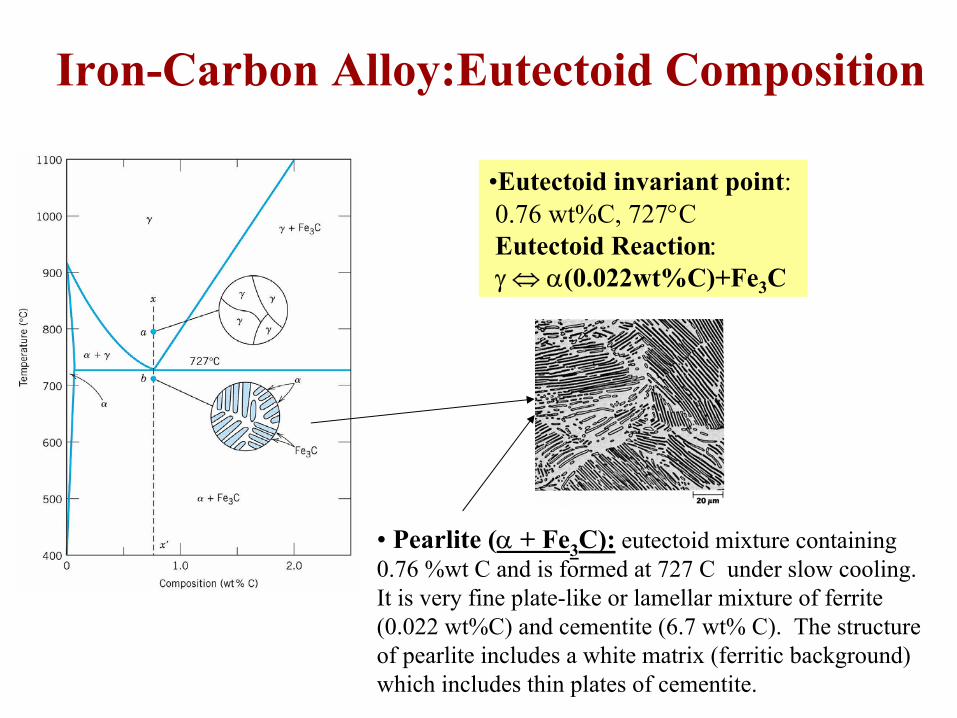
Iron-Carbon Alloy:Eutectoid Composition
•Eutectoid invariant point: 0.76 wt%C, 727°C Eutectoid Reaction: γ ⇔ α(0.022wt%C)+Fe3C
• Pearlite (α + Fe3C): eutectoid mixture containing0.76 %wt C and is formed at 727 C under slow cooling.It is very fine plate-like or lamellar mixture of ferrite(0.022 wt%C) and cementite (6.7 wt% C). The structure of pearlite includes a white matrix (ferritic background) which includes thin plates of cementite.

Iron-Carbon Alloy: Hypo-eutectoid Composition
•Hypo-eutectoid compositions: 0.022-0.76 wt% C (less than eutectoid)
100 µm
Hypo-eutectoid Steel
PearlitePro-eutectoid α(before eutectoid)

Iron-Carbon Alloy: Hyper-eutectoid Composition
•Hypo-eutectoid compositions: 0.76 – 2.14 wt% C
(more than eutectoid)
Hyper-eutectoid Steel
PearlitePro-eutectoid Fe3C(before eutectoid)

Computation of the Relative Amounts of Different Phases in Fe-Fe3C System
• Hypo-eutectoid composition:C’o ; T < TE
• Phases: α-Fe and pearlite• The fraction of pro-eutectoid α-Fe:
74.0C76.0
02.076.0C76.0
UTUW
'o
'o −
=−−
≈+
=α
• The fraction of pearlite:
74.002.0C
02.076.002.0C
UTTW
'o
'o −
=−
−≈
+=α
• Hyper-eutectoid composition:C’1 ; T < TE
• Phases: Fe3C and pearlite• The fraction of pro-eutectoid Fe3C:
TEE
94.576.0C
76.07.676.0C
XVVW
'1
'1
C3Fe−
=−−
=+
=
• The fraction of pearlite:
94.5C70.6
76.07.6C70.6
XVXW
'1
'1
C3Fe−
=−
−=
+=

T E, (
°C)
Concentration of alloying elements, wt%
Ti
Ni600
800
1000
1200
0 4 8 12
Mo SiW
Cr
MnC
E,(w
t% C
) Ni
Ti
0 4 8 120
0.2
0.4
0.6
0.8
Cr
SiMnW
Mo
• Teutectoid changes: • Ceutectoid changes:
ALLOYING STEEL WITH MORE ELEMENTS
Concentration of alloying elements, wt%
In general, alloying elements that added to improve some specific steel properties,also effect the positions of phase boundaries and regions shape on the phase diagram
Example:addition of ~1 wt% of Ti increases TE almost twice!!

Result: Pearlite = alternating layers of α and Fe 3C phases.
120 µm
• 2 important points
-Eutectic (A):
-Eutectoid (B): L ⇒ γ + Fe 3C
γ ⇒ α +Fe 3C
Fe3C
(cem
entit
e)
1600
1400
1200
1000
800
600
4000 1 2 3 4 5 6 6.7
L
γ (austenite)
γ+L
γ+Fe 3C
α+Fe 3C
α+γ
L+Fe 3C
δ
(Fe) Co, wt% C0.77 4.30
727°C = T eutectoid
1148°C
T(°C)
A
B
SR
R S
γ γγγ
Fe 3C (cementite-hard)α (ferrite-soft)
αC
eute
ctoi
d
IRON-CARBON (Fe-C) PHASE DIAGRAM

(Fe-C System)
Co
Fe3C
(cem
entit
e)
1600
1400
1200
1000
800
600
4000 1 2 3 4 5 6 6.7
L
γ (austenite)
γ+L
γ+Fe 3C
α+Fe 3C
L+Fe 3C
δ
Co, wt% C0.77
1148°C
T(°C)
R S
γ γγγ
αs
wFe3C =r/(r+s)wγ =(1-w Fe3C )
wα =S/(R+S)wFe3C =(1-w α)
wpearlite = wγpearlite
60µm Hypereutectoid steel
rγγ
γ γ
γγγ γ
Fe 3C
HYPEREUTECTOID STEEL

HYPOEUTECTOID STEEL
(Fe-C System)
Co
Fe3C
(cem
entit
e)
1600
1400
1200
1000
800
600
4000 1 2 3 4 5 6 6.7
L
γ (austenite)
γ+L
γ+Fe3C
α+Fe3C
L+Fe3C
δ
Co, wt% C0.77
727°C
1148°C
T(°C)
R S
γ γγγ
α
γγγ γ
γγ γ
γ r s
wα =s/(r+s)wγ =(1-w α)
wα =S/(R+S)wFe3C =(1-w α)
wpearlite = wγ
α
αα
αα
α pearlite
100µm Hypoeutectoid steel
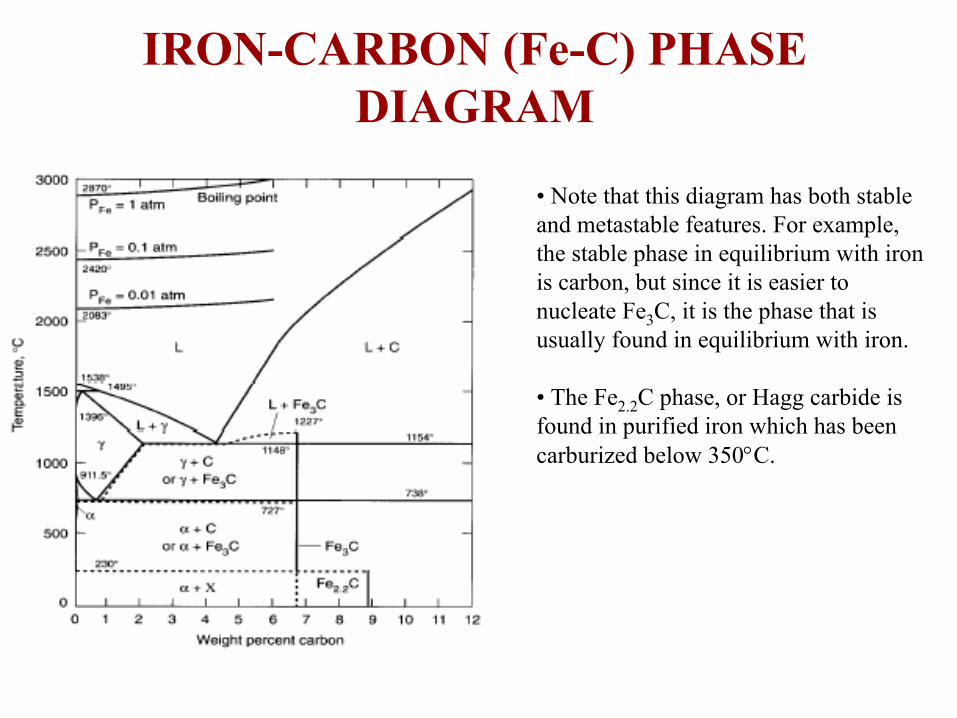
• Note that this diagram has both stable and metastable features. For example, the stable phase in equilibrium with iron is carbon, but since it is easier to nucleate Fe3C, it is the phase that is usually found in equilibrium with iron.
• The Fe2.2C phase, or Hagg carbide is found in purified iron which has been carburized below 350°C.
IRON-CARBON (Fe-C) PHASE DIAGRAM

• Phase diagrams are useful tools to determine:--the number and types of phases,--the wt% of each phase,--and the composition of each phase for a given T and composition of the system.
• Binary eutectics and binary eutectoids allow for a range of microstructures with different properties
SUMMARY


![Mixed phases during the phase transitionsarXiv:1107.0804v1 [nucl-th] 5 Jul 2011 Chapter 9 Mixed phases during the phase transitions Toshitaka Tatsumi1, Nobutoshi Yasutake2, and Toshiki](https://static.fdocuments.in/doc/165x107/5e719edec90d4f07e655fbb8/mixed-phases-during-the-phase-transitions-arxiv11070804v1-nucl-th-5-jul-2011.jpg)