ISSUES PERTAINING TO THE PERMEABILITY CHARACTERISTICS … · ISSUES PERTAINING TO THE PERMEABILITY...
32
277 Technology Parkway • Auburn, AL 36830 NCAT Report 02-06 ISSUES PERTAINING TO THE PERMEABILITY CHARACTERISTICS OF COARSE- GRADED SUPERPAVE MIXES By L. Allen Cooley, Jr. Brian D. Prowell E. Ray Brown July 2002
Transcript of ISSUES PERTAINING TO THE PERMEABILITY CHARACTERISTICS … · ISSUES PERTAINING TO THE PERMEABILITY...
277 Technology Parkway • Auburn, AL 36830
NCAT Report 02-06
ISSUES PERTAINING TO THEPERMEABILITYCHARACTERISTICS OF COARSE-GRADED SUPERPAVE MIXES
By
L. Allen Cooley, Jr.Brian D. ProwellE. Ray Brown
July 2002
ISSUES PERTAINING TO THE PERMEABILITY CHARACTERISTICSOF COARSE-GRADED SUPERPAVE MIXES
By
L. Allen Cooley, Jr.Civil Engineer
National Center for Asphalt TechnologyAuburn University, Alabama
Brian D. ProwellCivil Engineer
National Center for Asphalt TechnologyAuburn University, Alabama
and
E. Ray BrownDirector
National Center for Asphalt TechnologyAuburn University, Alabama
NCAT Report 02-06
July 2002

-i-
DISCLAIMER
The contents of this report reflect the views of the authors who are solely responsible forthe facts and the accuracy of the data presented herein. The contents do not necessarily reflectthe official views and policies of the National Center for Asphalt Technology of AuburnUniversity. This report does not constitute a standard, specification, or regulation.
-ii-
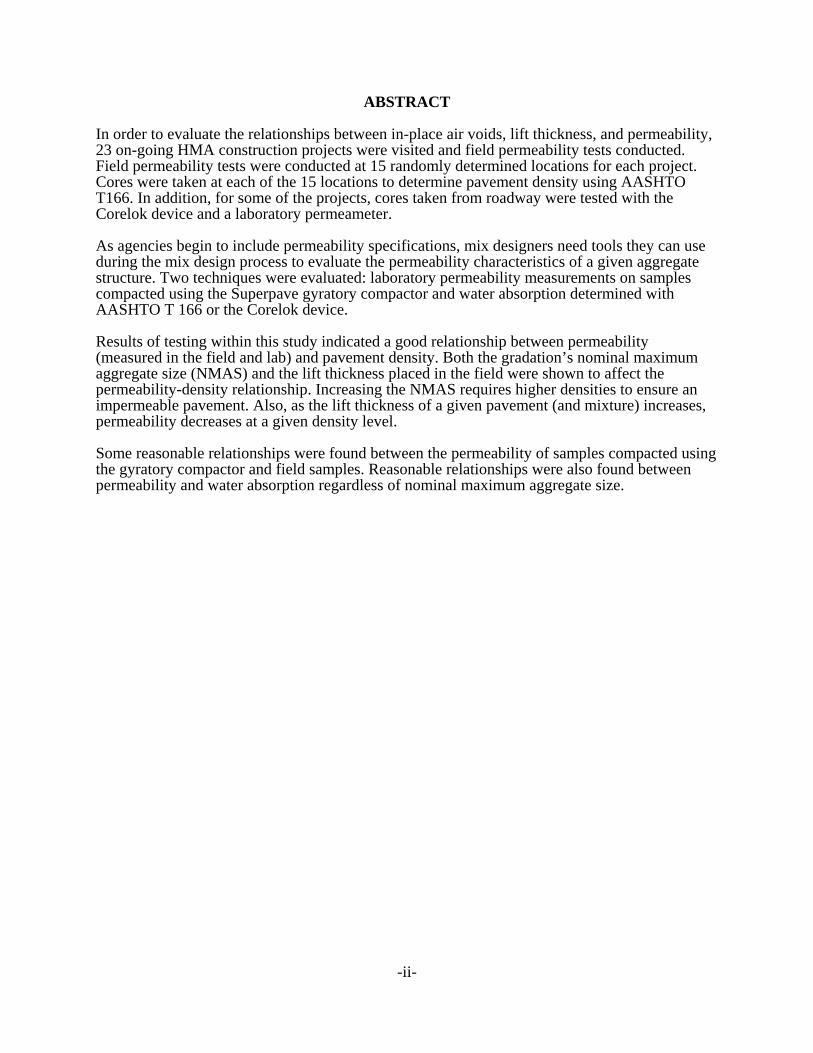
ABSTRACT
In order to evaluate the relationships between in-place air voids, lift thickness, and permeability,23 on-going HMA construction projects were visited and field permeability tests conducted.Field permeability tests were conducted at 15 randomly determined locations for each project.Cores were taken at each of the 15 locations to determine pavement density using AASHTOT166. In addition, for some of the projects, cores taken from roadway were tested with theCorelok device and a laboratory permeameter.
As agencies begin to include permeability specifications, mix designers need tools they can useduring the mix design process to evaluate the permeability characteristics of a given aggregatestructure. Two techniques were evaluated: laboratory permeability measurements on samplescompacted using the Superpave gyratory compactor and water absorption determined withAASHTO T 166 or the Corelok device.
Results of testing within this study indicated a good relationship between permeability(measured in the field and lab) and pavement density. Both the gradation’s nominal maximumaggregate size (NMAS) and the lift thickness placed in the field were shown to affect thepermeability-density relationship. Increasing the NMAS requires higher densities to ensure animpermeable pavement. Also, as the lift thickness of a given pavement (and mixture) increases,permeability decreases at a given density level.
Some reasonable relationships were found between the permeability of samples compacted usingthe gyratory compactor and field samples. Reasonable relationships were also found betweenpermeability and water absorption regardless of nominal maximum aggregate size.
Cooley Jr., Prowell, & Brown
1
ISSUES PERTAINING TO THE PERMEABILITY CHARACTERISTICS OF COARSE-GRADED SUPERPAVE MIXES
L. Allen Cooley Jr., Brian D. Prowell, and E. Ray Brown
INTRODUCTION
It is important in the construction of hot mix asphalt (HMA) that the mix be adequatelycompacted in-place so that the initial permeability is low and there will not be significantadditional densification under traffic. For dense-graded mixes, numerous studies have shownthat initial in-place air void content should not be below approximately 3 percent or aboveapproximately 8 percent (1). Low in-place air voids have been shown to result in rutting,bleeding, and shoving, while high air voids allow water and air to penetrate into the pavementleading to an increased potential for water damage, oxidation, raveling, and cracking.
In the past, it has been thought that for most conventional dense-graded HMA, increases in in-place air void contents have meant increases in the permeability of pavements. Zube (2)indicated during the 1960s dense-graded pavements become excessively permeable at in-placeair voids above 8 percent. This value was later confirmed by Brown et al. (3) during the 1980s.However, due to problems associated with coarse-graded (gradation passing below maximumdensity line and restricted zone) Superpave designed mixes, the size and interconnectivity of airvoids have been shown to greatly influence permeability (4). A study conducted by the FloridaDepartment of Transportation (FDOT) indicated that coarse-graded Superpave mixes can beexcessively permeable to water at in-place air voids less than 8 percent.
Numerous factors can potentially affect the permeability of HMA pavements. In a study by Fordand McWilliams (5), it was suggested that aggregate particle size distribution, aggregate particleshape, and pavement density (air voids or percent compaction) can affect permeability. Hudsonand Davis (6) concluded that permeability is dependent on the size of air voids within apavement, not just the total volume percentage of voids. Recent work in Maine by Mallick et al.(7) has also shown that the nominal maximum aggregate size (NMAS) and lift thickness for agiven NMAS affects permeability.
Work by FDOT also indicated that lift thickness can have an influence on density, and hencepermeability (8). FDOT constructed numerous pavement test sections on Interstate 75 thatincluded mixes of different NMAS and lift thicknesses. Results of this experiment suggested thatincreased lift thicknesses can lead to better pavement density and, hence, lower permeability.
The three items discussed, density, lift thickness, and permeability, are all interrelated.Permeability has been shown to be related to pavement density. Increased lift thickness has beenshown to allow desirable density levels to be more easily achieved. Based upon theseconfounding factors, the objectives of this study were to characterize the effect of typicallyspecified values (density, NMAS, and lift thickness) on the permeability of coarse-gradedSuperpave mixes. In addition, the paper examines water absorption from water displacementbulk specific gravity measurements and permeability of gyratory compacted samples aspredictors of field permeability. This would allow a mix designer to evaluate various mixproperties for permeability potential.
REVIEW OF LITERATURE
A brief review of literature on the permeability of HMA pavements suggested that a significantamount of work has been conducted. Primarily, this work has been to evaluate the relationshipbetween permeability and pavement density. Permeability testing in the literature has been donein both the laboratory and field. Laboratory testing has usually been done using water and a
Cooley Jr., Prowell, & Brown
2
falling head approach (4, 9, 10, 11, 12, 13, 14). Field permeability testing has been conductedusing both air (15, 16, 17) and water (2, 7, 10, 14, 18).
Numerous researchers have shown that permeability (both lab and field) is related to pavementdensity (2, 3, 4, 7, 9, 10, 11, 13, 17, 18, 20). Several factors have been shown to affect therelationship between permeability and density. First, Mallick et al. (7) have shown that nominalmaximum aggregate size of a mix can significantly affect this relationship. Work by Cooley andBrown (19) and Maupin (13) has also shown similar trends in the relationship between NMASand permeability of dense-graded HMA mixes. Cooley and Brown (20) have also shown asimilar relationship for SMA mixes.
Research by Mallick et al. (7) and Musselman et al (8) has shown that lift thickness on theroadway can also affect density and permeability. Westerman (10), Choubane et al. (4), andMusselman et al. (8) have suggested that a lift thickness to NMAS ratio (t/NMAS) of 4.0 ispreferred. Most guidance recommends that a minimum t/NMAS of 3.0 be used (21).
Another factor that can affect the relationship between permeability and density is the gradationshape for a given NMAS. Choubane et al. (4) suggested that fine-graded (passing abovemaximum density line and restricted zone) Superpave mixes tend to be less permeable thancoarse-graded mixes at similar air void levels.
Work by Cechetini (16) has suggested that the type of roller and rolling pattern duringconstruction can affect pavement permeability. Based upon Cechetini, vibratory rollers reducethe potential for permeability.
Zube (2) has suggested that the time of construction can also affect permeability characteristicsover time. Pavements constructed during the summer can be expected to “seal up” due to trafficand thus reduce pavement permeability quickly. Pavements constructed in the fall may not “sealup” due to cooler weather and lead to permeability problems for an extended time period.
The permeability characteristics of an HMA pavement are important because a number ofresearchers have shown that permeability is directly related to durability (9, 12, 17). When apavement is permeable, both air and water can permeate into the void structure of a pavement.Water entering the pavement can lead to moisture-induced damage, while air penetrating into apavement can lead to excessive age hardening of the binder and, thus, premature cracking.
SCOPE
In order to evaluate the relationships between in-place air voids, lift thickness, and permeability,23 on-going HMA construction projects were visited and field permeability tests conducted. Thefield permeameter has been described previously by Cooley (14) and Cooley and Brown (18).
For each field project visited, field permeability tests were conducted at a total of fifteenrandomly selected locations. At each test location, replicate permeability tests were conducted(single tests were performed for six projects in one state). Because the field permeameter uses asilicone-rubber caulk to help seal the device to the pavement, replicate tests could not beconducted on the same spot of the pavement. Therefore, after the first replicate at a given testlocation was completed, the device was lifted off the pavement and re-sealed immediately besidethe first replicate to conduct the second replicate test. The device was moved longitudinallydown the pavement during these replicate tests because pavement density tends to be moreuniform longitudinally than transversely.
For each of the fifteen test locations, a single 150 mm core was cut from the pavement within theregion field permeability tests were conducted. The core was used to measure pavement density
Cooley Jr., Prowell, & Brown
3
and to determine the actual placed lift thickness on the roadway. For all projects, the bulkspecific gravity of the cores was measured using AASHTO T 166 (water displacement method).For some projects, the bulk specific gravity of the cores was also measured using the vacuumsealing method (Corelok) described by Buchanan (22). Theoretical maximum specific gravity(Gmm) measurements were obtained from the testing of plant produced mix and used to calculatein-place air void contents.
PROJECT DESCRIPTIONS
A total of 23 on-going HMA construction projects were tested during this study. The commonthread between all 23 projects was that mix from each project was designed using Superpaveprotocols and that the gradations of each mix passed below the maximum density line at the 2.36mm (No. 8) sieve. For the purposes of this study, coarse-graded Superpave gradations weredefined as gradations passing below the Superpave defined maximum density line at the 2.36mm (No. 8) sieve.
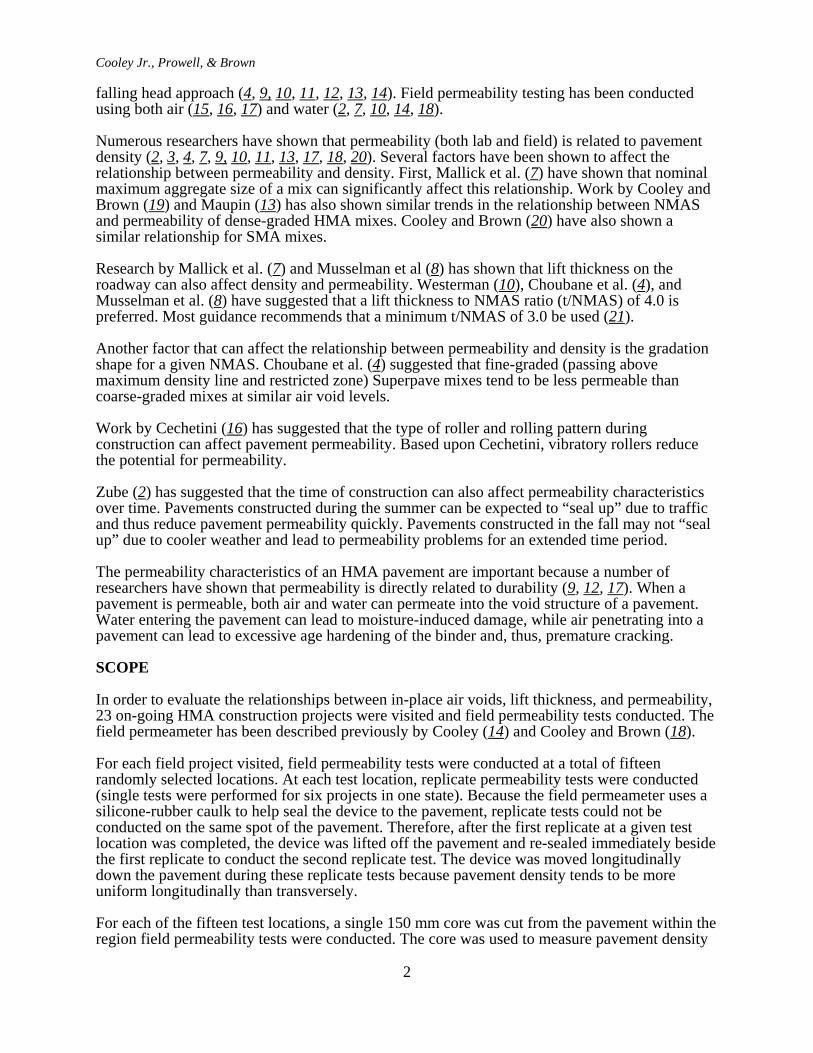
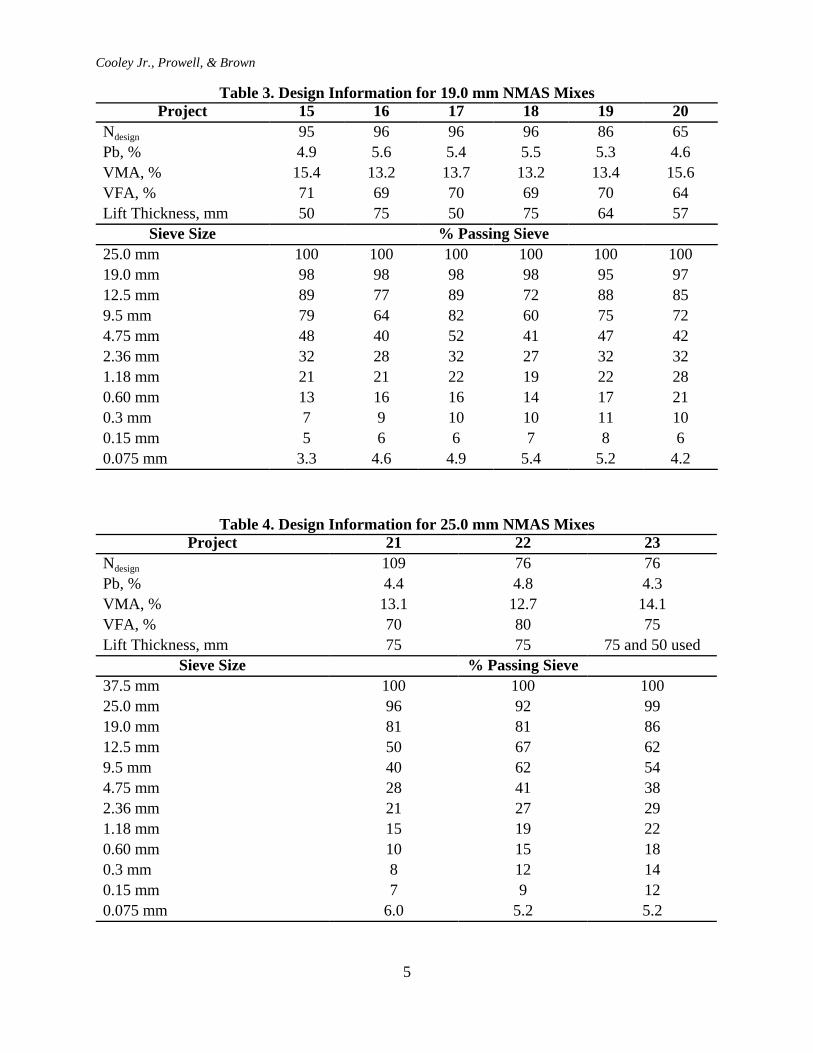
Tables 1 though 4 present design information for the 23 projects tested during this study. Table 1shows information on six 9.5 mm NMAS mixes. Design compactive efforts for the six mixesranged from a low of 75 gyrations to a high of 100 gyrations. Binder contents ranged from 5.5percent to 7.9 percent. Project 5, which had the 7.9 percent binder content, was actually an SMAmix. Design lift thicknesses for the six projects were all similar ranging from 38 to 40 mm.Voids in mineral aggregate (VMA) values ranged from 15.0 to 20.1 percent. Besides the onestone matrix asphalt (SMA) project (Project 5), all of the gradations are also similar except thepercent passing the 0.075 mm sieve was a lower at 3.8 percent (Project 1).
Table 1. Design Information on 9.5 mm NMAS MixesProject 1 2 3 4 5 6
Ndesign 96 86 96 96 100 75Pb, % 5.5 5.7 5.9 6.2 7.9 5.9VMA, % 15.0 15.4 15.5 15.1 20.1 15.4VFA, % 73 74 74 74 82 84Lift Thickness, mm 40 38 38 38 38 38
Sieve Size % Passing Sieve12.5 mm 100 100 100 100 100 1009.5 mm 93 94 97 93 94 964.75 mm 56 63 64 59 36 662.36 mm 33 38 37 38 22 451.18 mm 26 21 24 26 19 3160 mm 20 15 17 19 17 210.30 mm 12 11 11 11 16 120.15 mm 8 8 7 7 14 80.075 mm 3.8 4.9 5.1 5.5 10.4 5.2
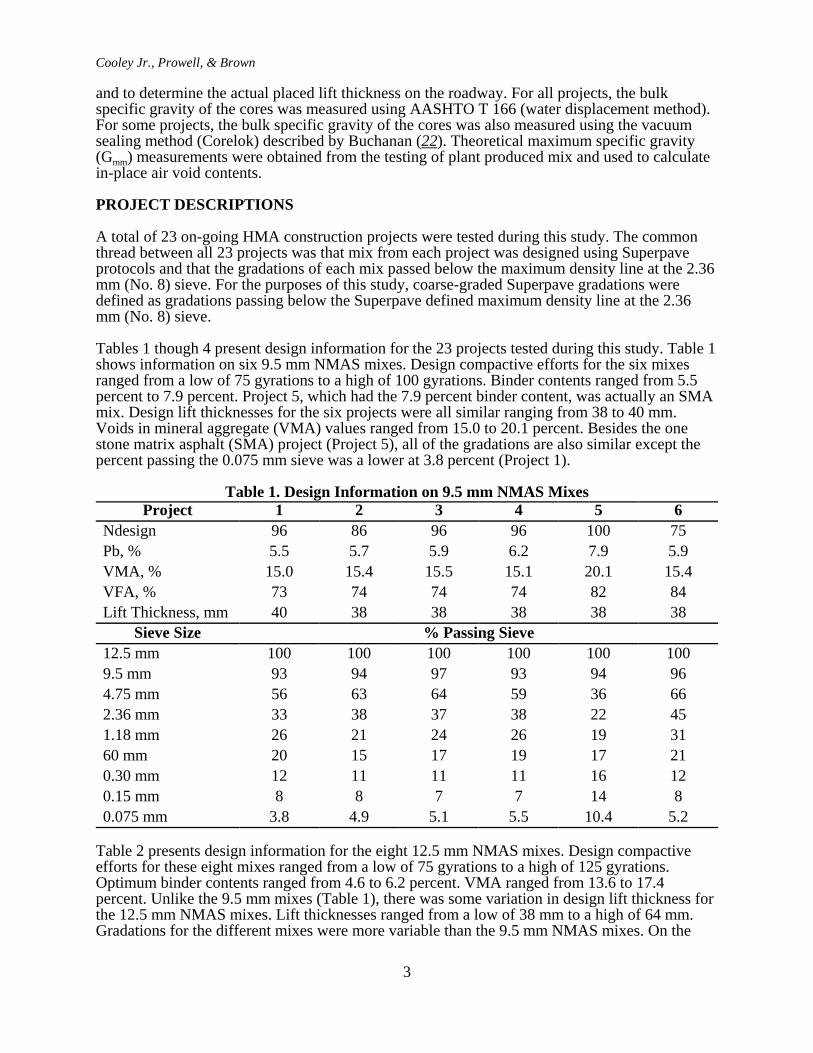
Table 2 presents design information for the eight 12.5 mm NMAS mixes. Design compactiveefforts for these eight mixes ranged from a low of 75 gyrations to a high of 125 gyrations.Optimum binder contents ranged from 4.6 to 6.2 percent. VMA ranged from 13.6 to 17.4percent. Unlike the 9.5 mm mixes (Table 1), there was some variation in design lift thickness forthe 12.5 mm NMAS mixes. Lift thicknesses ranged from a low of 38 mm to a high of 64 mm.Gradations for the different mixes were more variable than the 9.5 mm NMAS mixes. On the
Cooley Jr., Prowell, & Brown
4
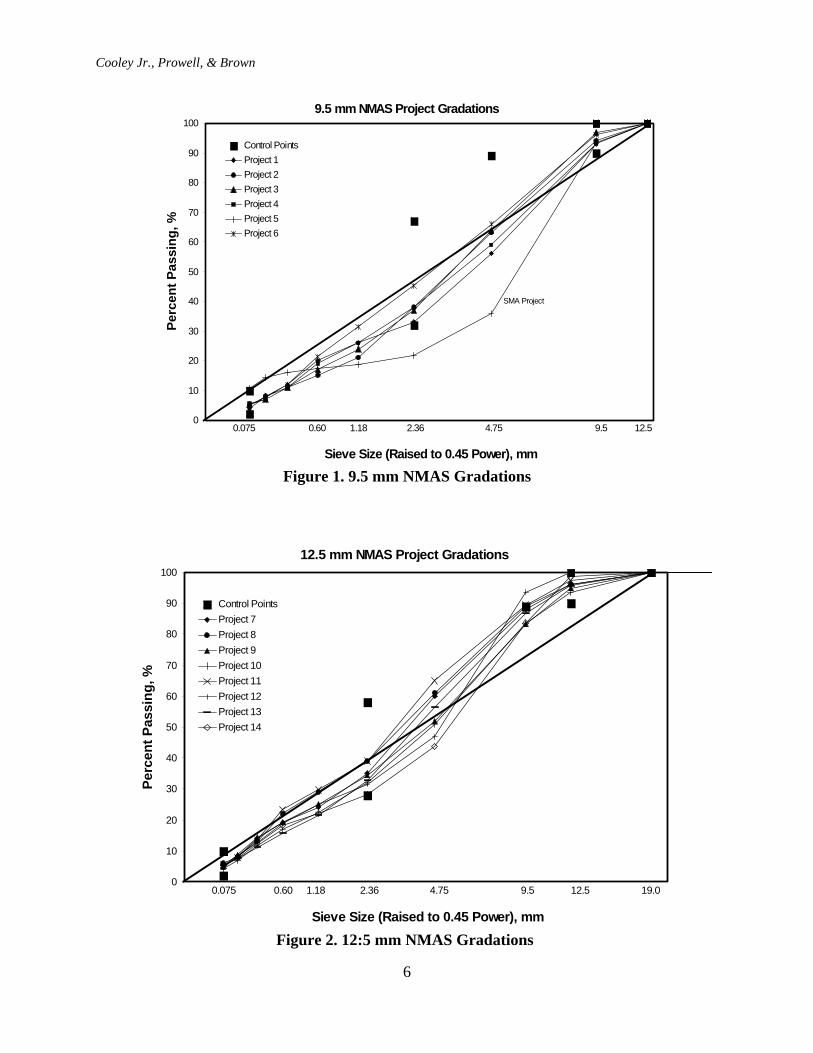
2.36 mm sieve, values of percent passing ranged from 28 to 39 percent. On the 0.075 mm sieve,values of percent passing ranged from 4.1 to 6.1 percent passing. the 12.5 mm NMAS gradationsare illustrated in Figure 2.
Table 2. Design Information for 12.5 mm NMAS MixesProject 7 8 9 10 11 12 13 14
Ndesign 96 96 125 125 96 75 75 75Pb, % 5.2 6.2 4.8 4.6 5.7 5.4 5.3 6.1VMA, % 14.6 14.1 13.6 14.1 14.2 16.5 17.4 16.7VFA, % 73 73 69 71 72 76 75 78Lift Thickness, mm 50 50 34 38 50 50 50 64
Sieve Size % Passing Sieve19.0 mm 100 100 100 100 100 100 100 10012.5 mm 96 96 95 94 97 100 96 999.5 mm 88 89 83 84 89 84 87 844.75 mm 60 61 52 51 65 47 56 442.36 mm 55 39 35 32 39 32 33 281.18 mm 24 29 25 23 30 25 22 220.6 mm 19 22 19 17 23 19 16 180.3 mm 14 13 14 12 14 13 11 130.15 mm 8 8 9 7 8 8 8 80.075 mm 4.8 6.1 4.8 4.1 5.4 5.3 5.3 5.5
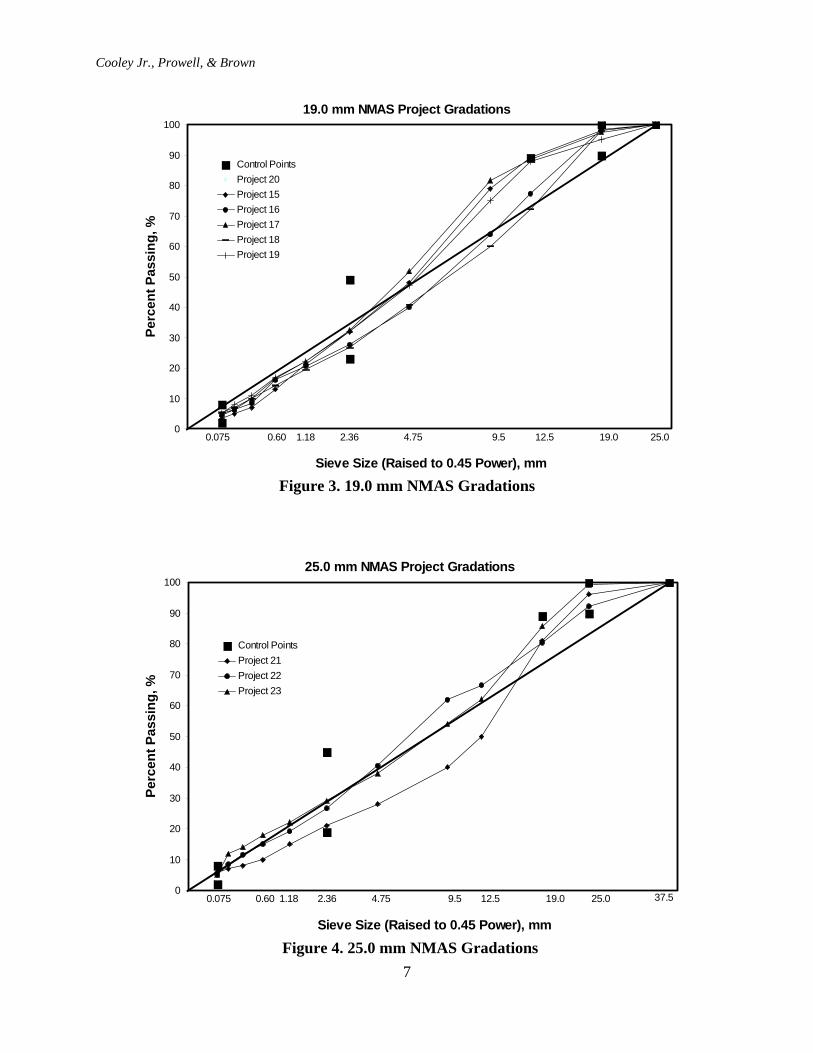
Table 3 presents the information for six 19.0 mm NMAS mixes encountered in this study. for thesix 19.0 mm NMAS mixes, design compactive efforts ranged from a low of 65 gyrations to ahigh of 96 gyrations. Optimum binder contents ranged from 4.6 to 5.6 percent. Values of VMAranged from 13.2 to 15.6 percent. The lowest design left thickness encountered for the 19.0 mmNMAS mixes was 50 mm while the highest was 75 mm. Gradations were only available for fiveof the six mixes and are illustrated in Figure 3.
Table 4 presents design information for three 25.0 NMAS mixes. Design compactive efforts forthese three mixes were 76 and 109 gyrations. Optimum asphalt contents ranged from 4.3 to 4.8percent. VMA values ranged from 12.7 to 14.1 percent. All three of the projects utilized a designlift thickness of 75 mm. However, for Project 23 two separate lifts were tested. The first lifttested had a design lift thickness of 75 mm. This lift was placed directly on an aggregate base.The second lift tested had a design lift thickness of 50 mm and was placed over the initial 75 mmlift. Percent passing the 4.75 mm sieve ranged from 28 to 41 percent. On the 0.075 mm sieve, thepercent passing ranged from 5.2 to 6.0 percent. The 25.0 mm NMAS project gradations areillustrated in Figure 4.
Cooley Jr., Prowell, & Brown
5
Table 3. Design Information for 19.0 mm NMAS MixesProject 15 16 17 18 19 20
Ndesign 95 96 96 96 86 65Pb, % 4.9 5.6 5.4 5.5 5.3 4.6VMA, % 15.4 13.2 13.7 13.2 13.4 15.6VFA, % 71 69 70 69 70 64Lift Thickness, mm 50 75 50 75 64 57
Sieve Size % Passing Sieve25.0 mm 100 100 100 100 100 10019.0 mm 98 98 98 98 95 9712.5 mm 89 77 89 72 88 859.5 mm 79 64 82 60 75 724.75 mm 48 40 52 41 47 422.36 mm 32 28 32 27 32 321.18 mm 21 21 22 19 22 280.60 mm 13 16 16 14 17 210.3 mm 7 9 10 10 11 100.15 mm 5 6 6 7 8 60.075 mm 3.3 4.6 4.9 5.4 5.2 4.2
Table 4. Design Information for 25.0 mm NMAS MixesProject 21 22 23
Ndesign 109 76 76Pb, % 4.4 4.8 4.3VMA, % 13.1 12.7 14.1VFA, % 70 80 75Lift Thickness, mm 75 75 75 and 50 used
Sieve Size % Passing Sieve37.5 mm 100 100 10025.0 mm 96 92 9919.0 mm 81 81 8612.5 mm 50 67 629.5 mm 40 62 544.75 mm 28 41 382.36 mm 21 27 291.18 mm 15 19 220.60 mm 10 15 180.3 mm 8 12 140.15 mm 7 9 120.075 mm 6.0 5.2 5.2
Cooley Jr., Prowell, & Brown
6
9.5 mm NMAS Project Gradations
0
10
20
30
40
50
60
70
80
90
100
Sieve Size (Raised to 0.45 Power), mm
Perc
ent P
assi
ng, %
Control PointsProject 1Project 2Project 3Project 4Project 5Project 6
0.075 0.60 1.18 2.36 4.75 9.5 12.5
SMA Project
Figure 1. 9.5 mm NMAS Gradations
12.5 mm NMAS Project Gradations
0
10
20
30
40
50
60
70
80
90
100
Sieve Size (Raised to 0.45 Power), mm
Perc
ent P
assi
ng, %
Control PointsProject 7Project 8Project 9Project 10Project 11Project 12Project 13Project 14
0.075 0.60 1.18 2.36 4.75 9.5 12.5 19.0
Figure 2. 12:5 mm NMAS Gradations
Cooley Jr., Prowell, & Brown
7
19.0 mm NMAS Project Gradations
0
10
20
30
40
50
60
70
80
90
100
Sieve Size (Raised to 0.45 Power), mm
Perc
ent P
assi
ng, %
Control PointsProject 20Project 15Project 16Project 17Project 18Project 19
0.075 0.60 1.18 2.36 4.75 9.5 12.5 19.0 25.0
Figure 3. 19.0 mm NMAS Gradations
25.0 mm NMAS Project Gradations
0
10
20
30
40
50
60
70
80
90
100
Sieve Size (Raised to 0.45 Power), mm
Perc
ent P
assi
ng, %
Control PointsProject 21Project 22Project 23
0.075 0.60 1.18 2.36 4.75 9.5 12.5 19.0 25.0 37.5
Figure 4. 25.0 mm NMAS Gradations
Cooley Jr., Prowell, & Brown
8
Test Methods
Core densities for all projects were measured using AASHTO T166. For projects in which theCorelok was used, core densities were first determined with the Corelok device and then inaccordance with AASHTO T-166. The Corelok device was designed to aid in the densitydetermination of HMA samples with water absorption greater than 2 percent. AASHTO T166,Standard Specification for Bulk Specific Gravity of Compacted Bituminous Mixtures UsingSaturated Surface-Dry Specimens, specifies that the specimens with greater than 2 percent waterabsorption be tested with paraffin or parafilm (AASHTO T 275). Both of these procedures areextremely time consuming. The Corelok device was developed to vacuum seal a specimen in aplastic bag, which can in turn be measured in a manner similar to parafilm. The maximumspecific gravity, used to calculate percent density (or in-place air voids), was conducted on plant-produced material in accordance with AASHTO T209.
The field permeability device utilized in this study was developed by the National Center forAsphalt Technology (14). This device uses a three-tier standpipe with each standpipe having adifferent diameter. The standpipe with the smallest diameter is at the top and the largest diameterstandpipe is at the bottom. This configuration was designed in an effort to make the permeametermore sensitive to the flow of water into a pavement. For pavements that are relativelyimpermeable, the water will fall within the top tier standpipe very slowly. Additionally, becauseof the small diameter of the top standpipe, the device is very sensitive to water draining from thedevice.
For pavements of “medium” permeability, the water flows through the top-tier standpipe quicklybut slows down when it reaches the larger diameter middle standpipe. Likewise, for a verypermeable pavement, the water will flow quickly through the top and middle tiers and slowdown in the larger diameter bottom standpipe.
The device is sealed to the pavement surface using silicon-rubber caulk. At the bottom of thedevice is a square base plate. A flexible rubber mat with a hole cut to the diameter of the lowesttier standpipe is placed below the metal base plate. The silicon-rubber caulk is placed onto thebottom of the rubber mat. A weight is then placed onto the top of the base plate. The weight wasdesigned to resist the hydrostatic uplift forces when the permeameter is filled with water and toprovide a downward force to help seal the device. The rubber mat was incorporated into thesealing system because, being flexible, the mass of the weight would push the silicon-rubbercaulk into the surface voids of the pavement. This results in a repeatable seal to the pavementsurface, which prevents water from escaping through the surface texture of the pavement.
Based upon NCAT’s work with the field permeability device, a standardized test procedure wasdeveloped. This procedure can be found in 14.
It should be stated that results from the field permeability device are not a true measure ofpermeability (hydraulic conductivity), but rather an index of permeability. Water exiting the fielddevice can flow vertically and/or horizontally and, therefore, can have three-dimensional flow.However, for simplicity, the flow rate, or index of permeability, measured by the field device isreferred to as permeability within this paper since the measured units are the same as typicalpermeability tests (cm/sec). The strength of the data presented herein is that results of field testswere conducted with similar devices, utilizing identical test methods.
The laboratory permeameter used for this study is commercially sold and is essentially thesecond generation of the lab device developed by the Florida DOT (4). The device is a flexiblewall, falling head permeameter that applies a confining seal via air pressure. Currently, nonational standardized procedure is available for the lab device; however, a task group under theASTM Subcommittee D04.23 is in the process of developing a standardized test method. A
Cooley Jr., Prowell, & Brown
9
Relationship Between Field Permeability and In-Place Air Voids 9.5 mm NMAS
y = 0.0054x4.9098
R2 = 0.6925Overall Data
0
500
1000
1500
2000
2500
3000
3500
4000
2.0 4.0 6.0 8.0 10.0 12.0 14.0 16.0 18.0
In-Place Air Void Content, %
Fiel
d Pe
rmea
bilit
y, E
-5 c
m/s
ec
Project 1Project 2Project 3Project 4Project 5Project 6
Project 1: R2 = 0.83Project 2: R2 = 0.24Project 3: R2 = 0.54Project 4: R2 = 0.80Project 5: R2 = 0.58Project 6: R2 = 0.67
Figure 5. Relationship Between Permeability and Density ~ 9.5 mm NMAS Mixes
standardized test procedure was developed for use in this study based upon the work of the taskgroup and can be found in (14).
RESULTS AND DISCUSSION
This section provides the results of analyses conducted to accomplish the objectives of thisstudy.
Relationship Between Field Permeability and In-Place Density
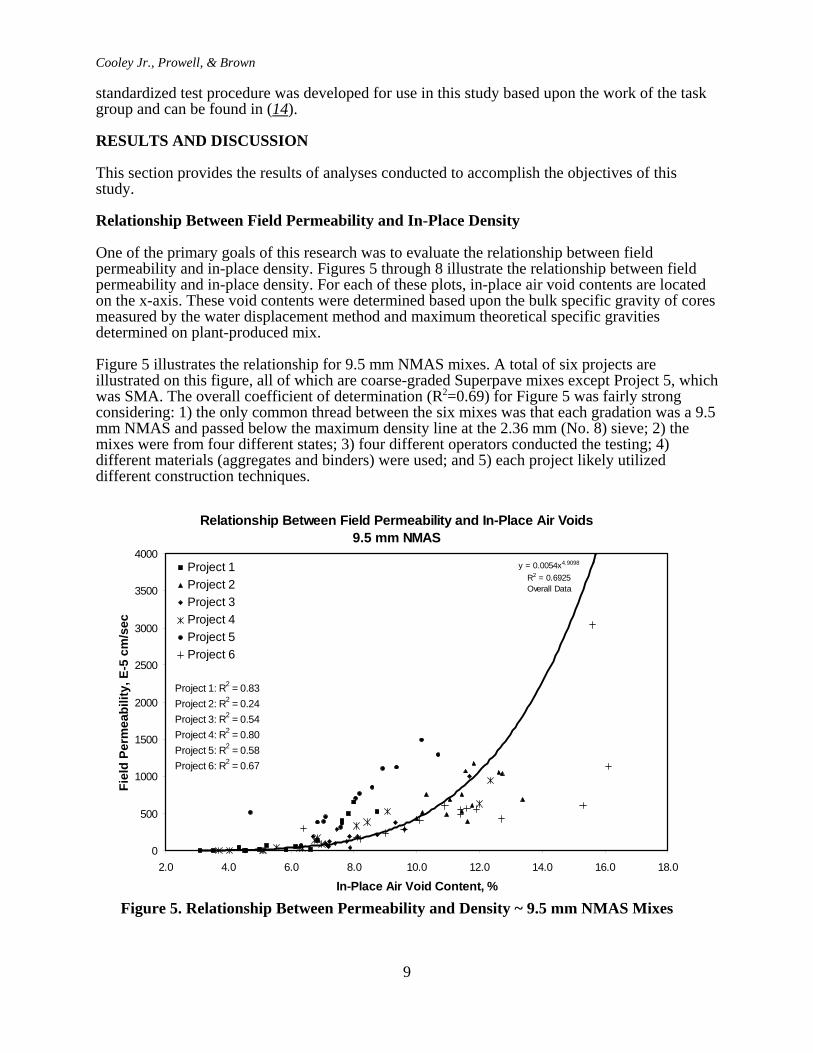
One of the primary goals of this research was to evaluate the relationship between fieldpermeability and in-place density. Figures 5 through 8 illustrate the relationship between fieldpermeability and in-place density. For each of these plots, in-place air void contents are locatedon the x-axis. These void contents were determined based upon the bulk specific gravity of coresmeasured by the water displacement method and maximum theoretical specific gravitiesdetermined on plant-produced mix.
Figure 5 illustrates the relationship for 9.5 mm NMAS mixes. A total of six projects areillustrated on this figure, all of which are coarse-graded Superpave mixes except Project 5, whichwas SMA. The overall coefficient of determination (R2=0.69) for Figure 5 was fairly strongconsidering: 1) the only common thread between the six mixes was that each gradation was a 9.5mm NMAS and passed below the maximum density line at the 2.36 mm (No. 8) sieve; 2) themixes were from four different states; 3) four different operators conducted the testing; 4)different materials (aggregates and binders) were used; and 5) each project likely utilizeddifferent construction techniques.
Cooley Jr., Prowell, & Brown
10
The R2 value of 0.69 indicates that 69 percent of the variation in field permeabilitymeasurements for 9.5 mm NMAS mixes can be attributed to changes in in-place air voids.Therefore, a pavement’s permeability is greatly influenced by the total number of air voidswithin the pavement. Based upon the relationship, permeability is very low at low in-place airvoid contents below 5 percent. From 5 to 7 percent voids, the permeability begins to increase at agreater rate with changes in in-place air voids. These results are very similar to those presentedby Choubane et al. (4). At voids above approximately 8 percent, small changes in densityresulted in large increases in field permeability.
For Figure 5, two of the six projects appear to be influencing the overall R2 value (Projects 5 and6). Interestingly, Project 5 utilized a SMA gradation and Project 6 utilized the finest gradation(Figure 1). Data points for the SMA (Project 5) all fall above the best-fit trend line while the datafor Project 6 fell below the best-fit line. This suggests that SMA mixes may have a higherpotential for permeability than dense-graded mixes, at a given void level. (Note that eleven ofthe fifteen data points for the SMA have in-place air void contents above 6 percent. Numerousresearchers have suggested that SMA mixes should be compacted to at least 94 percent of Ricedensity. The data in Figure 5 seems to support this conclusion.)
Most of the data points for Project 6 fall below the overall trend line. Since this project utilizedthe finest of the 9.5 mm NMAS gradations (follows near maximum density line), it appears thatfiner gradations may reduce the potential for permeability in the field as suggested by Choubaneet al. (4).
Based upon the relationship between field permeability and in-place air voids, Cooley et al. (19)have suggested that 9.5 mm NMAS mixes become excessively permeable at in-place air voidcontents above 7.7 percent, which corresponded to a field permeability value of 100x10-5 cm/sec.The data in Figure 5 seems to also suggest that 9.5 mm NMAS mixes become excessivelypermeable at in-place air void contents above 7.5 to 8 percent.
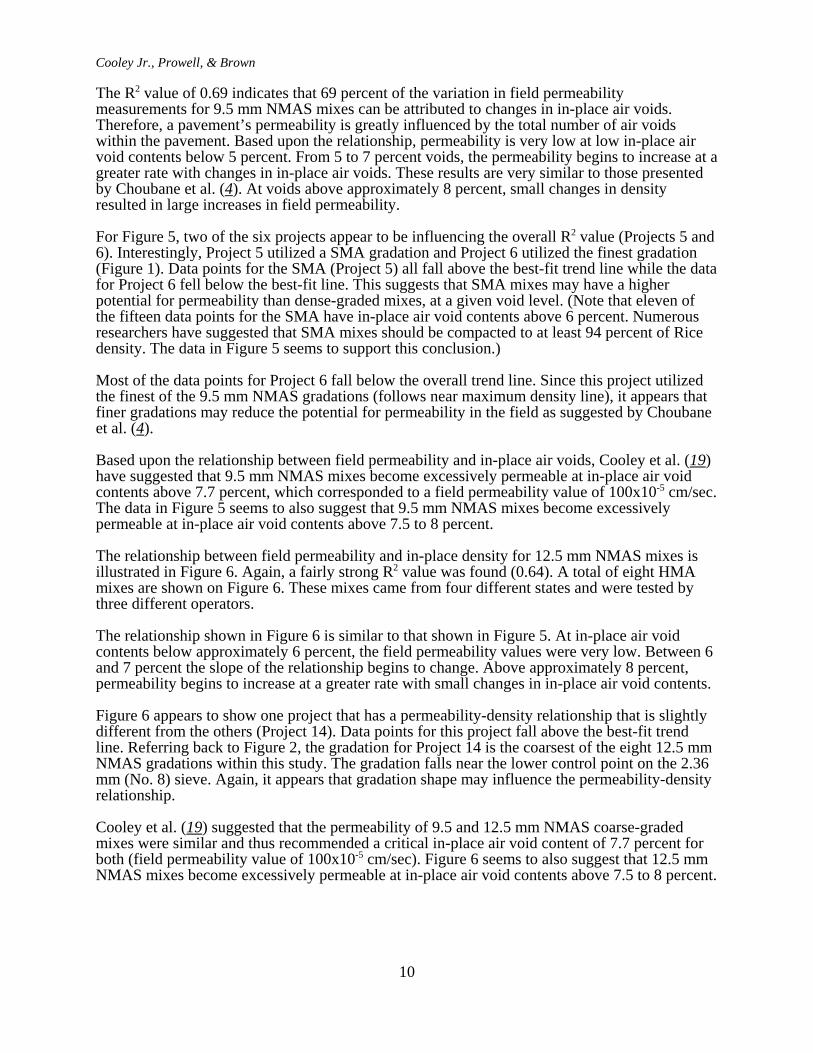
The relationship between field permeability and in-place density for 12.5 mm NMAS mixes isillustrated in Figure 6. Again, a fairly strong R2 value was found (0.64). A total of eight HMAmixes are shown on Figure 6. These mixes came from four different states and were tested bythree different operators.
The relationship shown in Figure 6 is similar to that shown in Figure 5. At in-place air voidcontents below approximately 6 percent, the field permeability values were very low. Between 6and 7 percent the slope of the relationship begins to change. Above approximately 8 percent,permeability begins to increase at a greater rate with small changes in in-place air void contents.
Figure 6 appears to show one project that has a permeability-density relationship that is slightlydifferent from the others (Project 14). Data points for this project fall above the best-fit trendline. Referring back to Figure 2, the gradation for Project 14 is the coarsest of the eight 12.5 mmNMAS gradations within this study. The gradation falls near the lower control point on the 2.36mm (No. 8) sieve. Again, it appears that gradation shape may influence the permeability-densityrelationship.
Cooley et al. (19) suggested that the permeability of 9.5 and 12.5 mm NMAS coarse-gradedmixes were similar and thus recommended a critical in-place air void content of 7.7 percent forboth (field permeability value of 100x10-5 cm/sec). Figure 6 seems to also suggest that 12.5 mmNMAS mixes become excessively permeable at in-place air void contents above 7.5 to 8 percent.
Cooley Jr., Prowell, & Brown
11
Relationship Between Field Permeability and In-Place Air Voids 12.5 mm NMAS
y = 0.0047x4.8672
R2 = 0.6423Overall Data
0
500
1000
1500
2000
2500
3000
3500
4000
2.0 4.0 6.0 8.0 10.0 12.0 14.0 16.0
In-Place Air Void Content, %
Fiel
d Pe
rmea
bilit
y, E
-5 c
m/s
ec
Project 7Project 8Project 9Project 10Project 11Project 12Project 13Project 14
Project 7: R2 = 0.14Project 8: R2 = 0.79Project 9: R2 = 0.59Project 10: R2 = 0.60Project 11: R2 = 0.67Project 12: R2 = 0.86Project 13: R2 = 0.95Project 14: R2 = 0.88
Figure 6. Relationship Between Permeability and Density ~ 12.5 mm NMAS Mixes
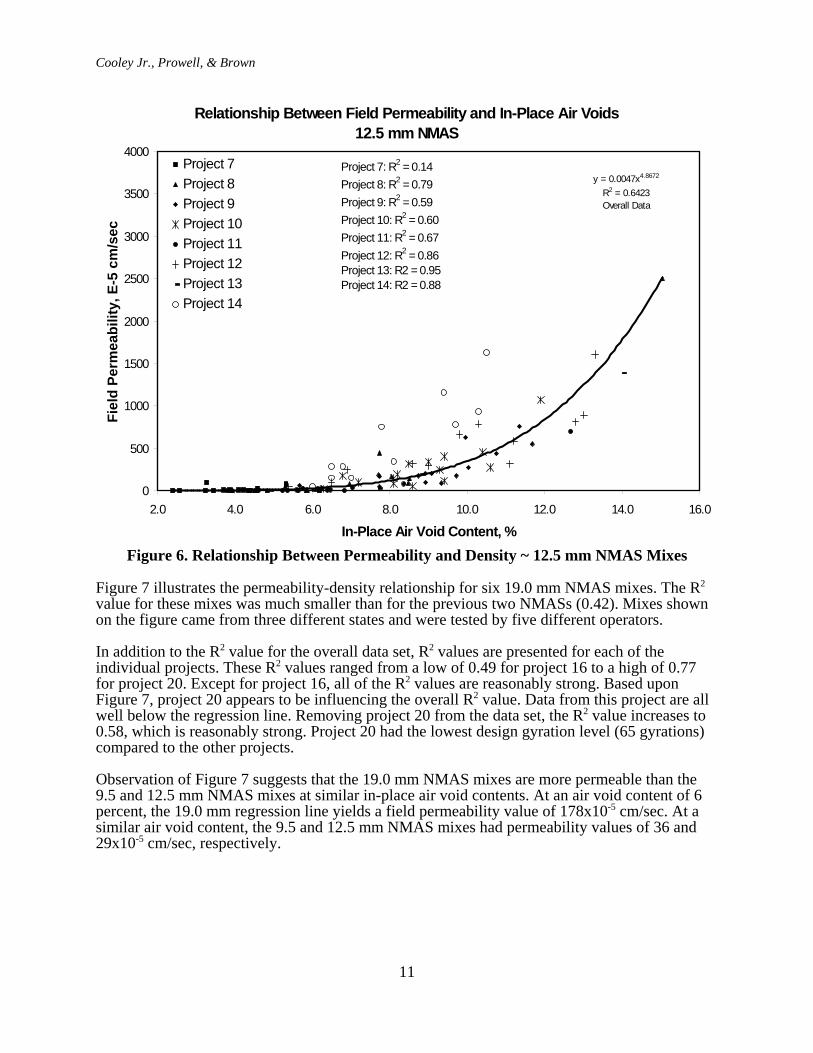
Figure 7 illustrates the permeability-density relationship for six 19.0 mm NMAS mixes. The R2
value for these mixes was much smaller than for the previous two NMASs (0.42). Mixes shownon the figure came from three different states and were tested by five different operators.
In addition to the R2 value for the overall data set, R2 values are presented for each of theindividual projects. These R2 values ranged from a low of 0.49 for project 16 to a high of 0.77for project 20. Except for project 16, all of the R2 values are reasonably strong. Based uponFigure 7, project 20 appears to be influencing the overall R2 value. Data from this project are allwell below the regression line. Removing project 20 from the data set, the R2 value increases to0.58, which is reasonably strong. Project 20 had the lowest design gyration level (65 gyrations)compared to the other projects.
Observation of Figure 7 suggests that the 19.0 mm NMAS mixes are more permeable than the9.5 and 12.5 mm NMAS mixes at similar in-place air void contents. At an air void content of 6percent, the 19.0 mm regression line yields a field permeability value of 178x10-5 cm/sec. At asimilar air void content, the 9.5 and 12.5 mm NMAS mixes had permeability values of 36 and29x10-5 cm/sec, respectively.
Cooley Jr., Prowell, & Brown
12
Relationship Between Field Permeability and In-Place Air Voids 19.0 mm NMAS
y = 0.0936x4.2145
R2 = 0.4162Overall Data
0
500
1000
1500
2000
2500
3000
3500
4000
2.0 3.0 4.0 5.0 6.0 7.0 8.0 9.0 10.0 11.0 12.0
In-Place Air Void Content, %
Fiel
d Pe
rmea
bilit
y, E
-5 c
m/s
ec
Project 15Project 16Project 17Project 18Project 19Project 20
Project 15: R2 = 0.65Project 16: R2 = 0.49Project 17: R2 = 0.76Project 18: R2 = 0.59Project 19: R2 = 0.77Project 20: R2 = 0.70
Figure 7. Relationship Between Permeability and Density ~ 19.0 mm NMAS Mixes
At in-place air void contents below approximately 4 to 5 percent, the permeability values arelow. Above 5 percent, the field permeability began to increase sharply with small increases in in-place air void content.
A critical density (as related to permeability) for 19.0 mm NMAS mixes of 5.5 percent has beensuggested by Cooley et al. (19). Data in Figure 7 seems to also suggest that when in-place airvoids are above 5.5 to 6 percent, pavements become excessively permeable.
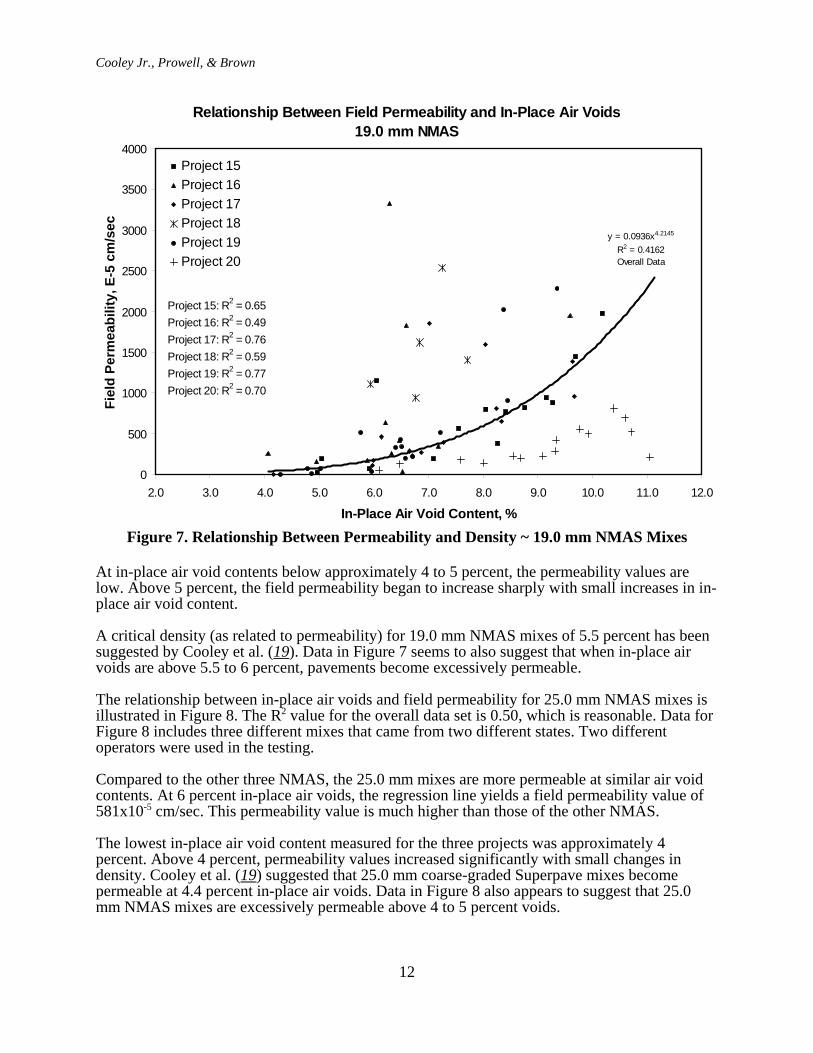
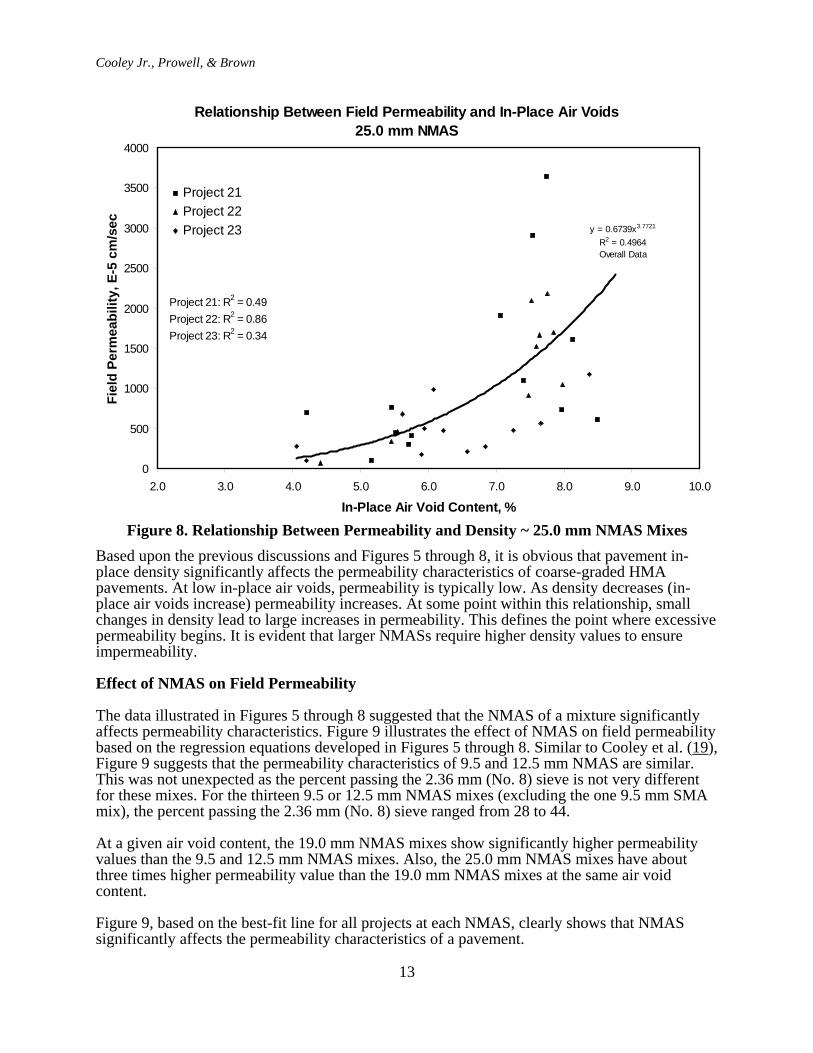
The relationship between in-place air voids and field permeability for 25.0 mm NMAS mixes isillustrated in Figure 8. The R2 value for the overall data set is 0.50, which is reasonable. Data forFigure 8 includes three different mixes that came from two different states. Two differentoperators were used in the testing.
Compared to the other three NMAS, the 25.0 mm mixes are more permeable at similar air voidcontents. At 6 percent in-place air voids, the regression line yields a field permeability value of581x10-5 cm/sec. This permeability value is much higher than those of the other NMAS.
The lowest in-place air void content measured for the three projects was approximately 4percent. Above 4 percent, permeability values increased significantly with small changes indensity. Cooley et al. (19) suggested that 25.0 mm coarse-graded Superpave mixes becomepermeable at 4.4 percent in-place air voids. Data in Figure 8 also appears to suggest that 25.0mm NMAS mixes are excessively permeable above 4 to 5 percent voids.
Cooley Jr., Prowell, & Brown
13
Relationship Between Field Permeability and In-Place Air Voids 25.0 mm NMAS
y = 0.6739x3.7721
R2 = 0.4964Overall Data
0
500
1000
1500
2000
2500
3000
3500
4000
2.0 3.0 4.0 5.0 6.0 7.0 8.0 9.0 10.0
In-Place Air Void Content, %
Fiel
d Pe
rmea
bilit
y, E
-5 c
m/s
ec
Project 21Project 22Project 23
Project 21: R2 = 0.49Project 22: R2 = 0.86Project 23: R2 = 0.34
Figure 8. Relationship Between Permeability and Density ~ 25.0 mm NMAS MixesBased upon the previous discussions and Figures 5 through 8, it is obvious that pavement in-place density significantly affects the permeability characteristics of coarse-graded HMA pavements. At low in-place air voids, permeability is typically low. As density decreases (in-place air voids increase) permeability increases. At some point within this relationship, smallchanges in density lead to large increases in permeability. This defines the point where excessivepermeability begins. It is evident that larger NMASs require higher density values to ensureimpermeability.
Effect of NMAS on Field Permeability
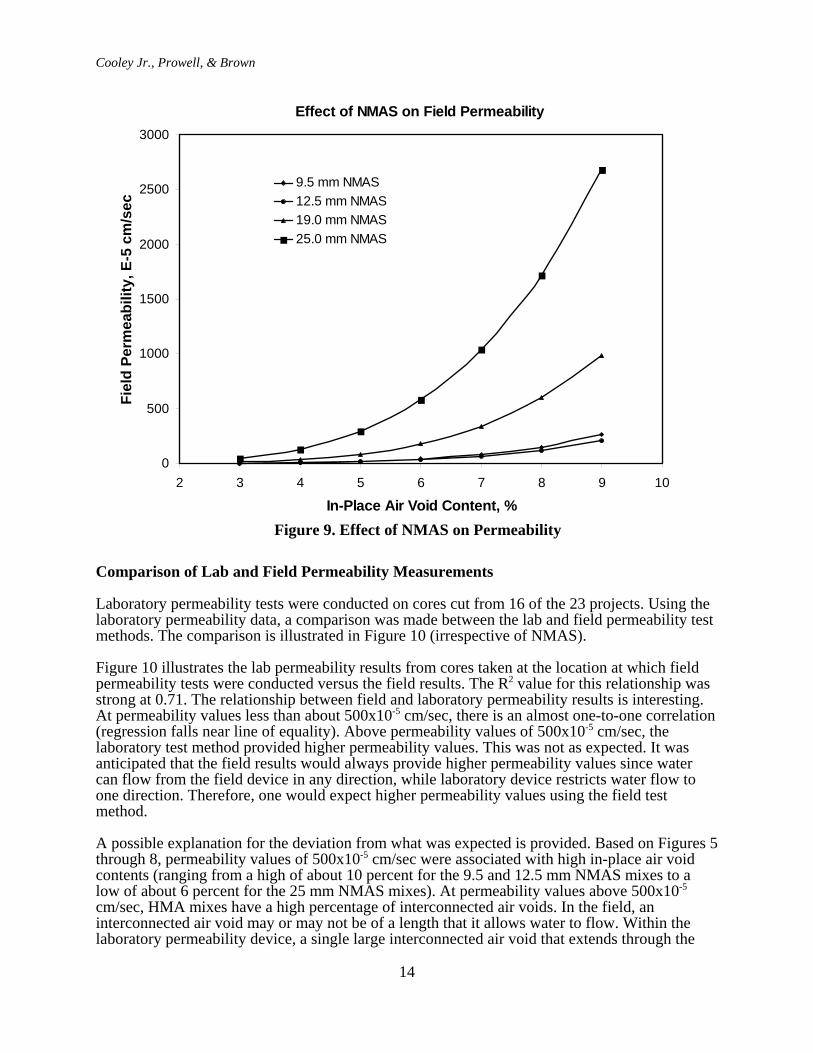
The data illustrated in Figures 5 through 8 suggested that the NMAS of a mixture significantlyaffects permeability characteristics. Figure 9 illustrates the effect of NMAS on field permeabilitybased on the regression equations developed in Figures 5 through 8. Similar to Cooley et al. (19),Figure 9 suggests that the permeability characteristics of 9.5 and 12.5 mm NMAS are similar.This was not unexpected as the percent passing the 2.36 mm (No. 8) sieve is not very differentfor these mixes. For the thirteen 9.5 or 12.5 mm NMAS mixes (excluding the one 9.5 mm SMAmix), the percent passing the 2.36 mm (No. 8) sieve ranged from 28 to 44.
At a given air void content, the 19.0 mm NMAS mixes show significantly higher permeabilityvalues than the 9.5 and 12.5 mm NMAS mixes. Also, the 25.0 mm NMAS mixes have aboutthree times higher permeability value than the 19.0 mm NMAS mixes at the same air voidcontent.
Figure 9, based on the best-fit line for all projects at each NMAS, clearly shows that NMASsignificantly affects the permeability characteristics of a pavement.
Cooley Jr., Prowell, & Brown
14
Effect of NMAS on Field Permeability
0
500
1000
1500
2000
2500
3000
2 3 4 5 6 7 8 9 10
In-Place Air Void Content, %
Fiel
d Pe
rmea
bilit
y, E
-5 c
m/s
ec
9.5 mm NMAS12.5 mm NMAS19.0 mm NMAS25.0 mm NMAS
Figure 9. Effect of NMAS on Permeability
Comparison of Lab and Field Permeability Measurements
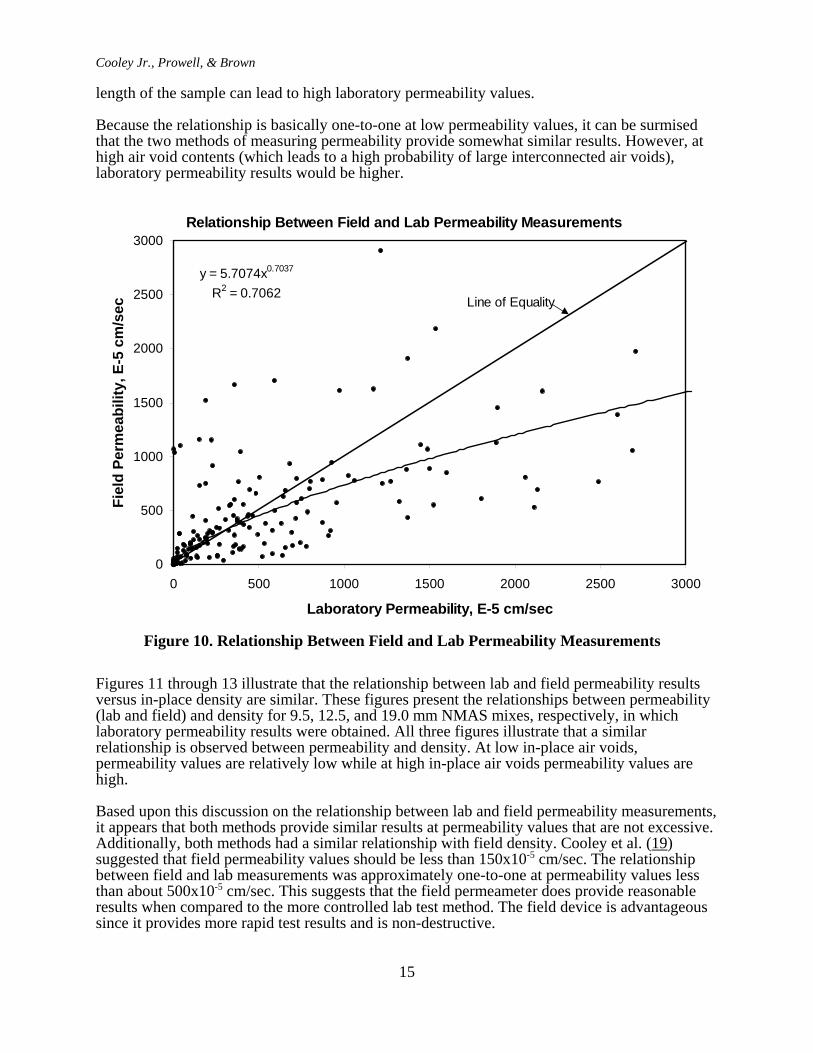
Laboratory permeability tests were conducted on cores cut from 16 of the 23 projects. Using thelaboratory permeability data, a comparison was made between the lab and field permeability testmethods. The comparison is illustrated in Figure 10 (irrespective of NMAS).
Figure 10 illustrates the lab permeability results from cores taken at the location at which fieldpermeability tests were conducted versus the field results. The R2 value for this relationship wasstrong at 0.71. The relationship between field and laboratory permeability results is interesting.At permeability values less than about 500x10-5 cm/sec, there is an almost one-to-one correlation(regression falls near line of equality). Above permeability values of 500x10-5 cm/sec, thelaboratory test method provided higher permeability values. This was not as expected. It wasanticipated that the field results would always provide higher permeability values since watercan flow from the field device in any direction, while laboratory device restricts water flow toone direction. Therefore, one would expect higher permeability values using the field testmethod.
A possible explanation for the deviation from what was expected is provided. Based on Figures 5through 8, permeability values of 500x10-5 cm/sec were associated with high in-place air voidcontents (ranging from a high of about 10 percent for the 9.5 and 12.5 mm NMAS mixes to alow of about 6 percent for the 25 mm NMAS mixes). At permeability values above 500x10-5
cm/sec, HMA mixes have a high percentage of interconnected air voids. In the field, aninterconnected air void may or may not be of a length that it allows water to flow. Within thelaboratory permeability device, a single large interconnected air void that extends through the
Cooley Jr., Prowell, & Brown
15
Relationship Between Field and Lab Permeability Measurements
y = 5.7074x0.7037
R2 = 0.7062
0
500
1000
1500
2000
2500
3000
0 500 1000 1500 2000 2500 3000
Laboratory Permeability, E-5 cm/sec
Fiel
d Pe
rmea
bilit
y, E
-5 c
m/s
ec Line of Equality
Figure 10. Relationship Between Field and Lab Permeability Measurements
length of the sample can lead to high laboratory permeability values.
Because the relationship is basically one-to-one at low permeability values, it can be surmisedthat the two methods of measuring permeability provide somewhat similar results. However, athigh air void contents (which leads to a high probability of large interconnected air voids),laboratory permeability results would be higher.
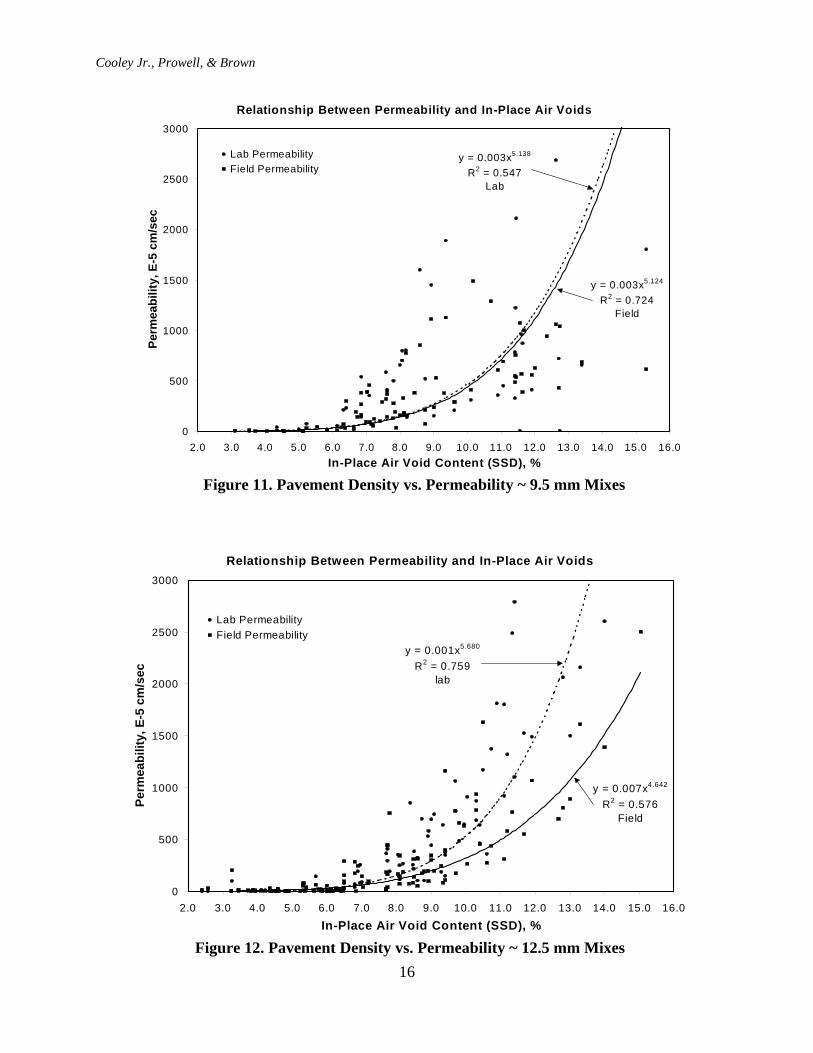
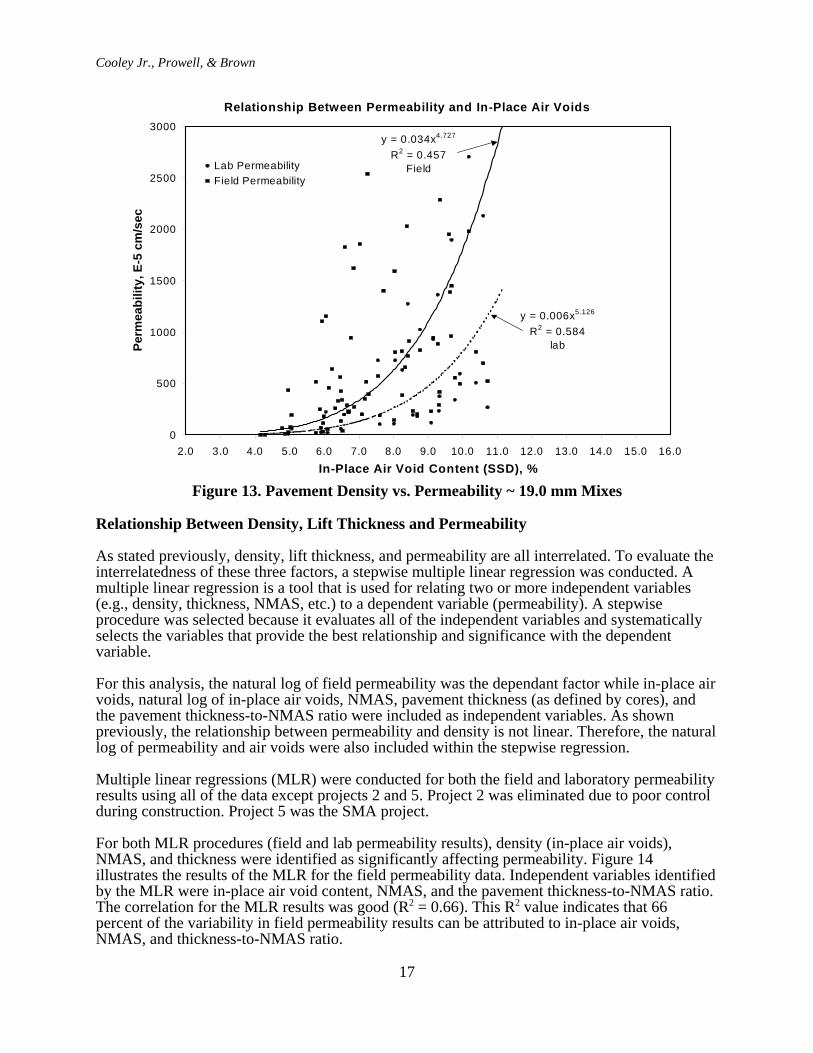
Figures 11 through 13 illustrate that the relationship between lab and field permeability resultsversus in-place density are similar. These figures present the relationships between permeability(lab and field) and density for 9.5, 12.5, and 19.0 mm NMAS mixes, respectively, in whichlaboratory permeability results were obtained. All three figures illustrate that a similarrelationship is observed between permeability and density. At low in-place air voids,permeability values are relatively low while at high in-place air voids permeability values arehigh.
Based upon this discussion on the relationship between lab and field permeability measurements,it appears that both methods provide similar results at permeability values that are not excessive.Additionally, both methods had a similar relationship with field density. Cooley et al. (19)suggested that field permeability values should be less than 150x10-5 cm/sec. The relationshipbetween field and lab measurements was approximately one-to-one at permeability values lessthan about 500x10-5 cm/sec. This suggests that the field permeameter does provide reasonableresults when compared to the more controlled lab test method. The field device is advantageoussince it provides more rapid test results and is non-destructive.
Cooley Jr., Prowell, & Brown
16
Relationship Between Permeability and In-Place Air Voids
y = 0.003x5.138
R2 = 0.547Lab
y = 0.003x5.124
R2 = 0.724Field
0
500
1000
1500
2000
2500
3000
2.0 3.0 4.0 5.0 6.0 7.0 8.0 9.0 10.0 11.0 12.0 13.0 14.0 15.0 16.0In-Place Air Void Content (SSD), %
Perm
eabi
lity,
E-5
cm
/sec
Lab PermeabilityField Permeability
Figure 11. Pavement Density vs. Permeability ~ 9.5 mm Mixes
Relationship Between Permeability and In-Place Air Voids
y = 0.001x5.680
R2 = 0.759lab
y = 0.007x4.642
R2 = 0.576Field
0
500
1000
1500
2000
2500
3000
2.0 3.0 4.0 5.0 6.0 7.0 8.0 9.0 10.0 11.0 12.0 13.0 14.0 15.0 16.0
In-Place Air Void Content (SSD), %
Perm
eabi
lity,
E-5
cm
/sec
Lab PermeabilityField Permeability
Figure 12. Pavement Density vs. Permeability ~ 12.5 mm Mixes
Cooley Jr., Prowell, & Brown
17
Relationship Between Permeability and In-Place Air Voids
y = 0.006x5.126
R2 = 0.584lab
y = 0.034x4.727
R2 = 0.457Field
0
500
1000
1500
2000
2500
3000
2.0 3.0 4.0 5.0 6.0 7.0 8.0 9.0 10.0 11.0 12.0 13.0 14.0 15.0 16.0
In-Place Air Void Content (SSD), %
Perm
eabi
lity,
E-5
cm
/sec
Lab PermeabilityField Permeability
Figure 13. Pavement Density vs. Permeability ~ 19.0 mm Mixes
Relationship Between Density, Lift Thickness and Permeability
As stated previously, density, lift thickness, and permeability are all interrelated. To evaluate theinterrelatedness of these three factors, a stepwise multiple linear regression was conducted. Amultiple linear regression is a tool that is used for relating two or more independent variables(e.g., density, thickness, NMAS, etc.) to a dependent variable (permeability). A stepwiseprocedure was selected because it evaluates all of the independent variables and systematicallyselects the variables that provide the best relationship and significance with the dependentvariable.
For this analysis, the natural log of field permeability was the dependant factor while in-place airvoids, natural log of in-place air voids, NMAS, pavement thickness (as defined by cores), andthe pavement thickness-to-NMAS ratio were included as independent variables. As shownpreviously, the relationship between permeability and density is not linear. Therefore, the naturallog of permeability and air voids were also included within the stepwise regression.
Multiple linear regressions (MLR) were conducted for both the field and laboratory permeabilityresults using all of the data except projects 2 and 5. Project 2 was eliminated due to poor controlduring construction. Project 5 was the SMA project.
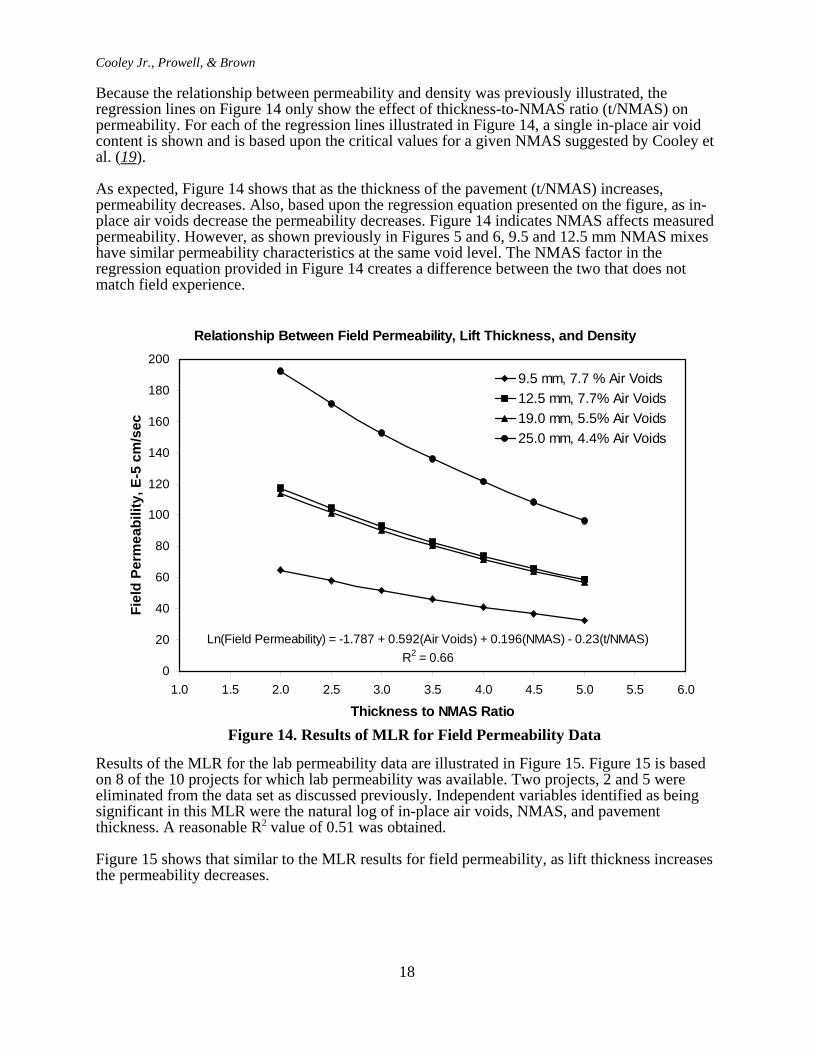
For both MLR procedures (field and lab permeability results), density (in-place air voids),NMAS, and thickness were identified as significantly affecting permeability. Figure 14illustrates the results of the MLR for the field permeability data. Independent variables identifiedby the MLR were in-place air void content, NMAS, and the pavement thickness-to-NMAS ratio.The correlation for the MLR results was good (R2 = 0.66). This R2 value indicates that 66percent of the variability in field permeability results can be attributed to in-place air voids,NMAS, and thickness-to-NMAS ratio.
Cooley Jr., Prowell, & Brown
18
Relationship Between Field Permeability, Lift Thickness, and Density
0
20
40
60
80
100
120
140
160
180
200
1.0 1.5 2.0 2.5 3.0 3.5 4.0 4.5 5.0 5.5 6.0
Thickness to NMAS Ratio
Fiel
d Pe
rmea
bilit
y, E
-5 c
m/s
ec
9.5 mm, 7.7 % Air Voids12.5 mm, 7.7% Air Voids19.0 mm, 5.5% Air Voids25.0 mm, 4.4% Air Voids
Ln(Field Permeability) = -1.787 + 0.592(Air Voids) + 0.196(NMAS) - 0.23(t/NMAS)R2 = 0.66
Figure 14. Results of MLR for Field Permeability Data
Because the relationship between permeability and density was previously illustrated, theregression lines on Figure 14 only show the effect of thickness-to-NMAS ratio (t/NMAS) onpermeability. For each of the regression lines illustrated in Figure 14, a single in-place air voidcontent is shown and is based upon the critical values for a given NMAS suggested by Cooley etal. (19).
As expected, Figure 14 shows that as the thickness of the pavement (t/NMAS) increases,permeability decreases. Also, based upon the regression equation presented on the figure, as in-place air voids decrease the permeability decreases. Figure 14 indicates NMAS affects measuredpermeability. However, as shown previously in Figures 5 and 6, 9.5 and 12.5 mm NMAS mixeshave similar permeability characteristics at the same void level. The NMAS factor in theregression equation provided in Figure 14 creates a difference between the two that does notmatch field experience.
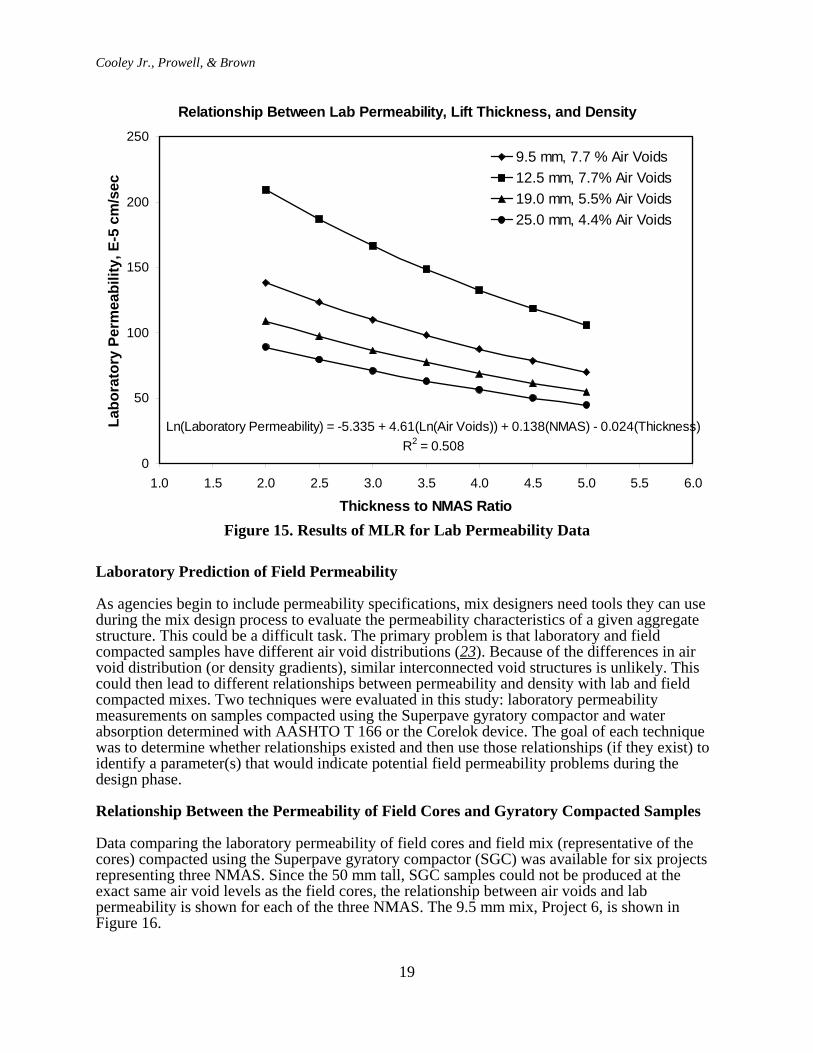
Results of the MLR for the lab permeability data are illustrated in Figure 15. Figure 15 is basedon 8 of the 10 projects for which lab permeability was available. Two projects, 2 and 5 wereeliminated from the data set as discussed previously. Independent variables identified as beingsignificant in this MLR were the natural log of in-place air voids, NMAS, and pavementthickness. A reasonable R2 value of 0.51 was obtained.
Figure 15 shows that similar to the MLR results for field permeability, as lift thickness increasesthe permeability decreases.
Cooley Jr., Prowell, & Brown
19
Relationship Between Lab Permeability, Lift Thickness, and Density
0
50
100
150
200
250
1.0 1.5 2.0 2.5 3.0 3.5 4.0 4.5 5.0 5.5 6.0
Thickness to NMAS Ratio
Labo
rato
ry P
erm
eabi
lity,
E-5
cm
/sec
9.5 mm, 7.7 % Air Voids12.5 mm, 7.7% Air Voids19.0 mm, 5.5% Air Voids25.0 mm, 4.4% Air Voids
Ln(Laboratory Permeability) = -5.335 + 4.61(Ln(Air Voids)) + 0.138(NMAS) - 0.024(Thickness)R2 = 0.508
Figure 15. Results of MLR for Lab Permeability Data
Laboratory Prediction of Field Permeability
As agencies begin to include permeability specifications, mix designers need tools they can useduring the mix design process to evaluate the permeability characteristics of a given aggregatestructure. This could be a difficult task. The primary problem is that laboratory and fieldcompacted samples have different air void distributions (23). Because of the differences in airvoid distribution (or density gradients), similar interconnected void structures is unlikely. Thiscould then lead to different relationships between permeability and density with lab and fieldcompacted mixes. Two techniques were evaluated in this study: laboratory permeabilitymeasurements on samples compacted using the Superpave gyratory compactor and waterabsorption determined with AASHTO T 166 or the Corelok device. The goal of each techniquewas to determine whether relationships existed and then use those relationships (if they exist) toidentify a parameter(s) that would indicate potential field permeability problems during thedesign phase.
Relationship Between the Permeability of Field Cores and Gyratory Compacted Samples
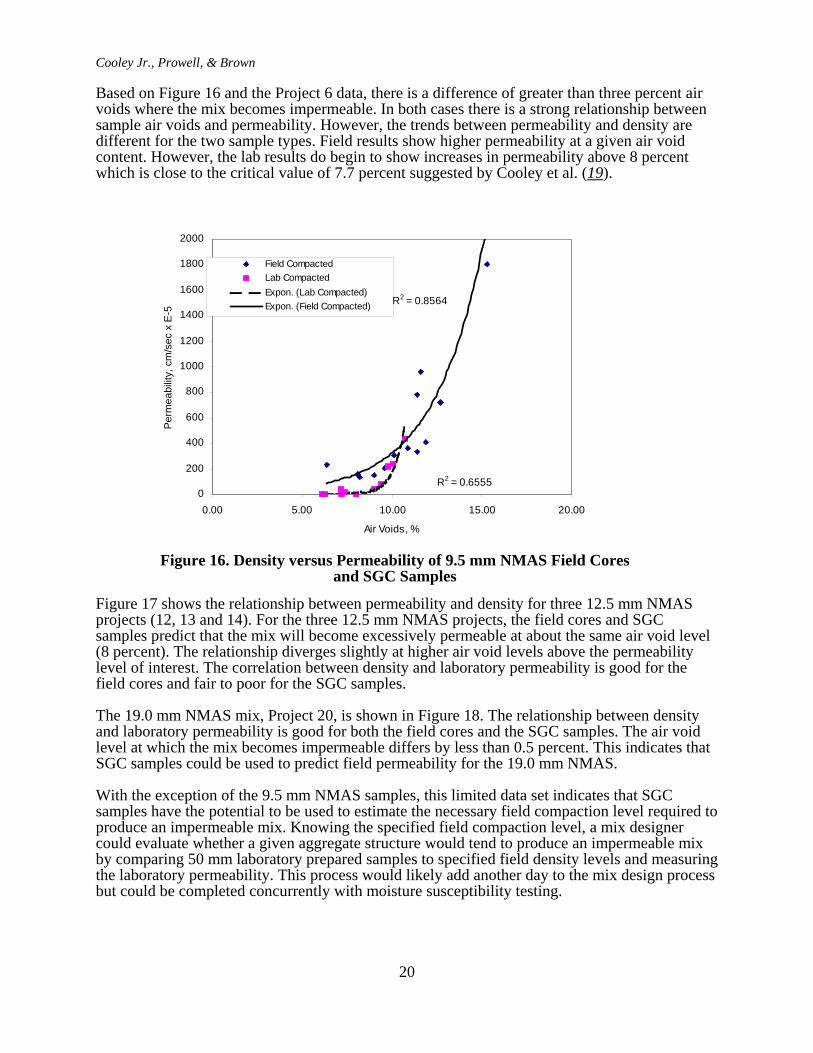
Data comparing the laboratory permeability of field cores and field mix (representative of thecores) compacted using the Superpave gyratory compactor (SGC) was available for six projectsrepresenting three NMAS. Since the 50 mm tall, SGC samples could not be produced at theexact same air void levels as the field cores, the relationship between air voids and labpermeability is shown for each of the three NMAS. The 9.5 mm mix, Project 6, is shown inFigure 16.
Cooley Jr., Prowell, & Brown
20
R2 = 0.6555
R2 = 0.8564
0
200
400
600
800
1000
1200
1400
1600
1800
2000
0.00 5.00 10.00 15.00 20.00
Air Voids, %
Per
mea
bilit
y, c
m/s
ec x
E-5
Field CompactedLab CompactedExpon. (Lab Compacted)Expon. (Field Compacted)
Figure 16. Density versus Permeability of 9.5 mm NMAS Field Coresand SGC Samples
Based on Figure 16 and the Project 6 data, there is a difference of greater than three percent airvoids where the mix becomes impermeable. In both cases there is a strong relationship betweensample air voids and permeability. However, the trends between permeability and density aredifferent for the two sample types. Field results show higher permeability at a given air voidcontent. However, the lab results do begin to show increases in permeability above 8 percentwhich is close to the critical value of 7.7 percent suggested by Cooley et al. (19).
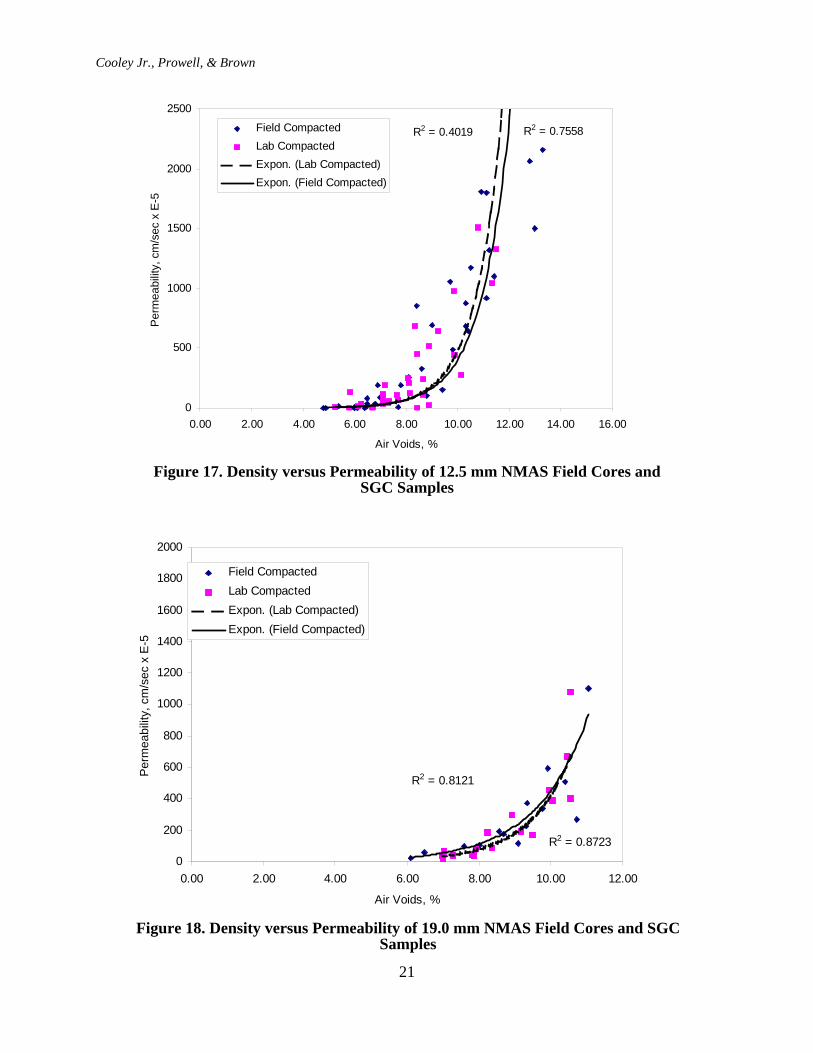
Figure 17 shows the relationship between permeability and density for three 12.5 mm NMASprojects (12, 13 and 14). For the three 12.5 mm NMAS projects, the field cores and SGCsamples predict that the mix will become excessively permeable at about the same air void level(8 percent). The relationship diverges slightly at higher air void levels above the permeabilitylevel of interest. The correlation between density and laboratory permeability is good for thefield cores and fair to poor for the SGC samples.
The 19.0 mm NMAS mix, Project 20, is shown in Figure 18. The relationship between densityand laboratory permeability is good for both the field cores and the SGC samples. The air voidlevel at which the mix becomes impermeable differs by less than 0.5 percent. This indicates thatSGC samples could be used to predict field permeability for the 19.0 mm NMAS.
With the exception of the 9.5 mm NMAS samples, this limited data set indicates that SGCsamples have the potential to be used to estimate the necessary field compaction level required toproduce an impermeable mix. Knowing the specified field compaction level, a mix designercould evaluate whether a given aggregate structure would tend to produce an impermeable mixby comparing 50 mm laboratory prepared samples to specified field density levels and measuringthe laboratory permeability. This process would likely add another day to the mix design processbut could be completed concurrently with moisture susceptibility testing.
Cooley Jr., Prowell, & Brown
21
R2 = 0.4019 R2 = 0.7558
0
500
1000
1500
2000
2500
0.00 2.00 4.00 6.00 8.00 10.00 12.00 14.00 16.00
Air Voids, %
Per
mea
bilit
y, c
m/s
ec x
E-5
Field CompactedLab CompactedExpon. (Lab Compacted)Expon. (Field Compacted)
Figure 17. Density versus Permeability of 12.5 mm NMAS Field Cores andSGC Samples
R2 = 0.8723
R2 = 0.8121
0
200
400
600
800
1000
1200
1400
1600
1800
2000
0.00 2.00 4.00 6.00 8.00 10.00 12.00
Air Voids, %
Per
mea
bilit
y, c
m/s
ec x
E-5
Field CompactedLab CompactedExpon. (Lab Compacted)Expon. (Field Compacted)
Figure 18. Density versus Permeability of 19.0 mm NMAS Field Cores and SGCSamples
Cooley Jr., Prowell, & Brown
22
Relationship Between Water Absorption and Permeability
The percentage of water permeable voids is determined in AASHTO T-166 according toEquation 1.
(1)
where:A = core mass in airB = core mass saturated surface dry (SSD)C = core mass in water
The manufacturer of the Corelok proposed Equation 2 to calculate what they termed as theporosity of the sample. A better term is effective air void content.
(2)
where:A = saturated density of sample, g/cm3 B = sealed density of sample, g/cm3
The Corelok manufacturer recommends that the sealed sample be opened underwater, allowing aslight vacuum to fill voids that might not otherwise become saturated. Since this technique wasproposed after the majority of the testing was completed, the authors substituted the saturateddensity determined according to AASHTO T-166 for D2.
It seems intuitive that the percentage of water permeable voids should be related to the availableflow paths for the water and in turn to permeability. Previous research has shown thatpermeability is dependent on gradation as well as density. A strong relationship between waterpermeable voids and permeability, independent of gradation, could be used as a screening toolby a mix designer or agency. During design, it would allow the mix designer to assess thepotential permeability of a given aggregate structure without conducting permeability tests.During production it could be used as a quick screening tool by the agency (if they employ acore density specification) without the additional work of laboratory permeability testing.
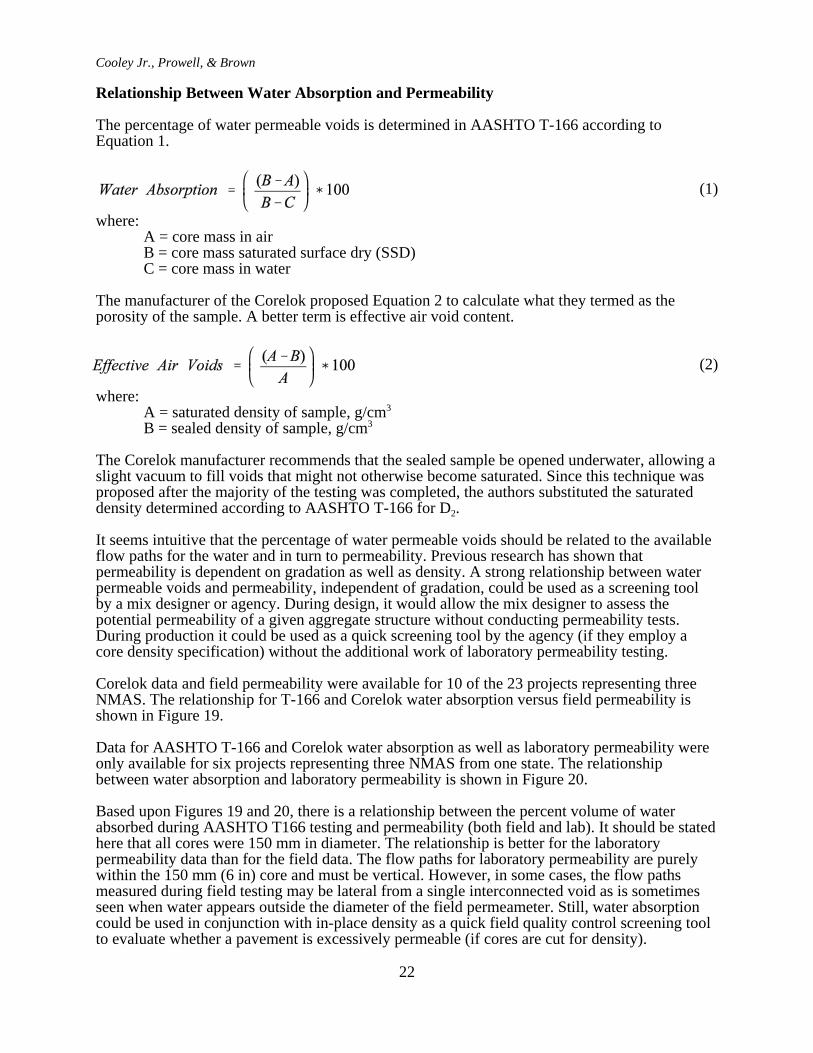
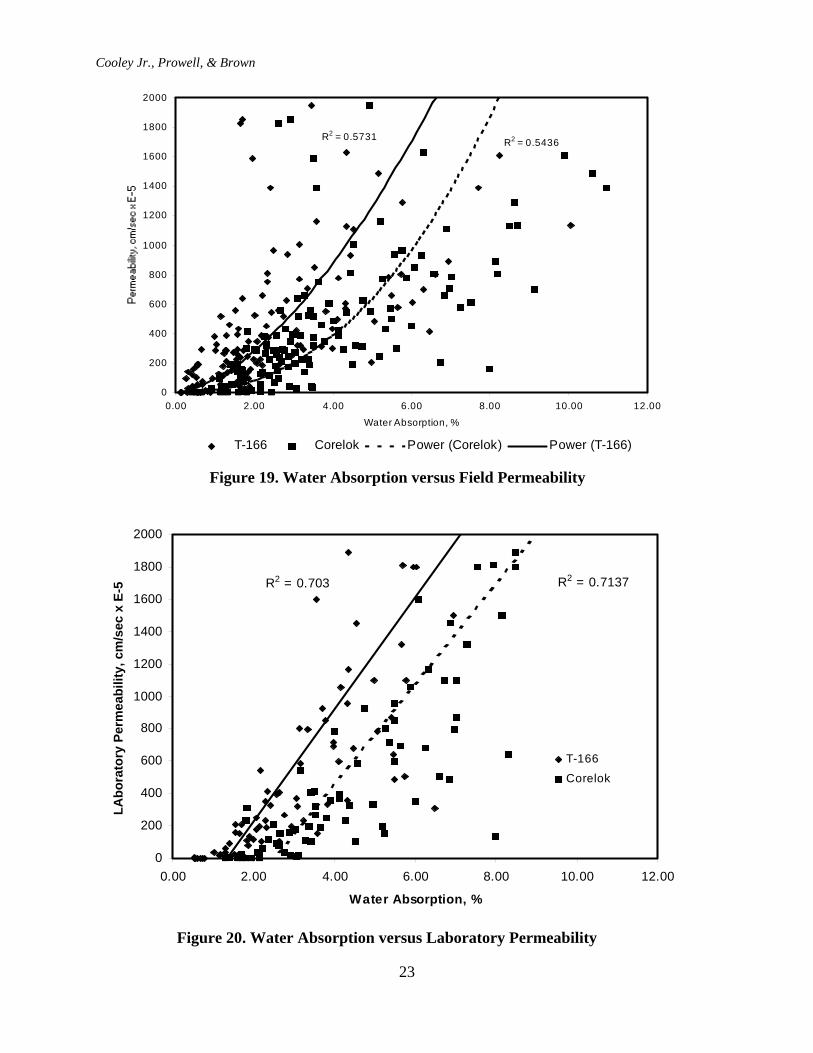
Corelok data and field permeability were available for 10 of the 23 projects representing threeNMAS. The relationship for T-166 and Corelok water absorption versus field permeability isshown in Figure 19.
Data for AASHTO T-166 and Corelok water absorption as well as laboratory permeability wereonly available for six projects representing three NMAS from one state. The relationshipbetween water absorption and laboratory permeability is shown in Figure 20.
Based upon Figures 19 and 20, there is a relationship between the percent volume of waterabsorbed during AASHTO T166 testing and permeability (both field and lab). It should be statedhere that all cores were 150 mm in diameter. The relationship is better for the laboratorypermeability data than for the field data. The flow paths for laboratory permeability are purelywithin the 150 mm (6 in) core and must be vertical. However, in some cases, the flow pathsmeasured during field testing may be lateral from a single interconnected void as is sometimesseen when water appears outside the diameter of the field permeameter. Still, water absorptioncould be used in conjunction with in-place density as a quick field quality control screening toolto evaluate whether a pavement is excessively permeable (if cores are cut for density).
Cooley Jr., Prowell, & Brown
23
R2 = 0.5436R2 = 0.5731
0
200
400
600
800
1000
1200
1400
1600
1800
2000
0.00 2.00 4.00 6.00 8.00 10.00 12.00
Water Absorption, %
T-166 Corelok Power (Corelok) Power (T-166)
Figure 19. Water Absorption versus Field Permeability
R2 = 0.7137R2 = 0.703
0
200
400
600
800
1000
1200
1400
1600
1800
2000
0.00 2.00 4.00 6.00 8.00 10.00 12.00
Water Absorption, %
LAbo
rato
ry P
erm
eabi
lity,
cm
/sec
x E
-5
T-166
Corelok
Figure 20. Water Absorption versus Laboratory Permeability
Cooley Jr., Prowell, & Brown
24
y = 0.7622x - 3.4392R2 = 0.7632
Field
y = 0.7061x - 3.3413R2 = 0.7017
SGC
0.0
2.0
4.0
6.0
8.0
10.0
12.0
0.0 2.0 4.0 6.0 8.0 10.0 12.0 14.0 16.0 18.0
AASHTO T-166 Air Voids, %
T-16
6 W
ater
Abs
orpt
ion,
%
SGC CompactedField CompactedLinear (Field Compacted)Linear (SGC Compacted)
Figure 21. Relationship Between Water Absorption and Air Voids for Lab and FieldCompacted Samples
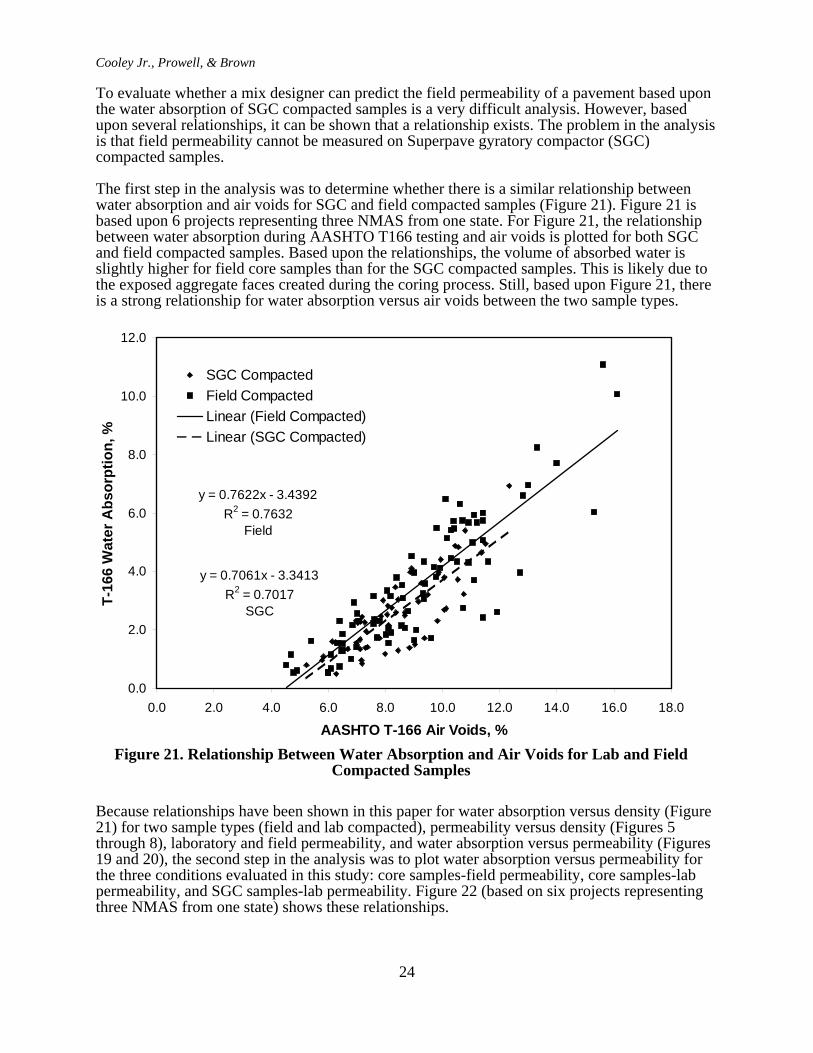
To evaluate whether a mix designer can predict the field permeability of a pavement based uponthe water absorption of SGC compacted samples is a very difficult analysis. However, basedupon several relationships, it can be shown that a relationship exists. The problem in the analysisis that field permeability cannot be measured on Superpave gyratory compactor (SGC)compacted samples.
The first step in the analysis was to determine whether there is a similar relationship betweenwater absorption and air voids for SGC and field compacted samples (Figure 21). Figure 21 isbased upon 6 projects representing three NMAS from one state. For Figure 21, the relationshipbetween water absorption during AASHTO T166 testing and air voids is plotted for both SGCand field compacted samples. Based upon the relationships, the volume of absorbed water isslightly higher for field core samples than for the SGC compacted samples. This is likely due tothe exposed aggregate faces created during the coring process. Still, based upon Figure 21, thereis a strong relationship for water absorption versus air voids between the two sample types.
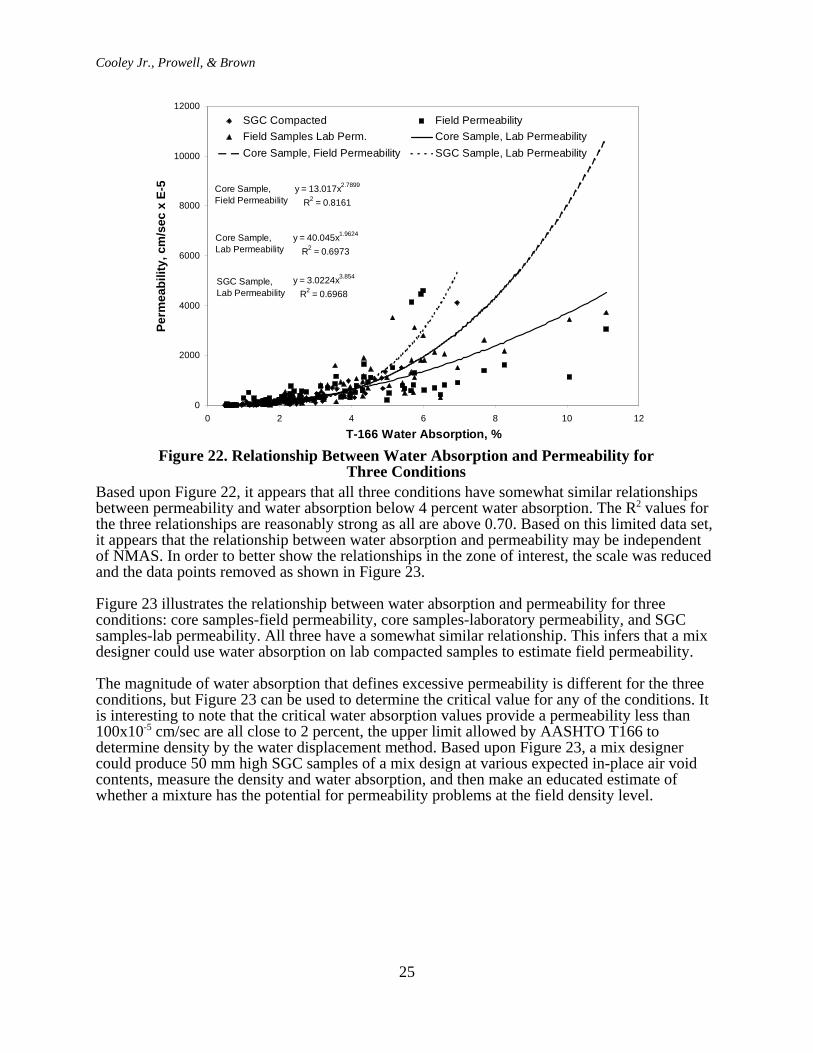
Because relationships have been shown in this paper for water absorption versus density (Figure21) for two sample types (field and lab compacted), permeability versus density (Figures 5through 8), laboratory and field permeability, and water absorption versus permeability (Figures19 and 20), the second step in the analysis was to plot water absorption versus permeability forthe three conditions evaluated in this study: core samples-field permeability, core samples-labpermeability, and SGC samples-lab permeability. Figure 22 (based on six projects representingthree NMAS from one state) shows these relationships.
Cooley Jr., Prowell, & Brown
25
y = 40.045x1.9624
R2 = 0.6973
y = 13.017x2.7899
R2 = 0.8161
y = 3.0224x3.854
R2 = 0.6968
0
2000
4000
6000
8000
10000
12000
0 2 4 6 8 10 12
T-166 Water Absorption, %
Perm
eabi
lity,
cm
/sec
x E
-5
SGC Compacted Field PermeabilityField Samples Lab Perm. Core Sample, Lab PermeabilityCore Sample, Field Permeability SGC Sample, Lab Permeability
Core Sample,Field Permeability
Core Sample,Lab Permeability
SGC Sample,Lab Permeability
Figure 22. Relationship Between Water Absorption and Permeability forThree Conditions
Based upon Figure 22, it appears that all three conditions have somewhat similar relationshipsbetween permeability and water absorption below 4 percent water absorption. The R2 values forthe three relationships are reasonably strong as all are above 0.70. Based on this limited data set,it appears that the relationship between water absorption and permeability may be independentof NMAS. In order to better show the relationships in the zone of interest, the scale was reducedand the data points removed as shown in Figure 23.
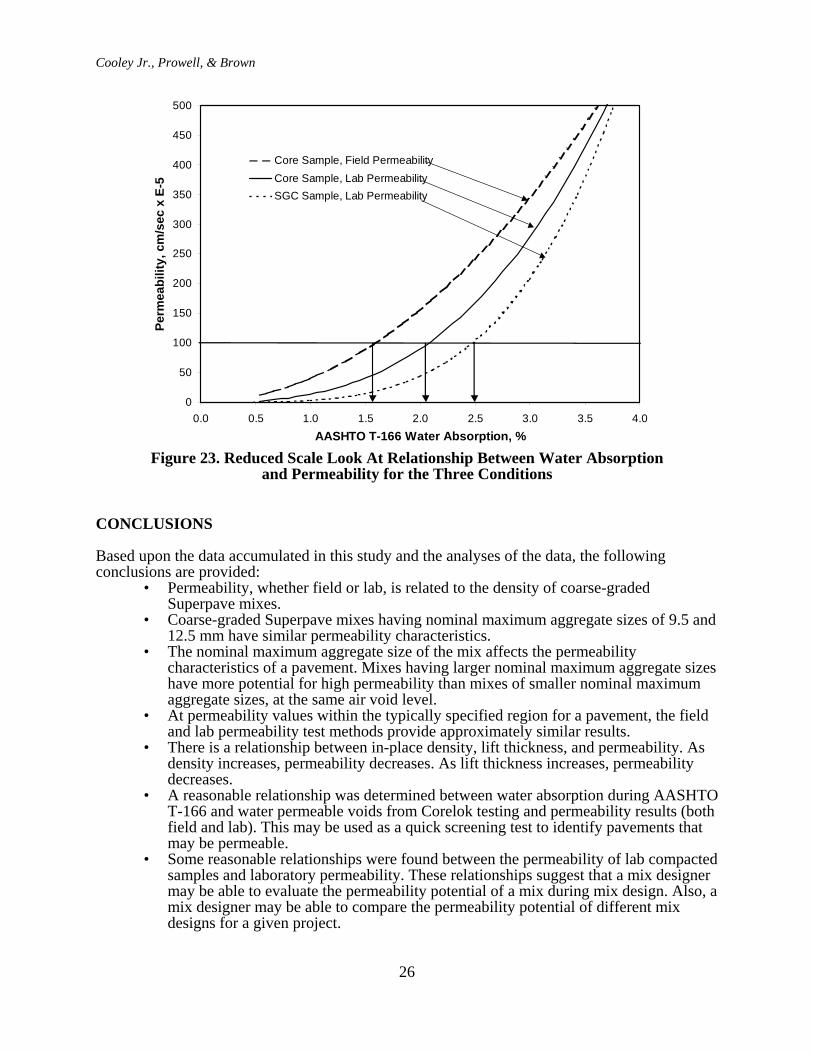
Figure 23 illustrates the relationship between water absorption and permeability for threeconditions: core samples-field permeability, core samples-laboratory permeability, and SGCsamples-lab permeability. All three have a somewhat similar relationship. This infers that a mixdesigner could use water absorption on lab compacted samples to estimate field permeability.
The magnitude of water absorption that defines excessive permeability is different for the threeconditions, but Figure 23 can be used to determine the critical value for any of the conditions. Itis interesting to note that the critical water absorption values provide a permeability less than100x10-5 cm/sec are all close to 2 percent, the upper limit allowed by AASHTO T166 todetermine density by the water displacement method. Based upon Figure 23, a mix designercould produce 50 mm high SGC samples of a mix design at various expected in-place air voidcontents, measure the density and water absorption, and then make an educated estimate ofwhether a mixture has the potential for permeability problems at the field density level.
Cooley Jr., Prowell, & Brown
26
0
50
100
150
200
250
300
350
400
450
500
0.0 0.5 1.0 1.5 2.0 2.5 3.0 3.5 4.0AASHTO T-166 Water Absorption, %
Perm
eabi
lity,
cm
/sec
x E
-5Core Sample, Field PermeabilityCore Sample, Lab PermeabilitySGC Sample, Lab Permeability
Figure 23. Reduced Scale Look At Relationship Between Water Absorptionand Permeability for the Three Conditions
CONCLUSIONS
Based upon the data accumulated in this study and the analyses of the data, the followingconclusions are provided:
• Permeability, whether field or lab, is related to the density of coarse-gradedSuperpave mixes.
• Coarse-graded Superpave mixes having nominal maximum aggregate sizes of 9.5 and12.5 mm have similar permeability characteristics.
• The nominal maximum aggregate size of the mix affects the permeabilitycharacteristics of a pavement. Mixes having larger nominal maximum aggregate sizeshave more potential for high permeability than mixes of smaller nominal maximumaggregate sizes, at the same air void level.
• At permeability values within the typically specified region for a pavement, the fieldand lab permeability test methods provide approximately similar results.
• There is a relationship between in-place density, lift thickness, and permeability. Asdensity increases, permeability decreases. As lift thickness increases, permeabilitydecreases.
• A reasonable relationship was determined between water absorption during AASHTOT-166 and water permeable voids from Corelok testing and permeability results (bothfield and lab). This may be used as a quick screening test to identify pavements thatmay be permeable.
• Some reasonable relationships were found between the permeability of lab compactedsamples and laboratory permeability. These relationships suggest that a mix designermay be able to evaluate the permeability potential of a mix during mix design. Also, amix designer may be able to compare the permeability potential of different mixdesigns for a given project.
Cooley Jr., Prowell, & Brown
27
REFERENCES
1. F.L. Roberts, P.S. Kandhal, E.R. Brown, D.Y. Lee, and T.W, Kennedy. Hot Mix AsphaltMaterials, Mixture Design, and Construction. NAPA Education Foundation, Lanham,MD. Second Ed., 1996.
2. E. Zube, “Compaction Studies of Asphalt Concrete Pavements as Related to the WaterPermeability Test.” Highway Research Board, Bulletin 358, 1962.
3. E.R. Brown, R. Collins, and J.A. Brownfield. “Investigation of Segregation of AsphaltMixtures in the State of Georgia.” Transportation Research Record 1217, 1989.
4. B. Choubane, G.C. Page, and J.A. Musselman. “Investigation of Water Permeability ofCoarse Graded Superpave Pavements.” Association of Asphalt Paving Technologists,Volume 67. 1998.
5. M.C. Ford, and C.E. McWilliams. “Asphalt Mix Permeability.” University of Arkansas,Fayettville, AR, 1988.
6. S.B. Hudson, and R.L. Davis. “Relationship of Aggregate Voidage to Gradation.”Association of Asphalt Paving Technologists, Volume 34. 1965.
7. R.B. Mallick, L.A. Cooley, Jr., and M. Teto. “Evaluation of Permeability of SuperpaveMixes in Maine, Final Report. Technical Report ME-001, November 1999.
8. J.A. Musselman, B. Choubane, G.C. Page, and P.B. Upshaw. “Superpave FieldImplementation: Florida’s Early Experience.” Transportation Research Record 1609,1998.
9. A. Kumar, and W.H. Goetz. “Asphalt Hardening as Affected by Film Thickness, Voidsand Permeability in Asphaltic Mixtures.” Association of Asphalt Paving Technologists,Volume 46, 1977.
10. J.R. Westerman. “AHTD’s Experience with Superpave Pavement Permeability.”<http://www.utexas.edu/research/superpave/articles/jrw10a.html>, January 21, 1998.
11. Huang, L.N. Mohammad, A. Roghavendra, and C. Abadie. “Fundamental of Permeabilityin Asphalt Mixtures.” Association of Asphalt Paving Technologists, Volume 68. 1999.
12. W.G. Muller. “Beam Flexure and Permeability Testing of Bituminous PavementSamples.” Association of Asphalt Paving Technologists, Volume 36. 1967.
13. G.W. Maupin, Jr. “Asphalt Permeability Testing in Virginia.” Transportation ResearchRecord 1723, 2000.
14. L.A. Cooley, Jr. “Permeability of Superpave Mixtures: Evaluation of FieldPermeameters.” National Center for Asphalt Technology, NCAT Report 99-1, February1999.
15. J.M. James. “Asphalt Mix Permeability.” Final Report, TRC-82, FHWA/AR-88/003.Arkansas State Highway and Transportation Department, September 1988.
16. J.A. Cechetini. “Vibratory Compaction of Asphalt Concrete Pavements.” Association ofAsphalt Paving Technologists, Volume 43. 1974.
17. W.J. Kari and L.E. Santucci. “Control of Asphalt Concrete Construction by the AirPermeability Test.” Association of Asphalt Paving Technologists, Volume 32. 1963.
18. L.A. Cooley and E.R. Brown. “Selection and Evaluation of a Field Permeability Devicefor Asphalt Pavements.” Transportation Research Record 1723, 2000.
19. L.A. Cooley, Jr., E.R. Brown, and S. Maghsoodloo. “Development of Critical FieldPermeability and Pavement Density Values for Coarse Graded Superpave Pavements.”Journal of the Transportation Research Board. No. 1761, 2001.
20. L.A. Cooley, Jr. and E.R. Brown. “Potential of Using Stone Matrix Asphalt (SMA) forThin Overlays.” Prepared for Presentation and Publication at the 80th Annual Meeting ofthe Transportation Research Board. January 2001.
21. “Superpave Construction Guidelines.” National Asphalt Pavement Association. SpecialReport 180. Lanham, Maryland. October1997.
22. M.S. Buchanan. “An Evaluation of Selected Methods for Measuring the Bulk SpecificGravity of Compacted Hot Mix Asphalt (HMA) Mixes.” Association of Asphalt PavingTechnologists, Volume 69. 2000.

Cooley Jr., Prowell, & Brown
28
23. L. Tashman, E. Masad, B. Peterson, and H. Saleh. “Internal Structure Analysis of AsphaltMixes to Improve the Simulation of Superpave Gyratory Compaction to FieldConditions.” Association of Asphalt Paving Technologists, Volume 70. 2001.