ISSUES IN LINKING INFORMATION TECHNOLOGY CAPABILITY TO ... · ISSUES IN LINKING INFORMATION...
30
Santhanam & Hartono/Lini<ing iT Capability to Firm Performance RESEARCH NOTE ISSUES IN LINKING INFORMATION TECHNOLOGY CAPABILITY TO FIRM PERFORMANCE^ By: Radiiika Santhanam DSiS Area, School of iVIanagement Gatton School of Business and Economics University of Kentucky Lexington, Kentucky 40506-0034 U.S.A. [email protected] Edward Hartono DSIS Area, School of Management Gatton School of Business and Economics University of Kentucky Lexington, Kentucky 40506-0034 U.S.A. [email protected] Abstract The resource-based view has been proposed to investigate the impact of information technology (IT) investments on firm performance. Re- searchers have shown that a firm's ability to effectively leverage its IT investments by devei- oping a strong IT capability can result in improved V.Sambamurthy was the accepting senior editor for this paper. firm performance. We test the robustness of this approach and examine severai related issues. Our results indicate that firms with superior IT capability indeed exhibit superior current and sus- tained firm performance when compared to aver- age industry performance, even after adjusting for effects of prior firm performance. However, the differences in the results from various analyses suggest that the impact of "haio effects" and prior financial performance of firms must be taken into consideration in future tests of IT capability. Further, it is criticai to develop theoretically derived multidimensional measures of IT capabi- lity in order to continue to apply theRBV approach to assess the impact of IT investments on firm performance. Keywords: Resource-based view, IT capability, firm pertormance ISRL Categories: Aid 04, AF01.02, EI0102 Introduction Corporations allocate resources to acquire IT- related products because it is assumed that these investments provide economic returns to a firm. Research studies to prove this premise have, however, generated mixed results, creating a productivity paradox (Brynjolfsson and Hitt 1998; Lucas 1999). This prompted an editorial comment in MIS Quarterly: MiS Quarteriy Voi. 27 No. 1, pp. 125-153/March 2003 125
Transcript of ISSUES IN LINKING INFORMATION TECHNOLOGY CAPABILITY TO ... · ISSUES IN LINKING INFORMATION...

Santhanam & Hartono/Lini<ing iT Capability to Firm Performance
RESEARCH NOTE
ISSUES IN LINKING INFORMATION TECHNOLOGYCAPABILITY TO FIRM PERFORMANCE^
By: Radiiika SanthanamDSiS Area, School of iVIanagementGatton School of Business and
EconomicsUniversity of KentuckyLexington, Kentucky [email protected]
Edward HartonoDSIS Area, School of ManagementGatton School of Business and
EconomicsUniversity of KentuckyLexington, Kentucky [email protected]
Abstract
The resource-based view has been proposed toinvestigate the impact of information technology(IT) investments on firm performance. Re-searchers have shown that a firm's ability toeffectively leverage its IT investments by devei-oping a strong IT capability can result in improved
V.Sambamurthy was the accepting senior editor for this
paper.
firm performance. We test the robustness of thisapproach and examine severai related issues.Our results indicate that firms with superior ITcapability indeed exhibit superior current and sus-tained firm performance when compared to aver-age industry performance, even after adjusting foreffects of prior firm performance. However, thedifferences in the results from various analysessuggest that the impact of "haio effects" and priorfinancial performance of firms must be taken intoconsideration in future tests of IT capability.Further, it is criticai to develop theoreticallyderived multidimensional measures of IT capabi-lity in order to continue to apply theRBV approachto assess the impact of IT investments on firmperformance.
Keywords: Resource-based view, IT capability,firm pertormance
ISRL Categories: A i d 04, AF01.02, EI0102
Introduction
Corporations allocate resources to acquire IT-related products because it is assumed that theseinvestments provide economic returns to a firm.Research studies to prove this premise have,however, generated mixed results, creating aproductivity paradox (Brynjolfsson and Hitt 1998;Lucas 1999). This prompted an editorial commentin MIS Quarterly:
MiS Quarteriy Voi. 27 No. 1, pp. 125-153/March 2003 125

Santhanam & Hartono/Linking IT Capability to Firm Performance
It is the obligation of every IS profes-sional to understand the issues thatsurround the paradox...and each of usmust then be prepared and willing toparticipate knowledgeably in the debate.(Ives1994, pp. 21-24)
To address this productivity paradox, a theory-based framework commonly referred to as theresource-based view (RBV) has been adopted.Based on this, Bharadwaj (2000) proposed that iffirms can combine IT related resources to createa unique IT capability, it can result in superior firmperformance. She demonstrated that the averageperformance of firms identified as possessingsuperior IT capability was significantly superior tothe average performance of a matched set offirms.
A true test of a theory's usefulness depends onproper replications, extensions, and generaliza-tions (Rosenthal 1991; Tsang and Kwan 1999).Such replications play a central role in theconstruction of IS knowledge (Berthon et al. 2002)and can help build a much needed cumulativetradition in IS (Benbasat and Zmud 1999;Sambamurthy 2001). Because the RBV is in-creasingly being used to address a critical ISresearch issue, namely the productivity paradox,further investigation of this framework is neces-sary. Hence, the objective of this study is to testthe robustness of the concept of IT capability andits relationship to firm performance, and to identifycritical issues in the application of RBV to examinethe productivity paradox.
Research Framework
Empirical evidence to unambiguously support theview that investments in IT-related resourcesenhance firm performance has been elusive (for areview, see Chan 2000). The inconsistenciesobserved among various studies have beenattributed to variation in methods and measuresused in the analyses (Hitt and Brynjolfsson 1996).Because the assessment ofthe economic impactof IT is of critical importance to IS researchers.
more research using unifying theory-based frame-works is necessary (Chan 2000; Ives 1994).
Barney (1991) proposed that firms could obtaincompetitive advantages on the basis of corporateresources that are firm specific, valuable, rare,imperfectly imitable, and not strategically substitu-table by other resources. This is often referred toas the resource-based view (RBV) of a firm.Grant (1991) and Makadok (1991) emphasize thatwhile resources by themselves can serve as thebasic units of analyses, firms create competitiveadvantage by assembling these resources tocreate organizational capabilities. Makadok statesthat these firm-specific capabilities, embedded inorganizational processes, provide economicreturns because the firm is more effective than itsrivals in deploying resources. IS researchershave adopted this capability notion of resourcesby arguing that competitors may easily duplicateinvestments in IT resources by purchasing thesame hardware and software, and henceresources perse do not provide sustained compe-titive advantages. Rather, it is the manner inwhich firms leverage their IT investments to createunique capabilities that impact a firm's overalleffectiveness (Clemons and Row 1991; Mata et al.1995). Using this RBV framework, firms candevise strategies to create and sustain advan-tages from investments in IT (Duliba et al. 2001).Ross and Beath (1996) provide Illustrative caseexamples to underscore the idea that a firm's ITcapability can indeed provide competitive advan-tages and enhance a firms' performance.
Recently, Bharadwaj (2000) empirically tested therelationship between the IT capability of a firm andits performance by comparing the financial perfor-mance of firms rated as IT leaders to those ofcomparable firms. The list of IT leaders wasobtained from Information Week and representeda set of firms chosen by a panel of industryexperts as the most efficient and effective users ofIT in the industry. Each of these IT leader firmswas matched with another firm of similar size.The financial performance of the IT leaders andthe matching firms were compared. The resultsindicated that the average financial performancemeasures of IT leader firms (hereafter referred to
126 MIS Quarterly Vol. 27 No. 1/March 2003

Santhanam & Hartono/Linking IT Capability to Firm Performance
as leaders) were significantly better than those ofthe matched firms on several measures of finan-cial performance. This provided support for theargument that those firms that develop aneffective IT capability are able to obtain superiorfinancial performance compared to those who donot develop an effective IT capability.
While this study is an important first step ininvestigating the productivity paradox using RBV,there are several issues that need to be add-ressed. Resolution of these issues is important inorder to generalize the results and establish therobustness of the RBV framework. In the fol-lowing sections, we identify and discuss issuesrelating to (1) the benchmark firms used for com-parison with leader firms, (2) adjustments for priorfinancial performance of firms, and (3) evaluationof sustained performance effects.
Benchmarks for Comparison
In Bharadwaj, a single benchmark (or control) firmwas chosen for each leader firm based on thecriteria that it was of comparable size and in thesame industry as the IT leader. Such a matchingprocedure allows for a strong statistical test, buthas important implications regarding the robust-ness of the results. When multiple organizationsfit the criteria, one was chosen at random. Thedifferences between the financial performance ofthe leader firms and these benchmark firms wereanalyzed. The choice of a single benchmark froma potential set of firms may make the observedresults sensitive to the selection of individualbenchmark firms. Poor management practices ofa benchmark firm may impact the observed dif-ferences in the financial performance betweenleader and benchmark firms. In fact, some of thefirms used as a benchmark (such as MontgomeryWard) have gone out of business. While the im-pact of a single benchmark firm may not be sub-stantive in analysis involving a large number offirms, the study consisted of only 56 leader-controlpairs. Hence, the choice of benchmark firms inthis relatively small sample goes directly to add-ress the issue as to whether the results are robustto changes in the choice of benchmark firms.
An alternative approach to selecting a singlebenchmark firm for each ITIeaderfirmwouldbetoconsider all the firms in that industry as the bench-mark for comparison. This procedure provides amore robust test of the IT capability framework forseveral reasons. First and foremost, this ap-proach is consistent with the selection procedurefor leaders. The leaders were selected because,"within each industry group, the firms receiving thehighest number of votes are selected as ITleaders" (Bharadwaj 2000, pg, 177), Since thecriterion for choosing the IT leaders was the firm'sIT capability in relation to all other firms in ttieindustry, it stands to reason that a consistentbenchmark for comparing financial performanceshould also be all other firms in the industry.Second, average industry performance is oftensuggested as the standard of comparison inresearch as well as in practice (Robbins andPearce 1992; Wisner and Eakins 1994), Third,from a statistical perspective, using all of the firmsin the industry reduces the potential variability thatcould arise from choosing a single firm as thebenchmark for comparison. Fourth, using theindustry as a basis for benchmarking allows us todefine the "industry" in different ways. If data canbe analyzed for different definitions of industry, itcan provide a better measure of the robustness ofthe results. Finally, and perhaps most importantly,Tsang and Kwan (1999) suggest that such typesof replication are important in determining theextent to which the results of the prior study canbe generalized. Therefore, we propose the fol-lowing hypotheses:
Hypothesis 1 : The average profit ratiosof firms that have superior IT capabilityare higher than the average profit ratiosof all other firms in the industry.
Hypothesis 2: The average cost ratiosof firms that have superior IT capabilityare lower than the average cost ratios ofall other firms in the industry.
Adjusting for Prior FinancialPerformance
The selection of IT leaders was determined by apanel of experts who identified these firms as the
MIS Quarterly Vol. 27 No. 1/March 2003 127

Santhanam & Hartono/Linking iT Capabiiity to Firm Performance
most "effective and efficient users of informationtechnology" (Dreyfus 1994, p. 30). Prior researchhas suggested that reputation ratings by industryexperts are often influenced by a firm's priorfinancial performance and subject to a "haloeffect" (Brown and Perry 1994). Hence, the selec-tion of a firm as an IT leader could be influer\cedby theirsuperiorfinancial performance ratherthantheir IT capability. Bharadwaj calculated a haloindex for each leader firm based on their priorfinancial performance. She did not find sufficientstatistical evidence to indicate a relationshipbetween the halo index for the firm and its ratingas an IT leader and hence conducted her analysisassuming there was no halo effect.
This particular halo index was created fromperformance measures that were different fromthe actual dependent measures used to test theperformance effects of IT capability. Secondly,the halo index utilized the average financialperformance of the prior five years while rankingsmight have been more influenced by a firm'simmediate past performance. Given that severalprior research findings have indicated the pre-sence of a financial performance halo effect andit cannot be ruled out with complete certainty, aresearch question to be investigated is the fol-lowing: If there is a halo effect, what impact wouldit have on the observed results? Hence, a moreconservative approach to addressing the haloeffect is to assume that a halo effect does exist,and then determine the impact of IT capability onfinancial performance, after adjusting for the haloeffect. If results of such analysis indicate superiorfinancial performance for IT leaders, then there ismore convincing evidence for a relationship be-tween IT capability and financial performance thatis not attributable to prior financial performance.
Perhaps equally important is the fact that there isconsiderable evidence in the finance literatureindicating that current financial performance isstrongly related to prior financial performance(e.g., Fama and French 2000). Analysis con-ducted without eliminating the effect of priorfinancial performance on current financial perfor-mance may overstate the significance of ITcapability. Thus, given the dual impact of financialperformance on IT leader rating and on current
financial performance, it is reasonable to adjustthe impact of prior financial performance on bothof these variables and analyze the relationshipbetween IT capability and firm performance. Byemploying analytical procedures that are moreconservative and different from the original study,this analysis would serve as a conceptual exten-sion to the prior study supporting a theory testingand development process (Tsang and Kwan1999). Hence, we propose the following:
Hypothesis 3: The average profit ratiosof firms that have superior IT capabilityare higher than the average profit ratiosof ail other firms in the industry afteradjusting for prior financiai performance.
Hypothesis 4: The average cost ratiosof firms that have superior IT capabilityare iower than the average cost ratios ofali other firms in the industry afteradjusting for prior financiai performance.
Testing the Sustained Effectsof iT Capabiiity
According to the RBV, the benefits of superior ITcapability must be sustainable over time. Barney(1991) states that sustained competitive advan-tage does not imply that the benefits will lastforever but indicates that it will not "be competedaway by the duplication efforts of other firms." Hestates this as an important research issue. Grant(1991) emphasized that the primary task of theresource-based approach in strategy formulationis to provide a way to maximize returns overseveral periods. Specifically, the concept of ITcapability was developed using the premise thatwhile resources can be easily duplicated, a uniqueset of capabilities mobilized by a firm cannot beeasily duplicated and will result in sustained com-petitive advantages. Researchers have empha-sized that IT investments are made with long-termgoals and there is a time lag in obtaining benefits(Brynjolfsson and Hitt 1998; Weill and Olson1989). Despite these assertions, very few studiestest the sustained effects of IT investments(Mahmood and Mann 2000). Chan (2000) sug-
128 MIS Quarterly Vol. 27 No. 1/March 2003

Santhanam & Hartono/Linking IT Capability to Firm Performance
gests that the lack of time-lagged studies could beone possible reason for the inconsistenciesamong studies linking IT investments to firmperformance. Hence, it is important to test thesustained benefits of IT capability.
Based on the above discussion, we propose fourhypotheses. The first two hypotheses (similar tohypotheses 1 and 2) use all of the firms in theindustry as the benchmark and compare financialperformance of the leaders to the benchmarkfirms over a sustained period of time. The secondtwo hypotheses (similar to hypotheses 3 and 4)investigate performance differences betweenleader firms and benchmark firms after adjustingfor prior financial performance.
Hypothesis 5: The average profit ratiosof firms that have superior IT capabilityare higher than the average profit ratiosof all other firms in the industry in subse-quent years.
Hypothesis 6: The average cost ratiosof firms that have superior IT capabilityare lower than the average cost ratios ofall other firms in the industry in subse-quent years.
Hypothesis 7: After adjusting for priorfinancial performance, the average profitratios of firms that have superior IT capa-bility are higher than the average profitratios of all other firms in the industry insubsequent years.
Hypothesis 8: After adjusting for priorfinancial performance, the average costratios of firms that have superior IT capa-bility are lower than the average costratios of all other firms in the industry insubsequent years.
Note that by using different years of analysis totest the effects of IT capability and by also usingdifferent analytical procedures from the priorstudy, this type of replication can be viewed as ageneralization and extension of the prior study(Tsang and Kwan 1999),
Method
The purpose of this study was to test theusefulness of the RBV framework by replicating,generalizing, and extending the framework ofBharadwaj (2000), Therefore, with the exceptionof specific changes discussed in the previous sec-tion, we attempted to maintain the same metricsas in the prior study. The same source of data(Compustat database) and the same eight perfor-mance measures were used. These measureswere:
Profit Ratios: Return on sales (ROS), return onassets (ROA), operating income to assets(Ol/A), operating income to sales (Ol/S), andoperating income to employees (Ol/E),
Cost Ratios: Cost of goods sold to sales(COG/S), selling and general administrationexpenses to sales (SGA/S), and operatingexpenses to sales (OPEXP/S),
In every year during the period 1991 through1994, Information Week published a list of 40 to50 firms that were rated by industry experts asleaders in their respective industries, in the use oftechnology. Using these ratings, Bharadwaj com-piled a set of 149 unique firms that were voted asleaders in at least one year. From this compiledlist, she selected 56 as having an enduring ITcapability because they were rated as leaders inat least two of the four years (some were rated asleaders in three years and some in all four years).This set of 56 firms was called IT leaders and weuse the same set of leaders in this study. Sinceone of the objectives of the study was to genera-lize the results of the RBV framework by using thefirms in the industry as the benchmark, the stan-dard industry classification (SIC) scheme wasutilized. The SIC is a four-digit system of classifi-cation that can identify a firm based on its busi-ness activity. When a firm is classified using thefirst two digits of the SIC code (referred to as theprimary SIC code), the classification is mostgeneral. Classification of a firm using all fourdigits is most specific and identifies the productlines of a firm. We formed two different sets ofbenchmark firms (control groups). In the first set.
MIS Quarterly Vol. 27 No. 1/March 2003 129

Santhanam & i-lartono/Lini<ing iT Capabiiity to Firm Performance
for each leader firm in the sample, ail the firmsthat had the same four digit SiC code as theieader firm were seiected. To furtiier enhancegeneraiizabiiity, for each ieader firm, a secondcontroi group consisting of aii the firms with thesame two digit SIC code was created. The 56ieader firms and these two different controi groupswere utilized in conducting aii of the tests.
Benchmark for Comparison(Hypotheses 1 and 2)
Simiiar to the prior study, to test hypotiieses 1and 2 we empioyed the matctied sample com-parison group methodoiogy. For each of the eightperformance measures, the difference betweenthe performance of the leader firm and theaverage performance of ail firms with the corres-ponding (two and four digit) SiC codes was com-puted and anaiyzed. Both the Wiicoxon signed-rani< test and the parametric t-test were used totest differences.
Adjusting for Prior FinancialPerformance (Hypotheses3 and 4)
Regression anaiysis procedures were utiiized totest hypotheses 3 and 4. Separate sets of regres-sion anaiyses were conducted, with controi groupsincluding firms matched at the two and four digitSiC codes, and for each financiai performanceratio within each controi group. The anaiysis wasbased on three variabies, nameiy, the financiaiperformance measure (profit or cost ratios) for thecurrent year, tiie financiai performance measurefor the previous year, and a binary indicatorvariabie (coded as 1 for ieaders and 0 for thecontrol group). First a regression anaiysis regres-sing prior years' performance on current perfor-mance was conducted. Next, the indicator vari-abie was added to the modei and the resuits wereanaiyzed. Tiie two modeis can be stated as:
FP, =FP, = FP,,.i, +
(1)(2)
where FP denotes financiai performance, t repre-sents the time period, and (po and OQ) are theintercepts, p,, a, and cxj represent the regressioncoefficients in tiie second modei, and D denotesthe (0, 1) binary variable.
Since tiie second model irwolved the addition of asingie variabie, the significance of the coefficient(02) of this variabie wiii indicate whether the iTcapabiiity has a statisticaiiy significant effect onperformance (after adjusting the effects of priorperformance on both the independent and depen-dent variables). Note that this regression analysisprocedure wiii provide simiiar resuits as theprocedure suggested by Brown and Perry (1994)of regressing (the residuai resulting from pre-dicting iT ieadership using prior years' perfor-mance) on (the residuai resuiting from predictingcurrent year's performance using prior year'sperformance) (Neter et ai. 1996).
Testing for Sustained Effectsof IT Capability (Hypotheses5, 6, 7, and 8)
To test hypotheses 5, 6, 7, and 8, data for thesame set of ieader and controi firms were utiiized.Because the ieader firms were identified as havingsuperior iT capabiiity over the period 1992 through1994, comparing their performance to their within-industry competitors for the period 1995 through1997 wiii provide evidence on the sustained ef-fects of superior iT capabiiity. A matched sampiecomparison group method (simiiar to the test forhypotheses 1 and 2) was used to test hypothesis5 and 6 and a regression anaiysis adjusting forprior performance (simiiar to the test for hypo-theses 3 and 4) was used to test hypotheses 7and 8.
Results
A summary of the resuits is provided in Tabie 1.The specific resurts of all analyses are shown inTabies 2 through 9. The performance data onsome measures for some of the ieader and controi
130 M/S Quarterly Voi. 27 No. 1/March 2003

Santhanam & Hartono/Linking IT Capability to Firm Performance
Table 1. Summary of Results
Hypothesis 1
Hypothesis 2
Hypothesis 3
Hypothesis 4
Hypothesis 5
Hypothesis 6
Hypothesis 7
Hypothesis 8
The average profit ratios of firms that have superior IT capability arehigher than the average profit ratios of all other firms in the industry
The average cost ratios of firms that have superior IT capability arelower than the average cost ratios of all other firms in the industry
The average profit ratios of firms that have superior IT capability arehigher than the average profit ratios of all other firms in the industry
after adjusting for prior financial performance
The average cost ratios of firms that have superior IT capability arelower than the average cost ratios of all other firms in the industry
after adjusting for prior financial performance
The average profit ratios of firms that have superior IT capability arehigher than the average profit ratios of all other firms in the industry
in subsequent years.
The average cost ratios of firms that have superior IT capability arelower than the average cost ratios of all other firms in the industry in
subsequent years
After adjusting for prior financial performance, the average profitratios of firms that have superior IT capability are higher than the
average profit ratios of all other firms In the industry in subsequentyears
After adjusting for prior financial performance, the average costratios of firms that have superior IT capability are lower than the
average cost ratios of all other firms in the industry in subsequentyears
Stronglysupported
Stronglysupported
Partiallysupported
Partiallysupported
Stronglysupported
Stronglysupported
Supported
Supported
firms were not available in the recent version ofthe Compustat database and hence had to beexcluded. The sample size on each performancemeasure is provided in the respective tables.
Benchmark for Comparison(Hypotheses 1 and 2)
Tables 2 and 3 list the results of the matchedsample procedures with benchmarks selectedusing the two and four digit SIC codes. The t-statistic from the t-test and the Z-statistic from theWilcoxon test are reported. Following the conven-
tion in prior studies, a negative sign is includedbefore the test statistic if the performance of theleader group is higher than the control group andvice versa. Hence, a significant negative teststatistic in profit ratios and a significant positivetest statistic for cost ratios will indicate superior ITcapability effect.
We found strong support for both of our hypothe-ses, with profit ratios significantly higher for theleader sample and cost ratios significantly lowerfor the control sample, in most cases. The resultsshow that, with a few exceptions, the pairwise t-test and Wilcoxon signed-ranks test indicate
MIS Quarterly Vol. 27 No. 1/March 2003 131

Santhanam & Hartono/Unking iT Capabiiity to Firm Performance
Table 2. Matched Sample Comparison of Firms at the Specific SIC Classification(Four Digit)
ROA
ROS
Ol/A
Ol/S
Ol/E
COG/S
SGA/S
OPEXP/S
ROA
ROS
Ol/A
Ol/S
Ol/E
COG/S
SGA/S
OPEXP/S
leadercontrolleadercontrolleadercontrolleadercontrolleadercontrolleadercontrolleadercontrolleadercontrol
leadercontrolleadercontrolleadercontrolleadercontrolleadercontrolleadercontrolleadercontrolleadercontrol
1991
N
46464646454645464446464632433243
Mean
0.044-0.3500.054
-6.9360.1370.0710.188
-4.13742.19226.587
0.6594.8650.2240.6550.8340.936
Median
0.0390.0180.0480.0160.1380.0990.1570.075
30.96921.134
0.6430.7070.2140.2580.8520.890
t
-3.375*"
-1.969*
-3.182*"
-1.961*
-3.000***
1.914*
4.153*"
3.979"*
Z
-3.065"*
-4.545***
-3.539*"
-4.351*"
-3.198*"
1.491
3.852*"
4.581*"
1992
N
46464646454645464446464632433243
Mean
0.028-3.6290.037
-1.2650.1360.0540.191
-1.14543.75727.6810.6551.8690.2260.3550.8230.992
Median
0.0370.0150.0390.0210.1460.1040.1530.081
35.42219.7530.6390.7090.2290.2640.8640.933
t
-2.204**
-2.111"
-2.736*"
-2.152"
-2.847*"
1.963*
4.102*"
3.986*"
Z
-1.961"
-3.556*"
-2.974***
-3.939***
-3.139*"
1.415
3.815*"
3.945***
ROA: Return on Assets; ROS: Return on Sales; Ol/A: Operating Income to Assets; Ol/S: Operating Income to Saies; Oi/E: OperatingIncome to Employees; COG/S: Cost of Goods Sold to Sales; SGA/S: Selling and General Administration Expense to Saies; OPEXP/S:Operating Expenses to Saies
•Significant at the 10 percent ievei of significance."Significant at the 5 percent ievel of significance.•"Significant at the 1 percent Ievei of significance.
132 MiS Quarterly Vol. 27 No. 1/March 2003

Santhanam & Hartono/Linking IT Capability to Firm Performance
Table 2. Matched Sample Comparison of Firms at the Specific SIC Classification 1(Four Digit) (Continued) |
ROA
ROS
Ol/A
Ol/S
Ol/E
COG/S
SGA/S
OPEXP/S
ROA
ROS
Ol/A
Ol/S
Ol/E
COG/S
SGA/S
OPEXP/S
leadercontrolleadercontrolleadercontrolleadercontrolleadercontrolleadercontrolleadercontrolleadercontrol
leadercontrolleadercontrolleadercontrolleadercontrolleadercontrolleadercontrolleadercontrolleadercontrol
1993
N
45464546434643464246454632433243
Mean
0,034-1.4300.053
-0,7800,1410,0760,213
-0,61752.07428,7500,6361,3330,2240,3950,8121,027
Median
0,0350,0190.0490,0270,1480,0990,1680,085
35,56320,456
0,6240,7110.2320,2530,8410,933
t
-2,832***
-2,253**
-3,808***
-2,295**
-3,896***
1,947*
3,312***
3,432***
Z
-2,568***
-3,234***
-3,961***
-4,081***
-4.408***
1,608
3,459***
3,945***
1994
N
45464546444644464046454631433143
Mean
0,055-4.2390,077
-2,1490,1430.0360,217
-1,88960,62523,920
0,6362,6300,2180.3730,8081,015
Median
0,0480,0100.0640,0300,1470,0940,1820,079
46,36921,613
0,6710,7030,2230.2610.8380,930
t
-3,167***
-1,996*
-3,297***
-1,970*
-4,235***
1,863*
2,640**
2.935***
Z
-3,177***
-3,516***
-3,875***
-4,481***
-4,409***
1,597
3,723***
4,488***
ROA: Return on Assets; ROS: Return on Sales; Ol/A: Operating Income to Assets; Ol/S: Operating Income to Sales; Ol/E: OperatingIncome to Employees; COG/S: Cost of Goods Sold to Sales; SGA/S: Selling and General Administration Expense to Sales; OPEXP/S:Operating Expenses to Sales
'Significant at the 10 percent level of significance,"Significant at the 5 percent level of significance,"'Significant at the 1 percent level of significance.
MIS Quarterly Vol. 27 No. 1/March 2003 133

Sartthanam & Hartono/Unking IT Capability to Firm Performance
Table 3. Matched Sample Comparison of Firms at the Primary SIC Classification(Two Digit)
ROA
ROS
Ol/A
Ol/S
Ol/E
COG/S
SGA/S
OPEXP/S
ROA
ROS
Ol/A
Ol/S
Ol/E
COG/S
SGA/S
OPEXP/S
leadercontrolleadercontrolleadercontrolleadercontrolleadercontrolleadercontrolleadercontrolleadercontrol
leadercontrolleadercontrolleadercontrolleadercontrolleadercontrolleadercontrolleadercontrolleadercontrol
1991
N
46464646454645464446464632433243
Mean
0.044-0.0430.054
-6.8380.1370.0340.188
-7.19542.19248.1360.6597.2580.2241.3840.8342.136
Median
0.039-1.7860.048
-0.1790.1380.0530.157
-0.09130.96911.8850.6430.8070.2140.4390.8521.078
t
-4.743***
-2.849***
-4.826***
-3.154***
0.208
3.046***
3.290***
3.515***
Z
-4.408***
-3.753***
-5.017***
-5.683***
-3.571***
3.807***
4.806***
4.768***
1992
N
46464646454645464446464632433243
Mean
0.028-0.0420.037
-5.8800.1360.0180.191
-1.89743.75731.2780.6552.3850.2260.7130.8232.259
Median
0.037-4.7600.039
-0.4620.1460.0550.153
-0.50935.42211.3330.6390.8200.2290.4310.8641.037
t
-3.840**
-2.865***
-5.298***
-4.435***
-0.669
4.065***
5.339***
3.875***
Z
-3.600**
-5.698***
-5.074***
-5.661***
-3.781***
4.266***
4.937***
4.824***
ROA: Return on Assets; ROS: Return on Sales; Ol/A: Operating Income to Assets; Ol/S: Operating Income to Sales; Ol/E: OperatingIncome to Employees; COG/S: Cost of Goods Sold to Sales; SG/WS: Selling and General Administration Expense to Sales; OPEXP/S:Operating Expenses to Sales
"Significant at the 10 percent level of significance."Significant at the 5 percent level of significance.•"Significant at the 1 percent level of significance.
134 MIS Quarterly Vol. 27 No. 1/March 2003

Santhanam & Hartono/Unking IT Capabiiity to Firm Performance
Table 3. Matched Sample Comparison of Firms at the Primary SIC Classification(Two Digit) (Continued)
ROA
ROS
Ol/A
Ol/S
Ol/E
COG/S
SGA/S
OPEXP/S
ROA
ROS
Ol/A
Ol/S
Ol/E
COG/S
SGA/S
OPEXP/S
leadercontrolleadercontrolleadercontrolleadercontrolleadercontrolleadercontrolleadercontrolleadercontrol
leadercontrolleadercontrolleadercontrolleadercontrolleadercontrolleadercontrolleadercontrolleadercontrol
1993
N
45464546434643464246454632433243
Mean
0.0340.7310.053
-2.0590.141
-0.3290.213
-1.87452.07435.3660.6362.3460.2240.6800.8121.444
Median
0.035-1.7490.049
-0.2400.1480.0540.1680.032
35.56312.9860.6240.7980.2320.3850.8411.077
t
1.193
-4.066***
-1.996*
-4.112***
-1.143
3.481***
5.753***
5.041***
Z
-3.889***
-5.085***
-5.132***
-5.422***
-4.333***
3.877***
4.693***
4.824***
1994
N
45464546444644464046454631433143
Mean
0.055-0.1700.077
-2.5730.143
-4.0200.217
-1.85360.62537.8730.6362.5140.2180.4850.8081.126
Median
0.048-9.3980.064
-0.1610.1470.0620.1820.015
46.36913.3260.6710.7760.2230.4790.8381.116
t
-3.954***
-3.123***
-4.537***
-3.131***
-1.779*
2.863***
6.738***
6.913***
Z
-4.532***
-5.096***
-5.147***
-5.240***
-4.503***
2.760***
4.507***
4.723***
ROA: Return on Assets; ROS: Return on Sales; Ol/A: Operating Income to Assets; Ol/S: Operating income to Saies; Oi/E: Operatingincome to Empioyees; COG/S: Cost of Goods Sold to Saies; SGA/S: Seiiing and Generai Administration Expense to Saies; OPEXP/S:Operating Expenses to Saies
"Significant at the 10 percent ievel of significance."Significant at the 5 percent ievel of significance.•"Significant at the 1 percent Ievei of significance.
MiS Quarteriy Voi. 27 No. 1/March 2003 135

Santhanam & Hartono/Unking IT Capability to Firm Performance
similar results. From Tables 2 and 3, it is seenthat, in each of the four years, for industry aver-ages computed using both two and four digit SICcodes, for all profit ratios and three of the costratios, the average performance of the leaderswas significantly better than the industry aver-ages. These results are not only consistent withthe results found earlier, but in some cases,stronger. For instance, the SGA/S ratio was signi-ficantly lower for the leader sample only in oneyear in the earlier study, but in this study, it waslower in all four years. In addition, the level ofsignificance of the effects was also higher inseveral cases (for example tests of Ol/E in 1991in Table 2, Ol/A in 1991 in Table 3, and OPEXP/Sin 1991 in Tables 2 and 3).
Note that while not significant, in two instances,the t-tests indicated results that were contrary toexpectations. The mean of ROA in 1993 and Ol/Ein 1991 (Table 3) were found to be lower for theleader sample instead of being higher. TheWilcoxon test indicated that the value of themedian was significantly higher for both the ratios.Considering that 64 different tests were per-formed, it is not unreasonable to observe a fewinconsistencies that might have occurred bychance.
As seen in Tables 4 and 5, there is variation in themagnitude and levels of significance dependingon the year of analysis and whether control firmswere matched at the four digit or two digit SICcode level. When control firms at the four digitlevel were used (Table 4), only 3 of the 24 per-formance measures were found to be significant.When control firms are matched at the two digitlevel (Table 5), 16 of the 24 performance mea-sures were found to be significant. Table 4 showsthat in 1992, when industry averages based onthe four digit SIC code are used, no significanteffects are observed on any of the performancemeasures. However, from Table 5 it is seen thatfor the same year, when industry averages basedon the two digit SIC code are used, significanteffects are observed on all performance mea-sures. On six ofthe eight ratios (ROS, Ol/S, Ol/E,COG/S, SGA/S, and OPEXP/S), the effects oftheIT capability factor were highly significant (p <0.01). It should also be noted that" on two ratiosin Table 4 (ROA (1993) and Ol/S (1994)), and tworatios in Table 5 (Ol/S (1994) COG/S (1994)), thecoefficient of the binary variable was significantbut not in the expected direction. Thus, theresults for hypotheses 3 and 4 seem to depend onthe benchmark firms used for comparison and areless pronounced than that obtained by using thematched sample comparison procedure.
Adjusting for Prior FinancialPerformance (Hypothesis 3and 4)
Tables 4 and 5 show the results of the regressionanalysis that seek to examine the effects of ITcapability after adjusting for prior year's firm per-formance. Changes in R-square and the regres-sion coefficients of models described in equations(1) and (2) are shown. It is important to note fromthe results shown for model 1 that, in almost allcases, prior performance has a significant effecton current year's performance. In analyzing ITcapability effect, a significant positive coefficientfor the dummy term relating to profit ratios and asignificant negative coefficient for the dummy termrelating to cost ratios would indicate an ITcapability effect on performance.
Testing for Sustained Effectsof IT Capability
Matched Sample Comparison Procedure forSustained Effects (Hypotheses 5 and 6)
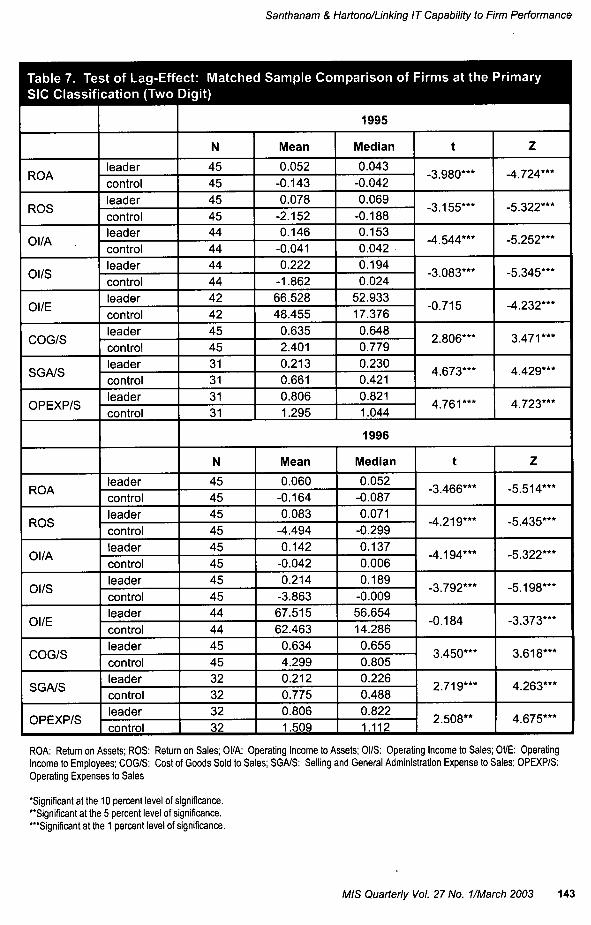
Tables 6 and 7 present the results of matchedsample comparison procedures with control firmsat the four digit SIC and the two digit SIC coderespectively. The results indicate that the profitratios are significantly higher and the cost ratiosare significantly lower for IT leaders, when com-pared to the industry averages in all cases whenthe Wilcoxon test is used and in almost all caseswhen the t-test is used. The few exceptions weret-test performed on one profit ratio for three years(Ol/E 1995,1996,1997 in Table 7) and four ratios
136 MIS Quarterly Vol. 27 No. 1/March 2003

Santhanam & Hartono/Unking IT Capability to Firm Performance
Table 4. Regression Analysis of Firms at the Specific SIC Classification (Four Digit)
ROA
ROS
Ol/A
Ol/S
Ol/E
COG/S
SGA/S
OPEXP/S
ROA
ROS
Ol/A
Ol/S
Ol/E
COG/S
SGA/S
OPEXP/S
Model1212121212121212
Model1212121212121212
N
92
92
90
90
88
92
64
64
N
91
90
86
86
84
90
64
64
1992
R-SquareChange
0.247***0.0050.518***0.0040.389***0.0070.937***0.0000.941***0.0000.975***0.0000.740***0.0000.642***0.001
1991 FinancialPerformance
0.497***0.471***0.720***0.707***0.624***0.593***0.987***0.985***0.970***0.971***0.987***0.987***0.860***0.847***0.801***0.789***
Dummy°
0.074
0.061
0.089
0.007
-0.004
0.000
-0.039
-0.027
1993
R-SquareChange
0.642***0.011*0.999***0.0000.518***0.310**0.998***0.0000.973***0.0010.997***0.0000.946***0.0000.911***0.000
1992 FinancialPerformance
0.801***0.774***1.000***0.999***0.720***0.661***0.999***0.998***0.986***0.980***0.999***0.998***0.972***0.977***0.955***0.950***
Dummy°
0.109*
0.002
0.185**
0.007
0.026
-0.003
0.015
-0.011Model 1: (Performance measure for year t) = f(Performance measure for year t-1)Model 2: (Performance measure for year t) = f(Performance measure for year t-1, dummy: 1 = leader finn, 0 = control finn)
'Please note that for model 1, the dummy variable is not included and hence has no coefficient.
ROA: Return on Assets; ROS: Return on Sales; Ol/A: Operating Income to Assets; Ol/S: Operating Income to Sales; Ol/E:Income to Employees; COG/S: Cost of Goods Sold to Sales; SGA/S: Selling and General Administration Expense to Sales;Operating Expenses to Sales
"Significant at the 10 percent level of significance."Significant at the 5 percent level of significance.""Significant at the 1 percent level of significance.
OperatingOPEXP/S:
MIS Quarterly Vol. 27 No. 1/Marcti 2003 137

Santhanam & Hartono/Linking IT Capability to Firm Performance
Table 4. Regression Analysis of Firms at the Specific SIC Classificat(Continued)
ROA
ROS
Ol/A
Ol/S
Ol/E
COG/S
SGA/S
OPEXP/S
Model1212121212121212
N
90
90
86
86 .
80
90
62
63
on (Four Digit)
1994
R-SquareChange
0,680***0,009*0,994***0,0000,787***0,0000,993***0.0001*0,623***0,027**0.992***0,0000,625***0,0010,661***0.000
1993 FinancialPerformance
0.825***0,794***0,997***0,999***0,887***0,878***0.996***1,000***0,790***0,744***0,996***0,999***0,790***0,778***0,813***0,813***
Dummy°
0,101*
-0,009
0,023
-0,017*
0,170**
0,013
-0,040
-0,001Model V, (Performance measure for year t) = f(Pertorniance measure for year t-1)Model,2: (Performance measure for year t) = f(Perfomiance measure for year t-1, dummy: 1 = leader firm, 0 = control firm)
'Please note that for model 1, the dummy variable is not included and hence has no coefficient,
ROA: Retum on Assets; ROS: Return on Sales; Ol/A: Operating Income to Assets; Ol/S: Operating Income to Sales; Ol/E: OperatingIncome to Employees; COG/S: Cost of Goods Sold to Sales; SGA/S: Selling and General Administration Expense to Sales; OPEXP/S:Operating Expenses to Sales
"Significant at the 10 percent level of significance,"Significant at the 5 percent ievel of significance.'"Significant at the 1 percent level of significance.
138 MIS Quarteriy Vol. 27 No. 1/March 2003

Santhanam & Hartono/Unking IT Capability to Firm Performance
1 Table 5. Regression Analysis of Firms at the Primary SIC Classification (Two Digit)
ROA
ROS
Ol/A
Ol/S
Ol/E
COG/S
SGA/S
OPEXP/S
ROA
ROS
Ol/A
Ol/S
Ol/E
COG/S
SGA/S
OPEXP/S
Model1212121212121212
Model1212121212121212
N
92
92
90
90
88
92
64
64
N
90
90
86
86
84
90
64
64
1992
R-SquareChange
0.043**0.064**0.0080.106***0.952***0.002*0.394***0.050***0.954***0.007***0.336***0.052***0.920***0.018***0.084**0.117***
1991 FinancialPerformance
0.206**0.064
-0.092-0.190*0.976***0.952***0.628***0.551***0.977***0.978***0.580***0.506***0.959***0.906***0.290*0.142
Dummy°
0.290**
0.340***
0.050*
0.236***
0.083***
-0.240***
-0.144***
-0.373***1993
R-SquareChange
0.0280.0000.0190.122***0.178***0.0020.692***0.0010.951***0.0010.719***0.0000.239***0.077***0.0000.253***
1992 FinancialPerformance
-0.166-0.1600.1370.0310.422***0.452***0.832***0.816***0.975***0.973***0.848***0.848***0.489***0.338***0.011
-0.228*
Dummy°
-0.021
0.365***
-0.055
0.037
0.029
0.000
-0.315***
-0 557***Model 1: (Performance measure for year t) = f(Perforniance measure for year t-1)Model 2: (Performance measure for year t) = f(Performance measure for year t-1, dummy: 1 = leader firm, 0 = control finn)
'Please note that for model 1, the dummy variable is not included and hence has no coefficient.
ROA: Return on Assets; ROS: Return on Sales; Ol/A: Operating Income to Assets; Ol/S: Operating Income to Sales; Ol/E:Income to Employees; COG/S: Cost of Goods Sold to Sales; SGA/S: Selling and General Administration Expense to Sales;Operating Expenses to Saies
"Significant at the 10 percent level of significance."Significant at the 5 percent levei of significance.•"Significant at the 1 percent ievel of significance.
OperatingOPEXP/S:
MIS Quarterly Vol. 27 No. 1/March 2003 139

Santtianam & Hartono/Linidng iT Capabiiity to Firm Performance
Table 5. Regression Analysis of Firms at the Primary SIC Classification (Two Digit)(Continued)
ROA
ROS
Ol/A
OI/S
Ol/E
COG/S
SGA/S
OPEXP/S
Model1212121212121212
N
90
90
86
86
80
90
62
62
1994
R-SquareChange
0.378***0.133***0.865***0.0030.458***0.098***0.905***0.004*0.970***0.005***0.956***0.003***0.472***0.051**0.320***0.141***
1993 FinancialPerformance
-0.615***-0.588***0.930***0.951***0.676***0.617***0.951***0.977***0.985***0.977***0.978***0.998***0.687***0.562***0.566***0.367***
Dummy°
0.365***
-0.055
0.319***
-0.067*
0.070***
0.061***
-0.258**
-0.424***Model 1: (Performance measure for year t) = f(Performance measure for year t-1)Model 2: (Performance measure for year t) = f(Performance measure for year t-1, dummy: 1 = leader firm, 0 = control firm)
'Please note that for model 1, the dummy variable is not included and hence has no coefficient.
ROA: Return on Assets; ROS: Return on Sales; Ol/A: Operating Income to Assets; OI/S: Operating Income to Sales; Ol/E:Income to Employees; COG/S: Cost of Goods Sold to Sales; SGA/S: Selling and General Administration Expense to Sales;Operating Expenses to Sales
'Significant at the 10 percent level of significance."Significant at the 5 percent level of significance.•"Significant at the 1 percent level of significance.
OperatingOPEXP/S:
140 MIS Quarteriy Voi. 27 No. 1/March 2003

Santhanam & Hartono/Unking IT Capability to Firm Performance
Table 6. Test of Lag-Effect: Matched Sample Comparison of Firms at the SpecificSIC Classification (Four Digit)
ROA
ROS
Ol/A
Ol/S
Ol/E
COG/S
SGA/S
OPEXP/S
ROA
ROS
Ol/A
Ol/S
Ol/E
COG/S
SGA/S
OPEXP/S
leadercontrolleadercontrolleadercontrolleadercontrolleadercontrolleadercontrolleadercontrolleadercontrol
leadercontrolleadercontrolleadercontrolleadercontrolleadercontrolleadercontrolleadercontrolleadercontrol
1995
N
45454545444444444242454531313131
Mean
0.052-0.1050.078
-1.0880.1460.00020.222
-0.84466.52831.3800.6351.4420.2130.6310.8061.273
Median
0.0430.0090.069
-0.0040.1530.1020.1930.054
52.93326.5790.6480.7090.2300.2600.8210.950
t
-3.414***
-2.371**
-3.370***
-2.453**
-4.067***
2.111**
2.819***
2.942***
Z
-4.120***
-4.724***
-4.271***
-5.030***
-4.245***
2.308**
4.429***
4.390***
1996
N
45454545454545454444454532323232
Mean
0.060-0.2200.083
-0.9070.142
-0.0900.214
-0.89867.51533.0550.6341.2250.2120.9580.8061.784
Median
0.0520.0110.0710.0040.1370.1000.1890.076
56.65422.4140.6550.7390.2260.2570.8220.932
t
-1.644
-1.532
-1.873*
-2.740***
-4.212***
2.546**
1.517
1.464
Z
-3.708***
-4.024***
-4.351***
-5.006***
-4.691***
2.241**
4.394***
4.226***
ROA: Retum on Assets; ROS: Retum on Sales; Ol/A: Operating Income to Assets; Ol/S: Operating income to Saies; Oi/E: Operatingincome to Empioyees; COG/S: Oost of Goods Soid to Saies; SGA/S: Seiling and General Administration Expense to Saies; OPEXP/S:Operating Expenses to Sales
'Significant at the 10 percent Ievei of significance."Significant at the 5 percent ievei of significance.'"Significant at the 1 percent ievei of significance.
MIS Quarterly Vol. 27 No. 1/March 2003 141

Santhanam & Hartono/Unking iT Capabiiity to Firm Performance
Table 6. Test of Lag-Effect: Matched Sample Comparison of Firms at the SpecificSIC Classification (Four Digit) (Continued)
ROA
ROS
Ol/A
OI/S
Ol/E
COG/S
SGA/S
OPEXP/S
leadercontrolleadercontrolleadercontrolleadercontrolleadercontrolleadercontrolleadercontrolleadercontrol
1997
N
47474747474747474646474733333333
Mean
0.060-0.0530.075
-1.9630.1490.0460.214
-1.72769.93233.2740.6372.2890.2100.7120.7961.383
Median
0.0520.0110.073
-0.0070.1420.0820.1950.083
59.90024.2150.6850.7110.2220.2530.8050.950
t
-4.083***
-2.789***
-3.941***
-2.605**
-4.621***
2.276**
3.27***
3.022***
Z
-4.148***
-4.381***
-4.127***
-4.698***
-4.703***
1.640*
4.512***
4.315***
ROA: Return on Assets; ROS: Return on Sales; Ol/A: Operating Income to Assets; OI/S: Operating Income to Sales; Ol/E; OperatingIncome to Employees; COG/S: Cost of Goods Sold to Sales; SGA/S; Selling and General Administration Expense to Sales; OPEXP/S;Operating Expenses to Sales
•Significant at the 10 percent level of significance."Significant at the 5 percent level of significance.•"Significant at the 1 percent level of significance.
142 MiS Quarteriy Voi. 27 No. 1/March 2003
Santhanam & i-iartono/Lini<ing iT Capability to Firm Performance
Table 7. Test of Lag-Effect: Matched Sample Comparison of Firms at the PrimarySIC Classification (Two Digit)
ROA
ROS
Ol/A
Ol/S
Ol/E
COG/S
SGA/S
OPEXP/S
ROA
ROS
Ol/A
Ol/S
Ol/E
COG/S
SGA/S
OPEXP/S
leadercontrolleadercontrolleadercontrolleadercontrolleadercontrolleadercontrolleadercontrolleadercontrol
leadercontrolleadercontrolleadercontrolleadercontrolleadercontrolleadercontrolleadercontrolleadercontrol
1995
N
45454545444444444242454531313131
Mean
0.052-0.1430.078
-2.1520.146
-0.0410.222
-1.86266.52848.455
0.6352.4010.2130.6610.8061.295
Median
0.043-0.0420.069
-0.1880.1530.0420.1940.024
52.93317.3760.6480.7790.2300.4210.8211.044
t
-3.980***
-3.155***
-4.544***
-3.083***
-0.715
2.806***
4.673***
4.761***
Z
-4.724***
-5.322***
-5.252***
-5.345***
-4.232***
3.471***
4.429***
4.723***
1996
N
45454545454545454444454532323232
Mean
0.060-0.1640.083
-4.4940.142
-0.0420.214
-3.86367.51562.4630.6344.2990.2120.7750.8061.509
Median
0.052-0.0870.071
-0.2990.1370.0060.189
-0.00956.65414.2860.6550.8050.2260.4880.8221.112
t
-3.466***
-4.219***
-4.194***
-3.792***
-0.184
3.450***
2.719***
2.508**
Z
-5.514***
-5.435***
-5.322***
-5.198***
-3.373***
3.618***
4.263***
4.675***
ROA: Return on Assets; ROS: Return on Sales; Ol/A: Operating Income to Assets; Ol/S: Operating Income to Sales; Ol/E: OperatingIncome to Employees; COG/S: Cost of Goods Sold to Sales; SGA/S: Selling and General Administration Expense to Sales; OPEXP/S:Operating Expenses to Sales
"Significant at the 10 percent ievel of significance."Significant at the 5 percent ievei of significance.""Significant at the 1 percent ievel of significance.
MiS Quarteriy VoL 27 No. 1/March 2003 143

Santhanam & Hartono/Linidng IT Capabiiity to Firm Performance
Table 7. Test of Lag-Effect: Matched Sample Comparison of Firms at the PrimarySIC Classification (Two Digit) (Continued)
ROA
ROS
Ol/A
OI/S
Ol/E
COG/S
SGA/S
OPEXP/S
leadercontrolleadercontrolleadercontrolleadercontrolleadercontrolleadercontrolleadercontrolleadercontrol
1997
N
47474747474747474646474733333333
Mean
0.060-0.1300.075
-3.616-0.149-0.0200.214
-3.14369.93257.9540.6373.2820.2101.4710.7962.221
Median
0.052-0.0250.073
-0.2720.1420.0250.195
-0.21059.90018.4410.6850.8050.2220.5840.8051 335
t
-5.619***
-3.883***
-5.378***
-3.716***
-0.469
3.259***
4.689***
4.792***
Z
-5.704***
-5.333***
-5.376***
-5.323***
3.644***
3.513***
4.619***
4.780***
ROA: Return on Assets; ROS: Return on Sales; Ol/A: Operating Income to Assets; OI/S: Operating Income to Sales; Ol/E: OperatingIncome to Employees; COG/S: Cost of Goods Sold to Sales; SGA/S: Selling and General Administration Expense to Sales; OPEXP/S:Operating Expenses to Sales
'Significant at the 10 percent level of significance."Significant at the 5 percent level of significance.•"Significant at the 1 percent level of significance.
in 1996 (ROA, ROS, SGA/S, and OPEXP/S inTable 6), whose differences are in the correctdirection but are not significant.
Regression Analysis Procedure for SustainedEffects (Hypothesis 7 and 8)
The effects of the regression analysis testing forsustained effects of IT capability are shown inTables 8 and 9. When industry averages basedon four digit SIC code are used, 12 of 24 ratiosindicate significantly better financial performanceby leaders during the three years after they wererated (Table 8). These effects are most pro-nounced in the third year (i.e., 1997) where signifi-cant effects are observed for six of the eight per-formance ratios. The results with industry aver-
ages based on the two digit SIC code shown inTable 9 indicate stronger effects for leaders with20 of 24 ratios being significant. Once again, inthe third year after being identified as leaders, theresults are strong with seven of the eight ratiosbeing significant. In one ratio (Ol/E 1995 inTable 9) the results were not in the expecteddirection.
Similar to the results observed for current effectsof IT capability, the analysis for sustained effectsalso showed some variability depending on thebenchmark firms used for comparison. In bothcases, the results are generally stronger whencontrol firms are matched with leaders at the twodigit level. However, when current effects of ITcapability were analyzed, the results wereconsiderably stronger at the two digit level and
144 MiS Quarteriy Voi. 27 No. 1/March 2003

Santhanam & i-iartono/Lini<ing iT Capabiiity to Firm Performance
Table 8. Test of Lag-Effect: Regression Analysis at the Specific SIC Classification(Four Digit)
ROA
ROS
Ol/A
OI/S
Ol/E
COG/S
SGA/S
OPEXP/S
ROA
ROS
Ol/A
OI/S
Ol/E
COG/S
SGA/S
OPEXP/S
Model12121
21212121212
Model1212121212121212
N
94
94
93
93
89
94
77
77
N
94
94
93
93
91
94
77
77
1995
R-SquareChange
0.780***0.0040.939***0.003**0.737***0.0080.928***0.005**0.739***0.0000.935***0.0010.658***0.013*0.551***0.019*
1994 FinanciaiPerformance
0.883***0.859***0.969***0.958***0.859***0.831***0.963***0.950***0.860***0.853***0.967***0.960***0.811***0.783***0.742***0.698***
Dummy"
0.070
0.058**
0.080
0.069**
0.022
-0.037
-0.118*
-0.144*
1996
R-SquareChange
0.0190.0170.117***0.0110.040*0.0170.231***0.030*0.828***0.0030.761***0.009*0.080**0.0140.084**0.011
1995 FinancialPerformance
0.1360.0850.343***0.316***0.199*0.1480.480***0.435***0.910***0.925***0.837***0.852***0.284**0.245**0.290***0.251**
Dummy"
0.141
0.110
0.139
0.179*
-0.060
-0.095*
-0.126
-0.111Model 1: (Performance measure for year t) = f(Performance measure for year t-1)Model 2; (Performance measure for year t) = fjPerformance measure for year t-1, dummy: 1 = leader firm, 0 = control firm)
'Please note that for model 1, the dummy variable is not included and hence has no coefficient.
ROA: Retum on Assets; ROS: Return on Sales; Ol/A: Operating Income to Assets; OI/S: Operating Income to Sales; Ol/E: OperatingIncome to Employees; COG/S: Cost of Goods Sold to Sales; SGA/S: Selling and General Administration Expense to Sales; OPEXP/S:Operating Expenses to Sales
"Significant at the 10 percent level of significance."Significant at the 5 percent level of significance.•"Significant at the 1 percent level of significance.
MiS Quarteriy Voi. 27 No. 1/March 2003 145

Santhanam & i-lartono/Lini<ing iT Capabiiity to Firm Performance
Table 8. Test of Lag-Effect: Regression Analysis at the Specific SIC Classification(Four Digit) (Continued)
ROA
ROS
Ol/A
Ol/S
Ol/E
COG/S
SGA/S
OPEXP/S
Model1212121212121212
N
94
94
94
94
93
94
78
78
1997
R-SquareChange
0.032*0.152*"0.037*0.066**0.055**0.137*"0.199*"0.0220.945*"0.004"0.702*"0.0000.0080.061"0.0040.071"
1996 FinanciaiPerformance
0.180*0.1120.191*0.1430.235**0.162*0.446***0.402*"0.972***0.962*"0.838"*0.840*"0.0870.0350.0650.010
Dummy^
0.396*"
0.261"
0.377*"
0.154
0.062"
0.007
-0.253"
-0.272"Model 1: (Performance measure for year I) = f(Performance measure for year t-1)Model 2: (Performance measure for year t) = f(Performance measure for year t-1, dummy: 1 = leader firm, 0 = control firm)
'Please note that for model 1, the dummy variable is not included and hence has no coefficient.
ROA: Retum on Assets; ROS: Return on Sales; Ol/A: Operating Income to Assets; Ol/S: Operating Income to Sales; Ol/E:Income to Employees; COG/S: Cost of Goods Sold to Sales; SGA/S: Selling and General Administration Expense to Sales;Operating Expenses to Sales
•Significant at the 10 percent level of significance."Significant at the 5 percent level of significance.•"Significant at the 1 percent level of significance.
OperatingOPEXP/S:
146 MiS Quarteriy VoL 27 No. 1/March 2003

Santhanam & Hartono/Linking IT Capability to Firm Performance
Table 9. Test of Lag-Effect: Regression Analysis of Firms at the Primary SICClassification (Two Digit)
ROA
ROS
Ol/A
Ol/S
Ol/E
COG/S
SGA/S
OPEXP/S
ROA
ROS
Ol/A
Ol/S
Ol/E
COG/S
SGA/S
OPEXP/S
Model12121
21212121212
Model1212121212121212
N
94
94
93
93
89
94
80
80
N
94
94
93
93
91
94
80
80
1995
R-SquareChange
0.909***0.0010.990***0.001**0.961***0,001*0,996***0.001***0.948***0.005***0,997***0,001**0.498***0,018*0,427***0,036**
1994 FinancialPerformance
0.953***0,942***0,995***0.988***0,980***0,963***0,998***0.992***0,974***0,984***0.998***0.994***0,706***0,640***0.653***0,541***
Dummy"
0,027
0,025**
0,040*
0,019***
-0,071***
-0,015**
-0.148*
-0,221**
1996
R-SquareChange
0.243***0,028*0,215***0,077***0.410***0.020*0,120***0,078***0,967***0.001*0.096***0,069***0,175***0,0090,135***0.009
1995 FinancialPerformance
0,493***0,418***0.464***0.369***0,640***0,569***0,346***0.254**0,983***0,985***0,310***0.229**0.418***0.372***0,368***0.315**
Dummy"
0,183*
0.293***
0,159*
0,293***
-0,037*
-0,274***
-0,105
-0,107Model 1: (Performance measure for year t) = f(Performance measure for year t-1)Model 2: (Performance measure for year t) = fjPerformance measure for year t-1, dummy: 1 = leader firm, 0 = control firm)
'Please note that for model 1, the dummy variable is not included and hence has no coefficient,
ROA: Return on Assets; ROS: Return on Sales; Ol/A: Operating Income to Assets; Ol/S: Operating Income to Sales; Ol/E:Income to Employees; COG/S; Cost of Goods Sold to Sales; SGA/S: Selling and General Administration Expense to Sales;Operating Expenses to Sales
"Significant at the 10 percent level of significance."Significant at the 5 percent level of significance.'"Significant at the 1 percent level of significance.
OperatingOPEXP/S:
MIS Quarterly Vol. 27 No. 1/March 2003 Ul

Santhanam & i-iartono/Linidng iT Capabiiity to Firm Performance
Table 9. Test of Lag-Effect: Regression Analysis of Firms at the Primary SICClassification (Two Digit) (Continued)
ROA
ROS
Ol/A
Ol/S
Ol/E
COG/S
SGA/S
OPEXP/S
Model
1
21
21
2
1
2
1
21
2
1
2
1
2
N
94
94
94
94
93
94
81
81
1997
R-SquareChange
0.128*"
0.190*"
0.390***
0.017
0.316"
0.095*"
0.245*"
0.037"
0.988***
0.001"
0.232"*
0.031*
0.043*
0.136*"
0.041*
0.150*"
1996 FinancialPerformance
0.358"*
0.193"
0.624"*
0.565"*
0.562*"
0.423"*
0.495***
0.417*"
0.994"*
0.994***
0.482*"
0.418*"
0.208*
0.104
0.202*
0.095
Dummy^
0.466*"
0.143
0.338*"
0.207"
0.027"
-0.187*
-0.383*"
-0.402*"
Model 1: (Perfonnance measure for year t) = f(Performance measure for year t-1)
Model 2: (Performance measure for year \) = f(Performance measure for year t-1, dummy: 1 = leader firm, 0 = control firm)
'Please note that for model 1, the dummy variable is not included and hence has no coefficient.
ROA: Retum on Assets; ROS: Return on Sales; Ol/A: Operating Income to Assets; Ol/S: Operating Income to Sales; Ol/E: Operating
Income to Employees; COG/S: Cost of Goods Sold to Sales; SG/VS: Selling and General Administration Expense to Sales; OPEXP/S:
Operating Expenses to Sales
•Significant at the 10 percent level of significance.
"Significant at the 5 percent level of significance.
•"Significant at the 1 percent level of significance.
markedly different from the results obtained at thefour digit level. By contrast, for sustained effects,strong support for superior financial performanceof leaders is observed at both the two and fourdigit SIC codes. These results suggest that insubsequent years, there is stronger evidence of alink between leaders and their financial perfor-mance. In addition, it is to be noted that the over-all results for IT capability obtained by combiningthe matched sample and regression analysisprocedure were much stronger for sustainedeffects than for current effects.
Discussion
Berthon et al. (2002), Rosenthal (1991), andTsang and Kwan (1999), among others, state thata theory development and knowledge creationprocess must consist of replications, extensions,and generalizations that provide new insights andadd to the existing stock of knowledge. Aggre-gating the results of the various analyses con-ducted in this study provides information to buildsuch cumulative knowledge. We frame the dis-cussion of the results into two categories: results
148 MiS Quarteriy VoL 27 No. 1/March 2003

Santhanam & Hartono/Unking IT Capability to Firm Performance
that are consistent with those observed byBharadwaj (2000), and others that while suppor-tive of prior results, provide a source of furtherinsight.
When we conducted an empirical generalizationtest by utilizing the same matched sample proce-dures as in the prior study, the results indicatedthat IT capability effects on firm performance werevery significant and similar to the results obtainedearlier. It did not matter whether the benchmarkfirms were chosen on industry groupings matchedwith the leaders at the two or four digit SIC code.These results indicate that the RBV framework isrobust. In addition, we examined whether there isevidence to suggest that IT capability has a sus-tained impact on firm performance. This aspectwas not examined earlier and represents a con-ceptual extension of the prior study. We foundstrong evidence to suggest (both from thematched group and the regression analysis proce-dures) that IT capability does indeed have a sus-tained impact on firm performance. We observedthat, in many cases, the relationship between ITcapability and financial performance was strongerin later time periods than in the current timeperiod. These results are consistent with RBV,which suggests that returns should be maximizedover several time periods. Thus, these resultsverify (using different benchmarks) and extend(sustained financial performance) the findingsobserved earlier. Equally interesting are otherresults that provide support for prior findings buthighlight important issues that must be addressed.
One key difference between this study and theprior study is that we used a different, moreconservative analytical procedure, namely regres-sion analysis. When analyzed in this manner, theeffects for IT capability were mixed and lesspronounced. One possible explanation from astatistical perspective could be that the matchedsample test is more powerful. Other alternativeexplanations can be examined from a theorydevelopment perspective. Such an examinationfacilitates the development of a more compre-hensive model and a refinement of the structuresfor using the underlying framework (Tsang andKwang 1999),
Prior Financial Performance
In the regression analysis, the effect of priorfinancial performance was adjusted both on cur-rent financial performance (dependent variable)and the IT leader rating (independent variable).When analyzed in this manner, the effect of ITcapability was less pronounced than that obtainedvia matched sample procedures. Our results indi-cate that there is a relationship between past andcurrent financial performance. Further, the lesspronounced results may have occurred becauseof a relationship between prior financial perfor-mance and the IT capability rating. Because ofthis halo effect, it becomes quite difficult to com-pletely isolate the effects of IT capability oncurrent financial performance. From these results,it is clear that prior financial performance has tobe acknowledged and adjusted using proceduressimilar to those utilized in this study. However, itis to be noted that there exists no perfect metho-dological solution exists to remove the halo effectsof prior financial performance on leader ratings.
Benchmark Firms for Comparison
Another major difference we observed whenutilizing the regression analysis procedures wasthat the significance of the results seemed to varywith the choice of benchmark firms. Unlike thematched sample procedures where variation inthe benchmark firms did not matter, the resultsfrom the regression analysis indicated strongereffects when firms were matched at the two digitSIC code. Benchmark firms selected by matchingleader firms at the two digit SIC code include alarger number of firms than those selected bymatching at the four digit SIC code. Hence,having a larger sample of firms could have pro-vided a better approximation of the true mean(average performance) of the control firms. Froma statistical perspective, this might be oneexplanation for the stronger effects observedusing the two digit SIC code. One could alsotheorize that IT capabilities provide a muchstronger performance differential in a hetero-geneous group of firms (formed using the two digitSIC code). However, in a relatively homogenous
MIS Quarterly Vol. 27 No. 1/March 2003 149

Santhanam & Hartono/Unking IT Capabiiity to Firm Performance
group of firms (formed using the four digit SICcode), performance differentials could perhapsaccrue due to other higher order capabilities(Teece et al. 1997). The effects of these higherorder capabilities (such as those resulting fromthe complementary integration between IT andbusiness capabilities) need to be examined.Thus, these differences in the effects of IT capa-bilities among the two sets of benchmark firmshighlight the need for conducting more finelygrained investigations of higher-order capabilitiesand the effects of various capability-buildingprocesses in organizations. It is also evident thatthe industry grouping or benchmark firms used incomparing financial performances are important inanalyzing IT capability effects and close attentionmust be paid to this issue in future studies.
Identification of IT Leaders
It is important to note that the need for selectingappropriate benchmark firms arises because ofthe existing definitions and measures of ITleaders. Leaders were selected by industryexperts based on their opinion of the firm's ITcapability. This method of selecting leaders didnot ask experts to rank each firm in the industrybut asked them to identify those firms that theyperceived to have superior IT capability comparedto other firms in the industry. Note that this proxymethod of identification of firms with superior ITcapability does not provide a true multidimen-sional measure of a firm's capability as describedby the RBV. Instead, the measurement andselection is binary with some firms being identifiedas leaders and others not. This leads to the prob-lem of identifying an appropriate set of benchmarkfirms whose financial performance can becompared to the leaders in order to evaluate theeffects of superior IT capability.
In addition to the problem of identifying bench-mark firms, the binary nature of the leader mea-sure prevents researchers from directly comparingfirm performance to their level of IT capability. Infact, further developments in the application of theRBV framework can be meaningful only if all ofthe firms in the industry can be examined. From
a methodological perspective, such investigationswould be a substantive improvement over existingstudies because this could allow researchers toinvestigate a larger set of firms in different indus-tries. More importantly, it could help in examiningmore finely grained relationships between ITcapability and firm performance by evaluating theimpact of incremental improvements in IT capa-bility on firm performance. The existing methodsof identifying leaders and others do not allow forsuch research investigations to be conducted.
Longitudinal Studies
The binary nature of the assessment of IT capa-bility creates another difficulty in pursuinginvestigations using RBV. In this study, we foundevidence of sustained impact, which suggests thatin subsequent years, the financial performance ofleaders is significantly higher than those ofbenchmark firms. However, a better assessmentof sustained impact would be to conduct anextended longitudinal study of the effects of ITcapability on a firm's financial performance. Theexisting method of selecting leaders does notallow us to conduct such longitudinal analysis forseveral reasons. First, ratings by trade journalsoften change the procedure by which firms areidentified as leaders. For example, in 1995,Information Week changed the procedure forranking IT Leaders by tying it to the firm's financialand operating performance. Hence, after 1994, itis not possible to use Information Week's rating ofleaders to conduct analyses similar to those con-ducted in this study. Further, identification ofmutually exclusive leaders and non-leadersgroups implies that the set of firms consistentlyranked as leaders over several time periods islikely to be small, making it difficult to conductlongitudinal studies with large samples.
Thus, our analysis raises four important issuesthat must be addressed in future studies of thelink between IT capability and firm performance.These are: (1) the impact of prior financialperformance and halo effects, (2) the selection ofbenchmark firms, (3) the existing binary measure-ments of IT leaders, and (4) the inability to con-
150 MiS Quarteriy Voi. 27 No. 1/March 2003

Santhanam & Hartono/Linking IT Capability to Firm Performance
duct longitudinal studies. As stated earlier, thereare no easy or methodological solutions to theseproblems. However, there is one approach thatcould potentially alleviate these problems and thatapproach is discussed next.
cal need for developing theoretically derived mea-sures of IT capability in order to continue theinvestigation of the productivity paradox usingRBV.
Development of IT Capability Measure
To continue the assessment of the impact of ITcapability, it is critical to develop standardizedscales to measure a firm's level of IT capability.The development of such standardized measurescan help in several ways. First and foremost,such a measure could provide a systematic andtheoretically derived multidimensional assessmentof a firm's IT capability. Such a measure couldalleviate specific problems identified in this studyin the following ways: (1) it would provide a con-tinuous assessment of IT capability and reducethe problems occurring due to the binary nature ofthe existing measure, (2) it would eliminate theneed for selecting appropriate benchmark firms forcomparison because all firms could be included inthe analysis, (3) it would allow for conducting theanalysis on an annual basis, providing the abilityto conduct longitudinal investigations, and impor-tantly, (4) because it measures IT capabilitydirectly, it would reduce the occurrence of a haloeffect. Therefore, the development of continuousmeasures of IT capability, such as in Bharadwaj etal. (1999), is needed to continue to test its effectson firm performance.
The urgency for understanding the relationshipbetween IT capability and firm performance hasincreased in the last few years. With the recentpoor performance of information technology firms,there has been a trend toward downplaying theeffect of information technology as evidenced bya recent report stating that IT investments have nobenign effect on economic productivity (Martin-sons and Martinsons 2002). This is a far cry froma few years ago, when IT investments were des-cribed as a key factor in a firm's success. In thisstudy, we have provided further evidence to sug-gest that there is a positive relationship betweenIT capability and financial performance. Theissues highlighted in this study also point to a criti-
Acknowledgements
We thank the senior editor for patiently guiding usin improving the quality of the manuscript and insynthesizing the message from this study. Wealso thank the associate editor and reviewers forpointing out several analytical issues that haveimproved the study considerably.
References
Barney, J. B. "Firm Resources and SustainedCompetitive Advantage," Journal of Manage-ment ('\7:'\), 1991, pp. 99-120.
Benbasat, I., and Zmud, R. W. "Empirical Re-search in Information Systems: The Practice ofRelevance," MIS Quarterly [22.'\), 1999, pp. 3-16.
Berthon, P., Pitt, L., Ewing, M., and Carr, C. L."Potential Research Space in MIS: A Frame-work for Envisioning and Evaluating ResearchReplication, Extension and Generation," Infor-mation Systems Research (13:4), 2002, pp.416-427.
Bharadwaj, A. S. "A Resource-Based Perspectiveon Information Technology Capability and FirmPerformance: An Empirical Investigation," MSQt/arter/y (24:1), 2000, pp. 169-196.
Bharadwaj, A., Sambamurthy, V., and Zmud, R.W. "IT Capabilities: Theoretical Perspectivesand Empirical Operationalization," in Pro-ceedings of the 20^ International Conferenceon Information Systems, P. De and J. I.DeGross (eds.), Charlotte, NC, December1999, pp. 378-385.
Brown, B., and Perry, S. "Removing the FinancialPerformance Halo from Fortune's Most Ad-mired Companies," Academy of ManagementJournal (37:5), 1994, pp. 1347-1359.
Brynjolfsson, E., and Hitt, L. M. "Beyond the Pro-ductivity Paradox," Communications of the ACM(41:8), 1998, pp. 49-55.
MIS Quarteriy Vol. 27 No. 1/March 2003 151

Santhanam & i-iartono/Lini<ing iT Capabiiity to Firm Performance
Chan, Y. "IT Value: The Great Divide betweenQualitative and Quantitative and Individual andQrganizational Measures," Journai of Manage-ment Information Systems (16:4), 2000, pp.225-261.
Clemons, E. K., and Row, M. C. "Sustaining ITAdvantage: The Role of Structural Differ-ences," MIS Quarterly (15:3), 1991, pp. 275-292.
Dreyfus, J. "IW500: A Methodology,"/nformaf/of7Week, October 10, 1994, pp 30.
Duliba, K. A., Kauffman, R. J., and Lucas Jr., H.C. "Appropriating Value from CRS Ownershipin the Airline Industry," Organization Science(12:6), 2001, pp. 702-728.
Fama, E. R, and French, K. R. "Forecasting Pro-fitability and Earnings," Ttie Journal of Business(73:2), 2000, pp. 161-175.
Grant, R. M. "The Resource-Based Theory ofCompetitive Advantage: Implications for Stra-tegy Formulation," Caiifornia ManagementReview (33.3), 1991, pp. 114-135.
Hitt, L., and Brynjolfsson, E. "Productivity, Busi-ness Profitability, and Consumer Surplus:Three Different Measures of Information Tech-nology Value," MIS Quarterly (20:2), 1996, pp.121-142.
Ives, B. "Editor's Comment: Probing theProductivity Paradox," MIS Quarterly (18:2),1994, pp. xxi-xxiv.
Lucas, H. Information Technology and the Pro-ductivity Paradox: Assessing the Vaiue of In-vesting in IT, Oxford University Press, NewYork, 1999.
Mahmood, M. A., and Mann, G. J. "Special Issue:Impacts of Information Technology Investmenton Organizational Performance," Joumal ofManagement Information Systems (16:4), 2000,pp. 3-10.
Makadok, R. "Toward a Synthesis of theResource-Based and Dynamic-CapabilityViews of Rent Creation," Strategic ManagementJournal (22:5), 2001, pp. 387-401.
Martinsons, M. G., and Martinsons, V. "Rethinkingthe Value of IT, Again," Communications oftheACM (45:7), July 2002, pp. 25-26.
Mata, F. J., Fuerst, W. L., and Barney, J. B."Information Technology and Sustained Com-petitive Advantage: A Resource-Based Analy-sis," MIS Quarterly (19.4), 1995, pp. 487-505.
Neter, J., Kutner, M. H., Nachtsheim, C. J., andWasserman, W. Applied Linear StatisticalModels (4"" ed.), Inwin, Chicago, 1996.
Robbins, D. K., and Pearce, J. A. "Turnaround,Retrenchment and Recovery," Strategic Man-agement Journal (^3.A), 1992, pp. 287-310.
Rosenthal, R. "Replication in Behavioral Re-search," in Replication Research in the SocialSciences, J. W. Neuliep (ed.). Sage, NewburyPark, CA, 1991, pp. 1-30.
Ross, J. W., and Beath, C. M. "Develop Long-term Competitiveness Through IT Assets,"Sioan Management Review (38:1), Fall 1996,pp. 31-42.
Sambamurthy, V. "Research in Information Sys-tems: What We Haven't Learned," M S Quar-ter/y (25:4), 2001, pp. 10-11.
Teece, D. J., Pisano, G., and Shuen, A. "DynamicCapabilities and Strategic Management," Stra-tegic Management Journal (18:7), 1997, pp.509-533.
Tsang, E. W. K., and Kwan, K. M. "Replicationand Theory Development in OrganizationalScience: A Critical Realist Perspective," Aca-demy of Management Review {24.4), 1999, pp.759-780.
Weill, P., and Olson, M. H. "Managing Investmentin Information Technology: Mini CaseExamples and Implications," MIS Quarterly(13:1), March 1989, pp. 2-17.
Wisner, J. D., and Eakins, S. G. "A PerformanceAssessment of the US Baldridge Quality AwardWinners," The International Journal of Qualityand Reliabiilty Management(^^:2), 1994, pp. 8-26.
About the Authors
Radhika Santhanam is a faculty member in theDecision Sciences and Information Systems areain the Gatton School of Business and Economicsat the University of Kentucky. Her researchinterests focus on issues relating to human-computer interaction, management support sys-tems and information system investments. Usinga variety of research methods, she has inves-tigated ways by which training and system design
152 MIS Quarteriy VoL 27 No. 1/March 2003

Santhanam & i-iartono/Linking iT Capabiiity to Firm Performance
can improve a user's understanding and use ofinformation systems. From a macro perspective,her research has proposed methods by whichorganizations can select and monitor investmentsin information systems. Her research has ap-peared in information Systems Research, Deci-sion Support Systems, Information and Organi-zation, information Technoiogy and Management,European Journal of information Systems, andInformation and Management, among otherjournals.
Edward Hartono is completing his Ph.D. ininformation systems at the Gatton College ofBusiness and Economics at the University ofKentucky. He holds a BS in Electrical Engineeringfrom Trisakti University in Indonesia and an MBAfrom Suffolk University in Boston. His majorresearch interests are e-commerce, knowledgemanagement and information systems strategy.His articles are being published in Information andManagement and Data Base for Advances inInformation Systems.
MiS Quarieriy Voi. 27 No. 1/March 2003 153