Issues in Ammonia and Nitric Acid Measurements ... in Ammonia and Nitric Acid Measurements:...
48
Issues in Ammonia and Nitric Acid Measurements: Experiences in the Midwest Donna Kenski Lake Michigan Air Directors Consortium, Des Plaines, IL David Gay Illinois State Water Survey, Champaign, IL
Transcript of Issues in Ammonia and Nitric Acid Measurements ... in Ammonia and Nitric Acid Measurements:...

Issues in Ammonia and Nitric Acid Measurements: Experiences
in the MidwestDonna Kenski
Lake Michigan Air Directors Consortium, Des Plaines, IL
David GayIllinois State Water Survey, Champaign, IL

Overview
• Why ammonia?• Network sites and equipment • What have we done with the data?
– How good is it?– What does it tell us about PM?
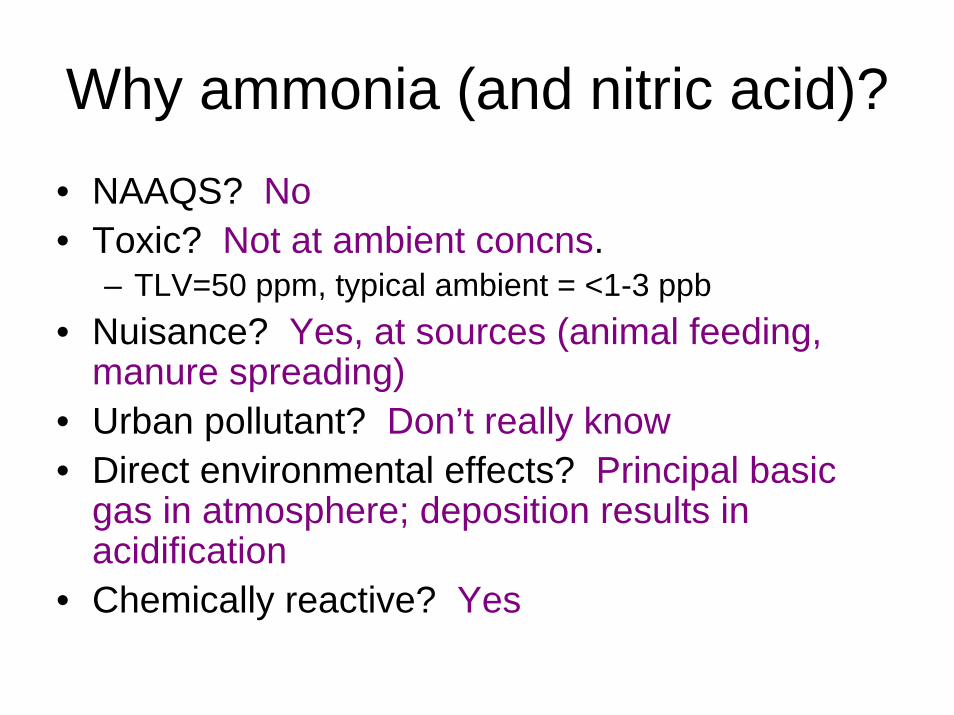
Why ammonia (and nitric acid)?• NAAQS? No• Toxic? Not at ambient concns.
– TLV=50 ppm, typical ambient = <1-3 ppb• Nuisance? Yes, at sources (animal feeding,
manure spreading)• Urban pollutant? Don’t really know• Direct environmental effects? Principal basic
gas in atmosphere; deposition results in acidification
• Chemically reactive? Yes
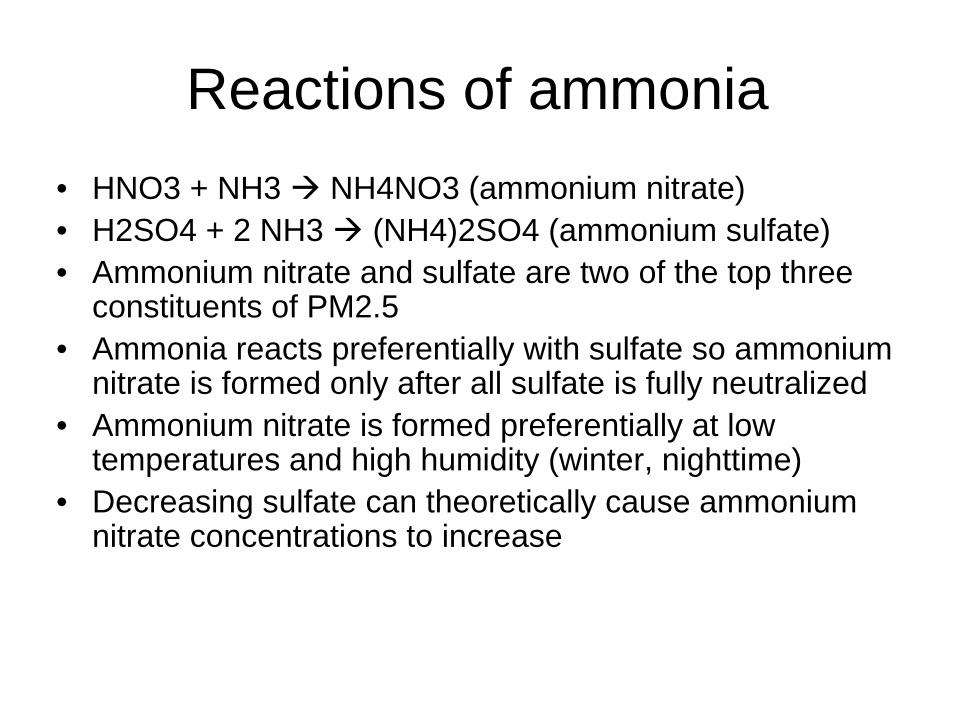
Reactions of ammonia• HNO3 + NH3 NH4NO3 (ammonium nitrate)• H2SO4 + 2 NH3 (NH4)2SO4 (ammonium sulfate)• Ammonium nitrate and sulfate are two of the top three
constituents of PM2.5• Ammonia reacts preferentially with sulfate so ammonium
nitrate is formed only after all sulfate is fully neutralized• Ammonium nitrate is formed preferentially at low
temperatures and high humidity (winter, nighttime) • Decreasing sulfate can theoretically cause ammonium
nitrate concentrations to increase

Why focus on the Midwest? 1. Ammonia Emissions Density
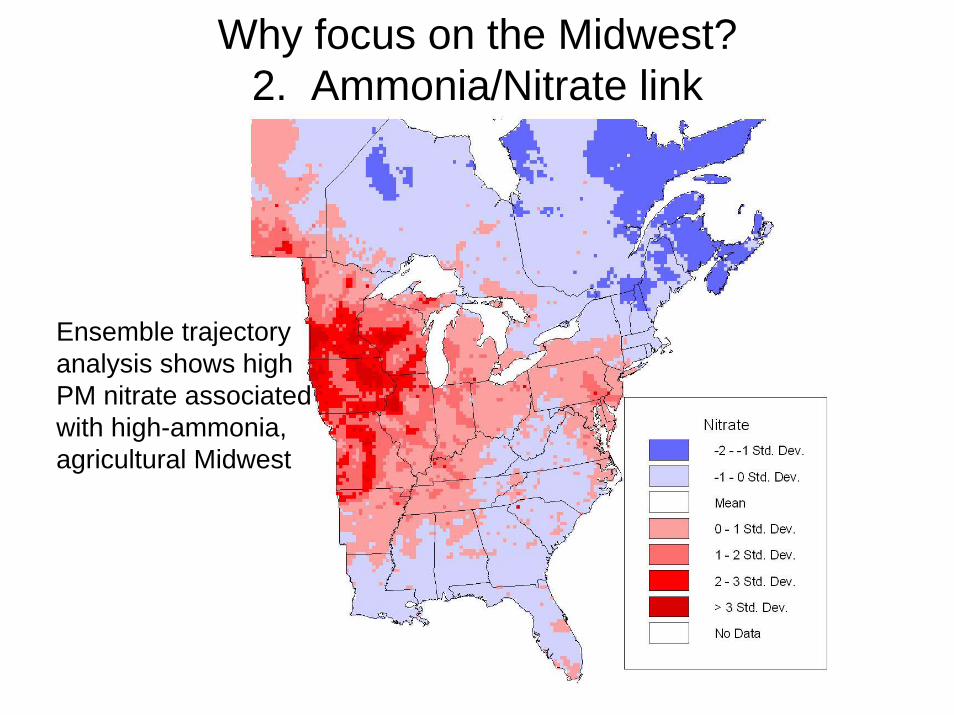
Ensemble trajectory analysis shows high PM nitrate associated with high-ammonia, agricultural Midwest
Why focus on the Midwest?2. Ammonia/Nitrate link
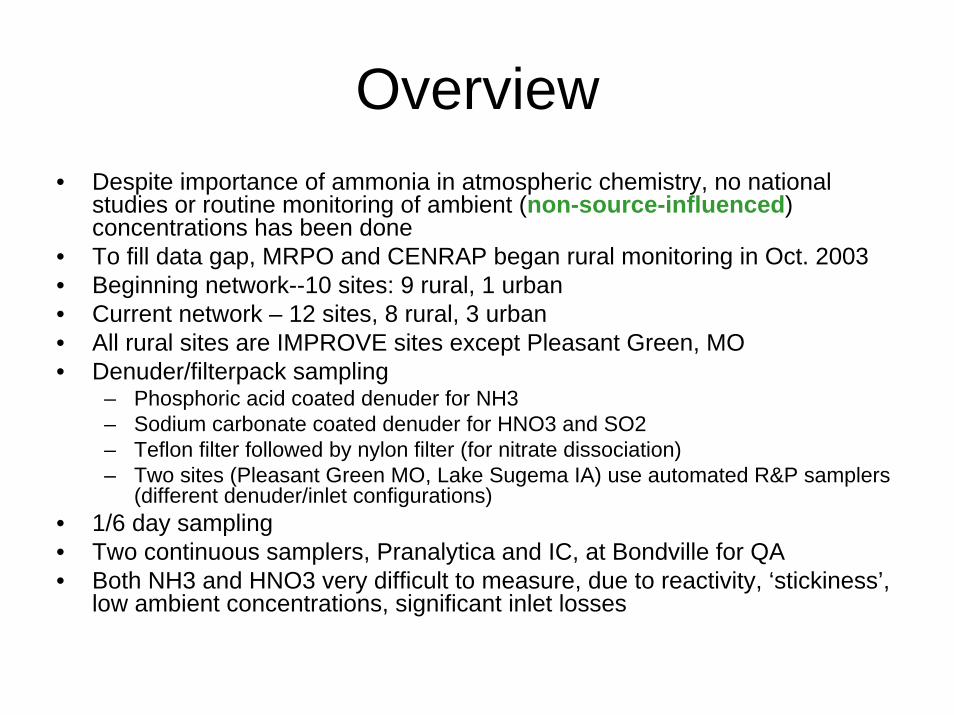
Overview• Despite importance of ammonia in atmospheric chemistry, no national
studies or routine monitoring of ambient (non-source-influenced) concentrations has been done
• To fill data gap, MRPO and CENRAP began rural monitoring in Oct. 2003• Beginning network--10 sites: 9 rural, 1 urban• Current network – 12 sites, 8 rural, 3 urban • All rural sites are IMPROVE sites except Pleasant Green, MO• Denuder/filterpack sampling
– Phosphoric acid coated denuder for NH3– Sodium carbonate coated denuder for HNO3 and SO2– Teflon filter followed by nylon filter (for nitrate dissociation)– Two sites (Pleasant Green MO, Lake Sugema IA) use automated R&P samplers
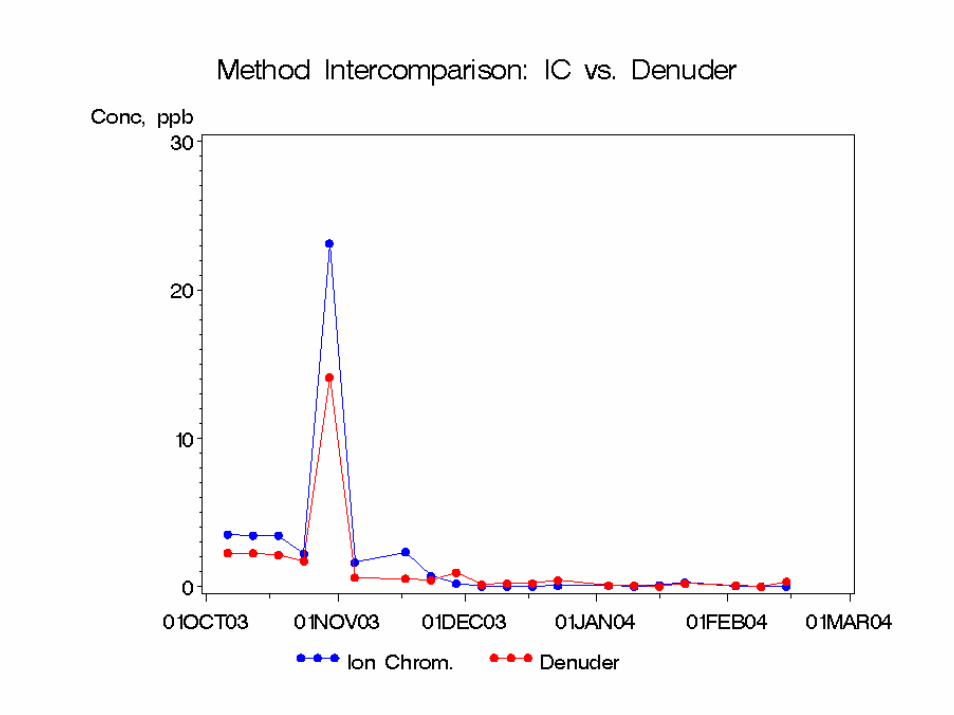
(different denuder/inlet configurations)• 1/6 day sampling• Two continuous samplers, Pranalytica and IC, at Bondville for QA• Both NH3 and HNO3 very difficult to measure, due to reactivity, ‘stickiness’,
low ambient concentrations, significant inlet losses

LADCO-CENRAP NH3 Network
#S #S
#S
#S
#S#S
#S
#S
#S
#S
#S#S
#S#S
#S#S
#SBlue Mounds Great River Bluffs
Lake Sugema
ReservePleasant Green
Cherokee Nation
Athens
Detroit
Bondville
Mammoth Cave
Mayville
Indianapolis
Cincinnati
Red=urban sites
Blue=rural sites

Custom-built URG sampler

URG System
R&P System

Temporal variation in NH3
Base F2 NH3 Emissions
Log scale
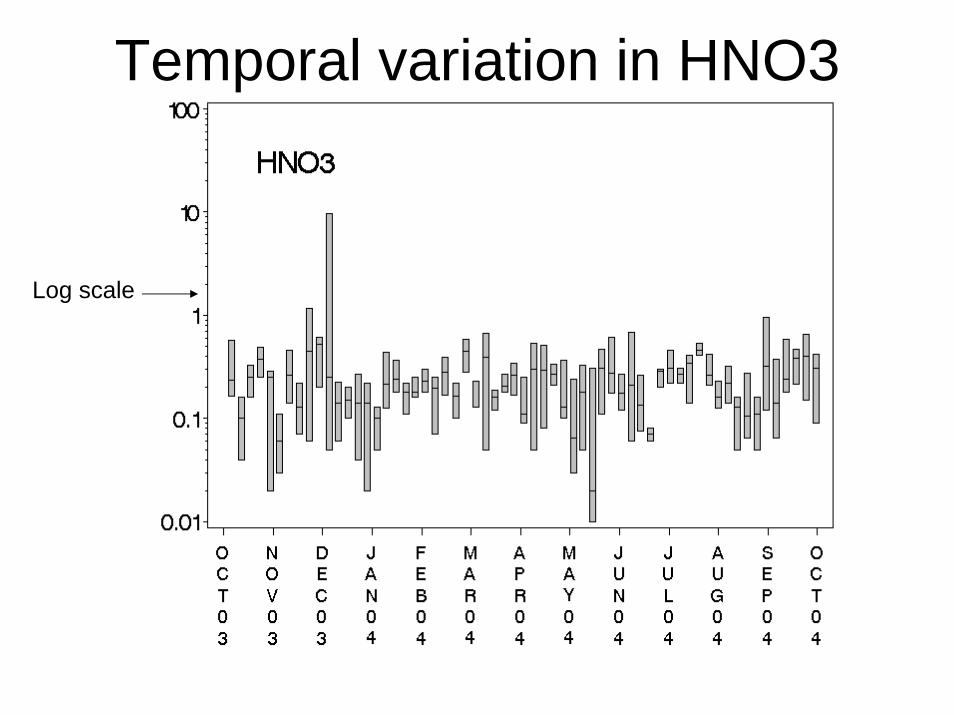
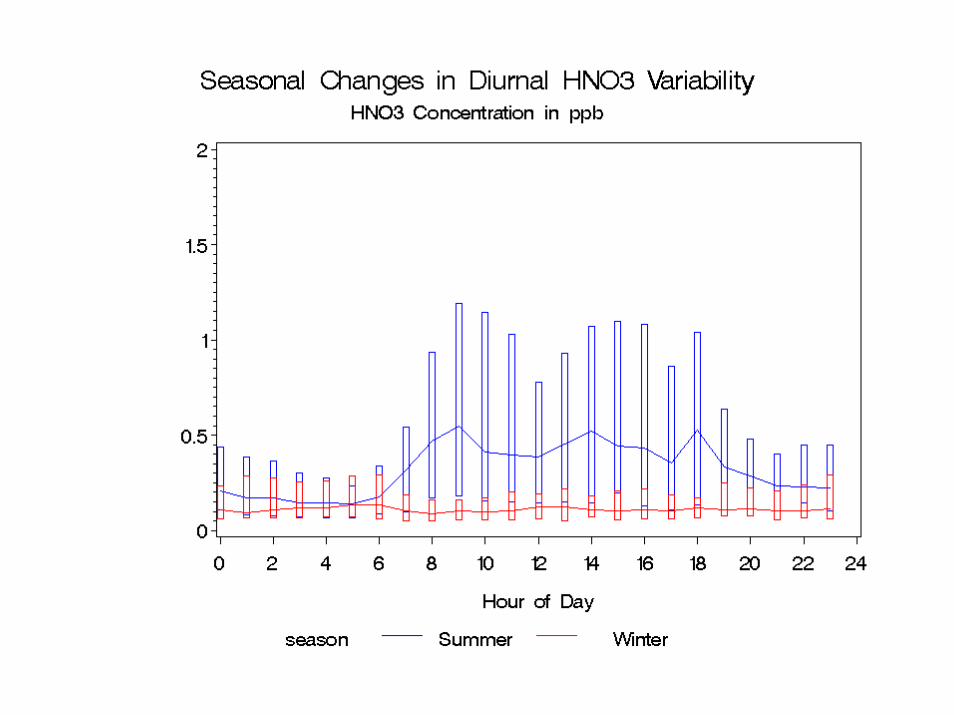
Temporal variation in HNO3
Log scale
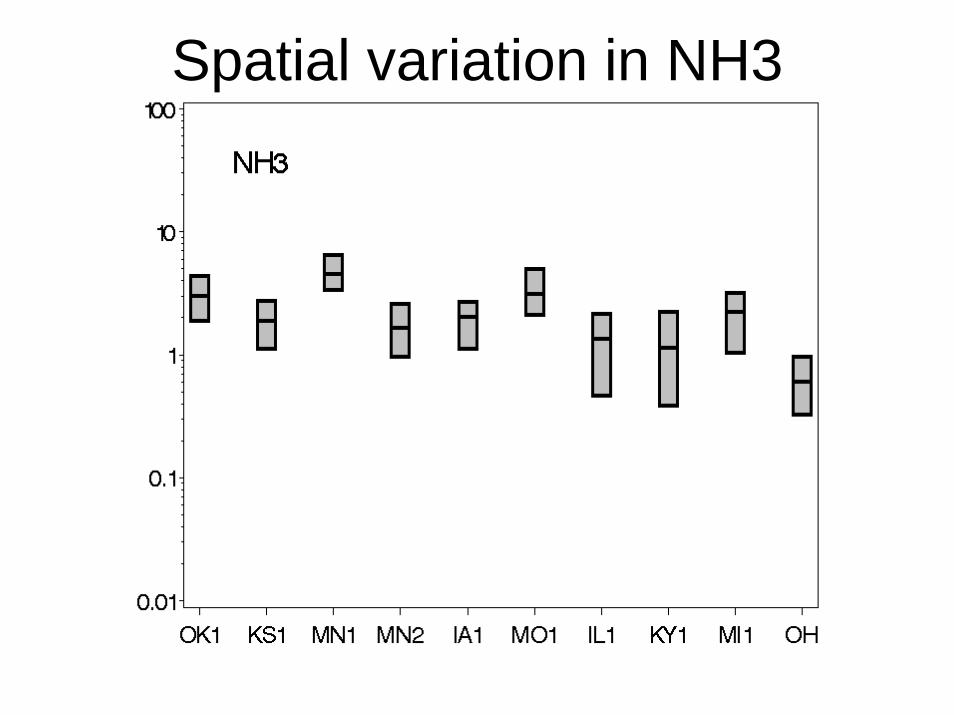
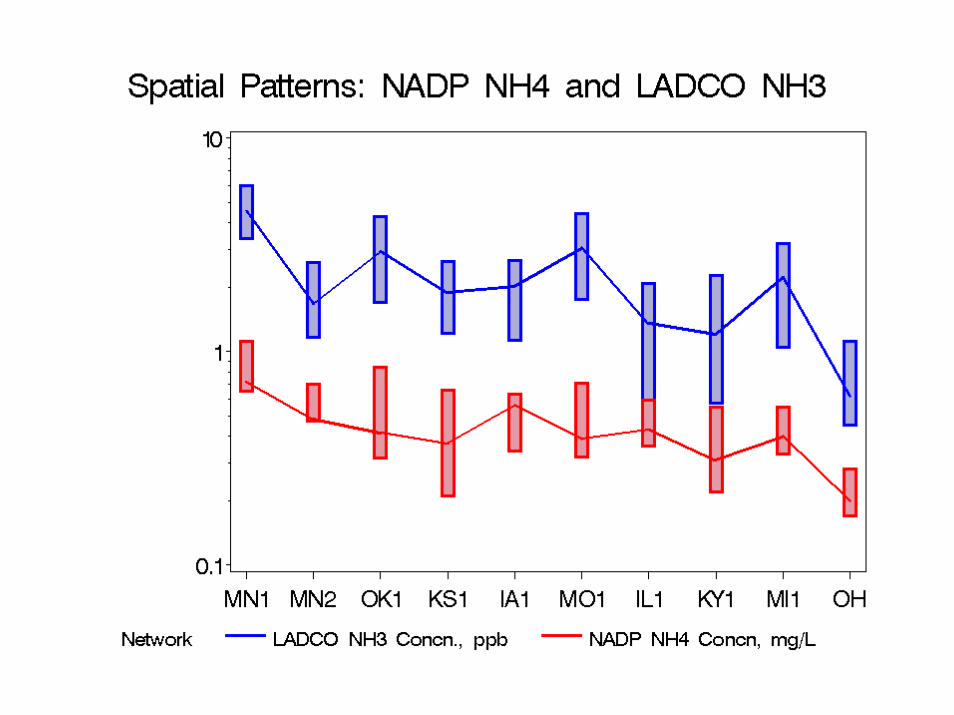
Spatial variation in NH3

Spatial variation in HNO3

QA Comparisons at Bondville
• Species comparisons– Collocated URG and R&P, March 2004-Feb
2005– Collocated URGs, Sep. 2004 – Feb. 05– Collocated R&Ps, Jan-Feb. 05
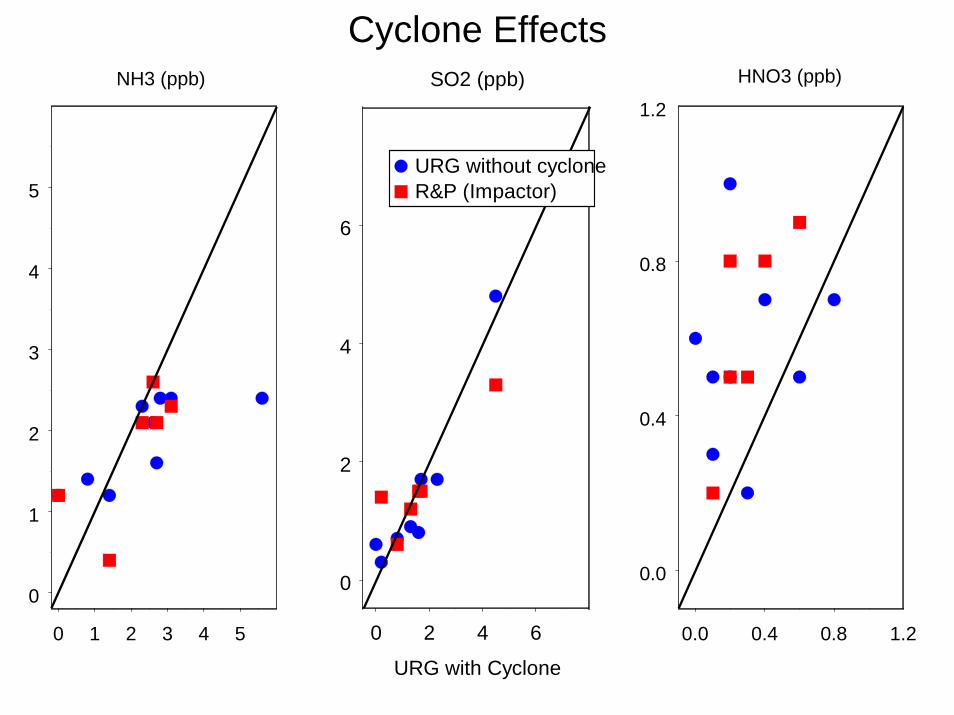
• Cyclone Effects• Denuder Breakthrough• Ammonium Losses from Filters

Apr May Jun Jul Aug Sep Oct Nov Dec Jan Feb2004 - 2005
0.6
1.4
4.0
10.0
2.0
5.0
HNO3
NH3
SO2
URG Denuder 1URG Denuder 2R&P 1R&P 2
Sampler Intercomparison -- GasesConcentration in ppb

1 3 5 7 3 8 13
2 14 26 38 1 3 5 7
URG Denuder 1
2
6
4
10
10
40
3
8
nh4 no3
pm25 so4
URG Denuder 2R&P 1R&P 2
Sampler Intercomparison -- ParticlesConcentration in ug/m3

0.0 0.1 0.2 0.3 0.4 0.5 0.6 0.7
0.0 2.0 4.0 6.0 8.0 10.0 12.0
0.0 1.0 2.0 3.0 4.0 5.0
URG Denuder 1
0.6
1.4
0.0
10.0
1.0
4.0
HNO3
NH3
SO2
URG Denuder 2R&P 1R&P 2
Sampler Intercomparison -- GasesConcentration in ppb
0 1 2 3 4 5
0
1
2
3
4
5
NH3 (ppb)
0 2 4 6
URG with Cyclone
0
2
4
6
SO2 (ppb)
URG without cycloneR&P (Impactor)
0.0 0.4 0.8 1.2
0.0
0.4
0.8
1.2
HNO3 (ppb)
Cyclone Effects
05/27/200410/12/200410/24/200411/17/200411/29/200401/16/200501/28/200502/09/2005date
0
5
10
0
5
10
0
5
10
BV1
BV2
R&P
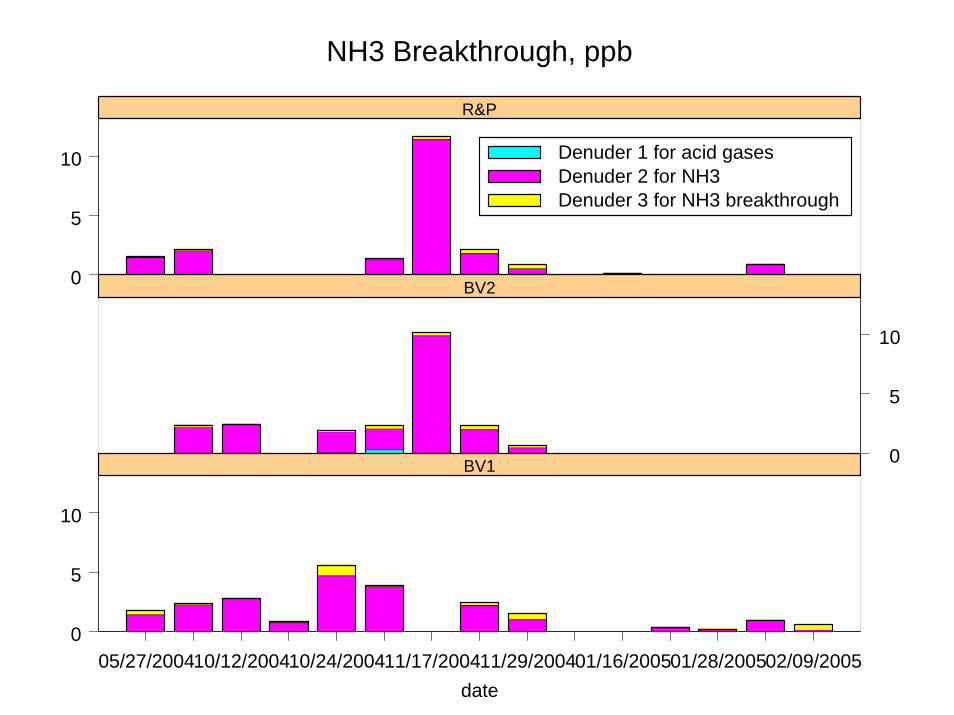
NH3 Breakthrough, ppb
Denuder 1 for acid gasesDenuder 2 for NH3Denuder 3 for NH3 breakthrough

05/27/2004 10/18/2004 11/17/2004 01/10/2005 01/28/2005Date
0
4
8
0
4
8
0
4
8
BV1
BV2
R&P
SO2 Breakthrough, ppb
Denuder 1 for acid gasesDenuder 2 for NH3Denuder 3 for NH3 breakthrough
05/27/2004 10/18/2004 11/17/2004 01/10/2005 01/28/2005Date
0.0
0.5
1.0
0.0
0.5
1.0
0.0
0.5
1.0
BV1
BV2
R&P
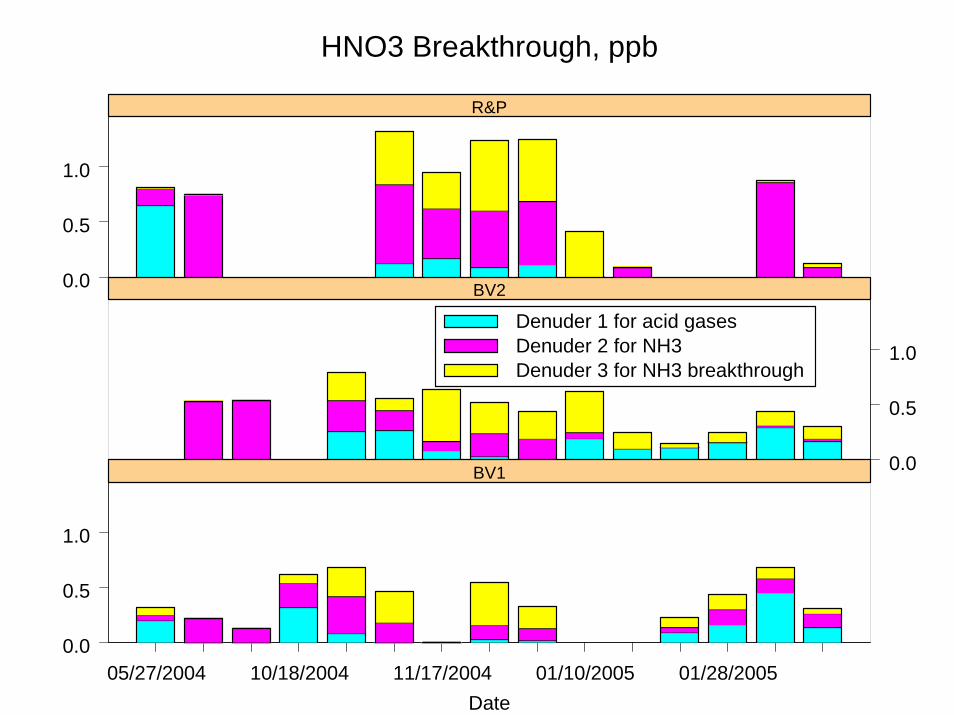
HNO3 Breakthrough, ppb
Denuder 1 for acid gasesDenuder 2 for NH3Denuder 3 for NH3 breakthrough

0.00 0.25 0.50 0.75 1.00 1.25 1.50 1.75 2.00Measured NH4
0.0
0.5
1.0
1.5
2.0
2.5
Cal
cula
ted
NH
4
1:1 line
Ammonium Losses from FiltersConcentration in ug/m3
0.0816 + 1.1896*x

How good are the network data?
• Comparison of collocated monitors• Comparison with IMPROVE• Comparison with modeled data

Comparison of IMPROVE with LADCO data
Work by Blanchard & Tanenbaum

Comparison of Ambient with Modeled (ISORROPIA) Species
From Blanchard&Tanenbaum report

Thermodynamic Models—ISORROPIA and SCAPE2
• Thermodynamic models predict the partitioning of PM species between gas and particle phases, based on concentration, temperature, and RH
• Using measured NH3, HNO3, NH4, NO3, and SO4, systematically vary concentrations from starting (ambient) conditions and calculate new equilibrium concentrations
• Resulting isopleths tell us how sensitive PM is to changes in precursors
• SO4 and NO3 – 25, 50, 75, 100% of current• NH4 – 50, 100, 150, 200% of current

Predicted PM2.5 Concentrations
PM is about equally sensitive to reductions in SO4 and NO3
PM is slightly more sensitive to NH3 reductions than to HNO3

SeasonalPM2.5Concentrations
PM is most responsive to NO3 in the winter; response to sulfate is similar year-round.

Predicted PM2.5 Concentrations
Expected reductions in SO4 may lead to PM being less responsive to reductions in ammonia
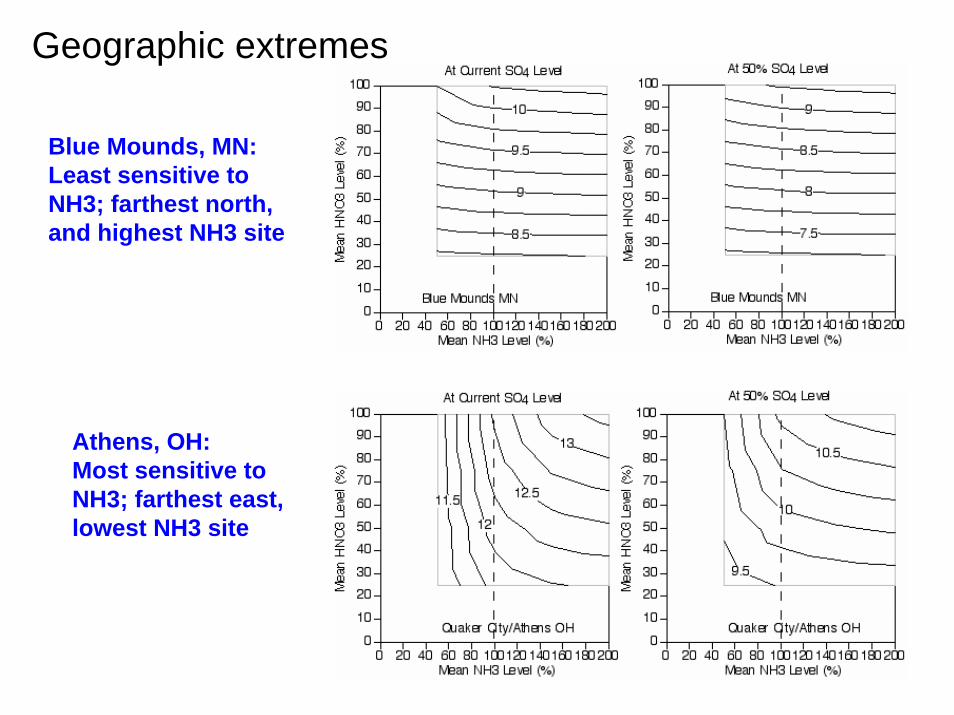
Geographic extremes
Blue Mounds, MN: Least sensitive to NH3; farthest north, and highest NH3 site
Athens, OH: Most sensitive to NH3; farthest east, lowest NH3 site
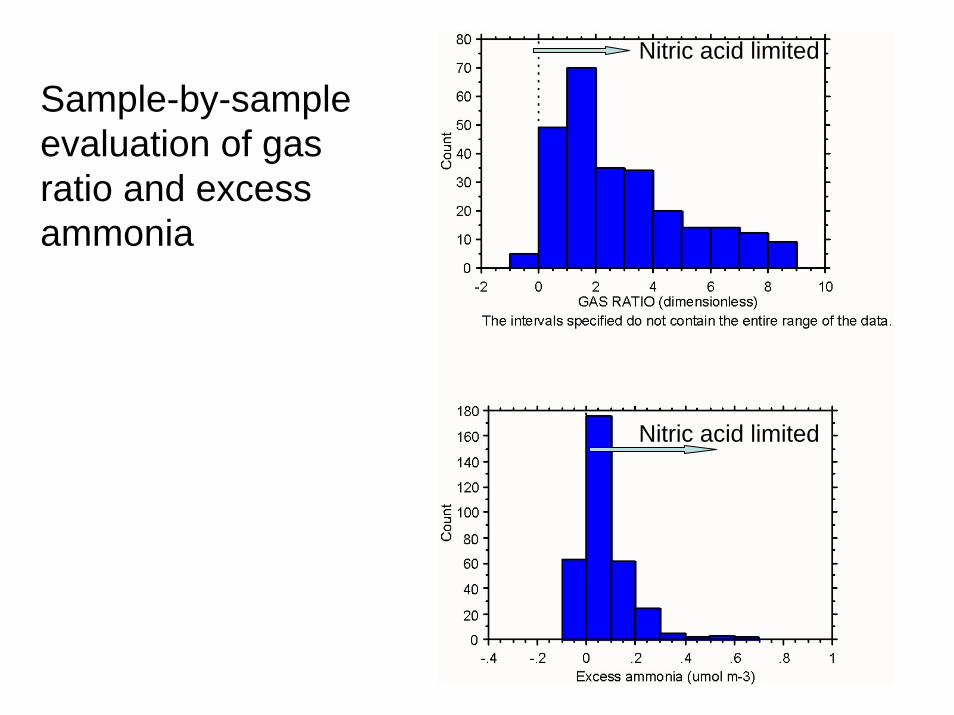
Nitric acid limited
Nitric acid limited
Nitric acid limited
Nitric acid limited
Sample-by-sample evaluation of gas ratio and excess ammonia

How do ambient results compare with modeling?
Agricultural (CMU Model) NH3 30% Reduction Annual Average Difference
Entire Domain Anthropogenic NOX 30% ReductionAnnual Average Difference
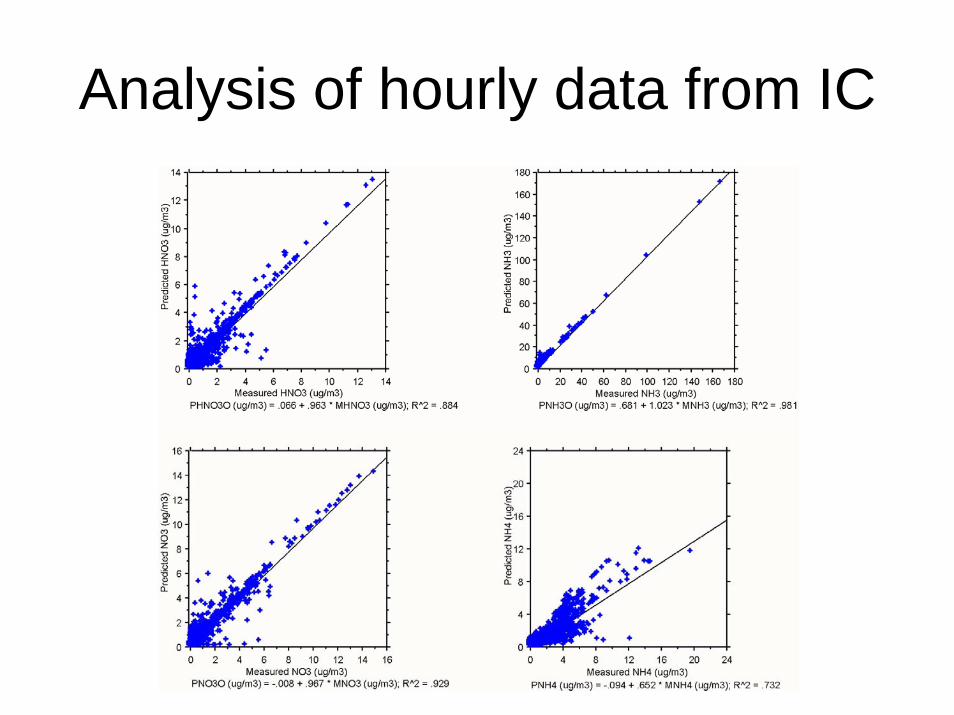
Analysis of hourly data from IC
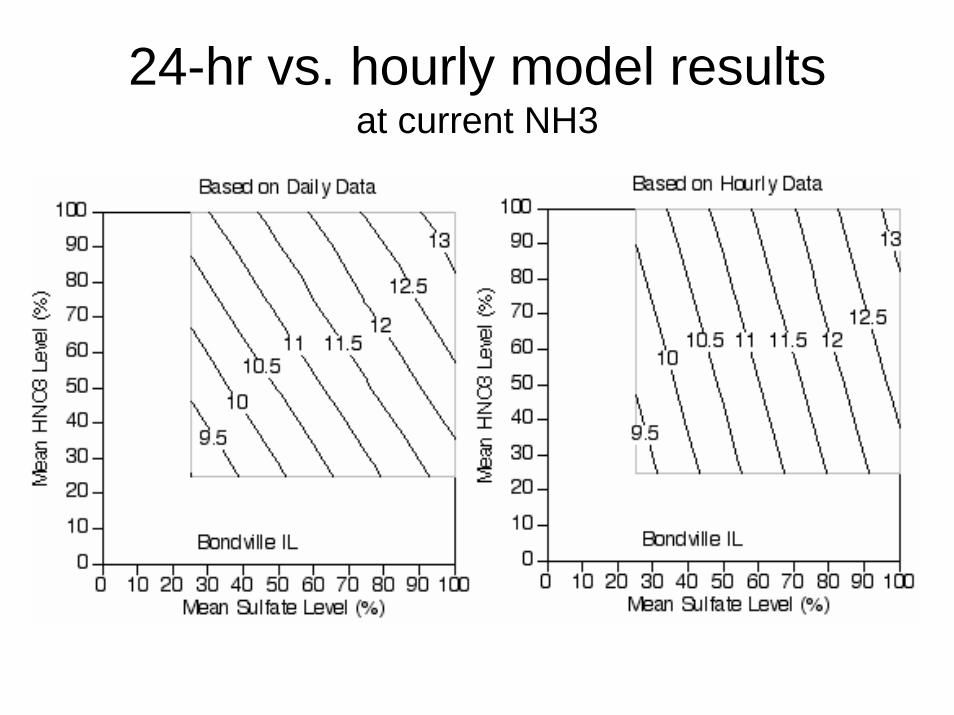
24-hr vs. hourly model resultsat current NH3
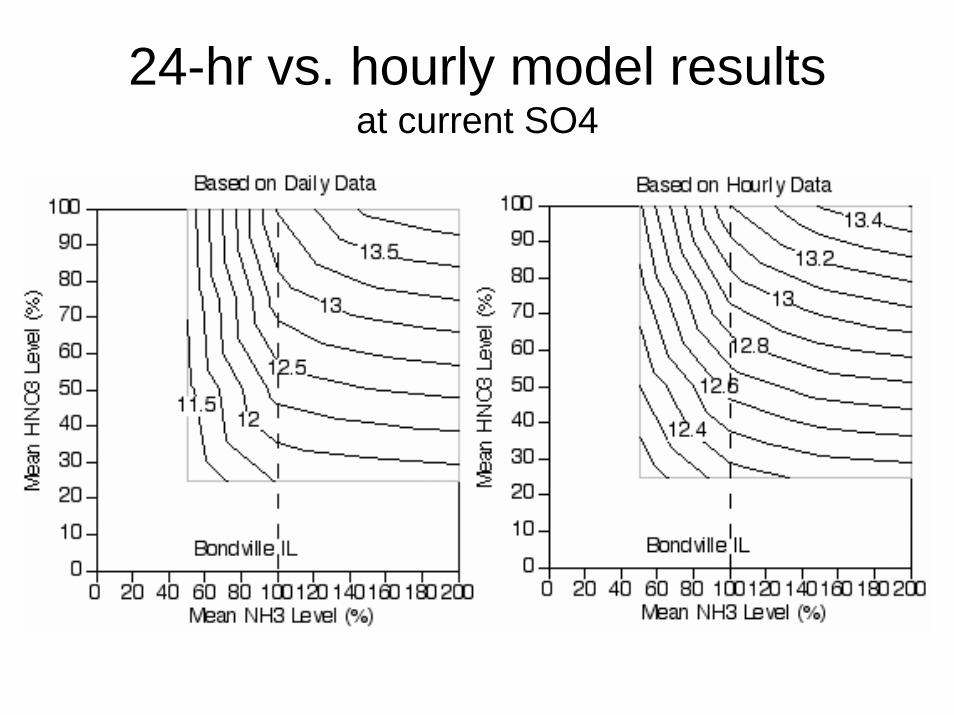
24-hr vs. hourly model resultsat current SO4
Preliminary Conclusions
• At current conditions, PM mass decreases in response to reductions in sulfate, nitric acid, and ammonia
• At current conditions, particulate nitrate formation limited generally by nitric acid
• At expected future conditions (i.e., lower sulfate), PM mass is more responsive to nitric acid reductions
• Daily and hourly data support same conclusions


Conclusions
• No significant differences between URG and R&P samplers except in HNO3 measurements
• Differences in HNO3 due partly to cyclone losses
• Ammonium losses average 20%• Denuders highly efficient for SO2 and
NH3; HNO3 results were erratic


Applications for NH3 data
• Thermodynamic evaluation across the region; when and where are conditions limited by nitric acid vs. ammonia (Charlie Blanchard)
• PM episode analysis – Feb. ’05 event, role of snow as source/sink
• Model evaluation (Kirk Baker dissertation?)
• Eventually: inventory validation

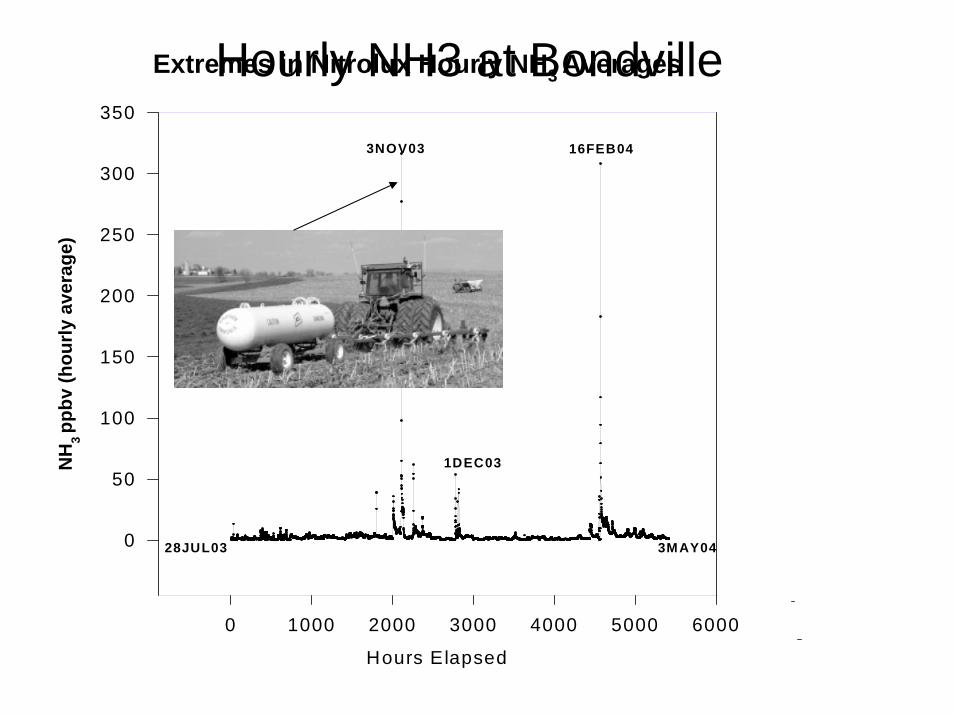
Extremes in Nitrolux Hourly NH3 Averages
Hours Elapsed
0 1000 2000 3000 4000 5000 6000
NH
3 pp
bv (h
ourly
ave
rage
)
0
50
100
150
200
250
300
350
28JUL03 3MAY04
3NOV03 16FEB04
1DEC03
Hours Elapsed
0 1000 2000 3000 4000 5000 6000
NH
3 pp
bv (h
ourly
ave
rage
)
0
50
100
150
200
250
300
350
28JUL03 3MAY04
3NOV03 16FEB04
1DEC03
Hourly NH3 at Bondville