Issue Paper: Inorganic Arsenic Cancer Slope Factorwilsonweb.physics.harvard.edu/arsenic/EPA Issue...
38
Environmental Protection Agency Issue Paper: Inorganic Arsenic Cancer Slope Factor Final Draft July 23, 2005
Transcript of Issue Paper: Inorganic Arsenic Cancer Slope Factorwilsonweb.physics.harvard.edu/arsenic/EPA Issue...

Environmental Protection Agency
Issue Paper: Inorganic Arsenic Cancer Slope Factor Final Draft
July 23, 2005

DRAFT Material
ii
Issue Paper: Inorganic Arsenic Cancer Slope Factor
EXECUTIVE SUMMARY ................................................................................................V
INTRODUCTION............................................................................................................. 1
Background..................................................................................................................................................................1
ISSUE 1: CHOICE OF CHRONIC ENDPOINTS........................................................ 3
EPA’s Drinking Water Risk Assessment (2001) .......................................................................................................3
NRC 2001 Recommendation.......................................................................................................................................3
Workgroup Conclusion...............................................................................................................................................3
ISSUE 2: INCLUSION OF NON-CANCER ENDPOINTS ......................................... 4
Workgroup Conclusion...............................................................................................................................................4
ISSUE 3: DETERMINATION OF THE DATA SET TO BE USED FOR MODELING. 5
EPA’s Drinking Water Risk Assessment (2001) .......................................................................................................6
Newly published related papers .................................................................................................................................6
Workgroup Conclusion.............................................................................................................................................11
ISSUE 4: CHOICE OF ED01 MODEL........................................................................... 12
EPA’s Drinking Water Risk Assessment (2001) .....................................................................................................12
NRC 2001 Recommendation.....................................................................................................................................13
Workgroup Conclusion.............................................................................................................................................13
ISSUE 5: LINEAR EXTRAPOLATION TO LOW DOSE.............................................. 14
EPA’s Drinking Water Risk Assessment (2001) .....................................................................................................14
NRC 2001 Recommendation.....................................................................................................................................15
Workgroup Conclusion.............................................................................................................................................15

DRAFT Material
iii
ISSUE 6: USE OF A COMPARISON POPULATION .................................................. 16
EPA’s Drinking Water Risk Assessment (2001) .....................................................................................................16
NRC 2001 Recommendation.....................................................................................................................................16
Workgroup Conclusion.............................................................................................................................................17
ISSUE 7: BACKGROUND CANCER RATE ................................................................ 18
EPA’s Drinking Water Risk Assessment (2001) .....................................................................................................18
NRC 2001 Recommendation.....................................................................................................................................18
ISSUE 8: ADJUSTMENT FOR DIETARY INTAKE OF ARSENIC (FOOD)................. 19
EPA’s Drinking Water Risk Assessment (2001) .....................................................................................................19
NRC 2001 Recommendation.....................................................................................................................................19
Workgroup Discussion ..............................................................................................................................................19 Review of New Studies ...........................................................................................................................................19
ISSUE 9: ADJUSTMENT FOR WATER INTAKE (FROM DRINKING WATER ONLY)...................................................................................................................................... 22
EPA’s Drinking Water Risk Assessment (2001) .....................................................................................................22
NRC 2001 Recommendation.....................................................................................................................................22 Review of New Studies ..........................................................................................................................................23
Workgroup Conclusions ...........................................................................................................................................24
ISSUE 10: ADJUSTMENT FOR DIETARY WATER INTAKE (FROM COOKING WATER)........................................................................................................................ 26
EPA’s Drinking Water Risk Assessment (2001) .....................................................................................................26
NRC 2001 Recommendation.....................................................................................................................................26
Workgroup Conclusions ...........................................................................................................................................26
ISSUE 11: ADJUSTMENT FOR MORTALITY VS. CANCER INCIDENCE................. 27
EPA’s Drinking Water Risk Assessment (2001) .....................................................................................................27
NRC 2001 Recommendation.....................................................................................................................................27
Workgroup Conclusion.............................................................................................................................................27
DRAFT Material
iv
ISSUE 12: CHILD SENSITIVITY ISSUE...................................................................... 28
Working Group Conclusion......................................................................................................................................28
DRAFT Material
v
Executive Summary Since publication of the 2001 NRC report, an intra-Agency workgroup has examined the NRC recommendations and their potential influence on regulation of inorganic arsenic by the various program offices. The Arsenic Cancer Slope Factor Workgroup consists of members of the Office of Water, the Office of Research and Development, the Antimicrobial Division and the Health Effects Division of the Office of Pesticide Programs, the Office of Children’s Health Protection, the Office of Solid Waste, and the Office of Emergency Response and Remediation. Over the course of eight meetings (April 30, 2003; June 10, 2003; Aug 12, 2003; Sept 17, 2003; March 10, 2004; Oct 25, 2004; Nov 9, 2004; and November 30, 2004), the workgroup discussed twelve issues:
1. The choice of chronic endpoints
2. The use of non-carcinogenic endpoints
3. Data to use for modeling
4. The model to use to calculate risk estimates
5. The method of extrapolating data to low doses
6. The use of a comparison population
7. The U.S. lung and bladder cancer background incidence rates
8. Dietary intake of arsenic in Taiwan
9. Consumption of drinking water in Taiwan
10. Consumption of cooking water in Taiwan
11. Adjusting cancer mortality data for incidence
12. Child Sensitivity Issue
This paper summarizes EPA’s Drinking Water risk assessment (January 2001), the NRC’s 2001 recommendations, and the Arsenic Cancer Slope Factor Workgroup’s discussions. In addition, a brief summary of reports published since the NRC 2001 recommendation is presented.
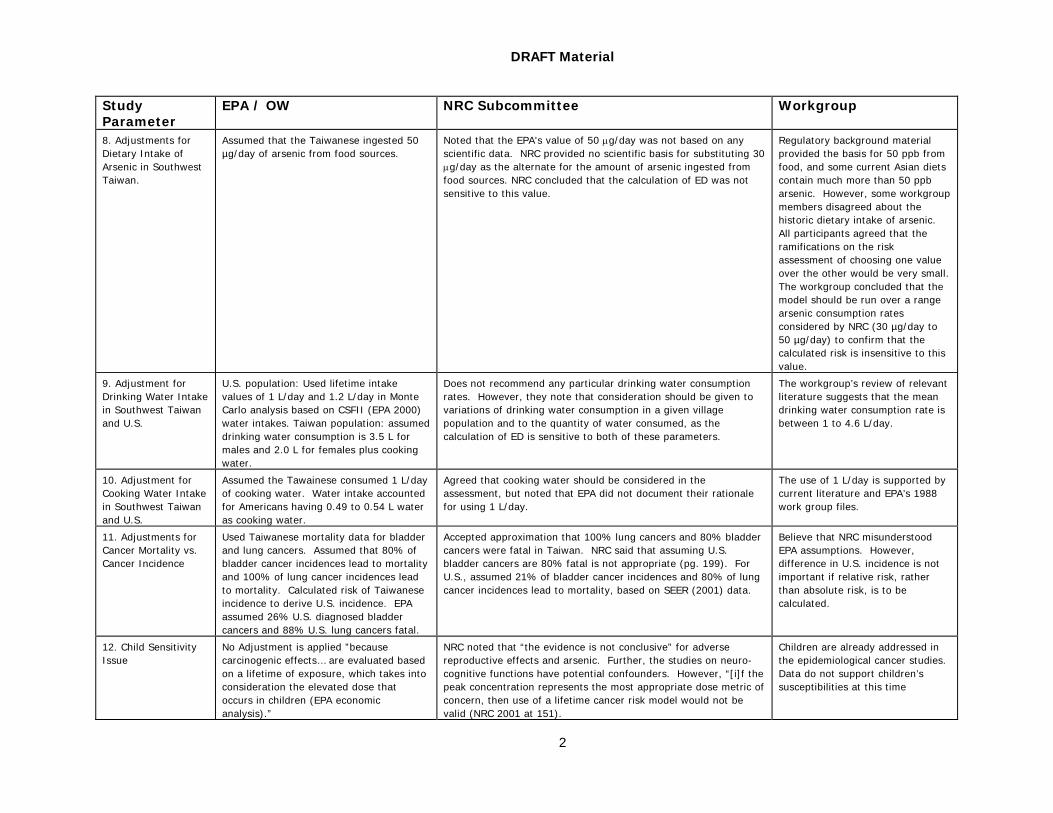
A summary table showing the issues is shown in Table 1. In general, the workgroup agrees with the recommendations made by the NRC. Issues for which the workgroup could not reach agreement were regarding the dietary intake of arsenic in Taiwan, and the consumption of drinking water in Taiwan.

Table 1. Summary of Issues and Recommendations Study Parameter
EPA / OW NRC Subcommittee Workgroup
1. Choice of Endpoint Lung and bladder cancer Lung and bladder cancer Same as NRC recommendation
2. Inclusion of Non-Cancer Endpoints
Brief review Brief review For carcinogenic analysis, the
agency will take a qualitative
approach in analyzing non-cancer
effects.
3. Choice of Study Southwestern Taiwanese cancer mortality data from Chen et al. (1985, 1988, 1992)
Southwestern Taiwanese data from Chen et al. (1985, 1988, 1992) as primary source; Northwestern Taiwanese data (Chiou et al. 2001) and Chilean lung cancer incidence data (Ferreccio et al. 2000) as supplementary sources
Should use the southwestern Taiwan data set presented in the 1999 NRC report.
4. Model Choice Poisson regression model with exponential linear function of dose anda quadratic function for age (multiplicative). This model was chosen because it fit the Akaike information criteria best.
Poisson regression model with linear function of dose (additive). This model was chosen because it led to the best fit when used with data from Chiou et al (2001).
Poisson regression model with linear function of dose (additive).
5. Linear Extrapolation to Low Dose
Linear extrapolation from ED01 Linear extrapolation from ED01 Same as NRC recommendation
6. Selection of Comparison Group
No comparison group used, because the model that fit the Akaike information criteria best did not include a comparison group, and because models with comparison groups led to supralinear dose-response relationships.
External comparison group recommended, because data for an external comparison group exists and because Tsai et al. (1999) demonstrated that the standardized mortality ratios derived from the southwestern comparison group are similar to those using the full Taiwanese population as a comparison group.
Same as NRC recommendation
7. Background Cancer Rate for U.S. Population
U.S. background cancer rates are the same as those in Taiwan as found in You et al. (2001)
Compared to Taiwanese background cancer rates, U.S. background cancer rates are 1.6 times and 2 times greater for males and females, respectively. This is based on comparing data from You et al. (2001) and SEER (2001).
Same as NRC recommendation
DRAFT Material
2
Study Parameter
EPA / OW NRC Subcommittee Workgroup
8. Adjustments for Dietary Intake of Arsenic in Southwest Taiwan.
Assumed that the Taiwanese ingested 50 µg/day of arsenic from food sources.
Noted that the EPA's value of 50 µg/day was not based on any scientific data. NRC provided no scientific basis for substituting 30 µg/day as the alternate for the amount of arsenic ingested from food sources. NRC concluded that the calculation of ED was not sensitive to this value.
Regulatory background material provided the basis for 50 ppb from food, and some current Asian diets contain much more than 50 ppb arsenic. However, some workgroup members disagreed about the historic dietary intake of arsenic. All participants agreed that the ramifications on the risk assessment of choosing one value over the other would be very small. The workgroup concluded that the model should be run over a range arsenic consumption rates considered by NRC (30 µg/day to 50 µg/day) to confirm that the calculated risk is insensitive to this value.
9. Adjustment for Drinking Water Intake in Southwest Taiwan and U.S.
U.S. population: Used lifetime intake values of 1 L/day and 1.2 L/day in Monte Carlo analysis based on CSFII (EPA 2000) water intakes. Taiwan population: assumed drinking water consumption is 3.5 L for males and 2.0 L for females plus cooking water.
Does not recommend any particular drinking water consumption rates. However, they note that consideration should be given to variations of drinking water consumption in a given village population and to the quantity of water consumed, as the calculation of ED is sensitive to both of these parameters.
The workgroup’s review of relevant literature suggests that the mean drinking water consumption rate is between 1 to 4.6 L/day.
10. Adjustment for Cooking Water Intake in Southwest Taiwan and U.S.
Assumed the Tawainese consumed 1 L/day of cooking water. Water intake accounted for Americans having 0.49 to 0.54 L water as cooking water.
Agreed that cooking water should be considered in the assessment, but noted that EPA did not document their rationale for using 1 L/day.
The use of 1 L/day is supported by current literature and EPA’s 1988 work group files.
11. Adjustments for Cancer Mortality vs. Cancer Incidence
Used Taiwanese mortality data for bladder and lung cancers. Assumed that 80% of bladder cancer incidences lead to mortality and 100% of lung cancer incidences lead to mortality. Calculated risk of Taiwanese incidence to derive U.S. incidence. EPA assumed 26% U.S. diagnosed bladder cancers and 88% U.S. lung cancers fatal.
Accepted approximation that 100% lung cancers and 80% bladder cancers were fatal in Taiwan. NRC said that assuming U.S. bladder cancers are 80% fatal is not appropriate (pg. 199). For U.S., assumed 21% of bladder cancer incidences and 80% of lung cancer incidences lead to mortality, based on SEER (2001) data.
Believe that NRC misunderstood EPA assumptions. However, difference in U.S. incidence is not important if relative risk, rather than absolute risk, is to be calculated.
12. Child Sensitivity Issue
No Adjustment is applied ”because carcinogenic effects… are evaluated based on a lifetime of exposure, which takes into consideration the elevated dose that occurs in children (EPA economic analysis).”
NRC noted that “the evidence is not conclusive” for adverse reproductive effects and arsenic. Further, the studies on neuro-cognitive functions have potential confounders. However, “[i]f the peak concentration represents the most appropriate dose metric of concern, then use of a lifetime cancer risk model would not be valid (NRC 2001 at 151).
Children are already addressed in the epidemiological cancer studies. Data do not support children’s susceptibilities at this time

Introduction
Background
In 1975, the U.S. Environmental Protection Agency (EPA) adopted a drinking water regulation for arsenic based on a U.S. Public Health Service standard set in 1942. The drinking water standard of 50 micrograms per liter (µg/L), which is equivalent to 50 parts per billion (ppb), remains in effect until 2006. EPA conducted risk assessments for arsenic-induced skin cancer in 1980, 1988, and 1992. Currently, the Agency’s Integrated Risk Information System (IRIS) carcinogenic risk from oral exposure to arsenic is based on southwestern Taiwanese skin cancer studies published in 1977 and 1968. IRIS estimates the one-in-a-million additional skin cancer risk to be 0.02 ppb arsenic in drinking water.
In 1996, EPA charged the National Academy of Sciences (NAS) to review the Agency’s characterization of potential health risks from ingestion of arsenic; the available data on carcinogenic and non-carcinogenic effects of arsenic in drinking water; the data on metabolism, kinetics, and mode(s) of action of arsenic; and research priorities. In response, National Research Council (NRC) issued a report in 1999. NRC used data from Wu et al. 1989 and Chen et al. 1992 to address several risk assessment issues.
EPA applied many of the recommendations from the 1999 NRC report in the risk characterization used to support the January 2001 revised arsenic drinking water regulation. The Agency based its new 10 ppb arsenic standard on the risk of bladder and lung cancers from the Taiwanese data used by NRC and estimated 1 - 6 x 10⁻⁴ risk to the 90th percentile of the U.S. population.
In April 2001, EPA charged the NRC to review the risk analysis used to support the revised arsenic drinking water regulation in light of studies published since the 1999 NRC report. NRC released its update report in September 2001.
Since publication of the 2001 NRC report, an intra-Agency workgroup has examined the NRC recommendations and their potential influence on regulation of inorganic arsenic by the various program offices. The Arsenic Cancer Slope Factor Workgroup consists of members of the Office of Water, the Office of Research and Development, the Antimicrobial Division and the Health Effects Division of the Office of Pesticide Programs, the Office of Children’s Health Protection, the Office of Solid Waste, and the Office of Emergency Response and Remediation. Over the course of eight meetings (April 30, 2003 to November 30, 2004), the workgroup discussed twelve issues:
1. The choice of chronic endpoints
2. The use of non-carcinogenic endpoints
3. Data to use for modeling
4. The model to use to calculate risk estimates
5. The method of extrapolating data to low doses
6. The use of a comparison population
7. The U.S. lung and bladder cancer background incidence rates
8. Dietary intake of arsenic in Taiwan
9. Consumption of drinking water in Taiwan
10. Consumption of cooking water in Taiwan
11. Adjusting cancer mortality data for incidence

DRAFT Material
2
12. Child Sensitivity Issue
This paper summarizes EPA’s Drinking Water risk assessment (January 2001), the NRC’s 2001 recommendations, and the Arsenic Cancer Slope Factor Workgroup’s discussions. In addition, a brief summary of some studies published since the NRC 2001 recommendation is presented.

DRAFT Material
3
Issue 1: Choice of Chronic Endpoints
Issue: There are a number of toxic effects associated with the long-term ingestion of inorganic arsenic. Which of these effects should be used in the risk assessment?
Workgroup Conclusion: Lung and bladder cancers were chosen as the chronic endpoints.
EPA’s Drinking Water Risk Assessment (2001)
EPA based its quantitative risk assessment on lung and bladder cancers, consistent with the 1999 NRC report. The 1999 NRC report concluded that there was sufficient evidence to conclude that ingestion of arsenic in drinking water causes skin, bladder, and lung cancer. The internal cancers (bladder and lung) were considered to be the main cancers of concern, based on the NRC 1999 report, which presents the best science as of its completion, and more recently published studies.
NRC 2001 Recommendation
NRC 2001 noted that new studies link arsenic to hypertension, diabetes, adverse reproductive effects, respiratory effects, skin lesions, and cognitive effects. However, the epidemiological studies of bladder and lung cancer provide “a sound and adequate basis for quantitative assessment of cancer risk (NRC 2001, p. 68).” The NRC noted that additional studies would be needed to assess the association of arsenic exposure with other health effects.
Workgroup Conclusion
The workgroup participants concurred in using bladder and lung cancer for risk assessments.

DRAFT Material
4
Issue 2: Inclusion of Non-Cancer Endpoints
Issue: There are a number of toxic effects associated with the long-term ingestion of inorganic arsenic. Which of these effects should be used in the risk assessment?
Workgroup Conclusion: Recommends a qualitative approach in considering non-cancer endpoints.
In 1999, NRC recommended additional study of arsenic-associated skin, cardiovascular, cerebrovascular effects as well as diabetes and adverse reproductive outcomes. However, in August 2001, EPA’s Science Advisory Board recommended that EPA quantify the benefits of hypertension and diabetes mellitus. In its EPA 2001 risk assessment, EPA listed cardiovascular, pulmonary, immunological, neurological, and endocrine effects as potential yet nonquantifiable health benefits. In 2001, NRC affirmed that “cancer represents the most sensitive health endpoint.(NRC 2001, p. 151)”, further noting that hypertension, cardiovascular disease, cerebrovascular disease and diabetes need additional study, as well as reproductive and developmental effects, and respiratory function.
Workgroup Conclusion
The workgroup agreed that these non-cancer effects will be assessed quantitatively in the non-carcinogenicity assessment (e.g., IRIS and OPP RED). There was no objection among the workgroup participants that for carcinogenic analysis, the agency will take a qualitative approach in analyzing non-cancer effects.

DRAFT Material
5
Issue 3: Determination of the Data Set to be Used for Modeling
Issue: Which data set should be used in the quantitative risk assessment for long-term exposure to arsenic in drinking water?
Workgroup Conclusion: The southwestern Taiwan data set presented in the 1999 NRC report should be used.
An important decision in a quantitative risk assessment is the choice of critical study to be used in the dose-response assessment. NRC reviewed a number of data sets as potential candidates for use in dose-response modeling for carcinogenic effects, including data from northeastern Taiwan, Chile,and southwestern Taiwan. Short descriptions of the studies from these regions are provided below. More detailed descriptions of these studies are provided in Chapter 2 of the NRC 2001 report. In addition, facts such as gender, differences in diet, cultural background, smoking, occupational exposures, and access to medical care were considered.
Northeastern Taiwan
Chiou et al. (2001) conducted a prospective cohort study of 8,102 persons in the Lanyang basin of northeastern Taiwan. The primary drinking water supply of all cohort members were wells that had been contaminated with arsenic from the late 1940s through the mid-1990s. Each subject was monitored for cancer incidence for 3 to 6 years (the study period was from 1991 to 1996). The study report included analyses of total urinary cancer rates (including kidney, bladder, and urethral cancer), and of transitional cell carcinoma (TCC).
Multivariate relative risks were calculated by comparing the results to those of a nonexposed reference group with arsenic exposures of 10 µg/L or less. The study concluded that the increase in arsenic-induced TCC was more prominent for those individuals who were exposed to the contaminated drinking water for more than 40 years. The adjusted relative risk of TCC in the highest exposure category (>100.0 µg/L) was 15.1. However, due to the short duration of follow-up, it only recorded a small number of cancer cases, this value has a large confidence interval (95% CI = 1.7 - 138.5). NRC (2001 at p. 49) noted that “risk estimates based on these data might be too imprecise for use in a quantitative risk assessment. However, the data can serve as supplementary information, along with data from other selected studies.”
Chile
Ferreccio et al. (2000) conducted a case-control study of incident lung cancer and bladder cancer in a region of Chile with a history of increased concentrations of arsenic in drinking water. For each participant, two controls were selected that matched the participant’s sex and closely matched the participant’s age. In addition, the authors attempted to select representative of arsenic exposure in the overall . NRC (2001) pg. 51 said the highest exposure had too many controls, which would tend to underestimate risk, while the next category (100-300 ppb) having less controls, would increase risk estimates.
Odds ratios were used to estimate the relative risk of exposure to various concentrations of arsenic in drinking water relative to a referent concentration of 0-10 µg/L. Results from the analysis show an increase in the odds ratio with arsenic concentration, reaching an odds ratio of 8.9 for the highest exposure group (200-400 µg/L). However, the odds ratio is underestimated for the exposure 200-400 and overestimated for the next lower category because of the distribution of controls. There was evidence suggestive of a synergistic interaction between smoking and exposure to arsenic.

DRAFT Material
6
Southwestern Taiwan
(1) Tsai et al. (1999) evaluated mortality due to several cancer and non-cancer causes in a region of southwestern Taiwan where blackfoot-disease was endemic. The study was conducted between 1971 through 1994. The area had high concentrations of arsenic in the drinking water in the past. SMRs were calculated twice, using two referent groups. The first referent was the mortality experience of the whole of Taiwan. The second referent was the mortality experience of two counties in southwestern Taiwan where blackfoot disease was endemic. The SMRs for two groups were used to determine the effects of inorganic arsenic consumption. In addition, factors such as gender, differences in diet, cultural background, smoking, occupational exposures, and access to medical care were considered.
EPA’s Drinking Water Risk Assessment (2001)
EPA used the southwestern Taiwan data provided by NRC 1999 in its quantitative risk assessment for exposure to arsenic in drinking water.
NRC 2001 Recommendation
The NRC noted that the southwestern Taiwanese ecological studies are the strongest sources of dose-response information for cancer endpoints. However, they suggested consideration of the northeastern Taiwanese urinary cancer prospective cohort study (Chiou et al. 2001) and the Chilean lung cancer case-control study (Ferreccio et al. 2000) for use in a quantitative risk assessment for the following reasons:
Chiou et al. 2001:
1. Large number of subjects;
2. Exposure levels close to concentrations of current regulatory concern (more than half the study subjects were exposed to concentrations less than 50 µg/L);
3. Data are available at the individual level on potential confounding factors, such as smoking and socioeconomic status; and
4. Urinary-tract cancer is the endpoint of interest
Ferreccio et al. 2000:
1. Individual information available on residential history, socioeconomic status, occupational history, and smoking; and
2. Detailed, individual-specific exposure assessments.
Newly published related papers
Since publication of the 2001 NRC report, several published papers may present alternative ways in analyzing the Taiwan.
(1) Lamm SH, Byrd DM, Kruse MB, Feinleib M, Lai S. Bladder Cancer and Arsenic Exposure: Differences in the Two Populations Enrolled in a Study in Southwest Taiwan. Biomedical and Environmental Sciences 2003; 16:355-368
(2) Lamm SH, Engel A, Kruse MB, Feinleib M, Byrd DM, Lai S, Wilson R. Arsenic in Drinking Water and Bladder Cancer Mortality in the U.S.: An analysis based on 133 U.S. counties and thirty years of observation. Journal of Occupational and Environmental Medicine 2004; 46(3):298-306

DRAFT Material
7
(3) Steinmaus C, Yuan Y, Bates M, Smith A. Case-Control Study of Bladder Cancer and Drinking Water Arsenic in the Western United States. American Journal of Epidemiology 2003; 158:1193-1201
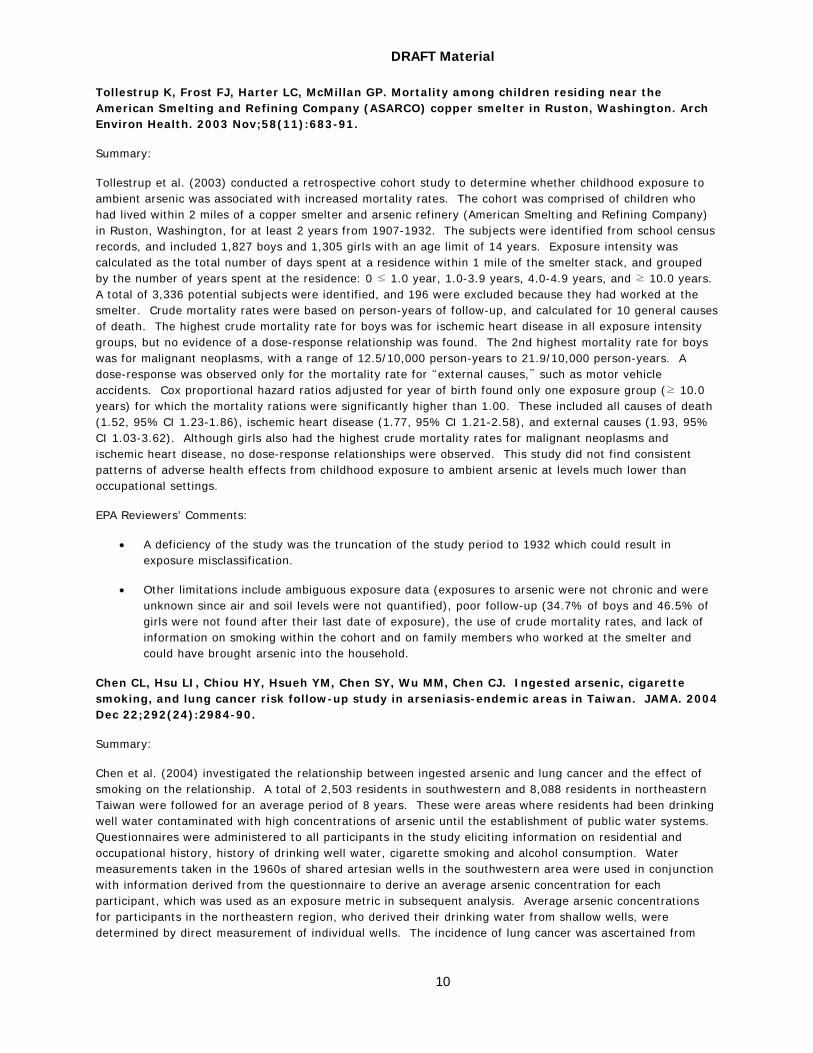
(4) Tollestrup K, Frost FJ, Harter LC, McMillan GP. Mortality among children residing near the American Smelting and Refining Company (ASARCO) copper smelter in Ruston, Washington. Arch Environ Health. 2003 Nov;58(11):683-91.
(5) Chen CL, Hsu LI, Chiou HY, Hsueh YM, Chen SY, Wu MM, Chen CJ. Ingested arsenic, cigarette smoking, and lung cancer risk follow-up study in arseniasis-endemic areas in Taiwan. JAMA. 2004 Dec 22;292(24):2984-90.
The Agency reviewed these five papers. The summary and review are listed below:
Lamm SH, Byrd DM, Kruse MB, Feinleib M, Lai S. Bladder Cancer and Arsenic Exposure: Differences in the Two Populations Enrolled in a Study in Southwest Taiwan. Biomedical and Environmental Sciences 2003; 16:355-368
Summary:
This study was a reanalysis of the underlying data used by the National Research Council (1999, 2001), and the U.S. Environmental Protection Agency (2001) to assess carcinogenic risk from arsenic ingestion. The original data were from studies by Wu et al. (1989) and Chen et al. (1992) with a reanalysis and risk assessment from Morales et al. (2000). Based upon median arsenic concentrations of wells within the villages of Southwest Taiwan, Lamm et al. (2003) categorized villages by water source as either artesian wells, shallow wells, or mixed, as suggested in earlier papers by Chen et al. (1985). Lamm et al. (2003) included this categorization in their re-analyses examining drinking water arsenic and bladder cancer mortality. Although a significant dose response relationship was confirmed for the artesian wells, no such trend was observed for the other two well types, which had arsenic concentrations generally less than 325 ppb. The authors concluded that previous risk assessments may have been flawed by failing to account for well type in the analysis. Two possibilities were suggested to explain the results: 1.) the trend was only present at high exposures; 2.) the presence of a co-carcinogen in the artesian wells that was not present in the shallow wells.
EPA Reviewers’ Comments:
Lamm et al. (2003) reclassified wells based solely on the median arsenic concentration of wells within a village. Specifically, the authors artificially classified village well types into three categories (shallow, < 0.325 ppm; mixed, wells above and below 0.325 ppm; and artesian, > 0.325 ppm) according to the arsenic concentration in the well water. The validity of Lamm’s reclassification is impossible to assess with the information provided. Assuming that all the authors had was the information in Chen et al. (1985), the validity of the classification is suspect.
Age is an important risk factor related both to duration of exposure and cancer risk, but age was not considered in the Lamm et al. (2003) re-analysis. Although the authors acknowledge that their analysis does not account for age or smoking as an influence because the data are not available to the public, it is evident from past literature that age and smoking can dramatically affect the onset of adverse health effects due to arsenic exposure (Tseng et al., 2000, 2003) and is commonly adjusted for in most epidemiological studies.
In this manuscript, Lamm et. al. (2003) used the fact that the Taiwanese studies (Wu et al., 1989; Tseng et al., 2000) of arsenic and bladder cancer were ecologic to suggest that factors other than arsenic may be responsible for bladder cancer. Little evidence exists for the co-carcinogen explanation. Previous studies have reported little difference in the chemical make-up of the wells that could explain the results. The presence of another bladder carcinogen in well water seems unlikely.

DRAFT Material
8
Lamm SH, Engel A, Kruse MB, Feinleib M, Byrd DM, Lai S, Wilson R. Arsenic in Drinking Water and Bladder Cancer Mortality in the U.S.: An analysis based on 133 U.S. counties and thirty years of observation. Journal of Occupational and Environmental Medicine 2004; 46(3):298-306
Summary:
This ecologic study examined white male bladder cancer mortality in the U.S. in relation to drinking water arsenic concentrations. This study was designed to be analogous to the Wu et al. (1989) Southwest Taiwan Study. Arsenic exposures were based on U.S. Geological Survey county-specific data. U.S. counties were evaluated for inclusion in the study if they exclusively used groundwater as source of drinking water and had measured arsenic levels ≥3 ppb (n=268 counties, arsenic range 3-60 ppb). These exposures were considerably lower than those in the previous studies conducted in Taiwan. White male bladder cancer mortality data from 1950-1979 were extracted from the NCI/EPA (1983). Of the 268 counties identified from the U.S.GS, 133 counties had at least one male bladder cancer death. More than 4500 white male bladder cancer deaths were observed across those 133 counties for the 30-year period. County level standardized mortality ratios (SMR) were calculated. No increase in SMR was observed as the median arsenic level of the county increased.
EPA Reviewers’ Comments:
Serious limitations in this ecological study exist with not enough detail or acknowledgement in the discussion by the authors. Exposure assignment was likely a major source of misclassification, even at the county level. A major assumption of this study was groundwater arsenic concentrations for a county were stable over time. The U.S.GS exposure information was collected between 1973-1998 with the majority of groundwater arsenic measures obtained after 1980. Groundwater arsenic concentrations may not be stable over time, and no evidence is provided to support this assumption. Also, little variance was observed across counties in median groundwater arsenic concentrations. Only two counties had median arsenic concentrations above 50 mg/L, five counties had exposures above 20 mg/L; and only 15 counties over 10 mg/L. The statistical power to observe SMRs below 1.7 is severely limited in the counties with arsenic greater than 50 mg/L. The power to detect an SMR of 1.5 in these counties is 46%.
Individual heterogeneity with respect to consumption of arsenic contaminated fluids was not taken into account which could be due to migration, use of alternative water sources, and simple variation in intake. Although the Steinmaus et. al. (2003) analysis demonstrates how important these variables are in evaluating the effect of low level arsenic exposure, individual information on age, duration of exposure, latency, occupation, and smoking cannot be taken into account in an ecologic analysis. Although the sample size may have been large enough to overcome the problems of studying a rare disease, the averaging effect of ecologic studies such as this make it impossible to evaluate subgroups in the population that may be more sensitive to low-level arsenic. Another averaging effect comes from the use of person-years. Not incorporating age information implies that 100 person-years from five 20-year old individuals would be the same as two 50-year old individuals. This averaging effect could have significant impact on the results of this study.
Counties with zero cases were excluded from the analyses without any justification given. Presumably, this was because a SMR could not be calculated for these counties. However, this exclusion may have resulted in biases, especially if these counties were also areas with low arsenic exposure.
The method of calculating the expected numbers of cases was questionable. Expected deaths were calculated by multiplying the ratio of the decade specific death rate for each county to the decade specific death rate for the state by the observed number of deaths. With this unconventional method, it was not clear as to whether Lamm et al. (2004) were referring to bladder cancer mortality rates or to overall death rates. The use of the SMR was unnecessary and confusing. If the authors were indeed referring to county level bladder cancer mortality rates in the ratio, why not compare the bladder rates directly using a Poisson model?

DRAFT Material
9
Steinmaus C, Yuan Y, Bates M, Smith A. Case-Control Study of Bladder Cancer and Drinking Water Arsenic in the Western United States. American Journal of Epidemiology 2003; 158:1193-1201
Summary:
An incident case-control study of bladder cancer in relation to drinking water arsenic was conducted in seven counties in the western United States. All incident cases of bladder cancer, which occurred between the years 1994 and 2000 were identified and enrolled (n=181). Controls were frequency matched to cases by age and gender and were selected either through random digit dialing or through the Health Care Financing Administration rolls if the case was ³65 years old. Lifetime exposure to drinking water arsenic was estimated using 7000 measurements from community and domestic wells obtained from the Nevada and California state health departments. Subjects were asked to estimate their drinking water intake as well as use of water filters and bottled water over the last 60 years. If drinking water estimates were not obtained or could not be estimated, drinking water estimates for that well were assigned a value of zero. No statistically elevated risks were identified for arsenic intakes greater than 80 ppb, although there was some evidence of elevated risks among smokers with a 40-year exposure lag at intakes greater than 80 ppb (OR=3.67, 95%CI 1.43-9.42).
EPA Reviewers’ Comments:
The reviewers have identified two issues that may have influenced the validity of the exposure assessment in this study. First, the authors have chosen to use a default of 0 µg/day arsenic exposure for several types of circumstances in the exposure assessment. These circumstances were as follows: 1) arsenic exposures for residences outside the study area were assigned a value of zero; 2) the use of bottled water and water treated with a filter known to remove arsenic was assigned an arsenic level of zero; 3) for residences where arsenic measurements could not be located or estimated, arsenic levels were assigned a value of zero. For these default situations it is an appropriate assumption to treat them in the same manner, but these default assumptions could skew the result towards the null hypothesis if the cases or controls were classified as false-negatives.
Second, misclassification of arsenic exposure as well as recall bias may be present within this study. Individual exposures were obtained by interview. Both cases and controls were asked to recall living locations over their lifetime and recall the type of water as well as amount of water consumed so that the authors could estimate a quantitative dose of arsenic over time. However, more cases than controls (19% versus 6%) were interviewed using next of kin. The likelihood that a person can recall fluid intake over lifetime (let alone have that recalled by the next of kin), considering the mean age for both cases and controls was approximately 70 years, may be improbable.
The appropriateness of controls was questionable. Controls were significantly more likely to be in a higher income bracket than cases. The authors state that since income was not a risk factor for bladder cancer than this could not be a confounder. While true, the possibility that controls were a biased selection of the study population still remains. If income were strongly associated with higher or lower arsenic exposures, the results would be biased relative to the general population.
The most significant problem with this study may be the interpretation and conclusion. For a small study with limited statistical power, a great deal of attention was made to the statistical significance of results. Little attention was provided to other potential trends in the data, despite the lack of significance. In Table 3, at a 40-year lag, elevated odds ratios compared to the referent group (under 10 ppb) were detected in all classifications of exposure, with the exception of 10-80 ppb in the highest 1-year and 5-year average. While attention to statistical significance is important, the elevated odds ratios may also be relevant, particularly given the low power of the study. For example, the power to detect an odds ratio of 1.78 for the >80 ppb category in the highest one year average for a 40-year lag was only 46%.
DRAFT Material
10
Tollestrup K, Frost FJ, Harter LC, McMillan GP. Mortality among children residing near the American Smelting and Refining Company (ASARCO) copper smelter in Ruston, Washington. Arch Environ Health. 2003 Nov;58(11):683-91.
Summary:
Tollestrup et al. (2003) conducted a retrospective cohort study to determine whether childhood exposure to ambient arsenic was associated with increased mortality rates. The cohort was comprised of children who had lived within 2 miles of a copper smelter and arsenic refinery (American Smelting and Refining Company) in Ruston, Washington, for at least 2 years from 1907-1932. The subjects were identified from school census records, and included 1,827 boys and 1,305 girls with an age limit of 14 years. Exposure intensity was calculated as the total number of days spent at a residence within 1 mile of the smelter stack, and grouped by the number of years spent at the residence: 0 ≤ 1.0 year, 1.0-3.9 years, 4.0-4.9 years, and ≥ 10.0 years. A total of 3,336 potential subjects were identified, and 196 were excluded because they had worked at the smelter. Crude mortality rates were based on person-years of follow-up, and calculated for 10 general causes of death. The highest crude mortality rate for boys was for ischemic heart disease in all exposure intensity groups, but no evidence of a dose-response relationship was found. The 2nd highest mortality rate for boys was for malignant neoplasms, with a range of 12.5/10,000 person-years to 21.9/10,000 person-years. A dose-response was observed only for the mortality rate for “external causes,” such as motor vehicle accidents. Cox proportional hazard ratios adjusted for year of birth found only one exposure group (≥ 10.0 years) for which the mortality rations were significantly higher than 1.00. These included all causes of death (1.52, 95% CI 1.23-1.86), ischemic heart disease (1.77, 95% CI 1.21-2.58), and external causes (1.93, 95% CI 1.03-3.62). Although girls also had the highest crude mortality rates for malignant neoplasms and ischemic heart disease, no dose-response relationships were observed. This study did not find consistent patterns of adverse health effects from childhood exposure to ambient arsenic at levels much lower than occupational settings.
EPA Reviewers’ Comments:
• A deficiency of the study was the truncation of the study period to 1932 which could result in exposure misclassification.
• Other limitations include ambiguous exposure data (exposures to arsenic were not chronic and were unknown since air and soil levels were not quantified), poor follow-up (34.7% of boys and 46.5% of girls were not found after their last date of exposure), the use of crude mortality rates, and lack of information on smoking within the cohort and on family members who worked at the smelter and could have brought arsenic into the household.
Chen CL, Hsu LI, Chiou HY, Hsueh YM, Chen SY, Wu MM, Chen CJ. Ingested arsenic, cigarette smoking, and lung cancer risk follow-up study in arseniasis-endemic areas in Taiwan. JAMA. 2004 Dec 22;292(24):2984-90.
Summary:
Chen et al. (2004) investigated the relationship between ingested arsenic and lung cancer and the effect of smoking on the relationship. A total of 2,503 residents in southwestern and 8,088 residents in northeastern Taiwan were followed for an average period of 8 years. These were areas where residents had been drinking well water contaminated with high concentrations of arsenic until the establishment of public water systems. Questionnaires were administered to all participants in the study eliciting information on residential and occupational history, history of drinking well water, cigarette smoking and alcohol consumption. Water measurements taken in the 1960s of shared artesian wells in the southwestern area were used in conjunction with information derived from the questionnaire to derive an average arsenic concentration for each participant, which was used as an exposure metric in subsequent analysis. Average arsenic concentrations for participants in the northeastern region, who derived their drinking water from shallow wells, were determined by direct measurement of individual wells. The incidence of lung cancer was ascertained from

DRAFT Material
11
national registry data for the period the period January 1985-December 2000. During the follow up period of 83,783 person-years, 139 lung cancer cases were diagnosed.
After adjusting for cigarette smoking and other risk factors such as age, alcohol consumption, and years of schooling, a significant (p <0.001) increasing trend in lung cancer was shown to result from increasing average levels of arsenic in well water. With levels <10 µg/L as the referent, relative risks (with 95% confidence intervals) for those consuming drinking water with arsenic concentrations of 10-99, 100-299, 300-699, and ≥700 µg/L, were respectively, 1.09 (0.63-1.91), 2.28 (1.22-4.27), 3.03 (1.62-5.69), 3.29 (1.60-6.78). It was further shown that 32% to 55% of lung cancer cases were attributable to both arsenic exposure and cigarette smoking. The synergism was shown to be additive; multiplicative interaction was not statistically demonstrated.
Workgroup Conclusion
The workgroup agreed that the southwestern Taiwan study should be used as the primary data source. The large confidence intervals (CI) on the Chiou et al. 2001 data and Ferreccio et al. 2001 data (CI values overlap considerably) are not precise enough for quantified risk assessments

DRAFT Material
12
Issue 4: Choice of ED01 Model
Issue: What model should be used to calculate the 1% effective dose (ED01) and other risk estimates?
Workgroup Conclusion: Poisson regression model with linear function of dose (additive) should be used.
The 1% effective dose (ED01) is the dose at which 1% of the population is affected. In trying to determine a dose-response curve, previous modeling attempts have started by estimating ED01 for exposure to inorganic arsenic.
EPA’s Drinking Water Risk Assessment (2001)
Morales et al. (2000) calculated cancer risk estimates using 10 risk models to estimate the risk of cancer mortality. Morales et al. (2000) used large number of models to help determine the sensitivity of the models. Poisson models were used in Morales et al. (2000) based on a recommendation from NRC (1999), which suggested that Poisson models were more stable than other modeling methods that had been used previously (mainly multi-stage Weibull models). After taking public comment on the models presented by Morales et al. (2000), EPA selected one of the ten models to use for estimating bladder and lung cancer ED01 values. The Morales et al. (2000) models were all based on the following general equation:
M = f(t) * g(d)
where:
M = Cancer hazard function
f(t) = a function describing the baseline risk in the absence of exposure to the chemical in question. Although the baseline function can incorporate a number of factors (e.g., age, gender, smoking/non-smoking, etc.), the Taiwanese data used by Morales et al. only contained gender and age (t) information.
g(d) = a function describing the effect of exposure to the chemical. The term d is the chemical dose.
Models that use this general equation frequently fall into one of two categories: multiplicative models or additive models. In a multiplicative model, the function g(d) takes the following general form:
)( 322
1)( cdcdcedg ++=
where c1, c2, and c3 are constants. If c1 = 0, the multiplicative model is exponential linear; otherwise, it is exponential quadratic. In contrast, an additive model takes the form:
322
1)( cdcdcdg ++=
where c1, c2, and c3 are constants. If c1 = 0, then additive model is linear; otherwise, it is quadratic.
In determining which of the ten models to use, EPA did not consider any model using an external comparison group because such models tended to produce supralinear dose-response curves, and superlinear curves were not considered to be sufficiently conservative (see Issue 5). The final model chosen was a quadratic function of age and a linear dose with no dose transformation (multiplicative model). This model was chosen because it did not use an external comparison population, and because the model best fit the Akaike information criterion.

DRAFT Material
13
NRC 2001 Recommendation
NRC notes that although the general Poisson approach is appropriate for calculating ED01 values, the applications had some limitations. Table 5-3 in NRC (2001) illustrated the differences in ED01 values calculated for the U.S. population for three studies using the Beir IV approach to calculate lifetime risk, assuming that the Chilean, Taiwanese, and U.S. populations drank the same amount of water, with the first two populations weighing 50 kg and assuming that the risks of cancer incidence were the same as the risks of cancer mortality. (Table 5-5 shows the difference between the using different drinking water rates in Taiwan and the U.S.) For the Chilean data (Ferreccio et al. 2000), NRC calculated ED01 values using linear regression of relative risks. NRC used two multiplicative models (either with linear or log dose) and one additive model with linear dose for both the northeastern Taiwan data (Chiou et al. 2001) and the southwestern Taiwan data (Chen et al. 1985, 1992). “The BEIR IV formula allows a useful approach to computing an ED01 for the United States based on relative risks obtained from a different population (NRC 2001 at p. 207).” In contrast, Morales et al. (2000) calculated ED01 values directly from the dose-response function, which was estimated using Taiwanese baseline risks.
In Tables 5-7 and 5-8 NRC calculated risk estimates for U.S. populations exposed to arsenic through drinking water using U.S. background incidence rates (vs. Table 5-9 using the background incidence rate of Taiwan). Tables 5-7 calculated U.S. lung cancer risk based on the Chilean and Taiwanese data. Table5-8 assumed that the Taiwanese drank 1 L/day or 2 L/day. These estimates were determined using a Poisson model with linear dose (additive model) and using the BEIR IV approach to apply relative risks from Taiwan to U.S. baseline population risks. NRC notes that they calculated risks “using assumptions considered to be reasonable by the subcommittee; it is possible to get higher and lower estimates using other assumptions.”
“...[A] wide range of different models can be used to fit the arsenic carcinogenicity data currently available, and no clear biological basis exists for distinguishing among them (NRC 2001 at p. 151).” The top three models in Table 5-4 based on high PMP values are the multiplicative with quadratic dose model (used by OW in the 2001 risk assessment), the additive log dose, and the additive linear dose. Based on low AIC values, the top three models are the additive linear dose, the multiplicative with quadratic dose model, and the additive linear dose. NRC concluded that the information known regarding mode of action does not “justify the choice of any specific dose-response model...” and among the “reasonable model choices, the estimates do not vary by more than an order of magnitude (NRC 2001, at pp. 207 and 208).“ Finally, the recommended model “is a biologically plausible model.”
Workgroup Conclusion
In general, it is more difficult to use external control information in a relative risk model when individual (not grouped) data are used such as the case of proportional hazard model where partial likelihood is used. When external control rates are in the form of vital statistics, it is difficult to use them in that model. Note that the reason is statistical, not mathematical; while one can transform "mathematically" from relative to additive model by log transform, it is difficult to incorporate external control when individual data must be used to construct a model. In the additive model, one can always use the external control data to estimate background parameters in a model, but not always easy to do so when some relative risk model is used. After discussion, the workgroup agreed that the additive Poisson regression model with a linear dose, as recommended by the NRC, is the preferred model.

DRAFT Material
14
Issue 5: Linear Extrapolation to Low Dose
Issue: The arsenic toxicity data needs to be extrapolated in order to estimate risk for the potential concentrations of concern. Should the extrapolation at low concentrations be linear or nonlinear?
Workgroup Conclusion: Linear extrapolation should be used.
Dose-response models can be classified in terms of the way they represent risks at low doses. In a linear model, the response is directly proportional to the dose administered, while in nonlinear models, the response and dose are not directly proportional. Two types of nonlinear models are supralinear, which is concave downward, and sublinear, which is concave upward. These dose-relationship models are illustrated in Figure 1.
Figure 1. Linear and NonLinear Dose-Response Models
EPA’s Drinking Water Risk Assessment (2001)
NRC (1999) concluded that the existing studies did not identify specific modes of action. When studies show no DNA reactivity, without sufficient evidence to support nonlinear modes of action, EPA’s current interim cancer guidelines (EPA 2001) uses linear extrapolation (EPA 1999 at I-16).
EPA’s cancer guidelines noted that animal studies generally don’t detect less than a 10% tumor incidence (1999 at I-13), which is equivalent to 100 tumors in a population of 1,000. The cancer guidelines state that data are used to identify the lower limit of the observed dose estimated to cause an adverse health effect for 10% of the population (LED10). “The linear approach is to draw a straight line between a point of departure from observed data, generally, as a default, the LED10, and the origin...(EPA 1999 at I-16).” Linear extrapolation produces the upper bound on risk at low doses assuming no need to add a factor to account for human variability (EPA 1999 at I-17).
0
1
2
3
4
5
6
7
8
Dose
Res
pons
e
Supralinear
Superlinear
Linear

DRAFT Material
15
EPA accepted the 1999 NRC conclusions about modes of action for arsenic. Therefore, EPA estimated the risks of cancer from exposure to arsenic in drinking water using a linear extrapolation from the southwestern Taiwanese epidemiological studies down to the origin.
NRC 2001 Recommendation
The NRC subcommittee concluded that the available mode of action studies do not indicate the shape of the dose-response curve, which will be a composite of the curves for specific biochemical endpoints (pg. 119). Statistical goodness-of-fit criteria applied to both the southwestern Taiwanese data and the northeastern Taiwan data support supralinear models with a log-transform of dose (NRC, 2001at p.192). The Chilean data set (Ferreccio et al. 2000) yielded some evidence of supralinear dose-response relationship. On the other hand, dose misclassification of the southwestern Taiwan data may cause an apparent supralinear relationship. NRC also recommended a linear dosed because of the inter-individual variation of response in humans
In determining which dose-response model to use, EPA had removed from consideration models that incorporated a comparison population because they tended to produce supralinear dose-response curves. The NRC criticized this practice, noting that an apparent supralinear curve may be caused by dose misclassification. Exposure to high concentrations of arsenic in food or movement of people among the different villages might cause such effects to appear. NRC noted that the presence of a supralinear curve in modeling scenarios was not enough justification to remove a model from consideration. NRC did not criticize the practice of using linear extrapolation below ED01.
Workgroup Conclusion
The workgroup participants agreed that a linear extrapolation to low dose should be used.

DRAFT Material
16
Issue 6: Use of a Comparison Population
Issue: Should internal or external comparison groups be used in dose-response modeling?
Workgroup Conclusion: An external comparison population should be used.
In the 1999 NRC report, it was suggested that two different comparison groups be considered for models of the southwestern Taiwan data set: (1) using only the 42 villages and using the variation in cancer rates from village-to-village to determine the nature of the estimated dose-response relationship (internal comparison group); and (2) using data from an external comparison population, such as nationwide data (external comparison group). NRC noted that an external comparison group is classically used in the analysis of cohort data and provides more accurate estimates of the baseline cancer rates than an internal comparison group. However, if a comparison group differs from the study population in important ways, the results will be biased.
Morales et al. (2000) derived standardized mortality ratios (SMRs) from the ecological Taiwanese data set with comparison populations of southwestern and all of Taiwan. The authors noted that SMRs correspond to maximum likelihood estimates (MLEs) of risk ratios derived from Poisson models. The authors obtained the baseline hazard three ways: modeling without a comparison population, assuming the comparison population has no exposure, or by using empirical estimates of baseline hazard based on the comparison population. "In general, models with no transformation on dose and an exponential linear dose effect fit well ...[with] no comparison population.... [Using] southwestern ... or the entire Taiwnese population, models with the square root and log transformation fit well (Morales et al. 2000 at p. 658)." Although log transformation without a comparison population had a good model fit, that model was instable at low dose. In addition, multiplicative models gave a better fit than additive models. The authors note that ED01 values for male bladder cancer ranged from 21 to 633 g/L depending on the model choice and on the use of a comparison population.
EPA’s Drinking Water Risk Assessment (2001)
EPA based its risk assessment on a model that did not use any comparison population. This model was chosen partly because the no-comparison group models were more stable (i.e., less sensitive to model choice) and the comparison-group models yielded ED01 values much lower than seemed reasonable. Moreover, the differences between the poor rural study population and the more prosperous urban comparison population might cause bias. Finally, models incorporating a comparison population tended to produce a supralinear dose-response relationship, even though the mechanistic data suggested a sublinear model.
NRC 2001 Recommendation
The NRC recommended using the whole Southwest Taiwan region (of which only a small minority is exposed to increased arsenic concentrations in drinking water) as an external comparison group for the following reasons:
1. Although it has been argued that the southwestern Taiwan population differs significantly from that of the whole of Taiwan (other than in the amount of arsenic in the drinking water), the standard mortality rates from the arsenic-endemic area are similar to those in the rest of Taiwan.
2. Models incorporating a comparison group tended to produce supralinear dose-response curves. Although the mechanistic data suggest sublinear dose, there are other factors to consider that might cause the curve to be supralinear (see Issue 5).

DRAFT Material
17
The shape of the dose reponse curve in an individual will be a composite of the curves for the biological endpoints. NRC notes that even though the modes of action suggest sublinear dose-response curves, especially extremely susceptible populations may produce a supralinear dose-response curve composite.
NRC (2001, p. 192) noted that supralinear curves can result from understimating the arsenic exposure from food, from movement of people between villages, and underestimation of the people exposed to high arsenic wells in villages assigned low exposure. Twenty of the 42 villages only had one well tested, and the rest of the villages had measurements for 2 to 47 wells (NRC 1999). Using no comparison population would understimate the slope of the dose-response curve, and using an external comparison population would decrease the measurement error because the large control group anchors the model fit (NRC 2001 at p. 192).
Workgroup Conclusion
There was no objection among the workgroup participants in using the Southwest Taiwan region as the external comparison group. However, OW questions whether NRC (1999 and 2001) fully addressed village exposure uncertainty in their analyses because the measured wells may not have represented all the wells used in the village during the period of exposure. Wu et al. (1989) collected water samples from wells used 1964-1966, and calculated person-years for 1973-1986, the years analyzed for death certificates. Village 4-7 had one well and 20,856 person-years, while village 6-C had one well and 24,694 person-years.
The Yang and Blackwell (1961) paper examined by the workgroup noted that: “the village of Fong-chia, which has a population of about 1500 people, has seven wells. As many as twenty or more families use one well (pg. 114).” “The average life of a deep well is two to three years; however, some of the wells in villages further from the sea coast occasionally last longer (pg. 114-115).”

DRAFT Material
18
Issue 7: Background Cancer Rate
Issue: What background lung and bladder cancer incidence rates should be used for the United States population?
Workgroup Conclusion: U.S. background cancer rates should be used in calculating lifetime risk.
The hazard (or relative risk) of cancer due to arsenic exposure has been estimated based on Taiwanese data, including the Taiwanese background rate. The results are then used to calculate lifetime risk for the U.S. population, using the BEIR IV formula and the U.S. background cancer rates.
EPA’s Drinking Water Risk Assessment (2001)
EPA used the ED01s derived by NRC (1999) from Poisson regression models. Furthermore, EPA derived cancer incidence from the Taiwanese mortality data by assuming 80% mortality for bladder cancer and 100% mortality for lung cancer. Then the Agency applied the increased lifetime cancer risks (absolute risks) in Taiwan in Monte Carlo simulations of the U.S. population, to estimate the average individual lifetime bladder and lung cancer risks in the U.S. caused by arsenic exposure. The average risk value, multiplied by the number of people exposed to arsenic at 10 ppb in the U.S., provided the number of U.S. cases expected. Running the Monte Carlo simulation at existing arsenic levels provides the total cases, which when subtracted from the number of cases at 10 ppb, estimates the number of cases avoided by lowering the MCL to 10 ppb. The Agency assumed that 26% of the bladder cancers are fatal and 88% of the lung cancers are fatal when costing out the health benefits for the drinking water regulation.
NRC 2001 Recommendation
NRC noted that the Poisson regression approach cannot readily incorporate the baseline risk of the U.S. population in deriving the relative risk. NRC estimated U.S. excess lifetime lung and bladder cancer incidence using U.S. background cancer incidence data from SEER 2001 in Tables 5-7 and 5-8, respectively, and adjusted by the difference in background cancer incidence between the U.S. and Taiwan using the data from You et al. 2001 in Table 5-9. Using U.S. background rates increases the bladder risk about 3 times for males and 2 times for females; 2.3 times for males and 3 times for females for lung cancer.
Workgroup Conclusion
After discussion, the workgroup agreed that relative risk should be used in calculating risk estimates for the U.S. population. When applying this relative risk data to the U.S. population, it is necessary to use U.S. background data instead of Taiwanese background data. Therefore, use of U.S. background cancer rates is recommended.

DRAFT Material
19
Issue 8: Adjustment for Dietary Intake of Arsenic (Food)
Issue: How should the dietary intake of arsenic in southwestern Taiwan be taken into account?
Workgroup Conclusion: The model should be run multiple times over a range of possible food consumption rates.
Because there is a high general background level of inorganic arsenic in food, it has been suggested that effective exposures to arsenic in Taiwan are higher than represented simply by the amount of well water drunk. For this paper, the issue of intake of arsenic from food (e.g., dry rice, sweet potatoes) has been distinguished from the issue of intake of arsenic from drinking water (Issue 9) and intake of arsenic from water used in cooking, such as water used to boil rice and potatoes (Issue 10).
EPA’s Drinking Water Risk Assessment (2001)
To account for background levels of arsenic in food, EPA assumed that the inorganic arsenic consumption due to food in Taiwan was 50 µg/day, compared to 10 µg/day in the United States. NRC (1999) cited results of Schoof et al. (1998) as estimating Taiwanese daily intake from yams as 31 µg/day and rice as 19 µg/day. NRC (1999) also noted that the Li et al. (1979) study found 95% of the rice crop to contain arsenic primarily 100 to 700 µg/kg, with some up to 1.43 mg/kg. The soil had probably been treated with arsenical pesticides.
NRC 2001 Recommendation
The NRC found little evidence to support EPA’s assumption that food contributed 50 µg/day of inorganic arsenic to the Taiwanese diet. NRC addressed the issue by determining how sensitive the calculation of ED01 was to the consumption rate. NRC found that changing the consumption rate from 50 µg/day to 30 µg/day did not change the calculated ED01 significantly (about 1% difference). This lack of sensitivity was not unexpected, since the southwestern Taiwanese population, which was used as a comparison group, had a similar dietary intake as the exposed population.
Workgroup Discussion
Review of New Studies Since the publication of NRC 2001, the workgroup reviewed a number of studies, delving into the literature used to derive EPA’s 50 µg/day value and examining new Asian literature.
Taiwanese Studies
(Irgolic 1988) summarized Yang and Blackwell’s 1961 study of 41 families in Southwest Taiwan.
(Yang and Blackwell 1961) interviewed 41 families in the affected region of Southwest Taiwan. Based on these interviews, the study presents consumption rates of rice and sweet potatoes. Although the information is based on anecdotal data, and no statistics are presented, the study was considered worth reviewing because the data are directly from the population of concern.
(EPA 1989) An internal workgroup paper which slightly modified the food consumption patterns in the Irgolic 1988 and Yang and Blackwell 1969 papers to account for the higher sweet potato consumption of the majority of the study population. Using Yang and Blackwell’s data for cooked rice and sweet potatoes, EPA’s food adjustment decreases the caloric average consumption that Yang and Blackwell developed in the field, so EPA’s arsenic intake may underestimate actual consumption patterns at the time.
(Li et al. 1979) In 1975 the authors collected rice samples from 86 townships in Taiwan, when Taiwan routinely used arsenical pesticides on rice. The mean was 0.3 to 0.53 ppm or mg/kg .

DRAFT Material
20
(Schoof et al., 1988) The authors analyzed the dry weight concentrations of arsenic in rice and yams in South West Taiwan and applied EPA’s 1989 daily consumption rate of 225 g/day of rice and 500 g/day yams (Irgolic 1988) to estimate daily dietary intake of arsenic.
Studies in India and Bangladesh
Duxbury et al. (2003), Bae et al. (2003), Alam et al. (2003), and Watanabe et al. (2004) reported arsenic content in foods grown in West Bengal, India and Bangladesh. Chowdhury et al. (2001) estimate that adults in West Bengal, India obtain about 285 µg/day of inorganic arsenic from their primary staples of rice (750 g/day) and vegetables (500 g/day). Roychowdhury et al. (2002) report concentrations of arsenic in potatoes and raw and cooked rice from 6 villages in West Bengal where arsenic concentrations in groundwater are above 50 mg/L.
Food consumption rates, arsenic concentrations in food, and arsenic ingestion rates from these studies are presented in Tables 2, 3, and 4, respectively. The arsenic ingestion rates calculated from Chowdhury et al. (2001) and Watanabe (2004) are 285 and 214 µg/day, respectively. These rates are much higher than 30-50 µg/day consumption rates used by NRC. However, the studies from which these rates were derived are from locations where both dietary habits and arsenic concentrations in food differ from those in Taiwan.
Table 2. Summary of Food Consumption Studies Study Population Method Food Type/Population Food Consumption Rate
Yang and Blackwell, 1961 Southwes Taiwan, male adults
Informal interview survey, n=41 (a)
Cooked Rice
Sweet Potato
396 g/day
467 g/day
Total = 2934 Kcal (b)
U.S. EPA 1989 Taiwan Literature and judgement
Cooked rice
Yam
225 g/day
500 g/day
Total = 2475 Kcal (b)
Chowdhury et al. 2001 West Bengal, India Formal interview survey, n=3,411
Rice, cooked, Adults
Rice, cooked, Children
Vegetables, Adults
Vegetables, Children
750 g/day
400 g/day
500 g/day
300 g/day
Bae et al., 2002 Bangladesh -- Rice, cooked, Adults 1500 g/day
Watanabe et al., 2004 NW Bangladesh -- Rice, cooked, Male
Rice, cooked, Female
Bread, Male
Bread, Female
Potato, Male
Potato, Female
Fish, Male
Fish, Female
523 g/day
300 g/day
179 g/day
131 g/day
130 g/day
66 g/day
72 g/day
26 g/day
Note:
(a). Although the n goes up to 48 in the paper, there are only 41 families. I have put the data into several Excel worksheets, and this one shows the farmers (F), city dwellers (C), and fishers (Fish).
(b). Based on cooked rice is 130 cal/100 gm and cooked yam is 116 cal/100 gm (http://www.rahul.net/cgi-bin/fatfree/usda/usda-l0.cgi?YAMx%20CKD,%20BOILED,%20DRAINED,%20OR%20BAKED,%20WOzSALT)

DRAFT Material
21
Table 3. Summary of Studies of Arsenic Concentrations in Food Study Population Method Food Type Concentration
Li et al. 1979 Taiwan Samples from 85 townships
Rice mean 0.3 to 0.53 mg/kg
Schoof et al. 1998 South west Taiwan
8 rice samples & 19 yam samples
Rice
Yams
0.15 mg/kg
0.11 mg/kg
Duxbury et al., 2003 Bangladesh 150 rice samples tested from winter and rainy season
Dry Rice 0.1-0.42 mg/kg
Alam et al., 2003 Bangladesh -- Potatoes (not reported as yams or as white potatoes)
<0.1 mg/kg (dry weight)
Bae et al., 2002 Bangladesh -- Dry Rice 0.173 mg/kg
Roy Chowdhury et al., 2002 West Bengal, India -- Dry Rice
Potato skins
0.04-0.7 mg/kg
0.06-0.7 mg/kg
Table 4. Summary of Studies of Arsenic Consumption Per Day Study Population Method Food Type Concentration
Schoof et al. 1998 Taiwan -- Rice and Yams, Adults 50 µg/day
Chowdhury et al., 2001 West Bengal, India -- Rice and Vegetables, Adults
Rice and Vegetables, Children
285.0 µg/day
153.2 µg/day
Watanabe et al., 2004 NW Bangladesh -- Rice, Bread, Potato, Fish, Male
Rice, Bread, Potato, Fish, Female
214 µg/day
120 µg/day
Workgroup Conclusion
While there was disagreement among the workgroup participants as to the dietary intake of arsenic, all participants agreed that the ramifications on the risk assessment of choosing one value over the other would be very small. The workgroup concluded that the model should be run over a range arsenic consumption rates considered by NRC (30 µg/day to 50 µg/day) to confirm that the calculated risk is insensitive to this value.

DRAFT Material
22
Issue 9: Adjustment for Water Intake (From Drinking Water Only)
Issue: How much water do people drink in southwestern Taiwan and in the United States?
Workgroup Conclusion: The model should be run multiple times over a range of possible drinking water consumption rates
To estimate cancer risks associated with a given arsenic concentration in drinking water, a value must be determined to account for the quantity of drinking water consumed. The drinking water consumption rates used in the model are important, as assumptions about the total arsenic exposure in the study population can have a large impact on risk assessments. This paper addressed the issue of intake of arsenic from drinking water (Issue 9) and intake of arsenic from water used in cooking, such as water used to boil rice and potatoes (Issue 10).
EPA’s Drinking Water Risk Assessment (2001)
Based on data from the 1994-1996 Continuing Survey of Food Intakes by Individuals (CSFII) (EPA 2000), EPA estimated that the mean daily average per capita consumption of tap water by individuals in the United States was 1 L/person/day for “community tap water” and 1.2 L/person/day for “total water” (which includes bottled water). The values represented a lifetime average tap water intake, which included the amount of tap water added during food preparation (discussed further in issue 10). U.S. consumption of tap water does not include water added by manufacturers during processing (e.g., beer, soft drinks, ready-to-eat canned soup) because manufacturers often process the water (e.g., reverse osmosis) for product consistency, which would remove contaminants such as arsenic. However, instead of using a point estimate (e.g., a 70-kg adult drinking 2 L/day, and about 90% of the population drinks less than 2 L/day) for its risk assessment, EPA conducted a Monte Carlo analysis generate lifetime risks of water intake.
For the Taiwanese population, EPA assumed that the consumption was 3.5 and 2.0 L/day for men and women, respectively. The Agency also used these consumption rates in the 1988 risk assessment. A 1989 EPA workgroup report noted that 3 to 4 adults estimated their daily water intake as up to 3.75 L/day during EPA’s 1988 visit to the affected Taiwan area.
NRC 2001 Recommendation
NRC was concerned about two issues:
1. The Taiwanese study used by EPA measured exposure at the village level, rather than at the individual level. Individuals in the same village may vary dramatically in terms of the quantity of water consumed.
2. Although, on average, the Taiwanese population should have a higher drinking water consumption than the U.S. population, the idea that the two populations differ dramatically has been questioned (Mushak and Crocetti, 1995).
NRC (2001at 140) noted that “...no appropriate data on the distribution of water consumption in the Taiwanese study populations are available at this time.... However, it seems likely that the water consumption pattern of the people in southwestern Taiwan... has changed with time as the socioeconomic situation has improved.... In the absence of reliable data on water consumption in the Taiwanese study populations, the sensitivity of the risk estimates to those assumptions should be assessed to quantify some of the uncertainty in the risk assessment.”
DRAFT Material
23
To determine the impact of individual variability in the Taiwanese drinking water rate, NRC modeled Taiwanese risk based on the U.S. population water intake profile of the CSFII data, which has a mean of 21 milliliters per kilogram body weight per day (mL/kg/day) and a standard deviation of 15 mL/kg/day.
Second, for the sensitivity analysis in Table 5-5, NRC selected three water consumption rates for a 50 kg Taiwanese adult: a consumption rate equal to the U.S. mean rate (i.e., 21 mL/kg/day x 50 kg= 1 L/day), a rate 2.2 times that of the U.S. mean, as used in EPA 1988 (21 mL/kg/day x 50 kg x 2.2 = 2.3 L/day, or 46 mL/kg/day), and a rate 3 times the U.S. mean (to implicitly account for additional arsenic exposure through food and cooking water [see issue 10], 3.2 L/day, or 64 mL/kg/day. Taking individual variability of Taiwanese into account and increasing the consumption rate increased the central tendency estimates for ED01 and widened the 95% confidence interval for the calculated ED01 values. Therefore, NRC concluded that the drinking water consumption rate, as well as variability of that rate in both U.S. and Taiwanese populations, are important factors to consider.
In calculating risk estimates for U.S. populations exposed to arsenic through drinking water, NRC used a drinking water consumption rate of 1 L/day for the U.S. population and two possible consumption rates for the Taiwanese population: 1 L/day (identical to the U.S. population) and 2.2 L/day. NRC noted that they calculated risk estimates to compare results from Taiwan, Chile, and the U.S., noting that the risk values presented “should not be considered bounds on the possible risk estimates, because other assumptions could be made that would result in higher or lower values (NRC 2001 at 203).” The report also states that NRC calculated risks “using assumptions considered to be reasonable by the subcommittee. (NRC 2001 at p. 203).”
Review of New Studies Since the publication of NRC 2001, the workgroup reviewed a number of other studies not cited by NRC. These studies are summarized in Table 5.
Taiwanese Study (Yang and Blackwell, 1961) – EPA had not previously cited this source, although the 1989 workgroup members had file copies. The study authors conducted interviews in Southwest Taiwan with families in the affected region. Based on these interviews, the study estimates adult water intake to be 1 to 3 liters a day, depending on temperature and physical activity. “[M]ost of the population are engaged in relatively heavy labor.... [T]he proportion of poor people in the total population of the area appears to be higher than the national average and the economic status of the poorest families in the area certainly is extremely low.... The two principal sources of calories ... are sweet potatoes and rice
Studies in India and Bangladesh - Two recent studies have reported on arsenic exposure in rural villages of Bangladesh (Watanabe et al., 2004) and West Bengal, India (Chowdhury et al., 2001). The rural settings and socioeconomic classes share some similarities with the Taiwanese study population. However, these studies have higher temperatures, different foods and preparation methods, longer growing seasons, and Watanabe reported short work days. A larger data set was collected in the Chowdhury study; however reporting of methods and analyses were limited.
• International Commission on Radiological Protection (ICRP)– (1981), as cited in EPA 1997. Although the U.S. populations (adult and children) and study design are not clearly provided, the results are consistent with other studies. Increasing temperature and activity increased fluid intake in the U.S. (3.7 L/day for a 70 kg adult = 52 mL/kg/day) to levels approaching the Asian studies.
• Ershow and Cantor (1989) – as cited in EPA 1997. The Ershow and Cantor (1989) based their estimates on the U.S.DA 1977-1978 Nationwide Food Consumption Survey. Total water was defined as tapwater plus water in purchased food and beverages (e.g, soft drinks and beer). A 70 kg American adult has a total water consumption of 30 mL/kg/day.
• 2004 U.S. Studies - Two large, well conducted surveys of drinking water rates in the U.S. have been conducted (NHANES and CSFII). These studies provide useful benchmarks for evaluating Taiwanese drinking water rates. In addition to water intake, the NHANES survey provides information on all beverages consumed and attributes 19% water contribution inherent in food sources.
DRAFT Material
24
Data from these studies are summarized in Table 5. The studies present values for the mean drinking water rate ranging from 2 to 3.5L/day in Asia. This range is consistent with the range used in the NRC report (1 to 3.1 L/day). In addition, unlike the Taiwanese, the Americans obtain fluids other than tap water (e.g., soft drinks, beer), so that total U.S. water ranges from 2.1 to 2.8 L/day and higher for active adults or adults in hot environments. Water added to products prior to merchandising (e.g., bottled ice tea) is not included in the 2001 EPA risk assessment consumption, and the National Health and Nutrition Examination Survey (N HANES) tracks beverage water in the 2.8 L/day value. Furthermore, NHANES tracks water contained in food in its 3.2 L/day total water estimate.
Workgroup Conclusions
The workgroup agrees with the NRC conclusion that the selection of the drinking water consumption rates should consider, as possible, the uncertainty associated with trying to accurately determine the mean consumption rate of the populations, and of the variability of individuals within the populations. The workgroup agrees that the model is highly sensitive to the term selected. The workgroup’s review of relevant literature suggests that the mean adult drinking water consumption rate for Asian population is between 1 to 4.6 L/day.

DRAFT Material
25
Table 5. Summary of Water Consumption Studies
Study Population Method Water Type Consumption Rate (L/day)
Yang and Blackwell, 1961 Southwest Taiwan, adults
Informal interview survey, n=48
Drinking water range: 1- 3
EPA 1989 Southwest Taiwan, adults
informal questioning of 3-4
Drinking water up to 3.75
Chowdhury et al., 2001(a) West Bengal, India - adults
Formal interview survey,
n = 4,613 (a)
Well water drunk
mean: 3.5 L/d
Male =4.15 L/day(a)
Female =3.16 L/day (a)
Watanabe et al., 2004 Bangladesh – adults working 1-4 hours a day mean, 6 max.
Formal interview survey, n=38
6 days of hot weather at the end of the rainy season.
Well water drunk mean: 3.1; max 6
ICRP 1981, as cited in EPA 1997.
U.S. adults Normal conditions
Up to 90oF
Moderately active
Includes tap water, coffee, soft drinks, beer, etc.
0.37 to 2.4 L/day
2.8-3.4 L/day
3.7 L/day
Ershow and Cantor (1989), as cited in EPA 1997.
U.S. adults 20-64
U.S.DA survey, included 1,731 adults in that age group
Tap water
Total water: includes water in food & beverages (b)
1.4 L/day
2.1 L/day
U.S.DA CSFII as reported in EPA, 2004
U.S. all ages Formal questionnaire survey, n=20,000
Direct tap, tap used in food/beverages, bottled(b)
lifetime mean: 1.0-1.2
NHANES III as reported in NRC, 2004
U.S. adults 18-30 yr
Formal questionnaire survey, n= ~3,700
Tap water
Drinking water (tap used in food/beverages) and beverage water (e.g., added to soft drinks, beer)
Total water (~19% from
food) (b)
mean 1.0
mean: 2.8
mean: 3.2
Note: (a) This study was supplemented by information provided via personal communication from the author.

DRAFT Material
26
Issue 10: Adjustment for Dietary Water Intake (From Cooking Water)
Issue: How should the dietary intake of arsenic in southwestern Taiwan via cooking water be taken into account?
Workgroup Conclusion: The use of 1 L/day is justified by literature.
For this paper, the issue of intake of arsenic from drinking water (Issue 9) and intake of arsenic from water used in cooking, such as water used to boil rice and potatoes (Issue 10).
EPA’s Drinking Water Risk Assessment (2001)
EPA assumed that 1 L/day of cooking water was consumed by both men and women in Southwest Taiwan. The value was based on anecdotal information regarding water requirements to cook rice and potatoes, and information regarding rice and potato consumption rates (U.S. EPA 1989).
NRC 2001 Recommendation
Although the NRC agreed with EPA’s method for accounting for the extra water consumption due to use of drinking water in cooking food, the NRC noted that the rationale for using 1 L/day was not documented.
Workgroup Conclusions
Three recent studies have reported on arsenic exposure in rural villages of Bangladesh (Watanabe et al., 2004, and Bae at al., 2003) and West Bengal, India (Chowdhury et al., 2001). The rural settings and populations have similarities with the Taiwanese study population. However, climatic and cultural differences exist (e.g, different foods in diet and different rice preparation).
Chowdhury et al. (2001), Bae et al. (2003), and Watanabe et al. (2004) reported that 1 L of water was used for food preparation (rice, potatoes, drinks) for adults in West Bengal and Bangladesh.
The lifetime per capita U.S. mean of tap water and bottled water of 1.0-1.2 L/day, respectively, includes the water added to foods and beverages during preparation (indirect water used in food preparation ranges from 0.5 to 0.55 L/day of the U.S. water consumption).

DRAFT Material
27
Issue 11: Adjustment for Mortality vs. Cancer Incidence Issue: How are cancer mortality rates related to cancer incidence rates?
Workgroup Conclusion: Since the workgroup decided to determine relative risks instead of absolute risks, this issue is irrelevant.
ED01 calculations used by EPA were based on data from southwestern Taiwan and referred to lifetime cancer mortality from bladder or lung cancer. In order to compare these data to the northwestern Taiwan data, it was necessary to make assumptions regarding the relationship between cancer incidence and cancer mortality.
EPA’s Drinking Water Risk Assessment (2001)
EPA converted risks calculated from Taiwanese mortality data to cancer incidence by assuming an 80% mortality for bladder cancer and a 100% mortality for lung cancer. EPA applied the absolute risk increase seen in Taiwan to the U.S. arsenic exposure to derive increased occurrence of lung and bladder cancer incidence. In its 2001 risk assessment, EPA applied 26% bladder mortality and 88% lung cancer mortality to the U.S. cancer estimates.
NRC 2001 Recommendation
NRC used the lifetime baseline (background) cancer risk in the U.S. to derive cancer risk for arsenic exposure, which increases the risk estimates. Lung cancer incidence is three times higher for females and two times higher for males in the U.S. than in Taiwan. Likewise, bladder cancer is about three times higher in males and two times higher in females for American.
“[T]he subcommittee was split on whether using the U.S. background rates was preferable to using the Taiwanese background rates for estimating arsenic risks in the United States.... The subcommittee agreed, however, that if there was a multiplicative interaction between a complex array of risk factors, including smoking,... then using the U.S. background cancer incidence rates would be preferred over the Taiwanese background rates for estimating arsenic cancer risks in the U.S. population (NRC 2001 at 221).”
NRC believes that 100% mortality for lung cancer is probably an appropriate estimate, but that 80% mortality for bladder cancer in Taiwan may not be appropriate for the U.S. population. Data from SEER (2001) suggest that the mortality rate in the U.S. is around 20%.
Workgroup Conclusion
Because the workgroup decided to use relative risks instead of absolute risks, no adjustment is necessary to account for the difference in background cancer incidences between the U.S. and Taiwan.

DRAFT Material
28
Issue 12: Child Sensitivity Issue
Issue: What food and water consumption rates should be used for children?
Workgroup Conclusion:
Children should already be addressed in the epidemiological studies. However, the time to tumor may have longer time to develop into a tumor. Will be discussed in the uncertainty analysis. No further adjustment is needed.
The Agency has published Guidelines for Carcinogen Risk Assessment (U.S. EPA, 2005a); this document mentions the need to address early-life exposures from carcinogens. In addition, the recent EPA Supplemental Guidance for Assessing Susceptibility from Early-Life Exposure to Carcinogens (EPA, 2005b) identifies age-dependent adjustment factors to be applied to carcinogens with a mutagenic mode of action when chemical-specific data are unavailable. (U.S. EPA, 2005b).
Much toxicity data are available on arsenic; however, the data needed to account for an accurate representation of early-life exposure to arsenic appears to be insufficient. For example, the National Resource Council (NRC, 2001) summarizes the few studies of infant mortality, spontaneous abortions, and still births in chapter 2. NRC (2001) concluded: "There are no reliable data that indicate heightened susceptibility of children to arsenic.... [I]nfants and children might be at greater risk for cancer and noncancer effects because of greater water consumption on a body-weight basis. However, ... the lifetime cancer risk estimates account for the greater childhood exposures by deriving risk estimates from epidemiology studies of cancer among populations exposed to cancer from birth...." (NRC 2001 at p. 8) "However, the [adverse reproductive effects] evidence is not conclusive, because the studies suffer from such limitations as a lack of information on lifestyle and other exposures that could affect reproductive outcomes (NRC 2001 at 66). NRC also concluded “that although a large amount of research is available on arsenic’s mode of action, the exact nature of the carcinogenic action is not clear” (NRC, 2001). Finally, NRC concluded that inorganic arsenic and its metabolites have been shown to induce chromosomal alterations and large deletion type mutations, but not point mutations.
Although there is some new evidence indicating that exposure to arsenic from drinking water during pregnancy may be associated with decreased birth weights of newborns (Hopenhayn, 2003) and may increase the cancer incidence of the child in the later stage of life (Waalkes, 2003), the data needed to account for an accurate representation of early-life exposure of arsenic appears to be insufficient (NRC, 2001).
The working group also understands that whether children are more sensitive to a carcinogen is not necessary related to the mechanism of how it causes cancer. For the chemical with same potency, exposure at the early stages of life would allow the body more time to express and turn into final cancer. A time to tumor analysis would help to demonstrate this kind of difference.
Working Group Conclusion
Because the cancer slope factor used in this cancer risk assessment is derived from the epidemiology study using the Southwestern Taiwan data, it is generally believed that the sensitive population exposed to inorganic arsenic through drinking water during the most sensitive period of time is already included in the exposed population. Therefore, given the lack of additional data, the working group agreed that an adjustment factor does not appear to be appropriate in the cancer risk assessment associated with inorganic arsenic exposure in the current approach.

DRAFT Material
29
References
Alam MGM et al. 2003. “Arsenic and heavy metal contamination of vegetables grown in Samta village, Bangladesh.”The Science of Total Environment. 308, pp. 83-96.
Bae, M. C. Watanabe, T. Inaoka, M. Sekiyama, N. Sudo, M..H. Bokul, R. Ohtsuka. 2002. Arsenic in cooked rice in Bangladesh. The Lancet v. 360, December 7, 2002, 1839-1840.
Chen CJ, CW Chen, MM Wu, TL Kuo. 1992. Cancer potential in liver, lung, bladder, and kidney due to ingested inorganic arsenic in drinking water. Br. J. Cancer 66(5):888-892.
Chen CJ, MM Wu, SS Lee, JD Wang, SH Cheng, and HY Wu. 1988. Atherogenicity and carcinogenicity of high-arsenic artesian well water. Multiple risk factors and related malignant neoplasms of blackfoot disease. Arteriosclerosis 8:452-460 Chen CJ, YC Chuang, TM Lin, and HY Wu. 1985. Malignant neoplasms among residents of a blackfoot disease-endemic area in Taiwan: high-arsenic artesian well water and cancers. Cancer Res. 45(11 Pt 2): 5895-5899. Chiou HY, ST Chiou, YH Hsu, YL Chou, CH Tseng, ML Wei, CJ Chen. 2001. Incidence of transitional cell carcinoma and arsenic in drinking water: a follow-up study of 8,102 residents in an arseniasis-endemic area in northeastern Taiwan. Am. J. Epidemiol. 153(5)411-418.
Chowdhury et. al. 2001. “Groundwater Arsenic Contamination and Human Suffering in West Bengal - India and Bangladesh.” Environmental Sciences 8(5), 2001, pp. 393-415.
Duxbury JM, AB Mayer, JG Lauren, N. Hassan. 2003. “Food chain aspects of arsenic contamination in Bangladesh: Effects on quality and productivity of rice.” in Journal of Environmental Science and Health, Vol. A38, No. 1, pp.61-69.
Ershow and Cantor. 1989. Total Water and Tapwater Intake in the United States: Population-Based Estimates of Quantities and Sources. As cited in U.S. EPA 1997.
Ferreccio C, C Gonzales, V Milosavlijevic, G Marshall, AM Sancha, and AH Smith. 2000. Lung cancer and arsenic concentrations in drinking water in Chile. Epidemiology 11(6):673-679. Hopenhayn,C.; Ferreccio, C.; Browning, S.R.; Huang, B. Peralta, C.; Gibb, H.; and Hertz-Picciotto, I. 2003. Arsenic Exposure from Drinking Water and Birth Weight. Epidemiology. 14:593-602. Institute of Medicine of the National Academies (2004). Dietary reference intakes: water, potassium, sodium, chloride and sulfate. National Academies Press, Washington, DC.
Lamm SH, Byrd DM, Kruse MB, Feinleib M, Lai S. Bladder Cancer and Arsenic Exposure: Differences in the Two Populations Enrolled in a Study in Southwest Taiwan. Biomedical and Environmental Sciences 2003; 16:355-368
Lamm SH, Engel A, Kruse MB, Feinleib M, Byrd DM, Lai S, Wilson R. Arsenic in Drinking Water and Bladder Cancer Mortality in the U.S.: An analysis based on 133 U.S. counties and thirty years of observation. Journal of Occupational and Environmental Medicine 2004; 46(3):298-306
Lewis DR, JW Southwick, R Ouellet Hellstrom, J Rench, and RL Calderon. 1999. Drinking water arsenic in Utah: a cohort mortality study. Environmental Health Perspectives 107(5):359-365.

DRAFT Material
30
Morales KH, L Ryan, TL Kuo, MM Wu, and CJ Chen. 2000. Risk of Internal Cancers from Arsenic in Drinking Water. Env. Health Persp. V108, n7, July 2000.
Mushak P and AF Crocetti, 1995. Risk and revisionism in arsenic cancer risk assessment. Environ. Health Perspect. 103 (7-8):684-689.
NRC, 1999. Arsenic in Drinking Water. Washington, DC: National Academy Press.
NRC, 2001. Arsenic in Drinking Water: 2001 Update. Washington, DC: National Academy Press.
Roychowdhury T, T Uchino, H Tokunaga, and M. Ando. 2002. Survey of arsenic in food composites from an arsenic-affected area of West Bengal, India. Food and Chemical Toxicology 40:1611-1621.
Schoof RA, LJ Youst, E Crecelius, K Irgolic, W Goessler, HR Guo, and H Greene. 1998. Dietary arsenic intake in Taiwanese districts with elevated arsenic in drinking water. Human and Ecological Risk Assessment 4(1):117-135.
SEER (Surveillance, Epidemiology, and End Results). 2001. Surveillance, Epidemiology, and End Results Program Public-Use Data (1973-1998), National Cancer Institute, DCCPS, Surveillance Research Program, Cancer Statistics Branch. [Online]. Available: http://www-seer.ims.nci.nih.gov/Publications/ [August 20, 2001]
Steinmaus C, Yuan Y, Bates M, Smith A. Case-Control Study of Bladder Cancer and Drinking Water Arsenic in the Western United States. American Journal of Epidemiology 2003; 158:1193-1201
Tsai SM, TN Wang, and YC Ko. 1999. Mortality for certain diseases in areas with high lvels of arsenic in drinking water. Arch. Enivron. Health 54(3):186-193.
Tollestrup K, Frost FJ, Harter LC, McMillan GP. Mortality among children residing near the American Smelting and Refining Company (ASARCO) copper smelter in Ruston, Washington. Arch Environ Health. 2003 Nov;58(11):683-91.
U.S. EPA. 1980. Water Quality Criteria Documents Availability. November 28, 1980 Federal Register (45 FR 79318).
U.S. EPA. 1988. Special Report on Ingested Inorganic Arsenic: Skin Cancer; Nutritional Essentiality. EPA/625/3-87/013.
U.S. EPA. 1989. Report on Arsenic Work Group Meetings. From Charles Abernathy, William Marcus, Chao Chen, Herman Gibb, and Paul White to Peter Cook and Peter Preuss. February 23, 1989.
U.S. EPA. 1992. Water Quality Standards; Establishment of Numeric Criteria for Priority Toxic Pollutants; States’ Compliance; Final Rule. December 22, 1992 Federal Register (57 FR 60848).
U.S. EPA. 1997. Exposure Factors Handbook: Volume I – General Factors. EPA/600/P-95/002Fa. August 1997. Office of Research and Development. National Center for Environmental Assessment.
U.S. EPA. 1999. Draft Guidelines for Carcinogen Risk Assessment. NCEA-F-0644. July 1999. Review draft. Available at www.epa.gov/ncea/raf/pdfs/cancer_gls.pdf.
U.S. EPA. 2001a. National Primary Drinking Water Regulations; Arsenic and Clarifications to Compliance and New Source Contaminants Monitoring; Final Rule. January 22, 2001 Federal Register (66 FR 6976).
U.S. EPA. 2001b. Arsenic Rule Benefits Analysis: An SAB Review. A Review by the Arsenic Benefits Review Panel (ABRP) of the U.S. EPA Science Advisory Board (SAB) EPA-SAB-EC-01-008.

DRAFT Material
31
U.S. EPA. 2003a. Notice of Availability and Opportunity to Provide Comment on the Draft Final Guidelines for Carcinogen Risk Assessment and the Draft Supplemental Guidance for Assessing Cancer Susecptibility from Early-Life Exposure to Carcinogens. March 3, 2003 Federal Register (68 FR 10012).
U.S. EPA. 2003b. Draft Final Guidelines for Carcinogen Risk Assessment. EPA/630/P-03/001A. NCEA-F-0644A. February 2003. Available at www.epa.gov/ncea/raf/cancer2003.htm.
U.S. EPA. 2003c. Supplemental Guidance for Assessing Cancer Susceptibility from Early-Life Exposure to Carcinogens. EPA/630/R-03/003. External Review Draft. February 2003. Available at www.epa.gov/ncea/raf/cancer2003.htm.
U.S. EPA. 2004. Estimated Per Capita Water Ingestion in the United States—An Update. Based on Data Collected by the United States Department of Agriculture’s (U.S.DA) 1994-1996 and 1998 Continuing Survey of Food Intakes by Individuals. EPA-822-00-001. Office of Water, Office of Standards and Technology, U.S. Environmental Protection Agency. October 2004.
U.S. EPA. 2005a. Guidelines for Carcinogen Risk Assessment. EPA/630/P-03/001F March 2005. Available at http://cfpub.epa.gov/ncea/cfm/recordisplay.cfm?deid=116283
U.S. EPA. 2005b. Supplemental Guidance for Assessing Susceptibility from Early-Life Exposure to Carcinogens. EPA/630/R-03/003F March 2005. Available at http://cfpub.epa.gov/ncea/cfm/recordisplay.cfm?deid=116283
Waalkes, M.P.; JM Ward, J Liu and BA Diwan 2003. Transplacental carcinogenicity of inorganic arsenic in the drinking water: induction of hepatic, ovarian, pulmonary, and adrenal tumors in mice. Toxicology and Applied Pharmacology: 186:7-17
Watanabe et al 2004. Water intake in an Asian population living in arsenic-contaminated area. Toxicology and Applied Pharmacology. 198:272-282
Yang TI and RQ Blackwell (1961). Nutritional and environmental conditions in the endemic blackfoot area. Formosan Science. Volume 15, number 3, pages 101 - 129.
You SL, TW Huang, and CJ Chen. 2001. Cancer registration in Taiwan. Asian Pacific J. Cancer Prev. 2(IACR suppl.): 75-78.
Chen CL, Hsu LI, Chiou HY, Hsueh YM, Chen SY, Wu MM, Chen CJ. Ingested arsenic, cigarette smoking, and lung cancer risk follow-up study in arseniasis-endemic areas in Taiwan. JAMA. 2004 Dec 22;292(24):2984-90.