issue 22 - EPRA
44
ISSUE 22 EPRA NEWS - ISSUE 22 GUEST EDITOR Mark Cooper % CALM BEFORE THE STORM FEATURES % INTERVIEW WITH GUILLAUME POITRINAL % REAL PROPERTY INVESTMENT LAW IN NEW EUROPE % ISLAMIC REITS % MANY OPPORTUNITIES ABROAD FOR INVESTORS MARKET FOCUS % GLOBAL LISTED PROPERTY UNIVERSE % MARKET OVERVIEW – FIRST QUARTER 2007 % EUROPEAN ANALYST COVERAGE % CITYCON: AN EXPANDING RETAIL PROPERTY EXPERT
Transcript of issue 22 - EPRA

i ss u e 22
EPRA
NEW
S -
ISSU
E 22
guest editor Mark Cooper% Calm before the storm
features
% IntervIew wIth GuIllaume PoItrInal% real ProPerty Investment law In new euroPe% IslamIC reIts% many oPPortunItIes abroad for Investors
market focus
% Global lIsted ProPerty unIverse% market overvIew – fIrst Quarter 2007% euroPean analyst CoveraGe% CItyCon: an exPandInG retaIl ProPerty exPert

As at 16 June 2007
EPRA MEMBERSAustrAliA
•OrchardFundsManagement
•Univ.ofWesternSydney,PropertyResearchCentre
•ValadPropertyGroup
•VanguardInvestmentsAustralia
AustriA
•CAImmobilienAnlagen
•conwertImmobilienInvest
•Immoeast
•ImmofinanzImmobilienAnlagen
•MeinlEuropeanLand
•Warimipex
Belgium
•Befimmo
•Cofinimmo
•LeasinvestRealEstate
•Petercam
•SolvayBusinessSchool
CAnAdA
•OxfordPropertiesGroup
•Presima(CDPCapital)
FinlAnd
•Citycon
•CREFCenterforRealEstateInvestment&Finance/Hanken
•KTIFinland
•Sponda
FrAnCe
•AcantheDeveloppement
•Affine
•AXAREIMFrance
•BNPParibas
•E.M.G.P.
•FoncièredesRégions
•FoncièreParisFrance
•Gecina
•Klépierre
•Mercialys
•OrcoPropertyGroup
•Silic
•SociétédelaTourEiffel
•SociétéFoncièreLyonnaise
•SociétéGénérale
•Unibail
•UniversitéParisDauphine
germAny
•AlstriaOffice
•BeitenBurkhardt
•ColoniaRealEstate
•DBRealEstateInvestment
•DeutscheEuroshop
•DeutscheWohnen
•DICAsset
•EurocastleInvestment
•GBWAGBayerischeWohnungs-Aktiengesellschaft
•Heitman
•HSHNordbank
•HypoVereinsbank
•IRE|BSImmobilienakademie
•IVGImmobilien
•PATRIZIAImmobilien
•Rothschild
•SEBAssetManagement
•TAGTegernsee
•Viterra
•Vivacon
•WestLB
greeCe
•BabisVovos–International
ConstructionGroup
•EurobankPropertiesREIC
•LamdaDevelopment
Hong Kong
•HongkongLand
•UniversityofHongKong,Dept.ofRealEstate&Construction
isrAel
•Gazit-Globe
itAly
•Aedes
•BeniStabili
•IGD
•Pirelli&C.RealEstate
•Risanamento
netHerlAnds
•ABN-AMROAssetManagement
•ABPInvestments
•AMBPropertyEurope
•AmsterdamSchoolofRealEstate
•BPFBouwinvest
•CBRichardEllis
•CITCO
•CliffordChance
•CordaresRealEstate
•Corio
•DeloitteRealEstate
•DoctorsPensionFunds
•Ernst&YoungEuropeanRealEstateGroup
•EurocommercialProperties
•FortisInvestmentManagement
•Kempen&Co
•KPMGAccountants
•LaSalleInvestmentManagement
•Loyens&Loeff
•MNServices
•NIBCBank
•NieuweSteenInvestments
•PGGM
•PhilipsPensionFund
•PricewaterhouseCoopers
•ProLogis
•RedevcoEuropeServices
•RodamcoEurope
•SpazioInvestment
•SPFBeheer
•UniversityofMaastricht
•VastNedGroup
•Wereldhave
norwAy
•NorwegianProperty
russiA
•EasternPropertyHoldings
•SistemaHals
singApore
•GICRealEstate
•KeppelLand
•NationalUniversityofSingapore,Dept.ofRealEstate
spAin
•InmobiliariaColonial
•Metrovacesa
•ParquesolInmobiliariayProectos
•RentaCorporaciónRealEstate
•ReyalUrbis
•TESTA(GrupoSacyrVallehermoso)
sweden
•Castellum
switzerlAnd
•AllrealHolding
•CUREM
•PSPSwissProperty
•Sal.OppenheimRealEstate
•SwissPrimeSite
•ZüblinImmobilienHolding
united ArAB emirAtes
•AbuDhabiInvestmentAuthority
united Kingdom
•AllcoFinance
•AMPCaptialReddingInvestors
•AssetValueInvestors
•BarclaysGlobalInvestors
•BDOStoyHayward
•BigYellowGroup
•BerwinLeightonPaisner
•BritishLand
•Brixton
•CambridgePlaceIM
•Capital&Regional
•CassBusinessSchool
•Citigroup
•CreditSuisseFirstBoston
•DerwentLondon
•DeutscheBank
•DTZInternational
•EuroHypo
•GoldmanSachs
•GraingerTrust
•Hammerson
•HelicalBar
•HendersonGlobalInvestors
•HinesEurope
•HSBCBank
•InvistaFoundationProperty
•JPMorgan
•JPMorganCazenove
•LandSecurities
•LehmanBrothers
•LibertyInternational
•Linklaters
•Lovells
•M3CapitalPartners
•MapeleyEstates
•MerrillLynch
•MorganStanley
•MorleyFundManagement
•Moody’sInvestorsService
•NabarroNathanson
•PrincipalGlobalInvestors
•QuintainEstates&Development
•Safestore
•Schroders
•Shaftesbury
•SEGRO
•SpeymillGroup
•StandardLifeInvestments
•ThamesRiverCapital
•UBSInvestmentBank
•UKBalancedPropertyTrust
•UKCommercialPropertyTrust
•UniversityofCambridge,Dept.ofRealEstate
•UniversityofReading,CentreforRealEstateResearch
•WarburgPincus
•WestfieldGroup
•WorkspaceGroup
usA
•Archstone-Smith
•AEWCapitalManagement
•CherokeeINvestementServices
•Cohen&SteersCapitalMgmt
•CornerstoneRealEstateAdvisors
•EuropeanInvestors
•FidelityMgmt&Research
•ForumPartnersIM
•FranklinTempletonInvestments
•GEMRealtyCapital
•INGClarionRealEstateSecurities
•KensingtonInvestmentGroup
•MercuryPartners
•MITCenterforRealEstate
•TheOhioStateUniversity
•TabernaRealtyFinanceTrust
•RealFoundations
•RussellInvestmentGroup
•SimonPropertyGroup
•SNLFinancial
•TheTuckermanGroup
•TheWhartonSchool,Zell-LurieRealEstateCenter,
Univ.ofPennsylvania

July 2007, issue 22
GUEST EDITORCalm before the storm . . . . . . . . . . . . . . . . . . . . . . . . . . . . . . . . . . . . . . . . . . . . . . . . . . . . . . 4
NEWSIn the news . . . . . . . . . . . . . . . . . . . . . . . . . . . . . . . . . . . . . . . . . . . . . . . . . . . . . . . . . . . . . . . . . . . 6
FEATURESInterview with Guillaume Poitrinal . . . . . . . . . . . . . . . . . . . . . . . . . . . . . . . . . . . . . . .8
The status of Real Property Investment Law in New Europe . . . . . . . . . . 10
Islamic REITs . . . . . . . . . . . . . . . . . . . . . . . . . . . . . . . . . . . . . . . . . . . . . . . . . . . . . . . . . . . . . . . . 12
G-REITs without residential real estate:
many opportunities abroad for investors . . . . . . . . . . . . . . . . . . . . . . . . . . . . . . . . 14
MARKET FOCUSREITs within the context of the Global Listed Property Universe . . . . . . 16
EPRA Sees Global Real Estate Coalition Emerging
Over Accounting Rules . . . . . . . . . . . . . . . . . . . . . . . . . . . . . . . . . . . . . . . . . . . . . . . . . . . . . 19
Market Overview – First Quarter 2007 . . . . . . . . . . . . . . . . . . . . . . . . . . . . . . . . . . . 20
Unibail . . . . . . . . . . . . . . . . . . . . . . . . . . . . . . . . . . . . . . . . . . . . . . . . . . . . . . . . . . . . . . . . . . . . . . 24
European Analyst Coverage . . . . . . . . . . . . . . . . . . . . . . . . . . . . . . . . . . . . . . . . . . . . . . . .26
Citycon - An Expanding Retail Property Expert . . . . . . . . . . . . . . . . . . . . . . . . . . .32
REFERENCEFTSE EPRA/NAREIT Global Real Estate Indices . . . . . . . . . . . . . . . . . . . . . . . . . 34
Working Committees . . . . . . . . . . . . . . . . . . . . . . . . . . . . . . . . . . . . . . . . . . . . . . . . . . . . . . 40
Annual Conference 2007 . . . . . . . . . . . . . . . . . . . . . . . . . . . . . . . . . . . . . . . . . . . . . . . . . . 42
CONTENTSCREDITS
GUEST EDITORMark Cooper, Europroperty
ARTICLE CREDITSMarcus Cieleback, EurohypoCharles Cruden & Jacques de Servigny, Gide Loyrette NovelGerard de Gunzburg, M3 Capital PartnersMike Grupe, NAREITSteve Hays, Bellier FinancialHanna Jaakkola, CityconHarm Meijer & Osmaan Malik, JPMorganAlex Moss, AME CapitalAtasya Osmadi, University of Western SydneyGuilaume Poitrinal, UnibailSandra Steel, FTSE
DESIGN & LAYOUTLen Shape – info@lenshape .nl Marek Maakt – mm@marekmaakt .nl
PRINTINGSmiet-Offset BV, Den Haag
FROM EPRA
Welcome to the 22nd edition of EPRA News
We are in the thick of our preparations for the
8th annual conference on 6 & 7 September
2007 in the Hotel Grande Bretgne, Athens,
Greece . We have now closed the opportunity
to sponsor the conference . We closed sponsor-
ship at eight headline and 24 standard spon-
sors . Unfortunately, anyone wishing to sponsor,
must now wait for the 2008 conference in
Dublin . A full list of sponsors can be found
in the conference section of the newsletter,
under the ‘Reference’ section . In addition, as
most people are aware, we limit the delegate
number to 250 . We are rapidly approaching
80% of this capacity, and the Grande Bretgne
is fully booked . This incredible level of support
clearly means that the conference is clearly well
respected in the industry and members appre-
ciate the work we are doing of their behalf .
As always, we would like to encourage members
to get involved with the publication and come
forward with suggestions for contributions and
articles . We must ensure the newsletter is both
topical and interesting for the reader .
Please send your comments and suggestions
to: info@epra .com

� epra news - july 2007 - www.epra.com
EuroProperty is Europe’s leading commercial
real estate investment magazine. Published
twice a month, it focuses on cross-border busi-
ness, tracking deals, M&A activity and fund
launches across Europe.
Mark Cooper is group editor of EuroProperty.
Prior to this he spend a year as editor of IPE
Real Estate magazine. He has eight years
experience in real estate journalism, starting
his career with the Estates Gazette in the UK.
’ ContactMark Cooper
Group Editor
EuroProperty
Tel: +44 (0)20 7911 1845
Mob: +44 (0) 7795 657 066
Fax: +44 (0)20 7911 1900
1 Procter Street
London WC1V 6EU
Mark CooperGroup editor of
EuroProperty
Are we to see a wave of private equity takeovers in the European listed prop-
erty sector, following a couple of years of take-private transactions in the US? Or more mega-mergers such as the swallowing of Rodamco Europe by Unibail?
Prior to the introduction of the UK REIT, many commentators predicted a rush of mergers as the new REITs jostled to find their place in the market, to achieve signifi-cant scale and to attract international share-holders. Overall, there has been rather less M&A activity in the European market than might have been expected. In fact, European real estate stocks have performed pretty sluggishly since the start of the year, pro-ducing a -0.79% return in the year to May – surely not the sign that the market is expecting a wave of takeovers.
Since the flurry of activity in the SIIC sector a few years ago and in Spain, there has been fairly little activity other than Derwent Valley’s acquisition of London Merchant Securities and the Unibail/Rodamco Europe deal. Since then Foncière des Régions has announced its intention to merge with Beni Stabili, so we may be seeing the start of a trend.
However, compared with the massive priva-tisation drive in the US, where the take-pri-vates of Equity Office Properties and Archstone-Smith alone took more than $50bn of property out of the public markets, there has been almost nothing in Europe. This seems rather odd, especially as the growth prospects in continental Europe are much stronger than in the US. The big private equity players involved in REIT take-privates in the US all have very significant operations in Europe. And they all have plenty of cash to play with.
One reason why private equity players are not taking on big M&A deals may also explain why European companies are not getting involved in consolidation. A significant amount of attention and capital has been turned towards the east and the developing markets of eastern Europe and Russia.
Rather than looking for western European companies to buy, players like Morgan Stanley are investing in ventures in Russia and the east. Similarly, companies which have raised significant chunks of equity, such as Immoeast and Meinl European Land, have been raising it to expand eastwards.
It may also be that European REITs and other listed property companies are just too expen-sive. US REITs and their portfolios tend to be higher yielding than European companies. The most attractive continental European REITs tend to trade at a premium to net asset value so there’s little chance of picking them up on the cheap, although finance costs on the continent are still low to enable highly-geared players to leverage the stuffing out of a portfolio. However, that they are not doing it suggests they are cautious on the pros-pects of value growth in core European markets.
However, a company with a strong develop-ment pipeline could be worth buying in to as standing investments could be sold into a still-hot market in order to focus on the added value development business. Analysts canvassed by EuroProperty for a recent article said the strength of Hammerson’s development pipeline is one of the reasons it has been the most talked-about takeover target. The only question is whether its board and shareholders would let it go at a price to suit a private equity buyer.
The other UK majors have generally been trading at a discount to net asset value of at least 10%, which could offer opportunities. However, it’s fairly unlikely that any buyer could pick these companies up even at net asset value. Derwent Valley bought London Merchant Securities for a 30% premium to net asset value so it’s pretty clear there’s nothing going cheap. Nonetheless, most of the analysts EuroProperty spoke to still reckon a private equity buyout of a UK major is likely this year.
The full price Derwent paid was a reflection of how important London Merchant Securities was to its plans to become a significant
Calm before the storm
By: Mark Cooper
guest editor

www.epra.com - july 2007 - epra news �
guest editor
Calm before the storm
central London REIT. And it is this desire to create sector-dominating businesses which will drive merger activity in the European listed sector in the next few years.
The pace of this activity will inevitably be fairly slow as the companies involved are large and bids take time to assemble. However, there is a real opportunity for com-panies with big ambitions in the region to position themselves for the long term.
From a pricing point of view, it’s probably the wrong time to start buying, but from a strategy point of view, it’s unlikely to be better. Sentiment is good and shareholders will be happy to sanction big plans. Continental European players have a big advantage here: their ratings are higher and they have access to cheaper debt. Picking up their peers on either side of the Channel could be relatively straightforward.
But what about the UK majors? They have been the most significant companies in the European sector but, apart from Hammerson and SEGRO, have little presence outside the UK. The recent sluggish performance of the UK market may protect some of them, but also prevent them from expanding on the continent. There’s no reason of course why a UK company shouldn’t remain a UK company,
but if it does it won’t be a major in the future. They’ll be more like those US REITs which specialise in the West Coast or other regions. In an increasingly integrated Europe, the future giants will be sector specialists with cross-border presence.
This will not just be scale for the sake of it, but the scale to service global occupiers, the country diversification to offset cycles and most importantly, the room to grow and develop as Europe grows and develops.
Unibail has made a strong start with the Rodamco acquisition – it now has a significant retail weighting and a genuinely pan-European business. It would make sense to develop the business in that direction. However, Foncière des Régions remains very diversified – a col-lection of different businesses. The US experi-ence would suggest that this will change and non-core business lines like residential and hotels must eventually be spun off.
While the management teams of sector-diversified companies generally tend to press the benefits of the current way of things, such as the ability to ride the downturn in one sector by focusing on another, the evi-dence is that shareholders – particularly big REIT funds – like sector specialisation. And it is these shareholders who will take the
market forward across the world. Mini-con-glomerates will not survive in property. On the other hand, a company like Derwent London can remain as a significant niche player with scale in its specialist market.
But what about Land Securities or British Land. Both companies have done well in recent times, but it seems inevitable that they will be broken up into their distinct business lines. In fact, it would make sense for them to swap their diverse business lines, so Land Securities would take on British Land’s retail assets while BL swallow LandSec’s office business.
But if either company wants to be a truly sig-nificant European player in the future, it will have to cross the channel in a significant way. This might seem difficult and expensive, but if LandSec sold off its office assets and Trillium, for example, it would have a pretty significant cash pile for buying businesses in continental Europe. However, that’s a pretty serious step for management to take; it is more likely that LandSec and companies like it will carry on as they are until shareholder pressure breaks them up.
Those companies with a significant foothold outside their domestic market, however, have a real chance to be the big names of the future. $
The Chicago skyline, home to Blackstone’s newly acquired Equity Office empire.

� epra news - july 2007 - www.epra.com
news
In the news
EPRA’s Travels
Nick and Fraser traveled to the NAREIT Investor conference in New York at the
beginning of June and following this Nick flew alone to Montreal to speak to Canadian investors. The amount of interest generated by North American investors for global listed real estate continues to be strong. Nick also made trips to the OECD meeting in Sydney in
FTSE EPRA/NAREIT Developments
There are a number of recent developments with FTSE EPRA/NAREIT. Please see below:
• The Launch of FTSE EPRA NAREIT Europe REIT index (scheduled for June 25th): Created in response to market demand, the FTSE EPRA/NAREIT Europe REITs and Non-REITs indices will enhance the FTSE EPRA/NAREIT index series, and reflect all of Europe’s developed markets. These real time indices, will be calculated on a daily basis, every 15 seconds and will be of interest to institutional investors in real estate securities who want to differenti-ate between Europe REITs and Europe Non-REITs.
• BGI Launched iShares FTSE EPRA/NAREIT UK Property Fund (Listed on LSE) on 20 March 2007.
• The FTSE EPRA/NAREIT Capped indices were launched on 20 June to enhance the EPRA/NAREIT product range, and to create new indices which meet the UCITs III requirements (no weightings above 10%). $
EPRA Membership hits 201
Membership numbers continue to rise. Since the last edition in March we have
welcomed nine new members from nine dif-ferent countries. New members for this period are: Alstria Office (Austria), Cornerstone (United States), Eurobank Properties (Greece), Fonciere Paris France (France), GBWAG (Germany), Norwegian Properties (Norway), Orchard Fund Management (Australia), Parquesol (Spain) and University of Maastricht (Netherlands). A full membership list is located on page 2 of the newsletter. $
ing carbon footprint in 2007. To round things off, Fraser spoke at the IPF property course in London on two separate occasions in April and June. $
eprA has appointed philip Charls (58), currently general manager of the dutch Chamber of Commerce for Belgium and luxembourg, as its new Chief executive officer, with effect from october 1st, 2007.
He succeeds Nick van Ommen (60) who has led EPRA as Chief Executive Officer since May 2000, following the association’s inception in October 1999.
“I am delighted at Philip’s appointment and confident he will build on EPRA’s success in the future, due to his broad managerial and financial market experience, and through working closely with the association’s com-mittees,“ Van Ommen said.
April to discuss international tax issues, the BPF REIT conference in London, and he gave presentations at the Vienna real estate exhi-bition and the Milan real estate conference in May. In June he attended the Morgan Stanley conference in London and scheduled two days of one-on-ones. I am afraid Al Gore would be horrified at Nick’s rapidly expand-
“The tax harmonisation of Real Estate Investment Trusts (REITs) between the U.S. and Europe, the planned launch of deriva-tives on the FTSE/EPRA NAREIT real estate indices this year, and the expansion of coop-eration with our partner associations -- NAREIT in the U.S. and APREA in Asia, are just some of the key areas we are working on,” he added.
Philip Charls has held his position at the Dutch Chamber of Commerce since 2001 and prior to that was Chief Executive Officer of RVS-Insurance Belgium, part of the ING Group, for seven years.“I’m looking forward to joining such an internationally diverse and dynamic organi-sation as EPRA, operating in one of the most
exciting investment sectors, as the growth in real estate stocks around the world has been phenomenal in recent years. I trust the team will meet to the expectations set by the industry for the coming years,” Charls said. $
EPRA appoints Philip Charls as new Chief Executive Officer
Philip Charls
www.epra.com - july 2007 - epra news �
Michael R. Grupe is executive vice president for
Research and Investor Outreach at The National
Association of Real Estate Investment Trusts
(NAREIT). NAREIT is the trade association for
real estate investment trusts (REITs) and pub-
licly traded real estate companies with an
interest in the U.S. property and investment
markets. At NAREIT, he directs all research and
investor outreach activities related to industry
information, the analysis of industry perfor-
mance, the design and implementation of
membership surveys, communication with
investors, the media, policymakers and the
public, and support for the association’s Policy
& Politics agenda. He also acts as liaison to the
press on technical issues involving REIT indus-
try experience and practice.
Michael earned his Ph.D. degree in business-
statistics from The University of Wisconsin. He
is a member of the Urban Land Institute, the
American Real Estate Society and the Advisory
Board of the Real Estate Research Institute.
’ ContactNational Association of Real Estate Investment
Trusts
1875 Eye Street NW, Suite 600
Washington, DC 20006-5413
Tel: 202-739-9400 or 800-3-NAREIT
E-mail: [email protected]
Michael R. GrupeExecutive Vice President,
Research and Investor
Outreach
The National Association
of Real Estate Investment
Trusts
news
Ibbotson explored optimal global real estate allocations by creating and comparing the
performance of optimal portfolios based on two different methodologies: one that con-structed portfolio performance using histori-cal investment returns for various asset classes, and another that projected future portfolio performance using forward-looking, expected investment returns.
Ibbotson’s historical analysis of data for the period 1990-2005 showed the addition of global real estate allocations improved returns of global portfolios, with nearly all of that increase coming from U.S. real estate investment, according to Thomas Idzorek, Ibbotson Associates’ Vice President of Research and Product Development, and co-author of the study.
“The forward-looking analysis indicated that North American real estate should continue to be approximately half of the total real estate allocation in an optimized global portfolio and serve as a core component of the global market portfolio,” Idzorek said. “As compared with the optimized portfolio based on histori-cal data, future allocations to European and Asian real estate should increase. The forward-looking optimizations include significant allo-cations to Asian and European real estate. As always, the key is diversification.”
Real Estate Boosts Historical Portfolio ReturnsIbbotson created its historical models by charting risks and returns for various asset classes for the 1990-2005 period and con-structing optimized portfolios of moderate risk (defined by a volatility level of 10 percent) with and without global listed real estate. The real estate asset class was represented by the FTSE EPRA/NAREIT Global Real Estate Index, with its North American, European
and Asian sub indices. The researchers found that the optimized real estate allocations by region placed the bulk of investment in North America, because of its superior returns and lower volatility, with little allocation to Europe and none to Asia.
Modeling the FutureThe future performance of global real estate, however, is unlikely to be the same as that of the past. Consequently, Ibbotson constructed estimates of future investment returns for each asset class by blending historical returns with expected future returns. Importantly, the future return calculations took into con-sideration the historical levels of risk (volatil-ity) and correlation for each asset class and geographic region, based on the assumption that, over time, higher levels of risk will be commensurate with higher returns.
In Ibbotson’s unconstrained, forward-looking optimizations, allocations to global real estate range from 15 to 24 percent at the moderate-risk level (10 percent volatility). The allocations, however, were diversified among the world’s real estate markets.
“Approximately half of the real estate alloca-tion – 12.1 percent of the total portfolio – still went to North America,” said NAREIT Executive Vice President of Research and Investor Outreach Michael Grupe. “However, one-third of the forward-looking real estate allocation – 7.8 percent of the total portfolio – went to Europe, and 3.4 percent of the total portfolio went to Asian real estate.”
Additionally, Ibbotson’s forward-looking expected returns are more conservative when compared with historical investment performance. Including global real estate,
Ibbotson projected a 9.60 percent average total return for the optimal forward-looking portfolio, down from the 10.98 percent average annual return of the optimal his-torical portfolio.
“Ibbotson’s forward-looking results point to the growing importance of the European and Asian real estate markets for global investors – but also to the continuing importance of the North American market and the overall importance of real estate investment in a globally allocated longterm portfolio,” Grupe said. “However, they also may indicate that, going forward, investors may be required to assume more risk to achieve returns compa-rable to historical ones.” $ Ibbotson Report available from:www.epra.com
WASHINGTON, DC—At $4.6 trillion, income-producing commercial real estate – indirect and direct – is a major component of the global investment universe, and investors increasingly are globalizing their real estate allocations. The spread of the REIT approach to real estate invest-ment makes it easy and efficient for investors around the world to invest in other regions. At a time when many investors are diversifying abroad, the findings of a new Ibbotson Associates study, commissioned by NAREIT, serve as a reminder that a global real estate investment port-folio should be anchored with a significant allocation to North American real estate.
Ibbotson study underscoresImportance of real estate in global investment portfolios
Portfolio Optimization Study Points to Continuing Importance of North AmericanReal Estate Market; Growing Roles for Europe and Asia

� epra news - july 2007 - www.epra.com
features
FH: How and why did you decide get into real estate?GP: I entered the real estate market in 1995. After a few years with Morgan Stanley M&A department, Leon Bressler offered me an opportunity to join Unibail to head up the corporate development activities. I did not know anything about the sector, but I liked the CEO, the team and the company.
FH: Leon Bressler is a tough act to follow, how do you think you are doing? GP: Leon and I have worked together very closely for 12 years. In this context, this suc-cession is a continuation more than anything else. I accepted the job because I strongly believe in the future of the company, based on its backbone of advanced skills, unique positioning and development outlook.
FH: The Rodamco/Unibail deal means that you will lead the largest company in Europe. Did you envisage this when you took over?GP: Size is not the prime objective of the transaction. The prime objective is to deliver shareholder value based on the cross-fertil-ization of the knowledge and strengths of both companies. Unibail is primarily a devel-oper, in addition to an active property manager. However, Unibail is only active in France. On the other hand, Rodamco is a successful international investor: it has gath-ered a fantastic portfolio of large and unique shopping centres in the major European cities. Putting the two companies together - deploying an active management and devel-opment strategy on every asset should create outstanding value.
FH: For how long was the deal brewing?GP: Like any transaction that has a strong industrial sense, the idea of this combination has been “on and off” over the past decade. The pending evolution of the Dutch BI law and the support of a number of large share-holders make the transaction easier to implement today that it was in the past.
FH: How important was it for Unibail to diversify outside of the Paris/French market?GP: The idea for Unibail is not to diversify its holdings, but to create value. This combina-tion should create value, primarily on an
asset by asset basis. To achieve this objective, we will mobilise Unibail’s practice in large shopping centre management and develop-ment, which we started to built-up some 30 years ago. Moreover, the size of the com-bined entity will help us generate additional revenues. Our 95 shopping centres will be a very exciting development platform for any new or active retailer wishing to penetrate the European market. The flow of some 700 million visits per annum to our sites will be marketed to advertisers and any other players that want to get access to a large number of qualified customers.
FH: What synergies do you see and where will you need to make improvements in the Rodamco portfolio?GP: Our objective is to jointly build up one the best integrated operator-developer-investor companies in Europe, active in a selected number of underlying property markets, holding a major position in the large shopping centre segment. Historically, Rodamco has primarily focused on invest-ment, as opposed to management and development. As a result, we see many opportunities embedded into Rodamco current portfolio. In addition, there is many things to be carried out regarding Unibail’s assets. The new organization, relying on 5 strong local headquarters and one focused international headquarter, is designed to deliver this value creation.
FH: How do you see the future of your offices and Convention & Exhibition businesses?GP: The Paris office market is the most attrac-tive and robust office market in continental Europe and still has strong growth potential driven by the on-going market recovery and a high demand coupled with limited supply for prime office assets. Unibail’s outstanding development projects will foster further value creation, particularly in La Défense. The office business remains a major part of Unibail’s development, allowing the company to seize relevant opportunities on the European market.
Unibail will leverage its leadership in the French Convention & Exhibition market where it owns prime assets in Paris and La Défense. Furthermore, the merger project
Interview with Guillaume Poitrinal
Guillaume Poitrinal was appointed Chairman
& Chief Executive Officer in June 2006.
Aged 39 and father of three, Guillaume
Poitrinal joined Unibail in 1995 as a Project
Manager at the office of the Chief Executive. He
was promoted successively to Head of Corporate
Development and Planning, Chief Financial
Officer, Executive Vice President in charge of
Finance and the Office Division, and then
Managing Director in charge of all Divisions
and of Finance. Guillaume has been CEO since
April 2005.
Over the last ten years, in his different roles,
Guillaume Poitrinal has played a key part in
major external growth and development,
which are focal points of the Group’s history.
He has also been responsible for all operations
in the capital markets over this period.
Before joining Unibail, he spent three years in
mergers and acquisitions and corporate
finance departments at Morgan Stanley in
London and then in Paris. He is a graduate of
HEC Business School.
’ Contact Unibail
5 boulevard Malesherbes
75802 Paris Cedex 08
France
Tel: +33 53 437 437
www.unibail.com
Guillaume PoitrinalChairman & Chief
Executive Officer
By: Fraser Hughes

www.epra.com - july 2007 - epra news �
About Unibail/Rodamco EuropeCreating the pan-European commercial property leader
The no.1 commercial property company in Europe
• The no.1 portfolio of prime shopping centres with 10 out of the top 25 in Continental Europe
• A total combined property value of €21.7 billion and a presence in 14 European countries
A unique pan-European vision for value creation
• Combination of two industry success stories
• Implementing a single pan-European marketing and retail management strategy
• Sharing best practices and complementary skills in investment and retail management
• Leveraging Rodamco’s pan-European network and Unibail’s proven development skills
The no.1 commercial property developer in Europe
• At the forefront of retail innovation
• Acceleration of development opportunities across Europe
Further value creation opportunities in Paris Office market and Convention & Exhibition
Strong financial profile
Support from Rodamco and Unibail Management and Supervisory Boards
Support from Rodomco’s largest shareholder
features
with CCIP will create the European leader in the sector, with a growth potential from a unique portfolio of prime and complemen-tary assets, and open the door to new exten-sion opportunities. The merger should also accelerate the growth of the sector in France.
FH: Some analysts have expressed concerns that the enlarged group will be too big to outperform. How do you react to this?GP: Guess what....this is a question that we have fielded for the past 6 or 8 years regard-ing Unibail as a sole entity! In fact, there is only one way to make sure that a small or a large company outperforms: it must ensure that each underlying asset itself is outper-forming. If an asset is not positioned to deliver superior growth, the company should dispose of it. With this discipline, and a con-trolled number of assets, there is no reason why size should be an issue. Moreover, in the large shopping centres segment, size gives you a better access to new and existing retailers, to development and extension opportunities and to additional revenues. Size also allows you to develop advanced marketing skills and innovative ideas that can be deployed on the entire portfolio, sub-sequently resulting in a more attractive overall retail product.
FH: Name the three big challenges for the merged group in the short term.GP: The first challenge is obviously about organization. We expect to have the full new organization, including people and key pro-cesses, in place within three months. It does not appear to be too difficult given the quasi absence of overlap between the two busi-ness models.
The second challenge is to put all the assets “in motion”, with a real strategic value cre-ation vision for the next 5 years. To achieve this, many areas of expertise can be put in force, including leasing, marketing, refur-bishment and extensions.
The third challenge is to consolidate our development pipeline. We will start with 1.5 million m² of existing projects scheduled for delivery over the next 5 years. Beyond that, we believe that we can further rein-force our leadership in large shopping centre developments. There are still many opportunities in this segment, including the so-called “mature” western Europe markets.
FH: When you look at other property companies in the Europe, who do you most admire and why?GP: With the expansion of the REIT regimes throughout Europe, there is now a number of highly interesting investment opportuni-ties for investors - the investment choices are really there. My personal preference would go to focused, skilled, self managed compa-nies with a completely aligned interest between the investors and the executive team.
FH: Looking back, do you have any regrets?GP: No.
FH: What do you do in your spare time?GP: Nothing exceptional: family, music and sport. $
FH: On the whole, how do you feel the market has reacted to the Rodamco deal?GP: The share price has suffered somewhat since the announcement. One of the reasons for this is the significant market correction of the sector as a whole. Unibail, has under-performed the EPRA Europe Index by some 5 to 6%, which, I would argue is minimal for a change of this size.
FH: You are one of the youngest CEOs in the industry, with many years ahead of you. How do you expect the European landscape to develop over the next 10 years?GP: I am quite confident for those companies that have decided to focus on very strong market positions coupled with defined expertise. Value creation in the future will be primarily derived from operational skills. Finance will no longer be sufficient. Unibail-Rodamco is well positioned to fully benefit from this trend.
Interview with Guillaume Poitrinal

10 epra news - july 2007 - www.epra.com
features
The status of real property investment law in new Europe
Jacques de ServignyPartner
Jacques de Servigny is partner in charge of the
Budapest office of Gide Loyrette Nouel. He was
admitted to the Paris Bar in 1990. He has a DESS
(Master’s degree) in international tax law,
University of Paris XII (1989). He graduated from
HEC, Paris (1989). He has a DEA (Master’s degree)
in intellectual property (1987) and a Maitrise in
private law, University of Paris (1986).
’ Contact Office BudapestPhone: +36 1 411 7400
Fax: +36 1 411 7440
E-mail: [email protected]
Charles Scott CrudenSenior Associate
Charles Cruden is a senior associate in the Budapest
office of Gide Loyrette Nouel and a member of the
International Real Estate Practice Group. He has
practised real property investment law in Central
and Eastern Europe for over 5 years. He qualified
as a solicitor in 2001. He has a diploma in legal
practice, Exeter University (1999), a diploma in law,
Exeter University (1998), a M.A in history, Cambridge
University (2001) and a B.A. in history, Cambridge
University (1996).
’ Contact GLN Budapest Direct Phone: +36 1 411 7418
Phone: +36 1 411 7400
Fax: +36 1 411 7440
E-mail: [email protected]
“Perceived risk” is hindering the devel-opment of some New European prop-
erty markets. We have been advising inves-tors, banks and developers in New Europe since 1991. In general the legal frameworks of Bulgaria, Croatia, Czech Republic, Hungary, Montenegro, Romania, Russia, Serbia, Slovakia, Turkey and Ukraine permit institu-tional real estate investment. A short over-view of CEE countries highlighting specific juridical matters is produced in the following text.1
BulgariaThe Bulgarian commercial real estate market began in 2005. We are slightly concerned that the Bulgarian Law of Restitution is open to abuse. However, the restitution issue will eventually tail off due to a statute of limita-tion. An interesting twist is that a privatised state company may use the Law to claim the restitution of property that was nationalised from the company that was the predecessor of the state company that was privatised.
CroatiaThe implementation of the Croatian Construction Act 2003 will facilitate develop-ment in Croatia. The Lease and Sale of Business Premises Act 2004 and the Obligations Act 2005 have created a clear framework for commercial leases. The Financial Leasing Act 2006 creates the pos-sibility to financially lease real property.
Czech RepublicThe Czech Republic has a well established real property investment market. The early reorganization of the Czech cadastre in 1993 has facilitated the development of the market. The Building Act 2006, which entered into force on 1st January 2007, aims at improving the co-operation between the administra-tions involved in the authorisation process.
The Czech Commercial Leases Act 1990 created uncertainty as to whether the tenant had a pre-emption right if the landlord sold the property. In 2005 the legislator removed the ambiguity: a tenant does not have a stat-utory pre-emption right.
HungaryHungary is an often used jurisdiction in international real estate tax structures. Hungary benefits for an extensive network of double taxation treaties. The possibility of being able to obtain binding rulings from the tax authority greatly facilitates the cer-tainty of the Hungarian aspects of interna-tional tax structures.
MontenegroThe adoption by Montenegro of the EURO as its national currency has stabilized its economy. Like Bulgaria, Montenegro is tack-ling the past expropriation of real property without the payment of fair compensation. The Restitution Act 2004 enables former owners to seek restitution or reimburse-ment. The Act provides for a 10 year period in which to bring claims. We recommend a careful title due diligence to ascertain the risk of restitution claims.
PolandPoland has the most significant real property investment market in New Europe. In the coming years Russia, Ukraine and Turkey will be strong contenders. The perpetual usufruct is a form of title specific to the Polish legal system. It is commonly used in relation to real property held in full ownership by the State Treasury or local authorities. The per-petual usufruct is an ownership right for a limited duration in return for an annual fee. Local authorities are entitled to modify the annual fee each year. Sometimes adjust-ments lead to major disputes.
Capital is flooding into real estate investments. Private equity firms and pension funds are increasing their real estate allocations. Many sovereign funds are yet to make their first investments in New Europe. We are also seeing the first securitizations of New European properties. The weight of capital has changed investment profiles. The sheer weight of capital is having a positive effect in opening up new real estate markets and creating alternative asset classes across New Europe.
By: Jacques de Servigny and Charles Cruden

www.epra.com - july 2007 - epra news 11
features
RomaniaRomania has a dynamic real estate invest-ment market. Romanian law specifies that any deed pursuant to which a transfer of ownership takes place must be executed in notarised form under the pain of nullity. Deeds must be registered with the local bureau of the Office for Cadastral Works and Real Property Publicity in order to become binding against third parties.
RussiaIn some regions of Russia (including Moscow) the easiest way to obtain a development site is to lease it. However, the purchase of land is also possible in Moscow and is more advisable. As a rule a site is leased to an investor for 1 to 3 years (for the period of the design works and construction) and then a period such period is prolonged to 49 years after the building is constructed. We note that the owner of the building has an exclu-sive right to renew an agreement for the lease of a site underlying a building.
SerbiaIn Serbia real property investment is primar-ily focused on Belgrade. Unlike Bulgaria and Montenegro the law regulating full-scale restitution is yet to be enacted (possibly in 2007). Instead, persons have been granted usage rights over land owned prior to nation-alisation, while the State remains the actual
owner. The uncertainty of restitution is not preventing real estate investments; rather prudent investors are spending more on title due diligence to ascertain the risk.
SlovakiaSlovakia joined the EU on 1st May along with the Czech Republic, Hungary and Poland. However, the Slovak real property investment market did not receive as much investor atten-tion as the markets of the Czech Republic, Hungary or Poland. Slovakia responded quickly by abolishing transfer tax from 1st January 2005. Therefore, the sale of real prop-erty is not subject to transfer tax. This had a positive effect with investors and real estate investment in Slovakia has since quickened. Unfortunately, other countries in New Europe have not followed Slovakia’s lead and abol-ished transfer tax on real property.
TurkeyCo-ownership of real property is common in Turkey. It is also common for commercial property such as shopping malls to be co-owned in Turkey. Co-ownership reflects Turkish customs regarding the inheritance of land. In Istanbul the co-ownership of land has had an impact on the development of the real property investment market. If co-owners cannot agree on the use, sale or pos-session of the property, they may have to go to the court to resolve the matter in a parti-
tion action. As co-ownership is solved, Turkey will become an important real property investment market in the region.
UkraineSome investments in Ukraine have required innovative holding structures. The number of developers with track records in investment grade real estate is increasing. There were some exciting challenges as we implemented a western acquisition structure in the Ukraine. We used the laws of France and the laws of Ukraine to create a contractual framework that gave our client the comfort it needed to proceed with an acquisition.
Team approachA team approach is important to the success of any real estate transaction. Often commer-cial property investments require lawyers, accountants, tax advisers, valuers, environ-ment consultants and technical experts to perform due diligence. When different teams work together the investment process is facilitated. A due diligence that identifies the key risks and provides solutions will help any transaction to succeed. $
1 Jacques de Servigny and Charles Cruden are among the authors of “Real Property Investment Law” a set of 12 New European country reports published with REP Real Estate Publishers. Full reports available from Europe Real Estate (REP Real Estate Publishers): www.europe-re.com
The status of real property investment law in new Europe
The Kemlin, an old face in developing Moscow.

12 epra news - july 2007 - www.epra.com
features
Atasya Osmadi is a PhD student from Malaysia;
now at the University of Western Sydney doing her
research on REITs in Malaysia. She is also a lecturer
at Universiti Sains Malaysia, Penang.
Atasya OsmadiLecturer
Islamic REITs
LPTs have proven to be a very successful property investment vehicle in Australia, as well as REITs in the US. Recent years has also seen substantial growth in REITs around the world; particularly in Asia (Japan, Singapore, Hong Kong, South Korea) and in Europe (France, UK, Germany), with over US$600 billion in the global REIT markets. One unique development in this area is the establishment of the world’s first Islamic REITs in Malaysia, which include the principles of Sharia finance.
• Banks and Financial Institutions with riba (interest) base services.
In a situation where the property has tenants operating haram activities, the fund manager needs to perform some additional compliance assessments before acquiring the property for an Islamic REIT. They need to ensure that the total rental ratio from haram activities to the total turnover of the Islamic REIT in the current financial year should not exceed 20 percent. If it does exceed 20 percent, the SAC will advise against investing in such a property. The fund manager needs to be well-versed in differenti-ating halal and haram activities. In addition, the manager of an Islamic REIT has to ensure that all forms of investment, deposit and financing instruments comply with the Sharia principles. One of the key difference of Islamic financing system is they do not charge and pay interest.
The Islamic financial system is viewed to be advantageous to both sides of the capital provider and client as to embrace the concept of value-adding partnership, and profit and risk sharing. A few of the general Islamic finance laws that need to be followed includes the debt and cash money should not form 50% of the existing assets and debt to equity ratio of the company should not be more than 30:70%. Besides that, it has to use Islamic insurance to insure its property. However, conventional insurance is accept-able if Islamic insurance is unavailable. An Islamic REIT is also encouraged to partici-pate in forward sales or purchases of cur-rency with Islamic financial institutions. However, if the Islamic REIT deals with con-ventional financial institutions, it is permit-ted to participate in the conventional forward sales or purchases of currency. Figure 1 high-lights the differences between Islamic REITs and conventional REITs.
An Islamic REIT is also not permitted to own a property in which all the tenants operate only haram activities. It cannot be put into an Islamic REIT, even if the total rental complies with the 20% benchmark. In the case of accepting new tenants, tenants who operate fully haram activ-ities will not be allowed. By taking these factors into account, it is seen to be advantageous, as it encourages production of lawful commodi-ties and services and thus promotes ethical business and ethical investing.
By: Atasya Osmadi
Graeme Newell is professor of property investment
at the University of Western Sydney. He is actively
involved in property research and was strong links
to the property industry, both in Australia and inter-
nationally. Professor Newell is a member of the
EPRA Academic Circle and has previously prepared
research reports for EPRA on the diversification ben-
efits of European property stocks in portfolios.
The University of Western Sydney (UWS) has been
offering property degree programs for over 30
years. Over 500 students are currently doing prop-
erty programs at UWS. Many UWS property gradu-
ates are now leaders in the Australian property
industry, as well as internationally.
Graeme NewellProfessor of property
investment at the
University of Western
Sydney
With over US$600 billion in Islamic finance funds, Malaysia has a signifi-
cant role in Islamic finance; in particular, Malaysia is the world’s biggest issuer of Islamic debt, ahead of Bahrain, accounting for US$32 billion, or 60 per cent of all Islamic debt globally. Internationally, Malaysia dom-inates the Islamic bond market by account-ing for 84% of the total value of Islamic bonds issued globally. 85% of equity stocks traded on Bursa Malaysia are Sharia compli-ant. Although Islamic REITs are in the process of being established, Islamic funds have been well established, with a few of the major Islamic finance and property funds including Dubai Islamic Bank, Kuwait Finance House and Gulf Finance House.
Islamic REITs An Islamic REIT is a form of ethical invest-ment. Every single property transaction will be examined by the Sharia Advisory Council (SAC) of the Securities Commission (SC) to ensure full compliance with Islamic principles. The Islamic REIT guideline which compli-ments the existing Malaysian REIT guidelines allows Muslims to enjoy the benefits of con-ventional REITs, while being Sharia-compli-ant. This is seen to be more advantageous.
According to the guidelines, an Islamic REIT is permitted to own or purchase property in which the tenants operate mixed activities which are halal (permitted) and haram (not permitted), but with restrictions. Activities that are classified as haram as decided by the SAC are:
• Manufacturing or sale of haram products (i.e pork products, tobacco, alcoholic liquor, arms and ammunitions).
• Entertainment activities- cinema, pornog-raphy and any other obscene materials, hotels and resorts.
• Gambling.
• Conventional insurance companies.
• Stockbroking or share trading in non-Sharia compliant securities.
www.epra.com - july 2007 - epra news 13
features
Property Investment OpportunitiesIn the world of globalisation, there is a need for a global property investment strategy. These days, conventional foreign banks are adopting the concept of Islamic finance and offering a range of Islamic financial products (i.e. HSBC, Citibank, UBS). This indicates new expertise and new ideas locally and interna-tionally. This is an opportunity to join in the growth in this sector as Middle Eastern inves-tors are looking for safer places to invest their money which also offers superior return, as well as meeting the requirements of Sharia finance. Although the market for Islamic REITs is still small, there is plenty of room for further development. Support for this product is growing as Muslims become more concerned over the matter of a true Islamic regulation
and more investors are aware that they get better advantage with Islamic products. There is a promising global future for Islamic REITs as Dubai is also considering an Islamic REIT structure while Amanah Raya Bhd (the first Malaysian Government firm to form a REIT) plans to list its second real estate investment trust (REIT) in Malaysia and in Dubai. Implications for Property Investors in EuropeIn January 2007, REITs were introduced both in UK and Germany, adding to the existing form of REIT-like structures in Belgium, France and the Netherlands. Their entry to the REIT market is significant as it will increase liquidity and transparency to the international REIT market. Importantly, Islamic REITs are also considered to be a
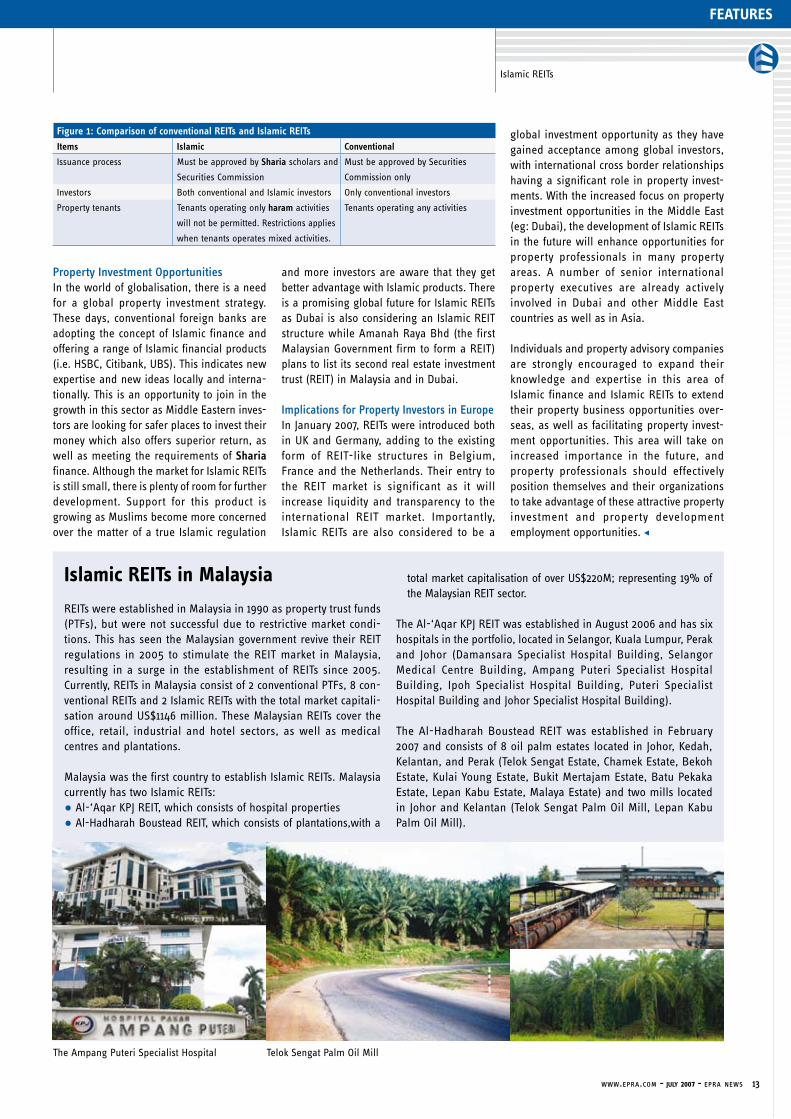
Figure 1: Comparison of conventional REITs and Islamic REITs
Items Islamic Conventional
Issuance process Must be approved by Sharia scholars and
Securities Commission
Must be approved by Securities
Commission only
Investors Both conventional and Islamic investors Only conventional investors
Property tenants Tenants operating only haram activities
will not be permitted. Restrictions applies
when tenants operates mixed activities.
Tenants operating any activities
Islamic REITs
Islamic REITs in Malaysia
REITs were established in Malaysia in 1990 as property trust funds (PTFs), but were not successful due to restrictive market condi-tions. This has seen the Malaysian government revive their REIT regulations in 2005 to stimulate the REIT market in Malaysia, resulting in a surge in the establishment of REITs since 2005. Currently, REITs in Malaysia consist of 2 conventional PTFs, 8 con-ventional REITs and 2 Islamic REITs with the total market capitali-sation around US$1146 million. These Malaysian REITs cover the office, retail, industrial and hotel sectors, as well as medical centres and plantations.
Malaysia was the first country to establish Islamic REITs. Malaysia currently has two Islamic REITs:
• Al-‘Aqar KPJ REIT, which consists of hospital properties
• Al-Hadharah Boustead REIT, which consists of plantations,with a
total market capitalisation of over US$220M; representing 19% of the Malaysian REIT sector.
The Al-‘Aqar KPJ REIT was established in August 2006 and has six hospitals in the portfolio, located in Selangor, Kuala Lumpur, Perak and Johor (Damansara Specialist Hospital Building, Selangor Medical Centre Building, Ampang Puteri Specialist Hospital Building, Ipoh Specialist Hospital Building, Puteri Specialist Hospital Building and Johor Specialist Hospital Building).
The Al-Hadharah Boustead REIT was established in February 2007 and consists of 8 oil palm estates located in Johor, Kedah, Kelantan, and Perak (Telok Sengat Estate, Chamek Estate, Bekoh Estate, Kulai Young Estate, Bukit Mertajam Estate, Batu Pekaka Estate, Lepan Kabu Estate, Malaya Estate) and two mills located in Johor and Kelantan (Telok Sengat Palm Oil Mill, Lepan Kabu Palm Oil Mill).
global investment opportunity as they have gained acceptance among global investors, with international cross border relationships having a significant role in property invest-ments. With the increased focus on property investment opportunities in the Middle East (eg: Dubai), the development of Islamic REITs in the future will enhance opportunities for property professionals in many property areas. A number of senior international property executives are already actively involved in Dubai and other Middle East countries as well as in Asia.
Individuals and property advisory companies are strongly encouraged to expand their knowledge and expertise in this area of Islamic finance and Islamic REITs to extend their property business opportunities over-seas, as well as facilitating property invest-ment opportunities. This area will take on increased importance in the future, and property professionals should effectively position themselves and their organizations to take advantage of these attractive property investment and property development employment opportunities. $
The Ampang Puteri Specialist Hospital Telok Sengat Palm Oil Mill

14 epra news - july 2007 - www.epra.com
features
The REIT Act does, however, come with a significant limitation with regard to
investment opportunities: the G-REIT may not or only to a limited extent invest in German residential property portfolios. This was a political compromise which makes little sense from an economic point of view. Analysis of the 15 largest stocks of the DIMAX in terms of market capitalisation shows that 9 of these companies hold considerable resi-dential property portfolios or focus entirely on residential real estate. So what alterna-tives exist for residential real estate investors if they cannot incorporate their portfolios into a G-REIT?
The existing stock corporations with large residential portfolios already demonstrate that there is a route to the stock market without incorporating German residential
Real Estate Investment Trusts (REITs) worldwide and their implementation
Source: Eurohypo RAC Research Source: Eurohypo RAC Research, Ellwanger & Geiger
DIMAX - top 15 in terms of market capitalisation
(as at 31.12.2006)
Market capitalisation in m EUR
% Gagfah 5,386
IVG Immobilien AG 3,775
% Patrizia Immobilien AG 1,069
% Deutsche Wohnen AG 1,030
Deutsche Euroshop AG 968
DIC Asset AG 874
% DIBAG Industriebau AG 612
% Colonia Real Estate AG 583
% GAG Gemeinnütz. AG f. Wohnungsbau Köln 562
% Vivacon AG 520
% GBWAG Bayerische Wohnungs-AG 458
% GBH Grundstücks- und Baugesellschaft AG 375
TAG Tegernsee AG 304
DGAG Deutsche Grundvermögen AG 289
Hamborner AG 263
% = AGs with large residential portfolios
By: Dr. Marcus Cieleback
Following often intense discussions between proponents and opposers of REITs, which almost led to a coalition row, the lower and upper houses of German government approved the law on the creation of German real estate stock corporations with listed shareholdings (REIT Act) at the end of March. For investors this has created a new possibility of indirect real estate investment, which fulfils international requirements in terms of fungibility and transparency and which has existed internationally for many years. This has taken the professionalisation of the German real estate market to a new level, which will be felt by all market participants. With their specific risk/return profile, G-REITs offer attractive entry and exit opportunities into and out of the real estate asset category, and not just for internationally active investors.
G-REITs without residential real estate: many opportunities abroad for investors
portfolios into the REIT Act. The high level of interest in easily tradable indirect real estate participations in German residential portfo-lios can be satisfied in other ways. Gagfah is an example of how a “quasi REIT” can be created with German residential property using a foreign holding. Other ways of satis-fying investor interest are listing on foreign stock exchanges via, for example, a SIIC (Société d’Investissements Immobiliers Cotées = French REIT, e.g. Fonciere des Regions) or on the alternative investment market in London (e.g. Puma Brandenburg). These vehicles represent an increasingly sig-nificant channel for the gathering pace of the secondary sales of residential portfolios.
The secondary sales show further ways of disposing of residential portfolios, for example, participation of professional, long-
term focussed asset managers or the creation of closed funds or special funds (e.g. LB Wohn-Invest, DCM GmbH & Co. Wohn-immobilien-Fonds 2 Berlin KG, ZBI 1 - 3). Tenant privatisation is also possible, but only sensible for sub-portfolios. Ultimately a mix of these strategies is possible or waiting until a residential G-REIT is introduced since incorporation of residential real estate makes sense in the long term from an economic point of view. The inverted route, which involves buying further portfolios to create a critical mass to enable a stock market flota-tion in Germany or abroad, is another pos-sible way. The latter currently appears to be the likely solution.
The analysis shows that German residen-tial portfolios can be traded in various ways, mostly in a highly liquid manner, even without the G-REIT. The current market capitalisation of the DIMAX is also dominated by companies with consider-able residential real estate portfolios. In the end, the exclusion of residential port-folios from the REIT Act has resulted in foreign holding structures or listing on foreign stock exchanges being significantly more attractive to investors. This can not be a long-term solution for the German capital market. $

www.epra.com - july 2007 - epra news 15
features
Since 2005 Dr. Marcus Cieleback is heading the
Research department in the Real Estate Appraisal &
Consulting division of Eurohypo AG. He studied eco-
nomics at the University in Freiburg and completed
his doctorate at the University of Bayreuth in 2001 in
the area of real estate finance. A year later he joined
MEAG, the asset management company Munich Re
Group. At MEAG, Dr. Cieleback was responsible for
the strategic real estate market analysis and com-
parative asset class studies. His focus at Eurohypo
includes the risk-based analysis and comparison of
global real estate markets and the development of
econometric models for forecasting the risks and
returns of the global markets. He is a frequent
speaker at international conferences and a pub-
lished author in various international magazines.
’ Contact EUROHYPO AG
Head of Research
Real Estate Appraisal & Consulting
Helfmann-Park 5, 65760 Eschborn
E-mail: [email protected]
Tel: +49 (0) 69 - 2548 - 21533
Fax: +49 (0) 69 - 2548 - 81533
Dr. Marcus CielebackHead of Research
G-REITs without residential real estate:
many opportunities abroad for investors
Trading of residential portfolios
1999
Source: AME Capital / Bloomberg
400000
350000
300000
250000
200000
150000
100000
50000
02000 2001 2002 2003 2004 2005 1st half 2006
Initial sales fo 800 units or more
Second sales of 800 units or more
Examples of investments in German residential portfolios by opportunistic investors and their exits
Notable primary portfolios /
companies
Company /
entity new
Investor Exit
Gagfah
Nileg
WOBA Dresden
Gagfah Fortress Listing via Luxembourg holding
Wohnungsbau Hoechst
and others
Deutsche Wohnen
AG
Deutsche Bank Listing
Viterra
Eisenbahnerwohnungen
RWE
BIG Heimbau AG
Deutsche
Annington
Terra Firma ? - speculation of a listing
WBG Jade and others WBG Jade and
others
Deutsche Bank/
Cerberus
Sale to Babcock & Brown / GPT
Group
ThyssenKrupp Immeo Wohnen Morgan Stanley/
Cerberus
Sale
(Fonciere des Regions) to Foncière
Développement Logement
Kieler Wohnungsbau
Gladbacher ABG
and others
Vitus Gruppe Blackstone Majority sale to a consortium
led by Deutsche Bank (including
Round Hill Capital and Morley Fund
Management)
DGAG DGAG B&L Immobilien/
HSH Nordbank
Majority sale to Pirelli Real Estate
GSW GSW Cerberus / Goldman
Sachs
?
BauBecon Holding BauBecon
Holding
Cerberus ?
GEHAG GEHAG Oaktree Capital
Management
?
Source: Eurohypo RAC Research
About EUROHYPO AGEurohypo AG is Europe’s leading spe-cialised bank for real estate and public sector financing. The bank is a member of the Commerzbank group.
Eurohypo has an excellent position in the global market: The Bank is a real estate finance providers with a pan-European presence, an established unit in the USA and the leader in European real estate investment banking. The bank also establishes its corporate finance business in asia.
16 epra news - july 2007 - www.epra.com
0
200
400
600
800
1000
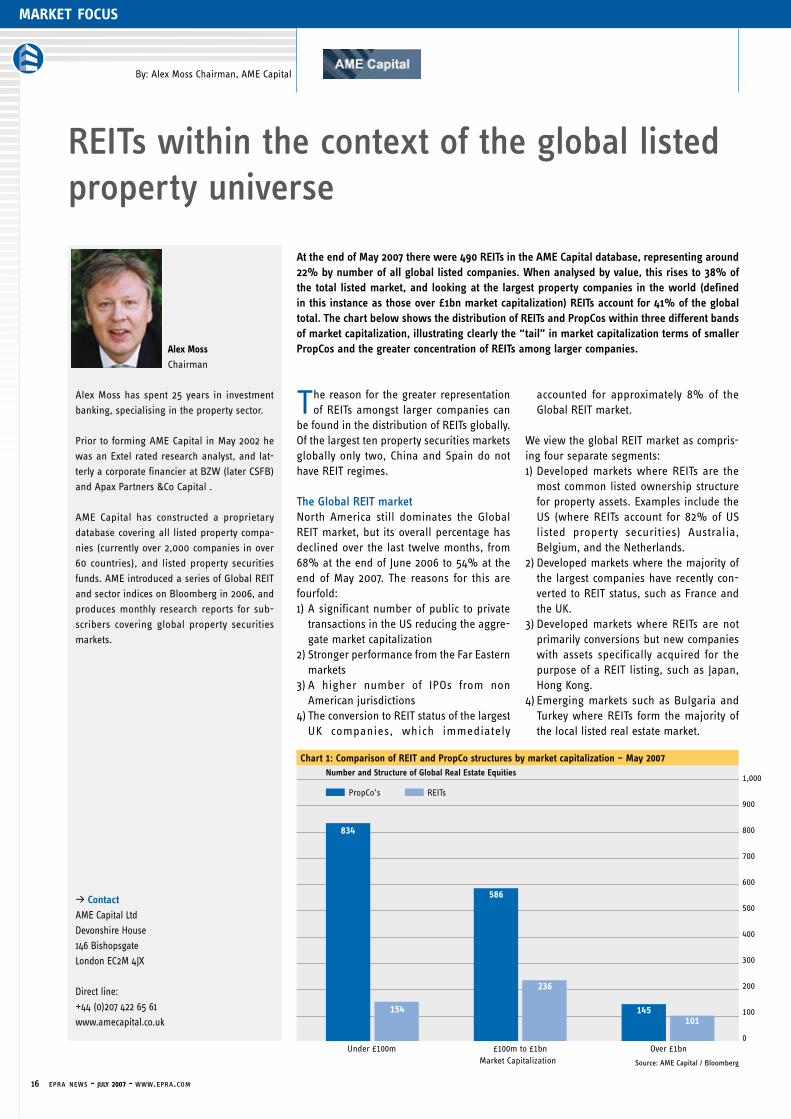
Chart 1: Comparison of REIT and PropCo structures by market capitalization – May 2007
market focus
The reason for the greater representation of REITs amongst larger companies can
be found in the distribution of REITs globally. Of the largest ten property securities markets globally only two, China and Spain do not have REIT regimes.
The Global REIT marketNorth America still dominates the Global REIT market, but its overall percentage has declined over the last twelve months, from 68% at the end of June 2006 to 54% at the end of May 2007. The reasons for this are fourfold:1) A significant number of public to private
transactions in the US reducing the aggre-gate market capitalization
2) Stronger performance from the Far Eastern markets
3) A higher number of IPOs from non American jurisdictions
4) The conversion to REIT status of the largest UK companies, which immediately
accounted for approximately 8% of the Global REIT market.
We view the global REIT market as compris-ing four separate segments:1) Developed markets where REITs are the
most common listed ownership structure for property assets. Examples include the US (where REITs account for 82% of US listed property securities) Australia, Belgium, and the Netherlands.
2) Developed markets where the majority of the largest companies have recently con-verted to REIT status, such as France and the UK.
3) Developed markets where REITs are not primarily conversions but new companies with assets specifically acquired for the purpose of a REIT listing, such as Japan, Hong Kong.
4) Emerging markets such as Bulgaria and Turkey where REITs form the majority of the local listed real estate market.
At the end of May 2007 there were 490 REITs in the AME Capital database, representing around 22% by number of all global listed companies. When analysed by value, this rises to 38% of the total listed market, and looking at the largest property companies in the world (defined in this instance as those over £1bn market capitalization) REITs account for 41% of the global total. The chart below shows the distribution of REITs and PropCos within three different bands of market capitalization, illustrating clearly the “tail” in market capitalization terms of smaller PropCos and the greater concentration of REITs among larger companies.
Alex Moss has spent 25 years in investment
banking, specialising in the property sector.
Prior to forming AME Capital in May 2002 he
was an Extel rated research analyst, and lat-
terly a corporate financier at BZW (later CSFB)
and Apax Partners &Co Capital .
AME Capital has constructed a proprietary
database covering all listed property compa-
nies (currently over 2,000 companies in over
60 countries), and listed property securities
funds. AME introduced a series of Global REIT
and sector indices on Bloomberg in 2006, and
produces monthly research reports for sub-
scribers covering global property securities
markets.
’ Contact AME Capital Ltd
Devonshire House
146 Bishopsgate
London EC2M 4JX
Direct line:
+44 (0)207 422 65 61
www.amecapital.co.uk
Alex MossChairman
By: Alex Moss Chairman, AME Capital
REITs within the context of the global listed property universe
Number and Structure of Global Real Estate Equities
Under £100m
1,000
900
800
700
600
500
400
300
200
100
0£100m to £1bn Over £1bn
PropCo’s REITs
Market Capitalization
834
586
154
236
145101
Source: AME Capital / Bloomberg

www.epra.com - july 2007 - epra news 17
Chart 2: Largest property securities markets by country - May 2007
market focus
Future MarketsLooking at the structure of the existing listed property securities markets in the Germany and Italy it would appear rea-sonable to assume that their REIT markets will come to be dominated as much by IPOs as conversions of existing listed companies. Further field there are a number of countries where REIT-type legislation has been passed but there are no listed REITs, such as Brazil, Israel and Mexico. In addition a number of emerg-ing markets are considering passing REIT – like legislation such as China, India, and the Philippines. %
REITs within the context of the global listed
property universe
Table 1: Global REIT Markets ranked by size May 2007
Listing Country Number of Companies
Market cap < £100m
Market cap £100m to
£1bn
Market cap > £1bn Sector Mkt cap £
% of Global Listed Real Estate
Equity mkt
% of Global REIT mkt
% of Local Listed Real Estate mkt
AMERICAS 217 52 107 58 227,295,795,807 20.77% 54.32%
AMERICAS DEVELOPED 217 52 107 58 227,295,795,807 20.77% 54.32%
US 184 39 91 54 213,161,891,100 19.48% 50.94% 82.22%
Canada 33 13 16 4 14,133,904,707 1.29% 3.38% 38.24%
FAR EAST 100 34 55 11 44,131,085,321 4.03% 10.55%
FAR EAST DEVELOPED 63 5 47 11 41,670,503,920 3.81% 9.96%
Japan 41 4 30 7 27,901,152,940 2.55% 6.67% 23.87%
Singapore 16 1 12 3 9,438,870,530 0.86% 2.26% 19.85%
Hong Kong 6 0 5 1 4,330,480,451 0.40% 1.03% 2.91%
FAR EAST EMERGING 37 29 8 0 2,460,581,400 0.22% 0.59%
Taiwan 7 2 5 0 909,904,901 0.08% 0.22% 15.09%
Malaysia 13 12 1 0 702,189,598 0.06% 0.17% 8.26%
South Korea 10 9 1 0 520,103,542 0.05% 0.12% 93.49%
Thailand 7 6 1 0 328,383,360 0.03% 0.08% 8.14%
EUROPE 99 45 35 19 85,667,584,452 7.83% 20.47%
EUROPE DEVELOPED 67 16 32 19 84,194,854,083 7.69% 20.12%
UK 14 0 7 7 35,457,662,000 3.24% 8.47% 47.28%
France 30 10 13 7 31,058,560,977 2.84% 7.42% 69.14%
Netherlands 9 2 3 4 14,109,065,270 1.29% 3.37% 75.69%
Belgium 14 4 9 1 3,569,565,835 0.33% 0.85% 82.11%
EUROPE EMERGING 32 29 3 0 1,472,730,369 0.13% 0.35%
Turkey 11 9 2 0 940,551,316 0.09% 0.22% 99.18%
Greece 2 1 1 0 373,431,814 0.03% 0.09% 17.22%
Bulgaria 19 19 0 0 158,747,239 0.01% 0.04% 92.33%
OCEANIA 69 22 34 13 59,934,650,941 5.48% 14.32%
OCEANIA DEVELOPED 69 22 34 13 59,934,650,941 5.48% 14.32%
Australia 61 19 29 13 58,385,635,580 5.34% 13.95% 84.88%
New Zealand 8 3 5 0 1,549,015,361 0.14% 0.37% 91.23%
AFRICA 5 0 5 0 1,444,061,549 0.13% 0.35%
AFRICA EMERGING 5 0 5 0 1,444,061,549 0.13% 0.35%
South Africa 5 0 5 0 1,444,061,549 0.13% 0.35% 26.60%
GLOBAL REIT 490 153 236 101 418,473,178,069 38.24% 100.00%
GLOBAL DEVELOPED 416 95 220 101 413,095,804,751 37.75% 98.72%
GLOBAL EMERGING 74 58 16 0 5,377,373,318 0.49% 1.28%
300
250
200
150
100
50
0
US Hong Kong Japan UK Australia China Singapore France Canada Spain
25%
20%
15%
10%
5%
0%
Mar
ket
Capi
taliz
atio
n £b
n
% o
f Glo
bal M
arke
t
Source: AME Capital / Bloomberg
Source: AME Capital / Bloomberg
18 epra news - july 2007 - www.epra.com
0
10
20
30
40
50
60
70
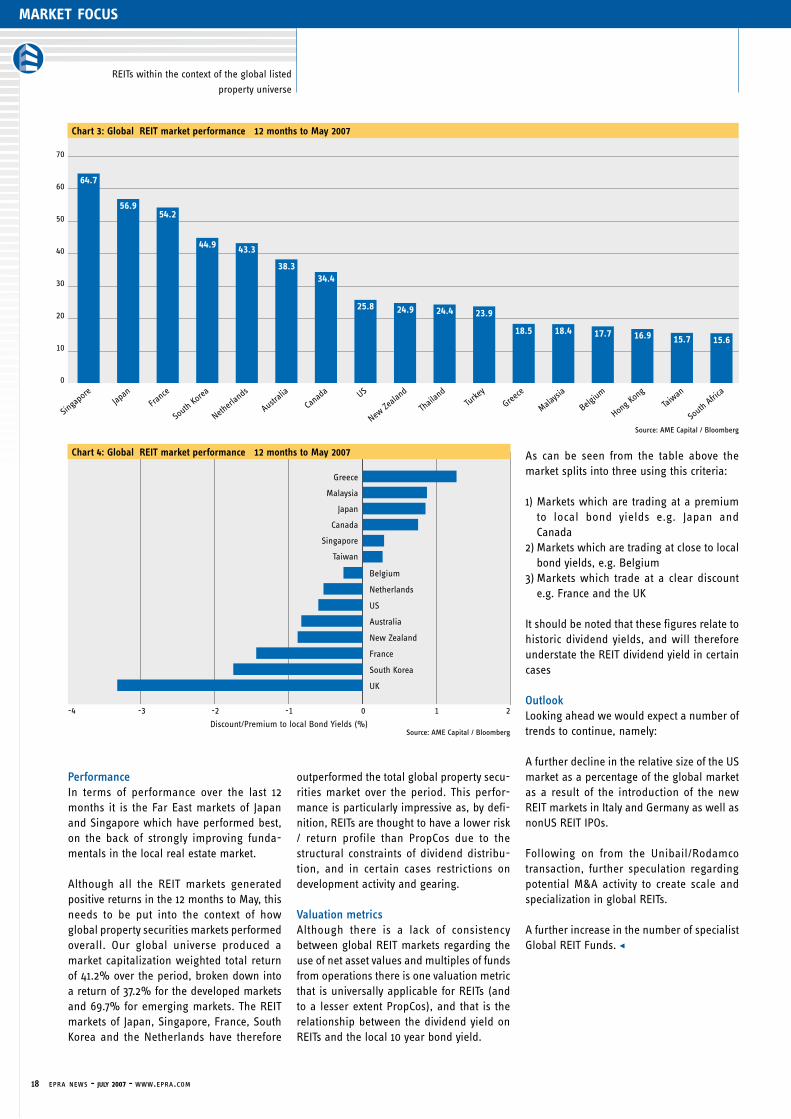
Chart 3: Global REIT market performance 12 months to May 2007
70
60
50
40
30
20
10
0
-4 -3 -2 -1 0 1 2
Chart 4: Global REIT market performance 12 months to May 2007
-4 -3 -2 -1 0 1 2
market focus
PerformanceIn terms of performance over the last 12 months it is the Far East markets of Japan and Singapore which have performed best, on the back of strongly improving funda-mentals in the local real estate market.
Although all the REIT markets generated positive returns in the 12 months to May, this needs to be put into the context of how global property securities markets performed overall. Our global universe produced a market capitalization weighted total return of 41.2% over the period, broken down into a return of 37.2% for the developed markets and 69.7% for emerging markets. The REIT markets of Japan, Singapore, France, South Korea and the Netherlands have therefore
outperformed the total global property secu-rities market over the period. This perfor-mance is particularly impressive as, by defi-nition, REITs are thought to have a lower risk / return profile than PropCos due to the structural constraints of dividend distribu-tion, and in certain cases restrictions on development activity and gearing.
Valuation metricsAlthough there is a lack of consistency between global REIT markets regarding the use of net asset values and multiples of funds from operations there is one valuation metric that is universally applicable for REITs (and to a lesser extent PropCos), and that is the relationship between the dividend yield on REITs and the local 10 year bond yield.
As can be seen from the table above the market splits into three using this criteria:
1) Markets which are trading at a premium to local bond yields e.g. Japan and Canada
2) Markets which are trading at close to local bond yields, e.g. Belgium
3) Markets which trade at a clear discount e.g. France and the UK
It should be noted that these figures relate to historic dividend yields, and will therefore understate the REIT dividend yield in certain cases
OutlookLooking ahead we would expect a number of trends to continue, namely:
A further decline in the relative size of the US market as a percentage of the global market as a result of the introduction of the new REIT markets in Italy and Germany as well as nonUS REIT IPOs.
Following on from the Unibail/Rodamco transaction, further speculation regarding potential M&A activity to create scale and specialization in global REITs.
A further increase in the number of specialist Global REIT Funds. $
Source: AME Capital / Bloomberg
Source: AME Capital / Bloomberg
Singa
poreJap
anFra
nce
South Ko
rea
Netherl
ands
Australi
a
Canad
a US
New Ze
aland
Thail
and
Turke
y
Greece
Malaysi
a
Belgium
Hong Ko
ng
Taiw
an
South Afric
a
64.7
56.954.2
44.9 43.3
38.334.4
25.8 24.9 24.4 23.9
18.5 18.4 17.7 16.9 15.7 15.6
Belgium
Netherlands
US
Australia
New Zealand
France
South Korea
UK
Greece
Malaysia
Japan
Canada
Singapore
Taiwan
REITs within the context of the global listed
property universe
Discount/Premium to local Bond Yields (%)

www.epra.com - july 2007 - epra news 19
market focus
“The project being managed jointly
by the U.S. Financial Accounting Standards Board (FASB) and the London-based Interna-t i ona l Account ing Standards Boards (IASB) has profound implica-tions for the listed real
estate industry and unless we move now to shape the process we will be landed with completely different financial reporting state-ments from those we have been used to,” Hans Bruggink, Director of Reporting Practices at EPRA said.
The proposed re-writing of Financial Statement Presentation under IFRS (International Financial Reporting Standards) and its convergence with U.S. GAAP, is aimed at moving away from the focus on a single bottom line profit figure in company income statements and balance sheets, showing what is left after expenses and taxes, towards reflecting how businesses are actually run to give a clearer picture of value in different parts of a company.
“At the moment you can see current assets and fixed assets, liabilities and equity clearly in a listed real estate company’s accounts so you can calculate your ratios at one glance. Under the ‘cohesive principle’ in the new proposed rules you have to put financing in the financing part of the balance sheet and the industry’s present practice of putting funds from opera-tion and its financing in the business part would not be allowed,” Bruggink said.
“The income for lessors would become interest in the financing side not rent in the opera-tional side. People who want to invest in real estate wouldn’t see rents, they would see a lot of interest paid and a lot of interest received.”
With the owner taking the risk and rewards in the real estate investment business and most leasees not having most a financial lease, a building asset could be broken down into a receivable and residual value, with both under financial assets, instead of fixed assets.
“We absolutely do not want this because the value of real estate companies is all based on the visible net asset value of the real estate properties. This property is not like a leased car, machinery or aircraft rental contact with a life of five, 10 or 15 years, bricks and mortar can extend for 50 to a 100 years and the residual value would be higher than the net present value of the receivable, based on a 5 or 10 year term” Bruggink said.
The implications of the accounting boards’ proposals have fired up the representative bodies for listed real estate around the world to form a united coalition, which will lobby the FASB and IASB to adopt standards that best match the operational realities of the real estate industry.
Alongside EPRA, NAREIT in the U.S., APREA in Asia, the BPF in the UK, and Canadian and Australian associations are all repre-sented in the coalition.
“We are working right now to get out a global profit and loss model in which the industry can focus on a metric that is very close to the adjusted EPRA Earnings Per Share model, but at the same time equals Funds From Operations as they know it in the U.S. and Canada. It’s a P&L that looks a bit different from the present standards of IFRS, but we’re going to the accounting boards in the autumn of this year to see if we can get some recognition of this way of presenting performance,” Bruggink said.
It is important the FASB and IASB realise the huge influence the real estate industry has in the global economic system in terms of investments by pension funds, insurance companies and public and private investors in the direct form, or indirectly via funds, equities and real estate bonds, as an alter-native for shares, bonds and other securities, he added.
The British Property Federation estimates that the UK’s real estate industry, for example, is six times larger than its agricultural sector, more than twice the size of the oil industry and larger than each of the banking, leisure, transport and communication sectors.
EPRA is currently evaluating the results of its industry Best Practices Survey, on the work of the association’s committee in this area. Early responses indicate that fair value mea-surement and financial statement presenta-tion are at the top of the list of priorities for European listed property companies, with chief financial officers only able to follow the plans of the international accounting bodies from a distance.
The global listed real estate industry still has time to make its voice heard and influence the outcome of the next round of IFRS, as there is an interregnum while the changes implemented in 2005 are still working there way through the corporate world. The new rules are intended to come into force at the earliest in the 2009 financial year, but the boards’ secretariats continue to issue IFRS exposure drafts for discussion.
“We have to use the time now to exert our influence. I think we’ve got about 18 months, until the end of 2008, to make a difference,” Bruggink concluded. $
Steve Hays is a founding director of Bellier
Financial Marketing based in Amsterdam
This article was originally commissioned by
IPE Real Estate Magazine and is reproduced
with their permission.
EPRA sees global real estate coalition emerging over accounting rules
By: Steve Hays
Proposals “that could mark one of the most drastic changes in international accounting and financial reporting rules since the 19th Century’s Industrial Revolution” (The Wall Street Journal 12/5/2007) are drawing together the international listed real estate industry in an unprecedented coalition to influence their outcome, and marks the real globalization of the sector, the European Public Real Estate Association (EPRA) says.
Hans Bruggink
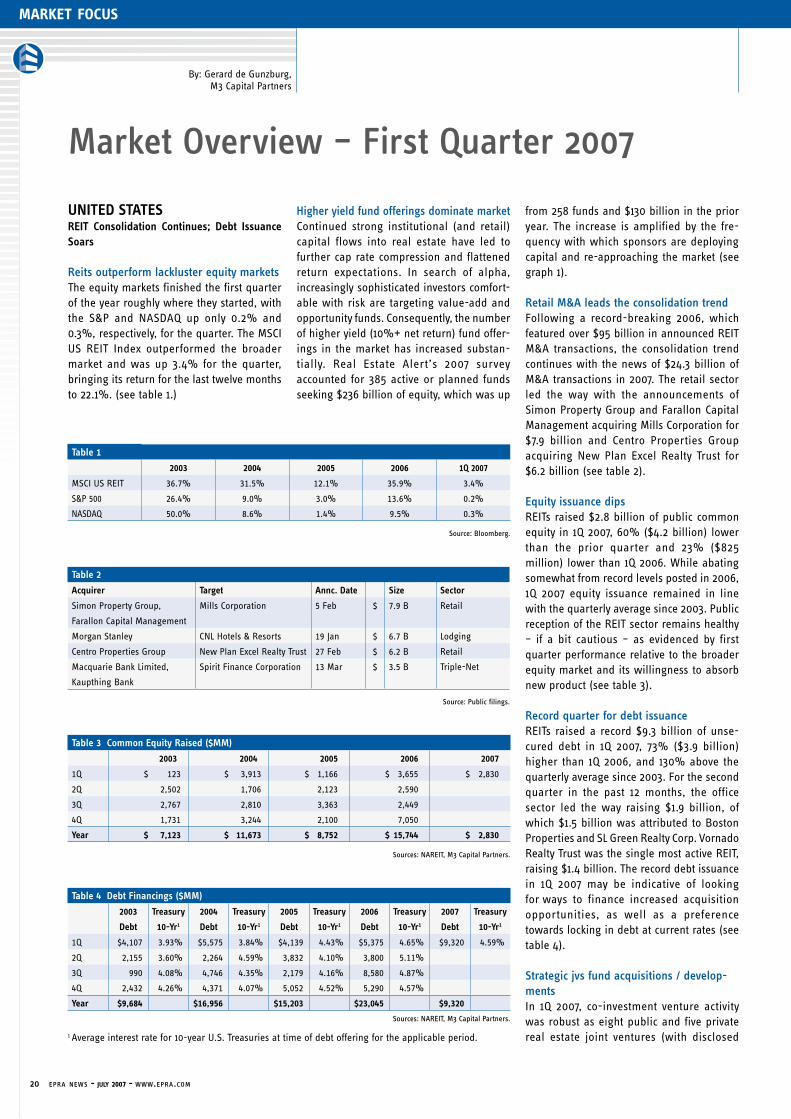
20 epra news - july 2007 - www.epra.com
market focus
Reits outperform lackluster equity marketsThe equity markets finished the first quarter of the year roughly where they started, with the S&P and NASDAQ up only 0.2% and 0.3%, respectively, for the quarter. The MSCI US REIT Index outperformed the broader market and was up 3.4% for the quarter, bringing its return for the last twelve months to 22.1%. (see table 1.)
Higher yield fund offerings dominate marketContinued strong institutional (and retail) capital flows into real estate have led to further cap rate compression and flattened return expectations. In search of alpha, increasingly sophisticated investors comfort-able with risk are targeting value-add and opportunity funds. Consequently, the number of higher yield (10%+ net return) fund offer-ings in the market has increased substan-tially. Real Estate Alert’s 2007 survey accounted for 385 active or planned funds seeking $236 billion of equity, which was up
UNITED STATESREIT Consolidation Continues; Debt Issuance Soars
Market Overview – First Quarter 2007
from 258 funds and $130 billion in the prior year. The increase is amplified by the fre-quency with which sponsors are deploying capital and re-approaching the market (see graph 1).
Retail M&A leads the consolidation trendFollowing a record-breaking 2006, which featured over $95 billion in announced REIT M&A transactions, the consolidation trend continues with the news of $24.3 billion of M&A transactions in 2007. The retail sector led the way with the announcements of Simon Property Group and Farallon Capital Management acquiring Mills Corporation for $7.9 billion and Centro Properties Group acquiring New Plan Excel Realty Trust for $6.2 billion (see table 2).
Equity issuance dipsREITs raised $2.8 billion of public common equity in 1Q 2007, 60% ($4.2 billion) lower than the prior quarter and 23% ($825 million) lower than 1Q 2006. While abating somewhat from record levels posted in 2006, 1Q 2007 equity issuance remained in line with the quarterly average since 2003. Public reception of the REIT sector remains healthy – if a bit cautious – as evidenced by first quarter performance relative to the broader equity market and its willingness to absorb new product (see table 3).
Record quarter for debt issuanceREITs raised a record $9.3 billion of unse-cured debt in 1Q 2007, 73% ($3.9 billion) higher than 1Q 2006, and 130% above the quarterly average since 2003. For the second quarter in the past 12 months, the office sector led the way raising $1.9 billion, of which $1.5 billion was attributed to Boston Properties and SL Green Realty Corp. Vornado Realty Trust was the single most active REIT, raising $1.4 billion. The record debt issuance in 1Q 2007 may be indicative of looking for ways to finance increased acquisition opportunities, as well as a preference towards locking in debt at current rates (see table 4).
Strategic jvs fund acquisitions / develop-mentsIn 1Q 2007, co-investment venture activity was robust as eight public and five private real estate joint ventures (with disclosed
Table 1
2003 2004 2005 2006 1Q 2007
MSCI US REIT 36.7% 31.5% 12.1% 35.9% 3.4%
S&P 500 26.4% 9.0% 3.0% 13.6% 0.2%
NASDAQ 50.0% 8.6% 1.4% 9.5% 0.3%
Source: Bloomberg.
Table 2
Acquirer Target Annc. Date Size Sector
Simon Property Group, Mills Corporation 5 Feb $ 7.9 B Retail
Farallon Capital Management
Morgan Stanley CNL Hotels & Resorts 19 Jan $ 6.7 B Lodging
Centro Properties Group New Plan Excel Realty Trust 27 Feb $ 6.2 B Retail
Macquarie Bank Limited, Spirit Finance Corporation 13 Mar $ 3.5 B Triple-Net
Kaupthing Bank
Source: Public filings.
Table 3 Common Equity Raised ($MM)
2003 2004 2005 2006 2007
1Q $ 123 $ 3,913 $ 1,166 $ 3,655 $ 2,830
2Q 2,502 1,706 2,123 2,590
3Q 2,767 2,810 3,363 2,449
4Q 1,731 3,244 2,100 7,050
Year $ 7,123 $ 11,673 $ 8,752 $ 15,744 $ 2,830
Sources: NAREIT, M3 Capital Partners.
Table 4 Debt Financings ($MM)
2003 Treasury 2004 Treasury 2005 Treasury 2006 Treasury 2007 Treasury
Debt 10-Yr1 Debt 10-Yr1 Debt 10-Yr1 Debt 10-Yr1 Debt 10-Yr1
1Q $4,107 3.93% $5,575 3.84% $4,139 4.43% $5,375 4.65% $9,320 4.59%
2Q 2,155 3.60% 2,264 4.59% 3,832 4.10% 3,800 5.11%
3Q 990 4.08% 4,746 4.35% 2,179 4.16% 8,580 4.87%
4Q 2,432 4.26% 4,371 4.07% 5,052 4.52% 5,290 4.57%
Year $9,684 $16,956 $15,203 $23,045 $9,320
Sources: NAREIT, M3 Capital Partners.
1 Average interest rate for 10-year U.S. Treasuries at time of debt offering for the applicable period.
By: Gerard de Gunzburg,M3 Capital Partners

www.epra.com - july 2007 - epra news 21
%
market focus
values) were formed with total capitaliza-tions of $15.9 billion. This represents an increase in volume of 62% from 4Q 2006 when nine ventures closed for a total of $9.8 billion. The quarter’s largest formation announcement was the $7.9 billion strategic joint venture between Simon Property Group and Farallon Capital Management to acquire Mills Corporation. Likewise, Thomas Properties Group partnered with institutional capital to acquire a $1.2 billion office portfo-lio in Austin, Texas, which was sold by Blackstone following the Equity Office Properties privatization (see table 5).
EUROPEG-REITs Arrive; Sustainable Development Gains Interest
Finally... Reits introduced in germanyFollowing much political debate, at the end of March the German parliament passed leg-islation allowing for the formation of REITs retroactive from 1 January 2007. Germany joins numerous European countries with REIT regimes already in place. Initially based on the framework of UK REITs, alterations were made to key points of the original pro-posal; a number of the changes appeared politically driven. Most significantly, German REITs exclude residential real estate built before 2007. The residential real estate exclu-
sion was mainly driven by the German Social Democratic Party, which feared a negative impact on tenants being indirectly exposed to the forces of the capital markets.
Structural Highlights of German REIT Legislation
• Must be a German tax resident corporate entity
• Must be listed on a recognised exchange
• A minimum of 15% free float has to be maintained
• No shareholder may own more than 10%
• Maximum leverage of 60%
• Exempt from trade tax and corporate income tax
• 90% of income to be distributed as divi-dends
• At least 75% of income generated by real estate
• Maximum of 50% of the REIT’s assets can be sold over 5 years
• No residential real estate (except if built after 1 January 2007)
Sources: German Ministry of Finance, Financial Times
Deutschland, Property Week.
Sustainable development a hot topicThe topic of sustainable development, which basically means constructing more energy-efficient and ecologically sound buildings, is
attracting increasing amounts of attention from the European property sector. It is esti-mated that approximately 40% of energy consumption in the EU is linked to proper-ties; therefore, a change of building regula-tions and policy measures, as well as tenant and investor attitudes, is expected.
In 1Q 2007, 36 leading property companies, including British Land, HBOS and SEGRO (Slough Estates), announced the launch of the Green Building Council, an organisation that will look at how to improve the ways in which the real estate industry implements sustainable development. Moreover, both British Land and PRUPIM, an affiliate of Prudential’s asset management arm M&G Group, announced plans to minimise carbon emissions. ProLogis and Gazeley, both devel-opers, managers and owners of logistics space, have made sustainability a corporate initiative by implementing techniques such as solar and wind power, efficient water and lighting systems, air-tight building construc-tion and the use of recycled and organic materials.
Though supply remains limited, property investors are showing greater demand for sustainable development as part of socially responsible investing. Tenants are also increasingly focusing on sustainable con-struction, as the resulting efficiencies reduce operating costs and CO2 emissions signifi-cantly. As more tenants, investors and poli-cymakers make sustainability a priority, the industry expects its presence (or lack thereof) will begin to impact valuations.Sources: IPE Real Estate, Financial Times, Property
Week, M3 Capital Partners.
Senior living sector blossoms in UKActivity in the UK senior living sector picked up in 1Q 2007, with American operator Sunrise Senior Living entering into a £500m joint venture with Pramerica Real Estate to develop UK assisted living communities. Consensus Group acquired Peverel, a major freeholder and manager of privately owned UK residential developments, for £500m, becoming the largest owner of UK retirement home freeholds.
The UK senior living sector presents attractive medium- to long-term dynamics for inves-tors. Increasing demand is driven by the demographic realities of a rapidly aging pop-ulation; there is a projected shortfall of 62,500 retirement homes by 2020. Additionally, there are high barriers to entry due to planning
# o
f Fun
ds
Graph 1 Higher Yield Fund Offerings
Source: Real Estate Alert.
2002 2003 2004 2005 2006 2007
250
200
150
100
50
0
500
400
300
200
100
0
Targeted Equity ($B)
Number of Funds
Table 5
Operator Sector Size Venture Type Institutional Investor
Simon Property Group Retail $7.9 B Acquisition Farallon Capital Management
TIAA-CREF Office $1.5 B Acquisition Canada Pension Plan Investment Board
Thomas Properties Group Office $1.2 B Existing Assets Undisclosed
Health Care Properties Healthcare $1.1 B Existing Assets / Undisclosed
Acquisition
Sunrise Senior Living Healthcare $1.0 B Development Prudential Real Estate Investors
Trammell Crow Office $1.0 B Development ING Clarion
Sources: M3 Capital Partners, public filings.
Equi
ty (
$B)
Market Overview – First Quarter 2007
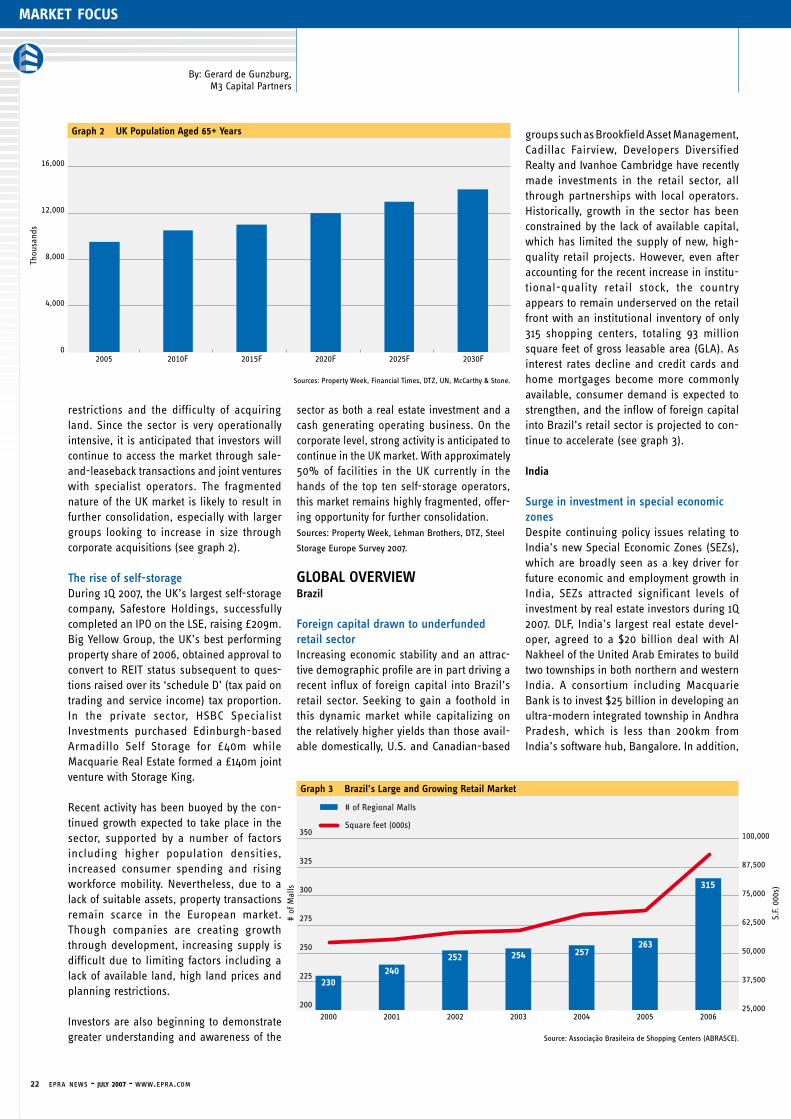
22 epra news - july 2007 - www.epra.com
market focus
restrictions and the difficulty of acquiring land. Since the sector is very operationally intensive, it is anticipated that investors will continue to access the market through sale-and-leaseback transactions and joint ventures with specialist operators. The fragmented nature of the UK market is likely to result in further consolidation, especially with larger groups looking to increase in size through corporate acquisitions (see graph 2).
The rise of self-storageDuring 1Q 2007, the UK’s largest self-storage company, Safestore Holdings, successfully completed an IPO on the LSE, raising £209m. Big Yellow Group, the UK’s best performing property share of 2006, obtained approval to convert to REIT status subsequent to ques-tions raised over its ‘schedule D’ (tax paid on trading and service income) tax proportion. In the private sector, HSBC Specialist Investments purchased Edinburgh-based Armadillo Self Storage for £40m while Macquarie Real Estate formed a £140m joint venture with Storage King.
Recent activity has been buoyed by the con-tinued growth expected to take place in the sector, supported by a number of factors including higher population densities, increased consumer spending and rising workforce mobility. Nevertheless, due to a lack of suitable assets, property transactions remain scarce in the European market. Though companies are creating growth through development, increasing supply is difficult due to limiting factors including a lack of available land, high land prices and planning restrictions.
Investors are also beginning to demonstrate greater understanding and awareness of the
sector as both a real estate investment and a cash generating operating business. On the corporate level, strong activity is anticipated to continue in the UK market. With approximately 50% of facilities in the UK currently in the hands of the top ten self-storage operators, this market remains highly fragmented, offer-ing opportunity for further consolidation.Sources: Property Week, Lehman Brothers, DTZ, Steel
Storage Europe Survey 2007.
GLOBAL OVERVIEWBrazil
Foreign capital drawn to underfunded retail sectorIncreasing economic stability and an attrac-tive demographic profile are in part driving a recent influx of foreign capital into Brazil’s retail sector. Seeking to gain a foothold in this dynamic market while capitalizing on the relatively higher yields than those avail-able domestically, U.S. and Canadian-based
groups such as Brookfield Asset Management, Cadillac Fairview, Developers Diversified Realty and Ivanhoe Cambridge have recently made investments in the retail sector, all through partnerships with local operators. Historically, growth in the sector has been constrained by the lack of available capital, which has limited the supply of new, high-quality retail projects. However, even after accounting for the recent increase in institu-tional-quality retail stock, the country appears to remain underserved on the retail front with an institutional inventory of only 315 shopping centers, totaling 93 million square feet of gross leasable area (GLA). As interest rates decline and credit cards and home mortgages become more commonly available, consumer demand is expected to strengthen, and the inflow of foreign capital into Brazil’s retail sector is projected to con-tinue to accelerate (see graph 3).
India
Surge in investment in special economic zonesDespite continuing policy issues relating to India’s new Special Economic Zones (SEZs), which are broadly seen as a key driver for future economic and employment growth in India, SEZs attracted significant levels of investment by real estate investors during 1Q 2007. DLF, India’s largest real estate devel-oper, agreed to a $20 billion deal with Al Nakheel of the United Arab Emirates to build two townships in both northern and western India. A consortium including Macquarie Bank is to invest $25 billion in developing an ultra-modern integrated township in Andhra Pradesh, which is less than 200km from India’s software hub, Bangalore. In addition,
Graph 2 UK Population Aged 65+ Years
Sources: Property Week, Financial Times, DTZ, UN, McCarthy & Stone.
Graph 3 Brazil’s Large and Growing Retail Market
Source: Associação Brasileira de Shopping Centers (ABRASCE).
2005
16,000
12,000
8,000
4,000
02010F 2015F 2020F 2025F 2030F
Thou
sand
s
350
325
300
275
250
225
200
# o
f Mal
ls
S.F.
000
s)
100,000
87,500
75,000
62,500
50,000
37,500
25,000
# of Regional Malls
Square feet (000s)
2000 2001 2002 2003 2004 2005 2006
230240
252 254 257263
315
By: Gerard de Gunzburg,M3 Capital Partners
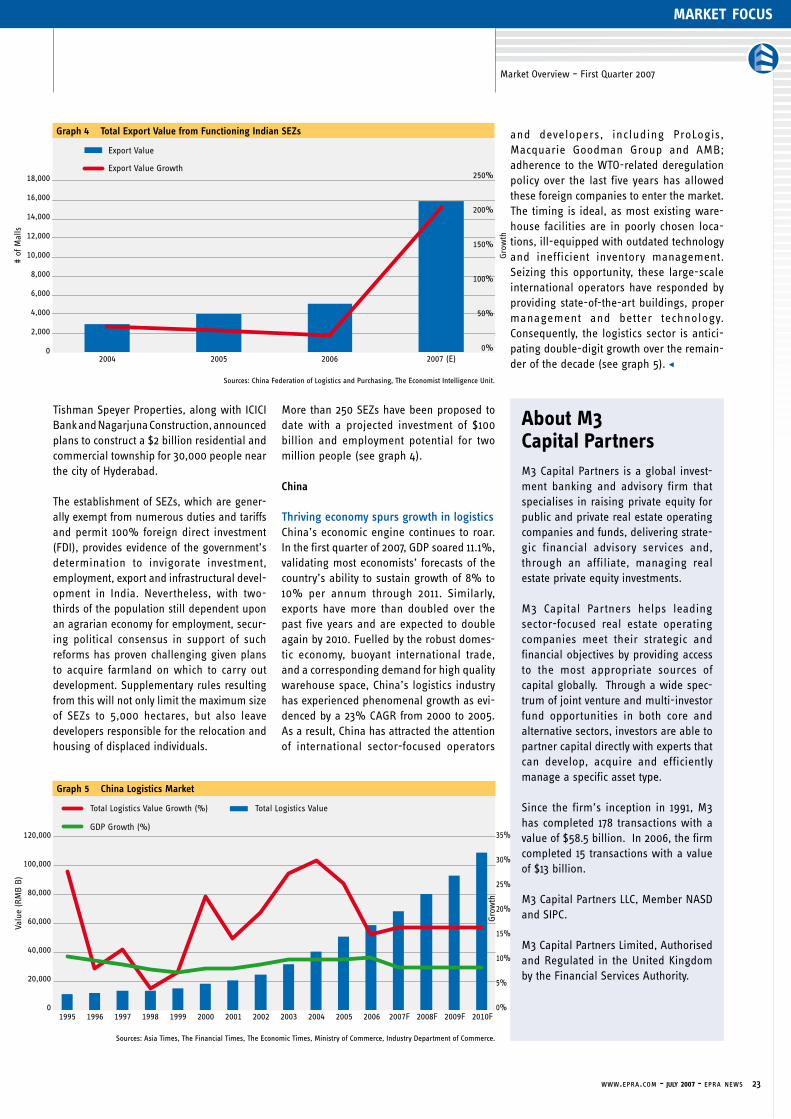
www.epra.com - july 2007 - epra news 23
market focus
Tishman Speyer Properties, along with ICICI Bank and Nagarjuna Construction, announced plans to construct a $2 billion residential and commercial township for 30,000 people near the city of Hyderabad.
The establishment of SEZs, which are gener-ally exempt from numerous duties and tariffs and permit 100% foreign direct investment (FDI), provides evidence of the government’s determination to invigorate investment, employment, export and infrastructural devel-opment in India. Nevertheless, with two-thirds of the population still dependent upon an agrarian economy for employment, secur-ing political consensus in support of such reforms has proven challenging given plans to acquire farmland on which to carry out development. Supplementary rules resulting from this will not only limit the maximum size of SEZs to 5,000 hectares, but also leave developers responsible for the relocation and housing of displaced individuals.
More than 250 SEZs have been proposed to date with a projected investment of $100 billion and employment potential for two million people (see graph 4).
China
Thriving economy spurs growth in logisticsChina’s economic engine continues to roar. In the first quarter of 2007, GDP soared 11.1%, validating most economists’ forecasts of the country’s ability to sustain growth of 8% to 10% per annum through 2011. Similarly, exports have more than doubled over the past five years and are expected to double again by 2010. Fuelled by the robust domes-tic economy, buoyant international trade, and a corresponding demand for high quality warehouse space, China’s logistics industry has experienced phenomenal growth as evi-denced by a 23% CAGR from 2000 to 2005. As a result, China has attracted the attention of international sector-focused operators
and developers, including ProLogis, Macquarie Goodman Group and AMB; adherence to the WTO-related deregulation policy over the last five years has allowed these foreign companies to enter the market. The timing is ideal, as most existing ware-house facilities are in poorly chosen loca-tions, ill-equipped with outdated technology and inefficient inventory management. Seizing this opportunity, these large-scale international operators have responded by providing state-of-the-art buildings, proper management and better technology. Consequently, the logistics sector is antici-pating double-digit growth over the remain-der of the decade (see graph 5). $
About M3 Capital PartnersM3 Capital Partners is a global invest-ment banking and advisory firm that specialises in raising private equity for public and private real estate operating companies and funds, delivering strate-gic financial advisory services and, through an affiliate, managing real estate private equity investments.
M3 Capital Partners helps leading sector-focused real estate operating companies meet their strategic and financial objectives by providing access to the most appropriate sources of capital globally. Through a wide spec-trum of joint venture and multi-investor fund opportunities in both core and alternative sectors, investors are able to partner capital directly with experts that can develop, acquire and efficiently manage a specific asset type.
Since the firm’s inception in 1991, M3 has completed 178 transactions with a value of $58.5 billion. In 2006, the firm completed 15 transactions with a value of $13 billion.
M3 Capital Partners LLC, Member NASD and SIPC.
M3 Capital Partners Limited, Authorised and Regulated in the United Kingdom by the Financial Services Authority.
Graph 4 Total Export Value from Functioning Indian SEZs
Graph 5 China Logistics Market
Sources: Asia Times, The Financial Times, The Economic Times, Ministry of Commerce, Industry Department of Commerce.
Sources: China Federation of Logistics and Purchasing, The Economist Intelligence Unit.
18,000
16,000
14,000
12,000
10,000
8,000
6,000
4,000
2,000
0
# o
f Mal
ls
Export Value
Export Value Growth
2004
250%
200%
150%
100%
50%
0%
Gro
wth
Total Logistics Value Growth (%)
GDP Growth (%)
Total Logistics Value
120,000
100,000
80,000
60,000
40,000
20,000
01995 1996 1997 1998 1999 2000 2001 2002 2003 2004 2005 2006 2007F 2008F 2009F 2010F
Gro
wth
Valu
e (R
MB
B)
35%
30%
25%
20%
15%
10%
5%
0%
Market Overview – First Quarter 2007
2005 2006 2007 (E)

24 epra news - july 2007 - www.epra.com
market focus
Unibail is a French commercial property investment company with a market cap
of around €9.2bn (around €18bn after
Rodamco merger and based on €195 share price). The company focuses on shopping centres and offices, with a segment in con-
Unibail
In our most recent sector note ‘Positioning for future headwind’, 25 May 2007, we argued that certain property stocks would benefit in the current environment of rising interest rates, while others should be avoided. We reiterate that Unibail is one of the best posi-tioned companies in our view, have a target price of €255, and see potential to €280. We know that some selling from property benchmark investors could occur (because of a too high index weighting after the merger with Rodamco), but see any significant share price drop as a nice entry point. In the following article we explain in more detail why the stock is currently one of our top picks.
Table 1: Key Financials
€ in millions, € Unibail Rodamco Combined Company
Net Rental Income (€ m) 411 563 974
Recurring Net Profit (€ m) 313 369 682
Property Value (€ m) 10,856 10,862 21,718
NNNAV (€ m) 6,750 6,853 13,603
NNNAV/Share (€) 140.6 76.5 142.4
Recurring EPS (€) 6.8 4.1 7.3
Source: Company Data
Table 2: Estimated financials of combined Rodamco-Unibail
€ 2006A 2007E 2008E 2009E
EPS 7.30 8.08 9.49 10.63
Growth 11% 17% 12%
Dividend 5.00 7.28 8.54 9.57
Adj NAV 143.0 176.3 212.3 245.4
Source: Unibail, Rodamco, JPMorgan Estimates
Table 3: Results of one year rolled forward European valuation model
Operating return
Capital return
Assigned value t+1
Up/Downside to price targetPrice NNAV t+1 Premium Total return WACC Spread Upside Price target
Unibail 194.9 190.4 2.4% 4.4% 9.8% 14.3% 6.3% 8.0% 257.4 32.2% 255.0 30.9%
Average -1.9% 4.6% 4.1% 8.8% 6.7% 2.1% 16.4% 16.9%
Source: JPMorgan estimates, Datastream. Share prices COB 11 June 2007.
Graph 1 UNIBAIL Holding FTSE EPRA/NAREIT Europe - price index
Source: Company Data
vention and exhibition centres. In our view, Unibail has an exceptional track record in shareholder value creation. We estimate that Unibail has outperformed the EPRA Europe by 361% since 2000 (see graph 1).
Merger with RodamcoOn 10 April 2007 Unibail and Rodamco announced a ‘merger of equals’, which we believe is in reality a takeover of Rodamco by Unibail. Unibail has offered 0.5223 shares in Unibail for every Rodamco share. The (first) acceptance period for the offer began on 22 May and will end on 20 June 2007. The first expected date of trading of the combined group is 22 June, 2007 with settle-ment on 25 June. Unibail will honor its bid if at least 60% of shares are tendered.
Portfolio: Unbail-Rodamco combinationAt the end of 2006, the pro-forma portfolio consisted of around €4.5bn offices and €15.8bn retail. In addition, the planned new entity will have a 1.5m sq m development pipeline and the company expects total capital expenditure of €6.1bn. The combina-tion will be predominantly focused on retail property (73% of assets). See graph 2 and 3.
Key financialsThe planned combination’s key financials are given below with a total property value of €21.7bn and net rental income of €974m.(see table 1.)
Combined key forecastsIf we combine our Rodamco and Unibail valuation models and allow for some cost reductions (reduction of about 2% in operat-ing cost margin after 2008), we forecast the following key financials. (see table 2.)
31% potential upsideOur May 2008 target price is €255, based on our European valuation model. Our target price incorporates potential benefits from the pro-posed Unibail-Rodamco merger, and includes a forecast increase in rental growth to 5% post-2007 from the Rodamco portfolio. Based on
Unibail1000
900
800
700
600
500
400
300
200
100
0
EPRA Europe
Jan-00 Jan-01 Jan-02 Jan-03 Jan-04 Jan-05 Jan-06 Jan-07
By: Harm Meijer and Osmaan Malik
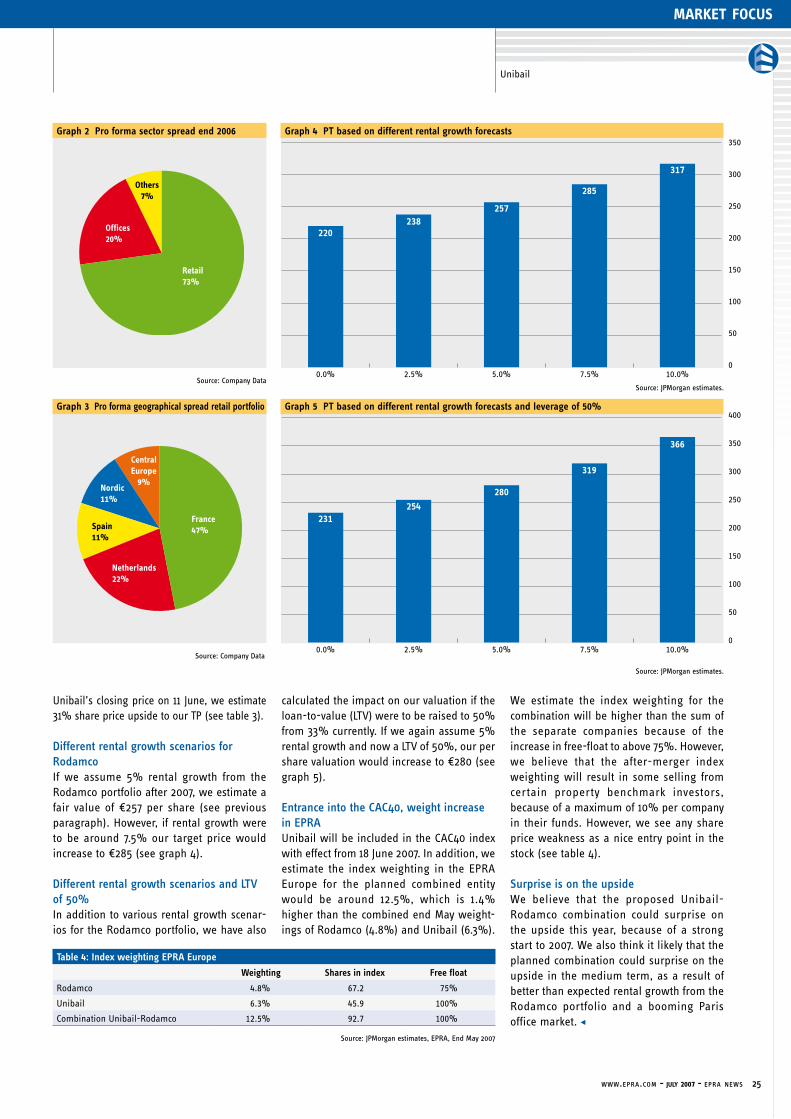
www.epra.com - july 2007 - epra news 25
market focus
Unibail’s closing price on 11 June, we estimate 31% share price upside to our TP (see table 3).
Different rental growth scenarios for RodamcoIf we assume 5% rental growth from the Rodamco portfolio after 2007, we estimate a fair value of €257 per share (see previous paragraph). However, if rental growth were to be around 7.5% our target price would increase to €285 (see graph 4).
Different rental growth scenarios and LTV of 50%In addition to various rental growth scenar-ios for the Rodamco portfolio, we have also
calculated the impact on our valuation if the loan-to-value (LTV) were to be raised to 50% from 33% currently. If we again assume 5% rental growth and now a LTV of 50%, our per share valuation would increase to €280 (see graph 5).
Entrance into the CAC40, weight increase in EPRAUnibail will be included in the CAC40 index with effect from 18 June 2007. In addition, we estimate the index weighting in the EPRA Europe for the planned combined entity would be around 12.5%, which is 1.4% higher than the combined end May weight-ings of Rodamco (4.8%) and Unibail (6.3%).
Table 4: Index weighting EPRA Europe
Weighting Shares in index Free float
Rodamco 4.8% 67.2 75%
Unibail 6.3% 45.9 100%
Combination Unibail-Rodamco 12.5% 92.7 100%
Source: JPMorgan estimates, EPRA, End May 2007
Offices20%
Others7%
Retail73%
Graph 2 Pro forma sector spread end 2006
Nordic11%
CentralEurope
9%
Spain11%
France47%
Netherlands22%
Graph 3 Pro forma geographical spread retail portfolio
Source: Company Data
Source: Company Data
Graph 4 PT based on different rental growth forecasts
Source: JPMorgan estimates.
Graph 5 PT based on different rental growth forecasts and leverage of 50%
Source: JPMorgan estimates.
We estimate the index weighting for the combination will be higher than the sum of the separate companies because of the increase in free-float to above 75%. However, we believe that the after-merger index weighting will result in some selling from certain property benchmark investors, because of a maximum of 10% per company in their funds. However, we see any share price weakness as a nice entry point in the stock (see table 4).
Surprise is on the upsideWe believe that the proposed Unibail-Rodamco combination could surprise on the upside this year, because of a strong start to 2007. We also think it likely that the planned combination could surprise on the upside in the medium term, as a result of better than expected rental growth from the Rodamco portfolio and a booming Paris office market. $
350
300
250
200
150
100
50
00.0% 2.5% 5.0% 7.5% 10.0%
220238
257
285
317
0.0% 2.5% 5.0% 7.5% 10.0%
400
350
300
250
200
150
100
50
0
231254
280
319
366
Unibail

26 epra news - july 2007 - www.epra.com
market focus
HighlightsOf the 101 constituents in the FTSE EPRA/NAREIT Europe Index, 90 companies, or approximately 97.5% (€203 billion), of the market capitalisation of the index are covered by at least one analyst. Merrill Lynch covers the largest number of companies in the index (56) and their overall coverage is 66 (ten non-constituents). Merrill Lynch covers 83% of the total market capitalisation of the FTSE EPRA/NAREIT Europe Index, spanning ten countries. If we say that European coverage should be six countries or more, then only eight of the 84 banks covered by table.1 qualify. Those banks are:
• Merrill Lynch (10 countries)
• Kempen & Co (9 countries, excludes UK)
• Exane BNP (8 countries)
• Goldman Sachs (7 countries)
• Morgan Stanley (7 countries)
• Deutsche Bank (7 countries)
• JP Morgan (6 countries)
• UBS (6 countries)
There are still a number of constituents in the index not covered by the analysts. In total eleven companies have no coverage accord-ing to our sources, representing a market capitalisation of €5.3 billion, or approxi-mately 2.5% of the total index market capi-talisation. These companies are (largest cap first):
• Sparkassen Immobilien (Austria)
• Assura (UK)
• Alstria Office (Germany)
• UK Commercial Property Trust (UK)
• Plaza Centers (UK)
• Sparkassen Immo Invest (Austria)
• Freeport (UK)
• Marylebone Warwick Balfour (UK)
• ISIS Property Trust No.2 (UK)
• ISIS Property Trust No.1 (UK)
VolatilityUK majors in terms of market capitalisation and coverage (number of banks covering company in brackets) are Land Securities (13), British Land (14), Liberty International (16), Hammerson (14), Segro (13) and Brixton (11). Recently merged Derwent London is not included in the ‘majors’ group as current number of banks covering the stock is only six. Looking at the merged size of the company, one would expect coverage on the company to broaden in the future. What is clearly evident from the graph is that since December 1999, market volatility in all of the UK majors has fallen significantly. Brixton and British Land have seen volatility almost half in the six and half years period covered in graph.1. At the end of 1999, the UK majors recorded volatility figures within the range 20-30%, compared against current levels which are not only significantly lower, but also tightly packed into a narrower 15-20% band.
Using the same principle, Continental Europe majors in terms of coverage (in brackets) are: Cofinimmo (12), Unibail (18), Gecina (14), Klepierre (16), IVG Immobilien (20), Corio (13), Deutsche Euroshop (16) and Rodamco Europe (16). Graph.2 highlights that with the exception of IVG, which has experienced quite some movement in terms of volatility since 1999, the majority of companies have generally remained within the 10-20% band-width. One noticeable exception is the leap in Gecina’s volatility in December 2006 fol-lowing SIIC 4 amendments.
Do lesser covered constituents display more volatility? In graph.3 we look at a selection of constituents with narrower coverage. The stocks included in this selection are CLS Holdings (2), Lamda Development (2), TK Development (2), Mucklow (2), and Primary
European Analyst Coverage
The aim of this article is to provide a clear picture of the level of coverage of the FTSE EPRA/NAREIT Europe Index constituents by European banks research/analyst teams. We obtained coverage lists from the major banks active in sector directly. In addition, we searched on Bloomberg for analyst coverage of individual companies. Table 1 highlights the source of the data (row 1). BK denotes information derived directly from the relevant bank and BB identifies Bloomberg as the source. Please note that stocks can be added or deleted to coverage lists and subsequently this table, in its current form, has a limited life. However, we encourage banks to update us directly with their coverage list, enabling EPRA publish an accurate list on www.epra.com in the future.
By: Fraser Hughes, EPRA
Health Properties (1). The broad volatility bandwidth of this group of companies is in the 20-40% range. There are two exceptions to this rule. TK Developments has experi-enced a roller coaster ride over the period both in terms of price and subsequently vol-atility, the later hit a peak of 80% at the end of 2004. Conversely, Lamda Development has reduced levels of volatility considerably since the end of 1999. From a peak of 100% in 2001, the company has taken a considerable trip south to finish at the 30% mark at this moment in time.
ConclusionAlthough this is a very basic piece of analy-sis, it would seem at first glance that stocks that have broad coverage generally experi-ence lower levels of market volatility. The UK majors have seen decreased volatility since 1999, and continental European volatility, amongst the well followed companies has remained fairly stable. A selection of the lesser followed companies, displays on average, higher volatility figures. There are still a number of constituents in the FTSE EPRA/NAREIT Europe Index that are not covered, being mixed bag of new and estab-lished companies. We would expect that cov-erage in the new companies be undertaken in due course. Once again, we encourage banks and companies to update us on a regular basis to ensure our overview is accu-rate.
EPRA NAV & EPS Consensus EstimatesLooking forward, we would like to establish a network of banks willing to contribute to a series of NAV and EPS consensus estimates, at least for the widely covered constituents in the FTSE EPRA/NAREIT Europe Index. In principle, the majority of banks we have approached directly are willing to partici-pate. It you have not been approached, and would like to contribute to the project, please contact us directly.
[email protected]@epra.com

www.epra.com - july 2007 - epra news 27
market focus
Graph 1 UK Majors- 36 months rolling Volatility
Land Securities
35%
30%
25%
20%
15%
10%Dec-99
British Land
Liberty Intl
Hammerson
Segro
Brixton
Jun-00 Dec-00 Jun-01 Dec-01 Jun-02 Dec-02 Jun-03 Dec-03 Jun-04 Dec-04 Jun-05 Dec-05 Jun-06 Dec-06
Vola
tility
Graph 2 Continental Europe Majors - 36 months rolling Volatility
Dec-99 Jun-00 Dec-00 Jun-01 Dec-01 Jun-02 Dec-02 Jun-03 Dec-03 Jun-04 Dec-04 Jun-05 Dec-05 Jun-06 Dec-06
40%
35%
30%
25%
20%
15%
10%
5%
0%
Cofinimmo
Unibail
Gecina
Klepierre
IVG Immobilien
Corio
Deutsche Euroshop
Rodamco Europe
European Analyst Coverage
Graph 3 Less Covered Stocks - 36 months rolling Volatility120%
100%
80%
60%
40%
20%
0%
Vola
tility
CLS Holdings
Lamda Development
Mucklow
Primary Health Properties
TK Development
Dec-99 Jun-00 Dec-00 Jun-01 Dec-01 Jun-02 Dec-02 Jun-03 Dec-03 Jun-04 Dec-04 Jun-05 Dec-05 Jun-06 Dec-06
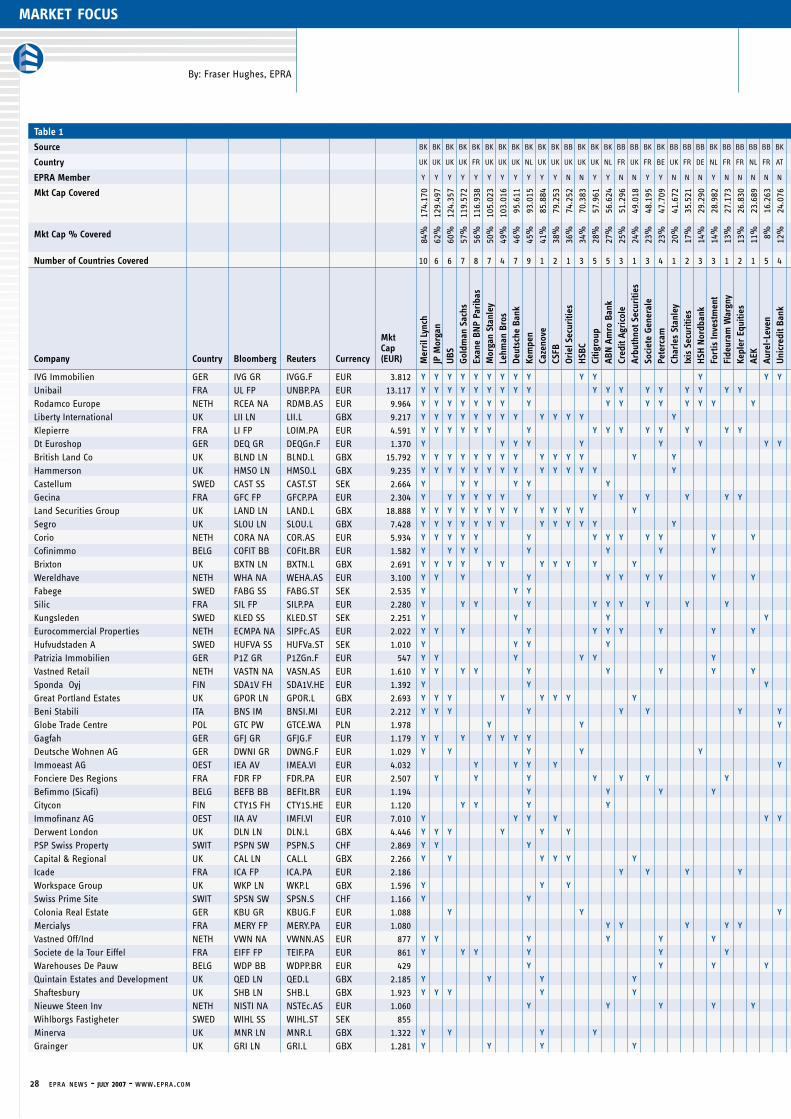
28 epra news - july 2007 - www.epra.com
market focus
By: Fraser Hughes, EPRA
Table 1
Source BK BK BK BK BK BK BK BK BK BK BK BB BK BK BK BB BB BK BK BB BB BB BK BB BB BB BB BK BB BB BB BB BB BB BB BB BK BB BB BB BB BB BB BB BB BB BB BB BB BB BB BB BB BB BB BB BB BB BB BB BB BB BB BB BB BB BB BB BB BB BB BB BB BB BB BB BB BB BB BB BB BB BB BB
Country UK UK UK UK FR UK UK UK NL UK UK UK UK UK NL FR UK FR BE UK FR DE NL FR FR NL FR AT DE SE SE FR UK SE SE SE BE SE SA SA DE US DE DE FI DE DE SW SW AT DE BE FI UK BE UK PO PO PO PO AT UK UK PT FI DE UK SW DE UK IT NO GR DK IT IT SP SP SP UK GR GR FR FR
EPRA Member Y Y Y Y Y Y Y Y Y Y Y N N Y Y N N Y Y N N N Y N N N N N N N N N N N N N Y N N N N N N N N N N N N N N N N N N N N N N N N N N N N N N N N N N N N N N N N N N N N N N N
Mkt Cap Covered
174.
170
129.
497
124.
357
119.
572
116.
938
105.
023
103.
016
95.6
11
93.0
15
85.8
84
79.2
53
74.2
52
70.3
83
57.9
61
56.6
24
51.2
96
49.0
18
48.1
95
47.7
09
41.
672
35.5
21
29.2
90
28.9
82
27.1
73
26.8
30
23.6
89
16.2
63
24.0
76
12.8
32
11.8
59
10.4
59
10.3
55
10.2
65
9.95
0 9.
922
9.92
2 9.
610
9.31
5 9.
217
9.21
7 7.
845
7.71
1 6.
757
5.72
8 5.
614
5.18
1 4.
991
4.98
7 4.
987
4.03
2 3.
891
3.41
7 2.
950
2.86
8 2.
777
2.18
5 1.
978
1.97
8 1.
978
1.97
8 1.
860
1.59
6 1.
596
1.58
2 1.
392
1.37
0 1.
239
1.16
6 1.
088
1.04
3 1.
039
966
901
822
714
628
461
461
461
294
272
272
194
194
Mkt Cap % Covered
84%
62%
60%
57%
56%
50%
49%
46%
45%
41%
38%
36%
34%
28%
27%
25%
24%
23%
23%
20%
17%
14%
14%
13%
13%
11% 8% 12% 6% 6% 5% 5% 5% 5% 5% 5% 5% 5% 4% 4% 4% 4% 3% 3% 3% 3% 2% 2% 2% 2% 2% 2% 1% 1% 1% 1% 1% 1% 1% 1% 1% 1% 1% 1% 1% 1% 1% 1% 1% 1% 1% 1% 0% 0% 0% 0% 0% 0% 0% 0% 0% 0% 0% 0%
Number of Countries Covered 10 6 6 7 8 7 4 7 9 1 2 1 3 5 5 3 1 3 4 1 2 3 3 1 2 1 5 4 2 4 2 1 1 2 1 1 3 1 1 1 1 2 1 1 2 1 1 1 1 1 3 1 1 1 1 1 1 1 1 1 1 1 1 1 1 1 1 1 1 1 1 1 1 1 1 1 1 1 1 1 1 1 1 1
Company Country Bloomberg Reuters Currency
Mkt Cap (EUR) M
erri
l Lyn
chJP
Mor
gan
UBS
Gol
dman
Sac
hsEx
ane
BNP
Pari
bas
Mor
gan
Stan
ley
Lehm
an B
ros
Deut
sche
Ban
kKe
mpe
nCa
zeno
veCS
FBO
riel
Sec
uriti
esH
SBC
Citig
roup
ABN
Am
ro B
ank
Cred
it Ag
rico
leAr
buth
not S
ecur
ities
Soci
ete
Gen
eral
ePe
terc
amCh
arle
s St
anle
yIx
is S
ecur
ities
HSH
Nor
dban
kFo
rtis
Inve
stm
ent
Fide
uram
War
gny
Kepl
er E
quiti
esAE
KAu
rel-
Leve
nU
nicr
edit
Bank
Sal O
ppen
heim
SEB
Ensk
ilda
ABG
Sun
dal C
ollie
rO
ddo
& C
ieEv
olut
ion
Secu
ritie
sCa
rneg
ieHa
ndel
sban
ken
Kaup
thin
gIN
G W
hole
sale
Ban
kSw
edba
nkM
acqu
arie
Fir
st S
outh
Barn
ard
Jaco
bsW
estL
B Eq
uitie
sSt
anda
rd &
Poo
rsH
SBC
Trin
kaus
Bank
haus
Lam
peFI
M S
ecur
ities
Bank
haus
Met
zle
DZ B
ank
Bank
Von
tobe
lZu
erch
er K
anto
nalb
ank
Erst
e Ba
nkBe
renb
erg
Bank
Dexi
a Se
curi
ties
OKO
Ban
kBr
idge
wel
l Sec
uriti
esBa
nk D
egro
ofSe
ymou
r Pi
erce
Patr
ia F
inan
cePe
kao
Secu
ritie
sPK
O B
P Se
curi
ties
Woo
d &
Co
SRC
Rese
arch
Inve
stec
Panm
ure
Gor
don
BCP
eQ B
ank
Equi
net I
nstit
ute
Teat
her
& G
reen
Bank
Sar
asin
Com
mer
zban
kDr
esdn
er K
lein
wor
tCe
ntro
sim
Pare
to S
ecur
ities
Prot
on B
ank
Nor
dea
Secu
ritie
sIn
terb
anca
Rasb
ank
Bane
sto
Bols
aIb
er S
ecur
ities
La C
aixa
Num
is S
ecur
ities
Inve
st B
ank
of G
reec
ePi
raeu
s Se
curi
ties
Arke
on F
inan
ceCy
ril F
inan
ceTo
tal
IVG Immobilien GER IVG GR IVGG.F EUR 3.812 Y Y Y Y Y Y Y Y Y Y Y Y Y Y Y Y Y Y Y Y 20
Unibail FRA UL FP UNBP.PA EUR 13.117 Y Y Y Y Y Y Y Y Y Y Y Y Y Y Y Y Y Y 18
Rodamco Europe NETH RCEA NA RDMB.AS EUR 9.964 Y Y Y Y Y Y Y Y Y Y Y Y Y Y Y Y 16
Liberty International UK LII LN LII.L GBX 9.217 Y Y Y Y Y Y Y Y Y Y Y Y Y Y Y Y 16
Klepierre FRA LI FP LOIM.PA EUR 4.591 Y Y Y Y Y Y Y Y Y Y Y Y Y Y Y Y 16
Dt Euroshop GER DEQ GR DEQGn.F EUR 1.370 Y Y Y Y Y Y Y Y Y Y Y Y Y Y Y Y 16
British Land Co UK BLND LN BLND.L GBX 15.792 Y Y Y Y Y Y Y Y Y Y Y Y Y Y 14
Hammerson UK HMSO LN HMSO.L GBX 9.235 Y Y Y Y Y Y Y Y Y Y Y Y Y Y 14
Castellum SWED CAST SS CAST.ST SEK 2.664 Y Y Y Y Y Y Y Y Y Y Y Y Y Y 14
Gecina FRA GFC FP GFCP.PA EUR 2.304 Y Y Y Y Y Y Y Y Y Y Y Y Y Y 14
Land Securities Group UK LAND LN LAND.L GBX 18.888 Y Y Y Y Y Y Y Y Y Y Y Y Y 13
Segro UK SLOU LN SLOU.L GBX 7.428 Y Y Y Y Y Y Y Y Y Y Y Y Y 13
Corio NETH CORA NA COR.AS EUR 5.934 Y Y Y Y Y Y Y Y Y Y Y Y Y 13
Cofinimmo BELG COFIT BB COFIt.BR EUR 1.582 Y Y Y Y Y Y Y Y Y Y Y Y 12
Brixton UK BXTN LN BXTN.L GBX 2.691 Y Y Y Y Y Y Y Y Y Y Y 11
Wereldhave NETH WHA NA WEHA.AS EUR 3.100 Y Y Y Y Y Y Y Y Y Y 10
Fabege SWED FABG SS FABG.ST SEK 2.535 Y Y Y Y Y Y Y Y Y Y 10
Silic FRA SIL FP SILP.PA EUR 2.280 Y Y Y Y Y Y Y Y Y Y 10
Kungsleden SWED KLED SS KLED.ST SEK 2.251 Y Y Y Y Y Y Y Y Y Y 10
Eurocommercial Properties NETH ECMPA NA SIPFc.AS EUR 2.022 Y Y Y Y Y Y Y Y Y Y 10
Hufvudstaden A SWED HUFVA SS HUFVa.ST SEK 1.010 Y Y Y Y Y Y Y Y Y Y 10
Patrizia Immobilien GER P1Z GR P1ZGn.F EUR 547 Y Y Y Y Y Y Y Y Y Y 10
Vastned Retail NETH VASTN NA VASN.AS EUR 1.610 Y Y Y Y Y Y Y Y Y 9
Sponda Oyj FIN SDA1V FH SDA1V.HE EUR 1.392 Y Y Y Y Y Y Y Y Y 9
Great Portland Estates UK GPOR LN GPOR.L GBX 2.693 Y Y Y Y Y Y Y Y 8
Beni Stabili ITA BNS IM BNSI.MI EUR 2.212 Y Y Y Y Y Y Y Y 8
Globe Trade Centre POL GTC PW GTCE.WA PLN 1.978 Y Y Y Y Y Y Y Y 8
Gagfah GER GFJ GR GFJG.F EUR 1.179 Y Y Y Y Y Y Y Y 8
Deutsche Wohnen AG GER DWNI GR DWNG.F EUR 1.029 Y Y Y Y Y Y Y Y 8
Immoeast AG OEST IEA AV IMEA.VI EUR 4.032 Y Y Y Y Y Y Y 7
Fonciere Des Regions FRA FDR FP FDR.PA EUR 2.507 Y Y Y Y Y Y Y 7
Befimmo (Sicafi) BELG BEFB BB BEFIt.BR EUR 1.194 Y Y Y Y Y Y Y 7
Citycon FIN CTY1S FH CTY1S.HE EUR 1.120 Y Y Y Y Y Y Y 7
Immofinanz AG OEST IIA AV IMFI.VI EUR 7.010 Y Y Y Y Y Y 6
Derwent London UK DLN LN DLN.L GBX 4.446 Y Y Y Y Y Y 6
PSP Swiss Property SWIT PSPN SW PSPN.S CHF 2.869 Y Y Y Y Y Y 6
Capital & Regional UK CAL LN CAL.L GBX 2.266 Y Y Y Y Y Y 6
Icade FRA ICA FP ICA.PA EUR 2.186 Y Y Y Y Y Y 6
Workspace Group UK WKP LN WKP.L GBX 1.596 Y Y Y Y Y Y 6
Swiss Prime Site SWIT SPSN SW SPSN.S CHF 1.166 Y Y Y Y Y Y 6
Colonia Real Estate GER KBU GR KBUG.F EUR 1.088 Y Y Y Y Y Y 6
Mercialys FRA MERY FP MERY.PA EUR 1.080 Y Y Y Y Y Y 6
Vastned Off/Ind NETH VWN NA VWNN.AS EUR 877 Y Y Y Y Y Y 6
Societe de la Tour Eiffel FRA EIFF FP TEIF.PA EUR 861 Y Y Y Y Y Y 6
Warehouses De Pauw BELG WDP BB WDPP.BR EUR 429 Y Y Y Y Y Y 6
Quintain Estates and Development UK QED LN QED.L GBX 2.185 Y Y Y Y Y 5
Shaftesbury UK SHB LN SHB.L GBX 1.923 Y Y Y Y Y 5
Nieuwe Steen Inv NETH NISTI NA NSTEc.AS EUR 1.060 Y Y Y Y Y 5
Wihlborgs Fastigheter SWED WIHL SS WIHL.ST SEK 855 Y Y Y Y Y 5
Minerva UK MNR LN MNR.L GBX 1.322 Y Y Y Y 4
Grainger UK GRI LN GRI.L GBX 1.281 Y Y Y Y 4

www.epra.com - july 2007 - epra news 29
market focus
European Analyst Coverage
Table 1
Source BK BK BK BK BK BK BK BK BK BK BK BB BK BK BK BB BB BK BK BB BB BB BK BB BB BB BB BK BB BB BB BB BB BB BB BB BK BB BB BB BB BB BB BB BB BB BB BB BB BB BB BB BB BB BB BB BB BB BB BB BB BB BB BB BB BB BB BB BB BB BB BB BB BB BB BB BB BB BB BB BB BB BB BB
Country UK UK UK UK FR UK UK UK NL UK UK UK UK UK NL FR UK FR BE UK FR DE NL FR FR NL FR AT DE SE SE FR UK SE SE SE BE SE SA SA DE US DE DE FI DE DE SW SW AT DE BE FI UK BE UK PO PO PO PO AT UK UK PT FI DE UK SW DE UK IT NO GR DK IT IT SP SP SP UK GR GR FR FR
EPRA Member Y Y Y Y Y Y Y Y Y Y Y N N Y Y N N Y Y N N N Y N N N N N N N N N N N N N Y N N N N N N N N N N N N N N N N N N N N N N N N N N N N N N N N N N N N N N N N N N N N N N N
Mkt Cap Covered
174.
170
129.
497
124.
357
119.
572
116.
938
105.
023
103.
016
95.6
11
93.0
15
85.8
84
79.2
53
74.2
52
70.3
83
57.9
61
56.6
24
51.2
96
49.0
18
48.1
95
47.7
09
41.
672
35.5
21
29.2
90
28.9
82
27.1
73
26.8
30
23.6
89
16.2
63
24.0
76
12.8
32
11.8
59
10.4
59
10.3
55
10.2
65
9.95
0 9.
922
9.92
2 9.
610
9.31
5 9.
217
9.21
7 7.
845
7.71
1 6.
757
5.72
8 5.
614
5.18
1 4.
991
4.98
7 4.
987
4.03
2 3.
891
3.41
7 2.
950
2.86
8 2.
777
2.18
5 1.
978
1.97
8 1.
978
1.97
8 1.
860
1.59
6 1.
596
1.58
2 1.
392
1.37
0 1.
239
1.16
6 1.
088
1.04
3 1.
039
966
901
822
714
628
461
461
461
294
272
272
194
194
Mkt Cap % Covered
84%
62%
60%
57%
56%
50%
49%
46%
45%
41%
38%
36%
34%
28%
27%
25%
24%
23%
23%
20%
17%
14%
14%
13%
13%
11% 8% 12% 6% 6% 5% 5% 5% 5% 5% 5% 5% 5% 4% 4% 4% 4% 3% 3% 3% 3% 2% 2% 2% 2% 2% 2% 1% 1% 1% 1% 1% 1% 1% 1% 1% 1% 1% 1% 1% 1% 1% 1% 1% 1% 1% 1% 0% 0% 0% 0% 0% 0% 0% 0% 0% 0% 0% 0%
Number of Countries Covered 10 6 6 7 8 7 4 7 9 1 2 1 3 5 5 3 1 3 4 1 2 3 3 1 2 1 5 4 2 4 2 1 1 2 1 1 3 1 1 1 1 2 1 1 2 1 1 1 1 1 3 1 1 1 1 1 1 1 1 1 1 1 1 1 1 1 1 1 1 1 1 1 1 1 1 1 1 1 1 1 1 1 1 1
Company Country Bloomberg Reuters Currency
Mkt Cap (EUR) M
erri
l Lyn
chJP
Mor
gan
UBS
Gol
dman
Sac
hsEx
ane
BNP
Pari
bas
Mor
gan
Stan
ley
Lehm
an B
ros
Deut
sche
Ban
kKe
mpe
nCa
zeno
veCS
FBO
riel
Sec
uriti
esH
SBC
Citig
roup
ABN
Am
ro B
ank
Cred
it Ag
rico
leAr
buth
not S
ecur
ities
Soci
ete
Gen
eral
ePe
terc
amCh
arle
s St
anle
yIx
is S
ecur
ities
HSH
Nor
dban
kFo
rtis
Inve
stm
ent
Fide
uram
War
gny
Kepl
er E
quiti
esAE
KAu
rel-
Leve
nU
nicr
edit
Bank
Sal O
ppen
heim
SEB
Ensk
ilda
ABG
Sun
dal C
ollie
rO
ddo
& C
ieEv
olut
ion
Secu
ritie
sCa
rneg
ieHa
ndel
sban
ken
Kaup
thin
gIN
G W
hole
sale
Ban
kSw
edba
nkM
acqu
arie
Fir
st S
outh
Barn
ard
Jaco
bsW
estL
B Eq
uitie
sSt
anda
rd &
Poo
rsH
SBC
Trin
kaus
Bank
haus
Lam
peFI
M S
ecur
ities
Bank
haus
Met
zle
DZ B
ank
Bank
Von
tobe
lZu
erch
er K
anto
nalb
ank
Erst
e Ba
nkBe
renb
erg
Bank
Dexi
a Se
curi
ties
OKO
Ban
kBr
idge
wel
l Sec
uriti
esBa
nk D
egro
ofSe
ymou
r Pi
erce
Patr
ia F
inan
cePe
kao
Secu
ritie
sPK
O B
P Se
curi
ties
Woo
d &
Co
SRC
Rese
arch
Inve
stec
Panm
ure
Gor
don
BCP
eQ B
ank
Equi
net I
nstit
ute
Teat
her
& G
reen
Bank
Sar
asin
Com
mer
zban
kDr
esdn
er K
lein
wor
tCe
ntro
sim
Pare
to S
ecur
ities
Prot
on B
ank
Nor
dea
Secu
ritie
sIn
terb
anca
Rasb
ank
Bane
sto
Bols
aIb
er S
ecur
ities
La C
aixa
Num
is S
ecur
ities
Inve
st B
ank
of G
reec
ePi
raeu
s Se
curi
ties
Arke
on F
inan
ceCy
ril F
inan
ceTo
tal
IVG Immobilien GER IVG GR IVGG.F EUR 3.812 Y Y Y Y Y Y Y Y Y Y Y Y Y Y Y Y Y Y Y Y 20
Unibail FRA UL FP UNBP.PA EUR 13.117 Y Y Y Y Y Y Y Y Y Y Y Y Y Y Y Y Y Y 18
Rodamco Europe NETH RCEA NA RDMB.AS EUR 9.964 Y Y Y Y Y Y Y Y Y Y Y Y Y Y Y Y 16
Liberty International UK LII LN LII.L GBX 9.217 Y Y Y Y Y Y Y Y Y Y Y Y Y Y Y Y 16
Klepierre FRA LI FP LOIM.PA EUR 4.591 Y Y Y Y Y Y Y Y Y Y Y Y Y Y Y Y 16
Dt Euroshop GER DEQ GR DEQGn.F EUR 1.370 Y Y Y Y Y Y Y Y Y Y Y Y Y Y Y Y 16
British Land Co UK BLND LN BLND.L GBX 15.792 Y Y Y Y Y Y Y Y Y Y Y Y Y Y 14
Hammerson UK HMSO LN HMSO.L GBX 9.235 Y Y Y Y Y Y Y Y Y Y Y Y Y Y 14
Castellum SWED CAST SS CAST.ST SEK 2.664 Y Y Y Y Y Y Y Y Y Y Y Y Y Y 14
Gecina FRA GFC FP GFCP.PA EUR 2.304 Y Y Y Y Y Y Y Y Y Y Y Y Y Y 14
Land Securities Group UK LAND LN LAND.L GBX 18.888 Y Y Y Y Y Y Y Y Y Y Y Y Y 13
Segro UK SLOU LN SLOU.L GBX 7.428 Y Y Y Y Y Y Y Y Y Y Y Y Y 13
Corio NETH CORA NA COR.AS EUR 5.934 Y Y Y Y Y Y Y Y Y Y Y Y Y 13
Cofinimmo BELG COFIT BB COFIt.BR EUR 1.582 Y Y Y Y Y Y Y Y Y Y Y Y 12
Brixton UK BXTN LN BXTN.L GBX 2.691 Y Y Y Y Y Y Y Y Y Y Y 11
Wereldhave NETH WHA NA WEHA.AS EUR 3.100 Y Y Y Y Y Y Y Y Y Y 10
Fabege SWED FABG SS FABG.ST SEK 2.535 Y Y Y Y Y Y Y Y Y Y 10
Silic FRA SIL FP SILP.PA EUR 2.280 Y Y Y Y Y Y Y Y Y Y 10
Kungsleden SWED KLED SS KLED.ST SEK 2.251 Y Y Y Y Y Y Y Y Y Y 10
Eurocommercial Properties NETH ECMPA NA SIPFc.AS EUR 2.022 Y Y Y Y Y Y Y Y Y Y 10
Hufvudstaden A SWED HUFVA SS HUFVa.ST SEK 1.010 Y Y Y Y Y Y Y Y Y Y 10
Patrizia Immobilien GER P1Z GR P1ZGn.F EUR 547 Y Y Y Y Y Y Y Y Y Y 10
Vastned Retail NETH VASTN NA VASN.AS EUR 1.610 Y Y Y Y Y Y Y Y Y 9
Sponda Oyj FIN SDA1V FH SDA1V.HE EUR 1.392 Y Y Y Y Y Y Y Y Y 9
Great Portland Estates UK GPOR LN GPOR.L GBX 2.693 Y Y Y Y Y Y Y Y 8
Beni Stabili ITA BNS IM BNSI.MI EUR 2.212 Y Y Y Y Y Y Y Y 8
Globe Trade Centre POL GTC PW GTCE.WA PLN 1.978 Y Y Y Y Y Y Y Y 8
Gagfah GER GFJ GR GFJG.F EUR 1.179 Y Y Y Y Y Y Y Y 8
Deutsche Wohnen AG GER DWNI GR DWNG.F EUR 1.029 Y Y Y Y Y Y Y Y 8
Immoeast AG OEST IEA AV IMEA.VI EUR 4.032 Y Y Y Y Y Y Y 7
Fonciere Des Regions FRA FDR FP FDR.PA EUR 2.507 Y Y Y Y Y Y Y 7
Befimmo (Sicafi) BELG BEFB BB BEFIt.BR EUR 1.194 Y Y Y Y Y Y Y 7
Citycon FIN CTY1S FH CTY1S.HE EUR 1.120 Y Y Y Y Y Y Y 7
Immofinanz AG OEST IIA AV IMFI.VI EUR 7.010 Y Y Y Y Y Y 6
Derwent London UK DLN LN DLN.L GBX 4.446 Y Y Y Y Y Y 6
PSP Swiss Property SWIT PSPN SW PSPN.S CHF 2.869 Y Y Y Y Y Y 6
Capital & Regional UK CAL LN CAL.L GBX 2.266 Y Y Y Y Y Y 6
Icade FRA ICA FP ICA.PA EUR 2.186 Y Y Y Y Y Y 6
Workspace Group UK WKP LN WKP.L GBX 1.596 Y Y Y Y Y Y 6
Swiss Prime Site SWIT SPSN SW SPSN.S CHF 1.166 Y Y Y Y Y Y 6
Colonia Real Estate GER KBU GR KBUG.F EUR 1.088 Y Y Y Y Y Y 6
Mercialys FRA MERY FP MERY.PA EUR 1.080 Y Y Y Y Y Y 6
Vastned Off/Ind NETH VWN NA VWNN.AS EUR 877 Y Y Y Y Y Y 6
Societe de la Tour Eiffel FRA EIFF FP TEIF.PA EUR 861 Y Y Y Y Y Y 6
Warehouses De Pauw BELG WDP BB WDPP.BR EUR 429 Y Y Y Y Y Y 6
Quintain Estates and Development UK QED LN QED.L GBX 2.185 Y Y Y Y Y 5
Shaftesbury UK SHB LN SHB.L GBX 1.923 Y Y Y Y Y 5
Nieuwe Steen Inv NETH NISTI NA NSTEc.AS EUR 1.060 Y Y Y Y Y 5
Wihlborgs Fastigheter SWED WIHL SS WIHL.ST SEK 855 Y Y Y Y Y 5
Minerva UK MNR LN MNR.L GBX 1.322 Y Y Y Y 4
Grainger UK GRI LN GRI.L GBX 1.281 Y Y Y Y 4

30 epra news - july 2007 - www.epra.com
market focus
Table 1
Source BK BK BK BK BK BK BK BK BK BK BK BB BK BK BK BB BB BK BK BB BB BB BK BB BB BB BB BK BB BB BB BB BB BB BB BB BK BB BB BB BB BB BB BB BB BB BB BB BB BB BB BB BB BB BB BB BB BB BB BB BB BB BB BB BB BB BB BB BB BB BB BB BB BB BB BB BB BB BB BB BB BB BB BB
Country UK UK UK UK FR UK UK UK NL UK UK UK UK UK NL FR UK FR BE UK FR DE NL FR FR NL FR AT DE SE SE FR UK SE SE SE BE SE SA SA DE US DE DE FI DE DE SW SW AT DE BE FI UK BE UK PO PO PO PO AT UK UK PT FI DE UK SW DE UK IT NO GR DK IT IT SP SP SP UK GR GR FR FR
EPRA Member Y Y Y Y Y Y Y Y Y Y Y N N Y Y N N Y Y N N N Y N N N N N N N N N N N N N Y N N N N N N N N N N N N N N N N N N N N N N N N N N N N N N N N N N N N N N N N N N N N N N N
Mkt Cap Covered
174.
170
129.
497
124.
357
119.
572
116.
938
105.
023
103.
016
95.6
11
93.0
15
85.8
84
79.2
53
74.2
52
70.3
83
57.9
61
56.6
24
51.2
96
49.0
18
48.1
95
47.7
09
41.
672
35.5
21
29.2
90
28.9
82
27.1
73
26.8
30
23.6
89
16.2
63
24.0
76
12.8
32
11.8
59
10.4
59
10.3
55
10.2
65
9.95
0 9.
922
9.92
2 9.
610
9.31
5 9.
217
9.21
7 7.
845
7.71
1 6.
757
5.72
8 5.
614
5.18
1 4.
991
4.98
7 4.
987
4.03
2 3.
891
3.41
7 2.
950
2.86
8 2.
777
2.18
5 1.
978
1.97
8 1.
978
1.97
8 1.
860
1.59
6 1.
596
1.58
2 1.
392
1.37
0 1.
239
1.16
6 1.
088
1.04
3 1.
039
966
901
822
714
628
461
461
461
294
272
272
194
194
Mkt Cap % Covered
84%
62%
60%
57%
56%
50%
49%
46%
45%
41%
38%
36%
34%
28%
27%
25%
24%
23%
23%
20%
17%
14%
14%
13%
13%
11% 8% 12% 6% 6% 5% 5% 5% 5% 5% 5% 5% 5% 4% 4% 4% 4% 3% 3% 3% 3% 2% 2% 2% 2% 2% 2% 1% 1% 1% 1% 1% 1% 1% 1% 1% 1% 1% 1% 1% 1% 1% 1% 1% 1% 1% 1% 0% 0% 0% 0% 0% 0% 0% 0% 0% 0% 0% 0%
Number of Countries Covered 10 6 6 7 8 7 4 7 9 1 2 1 3 5 5 3 1 3 4 1 2 3 3 1 2 1 5 4 2 4 2 1 1 2 1 1 3 1 1 1 1 2 1 1 2 1 1 1 1 1 3 1 1 1 1 1 1 1 1 1 1 1 1 1 1 1 1 1 1 1 1 1 1 1 1 1 1 1 1 1 1 1 1 1
Company Country Bloomberg Reuters Currency
Mkt Cap (EUR) M
erri
l Lyn
chJP
Mor
gan
UBS
Gol
dman
Sac
hsEx
ane
BNP
Pari
bas
Mor
gan
Stan
ley
Lehm
an B
ros
Deut
sche
Ban
kKe
mpe
nCa
zeno
veCS
FBO
riel
Sec
uriti
esH
SBC
Citig
roup
ABN
Am
ro B
ank
Cred
it Ag
rico
leAr
buth
not S
ecur
ities
Soci
ete
Gen
eral
ePe
terc
amCh
arle
s St
anle
yIx
is S
ecur
ities
HSH
Nor
dban
kFo
rtis
Inve
stm
ent
Fide
uram
War
gny
Kepl
er E
quiti
esAE
KAu
rel-
Leve
nU
nicr
edit
Bank
Sal O
ppen
heim
SEB
Ensk
ilda
ABG
Sun
dal C
ollie
rO
ddo
& C
ieEv
olut
ion
Secu
ritie
sCa
rneg
ieHa
ndel
sban
ken
Kaup
thin
gIN
G W
hole
sale
Ban
kSw
edba
nkM
acqu
arie
Fir
st S
outh
Barn
ard
Jaco
bsW
estL
B Eq
uitie
sSt
anda
rd &
Poo
rsH
SBC
Trin
kaus
Bank
haus
Lam
peFI
M S
ecur
ities
Bank
haus
Met
zle
DZ B
ank
Bank
Von
tobe
lZu
erch
er K
anto
nalb
ank
Erst
e Ba
nkBe
renb
erg
Bank
Dexi
a Se
curi
ties
OKO
Ban
kBr
idge
wel
l Sec
uriti
esBa
nk D
egro
ofSe
ymou
r Pi
erce
Patr
ia F
inan
cePe
kao
Secu
ritie
sPK
O B
P Se
curi
ties
Woo
d &
Co
SRC
Rese
arch
Inve
stec
Panm
ure
Gor
don
BCP
eQ B
ank
Equi
net I
nstit
ute
Teat
her
& G
reen
Bank
Sar
asin
Com
mer
zban
kDr
esdn
er K
lein
wor
tCe
ntro
sim
Pare
to S
ecur
ities
Prot
on B
ank
Nor
dea
Secu
ritie
sIn
terb
anca
Rasb
ank
Bane
sto
Bols
aIb
er S
ecur
ities
La C
aixa
Num
is S
ecur
ities
Inve
st B
ank
of G
reec
ePi
raeu
s Se
curi
ties
Arke
on F
inan
ceCy
ril F
inan
ceTo
tal
Unite Group UK UTG LN UTG.L GBX 1.239 Y Y Y Y 4
ProLogis European Properties NETH PEPR NA PEPR.AS EUR 1.171 Y Y Y Y 4
Big Yellow Group UK BYG LN BYG.L GBX 1.048 Y Y Y Y 4
Aedes ITA AE IM AEDI.MI EUR 714 Y Y Y Y 4
Development Securities UK DSC LN DSC.L GBX 514 Y Y Y Y 4
Renta Corp Real Estate SA SP REN SM REN.MC EUR 461 Y Y Y Y 4
Zueblin Immobilien Holding AG SWIT ZUBN SW ZUBN.S CHF 335 Y Y Y Y 4
Acanthe Developpement FRA ACAN FP CFMP.PA EUR 194 Y Y Y Y 4
Conwert Immobilien Invest OEST CWI AV CONW.VI EUR 1.860 Y Y Y 3
St.Modwen Properties UK SMP LN SMP.L GBX 1.272 Y Y Y 3
Risanamento ITA RN IM RN.MI EUR 1.039 Y Y Y 3
Babis Vovos International GRC VOVOS GA VOVr.AT EUR 901 Y Y Y 3
Mapeley UK MAY LN MAY.L GBX 881 Y Y Y 3
Helical Bar UK HLCL LN HLCL.L GBX 848 Y Y Y 3
Immobiliare Grande Distribution ITA IGD IM IGD.MI EUR 628 Y Y Y 3
Allreal Hld N SWIT ALLN SW ALLN.S CHF 617 Y Y Y 3
Klovern AB SWED KLOV SS KLOV.ST SEK 607 Y Y Y 3
LEASINVEST-SICAFI BELG LEAS BB LNRE.BR EUR 212 Y Y Y 3
Wereldhave Belgium BELG WEHB BB WEHAe.BR EUR 183 Y Y Y 3
Ca Immobilien OEST CAI AV CAIV.VI EUR 1.876 Y Y 2
Norwegian Property ASA NOR NPRO NO NPRO.OL NOK 966 Y Y 2
CLS Holdings UK CLI LN CLI.L GBX 785 Y Y 2
TK Development DEN TKDV DC TKDV.CO DKK 636 Y Y 2
Technopolis FIN TPS1V FH TPS1V.HE EUR 438 Y Y 2
Lamda Develop/R GRC LAMDA GA LMDr.AT EUR 272 Y Y 2
Affine FRA IML FP BTPP.PA EUR 239 Y Y 2
Mucklow (A.& J.)Group UK MKLW LN MKLW.L GBX 223 Y Y 2
Keops DEN KEOPS DC KEOPS.CO DKK 186 Y Y 2
Invista Foundation Property Trust UK IFD LN IFD.L GBX 909 Y 1
ING UK Real Estate Income Trust UK IRET LN IRET.L GBX 774 Y 1
F&C Commercial Property Trust UK FCPT LN FCPT.L GBX 769 Y 1
UK Balanced Property Trust UK UBR LN UBR.L GBX 552 Y 1
Daejan Hdg UK DJAN LN DJAN.L GBX 479 Y 1
Invesco Property Income Trust UK IPI LN IPI.L GBX 368 Y 1
Westbury Property Fund UK WPFI LN WPF.L GBX 354 Y 1
Teesland Advantage Property Inc Tst UK TAP LN TAP.L GBX 321 Y 1
Primary Health Prop. UK PHP LN PHP.L GBX 294 Y 1
Intervest Offices BELG INTO BB PRIF.BR EUR 270 Y 1
Eurobank Properties GRC EUPRO GA EUPr.AT EUR 170 Y 1
Sparkassen Immobilien OEST SPI AV SIAG.VI EUR 1.088 0
Assura UK AGR LN AGR.L GBX 1.068 0
Alstria Office GER AOX GR AOXG.F EUR 605 0
UK Commercial Property Trust UK UKCM LN UKCMq.L GBX 526 0
Plaza Centers NV UK PLAZ LN PLAZ.L GBX 479 0
Sparkassen Immo Invest Genusscheine OEST SIIG AV SIMIg.VI EUR 324 0
Freeport UK FPR LN FPR.L GBX 287 0
Standard Life Inv Prop Inc Trust UK SLI LN SLI.L GBX 248 0
Marylebone Warwick Balfour Group UK MWB LN MWB.L GBX 237 0
ISIS Property Trust 2 Ld UK IRP LN IRP.L GBX 223 0
ISIS Property Trust Ld UK IPT LN IPT.L GBX 168 0
208.631 56 26 25 22 19 17 15 18 35 19 10 10 11 14 18 12 10 10 14 4 7 5 14 9 8 6 6 9 9 8 6 5 2 6 6 6 7 5 1 1 5 4 4 3 4 2 2 4 4 1 3 4 3 2 2 1 1 1 1 1 1 1 1 1 1 1 1 1 1 3 1 1 1 2 1 1 1 1 1 1 1 1 1 1
By: Fraser Hughes, EPRA

www.epra.com - july 2007 - epra news 31
market focus
Table 1
Source BK BK BK BK BK BK BK BK BK BK BK BB BK BK BK BB BB BK BK BB BB BB BK BB BB BB BB BK BB BB BB BB BB BB BB BB BK BB BB BB BB BB BB BB BB BB BB BB BB BB BB BB BB BB BB BB BB BB BB BB BB BB BB BB BB BB BB BB BB BB BB BB BB BB BB BB BB BB BB BB BB BB BB BB
Country UK UK UK UK FR UK UK UK NL UK UK UK UK UK NL FR UK FR BE UK FR DE NL FR FR NL FR AT DE SE SE FR UK SE SE SE BE SE SA SA DE US DE DE FI DE DE SW SW AT DE BE FI UK BE UK PO PO PO PO AT UK UK PT FI DE UK SW DE UK IT NO GR DK IT IT SP SP SP UK GR GR FR FR
EPRA Member Y Y Y Y Y Y Y Y Y Y Y N N Y Y N N Y Y N N N Y N N N N N N N N N N N N N Y N N N N N N N N N N N N N N N N N N N N N N N N N N N N N N N N N N N N N N N N N N N N N N N
Mkt Cap Covered
174.
170
129.
497
124.
357
119.
572
116.
938
105.
023
103.
016
95.6
11
93.0
15
85.8
84
79.2
53
74.2
52
70.3
83
57.9
61
56.6
24
51.2
96
49.0
18
48.1
95
47.7
09
41.
672
35.5
21
29.2
90
28.9
82
27.1
73
26.8
30
23.6
89
16.2
63
24.0
76
12.8
32
11.8
59
10.4
59
10.3
55
10.2
65
9.95
0 9.
922
9.92
2 9.
610
9.31
5 9.
217
9.21
7 7.
845
7.71
1 6.
757
5.72
8 5.
614
5.18
1 4.
991
4.98
7 4.
987
4.03
2 3.
891
3.41
7 2.
950
2.86
8 2.
777
2.18
5 1.
978
1.97
8 1.
978
1.97
8 1.
860
1.59
6 1.
596
1.58
2 1.
392
1.37
0 1.
239
1.16
6 1.
088
1.04
3 1.
039
966
901
822
714
628
461
461
461
294
272
272
194
194
Mkt Cap % Covered
84%
62%
60%
57%
56%
50%
49%
46%
45%
41%
38%
36%
34%
28%
27%
25%
24%
23%
23%
20%
17%
14%
14%
13%
13%
11% 8% 12% 6% 6% 5% 5% 5% 5% 5% 5% 5% 5% 4% 4% 4% 4% 3% 3% 3% 3% 2% 2% 2% 2% 2% 2% 1% 1% 1% 1% 1% 1% 1% 1% 1% 1% 1% 1% 1% 1% 1% 1% 1% 1% 1% 1% 0% 0% 0% 0% 0% 0% 0% 0% 0% 0% 0% 0%
Number of Countries Covered 10 6 6 7 8 7 4 7 9 1 2 1 3 5 5 3 1 3 4 1 2 3 3 1 2 1 5 4 2 4 2 1 1 2 1 1 3 1 1 1 1 2 1 1 2 1 1 1 1 1 3 1 1 1 1 1 1 1 1 1 1 1 1 1 1 1 1 1 1 1 1 1 1 1 1 1 1 1 1 1 1 1 1 1
Company Country Bloomberg Reuters Currency
Mkt Cap (EUR) M
erri
l Lyn
chJP
Mor
gan
UBS
Gol
dman
Sac
hsEx
ane
BNP
Pari
bas
Mor
gan
Stan
ley
Lehm
an B
ros
Deut
sche
Ban
kKe
mpe
nCa
zeno
veCS
FBO
riel
Sec
uriti
esH
SBC
Citig
roup
ABN
Am
ro B
ank
Cred
it Ag
rico
leAr
buth
not S
ecur
ities
Soci
ete
Gen
eral
ePe
terc
amCh
arle
s St
anle
yIx
is S
ecur
ities
HSH
Nor
dban
kFo
rtis
Inve
stm
ent
Fide
uram
War
gny
Kepl
er E
quiti
esAE
KAu
rel-
Leve
nU
nicr
edit
Bank
Sal O
ppen
heim
SEB
Ensk
ilda
ABG
Sun
dal C
ollie
rO
ddo
& C
ieEv
olut
ion
Secu
ritie
sCa
rneg
ieHa
ndel
sban
ken
Kaup
thin
gIN
G W
hole
sale
Ban
kSw
edba
nkM
acqu
arie
Fir
st S
outh
Barn
ard
Jaco
bsW
estL
B Eq
uitie
sSt
anda
rd &
Poo
rsH
SBC
Trin
kaus
Bank
haus
Lam
peFI
M S
ecur
ities
Bank
haus
Met
zle
DZ B
ank
Bank
Von
tobe
lZu
erch
er K
anto
nalb
ank
Erst
e Ba
nkBe
renb
erg
Bank
Dexi
a Se
curi
ties
OKO
Ban
kBr
idge
wel
l Sec
uriti
esBa
nk D
egro
ofSe
ymou
r Pi
erce
Patr
ia F
inan
cePe
kao
Secu
ritie
sPK
O B
P Se
curi
ties
Woo
d &
Co
SRC
Rese
arch
Inve
stec
Panm
ure
Gor
don
BCP
eQ B
ank
Equi
net I
nstit
ute
Teat
her
& G
reen
Bank
Sar
asin
Com
mer
zban
kDr
esdn
er K
lein
wor
tCe
ntro
sim
Pare
to S
ecur
ities
Prot
on B
ank
Nor
dea
Secu
ritie
sIn
terb
anca
Rasb
ank
Bane
sto
Bols
aIb
er S
ecur
ities
La C
aixa
Num
is S
ecur
ities
Inve
st B
ank
of G
reec
ePi
raeu
s Se
curi
ties
Arke
on F
inan
ceCy
ril F
inan
ceTo
tal
Unite Group UK UTG LN UTG.L GBX 1.239 Y Y Y Y 4
ProLogis European Properties NETH PEPR NA PEPR.AS EUR 1.171 Y Y Y Y 4
Big Yellow Group UK BYG LN BYG.L GBX 1.048 Y Y Y Y 4
Aedes ITA AE IM AEDI.MI EUR 714 Y Y Y Y 4
Development Securities UK DSC LN DSC.L GBX 514 Y Y Y Y 4
Renta Corp Real Estate SA SP REN SM REN.MC EUR 461 Y Y Y Y 4
Zueblin Immobilien Holding AG SWIT ZUBN SW ZUBN.S CHF 335 Y Y Y Y 4
Acanthe Developpement FRA ACAN FP CFMP.PA EUR 194 Y Y Y Y 4
Conwert Immobilien Invest OEST CWI AV CONW.VI EUR 1.860 Y Y Y 3
St.Modwen Properties UK SMP LN SMP.L GBX 1.272 Y Y Y 3
Risanamento ITA RN IM RN.MI EUR 1.039 Y Y Y 3
Babis Vovos International GRC VOVOS GA VOVr.AT EUR 901 Y Y Y 3
Mapeley UK MAY LN MAY.L GBX 881 Y Y Y 3
Helical Bar UK HLCL LN HLCL.L GBX 848 Y Y Y 3
Immobiliare Grande Distribution ITA IGD IM IGD.MI EUR 628 Y Y Y 3
Allreal Hld N SWIT ALLN SW ALLN.S CHF 617 Y Y Y 3
Klovern AB SWED KLOV SS KLOV.ST SEK 607 Y Y Y 3
LEASINVEST-SICAFI BELG LEAS BB LNRE.BR EUR 212 Y Y Y 3
Wereldhave Belgium BELG WEHB BB WEHAe.BR EUR 183 Y Y Y 3
Ca Immobilien OEST CAI AV CAIV.VI EUR 1.876 Y Y 2
Norwegian Property ASA NOR NPRO NO NPRO.OL NOK 966 Y Y 2
CLS Holdings UK CLI LN CLI.L GBX 785 Y Y 2
TK Development DEN TKDV DC TKDV.CO DKK 636 Y Y 2
Technopolis FIN TPS1V FH TPS1V.HE EUR 438 Y Y 2
Lamda Develop/R GRC LAMDA GA LMDr.AT EUR 272 Y Y 2
Affine FRA IML FP BTPP.PA EUR 239 Y Y 2
Mucklow (A.& J.)Group UK MKLW LN MKLW.L GBX 223 Y Y 2
Keops DEN KEOPS DC KEOPS.CO DKK 186 Y Y 2
Invista Foundation Property Trust UK IFD LN IFD.L GBX 909 Y 1
ING UK Real Estate Income Trust UK IRET LN IRET.L GBX 774 Y 1
F&C Commercial Property Trust UK FCPT LN FCPT.L GBX 769 Y 1
UK Balanced Property Trust UK UBR LN UBR.L GBX 552 Y 1
Daejan Hdg UK DJAN LN DJAN.L GBX 479 Y 1
Invesco Property Income Trust UK IPI LN IPI.L GBX 368 Y 1
Westbury Property Fund UK WPFI LN WPF.L GBX 354 Y 1
Teesland Advantage Property Inc Tst UK TAP LN TAP.L GBX 321 Y 1
Primary Health Prop. UK PHP LN PHP.L GBX 294 Y 1
Intervest Offices BELG INTO BB PRIF.BR EUR 270 Y 1
Eurobank Properties GRC EUPRO GA EUPr.AT EUR 170 Y 1
Sparkassen Immobilien OEST SPI AV SIAG.VI EUR 1.088 0
Assura UK AGR LN AGR.L GBX 1.068 0
Alstria Office GER AOX GR AOXG.F EUR 605 0
UK Commercial Property Trust UK UKCM LN UKCMq.L GBX 526 0
Plaza Centers NV UK PLAZ LN PLAZ.L GBX 479 0
Sparkassen Immo Invest Genusscheine OEST SIIG AV SIMIg.VI EUR 324 0
Freeport UK FPR LN FPR.L GBX 287 0
Standard Life Inv Prop Inc Trust UK SLI LN SLI.L GBX 248 0
Marylebone Warwick Balfour Group UK MWB LN MWB.L GBX 237 0
ISIS Property Trust 2 Ld UK IRP LN IRP.L GBX 223 0
ISIS Property Trust Ld UK IPT LN IPT.L GBX 168 0
208.631 56 26 25 22 19 17 15 18 35 19 10 10 11 14 18 12 10 10 14 4 7 5 14 9 8 6 6 9 9 8 6 5 2 6 6 6 7 5 1 1 5 4 4 3 4 2 2 4 4 1 3 4 3 2 2 1 1 1 1 1 1 1 1 1 1 1 1 1 1 3 1 1 1 2 1 1 1 1 1 1 1 1 1 1
European Analyst Coverage
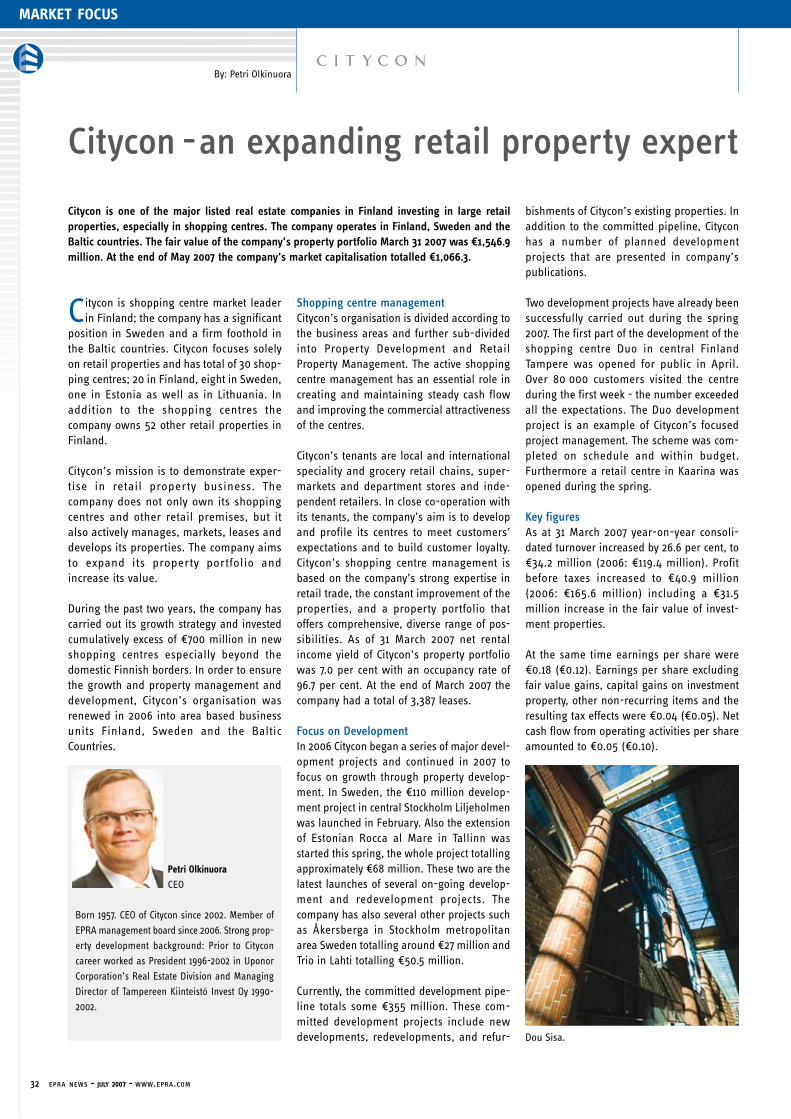
32 epra news - july 2007 - www.epra.com
market focus
Citycon is one of the major listed real estate companies in Finland investing in large retail properties, especially in shopping centres. The company operates in Finland, Sweden and the Baltic countries. The fair value of the company’s property portfolio March 31 2007 was €1,546.9 million. At the end of May 2007 the company’s market capitalisation totalled €1,066.3.
Citycon is shopping centre market leader in Finland; the company has a significant
position in Sweden and a firm foothold in the Baltic countries. Citycon focuses solely on retail properties and has total of 30 shop-ping centres; 20 in Finland, eight in Sweden, one in Estonia as well as in Lithuania. In addition to the shopping centres the company owns 52 other retail properties in Finland.
Citycon’s mission is to demonstrate exper-tise in retail property business. The company does not only own its shopping centres and other retail premises, but it also actively manages, markets, leases and develops its properties. The company aims to expand its property portfolio and increase its value.
During the past two years, the company has carried out its growth strategy and invested cumulatively excess of €700 million in new shopping centres especially beyond the domestic Finnish borders. In order to ensure the growth and property management and development, Citycon’s organisation was renewed in 2006 into area based business units Finland, Sweden and the Baltic Countries.
Shopping centre management Citycon’s organisation is divided according to the business areas and further sub-divided into Property Development and Retail Property Management. The active shopping centre management has an essential role in creating and maintaining steady cash flow and improving the commercial attractiveness of the centres.
Citycon’s tenants are local and international speciality and grocery retail chains, super-markets and department stores and inde-pendent retailers. In close co-operation with its tenants, the company’s aim is to develop and profile its centres to meet customers’ expectations and to build customer loyalty. Citycon’s shopping centre management is based on the company’s strong expertise in retail trade, the constant improvement of the properties, and a property portfolio that offers comprehensive, diverse range of pos-sibilities. As of 31 March 2007 net rental income yield of Citycon’s property portfolio was 7.0 per cent with an occupancy rate of 96.7 per cent. At the end of March 2007 the company had a total of 3,387 leases.
Focus on Development In 2006 Citycon began a series of major devel-opment projects and continued in 2007 to focus on growth through property develop-ment. In Sweden, the €110 million develop-ment project in central Stockholm Liljeholmen was launched in February. Also the extension of Estonian Rocca al Mare in Tallinn was started this spring, the whole project totalling approximately €68 million. These two are the latest launches of several on-going develop-ment and redevelopment projects. The company has also several other projects such as Åkersberga in Stockholm metropolitan area Sweden totalling around €27 million and Trio in Lahti totalling €50.5 million. Currently, the committed development pipe-line totals some €355 million. These com-mitted development projects include new developments, redevelopments, and refur-
Citycon - an expanding retail property expert
Born 1957. CEO of Citycon since 2002. Member of
EPRA management board since 2006. Strong prop-
erty development background: Prior to Citycon
career worked as President 1996-2002 in Uponor
Corporation’s Real Estate Division and Managing
Director of Tampereen Kiinteistö Invest Oy 1990-
2002.
Petri OlkinuoraCEO
By: Petri Olkinuora
bishments of Citycon’s existing properties. In addition to the committed pipeline, Citycon has a number of planned development projects that are presented in company’s publications.
Two development projects have already been successfully carried out during the spring 2007. The first part of the development of the shopping centre Duo in central Finland Tampere was opened for public in April. Over 80 000 customers visited the centre during the first week - the number exceeded all the expectations. The Duo development project is an example of Citycon’s focused project management. The scheme was com-pleted on schedule and within budget. Furthermore a retail centre in Kaarina was opened during the spring.
Key figures As at 31 March 2007 year-on-year consoli-dated turnover increased by 26.6 per cent, to €34.2 million (2006: €119.4 million). Profit before taxes increased to €40.9 million (2006: €165.6 million) including a €31.5 million increase in the fair value of invest-ment properties.
At the same time earnings per share were €0.18 (€0.12). Earnings per share excluding fair value gains, capital gains on investment property, other non-recurring items and the resulting tax effects were €0.04 (€0.05). Net cash flow from operating activities per share amounted to €0.05 (€0.10).
Dou Sisa.
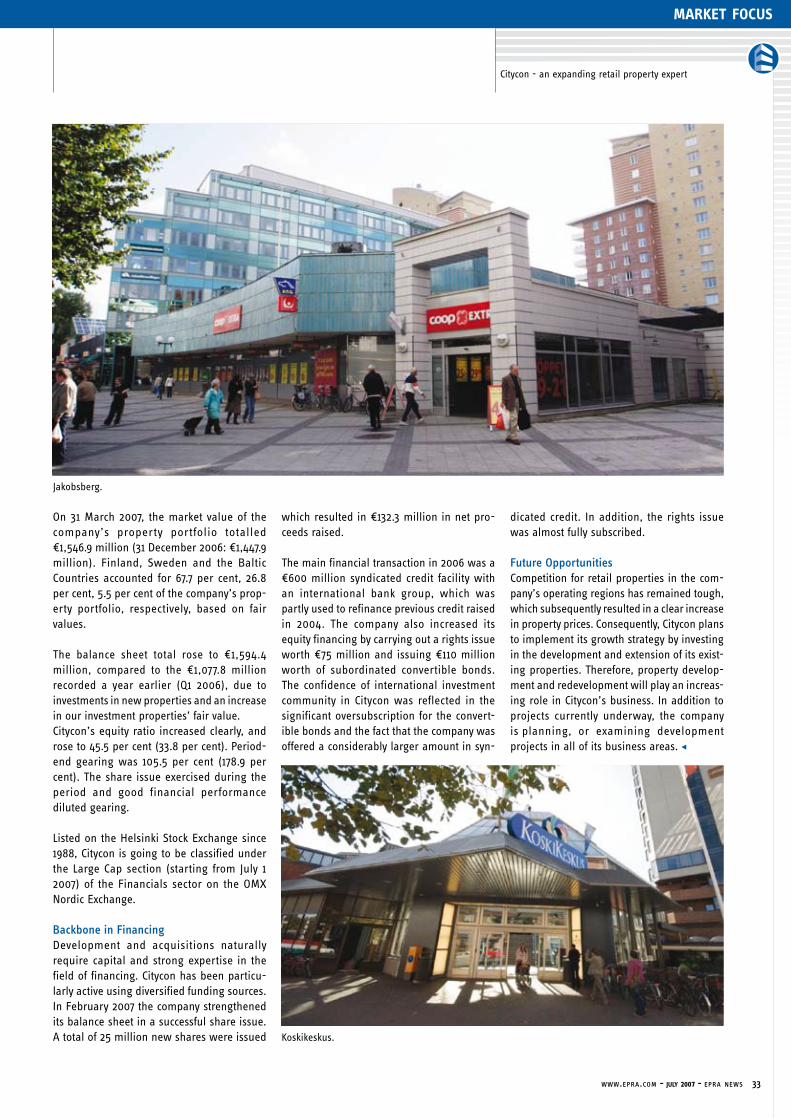
www.epra.com - july 2007 - epra news 33
market focus
On 31 March 2007, the market value of the company’s property portfolio totalled €1,546.9 million (31 December 2006: €1,447.9 million). Finland, Sweden and the Baltic Countries accounted for 67.7 per cent, 26.8 per cent, 5.5 per cent of the company’s prop-erty portfolio, respectively, based on fair values.
The balance sheet total rose to €1,594.4 million, compared to the €1,077.8 million recorded a year earlier (Q1 2006), due to investments in new properties and an increase in our investment properties’ fair value. Citycon’s equity ratio increased clearly, and rose to 45.5 per cent (33.8 per cent). Period-end gearing was 105.5 per cent (178.9 per cent). The share issue exercised during the period and good financial performance diluted gearing.
Listed on the Helsinki Stock Exchange since 1988, Citycon is going to be classified under the Large Cap section (starting from July 1 2007) of the Financials sector on the OMX Nordic Exchange.
Backbone in Financing Development and acquisitions naturally require capital and strong expertise in the field of financing. Citycon has been particu-larly active using diversified funding sources. In February 2007 the company strengthened its balance sheet in a successful share issue. A total of 25 million new shares were issued
which resulted in €132.3 million in net pro-ceeds raised.
The main financial transaction in 2006 was a €600 million syndicated credit facility with an international bank group, which was partly used to refinance previous credit raised in 2004. The company also increased its equity financing by carrying out a rights issue worth €75 million and issuing €110 million worth of subordinated convertible bonds. The confidence of international investment community in Citycon was reflected in the significant oversubscription for the convert-ible bonds and the fact that the company was offered a considerably larger amount in syn-
dicated credit. In addition, the rights issue was almost fully subscribed.
Future OpportunitiesCompetition for retail properties in the com-pany’s operating regions has remained tough, which subsequently resulted in a clear increase in property prices. Consequently, Citycon plans to implement its growth strategy by investing in the development and extension of its exist-ing properties. Therefore, property develop-ment and redevelopment will play an increas-ing role in Citycon’s business. In addition to projects currently underway, the company is planning, or examining development projects in all of its business areas. $
Citycon - an expanding retail property expert
Jakobsberg.
Koskikeskus.

34 epra news - april 2007 - www.epra.com
Europe 22%
Asia 36% North America 42%
Global Rental74%
Non-Global Rental26%
Global Diversified36%
Global Healthcare 3%
Global Office 15%
Global Industrial/Office 1%
Global Lodging/Resorts 4%
Global Retail23%
Global Residential 10%
Global Specialty 1%
Global Industrial 6%
Global Self Storage 2%
reference
FTSE EPRA/NAREIT Global Real Estate Indices
Price Total
Investment Rtn (%) Rtn (%)
Company Country Focus Sector 05-07 Dividend 05-07
Kerry Properties HK Non-Rental Diversified 21,86 0,00 21,86
Norwegian Property ASA NK Rental Office 21,33 0,00 21,33
Archstone-Smith Trust * US Rental Residential 18,40 0,87 19,27
Sunland Group AU Non-Rental Lodging/Resorts 18,39 0,00 18,39
Premier Investment Co. * JP Rental Diversified 18,12 0,00 18,12
CBL & Associates Props * US Rental Retail -9,70 0,00 -9,70
Freeport UK Rental Retail -9,77 0,00 -9,77
Risanamento IT Non-Rental Diversified -9,85 0,00 -9,85
Babis Vovos GR Rental Diversified -10,20 0,00 -10,20
Capital & Regional Props UK Rental Retail -10,25 0,00 -10,25
Close Div Total Total Total Total Total
Value Yld (%) Rtn (%) Rtn (%) Rtn (%) Rtn (%) Rtn (%) 36 Mths
Index Description 31-mei 31-mei - 5 Yrs - 3 Yrs - 1 Yr 05-07 YTD Vlty (%)
EPRA/NAREIT Europe TR (EUR) 3801.83 2.20 22.22 32.12 32.99 0.24 (1.38) 11.10
EPRA/NAREIT Asia TR (USD) 3087.04 2.62 27.77 34.94 51.49 2.76 17.02 10.75
EPRA/NAREIT North America TR (USD) 4337.9 3.70 22.41 27.75 31.88 0.19 4.58 12.92
EPRA/NAREIT Global TR (USD) 3872.19 2.98 25.92 32.04 40.16 0.82 7.90 9.80
355
330
305
280
255
230
205
180
155
130
105
80
EPRA/NAREIT Europe TR (EUR) 145.4%
EPRA/NAREIT North America TR (USD) 102.8%
EPRA/NAREIT Global TR (USD) 125.4%EPRA/NAREIT Asia TR (USD) 141.7%
Inde
x Va
lue
(reb
ased
to
100)
Global
epra/nareit global real estate index
& Time’
global - regional breakdown by market cap
global investment focus market cap breakdown
sector breakdown - global
July 03 Oct 03 Jan 04 April 04 July 04 Oct 04 Jan 05 April o5 July 05 Oct 05 Jan 06 April o6 July o6 Oct o6 Jan 07 May 07
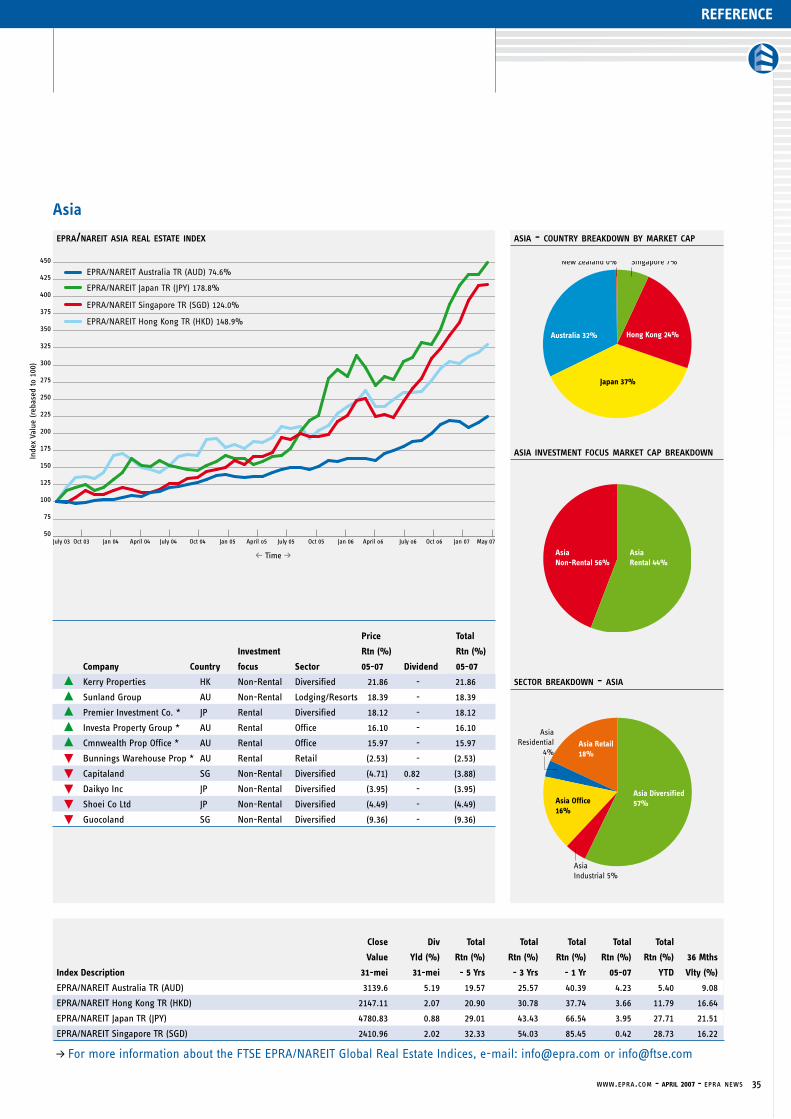
www.epra.com - april 2007 - epra news 35
Japan 37%
Hong Kong 24%Australia 32%
Singapore 7%New Zealand 0%
AsiaNon-Rental 56%
Asia Rental 44%
Asia Retail18%
Asia Office16%
AsiaResidential
4%
Asia Industrial 5%
Asia Diversified57%
reference
p For more information about the FTSE EPRA/NAREIT Global Real Estate Indices, e-mail: [email protected] or [email protected]
Close Div Total Total Total Total Total
Value Yld (%) Rtn (%) Rtn (%) Rtn (%) Rtn (%) Rtn (%) 36 Mths
Index Description 31-mei 31-mei - 5 Yrs - 3 Yrs - 1 Yr 05-07 YTD Vlty (%)
EPRA/NAREIT Australia TR (AUD) 3139.6 5.19 19.57 25.57 40.39 4.23 5.40 9.08
EPRA/NAREIT Hong Kong TR (HKD) 2147.11 2.07 20.90 30.78 37.74 3.66 11.79 16.64
EPRA/NAREIT Japan TR (JPY) 4780.83 0.88 29.01 43.43 66.54 3.95 27.71 21.51
EPRA/NAREIT Singapore TR (SGD) 2410.96 2.02 32.33 54.03 85.45 0.42 28.73 16.22
450
425
400
375
350
325
300
275
250
225
200
175
150
125
100
75
50
Inde
x Va
lue
(reb
ased
to
100)
& Time’
Asia
epra/nareit asia real estate index
EPRA/NAREIT Australia TR (AUD) 74.6%
EPRA/NAREIT Japan TR (JPY) 178.8%
EPRA/NAREIT Singapore TR (SGD) 124.0%
EPRA/NAREIT Hong Kong TR (HKD) 148.9%
asia - country breakdown by market cap
asia investment focus market cap breakdown
sector breakdown - asia
July 03 Oct 03 Jan 04 April 04 July 04 Oct 04 Jan 05 April o5 July 05 Oct 05 Jan 06 April o6 July o6 Oct o6 Jan 07 May 07
Price Total
Investment Rtn (%) Rtn (%)
Company Country focus Sector 05-07 Dividend 05-07
Kerry Properties HK Non-Rental Diversified 21.86 - 21.86
Sunland Group AU Non-Rental Lodging/Resorts 18.39 - 18.39
Premier Investment Co. * JP Rental Diversified 18.12 - 18.12
Investa Property Group * AU Rental Office 16.10 - 16.10
Cmnwealth Prop Office * AU Rental Office 15.97 - 15.97
Bunnings Warehouse Prop * AU Rental Retail (2.53) - (2.53)
Capitaland SG Non-Rental Diversified (4.71) 0.82 (3.88)
Daikyo Inc JP Non-Rental Diversified (3.95) - (3.95)
Shoei Co Ltd JP Non-Rental Diversified (4.49) - (4.49)
Guocoland SG Non-Rental Diversified (9.36) - (9.36)
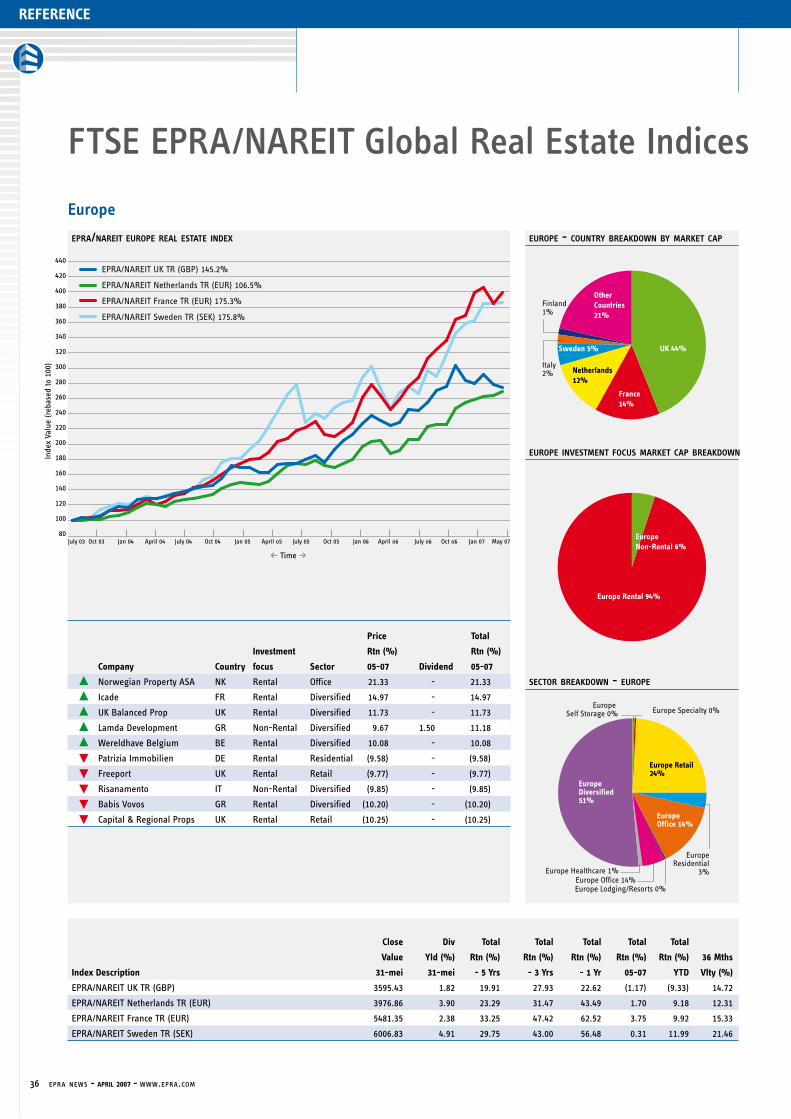
36 epra news - april 2007 - www.epra.com
reference
France14%
Netherlands12%
UK 44%Sweden 5%
OtherCountries21%
Italy 2%
Finland1%
europe - country breakdown by market cap
Europe Rental 94%
EuropeNon-Rental 6%
europe investment focus market cap breakdown
Europe Retail24%
EuropeResidential
3%
Europe Lodging/Resorts 0%Europe Office 14%
Europe Healthcare 1%
EuropeDiversified51%
Europe Office 14%
Europe Self Storage 0% Europe Specialty 0%
sector breakdown - europe
FTSE EPRA/NAREIT Global Real Estate Indices
Price Total
Investment Rtn (%) Rtn (%)
Company Country focus Sector 05-07 Dividend 05-07
Norwegian Property ASA NK Rental Office 21.33 - 21.33
Icade FR Rental Diversified 14.97 - 14.97
UK Balanced Prop UK Rental Diversified 11.73 - 11.73
Lamda Development GR Non-Rental Diversified 9.67 1.50 11.18
Wereldhave Belgium BE Rental Diversified 10.08 - 10.08
Patrizia Immobilien DE Rental Residential (9.58) - (9.58)
Freeport UK Rental Retail (9.77) - (9.77)
Risanamento IT Non-Rental Diversified (9.85) - (9.85)
Babis Vovos GR Rental Diversified (10.20) - (10.20)
Capital & Regional Props UK Rental Retail (10.25) - (10.25)
Close Div Total Total Total Total Total
Value Yld (%) Rtn (%) Rtn (%) Rtn (%) Rtn (%) Rtn (%) 36 Mths
Index Description 31-mei 31-mei - 5 Yrs - 3 Yrs - 1 Yr 05-07 YTD Vlty (%)
EPRA/NAREIT UK TR (GBP) 3595.43 1.82 19.91 27.93 22.62 (1.17) (9.33) 14.72
EPRA/NAREIT Netherlands TR (EUR) 3976.86 3.90 23.29 31.47 43.49 1.70 9.18 12.31
EPRA/NAREIT France TR (EUR) 5481.35 2.38 33.25 47.42 62.52 3.75 9.92 15.33
EPRA/NAREIT Sweden TR (SEK) 6006.83 4.91 29.75 43.00 56.48 0.31 11.99 21.46
440
420
400
380
360
340
320
300
280
260
240
220
200
180
160
140
120
100
80
EPRA/NAREIT UK TR (GBP) 145.2%
EPRA/NAREIT Netherlands TR (EUR) 106.5%
EPRA/NAREIT France TR (EUR) 175.3%
EPRA/NAREIT Sweden TR (SEK) 175.8%
Inde
x Va
lue
(reb
ased
to
100)
Europe
epra/nareit europe real estate index
& Time’
July 03 Oct 03 Jan 04 April 04 July 04 Oct 04 Jan 05 April o5 July 05 Oct 05 Jan 06 April o6 July o6 Oct o6 Jan 07 May 07

www.epra.com - april 2007 - epra news 37
reference
United States 92%
Canada 8%
north america - country breakdown by market cap
North AmericaRental 90%
North AmericaNon-Rental 10%
north america investment focus market cap breakdown
North AmericaRetail 27%
North America Lodging/Resorts 9%
NorthAmerica Healthcare 7%
North America Industrial 6%North America Industrial/Office 3%
NorthAmericaResidential18%
NorthAmerica
Office 15%
North America Self Storage 4%
North America Specialty 2%North America Diversified 10%
sector breakdown - north america
p For more information about the FTSE EPRA/NAREIT Global Real Estate Indices, e-mail: [email protected] or [email protected]
Price Total
Investment Rtn (%) Rtn (%)
Company Country focus Sector 05-07 Dividend 05-07
Archstone-Smith Trust * US Rental Residential 18.4 0.87 19.27
Equity Inns * US Rental Lodging/Resorts 16.9 - 16.90
Diamondrock Hospitality * US Rental Lodging/Resorts 14.49 - 14.49
Corrections Corp of US US Rental Specialty 14.08 - 14.08
Alexander’s Inc. * US Rental Retail 13.19 - 13.19
Health Care Properties * US Rental Health Care -7.69 1.26 (6.43)
Primaris Retail REIT * CA Rental Retail -7.32 0.48 (6.84)
Brookfield Props CA Rental Office -7.82 0.46 (7.36)
General Growth Props * US Rental Retail -7.53 - (7.53)
CBL & Associates Props * US Rental Retail -9.7 - (9.70)
Close Div Total Total Total Total Total
Value Yld (%) Rtn (%) Rtn (%) Rtn (%) Rtn (%) Rtn (%) 36 Mths
Index Description 31-mei 31-mei - 5 Yrs - 3 Yrs - 1 Yr 05-07 YTD Vlty (%)
EPRA/NAREIT Canada TR (CAD) 4040.76 4.45 20.09 24.79 34.54 (1.91) 4.28 11.14
EPRA/NAREIT United States TR (USD) 4284.59 3.63 22.02 27.24 31.25 0.08 3.85 13.33
260
250
240
230
220
210
200
190
180
170
160
150
140
130
120
110
100
90
80
Inde
x Va
lue
(reb
ased
to
100)
& Time’
North America
epra/nareit north america real estate index
EPRA/NAREIT United States TR (USD) 101.6%
EPRA/NAREIT Canada TR (CAD) 82.5%
July 03 Oct 03 Jan 04 April 04 July 04 Oct 04 Jan 05 April o5 July 05 Oct 05 Jan 06 April o6 July o6 Oct o6 Jan 07 May 07
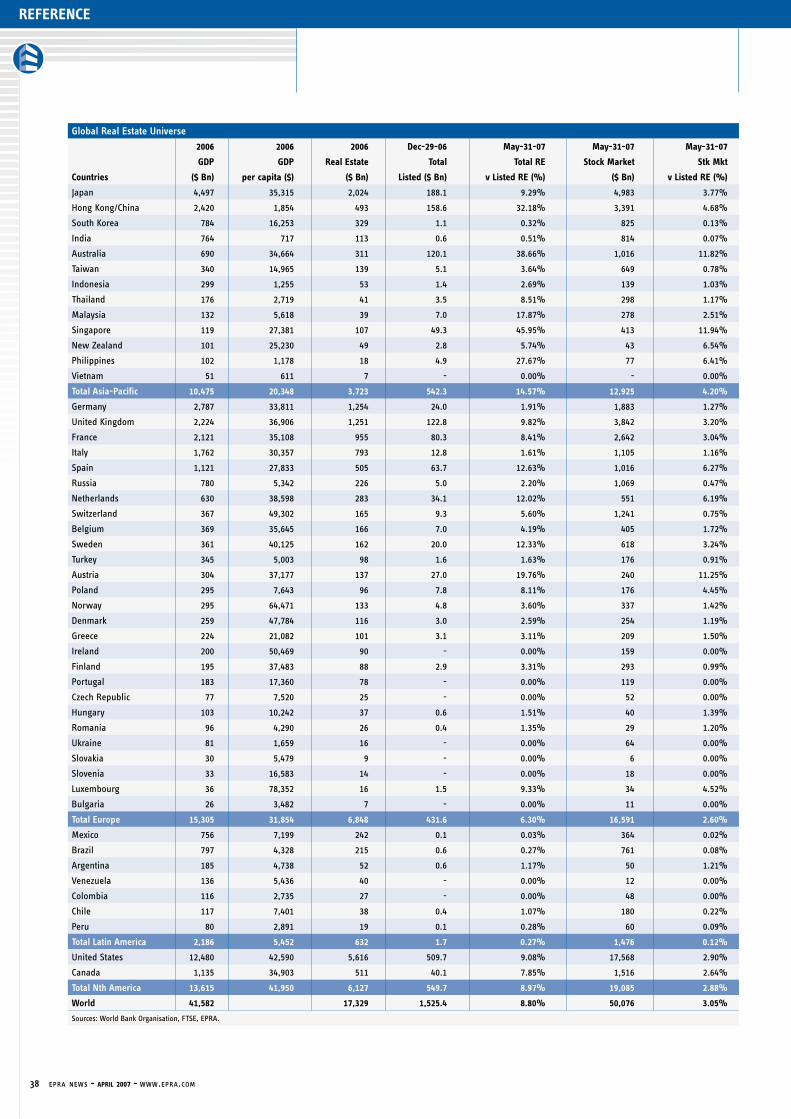
38 epra news - april 2007 - www.epra.com
Global Real Estate Universe
Sources:WorldBankOrganisation,FTSE,EPRA.
2006 2006 2006 Dec-29-06 May-31-07 May-31-07 May-31-07
GDP GDP Real Estate Total Total RE Stock Market Stk Mkt
Countries ($ Bn) per capita ($) ($ Bn) Listed ($ Bn) v Listed RE (%) ($ Bn) v Listed RE (%)
Japan 4,497 35,315 2,024 188.1 9.29% 4,983 3.77%
Hong Kong/China 2,420 1,854 493 158.6 32.18% 3,391 4.68%
South Korea 784 16,253 329 1.1 0.32% 825 0.13%
India 764 717 113 0.6 0.51% 814 0.07%
Australia 690 34,664 311 120.1 38.66% 1,016 11.82%
Taiwan 340 14,965 139 5.1 3.64% 649 0.78%
Indonesia 299 1,255 53 1.4 2.69% 139 1.03%
Thailand 176 2,719 41 3.5 8.51% 298 1.17%
Malaysia 132 5,618 39 7.0 17.87% 278 2.51%
Singapore 119 27,381 107 49.3 45.95% 413 11.94%
New Zealand 101 25,230 49 2.8 5.74% 43 6.54%
Philippines 102 1,178 18 4.9 27.67% 77 6.41%
Vietnam 51 611 7 - 0.00% - 0.00%
Total Asia-Pacific 10,475 20,348 3,723 542.3 14.57% 12,925 4.20%
Germany 2,787 33,811 1,254 24.0 1.91% 1,883 1.27%
United Kingdom 2,224 36,906 1,251 122.8 9.82% 3,842 3.20%
France 2,121 35,108 955 80.3 8.41% 2,642 3.04%
Italy 1,762 30,357 793 12.8 1.61% 1,105 1.16%
Spain 1,121 27,833 505 63.7 12.63% 1,016 6.27%
Russia 780 5,342 226 5.0 2.20% 1,069 0.47%
Netherlands 630 38,598 283 34.1 12.02% 551 6.19%
Switzerland 367 49,302 165 9.3 5.60% 1,241 0.75%
Belgium 369 35,645 166 7.0 4.19% 405 1.72%
Sweden 361 40,125 162 20.0 12.33% 618 3.24%
Turkey 345 5,003 98 1.6 1.63% 176 0.91%
Austria 304 37,177 137 27.0 19.76% 240 11.25%
Poland 295 7,643 96 7.8 8.11% 176 4.45%
Norway 295 64,471 133 4.8 3.60% 337 1.42%
Denmark 259 47,784 116 3.0 2.59% 254 1.19%
Greece 224 21,082 101 3.1 3.11% 209 1.50%
Ireland 200 50,469 90 - 0.00% 159 0.00%
Finland 195 37,483 88 2.9 3.31% 293 0.99%
Portugal 183 17,360 78 - 0.00% 119 0.00%
Czech Republic 77 7,520 25 - 0.00% 52 0.00%
Hungary 103 10,242 37 0.6 1.51% 40 1.39%
Romania 96 4,290 26 0.4 1.35% 29 1.20%
Ukraine 81 1,659 16 - 0.00% 64 0.00%
Slovakia 30 5,479 9 - 0.00% 6 0.00%
Slovenia 33 16,583 14 - 0.00% 18 0.00%
Luxembourg 36 78,352 16 1.5 9.33% 34 4.52%
Bulgaria 26 3,482 7 - 0.00% 11 0.00%
Total Europe 15,305 31,854 6,848 431.6 6.30% 16,591 2.60%
Mexico 756 7,199 242 0.1 0.03% 364 0.02%
Brazil 797 4,328 215 0.6 0.27% 761 0.08%
Argentina 185 4,738 52 0.6 1.17% 50 1.21%
Venezuela 136 5,436 40 - 0.00% 12 0.00%
Colombia 116 2,735 27 - 0.00% 48 0.00%
Chile 117 7,401 38 0.4 1.07% 180 0.22%
Peru 80 2,891 19 0.1 0.28% 60 0.09%
Total Latin America 2,186 5,452 632 1.7 0.27% 1,476 0.12%
United States 12,480 42,590 5,616 509.7 9.08% 17,568 2.90%
Canada 1,135 34,903 511 40.1 7.85% 1,516 2.64%
Total Nth America 13,615 41,950 6,127 549.7 8.97% 19,085 2.88%
World 41,582 17,329 1,525.4 8.80% 50,076 3.05%
reference

www.epra.com - april 2007 - epra news 39
Global Bonds
Australia
Belgium
Canada
USNetherlands
Finland
France
Nth Am RE
Sweden
UK
Europe RE
Global RE
Switzerland
Italy
Asia REGlobal Equities
Japan
Germany
Hong Kong
Singapore
Denmark
Spain
Europe 40%
North America 35%
Asia 21%
Latin America 4%
Underlying Real Estate
North America 36% Asia-Pacific 36%
Europe 28%
LatinAmerica 0%
Listed Real Estate
Rolling 10 Years Risk/Return Profiles Local Currencies - Countries
Global Real Estate vs Equities & Bonds
250
200
150
100
50
0
FTSE EPRA/NAREIT Global RE 108%
FTSE World 56%
JP Morgan Global Funds 10%
31-05-04 31-10-04 30-04-05 31-10-05 30-04-06 31-10-06 31-05-07
reference
Risk(StDeviation)0% 5% 10% 15% 20% 25% 30% 35% 40% 45% 50% 60%
35%
30%
25%
20%
15%
10%
5%
0%
-5%
Retu
rn
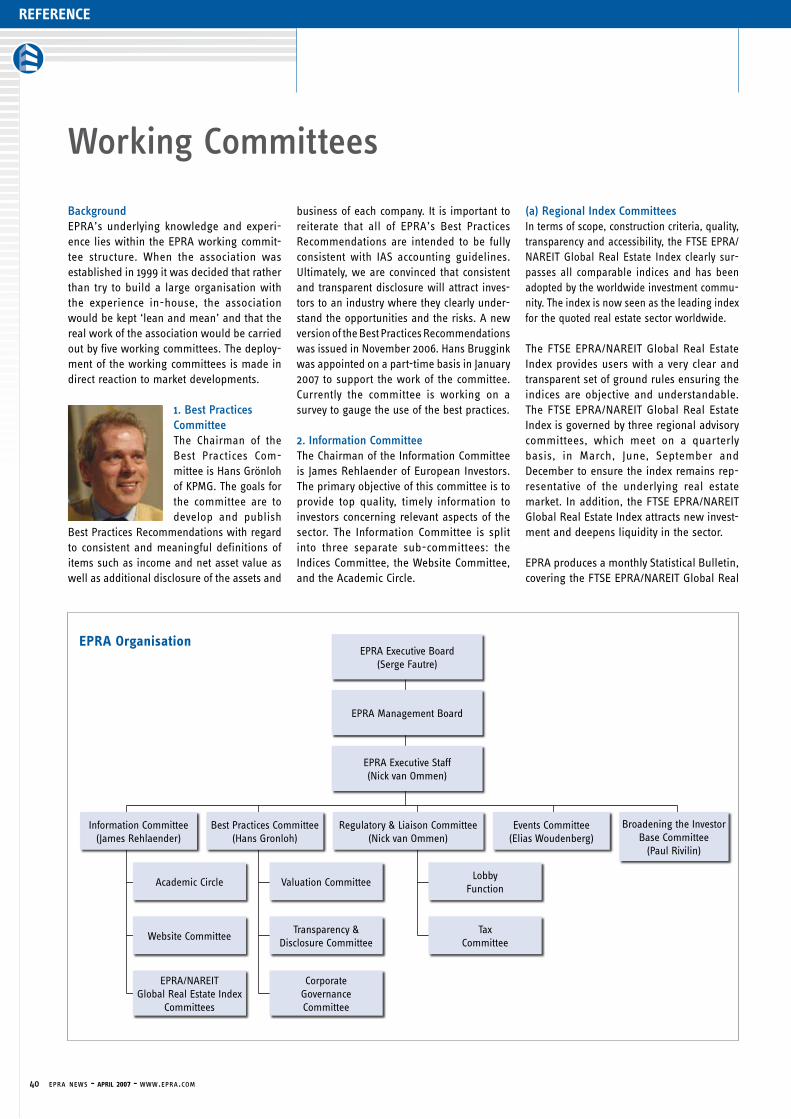
40 epra news - april 2007 - www.epra.com
reference
BackgroundEPRA’s underlying knowledge and experi-ence lies within the EPRA working commit-tee structure. When the association was established in 1999 it was decided that rather than try to build a large organisation with the experience in-house, the association would be kept ‘lean and mean’ and that the real work of the association would be carried out by five working committees. The deploy-ment of the working committees is made in direct reaction to market developments.
1. Best Practices CommitteeThe Chairman of the Best Practices Com-mittee is Hans Grönloh of KPMG. The goals for the committee are to develop and publish
Best Practices Recommendations with regard to consistent and meaningful definitions of items such as income and net asset value as well as additional disclosure of the assets and
business of each company. It is important to reiterate that all of EPRA’s Best Practices Recommendations are intended to be fully consistent with IAS accounting guidelines. Ultimately, we are convinced that consistent and transparent disclosure will attract inves-tors to an industry where they clearly under-stand the opportunities and the risks. A new version of the Best Practices Recommendations was issued in November 2006. Hans Bruggink was appointed on a part-time basis in January 2007 to support the work of the committee. Currently the committee is working on a survey to gauge the use of the best practices.
2. Information Committee The Chairman of the Information Committee is James Rehlaender of European Investors. The primary objective of this committee is to provide top quality, timely information to investors concerning relevant aspects of the sector. The Information Committee is split into three separate sub-committees: the Indices Committee, the Website Committee, and the Academic Circle.
(a) Regional Index CommitteesIn terms of scope, construction criteria, quality, transparency and accessibility, the FTSE EPRA/NAREIT Global Real Estate Index clearly sur-passes all comparable indices and has been adopted by the worldwide investment commu-nity. The index is now seen as the leading index for the quoted real estate sector worldwide.
The FTSE EPRA/NAREIT Global Real Estate Index provides users with a very clear and transparent set of ground rules ensuring the indices are objective and understandable. The FTSE EPRA/NAREIT Global Real Estate Index is governed by three regional advisory committees, which meet on a quarterly basis, in March, June, September and December to ensure the index remains rep-resentative of the underlying real estate market. In addition, the FTSE EPRA/NAREIT Global Real Estate Index attracts new invest-ment and deepens liquidity in the sector.
EPRA produces a monthly Statistical Bulletin, covering the FTSE EPRA/NAREIT Global Real
Working Committees
EPRAOrganisationEPRA Executive Board
(Serge Fautre)
EPRA Management Board
EPRA Executive Staff(Nick van Ommen)
Regulatory & Liaison Committee (Nick van Ommen)
Best Practices Committee(Hans Gronloh)
Information Committee(James Rehlaender)
Broadening the Investor Base Committee
(Paul Rivilin)
Events Committee(Elias Woudenberg)
Academic Circle
Website Committee
EPRA/NAREITGlobal Real Estate Index
Committees
Valuation Committee
Transparency & Disclosure Committee
CorporateGovernanceCommittee
Lobby Function
Tax Committee

www.epra.com - april 2007 - epra news 41
reference
Estate Index, which encompasses an array of useful and exhaustive statistical data on per-formance, market events and index changes. This is an essential “hard copy” tool for pro-fessionals and provides the clearest possible window on the sector around the world. In addition, daily ‘tracker’ files are available from FTSE.
The last round of regional index committees took place on 6 June with the changes effec-tive 18 June. The next round of regional index committee meetings will be held on Wednesday 5 September 2007.
(b) Website CommitteeThe website of EPRA is not only the gateway to EPRA and all its work, but also to its members and a world of information about the sector. The www.epra.com website aver-ages approximately half a million hits per month. This is an astounding figure and is indicative of the quality information avail-able and the interest in the sector. EPRA has a panel of individuals from different coun-tries, whose task it is to discuss the role and content of the website, ensuring that it meets user’s requirements and responds to new challenges. We continually examine how we can improve the website and make enhance-ments on a regular basis.
(c) Academic CircleThe EPRA Academic Circle was formed in 2002, and is chaired by Martin Allen of Morgan Stanley. The Academic Circle brings together the 11 leading real estate faculties around the world to provide EPRA with an extremely valuable resource. EPRA provides the funding for the Academic Circle to produce research on topics that directly affect the sector. The selection criteria for the topics are not only academically demanding but should be assessable to practitioners. The University of Cambridge issued the “Diversification Benefits of European Real estate Stocks” in September 2006. The circle conducts research based upon the demands of the market and our members. Academic Circle members are:
• Amsterdam School of Real Estate
• EBS Immobilienakademie
• KTI Finland
• MIT Center for Real Estate
• National University of Singapore
• University of Cambridge
• University of Hong Kong
• University of Reading
• University of Western Sydney
• Universite Paris Dauphine
• Wharton School, Zell – Laurie Real Estate Center
3. Regulatory and Liaison Committee The primary objective of this committee is to identify and remove obstacles to free cross-border investment in real estate companies. The interim Chairman of the Regulatory and Liaison Committee is Nick van Ommen. The Regulatory and Liaison Committee is still a somewhat dormant committee although there will be increased activities towards governments, European Union, suprana-tional bodies like IASC and IVSC as an outcome of the good work done by other EPRA committees. The decision has been taken to focus the future activities of the regulatory committee on the promotion of tax transparent property vehicles in Europe, as well at national levels.
(a) Tax Committee The Tax Committee, chaired by Matthias Roche of Ernst & Young in Germany, has two objectives. Firstly the committee maintains an inventory of worldwide tax transparent structures. On the basis of this inventory the TTC will publish recommendations as to what the most supportive elements are from these different structures (the short term goals) and what could be the most preferred structure for a European REIT (the long term goal). The second objective is to provide European legislators with the evidence that tax transparent structures are beneficial for the tax collectors, the companies, the inves-tors and the tenants. As a result this will have significant macro-economic effects. The Academic Circle aims to provide supportive evidence for tax transparent structures through separate research projects. In September 2004 we issued an update of the EPRA Global REIT survey. Before the EPRA conference in September an update of the EPRA Global REIT survey will be issued.
4. Events Committee The primary objective of this committee is to establish a high-level communication plat-form for the European public real estate sector by organizing productive and influen-tial events. The annual EPRA conference is already established as the leading, dedicated meeting point for the European quoted property sector. The combination of the two-day programme, the overall quality of the attendees, and the venue contributes to the conference’s growing success. The Executive Board of EPRA acts as the programme com-
mittee and seeks to attract top-class keynote speakers and panels of CEO’s and other senior representatives of real estate compa-nies, investors, and their advisers. At the 7th Annual Conference in Budapest in September 2006, the “Best Annual Report Award 2005”, sponsored by PGGM, was won by VastNed Retail. The “Best Large Cap Performer Award 2005”, sponsored by LaSalle Investment Management was picked up by IVG Immobilien, and Workspace Group won the “Best Small/Mid Cap Performer Award 2005”, sponsored by Kempen & Co. Besides EPRA organised “road shows” in many coun-tries, the EPRA management and executive board members also represent EPRA as speakers or panellists at various conferences in Europe, the United States, and Asia. The 2007 annual conference will be held in the Hotel Grande Bretagne in Athens on the 6 & 7 September.
5. Broadening the Investor Base CommitteeThis committee was set up in 2005 and is currently under the supervision of Paul Rivlin of EuroHypo
Real Estate Investment Banking in London. The aim of the committee is to take the real estate message to a broader audience, panning both institutional and retail inves-tors. The first piece of research to be issued by the committee in October 2006 was the “Diversification Benefits of European Real Estate Stocks” by the University of Cambridge. The research provides investors with a clear picture of how investing in listed real estate stocks can add benefits to a multi-asset port-folio, in terms of risk and reward. The University of Regensburg recently completed research focusing on the correlation of real estate against other asset classes. This research was distributed in May. $
Working Committees
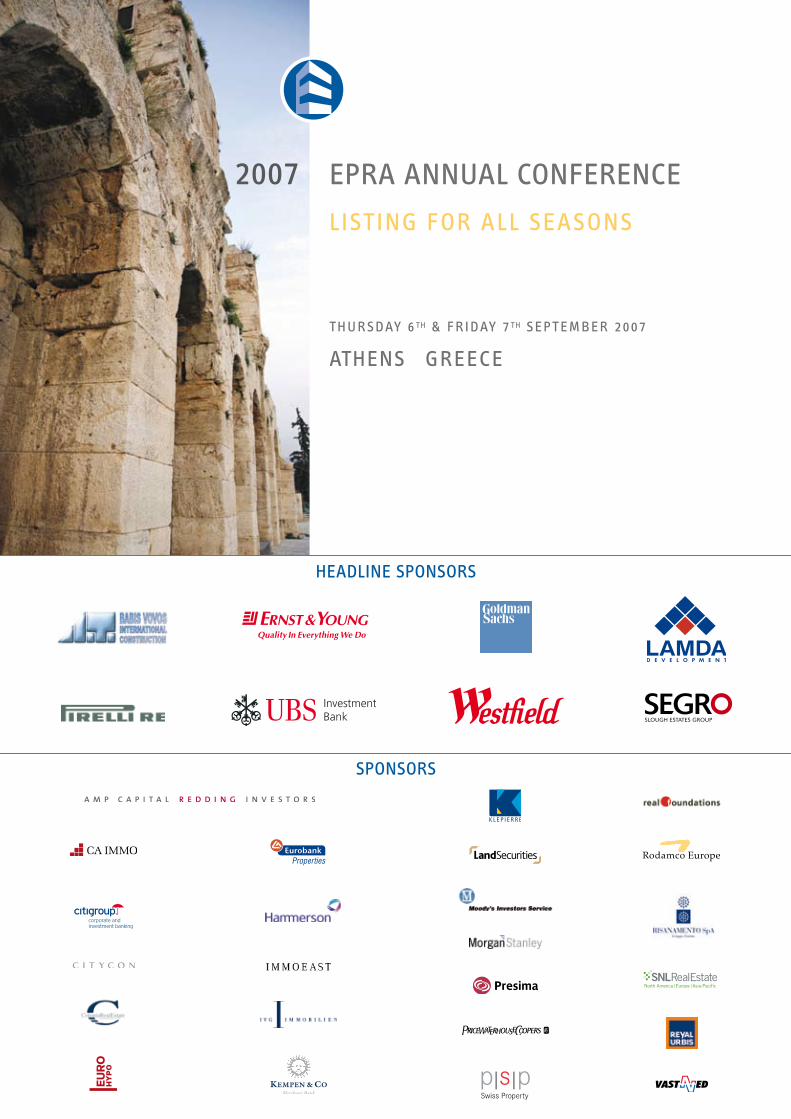
EPRA ANNUAL CONFERENCE
LISTING FOR ALL SEASONS
THURSDAY 6 TH & FR IDAY 7 TH SEPT EMBER 2007
athens greece
2007
HEADLINE SPONSORS
SPONSORS

By: Editors Name08:00 • 09:15 Breakfast and conference registration
09:15 • 09:30 Opening remarks by Serge Fautré, Chairman of EPRA
09:30 • 10:15 George Alogoskoufis, Minister of Economy & Finance of Greece
10:15 • 11:15 WHERE IS THE PRODUCT?Moderator: Ian Hawksworth, Capital & Counties
Panel members: 4 CEO’s of large listed companies
EPRA Best Annual Report 2006, sponsored by PGGM
11:30 • 12:00 Break
12:00 • 13:15 Discussion leader: Prof. Tony Ciochetti, MITPresentations by: 3 leading Universities
13:15 • 14:45 Lunch
14:45 • 15:45 I WANT YOUR PROPERTY!Moderator: Jon H. Zehner, JPMorgan
Panel members: Panel 4 CEO’s of large listed companies
EPRA Best Small/MidCap Performance Award 2006, sponsored by Kempen & Co
16:00 • 17:30 Networking garden party
19:00 Cocktails & Dinner in the Zappeion
T I M E
* ON THURSDAY EPRA WILL ORGANISE A PARTNER’S PROGRAMME *
LISTING FOR ALL SEASONS
P R O G R A M M E
K E Y N OT E S P E A K E R p
PA N E L D I S C U SS I O N I p
PA N E L D I S C U SS I O N I I p
A C A D E M I C C I R C L E p
O P E N I N G p
A W A R D P R E S E NTAT I O N p
THURSDAY SEPTEMBER 6TH
2007
A W A R D P R E S E NTAT I O N p
EPRA_HTD 2007_v3.indd 2 26-06-2007 12:07:00
T I M E
A W A R D P R E S E NTAT I O N p
08:00 • 09:00 Breakfast
09:00 • 09:45 Peter Barge, Jones Lang LaSalle
EPRA Best Large Cap Performance Award 2007, sponsored by LaSalle Investment Management
10:00 • 12:15 2 x 2 Concurrent Sessions
10:00 • 11:00 UK-REITsModerator: Patrick Sumner, Henderson Global Investors
Panel members: • Robert Fowlds, JPMorgan Cazenove • Mike Riley, The Local Shopping Reit
• Francis Salway, Land Securities • James Rehlaender, European Investors
10:00 • 11:00 EUROPEAN EMERGING MARKETSModerator: Karl Petrikovics, Immoeast Immobilien Anlagen
Panel members: • Alex Moss, AME Capital • Terry Olin, Eastern Property Holdings
• Apostolos Tamvakakis, LAMDA • Peter Weinzierl, MEINL Bank
11:00 • 11:15 Break
11:15 • 12:15 G-REITsModerator: Ronald Wijs, Loyens & Loeff
Panel members: • John Kriz, Moody’s • Oliver Puhl, Morgan Stanley
• Hans Volckens, Beiten Burkhardt • Panel member to be confirmed
11:15 • 12:15 ASIA & SOUTH AMERICAN EMERGING MARKETSModerator: Nick Tyrrell, JPMorgan
Panel members: • Evan Gallagher, Allco • Paolo Gomez, PREI
• Kiran Patel, AXA REIM • Ben Sanderson, Prupim
• Scott Crowe, Cohen & Steers
12:30 • 13:30 I GOT YOUR PROPERTY!Moderator: John Carrafiell, Morgan Stanley
Panel members: 2 CEO’s of hedge/buy-out companies and 2 CEO’s of property companies
Closing remarks Nick J.M. van Ommen, CEO of EPRA
13:30 • 15:00 Lunch
S E SS I O N I p
K E Y N OT E S P E A K E R p
PA N E L D I S C U SS I O N I I I p
S E SS I O N I I I p
S E SS I O N I V p
S E SS I O N I I p
P R O G R A M M E
LISTING FOR ALL SEASONSFRIDAY SEPTEMBER 7TH
2007
EPRA_HTD 2007_v3.indd 3 26-06-2007 10:29:49
THURSDAY 6 TH & FR IDAY 7 TH SEPT EMBER 2007
athens greece

Schiphol Boulevard 283 1118 BH Schiphol Airport The Netherlands
T +31 20 405 3830 F +31 20 405 3840 W www.epra.com