
ISSN: 2581-4982 Design and Simulative Analysis of ... · a Chebyshev band pass filter for LMDS band...
13
Journal of Science Technology Engineering and Management-Advanced Research & Innovation ISSN: 2581-4982 Vol. 1, Issue 2, May 2018 1 Design and Simulative Analysis of Chebyshev Band Pass Filter For LMDS Band MHD Mounzir Jamal Eldin Veeraiyah Thangasamy & Shankar Duraikannan Asia Pacific University, Technology Park Malaysia, Bukit Jalil 5700, Kuala Lumpur, Malaysia [email protected] Abstract: LMDS wireless technology is capable of handling high data rate and data volumes required for the recent mobile standards especially 5G. This paper presents the design and simulation based analysis of a Chebyshev band pass filter for LMDS band at a center frequency of 29.3625 GHz and bandwidth of 3.725 GHz. The designed filter is tested on 5 different substrate materials which shows a good agreement with the theoretical results. Keywords: Microwave Filters, Chebyshev Filters, Bilinear Transformation, LMDS. 1. Introduction Local Multipoint Point Distribution Service (LMDS) can be defined as a broadband wireless service that primarily centered within the 28 GHz and operates on microwave frequencies range of 26 GHz to 30 GHz bands [1]. Also, it can be considered as point-to-multipoint communication system which provides two-way voice, data and Internet services by utilizing microwave communications. Unlike LTE, LMDS uses a 1.3 GHz wideband spectrum around frequency of 28 GHz, where it can provide a 1Gpbs data rate for each LMDS channel [2]. Band Pass Filters (BPF) are mostly used in wireless applications in the transmitter and receiver. In the transmitter side, the filter can be used to limit the bandwidth of the output signal in order to transmit the required data at the desired speed. In the receiver side, the band pass filter allows signals at a specified range of frequency to pass through, while eliminating or preventing the unwanted signals at different frequencies to pass through. Where Band pass Filter (BPF) has a good optimization for Signal-to-Noise Ratio (SNR) for a receiver. Chebyshev is a type of filter that can be used in many applications, but mostly is used in RF application where its ripple is not an issue. Chebyshev filter has shown a better performance in term of frequency response [3], but it has a smaller transition region at the expense of ripples in its pass band [4]. Microstrip coupled line has been chosen as it fulfills the requirements of the band pass filter design because it is well confined for large line width over the substrate height ratios, and it is suitable for elements with low characteristic impedance and radiation loss. Microstrip coupled lines is the most suitable and widely used technology in microwave applications due to its lower cost comparing with other transmission line and it is easy to implement and fabricate on PCB substrate materials, and it has a light weight. 2. Design Methodology Table 1 shows the filter specifications, where some of the specifications have been taken from the filter proposed for FM wireless applications [5], while the filter order has been calculated by using Bilinear transformation method [6] as showing below:
Transcript of ISSN: 2581-4982 Design and Simulative Analysis of ... · a Chebyshev band pass filter for LMDS band...

Journal of Science Technology Engineering and Management-Advanced Research & Innovation ISSN: 2581-4982
Vol. 1, Issue 2, May 2018
1
Design and Simulative Analysis of Chebyshev
Band Pass Filter For LMDS Band
MHD Mounzir Jamal Eldin Veeraiyah Thangasamy & Shankar Duraikannan
Asia Pacific University, Technology Park Malaysia, Bukit Jalil 5700, Kuala Lumpur, Malaysia
Abstract: LMDS wireless technology is capable of handling high data rate and data volumes required for
the recent mobile standards especially 5G. This paper presents the design and simulation based analysis of
a Chebyshev band pass filter for LMDS band at a center frequency of 29.3625 GHz and bandwidth of 3.725
GHz. The designed filter is tested on 5 different substrate materials which shows a good agreement with
the theoretical results.
Keywords: Microwave Filters, Chebyshev Filters, Bilinear Transformation, LMDS.
1. Introduction
Local Multipoint Point Distribution Service (LMDS) can be defined as a broadband wireless service that
primarily centered within the 28 GHz and operates on microwave frequencies range of 26 GHz to 30 GHz
bands [1]. Also, it can be considered as point-to-multipoint communication system which provides two-way
voice, data and Internet services by utilizing microwave communications. Unlike LTE, LMDS uses a 1.3
GHz wideband spectrum around frequency of 28 GHz, where it can provide a 1Gpbs data rate for each
LMDS channel [2].
Band Pass Filters (BPF) are mostly used in wireless applications in the transmitter and receiver. In the
transmitter side, the filter can be used to limit the bandwidth of the output signal in order to transmit the
required data at the desired speed. In the receiver side, the band pass filter allows signals at a specified
range of frequency to pass through, while eliminating or preventing the unwanted signals at different
frequencies to pass through. Where Band pass Filter (BPF) has a good optimization for Signal-to-Noise
Ratio (SNR) for a receiver. Chebyshev is a type of filter that can be used in many applications, but mostly is
used in RF application where its ripple is not an issue. Chebyshev filter has shown a better performance in
term of frequency response [3], but it has a smaller transition region at the expense of ripples in its pass
band [4].
Microstrip coupled line has been chosen as it fulfills the requirements of the band pass filter design
because it is well confined for large line width over the substrate height ratios, and it is suitable for
elements with low characteristic impedance and radiation loss. Microstrip coupled lines is the most suitable
and widely used technology in microwave applications due to its lower cost comparing with other
transmission line and it is easy to implement and fabricate on PCB substrate materials, and it has a light
weight.
2. Design Methodology
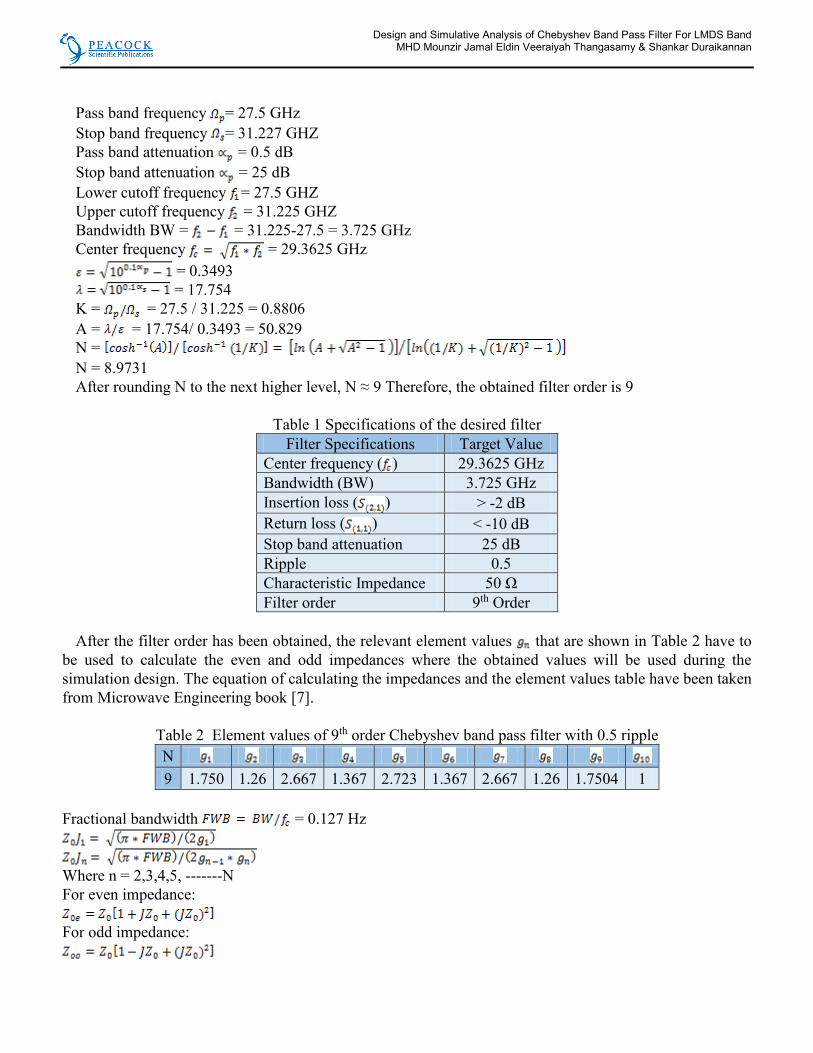
Table 1 shows the filter specifications, where some of the specifications have been taken from the filter
proposed for FM wireless applications [5], while the filter order has been calculated by using Bilinear
transformation method [6] as showing below:
Design and Simulative Analysis of Chebyshev Band Pass Filter For LMDS Band MHD Mounzir Jamal Eldin Veeraiyah Thangasamy & Shankar Duraikannan
Pass band frequency = 27.5 GHz
Stop band frequency = 31.227 GHZ
Pass band attenuation = 0.5 dB
Stop band attenuation = 25 dB
Lower cutoff frequency = 27.5 GHZ
Upper cutoff frequency = 31.225 GHZ
Bandwidth BW = = 31.225-27.5 = 3.725 GHz
Center frequency = 29.3625 GHz
= 0.3493
= 17.754
K = = 27.5 / 31.225 = 0.8806
A = = 17.754/ 0.3493 = 50.829
N =
N = 8.9731
After rounding N to the next higher level, N ≈ 9 Therefore, the obtained filter order is 9
Table 1 Specifications of the desired filter
Filter Specifications Target Value
Center frequency ( ) 29.3625 GHz
Bandwidth (BW) 3.725 GHz
Insertion loss ( ) > -2 dB
Return loss ( ) < -10 dB
Stop band attenuation 25 dB
Ripple 0.5
Characteristic Impedance 50 Ω
Filter order 9th Order
After the filter order has been obtained, the relevant element values that are shown in Table 2 have to
be used to calculate the even and odd impedances where the obtained values will be used during the
simulation design. The equation of calculating the impedances and the element values table have been taken
from Microwave Engineering book [7].
Table 2 Element values of 9th order Chebyshev band pass filter with 0.5 ripple
N
9 1.750 1.26 2.667 1.367 2.723 1.367 2.667 1.26 1.7504 1
Fractional bandwidth = 0.127 Hz
Where n = 2,3,4,5, -------N
For even impedance:
For odd impedance:
Journal of Science Technology Engineering and Management-Advanced Research & Innovation ISSN: 2581-4982
Vol. 1, Issue 2, May 2018
3
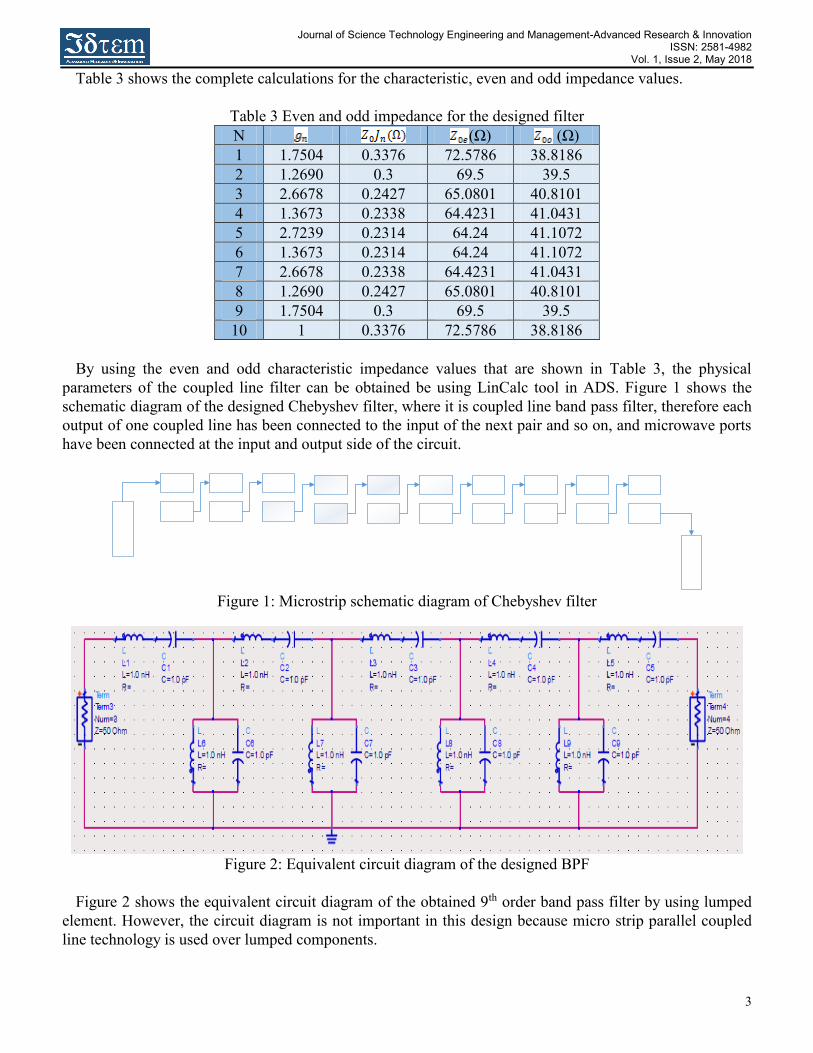
Table 3 shows the complete calculations for the characteristic, even and odd impedance values.
Table 3 Even and odd impedance for the designed filter
N
(Ω) (Ω)
1 1.7504 0.3376 72.5786 38.8186
2 1.2690 0.3 69.5 39.5
3 2.6678 0.2427 65.0801 40.8101
4 1.3673 0.2338 64.4231 41.0431
5 2.7239 0.2314 64.24 41.1072
6 1.3673 0.2314 64.24 41.1072
7 2.6678 0.2338 64.4231 41.0431
8 1.2690 0.2427 65.0801 40.8101
9 1.7504 0.3 69.5 39.5
10 1 0.3376 72.5786 38.8186
By using the even and odd characteristic impedance values that are shown in Table 3, the physical
parameters of the coupled line filter can be obtained be using LinCalc tool in ADS. Figure 1 shows the
schematic diagram of the designed Chebyshev filter, where it is coupled line band pass filter, therefore each
output of one coupled line has been connected to the input of the next pair and so on, and microwave ports
have been connected at the input and output side of the circuit.
Figure 1: Microstrip schematic diagram of Chebyshev filter
Figure 2: Equivalent circuit diagram of the designed BPF
Figure 2 shows the equivalent circuit diagram of the obtained 9th order band pass filter by using lumped
element. However, the circuit diagram is not important in this design because micro strip parallel coupled
line technology is used over lumped components.

Design and Simulative Analysis of Chebyshev Band Pass Filter For LMDS Band MHD Mounzir Jamal Eldin Veeraiyah Thangasamy & Shankar Duraikannan
3. Simulation Results
Figure 3 shows the initial simulation result, where as it can be seen the frequency response of the
insertion and return losses is not acceptable. Therefore, the optimization tool that has been provided by
ADS can be used to achieve the target values.
Figure 3: Insertion and return losses before optimization
The insertion loss S (2,1) and return loss S (1,1) that have been obtained for the Chebyshev filter are
illustrated in Fig. 4. Where the filter has been designed by using FR4 specifications that are shown in Table
4.
Table 4: FR4 substrate specifications
Conductor thickness (T) 0.15 mm
Permittivity ( ) 4.8
Tangent loss (TanD) 0.002
Material thickness (H) 1 mm
Figure 4: The bandwidth of FR4 at 3dB
Journal of Science Technology Engineering and Management-Advanced Research & Innovation ISSN: 2581-4982
Vol. 1, Issue 2, May 2018
5
From Figure 4, it can be seen that the insertion loss has achieved its expected target with a value of –
0.825dB at its maximum slope at a frequency of 30.1 GHz. Likewise, the return loss has also achieved its
target value which is -11.409dB at its highest ripple at a frequency of 29.43GHz. On the other hand, the
bandwidth that has been obtained at 3dB is 4.12 GHz which exceeded the target value by 0.395 GHz as
shown in Fig. 4, while the obtained center frequency is 29.39 GHz which is almost close to the calculated
value. While, Table 5 shows the obtained physical parameters after performing optimization to the design
Table 5 Physical parameters of the designed filter on FR4
N
Width (W)
(mm)
Space (S)
(um)
Length (L)
(mm)
1 1.7504 1.22666 274.765 1.32087
2 1.2690 2.27585 240.675 1.26103
3 2.6678 1.7518 503.054 1.32223
4 1.3673 1.51923 281.7 1.38767
5 2.7239 1.13024 264.368 1.56457
6 1.3673 1.21993 572.654 1.3125
7 2.6678 1.83485 527.13 1.22792
8 1.2690 2.32839 432.594 1.20217
9 1.7504 2.24315 375.412 1.25359
10 1 1.30859 241.219 1.25027
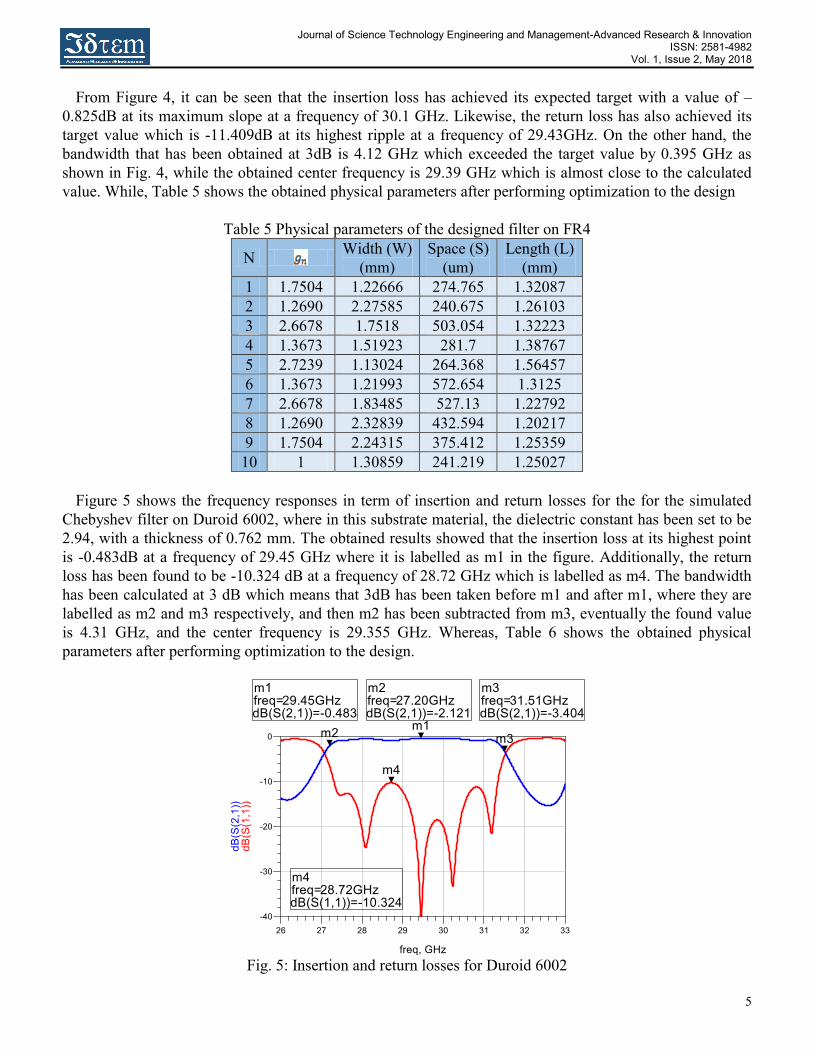
Figure 5 shows the frequency responses in term of insertion and return losses for the for the simulated
Chebyshev filter on Duroid 6002, where in this substrate material, the dielectric constant has been set to be
2.94, with a thickness of 0.762 mm. The obtained results showed that the insertion loss at its highest point
is -0.483dB at a frequency of 29.45 GHz where it is labelled as m1 in the figure. Additionally, the return
loss has been found to be -10.324 dB at a frequency of 28.72 GHz which is labelled as m4. The bandwidth
has been calculated at 3 dB which means that 3dB has been taken before m1 and after m1, where they are
labelled as m2 and m3 respectively, and then m2 has been subtracted from m3, eventually the found value
is 4.31 GHz, and the center frequency is 29.355 GHz. Whereas, Table 6 shows the obtained physical
parameters after performing optimization to the design.
Fig. 5: Insertion and return losses for Duroid 6002

Design and Simulative Analysis of Chebyshev Band Pass Filter For LMDS Band MHD Mounzir Jamal Eldin Veeraiyah Thangasamy & Shankar Duraikannan
Table 6 Physical parameters of the designed filter on Duroid 6002
N
Width (W)
(mm)
Space (S)
(um)
Length (L)
(mm)
1 1.7504 1.07858 247.328 1.56806
2 1.2690 1.85934 360.022 1.75899
3 2.6678 1.5497 392.7 1.57645
4 1.3673 1.01986 449.649 1.76979
5 2.7239 940.554 331.45 1.66244
6 1.3673 1.59853 298.471 1.9335
7 2.6678 2.22845 358.373 1.30999
8 1.2690 1.7876 334.055 1.77359
9 1.7504 1.24229 359.119 1.21703
10 1 1.22185 244.38 2.02843
Figure 6: Insertion and return losses for Duroid 5870
Table 7 Physical parameters of the designed filter on Duroid 5870
N
Width (W)
(mm)
Space (S)
(um)
Length (L)
(mm)
1 1.7504 808.313 174.991 1.75382
2 1.2690 1.52706 219.212 1.96619
3 2.6678 997.46 276.136 1.92887
4 1.3673 1.10862 339.56 1.85554
5 2.7239 1.13458 360.511 1.67425
6 1.3673 1.41684 378.746 1.85267
7 2.6678 1.19323 293.432 1.77363
8 1.2690 1.11708 383.882 1.89336
9 1.7504 1.38468 287.247 1.73099
10 1 746.62 226.407 1.94587

Journal of Science Technology Engineering and Management-Advanced Research & Innovation ISSN: 2581-4982
Vol. 1, Issue 2, May 2018
7
Figure 6 shows another test of the designed filter but this time by using a different substrate which is
Duroid 5780, where the dielectric constant and the substrate thickness is 2.35 and 0.508mm respectively.
The obtained insertion loss at maximum point is -0.679 dB at a frequency of 29.90 GHz which is labelled
as m1 in the graph, while the label m4 indicates to the highest value of return loss which is -10.728 dB at
frequency of 30.58 GHz. The bandwidth and center frequency found to be 4.43 GHz and 29.365 GHz
respectively. Whereas, Table 7 shows the obtained physical parameters after performing optimization to the
design.
Figure 7: Insertion and return losses for Duroid 5880
Figure 7 shows the results of testing the designed Chebyshev filter on Duroid 5880 substrate material.
Label m1 indicates to the highest value of insertion loss which is -0.546 dB at a frequency of 30.40 GHz.
Whereas, m4 indicates to the maximum value of return loss which is -12.029 dB at a frequency of 28.80
GHz. The obtained bandwidth is 4.21 GHz and the center frequency is
29.425 GHz. Whereas, Table 8 shows the obtained physical parameters after performing optimization to the
design.
Table 8 Physical parameters of the designed filter on Duroid 5880
N
Width (W)
(mm)
Space (S)
(um)
Length (L)
(mm)
1 1.7504 894.235 145.061 1.7796
2 1.2690 1.21543 200.743 1.81231
3 2.6678 1.27695 268.419 1.58136
4 1.3673 1.5955 366.783 2.12366
5 2.7239 1.24765 318.441 1.71261
6 1.3673 1.32364 318.41 2.03514
7 2.6678 1.51343 314.735 1.58403
8 1.2690 1.42689 327.294 2.26458
9 1.7504 1.42756 242.859 1.69321
10 1 770.637 263.654 2.16658

Design and Simulative Analysis of Chebyshev Band Pass Filter For LMDS Band MHD Mounzir Jamal Eldin Veeraiyah Thangasamy & Shankar Duraikannan
Fig. 8 Insertion and return losses for Duroid 6006
Figure 8 illustrates the obtained frequency response in terms of insertion and return losses from testing
the Chebyshev filter in Duroid 6006 substrate material, where in this case, the dielectric constant that has
been given is 6.15 and the substrate thickness is 0.635 mm. The maximum value of the insertion loss has
been labelled as m1 where the value is -1.101dB at a frequency of 28.8 GHz. Similarly, the obtained return
loss has been labelled as m4 at its highest ripple at a value of -10.247 dB. The calculated bandwidth and
center frequency at 3dB is 3.84 GHz and 29.53 GHz respectively. Whereas, Table 9 shows the obtained
physical parameters after performing optimization to the design.
Table 9 Physical parameters of the designed filter on Duroid 6006
N
Width (W)
(mm)
Space (S)
(um)
Length (L)
(mm)
1 1.7504 519.952 309.008 1.16821
2 1.2690 958.653 483.126 1.19467
3 2.6678 515.109 741.401 1.16876
4 1.3673 486.676 471.858 1.2801
5 2.7239 722.344 524.846 1.24896
6 1.3673 833.055 701.596 1.1114
7 2.6678 874.708 392.603 1.28245
8 1.2690 824.408 511.579 1.3187
9 1.7504 826.73 392.779 1.09055
10 1 374.263 285.154 1.30412
Figure 9 presents the frequency responses that have been obtained from using Duroid 6010.2 substrate
material which has a dielectric constant of 10.2 and a thickness of 0.635 mm. The obtained insertion loss at
maxima point has been labelled by m1 which has a value of -1.059 dB at 29.85GHz frequency, and the
return loss has been obtained to be -10.425 dB at its highest which is labelled by m4. The obtained
bandwidth is 4.13 GHz and center frequency 29.605 GHz. Whereas, Table 10 shows the obtained physical
parameters after performing optimization to the design.

Journal of Science Technology Engineering and Management-Advanced Research & Innovation ISSN: 2581-4982
Vol. 1, Issue 2, May 2018
9
Figure 9 Insertion and return losses for Duroid 6010.2
Table 10 Physical parameters of the designed filter on Duroid 6010.2
N
Width (W)
(mm)
Space (S)
(um)
Length (L)
(mm)
1 1.7504 402.36 262.453 1.06052
2 1.2690 345.489 454.594 792.292
3 2.6678 447.498 403.4 865.492
4 1.3673 503.862 643.472 865.225
5 2.7239 546.585 534.559 878.844
6 1.3673 576.583 712.167 889.651
7 2.6678 557.683 763.494 939.866
8 1.2690 555.327 752.848 939.336
9 1.7504 570.158 577.323 910.583
10 1 432.095 231.029 960.685
Fig. 10 Insertion and return losses for Duroid 6202

Design and Simulative Analysis of Chebyshev Band Pass Filter For LMDS Band MHD Mounzir Jamal Eldin Veeraiyah Thangasamy & Shankar Duraikannan
The last test has been done by using Duroid 6202 PCB material that has a thickness of 0.381 mm and a
dielectric constant of 2.9. Therefore, the simulation results have given an insertion loss of
-0.790 dB, and return loss of -10.829 dB and their highest points which have been labelled as m1 and m4
respectively as showing in Fig. 10. On the other hand, the bandwidth that has been obtained by the
simulation is 4.15 GHz and the center frequency is 29.515 GHz. Whereas, Table 11 shows the obtained
physical parameters after performing optimization to the design.
Table 11 Physical parameters of the designed filter on Duroid 6202
N
Width (W)
(mm)
Space (S)
(um)
Length (L)
(mm)
1 1.7504 451.259 179.412 1.75386
2 1.2690 635.917 226.346 1.58114
3 2.6678 500.894 266.807 1.51425
4 1.3673 566.636 386.451 1.84988
5 2.7239 775.795 299.55 1.67162
6 1.3673 760.215 354.338 1.71159
7 2.6678 681.164 317.712 1.5739
8 1.2690 663.855 316.557 1.86107
9 1.7504 757.781 292.237 1.63782
10 1 515.68 187.974 1.77547
4. Comparative Analysis
Figure 11 shows the combined obtained testing results for insertion loss. Where the filter has been testted
on different substrate materials, such as Duroid 6002, Duroid 5870, Duroid 6006 and more. It can be seen
that all the results are higher than -2dB, where the highest value has been obtained from Duroid 6002 which
has been labeled by m1 at a value of -0.483 dB. While the lowest insertion loss has been obtained from
Duroid 6006 at a value of -1.101 dB which has been labeled by m2. Moreover the other values are in
between -1 dB and -2 dB. Additionally, from Fig. 6, it be realized that all the insertion loss frequemcy
reponses are having the same shape with a little difference in the values.
Figure 11: Frequency responses for insertion loss results

Journal of Science Technology Engineering and Management-Advanced Research & Innovation ISSN: 2581-4982
Vol. 1, Issue 2, May 2018
11
Figure 12 and Figure 13 show the combined test results for return losses. The results have been split into
two graphs according to the similarity in the frequency response. Where in Fig. 12, the testing results of
Duroid 5870, Duroid 6006, and Duroid 6010.2 almost have the same responses with around 2 ripples in the
passband, and label m3 indicates the highest value which has been obtained from Duroid 6010.2 which is -
10.425dB.
Figure 12 Frequency responses for return loss results
While in Figure 13, the frequency responses for Duroid 6202, FR4, Duroid 5880, and Duroid 6002 have
been combined together where the highest point has been found at -10.324 dB for Duroid 6002 which has
been labeled by m4. However, from Fig. 12 and Fig. 13 it can be agreed that the return loss test result for
Duroid 5880 has the best frequency response.
Figure 13: Frequency responses for return loss results
Table 6 shows the discrepancies between the design specifications and the test results. From the table it
can be seen that the bandwidth (BW) has exceeded the target value in all cases, where the closest value has
been obtained from Duroid 6006 with a difference of 115 MHz compared with target value. Whereas, the

Design and Simulative Analysis of Chebyshev Band Pass Filter For LMDS Band MHD Mounzir Jamal Eldin Veeraiyah Thangasamy & Shankar Duraikannan
center frequency has been achieved from testing the filter on Duroid 5870 substrate material which gives
a value of 29.365 GHz, moreover, FR4 and Duroid have almost achieved it with a difference between the
simulated and target values of 28 MHz and 7 MHz respectively. While the other simulation test values are
far from the target value, such as Duroid 6010.2 where it exceeds the target value by 243 MHz. On the
other hand, the insertion loss has been achieved in all simulation tests where the maximum value has
been obtained from Druoid 6002 which is -0.483 dB, and the lowest one is -1.101 dB from Duroid 6006
which is still higher than the specified value -2 dB. Similarly, the return loss has been achieved in all
cases, where the closest value to the design specification is -10.247 dB which has been obtained from
Druoid 6006, and the minimum one has been obtained from testing the filter on Duroid 5880 which gives a
value of -12.029 dB. Overall, Duroid 5870 has met all the design specifications, and it is the most suitable
one to be used for fabrication. However, Duroid 5880 is also a suitable material to be used for fabrication if
the design required low power loss, since it has given an insertion loss of -12.029 dB
Table 12 Comparison between target and simulation results part
Parameters Design
specifications
Simulation Results
FR4 Duroid
6002
Duroid
5870
Duroid
5880
Duroid
6006
Duroid
6010.2
Duroid
6202
BW GHz 3.725 4.12 4.31 4.43 4.21 3.84 4.13 4.15
GHz 29.362 29.39 29.355 29.365 29.425 29.53 29.605 29.515
dB > -2 -0.825 -0.483 -0.679 -0.546 -1.101 -1.059 -0.790
dB < -10 -11.409 -10.324 -10.728 -12.029 -10.247 -10.425 -10.829
Fig. 14 Chebyshev bandpass filter layout
Figure 14 shows the 3D layout of the designed filter on FR4 PCB material, which can be used as reference
during the fabrication.
5. Conclusion
It can be concluded that the proposed filter for LMDS band has been successfully designed, simulated,
tested and analyzed on different material. Appropriate choice of the material can be done based on the
application and cost. The simulation shows a good match with the desired design. However, further
enhancement can be carried out for this project such as to increase the physical space between two
Journal of Science Technology Engineering and Management-Advanced Research & Innovation ISSN: 2581-4982
Vol. 1, Issue 2, May 2018
13
microwave pairs, and that can be done by doing tuning or additional optimization, because the physical
space between two microwave pairs was one of the reasons for not fabricating the simulated filter, where
the obtained physical parameters were too small, and the values were in term of micrometer, which makes
the fabrication process too difficult at these aspects. Thus, by doing that enhancement, the simulated filter
can be fabricated and hence, the fabrication and simulation performances can be compared, which leads to
further analysis to enhance the designed filter.
References
[1] J. Kshirsagar and A. Kachole, “Local Multipoint Distribution System (LMDS) Definition” Int. J. Emerg. Technol. Adv. Eng.,
vol. 3, no. 4, pp. 1–28, 2013.
[2] Z. Pi, J. Choi, and R. Heath, “Millimeter-wave gigabit broadband evolution toward 5G: Fixed access and backhaul,” IEEE
Commun. Mag., vol. 54, no. 4, pp. 138–144, 2016.
[3] S. Duraikannan and M. A. Salum, “Design Optimization for Diminution of 5 . 75 GHZ Chebyshev Bandpass Filter,” 2013
IEEE Int. Conf. Circuits Syst., pp. 96–101, 2013.
[4] M. A. Thilagavathi and A. Beno, “Design of Butterworth Bandpass Filter for Broadband Wireless Onchip Receiver,” J.
Recent Res. Appl. Stud., vol. 2, no. 12, pp. 39–43, 2015.
[5] S. Seghier, N. Benahmed, F. T. Bendimerad, and N. Benabdallah, “Design of parallel coupled microstrip bandpass filter for
FM Wireless applications,” in 2012 6th International Conference on Sciences of Electronics, Technologies of Information
and Telecommunications (SETIT), 2012, vol. 2, no. 1, pp. 207–211.
[6] L. Tan and J. Jiang, Digital Signal Processing, 2nd ed. Oxford, USA: Academic Press, 2013.
[7] D. M. Pozar, Microwave Engineering, 4th ed. Phoenix, AZ, USA: JohnWiley &Sons, Inc., 2011.


![Development of Hexagonal MMR Based UWB Bandpass Filter ... · For such circumstances, a UWB filter is required to provide rejection capability in a band from 5 to 6 GHz [3-6]. ...](https://static.fdocuments.in/doc/165x107/5e28116b7a0f7a70221dabdc/development-of-hexagonal-mmr-based-uwb-bandpass-filter-for-such-circumstances.jpg)
