ISSN 2529-668X Consolidated annual accounts of the ...
198
INTEGRATED FINANCIAL AND ACCOUNTABILITY REPORTING 2020 2020 FINANCIAL YEAR #EUBUDGET Consolidated annual accounts of the European Union ISSN 2529-668X Budget
Transcript of ISSN 2529-668X Consolidated annual accounts of the ...

INTEGRATED FINANCIAL AND ACCOUNTABILITY REPORTING 20202020
FINANCIAL YEAR
#EUBUDGET
Consolidated annual accounts of the European Union
ISSN 2529-668X
Budget

Printed by the Publications Office of the European Union in Luxembourg
The European Commission is not liable for any consequence stemming from the reuse of this publication.
Luxembourg: Publications Office of the European Union, 2021
© European Union, 2021
The reuse policy of European Commission documents is implemented based on Commission Decision 2011/833/EU of 12 December 2011 on the reuse of Commission documents (OJ L 330, 14.12.2011, p. 39). Except otherwise noted, the reuse of this document is authorised under a Creative Commons Attribution 4.0 International (CC-BY 4.0) licence (https://creativecommons.org/licenses/by/4.0/). This means that reuse is allowed provided appropriate credit is given and any changes are indicated.
For any use or reproduction of elements that are not owned by the European Union, permission may need to be sought directly from the respective rightholders.
All photos © European Union, unless otherwise stated.
Print ISBN 978-92-76-32451-5 ISSN 1830-5830 doi:10.2761/389138 KV-AF-21-001-EN-C
PDF ISBN 978-92-76-32450-8 ISSN 2529-668X doi:10.2761/413181 KV-AF-21-001-EN-N

EN EN
EUROPEAN COMMISSION
Brussels, 30.6.2021
COM(2021) 381 final
Communication from the Commission to the European Parliament, the Council and the
Court of Auditors - Annual Accounts of the European Union 2020

CONTENTS
FOREWORD ............................................................................................... 2
FINANCIAL HIGHLIGHTS OF THE YEAR ......................................................... 3
NOTE ACCOMPANYING THE CONSOLIDATED ACCOUNTS ............................... 35
CONSOLIDATED FINANCIAL STATEMENTS AND EXPLANATORY NOTES ............ 36
BALANCE SHEET ................................................................................... 38
STATEMENT OF FINANCIAL PERFORMANCE .............................................. 39
CASHFLOW STATEMENT ......................................................................... 40
STATEMENT OF CHANGES IN NET ASSETS ............................................... 41
NOTES TO THE FINANCIAL STATEMENTS ................................................. 42
BUDGETARY IMPLEMENTATION REPORTS AND EXPLANATORY NOTES ........... 125
GLOSSARY ............................................................................................ 186
LIST OF ABBREVIATIONS ........................................................................ 190

Annual accounts of the European Union 2020
2
FOREWORD
2020 has been an extraordinary year by
any measure: Facing economic and political challenges caused by the coronavirus pandemic, the European Union had to react with
unprecedented solutions and speed.
The European Commission has been working on all fronts to save lives and livelihoods, to support national health systems and companies, to foster recovery and resilience. We have mobilised all means at our disposal to help
Member States coordinate their national responses and to help those most affected by the crises, using instruments such as the Coronavirus Response Investment Initiative or SURE (Support to mitigate Unemployment Risks in an Emergency). Under SURE an
amount of EUR 39.5 billion out of a total of EUR 100 billion has already been disbursed in 2020
to affected Member States to address sudden increases in public expenditure for the preservation of employment. Further substantial disbursements followed in 2021.
While fighting the pandemic, the European Union
nevertheless delivered on its policy objectives, with a focus on young people, jobs and growth, as well as climate change. Measures to support economic growth and reduce the economic gaps between regions amounted to nearly half of the funds committed. EU funding contributed EUR 29.7 billion to less developed
regions and EUR 16.4 billion to research and innovation under Horizon 2020. Furthermore,
the 2020 EU budget helped agriculture and rural areas under the European Agricultural Guarantee Fund and Agricultural Fund for Rural Development with total commitments of EUR 59
billion. The 2020 budget was the final budget of the current multiannual financial framework, with budget implementation totalling EUR 181.7 billion in commitments made – adding value for all Europeans.
Finally, 2020 was also the year of the agreement on the EU’s long-term budget for 2021-2027
of EUR 1,074 trillion (in 2018 prices), boosted by EUR 750 billion through NextGenerationEU, a temporary instrument to kickstart the recovery and steer the transition towards a more sustainable and digital Europe.
It is my pleasure to present the 2020 annual
accounts of the European Union. They provide a
complete overview of EU finances and the implementation of the EU budget for the last year, including information on contingent liabilities, financial commitments and other obligations of the Union. The consolidated annual accounts of the European Union are part of the Commission’s integrated financial and
accountability reporting package and form an essential part of our highly developed system of financial accountability.
Johannes Hahn
Commissioner for Budget and Human
Resources

Annual accounts of the European Union 2020
3
FINANCIAL HIGHLIGHTS OF THE YEAR
The objective of the Financial Statements Analysis, which has been prepared on the basis of the principles outlined in the IPSASB Recommended Practice Guideline (RPG) 2 ‘Financial Statement
Discussion and Analysis’ is to assist readers to understand how the operational, financial and investment activities of the EU are reflected in the different elements of the consolidated financial statements of the EU. The information presented in this section has not been audited
It should be noted that due to the rounding of figures into millions of euros, some financial data in the tables below may appear not to add up.

Annual accounts of the European Union 2020
4
CONTENTS
1. KEY FIGURES 2020 .................................................................................... 5
2. CORONAVIRUS RESPONSE .......................................................................... 7
2.1. Highlights of the EU’s coronavirus response ............................................. 7
2.2. Response initiatives under 2014-2020 multiannual financial framework (MFF) and SURE programme ............................................................................ 7
3. THE LONG-TERM EU BUDGET 2021-2027 AND NEXT GENERATION EU ............ 12
4. DEPARTURE OF THE UNITED KINGDOM FROM THE EUROPEAN UNION ............ 15
4.1. Background ....................................................................................... 15
4.2. UK Share .......................................................................................... 15
4.3. EU annual accounts: Amounts owed by and to the UK under the Withdrawal Agreement ................................................................................................... 16
5. SUMMARY OF BUDGET IMPLEMENTATION ................................................... 19
6. FINANCIAL INSTRUMENTS AND BUDGETARY GUARANTEES........................... 20
6.1. Financial instruments financed by the EU budget.................................... 20
6.2. Financial assets held in guarantee funds for budgetary guarantees ........... 20
6.3. Loans and related borrowings for financial assistance programmes ........... 21
6.4. Budgetary contingent liabilities for financial assistance programmes ......... 24
7. FINANCIAL STATEMENTS ANALYSIS ........................................................... 25
7.1. REVENUE .......................................................................................... 25
7.2. EXPENSES ......................................................................................... 26
7.3. ASSETS ............................................................................................ 27
7.4. LIABILITIES ...................................................................................... 29
8. EU POLITICAL AND FINANCIAL FRAMEWORK, GOVERNANCE AND ACCOUNTABILITY ............................................................................................ 31
8.1. POLITICAL AND FINANCIAL FRAMEWORK .............................................. 31
8.2. GOVERNANCE AND ACCOUNTABILITY ................................................... 33

Annual accounts of the European Union 2020
5
1. KEY FIGURES 2020
The EU budget in 2020 – Implementation of commitment appropriations
EUR 181.7 bn implemented to deliver on the EU’s policy objectives:
see Budgetary Implementation Reports and Explanatory Notes, Table 4.2
The EU coronavirus response
SURE – Amounts granted in 2020
Instrument agreed EUR bn
Member State granted
EUR bn
Next Generation EU 750 Italy 27.4
SURE* 100 Spain 21.3
Macro-financial assistance 3.0 Poland 11.2
ESI 2.7 Belgium 7.8
UCPM 0.3 Portugal 5.9
Total 856.0 Romania 4.1
Greece 2.7
Other 9.9
*of which EUR 39.5 bn disbursed in 2020 Total granted in 2020 90.3
see points 2.2 and 3 see point 2.2.6
Economic, social and
territorial cohesion EUR
60.2 bn
Competitiveness for
growth and jobs EUR
29.3 bn
Sustainable growth: natural resources
EUR 60.8 bn
Global Europe EUR 12.0 bn
Security and citizenship and other EUR 8.8 bn
Administration EUR 10.5 bn

Annual accounts of the European Union 2020
6
Consolidated financial statements
The consolidated financial statements of the EU comprise more than 50 entities (including the European Parliament, the Council, the Commission and EU agencies). The European Commission is the most significant entity, accounting for 98% of the total assets of the consolidated financial statements.
The EU accounts are prepared according to the highest available standards, the International Public Sector Accounting Standards (IPSAS). Adhering to these standards ensures that the accounts provide relevant, reliable, comparable and understandable financial information for citizens. They provide information on the financial position (balance sheet) of the EU as well as detailed explanations of its assets, liabilities, financial commitments and obligations. They also show how the EU budget was implemented during the year.
EUR billion
2020 2019
ASSETS
Financial Assets 113.1 71.2
Pre-financing 62.7 51.4
Receivables 74.5 24.0
Cash and cash equivalents 16.7 19.7
Property, Plant and Equipment and other assets 13.0 12.6
Total 280.0 178.9
LIABILITIES
Post-employment benefits 116.0 97.7
Financial liabilities 95.0 54.5
Payables 32.4 27.2
Accruals 64.6 67.2
Other liabilities 5.4 4.8
Total 313.5 251.5
NET ASSETS
Reserves 5.1 5.0
Amounts to be called from Member States (38.5) (77.6)
Total (33.4) (72.5)
see Financial Statement Analysis, point 7

Annual accounts of the European Union 2020
7
2. CORONAVIRUS RESPONSE
2.1. Highlights of the EU’s coronavirus response
Since the outbreak of the COVID-19 pandemic, the European Commission has taken resolute action to reinforce the public health sectors and mitigate the socio-economic impact in the European Union. Based
on the 2014-2020 multiannual financial framework (MFF), the European Commission has mobilised all means at its disposal to help Member States coordinate their national responses and provided objective information about the spread of the virus and effective efforts to contain it.
Timeline of actions taken1
2 April Coronavirus response: European Commission mobilises every euro to protect lives and livelihoods
14 April €2.7 billion from the EU budget to support the healthcare sector
16 April President von der Leyen: ‘The European budget will be the mothership of Europe’s recovery’
22 April €3 billion financial assistance package for ten enlargement and neighbourhood countries
27 May Europe’s moment: major €2.4 trillion Recovery Plan for Europe unveiled to repair and prepare for the
next generation
4 June European Commission pledges €300 million to the Vaccine Alliance
21 July
European leaders reach a deal on the recovery plan and European long-term budget 2021-2027
25 August European Commission proposes to provide €87.3 billion in financial support for 16 Member States
under SURE
17 September European Commission presents next steps for €672.5 billion Recovery and Resilience Facility
22 September European Commission welcomes finalisation of guarantee system for €100 billion SURE instrument
7 October
European Commission to issue EU SURE bonds of up to €100 billion as social bonds
27 October European Commission disburses first €17 billion SURE instalments to Italy, Spain and Poland
10 November European Commission welcomes agreement on €1.8 trillion EU long-term budget and
NextGenerationEU to help build greener, more digital and more resilient Europe
17 November
European Commission disburses €14 billion to nine Member States under the SURE instrument
1 December European Commission disburses €8.5 billion under SURE to five Member States to help sustain jobs
17 December European Commission welcomes the adoption of the EU's long-term budget for 2021-2027
2.2. Response initiatives under 2014-2020 multiannual financial framework (MFF) and SURE programme
The European Union’s interventions under the 2014-2020 MFF to fight the COVID-19 pandemic ranged
from immediate actions such as funding urgent medical supplies and increasing medical stockpiles, to
1 For a complete and updated overview of actions taken please refer to the EU’s coronavirus response webpage at
https://ec.europa.eu/info/live-work-travel-eu/coronavirus-response/timeline-eu-action_en.

Annual accounts of the European Union 2020
8
introducing more flexibility as regards utilising the financial support from the European Structural and
Investment Funds, and to providing loans on favorable terms to both Member States and enlargement
and neighbourhood partners. The total direct support from the EU budget amounted to about EUR 70 billion in 2020. This covers commitments that could be redirected to COVID-19 related actions, of which EUR 66 billion came from redeployment and reprioritisation within existing programmes and EUR 4 billion from budgetary reinforcement. The key initiatives are explained in more detail below.
2.2.1. Activation of the Emergency Support Instrument (ESI)
Given the depth of the crisis following the COVID-19 pandemic, as well as the extent and nature of the needs requiring support from the EU budget, the EU reactivated the ESI instrument for a period of 2 years to finance expenditure necessary to address the COVID‐19 pandemic for the period 1 February
2020 to 31 January 2022 (see Council regulation (EU) 2016/369 of 15 March 2016)2. To further this objective, the 2020 budget was amended.3 Considering in addition DEC 13/2020 adopted on 24 July 2020, EUR 2.7 billion in commitment appropriations and EUR 2.6 billion in payment appropriations were allocated to the ESI instrument for 2020. The reactivation allows the Union to deploy measures
preventing and mitigating severe consequences in one or more Member States and to address, in a coordinated manner, the needs related to the COVID-19 pandemic, by complementing any assistance provided under other EU instruments. The instrument is centrally managed by the Commission and focuses on direct procurement and grants, complemented in certain cases by actions implemented through partners such as international organisations.
In 2020, the Commission signed advance purchase agreements with a number of pharmaceutical
companies. Advance purchase agreements help reduce the risk linked to investments made by manufacturers in the development of potential vaccines or aim at ensuring deliveries, and thus maximise the chances of quickly developing, manufacturing and deploying safe and effective vaccines, and ensuring that EU citizens will have access to them. The Commission negotiated with pharmaceutical companies on behalf of EU Member States, leading to the initial signature of six agreements, with further exploratory talks with additional vaccine manufacturers that started in 2020 and are still ongoing in 2021. The first vaccine to be granted conditional marketing authorisation, on 21 December 2020, was produced by
BioNTech/Pfizer. Its distribution started within days, in time for the launch of the EU Vaccination Days on
27, 28 and 29 December 2020. This authorisation followed a positive scientific recommendation based on a thorough assessment of the safety, effectiveness and quality of the vaccine by the European Medicines Agency, and was endorsed by the Member States.
As of 31 December 2020, the Commission has contracted 1 965 million doses (of which 1 305 million fixed and 660 million optional).
2 As amended by Council Regulation (EU) 2020/521 of 14/04/2020 activating emergency support under Regulation
(EU) 2016/369, and amending its provisions taking into account the COVID-19 outbreak, OJ 2020, L 117, p. 3 3 See amending budget No 1/2020 (adopted 17/04/2020), amending budget No 6/2020 (adopted 17(09/2020).

Annual accounts of the European Union 2020
9
In 2021, the Commission has contracted a further 2 400 million doses (fixed or optional). However, these
doses will be fully paid by the Member States concerned, with no effect on the EU budget.
2.2.2. Support for research
On 4 May 2020, the EU and its partners hosted an international pledging conference which has raised EUR 9.8 billion in pledges from donors worldwide to kick-start global cooperation on coronavirus research. This includes a pledge of EUR 1.4 billion from the Commission, of which EUR 1 billion comes
from Horizon 2020.
The EU plays a central role in supporting and coordinating research on infectious diseases, with EUR 4.1 billion invested from 2007 to 2019 through the 7th Framework Programme and Horizon 2020, with further commitments in 2020, in addition to the EUR 1 billion pledge for coronavirus research. Up to date figures of all funding pledged and already mobilised under Horizon 2020 to contribute to the Coronavirus Global Response pledging marathon are available online.4
Moreover, on 3 March 2020, the Innovative Medicines Initiative (IMI) supported through the European
Commission’s Horizon 2020 Framework Programme for Research and Innovation, launched a special fast-track call for the ‘Development of therapeutics and diagnostics combatting coronavirus infections’ with an EU contribution of EUR 45 million, which was subsequently increased to EUR 72 million.
Finally, on 8 June 2020 the Commission awarded nearly EUR 166 million, via the European Innovation Council (EIC) Accelerator Pilot, to 36 companies set up to combat the coronavirus pandemic.
2.2.3. Further reinforcement of the Union Civil Protection Mechanism (UCPM/rescEU)
As a complementary measure to the ESI, the UCPM/rescEU was reinforced to allow wider stock-piling and coordination of essential resource distribution across Europe (see Commission Implementing Decision (EU) 2019/570, as amended by Commission Implementing Decision 2020/414 of 19 March 2020 and
Commission Implementing Decision (EU) 2020/452 of 26 March 2020). To this purpose, the 2020 budget was amended to include a further EUR 0.4 billion in commitment appropriations and EUR 0.2 billion in payment appropriations.
The reinforcement of the UCPM/rescEU supports Member States in purchasing some of the required equipment (including therapeutics, medical equipment, personal protective equipment, laboratory supplies), thus increasing the volume as well as complementing and widening the scope of priority items purchased under the Joint Procurement Agreement, a coordinated approach giving Member States a strong position when negotiating with the industry on availability and price of medical products.
The rescEU direct grants provide 100% financing from the EU budget, which includes full financing for development of these capacities and full financing for deployment of equipment. The equipment
purchased will be hosted by one or more Member States, while decision making is organised at EU level, providing emergency supplies over and beyond national stocks. It will be available to all Member States
and will be used in case of insufficient national availability.
2.2.4. Coronavirus Response Investment Initiative (CRII and CRIIplus)
One of the first measures launched by the EU, to support Member States financially in their response to the crisis was the CRII, implemented by Regulation 2020/460 of the European Parliament and the Council
of 30 March 2020. By mobilising unspent money already allocated to EU Member States, the initiative provided an immediate liquidity boost to Member States’ and regions’ budgets and helped them to use cohesion policy funding to finance healthcare expenditure and short-term work schemes, and to offer working capital support for small and medium-sized enterprises. The scope of the European Union Solidarity Fund was also extended to cover major public health emergencies, thereby allowing Member States to receive support under this fund to help them tackle the COVID-19 pandemic.
From April, the CRIIplus, implemented by Regulation 2020/558 of the European Parliament and the
Council of 23 April 2020, made it simpler to quickly make use of existing European Structural and
4 See https://ec.europa.eu/info/research-and-innovation/research-area/health-research-and-innovation/coronavirus-
research-and-innovation/financing-innovation_en.

Annual accounts of the European Union 2020
10
Investment Funds for crisis-related measures, and made it possible to raise the EU’s contribution to
cohesion policy programmes to up to 100% for payment applications submitted between 1 July 2020 and 30 June 2021.
In December, the Commission announced the 2020 results of the two initiatives. Since the beginning of
the crisis, the EU has mobilised significant funding to fight the effects of the pandemic. Small and medium-sized enterprises benefited from most of the funding available, over EUR 10 billion, which helped businesses to stay afloat. EUR 3 billion was directed to citizens, including providing social services for vulnerable groups and temporary employment schemes for workers. Lastly, EUR 7 billion was provided to support the health sector, in addition to the EUR 10.2 billion from the EU budget that was already allocated to this area for the years 2014–2020 (note that there is some overlap between the groups of beneficiaries).
2.2.5. Assistance to enlargement, neighbourhood partners and beyond
The EU has so far mobilised over EUR 38.5 billion to fight the coronavirus on a global scale. The Team
Europe approach combines resources from the EU, its Member States and financial institutions, including the European Investment Bank and the European Bank for Reconstruction and Development, to support partner countries. Half of the EUR 38.5 billion global response to the coronavirus pandemic has been
disbursed.
Moreover, the Commission has concluded ten financial guarantee agreements worth EUR 990 million with partner financial institutions that complete the European Fund for Sustainable Development, the financing arm of the External Investment Plan. The agreements should generate up to EUR 10 billion in investment, to stimulate the economic recovery and strengthen the resilience of EU neighbourhood and African countries.
A further EUR 500 million was allocated to support the COVAX global vaccine initiative, aiming to provide
one billion coronavirus vaccine doses for low and middle-income countries in Africa, Asia, the Caribbean and Pacific, as well as in Europe’s Southern and Eastern Neighbourhood. EUR 100 million were allocated
by the Commission and EUR 400 million by the European Investment Bank, guaranteed by the European Fund for Sustainable Development, for the participation of low and middle-income countries in the COVAX Advance Market Commitment. On 19 February 2021, the European Union announced an additional EUR 500 million for the COVAX Facility, and the European Commission announced EUR 100 million in humanitarian assistance to support the rollout of vaccination campaigns in Africa.
On 25 May 2020 the European Parliament and the Council adopted a Decision (EU) 2020/701 on providing macro‐financial assistance to ten enlargement and neighbourhood partners to allow short‐term
policy space to implement measures to counter the economic fallout from the COVID‐19 pandemic with a
maximum total of EUR 3 billion in the form of loans. In 2020 a total of EUR 1.0 billion was disbursed as a first instalment to seven countries (Ukraine, Jordan, North Macedonia, Georgia, Kosova, Moldova and Montenegro). Up until June 2021 a total of EUR 0.6 billion was disbursed to five countires as a first
instalment (Albania, Tunisia) or second instalment (North Macedonia, Kosovo, Montenegro). Furthermore, a Memorandum of Understanding with Bosnia Herzegovina has been signed.
2.2.6. Temporary Support to mitigate Unemployment Risks in an Emergency (SURE)
following the COVID-19 pandemic
As part of its emergency support package to tackle the economic impact of the COVID-19 pandemic, the
EU adopted on 19 May 2020 Council Regulation (EU) 2020/672 establishing the SURE instrument, to help workers keep their jobs during the crisis. SURE is a temporary scheme which can provide up to EUR 100 billion of financial assistance (loans under favourable terms) to Member States. The instrument enables Member States to request EU financial assistance to help finance sudden and severe increases of national public expenditure, as from 1 February 2020, related to national short-time work schemes and similar measures, including for self-employed persons, or to some health-related measures, in particular in the work place in response to the crisis. To enable the EU to provide financial assistance under SURE, the
Commission is empowered to borrow on the capital markets or with financial institutions on behalf of the
EU up to a maximum amount of EUR 100 billion. SURE loans are backed by the EU budget and guarantees provided by Member States, according to their share in the EU's GNI. The total amount of guarantees amounts to EUR 25 billion. The instrument is time limited until 31 December 2022.

Annual accounts of the European Union 2020
11
As of 31 December 2020 the Commission has proposed a total of EUR 90.3 billion in financial support to
18 Member States, all of which has already been approved by the Council. The majority of this amount,
EUR 87.3 billion, targeting 16 Member States, has already been proposed by August 2020, with the remaining amount of EUR 3 billion, targeting Hungary and Ireland, proposed in October and November 2020, respectively:
Following the first three SURE bond issuances in October and November 2020, the Commission has disbursed a total of EUR 39.5 billion to 15 EU Member States (Belgium, Croatia, Cyprus, Greece, Hungary, Italy, Latvia, Lithuania, Malta, Poland, Portugal, Romania, Slovakia, Slovenia and Spain, see point 6.3).
The implementation of SURE continued in 2021. In February and March 2021 the Commission has
proposed EUR 230 million to Estonia and a further EUR 3.7 billion to Belgium, Cyprus, Greece, Latvia, Lithuania and Malta, increasing the total volume under SURE to EUR 94.3 billion. These additional amounts have been approved by the Council in March and April 2021. Following four further bond issuances in January, March and May 2021, the Commission disbursed a further EUR 50.1 billion, resulting in a total level of disbursements of EUR 89.6 billion.
All the bonds issued under SURE were largely oversubscribed, most of them by double-digit numbers,
and attracted a diverse base of EU and international investors. This resulted in very favourable pricing
terms. The bonds issued by the EU under SURE benefit from a social bond label. This provides investors with confidence that the funds mobilised will serve a truly social objective. The funds raised are being transferred to the beneficiary Member States in the form of loans to help them cover the costs directly related to the financing of national short-time work schemes and similar measures as a response to the pandemic.

Annual accounts of the European Union 2020
12
3. THE LONG-TERM EU BUDGET 2021-2027 AND
NEXT GENERATION EU
In 2020, the EU provided an unprecedented response to the coronavirus crisis that hit Europe and the world. At the heart of it is a stimulus package worth EUR 2.018 trillion in current prices (EUR 1.8 trillion in 2018 prices). It consists of the EU’s long-term budget for 2021-2027 of EUR 1.211 trillion (EUR 1.074 trillion in 2018 prices), topped up by EUR 807 billion (EUR 750 billion in 2018 prices) through NextGenerationEU, a temporary instrument to power the recovery.5 Taken together, the funds will help repair the economic and social damage caused by the coronavirus pandemic and steer the transition towards a modern and more sustainable Europe.
TotalEUR 2.018 trillion
More than 50% of the long-term budget and NextGenerationEU will go to new priorities. The money will go to research and innovation, via Horizon Europe; to fair climate and digital transitions, via the Just Transition Fund and the Digital Europe programme; to preparedness, recovery and resilience, via the
Recovery and Resilience Facility, the EU’s civil protection mechanism, rescEU, and to the health programme, EU4Health.
30% of the long-term budget and NextGenerationEU will be spent to fight climate change, the highest share ever of the largest European budget ever.
20% of NextGenerationEU funds will be invested in the EU’s digital transformation. The funds will help the EU invest more in supercomputing, artificial intelligence, cybersecurity, advanced digital skills and the wider use of digital technologies across the economy and society.
In 2026 and 2027, 10% of the annual spending under the long-term budget will contribute to halting and reversing the decline of biodiversity.
5 The separate values – current and 2018 prices – represent the same amount in nominal and in real terms. The
difference stems from the annual adjustment for inflation.
Single Market, Innovation and Digital 149.5 (+ 11.5 from NGEU)
Cohesion, Resilience and Values 426.7 (+ 776.5 from NGEU)
Natural Resources and Environment 401 (+ 18.9 from NGEU)
Migration and Border Management 25.7
Security and Defence 14.9
Neighbourhood and the World 110.6
European Public Administration 82.5
NextGenerationEU 806.9
Long-term budget 1 210.9

Annual accounts of the European Union 2020
13
NEXT GENERATION EU
Amounts raised and spent under NextGenerationEU (NGEU) will be included in the 2021 annual accounts. The first bond issuance, raising EUR 20 billion via a ten-year bond due in 2031, took place on 15 June 2021.
With a budget of EUR 806.9 billion, NextGenerationEU will help repair the immediate economic and social damage brought about by the coronavirus pandemic. The instrument will help build a post-COVID-19 Europe that is greener, more digital, more resilient and better fit for the current and forthcoming challenges.
Part of the funds – EUR 385.8 billion – will be used to provide loans from the Union to individual Member States. These loans will be repaid by those Member States. The other part – EUR 338.0 billion – will be provided in the form of grants or to enable budgetary guarantees for investment support.
The centrepiece of NextGenerationEU is the Recovery and Resilience Facility – an instrument to offer
grants and loans to support reforms and investments in the EU Member States to a total value of EUR 723.8 billion. The funds under the Recovery and Resilience Facility will be distributed according to national Recovery and Resilience plans prepared by each Member State, in cooperation with the Commission, and in line with an agreed allocation key.
In addition, NextGenerationEU will reinforce several existing EU programmes:
• Cohesion, under the Recovery Assistance for Cohesion and the Territories of Europe (REACT-EU),
to help address the economic consequences of COVID-19 in the first years of the recovery,
• Just Transition Fund, to guarantee that the transition to climate neutrality works for all,
• Rural development, to further support farmers,
• InvestEU, to support investment efforts of our businesses,
NextGenerationEU
contribution to other
programmes EUR 83.1 billion
REACT-EU 50.6
JUST TRANSITION FUND 10.9
RURAL DEVELOPMENT 8.1
INVESTEU
6.1
HORIZON EUROPE 5.4
RESCEU 2.0
Recovery and Resilience
Facility EUR 723.8 billion
338.0 in grants
385.8 in loans
POWER UP
Clean technologies and renewables
RENOVATE Energy efficiency of buildings
RECHARGE AND REFUEL Sustainable transport and charging stations
CONNECT
Roll-out of rapid broadband services
MODERNISE Digitalisation of public administration
SCALE UP Data cloud and sustainable processors
RESKILL AND UPSKILL Education and training to support digital skills

Annual accounts of the European Union 2020
14
• rescEU, so that the EU civil protection mechanism has the capacity to respond to large-scale
emergencies,
• Horizon Europe, to make sure the EU has the capacity to fund more excellence in research.
To finance NextGenerationEU, the EU will borrow on the markets with the EU budget as a guarantee. Repayment will take place over a long time horizon, until 2058. This will avoid immediate pressure on Member States’ national finances and enable EU countries to focus their efforts on the recovery.

Annual accounts of the European Union 2020
15
4. DEPARTURE OF THE UNITED KINGDOM FROM
THE EUROPEAN UNION
4.1. Background
On 31 January 2020, the United Kingdom (UK) withdrew from the European Union. The terms of its
departure are defined in an Agreement on the withdrawal of the UK from the EU and the European Atomic Energy Community6, also known as the ‘Withdrawal Agreement’ or ‘WA’. As part of this deal, the UK agreed to honour all financial obligations undertaken while it was a member of the EU. The agreement entered into force on 31 January 2020.
31 January 2020 The UK officially leaves the Union and the Withdrawal Agrement enters into force
1 February-31 December 2020
Transition period
31 March 2021 Reporting on financial information made by the EU to the UK
16 April 2021 Amounts to be paid are communicated by the EU to the UK
30 June 2021 First payments by the UK under Withdrawal Agreement due to begin
16 September 2021 Amounts to be paid communicated by the EU to the UK
31 October 2021 Second round of payments by the UK to begin
During the transition period, the UK continued to contribute to and benefit from the EU budget, as if it were a Member State. After the end of the transition period and in line with the WA, the UK will continue
to contribute to the EU budget. Equally, the UK will continue to benefit from pre-2021 EU programmes and expenditure as if it was a Member State. The UK will also receive back certain defined monies it paid into the EU budget or monies received by the EU budget linked to its period of membership.
These obligations create liabilities and receivables for the EU which have to be calculated and reflected in the EU’s annual accounts: the 2020 annual accounts show these amounts for the first time, as this is the year the UK left the EU.
These annual accounts therefore contain detailed explanations of the future UK contributions to the EU
budget required by the WA, as well as amounts due to the UK. The amounts concerned will be paid by the UK over a long period of time.
The net amount fully respects the three principles underpinning the financial settlement in the WA:
• no Member State should pay more or receive less because of the UK’s withdrawal from the Union;
• the UK should pay its share of the commitments undertaken during its membership; and
• the UK should neither pay more nor earlier than if it had remained a Member State. This implies in particular that the amounts that the UK should pay are based on the actual outcome of the
budget, i.e. adjusted to implementation.
The WA also details the methodologies to calculate the various amounts, as explained below.
4.2. UK Share
In accordance with Article 139 of the WA, the UK's share of the financial obligations arising from the WA is calculated as a ratio between the own resources made available by the United Kingdom in the years
2014 to 2020 and the own resources made available during that period by all Member States and the United Kingdom. The adjustments resulting from the netting of the VAT and GNI balances for the years
6 OJ L 29, 31.1.2020, p. 7-187.

Annual accounts of the European Union 2020
16
2014 to 2019 are also included. The calculated UK share will be subject to the final adjustments foreseen
in Article 139 WA in 2022. The UK share for 2021 is used for the calculations in points (a) and (c) of
Article 136(3), and in Articles 140 to 147.
The UK share calculated in accordance with Article 139 WA is 12.358072326018200%.
4.3. EU annual accounts: Amounts owed by and to the UK under the Withdrawal Agreement
The WA identifies provides for payments obligations between the two parties in particular in the following areas:
• Own resources (Article 136)
• Outstanding commitments (Article 140)
• Competition fines (Article 141)
• Union Liabilities (Article 142)
• Contingent financial liabilities and financial instruments (Articles 143 & 144)
• Net assets of the European Coal & Steel Community (Article 145)
• EU investment in the European Investment Fund, EIF (Article 146)
• Contingent liabilities concerning legal cases (Article 147).
The WA also lays down the methodology as to how these obligations will be dealt with each year – in summary the EU will report twice a year to the UK on the amounts due and the UK will pay these on a monthly basis. The reporting will be updated each year based on actual figures.
The table below summarises the amounts due by the UK to the EU, as well as any amounts due by the EU to the UK, resulting in a net overall receivable for the EU. All calculations have been made in full respect of the WA. These obligations relate to past commitments made when the UK was a Member State of the EU and during the transition period until 31 December 2020, and will expire as soon as they have been paid or if the obligation does not materialise. Payments will be made in line with the procedure set out in Article 148 WA.
EUR billion
Article 140 Article 142 Other 31.12.2020
Due from the UK 35.0 14.3 0.3 49.6
Due to the UK - - (2.1) (2.1)
Net receivable from the UK 35.0 14.3 (1.8) 47.5
Estimated to be paid by the UK after 2021 28.2 14.3 (1.9) 40.6
Estimated to be paid by the UK in 2021 6.8 0.0 0.0 6.8
The overall amount comprises the following elements:
Article 136: Own resources
Article 136 establishes the provisions applicable after 31 December 2020 in relation to own resources. The UK is entitled to receive its share of adjustments related to the surplus of the year 2020. It is also subject to any adjustments of VAT and GNI own resources that relate to the financial years until 2020 – these adjustments will be calculated yearly until 31 December 2028. Updates of the UK correction are
also made.
The UK is required to pay the traditional own resources collected by them after 28 February 2021, but related to the year 2020 and earlier. Their share of the total made available traditional own resources by the EU 27 and by them is then deducted from this amount. The separate account for traditional own resources shall be fully liquidated at 31 December 2025.
An amount of EUR 230 million is to be paid by the UK during 2021.

Annual accounts of the European Union 2020
17
Article 140: Outstanding commitments (‘RAL’)
The ‘Reste à liquider’, or ‘RAL’ represents the total volume of legal commitments the EU has made to recipients, for which payments will follow in the coming years. The RAL is a normal feature of all multi-annual budgets, such as the EU budget.
The commitments therefore refer to projects, programmes, agreements or contracts which have already been committed to, before 31 December 2020, but which are not yet fully implemented, with payments still to follow. Some of these payments are for UK recipients.
According to the WA, the UK must pay its share of the EU’s outstanding commitments as of 31 December 2020, the end of the transition period. Any commitments, or parts of it, expected to be cancelled (decommitments) and amounts relating to commitments funded by assigned revenue, or to programmes where UK does not participate (opt outs), are deducted from the total amount.
Other adjustments to the amount owed by the UK under this article are related to the net financial
corrections from 2014-2020 or previous programming periods and the Traditional Own Resources relating to 2020 and made available in January-February 2021.
To calculate the UK share of the RAL, the official budgetary RAL as of 31 December 2020 has been used as the starting point (EUR 303.2 billion see table 4.4 in the budgetary implementation tables). As of end-2020, the UK share of the adjusted RAL stood at EUR 36 billion – once adjusted for the forecast of decommitments, the receivable to the EU at end 2020 amounted to EUR 35 billion, of which EUR 6.8 billion will be paid between 30 June 2021 and 31 December 2021.
Article 141 Competition Fines
The European Commission directly enforces EU competition rules, by ensuring that all companies
compete equally and fairly on their merits. This can lead to the imposition of fines. Once imposed by the EU, fines can be contested (via legal proceedings) by the recipient of the fine – the fine is not definitive until all such proceedings are terminated.
The EU will pay the UK, each year, its share of any competition fines that had been decided upon by the Union before 31 December 2020, once these fines become definitive, i.e. the fined entity either does not introduce an appeal in front the European Court of Justice or the appeal fails and it must pay the fine.
In the annual accounts, the amounts owed to the UK as a result of fines are deducted from the overall amount due by the UK. As of 31 December 2020, the estimated UK share of outstanding fines is EUR 1.8 billion. This amount will be returned to the UK over a long period of time. The figure is based on the outstanding cases at 31 December 2020 and it may change, to reflect the actual amounts entered into the budget after the fines have become definitive.
Article 142 Union liabilities
The UK has committed to pay its share of Union liabilities as of end-2020 except for specified liabilities as
laid down in the WA. The UK will therefore be paying its share of obligations linked to the EU as an employer (i.e. pensions and sickness insurance of retired staff), as of 31 December 2020:
1. Pensions of EU officials: The payments of the pensions of EU staff are covered by the EU annual
budget. In addition, EU officials pay pension contributions throughout their working career. These
contributions are entered into the budget as revenue, decreasing the contributions needed from
Member States to finance the global annual budget. The EU Member States commit to cover the
pension costs of EU staff when they retire. In line with this commitment, the UK will be paying,
starting in June 2022, its share of the annual pensions paid to EU officials until all the pension
rights acquired by staff up to 31 December 2020 are exhausted, over several decades. The UK
may decide to settle its obligation at any point, by paying the actuarial liability at that year-end
over a period of 5 years.
2. Pensions of Members of the European Parliament, European Commissioners, Judges in the
European Court of Justice, etc.: The UK will pay its share of the actuarial liability as at 31
December 2020 over a period of 10 years, starting in October 2021.
3. Joint Sickness Insurance Scheme (JSIS): this is the system that covers the healthcare costs of EU
staff, including pensioners. EU officials and pensioners make contributions to the scheme
throughout their career and when retired, as does the EU as an employer. In line with the
principle also applied to the pension system of EU officials, the UK will pay its share of the EU’s

Annual accounts of the European Union 2020
18
budget contribution to the healthcare coverage for retired staff. These payments, beginning in
June 2022, will continue over several decades, or until all those obligations have been exhausted.
As with the pensions of officials, the UK can choose to settle the outstanding obligations at any
point in time by paying the actuarial liability at that year-end over a period of 5 years.
The EU’s liabilities relating to the above post-employment benefit obligations are calculated using audited actuarial valuations based on international standards. The amount attributable to the UK at 31 December 2020 stands at EUR 14.3 billion.
EUR 11 million is due to be paid by the UK during 2021 and relates only to the separate specific pension
schemes (e.g. MEPs). The remaining amounts for all schemes will be paid in line with the arrangements outlined above, from 2022 onwards.
Articles 143/144 Financial instruments and Budgetary guarantees
Under these articles, the UK shall be liable to fund the contingent liabilities of the EU stemming from pre-
withdrawal date operations in relation to its borrowing, lending and guarantee activities should these crystallise and should they not be covered by the UK share in the existing guarantee funds. The EU will refund to the UK amounts which the UK has already contributed to guarantee funds and which ultimately
end up not being needed.
These amounts are primarily:
• Amounts owed to the UK for its share of the European Fund for Sustainable Development (EFSD) Guarantee Fund where the UK has already contributed through its budget payments but where there have been no approved operations pre-withdrawal, thus no obligations for the UK to cover – EUR 93 million due to be returned to the UK in 2021;
• Amounts to be paid to the UK in relation to financial instruments – EUR 46 million;
• The UK remains liable to contribute its share of the EU’s contingent liabilities (budgetary guarantees – EFSI, ELM, EFSM and other borrowings, etc.) if these fall due. The maximum
obligation of the UK totals EUR 12.9 billion at year-end – see note 4.1 of the EU consolidated annual accounts for more details. The amounts are not due from the UK unless the obligation crystallises in the future and is not covered by a guarantee fund. This is considered unlikely.
Article 145 European Coal and Steel Community in Liquidation (ECSC i.L.)
The UK is entitled to its share of the net assets of the European Coal and Steel Community (ECSC) in Liquidation at 31 December 2020 – this will be paid to the UK over 5 years. The total amount payable to the UK is EUR 183 million (EUR 37 million to be repaid, i.e., offset against other amounts due in 2021). This means that every year between 2021 and 2025, the amount of EUR 37 million will be deducted from the amounts due by the UK.
Article 146 Investment in the EIF
The UK is entitled to its share of the investment that the EU has made in the paid-in share capital of the
European Investment Fund (EIF), payable in equal instalments over 5 years. The total amount payable to the UK is EUR 33 million. This means that every year between 2021 and 2025, the amount of EUR 7 million will be deducted from the amounts due by the UK.
Article 147 Contingent liabilities related to legal cases
The UK must pay, each year, its share of amounts paid out by the EU budget in relation to legal cases concerning events that occurred before 31 December 2020. The estimate of the UK’s share of legal cases
that will likely require future payments at year-end is EUR 46 million, but it is not payable by the UK until and unless the cases are settled and a payment is first made by the EU.

Annual accounts of the European Union 2020
19
5. SUMMARY OF BUDGET IMPLEMENTATION
The 2020 final adopted budget amounted to EUR 173.9 billion of commitment appropriations and EUR 164.1 billion of payment appropriations. Its implementation was heavily impacted by the COVID-19 pandemic and subsequent cross-sectoral crisis. The crisis created a need to take resolute actions to reinforce EU public health sectors and mitigate the socio-economic impact in the EU, as well as provide assistance to third countries. The 2020 budget was the last budget implemented under the Multiannual Financial Framework 2014-2020. Its implementation was carefully monitored and actively managed, which resulted in virtually full implementation of almost all programmes.
The implementation of the total commitment appropriations in 2020 totalled EUR 181.7 billion:
EUR 172.9 billion from the final adopted budget;
EUR 1.1 billion from appropriations carried-over from 2019;
EUR 7.7 billion from appropriations stemming from assigned revenue.
Total payments made in 2020 totalled EUR 173.3 billion:
EUR 161.8 billion from the final adopted budget;
EUR 1.6 billion from appropriations carried-over from 2019;
EUR 9.9 billion from appropriations stemming from assigned revenue.
All headings reached high levels of implementation in 2020. The 2020 implementation for all types of appropriations (budget, carry-overs from previous year and assigned revenue) was 97% for commitments and 94% for payments. Implementation rates excluding assigned revenue showed full implementation in 2020 (99.5% for commitment appropriations and 98.5% for payment appropriations).
The highest part of income was represented by Own resources, which amounted to 91.9% of the total
revenue of EUR 174.3 billion, followed 4.7% from Contributions and refunds in connection with EU agreements and programmes, which mainly concern revenue from financial corrections (ESIF, EAGF and EAFRD).
Outstanding commitments (sometimes referred to as RAL – reste à liquider), which are committed amounts not yet paid for, stood at EUR 303.2 billion at the end of 2020. An increase from the 2019 level had been expected, given the difference between budgeted commitment and payment appropriations (EUR 9.8 billion) in the final adopted budget and taking into account the fact that an increase in
outstanding commitments constitutes a normal evolution, as commitment appropriations increase every year as foreseen in the MFF. The increase in outstanding commitments compared to 2019 was EUR 5.5 billion.
The budget result (surplus) decreased from EUR 3.2 billion in 2019 to EUR 1.8 billion in 2020:
EUR million
2020 2019
Revenue for the financial year 174 306 163 918
Payments against current year appropriations (171 721) (157 428)
Payment appropriations carried over to year N+1 (2 086) (1 615)
Cancellation of unused appropriations carried over from year N-1 78 75
Evolution of assigned revenue (B)-(A) 1 398 (1 736)
Unused appropriations at the end of current year (A) 7 694 9 092
Unused appropriations at the end of previous year (B) 9 092 7 356
Exchange rate differences for the year (207) 4
Budget result 1 768 3 217
Annual accounts of the European Union 2020
20
6. FINANCIAL INSTRUMENTS AND BUDGETARY
GUARANTEES
6.1. Financial instruments financed by the EU budget
Under this type of budget implementation, funds are either already disbursed to the fiduciary accounts
managed by the entrusted entities and stay available (as cash and cash equivalents, debt securities or investments in money market funds or pooled portfolios of assets) to cover future guarantee calls or have been invested in equity. The significance and volume of financial instruments financed by the EU budget under direct and indirect management has been increasing in recent years. The basic concept behind this approach, in contrast to the traditional method of budget implementation of giving grants and subsidies, is that for each euro spent from the budget via financial instruments, the final beneficiary receives more than EUR 1 as financial support due to the leverage effect. Financial instruments financed by the EU
budget exist in the form of guarantee instruments, equity instruments and loan instruments. Under the 2021-2027 MFF the use of budgetary guarantees is expected to increase in comparison to the use of financial instruments fully financed or provisioned from the EU budget. In particular, under the InvestEU Programme EUR 26.2 billion of EU guarantee will be provided to the EIB group and other financial institutions to support various policy objectives of the Union by means of financing and investment operations.
6.2. Financial assets held in guarantee funds for budgetary guarantees
Under this type of budget implementation the EU provides guarantees to counterparts for which the funding is only partially provisioned via guarantee funds set up by the Commission and thus creating contingent liabilities for the EU budget in case the provisioning is not sufficient to cover the calls. The EU
has given guarantees on loans granted outside of the EU (so-called External Lending Mandate or ELM) and on debt and equity operations covered by the EFSI guarantee to the EIB Group, as well as guarantees on operations covered by the EFSD guarantee, given to EIB Group and other financial institutions.
In order to mitigate the risk that guarantee calls by the EIB Group or other financial institutions could have on the EU budget, the EU has created dedicated guarantee funds funded by the budget. At 31 December 2020, the Commission holds financial assets in the:
Guarantee Fund for external actions of EUR 2.8 billion;
EFSI Guarantee Fund of EUR 8.0 billion; and
EFSD Guarantee Fund of EUR 0.8 billion.
The Guarantee Fund for external actions is provisioned by the EU budget so as to cover 9% of the guaranteed loans outstanding at year-end for EIB external lending mandate activities to third countries. At 31 December 2020, the total asset value mentioned above covers an exposure of amounts disbursed of EUR 20.3 billion.
The EFSI Guarantee Fund started its activities in 2016. Pursuant to the amended EFSI Regulation (Regulation EU 2017/2396) the EFSI EU guarantee ceiling was increased to EUR 26 billion (from the initial EUR 16 billion) and the boundary for the guarantee fund decreased to 35% (from the initial 50%) of the total EU guarantee obligation. Therefore, the EFSI Guarantee Fund is now expected to reach a total amount of EUR 9.1 billion. The total assets that make up the EFSI Guarantee Fund at 31 December 2020 is EUR 8.0 billion and that covers an exposure of disbursed amounts of EUR 18.9 billion.
Pursuant to EFSD Regulation (Regulation EU 2017/1601), the EFSD Guarantee of up to EUR 1.5 billion (further increased by external contributions) is to be made available to support investments in partner countries in Africa and in the European Neighbourhood. The EU discloses the EFSD Guarantee in the
notes to its consolidated annual accounts (see note 4.1.1) as a contingent liability. As at 31 December 2020, fifteen EFSD guarantee agreements were effective, for a total cover limit of EUR 1 370 million. The EFSD Guarantee Fund has been established in order to cover potential future guarantee calls. Total contributions received into the fund as at 31 December 2020 amount to EUR 0.8
billion. Given that most of the guarantee agreements were concluded with the counterparts in 2020, the

Annual accounts of the European Union 2020
21
programme is in the ramp up phase with EUR 438 million guaranteed operations signed by the
counterparts by the end of 2020.
Following the entry into force of the 2021-2027 MFF, the net assets of the EFSI Guarantee Fund were transferred as from 1 January 2021 into the Common Provisioning Fund (CPF)7 which hold the provisions made to cover the financial liabilities arising from budgetary guarantees and financial assistance programmes under the 2021-2027 MFF. The assets of the EFSD Guarantee Fund and the Guarantee Fund for external actions are expected to be transferred to the CPF in the course of 2021.
6.3. Loans and related borrowings for financial assistance programmes
Financial support for Member States and third countries in the form of bilateral loans financed from the capital markets with the guarantee of the EU budget is provided by the Commission under decisions of
the European Parliament and of the Council.
In 2020 the Commission, acting on behalf of the EU, operated four main programmes under which it may grant loans:
Balance of Payments (BOP) assistance;
European Financial Stabilisation Mechanism (EFSM) assistance;
Macro-financial assistance (MFA), and
SURE assistance.
The capital required to fund the EU lending is raised on the capital markets or with financial institutions.
The EU borrowing and lending activities for financial assistance programmes are non-budget operations. In general, funds raised are on-lent back-to-back to the beneficiary country, i.e. with the same coupon,
maturity and amount. Notwithstanding the back-to-back methodology, the debt service of the funding instruments is a legal obligation of the EU, which will ensure that all payments are made fully and in a timely manner. The Commission has put procedures in place to ensure the repayment of borrowings even in case of a loan default.
7 Article 212 of the Financial Regulation (EU, Euratom) 2018/1046 of the European Parliament and of the Council of 18
July 2018.

Annual accounts of the European Union 2020
22
At 31 December 2020, the nominal amount of the loans granted for financial assistance were:
EUR billion
Total granted Total disbursed
at year-end Total repaid at
year-end Outstanding at
year-end
SURE
Belgium 7.8 2.0 - 2.0
Bulgaria 0.5 - - -
Croatia 1.0 0.5 - 0.5
Cyprus 0.5 0.3 - 0.3
Czechia 2.0 - - -
Greece 2.7 2.0 - 2.0
Hungary 0.5 0.2 - 0.2
Ireland 2.5 - - -
Italy 27.4 16.5 - 16.5
Latvia 0.2 0.1 - 0.1
Lithuania 0.6 0.3 - 0.3
Malta 0.2 0.1 - 0.1
Poland 11.2 1.0 - 1.0
Portugal 5.9 3.0 - 3.0
Romania 4.1 3.0 - 3.0
Slovakia 0.6 0.3 - 0.3
Slovenia 1.1 0.2 - 0.2
Spain 21.3 10.0 - 10.0
90.3 39.5 - 39.5
EFSM
Ireland 22.5 22.5 - 22.5
Portugal 26.0 24.3 - 24.3
48.5 46.8 - 46.8
MFA
Ukraine 5.0 4.4 (0.6) 3.8
Tunisia 1.4 0.8 - 0.8
Jordan 1.1 0.6 - 0.6
Other 1.5 0.8 (0.2) 0.6
9.0 6.6 (0.8) 5.8
BOP
Latvia 3.1 2.9 (2.7) 0.2
3.1 2.9 (2.7) 0.2
Total 150.9 95.8 (3.5) 92.3

Annual accounts of the European Union 2020
23
The repayment schedule for the amounts outstanding at year-end is as follows:
EUR billion
SURE EFSM MFA TOTAL
2021 - 9.8 - 9.8
2022 - 2.7 - 2.7
2023 - 3.5 0.1 3.6
2024 - 2.6 0.6 3.2
2025 8.0 2.4 - 10.4
2026 - 4.0 0.1 4.1
2027 - 3.0 0.2 3.2
2028 - 2.3 0.2 2.5
2029 - 1.4 0.9 2.3
2030 10.0 - 0.1 10.1
2031 - 2.2 0.9 3.1
2032 - 3.0 0.1 3.1
2033 - 2.1 0.5 2.6
2034 - 0.2 0.2
2035 8.5 2.0 1.9 12.4
2036 - 1.0 - 1.0
2038 - 1.8 - 1.8
2040 7.0 - - 7.0
2042 - 3.0 - 3.0
2050 6.0 - - 6.0
Total 39.5 46.8 5.8 92.1
SURE
SURE was established in 2020 to provide financial assistance to Member States which are experiencing, or are seriously threatened with, a severe economic disturbance caused by the COVID-19 pandemic on their territory. The instrument complements the national measures taken by affected Member States.
The maximum amount of financial assistance shall not exceed EUR 100 billion for all Member States. In 2020, Member States signed loan facility agreements amounting to EUR 85.9 billion and out of this amount EUR 39.5 billion were disbursed. The maturity of loans varies between 5, 10, 15, 20 and 30
years.
EFSM
EFSM was created to provide financial assistance to all Member States experiencing or seriously threatened by a severe economic financial disturbance caused by exceptional occurrences beyond their control. The EFSM was used to provide financial assistance, conditional on the implementation of reforms, to Ireland and Portugal between 2011 and 2014. This programme expired and no additional loans can be
drawn, though it remains in place for specific tasks such as the lengthening of maturities for loans to Ireland and Portugal and providing bridging loans. In February 2021, Ireland and Portugal requested the maturity lengthening for the amounts due in June 2021 (EUR 4.8 billion) and September 2021 (EUR 5 billion). In April 2021, the Commission has borrowed EUR 4.8 billion to roll-over the loans due in June 2021, which have been extended by 15 years.
No new operations nor loan repayments occurred in 2020.
MFA
The macro-financial assistance programme (MFA) is a form of financial assistance extended by the EU to
partner countries outside the EU experiencing a balance of payments crisis. It takes the form of medium/long-term loans or grants, or a combination of these, and is only available to countries benefiting from a disbursing IMF programme.

Annual accounts of the European Union 2020
24
In 2020, the Commission adopted a proposal for a EUR 3 billion MFA package to ten enlargement and
neighbourhood partners to help them limit the economic fallout of the coronavirus pandemic. The
decision was adopted by the European Parliament and the Council on 25 May 2020.
Overall, EUR 1.7 billion was disbursed in 2020 under the MFA programme.
BOP
The BOP is an assistance programme designed for countries outside the euro area that are experiencing or are threatened by difficulties regarding their balance of payments. BOP assistance takes the form of
medium-term loans that are conditional on the implementation of policies designed to address underlying economic problems. Typically, balance of payments assistance from the EU is offered in cooperation with the International Monetary Fund (IMF) and other international institutions or countries.
No new operations or loan repayments occurred in 2020.
6.4. Budgetary contingent liabilities for financial assistance programmes
Borrowings of the EU constitute direct and unconditional obligations of the EU and are guaranteed by the EU Member States (budgetary contingent liabilities). Borrowings undertaken to fund loans to countries outside the EU are covered by the Guarantee Fund for external actions. Should a beneficiary Member State default, the debt service will be drawn from the available treasury balance of the Commission, if possible. If that is not possible at that time, the Commission would draw the necessary funds from the Member States. EU Member States are legally obliged, according to the EU own resources legislation
(Article 14 of Council Regulation 609/2014), to make available sufficient funds to meet the EU’s obligations. Thus investors are only exposed to the credit risk of the EU, not to that of the beneficiary of loans funded. ’Back-to-back' lending ensures that the EU budget does not assume any interest rate or foreign exchange risk.
Loans provided to Member States under the SURE instrument are underpinned by a system of voluntary guarantees from Member States amounting to 25% of the maximum amount of financial assistance. Each
Member State’s contribution to the overall amount of the guarantee corresponds to its relative share in the total gross national income (GNI) of the European Union, based on the 2020 EU budget.
For each country programme, the European Parliament, the Council and the Commission decisions determine the overall granted amount, the number of instalments to be disbursed, and the maximum (average) maturity of the loan package. Subsequently, the Commission and the Member State concerned, agree the loan/funding parameters, in particular the maturity of instalments. In addition, except for the first one, all instalments of the loan depend on compliance with policy conditions, in the
context of a joint EU/IMF financial assistance, which is another factor influencing the timing of funding operations. This implies that the timing and maturities of issuances are dependent on the related EU lending activity. Funding is exclusively denominated in euro and the maturity spectrum is from 3 to 30 years.

Annual accounts of the European Union 2020
25
7. FINANCIAL STATEMENTS ANALYSIS
7.1. REVENUE
The consolidated revenue of the EU incorporates amounts related to exchange transactions and non-exchange transactions, the latter being the most significant. The five-year trend of the main non-
exchange revenue categories (comprising GNI resources, Traditional own resources, VAT resources, Fines and Recovery of expenses, and excluding the one-time effect of revenue relating to the UK’s withdrawal from the EU in the year 2020) is as follows:
Five-year trend of revenue from main non-exchange transactions (in EUR million)
*Excluding non-exchange revenue relating to the UK’s withdrawal from the EU (EUR 47 456 million)
As budget revenue should equal (or exceed) budget expenditure, the main driver in the revenue trend shown above is the payments made each year.
In 2020, the consolidated revenue amounted to EUR 224.0 billion, a considerable increase of EUR 63.7 billion or 39.7% from the previous year figure of EUR 160.3 billion. The main driver of this development
was the financial effect of the UK’s withdrawal from the European Union (EUR 47.5 billion). If adjusted for this one-time effect, the consolidated revenue of 2020 amounted to EUR 176.5 EUR billlion, still an increase of EUR 16.2 billion or 10.1% compared to the previous year. This adjusted increase is mainly due to the following effects:
Revenue from GNI (gross national income), the primary element of the EU’s operating revenue,
increased from EUR 108.8 billion in 2019 to EUR 125.4 billion in 2020. The increase of EUR 16.6 billion or 15.3% was mainly due to the increase in payment appropriation needs for the year 2020, designed to reinforce key EU policies, e.g the COVID-19 vaccines strategy (implemented via the Emergency Support Instrument), and the cohesion area (by adopting the Coronavirus Response Investment Initiative Plus).
Other non-exchange revenue increased from EUR 2.1 billion in 2019 to EUR 7.1 billion in 2020.
The increase of EUR 5.0 billion was mainly due to the contribution from Member States to the Innovation Fund which started operating in 2020 (EUR 2.1 billion), an increase of the budget
surplus taken in from the previous year (EUR 3.2 billion in 2020 vs. EUR 1.8 billion in 2019) as well as a contribution from Member States of EUR 0.8 billion to top up the Emergency Support Instrument ESI.
Annual accounts of the European Union 2020
26
Financial revenue increased from EUR 1.8 billion in 2019 to EUR 3.4 billion in 2020. The increase
of EUR 1.6 billion or 88.9% was mainly due to the increase in late payment interest, more
specifically for the UK TOR cases (EUR 0.5 billion) and non-UK cases (EUR 0.5 billion), as well as revenues from bond premiums related to the SURE instrument (EUR 0.7 billion).
Fines revenue decreased from EUR 4.3 billion in 2019 to EUR 0.5 billion in 2020. The decrease of EUR 3.8 billion or 88.4% was due to both the lower number and the lower amounts of fines issued in 2020. Whereas in 2020 the main fines amounted to EUR 0.26 billion in total (Orbia,
Clariant and Celanese), the biggest cases in 2019 amounted to EUR 3.1 billion (Google, two Forex cases and MasterCard).
The above changes were counterbalanced by a decrease in revenue from traditional own resources, which fell from EUR 21.2 billion in 2019 to EUR 19.6 billion in 2020 (a decrease of EUR 1.6 billion or 7.5%) and the decrease in financial recoveries, which fell from EUR 2.6 billion in 2019 to EUR 1.4 billion in 2020 (a decrease of EUR 1.2 billion or 46.2%).
7.2. EXPENSES
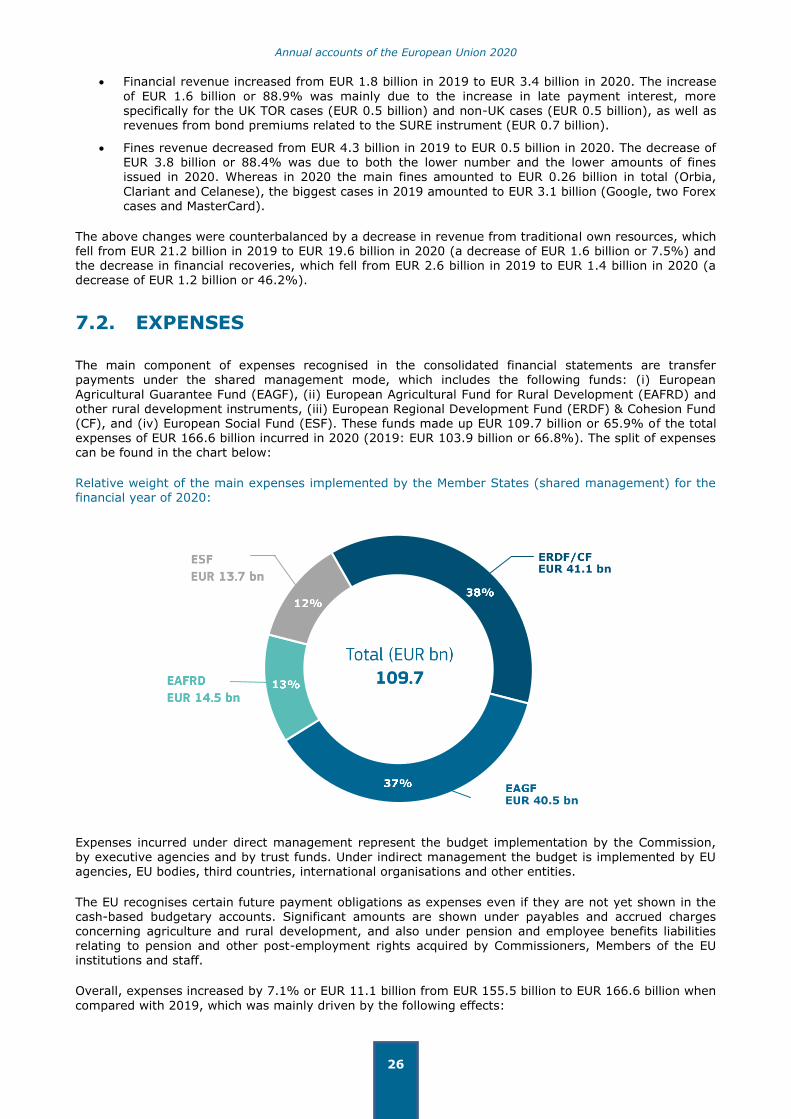
The main component of expenses recognised in the consolidated financial statements are transfer payments under the shared management mode, which includes the following funds: (i) European
Agricultural Guarantee Fund (EAGF), (ii) European Agricultural Fund for Rural Development (EAFRD) and other rural development instruments, (iii) European Regional Development Fund (ERDF) & Cohesion Fund (CF), and (iv) European Social Fund (ESF). These funds made up EUR 109.7 billion or 65.9% of the total expenses of EUR 166.6 billion incurred in 2020 (2019: EUR 103.9 billion or 66.8%). The split of expenses can be found in the chart below:
Relative weight of the main expenses implemented by the Member States (shared management) for the financial year of 2020:
Expenses incurred under direct management represent the budget implementation by the Commission, by executive agencies and by trust funds. Under indirect management the budget is implemented by EU agencies, EU bodies, third countries, international organisations and other entities.
The EU recognises certain future payment obligations as expenses even if they are not yet shown in the cash-based budgetary accounts. Significant amounts are shown under payables and accrued charges concerning agriculture and rural development, and also under pension and employee benefits liabilities relating to pension and other post-employment rights acquired by Commissioners, Members of the EU institutions and staff.
Overall, expenses increased by 7.1% or EUR 11.1 billion from EUR 155.5 billion to EUR 166.6 billion when
compared with 2019, which was mainly driven by the following effects:

Annual accounts of the European Union 2020
27
ERDF & CF expenses increased from EUR 35.2 billion in 2019 to EUR 41.1 billion in 2020. The
increase of EUR 5.9 billion or 16.8% was due to better implementation of programmes as the MFF
advanced.
ESF expenses increased from EUR 11.2 billion in 2019 to EUR 13.7 billion in 2020. The increase of EUR 2.5 billion or 22.3% was mainly due to increased implementation.
Expenses under direct management by the Commission increased from EUR 18.9 billion in 2019 to EUR 22.1 billion in 2020. The increase of EUR 3.2 billion or 16.9% was mainly due to the
spending on vaccines against COVID-19 (EUR 1.6 billion) as well as spending under the neighbourhood and pre-accession instruments (EUR 0.6 billion).
EAGF expenses decreased from EUR 44.0 billion in 2019 to EUR 40.5 billion in 2020. The decrease of EUR 3.5 billion or 8% was mainly due to the decrease of EUR 2.6 billion in amounts claimed for direct payments aimed at contributing to farm incomes.
7.3. ASSETS
The most significant items on the asset side of the balance sheet relate to financial assets (other than cash and cash equivalents), which make up 40.4% of the EU’s total assets, followed by receivables and pre-financing with percentages of 26.6% and 22.4% respectively:
Composition of the consolidated assets of the EU
As at 31 December 2020 the total assets were EUR 280.0 billion, reflecting an increase of EUR 101.1 billion or 56.5% over the previous year (2019: EUR 178.9 billion), mainly due to the following key changes:
Receivables increased from EUR 24.0 billion in 2019 to EUR 74.5 billion in 2020. The considerable increase of EUR 50.5 billion is primarily the result of the UK’s withdrawal from the European
Union and the receivable generated by this (EUR 47.5 billion).
Loans increased from EUR 52.7 billion in 2019 to EUR 93.3 billion in 2020. The considerable increase of EUR 40.6 billion or 77.0% mainly reflects the issuance of loans for financial assistance under the SURE instrument (EUR 39.5 billion).
Pre-financing increased from EUR 51.4 billion in 2019 to EUR 62.7 billion in 2020. The increase of EUR 11.3 billion or 22.0% is mainly due to the non-recovery of the 2019 annual pre-financing in
2020 as part of the Coronavirus Response Investment Initiatives measures (EUR 6.6 billion) and
the pre-financing paid for the development of vaccines to address the COVID-19 pandemic (EUR 1 billion).

Annual accounts of the European Union 2020
28
The cash balance of EUR 16.7 billion at year end is made up of the following main elements:
An amount of EUR 9.4 billion of payments not yet implemented at year end, of which EUR 7.9 billion relates to assigned revenues. The assigned revenues include EUR 1.3 billion of cash raised on the sale of emission allowances and recovered from the EIB after being assigned by Member States to the Innovation Fund.
An amount of EUR 2.4 billion belonging to financial instruments concerning primarily cash equivalents managed by fiduciaries, on behalf of the Commission, for the purpose of
implementing particular financial instrument programmes funded by the EU budget and cash and cash equivalents held in the guarantee funds relating to budgetary guarantees. The cash belonging to financial instruments and guarantee funds can only be used by the programmes concerned.
An amount of EUR 1.6 billion belonging to agencies and joint undertakings and managed by the Commission treasury on behalf of these entities.
Cash relating to fines of EUR 1.5 billion mainly relating to cash received in connection with fines
issued by the Commission for which the case is still open and, to a lesser extent, to definitively received fines to be transferred to the budget in the following year.
Cash relating to other consolidated institutions, agencies and bodies of EUR 1.4 billion.
Pre-financing
It should be noted that the level of pre-financing is significantly influenced by the MFF cycle – for example at the beginning of an MFF period large advances are expected to be paid to Member States under cohesion policy and these amounts remain available to the Member States until the closure of the
programmes. An annual pre-financing is also paid out, which must be used within the year or be recovered the following year as part of the annual closure of the accounts cycle. The Commission makes every effort to ensure that the levels of pre-financing are maintained at an appropriate level. A balance has to be struck between ensuring sufficient funding for the projects and the timely recognition of expenditure.
The total pre-financing (excluding other advances to Member States and contributions to the trust funds
Bêkou and Africa) on the EU balance sheet amounts to EUR 55.5 billion (2019: EUR 44.4 billion), almost all of which relates to Commission activities. Some 58% of the Commission's pre-financing concerns shared management, which means that the implementation of the budget is delegated to Member States (the Commission retains a supervisory role).
Commission pre-financing by management mode
Annual accounts of the European Union 2020
29
7.4. LIABILITIES
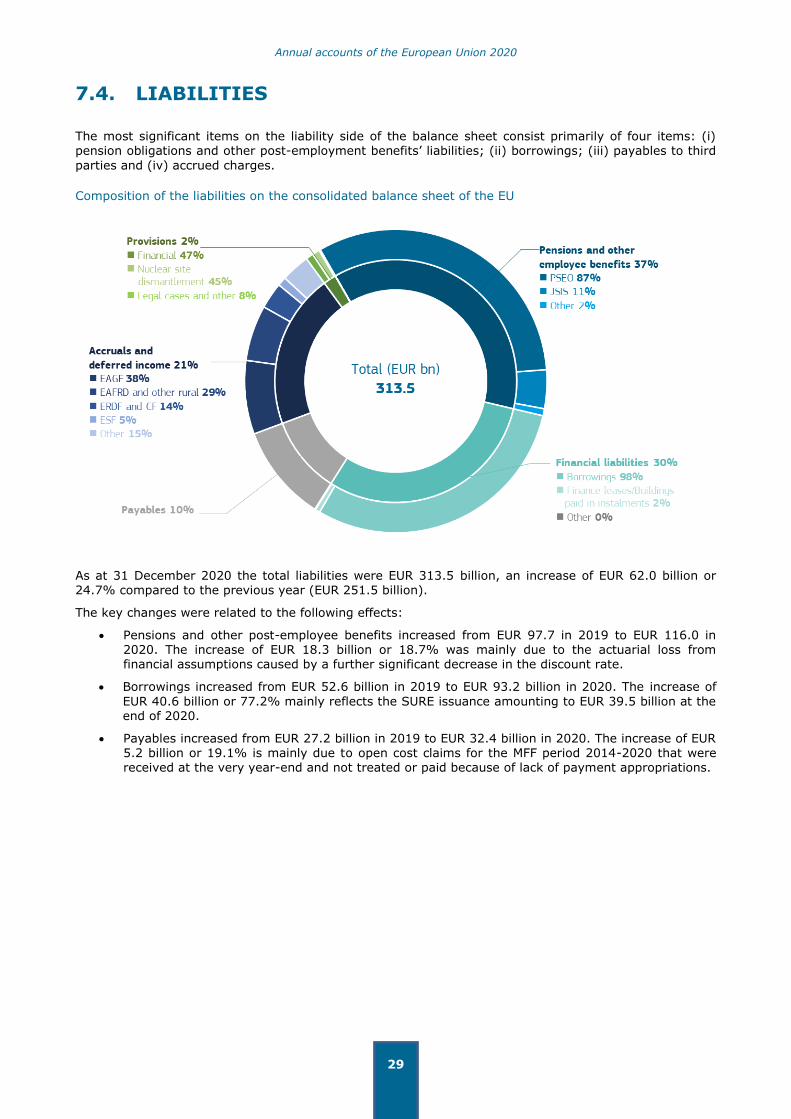
The most significant items on the liability side of the balance sheet consist primarily of four items: (i) pension obligations and other post-employment benefits’ liabilities; (ii) borrowings; (iii) payables to third
parties and (iv) accrued charges.
Composition of the liabilities on the consolidated balance sheet of the EU
As at 31 December 2020 the total liabilities were EUR 313.5 billion, an increase of EUR 62.0 billion or 24.7% compared to the previous year (EUR 251.5 billion).
The key changes were related to the following effects:
Pensions and other post-employee benefits increased from EUR 97.7 in 2019 to EUR 116.0 in 2020. The increase of EUR 18.3 billion or 18.7% was mainly due to the actuarial loss from financial assumptions caused by a further significant decrease in the discount rate.
Borrowings increased from EUR 52.6 billion in 2019 to EUR 93.2 billion in 2020. The increase of
EUR 40.6 billion or 77.2% mainly reflects the SURE issuance amounting to EUR 39.5 billion at the end of 2020.
Payables increased from EUR 27.2 billion in 2019 to EUR 32.4 billion in 2020. The increase of EUR
5.2 billion or 19.1% is mainly due to open cost claims for the MFF period 2014-2020 that were received at the very year-end and not treated or paid because of lack of payment appropriations.

Annual accounts of the European Union 2020
30
Total cost claims and invoices received and recognised in the Balance Sheet under the heading ‘Payables’
Net assets
The excess of liabilities over assets does not mean that the EU institutions and bodies are in financial difficulties, rather it means that certain liabilities will be funded by future annual budgets. Many expenses are recognised under accrual accounting rules in the current year although they may be actually paid in
the following or later years and funded using future budgets; the related revenues will only be accounted for in future periods. The most significant amounts to be highlighted are the EAGF activities (the bulk of which is usually paid in the first quarter of the following year) and the employee benefits liability (to be paid over several decades). The considerable decrease of the amounts to be called from Member States
from EUR 77.6 billion in 2019 to EUR 38.5 billion in 2020 is primarily due to the revenue related to the net amounts owed by the UK under the WA signed following its departure from the Union in 2020 – see
note 2.6.1.2 of the EU consolidated annual accounts.

Annual accounts of the European Union 2020
31
8. EU POLITICAL AND FINANCIAL FRAMEWORK,
GOVERNANCE AND ACCOUNTABILITY
The European Union (EU) is a Union on which the Member States confer competences to attain objectives they have in common. The Union is founded on the values of respect for human dignity, freedom, democracy, equality, the rule of law and respect for human rights, including the rights of persons belonging to minorities. These values are common to the Member States in a society in which pluralism, non-discrimination, tolerance, justice, solidarity and equality between women and men prevail.
8.1. POLITICAL AND FINANCIAL FRAMEWORK
EU Treaties
The overarching objectives and principles that guide the Union and the European institutions are defined in the Treaties. The Union and the EU
institutions may only act within the limits of the competences conferred by
the Treaties so as to attain the objectives set out therein and must do this in
accordance with the principles8 of subsidiarity and proportionality. To attain its objectives and carry out its policies, the Union provides itself with the necessary financial means. The Commission is responsible for promoting the general interest of the Union which includes executing the budget and managing programmes in cooperation with the Member States and in accordance with the principle of sound
financial management.
The EU pursues the objectives established by the Treaty with a number of tools, one of which is the EU budget. Others are, for example, a common legislative framework or joint policy strategies.
Commission political priorities
The political priorities of the Commission are defined in the political guidelines set by the President of the Commission. Under President von der Leyen, the Commission which took office on 1 December 2019 will focus on
the following six headline ambitions:
6 HEADLINE AMBITIONS
A European Green Deal
– Striving to be the first climate-neutral continent
A Europe fit for the digital age
– Empowering people with a new generation of technologies
An economy that works for people
– Working for social fairness and prosperity
A stronger Europe in the world
– Europe to strive for more by strengthening our unique brand of responsible global leadership
Promoting our European way of life
– Building a Union of equality in which we all have the same access to opportunities
A new push for European democracy
– Nurturing, protecting and strengthening our democracy
8 Under the principle of subsidiarity, the Union shall act only if and in so far as the objectives of the proposed action
cannot be sufficiently achieved by the Member States but can rather, by reason of the scale or effects, be better achieved at Union level. Under the principle of proportionality, the content and form of Union action shall not exceed what is necessary to achieve the objectives of the Treaties (see Article 5 TEU).

Annual accounts of the European Union 2020
32
Multiannual financial
framework and spending programmes
The policies supported by the EU budget are implemented in accordance with
the multiannual financial framework (MFF) and corresponding sectoral
legislation defining spending programmes and instruments. These translate the EU’s political priorities into financial terms over a period long enough to be effective and
to provide a coherent long-term perspective for beneficiaries of EU funds and co-financing national authorities. Maximum annual amounts (ceilings) are set for EU expenditure as a whole and for the main
categories of expenditure (headings). The sum of the ceilings of all headings gives the total ceiling for commitment appropriations. The MFF is adopted by the Council by unanimity of all Member States, with the consent of the European Parliament. The new 2021-2027 multiannual financial framework was adopted on 17 December 2020.
Annual budget
The annual budget is prepared by the Commission and usually agreed by mid-December by the European Parliament and the Council, based on the procedure of Article 314 TFEU. According to the principle of budgetary
equilibrium, total revenue must equal total expenditure (payment
appropriations) for a given financial year.
The main sources of funding of the EU are own resources revenues which are complemented by other
revenues. There are three types of own resources: traditional own resources (mainly custom duties), the own resource based on value added tax (VAT) and the own resource based on gross national income (GNI). Other revenues arising from the activities of the EU (e.g. competition fines) normally represent less than 10% of total revenue (disregarding the one-time effect of the UK’s withdrawal from the EU on the 2020 annual accounts). The overall amount of own resources needed to finance the budget is determined by total expenditure less other revenue.
Management modes
The EU budget is implemented in three management modes which determine how the money is paid out and managed:
Shared management: the vast proportion of the budget (around 3/4 of the budget) is managed under a system of shared management by the Commission in cooperation with the Member
States, notably in the areas of structural funds and agriculture.
Direct management: the Commission also manages programmes itself and can delegate the implementation of specific programmes to executive agencies.
Indirect management: Expenditure decisions can also be indirectly managed via other bodies within or outside the EU. The Financial Regulation and/or contribution agreements define the necessary control and reporting mechanisms by these entities and the supervision by the Commission where budget implementation tasks are entrusted to national agencies, the European
Investment Bank Group, third countries, international organisations (e.g. the World Bank or the United Nations) and other entities (e.g. EU decentralised agencies, Joint Undertakings).
Financial Regulation
The Financial Regulation (FR) 9 applicable to the general budget is a central act in the regulatory architecture of the EU´s finances. It defines in detail the financial rules applicable to the execution of the EU budget and the roles of the different actors involved in ensuring that the money is used soundly and
achieves the objectives set.
9 Regulation (EU, Euratom) No 2018/1046 of the European Parliament and of the Council of 18 July 2018 on the
financial rules applicable to the general budget of the Union and repealing Council Regulation (EU, Euratom) No 2012/966 – OJ L 193 of 30 July 2018, p. 1.

Annual accounts of the European Union 2020
33
8.2. GOVERNANCE AND ACCOUNTABILITY
8.2.1. Institutional structure
The EU has an institutional framework which aims to promote its values, advance its objectives, serve its interests, those of its citizens and those of the Member States, and ensure the consistency, effectiveness and continuity of its policies and actions. The organisational structure consists of institutions, agencies and other EU bodies, which are included in the EU consolidated accounts, as far as the consolidation criteria as set out in the FR and the applicable accounting rules are met (please see note 9 of the EU consolidated annual accounts for the list of entities included in the scope of consolidation).
The European Parliament, jointly with the Council, exercises legislative and budgetary functions. The
Commission is politically accountable to the European Parliament. The Council also carries out policy-making and coordinating functions within the general political direction and priorities of the Union set by
the European Council.
The European Commission is the executive arm of the European Union. It promotes the Union’s general interest and takes appropriate initiatives to that end. It ensures the application of the Treaties and oversees the application of Union law by Member States under the control of the Court of Justice of the
European Union. It exercises coordinating, executive and management functions, executes the budget and manages programmes.
The Commission implements the budget, in large part in cooperation with the Member States.10 Together, they ensure that the appropriations are used in accordance with the principles of sound financial management. Regulations lay down the control and audit obligations of the Member States when they share the implementation of the budget and the resulting responsibilities. They also lay down the responsibilities and detailed rules for each of the EU’s institutions as concerns their own expenditure.
8.2.2. The Commission’s governance structure
The Commission’s governance arrangements and how these ensure that the Commission functions as a modern, accountable and performance-oriented institution are described in the Communication, C(2020) 4240 dd 24.6.2020, on Governance in the European Commission.
The Commission performs its functions under the leadership of the College of Commissioners, which sets priorities and takes overall political responsibility for the work of the Commission. As a College, the
Commission works under the political guidance of its President, who presents the objectives he or she intends to pursue in the form of the President’s political guidelines. The President decides on the internal organisation of the Commission, ensuring that it acts consistently, efficiently and as a collegiate body. The internal arrangements create a structure of robust controls and management tools which allow the
College of Commissioners to take political responsibility for the work of the Commission.11
The College delegates the operational implementation of the budget and financial management to the Directors-General and Heads of Service who lead the administrative structure of the Commission. This
decentralised approach creates an administrative culture that encourages civil servants to take responsibility for activities over which they have control and requires them to provide assurance as concerns the activities for which they are accountable.
8.2.3. The Commission’s financial management
In the Commission, the roles and responsibilities in financial management are clearly defined (e.g. in the
FR and the Internal Rules12) and applied accordingly. As authorising officers by delegation, the Commission’s Directors-General and Heads of Service are responsible for the sound financial
10 See Article 317 TFEU. 11 As a result, the term 'European Commission' is used to denote both the institution – the College – formed by the
Members of the Commission, and its administration managed by the Directors-General of its departments (and heads of other administrative structures such as services, offices and executive agencies).
12 Since mid-2019 (further to the revised Article 12 of the Internal Rules) the management of the European Development Fund (EDF) is co-delegated among five departments (INTPA (DEVCO), ECHO, EAC, EACEA, JRC).

Annual accounts of the European Union 2020
34
management of EU resources, compliance with the provisions of the Financial Regulation, risk
management and establishing an appropriate internal control framework.
The responsibility of the Authorising Officers covers the entire management process, from determining what needs to be done to achieve the policy objectives set by the institution to managing the activities from both an operational and a sound financial management standpoint. Tasks can further be sub-delegated to Directors, Heads of Unit and others, who thereby become Authorising Officers by Sub-Delegation. Each authorising officer by delegation may rely on one or two directors in charge of risk
management and internal control to oversee and monitor the implementation of internal control systems.
The Commission’s central services provide guidance and advice and promote best practices, including through the work of the Corporate Management Board.
The FR requires each authorising officer to prepare an annual activity report (AAR) detailing achievements, internal control and financial management activities during the year. The AAR includes a
declaration that resources have been used based on the principles of sound financial management and that control procedures are in place which provide the necessary guarantees concerning the legality and
regularity of the underlying transactions. The Annual Management and Performance Report for the EU budget is the main instrument through which the College of Commissioners assumes political responsibility for the financial management of the EU budget.
The Accounting Officer of the Commission is centrally responsible for treasury management, recovery procedures, laying down accounting rules based on International Public Sector Accounting Standards (IPSAS), validating accounting systems and the preparation of the Commission's and consolidated annual accounts of the EU. Furthermore, the Accounting Officer is required to sign the annual accounts declaring
that they present fairly, in all material aspects, the financial position, the results of the operations and the cash flows of the Union. The annual accounts are adopted by the College of Commissioners. The Accounting Officer is an independent function and bears a major responsibility as regards financial reporting in the Commission.
The Internal Auditor of the Commission is likewise a centralised and independent function and provides independent advice, opinions and recommendations on the quality and functioning of internal control
systems inside the Commission, EU agencies and other autonomous bodies.
The Audit Progress Committee ensures the independence of the Internal Auditor and monitors the quality of internal audit work and the follow-up given by the Commission services to internal and external audit recommendations, as well as to the European Court of Auditors’ discharge related findings and recommendations on the reliability of the annual consolidated EU accounts. The advisory role of the committee contributes to the overall further improvement of the Commission’s effectiveness and efficiency in achieving its goals and facilitates the College’s oversight of the Commission’s governance,
risk management, and internal control practices.
8.2.4. External audit and discharge procedure
In line with the principles of sound financial management, funds must be managed in an effective, efficient and economic manner. An accountability framework based on comprehensive reporting, external audit and political control exists to provide reasonable assurance that EU funds are spent in a proper manner.
Every year the European Court of Auditors examines the reliability of the accounts, whether all revenue has been received and all expenditure incurred in a lawful and regular manner and whether the financial management and the qualitative aspects of budgeting, including the performance dimension, have been sound. The publication of the annual report of the European Court of Auditors is the starting point for the discharge procedure. The auditors also prepare special reports on specific spending or policy areas, or on budgetary or management issues.
The European Parliament decides, after a recommendation by the Council, on whether or not to provide its final approval, known as ‘granting discharge’, on the way the Commission implemented the EU budget in a given year. The annual discharge procedure ensures that the Commission is held politically accountable for the implementation of the EU budget.
The decision on the discharge is also based on the Commission’s integrated financial and accountability reporting, on hearings of Commissioners in the European Parliament and on the replies provided to written questions addressed to the Commission.

Annual accounts of the European Union 2020
35
NOTE ACCOMPANYING THE
CONSOLIDATED ACCOUNTS
The consolidated annual accounts of the European Union for the year 2020 have been prepared on the basis of the information presented by the institutions and bodies under Article 246(2) of the Financial Regulation applicable to the general budget of the European Union. I hereby declare that they were prepared in accordance with Title XIII of this Financial Regulation and with the accounting principles, rules and methods set out in the notes to the financial statements.
I have obtained from the accounting officers of these institutions and bodies, who certified its reliability,
all the information necessary for the production of the accounts that show the European Union's assets and liabilities and the budgetary implementation.
I hereby certify that based on this information, and on such checks as I deemed necessary to sign off the accounts of the European Commission, I have a reasonable assurance that the accounts present fairly, in all material aspects, the financial position, the results of the operations and the cashflows of the European Union.
Rosa ALDEA BUSQUETS
Accounting Officer of the Commission
18 June 2021

Annual accounts of the European Union 2020
36
EUROPEAN UNION
FINANCIAL YEAR 2020
CONSOLIDATED FINANCIAL STATEMENTS AND EXPLANATORY NOTES
It should be noted that due to the rounding of figures into millions of euros, some financial data in the
tables below may appear not to add-up.
Annual accounts of the European Union 2020
37
CONTENTS
BALANCE SHEET .............................................................................................. 38
STATEMENT OF FINANCIAL PERFORMANCE ......................................................... 39
CASHFLOW STATEMENT ................................................................................... 40
STATEMENT OF CHANGES IN NET ASSETS .......................................................... 41
NOTES TO THE FINANCIAL STATEMENTS ............................................................ 42
1. SIGNIFICANT ACCOUNTING POLICIES ..................................................... 43
2. NOTES TO THE BALANCE SHEET ............................................................. 58
3. NOTES TO THE STATEMENT OF FINANCIAL PERFORMANCE ........................ 91
4. CONTINGENT LIABILITIES AND ASSETS .................................................. 99
5. BUDGETARY AND LEGAL COMMITMENTS ............................................... 104
6. FINANCIAL RISK MANAGEMENT ............................................................ 108
7. RELATED PARTY DISCLOSURES ............................................................ 120
8. EVENTS AFTER THE BALANCE SHEET DATE ............................................ 122
9. SCOPE OF CONSOLIDATION ................................................................. 123

Annual accounts of the European Union 2020
38
BALANCE SHEET
EUR million
Note 31.12.2020 31.12.2019
NON-CURRENT ASSETS
Intangible assets 2.1 620 515
Property, plant and equipment 2.2 11 682 11 380
Investments accounted for using the equity method 2.3 588 591
Financial assets 2.4 99 214 66 714
Pre-financing 2.5 34 519 26 240
Exchange receivables and non-exchange recoverables 2.6 45 813 3 607
192 434 109 047
CURRENT ASSETS
Financial assets 2.4 13 881 4 514
Pre-financing 2.5 28 229 25 206
Exchange receivables and non-exchange recoverables 2.6 28 681 20 367
Inventories 2.7 80 68
Cash and cash equivalents 2.8 16 742 19 745
87 613 69 900
TOTAL ASSETS 280 047 178 947
NON-CURRENT LIABILITIES
Pension and other employee benefits 2.9 (116 020) (97 659)
Provisions 2.10 (3 878) (3 707)
Financial liabilities 2.11 (84 399) (53 071)
(204 297) (154 437)
CURRENT LIABILITIES
Provisions 2.10 (1 527) (1 116)
Financial liabilities 2.11 (10 649) (1 446)
Payables 2.12 (32 408) (27 241)
Accrued charges and deferred income 2.13 (64 584) (67 230)
(109 167) (97 033)
TOTAL LIABILITIES (313 464) (251 470)
NET ASSETS (33 418) (72 523)
Reserves 2.14 5 062 5 037
Amounts to be called from Member States* 2.15 (38 480) (77 560)
NET ASSETS (33 418) (72 523)
* The European Parliament adopted a budget on 18 December 2020 which provides for the payment of the Union's short-term
liabilities from own resources to be collected by, or called up from, the Member States in 2021. Additionally, under Article 83 of the Staff Regulations (Council Regulation 259/68 of 29 February 1968 as amended), the Member States shall jointly guarantee the
liability for pensions.

Annual accounts of the European Union 2020
39
STATEMENT OF FINANCIAL PERFORMANCE
EUR million
Note 2020 2019
REVENUE
Revenue from non-exchange transactions
GNI resources 3.1 125 393 108 820
Traditional own resources 3.2 19 559 21 235
VAT resources 3.3 17 858 18 128
Fines 3.4 452 4 291
Recovery of expenses 3.5 1 355 2 627
UK Withdrawal Agreement 3.6 47 456 –
Other 3.7 7 116 2 072
219 190 157 174
Revenue from exchange transactions
Financial revenue 3.8 3 434 1 817
Other 3.9 1 404 1 298
4 838 3 116
Total Revenue 224 028 160 289
EXPENSES
Implemented by Member States 3.10
European Agricultural Guarantee Fund (40 461) (43 951) European Agricultural Fund for Rural Development and other rural development instruments
(14 467) (13 541)
European Regional Development Fund and Cohesion Fund (41 118) (35 178)
European Social Fund (13 677) (11 218)
Other (2 701) (2 608) Implemented by the Commission, executive agencies and trust funds
3.11 (22 094) (18 942)
Implemented by other EU agencies and bodies 3.12 (3 530) (3 131) Implemented by third countries and international organisations
3.12 (4 178) (4 085)
Implemented by other entities 3.12 (3 257) (2 875)
Staff and pension costs 3.13 (11 995) (11 613)
Finance costs 3.14 (2 188) (1 491)
Other expenses 3.15 (6 946) (6 862)
Total Expenses (166 612) (155 493)
ECONOMIC RESULT OF THE YEAR 57 416 4 796

Annual accounts of the European Union 2020
40
CASHFLOW STATEMENT
EUR million
2020 2019
Economic result of the year 57 416 4 796
Operating activities
Amortisation 113 107
Depreciation 1 047 1 022
(Increase)/decrease in loans (40 624) 1 255
(Increase)/decrease in pre-financing (11 301) (1 472)
(Increase)/decrease in exchange receivables and non-exchange
recoverables (50 519) 691
(Increase)/decrease in inventories (12) 5
Increase/(decrease) in pension and other employee benefits 18 360 17 203
Increase/(decrease) in provisions 581 693
Increase/(decrease) in financial liabilities 40 531 (1 389)
Increase/(decrease) in payables 5 166 (4 985)
Increase/(decrease) in accrued charges and deferred income (2 645) 4 041
Prior year budgetary surplus taken as non-cash revenue (3 218) (1 803)
Remeasurement of employee benefits liability (non-cash movement not
included in statement of financial performance) (15 155) (14 164)
Other non-cash movements 63 111
Investing activities
(Increase)/decrease in intangible assets and property, plant and equipment
(1 566) (1 392)
(Increase)/decrease in investments accounted for using the equity method
3 (1)
(Increase)/decrease in available for sale financial assets (1 180) (2 964)
(Increase)/decrease in financial assets at fair value through surplus or deficit
(62) (121)
NET CASHFLOW (3 004) 1 633
Net increase/(decrease) in cash and cash equivalents (3 004) 1 633
Cash and cash equivalents at the beginning of the year 19 745 18 113
Cash and cash equivalents at year-end 16 742 19 745

Annual accounts of the European Union 2020
41
STATEMENT OF CHANGES IN NET ASSETS
EUR million
Amounts to be called from Member States
Accumulated Surplus/(Deficit) Other reserves Fair value reserve Net Assets
BALANCE AS AT 31.12.2018 (66 424) 4 730 231 (61 464)
Movement in Guarantee Fund reserve (21) 21 – –
Fair value movements – – 160 160
Remeasurements in employee benefits liabilities (14 164) – – (14 164)
Other 56 (105) – (49)
2018 budget result credited to Member States (1 803) – – (1 803)
Economic result of the year 4 796 – – 4 796
BALANCE AS AT 31.12.2019 (77 560) 4 646 391 (72 523)
Movement in Guarantee Fund reserve (173) 173 – –
Fair value movements – – 105 105
Remeasurements in employee benefits liabilities (15 155) – – (15 155)
Other 210 (252) – (42)
2019 budget result credited to Member States (3 218) – – (3 218)
Economic result of the year 57 416 – – 57 416
BALANCE AS AT 31.12.2020 (38 480) 4 566 496 (33 418)

Annual accounts of the European Union 2020
42
NOTES TO THE FINANCIAL STATEMENTS
Note that in the following tables amounts concerning the UK are still shown under the heading Member
States as although the UK departed the Union on 1 February 2020, during the transition period up to 31 December 2020 it continued to have a financial relationship with the Union equivalent to that of a Member State.
Annual accounts of the European Union 2020
43
1. SIGNIFICANT ACCOUNTING POLICIES
1.1. LEGAL BASIS AND ACCOUNTING RULES
The accounts of the EU are kept in accordance with Regulation (EU, Euratom) No 2018/1046 of the European Parliament and of the Council of 18 July 2018 on the financial rules applicable to the general
budget of the Union, amending Regulations (EU) No 1296/2013, (EU) No 1301/2013, (EU) No 1303/2013, (EU) No 1304/2013, (EU) No 1309/2013, (EU) No 1316/2013, (EU) No 223/2014, (EU) No 283/2014, and Decision No 541/2014/EU and repealing Regulation (EU, Euratom) No 966/2012 (OJ L 193, 30 July 2018, p. 1) hereinafter referred to as the ‘Financial Regulation’ (FR).
In accordance with article 80 of the Financial Regulation, the EU prepares its financial statements on the basis of accrual-based accounting rules that are based on International Public Sector Accounting
Standards (IPSAS). These accounting rules, adopted by the Accounting Officer of the Commission, have
to be applied by all the institutions and EU bodies falling within the scope of consolidation in order to ensure the internal consistency of the EU consolidated accounts.
Application of new and amended European Union Accounting Rules (EAR)
New EAR which are effective for annual periods beginning on or after 1 January 2020
There are no new EAR which became effective for annual periods beginning on or after 1 January 2020.
New EAR adopted but not yet effective at 31 December 2020
On 17 December 2020 the Accounting Officer of the European Commission adopted the revised EAR 11 ‘Financial Instruments’, which is effective for accounting periods beginning on or after 1 January 2021. The revised EAR 11 has been updated in line with the new IPSAS 41 ‘Financial Instruments’ and
establishes the principles for the financial reporting of the financial assets and financial liabilities held by the EU entities.
The main changes and their expected impacts on the EU 2021 accounts are as follows:
New classification and measurement principles for financial assets
The revised EAR 11 introduces a principles-based approach to the classification of financial assets which is based on two criteria: the management model which an entity applies for managing its financial assets and the contractual cash-flow characteristics of those assets. Depending on these criteria, financial assets are classified in the categories financial assets at amortised cost (AC), financial assets at fair value through net assets/equity (FVNA), or financial assets at fair value through surplus and deficit (FVSD).
Financial assets with contractual terms that represent solely principal and interests are classified as either
AC (if the financial asset is held within a management model whose objective is to hold financial assets in
order to collect contractual cash flows) or FVNA (if the financial asset is held within a management model whose objective is achieved by both collecting contractual cash flows and selling financial assets). Financial assets that do not meet the criteria to be classified as either AC or FVNA, in particular financial assets for which the contractual cashflows do not represent solely principal and interests or which are held within other management models, are classified as FVSD.
In line with these principles, in the 2021 EU annual accounts all equity investments which are currently
classified as ‘available for sale’ will be reclassified as FVSD. Debt securities are also expected to be reclassified as FVSD, given that the EU manages these asset portfolios and evaluates their performance on a fair value basis. The related fair value reserve will be released to Net Assets.
New impairment model
Whereas the current impairment model is based on incurred losses, the revised EAR 11 introduces a forward-looking impairment model based on expected credit losses, taking into account all possible
default events and any credit enhancements that are integral to the contractual terms. As regards the
applicable time horizon a staging approach applies: as long as there is no significant increase in credit risk, the impairment allowance is measured at an amount equal to the 12-months expected credit loss (stage 1). In case of a significant increase in credit risk (stage 2) and for credit-impaired financial assets,

Annual accounts of the European Union 2020
44
the impairment allowance equals the life time expected credit loss. The new impairment model applies to
all financial assets measured at AC or at FVNA, loan commitments and financial guarantee contracts.
It is expected that the new forward-looking impairment model will lead to a recognition of an additional impairment allowance in the 2021 EU annual accounts, in particular in relation to the loans for financial assistance provided to partner countries under the MFA and Euratom programmes.
Financial guarantee accounting
Under the current EAR 11, most financial guarantees – in particular those provided at no or nominal
consideration – are accounted for in accordance with the principles of EAR 10 ‘Provisions, contingent liabilities and contingent assets’, hence either recognised as provisions or disclosed as contingent liabilities depending on the probability of loss.
The revised EAR 11 requires the application of the financial guarantee accounting requirements to all financial guarantee contracts, which should be initially recognised either at fair value or at the life time
expected credit loss in case no reliable measure of fair value can be determined. At subsequent measurement, financial guarantee contracts should be measured at the higher of (i) the amount of the
loss allowance, and (ii) the amount initially recognised less, when appropriate, the cumulative amount of amortisation recognised in accordance with the principles of EAR 4 ‘Revenue from exchange transactions’.
As a consequence, in the 2021 EU accounts the existing financial guarantee contracts are expected to be reclassified from financial provisions to the financial guarantee liability categories and re-measured to the higher of the life time expected credit loss, and – if applicable – the amount initially recognised as provisions less accumulated amortisation. This change is expected to trigger an increase in the financial liabilities on the balance sheet, in particular in relation to the guarantees provided to the EIB Group under
the External Lending Mandate.
The new requirements shall be applied retrospectively and subject to the specific transitional provisions in the revised EAR 11. In particular, no restatement of comparatives is required. Hence, the impacts of any remeasurements will be recognised in Net Assets at the initial application date of the revised EAR 11.
1.2. ACCOUNTING PRINCIPLES
The objective of financial statements is to provide information about the financial position, performance and cashflows of an entity that is useful to a wide range of users. For the EU as a public sector entity, the objectives are more specifically to provide information useful for decision-making, and to demonstrate the accountability of the entity for the resources entrusted to it. It is with these goals in mind that the
present document has been drawn up.
The overall considerations (or accounting principles) to be followed when preparing the financial statements are laid down in EU accounting rule 1 ‘Financial Statements’ and are the same as those described in IPSAS 1: fair presentation, accrual basis, going concern, consistency of presentation, materiality, aggregation, offsetting and comparative information.
The qualitative characteristics of financial reporting are relevance, faithful representation (reliability),
understandability, timeliness, comparability and verifiability.
1.3. CONSOLIDATION
Scope of consolidation
The consolidated financial statements of the EU comprise all significant controlled entities, joint arrangements and associates. The complete list of entities falling under the scope of consolidation, which now comprises 52 controlled entities and 1 associate, can be found in note 9. Among the controlled entities are the EU institutions (including the Commission, but not the European Central Bank) and the EU agencies (except those of the Common and Foreign Security Policy). The European Coal and Steel
Community in Liquidation (ECSC i.L.) is also considered as a controlled entity. The EU’s only associate is
the European Investment Fund (EIF).

Annual accounts of the European Union 2020
45
Entities falling under the scope of consolidation but immaterial to the EU consolidated financial
statements as a whole need not be consolidated or accounted for using the equity method where to do so
would result in excessive time or cost to the EU. These entities are referred to as ‘Minor entities’ and are separately listed in note 9. In 2020, 8 entities have been classified as such minor entities.
Controlled entities
In order to determine the scope of consolidation, the control concept is applied. Controlled entities are entities for which the EU is exposed, or has right, to variable benefits from its involvement and has the
ability to affect the nature and amount of those benefits through its power over the other entity. This power must be presently exercisable and must relate to the relevant activities of the entity. Controlled entities are fully consolidated. The consolidation begins at the first date on which control exists, and ends when such control no longer exists.
The most common indicators of control within the EU are: creation of the entity through founding treaties or secondary legislation, financing of the entity from the EU budget, the existence of voting rights in the
governing bodies, audit by the European Court of Auditors and discharge by the European Parliament. An
individual assessment for each entity is made in order to decide whether one or all of the criteria listed above are sufficient to result in control.
All material inter-entity transactions and balances between EU controlled entities are eliminated, while unrealised gains and losses on such transactions are not material and so have not been eliminated.
Joint Arrangements
A joint arrangement is an agreement of which the EU and one or more parties have joint control. Joint control is the agreed sharing of control of an arrangement by way of a binding arrangement, which exists
only when decisions about the relevant activities require the unanimous consent of parties sharing control. Joint agreements can be either joint ventures or joint operations. A joint venture is a joint arrangement that is structured through a separate vehicle and whereby the parties that have joint control of the arrangement have rights to the net assets of the arrangement. Participations in joint ventures are
accounted for using the equity method (see note 1.5.4). A joint operation is a joint arrangement whereby the parties that have joint control of the arrangements have rights to the assets, and obligations
for the liabilities, related to the arrangement. Participations in joint operations are accounted for by recognising in the EU’s financial statements its assets and liabilities, revenues and expenses, as well as its share of assets, liabilities, revenues and expenses jointly held or incurred.
Associates
Associates are entities over which the EU has, directly or indirectly, significant influence but not exclusive or joint control. It is presumed that significant influence exists if the EU holds directly or indirectly 20% or more of the voting rights. Participations in associates are accounted for using the equity method (see
note 1.5.4).
Non-consolidated entities the funds of which are managed by the Commission
The funds of the Joint Sickness Insurance Scheme for staff of the EU, the European Development Fund and the Participants Guarantee Fund are managed by the Commission on behalf of these entities. However, since these entities are not controlled by the EU, they are not consolidated in its financial statements.
1.4. BASIS OF PREPARATION
Financial statements are presented annually. The accounting year begins on 1 January and ends on 31 December.
1.4.1. Currency and basis for conversion
Functional and reporting currency
The financial statements are presented in millions of euros, unless stated otherwise, the euro being the EU’s functional currency.

Annual accounts of the European Union 2020
46
Transactions and balances
Foreign currency transactions are translated into euros using the exchange rates prevailing at the dates of the transactions. Foreign exchange gains and losses resulting from the settlement of foreign currency transactions and from the re-translation at year-end exchange rates of monetary assets and liabilities denominated in foreign currencies are recognised in the statement of financial performance. Translation differences on non-monetary financial instruments classified as available for sale financial assets are included in the fair value reserve.
Different conversion methods apply to property, plant and equipment and intangible assets, which retain their value in euros at the rate that applied at the date when they were purchased.
Year-end balances of monetary assets and liabilities denominated in foreign currencies are converted into euros on the basis of the European Central Bank (ECB) exchange rates applying on 31 December:
Euro exchange rates
Currency 31.12.2020 31.12.2019 Currency 31.12.2020 31.12.2019
BGN 1.9558 1.9558 PLN 4.5597 4.2568
CZK 26.2420 25.4080 RON 4.8683 4.783
DKK 7.4409 7.4715 SEK 10.0343 10.4468
GBP 0.8990 0.8508 CHF 1.0802 1.0854
HRK 7.5519 7.4395 JPY 126.4900 121.9400
HUF 363.8900 330.5300 USD 1.2271 1.1234
1.4.2. Use of estimates
In accordance with IPSAS and generally accepted accounting principles, the financial statements necessarily include amounts based on estimates and assumptions by management based on the most
reliable information available. Significant estimates include, but are not limited to: amounts for employee benefit liabilities, financial risk of accounts receivable and the amounts disclosed in the notes concerning financial instruments, accrued revenue and charges, provisions, degree of impairment of intangible assets and property, plant and equipment, net realisable value of inventories, contingent assets and liabilities. Actual results could differ from those estimates. Changes in estimates are reflected in the period in which they become known, if the change affects the period only, or that period and future periods, if the change
affects both.
1.5. BALANCE SHEET
1.5.1. Intangible assets
An intangible asset is an identifiable non-monetary asset without physical substance. An asset is
identifiable if it is either separable (i.e. it is capable of being separated or divided from the entity, e.g. by being sold, transferred, licensed, rented, or exchanged, either individually or together with a related contract, identifiable asset or liability, regardless of whether the entity intends to do so), or arises from binding arrangements (including rights from contracts or other legal rights), regardless of whether those rights are transferable or separable from the entity or from other rights and obligations).
Acquired intangible assets are stated at historical cost less accumulated amortisation and impairment losses. Internally developed intangible assets are capitalised when the relevant criteria of the EU Accounting Rules are met and the expenses relate solely to the development phase of the asset. The capitalisable costs include all directly attributable costs necessary to create, produce, and prepare the asset to be capable of operating in the manner intended by management. Costs associated with research activities, non-capitalisable development costs and maintenance costs are recognised as expenses as
incurred.
Intangible assets are amortised on a straight-line basis over their estimated useful lives (3 to 11 years). The estimated useful lives of intangible assets depend on their specific economic life time or legal life time determined by an agreement.

Annual accounts of the European Union 2020
47
1.5.2. Property, plant and equipment
All property, plant and equipment are stated at historical cost less accumulated depreciation and impairment losses. Cost includes expenditure that is directly attributable to the acquisition, construction or transfer of the asset.
Subsequent costs are included in the asset’s carrying amount or recognised as a separate asset, as appropriate, only when it is probable that future economic benefits or service potential associated with
the item will flow to the EU and its cost can be measured reliably. Repairs and maintenance costs are charged to the statement of financial performance during the financial period in which they are incurred.
Land is not depreciated as it is deemed to have an indefinite useful life. Assets under construction are not depreciated, as these assets are not yet available for use. Depreciation on other assets is calculated using the straight-line method to allocate their cost less their residual values over their estimated useful lives, as follows:
Type of asset Straight line depreciation rate
Buildings 4% to 10%
Space assets 8% to 25%
Plant and equipment 10% to 25%
Furniture and vehicles 10% to 25%
Computer hardware 25% to 33%
Other 10% to 33%
Gains or losses on disposals are determined by comparing proceeds less selling expenses with the carrying amount of the disposed asset and are included in the statement of financial performance.
Leases
A lease is an agreement whereby the lessor conveys to the lessee, in return for a payment or series of payments, the right to use an asset for an agreed period of time. Leases are classified as either finance leases or operating leases.
Finance leases are leases where substantially all the risks and rewards incidental to ownership are transferred to the lessee. When entering a finance lease as a lessee, the assets acquired under the
finance lease are recognised as assets and the associated lease obligations as liabilities as from the commencement of the lease term. The assets and liabilities are recognised at amounts equal to the fair value of the leased property or, if lower, the present value of the minimum lease payments, each determined at the inception of the lease. Over the period of the lease term, the assets held under finance leases are depreciated over the shorter of the asset’s useful life and the lease term. The minimum lease payments are apportioned between the finance charge (the interest element) and the reduction of the outstanding liability (the capital element). The finance charge is allocated to each period during the lease
term so as to produce a constant periodic rate of interest on the remaining balance of the liability, which is presented as current/non-current, as applicable. Contingent rents are charged as expenses in the
period in which they are incurred.
An operating lease is a lease other than a finance lease, i.e. a lease where the lessor retains substantially all the risks and rewards incidental to ownership of an asset. When entering an operating lease as a lessee, the operating lease payments are recognised as an expense in the statement of financial performance on a straight-line basis over the lease term with neither a leased asset nor a leasing liability
presented in the statement of financial position.
1.5.3. Impairment of non-financial assets
An impairment is a loss in the future economic benefits or service potential of an asset, over and above the systematic recognition of the loss of the asset's future economic benefits or service potential through amortisation or depreciation (as applicable). Assets that have an indefinite useful life are not subject to
amortisation/depreciation and are tested annually for impairment. Assets that are subject to amortisation/depreciation are tested for impairment whenever there is an indication at the reporting date that an asset may be impaired. An impairment loss is recognised for the amount by which the asset’s carrying amount exceeds its recoverable (service) amount. The recoverable (service) amount is the higher of an asset’s fair value less costs to sell and its value in use.

Annual accounts of the European Union 2020
48
Intangible assets and property, plant and equipment residual values and useful lives are reviewed, and
adjusted if appropriate, at least once per year. If the reasons for impairments recognised in previous
years no longer apply, the impairment losses are reversed accordingly.
1.5.4. Investments accounted for using the equity method
Participations in associates and joint ventures
Investments accounted for using the equity method are initially recognised at cost, with the initial
carrying amount subsequently being increased or decreased to recognise further contributions, the EU’s share of the surplus or deficit of the investee, any impairments and dividends. The initial cost together with all movements give the carrying amount of the investment in the financial statements at the balance sheet date. The EU’s share of the investee’s surplus or deficit is recognised in the statement of financial performance, and its share of investee’s movements in equity is recognised in the reserves within net assets. Distributions received from the investment reduce the carrying amount of the asset.
If the EU's share of deficits of an investment accounted for using the equity method equals or exceeds its
interest in the investment, the EU discontinues recognising its share of further losses (‘unrecognised losses’). After the EU’s interest is reduced to zero, additional losses are provided for and a liability is recognised only to the extent that the EU has incurred legal or constructive obligation or made payments on behalf of the entity.
If there are indications of impairment, a write-down to the lower recoverable amount is necessary. The recoverable amount is determined as described under note 1.5.3. If the reason for impairment ceases to apply at a later date, the impairment loss is reversed to the carrying amount that would have been
determined had no impairment loss been recognised.
In cases where the EU holds 20% or more of an investment capital fund, it does not seek to exert significant influence. Such funds are therefore treated as financial instruments and categorised as available for sale financial assets.
Associates and joint ventures classified as minor entities (see note 1.3) are not accounted for under the equity method. EU contributions to those entities are accounted for as an expense of the period.
1.5.5. Financial assets
Classification
The EU classifies their financial assets in the categories ‘financial assets at fair value through surplus or deficit’, ‘loans and receivables’, ‘held-to-maturity investments’ and ‘available for sale financial assets’. The classification of financial instruments is determined at initial recognition and re-evaluated at each balance sheet date.
(i) Financial assets at fair value through surplus or deficit
A financial asset is classified in the category ‘fair value through surplus or deficit’ if acquired principally for the purpose of being sold in the short term, or if so designated by the entity. Derivatives are also presented in this category. Assets in this category are classified as current assets if they are expected to be realised within 12 months of the balance sheet date.
(ii) Loans and receivables
Loans and receivables are non-derivative financial assets with fixed or determinable payments that are
not quoted in an active market. They arise when the EU provides money, goods or services directly to a debtor with no intention of trading the receivable, or in case the EU is subrogated to the rights of the original lender following a payment made by the EU under a guarantee contract. Payments due within 12 months of the balance sheet date are classified as current assets. Payments due after 12 months from the balance sheet date are classified as non-current assets. Loans and receivables include term deposits
with the original maturity above three months.

Annual accounts of the European Union 2020
49
(iii) Held-to-maturity investments
Held-to-maturity investments are non-derivative financial assets with fixed or determinable payments and fixed maturities that the EU has the positive intention and ability to hold to maturity. During this financial year, the EU did not hold any investments in this category.
(iv) Available for sale financial assets
Available for sale financial assets are non-derivatives that are either designated in this category or not classified in any of the other categories. They are classified as either current or non-current assets,
depending on the period of time the EU expects to hold them. Investments in entities that are neither consolidated nor accounted for using the equity method and other equity-type investments (e.g. Risk Capital Operations) are also classified as available for sale financial assets.
Initial recognition and measurement
Purchases and sales of financial assets classified as ‘at fair value through surplus or deficit’, ‘held-to-maturity’ or ‘available for sale’, are recognised on their trade-date – the date on which the EU commits to purchase or sell the asset. Cash equivalents and loans are recognised when cash is deposited in a
financial institution or advanced to borrowers. Financial instruments are initially recognised at fair value. For all financial assets not carried at fair value through surplus or deficit, transactions costs are added to the fair value at initial recognition. Financial assets carried at fair value through surplus or deficit are initially recognised at fair value and transaction costs are expensed in the statement of financial performance.
The fair value of a financial asset on initial recognition is normally the transaction price (i.e. the fair value of the consideration received), unless the fair value of that instrument is evidenced by comparison with
other observable current market transactions in the same instrument or based on a valuation technique whose variables include only data from observable markets (e.g. in case of some derivative contracts). However, when a long-term loan that carries no interest or an interest below market conditions is granted, its fair value can be estimated as the present value of all future cash receipts discounted using
the prevailing market rate of interest for a similar instrument with a similar credit rating.
Loans granted are measured at their nominal amount, which is considered to be the fair value of the
loan. The reasoning for this is as follows:
The ‘market environment’ for EU lending is very specific and different from the capital market used to issue commercial or government bonds. As lenders in these markets have the opportunity to choose alternative investments, the opportunity of doing so is factored into market prices. However, this opportunity for alternative investments does not exist for the EU, which is not allowed to invest money on the capital markets; it only borrows funds for the purpose of lending at the same rate. This means that there is no alternative lending or investment option
available to the EU for the sums borrowed. Thus, there is no opportunity cost and therefore no basis of comparison with market rates. In fact, the EU lending operation itself represents the market. Essentially, since the opportunity cost ‘option’ is not applicable, the market price does not fairly reflect the substance of the EU lending transactions. Therefore, it is not appropriate to
determine the fair value of EU lending with reference to commercial or government bonds.
Furthermore, as there is no active market or similar transactions to compare with, the interest rate to be used by the EU for fair valuing its lending operations under the EFSM, BOP and other
such loans, should be the interest rate charged.
In addition, for these loans, there are compensating effects between loans and borrowings due to their back-to-back character. Thus, the effective interest for the loan equals the effective interest rate for the related borrowings. The transaction costs incurred by the EU and then recharged to the beneficiary of the loan are directly recognised in the statement of financial performance.
Financial instruments are derecognised when the rights to receive cashflows from the investments have
expired or the EU has transferred substantially all risks and rewards of ownership to another party.

Annual accounts of the European Union 2020
50
Subsequent measurement
a) Financial assets at fair value through surplus or deficit are subsequently carried at fair value. Gains and losses arising from changes in the fair value of the ‘financial instruments at fair value through surplus or deficit’ category are included in the statement of financial performance in the period in which they arise.
b) Loans and receivables are carried at amortised cost using the effective interest method. In the case of loans granted on borrowed funds, the same effective interest rate is applied to both the
loans and borrowings since these loans have the characteristics of ‘back-to-back operations’ and the differences between the loan and the borrowing conditions and amounts are not material. The transaction costs incurred by the EU and then recharged to the beneficiary of the loan are directly recognised in the statement of financial performance.
c) Held to maturity assets are carried at amortised cost using the effective interest method. The EU currently holds no held to maturity investments.
d) Available for sale financial assets are subsequently carried at fair value. Gains and losses arising
from changes in the fair value of available for sale financial assets are recognised in the fair value reserve, except for translation differences on monetary assets, which are recognised in the statement of financial performance. When assets classified as available for sale financial assets are derecognised or impaired, the cumulative fair value adjustments previously recognised in the fair value reserve are recognised in the statement of financial performance. Interest on available for sale financial assets calculated using the effective interest method is recognised in the statement of financial performance. Dividends on available for sale equity instruments are
recognised when the EU’s right to receive payment is established.
The fair values of quoted investments in active markets are based on current bid prices. If the market for a financial asset is not active (and for unlisted securities and over-the–counter derivatives), the EU establishes a fair value by using valuation techniques. These include the use of recent arm’s length transactions, reference to other instruments that are substantially the same, discounted cashflow
analysis, option pricing models and other valuation techniques commonly used by market participants.
Investments in Venture Capital Funds, classified as available for sale financial assets, which do not have a quoted market price in an active market are valued at the attributable net asset value, which is considered as an equivalent of their fair value.
In cases where the fair value of investments in equity instruments that do not have a quoted market price in an active market cannot be reliably measured, these investments are valued at cost less impairment losses.
Impairment of financial assets
A financial asset is impaired and a loss is recognised if, and only if, there is objective evidence of impairment as a result of one or more events that occurred after the initial recognition of the asset and that loss event (or events) has an impact on the estimated future cashflows of the financial asset that
can be reliably estimated. The EU assesses at each reporting date whether there is objective evidence that a financial asset is impaired.
(a) Assets carried at amortised cost
If there is objective evidence that an impairment loss on loans and receivables or held-to-maturity
investments carried at amortised cost has been incurred, the amount of the loss is measured as the difference between the asset’s carrying amount and the present value of estimated future cashflows (excluding future credit losses that have not been incurred) discounted at the financial asset’s original effective interest rate. The carrying amount of the asset is reduced and the amount of the loss is recognised in the statement of financial performance. If a loan or held-to-maturity investment has a variable interest rate, the discount rate for measuring any impairment loss is the current effective
interest rate determined under the contract. The calculation of the present value of the estimated future cashflows of a collateralised financial asset reflects the cashflows that may result from foreclosure less
costs for obtaining and selling the collateral, whether or not foreclosure is probable. If, in a subsequent period, the amount of the impairment loss decreases and the decrease can be related objectively to an event occurring after the impairment was recognised, the previously recognised impairment loss is reversed through the statement of financial performance.
Annual accounts of the European Union 2020
51
(b) Assets carried at fair value
In the case of equity investments classified as available for sale financial assets, a significant or permanent (prolonged) decline in the fair value of the security below its cost is considered in determining whether the securities are impaired. If any such evidence exists for available for sale financial assets, the cumulative loss – measured as the difference between the acquisition cost and the current fair value, less any impairment loss on that financial asset previously recognised in the statement of financial performance – is removed from reserves and recognised in the statement of financial performance.
Impairment losses recognised in the statement of financial performance on equity instruments are not reversed through the statement of financial performance. If, in a subsequent period, the fair value of a debt instrument classified as available for sale financial asset increases and the increase can be objectively related to an event occurring after the impairment loss was recognised, the impairment loss is reversed through the statement of financial performance.
1.5.6. Inventories
Inventories are stated at the lower of cost and net realisable value. Cost is determined using the first-in, first-out (FIFO) method. The cost of finished goods and work in progress comprises raw materials, direct labour, other directly attributable costs and related production overheads (based on normal operating capacity). Net realisable value is the estimated selling price in the ordinary course of business, less the costs of completion and selling expenses. When inventories are held for distribution at no charge or for a nominal charge, they are measured at the lower of cost and current replacement cost. Current replacement cost is the cost the EU would incur to acquire the asset on the reporting date.
1.5.7. Pre-financing amounts
Pre-financing is a payment intended to provide the beneficiary with a cash advance, i.e. a float. It may be split into a number of payments over a period defined in the particular contract, decision, agreement or basic legal act. The float or advance is either used for the purpose for which it was provided during the
period defined in the agreement or it is repaid. If the beneficiary does not incur eligible expenditure, they
have the obligation to return the pre-financing to the EU. As the EU retains control over the pre-financing and is entitled to a refund for the ineligible part, the amount is presented as an asset.
Pre-financing is initially recognised on the balance sheet when cash is transferred to the recipient. It is measured at the amount of the consideration given. In subsequent periods pre-financing is measured at the amount initially recognised on the balance sheet less the eligible expenses (including estimated amounts where necessary) incurred during the period.
Interest on pre-financing is recognised as it is earned in accordance with the provisions of the relevant
agreement. An estimate of the accrued interest revenue, based on the most reliable information, is made at the year-end and included in the balance sheet.
Other advances to Member States, which originate from reimbursement by the EU of amounts paid as
advances by the Member States to their beneficiaries (including ‘financial instruments under shared management’), are recognised as assets and presented under the heading ‘Pre-financing’. Other advances to Member States are subsequently measured at the amount initially recognised on the balance sheet less a best estimate of the eligible expenses incurred by final beneficiaries, calculated on the basis
of reasonable and supportable assumptions.
The contributions to EU trust funds not consolidated in the European Commission, or to other unconsolidated entities, are classified as pre-financing since their purpose is to give a float to the trust fund to allow it to finance specific actions defined under the trust fund’s objectives. The EU contributions to trust funds are measured at the initial amount of the EU contribution less eligible expenses, including estimated amounts where necessary, incurred by the trust fund during the reporting period and allocated
to the EU contribution in accordance with the underlying agreement.
1.5.8. Exchange receivables and non-exchange recoverables
The EU Accounting Rules require a separate presentation of exchange and non-exchange transactions. To distinguish between the two categories, the term ‘receivables’ is reserved for exchange transactions, whereas for ‘non-exchange transactions’, i.e. when the EU receives value from another entity without

Annual accounts of the European Union 2020
52
directly giving approximately equal value in exchange, the term ‘recoverables’ is used (e.g. recoverables
from Member States related to own resources).
Receivables from exchange transactions meet the definition of financial instruments and are thus classified as loans and receivables and measured accordingly (see note 1.5.5). The financial instruments notes disclosures concerning receivables from exchange transactions include accrued revenue and deferred charges from exchange transactions, as they are not material. A general write-down based on past experience is made for outstanding recovery orders not already subject to a specific write-down.
Recoverables from non-exchange transactions are carried at fair value as at the date of acquisition (adjusted for interest and penalties) less write-down for impairment. A write-down for impairment of recoverables from non-exchange transactions is established when there is objective evidence that the EU will not be able to collect all amounts due according to the original terms of recoverables from non-exchange transactions. The amount of the write-down is the difference between the asset’s carrying amount and the recoverable amount. The amount of the write-down is recognised in the statement of financial performance. A general write-down, based on past experience, is also made for outstanding
recovery orders not already subject to a specific write-down. See note 1.5.14 concerning the treatment
of accrued revenue at year-end. Amounts displayed and disclosed as recoverables from non-exchange transactions are not financial instruments, as they do not arise from a contract that would give rise to a financial liability or equity instrument. However, in the notes to the financial statements recoverables from non-exchange transactions are disclosed together with receivables from exchange transactions where appropriate.
1.5.9. Cash and cash equivalents
Cash and cash equivalents are financial instruments and include cash at hand, deposits held at call or at short notice with banks and other short-term highly liquid investments with original maturities of three months or less.
1.5.10. Employee benefits
The EU provides a set of benefits (emoluments and social security) to employees. For accounting purposes these have to be classified into short-term and post-employment benefits.
Short-term employee benefits
Short-term employee benefits are those benefits due to be settled before twelve months after the end of the reporting period in which employees rendered the service, such as salaries, annual and paid sick leaves, and other short-term allowances. Short-term employee benefits are recognised as an expense when the related service is provided. A liability is recognised for the amount expected to be paid if the EU
has a present legal or constructive obligation to pay as a result of past service provided by the employee and the obligation can be estimated reliably.
Post-employment benefits
The EU grants a set of post-employment benefits to employees, which include retirement, invalidity and survival pensions provided under the Pension Scheme of the European Officials (PSEO), as well as medical coverage provided under the Joint Sickness Insurance Scheme (JSIS) (see note 2.9). These benefits are provided under a single plan – although split in two schemes – and they must be treated
similarly so as to give a fair presentation of the situation and reflect the economic reality:
i. Pension Scheme of European Officials (PSEO): The benefits granted under this notionally funded13 scheme relate to seniority, invalidity and survival, as well as, family allowances, death before retirement to those employees that work or worked in the EU Institutions, Agencies and other EU
13 The PSEO is a notional (virtual) fund with defined benefits in which staff’s contributions serve to finance their
future pensions. Although there is no actual investment fund, the amount that would have been collected by such a fund is considered to have been invested in the Member States’ long-term bonds and is reflected in the pension liability that is registered in the annual accounts of the European Union. Member States jointly guarantee the payment of the benefits pursuant to Article 83 of the Staff Regulations and Article 4(3) of the Treaty on European Union (see COM(2018) 829 for a detailed description of the scheme).

Annual accounts of the European Union 2020
53
bodies or are survivors of deceased officials or pensioners. Staff contribute one third of the
expected cost of these benefits from their salaries.
ii. Joint Sickness Insurance Scheme (JSIS): Under this scheme, the EU provides health coverage for staff of the European Commission, Institutions, Agencies and other EU bodies through the reimbursement of medical expenses. The benefits granted to the ‘inactives’ of this scheme (i.e. pensioners, orphans, etc.) are classified as post-employment benefits.
The EU also provides post-employment benefits to members of the EU institutions via separate pension
schemes. These are shown under the heading ‘Other retirement benefit schemes’. Under these schemes the EU provides pension benefits to members of the Commission, Court of Justice and General Court, Court of Auditors, Council, European Parliament, Ombudsman, Data Protection Supervisor, Civil Service Tribunal. The EU provides health coverage to the members of the EU Institutions via the JSIS.
The above post-employment benefits qualify as defined benefit obligations of the EU and are calculated at each reporting date by estimating the amount of future benefit that employees have earned in the
current and prior periods, discounting that amount and deducting the fair value of any plan assets. The
calculation of defined benefit obligation is performed annually using the projected unit credit method. The present value of the defined benefit obligation is determined by discounting the estimated future cash outflows using interest rates of government bonds that are denominated in the currency in which the benefits will be paid, and that have terms to maturity approximating to the terms of the related pension liability.
The post-employment benefits provided to EU staff are incorporated in a single plan comprising both a pension scheme (PSEO) and a sickness insurance scheme (JSIS), with the right to coverage under the
JSIS scheme being dependent on having acquired the right to coverage under the PSEO scheme. Under the terms of this single plan, as set out in the Staff Regulation, certain entitlements, such as the right to a deferred and reduced pension under the PSEO scheme, are acquired after 10 years of service. However, the entitlements acquired under the single plan by the employee’s subsequent service are materially higher than those initial entitlements as reflected by subsequent annually accrued pension rights.
Therefore, in order to depict the economic substance of the underlying transaction required by the faithful representation qualitative characteristic of financial reporting as outlined in both EAR 1 and the IPSAS Conceptual Framework, the service cost incurred is accrued on a straight-line basis over staff’s estimated active service period, i.e. the period from the date when service by the employee first leads to benefits under the plan (whether or not the benefits are conditional on further service) until the date when further service by the employee will lead to no material amount of further benefits under the plan, other than from further salary increases. This approach is applied consistently to the benefits provided for under the
single plan.
Remeasurements of the net defined benefit liability comprise actuarial gains and losses and the return on plan assets, and are recognised immediately in net assets.
The EU recognises the net interest expense (income) and other expenses related to the defined benefit plans in the statement of financial performance within the heading ‘Staff and pension costs’.
When benefits provided are changed or curtailed, the resulting change in benefits that relates to past service or the gain or loss on curtailment is recognised immediately in the statement of financial
performance. Gains and losses on settlement are recognised when the settlement occurs. Past service cost is recognised immediately in the statement of financial performance, unless the changes are conditional on the employees remaining in service for a specified period of time.
1.5.11. Provisions
Provisions are recognised when the EU has a present legal or constructive obligation towards third parties
as a result of past events, it is more likely than not that an outflow of resources will be required to settle the obligation, and the amount can be reliably estimated. Provisions are not recognised for future operating losses. The amount of the provision is the best estimate of the expenses expected to be
required to settle the present obligation at the reporting date. Where the provision involves a large number of items, the obligation is estimated by weighting all possible outcomes by their associated probabilities (‘expected value’ method).

Annual accounts of the European Union 2020
54
Provisions for onerous contracts are measured at the present value of the lower of the expected cost of
terminating the contract and the expected net cost of continuing with the contract.
1.5.12. Financial liabilities
Financial liabilities are classified as financial liabilities at fair value through surplus or deficit, financial liabilities carried at amortised cost or as financial guarantee liabilities.
Borrowings are composed of borrowings from credit institutions and debts evidenced by certificates. They
are recognised initially at fair value, being their issue proceeds (fair value of consideration received) net of transaction costs incurred, then subsequently carried at amortised cost using the effective interest method; any difference between proceeds, net of transaction costs, and the redemption value is recognised in the statement of financial performance over the period of the borrowings using the effective interest method. In the case of loans granted on borrowed funds, the effective interest method may not be applied to loans and borrowings, based on materiality considerations. The transaction costs incurred
by the EU and then recharged to the beneficiary of the loan are directly recognised in the statement of
financial performance.
Financial liabilities categorised at fair value through surplus or deficit include derivatives where fair value is negative. They follow the same accounting treatment as financial assets at fair value through surplus or deficit, see note 1.5.5.
Financial guarantee liabilities are initially recognised at fair value, being the premium received. Subsequently, financial guarantee liabilities are measured at the higher of the best estimate of the expenses expected to be required to settle the financial guarantee liability and the amount initially
recognised less, when appropriate, cumulative amortisation. The EU recognises a financial guarantee liability when it receives consideration for granting of the guarantee, that is at market terms, or when the fair value of the guarantee can be measured reliably. In case no active market for a directly equivalent guarantee contract exists, the EU discloses the guarantee given as a contingent liability (see note 1.7.2) or – when it is more likely than not that an outflow of resources will be required to settle the obligation –
the EU recognises a provision (see note 1.5.11).
Financial liabilities are classified as non-current liabilities, except for maturities less than 12 months after the balance sheet date.
EU trust funds that are considered as part of the Commission’s operational activities (i.e. trust funds Madad and Colombia), are accounted for in the Commission accounts and further consolidated in the EU annual accounts. Therefore, contributions from other donors to the EU trust funds fulfil the criteria of revenues from non-exchange transactions under conditions and they are presented as financial liabilities until the conditions attached to the contributions transferred are met, i.e. eligible costs are incurred by
the trust fund. The trust fund is required to finance specific projects and return remaining funds at the time of winding-up. At the balance sheet date the outstanding contribution liabilities are measured at contributions received less the expenses incurred by the trust fund, including estimated amounts when necessary. For reporting purposes the net expenses are allocated to the contributions of other donors in proportion to net contributions paid as at 31 December. This allocation of contributions is only indicative.
When the trust fund is wound up the actual split of remaining resources will be decided by the trust fund board.
1.5.13. Payables
A significant amount of the payables of the EU are unpaid cost claims from beneficiaries of grants or other EU funding (non-exchange transactions). They are recorded as payables for the requested amount when the cost claim is received. Upon verification and acceptance of the eligible costs, the payables are valued at the eligible amount.
Payables arising from the purchase of goods and services are recognised at invoice reception for the original amount and the corresponding eligible expenses are entered in the accounts when the supplies or services are delivered and accepted by the EU.
Annual accounts of the European Union 2020
55
1.5.14. Accrued and deferred revenue and charges
Transactions and events are recognised in the financial statements in the period to which they relate. At year-end, if an invoice is not yet issued but the service has been rendered, the supplies have been delivered by the EU or a contractual agreement exists (e.g. by reference to a treaty), an accrued revenue will be recognised in the financial statements. In addition, at year-end, if an invoice is issued but the services have not yet been rendered or the goods supplied have not yet been delivered, the revenue will
be deferred and recognised in the subsequent accounting period.
Expenses are also accounted for in the period to which they relate. At the end of the accounting period, accrued expenses are recognised based on an estimated amount of the transfer obligation of the period. The calculation of accrued expenses is done in accordance with detailed operational and practical guidelines issued by the Commission which aim at ensuring that the financial statements provide a faithful representation of the economic and other phenomena they purport to represent. By analogy, if a payment has been made in advance for services or goods that have not yet been received, the expense
will be deferred and recognised in the subsequent accounting period.
1.6. STATEMENT OF FINANCIAL PERFORMANCE
1.6.1. Revenue
REVENUE FROM NON-EXCHANGE TRANSACTIONS
The vast majority of the EU’s revenue relates to non-exchange transactions as follows:
GNI based resources and VAT resources
Revenue is recognised for the period for which the Commission sends out a call for funds to the Member
States claiming their contribution. They are measured at their ‘called amount’. As VAT and GNI resources
are based on estimates of the data for the budgetary year concerned, they may be revised as changes occur until the final data are issued by the Member States. The effect of a change in estimate is included when determining the net surplus or deficit for the period in which the change occurred.
Traditional own resources
Recoverables from non-exchange transactions and related revenues are recognised when the relevant monthly ‘A’ statements (including duties collected and amounts due that are guaranteed and not contested) are received from the Member States. At the reporting date, revenue collected by the Member
States for the period but not yet paid to the Commission is estimated and recognised as accrued revenue. The quarterly ‘B’ statements (including duties neither collected nor guaranteed, as well as guaranteed amounts that have been contested by the debtor) received from the Member States are recognised as revenue less the collection costs to which they are entitled. In addition, a value reduction is recognised for the amount of the estimated recovery gap.
Fines
Revenue from fines is recognised when the EU’s decision imposing a fine has been taken and it is
officially notified to the addressee. After the decision to impose a fine, the undertakings have two months from the date of notification:
a) either to accept the decision, in which case they must pay the fine within the time limit laid down and the amount is definitively collected by the EU; or
b) not to accept the decision, in which case they lodge an appeal under EU law.
Even if appealed, the fine must be paid within the time limit of three months laid down, as the appeal
does not have suspensory effect (Article 278 TFEU). The cash received is used to clear the recoverable.
However, subject to the agreement of the Commission’s Accounting Officer, the undertaking may present a bank guarantee for the amount instead. In that case the fine remains as a recoverable. If neither cash nor a guarantee is received and there are doubts about the undertaking’s solvency, a value reduction on the entitlement is recognised.
Annual accounts of the European Union 2020
56
If the undertaking appeals against the decision, and has already provisionally paid the fine, the amount is
disclosed as a contingent liability, or, if it appears probable that the General Court may not rule in favour
of the EU, a provision is recognised to cover this risk. If a guarantee is given instead, the outstanding recoverable is written down.
The accumulated interest received by the Commission on the bank accounts where received payments are deposited is recognised as revenue, and any contingent liability is increased accordingly.
Since 2010, all provisionally cashed fines are managed by the Commission in a specifically created fund
(BUFI) and invested in financial instruments.
REVENUE FROM EXCHANGE TRANSACTIONS
Revenue from the sale of goods and services is recognised when the significant risk and rewards of ownership of the goods are transferred to the purchaser. Revenue associated with a transaction involving the provision of services is recognised by reference to the stage of completion of the transaction at the
reporting date.
Interest revenue and expense
Interest revenue and expense are recognised in the statement of financial performance using the effective interest method. This is a method of calculating the amortised cost of a financial asset or a financial liability and of allocating the interest revenue or interest expense over the relevant period. When calculating the effective interest rate, the EU estimates cashflows considering all contractual terms of the financial instrument (for example prepayment options) but does not consider future credit losses. The calculation includes all fees and interest rate points paid or received between parties to the contract that are an integral part of the effective interest rate, transaction costs and all other premiums or discounts.
Once a financial asset or a group of similar financial assets has been written down as a result of an impairment loss, interest revenue is recognised using the rate of interest to discount the future cashflows for the purpose of measuring the impairment loss.
Revenue from dividends
Revenue from dividends and similar distributions is recognised when the right to receive payment is established.
1.6.2. Expenses
Expenses from non-exchange transactions account for the majority of the EU’s expenses. They relate to transfers to beneficiaries and can be of three types: entitlements, transfers under agreement and discretionary grants, contributions and donations.
Transfers are recognised as expenses in the period during which the events giving rise to the transfer
occurred, as long as the nature of the transfer is allowed by regulation (Financial Regulation, Staff
Regulations, or other regulation) or an agreement has been signed authorising the transfer, any eligibility criteria have been met by the beneficiary, and a reasonable estimate of the amount can be made.
When a request for payment or cost claim is received and meets the recognition criteria, it is recognised as an expense for the eligible amount. At year-end, incurred eligible expenses due to the beneficiaries but not yet reported are estimated and recorded as accrued expenses.
Expenses from exchange transactions arising from the purchase of goods and services are recognised when the supplies are delivered and accepted by the EU. They are valued at their original invoice
amount. Furthermore, at the balance sheet date, expenses related to the service delivered during the period for which an invoice has not yet been received or accepted are estimated and recognised in the statement of financial performance.

Annual accounts of the European Union 2020
57
1.7. CONTINGENT ASSETS AND LIABILITIES
1.7.1. Contingent assets
A contingent asset is a possible asset that arises from past events and of which the existence will be confirmed only by the occurrence or non-occurrence of one or more uncertain future events not wholly within the control of the EU. A contingent asset is disclosed when an inflow of economic benefits or service potential is probable.
1.7.2. Contingent liabilities
A contingent liability is a possible obligation that arises from past events and of which the existence will
be confirmed only by the occurrence or non-occurrence of one or more uncertain future events not wholly
within the control of the EU, or a present obligation that arises from past events but is not recognised, either because it is not probable that an outflow of resources embodying economic benefits or service potential will be required to settle the obligation, or in the rare circumstances where the amount of the obligation cannot be measured with sufficient reliability. A contingent liability is disclosed unless the possibility of an outflow of resources embodying economic benefits or service potential is remote.
1.8. CASHFLOW STATEMENT
Cashflow information is used to provide a basis for assessing the ability of the EU to generate cash and cash equivalents, and its needs to utilise those cashflows.
The cashflow statement is prepared using the indirect method. This means that the economic result for the financial year is adjusted for the effects of transactions of a non-cash nature, any deferrals or
accruals of past or future operating cash receipts or payments, and items of revenue or expense associated with investing cashflows.
Cashflows arising from transactions in a foreign currency are recorded in the EU’s reporting currency (Euro), by applying to the foreign currency amount the exchange rate between the euro and the foreign currency at the date of the cashflow.
The cashflow statement reports cashflows during the period classified by operating and investing activities (the EU does not have financing activities).
Operating activities are the activities of the EU that are not investing activities. These are the majority of the activities performed. Loans granted to beneficiaries (and the related borrowings, when applicable) are not considered as investing (or financing) activities as they are part of the general objectives and thus daily operations of the EU.
Investing activities are the acquisition and disposal of intangible assets and property, plant and equipment and of other investments which are not included in cash equivalents. Investing activities do not include loans granted to beneficiaries. The objective is to show the real investments made by the EU.

Annual accounts of the European Union 2020
58
2. NOTES TO THE BALANCE SHEET
ASSETS
2.1. INTANGIBLE ASSETS
EUR million
Gross carrying amount at 31.12.2019 1 230
Additions 216
Disposals (39)
Transfer between asset categories 0
Other changes 2
Gross carrying amount at 31.12.2020 1 409
Accumulated amortisation at 31.12.2019 (715)
Amortisation charge for the year (113)
Amortisation written back 0
Disposals 38
Transfer between asset categories 0
Other changes 0
Accumulated amortisation at 31.12.2020 (789)
Net carrying amount at 31.12.2020 620
Net carrying amount at 31.12.2019 515
The above amounts relate primarily to computer software.
2.2. PROPERTY, PLANT AND EQUIPMENT
The space assets category covers operational fixed assets related to the two EU space programmes: the
Global Navigation Satellite Systems (GNSS), i.e. Galileo and European Geostationary Navigation Overlay System (EGNOS), and the Copernicus European Earth observation programme. Assets of the space systems which are not yet operational are included under the heading ‘Assets under construction’. The assets related to the EU space programmes are being built with the assistance of the European Space Agency (ESA).
For Galileo, no new satellites became operational in 2020. The constellation includes 26 satellites. The Galileo operational fixed assets, covering both satellites and ground installations, amounted to EUR 2 145
million at 31 December 2020, net of accumulated depreciation (2019: EUR 2 489 million). The remaining assets under construction total EUR 1 872 million (2019: EUR 1 361 million). The development of the Galileo system will continue until the system reaches its full operational capacity. When completed, the Galileo constellation will comprise 30 satellites (including 6 spare satellites).
Regarding Copernicus, no new satellites became operational in 2020. The total value of Copernicus operational fixed assets is EUR 877 million (2019: EUR 1 153 million), net of accumulated depreciation. A further EUR 1 894 million related to Copernicus satellites is recognised as assets under construction
(2019: EUR 1 453 million). This increase includes EUR 266 million regarding the satellite 6A, whose ownership was received from ESA on 21 November 2020, date of its lift-off. It is expected to be declared operational following controls in mid-2021.
Fixed assets related to the EGNOS ground infrastructure of EUR 24 million (2019: EUR 37 million) are also included under the heading ‘Space assets’. In addition, EGNOS assets under construction amount to EUR 273 million (2019: EUR 238 million).

Annual accounts of the European Union 2020
59
Property, plant and equipment
EUR million
Land and Buildings
Space assets
Plant and Equipment
Furniture and Vehicles
Computer Hardware
Other Finance
leases Assets under construction
Total
Gross carrying amount at 31.12.2019 5 895 5 680 542 259 644 325 2 638 3 653 19 635
Additions 15 6 27 13 123 12 18 1 155 1 369
Disposals (0) (16) (16) (6) (45) (20) (2) (1) (106)
Transfer between asset categories 26 – 3 7 5 14 (3) (52) 0
Other changes (11) – (10) (0) 0 (0) (0) (8) (29)
Gross carrying amount at 31.12.2020 5 924 5 670 546 272 727 332 2 650 4 748 20 868
Accumulated depreciation at 31.12.2019 (3 503) (2 001) (457) (194) (533) (255) (1 313) (8 255)
Depreciation charge for the year (185) (635) (33) (15) (67) (23) (93) (1 051)
Depreciation written back – – – 0 0 0 – 0
Disposals 0 10 16 6 45 20 1 98
Transfer between asset categories – – 0 (0) (2) 0 2 (0)
Other changes 11 – 10 0 0 0 – 21
Accumulated depreciation at 31.12.2020 (3 676) (2 625) (465) (203) (557) (259) (1 402) (9 186)
NET CARRYING AMOUNT AT 31.12.2020 2 249 3 045 81 69 170 73 1 248 4 748 11 682
NET CARRYING AMOUNT AT 31.12.2019 2 392 3 679 85 65 110 70 1 325 3 653 11 380

Annual accounts of the European Union 2020
60
2.3. INVESTMENTS ACCOUNTED FOR USING THE EQUITY
METHOD
The participation of the EU, represented by the Commission, in the European Investment Fund (EIF) is treated as an associate using the equity method of accounting. The EIF is the EU's financial institution specialising in providing risk capital and guarantees to Small and Medium-sized Entities (SMEs). The EIF
is located in Luxembourg and operates as a private-public partnership, whose members are the European Investment Bank (EIB), the EU and a group of financial institutions. At 31 December 2020, the EU held 29.7% of ownership interests in the EIF (2019: 29.7%) and 29.7% of the voting rights (2019: 29.7%). In accordance with its statutes, the EIF is required to allocate at least 20% of its annual net result to a statutory reserve, until the aggregate reserve amounts to 10% of subscribed capital. This reserve is not available for distribution.
EUR million
European Investment Fund
Participation at 31.12.2019 591
Contributions –
Dividends received –
Share of net result 38
Share in the net assets (42)
Participation at 31.12.2020 588
The following carrying amounts are attributable to the EU based on its percentage of participation:
EUR million
31.12.2020 31.12.2019
Total EIF Total EIF
Assets 3 256 2 965
Liabilities (1 277) (975)
Revenue 322 337
Expenses (194) (161)
Surplus/(deficit) 129 176
Reconciliation of the above summarised financial information to the carrying amount of the interest held in the EIF is as follows:
EUR million
31.12.2020 31.12.2019
Net assets of the associate 1 979 1 990
EC ownership interests in EIF 29.7% 29.7%
Carrying amount 588 591
The EU, represented by the Commission, has paid in 20% of its subscribed shares in the EIF capital at
31 December 2020, the amount uncalled being as follows:
EUR million
Total EIF capital EU subscription
Total share capital 4 500 1 337
Paid-in (900) (267)
Uncalled 3 600 1 070

Annual accounts of the European Union 2020
61
2.4. FINANCIAL ASSETS
EUR million
Note 31.12.2020 31.12.2019
Non-current
Available for sale financial assets 2.4.1 16 134 15 211
Financial assets at fair value through surplus or deficit 2.4.2 193 134
Loans 2.4.3 82 887 51 368
99 214 66 714
Current
Available for sale financial assets 2.4.1 3 453 3 196
Financial assets at fair value through surplus or deficit 2.4.2 6 3
Loans 2.4.3 10 422 1 316
13 881 4 514
Total 113 095 71 228
2.4.1. Available for sale financial assets EUR million
31.12.2020 31.12.2019
BUFI investments 1 598 1 863
ECSC in Liquidation 1 445 1 459
European Bank for Reconstruction and Development 188 188
EEAS local staff pension plan 73 75
3 304 3 585
Guarantee Funds for budgetary guarantees:
EFSI Guarantee Fund 7 526 6 654
Guarantee Fund for external actions 2 794 2 545
EFSD Guarantee Fund 692 595
11 012 9 794
Financial Instruments financed by the EU budget:
Horizon 2020 3 097 2 455
Connecting Europe Facility 764 699
EU SME Equity Facilities 533 507
European Fund for South East Europe 163 166
Green for Growth Fund 143 70
Energy Efficiency Finance Facility 104 105
Risk Sharing Finance Facility 96 597
Risk Capital Operations 82 112
Other 289 317
5 271 5 028
Total 19 587 18 407
Non-current 16 134 15 211
Current 3 453 3 196
Out of the total of EUR 19 587 million, the EU holds available for sale financial assets in the form of investments in:
Debt securities (e.g. bonds) of EUR 14 862 million (2019: EUR 14 998 million);
Equity instruments of EUR 4 071 million (2019: EUR 2 801 million); and
Money market funds (such as the EIB Unitary Fund) of EUR 654 million (2019: EUR 608 million).
BUFI investments
Provisionally cashed fines related to competition cases are allocated to a dedicated fund (BUFI Fund – 'Budget Fines' Fund) and are invested by the Commission in debt instruments categorised as available for sale financial assets.

Annual accounts of the European Union 2020
62
ECSC in Liquidation
Regarding the European Coal and Steel Community in Liquidation (ECSC i.L.), all available for sale financial assets are debt securities denominated in EUR and quoted in an active market.
European Bank for Reconstruction and Development
The EU holds a financial investment in the capital of the European Bank for Reconstruction and Development (EBRD), in which the number of shares held at 31 December 2020 were 90 044 (2019: 90 044 shares), representing 3% of the total subscribed share capital. The EU subscribed for a
total amount of EUR 900 million of share capital, out of which EUR 713 million is currently uncalled. According to the agreement establishing the EBRD, the shareholders have some contractual restrictions such as the fact that the shares are not transferable and their redemption is capped at the maximum of the original purchase cost. The EU measures the investment in EBRD at fair value. The original purchase cost is considered to be the best estimate of the fair value, in particular due to the contractual restrictions referred to above. Although EBRD's shares are not quoted on any stock exchange market,
there were recent transactions in the investee's equity (issuance of capital at par value), indicating that
cost is the best estimate of the fair value in this situation.
GUARANTEE FUNDS FOR BUDGETARY GUARANTEES
EFSI Guarantee Fund
Pursuant to the EFSI Regulation (Regulation (EU) 2015/2017), the EFSI Guarantee Fund has been established to provide a liquidity cushion against potential losses incurred by the EIB in relation to its financing and investment operations eligible for the EFSI EU guarantee under the EFSI Agreement – see note 4.1.1. The EFSI Guarantee Fund is financed by contributions from the EU budget. It is also endowed
by returns on guarantee fund resources invested, revenues received by the EU as remuneration for the guarantee under the EFSI Agreement, and amounts recovered by the EIB from defaulting debtors in respect of previous guarantee calls. At the end of 2020, the assets of the EFSI guarantee fund totalled EUR 8 028 million (2019: EUR 6 688 million), of which EUR 7 526 million was invested in available for sale financial assets (2019: EUR 6 654 million). Another EUR 931 million (2019: EUR 1 879 million) have
been committed but not yet paid into the fund and are included in the budgetary RAL, and also disclosed
as outstanding commitments not yet expensed in note 5.1. The fund will be progressively provisioned and will gradually reach EUR 9.1 billion, i.e. 35% of the total EU EFSI guarantee obligations.
Guarantee Fund for external actions
The Guarantee Fund for external actions covers loans guaranteed by the EU budget, in particular EIB lending operations outside the EU, financed from the EIB's own resources and loans under macro-financial assistance (MFA) and Euratom loans outside the EU – see note 4.1.1. The fund is managed by the EIB and is intended to cover any defaulting loans guaranteed by the EU. The fund is endowed by
payments from the EU budget, the proceeds from interest on investments made from the fund's assets, and amounts recovered from defaulting debtors for whom the fund has had to activate its guarantee. The Guarantee Fund for external actions should be maintained at a target amount corresponding to 9% of the guaranteed loans outstanding at year-end. The difference between the target amount and the value of the fund's assets at year-end will be covered from the EU budget in year N+2, while any surplus is paid
back to the EU budget. At the end of 2020, the assets of the Guarantee Fund for external actions totalled EUR 2 813 million (2019: EUR 2 590 million), of which EUR 2 794 million was invested in available for
sale financial assets (2019: EUR 2 545 million).
EFSD Guarantee Fund
Pursuant to the EFSD Regulation (Regulation (EU) 2017/1601) the EFSD Guarantee Fund has been established to provide a liquidity cushion to be used in the event of a call on the Union guarantee given pursuant to the relevant EFSD guarantee agreements. The EFSD Guarantee Fund is financed by contributions from the EU budget and from contributions from the 11th EDF to the EU budget, along with
voluntary contributions from Member States and other contributors. The fund is also endowed by returns on invested resources, amounts recovered from defaulting debtors, revenues and any other payments received by the EU in accordance with the EFSD guarantee agreements. The EFSD Guarantee Fund has been provisioned up to EUR 750 million, i.e. 50% of total future EFSD guarantee obligations covered by the EU budget, and further increased by other contributions. At the end of 2020, the assets of the EFSD
Guarantee Fund totalled EUR 804 million (2019: EUR 600 million), of which EUR 692 million is invested in available for sale financial assets (2019: EUR 595 million).
Annual accounts of the European Union 2020
63
FINANCIAL INSTRUMENTS FINANCED BY THE EU BUDGET
Horizon 2020
Under the EU Regulation establishing Horizon 2020 – the Framework Programme for Research and Innovation (2014-2020), new financial instruments have been established in order to enhance access to finance to entities engaged in research and innovation (R&I). These instruments are:
The InnovFin Loan and Guarantee Service for R&I under which the Commission shares the financial risk related to a portfolio of new financing operations entered into by the EIB;
The InnovFin SME Guarantee and the SME Initiative Uncapped Guarantee Instrument (SIUGI) – guarantee facilities managed by the EIF providing guarantees and counter-guarantees to financial intermediaries for new portfolios of loans (under SIUGI the Commission shares the financial risk related to the guarantee given with Member States, EIF and EIB);
The InnovFin Equity Facility for R&I providing for investments in venture capital funds which is
managed by the EIF; and
The EIC Fund (European Innovation Council Fund) which provides equity financing to accelerate
innovation and market deployment actions. The EIC fund will be primarily funded from the 2021-2027 MFF under the Horizon Europe framework programme. However, the Commission has committed resources available under the H2020 for a pilot facility that set up the EIC fund.
Connecting Europe Facility
Pursuant to Regulation (EU) No 2013/1316, the Connecting Europe Facility (CEF) debt instrument has been established with the objective to facilitate infrastructure projects’ access to financing in the sectors of transport, telecommunications and energy. It is managed by the EIB under an agreement with the EU.
The CEF debt financial instrument is the continuity of the Loan Guarantee Instrument for TEN-T projects (LGTT) and of the pilot phase of the Project Bond Initiative (PBI). It offers risk sharing for debt financing in the form of senior and subordinated debt or guarantee as well as support for project bonds. After
19 June 2019, with the effect of the first amendment of the delegation agreement with the EIB, all CEF operations deployed by the EIB are assigned to one of the two portfolios: debt portfolio or non securitisable financing portfolio, for which a new portfolio-based risk sharing approach is introduced.
EU SME Equity Facilities
These are equity instruments financed by the COSME, the CIP and MAP programmes and the Growth and Employment Initiative, under the trusteeship of the EIF, supporting the creation and financing of EU SMEs in their early (start-up) and growth stages by investing in suitable specialised venture capital funds.
Risk-Sharing Finance Facility
Under the Risk-Sharing Finance Facility, the EU guarantees to EIB, loans and guarantees the EIB gives to eligible research projects. The available for sale assets under this heading, are used to provision the EU’s
financial risk from calls the EIB may make on the EU guarantee. In total, an EU budget of up to EUR 1 billion was allocated to the RSFF under the 2007-2013 MFF. Under the 2014-2020 MFF, there were
no new budget contributions foreseen for the RSFF. Given that a significant portion of the RSFF outstanding operations has been already repaid to the EIB, in 2019 and 2020 the EIB partially released the EU guarantee. This resulted in a decrease in the EU contingent liability (see note 4.1.3). Subsequently, at the end of 2020 the EU available for sale assets are significantly lower, as in 2020 the EIB repaid EUR 500 million of the EU contribution to the Commission which was primarily used to
reinforce the EU financial instruments under the Horizon 2020.

Annual accounts of the European Union 2020
64
2.4.2. Financial assets at fair value through surplus or deficit
EUR million
31.12.2020 31.12.2019
Type of derivative Notional
amount Fair value
Notional
amount Fair value
Foreign currency forward contract 417 6 393 3
Guarantee on equity portfolio 3 197 193 1 439 134
Total 3 614 199 1 832 137
Non-current 3 197 193 1 439 134
Current 417 6 393 3
The EU enters into foreign currency forward contracts in order to hedge the foreign currency risk related to USD denominated debt securities held in the EFSI Guarantee Fund. Under the foreign currency forward contracts, the EU delivers the contractually agreed notional amount in foreign currency ('pay leg'), as
presented in the table above, and will receive the notional amount in EUR ('receive leg') at the maturity date. Such derivative contracts are measured at fair value at the balance sheet date and classified as either financial assets or financial liabilities at fair value through surplus or deficit depending on whether their fair value is positive or negative.
The heading ‘Guarantee on equity portfolio’ comprises guarantees given by the EU to financial institutions on portfolios of equity investments that are classified as derivative financial instruments and accounted
for as a financial asset or financial liability at fair value through surplus or deficit. The total amount represents mainly the EFSI guarantee given by the EU to the EIB Group with underlying equity investments disbursed by the EIB and EIF amounting to EUR 2 223 million (2019: EUR 1 420 million). The fair value of the EU guarantee on the EFSI equity portfolios totalled EUR 164 million (2019: EUR 134 million).
Fair value hierarchy of financial assets measured at fair value
EUR million
31.12.2020 31.12.2019
Level 1: Quoted prices in active markets 15 383 15 482
Level 2: Observable inputs other than quoted prices 2 712 1 543
Level 3: Valuation techniques with inputs not based on
observable market data 1 691 1 518
Total 19 786 18 544
During the period there were no transfers between level 1 and level 2.
Reconciliation of financial assets measured using valuation techniques with inputs not based on
observable market data (level 3)
EUR million
Opening balance at 1.1.2020 1 518
Purchases, sales, issues and settlements 179
Gains or losses for the period in financial income or finance costs 10
Gains or losses in net assets (17)
Transfers into level 3 –
Transfers out of level 3 –
Other 1
Closing balance at 31.12.2020 1 691

Annual accounts of the European Union 2020
65
2.4.3. Loans
EUR million
Note 31.12.2020 31.12.2019
Loans for financial assistance 2.4.3.1 93 193 52 564
Loans for budget programmes and term deposits 2.4.3.2 116 121
Total 93 309 52 684
Non-current 82 887 51 368
Current 10 422 1 316
2.4.3.1. Loans for financial assistance
EUR million
EFSM SURE BOP MFA Euratom Total
Total at 31.12.2019 47 394 – 201 4 754 214 52 564
New loans – 39 500 – 1 675 100 41 275
Repayments – – – (617) (35) (651)
Exchange differences – – – – – –
Changes in carrying amount 2 3 0 0 0 6
Impairment – – – – – –
Total at 31.12.2020 47 396 39 503 201 5 813 279 93 193
Non-current 37 050 39 500 200 5 783 250 82 783
Current 10 346 3 1 30 29 10 410
The nominal value of loans for financial assistance at 31 December 2020 totals EUR 92 565 million (2019: EUR 51 941 million). The change in carrying amount corresponds to the change in accrued interests.
The European Financial Stabilisation Mechanism (EFSM) enables the granting of financial assistance to a Member State in difficulties, or seriously threatened by severe difficulties caused by exceptional
circumstances beyond its control. The assistance may take the form of a loan or credit line. The ECOFIN
Council conclusions of 9 May 2010 restrict the facility to EUR 60 billion but the legal limit restricts the outstanding amount of loans or credit lines to the margin available under the own resources ceiling. Borrowings related to loans disbursed under the EFSM are guaranteed by the EU budget. It is not foreseen that the EFSM will engage in new financing programmes or enter into new loan facility agreements.
Support to mitigate Unemployment Risks in an Emergency (SURE) is the new European instrument that helps to maintain people in work and jobs affected by the coronavirus pandemic. The instrument enables Member States to request EU financial assistance to help finance sudden and severe increases of national public expenditure related to national short-time work schemes and similar measures, including for self-employed persons, or to some health-related measures, in particular in the work place in response to the crisis. It can provide financial assistance of up to EUR 100 billion in the form of loans to affected Member States. The instrument is underpinned by EUR 25 billion of guarantees that the Member States have
provided to the Commission. In accordance with the Council Regulation (EU) 2020/672, the Commission can enter into a loan agreement with a Member State only after the Commission has proposed, and the
Council has adopted, an implementing decision for SURE financial assistance. At 31 December 2020, the Council had approved EUR 90 363 million of financial assistance, out of which the Commission had signed loan agreements with Member States for EUR 85 863 million and had disbursed EUR 39 500 million to Member States (nominal amounts). The remaining signed loan agreement amounts are being disbursed in 2021. For the contingent liabilities related to SURE loans see also note 4.1.2.
The Balance of Payments (BOP) facility, a policy-based financial instrument, provides medium-term financial assistance to Member States of the EU that have not adopted the Euro. It enables the granting of loans to Member States who are experiencing, or are seriously threatened by, difficulties in their balance of payments or capital movements. The maximum outstanding amount of loans granted under the instrument is limited to EUR 50 billion. Borrowings related to these BOP loans are guaranteed by the EU budget.
MFA (Macro-Financial Assistance) is a form of financial aid extended by the EU to partner countries experiencing a balance of payment crisis. It takes the form of medium or long term loans or grants or an appropriate combination of both and generally complements financing provided in the context of an IMF-
supported adjustment and reform program. These loans are guaranteed by the Guarantee Fund for external actions. During the year ended 31 December 2020, further disbursements of loans under MFA for a total amount of EUR 1 675 million were provided, thereof EUR 1 100 million to Ukraine, EUR 250

Annual accounts of the European Union 2020
66
million to Jordan and EUR 325 million to other countries. For the contingent liabilities related to MFA
loans see also note 4.1.2.
The European Atomic Energy Community (Euratom, represented by the Commission) lends money to both Member States and non-Member States, and to entities of both, to finance projects relating to energy installations. Guarantees from third parties of EUR 279 million (2019: EUR 214 million) have been received to cover Euratom loans. For the contingent liabilities related to Euratom loans see note 4.1.2.
Loans effective interest rates (expressed as a range of interest rates)
31.12.2020 31.12.2019
European Financial Stabilisation Mechanism (EFSM) 0.50% - 3.75% 0.50% - 3.75%
Support to mitigate Unemployment Risks in an Emergency (SURE)
0.00% - 0.30% –
Balance of Payment (BOP) 2.88% 2.88%
Macro Financial Assistance (MFA) 0.00% - 3.69% 0.00% - 3.82%
Euratom 0.00% - 5.76% 0.08% - 5.76%
2.4.3.2. Loans for budget programmes and term deposits
The loans for budget programmes include: loans that are granted at preferential conditions as part of co-
operation with non-Member States (e.g. under the MEDA programme Euro-Mediterranean partnership), loans granted under the EU Employment and Social Innovation Programme and under the EU Electrification Financing Initiative.
Term deposits include amounts with maturity of over 3 months that do not meet the definition of cash equivalents.
The nominal value of loans for budget programmes and term deposits amounts to EUR 768 million (2019: EUR 728 million).
Impairment on loans for budget programmes
EUR million
31.12.2019 Additions Reversals Write-off Other 31.12.2020
Loans for budget programmes 10 3 – – – 13
Subrogated loans 658 73 – – (4) 726
Total 668 76 – – (4) 739
Subrogated loans are defaulted loans which were granted by the EIB and guaranteed by the EU budget. For these loans all rights have been subrogated to the EU, following the payment of the guarantee calls from the Guarantee Fund for external actions or from the EFSI Guarantee Fund. These loans are fully
impaired for an amount of EUR 726 million (2019: EUR 658 million). Guarantee calls are partially covered by financial provisions made in previous years. Under the relevant agreements between the EU and the EIB, recovery proceedings are undertaken by the EIB on behalf of the EU with the aim to recover any sums due.

Annual accounts of the European Union 2020
67
2.5. PRE-FINANCING
EUR million
Note 31.12.2020 31.12.2019
Non-current
Pre-financing 2.5.1 30 574 22 135
Other advances to Member States 2.5.2 3 825 4 045
Contribution to Trust Funds 119 60
34 519 26 240
Current
Pre-financing 2.5.1 24 902 22 314
Other advances to Member States 2.5.2 3 327 2 892
28 229 25 206
Total 62 748 51 446
The level of pre-financing in the various programmes must be sufficient to ensure the necessary funding
for the beneficiary to initiate and advance the project, while also safeguarding the financial interests of the EU and taking into consideration legal, operational and cost-effectiveness constraints.
2.5.1. Pre-financing
EUR million
Gross
amount Cleared via
accruals Net amount
at 31.12.2020 Gross
amount Cleared via
accruals Net amount
at 31.12.2019
Shared management
EAFRD & other rural development instruments
3 193 – 3 193 3 193 – 3 193
ERDF & CF 23 074 (3 846) 19 229 17 985 (3 540) 14 444
ESF 8 222 (1 348) 6 874 6 830 (1 530) 5 301
Other 4 192 (1 520) 2 672 3 549 (1 463) 2 086
38 681 (6 713) 31 967 31 557 (6 533) 25 024
Direct Management
Implemented by:
Commission 17 031 (10 648) 6 382 12 839 (8 344) 4 495
EU executive agencies 18 565 (10 931) 7 633 16 522 (10 339) 6 184
Trust funds 1 121 (843) 278 858 (665) 194
36 716 (22 423) 14 294 30 219 (19 347) 10 872
Indirect Management
Implemented by:
Other EU agencies & bodies 1 243 (781) 462 1 162 (678) 484
Third countries 1 515 (1 043) 471 1 491 (861) 630
International organisations 9 068 (6 020) 3 048 8 289 (5 317) 2 972
Other entities 11 665 (6 432) 5 233 10 570 (6 104) 4 467
23 491 (14 276) 9 215 21 513 (12 960) 8 553
Total 98 888 (43 412) 55 476 83 289 (38 840) 44 449
Non-current 30 574 – 30 574 22 135 – 22 135
Current 68 314 (43 412) 24 902 61 154 (38 840) 22 314
Pre-financing represents money paid out, and thus the implementation of payment appropriations. As explained in note 1.5.7, these are advances and so not yet expensed. Thus while pre-financing reduces outstanding RAL (see note 5.1) it represents expenses still to be accepted and recognised in the statement of financial performance.
For shared management, almost all pre-financing relates to the programming period 2014-2020. There is an initial pre-financing which will not be cleared (i.e. recognised in the statement of financial performance) before the end of the programming period and is shown as a non-current pre-financing.

Annual accounts of the European Union 2020
68
For the cohesion area, there is also an annual pre-financing which is cleared on an annual basis and is
shown as a current pre-financing. However, due to the COVID-19 pandemic and based on Coronavirus
Response Investment Initiative measures, the unused part of the 2019 annual pre-financing was not recovered in 2020 as it usually would be. The total amount, which corresponds to EUR 6.6 billion, is shown under non-current pre-financing. The non-recovery of the 2019 annual pre-financing in 2020 is an important factor explaining the increase in shared management pre-financing at year-end.
New pre-financing payments made in the cohesion area include the 2020 annual pre-financing
(EUR 10 billion), but also payments from the EU Solidarity Fund (EUR 1.1 billion).
For direct management, the biggest part of pre-financing concerns Research (mainly Horizon 2020, implemented by the Commission and EU executive agencies) and amounts to EUR 9.3 billion (2019: EUR 7.8 billion). The increase is a consequence of the agreements entered into during 2020, for which pre-financing payments were made.
For indirect management, the pre-financing covers mainly internal policies programmes like Galileo and
EGNOS, but also instruments related to external relations like ENI (European Neighbourhood
Instrument), DCI (Development Cooperation Instrument) and IPA (Instrument for Pre-Accession). The increase in pre-financing to international organisations concerns mainly the above mentioned external relations instruments.
Guarantees received in respect of pre-financing
These are guarantees that the Commission requests in certain cases from beneficiaries that are not Member States, when making advance payments (pre-financing). There are two values to disclose for this type of guarantee, the ‘nominal’ and the ‘on-going’ values. For the nominal value, the generating
event is linked to the existence of the guarantee. For the on-going value, the guarantee’s generating event is the pre-financing payment made against the guarantee, then reduced by subsequent clearings. At 31 December 2020 the nominal value of guarantees received in respect of pre-financing amounted to EUR 466 million while the on-going value of those guarantees was EUR 402 million (2019: EUR 492 million and EUR 406 million respectively).
Certain pre-financing amounts paid out under the 7th Research Framework Programme for research and
technological development (FP7) and under Horizon 2020 are effectively covered by a Participants Guarantee Fund (PGF). The PGF is a mutual benefit instrument set up to cover the risks relating to non-payment of amounts by the beneficiaries during the implementation of the actions of FP7 and Horizon 2020. All participants of indirect actions receiving a grant from the EU contribute 5% of the total amount received to the PGF's capital.
At 31 December 2020, pre-financing amounts covered by the PGF totalled EUR 2.3 billion (2019: EUR 2.1 billion). The EU (represented by the Commission) acts as an executive agent of the participants
of the PGF, but the fund is owned by the participants.
At year-end, the PGF had total assets of EUR 2.4 billion (2019: EUR 2.2 billion). The assets of the PGF also include financial assets that are managed by the Commission. As the PGF is a separate entity the assets of the fund are not consolidated in these EU annual accounts.
2.5.2. Other advances to Member States
EUR million
31.12.2020 31.12.2019 Advances to Member States for financial instruments under shared management
3 520 3 304
Aid Schemes 3 633 3 634
Total 7 153 6 937
Non-current 3 825 4 045
Current 3 327 2 892

Annual accounts of the European Union 2020
69
Advances to Member States for financial instruments under shared management
Under the framework of the European Structural and Investment Funds (ESIF) programmes, it is possible to make advance payments from the EU budget to Member States so as to allow them to contribute to financial instruments (i.e. loans, equity investments or guarantees). These financial instruments are set up and managed under the responsibility of the Member States, not the Commission. Nevertheless, monies that are unused by these instruments at year-end are the property of the EU (as with all pre-financing) and are thus treated as an asset on the EU’s balance sheet.
2014-2020 Period:
Under cohesion policy, out of EUR 10 518 million paid, it is estimated that EUR 3 452 million was unused at 31 December 2020. This includes the contribution of the Member States to the SME Initiative, an instrument aimed at stimulating additional lending by the banking sector to SMEs (EUR 1 238 million paid excluding amounts still in pre-financing, out of which EUR 349 million is estimated as unused).
For rural development, EUR 66 million remained unused at year-end.
2007-2013 Period:
All amounts related to cohesion policy are considered to have been either implemented or re-allocated to other measures, therefore no assets remain on the balance sheet at 31 December 2020. It should be noted that the actual implementation by the various instruments will be reviewed as part of the closure process of the programmes in the coming years.
Aid Schemes
Similar to the above, reimbursed amounts corresponding to advances paid by the Member States for various aid schemes (state aid, market measures of EAGF or investment measures of EAFRD) that were
not used at year-end are recorded as assets (advances) on the EU's balance sheet. The Commission has estimated the value of these advances based on information provided by the Member States; the
resulting amounts are included under the Aid Schemes sub-heading above.
2014-2020 Period:
The unused amounts at year-end were estimated at EUR 1 887 million for cohesion policy and for agriculture and rural development at EUR 1 663 million.
2007-2013 Period:
It is estimated that EUR 83 million paid in the context of rural development remains unused at the end of 2020.

Annual accounts of the European Union 2020
70
2.6. EXCHANGE RECEIVABLES AND NON-EXCHANGE
RECOVERABLES
EUR million
Note 31.12.2020 31.12.2019
Non-current
Recoverables from non-exchange transactions 2.6.1 44 128 2 422
Receivables from exchange transactions 2.6.2 1 685 1 185
45 813 3 607
Current
Recoverables from non-exchange transactions 2.6.1 26 915 19 328
Receivables from exchange transactions 2.6.2 1 766 1 038
28 681 20 367
Total 74 493 23 974
2.6.1. Recoverables from non-exchange transactions EUR million
Note 31.12.2020 31.12.2019
Non-current
Member States 2.6.1.1 2 237 2 422
UK Withdrawal Agreement 2.6.1.2 40 629 –
Accrued income and deferred charges 2.6.1.4 1 261 –
Other recoverables 1 –
44 128 2 422
Current
Member States 2.6.1.1 7 213 6 180
UK Withdrawal Agreement 2.6.1.2 6 827 –
Competition fines 2.6.1.3 11 295 11 301
Accrued income and deferred charges 2.6.1.4 787 1 788
Other recoverables 2.6.1.5 792 59
26 915 19 328
Total 71 043 21 750
2.6.1.1. Recoverables from Member States
EUR million
31.12.2020 31.12.2019
TOR A accounts 5 297 5 478
TOR separate accounts 1 460 1 591
Own resources to be received 2 188 7
Impairment (892) (931)
Other – –
Own resources recoverables 8 053 6 145
European Agricultural Guarantee Fund (EAGF) 1 378 1 722
European Agricultural Fund for Rural Development (EAFRD) and
other rural development instruments 720 879
Impairment (837) (822)
EAGF and rural development recoverables 1 260 1 779
Pre-financing recovery 53 443
VAT paid and recoverable 35 44
Other recoverables from Member States 49 191
Total 9 450 8 602
Non-current 2 237 2 422
Current 7 213 6 180

Annual accounts of the European Union 2020
71
The largest amount included under non-current relates to amounts due from Member States, specifically
EUR 2.1 billion of the United Kingdom (UK) infringement case (explained below). Also included as non-
current, as in previous years, are amounts relating to non-executed conformity clearance decisions for the European Agricultural Guarantee Fund (EAGF) as well as for the European Agricultural Fund for Rural Development (EAFRD). The amounts related to these decisions are being recovered in annual instalments.
The increase in current amounts due from Member States is mostly due the own resources to be received
linked to amending budgets in 2020 – see below.
Own resources recoverables
'A accounts' refers to the monthly statements where the Member States communicate the established Traditional Own Resources (TOR) entitlements to the Commission, not yet recovered. TOR are mainly customs duties collected by Member States on behalf of the Commission.
The ‘A accounts’ have tended to have a level of approximately EUR 3 billion at year-end, however, in both 2020 and 2019 the balance includes additional TOR amounts related to the UK infringement case
(explained below) and other TOR inspection reports. As late payment interest of EUR 1.7 billion is applicable (2019: EUR 1.2 billion), those amounts are therefore also reported in these annual accounts (see notes 2.6.2 and 3.8).
Concerning the infringement case, on 8 March 2018, the Commission sent a letter of formal notice (Infringement No 2018/2008) to the UK because it failed to make the correct amount of traditional own resources available to the EU budget, as required by EU law. As the UK did not provide a satisfactory reply, neither to the letter of formal notice nor to the reasoned opinion sent on 24 September 2018, the
Commission confirmed on 6 March 2019 its decision to refer the infringement to the Court of Justice of the EU and lodged its application on 7 March 2019. The case originated in a 2017 OLAF report, that found that importers in the UK evaded a large amount of customs duties by using fictitious and false invoices and incorrect customs value declarations at importation. Based on a methodology developed by OLAF and the JRC and on the information available, the Commission estimates that the infringement of EU
legislation by the UK resulted, during the period November 2011 to October 2017, in losses to the EU
budget amounting to EUR 2.1 billion (net, i.e. after deducting the collection costs to be retained by the UK from the gross amount of EUR 2.7 billion). The UK does not agree with the methodology used by the Commission to estimate the above losses. On 8 December 2020 the Court held the oral hearing. The next steps in the procedure are the opinion of the Advocate General and the Judgement of the Court of Justice for which the dates are not yet known. As the ongoing Court proceedings and the information available to date are indicative of a long-term process, both the principal of EUR 2.1 billion and the estimated late payment interest of EUR 1.6 billion accrued until end 2020 (compared to EUR 1.1 billion interest accrued
and recognised until end 2019) have been classified as long-term assets.
In addition, the Commission included in the accounts a receivable of EUR 0.15 billion for established customs duties and late payment interest which is based on the latest available information.
‘Separate accounts’ refers to established entitlements that have not been included in the 'A accounts', because they have not been recovered by Member States and no security has been provided (or if
security has been provided but the amounts are contested). These entitlements are subject to impairment based on information provided every year by the Member States. These amounts are
generally at a similar level at each year-end, as seen above.
‘Own resources to be received’ in 2020 refer to recoverables as a result of the amending budgets Nos 8 and 9/2020 adopted on 24 November 2020 and 15 December 2020 respectively. The amounts were entered by most Member States on the first working day of January 2021. There was no such amount relating to 2019.
EAGF and Rural Development recoverables
This item primarily covers the amounts owed by Member States at 31 December 2019, as declared and certified by the Member States as at 15 October 2019. An estimation is made for the recoverables arising after this declaration and up to 31 December 2019. The Commission also estimates a write-down for the
amounts owed by beneficiaries that are unlikely to be recovered. The fact that such an adjustment is made does not mean that the Commission is waiving future recovery of these amounts. A deduction of 20% is also included in the adjustment and corresponds to what Member States are allowed to retain to cover administrative costs.
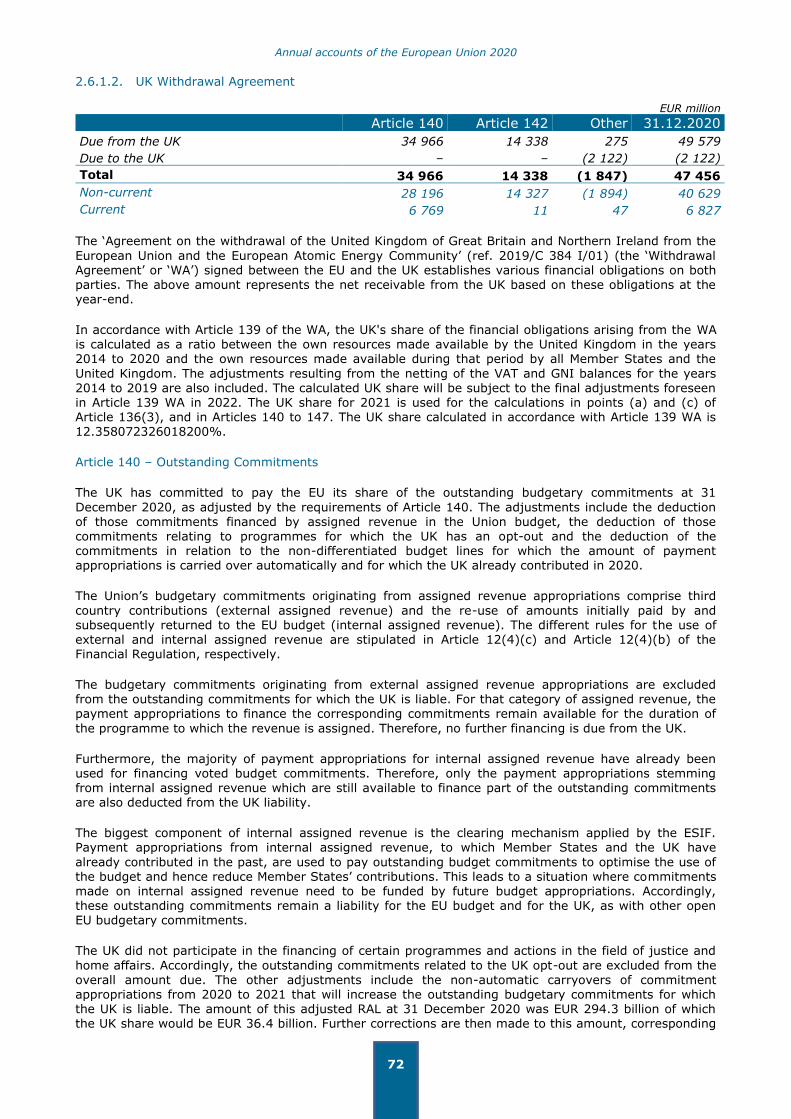
Annual accounts of the European Union 2020
72
2.6.1.2. UK Withdrawal Agreement
EUR million
Article 140 Article 142 Other 31.12.2020
Due from the UK 34 966 14 338 275 49 579
Due to the UK – – (2 122) (2 122)
Total 34 966 14 338 (1 847) 47 456
Non-current 28 196 14 327 (1 894) 40 629
Current 6 769 11 47 6 827
The ‘Agreement on the withdrawal of the United Kingdom of Great Britain and Northern Ireland from the
European Union and the European Atomic Energy Community’ (ref. 2019/C 384 I/01) (the ‘Withdrawal Agreement’ or ‘WA’) signed between the EU and the UK establishes various financial obligations on both parties. The above amount represents the net receivable from the UK based on these obligations at the year-end.
In accordance with Article 139 of the WA, the UK's share of the financial obligations arising from the WA is calculated as a ratio between the own resources made available by the United Kingdom in the years 2014 to 2020 and the own resources made available during that period by all Member States and the
United Kingdom. The adjustments resulting from the netting of the VAT and GNI balances for the years 2014 to 2019 are also included. The calculated UK share will be subject to the final adjustments foreseen in Article 139 WA in 2022. The UK share for 2021 is used for the calculations in points (a) and (c) of Article 136(3), and in Articles 140 to 147. The UK share calculated in accordance with Article 139 WA is 12.358072326018200%.
Article 140 – Outstanding Commitments
The UK has committed to pay the EU its share of the outstanding budgetary commitments at 31
December 2020, as adjusted by the requirements of Article 140. The adjustments include the deduction of those commitments financed by assigned revenue in the Union budget, the deduction of those
commitments relating to programmes for which the UK has an opt-out and the deduction of the commitments in relation to the non-differentiated budget lines for which the amount of payment appropriations is carried over automatically and for which the UK already contributed in 2020.
The Union’s budgetary commitments originating from assigned revenue appropriations comprise third
country contributions (external assigned revenue) and the re-use of amounts initially paid by and subsequently returned to the EU budget (internal assigned revenue). The different rules for the use of external and internal assigned revenue are stipulated in Article 12(4)(c) and Article 12(4)(b) of the Financial Regulation, respectively.
The budgetary commitments originating from external assigned revenue appropriations are excluded from the outstanding commitments for which the UK is liable. For that category of assigned revenue, the payment appropriations to finance the corresponding commitments remain available for the duration of
the programme to which the revenue is assigned. Therefore, no further financing is due from the UK.
Furthermore, the majority of payment appropriations for internal assigned revenue have already been used for financing voted budget commitments. Therefore, only the payment appropriations stemming from internal assigned revenue which are still available to finance part of the outstanding commitments are also deducted from the UK liability.
The biggest component of internal assigned revenue is the clearing mechanism applied by the ESIF. Payment appropriations from internal assigned revenue, to which Member States and the UK have
already contributed in the past, are used to pay outstanding budget commitments to optimise the use of the budget and hence reduce Member States’ contributions. This leads to a situation where commitments made on internal assigned revenue need to be funded by future budget appropriations. Accordingly, these outstanding commitments remain a liability for the EU budget and for the UK, as with other open EU budgetary commitments.
The UK did not participate in the financing of certain programmes and actions in the field of justice and
home affairs. Accordingly, the outstanding commitments related to the UK opt-out are excluded from the
overall amount due. The other adjustments include the non-automatic carryovers of commitment appropriations from 2020 to 2021 that will increase the outstanding budgetary commitments for which the UK is liable. The amount of this adjusted RAL at 31 December 2020 was EUR 294.3 billion of which the UK share would be EUR 36.4 billion. Further corrections are then made to this amount, corresponding

Annual accounts of the European Union 2020
73
to the UK’s share of: the net financial corrections from 2014-2020 or previous programming periods
which were cashed in 2021; and TOR relating to 2020 and made available in 2021. The amount owed by
the UK under Article 140 is thus EUR 36.0 billion. The amount recognised as a receivable is based on the official Commission forecast of decommitments of the entire stock of RAL of 31 December 2020, giving a total receivable of EUR 35.0 billion (of which EUR 6.8 billion is to be paid in the 12 months following the reporting date):
EUR million
31.12.2020 Outstanding budgetary commitments at 31.12.2020 as reported in the budgetary implementation reports
303 197
Commitments on non-differentiated budget lines: amount of payment appropriations carried over automatically
(1 196)
Commitments where the UK has an opt-out (1 826)
Commitments financed by assigned revenue (4 709)
Payment appropriations available from internal assigned revenue (1 128)
Other adjustments (non-automatic carryovers of commitment appropriations)
10
Adjusted budgetary commitments at 31.12.2020 on which UK share is applied
294 347
UK share of the adjusted budgetary commitments 36 376
Net financial corrections related to 2014-2020 or previous programme periods
(0)
TOR relating to 2020 and made available to the Union in 2021 (402)
Amounts owed by the UK under Article 140 35 973
Estimated non-implementation (1 008)
Total 34 966
Non-current 28 196
Current 6 769
For more details regarding the outstanding budgetary commitments at 31 December 2020 – which is the starting figure for the calculation of the amounts owed by the UK under Article 140 – please see Budgetary Implementation Reports and Explanatory Notes, table 4.4.
Article 142 – Union liabilities at end 2020
The UK has committed to pay the EU its share of Union liabilities at end 2020 with the exception of liabilities: (a) with corresponding assets and (b) relating to the operation of the budget and the management of own resources (including amounts already covered by the outstanding commitments (see Article 140 above)). The main amount here concerns the EU post-employment obligations (pensions and sickness insurance) existing at 31 December 2020 where the UK’s share totals EUR 14 338 million at year-end (of which EUR 11 million is to be paid in the 12 months following the reporting date):
EUR million
Pension Scheme of European Officials
Joint Sickness Insurance
Scheme
Other retirement
schemes
31.12.2020
Unpaid 31.12.2020 Liability 100 741 12 935 2 344 116 020
UK Share 12 450 1599 290 14 338
Non-current 12 450 1 599 279 14 327
Current – – 11 11
For more information regarding the employee benefit liabilities, please see note 2.9.

Annual accounts of the European Union 2020
74
Other Articles
EUR million
31.12.2020
Due from the UK:
Article 136 230
Article 147 46
275
Due to the UK:
Article 141 (1 766)
Article 143 (93)
Article 144 (46)
Article 145 (183)
Article 146 (33)
(2 122)
Total (1 847)
Non-current (1 894)
Current 47
Article 136 – Provisions applicable in relation to own resources
Article 136 establishes the provisions applicable after 31 December 2020 in relation to own resources. The UK is entitled to receive its share where the own resources related to the financial years up to and
including 2020 are to be made available, corrected or subject to adjustments after 31 December 2020. Furthermore, it will receive its share of adjustments related to the surplus of the year 2020. It is also subject to any adjustments of VAT and GNI own resources that relate to the financial years up to and including 2020. These VAT and GNI adjustments will be calculated yearly until 31 December 2028. The calculated updates of the UK correction of 2017-2019 are also be taken into account.
The UK is required to pay the traditional own resources collected by them after 28 February 2021, but related to the year 2020 and earlier. Their share of the total made available TOR by the EU 27 and by
them is then deducted from this amount. The separate account for traditional own resources shall be fully liquidated at 31 December 2025.
The amount of EUR 230 million below is to be paid by the UK during 2021.
EUR million
Surplus (219)
UK correction 211
Opt-out N/A
VAT and GNI adjustments (related to years 2020 and before) 214
UK net traditional own resources after 28 February 2021 23
Total 230
Article 141 – Fines
The UK is entitled to its share of fines decided before 31 December 2020 and also those decided upon by the Union after 31 December 2020 in a procedure referred to in Article 92(1) when these become definitive. The amount of UK relevant fines outstanding at 31 December 2020 is EUR 14.3 billion. In total, the UK would be entitled to EUR 1.8 billion (of which EUR 20 million is to be paid in the 12 months following the reporting date).
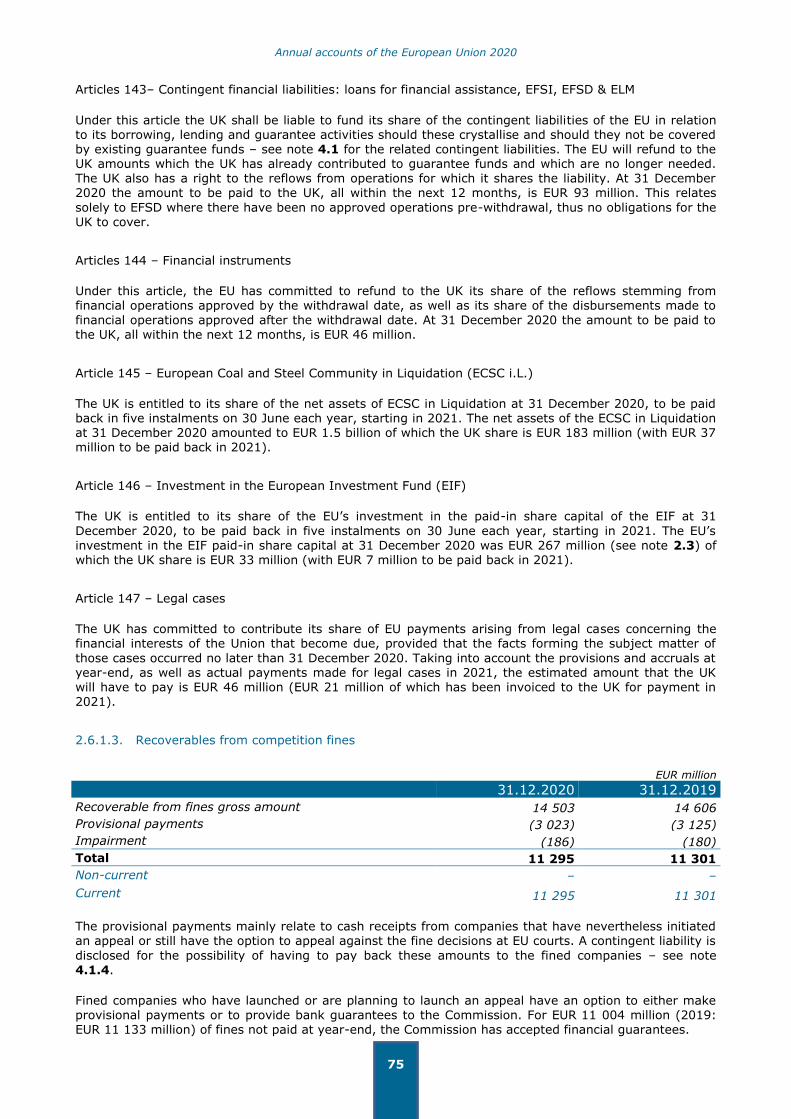
Annual accounts of the European Union 2020
75
Articles 143– Contingent financial liabilities: loans for financial assistance, EFSI, EFSD & ELM
Under this article the UK shall be liable to fund its share of the contingent liabilities of the EU in relation to its borrowing, lending and guarantee activities should these crystallise and should they not be covered by existing guarantee funds – see note 4.1 for the related contingent liabilities. The EU will refund to the UK amounts which the UK has already contributed to guarantee funds and which are no longer needed. The UK also has a right to the reflows from operations for which it shares the liability. At 31 December 2020 the amount to be paid to the UK, all within the next 12 months, is EUR 93 million. This relates
solely to EFSD where there have been no approved operations pre-withdrawal, thus no obligations for the UK to cover.
Articles 144 – Financial instruments
Under this article, the EU has committed to refund to the UK its share of the reflows stemming from financial operations approved by the withdrawal date, as well as its share of the disbursements made to
financial operations approved after the withdrawal date. At 31 December 2020 the amount to be paid to the UK, all within the next 12 months, is EUR 46 million.
Article 145 – European Coal and Steel Community in Liquidation (ECSC i.L.)
The UK is entitled to its share of the net assets of ECSC in Liquidation at 31 December 2020, to be paid back in five instalments on 30 June each year, starting in 2021. The net assets of the ECSC in Liquidation at 31 December 2020 amounted to EUR 1.5 billion of which the UK share is EUR 183 million (with EUR 37 million to be paid back in 2021).
Article 146 – Investment in the European Investment Fund (EIF)
The UK is entitled to its share of the EU’s investment in the paid-in share capital of the EIF at 31
December 2020, to be paid back in five instalments on 30 June each year, starting in 2021. The EU’s
investment in the EIF paid-in share capital at 31 December 2020 was EUR 267 million (see note 2.3) of which the UK share is EUR 33 million (with EUR 7 million to be paid back in 2021).
Article 147 – Legal cases
The UK has committed to contribute its share of EU payments arising from legal cases concerning the financial interests of the Union that become due, provided that the facts forming the subject matter of
those cases occurred no later than 31 December 2020. Taking into account the provisions and accruals at year-end, as well as actual payments made for legal cases in 2021, the estimated amount that the UK will have to pay is EUR 46 million (EUR 21 million of which has been invoiced to the UK for payment in 2021).
2.6.1.3. Recoverables from competition fines
EUR million
31.12.2020 31.12.2019
Recoverable from fines gross amount 14 503 14 606
Provisional payments (3 023) (3 125)
Impairment (186) (180)
Total 11 295 11 301
Non-current – –
Current 11 295 11 301
The provisional payments mainly relate to cash receipts from companies that have nevertheless initiated an appeal or still have the option to appeal against the fine decisions at EU courts. A contingent liability is
disclosed for the possibility of having to pay back these amounts to the fined companies – see note
4.1.4.
Fined companies who have launched or are planning to launch an appeal have an option to either make provisional payments or to provide bank guarantees to the Commission. For EUR 11 004 million (2019: EUR 11 133 million) of fines not paid at year-end, the Commission has accepted financial guarantees.

Annual accounts of the European Union 2020
76
The amounts written down due to impairment reflect the Commission's case-by-case assessment of fines
amounts not cashed or not covered with a guarantee, which the Commission expects not to recover.
The total recoverables from competition fines have remained relatively unchanged from 2019 to 2020. This is due to the fact that the newly issued recoverables in 2020 are largely offset by fines which were definitively cashed in 2020.
2.6.1.4. Accrued income and deferred charges
EUR million
31.12.2020 31.12.2019
Accrued income 1 755 1 502
Deferred charges relating to non-exchange transactions 293 286
Total 2 048 1 788
Non-current 1 261 –
Current 787 1 788
Accrued income includes EUR 1.7 billion (2019: EUR 1.4 billion) the Commission expects to recover in the area of cohesion as a result of the examination and acceptance of the annual accounts submitted by the Member States (based on the procedure introduced for the programming period 2014-2020). The biggest
part of this amount (EUR 1.3 billion) is expected to be recovered at the closure of the underlying programmes only (as a consequence of the Coronavirus Response Investment Initiative measures) and therefore classified as non-current.
2.6.1.5. Other recoverables
The total amount of other recoverables includes a recoverable of EUR 744 million resulting from the transfer of the unspent NER300 funds to the Innovation Fund not yet recovered from the EIB at the end of 2020 – see note 3.7.
2.6.2. Receivables from exchange transactions
EUR million
31.12.2020 31.12.2019
Non-current
Late payment interest 1 641 1 137
Other receivables 44 48
1 685 1 185
Current
Customers 324 269
Impairment on receivables from customers (188) (153)
Deferred charges relating to exchange transactions 345 238
Late payment interest 1 085 528
Other 200 157
1 766 1 038
Total 3 450 2 223
The non-current late payment interest concerns the infringement case mentioned in note 2.6.1.1.
The Other current receivables relate mainly to late payment interest. The increase from 2019 to 2020
results from additional accrued income stemming from TOR inspection reports and an increase due to accrued interest on guarantees provided by fined companies.

Annual accounts of the European Union 2020
77
2.7. INVENTORIES
EUR million
31.12.2020 31.12.2019
Scientific materials 59 47
Other 21 21
Total 80 68
2.8. CASH AND CASH EQUIVALENTS
EUR million
Note 31.12.2020 31.12.2019
Accounts with Treasuries and Central Banks 11 342 15 519
Current accounts 80 91
Imprest accounts 8 7
Transfers (cash in transit) 0 0
Bank accounts for budget implementation 2.8.1 11 430 15 617
Cash belonging to financial instruments 2.8.2 2 446 1 567
Cash relating to fines 2.8.3 1 458 1 258
Cash relating to other institutions, agencies and bodies 1 362 1 208
Cash relating to trust funds 46 97
Total 16 742 19 745
2.8.1. Bank accounts for budget implementation
This heading covers the funds which the Commission keeps in its bank accounts in each Member State and EFTA country (treasury or central bank), as well as in commercial bank current accounts, imprest accounts and petty cash accounts. The treasury balance at the end of 2020 is driven by the following main elements:
An amount of EUR 9.4 billion of payments not yet implemented at year end, of which EUR 7.9 billion relates to assigned revenues. The assigned revenues include EUR 1.3 billion of cash raised on the sale of emission allowances and recovered from the EIB after being assigned by the
Member States to the Innovation Fund – see note 3.7.
An amount of EUR 1.6 billion belonging to agencies and joint undertakings treasury – as the Commission manages the treasury on behalf of these entities, these amounts are shown under this sub-heading.
2.8.2. Cash belonging to financial instruments
Amounts shown under this heading primarily concern cash equivalents managed by fiduciaries, on behalf of the Commission, for the purpose of implementing particular financial instrument programmes funded by the EU budget and cash and cash equivalents held in the guarantee funds relating to budgetary guarantees – see note 2.4.1. The cash belonging to financial instruments and guarantee funds can only be used by the programmes concerned. The increase of the balance is mainly due to (i) further provisioning of the EFSI and EFSD Guarantee Funds that was not yet invested in bonds at end of 2020 and (ii) payments to the EU financial instruments, in particular under COSME and Horizon 2020
programmes, which have not yet been used for guarantee calls nor for investment in equity.

Annual accounts of the European Union 2020
78
2.8.3. Cash relating to fines
This is mainly cash received in connection with fines issued by the Commission for which the case is still open. These amounts are kept in specific deposit accounts that are not used for any other activities. Where an appeal has been lodged or when it is unknown if an appeal will be made by the other party, the underlying amount is shown as contingent liability in note 4.1.4. Since 2010, all subsequent provisionally cashed fines are managed by the Commission in the BUFI fund and invested in financial instruments
categorised as available for sale (see note 2.4.1). The increase of cash relating to fines at 2020 year-end is due to a higher cash balance held in BUFI as compared to the 2019 year-end as well as definitively received fines to be transferred to the budget.
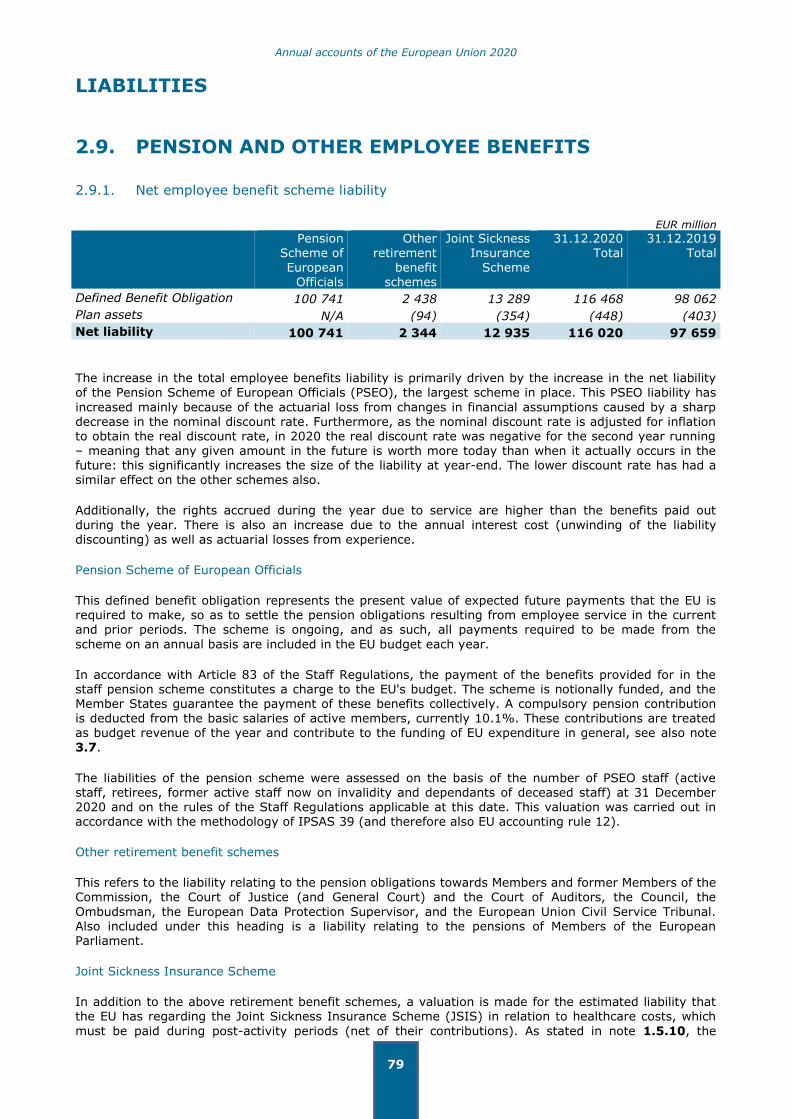
Annual accounts of the European Union 2020
79
LIABILITIES
2.9. PENSION AND OTHER EMPLOYEE BENEFITS
2.9.1. Net employee benefit scheme liability
EUR million
Pension Scheme of European
Officials
Other retirement
benefit schemes
Joint Sickness Insurance
Scheme
31.12.2020 Total
31.12.2019 Total
Defined Benefit Obligation 100 741 2 438 13 289 116 468 98 062
Plan assets N/A (94) (354) (448) (403)
Net liability 100 741 2 344 12 935 116 020 97 659
The increase in the total employee benefits liability is primarily driven by the increase in the net liability of the Pension Scheme of European Officials (PSEO), the largest scheme in place. This PSEO liability has
increased mainly because of the actuarial loss from changes in financial assumptions caused by a sharp decrease in the nominal discount rate. Furthermore, as the nominal discount rate is adjusted for inflation to obtain the real discount rate, in 2020 the real discount rate was negative for the second year running – meaning that any given amount in the future is worth more today than when it actually occurs in the future: this significantly increases the size of the liability at year-end. The lower discount rate has had a similar effect on the other schemes also.
Additionally, the rights accrued during the year due to service are higher than the benefits paid out
during the year. There is also an increase due to the annual interest cost (unwinding of the liability
discounting) as well as actuarial losses from experience.
Pension Scheme of European Officials
This defined benefit obligation represents the present value of expected future payments that the EU is required to make, so as to settle the pension obligations resulting from employee service in the current and prior periods. The scheme is ongoing, and as such, all payments required to be made from the
scheme on an annual basis are included in the EU budget each year.
In accordance with Article 83 of the Staff Regulations, the payment of the benefits provided for in the staff pension scheme constitutes a charge to the EU's budget. The scheme is notionally funded, and the Member States guarantee the payment of these benefits collectively. A compulsory pension contribution is deducted from the basic salaries of active members, currently 10.1%. These contributions are treated as budget revenue of the year and contribute to the funding of EU expenditure in general, see also note 3.7.
The liabilities of the pension scheme were assessed on the basis of the number of PSEO staff (active staff, retirees, former active staff now on invalidity and dependants of deceased staff) at 31 December 2020 and on the rules of the Staff Regulations applicable at this date. This valuation was carried out in accordance with the methodology of IPSAS 39 (and therefore also EU accounting rule 12).
Other retirement benefit schemes
This refers to the liability relating to the pension obligations towards Members and former Members of the Commission, the Court of Justice (and General Court) and the Court of Auditors, the Council, the
Ombudsman, the European Data Protection Supervisor, and the European Union Civil Service Tribunal. Also included under this heading is a liability relating to the pensions of Members of the European Parliament.
Joint Sickness Insurance Scheme
In addition to the above retirement benefit schemes, a valuation is made for the estimated liability that the EU has regarding the Joint Sickness Insurance Scheme (JSIS) in relation to healthcare costs, which
must be paid during post-activity periods (net of their contributions). As stated in note 1.5.10, the

Annual accounts of the European Union 2020
80
calculation of this liability takes account of the full active service period, ensuring that both the pension
and the sickness insurance schemes of the staff’s post-employment plan are accounted for consistently.
Taking into account the obligation to faithfully present the economic substance of the underlying situation as required by both EAR and IPSAS, we have not interpreted IPSAS 39 in a stricter sense when attributing the benefits to the periods of service. If one were to accrue the service cost for the JSIS scheme fully over 10 years for all officials, as opposed to the period of active service of the employee, the impact of such an approach on the defined benefit obligation at year-end would be an increase of
EUR 4.6 billion. However, as already indicated, this stricter approach would not be compatible with the qualitative characteristic of faithful representation, and thus would not be deemed to provide reliable information in accordance with EAR 1 and the IPSAS Conceptual Framework. This estimate is highly sensitive to the evolution of current staff administrative status (in particular, the number of fixed-term contract members assumed to become officials in the future).
2.9.2. Movement in present value of employee benefits defined benefit obligation
The present value of the defined benefit obligation is the discounted expected future payments required to settle the obligation resulting from employee service in the current and prior periods.
An analysis of the current year movement in the defined benefit obligation is presented below:
EUR million
Pension Scheme
of European
Officials
Other retirement
benefit schemes
Joint Sickness Insurance
Scheme
Total
Present value as at 31.12.2019 83 842 2 149 12 071 98 062
Recognised in statement of financial performance
Current Service Cost 3 441 97 348 3 886
Interest cost 919 17 145 1 081
Past Service Cost – – – –
Recognised in net assets
Remeasurements in employee benefits
liabilities
Actuarial (gains)/losses from experience
2 348 (7) (141) 2 200
Actuarial (gains)/losses from demographic assumptions
– (3) – (3)
Actuarial (gains)/losses from financial assumptions
11 896 259 964 13 119
Other
Benefits paid (1 706) (75) (97) (1 878)
Present value as at 31.12.2020 100 741 2 438 13 289 116 468
Current service cost is the increase in the present value of the defined benefit obligation arising from current members' service in the current year. Interest cost refers to the increase during the period in the present value of the defined benefit obligation because the benefits are one period closer to settlement.
Actuarial gains and losses from experience refer to the effects of differences between what was expected according to the assumptions made last year for 2020 and what really occurred in 2020. Actuarial gains and losses from actuarial assumptions (demographic variables such as employee turnover and mortality and financial variables such as discount rates and expected salary increases) arise where these assumptions are updated in order to reflect changes in underlying conditions.
Benefits (for example, pensions or medical cost reimbursements) are paid during the year according to the rules of the scheme. These benefits paid lead to a decrease in the defined benefit obligation.

Annual accounts of the European Union 2020
81
2.9.3. Plan assets
EUR million
Other retirement benefit schemes
Joint Sickness Insurance Scheme
Total
Present value as at 31.12.2019 94 309 403
Net movement in plan assets 0 45 45
Present value as at 31.12.2020 94 354 448
2.9.4. Actuarial assumptions – employee benefits
The principal actuarial assumptions used in the valuation of the two main employee benefit schemes of the EU are shown below:
Pension Scheme of European Officials
Joint Sickness Insurance Scheme
2020
Nominal discount rate 0.4% 0.5%
Expected inflation rate 1.2% 1.3%
Real discount rate (0.8)% (0.8)%
Expected rate of salary increases 1.8% 1.8%
Medical cost trend rates N/A 2.6%
Retirement age 63/64/66 63/64/66
2019
Nominal discount rate 1.1% 1.2%
Expected inflation rate 1.3% 1.3%
Real discount rate (0.2)% (0.1)%
Expected rate of salary increases 1.8% 1.8%
Medical cost trend rates N/A 3.0%
Retirement age 63/64/66 63/64/66
Mortality rates for 2019 and 2020 are based on the EU Civil Servants Life Table – EULT 2018.
The nominal discount rate is determined as the value of the Euro zero-coupon yield (with a maturity of 23 years as of December 2020 for the PSEO, and 27 years for the Joint Sickness Insurance Scheme). The
inflation rate used is the expected inflation rate over the equivalent period. It must be determined empirically, based on prospective values as expressed by index-linked bonds on the European financial markets. The real discount rate is calculated from the nominal discount rate and the expected long-term inflation rate.
A decrease in the real discount rate, i.e. the difference between the nominal discount rate and the
expected inflation rate was particularly steep in 2019 and continued in 2020. The decrease in the real discount rate is mainly due to the decline in the nominal discount rate, which is in line with the
continuous trend observed globally on the financial markets. The decline in the nominal discount rate was not sufficiently counterbalanced by changes in the inflation rate assumption. This was translated into a significant decrease in the real discount rate, thus continuing the negative trend and contributing to the significant actuarial loss from financial assumptions.
As in the case of the PSEO, the increase in the JSIS liability was mainly driven by the continued decrease in the real discount rate, though the effect was partly counterbalanced by the update of the assumed
annual increase of the medical costs, which is a key assumption in the context of medical schemes. In the 2020 exercise, the projected trend of medical costs has been derived on a much longer series of data covering the periods 2005 to 2019, thus ensuring greater consistency with the duration of the scheme and a more accurate estimation of the expected future trend of medical costs. Due to the exceptional circumstances of the COVID-19 pandemic, and to avoid the risk of bias in the estimate, the year 2020 has been excluded from the time series.

Annual accounts of the European Union 2020
82
2.9.5. Sensitivity analyses
The sensitivity analysis is based on simulations, which change, everything else being equal, the value of the concerned assumptions.
Pension Scheme of European Officials sensitivity
A ten basis point (0.1%) change in the assumed discount rate would have the following effects:
EUR million
2020 2019
Increase 0.1% Decrease 0.1% Increase 0.1% Decrease 0.1%
Defined benefit obligation (2 247) 2 319 (1 797) 1 854
A ten basis point (0.1%) change in expected salary increases would have the following effects:
EUR million
2020 2019
Increase 0.1% Decrease 0.1% Increase 0.1% Decrease 0.1%
Defined benefit obligation 2 206 (2 143) 1 774 (1 724)
A one-year change in assumed retirement age would have the following effects:
EUR million
2020 2019
One year increase One year decrease One year increase One year decrease
Defined benefit obligation (1 104) 1 417 (620) 771
Joint Sickness Insurance Scheme sensitivity
A ten basis point change in assumed medical cost trend rates would have the following effects:
EUR million
2020 2019
Increase 0.1% Decrease 0.1% Increase 0.1% Decrease 0.1%
The aggregate of the current service cost and interest cost
components of net periodic post-employment medical costs
15 (14) 8 (8)
Defined benefit obligation 397 (385) 352 (341)
A ten basis point (0.1%) change in the assumed discount rate would have the following effects:
EUR million
2020 2019
Increase 0.1% Decrease 0.1% Increase 0.1% Decrease 0.1%
Defined benefit obligation (348) 361 (311) 322
A ten basis point (0.1%) change in expected salary increases would have the following effects:
EUR million
2020 2019
Increase 0.1% Decrease 0.1% Increase 0.1% Decrease 0.1%
Defined benefit obligation (38) 37 (30) 29
A one-year change in assumed retirement age would have the following effects:
EUR million
2020 2019
One year increase One year decrease One year increase One year decrease
Defined benefit obligation (401) 421 (363) 383
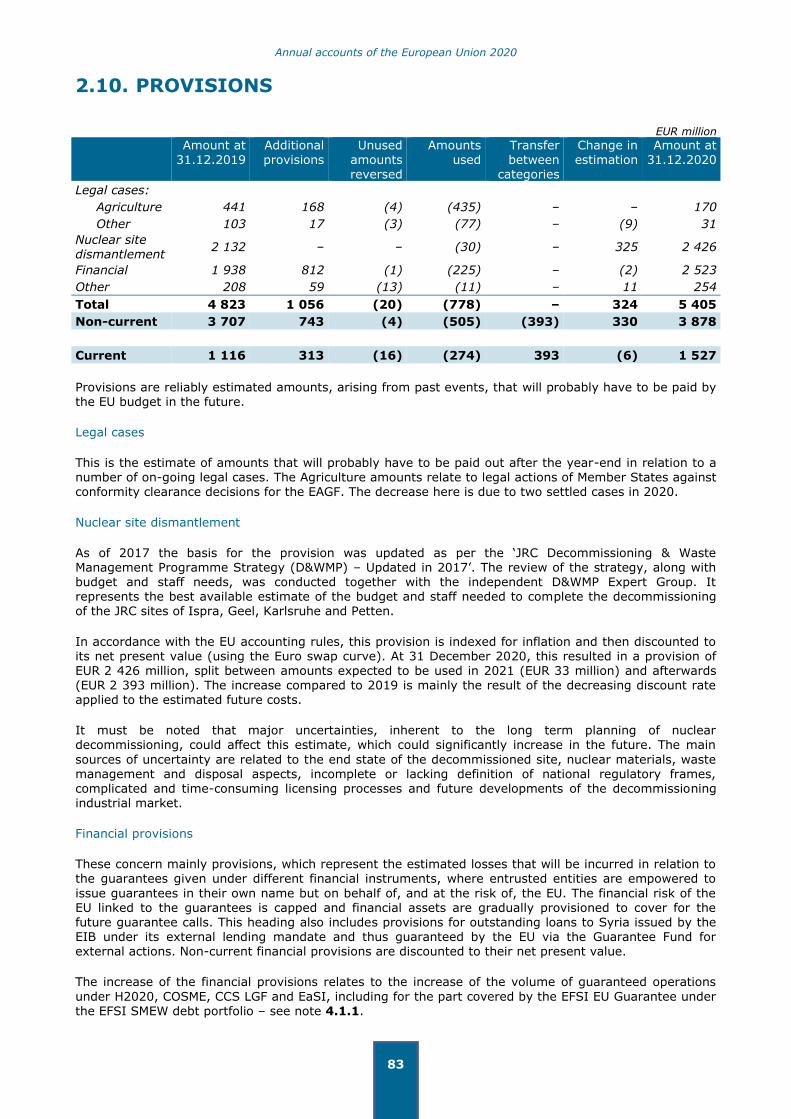
Annual accounts of the European Union 2020
83
2.10. PROVISIONS
EUR million
Amount at
31.12.2019 Additional provisions
Unused amounts reversed
Amounts used
Transfer between
categories
Change in estimation
Amount at 31.12.2020
Legal cases:
Agriculture 441 168 (4) (435) – – 170
Other 103 17 (3) (77) – (9) 31
Nuclear site dismantlement
2 132 – – (30) – 325 2 426
Financial 1 938 812 (1) (225) – (2) 2 523
Other 208 59 (13) (11) – 11 254
Total 4 823 1 056 (20) (778) – 324 5 405
Non-current 3 707 743 (4) (505) (393) 330 3 878
Current 1 116 313 (16) (274) 393 (6) 1 527
Provisions are reliably estimated amounts, arising from past events, that will probably have to be paid by the EU budget in the future.
Legal cases
This is the estimate of amounts that will probably have to be paid out after the year-end in relation to a number of on-going legal cases. The Agriculture amounts relate to legal actions of Member States against conformity clearance decisions for the EAGF. The decrease here is due to two settled cases in 2020.
Nuclear site dismantlement
As of 2017 the basis for the provision was updated as per the ‘JRC Decommissioning & Waste Management Programme Strategy (D&WMP) – Updated in 2017’. The review of the strategy, along with budget and staff needs, was conducted together with the independent D&WMP Expert Group. It represents the best available estimate of the budget and staff needed to complete the decommissioning of the JRC sites of Ispra, Geel, Karlsruhe and Petten.
In accordance with the EU accounting rules, this provision is indexed for inflation and then discounted to its net present value (using the Euro swap curve). At 31 December 2020, this resulted in a provision of EUR 2 426 million, split between amounts expected to be used in 2021 (EUR 33 million) and afterwards (EUR 2 393 million). The increase compared to 2019 is mainly the result of the decreasing discount rate applied to the estimated future costs.
It must be noted that major uncertainties, inherent to the long term planning of nuclear decommissioning, could affect this estimate, which could significantly increase in the future. The main
sources of uncertainty are related to the end state of the decommissioned site, nuclear materials, waste management and disposal aspects, incomplete or lacking definition of national regulatory frames, complicated and time-consuming licensing processes and future developments of the decommissioning industrial market.
Financial provisions
These concern mainly provisions, which represent the estimated losses that will be incurred in relation to the guarantees given under different financial instruments, where entrusted entities are empowered to
issue guarantees in their own name but on behalf of, and at the risk of, the EU. The financial risk of the EU linked to the guarantees is capped and financial assets are gradually provisioned to cover for the future guarantee calls. This heading also includes provisions for outstanding loans to Syria issued by the EIB under its external lending mandate and thus guaranteed by the EU via the Guarantee Fund for external actions. Non-current financial provisions are discounted to their net present value.
The increase of the financial provisions relates to the increase of the volume of guaranteed operations
under H2020, COSME, CCS LGF and EaSI, including for the part covered by the EFSI EU Guarantee under the EFSI SMEW debt portfolio – see note 4.1.1.

Annual accounts of the European Union 2020
84
2.11. FINANCIAL LIABILITIES
EUR million
Note 31.12.2020 31.12.2019
Non-current
Financial liabilities at amortised cost 2.11.1 84 395 53 062
Financial liabilities at fair value through surplus or deficit 2.11.2 4 9
84 399 53 071
Current
Financial liabilities at amortised cost 2.11.1 10 559 1 423
Financial liabilities at fair value through surplus or deficit 2.11.2 0 4
Financial guarantee liabilities 2.11.3 90 20
10 649 1 446
Total 95 048 54 517
2.11.1. Financial liabilities at amortised cost
EUR million
Note 31.12.2020 31.12.2019
Borrowings for financial assistance 2.11.1.1 93 192 52 564
Other financial liabilities 2.11.1.2 1 761 1 921
Total 94 954 54 485
Non-Current 84 395 53 062
Current 10 559 1 423
2.11.1.1. Borrowings for financial assistance
EUR million
EFSM SURE BOP MFA Euratom Total
Total at 31.12.2019 47 394 – 201 4 754 214 52 564
New loans – 39 500 – 1 675 100 41 275
Repayments – – – (617) (35) (651)
Exchange differences – – – – – –
Changes in carrying amount 2 3 0 0 (0) 5
Total at 31.12.2020 47 396 39 503 201 5 813 279 93 192
Non-current 37 050 39 500 200 5 783 250 82 782
Current 10 346 3 1 30 29 10 410
Borrowings mainly include debts evidenced by certificates amounting to EUR 92 415 million (2019: EUR 52 433 million). The changes in carrying amount correspond to the change in accrued interests.
The repayment of the above borrowings are ultimately guaranteed by the EU budget – see note 4.1.2, and by extension by each Member State.

Annual accounts of the European Union 2020
85
Borrowings effective interest rates (expressed as a range of interest rates)
31.12.2020 31.12.2019
European Financial Stabilisation Mechanism (EFSM) 0.50% - 3.75% 0.50% - 3.75%
Support to mitigate Unemployment Risks in an Emergency (SURE)
0.00% - 0.30% –
Balance of Payment (BOP) 2.88% 2.88%
Macro Financial Assistance (MFA) 0.00% - 3.69% 0.00% - 3.82%
Euratom 0.00% - 5.68% 0.00% - 5.68%
2.11.1.2. Other financial liabilities
EUR million
31.12.2020 31.12.2019
Non-current
Finance lease liabilities 1 130 1 244
Buildings paid for in instalments 346 385
Other 136 144
1 612 1 772
Current
Finance lease liabilities 101 97
Buildings paid for in instalments 38 36
Fines to be reimbursed 8 –
Other 2 17
149 149
Total 1 761 1 921
Finance lease liabilities
EUR million
Future amounts to be paid
< 1 year 1-5 years > 5 years Total
Liability
Land and buildings 96 457 665 1 218
Other fixed assets 5 8 – 13
Total at 31.12.2020 101 465 665 1 231
Interest element 50 170 124 345
Total future minimum lease payments at
31.12.2020 151 636 790 1 576
Total future minimum lease payments at 31.12.2019
150 644 946 1 741
The lease and building related amounts above will have to be funded by future budgets.

Annual accounts of the European Union 2020
86
2.11.2. Financial liabilities at fair value through surplus or deficit
EUR million
Type of derivative
31.12.2020 31.12.2019
Notional
amount Fair value
Notional
amount Fair value
Guarantee on equity portfolio 215 1 752 10
FX option (put spread) 14 4 13 2
Total 229 4 765 12
Non-current 229 4 148 9
Current 0 0 617 4
Guarantees on equity portfolios
Guarantees given on equity portfolios are classified as financial liabilities at fair value through surplus or deficit, since they do not meet the definition of a financial guarantee liability – see note 1.5.12. The EU financial liability is measured based on the value of the underlying investments.
Foreign exchange option
As at 31 December 2020 the EU holds a derivative financial instrument (Foreign exchange option – put spread type of option) in which it covers the devaluation of the foreign exchange currency (UHA) related
to loans given by financial institutions to SMEs in Ukraine so as to enhance the access to financing, as well as the attractiveness of the loan conditions in Ukraine. Under the terms of the contract, the EU provides its partners with an option to call, for each eligible loan, up to a maximum of 30%, for an EU contribution in the case of devaluation of the ratio UHA/EUR.
Fair value hierarchy of financial liabilities measured at fair value
EUR million
31.12.2020 31.12.2019
Level 1: Quoted prices in active markets – –
Level 2: Observable inputs other than quoted prices 4 2
Level 3: Valuation techniques with inputs not based on
observable market data 1 10
Total 4 12
2.11.3. Financial guarantee liabilities
The EFSI guarantee on the debt portfolio disbursed by the EIB under the EFSI Innovation and Infrastructure window (IIW), as well as the External Lending Mandate (ELM) guarantee for the EIB loans
disbursed under the EIB Resilience Initiative (ERI) are classified as a financial guarantee liability. At 31 December 2020, the EFSI financial guarantee liability totals EUR zero (2019: EUR zero), as the revenues to be received under this guarantee exceed expected losses, while the ELM ERI financial guarantee liability amounts to EUR 90 million (2019: EUR 20 million) – see note 4.1.1.

Annual accounts of the European Union 2020
87
2.12. PAYABLES
EUR million
Gross
Amount Adjustments
Net Amount at 31.12.2020
Gross Amount
Adjustments Net Amount
at 31.12.2019 Cost claims and invoices received from:
Member States
EAFRD & other rural development instruments
17 (0) 17 21 (0) 21
ERDF & CF 12 651 (2 698) 9 954 8 068 (2 437) 5 631
ESF 3 479 (370) 3 109 2 882 (558) 2 325
Other 792 (90) 701 852 (45) 807
Private and public entities 1 485 (182) 1 302 1 562 (180) 1 381
Total cost claims and invoices received
18 424 (3 341) 15 083 13 384 (3 220) 10 165
EAGF 16 160 N/A 16 160 16 255 N/A 16 255
Sundry payables 784 N/A 784 539 N/A 539
Other 381 N/A 381 283 N/A 283
Total 35 748 (3 341) 32 408 30 462 (3 220) 27 241
Payables include invoices and cost claims received but not yet paid at year-end. They are initially recognised at the time of the reception of the invoices / cost claims for the requested amounts. The payables are subsequently adjusted to reflect only the amounts accepted following review of costs, and the amounts estimated to be eligible. The amounts estimated to be non-eligible are included in the column ‘Adjustments’; the largest amounts concern the structural actions.
In the 2014-2020 programming period, the Common Provisions Regulation 2013/1303 (CPR) applicable
to the Structural Funds (ERDF and ESF), the Cohesion Fund and to the European Maritime and Fisheries
Fund (EMFF) foresees that the EU budget is protected by means of a systematic retention of 10% of the interim payments made. By February following the end of the CPR accounting year (1 July - 30 June), the control cycle is complete, both through management verifications by the managing authorities and audits by the audit authorities. The Commission examines the assurance documents and the accounts provided by the relevant authorities in the Member States. The payment / recovery of the final balance is made only after this assessment is finalised and the accounts are accepted. The amount retained according to
this provision at end 2020 totalled EUR 7.8 billion. A part of this amount (EUR 1.1 billion) is estimated as being non-eligible on the basis of the information provided by the Member States in their accounts and is also included in the column ‘Adjustments’. The final component of the adjustments to the payables is represented by the amounts corresponding to other advances to Member States (see note 2.5.2) still to be paid at year-end (EUR 1.3 billion).
The increase in amounts payable concerning cohesion policy (ERDF, CF, ESF) is mainly due to the cost claims received towards the end of 2020 (EUR 5.9 billion) which had not yet been paid due to a lack of
credits. In general, the higher level of cost claims reflects the progress of implementation in this area.
Requests for pre-financing
In addition to the above amounts, at the end of 2020, EUR 1.4 billion of requests for pre-financing have been received and were not yet paid at year-end. According to the EU accounting rules, these amounts are not booked as payables.
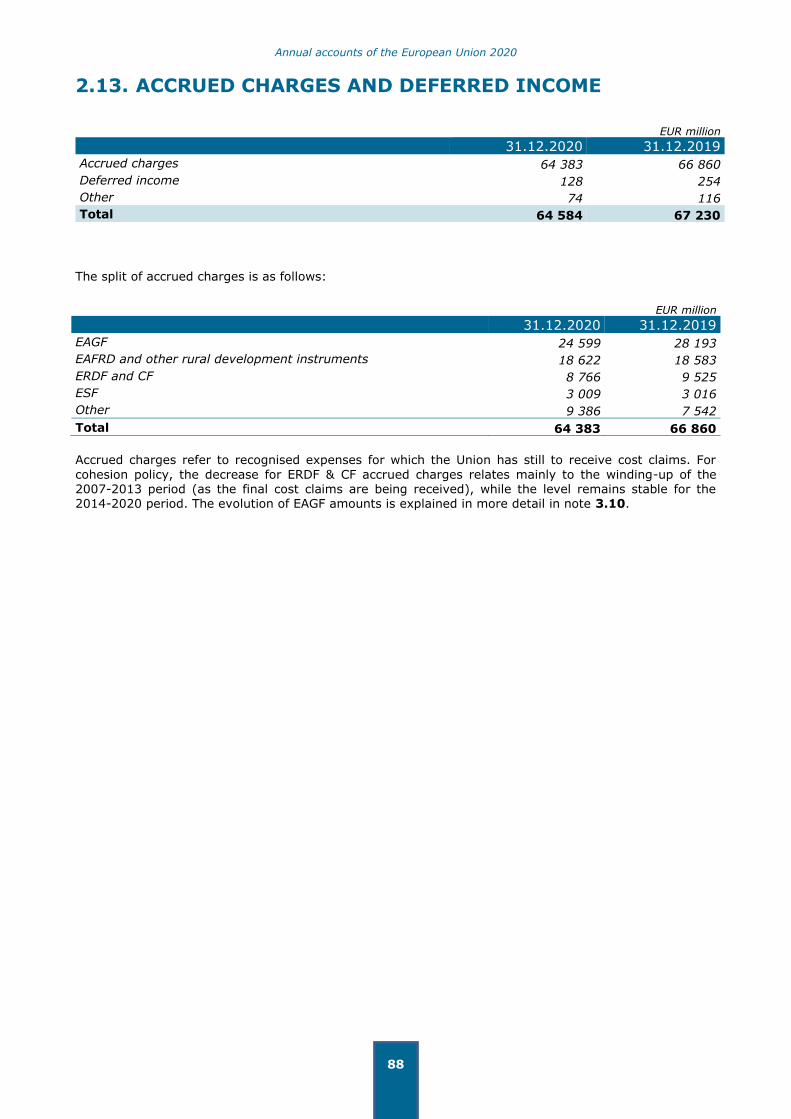
Annual accounts of the European Union 2020
88
2.13. ACCRUED CHARGES AND DEFERRED INCOME
EUR million
31.12.2020 31.12.2019
Accrued charges 64 383 66 860
Deferred income 128 254
Other 74 116
Total 64 584 67 230
The split of accrued charges is as follows:
EUR million
31.12.2020 31.12.2019
EAGF 24 599 28 193
EAFRD and other rural development instruments 18 622 18 583
ERDF and CF 8 766 9 525
ESF 3 009 3 016
Other 9 386 7 542
Total 64 383 66 860
Accrued charges refer to recognised expenses for which the Union has still to receive cost claims. For
cohesion policy, the decrease for ERDF & CF accrued charges relates mainly to the winding-up of the 2007-2013 period (as the final cost claims are being received), while the level remains stable for the 2014-2020 period. The evolution of EAGF amounts is explained in more detail in note 3.10.

Annual accounts of the European Union 2020
89
NET ASSETS
2.14. RESERVES
EUR million
Note 31.12.2020 31.12.2019
Fair value reserve 2.14.1 496 391
Guarantee Fund reserve 2.14.2 3 043 2 870
Other reserves 2.14.3 1 523 1 776
Total 5 062 5 037
2.14.1. Fair value reserve
In accordance with the EU accounting rules, the adjustment to fair value of available for sale financial assets is accounted for through the fair value reserve.
Movements of the fair value reserve during the period
EUR million
31.12.2020 31.12.2019
Included in fair value reserve 89 200
Included in the statement of financial performance 16 (40)
Total 105 160
2.14.2. Guarantee Fund reserve
This reserve reflects the 9% target amount of the outstanding amounts guaranteed by the EU budget under the EIB external lending mandate, that is required to be kept as assets in the Guarantee Fund for
external actions – see note 2.4.1.
2.14.3. Other reserves
The amount relates primarily to the reserves of the ECSC in Liquidation (EUR 1 275 million) for the assets of the Research Fund for Coal and Steel, which were created in the context of the winding-up of the ECSC i.L.
2.15. AMOUNTS TO BE CALLED FROM MEMBER STATES
EUR million
Amounts to be called from Member States at 31.12.2019 77 560
Return of budget surplus to Member States 3 218
Movement in Guarantee Fund reserve 173
Remeasurements of employee benefits liabilities 15 155
Other reserve movements (210)
Economic result of the year (57 416)
Total amounts to be called from Member States at 31.12.2020 38 480
This amount represents that part of the expenses incurred by the EU up to 31 December that must be funded by future budgets. Many expenses are recognised under accrual accounting rules in the year N although they may be actually paid in year N+1 (or later) and therefore funded using the budget of year N+1 (or later). The inclusion in the accounts of these liabilities coupled with the fact that the corresponding amounts are financed from future budgets, results in liabilities greatly exceeding assets at

Annual accounts of the European Union 2020
90
the year-end. The most significant amounts to be highlighted concern the EAGF activities and employee
benefit liabilities.
It should also be noted that the above has no effect on the budget result – budget revenue should always equal or exceed budget expenditure and any excess of revenue is returned to Member States.
The remeasurements of employee benefits liabilities relate to actuarial gains and losses arising from the actuarial valuation of these liabilities.
The considerable decrease of the amounts to be called from Member States is primarily due to the revenue related to the net amounts owed by the UK under the WA signed following its departure from the Union in 2020 – see note 2.6.1.2.

Annual accounts of the European Union 2020
91
3. NOTES TO THE STATEMENT OF FINANCIAL
PERFORMANCE
REVENUE
REVENUE FROM NON-EXCHANGE TRANSACTIONS: OWN RESOURCES
3.1. GNI RESOURCES
Own resources revenue is the primary element of the EU's operational revenue. GNI (gross national income) revenue amounts to EUR 125 393 million for 2020 (2019: EUR 108 820 million) and is the most
significant of the three categories of own resources. A uniform percentage is levied on the GNI of each Member State. The GNI revenue balances revenue and expenditure i.e. funds the part of the budget that is not covered by other sources of income. The increase of GNI revenue reflects the increase in payment appropriation needs for the year 2020, meant to reinforce key EU policies. In 2020, these key policies
included the COVID-19 vaccines strategy (through Emergency Support Instrument – ESI) and the Coronavirus Response Investment Initiative Plus, CRII+.
3.2. TRADITIONAL OWN RESOURCES
Traditional own resources relate mainly to customs duties where Member States retain, by way of collection costs, 20% of the amounts, so the above figures are net of this deduction. The decrease in customs duties is primarily due to lower collections due to the economic crisis.
3.3. VAT RESOURCES
The VAT resource was the first to be largely harmonised at the EU level. The VAT contribution is calculated by applying a uniform call rate of 0.3% to the national VAT base, which cannot exceed 50% of the gross national income (GNI) of each Member State. For the period 2014-2020, the Council Decision 2014/335/EU, Euratom, foresees a reduced rate of call of 0.15% for Germany, the Netherlands and
Sweden.
REVENUE FROM NON-EXCHANGE TRANSACTIONS: TRANSFERS
3.4. FINES
Revenue of EUR 452 million (2019: EUR 4 291 million) relates to fines the Commission has imposed on companies for breaches of EU competition rules and fines the Commission has imposed on Member States for infringements of EU law. The Commission recognises revenue from fines when it adopts the
decision to impose a fine and it officially notifies the addressee. The amounts relate mainly to competition fines (EUR 370 million). The biggest cases concern breaches of EU antitrust rules, i.e. a fine imposed on companies Orbia, Clariant and Celanese for a total amount of EUR 260 million for taking part in a cartel concerning purchases on the ethylene merchant market, along with fines imposed on the pharmaceutical companies Teva and Cephalon for an amount of EUR 60 million for agreeing to delay the market entry of a cheaper generic version of Cephalon’s sleep disorder medicine.

Annual accounts of the European Union 2020
92
3.5. RECOVERY OF EXPENSES
EUR million
2020 2019
Shared management 1 281 2 547
Direct management 53 65
Indirect management 21 16
Total 1 355 2 627
This heading mainly represents the recovery orders issued by the Commission that are cashed or offset against (i.e. deducted from) subsequent payments recorded in the Commission's accounting system. The recovery orders are issued so as to recover expenditure previously paid out from the EU budget. Recoveries are based on controls, audits or eligibility analysis and therefore, these operations protect the EU budget from expenditure incurred in breach of law.
Recovery orders issued by Member States to beneficiaries of EAGF expenditure, as well as the variation of accrued income estimations from the previous year-end to the current year-end, are also included.
The amounts included in the above table represent revenue earned through the issuance of recovery orders. For this reason, these figures cannot and do not show the full extent of the measures taken to protect the EU budget, particularly for cohesion policy where specific mechanisms are in place to ensure the correction of ineligible expenditure, most of which do not involve the issuance of a recovery order. Not included are amounts recovered through offsetting with expenses, amounts recovered by way of
withdrawals and recoveries of pre-financing amounts.
Shared management recoveries make up the bulk of the total:
Agriculture: EAGF and rural development
In the framework of the EAGF and the EAFRD, amounts accounted for as revenue of the year under this heading are financial corrections of the year and reimbursements declared by Member States and recovered during the year, as well as the net increase in the outstanding amounts declared by Member States to be recovered at year-end concerning fraud and irregularities.
Cohesion policy
The main amounts related to cohesion policy correspond to accrued income of EUR 0.4 billion (2019: EUR 1.4 billion) that the Commission expects to recover from the Member States. The recovery will be made as a result of the examination and acceptance of the annual accounts submitted by the Member States in early 2021. The amounts to be recovered represent essentially the difference between amounts initially declared as eligible during the accounting year and the amounts confirmed as eligible in the annual
accounts of the Member States. A low amount means that the controls in place at Member State level enabled the detection of ineligible amounts early in the process.
3.6. UK WITHDRAWAL AGREEMENT
This revenue relates to the net amounts owed by the UK under the WA signed following its departure from the Union in 2020 – see note 2.6.1.2.

Annual accounts of the European Union 2020
93
3.7. OTHER REVENUE FROM NON-EXCHANGE
TRANSACTIONS
EUR million
2020 2019
Contributions from Member States for the Innovation Fund 2 080 –
Staff taxes and contributions 1 316 1 299
Contributions from third countries 1 592 1 509
Contributions from Member States for ESI and external aid 1 073 331
Transfer of assets 317 60
Budgetary adjustments 214 (1 719)
Other 524 592
Total 7 116 2 072
Contributions from Member States to the Innovation Fund are revenues relating to the sale of emission allowances (EUR 1 334 million) and the transfer of the unspent NER300 funds (EUR 747 million) that are to be used to support innovation in low-carbon technologies. The EIB is entrusted with the monetisation of the allowances and with the management of the NER300 funds on behalf of the Member States. At year-end, EUR 1 336 million out of the total EUR 2 080 million has been transferred by the EIB to the Commission and is included as cash (net of the amount spent in 2020) – see note 2.8.1. The remaining revenue of EUR 744 million has not yet been recovered at the end of 2020 and is therefore recognised as
a non-exchange recoverable – see note 2.6.1.5.
Staff taxes and contributions revenue relate primarily to the deductions from staff salaries. Retirement contributions and income tax represent the substantial amounts within the category.
Contributions from third countries are mainly contributions from EFTA countries and pre-accession countries (EUR 1 293 million) as well as financial contributions of third states to the H2020 (EUR 297
million).
The Member States have contributed EUR 750 million as a top-up to the Emergency Support Instrument (ESI), as well as EUR 265 million to finance the Facility for Refugees in Turkey.
Transfer of assets revenue relates mainly to the transfer of satellite 6A under the Copernicus programme from the European Space Agency (ESA) to the Commission – see note 2.2. This transfer is a non-exchange transaction according to the EU accounting rules.
The increase in budgetary adjustments is mainly driven by the increase of the budget surplus taken in from the previous year, which amounted to EUR 3 218 million in 2020 as compared to EUR 1 803 million
in 2019. The budget surplus was counterbalanced by the annual adjustment of VAT and GNI, which amounted to EUR 3 165 million in 2020 as compared to EUR 3 443 million in 2019.
Other revenue from non-exchange transactions includes the ITER Host State and Membership contributions to Fusion for Energy, the European Joint Undertaking for ITER and the Development of Fusion Energy (EUR 156 million).

Annual accounts of the European Union 2020
94
REVENUE FROM EXCHANGE TRANSACTIONS
3.8. FINANCIAL REVENUE
EUR million
2020 2019
Interest on:
Late payments 1 129 133
Loans 1 167 1 180
Other 63 70
Issue premiums 674 2
Premium on financial guarantee liability 258 193
Dividends 22 29
Financial revenue from financial assets or liabilities at fair value through surplus or deficit
70 125
Realised gains on available for sale financial assets 48 82
Other 3 2
Total 3 434 1 817
Interest revenue on late payments stems mainly from fines and own resources contributions due and not
paid on time. The main amounts concern the infringement case referred to in note 2.6.1.1 (EUR 0.5 billion) and revenue estimated for a case against Netherlands for evading anti-dumping duties on solar panels (EUR 0.3 billion).
Interest revenue on loans relates mainly to loans granted for financial assistance – see note 2.4.3.
The issue premiums of EUR 674 million relate primarily to the issuance of SURE borrowings, for which
proceeds were received above the nominal value of the bonds issued. Those revenues were passed on to the Member States benefitting from the assistance programmes, leading to a recognition of
EUR 672 million of financial expenses – see note 3.14.
Premium on financial guarantee liability relates primarily to the risk-sharing revenues received from the EIB in relation to the EFSI guarantee on the EFSI IIW debt portfolio – see note 2.11.3.
3.9. OTHER REVENUE FROM EXCHANGE TRANSACTIONS
EUR million
2020 2019
Fee revenue for rendering of services (agencies) 640 592
Foreign exchange gains 370 347
Sales of goods 48 31
Share of net result of EIF 38 53
Fee and premium revenue related to financial instruments 34 43
Fixed assets related revenue 5 5
Other 269 227
Total 1 404 1 298
Fee revenue for rendering of services mainly includes marketing authorisation fees charged by the European Medicines Agency and trademark fees collected by the European Union Intellectual Property
Office.

Annual accounts of the European Union 2020
95
EXPENSES
3.10. SHARED MANAGEMENT
EUR million
Implemented by Member States 2020 2019
European Agricultural Guarantee Fund 40 461 43 951
European Agricultural Fund for Rural Development and other rural development instruments
14 467 13 541
European Regional Development Fund and Cohesion Fund 41 118 35 178
European Social Fund 13 677 11 218
Other 2 701 2 608
Total 112 425 106 495
The increase mainly concerns cohesion policy (ERDF, CF) where almost all expenses relate to the 2014-2020 programming period, where the activities continue to advance.
Other expenses mainly include: Asylum and Migration (EUR 0.6 billion), Fund for European Aid to the
Most Deprived (EUR 0.6 billion), Internal Security (EUR 0.5 billion), European Union Solidarity Fund (EUR 0.3 billion) and European Maritime and Fisheries Fund (EUR 0.6 billion).
The evolution of EAGF amounts is mostly related to the reduction in amounts claimed for direct payments, mainly because there are no agricultural direct payments for the UK farmers for claim year 2020 (decrease of EUR 2.6 billion compared to previous year).
3.11. DIRECT MANAGEMENT
EUR million
2020 2019
Implemented by the Commission 11 429 8 435
Implemented by EU Executive Agencies 10 029 10 095
Implemented by Trust funds 636 412
Total 22 094 18 942
These amounts mainly concern the implementation of Research Policy (EUR 7.2 billion), Transport Infrastructure Policy (EUR 3.9 billion), Development Co-operation Instrument (EUR 1.6 billion) and European Neighbourhood Policy (EUR 1.8 billion).
The increase in direct management expenses implemented by the Commission relates mainly (EUR 1.6 billion) to the COVID-19 vaccination programmes and to the European Neighbourhood Policy
(EUR 0.6 billion).
3.12. INDIRECT MANAGEMENT
EUR million
2020 2019
Implemented by other EU agencies & bodies 3 530 3 131
Implemented by third countries 559 637
Implemented by international organisations 3 619 3 448
Implemented by other entities 3 257 2 875
Total 10 965 10 091
Under indirect management expenses, EUR 4.2 billion relates to external actions (mainly the areas of pre-accession, humanitarian aid, international co-operation and neighbourhood). A further EUR 5.1 billion is related to increasing Europe's competitiveness (in areas such as research, satellite navigation systems
and education).

Annual accounts of the European Union 2020
96
3.13. STAFF AND PENSION COSTS
EUR million
2020 2019
Staff costs 7 028 6 939
Pension costs 4 967 4 674
Total 11 995 11 613
Pension costs represent elements of the movements that have arisen following the actuarial valuation of the employee benefits liabilities other than those recognised in Net Assets. They do not therefore represent actual pension payments of the year, which are significantly lower.
3.14. FINANCE COSTS
EUR million
2020 2019
Interest expenses:
Borrowings 1 160 1 174
Other 24 23
Issue costs 672 1
Impairment losses on loans and receivables 110 105
Loss on financial assets or liabilities at fair value through surplus or deficit
21 57
Finance leases 62 70
Impairment losses on available for sale financial assets 41 19
Realised loss on available for sale financial assets 5 7
Other 92 34
Total 2 188 1 491
The amount of interest expense on borrowings corresponds mainly to interest income on loans for
financial assistance (back-to-back transactions).
The issue costs of EUR 672 million relate mainly to the SURE programme, for which issue premiums received in relation to the borrowings were passed on to the Member States benefitting from the loans (see also note 3.8).
3.15. OTHER EXPENSES
EUR million
2020 2019
Administrative and IT expenses 1 984 2 154
Adjustment of provisions 1 390 1 294
Fixed assets related expenses 1 319 1 201
Land and buildings management expenses 661 568
Foreign exchange losses 578 343
Operating lease expenses 423 442
Other 593 860
Total 6 946 6 862
Following a more appropriate presentation of the expenses in 2020 (staff, administrative & IT and Land &
Building expenses) the 2019 comparative figures have been adapted accordingly.

Annual accounts of the European Union 2020
97
The aggregate amount of research and development expenditure recognised as an expense during 2020
is as follows:
EUR million
2020 2019
Research costs 402 398
Non-capitalised development costs 118 119
Total 520 517
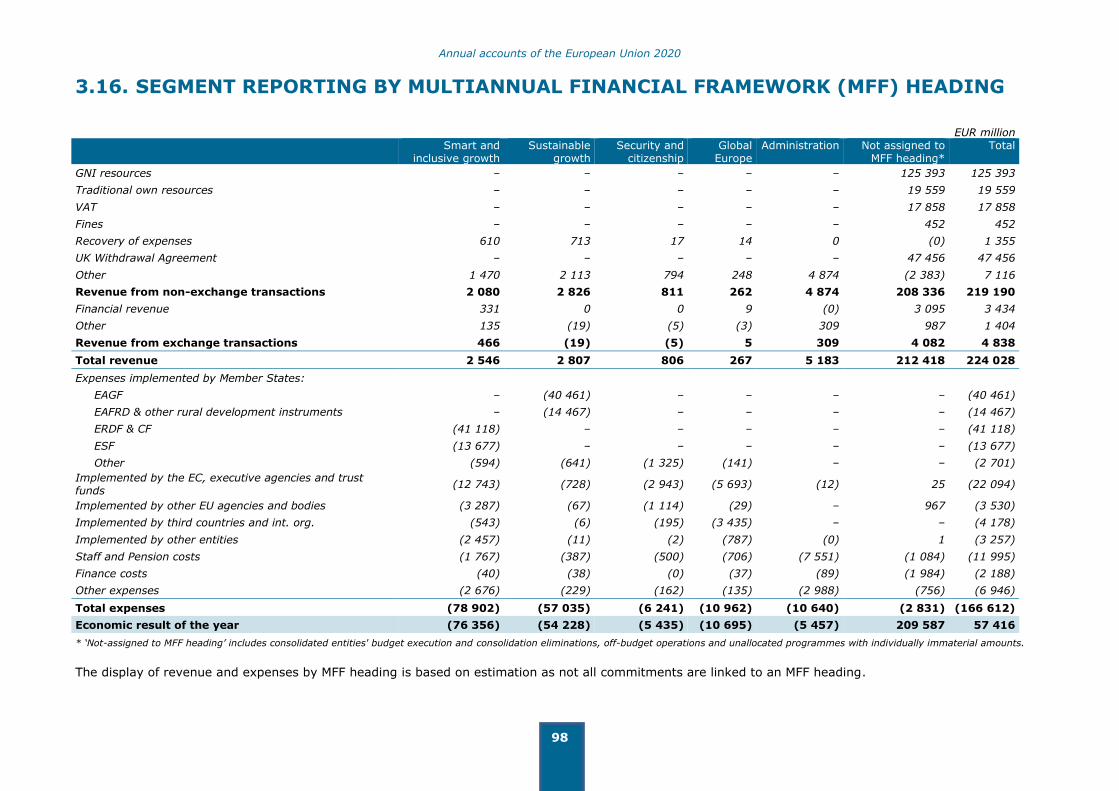
Annual accounts of the European Union 2020
98
3.16. SEGMENT REPORTING BY MULTIANNUAL FINANCIAL FRAMEWORK (MFF) HEADING
EUR million
Smart and
inclusive growth Sustainable
growth Security and
citizenship Global
Europe Administration Not assigned to
MFF heading* Total
GNI resources – – – – – 125 393 125 393
Traditional own resources – – – – – 19 559 19 559
VAT – – – – – 17 858 17 858
Fines – – – – – 452 452
Recovery of expenses 610 713 17 14 0 (0) 1 355
UK Withdrawal Agreement – – – – – 47 456 47 456
Other 1 470 2 113 794 248 4 874 (2 383) 7 116
Revenue from non-exchange transactions 2 080 2 826 811 262 4 874 208 336 219 190
Financial revenue 331 0 0 9 (0) 3 095 3 434
Other 135 (19) (5) (3) 309 987 1 404
Revenue from exchange transactions 466 (19) (5) 5 309 4 082 4 838
Total revenue 2 546 2 807 806 267 5 183 212 418 224 028
Expenses implemented by Member States:
EAGF – (40 461) – – – – (40 461)
EAFRD & other rural development instruments – (14 467) – – – – (14 467)
ERDF & CF (41 118) – – – – – (41 118)
ESF (13 677) – – – – – (13 677)
Other (594) (641) (1 325) (141) – – (2 701)
Implemented by the EC, executive agencies and trust funds
(12 743) (728) (2 943) (5 693) (12) 25 (22 094)
Implemented by other EU agencies and bodies (3 287) (67) (1 114) (29) – 967 (3 530)
Implemented by third countries and int. org. (543) (6) (195) (3 435) – – (4 178)
Implemented by other entities (2 457) (11) (2) (787) (0) 1 (3 257)
Staff and Pension costs (1 767) (387) (500) (706) (7 551) (1 084) (11 995)
Finance costs (40) (38) (0) (37) (89) (1 984) (2 188)
Other expenses (2 676) (229) (162) (135) (2 988) (756) (6 946)
Total expenses (78 902) (57 035) (6 241) (10 962) (10 640) (2 831) (166 612)
Economic result of the year (76 356) (54 228) (5 435) (10 695) (5 457) 209 587 57 416
* ‘Not-assigned to MFF heading’ includes consolidated entities' budget execution and consolidation eliminations, off-budget operations and unallocated programmes with individually immaterial amounts.
The display of revenue and expenses by MFF heading is based on estimation as not all commitments are linked to an MFF heading.

Annual accounts of the European Union 2020
99
4. CONTINGENT LIABILITIES AND ASSETS
4.1. CONTINGENT LIABILITIES
Contingent liabilities are possible future payment obligations for the EU that may arise due to past events or legally binding commitments taken but which will depend on future events not wholly under the
control of the EU. They relate mainly to financial guarantees given (on loans and financial assistance programmes) and to legal risks. All contingent liabilities, except those relating to fines, guarantees and financial instruments up to the level they are covered by funds (see note 2.4.1), would be financed, should they fall due, by the EU budget (and thus the EU Member States) in the years to come.
4.1.1. Budgetary guarantees
EUR million
31.12.2020 31.12.2019
Ceiling Signed Disbursed Ceiling Signed Disbursed
EIB external lending mandate guarantees
35 372 32 530 20 050 37 929 31 521 20 014
EFSI guarantee 25 543 23 831 18 590 25 797 21 889 17 634
EFSD guarantee 1 370 438 34 50 – –
Total 62 285 56 799 38 673 63 775 53 410 37 648
The above table shows the extent of the exposure of the EU budget to possible future payments linked to guarantees given to the EIB group or other financial institutions. Disbursed amounts represent the
amounts already given to final beneficiaries, while signed amounts include these disbursed monies plus agreements already signed with beneficiaries or financial intermediaries but not yet disbursed (EUR 18 126 million). The ceiling represents the total guarantee that the EU budget, and thus its Member States,
have committed to cover, since in order to disclose the maximum exposure faced by the EU at 31 December 2020, one must also include operations authorised to be signed but not yet signed (EUR 5 486 million). The amounts are presented net of financial provisions or financial liabilities recognised for
those programmes.
EIB external lending mandate guarantees
The EU budget guarantees loans signed and granted by the EIB from the EIB's own resources to third countries. At 31 December 2020 the amount of loans outstanding and covered by the EU guarantee totalled EUR 20 050 million (2019: EUR 20 014 million). The EU budget guarantees:
EUR 19 310 million (2019: EUR 19 074 million) via the Guarantee Fund for external actions (see note 2.4.1), and
EUR 740 million (2019: EUR 940 million) directly for loans granted to Member States before accession.
In addition to the EUR 20 050 million disclosed above as disbursed, the EU guarantees a further EUR 113 million of outstanding loans to Syria for which provisions have been made, and EUR 90 million recognised as a financial guarantee liability for the EIB Economic Resilience Initiative (ERI) Private Mandate (see below).
The EU external lending mandate guarantee relating to loans granted by the EIB is limited to 65% of the
outstanding balances for agreements signed after 2007 (mandates 2007-2013 and 2014-2020). For agreements made before 2007, the EU guarantee is limited to a percentage of the ceiling of the credit lines authorised, in most cases 65% but also 70%, 75% or 100%. Where the ceiling is not reached, the EU guarantee covers the full amount.
According to Decision (EU) 2018/412, up to EUR 2.3 billion shall be allocated to the new private sector
lending mandate for projects directed to the long term economic resilience of refugees, migrants, host
and transit communities under the EIB ERI. The EIB disbursed the first ERI Private Mandate operations in 2019. The Union budget is remunerated for the risk taken in relation to guarantees granted for EIB

Annual accounts of the European Union 2020
100
finacing operations under the ERI Private Mandate, hence the ERI Private Mandate guarantee is
accounted for as a financial guarantee liability (see note 2.11.3).
EU guarantee payments are made by the Guarantee Fund for external actions: During 2020, EUR 52 million of guarantee calls have been paid out from the Guarantee Fund for external actions (2019: EUR 55 million).
European Fund for Strategic Investments (EFSI) guarantee
EFSI is an initiative that aims to increase the risk bearing capacity of the EIB Group by enabling the EIB
to extend its investments in the EU. The objective of EFSI is to support additional investments in the EU and access to finance for small companies. The EU budget provides a guarantee of up to EUR 26 billion ('EFSI EU guarantee') under an agreement between the EU and the EIB, hereinafter referred to as 'EFSI Agreement', in order to protect the EIB from potential losses it may suffer from its financing and investment operations.
The EFSI operations are conducted within two windows: the Infrastructure and Innovation Window (IIW) implemented by the EIB (EFSI EU guarantee of EUR 19 250 million) and the SME Window (SMEW)
implemented by the EIF (EFSI EU guarantee of EUR 6 750 million), both of which have a debt portfolio and an equity portfolio. The EIF acts under an agreement with the EIB on the basis of an EIB guarantee, which itself is counter-guaranteed by the EFSI EU Guarantee under the EFSI Agreement.
The EU and the EIB have distinct roles within EFSI. EFSI is established within the EIB, who finance the operations (debt and equity investments) and, to do this, borrow the necessary funds on the capital markets. The EIB Group takes the investment decisions independently and manages the operations in accordance with its rules and procedures. The EU provides the guarantee for those operations, and
covers losses incurred by the EIB up to the ceiling of this guarantee.
In order to ensure that investments made under EFSI remain focused on the specific objective of addressing market failures and that they are eligible for the protection of the EU guarantee, a dedicated governance structure has been put in place, including an Investment Committee of independent experts
which examines each project proposed by the EIB under the IIW regarding its eligibility for the EU guarantee coverage and EFSI Steering Board ensuring an oversight over the programme.
As the control criteria and accounting requirements for consolidation under the EU accounting rules (and IPSAS) are not met, the related guaranteed assets are not accounted for in the consolidated annual accounts of the EU.
The EU guarantee granted to the EIB Group under EFSI is accounted for as a financial guarantee liability in respect of the IIW debt portfolio (see note 2.11.3), as a financial provision for the SMEW debt portfolio (see note 2.10) and as a derivative (financial asset or liability at fair value through surplus or deficit) for both equity portfolios (see note 2.4.2). In addition, a contingent liability related to the EFSI guarantee
given is disclosed in this note. The EFSI contingent liability includes operations of the COSME, H2020, CCS LGF and EaSI programmes for the part covered by the EFSI EU guarantee under SMEW debt portfolio, and is presented net of EUR 290 million of financial provisions recognised for this portfolio, as included under the heading financial provisions in the note 2.10.
EU guarantee payments, not covered by the EU revenues standing in credit on the EFSI settlement account at the EIB, are made by the EFSI Guarantee Fund – see note 2.4.1. During 2020, EUR 1 million of guarantee calls have been paid out from the EFSI Guarantee Fund (2019: EUR zero).
European Fund for Sustainable Development (EFSD)
The European Fund for Sustainable Development, established by the EFSD Regulation, is an initiative aiming to support investments in Africa and the European Neighbourhood as a means to contribute to the achievement of the sustainable development and to address specific socio-economic root causes of migration. Under the EFSD Regulation, the EU should make available guarantees of EUR 1.5 billion (further increased by external contributions) to implementing partners for their investment and financing
operations, in order to reduce their investment risks. The EFSD Guarantee is backed by the EFSD Guarantee Fund – see note 2.4.1. As at 31 December 2020, fifteen EFSD guarantee agreements were
effective with the total guarantee cover limit amounting at EUR 1 370 million (2019: EUR 50 million), while the operations signed by the counterparts and guaranteed by the EU under those agreements totalled EUR 438 million (2019: EUR zero).

Annual accounts of the European Union 2020
101
UK obligations arising from its departure from the EU
In accordance with Article 143 of the Withdrawal Agreement, the UK shall be liable to the Union for its share of contingent financial liabilities related to EFSI, EFSD and the EIB external lending mandate operations approved at the withdrawal date, 31 January 2020. Article 143 requires that in case of a guarantee call for a financial operation that has been approved before the withdrawal date, the UK would be liable to the Union for its share of payments made by the Union under those operations, unless this could be covered by the UK share of provisioning held in the guarantee fund where this is relevant.
For EIB external lending mandate loans (ELM), the value of the EU budgetary guarantee at the withdrawal date, for the operations approved by the withdrawal date, was EUR 33.7 billion. At 31 December 2020 this had changed to EUR 30.9 billion. The UK share of this contingent liability at 31 December 2020 is thus EUR 3.8 billion. As stated above however, any default on these loans is first covered by the guarantee fund for external actions and amounts would only be called from the UK if the UK provisioning for this fund, of EUR 347 million at 31 December 2020, was not sufficient.
With respect to EFSI operations, the value of the EU budgetary guarantee at the withdrawal date, for the
operations approved by the withdrawal date, was EUR 23.5 billion. At 31 December 2020 this had changed to EUR 19.9 billion. The UK share of this contingent liability at 31 December 2020 is thus EUR 2.5 billion. Any guarantee calls under EFSI are first covered by the EFSI guarantee fund and amounts would only be called from the UK if the UK provisioning for this fund, of EUR 1.1 billion at 31 December 2020, was not sufficient.
As no operations had been approved by the implementing partners in relation to the EFSD Guarantee before the withdrawal date, the UK has no obligations here.
The payments made out of the provisions held in the guarantee funds for the operations approved on or after the withdrawal date and up to 31 December 2020 are as follows: nil for EFSI and nil for ELM. In addition EUR 2.8 million of EFSI guarantee calls, fees and costs were made for the operations approved on or after the withdrawal date and up to 31 December 2020, which were covered by the EU revenues held on the EFSI settlement account at EIB (EUR 0.19 million) and from SMEW available amounts
(EUR 2.7 million) as per the EFSI Agreement. As per the WA these payments did not reduce the UK share
of the provisioning.
4.1.2. Guarantees relating to financial assistance (borrowing and lending activities)
EUR million
31.12.2020 31.12.2019
Drawn Undrawn Total Drawn Undrawn Total
EFSM 47 396 – 47 396 47 394 – 47 394
SURE 39 503 46 363 85 867 - - -
BOP 201 – 201 201 – 201
MFA 5 813 1 335 7 148 4 754 560 5 314
Euratom 279 100 379 214 200 414
Total 93 193 47 798 140 991 52 564 760 53 324
The EU budget guarantees the borrowings of the Commission taken to finance lending to Member and non-Member States in back-to-back transactions. These borrowings are already recognised as liabilities
on the EU balance sheet – see note 2.11.1. However, should there be a default on the back-to-back-loans given out with these borrowings, the EU budget, based on Article 14 of Council Regulation 609/2014, would have to bear the full cost of the amount defaulted:
Borrowings related to loans disbursed under the EFSM are guaranteed solely by the EU budget;
Borrowings related to SURE are underpinned by Member States guarantees of EUR 25 billion (25% of the maximum financial assistance amount of EUR 100 billion). The undrawn commitments relate to loan agreements signed in 2020 and for which the disbursement is
expected in 2021.
Borrowings related to BOP loans are guaranteed solely by the EU budget;
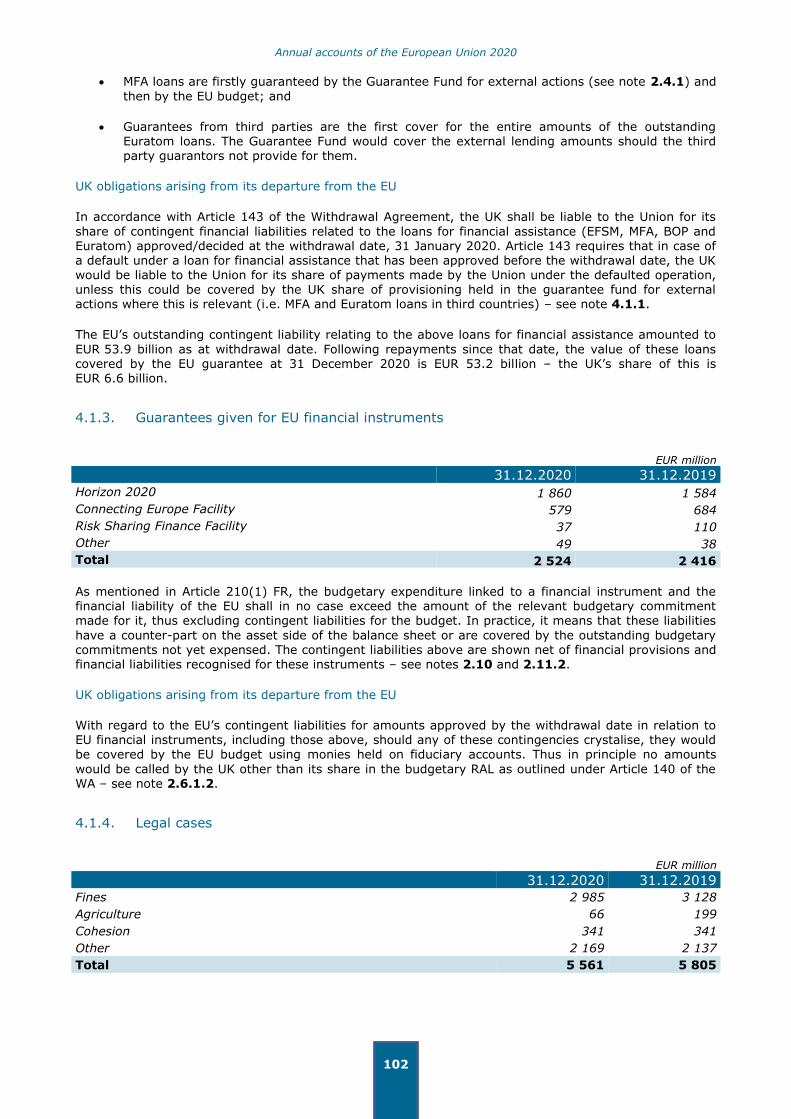
Annual accounts of the European Union 2020
102
MFA loans are firstly guaranteed by the Guarantee Fund for external actions (see note 2.4.1) and
then by the EU budget; and
Guarantees from third parties are the first cover for the entire amounts of the outstanding Euratom loans. The Guarantee Fund would cover the external lending amounts should the third party guarantors not provide for them.
UK obligations arising from its departure from the EU
In accordance with Article 143 of the Withdrawal Agreement, the UK shall be liable to the Union for its
share of contingent financial liabilities related to the loans for financial assistance (EFSM, MFA, BOP and Euratom) approved/decided at the withdrawal date, 31 January 2020. Article 143 requires that in case of a default under a loan for financial assistance that has been approved before the withdrawal date, the UK would be liable to the Union for its share of payments made by the Union under the defaulted operation, unless this could be covered by the UK share of provisioning held in the guarantee fund for external actions where this is relevant (i.e. MFA and Euratom loans in third countries) – see note 4.1.1.
The EU’s outstanding contingent liability relating to the above loans for financial assistance amounted to
EUR 53.9 billion as at withdrawal date. Following repayments since that date, the value of these loans covered by the EU guarantee at 31 December 2020 is EUR 53.2 billion – the UK’s share of this is EUR 6.6 billion.
4.1.3. Guarantees given for EU financial instruments
EUR million
31.12.2020 31.12.2019
Horizon 2020 1 860 1 584
Connecting Europe Facility 579 684
Risk Sharing Finance Facility 37 110
Other 49 38
Total 2 524 2 416
As mentioned in Article 210(1) FR, the budgetary expenditure linked to a financial instrument and the financial liability of the EU shall in no case exceed the amount of the relevant budgetary commitment made for it, thus excluding contingent liabilities for the budget. In practice, it means that these liabilities
have a counter-part on the asset side of the balance sheet or are covered by the outstanding budgetary commitments not yet expensed. The contingent liabilities above are shown net of financial provisions and financial liabilities recognised for these instruments – see notes 2.10 and 2.11.2.
UK obligations arising from its departure from the EU
With regard to the EU’s contingent liabilities for amounts approved by the withdrawal date in relation to EU financial instruments, including those above, should any of these contingencies crystalise, they would
be covered by the EU budget using monies held on fiduciary accounts. Thus in principle no amounts
would be called by the UK other than its share in the budgetary RAL as outlined under Article 140 of the WA – see note 2.6.1.2.
4.1.4. Legal cases
EUR million
31.12.2020 31.12.2019
Fines 2 985 3 128
Agriculture 66 199
Cohesion 341 341
Other 2 169 2 137
Total 5 561 5 805

Annual accounts of the European Union 2020
103
Fines
These amounts mainly concern fines imposed by the Commission for infringement of competition rules that have been provisionally paid by fined companies and where either an appeal has been lodged or where it is unknown whether an appeal will be made. The contingent liability will be maintained until a decision by the Court of Justice on the case is final or until the expiry of the period for appeal. Interest earned on provisional payments is included in the economic result of the year and also as a contingent liability to reflect the uncertainty of the Commission’s title to these amounts.
Should the EU lose any of the cases relating to fines imposed, the amounts that have been provisionally received will be returned to the companies without budgetary impact. The amount of fines is only recognised as budgetary revenue when the fines are definitive (Article 107 FR).
Agriculture
These are contingent liabilities towards the Member States connected with EAGF and rural development
conformity decisions pending judgement of the Court of Justice. The determination of the final amount of the liability and the year in which the effect of successful appeals will be charged to the budget will
depend on the length of the procedure before the Court.
Cohesion
These are contingent liabilities towards the Member States in connection with actions under cohesion policy awaiting the oral hearing date or pending judgement of the Court of Justice.
Other legal cases
This heading relates to actions for damages currently being brought against the EU, other legal disputes and the estimated legal costs. It should be noted that in an action for damages under Article 340 TFEU,
the applicant must demonstrate a sufficiently serious breach by the institution of a rule of law intended to confer rights on individuals, real harm suffered by the applicant, and a direct causal link between the
unlawful act and the harm. The amount for 2020 (as in 2019) mainly concerns a damages claim against the Commission for a merger prohibition decision, where, in the absence of a reliable estimate, the amount disclosed relates to the claimed amount.
UK obligations arising from its departure from the EU
Under Article 147 of the WA, the United Kingdom shall be liable for its share of the payments required to discharge the contingent liabilities of the Union that become due in relation to legal cases concerning financial interests of the Union, provided that the facts forming the subject matter of those cases occurred no later than 31 December 2020. Excluding the amounts concerning fines from the above table (since the cash has been provisionally received from the fined entity and would not need to be funded fully by the EU budget or the UK), the estimated maximum UK exposure here is EUR 318 million. For
legal cases where it is considered probable that amounts will be paid from the EU budget (see note 2.10), the UK share is included as part of the overall amount due from the UK – see details under note 2.6.1.2.
4.2. CONTINGENT ASSETS
EUR million
31.12.2020 31.12.2019
Guarantees received:
Performance guarantees 318 349
Other guarantees 8 16
Other contingent assets 58 65
Total 384 430
Performance guarantees are requested to ensure that beneficiaries of EU funding meet the obligations of their contracts with the EU.

Annual accounts of the European Union 2020
104
5. BUDGETARY AND LEGAL COMMITMENTS
This note provides information on the budgetary process and future funding needs and not on liabilities existing as at 31 December 2020.
The Multiannual Financial Framework (MFF) agreed by the Member States defines the programmes and sets out the heading ceilings for commitment appropriations and the total for payment appropriations within which the EU may enter into budgetary and legal commitments, and ultimately make payments for a period of 7 years – see table 1.1 in the notes to the budgetary implementation reports.
The MFF ceilings were adopted by the Council (Member States), with the consent of the European
Parliament, and Article 16 of Regulation 2013/1306 on the financing of the CAP makes a direct link between the annual ceiling of EAGF expenditure and the MFF Regulation. The European Parliament and the Council also adopted the respective basic acts for the EAGF expenditure that set out the expenditure per Member State for the entire period 2014-2020.
Legal commitments correspond to programmes, projects, agreements or contracts signed, thus legally binding the EU. A legal commitment is the act whereby the authorising officer enters or establishes an obligation (for the EU) which results in a charge (Article 2(37) FR).
A budgetary commitment is in principle made before the legal commitment, but for some multiannual programmes/projects it is the reverse, the relevant budgetary commitments being made in annual instalments, over several years, when the basic act so provides for. For example, for cohesion, Article 76 of the Common Provisions Regulation (CPR) (Regulation (EU) No 2013/1303) provides that the decision of the Commission adopting a programme shall constitute a legal commitment within the meaning of the Financial Regulation but that the budgetary commitments of the Union in respect of each programme
shall be made in annual instalments for each fund during the period between 1 January 2014 and 31 December 2020. Other legal bases may contain similar provisions. For this reason, there may be amounts that the EU has legally committed to pay, but where the budgetary commitment has not yet been made – see notes 5.2 and 5.3 below.
If the budgetary commitment has been made but the subsequent payments are not yet made, the amount of outstanding commitments is called ‘Reste à Liquider’ (RAL). This can represent programmes or projects, often multiannual, signed and for which payments will only be made in later years. They
represent payment obligations for future years. As the financial statements are prepared on an accrual basis, whereas the budgetary implementation reports are prepared on a cash basis, part of the overall amounts unpaid (RAL) has already been expensed and is recognised as a liability on the balance sheet (see notes 2.12 and 2.13). The calculation of these expenses is made based either on cost claims/invoices received or on the estimated implementation of a programme or project where no claims have been notified yet to the EU until the reporting date – see note 5.1 below. Once the payments relating to the RAL are made, the liability on the balance sheet is derecognised. The part of the RAL not
expensed yet is not included under liabilities but is instead disclosed below.
The disclosures below thus represent amounts at 31 December 2020 that the EU has committed to pay based on the fulfilment of the contractual agreements and which are therefore intended to be funded by
future EU budgets.
EUR million
Note 31.12.2020 31.12.2019
Outstanding budgetary commitments not yet expensed 5.1 249 309 249 686
Shared management legal commitments under the current MFF pending implementation
5.2 – 72 832
Significant legal commitments in other areas 5.3 14 481 13 941
Total 263 790 336 459

Annual accounts of the European Union 2020
105
5.1. OUTSTANDING BUDGETARY COMMITMENTS NOT YET
EXPENSED
EUR million
31.12.2020 31.12.2019
Outstanding budgetary commitments not yet expensed 249 309 249 686
The amount disclosed above is the budgetary RAL (‘Reste à Liquider’) of EUR 303 197 million (see table 4.4 in the notes to the budgetary implementation reports), less related amounts that have been included as liabilities on the balance sheet and as expenses in the statement of financial performance. The budgetary RAL is an amount representing the open commitments for which payments and/or decommitments have not yet been made. As explained above, this is the normal consequence of the
existence of multi-annual programmes.
It should be noted that outstanding pre-financing advances at 31 December 2020 totalled EUR 62.7 billion – see note 2.5. This represents budgetary commitments that have been paid, decreasing the RAL, but where the amounts paid are still considered as belonging to the EU and not to the beneficiary, until the relevant contractual obligations are fulfilled. They are thus, like the RAL disclosed above, not yet expensed.
5.2. SHARED MANAGEMENT LEGAL COMMITMENTS UNDER THE CURRENT MFF PENDING IMPLEMENTATION
EUR million
Funds
Financial
framework 2014-2020 (A)
Legal commitments
according to
latest Commission Decision (B)
Budget commitments
including decommitments
(C)
Legal commitments
pending implementation
(B-C)
European Regional Development Fund and Cohesion Fund
261 889 261 690 261 690 –
European Social Fund 93 642 93 498 93 498 0
European Neighbourhood Policy Instrument
– – – –
Fund for European Aid to the most Deprived
3 814 3 813 3 813 –
HEADING 1B: COHESION POLICY FUNDS
359 345 359 000 359 000 0
European Agricultural Fund for Rural Development
126 909 100 063 100 063 (0)
European Maritime and Fisheries Fund
5 749 5 655 5 655 –
HEADING 2: NATURAL RESOURCES
132 658 105 718 105 718 (0)
Asylum and Migration Fund 4 576 4 576 4 576 (0)
Internal Security Fund 3 172 3 172 3 172 (0)
HEADING 3: SECURITY & CITIZENSHIP
7 747 7 747 7 747 (0)
Total 499 750 472 466 472 466 0 * The financial framework for the EAFRD covers the period 2014-2022 according to Regulation (EU) 2020/2220.
These are legal obligations that the EU has committed to pay when adopting the operational programmes related to shared management. The decision of the Commission adopting an operational programme
constitutes a financing decision within the meaning of Article 110 FR and once notified to the Member State concerned, a legal commitment within the meaning of that Regulation.

Annual accounts of the European Union 2020
106
Article 76 of the CPR for European Structural and Investment Funds (ESIF) states:
‘The budget commitments of the Union in respect of each programme shall be made in annual instalments for each Fund during the period between 1 January 2014 and 31 December 2020. The budget commitments relating to the performance reserve in each programme shall be made separately from the remaining allocation to the programme.’
The table above provides an overview of the legal and budgetary commitments related to the headings 1B, 2 and 3 of the MFF 2014-2020. The table starts by disclosing the total MFF amounts voted for the
period (column A). Column B shows the legal commitments concluded by the EU at year-end. Column C contains the budgetary commitments already made to cover the above mentioned legal commitments. At the end of the year 2020, the legal commitments are entirely covered by budgetary commitments.
5.3. SIGNIFICANT LEGAL COMMITMENTS IN OTHER AREAS
EUR million
31.12.2020 31.12.2019
Connecting Europe Facility 4 140 7 680
ITER 6 837 1 676
Copernicus – 601
Galileo – 438
Fisheries agreements 172 223
Operating lease commitments 2 547 2 535
Other contractual commitments 785 788
Total 14 481 13 941
These amounts reflect the long-term legal commitments that were not covered by commitment appropriations in the budget at year-end. These binding obligations will be budgeted in annual
instalments in future years and paid.
Certain important programmes (see below) may be implemented by annual instalments according to Article 112(2) FR. This allows the EU to make legal commitments (sign grant agreements, delegation agreements and procurement contracts) in excess of the available commitment appropriations of a given year. Therefore a substantial amount of the overall allocation for the current MFF may be already committed. This applies in particular for the programmes described below:
Connecting Europe Facility (CEF)
The CEF provides financial assistance to trans-European networks in order to support projects of common interest in the sectors of transport, telecommunications and energy infrastructures. The legal commitments for the CEF programme cover an implementation period running from 2014 until 2024 for the CEF Transport and up to 31.12.2025 for CEF Energy. The legal basis of these commitments is
Regulation (EU) No 2013/1316 of the EP and of the Council of 11 December 2013 establishing the Connecting Europe Facility, amending Regulation (EU) No 2010/913 and repealing Regulations (EC) No
2007/680 and (EC) No 2010/67 Text with EEA relevance (OJ L 348, 20 December 2013) which foresees the use of the annual instalment in its article 19.
ITER – International Thermonuclear Experimental Reactor
These commitments are intended to cover future funding needs of the ITER facilities up to 2027. The EU (Euratom) contribution to ITER International is given through the Fusion for Energy Agency, including also the contributions from Member States and from Switzerland. The considerable year-on-year increase of the commitments reflects the prospective financing under the MFF 2021-2027 established by Council
decision (Euratom) 2021/281 of 22 February 2021 amending Decision 2007/198/Euratom establishing the European Joint Undertaking for ITER and the Development of Fusion Energy, which authorises the use of annual instalments. ITER was created to manage and to encourage the exploitation of the ITER facilities, to promote public understanding and acceptance of fusion energy, and to undertake any other
activities that are necessary to achieve its purpose. ITER involves the EU, China, India, Russia, South Korea, Japan and the USA.

Annual accounts of the European Union 2020
107
Copernicus
Copernicus is the European Earth observation programme – see also note 2.2. These commitments are made for the period until 2020. Based on Regulation (EU) 2014/377 of the EP and Council of 3 April 2014 (OJ L 122/44 of 24 April 2014) the Commission signed delegation agreements with the European Space Agency (ESA), EUMETSAT, Mercator and the European Centre for Medium Range weather forecasts. Article 8 of Regulation 2014/377 authorises the use of annual instalments.
At 31 December 2020, all legal commitments had been entirely covered by budgetary commitments.
Galileo
These are amounts committed to the Galileo programme developing a European Global Navigation Satellite System – see also note 2.2. These commitments are made for the period until 2020. Based on Regulation (EU) 2013/1285 of the EP and Council of 11 December 2013 (OJ L 347/1 of 20 December 2013) the Commission signed a delegation agreement with ESA. Article 9 of Regulation (EU) 2013/1285
authorises the use of annual instalments.
At 31 December 2020, all legal commitments had been entirely covered by budgetary commitments.
Fisheries agreements
These represent commitments entered into with third countries for operations under international fisheries agreements up to 2026. The commitments made are based on Council decisions for each third country (e.g. Agreement between the EU and the Republic of Seychelles and the Implementation Protocol thereto; OJ L60, 28.2.2020) and are considered specific international treaties with multi-annual rights and obligations.
Operating lease commitments
Minimum amounts committed to be paid according to the underlying contracts during the remaining term
of these lease contracts are as follows:
EUR million
Minimum lease payments
< 1 year 1- 5 years > 5 years Total
Buildings 407 993 1 088 2 488
IT materials and other equipment 15 35 10 60
Total 422 1 028 1 098 2 547
In March 2019, in the context of the United Kingdom’s notification of its intention to withdraw from the EU, and as a result of Regulation (EU) 2018/1718 of the European Parliament and of the Council of 14 November 2018 amending Regulation (EC) No 2004/726, the seat of the European Medicines Agency (EMA) was relocated from London to Amsterdam. On 2 July 2019, the Agency reached an agreement with
its landlord and since then has sublet its premises to a subtenant under conditions that are consistent with the ones of the headlease, including the sublease term that extends until the expiry of EMA’s
headlease in June 2039.
The amounts disclosed in the table above include EUR 378 million still due under the headlease contract. An equal amount of payments is expected to be received by the subtenant under the non-cancellable sublease.
Other contractual commitments
The amounts included under this disclosure correspond to amounts committed to be paid during the term of the contracts. The most significant amount included here relates to a building contract (JMO2) of the
Commission in Luxembourg (EUR 354 million).

Annual accounts of the European Union 2020
108
6. FINANCIAL RISK MANAGEMENT
The following disclosures with regard to the financial risk management of the EU relate to:
Borrowing and lending activities for financial assistance carried out by the Commission through EFSM, BOP, MFA, SURE and Euratom actions;
The treasury operations carried out by the Commission in order to implement the EU budget, including the receipt of fines;
Assets held in funds for budgetary guarantees: the Guarantee Fund for external actions, the EFSI Guarantee Fund and the EFSD Guarantee Fund; and
Financial instruments financed by the EU budget.
6.1. TYPES OF RISK
Market risk is the risk that the fair value or future cash flows of a financial instrument will fluctuate, because of variations in market prices. Market risk embodies not only the potential for loss, but also the potential for gain. It comprises currency risk, interest rate risk and other price risk (the EU has no significant other price risk).
Currency risk is the risk that the EU's operations or its investments' value will be affected by changes in exchange rates. This risk arises from the change in price of one currency against another.
Interest rate risk is the possibility of a reduction in the value of a security, especially a bond, resulting from an increase in interest rates. In general, higher interest rates will lead to lower
prices of fixed rate bonds, and vice versa.
Credit risk is the risk of loss due to a debtor's / borrower's non-payment of a loan or other line of credit (either the principal or interest or both) or other failure to meet a contractual obligation. The default events include a delay in repayments, restructuring of borrower repayments and bankruptcy.
Liquidity risk is the risk that arises from the difficulty in selling an asset; for example, the risk that a
given security or asset cannot be traded quickly enough in the market to prevent a loss or meet an obligation.
6.2. RISK MANAGEMENT POLICIES
Measurement of financial instruments
The following classes of financial assets and liabilities are not measured at fair value: cash and cash equivalents, loans, exchange receivables and non-exchange recoverables, borrowings and other financial liabilities measured at amortised cost. The carrying amount of those financial assets and liabilities is considered as a reasonable approximation of their fair value.
Borrowing and lending activities for financial assistance
The borrowing and lending transactions are carried out by the EU according to the respective Council Regulations, Council and European Parliament Decisions, and, if applicable, internal guidelines. Written procedure manuals covering specific areas such as borrowings and loans have been developed and are used by the relevant operational units. Lending operations are financed by ’back-to-back‘ borrowings, which thus do not generate open interest rate or currency positions.
Treasury
The rules and principles for the management of the Commission's treasury operations are laid down in the Council Regulation 609/2014 (as amended by Council Regulation 2016/804) and in the Financial Regulation.
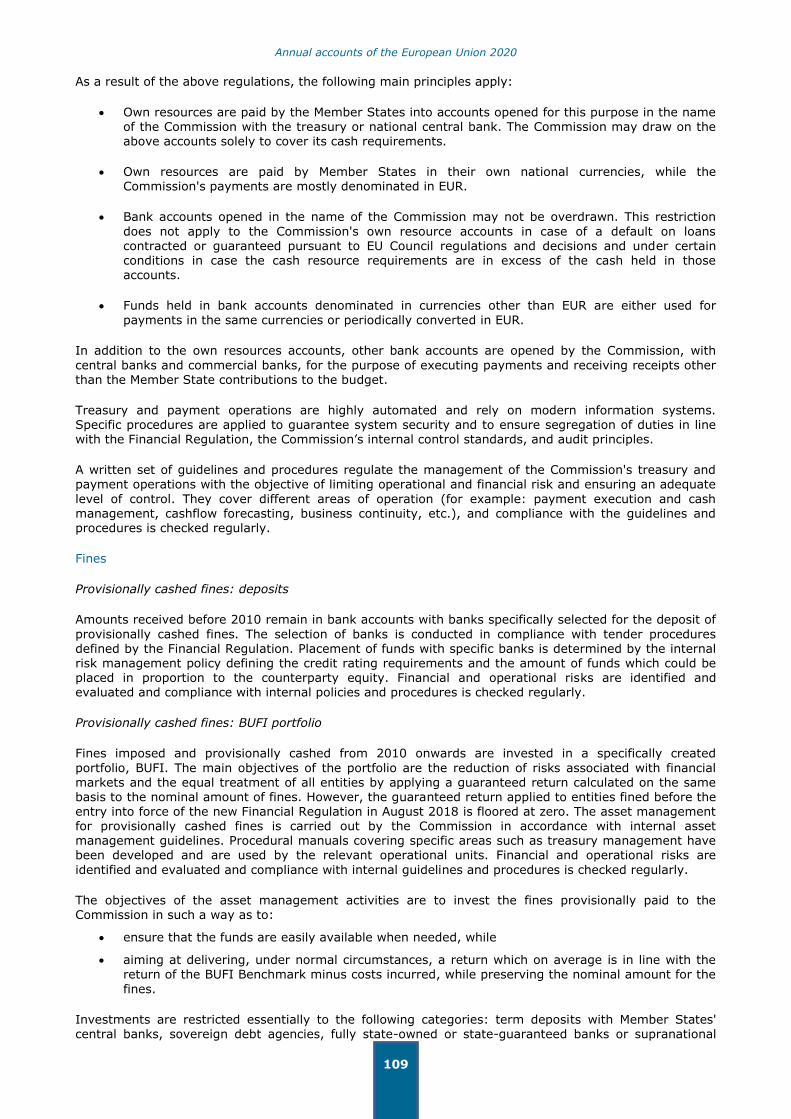
Annual accounts of the European Union 2020
109
As a result of the above regulations, the following main principles apply:
Own resources are paid by the Member States into accounts opened for this purpose in the name of the Commission with the treasury or national central bank. The Commission may draw on the above accounts solely to cover its cash requirements.
Own resources are paid by Member States in their own national currencies, while the Commission's payments are mostly denominated in EUR.
Bank accounts opened in the name of the Commission may not be overdrawn. This restriction
does not apply to the Commission's own resource accounts in case of a default on loans contracted or guaranteed pursuant to EU Council regulations and decisions and under certain conditions in case the cash resource requirements are in excess of the cash held in those accounts.
Funds held in bank accounts denominated in currencies other than EUR are either used for
payments in the same currencies or periodically converted in EUR.
In addition to the own resources accounts, other bank accounts are opened by the Commission, with
central banks and commercial banks, for the purpose of executing payments and receiving receipts other than the Member State contributions to the budget.
Treasury and payment operations are highly automated and rely on modern information systems. Specific procedures are applied to guarantee system security and to ensure segregation of duties in line with the Financial Regulation, the Commission’s internal control standards, and audit principles.
A written set of guidelines and procedures regulate the management of the Commission's treasury and payment operations with the objective of limiting operational and financial risk and ensuring an adequate
level of control. They cover different areas of operation (for example: payment execution and cash management, cashflow forecasting, business continuity, etc.), and compliance with the guidelines and procedures is checked regularly.
Fines
Provisionally cashed fines: deposits
Amounts received before 2010 remain in bank accounts with banks specifically selected for the deposit of
provisionally cashed fines. The selection of banks is conducted in compliance with tender procedures defined by the Financial Regulation. Placement of funds with specific banks is determined by the internal risk management policy defining the credit rating requirements and the amount of funds which could be placed in proportion to the counterparty equity. Financial and operational risks are identified and evaluated and compliance with internal policies and procedures is checked regularly.
Provisionally cashed fines: BUFI portfolio
Fines imposed and provisionally cashed from 2010 onwards are invested in a specifically created
portfolio, BUFI. The main objectives of the portfolio are the reduction of risks associated with financial markets and the equal treatment of all entities by applying a guaranteed return calculated on the same basis to the nominal amount of fines. However, the guaranteed return applied to entities fined before the entry into force of the new Financial Regulation in August 2018 is floored at zero. The asset management for provisionally cashed fines is carried out by the Commission in accordance with internal asset management guidelines. Procedural manuals covering specific areas such as treasury management have been developed and are used by the relevant operational units. Financial and operational risks are
identified and evaluated and compliance with internal guidelines and procedures is checked regularly.
The objectives of the asset management activities are to invest the fines provisionally paid to the Commission in such a way as to:
ensure that the funds are easily available when needed, while
aiming at delivering, under normal circumstances, a return which on average is in line with the
return of the BUFI Benchmark minus costs incurred, while preserving the nominal amount for the
fines.
Investments are restricted essentially to the following categories: term deposits with Member States' central banks, sovereign debt agencies, fully state-owned or state-guaranteed banks or supranational

Annual accounts of the European Union 2020
110
institutions, and bonds, bills and certificates of deposit issued by either sovereign or supranational
institutions.
Financial guarantees
Significant amounts of guarantees issued by financial institutions are held by the Commission in relation to the fines it imposes on companies breaching EU competition rules – see note 2.6.1.3. These guarantees are provided by fined companies as an alternative to making provisional payments. The guarantees are managed in compliance with the internal risk management policy. Financial and
operational risks are identified and evaluated and compliance with internal policies and procedures is checked regularly.
Guarantee funds
The Commission is increasingly providing financial guarantees to financial institutions as a means of efficient budget implementation, thus supporting beneficiaries due to the leverage effect. This use of the
EU budget aims at maximising the impact of the funds available. The Commission has set up guarantee funds to cover the budgetary guarantees given, with the objective of providing a liquidity cushion against
potential losses from guaranteed operations. The main guarantee funds at year-end are the Guarantee Fund for external actions, the EFSI Guarantee Fund and the EFSD Guarantee Fund.
Guarantee Fund for external actions
The rules and principles for the asset management of the Guarantee Fund are laid out in the Convention between the Commission and the EIB dated 25 November 1994 and its subsequent amendments. This Guarantee Fund operates only in euros. Management of the assets is based upon the traditional rules of prudence adhered to for financial activities. It is required to pay particular attention to reducing the risks
and to ensuring that the managed assets can be sold or transferred without significant delay, taking into account the commitments covered.
EFSI Guarantee Fund
The EFSI Guarantee Fund was established by the EFSI Regulation – see note 2.4.1. The rules and principles for the asset management of the fund are laid out in the Commission Decision C(2016)165 of 21 January 2016. The fund is managed by the Commission, which is authorised to invest the assets of
the EFSI Guarantee Fund on the financial markets in accordance with the principle of sound financial management following appropriate prudential rules. The managed assets shall provide sufficient liquidity in relation to potential guarantee calls, while still aiming at optimising the return and risk level that is compatible with maintaining a high degree of security and stability.
EFSD Guarantee Fund
EFSD Guarantee Fund has been established pursuant to the EFSD Regulation – see note 2.4.1. The management of the EFSD Guarantee Fund assets is carried out by the Commission in accordance with
internal guidelines and asset management guidelines which are included as Annex 1 to Commission Decision C(2017)7693 of 22 November 2017. The Commission is authorised to invest the assets of the
EFSD Guarantee Fund on the financial markets following the principle of sound financial management and appropriate prudential rules. The assets are managed in such a way as to provide sufficient liquidity in relation to the potential guarantee calls, while still aiming at optimising the return and risk level that is compatible with maintaining a high degree of security and stability.
Financial instruments programmes
The implementation of the EU budget has relied for many years now on the use of financial instrument programmes. For more information on the amounts concerned - see note 2.4.1.
Common to most financial instruments is the fact that the implementation is delegated either to the EIB group (including EIF) or to other financial institutions based on an agreement between the Commission and the financial institution. Agreements signed with these financial institutions include strict conditions and obligations on the intermediaries so as to ensure that EU monies are properly managed and reported
on. Once a financial contribution to one of the instruments has been committed, the funds are transferred to a specifically created bank account opened by the financial institution in its name but on behalf of the Commission (i.e. a fiduciary account). The financial institution may, depending on the instrument in question, use the funds on this fiduciary account to provide loans, issue debt instruments, invest in

Annual accounts of the European Union 2020
111
equity instruments or cover the guarantee calls. Proceeds from financial instruments have, as a general
rule, to be reimbursed to the EU budget.
The risk as regards these financial instruments is limited to a ceiling as indicated in the underlying agreements, which is the budgeted amount foreseen for the instrument. As the Commission often bears the ‘first loss piece’ and since instruments are intended to finance riskier beneficiaries (who have difficulties in obtaining funding from commercial lenders), it is therefore likely that some losses to the EU budget will occur.
6.3. CURRENCY RISK
Financial instruments exposure of the EU to currency risk at year-end – net position
EUR million
31.12.2020
USD GBP DKK SEK EUR Other Total
Financial assets
Available for sale financial assets 593 42 15 14 18 904 20 19 587
Financial assets at fair value through surplus or deficit
(417) – – – 616 – 199
Loans* 21 40 – – 46 9 116
Receivables and recoverables 22 1 208 116 176 72 233 738 74 493
Cash and cash equivalents 115 64 178 367 14 429 1 589 16 742
334 1 353 310 557 106 228 2 356 111 137
Financial liabilities
Financial liabilities at fair value through surplus or deficit
– – – – (1) (4) (4)
Payables (3) (0) (19) (1) (32 366) (19) (32 408)
(3) (0) (19) (1) (32 367) (22) (32 412)
Total 331 1 353 291 556 73 861 2 333 78 725
* Excluding back-to-back loans for financial assistance.
EUR million
31.12.2019
USD GBP DKK SEK EUR Other Total
Financial assets
Available for sale financial assets 577 62 17 9 17 723 21 18 407
Financial assets at fair value through surplus or deficit
(393) – – – 529 – 137
Loans* 17 32 – – 65 7 121
Receivables and recoverables 30 804 62 93 22 751 233 23 974
Cash and cash equivalents 100 311 319 432 16 910 1 673 19 745
332 1 209 398 533 57 979 1 934 62 384
Financial liabilities
Financial liabilities at fair value through surplus or deficit
(0) – – – (10) (2) (12)
Payables (5) (1) (0) (1) (27 200) (33) (27 241)
(5) (1) (0) (1) (27 211) (35) (27 254)
Total 326 1 208 398 532 30 768 1 898 35 130 * Excluding back-to-back loans for financial assistance.

Annual accounts of the European Union 2020
112
If the EUR had strengthened against other currencies by 10%, then it would have had the following
impact:
EUR million
Economic result
USD GBP DKK SEK
2020 (13) (119) (27) (49)
2019 (14) (104) (35) (48)
EUR million
Net assets
USD GBP DKK SEK
2020 (17) (4) (1) (1)
2019 (17) (6) (2) (1)
If the EUR had weakened against these currencies by 10%, then it would have had the following impact:
EUR million
Economic result
USD GBP DKK SEK
2020 16 146 33 60
2019 17 127 42 58
EUR million
Net assets
USD GBP DKK SEK
2020 21 5 2 2
2019 20 7 2 1
Borrowing and lending activities for financial assistance
Financial assets and liabilities are currently only in EUR, so the EU has no foreign currency risk.
Treasury
Own resources paid by Member States in currencies other than EUR are kept on the own resources
accounts, in accordance with Council Regulation 609/2014 (as amended by Council regulation 2016/804). They are converted into EUR when they are needed for the execution of payments. The procedures applied for the management of these funds are laid down by the above referred regulation. In a limited number of cases, these funds are directly used for payments to be executed in the same currencies.
A number of accounts in EU currencies other than EUR, and in USD and CHF, are held by the Commission with commercial banks, for the purpose of executing payments denominated in these same currencies. These accounts are replenished depending on the amount of payments to be executed, as a consequence their balances do not represent exposure to currency risk.
When miscellaneous receipts (receipts other than own resources) are received in currencies other than EUR, they are either transferred to Commission's accounts held in the same currencies, if they are needed to cover the execution of payments, or converted into EUR and transferred to accounts held in
EUR. Imprest accounts held in currencies other than EUR are replenished depending on the estimated short-term local payment needs in the same currencies. Balances on these accounts are kept within their
respective ceilings.

Annual accounts of the European Union 2020
113
Fines
All fines are imposed, paid or provisionally covered in EUR and therefore do not pose any foreign currency risk.
Guarantee funds
Guarantee Fund for external actions
The financial assets of this fund are in EUR so there is no currency risk. The loans subrogated to the EU as result of calls on the fund, following payment defaults by a loan beneficiary, are carried out in their
original currency and therefore expose the EU to currency risk. There are no activities to compensate foreign currency variations (‘hedging‘ activities) due to uncertainty relating to the loans’ repayment timing.
EFSI Guarantee Fund
The EFSI Guarantee Fund currently operates in both EUR and USD. Currency risk is managed through entering into derivative contracts (foreign exchange forward contracts) hedging the market value of the USD investments portfolio. The limit for maximum unhedged foreign exchange exposure is set at 1% of
the total portfolio value within the benchmark and annual strategy allocations. Thus, upward or downward movements in the USD investments' market value above or below the 1% limit would trigger a rebalancing trade (a new forward contract with the same or opposite direction), adjusting or reversing the hedged position accordingly. Readjustment of the hedge may also be prompted by movements of the EUR/USD exchange rate.
The loans subrogated to the EU as result of calls on the fund following payment defaults by a loan beneficiary – see note 2.4.3.2 – are carried out in their original currency and therefore expose the EU to
currency risk. For the subrogated loans, there are no activities to compensate foreign currency variations (‘hedging‘ activities) due to uncertainty relating to the loans’ repayment timing.
EFSD Guarantee Fund
The EFSD Guarantee Fund currently operates in EUR only, but the asset management guidelines for the EFSD Guarantee Fund provide for the possibility to invest in certain non-EUR denominated assets.
6.4. INTEREST RATE RISK
The following table illustrates the interest rate sensitivity of available for sale financial assets assuming a possible change in interest rates of +/- 100 basis points (1%).
EUR million
Increase (+) / decrease (-)
in basis points Effect on net assets
2020: Available for sale financial assets +100 (479)
-100 513
2019: Available for sale financial assets +100 (447)
-100 483
Sensitivity to interests rate changes of a given portfolio of money market instruments and bonds increases with its duration. The duration of the main asset portfolios managed by the Commission is
described below.
Borrowing and lending activities for financial assistance
Due to the nature of its borrowing and lending activities, the EU has significant interest-bearing assets and liabilities. However, there is no interest rate risk since the borrowings are offset by equivalent loans
at the same terms and conditions (back-to-back).

Annual accounts of the European Union 2020
114
Treasury
The Commission's treasury does not borrow money; so as a consequence, it is not exposed to interest rate risk. Interest is however calculated on balances held on the different bank accounts. The Commission has therefore put in place measures to ensure that interest earned on its bank accounts regularly reflects market interest rates, as well as their possible fluctuation.
Accounts opened with Member States treasuries for own resources receipts are non-interest bearing and free of charge. Accounts held with national central banks (own resources and other) may be remunerated
at the official rates applied by each institution. As some of the remunerations applied to these accounts may currently be negative, cash management procedures are in place to minimise balances kept on these accounts. Own resources accounts are protected from any impact of negative interest in accordance with Council Regulation 609/2014(as amended by Council Regulation 2016/804).
Overnight balances held on commercial bank accounts earn interest on a daily basis. This is based on variable market rates to which a contractual margin (positive or negative) is applied. The rates applied by
commercial banks are in general floored at zero for operational balances up to a specified ceiling.
Fines
The provisionally cashed fines are invested in a portfolio of money market instruments and long-term bonds with an average portfolio duration of 2.24 years.
Guarantee funds Guarantee Fund for external actions
The budget provisioned in the Guarantee Fund is invested in a portfolio of money market instruments and long-term bonds with a total average portfolio duration of 3.04 years.
EFSI Guarantee Fund
The budget provisioned in the EFSI Guarantee Fund is invested in a portfolio of money market instruments and long-term bonds with a total average portfolio duration of 3.19 years.
EFSD Guarantee Fund
The budget provisioned in the EFSD Guarantee Fund is invested in a portfolio of money market instruments and long-term bonds with a total average portfolio duration of 2.41 years.
6.5. CREDIT RISK
The amounts that represent the EU's exposure to credit risk at the end of the reporting period are the carrying amounts of the financial instruments as disclosed in note 2.
Analysis of the age of financial assets that are not impaired
EUR million
Total Neither past
due nor
impaired
Past due but not impaired
< 1 year 1-5 years > 5 years
Loans 93 309 93 308 0 – –
Receivables and recoverables 74 493 59 702 505 14 030 257
Financial assets at fair value
through surplus or deficit 199 199 – – –
Total at 31.12.2020 168 001 153 209 505 14 030 257
Loans 52 684 52 683 1 – –
Receivables and recoverables 23 974 9 410 2 726 11 543 295
Financial assets at fair value
through surplus or deficit 137 137 – – –
Total at 31.12.2019 76 795 62 231 2 727 11 543 295

Annual accounts of the European Union 2020
115
On 10 July 2020 the Commission took the decision to amend its internal provisions for the recovery of
amounts receivable in order to alleviate the impact of the COVID-19 pandemic on the Commission
debtors. The decision temporarily extended the deadlines for payments for new debts and provided for the possibility to grant additional time for payment for those debts that were pending at the time.
Receivables and recoverables which have passed their due date but are not impaired include recoverables related to competition fines of EUR 11 295 million (EUR 132 million have become past due in a period of less than 1 year, EUR 10 931 million – between 1 and 5 years and EUR 231 million have been due for
over 5 years). These amounts are largely covered by bank guarantees, thus making the Commission’s exposure to the credit risk low. Fined companies provide these guarantees as an alternative to making provisional payments. In addition to these, the first two categories of receivables and recoverables contain EUR 1.2 billion receivables and EUR 2.1 billion recoverables that relate to the infringement case referred to in note 2.6.1.1.
Credit quality of financial assets that are neither past due nor impaired
EUR million
31.12.2020
AFS* Financial
assets at
FVSD**
Loans Receivables
and
recoverables
Cash Total
Counterparties with external credit rating
Prime and high grade 9 005 199 2 040 52 817 13 896 77 956
Upper medium grade 3 415 – 35 040 1 535 1 011 41 001
Lower medium grade 2 133 – 48 139 1 886 1 651 53 809
Non-investment grade 310 – 7 964 142 165 8 580
14 862 199 93 182 56 380 16 723 181 347
Counterparties without external credit rating
Group 1 – – 126 3 318 19 3 463
Group 2 – – – 4 – 4
– – 126 3 322 19 3 466
Total 14 862 199 93 309 59 702 16 742 184 814
EUR million
31.12.2019
AFS* Financial
assets at
FVSD**
Loans Receivables
and
recoverables
Cash Total
Counterparties with external credit rating
Prime and high grade 8 848 137 32 3 632 15 452 28 101
Upper medium grade 3 588 – 23 013 1 444 3 688 31 734
Lower medium grade 2 298 – 24 711 1 867 322 29 198
Non-investment grade 264 – 4 855 478 262 5 858
14 998 137 52 610 7 422 19 724 94 891
Counterparties without external credit rating
Group 1 – – 73 1 987 21 2 082
Group 2 – – – 2 – 2
– – 73 1 989 21 2 083
Total 14 998 137 52 683 9 410 19 745 96 974
* Available for sale financial assets (excluding investments in money market funds and equity instruments).
** Financial assets at fair value through surplus or deficit.
Not included in the above table are available for sale financial assets in the form of equity instruments
without external credit rating. The four risk categories mentioned above are in principle based on the rating categories of external rating agencies and correspond to:

Annual accounts of the European Union 2020
116
Prime and high grade: Moody P-1, Aaa – Aa3; S&P A-1+, A-1, AAA – AA -; Fitch F1+, F1, AAA –
AA- and equivalent
Upper medium grade: Moody P-2, A1 – A3; S&P A-2, A+ - A-; Fitch F2, A+ - A- and equivalent
Lower medium grade: Moody P-3, Baa1 – Baa3, S&P A-3, BBB+ - BBB-; Fitch F-3, BBBB+ - BBB- and equivalent
Non-investment grade: Moody not prime, Ba1 – C; S&P B, C, BB+ - D; Fitch B, C, BB+ - D and equivalent
The EU uses these external agencies rating categories as a reference point notably for financial instruments and commercial banks, but may, after making its own analysis of individual cases, keep amounts in one of the above risk categories even though one or more of the above mentioned rating agencies may have downgraded the corresponding counterparty. As regards non-rated counterparties, group 1 relates to debtors without defaults in the past and group 2 relates to debtors with defaults in the
past.
The amounts displayed above under loans categorised in non-investment grade relate primarily to
financial assistance loans disbursed by the Commission to partner countries in financial difficulties. The amount under receivables and recoverables relates to recoverables against certain Members States based on own resources regulations or other legal basis. The amount under cash relates mainly to own resources bank accounts opened in the treasury or in the central banks of certain Member States to hold the own resources contributions as foreseen in the above referred regulation. The Commission may draw on these accounts solely to cover cash requirements for the implementation of the budget.
Borrowing and lending activities for financial assistance
Exposure to credit risk is managed firstly by obtaining state guarantees in the case of Euratom, then through the Guarantee Fund for external actions (MFA & Euratom), then by the possibility of drawing the necessary funds from the Commission's own resources accounts with the Member States and ultimately
through the EU budget.
The Own Resources legislation fixes the ceiling for own resources payments at 1.20% of Member States' GNI and during 2020 1.03% was actually used to cover payment appropriations. This means that at 31
December 2020 there existed an available margin of 0.17% to cover these guarantees. To this end, the EU is entitled to call upon Member States to ensure compliance with the EU's legal obligation towards its lenders.
Loans provided to Member States under the SURE instrument are underpinned by a system of voluntary guarantees from Member States, amounting to 25% of the maximum ceiling available for the related financial assistance. Before calling on guarantees provided by the Member States, the Commission is expected to examine the scope for drawing on the margin available under the own resources ceiling for
payments appropriation to the extent that it is deemed sustainable by the Commission, having regard, inter alia, to the total contingent liabilities of the Union and the sustainability of the general budget of the Union. Such examination shall not affect the irrevocable, unconditional and on-demand nature of the
guarantees provided.
Treasury
Most of the Commission's treasury resources are kept, in accordance with Council Regulation 609/2014 (as amended by Council Regulation 804/2016) on own resources, in the accounts opened by Member
States for the payment of their contributions (own resources). All such accounts are held with Member States' treasuries or national central banks. These institutions carry the lowest credit (or counterparty) risk for the Commission as the exposure is with its Member States. For the part of the Commission's treasury resources kept with commercial banks, in order to cover the execution of payments, replenishment of these accounts is made on a just-in-time basis and is automatically managed by the treasury cash management system. Minimum cash levels, which take into account the average amount of
daily payments executed from it, are kept on each account. As a consequence the total amount kept overnight on these accounts remains constantly at low levels (overall less than EUR 54 million on
average, spread over around 25 accounts) and so it is ensured that the Commission's risk exposure is limited. These amounts should be viewed with regard to the daily overall treasury balances which fluctuated in 2020 between EUR 2 billion and EUR 37 billion, and with an overall amount of payments made from Commission accounts in 2020 that exceeded EUR 163 billion.

Annual accounts of the European Union 2020
117
In addition, specific guidelines are applied for the selection of commercial banks in order to further
minimise counterparty risk to which the Commission is exposed:
All commercial banks are selected by call for tenders. The minimum long-term credit rating required for admission to the tendering procedures is S&P A- or equivalent. A lower level may be accepted in specific and duly justified circumstances.
The credit ratings of the commercial banks where the Commission has accounts are monitored on a regular basis.
In delegations outside the EU, imprest accounts are held with local banks selected by a simplified tendering procedure. Rating requirements depend on the local situation and may significantly differ from one country to another. In order to limit risk exposure, balances on these accounts are kept at the lowest possible levels (taking into account operational needs), they are regularly replenished, and the applied ceilings are reviewed on a yearly basis.
Fines
Provisionally cashed fines: deposits
Banks holding deposits for the fines provisionally cashed before 2010 are selected by tender procedure in compliance with the risk management policy which defines the credit rating requirements and the amount of funds which could be placed in proportion to the counterparty equity.
For commercial banks that have been specifically selected for the deposit of provisionally cashed fines, a minimum long-term rating A- (S&P or equivalent) with two rating agencies is required as a general rule. Specific measures are applied in case banks in this group are subject to downgrade. In addition, the amount deposited with each bank is limited to a certain percentage of its own funds, which varies
depending on the rating level of each institution. The calculation of such limits also takes into account the amount of outstanding guarantees issued to the Commission by the same institution. The compliance of outstanding deposits with the applicable policy requirements is reviewed regularly.
Provisionally cashed fines: BUFI portfolio
For sovereign debt investments from provisionally cashed fines imposed as from 2010, the Commission takes on the exposure to credit risk. The highest concentration of exposure is towards Spain, which
represents 17% of the portfolio. The five countries with the highest exposure (Spain, France, Italy, Germany and Belgium) represent altogether 45% of the investment portfolio. The weighted average credit rating of the portfolio is A (S&P or equivalent).
Financial guarantees received
The risk management policy applied for the acceptance of such guarantees ensures a high credit quality for the Commission. The policy includes defining a maximum credit exposure towards a particular financial sector entity based on its credit rating and the level of an entity’s capital as accounted for in its
IFRS financial statements. The compliance of the outstanding guarantees with the applicable policy requirements is reviewed regularly.
Guarantee funds Guarantee Fund for external actions
The asset management guidelines and/or investment strategy define certain limits and restrictions in order to limit the exposure to credit risk of the portfolio. Such limits and restrictions include eligibility criteria, absolute credit limits in nominal terms depending on issuer category, relative concentration limits
depending on issuer category and concentration limits per issue. All investments are rated at least as investment grade.
EFSI Guarantee Fund
The asset management guidelines, risk and investment strategies define certain limits and restrictions in
order to limit the exposure to credit risk of the portfolio which is limited to investment grade, except for EU Member States exposure. The weighted average credit rating of the portfolio is BBB+ (S&P or
equivalent).

Annual accounts of the European Union 2020
118
As the sole counterparty for all outstanding currency forwards as of 31 December 2020 is the Banque de
France, no credit enhancements, such as collateral, netting agreements, or guarantees are put in place
as of this date. The maximum exposure to credit risk for foreign exchange derivatives having a positive fair value at the end of the reporting period is equal to the carrying amount on the balance sheet.
EFSD Guarantee Fund
The asset management guidelines, risk and investment strategies define certain limits and restrictions in order to limit the exposure to credit risk of the portfolio, which is limited to investment grade, except for
EU Member States exposure. The weighted average credit rating of the portfolio is BBB+ (S&P or equivalent).
6.6. LIQUIDITY RISK
Maturity analysis of financial liabilities by remaining contractual maturity
EUR million
< 1 year 1-5 years > 5 years Total
Borrowings (10 410) (20 230) (62 553) (93 192)
Payables (32 408) – – (32 408)
Financial guarantee liabilities (90) – – (90)
Other (149) (665) (947) (1 761)
Total at 31.12.2020 (43 057) (20 895) (63 500) (127 451)
Borrowings (1 273) (19 312) (31 978) (52 564)
Payables (27 241) – – (27 241)
Financial guarantee liabilities (20) – – (20)
Other (149) (640) (1 132) (1 921)
Total at 31.12.2019 (28 684) (19 952) (33 110) (81 746)
Financial instruments at fair value through surplus or deficit
EUR million
< 1 year 1-5 years > 5 years Total
Derivative pay leg (417) (4) (1) (421)
Derivative receive leg 423 – – 423
Net cash flows at 31.12.2020 5 (4) (1) 1
Derivative pay leg (397) (2) (7) (406)
Derivative receive leg 395 – – 395
Net cash flows at 31.12.2019 (2) (2) (7) (10)
Borrowing and lending activities for financial assistance
The liquidity risk that arises from borrowings is generally offset by equivalent loans in terms and
conditions (back-to-back operations). For MFA and Euratom, the Guarantee Fund for external actions serves as a liquidity reserve (or safety net) in case of payment default and payment delays of borrowers. For the SURE instrument the loans are guaranteed by a system of the irrevocable, unconditional and on-
demand voluntary guarantees from Member States amounting to 25% of the maximum ceiling available for the financial assistance. For BOP, the Council Regulation 2009/431 provides for a procedure allowing sufficient time to mobilise funds through the Commission's own resources accounts with the Member States. For EFSM, the Council Regulation 2010/407 provides for a similar procedure.
Treasury
EU budget principles ensure that overall cash resources for a given year are always sufficient for the execution of all payments. In fact, the total Member States contributions together with the miscellaneous
revenue equal the amount of payment appropriations for the budgetary year. Member States’ contributions, however, are received in twelve monthly instalments throughout the year and based on the
adopted budget, while payments are subject to operational needs. Moreover, in accordance with the Council Regulation 609/2014 (on the methods and procedure for making available own resources, amended by Council Regulation 804/2016), Member States contributions relating to amending budgets approved in a given month (N) only become available either on the first working day of the month N+1 (if approved before the 16th of the given month) or on the first working day of month N+2 (if approved

Annual accounts of the European Union 2020
119
on the 16th or later of that given month), while the related payment appropriations are immediately
available.
In order to ensure that available treasury resources are always sufficient to cover the payments to be executed in any given month, procedures regarding regular cash forecasting are in place, and own resources or additional funding can be called up in advance from Member States if needed, up to certain limits and under certain conditions. Operational needs and overall budgetary restrictions in recent years have resulted in the need for increased monitoring of the rhythm of payments during the year. In
addition to the above, in the context of the Commission's daily treasury operations, automated cash management tools ensure that sufficient liquidity is available on each of the Commission's bank accounts, on a daily basis.
Fines
The BUFI fund where provisionally paid fines are invested is managed according to the principle that the assets shall have a sufficient degree of liquidity and mobilisation in relation to the relevant commitments.
The portfolio is composed of mostly highly liquid securities that can be sold to meet short-term cash
outflows. In addition, the share of cash, cash equivalents and securities maturing within 1 year is 34%.
Guarantee funds
Guarantee Fund for external actions
The fund is managed according to the principle that the assets shall have a sufficient degree of liquidity and mobilisation in relation to the relevant commitments. The fund therefore maintains a sufficient amount of monetary assets to cover short-term cash outflows. The share of cash, cash equivalents and securities maturing within 1 year is 15%.
EFSI Guarantee Fund
The EFSI Guarantee Fund is managed according to the principle that the assets shall have a sufficient
degree of liquidity and mobilisation in relation to the relevant commitments. The portfolio is composed of liquid assets that can be sold to meet short-term cash outflows if necessary. In addition the share of cash, cash equivalents and securities maturing within 1 year is 30%.
The settlement of derivative contracts is gross and is based on their contractual maturity. Obligations are
honoured via sales of USD-denominated assets and/or a swap transaction, whereby it is possible that a cash outflow arises due to foreign exchange differences.
No liquidity management is necessary with regard to collateral / margin requirements as the current hedging counterparty accepts to operate with the Commission without any requirements for collateral / margin calls.
EFSD Guarantee Fund
The EFSD Guarantee Fund is managed according to the principle that the assets shall have a sufficient
degree of liquidity and mobilisation in relation to the relevant commitments.
The portfolio is composed of liquid assets that can be sold to meet short-term cash outflows, if necessary. In addition the share of cash, cash equivalents and securities maturing within 1 year is 46%.
Other financial instruments – derivative financial liabilities
The EU holds a derivative contract (foreign exchange option) covering the devaluation of foreign exchange currency related to loans given by financial institutions under Eastern Partnership SME Finance Facility programme – see note 2.11.2. Moreover, the EU guarantee on equity portfolios held by the EIB
Group led to a financial obligation to cover changes in the value or impairments of underlying investments. As for the other financial instruments financed by the EU Budget, the amount for which the EU is liable under these instruments cannot exceed the amount committed, being the liquidity risk mitigated by that fact.

Annual accounts of the European Union 2020
120
7. RELATED PARTY DISCLOSURES
7.1. RELATED PARTIES
The related parties of the EU are the EU consolidated entities, associates and the key management personnel of these entities. Transactions between these entities take place as part of the normal
operations of the EU and as this is the case, no specific disclosure requirements are necessary for these transactions in accordance with the EU accounting rules.
7.2. KEY MANAGEMENT ENTITLEMENTS
For the purposes of presenting information on related party transactions concerning the key management
personnel of the EU, such persons are shown here under five categories:
Category 1: the Presidents of the European Council, the Commission and the Court of Justice of the European Union
Category 2: the Vice-president of the Commission and High Representative of the EU for Foreign Affairs and Security Policy and the other Vice-presidents of the Commission
Category 3: the Secretary-General of the Council, the Members of the Commission, the Judges and Advocates General of the Court of Justice of the European Union, the President and Members of the General Court, the Ombudsman and the European Data Protection Supervisor
Category 4: the President and Members of the European Court of Auditors
Category 5: the highest-ranking civil servants of the Institutions and Agencies
A summary of their entitlements is given below – further information can be found in the Staff
Regulations published on the Europa website which is the official document describing the rights and obligations of all officials of the EU. Key management personnel have not received any preferential loans from the EU.
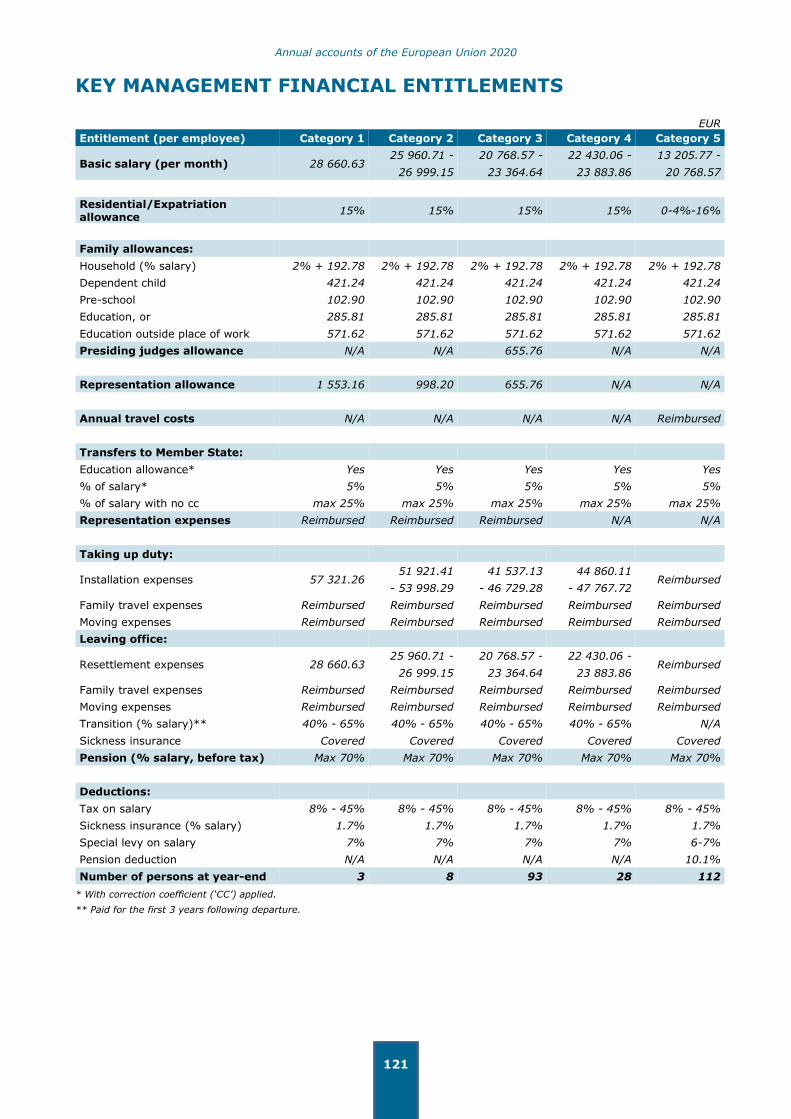
Annual accounts of the European Union 2020
121
KEY MANAGEMENT FINANCIAL ENTITLEMENTS
EUR
Entitlement (per employee) Category 1 Category 2 Category 3 Category 4 Category 5
Basic salary (per month) 28 660.63 25 960.71 - 20 768.57 - 22 430.06 - 13 205.77 -
26 999.15 23 364.64 23 883.86 20 768.57
Residential/Expatriation allowance
15% 15% 15% 15% 0-4%-16%
Family allowances:
Household (% salary) 2% + 192.78 2% + 192.78 2% + 192.78 2% + 192.78 2% + 192.78
Dependent child 421.24 421.24 421.24 421.24 421.24
Pre-school 102.90 102.90 102.90 102.90 102.90
Education, or 285.81 285.81 285.81 285.81 285.81
Education outside place of work 571.62 571.62 571.62 571.62 571.62
Presiding judges allowance N/A N/A 655.76 N/A N/A
Representation allowance 1 553.16 998.20 655.76 N/A N/A
Annual travel costs N/A N/A N/A N/A Reimbursed
Transfers to Member State:
Education allowance* Yes Yes Yes Yes Yes
% of salary* 5% 5% 5% 5% 5%
% of salary with no cc max 25% max 25% max 25% max 25% max 25%
Representation expenses Reimbursed Reimbursed Reimbursed N/A N/A
Taking up duty:
Installation expenses 57 321.26 51 921.41 41 537.13 44 860.11
Reimbursed - 53 998.29 - 46 729.28 - 47 767.72
Family travel expenses Reimbursed Reimbursed Reimbursed Reimbursed Reimbursed
Moving expenses Reimbursed Reimbursed Reimbursed Reimbursed Reimbursed
Leaving office:
Resettlement expenses 28 660.63 25 960.71 - 20 768.57 - 22 430.06 -
Reimbursed 26 999.15 23 364.64 23 883.86
Family travel expenses Reimbursed Reimbursed Reimbursed Reimbursed Reimbursed
Moving expenses Reimbursed Reimbursed Reimbursed Reimbursed Reimbursed
Transition (% salary)** 40% - 65% 40% - 65% 40% - 65% 40% - 65% N/A
Sickness insurance Covered Covered Covered Covered Covered
Pension (% salary, before tax) Max 70% Max 70% Max 70% Max 70% Max 70%
Deductions:
Tax on salary 8% - 45% 8% - 45% 8% - 45% 8% - 45% 8% - 45%
Sickness insurance (% salary) 1.7% 1.7% 1.7% 1.7% 1.7%
Special levy on salary 7% 7% 7% 7% 6-7%
Pension deduction N/A N/A N/A N/A 10.1%
Number of persons at year-end 3 8 93 28 112
* With correction coefficient (‘CC’) applied.
** Paid for the first 3 years following departure.

Annual accounts of the European Union 2020
122
8. EVENTS AFTER THE BALANCE SHEET DATE
At the date of signature of these accounts no material issues had come to the attention of or were reported to the Accounting Officer of the Commission that would require separate disclosure under this section. The accounts and related notes were prepared using the most recently available information and this is reflected in the information presented.

Annual accounts of the European Union 2020
123
9. SCOPE OF CONSOLIDATION
A. CONTROLLED ENTITIES (52)
1. Institutions and consultative bodies (11)
European Parliament European Data Protection Supervisor
European Council European Economic and Social Committee
European Commission European Ombudsman
European Court of Auditors European Committee of the Regions
Court of Justice of the European Union Council of the European Union
European External Action Service
2. EU Agencies (39)
2.1. Executive Agencies (6)
Education, Audiovisual and Culture Executive
Agency (EACEA)
Executive Agency for Small and Medium-sized
Enterprises (EASME)
Consumers, Health, Agriculture and Food Executive Agency (CHAFEA)
European Research Council Executive Agency (ERCEA)
Research Executive Agency (REA) Innovation and Networks Executive Agency (INEA)
2.2. Decentralised Agencies (33)
European Maritime Safety Agency (EMSA) European Food Safety Authority (EFSA)
European Medicines Agency (EMA) European Union Agency for Railways (RAIL)
European Chemicals Agency (ECHA) Community Plant Variety Office (CPVO)
European Institute for Gender Equality (EIGE) European Fisheries Control Agency (EFCA)
European Environment Agency (EEA) European Union Intellectual Property Office (EUIPO)
European Banking Authority (EBA) European Union Aviation Safety Agency (EASA)
European Asylum Support Office (EASO) European Securities and Markets Authority (ESMA)
European Border and Coast Guard Agency
(FRONTEX) European Training Foundation (ETF)
European Union Agency for Law Enforcement Training (CEPOL)
European Foundation for the Improvement of Living and Working Conditions (Eurofound)
European Global Navigation Satellite Systems Agency (GSA)
European Monitoring Centre for Drugs and Drug Addiction (EMCDDA)
European Union Agency for Criminal Justice Cooperation (Eurojust)
European Union Agency for Law Enforcement Cooperation (EUROPOL)
European Agency for Safety and Health at Work (EU-OSHA)
European Union Agency for Fundamental Rights (FRA)
European Centre for Disease Prevention and Control (ECDC)
European Insurance and Occupational Pensions Authority (EIOPA)
European Centre for the Development of Vocational Training (CEDEFOP)
Translation Centre for the Bodies of the European Union (CdT)
European Union Agency for the Cooperation of
Energy Regulators (ACER)
European Joint Undertaking for ITER and the
Development of Fusion Energy (Fusion for Energy) Agency for Support for the Body of European Regulators for Electronic Communications (BEREC Office)
European Union Agency for the Operational Management of Large-Scale IT Systems in the Area of Freedom, Security and Justice (eu-LISA)
European Union Agency for Cybersecurity (ENISA)
3. Other controlled entities (2)
European Coal and Steel Community in Liquidation (ECSC i.L.)
European Institute of Innovation and Technology (EIT)
B. ASSOCIATES (1) European Investment Fund (EIF)

Annual accounts of the European Union 2020
124
MINOR ENTITIES
The entities listed below have not been consolidated using the equity method in the 2020 EU consolidated financial statements on the basis of immateriality:
Bio Based Industries Joint Undertaking (BBI)
BBI is a Public-Private Partnership (PPP) between the EU and the Bio-based Industries Consortium (BIC). The objectives of the BBI are to contribute to a more resource efficient and sustainable low-carbon economy and to increasing economic growth and employment by developing sustainable and competitive
bio-based industries in Europe.
Clean Sky Joint Undertaking (Clean Sky)
Clean Sky is the largest European research programme developing innovative, cutting-edge technology aimed at reducing CO2, gas emissions and noise levels produced by aircraft. Funded by the EU’s Horizon
2020 programme, Clean Sky contributes to strengthening European aero-industry collaboration, global leadership and competitiveness.
Innovative Medicines Initiative Joint Undertaking (IMI)
IMI, a partnership between the European Union and the European pharmaceutical industry, is the world’s biggest public private partnership in life sciences and working to improve health by speeding up the development of, and patient access to, innovative medicines, particularly in areas where there is an unmet medical or social need.
Electronic Components and Systems for European Leadership Joint Undertaking (ECSEL)
ECSEL, a PPP in electronic components and systems, funds research, development and innovation projects for world-class expertise in electronic components and systems, thus contributing to the
development of a strong and globally competitive electronics components and systems industry in the
European Union.
Fuel Cells Hydrogen Joint Undertaking (FCH)
FCH is a PPP supporting research, technological development and demonstration (RTD) activities in fuel cell and hydrogen energy technologies in Europe. Its aim is to accelerate the market introduction of these technologies, realising their potential as an instrument in achieving a carbon-lean energy system.
Single European Sky ATM Research Joint Undertaking (SESAR)
SESAR is a PPP responsible for the modernisation of the European air traffic management (ATM) system by coordinating and concentrating all ATM relevant research and innovation efforts in the EU.
Shift2Rail Joint Undertaking (Shift2Rail)
Shift2Rail is the first European rail joint technology initiative to seek focused research and innovation (R&I) and market-driven solutions by accelerating the integration of new and advanced technologies into innovative rail product solutions.
EuroHPC Joint Undertaking (EuroHPC)
The EuroHPC Joint Undertaking is a joint initiative between the EU, European countries and private partners to develop a world-class supercomputing infrastructure and make Europe a leader in high-performance computing (HPC).
The annual accounts of the above entities are publicly available on their respective websites.

Annual accounts of the European Union 2020
125
EUROPEAN UNION
FINANCIAL YEAR 2020
BUDGETARY IMPLEMENTATION REPORTS AND EXPLANATORY NOTES
It should be noted that due to the rounding of figures into millions of euros, some financial data in the
tables below may appear not to add-up.
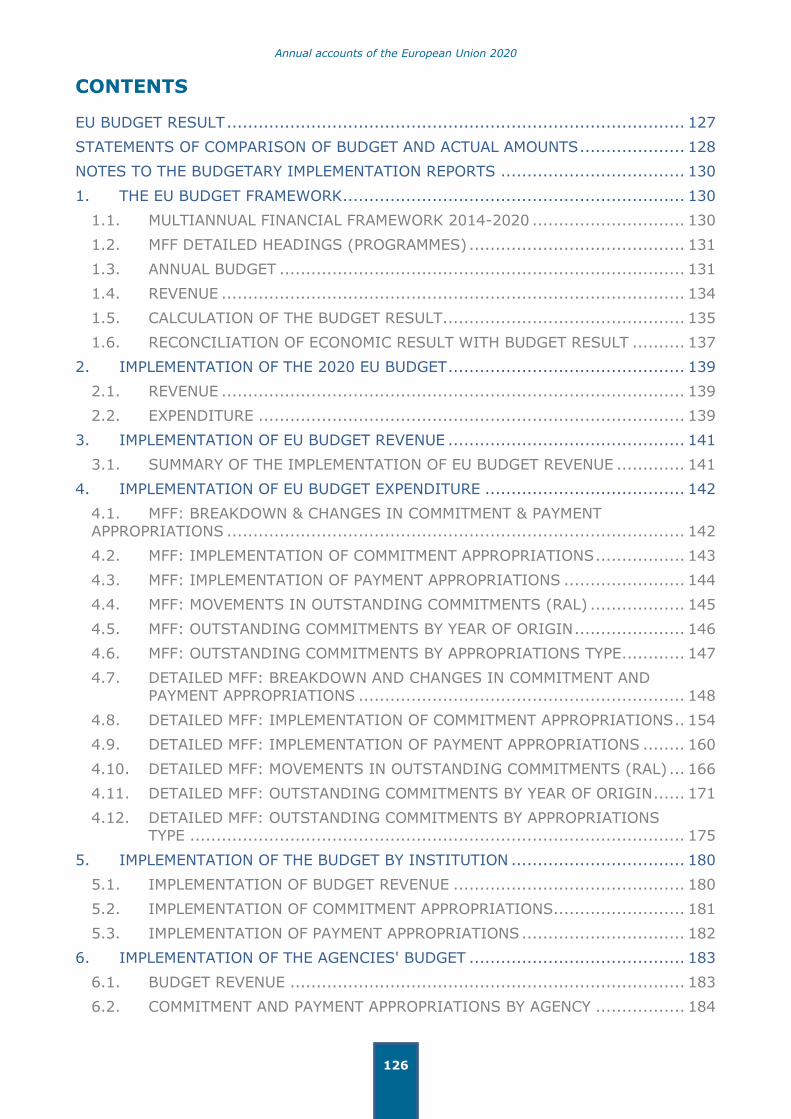
Annual accounts of the European Union 2020
126
CONTENTS
EU BUDGET RESULT ....................................................................................... 127
STATEMENTS OF COMPARISON OF BUDGET AND ACTUAL AMOUNTS .................... 128
NOTES TO THE BUDGETARY IMPLEMENTATION REPORTS ................................... 130
1. THE EU BUDGET FRAMEWORK ................................................................. 130
1.1. MULTIANNUAL FINANCIAL FRAMEWORK 2014-2020 ............................. 130
1.2. MFF DETAILED HEADINGS (PROGRAMMES) ......................................... 131
1.3. ANNUAL BUDGET ............................................................................. 131
1.4. REVENUE ........................................................................................ 134
1.5. CALCULATION OF THE BUDGET RESULT .............................................. 135
1.6. RECONCILIATION OF ECONOMIC RESULT WITH BUDGET RESULT .......... 137
2. IMPLEMENTATION OF THE 2020 EU BUDGET ............................................. 139
2.1. REVENUE ........................................................................................ 139
2.2. EXPENDITURE ................................................................................. 139
3. IMPLEMENTATION OF EU BUDGET REVENUE ............................................. 141
3.1. SUMMARY OF THE IMPLEMENTATION OF EU BUDGET REVENUE ............. 141
4. IMPLEMENTATION OF EU BUDGET EXPENDITURE ...................................... 142
4.1. MFF: BREAKDOWN & CHANGES IN COMMITMENT & PAYMENT
APPROPRIATIONS ....................................................................................... 142
4.2. MFF: IMPLEMENTATION OF COMMITMENT APPROPRIATIONS ................. 143
4.3. MFF: IMPLEMENTATION OF PAYMENT APPROPRIATIONS ....................... 144
4.4. MFF: MOVEMENTS IN OUTSTANDING COMMITMENTS (RAL) .................. 145
4.5. MFF: OUTSTANDING COMMITMENTS BY YEAR OF ORIGIN ..................... 146
4.6. MFF: OUTSTANDING COMMITMENTS BY APPROPRIATIONS TYPE ............ 147
4.7. DETAILED MFF: BREAKDOWN AND CHANGES IN COMMITMENT AND
PAYMENT APPROPRIATIONS .............................................................. 148
4.8. DETAILED MFF: IMPLEMENTATION OF COMMITMENT APPROPRIATIONS .. 154
4.9. DETAILED MFF: IMPLEMENTATION OF PAYMENT APPROPRIATIONS ........ 160
4.10. DETAILED MFF: MOVEMENTS IN OUTSTANDING COMMITMENTS (RAL) ... 166
4.11. DETAILED MFF: OUTSTANDING COMMITMENTS BY YEAR OF ORIGIN ...... 171
4.12. DETAILED MFF: OUTSTANDING COMMITMENTS BY APPROPRIATIONS TYPE .............................................................................................. 175
5. IMPLEMENTATION OF THE BUDGET BY INSTITUTION ................................. 180
5.1. IMPLEMENTATION OF BUDGET REVENUE ............................................ 180
5.2. IMPLEMENTATION OF COMMITMENT APPROPRIATIONS......................... 181
5.3. IMPLEMENTATION OF PAYMENT APPROPRIATIONS ............................... 182
6. IMPLEMENTATION OF THE AGENCIES' BUDGET ......................................... 183
6.1. BUDGET REVENUE ........................................................................... 183
6.2. COMMITMENT AND PAYMENT APPROPRIATIONS BY AGENCY ................. 184

Annual accounts of the European Union 2020
127
EU BUDGET RESULT
EUR million
Note 2020 2019
a Revenue for the financial year 174 306 163 918
b Payments against current year appropriations (171 721) (157 428)
c Payment appropriations carried over to year N+1 (2 086) (1 615)
d Cancellation of unused appropriations carried over from year N-1 78 75
e Evolution of assigned revenue (B)-(A) 1 398 (1 736)
Unused appropriations at the end of current year (A) 7 694 9 092
Unused appropriations at the end of previous year (B) 9 092 7 356
f Exchange rate differences for the year (207) 4
Budget result 1 768 3 217
The budget result of the EU is returned to the Member States in 2021 through deduction of their amounts
due. It is calculated in accordance with Article 1(1) of Council Regulation No 608/2014 laying down implementing measures for the system of own resources. More information can be found under section 1.5 Calculation of the budget result.
a. Revenue for the financial year: table 3.1 “Summary of the implementation of EU Budget Revenue”, column 8 “Total Revenue”.
b. Payments against current year appropriations: table 4.3 “MFF – Implementation of Payment appropriations”, column 2 “Payments made from adopted budget and column 4 “Payments made
from assigned revenue”.
c. Payment appropriations carried over to year N+1: table 4.3 “MFF – Implementation of Payment appropriations”, column 7 automatic carry-overs plus column 8 carry-over by decision.
d. Cancellation of unused payment appropriations carried over from year N-1: takes into account the amount of payment appropriations carried over (automatically and on decision) at the end of previous year and the current year’s “Payments made from carryovers” as in column 3 of table
4.3 “MFF – Implementation of Payment appropriations”.
e. Evolution of the total assigned revenue appropriations at year-end: calculates the difference of the amount of assigned revenue appropriations at the end of previous year (plus) and the amount of assigned revenue appropriations at the end of the current year (as in column 9 of table 4.3 “MFF – Implementation of Payment appropriations” - minus) to obtain the net variation
of assigned revenue in the current year.
f. Exchange rate differences include realised and non-realised exchange rate differences.
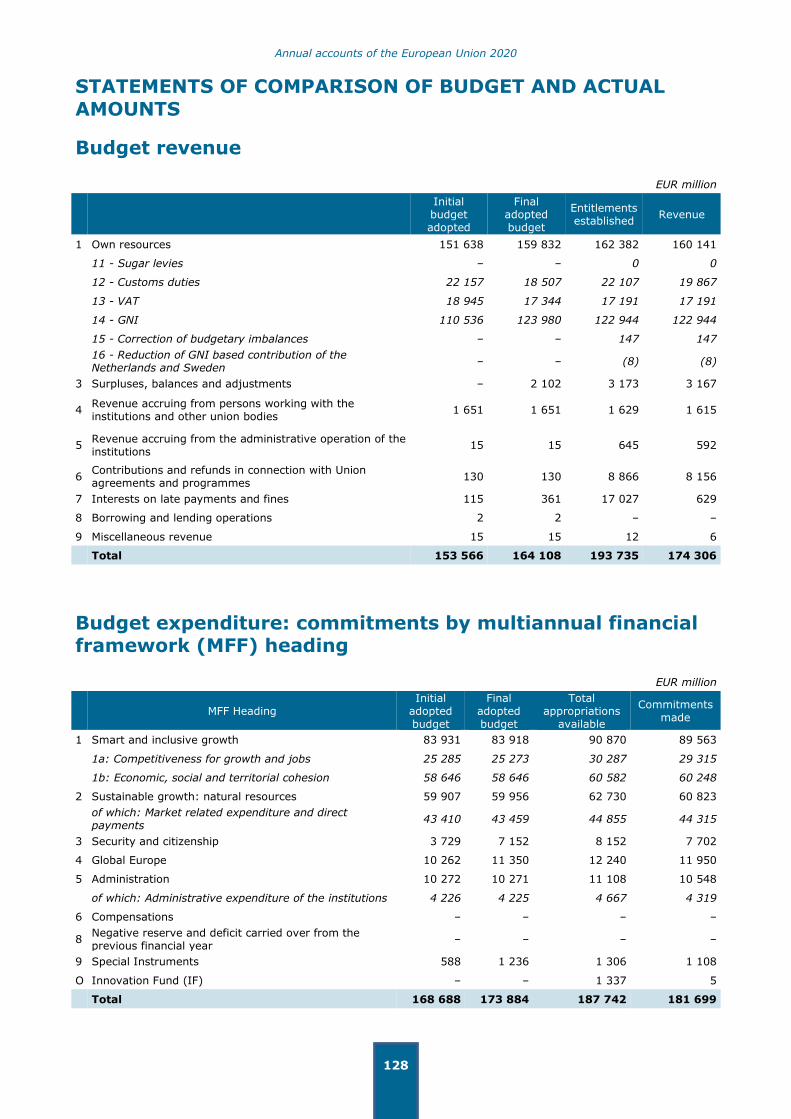
Annual accounts of the European Union 2020
128
STATEMENTS OF COMPARISON OF BUDGET AND ACTUAL
AMOUNTS
Budget revenue
EUR million
Initial budget adopted
Final adopted budget
Entitlements established
Revenue
1 Own resources 151 638 159 832 162 382 160 141
11 - Sugar levies – – 0 0
12 - Customs duties 22 157 18 507 22 107 19 867
13 - VAT 18 945 17 344 17 191 17 191
14 - GNI 110 536 123 980 122 944 122 944
15 - Correction of budgetary imbalances – – 147 147
16 - Reduction of GNI based contribution of the Netherlands and Sweden
– – (8) (8)
3 Surpluses, balances and adjustments – 2 102 3 173 3 167
4 Revenue accruing from persons working with the institutions and other union bodies
1 651 1 651 1 629 1 615
5 Revenue accruing from the administrative operation of the institutions
15 15 645 592
6 Contributions and refunds in connection with Union agreements and programmes
130 130 8 866 8 156
7 Interests on late payments and fines 115 361 17 027 629
8 Borrowing and lending operations 2 2 – –
9 Miscellaneous revenue 15 15 12 6
Total 153 566 164 108 193 735 174 306
Budget expenditure: commitments by multiannual financial framework (MFF) heading
EUR million
MFF Heading Initial
adopted budget
Final adopted budget
Total appropriations
available
Commitments made
1 Smart and inclusive growth 83 931 83 918 90 870 89 563
1a: Competitiveness for growth and jobs 25 285 25 273 30 287 29 315
1b: Economic, social and territorial cohesion 58 646 58 646 60 582 60 248
2 Sustainable growth: natural resources 59 907 59 956 62 730 60 823
of which: Market related expenditure and direct payments
43 410 43 459 44 855 44 315
3 Security and citizenship 3 729 7 152 8 152 7 702
4 Global Europe 10 262 11 350 12 240 11 950
5 Administration 10 272 10 271 11 108 10 548
of which: Administrative expenditure of the institutions 4 226 4 225 4 667 4 319
6 Compensations – – – –
8 Negative reserve and deficit carried over from the previous financial year
– – – –
9 Special Instruments 588 1 236 1 306 1 108
O Innovation Fund (IF) – – 1 337 5
Total 168 688 173 884 187 742 181 699

Annual accounts of the European Union 2020
129
Budget expenditure: payments by multiannual financial
framework (MFF) heading
EUR million
MFF Heading Initial
adopted budget
Final adopted budget
Total appropriations
available
Payments made
1 Smart and inclusive growth 72 354 77 278 88 334 83 541
1a: Competitiveness for growth and jobs 22 308 21 753 28 726 24 057
1b: Economic, social and territorial cohesion 50 046 55 525 59 607 59 484
2 Sustainable growth: natural resources 57 904 58 772 61 448 60 595
of which: Market related expenditure and direct payments
43 380 43 419 45 018 44 456
3 Security and citizenship 3 685 6 293 7 331 6 333
4 Global Europe 8 929 10 386 11 928 11 412
5 Administration 10 275 10 273 11 941 10 319
of which: Administrative expenditure of the institutions
4 226 4 225 5 168 4 134
6 Compensations – – – –
8 Negative reserve and deficit carried over from the previous financial year
– – – –
9 Special Instruments 419 1 106 1 128 1 108
O Innovation Fund (IF) – – 1 337 1
Total 153 566 164 108 183 446 173 310
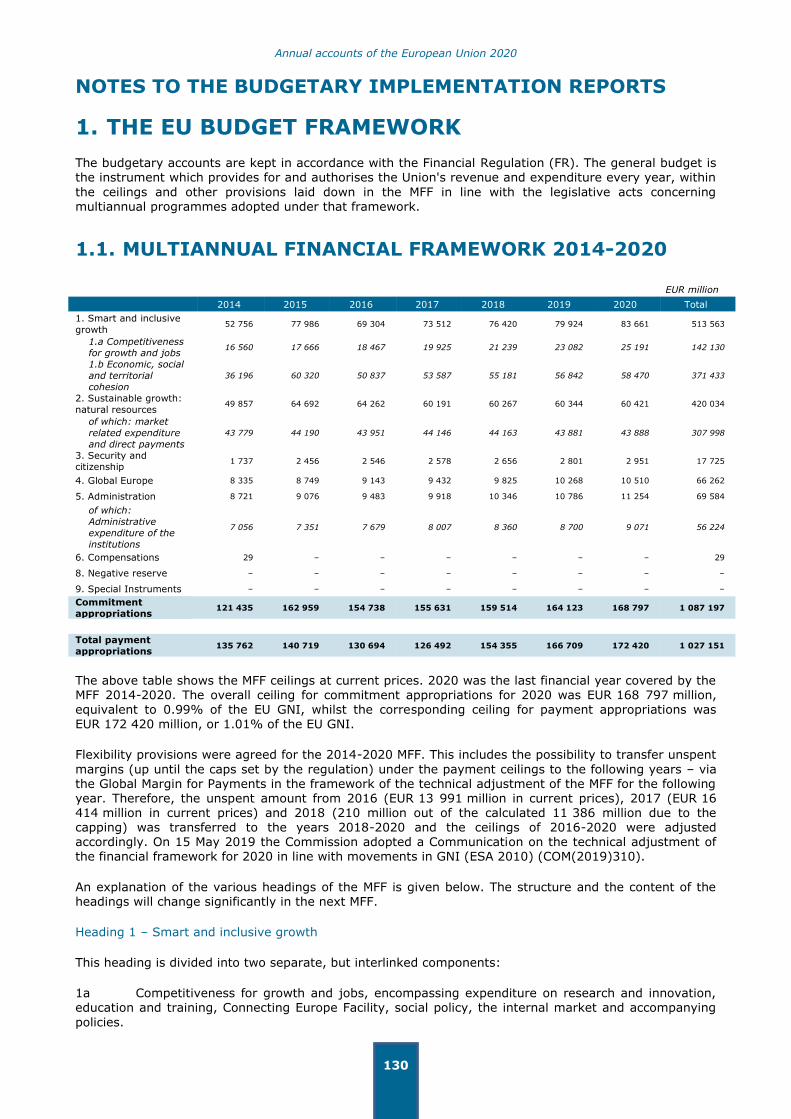
Annual accounts of the European Union 2020
130
NOTES TO THE BUDGETARY IMPLEMENTATION REPORTS
1. THE EU BUDGET FRAMEWORK
The budgetary accounts are kept in accordance with the Financial Regulation (FR). The general budget is the instrument which provides for and authorises the Union's revenue and expenditure every year, within
the ceilings and other provisions laid down in the MFF in line with the legislative acts concerning multiannual programmes adopted under that framework.
1.1. MULTIANNUAL FINANCIAL FRAMEWORK 2014-2020
EUR million
2014 2015 2016 2017 2018 2019 2020 Total
1. Smart and inclusive
growth 52 756 77 986 69 304 73 512 76 420 79 924 83 661 513 563
1.a Competitiveness
for growth and jobs 16 560 17 666 18 467 19 925 21 239 23 082 25 191 142 130
1.b Economic, social
and territorial
cohesion
36 196 60 320 50 837 53 587 55 181 56 842 58 470 371 433
2. Sustainable growth:
natural resources 49 857 64 692 64 262 60 191 60 267 60 344 60 421 420 034
of which: market
related expenditure
and direct payments
43 779 44 190 43 951 44 146 44 163 43 881 43 888 307 998
3. Security and citizenship
1 737 2 456 2 546 2 578 2 656 2 801 2 951 17 725
4. Global Europe 8 335 8 749 9 143 9 432 9 825 10 268 10 510 66 262
5. Administration 8 721 9 076 9 483 9 918 10 346 10 786 11 254 69 584
of which:
Administrative
expenditure of the
institutions
7 056 7 351 7 679 8 007 8 360 8 700 9 071 56 224
6. Compensations 29 – – – – – – 29
8. Negative reserve – – – – – – – –
9. Special Instruments – – – – – – – –
Commitment
appropriations 121 435 162 959 154 738 155 631 159 514 164 123 168 797 1 087 197
Total payment
appropriations 135 762 140 719 130 694 126 492 154 355 166 709 172 420 1 027 151
The above table shows the MFF ceilings at current prices. 2020 was the last financial year covered by the MFF 2014-2020. The overall ceiling for commitment appropriations for 2020 was EUR 168 797 million, equivalent to 0.99% of the EU GNI, whilst the corresponding ceiling for payment appropriations was
EUR 172 420 million, or 1.01% of the EU GNI.
Flexibility provisions were agreed for the 2014-2020 MFF. This includes the possibility to transfer unspent
margins (up until the caps set by the regulation) under the payment ceilings to the following years – via the Global Margin for Payments in the framework of the technical adjustment of the MFF for the following year. Therefore, the unspent amount from 2016 (EUR 13 991 million in current prices), 2017 (EUR 16 414 million in current prices) and 2018 (210 million out of the calculated 11 386 million due to the capping) was transferred to the years 2018-2020 and the ceilings of 2016-2020 were adjusted accordingly. On 15 May 2019 the Commission adopted a Communication on the technical adjustment of the financial framework for 2020 in line with movements in GNI (ESA 2010) (COM(2019)310).
An explanation of the various headings of the MFF is given below. The structure and the content of the headings will change significantly in the next MFF.
Heading 1 – Smart and inclusive growth
This heading is divided into two separate, but interlinked components:
1a Competitiveness for growth and jobs, encompassing expenditure on research and innovation, education and training, Connecting Europe Facility, social policy, the internal market and accompanying
policies.
Annual accounts of the European Union 2020
131
1b Economic, social and territorial cohesion, designed to enhance convergence of the least
developed Member States and regions, to complement the EU strategy for sustainable development
outside the less prosperous regions and to support inter regional cooperation.
Heading 2 – Sustainable growth: natural resources
Heading 2 includes the common agricultural and fisheries policies, and the environmental measures, in particular the Life + program.
Heading 3 – Security and citizenship
Heading 3 reflects the growing importance attached to fields where the EU has been assigned particular tasks – justice and home affairs, border protection, immigration and asylum policy, public health and consumer protection, culture, youth, information and dialogue with citizens.
Heading 4 – Global Europe
Heading 4 covers all external actions, including development cooperation, humanitarian aid, pre-accession and neighbourhood instruments. The EDF remains outside the EU budget and is not part of the MFF.
Heading 5 - Administration
This heading covers administrative expenditure for all institutions, pensions and the European Schools. For the Institutions other than the Commission, these costs make up the totality of their expenditure.
Heading 6 - Compensations
In accordance with the political agreement that new Member States should not become net contributors
to the budget at the very beginning of their membership, compensation is foreseen under this heading. This amount is available as transfers to new Member States to balance their budgetary receipts and
contributions.
Heading 9 – Special instruments
Flexibility mechanisms enable the EU to mobilise the necessary funds to react to unforeseen events such as crisis and emergency situations. Their scope, financial allocation and operating modalities are provided for in the MFF regulation and the Inter institutional Agreement. They ensure that budgetary resources can respond to evolving priorities, so that every euro is used where it is most needed. Most of the
flexibility mechanisms are therefore kept outside the MFF and the funding can be mobilised above the expenditure ceilings.
The MFF 2021-2027 will amount to EUR 1 074 billion for the EU27 in 2018 prices, including the
integration of the European Development Fund (EDF). Together with the Next Generation EU (NGEU) recovery instrument of EUR 750 billion, it will allow the EU to provide an unprecedented EUR 1.8 trillion of funding over the coming years to support recovery from the COVID-19 pandemic, and to support the EU's long-term priorities across different policy areas.
1.2. MFF DETAILED HEADINGS (PROGRAMMES)
The headings of the MFF are further broken down into detailed headings, corresponding to the main
spending programmes (e.g. Horizon 2020, Erasmus+ etc.). Underlying legal bases for budget implementation are adopted at this programme level. Programmes are the commonly used structure for reporting on implementation and results. Tables by programme are available in the budgetary implementation reports (see tables 4.7 - 4.12 below).
1.3. ANNUAL BUDGET
The budget adoption procedure is laid down in Article 314 of the Treaty on the Functioning of the EU. The following diagram presents the deadlines as well as the steps of the budget adoption.

Annual accounts of the European Union 2020
132
Treaty timetable1
1 September Draft Budget (DB) Commission
1 October Council’s position on the DB Council
European Parliament’s position on Council’s position Parliament
13 November
(42 days)
EP approves
Majority of votes cast
or takes no decision
EP adopts amendments
Majority of component members
▼ ▼
Budget adopted ◀
Committee accepts Parliament’s
amendments within 10 days
◀ Conciliation Committee
is convened2
▼
13 November
to 4 December (21 days)
Conciliation Committee agrees to a Joint Text Conciliation Committee
YES
within 14 days
NO
within 14 days
▼ ▼
18 December (14 days)
Parliament and Council approve (or fail to
decide)
——— OR ———
Council rejects,
Parliament has final word3
Council approves,
Parliament rejects
——— OR ———
Council and Parliament
reject
▶
Draft Budget rejected
Commission submits a new DB
▼
Budget adopted
(1) In practice, the three institutions endeavour to present their respective documents earlier in the year in order to smooth the process.
(2) The Conciliation Committee is composed of the members of the Council or their representatives and an equal number of members representing the European Parliament. The

Annual accounts of the European Union 2020
133
Commission takes part in the Conciliation Committee’s proceedings and takes all the necessary
initiatives to reconcile the positions of the European Parliament and the Council.
(3) The European Parliament approves the joint text and then, within 14 days of the Council’s rejection, decides (by a majority of its component members and 3/5 of the votes cast) to confirm all or some of its amendments.
The budget structure for the Commission consists of administrative and operational appropriations. The other Institutions have only administrative appropriations. Furthermore, the budget distinguishes
between two types of appropriations: non-differentiated and differentiated. Non-differentiated appropriations are used to finance operations of an annual nature (which comply with the principle of annuality). Differentiated appropriations are used in order to reconcile the principle of annuality with the need to manage multiannual operations. Differentiated appropriations are split into commitment and payment appropriations:
- commitment appropriations: cover the total cost of the legal obligations, entered into for the current
financial year, for operations extending over a number of years. However, budgetary commitments
for actions extending over more than one financial year may be broken down over several years, into annual instalments, where the basic act so provides.
- payment appropriations: cover expenditure arising from commitments entered into in the current
financial year and/or earlier financial years.
In the accounts, the types of funding are grouped into two main items:
Final adopted budget appropriations; and
Additional appropriations containing:
– Carry-overs from previous year (the financial regulation allows, for a limited number of cases, to carry unspent amounts from the previous year into the current year); and
– Assigned revenue arising from reimbursements, contributions from third parties/countries to EU
programmes and work performed for third parties; these are assigned directly to the corresponding expenditure budget lines and constitute the third pillar of funding.
All funding types together form the available appropriations.

Annual accounts of the European Union 2020
134
1.4. REVENUE
1.4.1. Own resources revenue
The vast majority of revenue comes from own resources, which consist of the following categories:
(1) Traditional own resources (TOR): account for +/- 14% of own resource revenue. As for (2) and (3) this percentage is referring to MFF period 2014-2020.
(2) Value added tax (VAT) based resource: accounts for +/- 13% of own resource revenue.
(3) Gross national income (GNI) based resource: accounts for +/- 73% of own resource revenue.
The allocation of own resources is made in accordance with the rules laid down in the Council Decision No. 2014/335/EU, Euratom of 26 May 2014 on the system of the EU's own resources (ORD 2014). This
decision entered into force on 1 October 2016 and was applied retroactively from 1 January 2014.
The total amount of own resources allocated to the Union to cover annual appropriations for payments shall not exceed 1.20% of the sum of all the Member States' GNIs.
With the start of the new MFF, Council Decision (EU, Euratom) 2020/2053 of 14 December 2020 on the system of own resources of the EU (Own Resources Decision 2020), once ratified by all Member States, entered into force on 1 June 2021 and replaces the current Own Resources Decision retroactively from 1
January 2021.
1.4.2. Traditional own resources (TOR)
TOR consist of customs duties (levied on imports from third countries) levied on economic operators and collected by Member States on behalf of the EU. However, Member States keep 20% as a compensation for their collection costs. All established traditional own resource amounts must be entered in one or other of the accounts kept by the competent authorities:
- In the ordinary accounts provided for in Article 6(3) of Regulation No 609/2014: all amounts recovered or guaranteed.
- In the separate accounts provided for also in the above Article: all amounts not yet recovered and/or not guaranteed; amounts guaranteed but challenged may also be entered in this account.
Traditional own resources must be entered in the Commission's account with its treasury or national central bank by the Member State at the latest on the first working day following the 19th day of the second month following the month during which the entitlement was established (or recovered in the
case of the separate account).
1.4.3. Value added tax (VAT)
Value added tax (VAT) is levied on Member States' VAT bases, which are harmonised for this purpose in accordance with EU rules. However, the VAT base is capped at 50% of each Member State’s GNI. The uniform VAT rate applied is fixed at 0.30% except for Germany, the Netherlands and Sweden that benefit from a reduced rate of 0.15%.
1.4.4. Gross national income (GNI)
The resource based on gross national income (GNI) is used to finance the part of the budget not covered by any other sources of revenue. The same percentage rate is levied on each Member States' GNI, which is established in accordance with EU rules.
VAT and GNI-based resources are determined on the basis of forecasts of relevant bases made when the draft budget is prepared. These forecasts are subsequently revised and updated during the budget year
in question, by means of an amending budget. Differences between the amounts due by the Member States by reference to the actual bases, and the sums actually paid on the basis of the (revised)

Annual accounts of the European Union 2020
135
forecasts, either positive or negative, are called by the Commission from the Member States for the first
working day of June of the second year following the budget year in question. Corrections may still be
made to the actual VAT and GNI bases during the subsequent four years, unless a reservation is issued. These reservations have to be seen as potential claims on the Member States for uncertain amounts, as their financial impact cannot be estimated with accuracy. When the exact amount can be determined, the corresponding VAT and GNI-based resources are called either in connection with the VAT and GNI balances exercise or by individual calls for funds.
1.4.5. UK correction
A budgetary imbalance correction mechanism in favour of the United Kingdom (reducing their own resource payments while increasing the payments of other Member States) was instituted by the European Council in Fontainebleau (June 1984). Germany, Austria, Sweden and Netherlands benefitted from a reduced financing of the UK correction (restricted to one fourth of their normal share). The United
Kingdom’s correction and the related financing arrangements expired at the end of 2020 with its
withdrawal from the EU.
1.4.6. Gross reduction
The European Council of 7-8 February 2013 concluded that Denmark, the Netherlands and Sweden should benefit from gross reductions in their annual contributions based on GNI for the period 2014-2020 while Austria only benefitted from gross reductions for the period 2014-2016. The annual reductions are as follows: Denmark EUR 130 million, the Netherlands EUR 695 million and Sweden EUR 185 million. For
the period 2021-2027, a gross reduction in the annual GNI-based contributions will benefit Austria, Denmark, Germany, the Netherlands and Sweden.
1.5. CALCULATION OF THE BUDGET RESULT
The budget result of the EU is returned to the Member States during the following year through deduction of their amounts due for that year.
The amounts of own resources entered in the accounts are those credited during the course of the year to the accounts opened in the Commission's name by the governments of the Member States. Revenue comprises also, in the case of a surplus, the budget result for the previous financial year. The other
revenue entered in the accounts is the amount actually received during the course of the year.
For the purposes of calculating the budget result for the year, expenditure comprises payments made
against the year's appropriations plus any of the appropriations for that year that are carried over to the following year. Payments made against the year's appropriations means payments that are made by the Accounting Officer by 31 December of the financial year. For the EAGF, payments are those effected by the Member States between 16 October N-1 and 15 October N, provided that the Accounting Officer was notified of the commitment and authorisation by 31 January N+1. EAGF expenditure may be subject to a
conformity decision following controls in the Member States.
The budget result comprises two elements: the result of the EU and the result of the participation of the EFTA countries belonging to the European Economic Area (EEA). In accordance with Article 1(1) of Regulation No 608/2014 laying down implementing measures for the system of own resources, this result represents the difference between:
- total revenue received for the financial year; and
- total payments made against current year's appropriations plus the total amount of that year's appropriations carried over to the following year.
The following are added to or deducted from the resulting figure:
- the net balance of cancellations of payment appropriations carried over from previous years and any payments which, because of fluctuations in the euro rate, exceed non-differentiated appropriations carried over from the previous year;

Annual accounts of the European Union 2020
136
- the evolution of assigned revenue; and
- the net exchange rate gains or losses recorded during the year.
Appropriations carried over from the previous financial year in respect of contributions by and work for third parties, which by definition never lapse, are included as additional appropriations for the financial year. This explains the difference between carryovers from the previous year in the year N budget
implementation reports and those carried over to the following year in the year N-1 budget implementation reports. Commitment appropriations made available again following the repayment of payments on account are disregarded when calculating the budget result.
Payment appropriations carried over include: automatic carry-overs and carry-overs by decision. The cancellation of unused payment appropriations carried over from the previous year comprises the cancellations of appropriations carried over automatically and by decision.

Annual accounts of the European Union 2020
137
1.6. RECONCILIATION OF ECONOMIC RESULT WITH
BUDGET RESULT
EUR million
2020 2019
ECONOMIC RESULT OF THE YEAR 57 416 4 796
Revenue
Entitlements established in current year but not yet collected (1 295) (6 193)
Entitlements established in previous years and collected in current year 3 886 8 656
Accrued revenue (net) (48 762) 3 341
(46 171) 5 804
Expenses
Accrued expenses (net) 8 258 8 394
Expenses prior year paid in current year (457) (3 832)
Net-effect pre-financing (17 547) (10 981)
Payment appropriations carried over to next year (2 268) (3 532)
Payments made from carry-overs & cancellation of unused payment appropriations
3 248 1 924
Movement in provisions 3 873 3 801
Other (4 441) (3 076)
(9 334) (7 304)
Economic result Agencies and ECSC i.L. (142) (79)
BUDGET RESULT OF THE YEAR 1 768 3 217
In accordance with the Financial Regulation, the economic result of the year is calculated on the basis of accrual accounting principles (EU Accounting Rules), while the budget result is based on modified cash
accounting rules. As the economic result and the budget result cover the same underlying transactions – the exception being the other (non-budgetary) sources of revenue and expenditure of the agencies and the ECSC in Liquidation which are included in the economic result only (see note 6) – the reconciliation of the economic result of the year with the budget result of the year serves as a useful consistency check.
Reconciling items – Revenue
The actual budgetary revenue for a financial year corresponds to the revenue collected from entitlements
established in the course of the year and amounts collected from entitlements established in previous years. Therefore the entitlements established in the current year but not yet collected are to be deducted from the economic result for reconciliation purposes as they do not form part of budgetary revenue. On
the contrary the entitlements established in previous years and collected in current year must be added to the economic result for reconciliation purposes.
The accrued revenue mainly consists of accrued revenue related to the UK’s withdrawal from the EU, the Innovation Fund, financial corrections, own resources, interests and dividends. Only the net effect, i.e.
accrued revenue for current year minus reversal accrued revenue from previous year, is taken into consideration.
Reconciling items – Expenditure
The accrued expenses mainly consists of accruals made for year-end cut-off purposes, i.e. eligible expenses incurred by beneficiaries of EU funds but not yet reported to the Commission. Only the net-effect, i.e. accrued expenses for current year minus the reversal of accrued expenses from the previous year, is taken into consideration. Payments made in the current year relating to invoices registered in
prior years are part of current year's budgetary expenditure and therefore must be added to the economic result for reconciliation purposes.
The net effect of pre-financing is the combination of (1) the new pre-financing amounts paid in the current year and recognised as budgetary expenditure of the year and (2) the clearing of the pre-financing through eligible costs accepted during the current year. The latter represent an expense in accrual terms but not in the budgetary accounts since the payment of the initial pre-financing had
already been considered as a budgetary expenditure at the time of its payment.
Annual accounts of the European Union 2020
138
As well as the payments made against the year's appropriations, the appropriations for that year that are
carried forward to the next year also need to be taken into account in calculating the budget result for
the year (in accordance with Article 1(1) of Regulation No 608/2014). The same applies for the budgetary payments made in the current year from carry-overs from previous years, and the cancellation of unused payment appropriations.
The movement in provisions relates to year-end estimates made in the financial statements (employee benefits mainly) that do not impact the budgetary accounts. Other reconciling amounts comprise different
elements such as asset amortisation/depreciation, asset acquisitions, capital lease payments and financial participations for which the budgetary and accrual accounting treatments differ.
Reconciling item – Economic result Agencies and ECSC in Liquidation
The budget result of the year is a non-consolidated figure and does not include the other (non-budgetary) sources of revenue and expenditure of the consolidated agencies and the ECSC i.L. (see note 6). To
reconcile the economic result of the year – a consolidated figure which includes these amounts – with the budgetary result of the year, the whole consolidated economic result of the year of the agencies and the
ECSC i.L. is presented as a reconciling item.

Annual accounts of the European Union 2020
139
2. IMPLEMENTATION OF THE 2020 EU BUDGET
2.1. REVENUE
In the initial adopted EU budget, signed by the President of the European Parliament on 27 November 2019, the amount of payment appropriations was EUR 153 566 million and the amount to be financed by
own resources totalled EUR 151 638 million. The revenue and expenditure estimates in the initial budget are typically adjusted during the budgetary year, such modifications being presented in amending budgets. Adjustments in the GNI-based own resources ensure that budgeted revenue matches exactly budgeted expenditure. In accordance with the principle of equilibrium, budget revenue and expenditure (payment appropriations) must be in balance.
During 2020, nine amending budgets were adopted. Taking these into account, the final adopted revenue
for 2020 amounted to EUR 164 108 million and the total financed by own resources was EUR 159 832 million. The main factor for the increase of Member States' contributions in 2020 was the increase of payment appropriations (EUR 10 542 million).
As far as the own resources result is concerned, the collection of traditional own resources was close to the forecasted amounts.
The final Member States' VAT and GNI payments also correspond closely to the final budgetary estimate. The differences between the forecasted amounts and the amounts actually paid are due to the differences
between the euro rates used for budgetary purposes and the rates in force at the time when the Member States outside the EMU actually made their payments.
For the VAT and GNI balances the rules are set out in Article 10 b of the Making Available Regulation (Regulation 609/2014). The procedure does not entail a budgetary amendment and therefore the
Commission directly requests the Member States to pay the net amounts. The impact for the EU budget is close to zero due to this netting system.
The title "Contributions and refunds in connection with EU agreements and programmes" concerns mainly
revenue from financial corrections (ESIF, EAGF and EAFRD), the participation of third countries in research programs, the clearance of accounts in agricultural funds and other contributions and refunds to EU programs/activities. A substantial part of this total is made up of assigned revenue, which typically gives rise to the entering of additional appropriations on the expenditure side.
The revenue from fines relates mainly to fines in the field of competition.
2.2. EXPENDITURE
The EU budget has an important role to support the delivery of the Union's policies and priorities. Despite its limited amount, representing around 2% of all public spending in the Union, it complements national budgets and has a clear focus on investment and additionality. It is a key tool among the wide set of
European-level policy and regulatory instruments, which all EU members have agreed upon, translated into a MFF containing the different programmes and maximum expenditure ceilings.
The EU budget for 2020, adopted on 27th November 2019, confirms that the EU is directing money to where the needs are. In 2020, the biggest part of the EU budget went to boost sustainable growth and reduce the economic gaps between regions, stimulate the creation of jobs, fight climate change, and address the socio-economic impact of the COVID-19 pandemic in the EU, as well as provide assistance to
third countries.
2020 was the last year of the 2014-2020 MFF and the Commission used all remaining possibilities to
mobilize additional funds to reinforce COVID-19-related actions across the budget and to support Member States with additional liquidity. The implementation was carefully monitored and managed, which resulted in virtually full implementation of almost all appropriations.
Appropriations established in the final adopted budget were EUR 173.9 billion (4.6% higher compared to the 2019 budget) for commitments, and EUR 164.1 billion (10.5% higher) for payments, corresponding
to 1.00% and 0.90% of EU gross national income (GNI), respectively.

Annual accounts of the European Union 2020
140
All headings reached high levels of implementation in 2020. The 2020 implementation for all types of
appropriations (budget, carry-overs from previous year and assigned revenue) was 97% for
commitments and 94% for payments. Implementation rates excluding assigned revenue showed full implementation in 2020 (99.5% for commitment appropriations and 98.5% for payment appropriations).
Outstanding commitments (sometimes referred to as RAL - reste à liquider), which are committed amounts not yet paid for, stood at EUR 303.2 billion at the end of 2020. An increase from the 2019 level had been expected, given the difference between budgeted commitment and payment appropriations
(EUR 9.8 billion) in the final adopted budget and taking into account the fact that an increase in outstanding commitments constitutes a normal evolution, as commitment appropriations increase every year as foreseen in the MFF. The increase in outstanding commitments compared to 2019 was EUR 5.5 billion.

Annual accounts of the European Union 2020
141
3. IMPLEMENTATION OF EU BUDGET REVENUE
3.1. SUMMARY OF THE IMPLEMENTATION OF EU BUDGET REVENUE
EUR million
Income
appropriations Entitlements established Revenue
Receipts as % of budget
Out- standing
Title Initial
adopted budget
Final adopted budget
Current year
Carried over
Total On
entitlements of current year
On entitlements carried over
Total
1 2 3 4 5=3+4 6 7 8=6+7 9=8/2 10=5-8
1 Own resources 151 638 159 832 160 092 2 291 162 382 160 086 55 160 141 100 % 2 241
3 Surpluses, balances and adjustments – 2 102 3 167 7 3 173 3 167 0 3 167 151 % 7
4 Revenue accruing from persons working with the institutions and other union bodies
1 651 1 651 1 619 10 1 629 1 606 9 1 615 98 % 14
5 Revenue accruing from the administrative operation of the institutions
15 15 600 44 645 569 23 592 3 933 % 53
6 Contributions and refunds in connection with Union agreements and programmes
130 130 7 321 1 545 8 866 6 881 1 275 8 156 6 273 % 711
7 Interests on late payments and fines 115 361 1 078 15 949 17 027 159 470 629 174 % 16 398
8 Borrowing and lending operations 2 2 – – – – – – – –
9 Miscellaneous revenue 15 15 6 7 12 5 1 6 39 % 7
Total 153 566 164 108 173 882 19 853 193 735 172 472 1 834 174 306 106 % 19 429

Annual accounts of the European Union 2020
142
4. IMPLEMENTATION OF EU BUDGET EXPENDITURE
4.1. MFF: BREAKDOWN & CHANGES IN COMMITMENT & PAYMENT APPROPRIATIONS
EUR million
Commitment appropriations Payment appropriations
MFF Heading Budget appropriations Additional
appropriations Total
approp. available
Budget appropriations Additional
appropriations Total
approp. available
Initial adopted budget
Amending budgets & transfers
Final adopted budget
Carry-
overs
Assigned
revenue
Initial adopted budget
Amending budgets & transfers
Final adopted budget
Carry-
overs
Assigned
revenue
1 2 3=1+2 4 5 6=3+ 4+5
7 8 9=7+8 10 11 12=9+ 10+11
1 Smart and inclusive growth 83 931 (12) 83 918 520 6 431 90 870 72 354 4 925 77 278 151 10 904 88 334
1a: Competitiveness for growth and jobs
25 285 (12) 25 273 3 5 012 30 287 22 308 (555) 21 753 139 6 835 28 726
1b: Economic, social and territorial cohesion
58 646 – 58 646 518 1 419 60 582 50 046 5 479 55 525 13 4 069 59 607
2 Sustainable growth: natural resources
59 907 49 59 956 467 2 308 62 730 57 904 867 58 772 677 1 999 61 448
of which: Market related expenditure and direct payments
43 410 49 43 459 467 929 44 855 43 380 39 43 419 670 929 45 018
3 Security and citizenship 3 729 3 423 7 152 – 1 000 8 152 3 685 2 607 6 293 9 1 030 7 331
4 Global Europe 10 262 1 089 11 350 47 843 12 240 8 929 1 457 10 386 38 1 503 11 928
5 Administration 10 272 (1) 10 271 – 837 11 108 10 275 (2) 10 273 828 839 11 941
of which: Administrative expenditure of the institutions
4 226 (1) 4 225 442 4 667 4 226 (1) 4 225 499 443 5 168
6 Compensations – – – – – – – – – – – –
8 Negative reserve and deficit carried over from the previous financial year
– – – – – – – – – – – –
9 Special Instruments 588 649 1 236 49 21 1 306 419 688 1 106 1 21 1 128
O Innovation Fund (IF) – – – – 1 337 1 337 – – – – 1 337 1 337
Total 168 688 5 196 173 884 1 083 12 775 187 742 153 566 10 542 164 108 1 704 17 634 183 446

Annual accounts of the European Union 2020
143
4.2. MFF: IMPLEMENTATION OF COMMITMENT APPROPRIATIONS
EUR million
Total
appropr. available
Commitments made Appropriat. carried over to
2021 Appropriations lapsing
MFF Heading from final adopted budget
from carry-overs
from assigned revenue
Total % assigned revenue
carry-overs by decision
Total
from final
adopted budget
from carry-overs
from assigned revenue
Total
1 2 3 4 5=2+3
+4 6=5/1 7 8 9=7+8 10 11 12
13=10+ 11+12
1 Smart and inclusive growth
90 870 83 890 520 5 152 89 563 99 % 1 219 22 1 241 6 – 59 65
1a: Competitiveness for growth and jobs
30 287 25 254 3 4 058 29 315 97 % 954 14 967 5 – 0 5
1b: Economic, social and territorial cohesion
60 582 58 636 518 1 095 60 248 99 % 265 8 274 1 – 59 60
2 Sustainable growth: natural resources
62 730 59 475 463 886 60 823 97 % 445 475 920 6 4 976 986
of which: Market related expenditure and direct payments
44 855 42 979 463 873 44 315 99 % 56 475 531 5 4 0 9
3 Security and citizenship 8 152 7 152 – 550 7 702 94 % 450 – 450 1 – 0 1
4 Global Europe 12 240 11 349 47 555 11 950 98 % 288 – 288 1 – 0 2
5 Administration 11 108 10 009 – 540 10 548 95 % 291 85 376 178 – 6 184
of which: Administrative expenditure of the institutions
4 667 4 024 294 4 319 93 % 142 85 226 116 0 6 122
6 Compensations – – – – – – – – – – – – –
8 Negative reserve and deficit carried over from the previous financial year
– – – – – – – – – – – – –
9 Special Instruments 1 306 1 059 49 – 1 108 85 % 13 – 13 177 – 8 185
O Innovation Fund (IF) 1 337 – – 5 5 0 % 1 332 – 1 332 – – – –
Total 187 742 172 933 1 078 7 688 181 699 97 % 4 038 582 4 620 369 4 1 050 1 423

Annual accounts of the European Union 2020
144
4.3. MFF: IMPLEMENTATION OF PAYMENT APPROPRIATIONS
EUR million
Total
appropr. available
Payments made Appropriations carried over to
2021 Appropriations lapsing
MFF Heading from final adopted budget
from carry-overs
from assigned revenue
Total % automat.
carry-overs
carry-overs by decis.
assigned revenue
Total
from final
adopted budget
from carry-overs
from assigned revenue
Total
1 2 3 4 5=2+ 3+4
6=5/1 7 8 9 10=7+
8+9 11 12 13
14=11+ 12+13
1 Smart and inclusive growth
88 334 77 097 129 6 316 83 541 95 % 149 12 4 579 4 740 21 23 9 53
1a: Competitiveness for growth and jobs
28 726 21 587 118 2 352 24 057 84 % 134 12 4 474 4 620 19 21 9 49
1b: Economic, social and territorial cohesion
59 607 55 509 11 3 964 59 484 100
% 15 – 105 120 1 2 0 4
2 Sustainable growth: natural resources
61 448 58 263 670 1 662 60 595 99 % 24 475 338 837 9 6 0 16
of which: Market related expenditure and direct payments
45 018 42 919 664 873 44 456 99 % 18 475 56 548 8 6 0 14
3 Security and citizenship
7 331 5 896 7 430 6 333 86 % 11 381 600 991 5 2 0 7
4 Global Europe 11 928 10 328 35 1 049 11 412 96 % 37 17 454 508 4 4 1 8
5 Administration 11 941 9 111 748 460 10 319 86 % 895 85 375 1 355 182 80 5 266
of which: Administrative expenditure of the institutions
5 168 3 435 440 258 4 134 80 % 585 85 182 852 120 59 3 182
6 Compensations – – – – – – – – – – – – – –
8
Negative reserve and deficit carried over from the previous financial year
– – – – – – 0 – – – – – – –
9 Special Instruments 1 128 1 106 0 2 1 108 98 % 0 – 13 13 0 0 6 6
O Innovation Fund (IF) 1 337 – – 1 1 0 % – – 1 336 1 336 – – – –
Total 183 446 161 801 1 589 9 920 173 310 94 % 1 116 969 7 694 9 779 221 115 20 357

Annual accounts of the European Union 2020
145
4.4. MFF: MOVEMENTS IN OUTSTANDING COMMITMENTS (RAL)
EUR million
Commitments outstanding at the end of previous year Commitments of the current year Total commitm.
outstanding at the end of the year
MFF Heading
Commitm. carried forward from previous
year
Decommitm./ Revaluations/ Cancellations
Payments Commitm. outstanding at year-end
Commitm. made
during the year
Payments
Cancellation of commitm.
which cannot be carried over
Commitm. outstanding at year-end
1 2 3 4=1+2+3 5 6 7 8=5+6+7 9=4+8
1 Smart and inclusive growth 220 627 (1 875) (71 673) 147 079 89 563 (11 868) (6) 77 689 224 769
1a: Competitiveness for growth and jobs 40 300 (954) (14 384) 24 962 29 315 (9 673) (5) 19 636 44 598
1b: Economic, social and territorial cohesion
180 327 (921) (57 289) 122 117 60 248 (2 195) (0) 58 053 180 170
2 Sustainable growth: natural resources 40 876 (122) (15 695) 25 058 60 823 (44 900) – 15 923 40 982
of which: Market related expenditure and direct payments
432 (5) (262) 165 44 315 (44 193) – 122 286
3 Security and citizenship 6 183 (119) (2 225) 3 839 7 702 (4 108) – 3 594 7 433
4 Global Europe 29 154 (672) (7 862) 20 620 11 950 (3 550) (1) 8 400 29 020
5 Administration 854 (92) (757) 5 10 548 (9 563) (0) 985 990
of which: Administrative expenditure of the institutions
511 (70) (440) 2 4 319 (3 694) 0 625 627
6 Compensations – – – – – – – – –
8 Negative reserve and deficit carried over from the previous financial year
– – – – – – – – –
9 Special Instruments 1 (0) (0) – 1 108 (1 108) – 0 0
O Innovation Fund (IF) – – – – 5 (1) – 4 4
Total 297 695 (2 881) (98 213) 196 601 181 699 (75 096) (7) 106 596 303 197
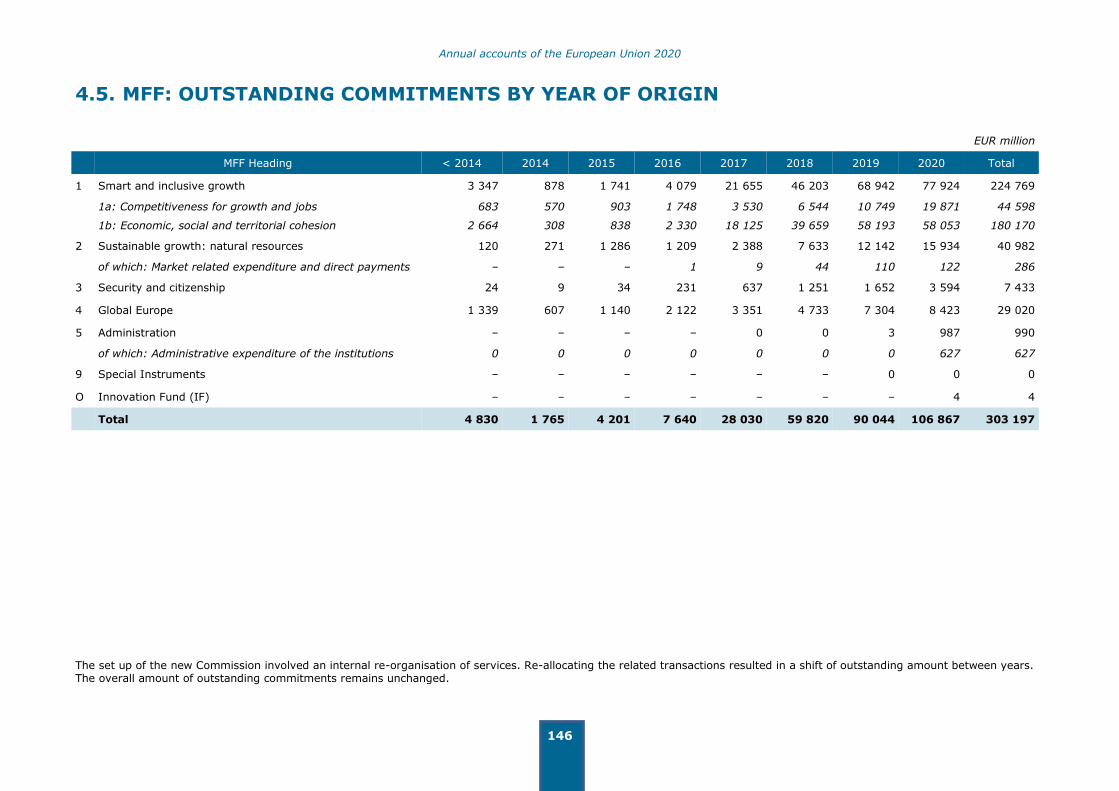
Annual accounts of the European Union 2020
146
4.5. MFF: OUTSTANDING COMMITMENTS BY YEAR OF ORIGIN
EUR million
MFF Heading < 2014 2014 2015 2016 2017 2018 2019 2020 Total
1 Smart and inclusive growth 3 347 878 1 741 4 079 21 655 46 203 68 942 77 924 224 769
1a: Competitiveness for growth and jobs 683 570 903 1 748 3 530 6 544 10 749 19 871 44 598
1b: Economic, social and territorial cohesion 2 664 308 838 2 330 18 125 39 659 58 193 58 053 180 170
2 Sustainable growth: natural resources 120 271 1 286 1 209 2 388 7 633 12 142 15 934 40 982
of which: Market related expenditure and direct payments – – – 1 9 44 110 122 286
3 Security and citizenship 24 9 34 231 637 1 251 1 652 3 594 7 433
4 Global Europe 1 339 607 1 140 2 122 3 351 4 733 7 304 8 423 29 020
5 Administration – – – – 0 0 3 987 990
of which: Administrative expenditure of the institutions 0 0 0 0 0 0 0 627 627
9 Special Instruments – – – – – – 0 0 0
O Innovation Fund (IF) – – – – – – – 4 4
Total 4 830 1 765 4 201 7 640 28 030 59 820 90 044 106 867 303 197
The set up of the new Commission involved an internal re-organisation of services. Re-allocating the related transactions resulted in a shift of outstanding amount between years. The overall amount of outstanding commitments remains unchanged.

Annual accounts of the European Union 2020
147
4.6. MFF: OUTSTANDING COMMITMENTS BY APPROPRIATIONS TYPE
EUR million
From budget appropriations From assigned revenue appropriations Total commitm.
outstanding at the end of
2020
Heading
Commitm. carried forward
from 2019
Adjust- ments
Commitm. made
Payments made
Amount remaining to
be settled
Commitm. carried forward
from 2019
Adjust- ments
Commitm. made
Payments made
Amount remaining
to be settled
1 2 3 4 5=1+2+3-4 6 7 8 9 10=6+7+8-
9 11=5+10
1 Smart and inclusive growth 195 138 (1 648) 84 411 81 035 196 865 25 490 (232) 5 152 2 506 27 904 224 769
1a: Competitiveness for growth and jobs
37 087 (736) 25 257 21 846 39 762 3 213 (223) 4 058 2 212 4 837 44 598
1b: Economic, social and territorial
cohesion 158 051 (912) 59 154 59 190 157 103 22 277 (10) 1 095 294 23 067 180 170
2 Sustainable growth: natural resources
40 451 (122) 59 937 59 707 40 559 425 (0) 886 888 423 40 982
of which: Market related expenditure and direct payments
431 (5) 43 441 43 582 286 1 – 873 874 – 286
3 Security and citizenship 6 004 (118) 7 152 5 919 7 119 179 (2) 550 414 314 7 433
4 Global Europe 27 633 (627) 11 395 10 468 27 933 1 521 (46) 555 943 1 087 29 020
5 Administration 761 (41) 10 009 9 818 910 93 (51) 540 502 80 990
of which: Administrative expenditure of the institutions
464 (22) 4 024 3 875 591 47 (47) 294 258 36 627
9 Special Instruments 1 (0) 1 108 1 108 0 0
O Innovation Fund (IF) – – – – – 5 1 4 4
Total 269 987 (2 557) 174 012 168 056 273 386 27 708 (330) 7 688 5 254 29 811 303 197

Annual accounts of the European Union 2020
148
4.7. DETAILED MFF: BREAKDOWN AND CHANGES IN COMMITMENT AND PAYMENT APPROPRIATIONS
EUR million
Commitment appropriations Payment appropriations
Budget appropriations Additional
appropriations Total approp. available
Budget appropriations Additional
appropriations Total approp. available Programme
Initial adopted budget
Amending budgets & transfers
Final adopted budget
Carry-overs
Assigned revenue
Initial adopted budget
Amending budgets & transfers
Final adopted budget
Carry-overs
Assigned revenue
1 2 3=1+2 4 5 6=3+ 4+5
7 8 9=7+8 10 11 12=9+ 10+11
1 European Fund Strategic
Investments (EFSI) 173 – 173 – 157 329 1 105 (2) 1 103 – 184 1 287
European satellite navigation (EGNOS/Galileo)
1 207 – 1 207 – 121 1 328 954 19 973 2 272 1 247
International Thermonuclear Reactor (ITER)
365 2 367 – 46 412 639 (0) 638 0 46 684
European Earth Observation Progr (Copernicus)
647 0 647 – 16 663 552 1 553 2 14 569
European Solidarity Corps (ESC) 166 – 166 – 11 177 154 (27) 126 3 15 144
European Defense Industrial Development Programme (EDIDP)
255 – 255 – 0 255 201 (24) 177 2 0 178
Nuclear Safety and Decommissioning
147 – 147 – – 147 171 (54) 117 – – 117
Horizon 2020 13 486 (0) 13 486 – 3 233 16 719 11 796 (181) 11 615 79 4 776 16 470
Euratom Research and Training Programme
398 0 398 3 92 492 417 (71) 346 36 137 519
Competitiveness enterprises and SME's (COSME)
418 (0) 418 – 41 460 386 102 488 2 60 549
Education, Training and Sport (Erasmus+)
2 885 – 2 885 – 678 3 563 2 739 9 2 748 7 787 3 543
Employment and Social Innovation (EaSI)
117 – 117 – 61 178 105 (6) 99 1 81 181
Customs, Fiscalis and Anti-Fraud 133 (0) 133 – 12 145 124 21 145 0 15 160
CEF - Energy 1 281 – 1 281 – 6 1 287 420 (29) 390 1 8 399
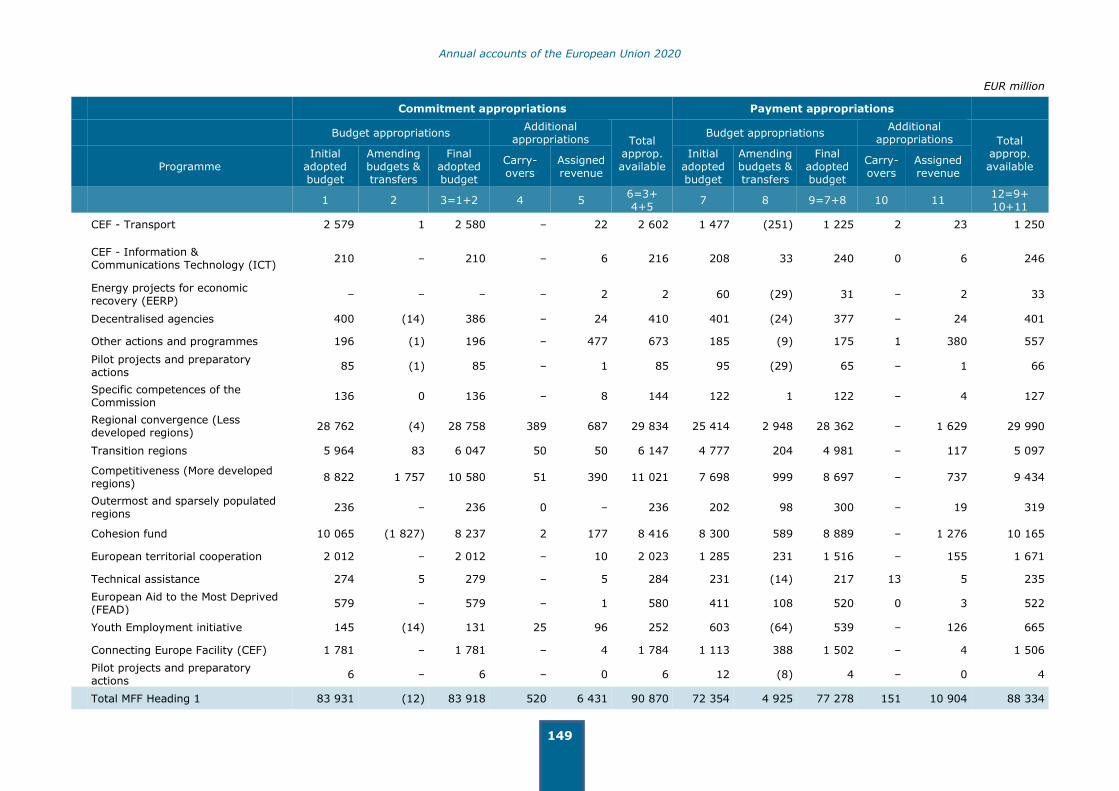
Annual accounts of the European Union 2020
149
EUR million
Commitment appropriations Payment appropriations
Budget appropriations Additional
appropriations Total approp. available
Budget appropriations Additional
appropriations Total approp. available Programme
Initial adopted budget
Amending budgets & transfers
Final adopted budget
Carry-overs
Assigned revenue
Initial adopted budget
Amending budgets & transfers
Final adopted budget
Carry-overs
Assigned revenue
1 2 3=1+2 4 5 6=3+ 4+5
7 8 9=7+8 10 11 12=9+ 10+11
CEF - Transport 2 579 1 2 580 – 22 2 602 1 477 (251) 1 225 2 23 1 250
CEF - Information & Communications Technology (ICT)
210 – 210 – 6 216 208 33 240 0 6 246
Energy projects for economic recovery (EERP)
– – – – 2 2 60 (29) 31 – 2 33
Decentralised agencies 400 (14) 386 – 24 410 401 (24) 377 – 24 401
Other actions and programmes 196 (1) 196 – 477 673 185 (9) 175 1 380 557
Pilot projects and preparatory actions
85 (1) 85 – 1 85 95 (29) 65 – 1 66
Specific competences of the Commission
136 0 136 – 8 144 122 1 122 – 4 127
Regional convergence (Less developed regions)
28 762 (4) 28 758 389 687 29 834 25 414 2 948 28 362 – 1 629 29 990
Transition regions 5 964 83 6 047 50 50 6 147 4 777 204 4 981 – 117 5 097
Competitiveness (More developed regions)
8 822 1 757 10 580 51 390 11 021 7 698 999 8 697 – 737 9 434
Outermost and sparsely populated regions
236 – 236 0 – 236 202 98 300 – 19 319
Cohesion fund 10 065 (1 827) 8 237 2 177 8 416 8 300 589 8 889 – 1 276 10 165
European territorial cooperation 2 012 – 2 012 – 10 2 023 1 285 231 1 516 – 155 1 671
Technical assistance 274 5 279 – 5 284 231 (14) 217 13 5 235
European Aid to the Most Deprived (FEAD)
579 – 579 – 1 580 411 108 520 0 3 522
Youth Employment initiative 145 (14) 131 25 96 252 603 (64) 539 – 126 665
Connecting Europe Facility (CEF) 1 781 – 1 781 – 4 1 784 1 113 388 1 502 – 4 1 506
Pilot projects and preparatory actions
6 – 6 – 0 6 12 (8) 4 – 0 4
Total MFF Heading 1 83 931 (12) 83 918 520 6 431 90 870 72 354 4 925 77 278 151 10 904 88 334

Annual accounts of the European Union 2020
150
EUR million
Commitment appropriations Payment appropriations
Budget appropriations Additional
appropriations Total approp. available
Budget appropriations Additional
appropriations Total approp. available Programme
Initial adopted budget
Amending budgets & transfers
Final adopted budget
Carry-overs
Assigned revenue
Initial adopted budget
Amending budgets & transfers
Final adopted budget
Carry-overs
Assigned revenue
1 2 3=1+2 4 5 6=3+ 4+5
7 8 9=7+8 10 11 12=9+ 10+11
2 European Agricultural Guarantee Fund (EAGF)
43 410 49 43 459 467 929 44 855 43 380 39 43 419 670 929 45 018
Agricultural Fund Rural Development (EAFRD)
14 709 – 14 709 – 1 163 15 871 13 141 799 13 940 2 910 14 852
European Maritime and Fisheries Fund (EMFF)
960 (0) 960 – 205 1 165 770 (8) 762 1 151 913
Fisheries Partnership Agreements (SFPAs) and Fisheries Management Organisations (RFMOs)
148 – 148 – – 148 143 2 144 – – 144
Environment and climate action (LIFE)
590 – 590 – 3 593 383 46 429 4 2 435
Decentralised agencies 68 – 68 – 7 75 68 – 68 – 7 75
Other actions and measures – – – – – – – – – – – –
Pilot projects and preparatory actions
23 – 23 – 0 23 20 (11) 9 – 0 9
Specific Actions – – – – – – – – – – – –
Total MFF Heading 2 59 907 49 59 956 467 2 308 62 730 57 904 867 58 772 677 1 999 61 448
3 Asylum, Migration and Integration Fund (AMF)
949 441 1 389 – 16 1 406 953 171 1 123 1 17 1 142
Consumer 30 – 30 – 1 31 28 2 30 1 1 31
Creative Europe 252 0 252 – 13 265 215 (16) 200 2 15 216
Emergency Support within the Union (IES)
– 2 700 2 700 – 750 3 450 – 2 610 2 610 0 750 3 360
Internal Security Fund 501 28 528 – 126 655 670 (217) 454 1 161 616
IT systems – – – – 0 0 – – – – 0 0
Justice 47 (0) 47 – 1 47 43 11 54 0 1 55
Rights, Equality and Citizenship 70 0 70 – 2 72 71 7 77 0 2 80

Annual accounts of the European Union 2020
151
EUR million
Commitment appropriations Payment appropriations
Budget appropriations Additional
appropriations Total approp. available
Budget appropriations Additional
appropriations Total approp. available Programme
Initial adopted budget
Amending budgets & transfers
Final adopted budget
Carry-overs
Assigned revenue
Initial adopted budget
Amending budgets & transfers
Final adopted budget
Carry-overs
Assigned revenue
1 2 3=1+2 4 5 6=3+ 4+5
7 8 9=7+8 10 11 12=9+ 10+11
Union Civil protection Mechanism 141 370 511 – 15 526 62 132 194 – 9 203
Europe for Citizens 31 7 38 – 0 38 29 (4) 25 0 0 26
Food and feed 279 (31) 247 – 4 251 245 (11) 233 1 2 237
Health 70 3 73 – 3 75 64 (3) 61 1 3 65
Decentralised agencies 1 233 (94) 1 139 – 67 1 206 1 184 (56) 1 128 – 67 1 195
Pilot projects and preparatory actions
23 – 23 – 0 23 16 (5) 11 – 0 11
Specific Actions 106 (0) 106 – 2 108 105 (13) 92 1 2 94
Total MFF Heading 3 3 729 3 423 7 152 – 1 000 8 152 3 685 2 607 6 293 9 1 030 7 331
4 Pre-accession assistance (IPA II) 1 571 38 1 609 – 249 1 858 1 432 264 1 696 6 448 2 150
Macro-financial Assistance (MFA) 20 (20) 0 – – 0 27 (12) 15 – – 15
Guarantee Fund for External Actions 233 – 233 – 7 240 233 – 233 – 7 240
Union Civil Protection Mechanism 19 66 85 – 4 89 16 22 37 – 3 40
EU Aid Volunteers initiative (EUAV) 21 (17) 4 – 1 4 19 (14) 5 – 1 5
Fund for Sustainable Development (EFSD)
25 – 25 – 80 105 25 – 25 – 174 199
European Neighbourhood Instrument (ENI)
2 671 174 2 845 – 64 2 909 1 966 639 2 605 6 70 2 681
Development Cooperation Instrument (DCI)
3 272 (67) 3 206 – 88 3 294 2 797 168 2 965 13 134 3 112
Partnership Instrument (PI) 162 2 164 – 8 172 133 (2) 131 0 8 140
Democracy and Human Rights (EIDHR)
196 (24) 172 – 7 179 175 (24) 151 3 7 161
Stability and Peace (IcSP) 394 15 408 – 5 413 350 30 379 3 6 389
Humanitarian aid 1 102 936 2 038 46 20 2 103 1 207 407 1 614 6 336 1 956
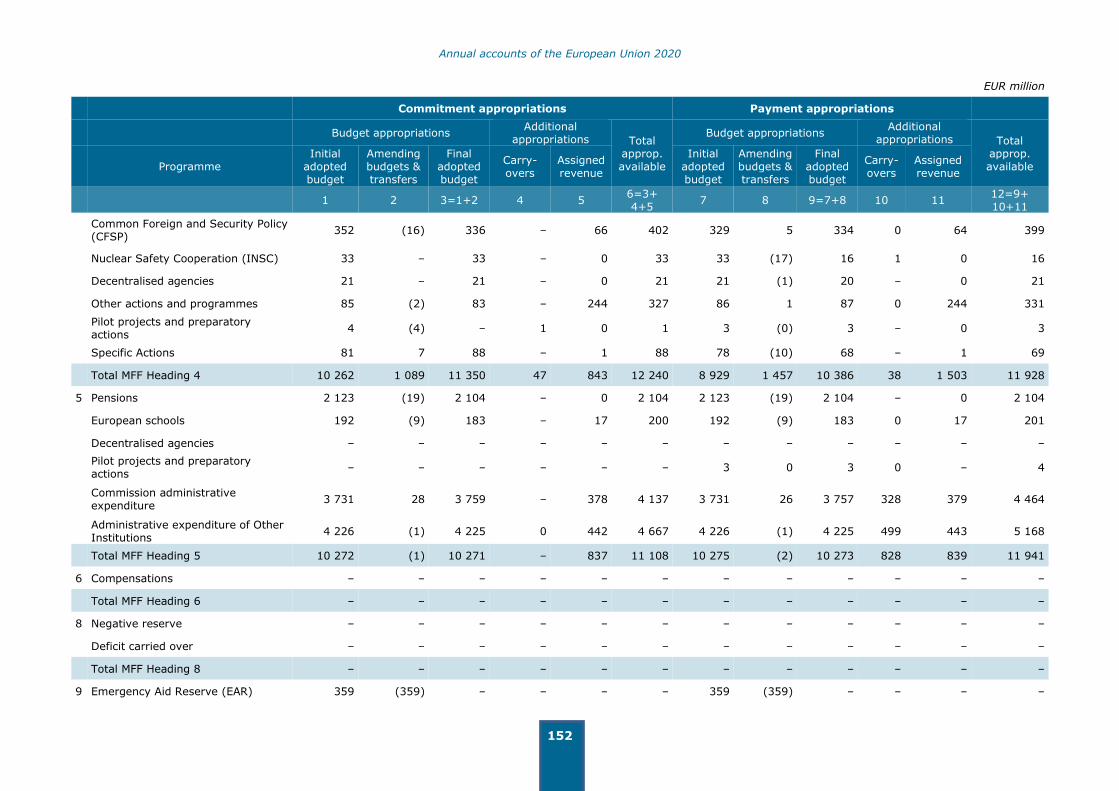
Annual accounts of the European Union 2020
152
EUR million
Commitment appropriations Payment appropriations
Budget appropriations Additional
appropriations Total approp. available
Budget appropriations Additional
appropriations Total approp. available Programme
Initial adopted budget
Amending budgets & transfers
Final adopted budget
Carry-overs
Assigned revenue
Initial adopted budget
Amending budgets & transfers
Final adopted budget
Carry-overs
Assigned revenue
1 2 3=1+2 4 5 6=3+ 4+5
7 8 9=7+8 10 11 12=9+ 10+11
Common Foreign and Security Policy (CFSP)
352 (16) 336 – 66 402 329 5 334 0 64 399
Nuclear Safety Cooperation (INSC) 33 – 33 – 0 33 33 (17) 16 1 0 16
Decentralised agencies 21 – 21 – 0 21 21 (1) 20 – 0 21
Other actions and programmes 85 (2) 83 – 244 327 86 1 87 0 244 331
Pilot projects and preparatory actions
4 (4) – 1 0 1 3 (0) 3 – 0 3
Specific Actions 81 7 88 – 1 88 78 (10) 68 – 1 69
Total MFF Heading 4 10 262 1 089 11 350 47 843 12 240 8 929 1 457 10 386 38 1 503 11 928
5 Pensions 2 123 (19) 2 104 – 0 2 104 2 123 (19) 2 104 – 0 2 104
European schools 192 (9) 183 – 17 200 192 (9) 183 0 17 201
Decentralised agencies – – – – – – – – – – – –
Pilot projects and preparatory actions
– – – – – – 3 0 3 0 – 4
Commission administrative expenditure
3 731 28 3 759 – 378 4 137 3 731 26 3 757 328 379 4 464
Administrative expenditure of Other Institutions
4 226 (1) 4 225 0 442 4 667 4 226 (1) 4 225 499 443 5 168
Total MFF Heading 5 10 272 (1) 10 271 – 837 11 108 10 275 (2) 10 273 828 839 11 941
6 Compensations – – – – – – – – – – – –
Total MFF Heading 6 – – – – – – – – – – – –
8 Negative reserve – – – – – – – – – – – –
Deficit carried over – – – – – – – – – – – –
Total MFF Heading 8 – – – – – – – – – – – –
9 Emergency Aid Reserve (EAR) 359 (359) – – – – 359 (359) – – – –

Annual accounts of the European Union 2020
153
EUR million
Commitment appropriations Payment appropriations
Budget appropriations Additional
appropriations Total approp. available
Budget appropriations Additional
appropriations Total approp. available Programme
Initial adopted budget
Amending budgets & transfers
Final adopted budget
Carry-overs
Assigned revenue
Initial adopted budget
Amending budgets & transfers
Final adopted budget
Carry-overs
Assigned revenue
1 2 3=1+2 4 5 6=3+ 4+5
7 8 9=7+8 10 11 12=9+ 10+11
European Globalisation Adjustment Fund (EGF)
179 – 179 – 21 200 10 (10) 0 1 21 22
European Union Solidarity Fund (EUSF)
50 1 007 1 057 49 – 1 106 50 1 056 1 106 – – 1 106
Total MFF Heading 9 588 649 1 236 49 21 1 306 419 688 1 106 1 21 1 128
O Innovation Fund (IF) – – – – 1 337 1 337 – – – – 1 337 1 337
Total MFF Heading O – – – – 1 337 1 337 – – – – 1 337 1 337
Total 168 688 5 196 173 884 1 083 12 775 187 742 153 566 10 542 164 108 1 704 17 634 183 446

Annual accounts of the European Union 2020
154
4.8. DETAILED MFF: IMPLEMENTATION OF COMMITMENT APPROPRIATIONS
EUR million
Total
appropr. available
Commitments made Appropriat. carried over to
2021 Appropriations lapsing
Programme
from final
adopted budget
from carry-overs
from assigned revenue
Total % assigned revenue
carry-overs by decision
Total
from final
adopted budget
from carry-overs
from assigned revenue
Total
1 2 3 4 5=2+3
+4 6=5/1 7 8 9=7+8 10 11 12
13=10+ 11+12
1 European Fund Strategic Investments (EFSI)
329 173 – 148 321 97 % 8 – 8 0 – – 0
European satellite navigation (EGNOS/Galileo)
1 328 1 207 – 105 1 312 99 % 16 – 16 – – 0 0
International Thermonuclear Reactor (ITER)
412 367 – 29 396 96 % 16 – 16 0 – – 0
European Earth Observation Progr (Copernicus)
663 647 – 16 663 100 % 0 – 0 0 – – 0
European Solidarity Corps (ESC) 177 166 – 7 173 98 % 4 – 4 – – – –
European Defense Industrial Development Programme (EDIDP)
255 255 – 0 255 100 % – – – 0 – – 0
Nuclear Safety and Decommissioning
147 147 – – 147 100 % – – – – – – –
Horizon 2020 16 719 13 485 – 2 925 16 411 98 % 307 – 307 1 – 0 1
Euratom Research and Training Programme
492 386 3 26 415 84 % 66 12 77 0 – 0 0
Competitiveness enterprises and SME's (COSME)
460 418 – 30 448 98 % 11 – 11 0 – – 0
Education, Training and Sport (Erasmus+)
3 563 2 885 – 595 3 481 98 % 82 – 82 0 – – 0
Employment and Social Innovation (EaSI)
178 116 – 49 164 92 % 12 – 12 1 – 0 1
Customs, Fiscalis and Anti-Fraud 145 133 – 11 144 99 % 1 – 1 0 – – 0
CEF - Energy 1 287 1 281 – 1 1 282 100 % 4 – 4 0 – – 0
CEF - Transport 2 602 2 580 – 4 2 584 99 % 18 – 18 0 – – 0
CEF - Information & Communications Technology (ICT)
216 210 – 6 216 100 % 0 – 0 0 – – 0

Annual accounts of the European Union 2020
155
EUR million
Total
appropr. available
Commitments made Appropriat. carried over to
2021 Appropriations lapsing
Programme
from final
adopted budget
from carry-overs
from assigned revenue
Total % assigned revenue
carry-overs by decision
Total
from final
adopted budget
from carry-overs
from assigned revenue
Total
1 2 3 4 5=2+3
+4 6=5/1 7 8 9=7+8 10 11 12
13=10+ 11+12
Energy projects for economic recovery (EERP)
2 – – 0 0 7 % 2 – 2 – – – –
Decentralised agencies 410 385 – 18 403 98 % 6 1 7 0 – – 0
Other actions and programmes 673 195 – 83 278 41 % 394 – 394 1 – 0 1
Pilot projects and preparatory actions
85 83 – – 83 98 % 0 1 1 0 – 0 1
Specific competences of the Commission
144 135 – 3 138 96 % 5 – 5 1 – 0 1
Regional convergence (Less developed regions)
29 834 28 758 389 579 29 726 100 % 65 – 65 – – 43 43
Transition regions 6 147 6 047 50 50 6 147 100 % 0 – 0 – – 0 0
Competitiveness (More developed regions)
11 021 10 571 51 197 10 819 98 % 185 8 193 – – 8 8
Outermost and sparsely populated regions
236 236 0 – 236 100 % – – – – – – –
Cohesion fund 8 416 8 237 2 165 8 404 100 % 11 – 11 – – – –
European territorial cooperation 2 023 2 012 – – 2 012 99 % 3 – 3 – – 7 7
Technical assistance 284 278 – 4 282 99 % 0 – 0 1 – 0 2
European Aid to the Most Deprived (FEAD)
580 579 – 1 579 100 % – – – 0 – – 0
Youth Employment initiative 252 131 25 96 252 100 % – – – – – – –
Connecting Europe Facility (CEF) 1 784 1 781 – 3 1 784 100 % 0 – 0 – – – –
Pilot projects and preparatory actions
6 6 – – 6 98 % 0 – 0 – – 0 0
Total MFF Heading 1 90 870 83 890 520 5 152 89 563 99 % 1 219 22 1 241 6 – 59 65
2 European Agricultural Guarantee Fund (EAGF)
44 855 42 979 463 873 44 315 99 % 56 475 531 5 4 0 9
Agricultural Fund Rural Development (EAFRD)
15 871 14 708 – 0 14 709 93 % 260 – 260 0 – 903 903

Annual accounts of the European Union 2020
156
EUR million
Total
appropr. available
Commitments made Appropriat. carried over to
2021 Appropriations lapsing
Programme
from final
adopted budget
from carry-overs
from assigned revenue
Total % assigned revenue
carry-overs by decision
Total
from final
adopted budget
from carry-overs
from assigned revenue
Total
1 2 3 4 5=2+3
+4 6=5/1 7 8 9=7+8 10 11 12
13=10+ 11+12
European Maritime and Fisheries Fund (EMFF)
1 165 960 – 3 963 83 % 129 – 129 0 – 74 74
Fisheries Partnership Agreements (SFPAs) and Fisheries Management Organisations (RFMOs)
148 148 – – 148 100 % – – – – – – –
Environment and climate action (LIFE)
593 590 – 3 592 100 % 1 – 1 0 – 0 0
Decentralised agencies 75 68 – 7 75 99 % 1 – 1 – – 0 0
Other actions and measures – – – – – – – – – – – – –
Pilot projects and preparatory actions
23 22 – – 22 99 % – – – 0 – 0 0
Specific Actions – – – – – – – – – – – – –
Total MFF Heading 2 62 730 59 475 463 886 60 823 97 % 445 475 920 6 4 976 986
3 Asylum, Migration and Integration Fund (AMF)
1 406 1 389 – 15 1 404 100 % 2 – 2 0 – – 0
Consumer 31 30 – 1 30 99 % 0 – 0 0 – – 0
Creative Europe 265 252 – 11 263 99 % 2 – 2 0 – – 0
Emergency Support within the Union (IES)
3 450 2 700 – 333 3 033 88 % 417 – 417 – – – –
Internal Security Fund 655 528 – 124 652 100 % 2 – 2 0 – – 0
IT systems 0 – – – – – 0 – 0 – – – –
Justice 47 47 – 0 47 100 % 0 – 0 0 – – 0
Rights, Equality and Citizenship 72 70 – 1 71 98 % 1 – 1 0 – 0 0
Union Civil protection Mechanism 526 511 – 14 525 100 % 1 – 1 0 – – 0
Europe for Citizens 38 38 – 0 38 100 % 0 – 0 0 – 0 0
Food and feed 251 247 – 2 249 99 % 2 – 2 0 – 0 0

Annual accounts of the European Union 2020
157
EUR million
Total
appropr. available
Commitments made Appropriat. carried over to
2021 Appropriations lapsing
Programme
from final
adopted budget
from carry-overs
from assigned revenue
Total % assigned revenue
carry-overs by decision
Total
from final
adopted budget
from carry-overs
from assigned revenue
Total
1 2 3 4 5=2+3
+4 6=5/1 7 8 9=7+8 10 11 12
13=10+ 11+12
Health 75 72 – 2 74 99 % 1 – 1 0 – 0 0
Decentralised agencies 1 206 1 139 – 47 1 186 98 % 20 – 20 0 – – 0
Pilot projects and preparatory actions
23 23 – – 23 100 % 0 – 0 0 – 0 0
Specific Actions 108 106 – 0 106 99 % 1 – 1 0 – 0 0
Total MFF Heading 3 8 152 7 152 – 550 7 702 94 % 450 – 450 1 – 0 1
4 Pre-accession assistance (IPA II) 1 858 1 609 – 172 1 780 96 % 77 – 77 1 – 0 1
Macro-financial Assistance (MFA) 0 0 – – 0 95 % – – – 0 – – 0
Guarantee Fund for External Actions
240 233 – 7 240 100 % 0 – 0 – – – –
Union Civil Protection Mechanism 89 85 – 3 87 98 % 1 – 1 – – – –
EU Aid Volunteers initiative (EUAV)
4 4 – 1 4 100 % 0 – 0 – – – –
Fund for Sustainable Development (EFSD)
105 25 – 79 104 100 % 0 – 0 – – – –
European Neighbourhood Instrument (ENI)
2 909 2 845 – 16 2 861 98 % 48 – 48 0 – 0 0
Development Cooperation Instrument (DCI)
3 294 3 206 – 63 3 268 99 % 25 – 25 0 – 0 0
Partnership Instrument (PI) 172 164 – 3 168 98 % 4 – 4 0 – 0 0
Democracy and Human Rights (EIDHR)
179 172 – 4 176 98 % 3 – 3 0 – 0 0
Stability and Peace (IcSP) 413 408 – 4 413 100 % 1 – 1 0 – 0 0
Humanitarian aid 2 103 2 038 46 13 2 097 100 % 6 – 6 0 – – 0
Common Foreign and Security Policy (CFSP)
402 336 – 43 379 94 % 23 – 23 0 – – 0
Nuclear Safety Cooperation (INSC)
33 33 – – 33 99 % 0 – 0 0 – – 0
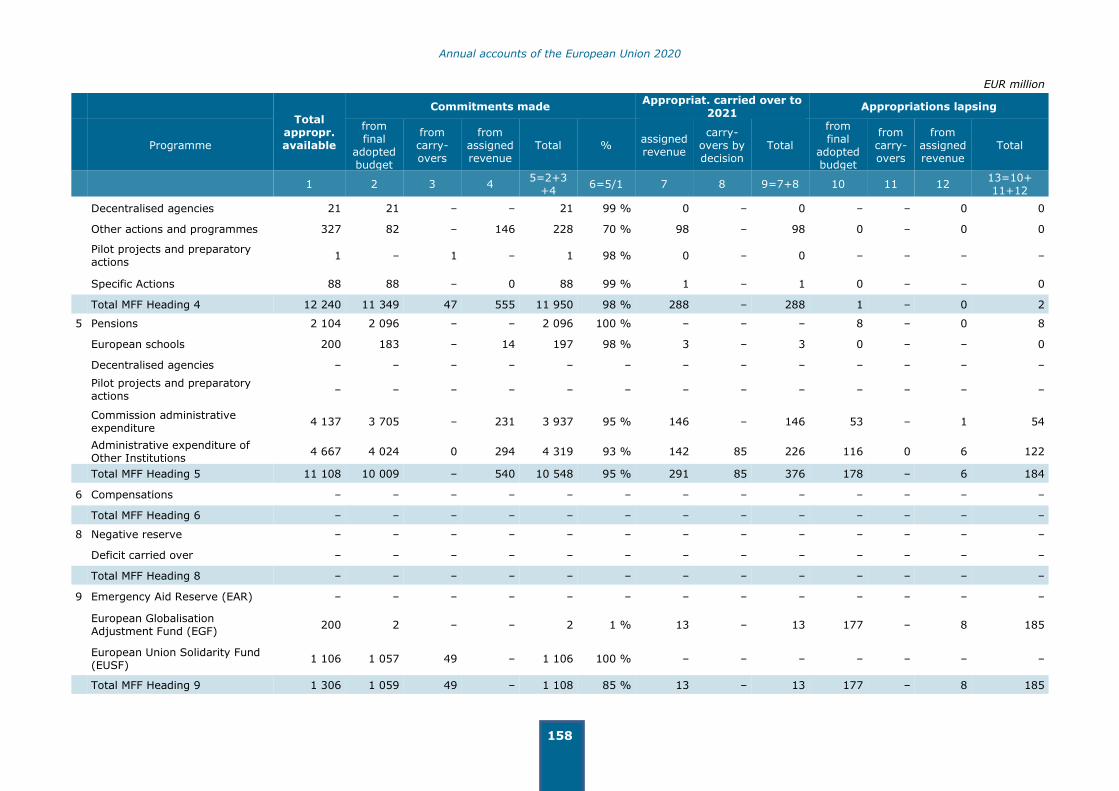
Annual accounts of the European Union 2020
158
EUR million
Total
appropr. available
Commitments made Appropriat. carried over to
2021 Appropriations lapsing
Programme
from final
adopted budget
from carry-overs
from assigned revenue
Total % assigned revenue
carry-overs by decision
Total
from final
adopted budget
from carry-overs
from assigned revenue
Total
1 2 3 4 5=2+3
+4 6=5/1 7 8 9=7+8 10 11 12
13=10+ 11+12
Decentralised agencies 21 21 – – 21 99 % 0 – 0 – – 0 0
Other actions and programmes 327 82 – 146 228 70 % 98 – 98 0 – 0 0
Pilot projects and preparatory actions
1 – 1 – 1 98 % 0 – 0 – – – –
Specific Actions 88 88 – 0 88 99 % 1 – 1 0 – – 0
Total MFF Heading 4 12 240 11 349 47 555 11 950 98 % 288 – 288 1 – 0 2
5 Pensions 2 104 2 096 – – 2 096 100 % – – – 8 – 0 8
European schools 200 183 – 14 197 98 % 3 – 3 0 – – 0
Decentralised agencies – – – – – – – – – – – – –
Pilot projects and preparatory actions
– – – – – – – – – – – – –
Commission administrative expenditure
4 137 3 705 – 231 3 937 95 % 146 – 146 53 – 1 54
Administrative expenditure of Other Institutions
4 667 4 024 0 294 4 319 93 % 142 85 226 116 0 6 122
Total MFF Heading 5 11 108 10 009 – 540 10 548 95 % 291 85 376 178 – 6 184
6 Compensations – – – – – – – – – – – – –
Total MFF Heading 6 – – – – – – – – – – – – –
8 Negative reserve – – – – – – – – – – – – –
Deficit carried over – – – – – – – – – – – – –
Total MFF Heading 8 – – – – – – – – – – – – –
9 Emergency Aid Reserve (EAR) – – – – – – – – – – – – –
European Globalisation Adjustment Fund (EGF)
200 2 – – 2 1 % 13 – 13 177 – 8 185
European Union Solidarity Fund (EUSF)
1 106 1 057 49 – 1 106 100 % – – – – – – –
Total MFF Heading 9 1 306 1 059 49 – 1 108 85 % 13 – 13 177 – 8 185

Annual accounts of the European Union 2020
159
EUR million
Total
appropr. available
Commitments made Appropriat. carried over to
2021 Appropriations lapsing
Programme
from final
adopted budget
from carry-overs
from assigned revenue
Total % assigned revenue
carry-overs by decision
Total
from final
adopted budget
from carry-overs
from assigned revenue
Total
1 2 3 4 5=2+3
+4 6=5/1 7 8 9=7+8 10 11 12
13=10+ 11+12
O Innovation Fund (IF) 1 337 – – 5 5 0 % 1 332 – 1 332 – – – –
Total MFF Heading O 1 337 – – 5 5 0 % 1 332 – 1 332 – – – –
Total 187 742 172 933 1 078 7 688 181 699 97 % 4 038 582 4 620 369 4 1 050 1 423

Annual accounts of the European Union 2020
160
4.9. DETAILED MFF: IMPLEMENTATION OF PAYMENT APPROPRIATIONS
EUR million
Total
appropr. available
Payments made Appropriations carried over to 2021 Appropriations lapsing
Programme
from final
adopted budget
from carry-overs
from assigned revenue
Total % autom. carry overs
carry-overs by
decis.
assigned revenue
Total
from final
adopted budge
from carry-overs
from assigned revenue
Total
1 2 3 4 5=2+ 3+4
6=5/1 7 8 9 10=7+
8+9 11 12 13
14=11+ 12+13
1 European Fund Strategic Investments (EFSI)
1 287 1 103 – 156 1 259 98 % 0 – 28 28 0 – – 0
European satellite navigation (EGNOS/Galileo)
1 247 971 2 30 1 003 80 % 1 – 242 244 0 0 0 0
International Thermonuclear Reactor (ITER)
684 637 0 1 639 93 % 1 – 44 45 0 0 – 0
European Earth Observation Progr (Copernicus)
569 551 2 14 566 100 % 2 – 0 2 0 0 – 0
European Solidarity Corps (ESC)
144 125 3 6 134 92 % 2 – 9 11 0 0 – 0
European Defense Industrial Development Programme (EDIDP)
178 176 2 – 178 100 % 0 – 0 0 0 0 – 0
Nuclear Safety and Decommissioning
117 117 – – 117 100 % – – – – 0 – – 0
Horizon 2020 16 470 11 524 69 1 615 13 207 80 % 83 – 3 160 3 243 8 10 1 19
Euratom Research and Training Programme
519 302 29 13 344 66 % 31 12 124 167 1 7 0 8
Competitiveness enterprises and SME's (COSME)
549 486 2 35 522 95 % 2 – 25 27 0 0 0 0
Education, Training and Sport (Erasmus+)
3 543 2 742 7 320 3 068 87 % 7 – 467 474 0 0 0 1
Employment and Social Innovation (EaSI)
181 96 0 37 134 74 % 1 – 36 37 1 1 8 10
Customs, Fiscalis and Anti-Fraud
160 143 0 9 152 95 % 0 – 6 6 2 0 – 2

Annual accounts of the European Union 2020
161
EUR million
Total appropr. available
Payments made Appropriations carried over to 2021 Appropriations lapsing
Programme
from final
adopted budget
from carry-overs
from assigned revenue
Total % autom. carry overs
carry-overs by
decis.
assigned revenue
Total
from final
adopted budge
from carry-overs
from assigned revenue
Total
1 2 3 4 5=2+ 3+4
6=5/1 7 8 9 10=7+
8+9 11 12 13
14=11+ 12+13
CEF - Energy 399 389 0 1 390 98 % 1 – 7 9 0 0 – 0
CEF - Transport 1 250 1 224 1 12 1 237 99 % 1 – 12 13 0 1 – 1
CEF - Information & Communications Technology (ICT)
246 240 0 5 246 100 % 1 – 0 1 0 0 0 0
Energy projects for economic recovery (EERP)
33 30 – 0 30 92 % 0 – 2 2 1 – – 1
Decentralised agencies 401 377 – 17 394 98 % 0 – 6 6 0 – – 0
Other actions and programmes
557 172 1 77 250 45 % 1 – 303 304 2 1 0 3
Pilot projects and preparatory actions
66 64 – 1 65 98 % 0 0 0 1 1 – 0 1
Specific competences of the Commission
127 120 – 2 122 97 % 0 – 2 2 2 – 0 2
Regional convergence (Less developed regions)
29 990 28 362 – 1 587 29 949 100 % 0 – 41 41 – – – –
Transition regions 5 097 4 981 – 116 5 097 100 % 0 – 0 0 – – 0 0
Competitiveness (More developed regions)
9 434 8 697 – 737 9 434 100 % 0 – – – – – – –
Outermost and sparsely populated regions
319 300 – 19 319 100 % 0 – – – – – – –
Cohesion fund 10 165 8 889 – 1 276 10 165 100 % 0 – – – – – – –
European territorial cooperation
1 671 1 516 – 155 1 671 100 % 0 – – – – – – –
Technical assistance 235 202 11 4 217 92 % 14 – 0 15 1 2 0 3
European Aid to the Most Deprived (FEAD)
522 519 0 3 522 100 % 0 – – 0 0 0 – 0
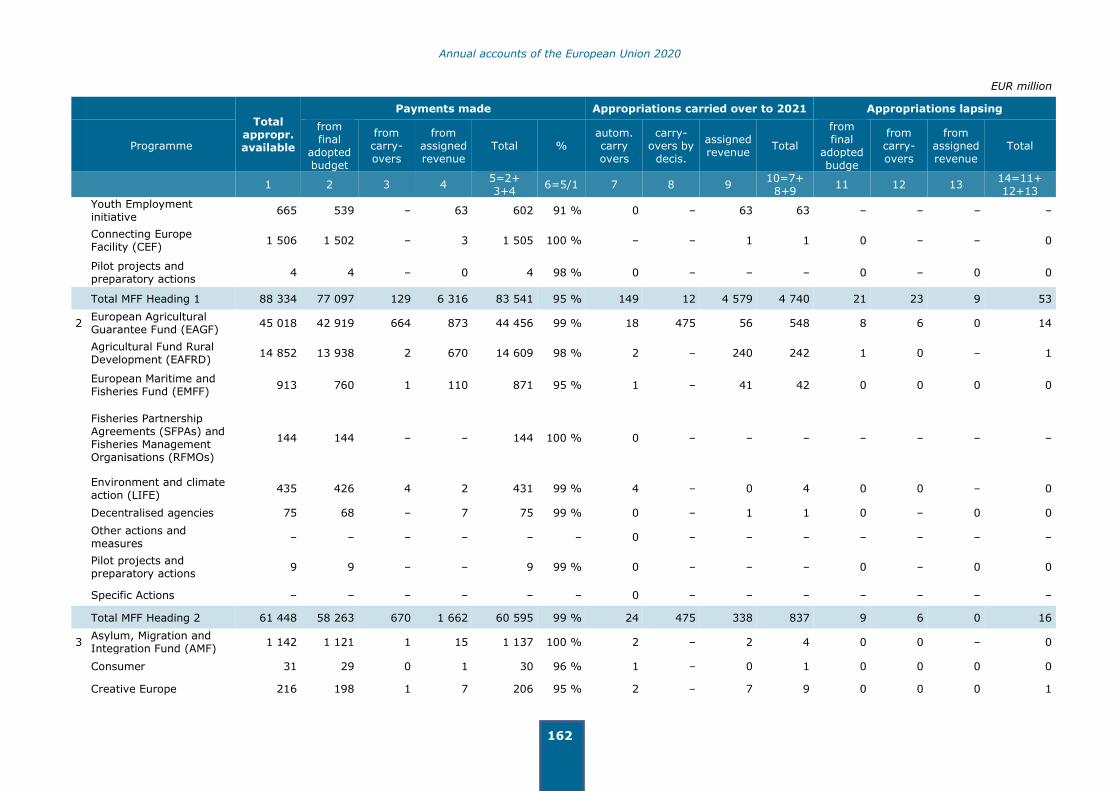
Annual accounts of the European Union 2020
162
EUR million
Total appropr. available
Payments made Appropriations carried over to 2021 Appropriations lapsing
Programme
from final
adopted budget
from carry-overs
from assigned revenue
Total % autom. carry overs
carry-overs by
decis.
assigned revenue
Total
from final
adopted budge
from carry-overs
from assigned revenue
Total
1 2 3 4 5=2+ 3+4
6=5/1 7 8 9 10=7+
8+9 11 12 13
14=11+ 12+13
Youth Employment initiative
665 539 – 63 602 91 % 0 – 63 63 – – – –
Connecting Europe Facility (CEF)
1 506 1 502 – 3 1 505 100 % – – 1 1 0 – – 0
Pilot projects and preparatory actions
4 4 – 0 4 98 % 0 – – – 0 – 0 0
Total MFF Heading 1 88 334 77 097 129 6 316 83 541 95 % 149 12 4 579 4 740 21 23 9 53
2 European Agricultural Guarantee Fund (EAGF)
45 018 42 919 664 873 44 456 99 % 18 475 56 548 8 6 0 14
Agricultural Fund Rural Development (EAFRD)
14 852 13 938 2 670 14 609 98 % 2 – 240 242 1 0 – 1
European Maritime and Fisheries Fund (EMFF)
913 760 1 110 871 95 % 1 – 41 42 0 0 0 0
Fisheries Partnership Agreements (SFPAs) and Fisheries Management Organisations (RFMOs)
144 144 – – 144 100 % 0 – – – – – – –
Environment and climate action (LIFE)
435 426 4 2 431 99 % 4 – 0 4 0 0 – 0
Decentralised agencies 75 68 – 7 75 99 % 0 – 1 1 0 – 0 0
Other actions and measures
– – – – – – 0 – – – – – – –
Pilot projects and preparatory actions
9 9 – – 9 99 % 0 – – – 0 – 0 0
Specific Actions – – – – – – 0 – – – – – – –
Total MFF Heading 2 61 448 58 263 670 1 662 60 595 99 % 24 475 338 837 9 6 0 16
3 Asylum, Migration and Integration Fund (AMF)
1 142 1 121 1 15 1 137 100 % 2 – 2 4 0 0 – 0
Consumer 31 29 0 1 30 96 % 1 – 0 1 0 0 0 0
Creative Europe 216 198 1 7 206 95 % 2 – 7 9 0 0 0 1

Annual accounts of the European Union 2020
163
EUR million
Total appropr. available
Payments made Appropriations carried over to 2021 Appropriations lapsing
Programme
from final
adopted budget
from carry-overs
from assigned revenue
Total % autom. carry overs
carry-overs by
decis.
assigned revenue
Total
from final
adopted budge
from carry-overs
from assigned revenue
Total
1 2 3 4 5=2+ 3+4
6=5/1 7 8 9 10=7+
8+9 11 12 13
14=11+ 12+13
Emergency Support within the Union (IES)
3 360 2 231 0 333 2 565 76 % – 379 417 795 – 0 – 0
Internal Security Fund 616 451 1 14 467 76 % 2 – 147 149 0 0 – 0
IT systems 0 – – – – – 0 – 0 0 – – – –
Justice 55 51 0 0 52 95 % 0 – 0 1 2 0 – 2
Rights, Equality and Citizenship
80 75 0 1 76 95 % 1 – 1 2 2 0 0 2
Union Civil protection Mechanism
203 194 – 8 202 100 % 0 – 1 1 – – – –
Europe for Citizens 26 25 0 0 25 98 % 0 – 0 0 0 0 0 0
Food and feed 237 232 1 1 234 99 % 1 – 2 3 0 0 – 0
Health 65 59 1 2 62 95 % 1 – 1 2 1 0 0 1
Decentralised agencies 1 195 1 126 – 47 1 173 98 % 0 2 20 22 0 – 0 0
Pilot projects and preparatory actions
11 11 – 0 11 100 % 0 – 0 0 – – – –
Specific Actions 94 91 1 0 92 98 % 1 – 1 2 0 0 0 0
Total MFF Heading 3 7 331 5 896 7 430 6 333 86 % 11 381 600 991 5 2 0 7
4 Pre-accession assistance (IPA II)
2 150 1 688 5 236 1 930 90 % 7 – 212 219 1 1 0 2
Macro-financial Assistance (MFA)
15 15 – – 15 100 % 0 – – – – – – –
Guarantee Fund for External Actions
240 233 – 7 240 100 % – – 0 0 – – – –
Union Civil Protection Mechanism
40 21 – 1 21 53 % 0 17 2 19 – – – –
EU Aid Volunteers initiative (EUAV)
5 5 – 0 5 87 % – – 1 1 – – – –
Fund for Sustainable Development (EFSD)
199 25 – 174 199 100 % – – – – – – – –

Annual accounts of the European Union 2020
164
EUR million
Total appropr. available
Payments made Appropriations carried over to 2021 Appropriations lapsing
Programme
from final
adopted budget
from carry-overs
from assigned revenue
Total % autom. carry overs
carry-overs by
decis.
assigned revenue
Total
from final
adopted budge
from carry-overs
from assigned revenue
Total
1 2 3 4 5=2+ 3+4
6=5/1 7 8 9 10=7+
8+9 11 12 13
14=11+ 12+13
European Neighbourhood Instrument (ENI)
2 681 2 600 6 43 2 649 99 % 5 – 27 32 0 0 0 1
Development Cooperation
Instrument (DCI) 3 112 2 954 12 77 3 043 98 % 11 – 57 68 0 1 0 1
Partnership Instrument (PI)
140 130 0 4 134 96 % 0 – 4 4 1 0 – 1
Democracy and Human Rights (EIDHR)
161 147 2 3 152 95 % 4 – 4 8 0 0 0 1
Stability and Peace (IcSP) 389 376 3 4 382 98 % 4 – 3 6 0 1 0 1
Humanitarian aid 1 956 1 609 5 304 1 918 98 % 5 – 32 37 0 1 – 1
Common Foreign and Security Policy (CFSP)
399 333 0 56 390 98 % 0 – 8 8 0 0 – 0
Nuclear Safety Cooperation (INSC)
16 15 0 0 15 92 % 1 – 0 1 0 0 – 0
Decentralised agencies 21 20 – 0 20 99 % 0 – 0 0 – – – –
Other actions and programmes
331 87 0 140 227 68 % – – 105 105 0 0 – 0
Pilot projects and preparatory actions
3 3 – – 3 87 % 0 – 0 0 0 – – 0
Specific Actions 69 67 – 0 68 98 % 0 – 0 0 1 – – 1
Total MFF Heading 4 11 928 10 328 35 1 049 11 412 96 % 37 17 454 508 4 4 1 8
5 Pensions 2 104 2 096 – – 2 096 100 % 0 – – 0 8 – 0 8
European schools 201 183 0 13 197 98 % 0 – 4 4 0 0 – 0
Decentralised agencies – – – – – – – – – – – – – –
Pilot projects and preparatory actions
4 3 0 – 4 99 % 0 0 – 0 0 – – 0

Annual accounts of the European Union 2020
165
EUR million
Total appropr. available
Payments made Appropriations carried over to 2021 Appropriations lapsing
Programme
from final
adopted budget
from carry-overs
from assigned revenue
Total % autom. carry overs
carry-overs by
decis.
assigned revenue
Total
from final
adopted budge
from carry-overs
from assigned revenue
Total
1 2 3 4 5=2+ 3+4
6=5/1 7 8 9 10=7+
8+9 11 12 13
14=11+ 12+13
Commission administrative expenditure
4 464 3 393 307 189 3 889 87 % 311 – 188 499 53 21 2 76
Administrative expenditure of Other Institutions
5 168 3 435 440 258 4 134 80 % 585 85 182 852 120 59 3 182
Total MFF Heading 5 11 941 9 111 748 460 10 319 86 % 895 85 375 1 355 182 80 5 266
6 Compensations – – – – – – – – – – – – – –
Total MFF Heading 6 – – – – – - – – – – – – – –
8 Negative reserve – – – – – – 0 – – – – – – –
Deficit carried over – – – – – – 0 – – – – – – –
Total MFF Heading 8 – – – – – - 0 – – – – – – –
9 Emergency Aid Reserve (EAR)
– – – – – – 0 – – – – – – –
European Globalisation Adjustment Fund (EGF)
22 – 0 2 2 11 % 0 – 13 13 0 0 6 6
European Union Solidarity Fund (EUSF)
1 106 1 106 – – 1 106 100 % 0 – – – – – – –
Total MFF Heading 9 1 128 1 106 0 2 1 108 98 % 0 – 13 13 0 0 6 6
O Innovation Fund (IF) 1 337 – – 1 1 0 % – – 1 336 1 336 – – – –
Total MFF Heading O 1 337 – – 1 1 0 % – – 1 336 1 336 – – – –
Total 183 446 161 801 1 589 9 920 173 310 94 % 1 116 969 7 694 9 779 221 115 20 357

Annual accounts of the European Union 2020
166
4.10. DETAILED MFF: MOVEMENTS IN OUTSTANDING COMMITMENTS (RAL)
EUR million
Commitments outstanding at the end of previous
year Commitments of the current year
Total commitm.
outstanding at the end of
the year Programme
Commitm. carried
forward from previous year
Decommitm./ Revaluations/ Cancellations
Payments Commitm. outstanding at year-end
Commitm. made
during the year
Payments
Cancellation of commitm. which cannot
be carried over
Commitm. outstanding at year-end
1 2 3 4=1+2+3 5 6 7 8=5+6+7 9=4+8
1 European Fund Strategic Investments (EFSI) 1 905 (0) (1 123) 782 321 (136) – 185 967
European satellite navigation (EGNOS/Galileo) 957 (2) (518) 437 1 312 (486) – 826 1 263
International Thermonuclear Reactor (ITER) 1 305 (0) (580) 725 396 (59) (1) 337 1 062
European Earth Observation Progr (Copernicus)
507 (1) (468) 38 663 (98) – 564 602
European Solidarity Corps (ESC) 55 (1) (16) 38 173 (118) – 55 93
European Defense Industrial Development Programme (EDIDP)
245 (0) (178) 67 255 (0) – 255 322
Nuclear Safety and Decommissioning 583 – (114) 469 147 (3) – 144 613
Horizon 2020 22 356 (595) (8 146) 13 615 16 411 (5 061) (5) 11 345 24 959
Euratom Research and Training Programme 295 (8) (122) 166 415 (222) (0) 192 358
Competitiveness enterprises and SME's (COSME)
993 (23) (456) 514 448 (66) – 382 896
Education, Training and Sport (Erasmus+) 997 (62) (446) 488 3 481 (2 623) – 858 1 346
Employment and Social Innovation (EaSI) 230 (18) (86) 125 164 (47) – 117 243
Customs, Fiscalis and Anti-Fraud 175 (8) (104) 63 144 (49) – 96 159
CEF - Energy 2 721 (14) (282) 2 424 1 282 (107) – 1 175 3 599
CEF - Transport 5 556 (95) (1 191) 4 270 2 584 (45) – 2 539 6 809
CEF - Information & Communications Technology (ICT)
490 (18) (169) 302 216 (77) – 139 442
Energy projects for economic recovery (EERP) 172 (48) (30) 94 0 (0) – – 94

Annual accounts of the European Union 2020
167
EUR million
Commitments outstanding at the end of previous
year Commitments of the current year
Total commitm.
outstanding at the end of
the year Programme
Commitm. carried
forward from previous year
Decommitm./ Revaluations/ Cancellations
Payments Commitm. outstanding at year-end
Commitm. made
during the year
Payments
Cancellation of commitm. which cannot
be carried over
Commitm. outstanding at year-end
1 2 3 4=1+2+3 5 6 7 8=5+6+7 9=4+8
Decentralised agencies 51 (10) (34) 6 403 (360) – 44 50
Other actions and programmes 410 (30) (177) 203 278 (73) – 206 408
Pilot projects and preparatory actions 133 (5) (60) 69 83 (5) – 79 147
Specific competences of the Commission 166 (14) (85) 68 138 (38) – 100 168
Regional convergence (Less developed regions)
88 615 (678) (29 709) 58 227 29 726 (240) – 29 486 87 714
Transition regions 19 984 (25) (4 637) 15 322 6 147 (460) – 5 687 21 009
Competitiveness (More developed regions) 27 824 (112) (8 579) 19 133 10 819 (854) – 9 965 29 098
Outermost and sparsely populated regions 618 (0) (304) 313 236 (15) – 221 535
Cohesion fund 28 582 (10) (9 731) 18 841 8 404 (433) – 7 971 26 812
European territorial cooperation 5 142 (1) (1 666) 3 475 2 012 (5) – 2 008 5 483
Technical assistance 273 (11) (106) 156 282 (110) (0) 172 327
European Aid to the Most Deprived (FEAD) 1 390 (1) (502) 887 579 (20) – 560 1 446
Youth Employment initiative 1 450 – (577) 874 252 (26) – 227 1 101
Connecting Europe Facility (CEF) 6 439 (83) (1 473) 4 883 1 784 (32) – 1 752 6 635
Pilot projects and preparatory actions 10 (0) (4) 6 6 (0) – 5 11
Total MFF Heading 1 220 627 (1 875) (71 673) 147 079 89 563 (11 868) (6) 77 689 224 769
2 European Agricultural Guarantee Fund (EAGF) 432 (5) (262) 165 44 315 (44 193) – 122 286
Agricultural Fund Rural Development (EAFRD) 35 108 (19) (14 154) 20 935 14 709 (455) – 14 253 35 189
European Maritime and Fisheries Fund (EMFF) 3 441 (74) (851) 2 516 963 (20) – 943 3 459

Annual accounts of the European Union 2020
168
EUR million
Commitments outstanding at the end of previous
year Commitments of the current year
Total commitm.
outstanding at the end of
the year Programme
Commitm. carried
forward from previous year
Decommitm./ Revaluations/ Cancellations
Payments Commitm. outstanding at year-end
Commitm. made
during the year
Payments
Cancellation of commitm. which cannot
be carried over
Commitm. outstanding at year-end
1 2 3 4=1+2+3 5 6 7 8=5+6+7 9=4+8
Fisheries Partnership Agreements (SFPAs) and Fisheries Management Organisations (RFMOs)
19 (2) (14) 4 148 (130) – 18 21
Environment and climate action (LIFE) 1 841 (22) (403) 1 417 592 (29) – 564 1 981
Decentralised agencies 3 (0) (3) – 75 (72) – 3 3
Other actions and measures – – – – – – – – –
Pilot projects and preparatory actions 31 (1) (8) 21 22 (1) – 22 43
Specific Actions – – – – – – – – –
Total MFF Heading 2 40 876 (122) (15 695) 25 058 60 823 (44 900) – 15 923 40 982
3 Asylum, Migration and Integration Fund (AMF) 2 870 (15) (1 048) 1 807 1 404 (90) – 1 314 3 122
Consumer 43 (4) (20) 18 30 (10) – 21 39
Creative Europe 256 (8) (95) 154 263 (112) – 152 306
Emergency Support within the Union (IES) 2 (2) (0) – 3 033 (2 565) – 469 469
Internal Security Fund 1 711 (5) (458) 1 248 652 (9) – 644 1 891
IT systems 10 (0) – 10 – – – – 10
Justice 87 (12) (27) 48 47 (25) – 22 69
Rights, Equality and Citizenship 108 (17) (43) 48 71 (33) – 37 86
Union Civil protection Mechanism 67 (4) (18) 45 525 (184) – 341 386
Europe for Citizens 24 (1) (12) 11 38 (14) – 24 35
Food and feed 357 (38) (179) 140 249 (55) – 194 334
Health 138 (7) (47) 85 74 (15) – 59 144
Decentralised agencies 395 (0) (205) 190 1 186 (968) – 218 408
Pilot projects and preparatory actions 29 (1) (11) 16 23 – – 23 39

Annual accounts of the European Union 2020
169
EUR million
Commitments outstanding at the end of previous
year Commitments of the current year
Total commitm.
outstanding at the end of
the year Programme
Commitm. carried
forward from previous year
Decommitm./ Revaluations/ Cancellations
Payments Commitm. outstanding at year-end
Commitm. made
during the year
Payments
Cancellation of commitm. which cannot
be carried over
Commitm. outstanding at year-end
1 2 3 4=1+2+3 5 6 7 8=5+6+7 9=4+8
Specific Actions 86 (4) (63) 19 106 (29) – 77 96
Total MFF Heading 3 6 183 (119) (2 225) 3 839 7 702 (4 108) – 3 594 7 433
4 Pre-accession assistance (IPA II) 8 481 (83) (1 698) 6 701 1 780 (232) (0) 1 549 8 249
Macro-financial Assistance (MFA) 35 (20) (15) – 0 (0) – 0 0
Guarantee Fund for External Actions – – – – 240 (240) – – –
Union Civil Protection Mechanism 17 (4) (4) 9 87 (18) – 70 78
EU Aid Volunteers initiative (EUAV) 28 (8) (3) 17 4 (1) – 3 20
Fund for Sustainable Development (EFSD) 95 – (95) – 104 (104) – – –
European Neighbourhood Instrument (ENI) 7 995 (196) (1 983) 5 815 2 861 (666) – 2 195 8 011
Development Cooperation Instrument (DCI) 9 203 (155) (2 591) 6 457 3 268 (452) – 2 816 9 273
Partnership Instrument (PI) 400 (3) (112) 285 168 (22) (0) 145 430
Democracy and Human Rights (EIDHR) 367 (24) (112) 231 176 (40) (0) 136 368
Stability and Peace (IcSP) 676 (49) (237) 391 413 (146) (0) 267 658
Humanitarian aid 1 205 (30) (804) 372 2 097 (1 115) (0) 982 1 354
Common Foreign and Security Policy (CFSP) 238 (68) (107) 64 379 (283) – 96 160
Nuclear Safety Cooperation (INSC) 102 (3) (14) 85 33 (1) – 32 117
Decentralised agencies 0 (0) – – 21 (20) – 1 1
Other actions and programmes 171 (27) (42) 101 228 (185) – 43 145
Pilot projects and preparatory actions 7 (1) (2) 5 1 (1) – – 5
Specific Actions 135 (2) (45) 88 88 (23) – 65 153
Total MFF Heading 4 29 154 (672) (7 862) 20 620 11 950 (3 550) (1) 8 400 29 020
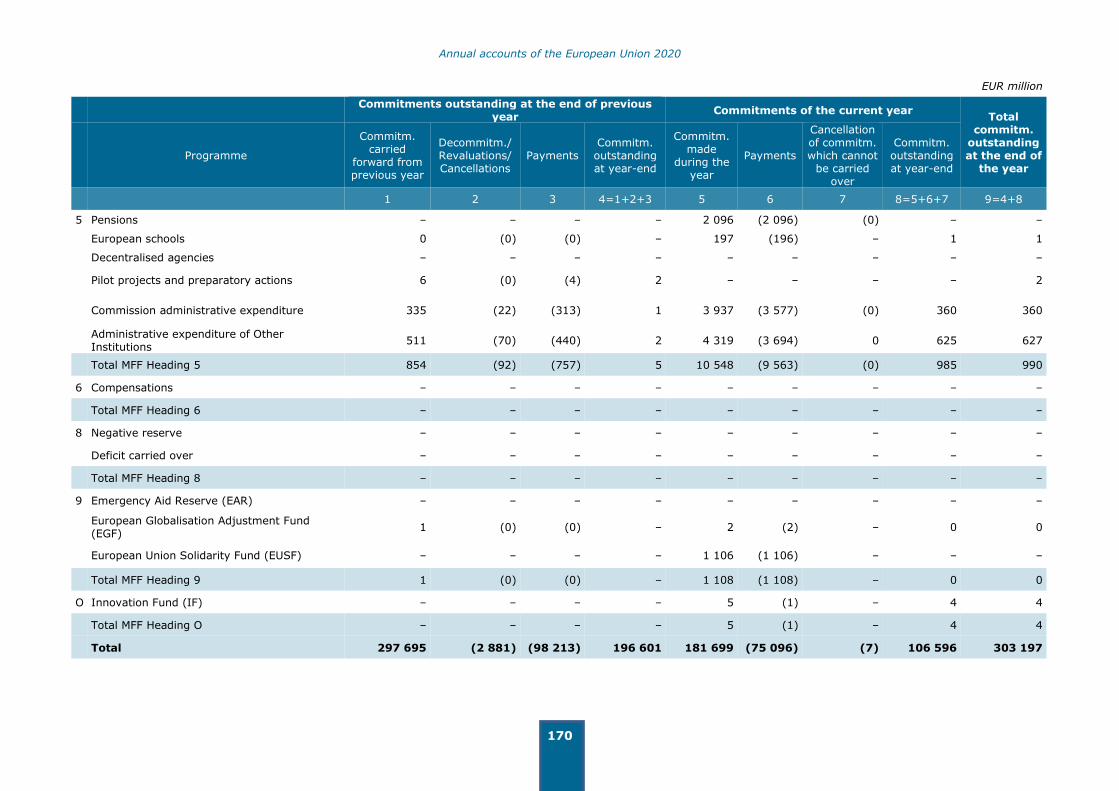
Annual accounts of the European Union 2020
170
EUR million
Commitments outstanding at the end of previous
year Commitments of the current year
Total commitm.
outstanding at the end of
the year Programme
Commitm. carried
forward from previous year
Decommitm./ Revaluations/ Cancellations
Payments Commitm. outstanding at year-end
Commitm. made
during the year
Payments
Cancellation of commitm. which cannot
be carried over
Commitm. outstanding at year-end
1 2 3 4=1+2+3 5 6 7 8=5+6+7 9=4+8
5 Pensions – – – – 2 096 (2 096) (0) – –
European schools 0 (0) (0) – 197 (196) – 1 1
Decentralised agencies – – – – – – – – –
Pilot projects and preparatory actions 6 (0) (4) 2 – – – – 2
Commission administrative expenditure 335 (22) (313) 1 3 937 (3 577) (0) 360 360
Administrative expenditure of Other Institutions
511 (70) (440) 2 4 319 (3 694) 0 625 627
Total MFF Heading 5 854 (92) (757) 5 10 548 (9 563) (0) 985 990
6 Compensations – – – – – – – – –
Total MFF Heading 6 – – – – – – – – –
8 Negative reserve – – – – – – – – –
Deficit carried over – – – – – – – – –
Total MFF Heading 8 – – – – – – – – –
9 Emergency Aid Reserve (EAR) – – – – – – – – –
European Globalisation Adjustment Fund (EGF)
1 (0) (0) – 2 (2) – 0 0
European Union Solidarity Fund (EUSF) – – – – 1 106 (1 106) – – –
Total MFF Heading 9 1 (0) (0) – 1 108 (1 108) – 0 0
O Innovation Fund (IF) – – – – 5 (1) – 4 4
Total MFF Heading O – – – – 5 (1) – 4 4
Total 297 695 (2 881) (98 213) 196 601 181 699 (75 096) (7) 106 596 303 197
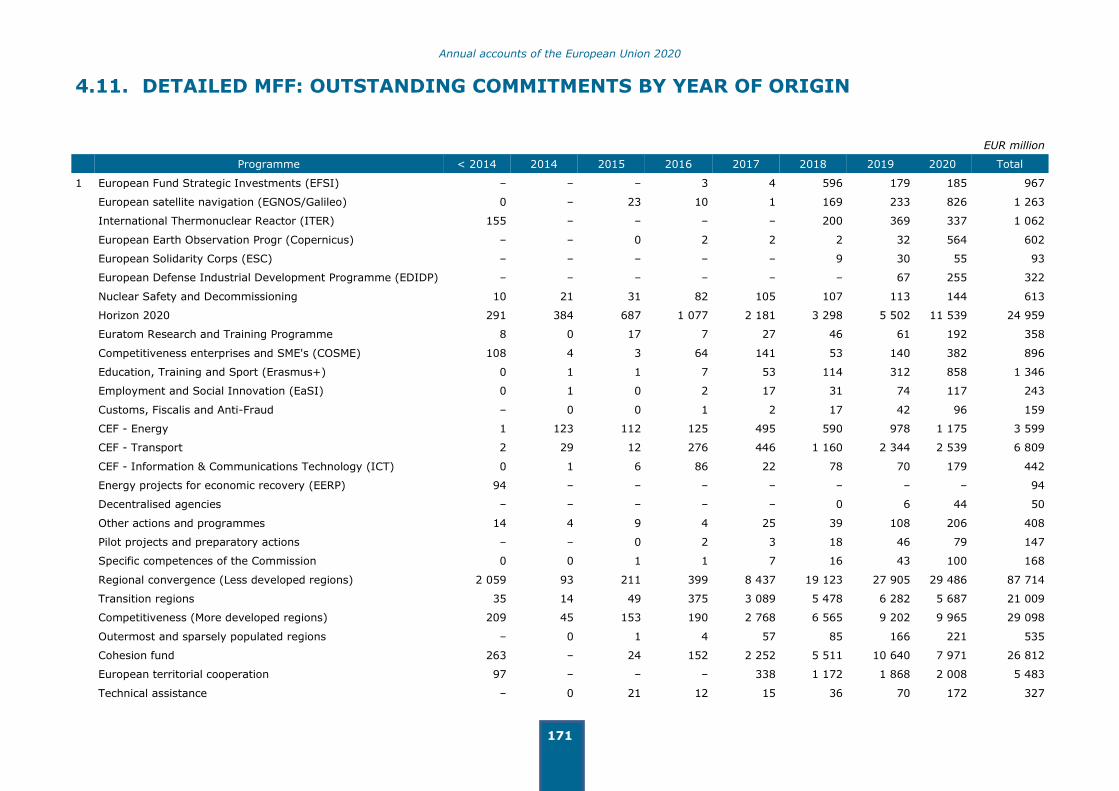
Annual accounts of the European Union 2020
171
4.11. DETAILED MFF: OUTSTANDING COMMITMENTS BY YEAR OF ORIGIN
EUR million
Programme < 2014 2014 2015 2016 2017 2018 2019 2020 Total
1 European Fund Strategic Investments (EFSI) – – – 3 4 596 179 185 967
European satellite navigation (EGNOS/Galileo) 0 – 23 10 1 169 233 826 1 263
International Thermonuclear Reactor (ITER) 155 – – – – 200 369 337 1 062
European Earth Observation Progr (Copernicus) – – 0 2 2 2 32 564 602
European Solidarity Corps (ESC) – – – – – 9 30 55 93
European Defense Industrial Development Programme (EDIDP) – – – – – – 67 255 322
Nuclear Safety and Decommissioning 10 21 31 82 105 107 113 144 613
Horizon 2020 291 384 687 1 077 2 181 3 298 5 502 11 539 24 959
Euratom Research and Training Programme 8 0 17 7 27 46 61 192 358
Competitiveness enterprises and SME's (COSME) 108 4 3 64 141 53 140 382 896
Education, Training and Sport (Erasmus+) 0 1 1 7 53 114 312 858 1 346
Employment and Social Innovation (EaSI) 0 1 0 2 17 31 74 117 243
Customs, Fiscalis and Anti-Fraud – 0 0 1 2 17 42 96 159
CEF - Energy 1 123 112 125 495 590 978 1 175 3 599
CEF - Transport 2 29 12 276 446 1 160 2 344 2 539 6 809
CEF - Information & Communications Technology (ICT) 0 1 6 86 22 78 70 179 442
Energy projects for economic recovery (EERP) 94 – – – – – – – 94
Decentralised agencies – – – – – 0 6 44 50
Other actions and programmes 14 4 9 4 25 39 108 206 408
Pilot projects and preparatory actions – – 0 2 3 18 46 79 147
Specific competences of the Commission 0 0 1 1 7 16 43 100 168
Regional convergence (Less developed regions) 2 059 93 211 399 8 437 19 123 27 905 29 486 87 714
Transition regions 35 14 49 375 3 089 5 478 6 282 5 687 21 009
Competitiveness (More developed regions) 209 45 153 190 2 768 6 565 9 202 9 965 29 098
Outermost and sparsely populated regions – 0 1 4 57 85 166 221 535
Cohesion fund 263 – 24 152 2 252 5 511 10 640 7 971 26 812
European territorial cooperation 97 – – – 338 1 172 1 868 2 008 5 483
Technical assistance – 0 21 12 15 36 70 172 327
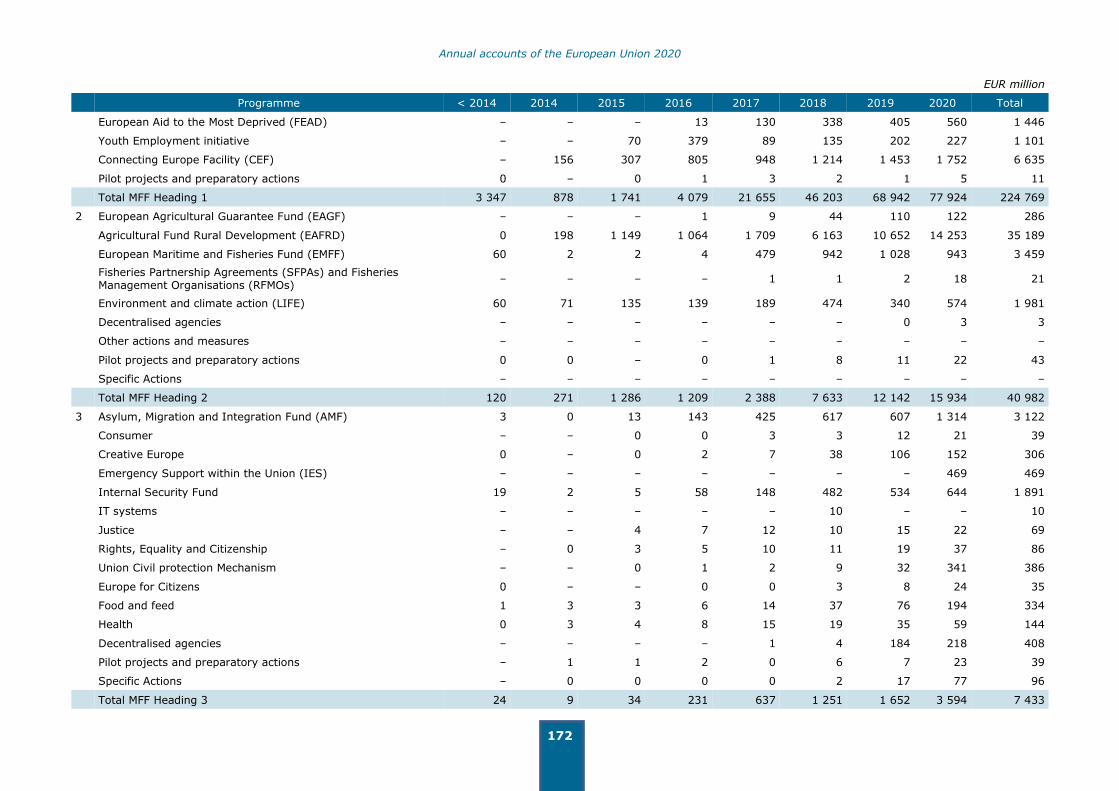
Annual accounts of the European Union 2020
172
EUR million
Programme < 2014 2014 2015 2016 2017 2018 2019 2020 Total
European Aid to the Most Deprived (FEAD) – – – 13 130 338 405 560 1 446
Youth Employment initiative – – 70 379 89 135 202 227 1 101
Connecting Europe Facility (CEF) – 156 307 805 948 1 214 1 453 1 752 6 635
Pilot projects and preparatory actions 0 – 0 1 3 2 1 5 11
Total MFF Heading 1 3 347 878 1 741 4 079 21 655 46 203 68 942 77 924 224 769
2 European Agricultural Guarantee Fund (EAGF) – – – 1 9 44 110 122 286
Agricultural Fund Rural Development (EAFRD) 0 198 1 149 1 064 1 709 6 163 10 652 14 253 35 189
European Maritime and Fisheries Fund (EMFF) 60 2 2 4 479 942 1 028 943 3 459
Fisheries Partnership Agreements (SFPAs) and Fisheries Management Organisations (RFMOs)
– – – – 1 1 2 18 21
Environment and climate action (LIFE) 60 71 135 139 189 474 340 574 1 981
Decentralised agencies – – – – – – 0 3 3
Other actions and measures – – – – – – – – –
Pilot projects and preparatory actions 0 0 – 0 1 8 11 22 43
Specific Actions – – – – – – – – –
Total MFF Heading 2 120 271 1 286 1 209 2 388 7 633 12 142 15 934 40 982
3 Asylum, Migration and Integration Fund (AMF) 3 0 13 143 425 617 607 1 314 3 122
Consumer – – 0 0 3 3 12 21 39
Creative Europe 0 – 0 2 7 38 106 152 306
Emergency Support within the Union (IES) – – – – – – – 469 469
Internal Security Fund 19 2 5 58 148 482 534 644 1 891
IT systems – – – – – 10 – – 10
Justice – – 4 7 12 10 15 22 69
Rights, Equality and Citizenship – 0 3 5 10 11 19 37 86
Union Civil protection Mechanism – – 0 1 2 9 32 341 386
Europe for Citizens 0 – – 0 0 3 8 24 35
Food and feed 1 3 3 6 14 37 76 194 334
Health 0 3 4 8 15 19 35 59 144
Decentralised agencies – – – – 1 4 184 218 408
Pilot projects and preparatory actions – 1 1 2 0 6 7 23 39
Specific Actions – 0 0 0 0 2 17 77 96
Total MFF Heading 3 24 9 34 231 637 1 251 1 652 3 594 7 433

Annual accounts of the European Union 2020
173
EUR million
Programme < 2014 2014 2015 2016 2017 2018 2019 2020 Total
4 Pre-accession assistance (IPA II) 429 155 380 821 1 046 1 365 2 505 1 549 8 249
Macro-financial Assistance (MFA) – – – – – – – 0 0
Guarantee Fund for External Actions – – – – – – – – –
Union Civil Protection Mechanism – – – 0 1 2 6 70 78
EU Aid Volunteers initiative (EUAV) – 2 0 0 3 4 7 3 20
Fund for Sustainable Development (EFSD) – – – – – – – – –
European Neighbourhood Instrument (ENI) 562 198 305 609 849 1 488 1 805 2 195 8 011
Development Cooperation Instrument (DCI) 320 205 391 577 1 225 1 485 2 229 2 839 9 273
Partnership Instrument (PI) 10 15 11 24 43 75 108 145 430
Democracy and Human Rights (EIDHR) 4 9 13 15 29 71 91 136 368
Stability and Peace (IcSP) 4 12 19 33 61 105 157 267 658
Humanitarian aid – – 0 0 48 73 251 982 1 354
Common Foreign and Security Policy (CFSP) 0 – – 1 5 9 49 96 160
Nuclear Safety Cooperation (INSC) 4 5 9 9 12 26 20 32 117
Decentralised agencies – – – – – – – 1 1
Other actions and programmes 4 6 9 24 13 14 31 43 145
Pilot projects and preparatory actions 1 – 2 0 1 1 1 – 5
Specific Actions 0 1 1 9 16 15 45 65 153
Total MFF Heading 4 1 339 607 1 140 2 122 3 351 4 733 7 304 8 423 29 020
5 Pensions – – – – – – (0) 0 –
European schools – – – – – – 0 1 1
Decentralised agencies – – – – – – – – –
Pilot projects and preparatory actions – – – – 0 0 2 – 2
Commission administrative expenditure – – – – – 0 1 360 360
Administrative expenditure of Other Institutions 0 0 0 0 0 0 0 627 627
Total MFF Heading 5 – – – – 0 0 3 987 990
6 Compensations – – – – – – – – –
Total MFF Heading 6 – – – – – – – – –
8 Negative reserve – – – – – – – – –
Deficit carried over – – – – – – – – –
Total MFF Heading 8 – – – – – – – – –
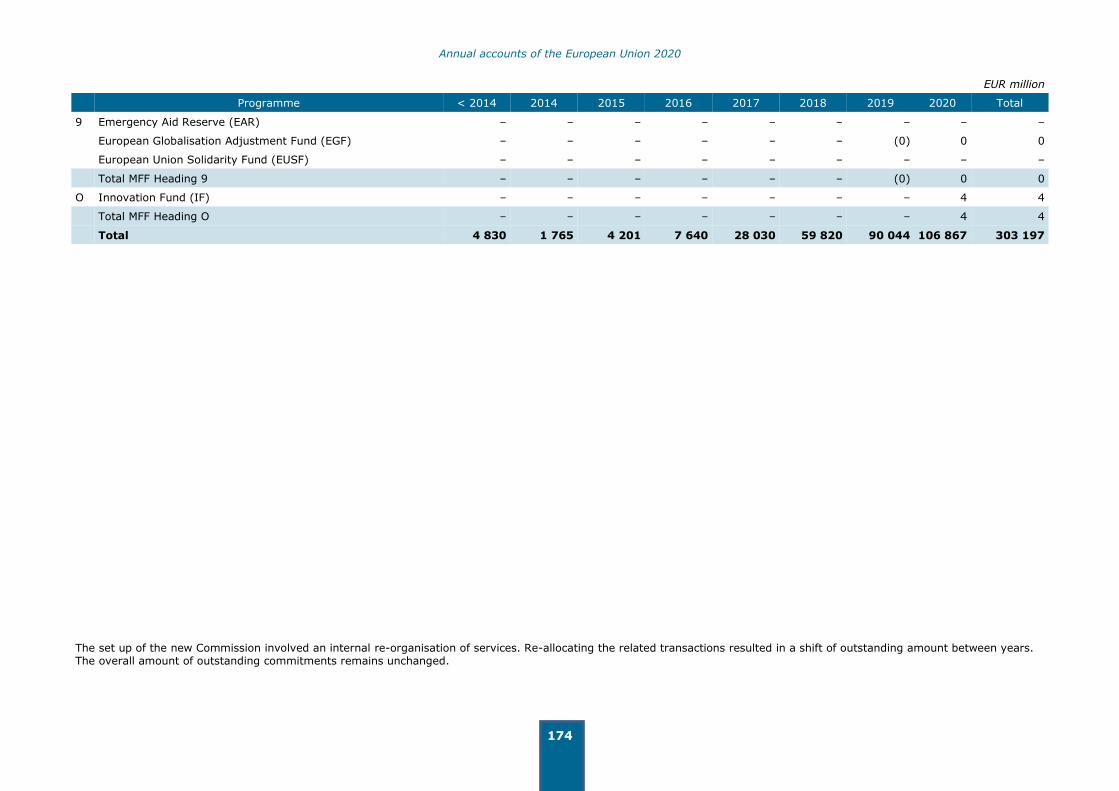
Annual accounts of the European Union 2020
174
EUR million
Programme < 2014 2014 2015 2016 2017 2018 2019 2020 Total
9 Emergency Aid Reserve (EAR) – – – – – – – – –
European Globalisation Adjustment Fund (EGF) – – – – – – (0) 0 0
European Union Solidarity Fund (EUSF) – – – – – – – – –
Total MFF Heading 9 – – – – – – (0) 0 0
O Innovation Fund (IF) – – – – – – – 4 4
Total MFF Heading O – – – – – – – 4 4
Total 4 830 1 765 4 201 7 640 28 030 59 820 90 044 106 867 303 197
The set up of the new Commission involved an internal re-organisation of services. Re-allocating the related transactions resulted in a shift of outstanding amount between years. The overall amount of outstanding commitments remains unchanged.

Annual accounts of the European Union 2020
175
4.12. DETAILED MFF: OUTSTANDING COMMITMENTS BY APPROPRIATIONS TYPE
EUR million
From budget appropriations From assigned revenue appropriations Total commitm.
outstanding at the end of
2020
Heading
Commitm. carried forward
from 2019
Adjust- ments
Commitm. made
Payments made
Amount remaining
to be settled
Commitm. carried forward
from 2019
Adjust- ments
Commitm. made
Payments made
Amount remaining
to be settled
1 2 3 4 5=1+2+3-4 6 7 8 9 10=6+7+8-
9 11=5+10
1 European Fund Strategic Investments (EFSI)
1 877 (0) 173 1 103 947 27 – 148 156 19 967
European satellite navigation (EGNOS/Galileo)
793 (0) 1 207 977 1 023 164 (2) 105 27 240 1 263
International Thermonuclear Reactor (ITER)
1 289 (1) 367 638 1 017 16 – 29 1 45 1 062
European Earth Observation Progr (Copernicus)
507 (1) 647 566 587 0 – 16 0 15 602
European Solidarity Corps (ESC)
51 (1) 166 128 88 4 – 7 6 5 93
European Defense Industrial Development Programme (EDIDP)
245 (0) 255 178 322 – – 0 – 0 322
Nuclear Safety and Decommissioning
583 – 147 117 613 613
Horizon 2020 20 078 (429) 13 485 11 815 21 319 2 278 (170) 2 925 1 392 3 641 24 959
Euratom Research and Training Programme
245 (7) 389 331 296 50 (1) 26 13 62 358
Competitiveness enterprises and SME's (COSME)
900 (23) 418 482 812 93 (0) 30 40 84 896
Education, Training and Sport (Erasmus+)
817 (32) 2 885 2 679 990 180 (30) 595 389 356 1 346
Employment and Social Innovation (EaSI)
202 (17) 116 102 199 27 (1) 49 32 44 243
Customs, Fiscalis and Anti-Fraud
167 (8) 133 147 146 8 (0) 11 6 13 159
CEF - Energy 2 674 (14) 1 281 390 3 551 47 – 1 0 48 3 599
CEF - Transport 5 374 (91) 2 580 1 188 6 675 182 (4) 4 49 133 6 809

Annual accounts of the European Union 2020
176
EUR million
From budget appropriations From assigned revenue appropriations Total
commitm. outstanding at the end of
2020
Heading
Commitm. carried forward
from 2019
Adjust- ments
Commitm. made
Payments made
Amount remaining
to be settled
Commitm. carried forward
from 2019
Adjust- ments
Commitm. made
Payments made
Amount remaining
to be settled
1 2 3 4 5=1+2+3-4 6 7 8 9 10=6+7+8-
9 11=5+10
CEF - Information & Communications Technology (ICT)
483 (17) 210 243 434 6 (1) 6 2 8 442
Energy projects for economic recovery (EERP)
172 (48) – 30 94 – – 0 0 – 94
Decentralised agencies 49 (9) 385 377 49 2 (1) 18 17 1 50
Other actions and programmes 283 (19) 195 172 287 127 (11) 83 78 121 408
Pilot projects and preparatory actions
133 (5) 83 64 147 1 – – 0 0 147
Specific competences of the Commission
165 (14) 135 119 166 2 (0) 3 3 2 168
Regional convergence (Less developed regions)
77 658 (669) 29 147 29 912 76 224 10 957 (10) 579 37 11 489 87 714
Transition regions 17 678 (25) 6 097 5 091 18 659 2 306 – 50 6 2 350 21 009
Competitiveness (More developed regions)
24 372 (112) 10 623 9 420 25 463 3 452 – 197 14 3 635 29 098
Outermost and sparsely populated regions
540 (0) 236 319 457 78 – – – 78 535
Cohesion fund 24 375 (10) 8 239 9 963 22 642 4 207 – 165 202 4 170 26 812
European territorial cooperation
4 506 (1) 2 012 1 671 4 847 636 – – – 636 5 483
Technical assistance 273 (11) 278 216 323 0 (0) 4 0 4 327
European Aid to the Most Deprived (FEAD)
1 361 (1) 579 522 1 417 29 – 1 – 30 1 446
Youth Employment initiative 839 – 157 567 429 611 – 96 35 672 1 101
Connecting Europe Facility (CEF)
6 439 (83) 1 781 1 505 6 632 – – 3 0 3 6 635
Pilot projects and preparatory actions
10 (0) 6 4 11 11
Total Heading 1: Smart and inclusive growth
195 138 (1 648) 84 411 81 035 196 865 25 490 (232) 5 152 2 506 27 904 224 769

Annual accounts of the European Union 2020
177
EUR million
From budget appropriations From assigned revenue appropriations Total
commitm. outstanding at the end of
2020
Heading
Commitm. carried forward
from 2019
Adjust- ments
Commitm. made
Payments made
Amount remaining
to be settled
Commitm. carried forward
from 2019
Adjust- ments
Commitm. made
Payments made
Amount remaining
to be settled
1 2 3 4 5=1+2+3-4 6 7 8 9 10=6+7+8-
9 11=5+10
2 European Agricultural Guarantee Fund (EAGF)
431 (5) 43 441 43 582 286 1 – 873 874 – 286
Agricultural Fund Rural
Development (EAFRD) 35 108 (19) 14 708 14 609 35 188 0 – 0 0 0 35 189
European Maritime and Fisheries Fund (EMFF)
3 027 (74) 960 871 3 043 413 – 3 0 416 3 459
Fisheries Partnership Agreements (SFPAs) and
Fisheries Management Organisations (RFMOs)
19 (2) 148 144 21 21
Environment and climate action (LIFE)
1 831 (21) 590 425 1 974 10 (0) 3 6 7 1 981
Decentralised agencies 3 (0) 68 67 3 0 – 7 7 – 3
Pilot projects and preparatory actions
31 (1) 22 9 43 43
Total Heading 2: Sustainable growth: natural resources
40 451 (122) 59 937 59 707 40 559 425 (0) 886 888 423 40 982
3 Asylum, Migration and Integration Fund (AMF)
2 817 (15) 1 389 1 124 3 068 53 – 15 14 54 3 122
Consumer 42 (4) 30 29 39 1 (0) 1 1 0 39
Creative Europe 250 (7) 252 200 296 6 (1) 11 7 9 306
Emergency Support within the Union (IES)
2 (2) 2 700 2 231 469 – – 333 333 0 469
Internal Security Fund 1 603 (5) 528 462 1 664 109 – 124 5 228 1 891
IT systems 7 – – – 7 2 (0) – – 2 10
Justice 86 (12) 47 52 69 0 (0) 0 0 0 69
Rights, Equality and Citizenship 107 (17) 70 75 85 1 (0) 1 1 1 86
Union Civil protection Mechanism
65 (4) 511 200 372 3 (0) 14 2 14 386
Europe for Citizens 24 (1) 38 25 35 0 (0) 0 0 0 35

Annual accounts of the European Union 2020
178
EUR million
From budget appropriations From assigned revenue appropriations Total
commitm. outstanding at the end of
2020
Heading
Commitm. carried forward
from 2019
Adjust- ments
Commitm. made
Payments made
Amount remaining
to be settled
Commitm. carried forward
from 2019
Adjust- ments
Commitm. made
Payments made
Amount remaining
to be settled
1 2 3 4 5=1+2+3-4 6 7 8 9 10=6+7+8-
9 11=5+10
Food and feed 354 (38) 247 231 333 3 (0) 2 3 2 334
Health 136 (7) 72 61 141 2 (0) 2 1 2 144
Decentralised agencies 395 (0) 1 139 1 126 407 0 – 47 46 0 408
Pilot projects and preparatory actions
29 (1) 23 11 39 39
Specific Actions 86 (4) 106 92 96 0 (0) 0 0 0 96
Total Heading 3: Security and citizenship
6 004 (118) 7 152 5 919 7 119 179 (2) 550 414 314 7 433
4 Pre-accession assistance (IPA II)
7 698 (81) 1 609 1 761 7 465 784 (2) 172 169 785 8 249
Macro-financial Assistance (MFA)
35 (20) 0 15 0 0
Guarantee Fund for External Actions
– – 233 233 – – – 7 7 – –
Union Civil Protection Mechanism
16 (4) 85 20 76 1 (0) 3 1 2 78
EU Aid Volunteers initiative (EUAV)
28 (8) 4 5 19 0 – 1 0 1 20
Fund for Sustainable Development (EFSD)
– – 25 25 – 95 – 79 174 (0) (0)
European Neighbourhood Instrument (ENI)
7 905 (193) 2 845 2 616 7 941 89 (3) 16 32 70 8 011
Development Cooperation Instrument (DCI)
9 054 (149) 3 206 2 949 9 162 149 (6) 63 95 111 9 273
Partnership Instrument (PI) 394 (3) 164 133 422 6 (0) 3 1 8 430
Democracy and Human Rights (EIDHR)
365 (24) 172 152 362 2 – 4 1 6 368
Stability and Peace (IcSP) 657 (48) 408 378 639 19 (1) 4 4 19 658
Humanitarian aid 873 (29) 2 084 1 627 1 301 332 (1) 13 291 53 1 354
Common Foreign and Security Policy (CFSP)
219 (57) 336 361 137 19 (10) 43 29 22 160

Annual accounts of the European Union 2020
179
EUR million
From budget appropriations From assigned revenue appropriations Total
commitm. outstanding at the end of
2020
Heading
Commitm. carried forward
from 2019
Adjust- ments
Commitm. made
Payments made
Amount remaining
to be settled
Commitm. carried forward
from 2019
Adjust- ments
Commitm. made
Payments made
Amount remaining
to be settled
1 2 3 4 5=1+2+3-4 6 7 8 9 10=6+7+8-
9 11=5+10
Nuclear Safety Cooperation (INSC)
101 (3) 33 15 116 1 (0) – – 1 117
Decentralised agencies – – 21 20 1 0 (0) – – – 1
Other actions and programmes 144 (5) 82 87 135 26 (23) 146 139 10 145
Pilot projects and preparatory actions
7 (1) 1 3 5 5
Specific Actions 135 (2) 88 68 153 0 – 0 0 0 153
Total Heading 4: Global Europe 27 633 (627) 11 395 10 468 27 933 1 521 (46) 555 943 1 087 29 020
5 Pensions – (0) 2 096 2 096 – – – – – – –
European schools 0 – 183 183 0 0 (0) 14 13 1 1
Pilot projects and preparatory actions
6 (0) – 4 2 0 – – – 0 2
Commission administrative expenditure
290 (19) 3 705 3 660 317 45 (4) 231 230 43 360
Administrative expenditure of Other Institutions
464 (22) 4 024 3 875 591 47 (47) 294 258 36 627
Total Heading 5: Administration
761 (41) 10 009 9 818 910 93 (51) 540 502 80 990
9 European Globalisation Adjustment Fund (EGF)
1 (0) 2 2 0 0
European Union Solidarity Fund (EUSF)
– – 1 106 1 106 – –
Total Heading 9: Special Instruments
1 – 1108 1108 – –
O Innovation Fund (IF) – – – – – 5 1 4 4
Total Heading O: Innovation Fund (IF)
– – – – – 5 1 4 4
Total 269 987 (2 557) 174 012 168 056 273 386 27 708 (330) 7 688 5 254 29 811 303 197

Annual accounts of the European Union 2020
180
5. IMPLEMENTATION OF THE BUDGET BY INSTITUTION
5.1. IMPLEMENTATION OF BUDGET REVENUE
EUR million
Income appropriations Entitlements established Revenue Receipts as % of budget
Out- standing Institution
Initial adopted budget
Final adopted budget
Current year
Carried over
Total On entitlem. of current year
On entitlem.
carried over Total
1 2 3 4 5=3+4 6 7 8=6+7 9=8/2 10=5-8
European Parliament 171 171 199 21 220 197 7 203 119 % 17
European Council and Council 56 56 102 2 103 101 1 102 181 % 1
Commission 153 185 163 727 173 169 19 829 192 998 171 765 1 824 173 589 106 % 19 409
Court of Justice 58 58 57 0 57 57 0 57 98 % 0
Court of Auditors 22 22 23 0 23 23 0 23 102 % 0
Economic and Social Committee 13 13 17 0 17 17 0 17 138 % 0
Committee of the Regions 10 10 11 0 11 11 0 11 109 % 0
Ombudsman 1 1 1 0 1 1 0 1 88 % –
European Data Protection Supervisor 2 2 1 0 1 1 0 1 82 % –
European External Action Service 49 49 302 2 304 299 2 301 615 % 3
Total 153 566 164 108 173 882 19 853 193 735 172 472 1 834 174 306 106 % 19 429
The consolidated reports on the implementation of the general budget of the EU include, as in previous years, the budget implementation of all Institutions
since within the EU budget a separate budget for each Institution is established.
The budget and implementation of Agencies are not consolidated within the EU budget and are not included in the EU budget reports. The Commission subsidy paid to the agencies however is part of the EU budget. In this budgetary part of the annual accounts, only the subsidy paid from the Commission budget to the Agencies is taken into consideration.
Concerning the EEAS, it should be noted that, in addition to its own budget, it also receives contributions from the Commission of EUR 148.1 million (2019: EUR 152.7 million) and the EDF and the Trust Funds of EUR 64.4 million (2019: EUR 63.1 million). These contributions cover the costs of the Commission's
staff in the delegations financed under the EDF and the Trust Funds, including assigned revenue generated during the year from these contributions.

Annual accounts of the European Union 2020
181
5.2. IMPLEMENTATION OF COMMITMENT APPROPRIATIONS
EUR million
Total
appropriat. available
Commitments made Appropriations carried over to
2021 Appropriations lapsing
Institution from final adopted budget
from carry-overs
from assigned revenue
Total % from
assigned revenue
carry-overs by decision
Total from final adopted budget
from carry-overs
from assigned revenue
Total
1 2 3 4 5=2+3+4 6=5/1 7 8 9=7+8 10 11 12 13=10+ 11+12
European Parliament 2 105 1 951 0 34 1 985 94 % 28 75 103 13 0 4 17
European Council and Council
649 550 0 15 566 87 % 43 0 43 40 0 1 41
Commission 183 075 168 909 1 078 7 393 177 381 97 % 3 896 497 4 393 253 4 1 044 1 302
Court of Justice 438 432 0 0 432 99 % 0 0 0 5 0 1 5
Court of Auditors 152 146 0 0 146 96 % 0 0 0 7 0 – 7
Economic and Social Committee
147 131 0 4 134 91 % 1 0 1 12 0 0 12
Committee of Regions 103 94 0 1 95 92 % 0 0 0 7 0 0 7
Ombudsman 12 12 0 0 12 95 % 0 0 0 1 0 0 1
European Data-protection Supervisor
19 14 0 – 14 73 % – 0 – 5 0 0 5
European External Action Service
1 040 695 0 240 934 90 % 69 10 79 27 0 0 27
Total 187 742 172 933 1 078 7 688 181 699 97 % 4 038 582 4 620 369 4 1 050 1 423

Annual accounts of the European Union 2020
182
5.3. IMPLEMENTATION OF PAYMENT APPROPRIATIONS
EUR million
Total approp.
available
Payments made Appropriations carried over to 2021 Appropriations lapsing
Institution
from final
adopted budget
from carry- overs
from assigned revenue
Total % automatic
carry-overs
carry- overs
by decision
from assigned revenue
Total
from final
adopted budget
from carry- overs
from assigned revenue
Total
1 2 3 4 5=2+3+
4 6=5/1 7 8 9
10=7+8+9
11 12 13 14
European Parliament 2 379 1 590 247 25 1 862 78 % 357 75 39 471 17 27 1 46
European Council and Council
702 481 45 14 540 77 % 70 0 44 113 40 7 1 48
Commission 178 278 158 366 1 149 9 661 169 176 95 % 532 885 7 511 8 928 101 56 18 174
Court of Justice 463 399 21 0 420 91 % 33 0 1 34 5 4 1 9
Court of Auditors 159 137 6 0 143 90 % 9 0 (0) 9 7 1 0 7
Economic and Social Committee
156 119 7 3 128 82 % 12 0 2 14 12 2 0 14
Committee of Regions 115 84 10 1 94 82 % 11 0 1 12 7 2 0 9
Ombudsman 13 12 0 0 12 93 % 0 0 0 0 1 0 0 1
European Data-protection Supervisor
21 13 2 – 15 69 % 1 0 – 1 5 0 0 5
European External Action Service
1 161 602 102 215 919 79 % 93 10 96 198 27 16 0 43
Total 183 446 161 801 1 589 9 920 173 310 94 % 1 116 969 7 694 9 779 221 115 20 357

Annual accounts of the European Union 2020
183
6. IMPLEMENTATION OF THE AGENCIES' BUDGET
The agencies’ revenue and expenditure, as shown in the reports 6.1 and 6.2 below, are not consolidated as such within the EU budget. In this budgetary part of the annual accounts, only the subsidy paid from the Commission budget to the Agencies is taken into consideration.
The EU budget implementation reports include the subsidy paid from the EU budget to the agencies as commitment and payment appropriations, when applicable.
The agencies’ reports below show an overview of the Agencies, both decentralised (also known as traditional agencies) and executive agencies, and of their revenue (6.1) and expenditure (6.2).
Other sources of revenue and their related expenditure are not added into the EU budget accounts. Each agency presents its own set of annual accounts.
6.1. BUDGET REVENUE
EUR million
Agency Funding
MFF heading
Final adopted budget
Revenue received
Agency for Operational Management of Large-Scale IT Systems 3 233 237
Agency for the Cooperation of Energy Regulators 1a 17 17
Body of European Regulators for Electronic Communications 1a 7 7
Community Plant Variety Office N/A 20 18
Consumers, Health, Agriculture and Food Executive Agency 3 11 11
Education, Audiovisual and Culture Executive Agency 1a, 3, 4 51 50
European Agency for Safety and Health at Work 1a 16 16
European Asylum Support Office 3 130 131
European Banking Authority 1a 101 48
European Border and Coast Guard Agency 3 364 373
European Centre for Disease Prevention and Control 3 62 72
European Centre for the Development of Vocational Training 1a 18 17
European Chemicals Agency 1a, 2 114 110
European Environment Agency 2 61 61
European Fisheries Control Agency 2 17 18
European Food Safety Authority 3 99 99
European Global Navigation Satellite Systems (GNSS) Agency 1a 35 933
European Institute for Gender Equality 3 8 8
European Institute of Innovation and Technology 1a 547 550
European Insurance and Occupational Pensions Authority 1a 28 29
European Maritime Safety Agency 1a 81 98
European Medicines Agency 3 370 404
European Monitoring Centre for Drugs and Drug Addiction 3 18 18
European Research Council 1a 52 52
European Securities and Markets Authority 1a 55 54
European Training Foundation 4 20 20
European Union Agency for Criminal Justice Cooperation 3 42 48
European Union Agency for Cybersecurity 1a 22 22
European Union Agency for Law Enforcement Cooperation 3 154 161
European Union Agency for Law Enforcement Training 3 8 25
European Union Agency for Railways 1a 31 31
European Union Aviation Safety Agency 1a 183 173
European Union Fundamental Rights Agency 3 24 24
European Union Intellectual Property Office N/A 465 284
Executive Agency for Small and Medium-sized Enterprises 1a 52 49
Foundation for Improvement of Living and Working Conditions 1a 22 22
Fusion for Energy Joint Undertaking 1a 640 795
Innovation and Networks Executive Agency 1a 32 31
Research Executive Agency 5 80 80
Translation Centre for the Bodies of the European Union 5 47 44
Total 4 338 5 240

Annual accounts of the European Union 2020
184
EUR million
Type of revenue Final adopted
budget Amounts received
Commission subsidy 2 543 3 423
Fee income 751 774
Other income 1 045 1 044
Total 4 338 5 240
6.2. COMMITMENT AND PAYMENT APPROPRIATIONS BY AGENCY
EUR million
Commitment
appropriations Payment
appropriations
Agency Total
appropr. available
Commit. made
Total appropr. available
Payments made
Agency for Operational Management of Large-Scale IT Systems 412 341 256 229
Agency for the Cooperation of Energy Regulators 17 17 20 17
Body of European Regulators for Electronic Communications 7 7 8 5
Community Plant Variety Office 21 18 20 18
Consumers, Health, Agriculture and Food Executive Agency 11 11 13 11
Education, Audiovisual and Culture Executive Agency 50 50 56 52
European Agency for Safety and Health at Work 17 16 20 13
European Asylum Support Office 141 120 149 107
European Banking Authority 49 49 54 49
European Border and Coast Guard Agency 384 372 495 305
European Centre for Disease Prevention and Control 72 61 82 57
European Centre for the Development of Vocational Training 18 18 18 17
European Chemicals Agency 112 108 128 110
European Environment Agency 77 75 97 69
European Fisheries Control Agency 18 17 20 16
European Food Safety Authority 104 104 107 95
European Global Navigation Satellite Systems (GNSS) Agency 915 438 1 584 788
European Institute for Gender Equality 8 8 10 7
European Institute of Innovation and Technology 625 612 560 551
European Insurance and Occupational Pensions Authority 29 29 33 27
European Maritime Safety Agency 105 98 119 99
European Medicines Agency 405 398 456 374
European Monitoring Centre for Drugs and Drug Addiction 19 18 20 17
European Research Council 52 52 55 53
European Securities and Markets Authority 54 53 60 51
European Training Foundation 21 21 22 20
European Union Agency for Criminal Justice Cooperation 48 44 51 40
European Union Agency for Cybersecurity 22 21 26 19
European Union Agency for Law Enforcement Cooperation 165 156 183 148
European Union Agency for Law Enforcement Training 30 13 32 10
European Union Agency for Railways 33 33 34 29
European Union Aviation Safety Agency 262 171 273 156
European Union Fundamental Rights Agency 25 24 30 22
European Union Intellectual Property Office 483 256 21 253
Executive Agency for Small and Medium-sized Enterprises 49 48 54 48
Foundation for Improvement of Living and Working Conditions 22 22 27 21
Fusion for Energy Joint Undertaking 886 885 816 800
Innovation and Networks Executive Agency 31 31 32 30
Research Executive Agency 80 79 86 78
Translation Centre for the Bodies of the European Union 47 42 50 42
Total 5 928 4 934 6 179 4 855
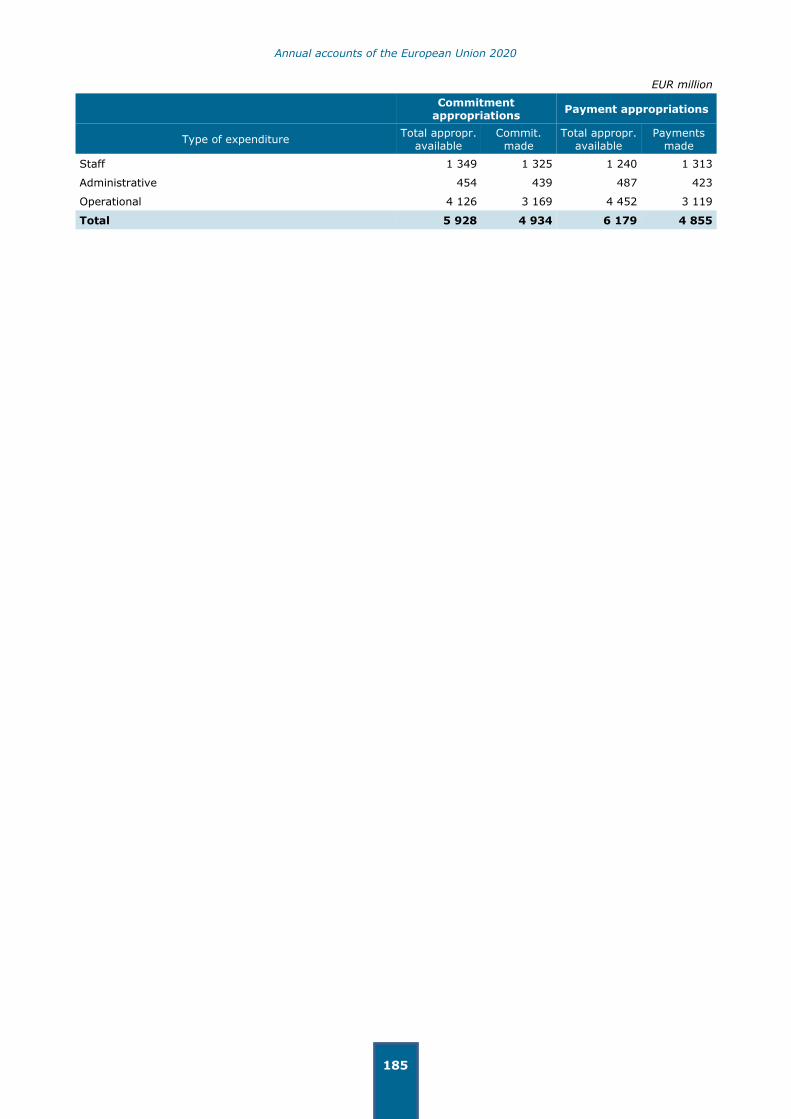
Annual accounts of the European Union 2020
185
EUR million
Commitment
appropriations Payment appropriations
Type of expenditure Total appropr.
available Commit.
made Total appropr.
available Payments
made
Staff 1 349 1 325 1 240 1 313
Administrative 454 439 487 423
Operational 4 126 3 169 4 452 3 119
Total 5 928 4 934 6 179 4 855

Annual accounts of the European Union 2020
186
GLOSSARY
Actuarial assumptions
Assumptions used to calculate the costs of future events that affect the pension liability.
Actuarial gains and losses
For a defined benefit scheme, the changes in actuarial deficits or surpluses. They arise as a result of differences between the previous actuarial assumptions and what has actually occurred and due to effects of changes in actuarial assumptions.
Administrative appropriations
Administrative appropriations cover the running costs of the Institutions and entities (staff, buildings, office equipment).
Adopted budget
Draft budget becomes the adopted budget as soon as it is approved by the Budgetary Authority and declared definitely adopted by the President of the European Parliament.
Amending budget
Decision adopted during the budget year to amend (increase, decrease, transfer) aspects of the adopted budget of that year.
Amounts to be called from Member States
These represent expenses incurred during the reporting period that will need to be funded by future
budgets, i.e. by the EU Member States. This is a consequence of the co-existence of accruals based financial statements and a cash based budget.
Annual Activity Report (AAR)
Annual Activity Reports indicate the results of operations by reference to objectives set, associated risks and the internal control structure, inter alia. Since the 2001 budget exercise for the Commission and since 2003 for all European Union institutions, the ‘authorising officer by delegation’ must submit an AAR
to his/her institution on the performance of his/her duties, together with financial and management information.
Appropriations
Budget funding. The budget forecasts both commitments and payments (cash or bank transfers to the beneficiaries). Appropriations for commitments and payments often differ (differentiated appropriations) because multi annual programmes and projects are usually fully committed in the year they are decided and are paid over the years as the implementation of the programme and project progresses. Non-
differentiated appropriations apply to administrative expenditure, for agricultural market support and direct payments and commitment appropriations equal payment appropriations.
Assigned revenue
Dedicated revenue received to finance specific items of expenditure. The main source of external assigned revenue is financial contributions from third countries to programmes financed by the Union. The main source of internal assigned revenue is revenue from third parties in respect of goods, services or work supplied at their request; revenue arising from the repayment of amounts wrongly paid and
revenue from the sale of publications and films.
Annual accounts of the European Union 2020
187
Available for sale financial assets
All financial assets (except derivatives) that are according to International Public Sector Accounting Standards measured at fair value and for which the changes in fair value are to be recognised in a reserve in net assets until derecognition (or impairment).
Budget line
As far as the budget structure is concerned, revenue and expenditure are shown in the budget in accordance with a binding nomenclature which reflects the nature and purpose of each item, as imposed
by the budgetary authority. The individual headings (title, chapter, article or line) provide a formal description of the nomenclature.
Cancellation of appropriations
Unused appropriations that may no longer be used.
Carryover of appropriations
Exception to the principle of annuality in so far as appropriations that could not be used in a given budget year may, under strict conditions, be exceptionally carried over for use during the following year.
Commitment
Legal pledge to provide finance subject to certain conditions. The EU commits itself to reimbursing its share of the costs of an EU funded project. Today’s commitments are tomorrow’s payments. Today’s payments are yesterday’s commitments.
Commitment appropriation
Commitment appropriations cover the total cost of legal obligations (contracts, grant
agreements/decisions) that could be signed in the current financial year.
Current service cost
The increase in scheme liabilities arising from service in the current financial year.
Decommitment
An act whereby a previous commitment (or part of it) is cancelled.
Defined benefit scheme
A pension or other retirement benefit scheme where the scheme rules define the benefits independently
of the contributions payable, and the benefits are not directly related to the investments of the scheme.
The scheme may be funded or unfunded.
Derivatives
Financial instruments whose value is linked to changes in the value of another financial instrument, an indicator or a commodity. In contrast to the holder of a primary financial instrument (e.g. a government bond), who has an unqualified right to receive cash (or some other economic benefit) in the future, the holder of a derivative has only a qualified right to receive such a benefit. An example of a derivative is
currency forward contract.
Direct management
Mode of budget implementation. Under direct management the budget is implemented directly by Commission services, Executive Agencies or Trust Funds.
Discount rate
The rate used to adjust for the time value of money. Discounting is a technique used to compare costs and benefits that occur in different time periods.
Annual accounts of the European Union 2020
188
Effective interest rate
The rate that discounts estimated future cash receipts or payments over the expected life of the financial asset or financial liability to the net carrying amount of the asset or liability.
Financial assets or liabilities at fair value through surplus or deficit
All financial assets or liabilities that are according to International Public Sector Accounting Standards measured at fair value and for which the changes in fair value are to be recognised in surplus or deficit of the period (i.e. derivatives).
Financial correction
The purpose of financial corrections is to protect the EU budget from the burden of irregular expenditure. For expenditure under shared management, the task of recovering irregular payments is primarily the responsibility of the Member State.
A 'confirmed' financial correction has been accepted by the Member State concerned. A 'decided' financial correction has been adopted by a Commission decision and is always a net correction, where the Member State is required to reimburse irregular funds to the EU budget, thus leading to a definitive reduction of
the allocated envelope to the Member State concerned. Confirmed and decided financial corrections are reported in this publication as one category.
An 'implemented' financial correction has corrected the observed irregularity.
Indirect management
Mode of budget implementation. Under indirect management the Commission confers tasks of budget implementation to bodies of EU law or national law.
Interruptions and suspensions
If the Commission finds, based on its own work or the information reported by audit authorities, that a Member State has failed to remedy serious shortcomings in the management and control systems and/or to correct irregular expenditure which had been declared and certified, it may interrupt or suspend payments.
Irregularity
An irregularity is an act which does not comply with the applicable EU or national rules and which has a
potentially negative impact on the EU financial interests. Irregularities, which may be the result of the conduct of beneficiaries claiming funds or of the authorities responsible for making payments. The notion of irregularity is wider than that of fraud, which refers to conduct that may qualify as a criminal offence.
Lapsing appropriations
Unused appropriations to be cancelled at the end of the financial year. Lapsing means the cancellation of all or part of the authorisation to make expenditures and/or incur liabilities which is represented by an appropriation. Only for Joint Undertakings, as specified in their Financial Rules, any unused
appropriations may be entered in the estimate of revenue and expenditure of up to the following three financial years (the so-called "N+3" rule). Hence, lapsing appropriations for JUs could be reactivated until financial year "N+3"
Outstanding commitments
As the Reste à Liquider (RAL), they represent the amount where a budgetary commitment has been made but the subsequent payment is not yet done. They represent payment obligations for the EU for future years and stem directly from the existence of multi annual programmes and the dissociation
between commitment and payment appropriations.

Annual accounts of the European Union 2020
189
Own resources
The main source of revenues for the EU budget. The different own resources are listed in the applicable Own Resource Decision (in 2020: Council Decision 2014/335) and are traditional own resources, VAT-based resources and GNI-based resources.
Payment appropriations
Payment appropriations cover expenditure due in the current year, arising from legal commitments entered in the current year and/or earlier years.
Pre-financing
A payment intended to provide the beneficiary with a float. It may be split into a number of instalments in accordance with the provisions of the underlying contract, decision, agreement or the basic legal act. The float or advance is either used for the purpose for which it was provided during the period defined in
the agreement or it is repaid.
Preventive measure
Preventive measures, which are at the Commission’s disposal to protect the EU budget when it is aware
of potential deficiencies, include suspensions and interruptions of payments from the EU budget to the operational programme.
Reste à Liquider (RAL)
As the Outstanding commitments, it represents the amount where a budgetary commitment has been made but the subsequent payment is not yet done. They represent payment obligations for the EU for future years and stem directly from the existence of multi annual programmes and the dissociation between commitment and payment appropriations.
Shared management
Mode of budget implementation. Under shared management budget implementation tasks are delegated to Member States. About three quarters of the EU expenditure falls under this implementation mode.
Traditional own resources
Traditional own resources are defined in the applicable Own Resources Decision (in 2020: Council Decision 2014/335) and comprise namely customs duties and sugar levies.
Transfers (between budget lines)
Transfers between budget lines imply the relocation of appropriations from one budget line to another, in the course of the financial year, and thereby they constitute an exception to the budgetary principle of
specification. They are, however, expressly authorised by the Treaty on the Functioning of the European Union under the conditions laid down in the Financial Regulation (FR). The FR identifies different types of transfers depending on whether they are between or within budget titles, chapters, articles or headings and require different levels of authorisation.

Annual accounts of the European Union 2020
190
LIST OF ABBREVIATIONS
AAR Annual Activity Report
AMIF Asylum, Migration and Integration Fund
AOD Authorising Officers by Delegation
ATM Air Traffic Management
BOP Balance of Payments
BUFI Fund Budget Fines Fund
CAP Common Agricultural Policy
CCS LGF Cultural and Creative Sector Guarantee Facility
CEF Connecting Europe Facility
CEF DI Connecting Europe Facility Debt Instrument
CF Cohesion Fund
CIP Competitiveness and Innovation Framework Programme
COM European Commission
COSME Competitiveness of Enterprises and Small and Medium-sized Enterprises
COSO Committee of Sponsoring Organizations of the Treadway Commission
CPR Common Provisions Regulation
D&WM Decommissioning and Waste Management
EAFRD European Agricultural Fund for Rural Development
EAGF European Agricultural Guarantee Fund
EAR European Union Accounting Rule
EaSI Employment and Social Innovation
EBRD European Bank for Reconstruction and Development
ECA European Court of Auditors
ECB European Central Bank
ECOFIN Economic and Financial Affairs Council
ECSC i.L. European Coal and Steel Community in Liquidation
EDF European Development Fund
EDIF Guarantee Facility under the Western Balkan

Annual accounts of the European Union 2020
191
EEA European Economic Area
EEAS European External Action Service
EFSD European Fund for Sustainable Development
EFSE European Fund for Southeast Europe
EFSF European Financial Stability Facility
EFSI European Fund for Strategic Investments
EFSM European Financial Stabilisation Mechanism
EFTA European Free Trade Association
EGNOS European Geostationary Navigation Overlay System
EIB European Investment Bank
EIF European Investment Fund
ElectriFI Electrification Financing Initiative
ELM
EMFF
External Lending Mandate
European Maritime and Fisheries Fund
EMU Economic and Monetary Union
ENEF Enterprise Expansion Fund
ENIF Enterprise Innovation Fund
ENPI European Neighbourhood and Partnership Instrument
EP European Parliament
ERDF European Regional Development Fund
ERI
ESA
EIB Resilience Initiative
European Space Agency
ESF European Social Fund
ESIF European Structural and Investment Funds
ESM European Stability Mechanism
ETF European Technology Start up Facility 1998
EU European Union
EUMETSAT European Organisation for the Exploitation of Meteorological Satellites
Euratom European Atomic Energy Community
FIFO First-in, First-out
FP7 7th Research Framework Programme for Research and Technological Development

Annual accounts of the European Union 2020
192
FR EU Financial Regulation
FSDA Financial Statement Discussion and Analysis
GDP Gross Domestic Product
GNI Gross National Income
GNSS Global Navigation Satellite Systems
H2020 Horizon 2020
IIW Infrastructure and Innovation Window
IMF International Monetary Fund
IPSAS International Public Sector Accounting Standards
IT Information Technology
ITER International Thermonuclear Experimental Reactor
JRC Joint Research Centre
JU Joint Undertaking
LGTT Loan Guarantee Instrument for TEN-T projects
MAP Multi Annual Program - Medium Enterprise Financial Inclusion Programme
MEP Member of the European Parliament
MFA Macro Financial Assistance
MFF Multiannual Financial Framework
MSME Micro, Small and Medium Enterprise
ORD Own Resources Decision
PBI Project Bond Initiative
PF4EE Private Finance for Energy Efficiency Instrument
PGF Participants Guarantee Fund
PPP Public-Private Partnership
PSEO Pension Scheme of European Officials
RAL "Reste à Liquider" (Outstanding Commitments)
RSFF Risk Sharing Finance Facility
RTD Research, Technological Development and Demonstration
S&P Standard & Poor's Financial Services LLC
SANAD MENA Fund for Micro-, Small and Medium Enterprises
SAPARD Special Accession Programme for Agriculture and Rural Development

Annual accounts of the European Union 2020
193
SEMED Southern and Eastern Mediterranean Micro, Small and Middle sized Entreprises Financial
Inclusion Programme
SIUGI SME Initiative Uncapped Guarantee Instrument
SME Small and Medium-sized Enterprise(s)
SMEW SME Window (Small and Medium-sized Enterprises Window)
SURE Support to mitigate Unemployment Risks in an Emergency
TFEU Treaty on the Functioning of the European Union
TOR Traditional Own Resources
TRDI Temporary Rural Development Instrument
VAT Value Added Tax

Getting in touch with the EU
In personAll over the European Union there are hundreds of Europe Direct information centres. You can find the address of the centre nearest you at: https://europa.eu/european-union/contact_en
On the phone or by emailEurope Direct is a service that answers your questions about the European Union. You can contact this service:— by freephone: 00 800 6 7 8 9 10 11 (certain operators may charge for these calls),— at the following standard number: +32 22999696 or — by email via: https://europa.eu/european-union/contact_en
Finding information about the EU
OnlineInformation about the European Union in all the official languages of the EU is available on the Europa website at: https://europa.eu/european-union/index_en
EU publications You can download or order free and priced EU publications at: https://publications.europa.eu/en/publications. Multiple copies of free publications may be obtained by contacting Europe Direct or your local information centre (see https://europa.eu/european-union/contact_en).
EU law and related documentsFor access to legal information from the EU, including all EU law since 1952 in all the official language versions, go to EUR-Lex at: http://eur-lex.europa.eu
Open data from the EUThe EU Open Data Portal (http://data.europa.eu/euodp/en) provides access to datasets from the EU. Data can be downloaded and reused for free, for both commercial and non-commercial purposes.


![ISSN: 2529-7287and Buddhism: Borobudur[1] and Loro Jonggrang (Prambanan)[2] in Java, Angkor Wat[3] and the Bayon in Cambodia[4]. Some observers believe that Southeast Asian Buddhism](https://static.fdocuments.in/doc/165x107/61176baa4eeefa58bb2cd924/issn-2529-7287-and-buddhism-borobudur1-and-loro-jonggrang-prambanan2-in.jpg)


![Noah%2520 valenzuela%2520%2528powerpointslide%2529%5b1%5d[1]](https://static.fdocuments.in/doc/165x107/58a0530e1a28ab5c1c8b485d/noah2520-valenzuela25202528powerpointslide25295b15d1.jpg)