ISSN: 2454-1362, Financial … · Idea Cellular and Reliance Communications Ltd. throughout the...
18
Imperial Journal of Interdisciplinary Research (IJIR) Vol-2, Issue-7, 2016 ISSN: 2454-1362, http://www.onlinejournal.in Imperial Journal of Interdisciplinary Research (IJIR) Page 1468 Financial Statements Analysis of Idea Cellular & Reliance Telecommunications: A Comparative Study Sumaira Jan Lecturer, Commerce, J&K Higher Education Department. Alamdar Colony - B, (near Masjid Muhammadia), Lane no.: 03, (Friend’s Lane), Botashah Mohalla, Lal Bazar, Srinagar, Kashmir, Jammu & Kashmir, India.Pin-code: 190023. Abstract: India's telecommunication network is the second largest in the world based on the total number of telephone users (both fixed and mobile phone). It has one of the lowest call tariffs in the world enabled by the mega telephone networks and hyper-competition among them. It has the world's third-largest Internet user-base. According to the Internet and Mobile Association of India (IAMAI), the Internet user base in the country stood at 190 million at the end of June, 2013. Major sectors of the Indian telecommunication industry are telephony, internet and television broadcast Industry in the country which is in an on-going process of transforming into next generation network, employs an extensive system of modern network elements such as digital telephone exchanges, mobile switching centers, media gateways and signaling gateways at the core, interconnected by a wide variety of transmission systems using fibre-optics or Microwave radio relay networks. Being a fastest growing sector, telecommunications in India is one of the sectors where innovation and intense competition is a key to the progress of the industry. Therefore, long term survival of the different players in the market is the toughest task. And this survival is a complex matrix of different strategies and action plans laid out by the companies from time to time. It is in this context this study titled “Financial Statements Analysis of Selected Telecommunication Companies: A Comparative Study” is unique. In this study a formal effort is made to assess and examine the competitive position of Idea cellular and Reliance Telecom Company on the basis of financial statements analysis of both the companies. Financial statement analysis from the standpoint of management relates to all of the questions raised by creditors and investors because these user groups must be satisfied in order for the firm to obtain capital as needed. In relation to the growth and prosperity of telecom sector the study being conducted to analyze the financial soundness of the companies. A general belief is that a firm’s operating performance depends on certain key financial factors viz., Liquidity, turnover, profit, asset utilization etc and the variables which are found in profit and loss account and balance sheet of a firm have a direct or indirect relation with each other. In order to measure the performance, ratios, the indicators, are normally used to identify the financial health of the firm. So the study concentrates on empirical approach towards measuring financial soundness of the companies operating under one of the most dynamic sector in Indian economy to identify key financial attributes of telecom companies and their respective impact. Keywords - Idea Cellular, Reliance Telecommunications, Financial Statements Analysis, Liquidity, Profitability, Solvency, Market value ratios 1. Introduction India's telecommunication network is the second largest in the world based on the total number of telephone users (both fixed and mobile phone). It has one of the lowest call tariffs in the world enabled by the mega telephone networks and hyper-competition among them. It has the world's third-largest Internet user-base. According to the Internet and Mobile Association of India (IAMAI), the Internet user base in the country stood at 190 million at the end of June, 2013. Major sectors of the Indian telecommunication industry are telephony, internet and television broadcast Industry in the country which is in an on-going process of transforming into next generation network, employs an extensive system of modern network elements such as digital telephone exchanges, mobile switching centres, media gateways and signaling gateways at the core,
Transcript of ISSN: 2454-1362, Financial … · Idea Cellular and Reliance Communications Ltd. throughout the...

Imperial Journal of Interdisciplinary Research (IJIR) Vol-2, Issue-7, 2016 ISSN: 2454-1362, http://www.onlinejournal.in
Imperial Journal of Interdisciplinary Research (IJIR) Page 1468
Financial Statements Analysis of Idea Cellular & Reliance Telecommunications:
A Comparative Study
Sumaira Jan Lecturer, Commerce, J&K Higher Education Department.
Alamdar Colony - B, (near Masjid Muhammadia), Lane no.: 03, (Friend’s Lane), Botashah Mohalla, Lal Bazar, Srinagar, Kashmir, Jammu & Kashmir, India.Pin-code: 190023.
Abstract: India's telecommunication network is the second largest in the world based on the total number of telephone users (both fixed and mobile phone). It has one of the lowest call tariffs in the world enabled by the mega telephone networks and hyper-competition among them. It has the world's third-largest Internet user-base. According to the Internet and Mobile Association of India (IAMAI), the Internet user base in the country stood at 190 million at the end of June, 2013. Major sectors of the Indian telecommunication industry are telephony, internet and television broadcast Industry in the country which is in an on-going process of transforming into next generation network, employs an extensive system of modern network elements such as digital telephone exchanges, mobile switching centers, media gateways and signaling gateways at the core, interconnected by a wide variety of transmission systems using fibre-optics or Microwave radio relay networks. Being a fastest growing sector, telecommunications in India is one of the sectors where innovation and intense competition is a key to the progress of the industry. Therefore, long term survival of the different players in the market is the toughest task. And this survival is a complex matrix of different strategies and action plans laid out by the companies from time to time. It is in this context this study titled “Financial Statements Analysis of Selected Telecommunication Companies: A Comparative Study” is unique. In this study a formal effort is made to assess and examine the competitive position of Idea cellular and Reliance Telecom Company on the basis of financial statements analysis of both the companies. Financial statement analysis from the standpoint of management relates to all of the questions raised by creditors and investors because these user groups must be satisfied in order for the firm to obtain capital as needed. In relation to the growth and prosperity of telecom sector the
study being conducted to analyze the financial soundness of the companies. A general belief is that a firm’s operating performance depends on certain key financial factors viz., Liquidity, turnover, profit, asset utilization etc and the variables which are found in profit and loss account and balance sheet of a firm have a direct or indirect relation with each other. In order to measure the performance, ratios, the indicators, are normally used to identify the financial health of the firm. So the study concentrates on empirical approach towards measuring financial soundness of the companies operating under one of the most dynamic sector in Indian economy to identify key financial attributes of telecom companies and their respective impact.
Keywords - Idea Cellular, Reliance Telecommunications, Financial Statements Analysis, Liquidity, Profitability, Solvency, Market value ratios
1. Introduction
India's telecommunication network is the second largest in the world based on the total number of telephone users (both fixed and mobile phone). It has one of the lowest call tariffs in the world enabled by the mega telephone networks and hyper-competition among them. It has the world's third-largest Internet user-base. According to the Internet and Mobile Association of India (IAMAI), the Internet user base in the country stood at 190 million at the end of June, 2013. Major sectors of the Indian telecommunication industry are telephony, internet and television broadcast Industry in the country which is in an on-going process of transforming into next generation network, employs an extensive system of modern network elements such as digital telephone exchanges, mobile switching centres, media gateways and signaling gateways at the core,
Imperial Journal of Interdisciplinary Research (IJIR) Vol-2, Issue-7, 2016 ISSN: 2454-1362, http://www.onlinejournal.in
Page 1469
interconnected by a wide variety of transmission systems using fibre-optics or Microwave radio relay networks. The access network, which connects the subscriber to the core, is highly diversified with different copper-pair, optic-fibre and wireless technologies. DTH, a relatively new broadcasting technology has attained significant popularity in the Television segment. The introduction of private FM has given a fillip to the radio broadcasting in India. Telecommunication in India has greatly been supported by the INSAT system of the country, one of the largest domestic satellite systems in the world. India possesses a diversified communications system, which links all parts of the country by telephone, Internet, radio, television and satellite.
Indian telecom industry underwent a high pace of market liberalisation and growth since the 1990s and now has become the world's most competitive and one of the fastest growing telecom markets. Telecommunication has supported the socioeconomic development of India and has played a significant role to narrow down the rural-urban digital divide to some extent. It also has helped to increase the transparency of governance with the introduction of e-governance in India. The government has pragmatically used modern telecommunication facilities to deliver mass education programmes for the rural folk of India.
Before starting the analysis of any company’s financial statements, it is necessary to specify the objectives of the analysis. According to Fraser and Ormiston (2004), the objectives will vary depending on the perspective of the financial statement user and the specific questions that are addressed by the analysis of the financial statement data.
Several perspectives include the creditor, the investor, and the management. Each of these stakeholders would have to have questions that need to be answered. Creditor is usually concerned with the ability of an existing or prospective borrower to make interest and principal payments on borrowed funds. The investor usually attempts to arrive at an estimation of a company’s future earnings stream in order to attach a value to the securities being considered for purchase or liquidation. Lastly, financial statement analysis from the standpoint of management relates to all of the questions raised by creditors and investors because these user groups must be satisfied in order for the firm to obtain capital as needed.
In relation to the growth and prosperity of telecom sector the study being conducted to analyze the financial soundness of the companies. A general belief is that a firm’s operating performance depends on certain key financial factors viz., turnover, profit, asset utilization etc and the variables which are found in profit and loss account and balance sheet of a firm have a direct or indirect relation with each other. By establishing a close relationship between the variables, a firm can analyze its financial performance in terms of liquidity, profitability, viability and sustainability. In order to measure the performance, ratios, the indicators, are normally used to identify the financial health of the firm. So the study concentrates on empirical approach towards analyzing the comparative financial soundness of the Idea Cellular and Reliance Telecommunications operating under one of the most dynamic sector in Indian economy to identify key financial attributes of telecom companies and their respective impact.
2. Literature Review
To identify ratios in peer-reviewed articles, searches of academic databases using keywords such as “financial management”, “Solvency”, “profitability and liquidity” and “ratio analysis” were undertaken. Articles published prior to 1995 were excluded from the searches in order to ensure that only the most recent studies were included. This exclusion was important because of the many changes in telecom since 1995 and the likely lower relevance of articles prior to these changes. Ratios were selected from the articles if results showed that they were statistically significant in explaining a dimension of Telecom Companys financial performance, such as profitability or financial distress. To identify ratios in industry publication, the websites of various organizations were reviewed Malhorta and McLeod, (1994) argued that the only way to assess future financial performance is through the inclusion of subjective measures.
Beaver's (1966) contented that standard financial ratios can predict the financial performance of firms; many subsequent studies have attempted to demonstrate the predictive value of various techniques for estimating actual business performance.
Ross et al., (2007) expressed most researchers divide the financial ratios into four group’s i.e profitability, solvency, liquidity and activity ratios. Lermack, (2003) the benefits of financial ratios analysis: Financial ratios are an important
Imperial Journal of Interdisciplinary Research (IJIR) Vol-2, Issue-7, 2016 ISSN: 2454-1362, http://www.onlinejournal.in
Page 1470
and well-established technique of financial analysis. Brigham and Ehrhardt (2010) stated the “financial ratios are designed to help evaluate financial statements”. Financial ratios are used as a planning and control tool. Financial ratios analysis is used to evaluate the performance of an organization.
3. Objectives Of the Study
The study is based on the following objectives: -
1. To determine the financial position of Idea Cellular & Reliance Communications Ltd.
2. To determine operational efficiency of both the companies by calculating Operating/Profitability ratios.
3. To determine the short term and long term financial position of both the companies with the help of Liquidity and Solvency ratios
4. To determine the present performance with the help of past performance to discover the positive and negative points of both the companies.
5. To give suggestions on the basis of study results.
4. Research Design
The study is empirical in nature. The present study is aimed to evaluate the comparative Financial Statements Analysis of Idea Cellular and Reliance Communications Ltd. throughout the reference period starting from March 2010- 11 to March 2014- 2015.
5. Data Collection
Only secondary source of data were used in the project. Secondary data was collected from the following sources:
• Magazines • Journals • Annual reports of Idea cellular and
Reliance telecom • Newspapers • Internet.
6. Statistical Tools and
Techniques Used
In order to achieve the objectives of the study the analysis of financial statements has
been done with the help of below mentioned statistical tools.
1. Ratio Analysis has been used for the purpose of the analysis of financial statements of both the telecom companies under study.
2. Tabulation has been done in order to know the percentage change.
3. Graphs have been drawn in order to know the trend of ratios of both the companies under study.
7. Financial Statements Analysis and Interpretation Of Data
According to Brigham and Houston (2009), financial analysis involves comparing the firm’s performance to that of other firms in the same industry and evaluating trends in the firm’s financial position over time. One rich source of information for financial statement analysis is the audited financial statements. The financial statements are usually part of the annual report that listed companies submit to regulatory agencies such as Securities and Exchange Commission and Stock Exchange entities.
There are six categories of ratios used in financial statement analysis. They are: -
A. Liquidity ratios, which measure a firm’s ability to meet cash needs as they arise.
B. Activity ratios, which measure the liquidity of specific assets and the efficiency of managing assets.
C. Leverage ratios, which measure the extent of a firm’s financing with debt relative to equity and its ability to cover interest and other fixed charges.
D. Profitability ratios, which measure the overall performance of a firm and its efficiency in managing assets, liabilities, and equity.
E. Solvency ratios, which measure a firm’s ability to meet its long term obligations.
F. Market value ratios, which bring in the stock price and give an idea of what investors, think about the firm and its future prospects. As we mentioned above six ratios but among them we are analyzing some most important ratios.
A. Liquidity Ratios: A class of financial matrics that is used
to determine a company’s ability to pay off its short – term debts obligations.
Imperial Journal of Interdisciplinary Research (IJIR) Vol-2, Issue-7, 2016 ISSN: 2454-1362, http://www.onlinejournal.in
Page 1471
Generally, the higher the value of ratio, the larger the margin of safety that company possesses to cover short term debts
1. Current Ratio:
The current ratio is a commonly used measure of short-run solvency, the ability of the firm to meet its debt requirements as they come due. Current liabilities are used as the denominator of the ratio because they are
considered to represent the most urgent debts, requiring retirement within one year or one operating cycle. The available cash resources to satisfy these obligations must come primarily from cash or the conversion to cash of other current assets. The ideal ratio is 2:1. The current ratio formula is:
Current ratio= Current assets/Current liabilities
Table 1: Table showing Current Ratio Profile & Percentage Change of Selected
Telecommunication Companies
Date Company Current Ratio (times) % Change
March 2010- 11 Reliance Communications 0.68 ***
Idea Cellular 0.49 ***
March 2011– 2012 Reliance Communications 0.77 13.24
Idea Cellular 0.53 8.16
March 2012– 2013 Reliance Communications 0.69 -10.39
Idea Cellular 0.52 -1.89
March 2013– 2014 Reliance Communications 0.72 4.35
Idea Cellular 0.42 -10.00
March 2014- 2015 Reliance Communications 1.48 105.55
Idea Cellular 0.39 -7.14 (Note: Percentage change = current year’s figure - Previous year figure/Previous year figure)
Graph 1: Comparative analysis of Current ratio of selected companies
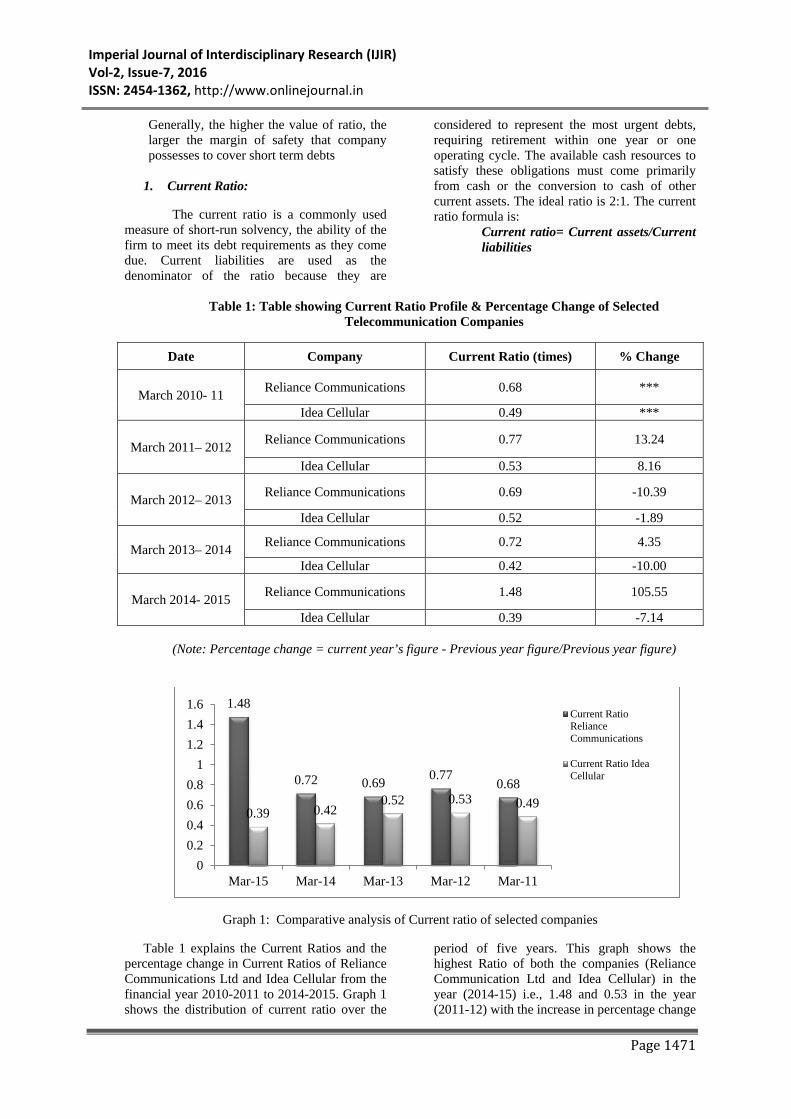
Table 1 explains the Current Ratios and the percentage change in Current Ratios of Reliance Communications Ltd and Idea Cellular from the financial year 2010-2011 to 2014-2015. Graph 1 shows the distribution of current ratio over the
period of five years. This graph shows the highest Ratio of both the companies (Reliance Communication Ltd and Idea Cellular) in the year (2014-15) i.e., 1.48 and 0.53 in the year (2011-12) with the increase in percentage change
1.48
0.72 0.69 0.77 0.68
0.39 0.42 0.52 0.53 0.49
00.20.40.60.8
11.21.41.6
Mar-15 Mar-14 Mar-13 Mar-12 Mar-11
Current RatioRelianceCommunications
Current Ratio IdeaCellular

Imperial Journal of Interdisciplinary Research (IJIR) Vol-2, Issue-7, 2016 ISSN: 2454-1362, http://www.onlinejournal.in
Page 1472
of 105.55% and 8.16% respectively. And the lowest Ratio of both the companies (Reliance Communication Ltd and Idea Cellular) was shown in the year (2010-11) i.e. 0.68 and 0.39 in the year (2014-15), with the decrease in percentage change of 0% and -7.14% respectively. This trend shows that the Current Ratio of Reliance Communication has increased in the current year (2014-15). It means if the current ratio is too high, then the company may not be efficiently using its Current Assets or its short-term financing facilities. This may also indicate problems in working capital management.
2. Quick Ratio or Acid Test Ratio: Quick ratio is an indicator of a
company’s short-term liquidity. It measures current (short term) liquidity and position of the company. The analysis is done by weighing current assets of the company against the current liabilities which result in the ratio that highlights the liquidity of the company. The ideal ratio is 1:1 and is calculated as follows:
Quick ratio = current assets – (cash and equivalents + marketable securities + `accounts receivable) / current liabilities
Table 2: Table showing Quick Ratio Profile & Percentage Change of Selected
Telecommunication Companies
Date Company Quick Ratio (times) % Change
March 2010- 11 Reliance Communications 1.01 *** Idea Cellular 0.52 ***
March 2011– 2012 Reliance Communications 1.19 17.82 Idea Cellular 0.55 5.76
March 2012– 2013 Reliance Communications 1.43 20.16 Idea Cellular 0.55 0
March 2013– 2014 Reliance Communications 1.23 -13.98 Idea Cellular 0.46 -16.36
March 2014- 2015 Reliance Communications 1.61 30.89 Idea Cellular 0.39 -15.217
Graph 2: Comparative analysis of Quick ratio of selected companies
Table 2 explains the Quick Ratios and the percentage change in Quick Ratios of Reliance Communications and Idea Cellular from the financial year 2010-2011 to 2014-2015. Graph 2 shows the distribution of Quick Ratio over the period of five years. This graph shows
the highest ratio of both the companies (Reliance Communication Ltd and Idea Cellular) was shown in the year (2014-15) i.e. 1.61 and 0.55 in the year (2011-12), with the increase in percentage change 30.89% and 5.76% respectively and the lowest ratio of both the
1.61
1.23 1.43
1.19 1.01
0.39 0.46 0.55 0.55 0.52
00.20.40.60.8
11.21.41.61.8
Mar-15 Mar-14 Mar-13 Mar-12 Mar-11
Quick Ratio RelianceCommunications
Quick Ratio Idea Cellular

Imperial Journal of Interdisciplinary Research (IJIR) Vol-2, Issue-7, 2016 ISSN: 2454-1362, http://www.onlinejournal.in
Page 1473
company’s (Reliance Communication Ltd and Idea Cellular) i.e. 1.01 in the year (2010-11) and 0.39 in the year (2014-15), with the decrease in percentage change of 0% and -15.217% respectively . This trend shows that the ratio of Reliance Communication Ltd. has increased in the current year which means that the most liquid assets of Idea Cellular Company exceed its total debts. On the opposite side a quick ratio of less than one indicates that a company would not be able to repay all its debts by using its most liquid assets.
Thus, we conclude that, generally a higher Quick Ratio is preferable because it means greater liquidity.
B. Profitability Ratio: A Profitability Ratio is a measure of
profitability, which is a way to measure a
company's performance. Profitability is simply the capacity to make a profit, and a profit is what is left over from income earned after you have deducted all costs and expenses related to earning the income. The formulas that are being used in the Profitability Ratios can be used to judge a company's performance and to compare its performance against other similarly-situated companies. Some important profitability ratios have been analyzed as under: -
1. Operating Profit Margin ratio:
Operating Gross Profit Margin tells us about the profitability of goods and services. It tells us how much it costs us to produce the product. It is calculated by dividing Gross Profit (GP) by Net Sales (NS) and multiplying the quotient by 100:
• Gross Margin = Gross Profit/Net Sales * 100
o GM = GP / NS * 100 Table 3: Table showing Operating Profit Margin & Percentage Change of Selected
Telecommunication Companies
Date Company Operating Profit Margin (%) % Change
March 2010- 11 Reliance Communications 3.53 *** Idea Cellular 23.59 ***
March 2011– 2012 Reliance Communications 21.67 515.34 Idea Cellular 25.20 6.82
March 2012– 2013 Reliance Communications 24.21 11.72 Idea Cellular 23.19 -7.97
March 2013– 2014 Reliance Communications 16.25 -32.87 Idea Cellular 27.78 19.79
March 2014- 2015 Reliance Communications 15.33 -5.66 Idea Cellular 30.92 11.30
Graph 3: Comparative analysis of Operating Profit Margin of selected companies
Table 3 explains the Operating Profit Margin and the percentage change in Operating Profit Margin ratios of Reliance Communications Ltd and Idea Cellular from the financial year 2010-2011 to 2014-2015. Graph 3
shows the distribution of Operating Profit Margin over the period of 5 years. This graph shows the highest ratio of both the companies (Reliance Communication Ltd and Idea Cellular) was shown in the year (2012-13) i.e. 24.21 %
15.33 16.25 24.21 21.67
3.53
30.92 27.78 23.19 25.2 23.59
0
10
20
30
40
Mar-15 Mar-14 Mar-13 Mar-12 Mar-11
Operating ProfitMargin(%) RelianceCommunications
Operating ProfitMargin(%) Idea Cellular

Imperial Journal of Interdisciplinary Research (IJIR) Vol-2, Issue-7, 2016 ISSN: 2454-1362, http://www.onlinejournal.in
Page 1474
and 30.92 % in the year (2014-15), with the increase in percentage change of 11.72% and 11.30% respectively; and the lowest ratio of both the companies (Reliance Communication Ltd and Idea Cellular) was shown in the year (2010-11) i.e. 3.53 % and 23.19 % in the year (2012-13) with the decrease in percentage change 0% and -7.97% respectively. This trend shows that the ratio of idea cellular is increasing in the
current year, which means higher the operating margin, the more profitable a company’s core is.
2. Profit before Interest and Tax : Profit or earnings before interest and
tax is an indicator of a company’s profitability calculated as revenue minus expenses excluding tax and interest. EBIT is also referred as “operating earnings”, “operating profit” and profit before interest and tax.
Table 4: Table showing profit before interest and tax& Percentage Change of Selected
Telecommunication Companies
Date Company Profit before interest and tax margin (%) % Change
March 2010- 11 Reliance Communications -8.77 *** Idea Cellular 12.29 ***
March 2011– 2012 Reliance Communications 5.62 -164.08 Idea Cellular 14.71 19.69
March 2012– 2013 Reliance Communications 8.16 45.19 Idea Cellular 9.32 -36.64
March 2013– 2014 Reliance Communications -1.85 -122.67 Idea Cellular 12.07 29.50
March 2014- 2015 Reliance Communications -2.55 37.83 Idea Cellular 15.18 25.76
Graph 4: Comparative analysis of Profit before Interest and Tax Margin of selected companies
Table 4 explains the Profit before Interest and Tax and the percentage change in Profit before interest and tax of Reliance Communications Ltd. and Idea Cellular from the financial year 2010-2011 to 2014-2015. Graph 4 shows the distribution of profit before interest and tax over the period of 5 years. This graph shows the highest position of both the companies (Reliance Communication Ltd and Idea Cellular) was shown in the year (2012-13) i.e., 8.16 % and 15.18 % in the year (2014-15), with the increase in percentage change 44.52% and 25.76%
respectively. And the lowest ratio of both the companies (Reliance Communication Ltd and Idea Cellular) was shown in the year (2013-14) i.e,-1.85 % and 9.32 % in the year (2012-13), with the decrease in percentage change -122.67% and -36.64% respectively. This trend shows that ratio of Idea Cellular is increasing in the current year. This indicator gives information on a company’s earnings ability increase in EBIT is mainly due to growth of net revenue, good cost control and strong productivity and
-2.55 -1.85
8.16 5.62
-8.77
15.18 12.07
9.32
14.71 12.29
-10
-5
0
5
10
15
20
Mar-15 Mar-14 Mar-13 Mar-12 Mar-11
Profit Before Interest And TaxMargin(%) RelianceCommunications
Profit Before Interest And TaxMargin(%) Idea Cellular

Imperial Journal of Interdisciplinary Research (IJIR) Vol-2, Issue-7, 2016 ISSN: 2454-1362, http://www.onlinejournal.in
Page 1475
decrease in EBIT margin largely results from reduction in revenue and higher operating costs.
3. Net Profit Margin:
It is the percentage of revenue left after all expenses have been deducted from sales. The measurement reveals the amount of profit that a business can extract from its total sales.
Table 5: Table showing net profit margin & Percentage Change of Selected
Telecommunication Companies
Date Company Net profit margin (%) % Change
March 2010- 11 Reliance Communications -6.24 *** Idea Cellular 5.50 ***
March 2011– 2012 Reliance Communications 1.40 -122.43 Idea Cellular 2.99 -45.63
March 2012– 2013 Reliance Communications 5.53 295 Idea Cellular 3.71 24.08
March 2013– 2014 Reliance Communications 6.53 18.08 Idea Cellular 6.46 74.12
March 2014- 2015 Reliance Communications -1.42 -121.74 Idea Cellular 8.98 39.00
Graph 5: Comparative analysis of Net Profit Margin of selected companies
Table 5 explains the Net Profit Margin
and the percentage change in of Reliance Communications Ltd. and Idea Cellular from the financial year 2010-2011 to 2014-2015. Graph 5 shows the distribution of net profit margin over the period of 5 years .This graph shows the highest position of both the companies (Reliance Communication Ltd and Idea Cellular) was shown in the year (2013-14) i.e., 6.53 % and 8.98 % in the year (2014-15), with the increase in percentage change of 18.08% and 39% respectively; and the lowest ratio of both the companies (Reliance Communication Ltd and Idea Cellular) was shown in the year (2014-15) i.e., -1.42 % and 2.99 % in the year (2011-12) ,
with the decrease in percentage change -121.74% and -45.63% respectively. This trend shows that the ratio of idea cellular has been increased in the current year; the company with high net profit margin indicates that a company is pricing its products correctly and is exercising good cost control.
4. Return on net worth:
It means determination of the ratio of a individual or business taxpayer’s income to their overall net worth .In the business context, net worth is also known as book value or shareholders’ equity.
-1.42
6.53 5.53
1.4
-6.24
8.98 6.46
3.71 2.99 5.5
-10
-5
0
5
10
Mar-15 Mar-14 Mar-13 Mar-12 Mar-11
Net Profit Margin(%)Reliance Communications
Net Profit Margin(%) IdeaCellular
Imperial Journal of Interdisciplinary Research (IJIR) Vol-2, Issue-7, 2016 ISSN: 2454-1362, http://www.onlinejournal.in
Page 1476
Table 6: Table showing Return on Net Worth Margin & Percentage Change of Selected Telecommunication Companies
Date Company Return on net worth margin (%) % Change
March 2010- 11 Reliance Communications -1.57 ***
Idea Cellular 6.87 ***
March 2011– 2012 Reliance Communications 0.34 -121.65
Idea Cellular 4.46 -35.08
March 2012– 2013 Reliance Communications 1.88 452.9
Idea Cellular 5.83 30.71
March 2013– 2014 Reliance Communications 2.32 23.40
Idea Cellular 10.89 86.79
March 2014- 2015 Reliance Communications -0.42 -118.10
Idea Cellular 12.83 17.81
Graph 6: Comparative analysis of Return on Net Worth of selected companies
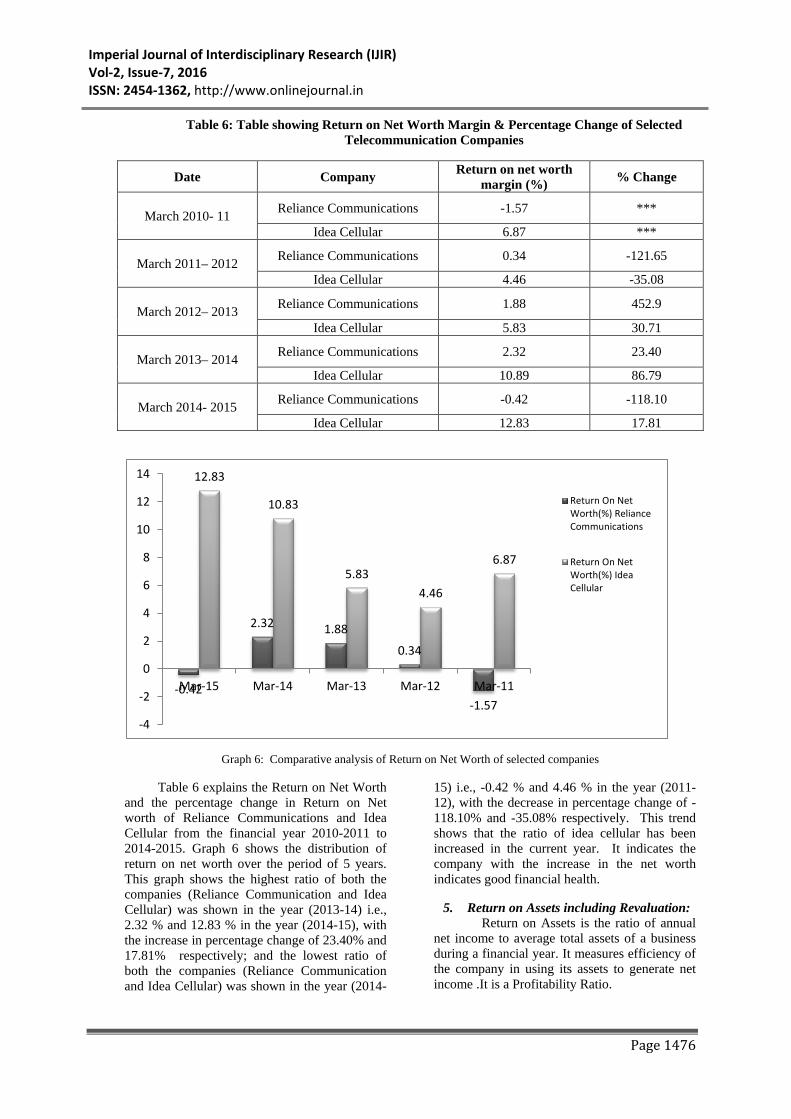
Table 6 explains the Return on Net Worth and the percentage change in Return on Net worth of Reliance Communications and Idea Cellular from the financial year 2010-2011 to 2014-2015. Graph 6 shows the distribution of return on net worth over the period of 5 years. This graph shows the highest ratio of both the companies (Reliance Communication and Idea Cellular) was shown in the year (2013-14) i.e., 2.32 % and 12.83 % in the year (2014-15), with the increase in percentage change of 23.40% and 17.81% respectively; and the lowest ratio of both the companies (Reliance Communication and Idea Cellular) was shown in the year (2014-
15) i.e., -0.42 % and 4.46 % in the year (2011-12), with the decrease in percentage change of -118.10% and -35.08% respectively. This trend shows that the ratio of idea cellular has been increased in the current year. It indicates the company with the increase in the net worth indicates good financial health.
5. Return on Assets including Revaluation: Return on Assets is the ratio of annual
net income to average total assets of a business during a financial year. It measures efficiency of the company in using its assets to generate net income .It is a Profitability Ratio.
-0.42
2.32 1.88
0.34
-1.57
12.83
10.83
5.83 4.46
6.87
-4
-2
0
2
4
6
8
10
12
14
Mar-15 Mar-14 Mar-13 Mar-12 Mar-11
Return On NetWorth(%) RelianceCommunications
Return On NetWorth(%) IdeaCellular
Imperial Journal of Interdisciplinary Research (IJIR) Vol-2, Issue-7, 2016 ISSN: 2454-1362, http://www.onlinejournal.in
Page 1477
Table 7: Table showing Return on Assets including Revaluation & Percentage Change of Selected Telecommunication Companies
Date Company Return on Assets
including Revaluation (%)
% Change
March 2010- 11 Reliance Communications 233.25 *** Idea Cellular 37.18 ***
March 2011– 2012 Reliance Communications 217.53 -6.75 Idea Cellular 38.99 4.86
March 2012– 2013 Reliance Communications 160.57 -26.18 Idea Cellular 42.30 8.48
March 2013– 2014 Reliance Communications 153.62 -4.32 Idea Cellular 46.95 10.99
March 2014- 2015 Reliance Communications 144.12 -6.18 Idea Cellular 60.84 29.58
Graph 7: Comparative analysis of Return on Assets including Revaluations of selected companies
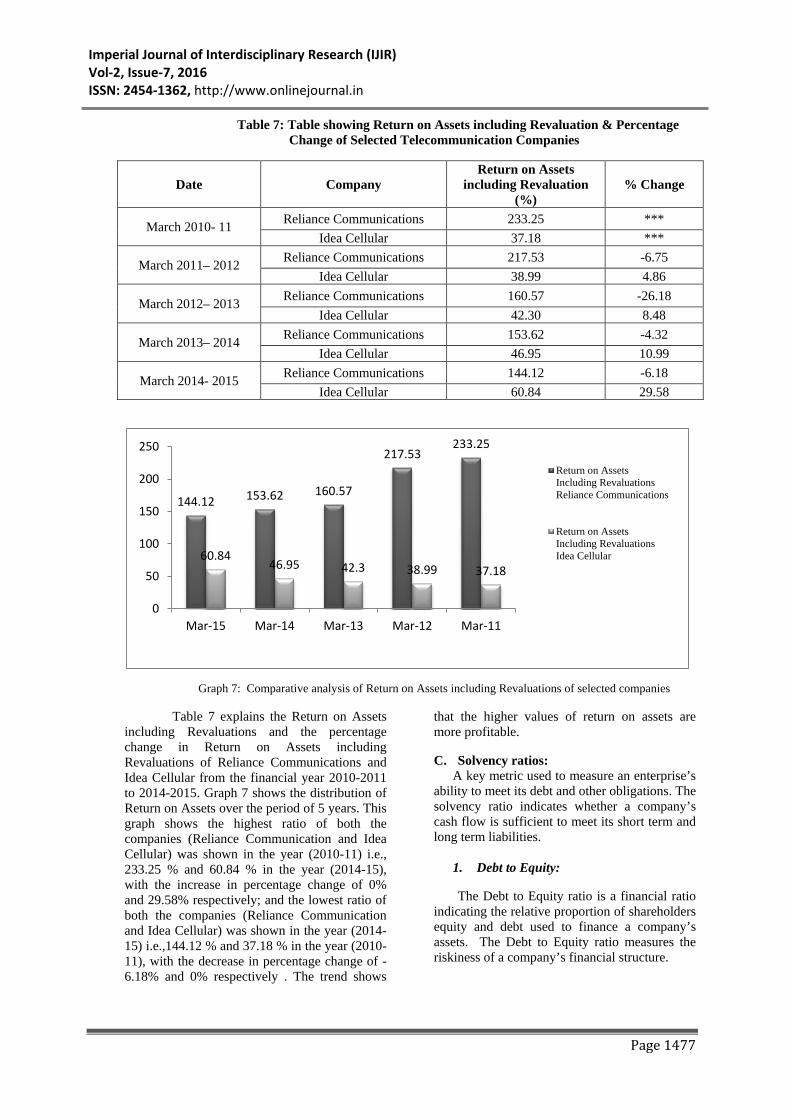
Table 7 explains the Return on Assets including Revaluations and the percentage change in Return on Assets including Revaluations of Reliance Communications and Idea Cellular from the financial year 2010-2011 to 2014-2015. Graph 7 shows the distribution of Return on Assets over the period of 5 years. This graph shows the highest ratio of both the companies (Reliance Communication and Idea Cellular) was shown in the year (2010-11) i.e., 233.25 % and 60.84 % in the year (2014-15), with the increase in percentage change of 0% and 29.58% respectively; and the lowest ratio of both the companies (Reliance Communication and Idea Cellular) was shown in the year (2014-15) i.e.,144.12 % and 37.18 % in the year (2010-11), with the decrease in percentage change of -6.18% and 0% respectively . The trend shows
that the higher values of return on assets are more profitable.
C. Solvency ratios: A key metric used to measure an enterprise’s
ability to meet its debt and other obligations. The solvency ratio indicates whether a company’s cash flow is sufficient to meet its short term and long term liabilities.
1. Debt to Equity:
The Debt to Equity ratio is a financial ratio indicating the relative proportion of shareholders equity and debt used to finance a company’s assets. The Debt to Equity ratio measures the riskiness of a company’s financial structure.
144.12 153.62 160.57
217.53 233.25
60.84 46.95 42.3 38.99 37.18
0
50
100
150
200
250
Mar-15 Mar-14 Mar-13 Mar-12 Mar-11
Return on AssetsIncluding RevaluationsReliance Communications
Return on AssetsIncluding RevaluationsIdea Cellular
Imperial Journal of Interdisciplinary Research (IJIR) Vol-2, Issue-7, 2016 ISSN: 2454-1362, http://www.onlinejournal.in
Page 1478
Table 8: Table showing Debt to Equity& Percentage Change of Selected Telecommunication Companies
Date Company Debt Equity Ratio (times) % Change
March 2010- 11 Reliance Communications 0.48 ***
Idea Cellular 0.86 ***
March 2011– 2012 Reliance Communications 0.62 29.16
Idea Cellular 0.79 -8.13
March 2012– 2013 Reliance Communications 0.92 48.38
Idea Cellular 0.80 1.26
March 2013– 2014 Reliance Communications 0.96 4.34
Idea Cellular 1.14 42.5
March 2014- 2015 Reliance Communications 0.76 -20.83
Idea Cellular 0.74 -35.08
Graph 8: Comparative analysis of Debt to Equity Ratio of selected Companies
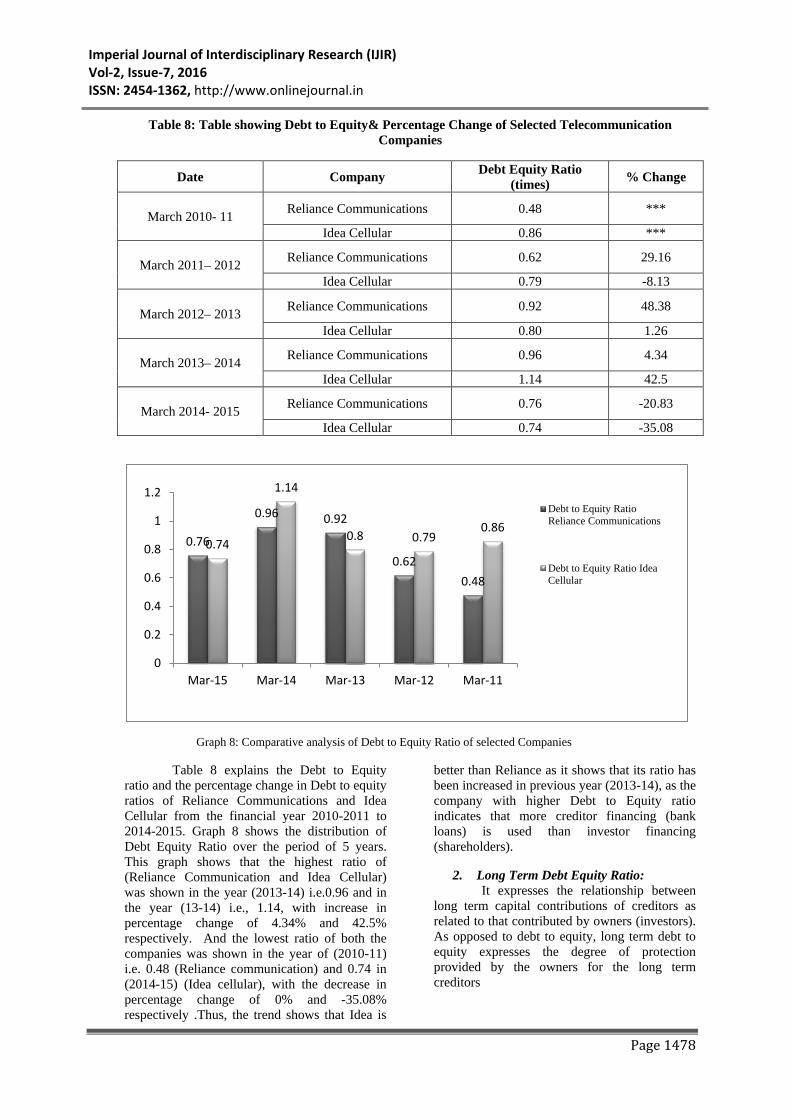
Table 8 explains the Debt to Equity ratio and the percentage change in Debt to equity ratios of Reliance Communications and Idea Cellular from the financial year 2010-2011 to 2014-2015. Graph 8 shows the distribution of Debt Equity Ratio over the period of 5 years. This graph shows that the highest ratio of (Reliance Communication and Idea Cellular) was shown in the year (2013-14) i.e.0.96 and in the year (13-14) i.e., 1.14, with increase in percentage change of 4.34% and 42.5% respectively. And the lowest ratio of both the companies was shown in the year of (2010-11) i.e. 0.48 (Reliance communication) and 0.74 in (2014-15) (Idea cellular), with the decrease in percentage change of 0% and -35.08% respectively .Thus, the trend shows that Idea is
better than Reliance as it shows that its ratio has been increased in previous year (2013-14), as the company with higher Debt to Equity ratio indicates that more creditor financing (bank loans) is used than investor financing (shareholders).
2. Long Term Debt Equity Ratio: It expresses the relationship between long term capital contributions of creditors as related to that contributed by owners (investors). As opposed to debt to equity, long term debt to equity expresses the degree of protection provided by the owners for the long term creditors
0.76
0.96 0.92
0.62 0.48
0.74
1.14
0.8 0.79 0.86
0
0.2
0.4
0.6
0.8
1
1.2
Mar-15 Mar-14 Mar-13 Mar-12 Mar-11
Debt to Equity RatioReliance Communications
Debt to Equity Ratio IdeaCellular
Imperial Journal of Interdisciplinary Research (IJIR) Vol-2, Issue-7, 2016 ISSN: 2454-1362, http://www.onlinejournal.in
Imperial Journal of Interdisciplinary Research (IJIR) Page 1479
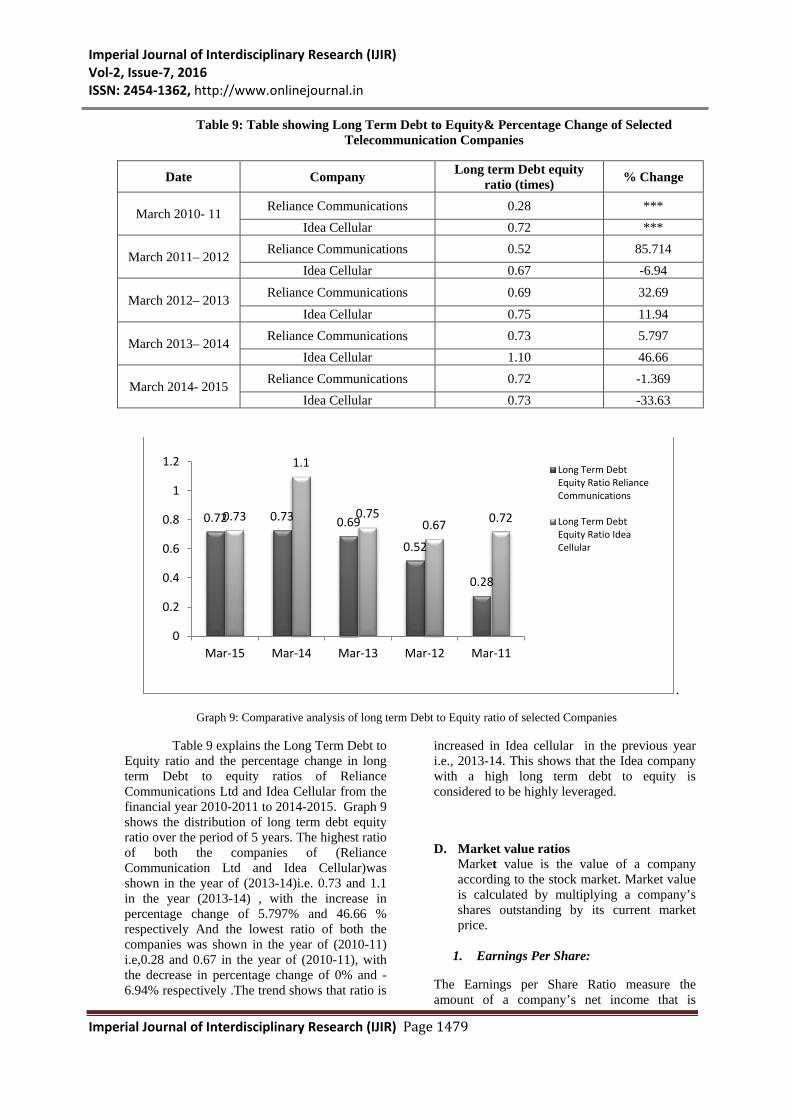
Table 9: Table showing Long Term Debt to Equity& Percentage Change of Selected Telecommunication Companies
Date Company Long term Debt equity ratio (times) % Change
March 2010- 11 Reliance Communications 0.28 *** Idea Cellular 0.72 ***
March 2011– 2012 Reliance Communications 0.52 85.714 Idea Cellular 0.67 -6.94
March 2012– 2013 Reliance Communications 0.69 32.69 Idea Cellular 0.75 11.94
March 2013– 2014 Reliance Communications 0.73 5.797 Idea Cellular 1.10 46.66
March 2014- 2015 Reliance Communications 0.72 -1.369 Idea Cellular 0.73 -33.63
.
Graph 9: Comparative analysis of long term Debt to Equity ratio of selected Companies
Table 9 explains the Long Term Debt to Equity ratio and the percentage change in long term Debt to equity ratios of Reliance Communications Ltd and Idea Cellular from the financial year 2010-2011 to 2014-2015. Graph 9 shows the distribution of long term debt equity ratio over the period of 5 years. The highest ratio of both the companies of (Reliance Communication Ltd and Idea Cellular)was shown in the year of (2013-14)i.e. 0.73 and 1.1 in the year (2013-14) , with the increase in percentage change of 5.797% and 46.66 % respectively And the lowest ratio of both the companies was shown in the year of (2010-11) i.e,0.28 and 0.67 in the year of (2010-11), with the decrease in percentage change of 0% and -6.94% respectively .The trend shows that ratio is
increased in Idea cellular in the previous year i.e., 2013-14. This shows that the Idea company with a high long term debt to equity is considered to be highly leveraged.
D. Market value ratios Market value is the value of a company according to the stock market. Market value is calculated by multiplying a company’s shares outstanding by its current market price.
1. Earnings Per Share:
The Earnings per Share Ratio measure the amount of a company’s net income that is
0.72 0.73 0.69
0.52
0.28
0.73
1.1
0.75 0.67 0.72
0
0.2
0.4
0.6
0.8
1
1.2
Mar-15 Mar-14 Mar-13 Mar-12 Mar-11
Long Term DebtEquity Ratio RelianceCommunications
Long Term DebtEquity Ratio IdeaCellular
Imperial Journal of Interdisciplinary Research (IJIR) Vol-2, Issue-7, 2016 ISSN: 2454-1362, http://www.onlinejournal.in
Page 1480
theoretically available for payment to the holders of its common stock.
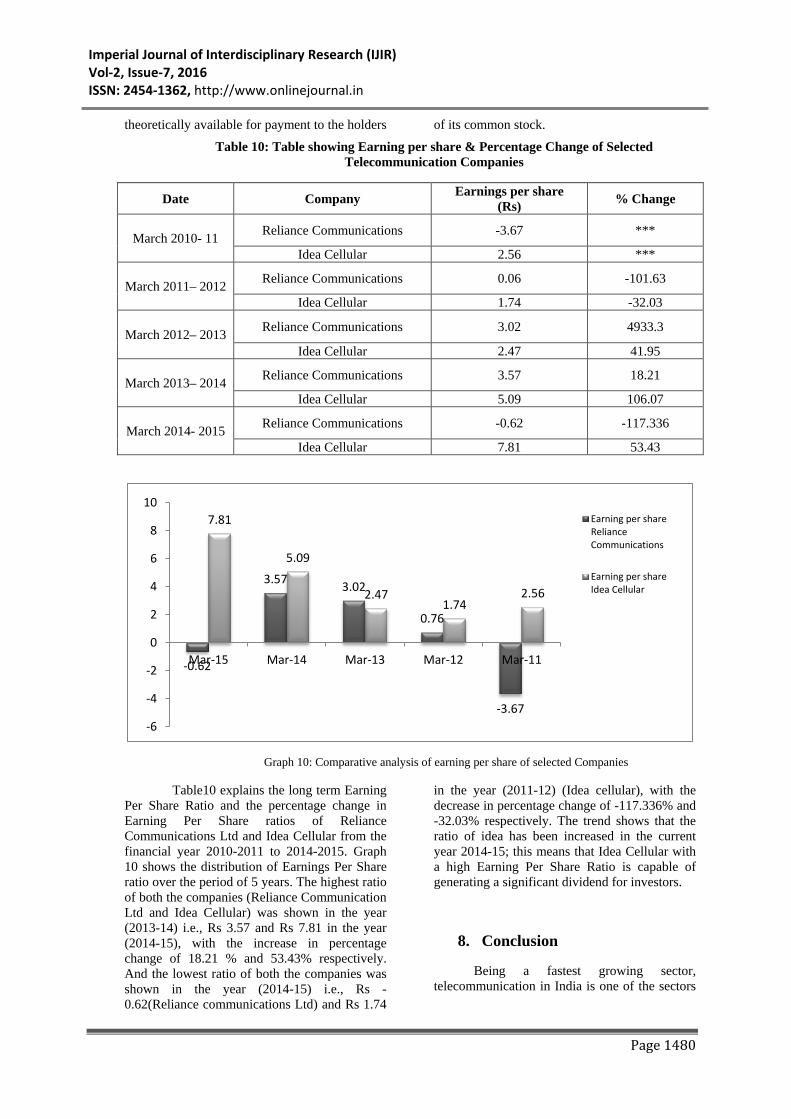
Table 10: Table showing Earning per share & Percentage Change of Selected Telecommunication Companies
Date Company Earnings per share (Rs) % Change
March 2010- 11 Reliance Communications -3.67 ***
Idea Cellular 2.56 ***
March 2011– 2012 Reliance Communications 0.06 -101.63
Idea Cellular 1.74 -32.03
March 2012– 2013 Reliance Communications 3.02 4933.3
Idea Cellular 2.47 41.95
March 2013– 2014 Reliance Communications 3.57 18.21
Idea Cellular 5.09 106.07
March 2014- 2015 Reliance Communications -0.62 -117.336
Idea Cellular 7.81 53.43
Graph 10: Comparative analysis of earning per share of selected Companies
Table10 explains the long term Earning Per Share Ratio and the percentage change in Earning Per Share ratios of Reliance Communications Ltd and Idea Cellular from the financial year 2010-2011 to 2014-2015. Graph 10 shows the distribution of Earnings Per Share ratio over the period of 5 years. The highest ratio of both the companies (Reliance Communication Ltd and Idea Cellular) was shown in the year (2013-14) i.e., Rs 3.57 and Rs 7.81 in the year (2014-15), with the increase in percentage change of 18.21 % and 53.43% respectively. And the lowest ratio of both the companies was shown in the year (2014-15) i.e., Rs -0.62(Reliance communications Ltd) and Rs 1.74
in the year (2011-12) (Idea cellular), with the decrease in percentage change of -117.336% and -32.03% respectively. The trend shows that the ratio of idea has been increased in the current year 2014-15; this means that Idea Cellular with a high Earning Per Share Ratio is capable of generating a significant dividend for investors.
8. Conclusion
Being a fastest growing sector, telecommunication in India is one of the sectors
-0.62
3.57 3.02
0.76
-3.67
7.81
5.09
2.47 1.74
2.56
-6
-4
-2
0
2
4
6
8
10
Mar-15 Mar-14 Mar-13 Mar-12 Mar-11
Earning per shareRelianceCommunications
Earning per shareIdea Cellular

Imperial Journal of Interdisciplinary Research (IJIR) Vol-2, Issue-7, 2016 ISSN: 2454-1362, http://www.onlinejournal.in
Page 1481
where innovation and intense competition is a key to the progress of the industry.
While reaching to the conclusion portion we came to know that Current Ratio of Reliance Communication is better than Idea Cellular.
In Quick Ratio, we came to know the liquidity position of Idea Cellular is better than Reliance Communication.
In Debt Equity Ratio the Idea Cellular is better than Reliance Communication to pay its debts.
Again the Long Term Debt Ratio of Idea cellular is better than Reliance Communication showing that the Idea cellular with a high Long Term Debt to Equity is considered to be highly leveraged.
Earnings Per Share Ratio (EPS) shows that the ratio of idea has been increased this means that Idea Cellular with a high Earning Per Share Ratio is capable of generating a significant dividend for investors as compare to Reliance Communication Ltd.
9. Suggestions
As from the analysis we come up with following suggestions:-
1. As the low values for the Liquidity Ratios indicates that a firm may have difficulty in meeting current obligations. Thus, it is better for them to increase their liquidity ratio by using long term financing rather than cash on hand to acquire inventory or selling unnecessary assets.
2. A Profitability Ratio is a measure of profitability, which is a way to measure a company's performance. Profitability is simply the capacity to make a profit. The firms can improve their profits by improving customers demand and minimizing costs help increase in profitability ratios.
3. The companies can make Solvency Ratios more secure either by paying off debt or increasing the amount of earnings retained in the business until after balance sheet date. As the higher ratio indicates a possible overuse of leverage, and it may indicate potential problems meeting the debt payments.
4. The companies can increase Market
Share Ratio through innovation, strengthening customer relationships, smart hiring practices and acquiring competitors.
10. References:
[1] Beaver, W. H., “Financial Ratios as Predictors of Failure”, Journal of Accounting Research, supplement, 1996, PP 71-127. [2] Bhattacharya, Asish. K., Introduction to Financial Statement Analysis, Elsevier, New Delhi, 1st edition, Chapter -03, Ratio Analysis, (2007), PP 32-45. [3] Brigham, E.F. and Ehrhardt, M.C., “Financial Management Theory and Practice”, 13th Ed. South-Western Cengage Learning, Mason, OH, (2010), ISBN: 1439078106, 1184. [4] Foster, George, “Financial Statement Analysis”, Prentice-Hall, Englewood Cliffs, 1986. [5] Kothari, C.R., “Research methodology” New Age International, New Delhi, 1997, [6] Lermack, H., “Steps to a basic company financial analysis”, Philadelphia University, Philadelphia, USA, 2003. [7] Ramamurthy C.G, “Research methodology” Dreamtech Press India , New Delhi, 2006. [8] Ross, S., et al, “Financial management fundamentals in Malaysia”’ McGraw-Hill, Malaysia, 2007. [9] Sharma R.K., Management Accounting Principles and Practice, Kalyani Publishers, Ludhiana, 1998. [10] Vijayalakshmi, B. & Sailaja, M. N., “Financial Health Of Selected Companies In Telecom Sector: A Comparative Study”, Arth Prabhand: A Journal Of Economics And Managemen,t Vol.2(8), 2013.
WEBSITES
• www.wkipedia.org • www.ideacellular.com • www.Reliancecommunications.com • www.moneycontrol.com • www.ndtvprofit.com • http/:mobigyaan.com/telecom/Indian-
telecom-Industry • http://www.moneycontrol.com/financial
s/reliancecommunications/ratios/RC13#RC13
Imperial Journal of Interdisciplinary Research (IJIR) Vol-2, Issue-7, 2016 ISSN: 2454-1362, http://www.onlinejournal.in
Page 1482
• http://www.moneycontrol.com/financials/ideacellular/profit-loss/IC8#IC8
• http://en.wikipedia.org/wiki/Financial_ratio
ABBREVIATIONS
• RCOM (Reliance Communications) • TRAI ( Telecom Regulatory Authority
of India) • RIL’s (Reliance India Limited)
• Mhz (Megahertz) • IAMAI (Internet and Mobile
Association of India) • INSAT (Indian National Satellite
System) • TDSAT (Telecom Disputes Settlement
Appellate Tribunal ) • NTP (New Telecommunications
Policy) • GSM ( Global System for Mobile) • LTE ( Long Term Evolution)

Imperial Journal of Interdisciplinary Research (IJIR) Vol-2, Issue-7, 2016 ISSN: 2454-1362, http://www.onlinejournal.in
Page 1483
Annexure-I
TELECOM REGULATORY AUTHORITY
OF INDIA
The Telecom Regulatory Authority of India (TRAI) is the independent regulator of the telecommunications business in India. TRAI was established on February 20, 1997 by an Act of Parliament to regulate telecom services and tariffs in India. Earlier regulation of telecom services and tariffs was overseen by the Central Government.
TRAI's mission is to create and nurture conditions for growth of telecommunications in India to enable the country to have a leading role in the emerging global information society.
COMPANY PROFILE OF IDEA Cellular
IDEA were incorporated as Birla Communications Limited on March 14, 1995 and granted a certificate of commencement of business on August 11, 1995. IDEA registered office was in Mumbai, Maharashtra.
Services of Idea Cellular in India
Idea operates in all circles of India . Its network is present in 395363 villages and 4000 census towns and 367272 non-census towns and villages , covering approximately 70.2% of the country population as of march 2015.Idea is 2nd largest operator in rular India with 1.167 million users as of april 2015
Idea is the 2nd most valued brand according to an annual survey conducted by Brand Finance and The Economic times 2010.
Some services provided by Idea Cellular are :-
3G
Consumers can now avail 3G services in regions that include Chandigarh, Ludhiana, Nawanshahr, Jagraon, Malerkotla and Nabha. With this launch, Idea expanded its 3G footprint to 28 Indian states.
4G
Idea to launch 4g services in 750 towns across 10 circles by the first half of 2016. The circles include Maharashtra, Goa ,AndraPardesh, Madhya Pradesh, Chhattisgarh, Kerala,
Punjab,Haryana,Karnataka,Orissa,Tamil Naidu And North East.
IDEA WI-FI
Smart Wi-Fi HUB is a compact & portable 3G / W-fi Modem, small enough to fit comfortably in one’s palm. The one key design of Smart Wi-Fi Hub blends elegance and practicality to provide 3G data connectivity with one touch and enables on the move, IDEA personal Wi-Fi zone Smart Wi-Fi Hub enables internet sharing with 10 devices, gives freedom from wires and software installation & external power IDEA since it comes with powerful 1500Mah battery. IDEA 3G SMART PHONE
Idea Cellular has launched two dual-SIM 3G smartphones the Magna and Magna L - priced at Rs. 4,999 and Rs. 6,250 respectively.
Both the Idea Magna and Idea Magna L smartphones run Android 4.4 KitKat out-of-the-box and support 3G connectivity - the highlight features of the new smartphones.
IDEA NETSETTER
Idea Cellular has launched a new version of its 3G dongle called the Idea NetSetter. This new dongle supports speeds up to 21.6Mbps and will be available for Rs 2,160 in Idea’s 3G circles, which includes Maharashtra, Goa, Madhya Pradesh, Chhattisgarh, Andhra Pradesh, and Kerala.
As mentioned above, the new Net Setter functions on Idea’s HSPA network and supports download speeds of up to 21.6Mbps and upload speeds of up to 5.76Mbps. It is compatible with devices running on Windows 8, Windows 8.1, Windows RT, Linux and Mac and is also backward compatible on EDGE and GPRS. Additionally, it has an in-built microSD card slot for cards with up to 32GB of storage.
COMPANY PROFILE OF RELIANCE TELECOMMUNICATIONS
Reliance Communications Limited is the flagship Company of Reliance Anil DhirubhaiAmbani Group, India's third largest business house. The company is India's largest private sector information and communications

Imperial Journal of Interdisciplinary Research (IJIR) Vol-2, Issue-7, 2016 ISSN: 2454-1362, http://www.onlinejournal.in
Page 1484
company, with over 100 million subscribers. They have established a pan-India, high-capacity, integrated (wireless and wireline), convergent (voice, data and video) digital network, to offer services spanning the entire infocomm value chain.
Services of Rcom in India
3G
Network offers you the best coverage, tariff plans and speed wherever you go. No more lags or buffering and messages get delivered instantly!Managing Reliance mobile account from anywhere is also extremely easy. Recharge, pay bills, activate Value Added Services and do lots more with handset.
4G
RIL’s telecom has pan-India 4G spectrum. “RCom becomes India’s first and only operator with nationwide footprint of contiguous 800/850 MHz spectrum. RCom operations now future-proofed across all circles for most advanced LTE technology at most optimal cost,” the company said in a statement.
However, RCom spectrum holding in 800 Mhz in some parts of the country cannot be used to offer 4G service as the matter is sub-judice or to start 4G service using those airwaves it will have to pay one-time spectrum fee of Rs 173 crore
demanded by government. Reliance Jio has also added two sets of spectrum-800 Mhz in 10 circles and additional 1800 Mhz in six circles, to boost its 4G services with stable voice calling service. On March 27, 2015
RCOM DATA CARD
• Wireless broadband for laptops and desktops
• Download speeds up to 3.1 Mbps and upload speeds up to 1.8 Mbps
• Simply plug and play • Connectivity across 24,000 towns and 6
lacs villages, as well as along major highways, railway routes, airport lounges and remote locations in India
Reliance WI-POD Features:
• Superior indoor internet coverage at 800 Mhz • Consistent data speeds • Connects multiple users simultaneously • Storage support with Micro SD
• Max 6 Users on WIFI • Micro SD slot • Powered by USB Port • Muti OS support
IDEA V/S RCOM
ACCORDING TO TELECOM REGULATORY AUTHORTY OF INDIA
Rank Operator's Name Technology Subscribers in crores (10m)
Ownership Market Share
1 Airtel GSM EDGE HSPA+TD-LTE
23.14 (May 2015) [1]
Bharti Enterprises (68%) SingTel (32%)
22.74% (September 2014)
2 Idea Cellular GSM EDGE HSPA+
15.9 (May 2014)[1]
Aditya Birla Group 20.50% (September 2014)
3 Vodafone India GSM EDGE HSPA+
17.3 (September 2014)[1]
Vodafone Group (100%)
18.69% (September 2014)
4 Reliance Communications
CDMA2000 EVDO REV. B GSM EDGE HSDPA HSPA+ WiMAX
13.4 (September 2014)
Reliance ADAG (67%) Public (26%)
11.84% (September 2014)
5 BSNL GSM EDGE HSDPA HSPA+ CDMA2000 EVDO REV. 0 WiMAX
8.67 (September 2014)[1]
State-owned 9.32% (September 2014)
Source: Wikipedia
Imperial Journal of Interdisciplinary Research (IJIR) Vol-2, Issue-7, 2016 ISSN: 2454-1362, http://www.onlinejournal.in
Page 1485
COMPETITORS ANALYSIS
Source: Telecom Regulatory Authority of India (TRAI)