ISSN 2348 – 7968 Benefit-Cost Analysis of Effluent ... · Benefit-Cost Analysis of Effluent...
25
IJISET - International Journal of Innovative Science, Engineering & Technology, Vol. 1 Issue 10, December 2014. www.ijiset.com ISSN 2348 – 7968 794 Benefit-Cost Analysis of Effluent Treatment Plant Installed in Haleeb Foods Factory Lahore Pakistan Mohammad Rafiq Khan* and Majed Rashid 1 *Lahore School of Economics, Lahore, Pakistan, 1 Department of Business Administration, AIOU, Islamabad Abstract Techno-economic assessment of effluent treatment plant installed in Haleeb Foods Private Limited was carried out. The data were collected through successive visits to HFL Food Processing Plant located at 62 Km Multan Road Lahore and seeking interviews with Mr. Suleman Daud, the Managing Director and with senior officers of the Company. The data were, subsequently, analyzed to determine the Benefit to Cost (B/C) Ratio and Net Present Value (NPV) of the Project. Sensitivity of the project was also checked by changing the discount rate, plant life\, etc. The analysis led to a B/C Ratio of 0.944 that is little less than 1 and a negative NPV of $96,201 that slightly deviates from the decision criteria. These indices suggest that the installation is both economically and socially justified and acceptable. The sensitivity analysis revealed that evaluation at low discount rate such as 5% and higher plant life such as 15 and 20 years pulls the project towards economic and social acceptability without any hesitation. Key Words: Techno-economic • Effluent • Treatment • Haleeb Introduction Since the appearance of the framework of Agenda 21 after Global Conference in Rio de Janeiro in 1992 [1], many countries have started turning towards the cleaner technologies as a sacred mission. The concept and practice of cleaner technologies have been described in different reports brought out by United Nations Environment Program (UNEP) at its own and in collaboration with other organizations [2, 3, and 4] Pakistan is also one of the stakeholders in this mission. The major experiment it has undertaken on these lines is the introduction of cleaner and sustainable technologies in its tanning industries scattered in different cities and towns of the Country in the form of clusters. An important aspect is the tannery effluent treatment for lowering down its pollutant concentrations to National Environmental Quality Control Standards (NEQS) before ultimate disposal to water bodies. The installation of water pretreatment plant at Kasur, near Lahore seems to be a successful experiment [5, 6, 7] After Pakistan Environmental Act, 1997-Sections 11 and 12 [8], some companies in Pakistan, exhibited a positive response toward its implementation and installed the effluent treatment plants requisite under the environmental protection laws in their processing establishments. Haleeb Foods Private Limited is one of the pioneers in this activity. As its Head Office as well as its Food Processing Plant is
Transcript of ISSN 2348 – 7968 Benefit-Cost Analysis of Effluent ... · Benefit-Cost Analysis of Effluent...
IJISET - International Journal of Innovative Science, Engineering & Technology, Vol. 1 Issue 10, December 2014.
www.ijiset.com
ISSN 2348 – 7968
794
Benefit-Cost Analysis of Effluent Treatment Plant Installed in Haleeb Foods Factory Lahore Pakistan
Mohammad Rafiq Khan* and Majed Rashid1
*Lahore School of Economics, Lahore, Pakistan, 1Department of Business Administration,
AIOU, Islamabad
Abstract Techno-economic assessment of effluent treatment plant installed in Haleeb Foods Private Limited was carried out. The data were collected through successive visits to HFL Food Processing Plant located at 62 Km Multan Road Lahore and seeking interviews with Mr. Suleman Daud, the Managing Director and with senior officers of the Company. The data were, subsequently, analyzed to determine the Benefit to Cost (B/C) Ratio and Net Present Value (NPV) of the Project. Sensitivity of the project was also checked by changing the discount rate, plant life\, etc. The analysis led to a B/C Ratio of 0.944 that is little less than 1 and a negative NPV of $96,201 that slightly deviates from the decision criteria. These indices suggest that the installation is both economically and socially justified and acceptable. The sensitivity analysis revealed that evaluation at low discount rate such as 5% and higher plant life such as 15 and 20 years pulls the project towards economic and social acceptability without any hesitation.
Key Words: Techno-economic • Effluent • Treatment • Haleeb
Introduction
Since the appearance of the framework of Agenda 21 after Global Conference in Rio de Janeiro in 1992 [1], many countries have started turning towards the cleaner technologies as a sacred mission. The concept and practice of cleaner technologies have been described in different reports brought out by United Nations Environment Program (UNEP) at its own and in collaboration with other organizations [2, 3, and 4] Pakistan is also one of the stakeholders in this mission. The major experiment it has undertaken on these lines is the introduction of cleaner and sustainable technologies in its tanning industries scattered in different cities and towns of the Country in the form of clusters. An important aspect is the tannery effluent treatment for lowering down its pollutant concentrations to National Environmental Quality Control Standards (NEQS) before ultimate disposal to water bodies. The installation of water pretreatment plant at Kasur, near Lahore seems to be a successful experiment [5, 6, 7]
After Pakistan Environmental Act, 1997-Sections 11 and 12 [8], some companies in Pakistan, exhibited a positive response toward its implementation and installed the effluent treatment plants requisite under the environmental protection laws in their processing establishments. Haleeb Foods Private Limited is one of the pioneers in this activity. As its Head Office as well as its Food Processing Plant is

IJISET - International Journal of Innovative Science, Engineering & Technology, Vol. 1 Issue 10, December 2014.
www.ijiset.com
ISSN 2348 – 7968
795
located in Lahore, where is also based Lahore School of Economics, the techno-economic assessment of its effluent treatment plant was undertaken due to easy access to both place and data.
Company Description Haleeb Foods Ltd (formerly CDL Foods Limited) is one of the few leading national companies of Pakistan that collects four to six hundred thousand liters of fresh milk daily from its large number of collection points scattered all over Punjab, chills it at the site and processes it to manufacture a long range of dairy products. The Company not only supplies its products nationwide but is also exporting its foods to a number of countries. It exports its full range of products through its distribution network to Afghanistan. Currently, its annual sales are more than US$ 150,000,000. The Company claims that it is competing very well with other companies including even the multinationals such as Nestle, Pakistan Private Limited, etc. The growth rate of the company that is above 25% is the highest as compared to any other Company in Pakistan. The Company has done well in implementation of the environmental protection laws. It was ISO- 9002 certified long ago and has won two ISO-14001 certifications in 2004 and 2007 respectively. As the Company produces processed foods on a large scale, it also produces a lot of waste. The major waste produced is the liquid effluent. Its disposal was one of the major problems encountered by Haleeb. Its disposal to keep the environment clean, respect for the National Environmental Protection Laws and attempt to qualify for ISO-14001 certifications were the stimuli for the planning and installation of an effluent treatment plant in the factory. The current work was undertaken to evaluate Haleeb Effluent Disposal Plant for its economic viability and social necessity and present the results to polluters in particular and humanity at large in general so that they may be able to know where their investment stands techno-economically. Research Methodology The plan of work involved the stages narrated below. Data Collection: The requisite data related to the technological, environmental and financial aspects of the project under investigation were collected by paying successive visits to HFL. Interview technique was used to collect data from the concerned circles and people. A comprehensive questionnaire was designed and standardized for collecting the information. Both one to one, one to group meetings were held to dig out the information. The following officials of the company were interviewed to collect the preliminary and general information about HFL, Food Processing Plant and Waste Water Treatment Plant:

IJISET - International Journal of Innovative Science, Engineering & Technology, Vol. 1 Issue 10, December 2014.
www.ijiset.com
ISSN 2348 – 7968
796
1. Managing Director 2. General Manager Human Resources 3. Maintenance Manager 4. General Manager Operations 5. Manager Quality Assurance 6. Manager Research and Development 7. Supervisor WWTP
Both milk processing and waste water plants were visited to see the work-in-progress with an objective to understand the technology involved and to identify the sub-processes and the cost elements. The block flow sheet diagram of the water waste treatment plant was drawn. The costs of different elements were obtained from the Maintenance Manager of WWTP. Analysis of the Data: The data were recorded and subsequently analyzed to compute initial fixed investment, expenditure of replacements (if any) in the future years after fixing the life of the project as 10 years per suggestion of Haleeb Management.. A schedule of current and future cash outlays and cash flows was constructed. All the expenditures and returns were discounted to the base year that was 2002 to 2003 to determine their present values by the application of the standard evaluation techniques (Asian Development Bank, 2001, 2003). From the present values, the B/C Ratio and NPV of the project were calculated as described under cost analysis. The 10% discount rate was adopted from ADB evaluations on South Asian countries (Asian Development Bank, 2001, 2003). Interpretation of Results: The general information about work-in-progress was computed as descriptive research. The results were interpreted by comparison with reference standards of B/C ratio that is 1 for acceptance of projects or for their economic viability and of value of NPV with reference to zero that is positive for acceptance and negative for rejection provided the investment is not in response to social obligation. Cost Analysis The cost analysis was done by the standard techniques followed by the Asian Development Bank [9, 10]. The following assumptions were made before application of analysis: Project Life: 10 Years Base Year: 2002 (2002-2003) Evaluation Year: 2004 Average Discount Rate in Pakistan: 10% Starting and Closing of Financial Year: July 1 to June 30 Currency Unit: US Dollar

IJISET - International Journal of Innovative Science, Engineering & Technology, Vol. 1 Issue 10, December 2014.
www.ijiset.com
ISSN 2348 – 7968
797
Initial Fixed Investment: Different cost elements of initial fixed investment are discussed below. Land: The Company purchased thirty seven acre land at the present site that is located at Multan Road, 62 kilometers from the District Courts, Lahore in 1984. The cost of land at that time was $36,123. The Plant occupies an area with dimensions 46.3×44.6 or 2065 square meters. This, in terms of acres, comes out as 0.625 acre. As the plant was installed in land that was not in any other use and there were no prospects of its coming into an active use in near future, its cost may be neglected. The current price of the land in that area is around $16,667 per acre on front of the road and $8,333 on the back. The Plant, of course, is located at the back, Anyhow, the summary of old and current costs is as under: Total Land 2065 M2 Constructed Area 1649 M2
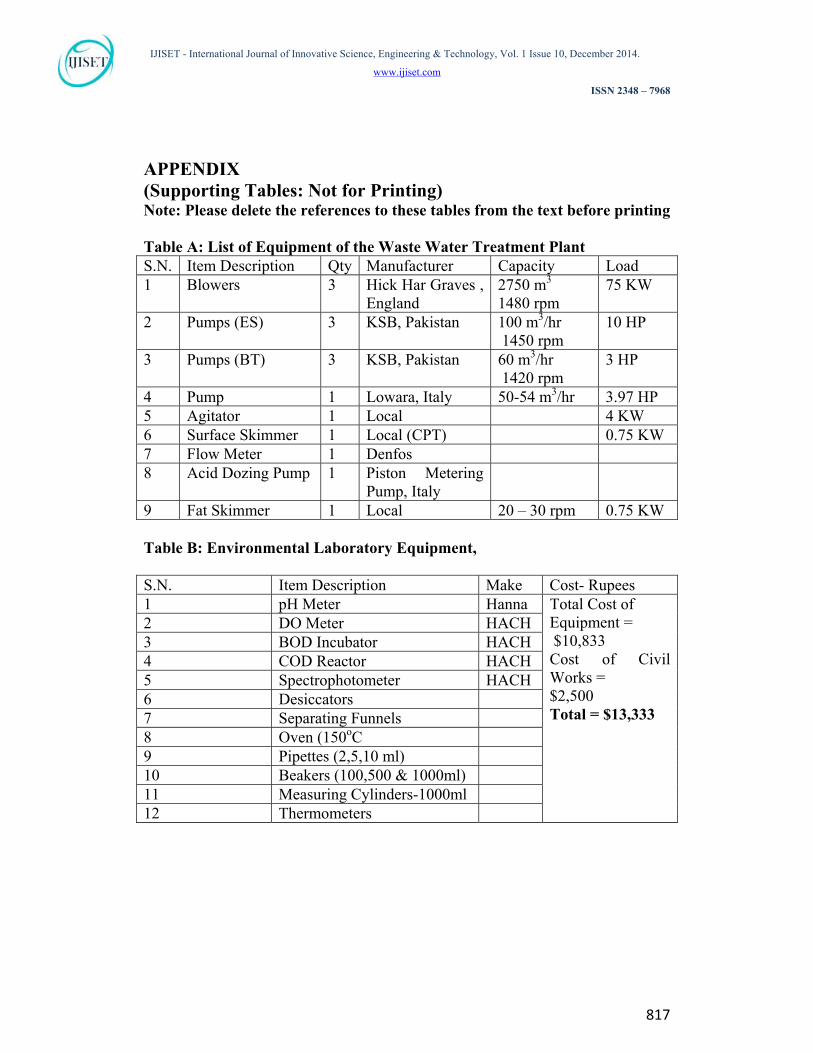
Open Land 416 M2 Cost of Land in 1984 $36,123/37×0.625 = $610 Cost of Land in 2004 $ 8,333 ×0.625 = $5,208 Building: Actually, there is no specially constructed building to cover the whole plant as most of the machinery is installed in open, which is the demand of the aerobic nature of the Active Sludge Process. Thus, the only civil works to be carried out were concrete floorings, etc, and a few rooms for covering the machines such as blowers and sludge holding tank to avoid spreading of the smell. In addition, the drainage system was renovated for its prolonged life and smooth flow of the effluent and the electrical system was to be updated per requirements. The contract for supply of plant machinery and its installation was given to DDFC Private Limited, while that of all civil works was given to Amin Tariq Associates, Lahore. The cost summary is given below, Total of Civil Works = $176,667 Cost of Electrical Installation = $23,700 Total = $200,367 (i) Machinery and Equipment: The cost of plant machinery and equipment is given below. DDFC Cost of Plant Machinery and Equipment (Listed in Appendix Supporting Table A)* $245,400 (ii) Laboratory Equipment (Appendix Supporting Table B)* $13,333 (iii) The design of the plant was revised due to some drawbacks in the original design that were detected later. As a result, an extra sump adjacent to the fat trap outlet meant to collect water after fat removal was required. The defect was agreed upon by all parties. Thus, Extra Expenditure = $4,417 (iv) Total Initial Fixed Investment (Without Land Price) = (i) + (ii) + (iii) + (iv) = $ (200,367 + 245,400 + 13,333+4,417) = $463,517 Operating Cost: The operating cost components and their costs are given below, Raw Material Cost: The raw material is the effluent that is to be disposed off. Thus, there is no cost of the raw material.

IJISET - International Journal of Innovative Science, Engineering & Technology, Vol. 1 Issue 10, December 2014.
www.ijiset.com
ISSN 2348 – 7968
798
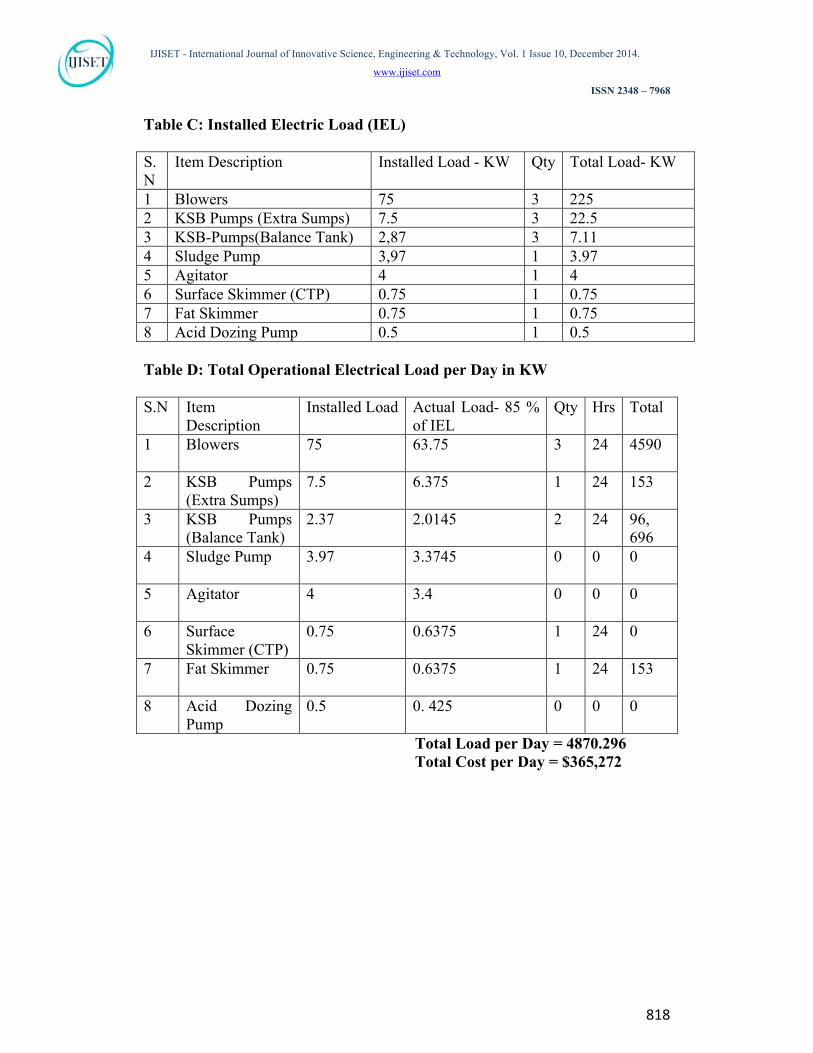
Cost of Other Inputs: As negligibly small quantity of water is used and no chemicals and fuel are used, no cost of other inputs except electric power is involved and that is given separately below. Cost of Electric Power: Cost of Electric Power/Day (App. Supporting Tables C & D)* = $365.3 Cost of Electric Power/ Year = $365, 3*365 = $133,335 (Approx.) Note: *Not for printing Labor Cost: Chemical Engineer Per Month = $250 Operators: $ 4×83.3 per Month = $ 333 Labor Cost per Month = $583 Total Labor Cost per Annum = $583*12 = $6,995 Maintenance Cost: Only oils are required to lubricate the blowers, pumps and CTP machinery, Cost of Oil Per Annum = $417 Cost of Laboratory Reagents per Annum = $1,667 Depreciation at the Rate of 10% of the Purchase Price (Plant Machinery and Equipment + Lab Equipment = $46,352 Expenditure in Base Year: Initial fixed Investment = $463,517 Operating Cost = Nil Pre-production Expenditure = Nil The Plant project was to be completed in three phases. These were Installation Phase that was purely the responsibility of the Contractor. This phase took one year. (2002 to 2003), and at the time of enquiry, the Plant was in the Commissioning Stage (2003 to 2004). The stage that was to follow was the Handing over Stage, The labor involved in operating the plant was that of the Company. It was trained on site .Some expenditure involved in assisting the Contractor may be neglected. Interest on Initial Fixed Investment and Working Capital: Nil The Company is doing business without interest. Expenditure in Future Years: In future, no investment in terms of machinery and equipment will be involved. Operating cost as in the first year of operation (2003 to 2004) will be there in all the years. It may change with the change in salaries of the employees and change in the prices of other inputs such as electricity and lubricating oil required for maintenance. If it is assumed that the salaries of labor undergo an increase of 15% of its basic pay after every three years and so do the prices of electric power by 10% and lubricating oils and chemicals, undergo an increase in cost by10% of initial cost every year, then the overall picture of future operating costs is presented in Table 1.
IJISET - International Journal of Innovative Science, Engineering & Technology, Vol. 1 Issue 10, December 2014.
www.ijiset.com
ISSN 2348 – 7968
799
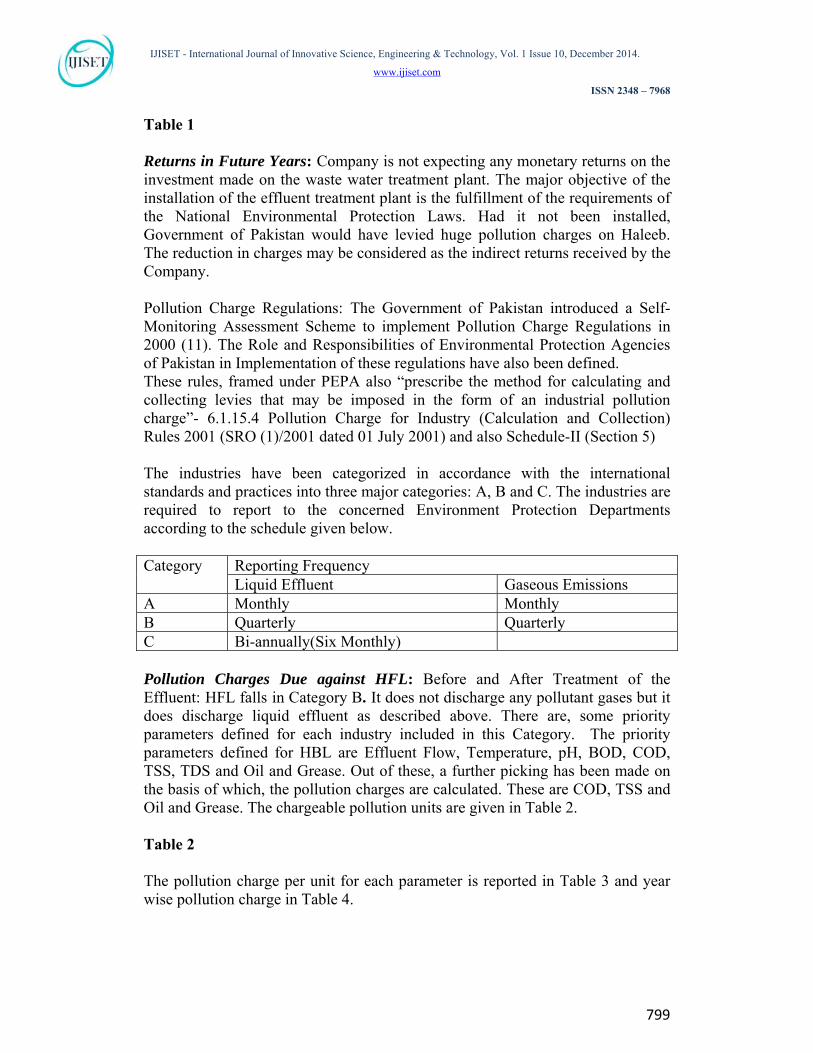
Table 1 Returns in Future Years: Company is not expecting any monetary returns on the investment made on the waste water treatment plant. The major objective of the installation of the effluent treatment plant is the fulfillment of the requirements of the National Environmental Protection Laws. Had it not been installed, Government of Pakistan would have levied huge pollution charges on Haleeb. The reduction in charges may be considered as the indirect returns received by the Company. Pollution Charge Regulations: The Government of Pakistan introduced a Self- Monitoring Assessment Scheme to implement Pollution Charge Regulations in 2000 (11). The Role and Responsibilities of Environmental Protection Agencies of Pakistan in Implementation of these regulations have also been defined. These rules, framed under PEPA also “prescribe the method for calculating and collecting levies that may be imposed in the form of an industrial pollution charge”- 6.1.15.4 Pollution Charge for Industry (Calculation and Collection) Rules 2001 (SRO (1)/2001 dated 01 July 2001) and also Schedule-II (Section 5) The industries have been categorized in accordance with the international standards and practices into three major categories: A, B and C. The industries are required to report to the concerned Environment Protection Departments according to the schedule given below. Category Reporting Frequency
Liquid Effluent Gaseous Emissions A Monthly Monthly B Quarterly Quarterly C Bi-annually(Six Monthly) Pollution Charges Due against HFL: Before and After Treatment of the Effluent: HFL falls in Category B. It does not discharge any pollutant gases but it does discharge liquid effluent as described above. There are, some priority parameters defined for each industry included in this Category. The priority parameters defined for HBL are Effluent Flow, Temperature, pH, BOD, COD, TSS, TDS and Oil and Grease. Out of these, a further picking has been made on the basis of which, the pollution charges are calculated. These are COD, TSS and Oil and Grease. The chargeable pollution units are given in Table 2. Table 2 The pollution charge per unit for each parameter is reported in Table 3 and year wise pollution charge in Table 4.

IJISET - International Journal of Innovative Science, Engineering & Technology, Vol. 1 Issue 10, December 2014.
www.ijiset.com
ISSN 2348 – 7968
800
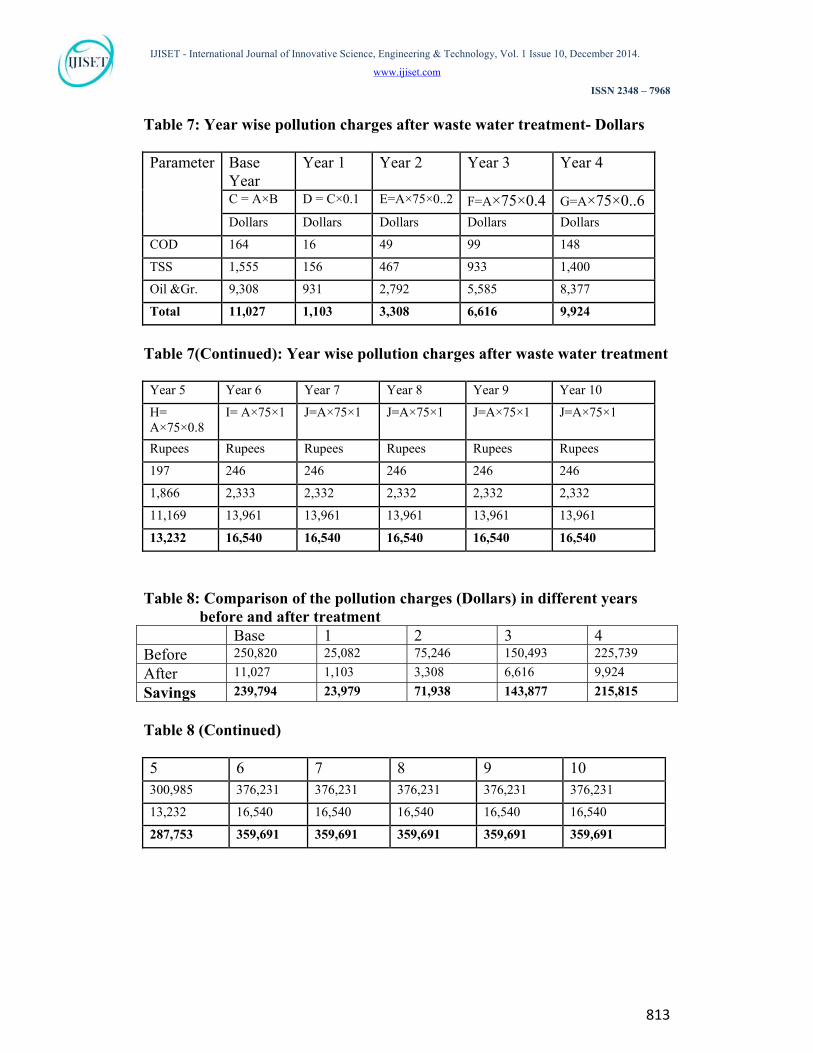
Table 3 Table 4 The comparison of pollution charges indicates that the charges go on increasing with the changes in the number of the year till in sixth year; the charge comes out to be the maximum. The life of the plant, as we have been told is ten years, Hence, the same values have been assumed for the years 7 to 10 (Table 4). The life in Pakistan is never as it is told by the manufactures or suppliers of machinery. That is due to cheaper labor available in Pakistan. The chargeable pollution units after treatment are given in Table 5 Table 5 The pollution charge per unit for each parameter after treatment is reported in Table 6. Table 6 Table 7 The comparison of the pollution charges before treatment (Table 4) and after treatment (Table 7) is made in Table 8. Table 8 The comparison indicates that there is a drastic reduction in the pollution charge every due year and this indirect saving may be considered as the revenue return. Scrap Value of the Machinery: If assumed at 10 % of the purchase price, it will be = $ 46,352
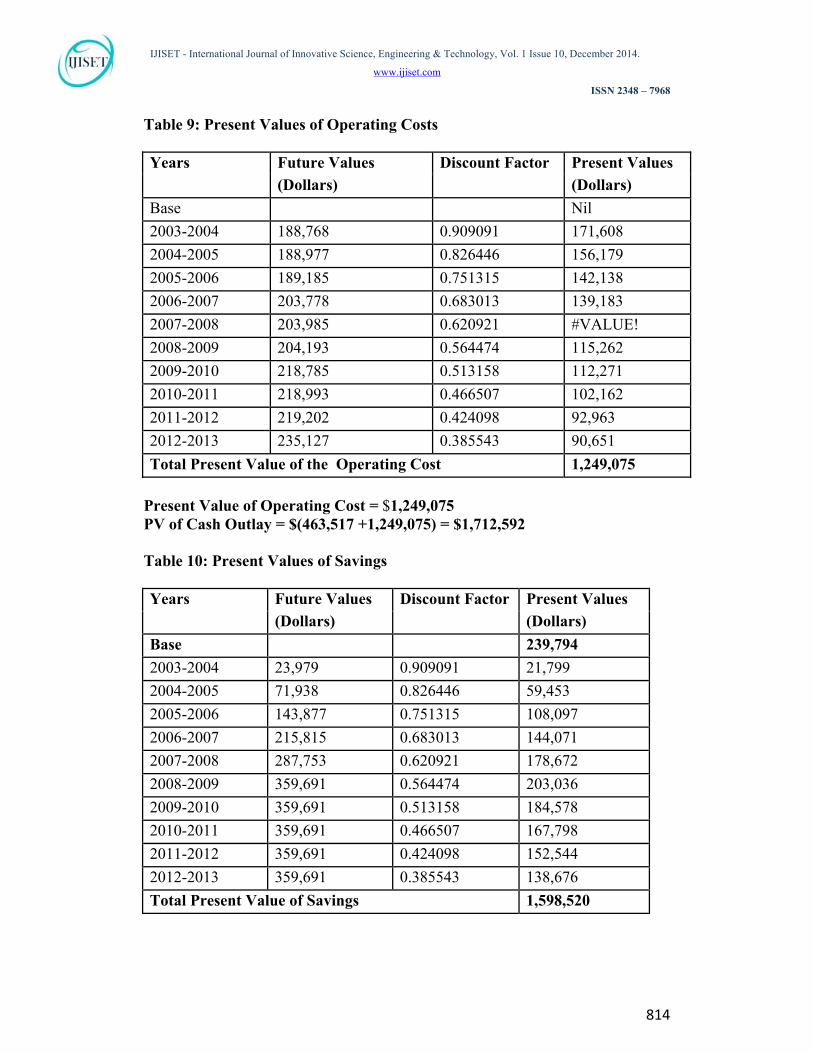
Total Expenditure and Total Returns Discounted to the Base Year: Present Values The calculations of present values of expenditure and returns in Tables 9 and 10 Expenditure: Initial Fixed Investment +Operating Cost Initial Fixed Investment = $ 463,517 Table 9 Present Value of Operating Cost = $1,249,075 PV of Cash Outlay = $ (463,517 +1,249,075) = $1,712,592

IJISET - International Journal of Innovative Science, Engineering & Technology, Vol. 1 Issue 10, December 2014.
www.ijiset.com
ISSN 2348 – 7968
801
Table 10 Returns = Savings + Scrap Value Present Value of Scrap = $ (46,352×0.385543) = $17,871
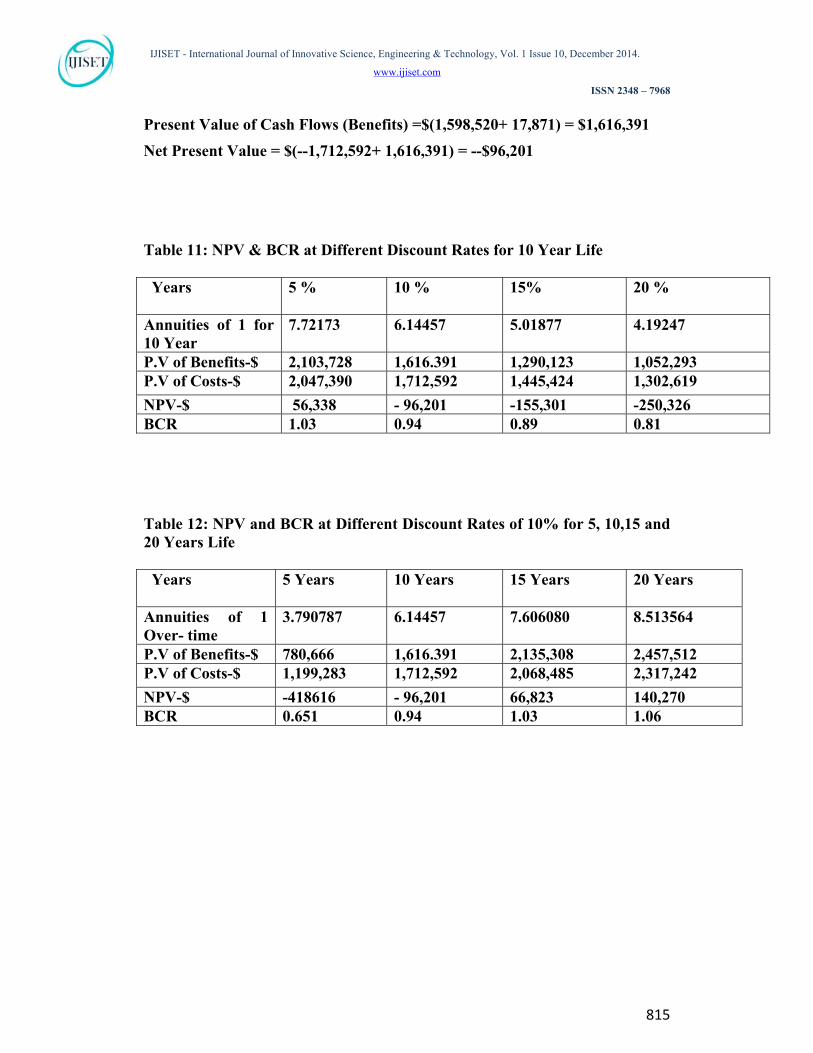
Present Value of Cash Flows (Benefits) =$(1,598,520+ 17,871) = $1,616,391
Present Value of Benefits
Benefit / Cost (B/C) Ratio = =
Present Value Cost 1,616,391 ──────── = 0.944 (After Rounding Off) 1,712,592
Net Present Value = $ (-1,712,592+ 1,616,391) = - $96,201 Sensitivity Analysis The sensitivity analysis helps in the assessment of the tendency of the decision parameters such as BCR and NPV to change with the change in independent variables on which the economic viability of the project depends. As there is no chance of changing the revenue returns the factors that are considered here are the basic norms for evaluation, inclusion of opportunity cost of land, the discount rate and the life of the plant. The method of performing sensitivity analysis is based on the study of the effect of change in one of different parameters mentioned above. The reference standard was the evaluation given above (10% discount rate and 10 Year plant life period, increasing the salaries and utilities in future years to accommodate the effect of inflation and inclusion of opportunity cost of land in initial fixed investment) Change in Basic Norm: There are usually two norms followed while evaluating the projects. 1, Expenditures and revenue returns when projected over the future years are incremented with a view to accommodate the impact of inflation, etc. 2. No inflation based increment is added on the assumption that whenever there is an increase in expenditures there is a proportionate increase in the revenues and thus the effects are mutually nullified. When no increment in salaries is added over time, the costs become continuous outlays. Thus, the summations of costs are simplified as these can be computed by applying Annuity Formula: Sum of the Expenditure Incurred Overtime =
IJISET - International Journal of Innovative Science, Engineering & Technology, Vol. 1 Issue 10, December 2014.
www.ijiset.com
ISSN 2348 – 7968
802
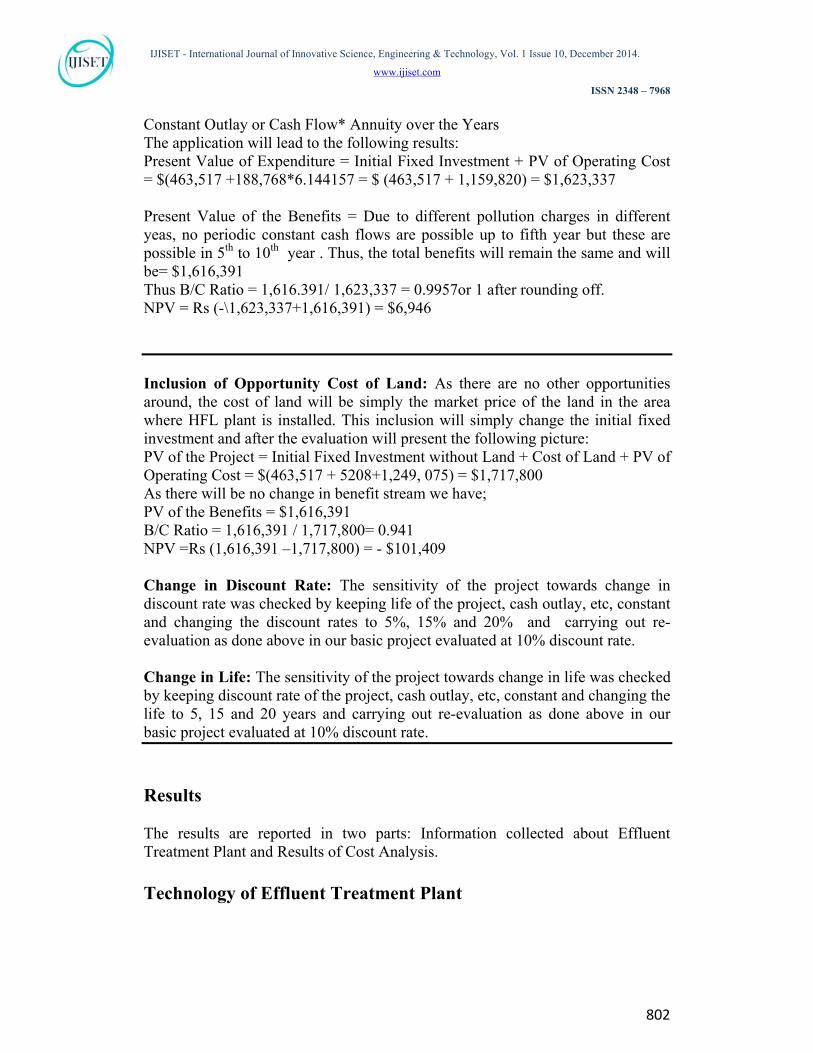
Constant Outlay or Cash Flow* Annuity over the Years The application will lead to the following results: Present Value of Expenditure = Initial Fixed Investment + PV of Operating Cost = $(463,517 +188,768*6.144157 = $ (463,517 + 1,159,820) = $1,623,337 Present Value of the Benefits = Due to different pollution charges in different yeas, no periodic constant cash flows are possible up to fifth year but these are possible in 5th to 10th year . Thus, the total benefits will remain the same and will be= $1,616,391 Thus B/C Ratio = 1,616.391/ 1,623,337 = 0.9957or 1 after rounding off. NPV = Rs (-\1,623,337+1,616,391) = $6,946 Inclusion of Opportunity Cost of Land: As there are no other opportunities around, the cost of land will be simply the market price of the land in the area where HFL plant is installed. This inclusion will simply change the initial fixed investment and after the evaluation will present the following picture: PV of the Project = Initial Fixed Investment without Land + Cost of Land + PV of Operating Cost = $(463,517 + 5208+1,249, 075) = $1,717,800 As there will be no change in benefit stream we have; PV of the Benefits = $1,616,391 B/C Ratio = 1,616,391 / 1,717,800= 0.941 NPV =Rs (1,616,391 –1,717,800) = - $101,409 Change in Discount Rate: The sensitivity of the project towards change in discount rate was checked by keeping life of the project, cash outlay, etc, constant and changing the discount rates to 5%, 15% and 20% and carrying out re-evaluation as done above in our basic project evaluated at 10% discount rate. Change in Life: The sensitivity of the project towards change in life was checked by keeping discount rate of the project, cash outlay, etc, constant and changing the life to 5, 15 and 20 years and carrying out re-evaluation as done above in our basic project evaluated at 10% discount rate. Results The results are reported in two parts: Information collected about Effluent Treatment Plant and Results of Cost Analysis. Technology of Effluent Treatment Plant

IJISET - International Journal of Innovative Science, Engineering & Technology, Vol. 1 Issue 10, December 2014.
www.ijiset.com
ISSN 2348 – 7968
803
The information gathered about the treatment and disposal of effluent by Haleeb Foods Limited is computed below as descriptive research results. Location of Treatment Plant and Sources of Effluent: The treatment plant is located in the factory at the back of the Warehouse, which in turn is situated at the back of the Production Unit. The production involves the major steps that are Milk Reception, Pumping, Chilling, Storage, Pasteurization, and Storage in Silos, Standardization, Ultra Heat Treatment, Tetrapak Filling, Tray Packing and Storage of Products in Warehouse. There are five major sections from which the effluent drains out and subsequently flows through the pipes to pool up for flowing through the main drain, The five sections that contribute effluent processed in the treatment plant are as under
1. Milk reception and primary cleaning 2. Pasteurization 3. Ultra heating 4. Tetra packing and bottling 5. Powdered milk, cream, butter, and desi ghee
The sewage from the toilets and other household uses is not mixed with the effluent of the processing sections as, its processing is not the demand of the National Environmental Protection Law, It, directly goes to a septic tank from where it drains into a disposal water body.. Composition of the Effluent: The major contributors to the effluent are the operations outlined below, Cleaning of Spillages at the Reception Site: The plant receives milk at the reception site. Some of the milk spills out and falls on floor of the collection area. It is to be thoroughly cleaned as otherwise, it will ferment and will fill the environment with obnoxious gases and will cause many nuisances. Thus, spilled area is washed every four hourly. The major ingredients of the effluent from the cleaning section is the milk spilled on the floor, detergents used for cleaning and any type of dissolved and suspended solids in the milk. The milk contains casein that is a protein as the major component and the fat, which are the major contributors towards effluent. Cleaning of the machinery and equipment operating in different sections: As in case of the reception section, the machinery and equipment is contaminated with the milk being processed and also with some chemicals if used anywhere for cleaning. Thus, the machinery and equipment is also washed after every four hours with detergent and other requisite chemicals and the effluent is drained into the main pipeline. Desludging: The milk is desludged after pasteurization before it is processed further to make cream, butter and desi ghee. The sludge is led into the main drain and thus it is one of the important contributors towards the composition of effluent.
IJISET - International Journal of Innovative Science, Engineering & Technology, Vol. 1 Issue 10, December 2014.
www.ijiset.com
ISSN 2348 – 7968
804
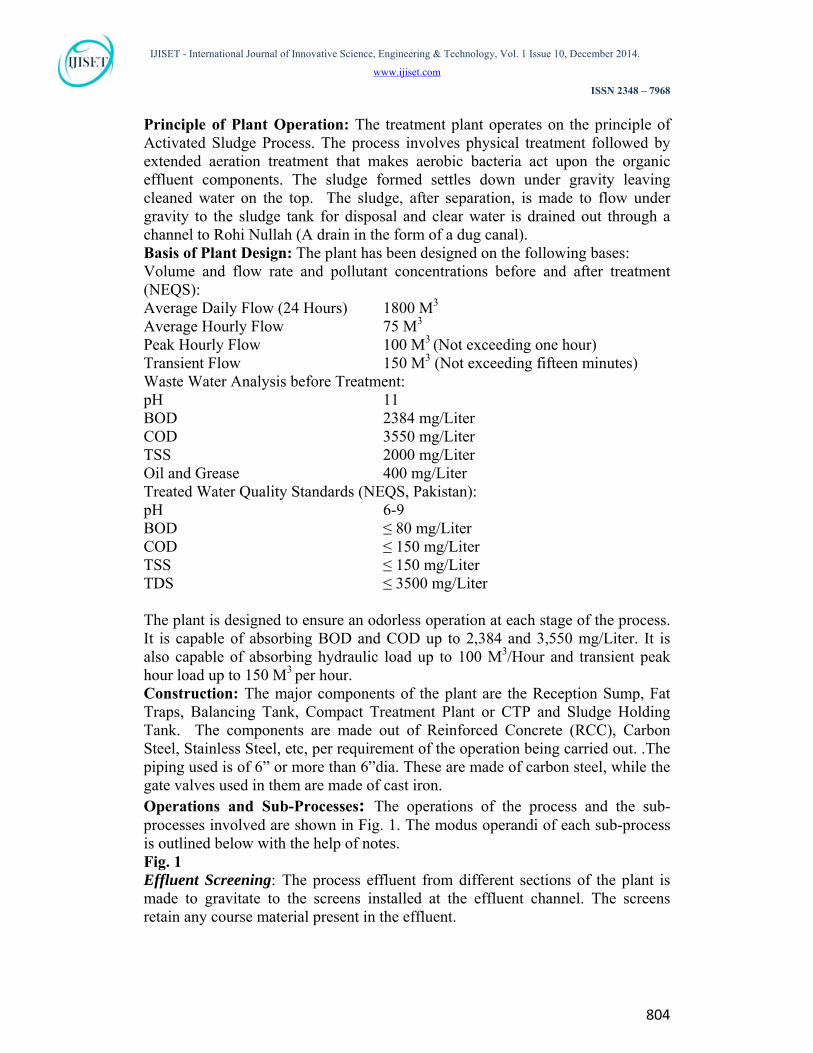
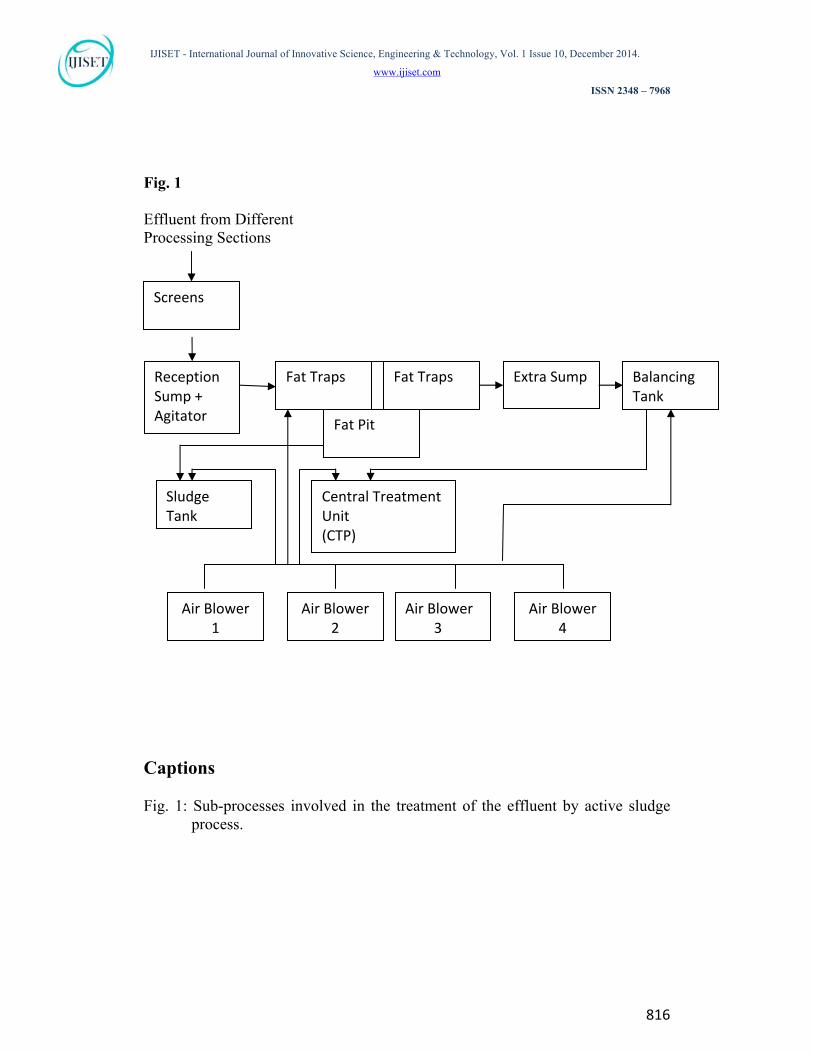
Principle of Plant Operation: The treatment plant operates on the principle of Activated Sludge Process. The process involves physical treatment followed by extended aeration treatment that makes aerobic bacteria act upon the organic effluent components. The sludge formed settles down under gravity leaving cleaned water on the top. The sludge, after separation, is made to flow under gravity to the sludge tank for disposal and clear water is drained out through a channel to Rohi Nullah (A drain in the form of a dug canal). Basis of Plant Design: The plant has been designed on the following bases: Volume and flow rate and pollutant concentrations before and after treatment (NEQS): Average Daily Flow (24 Hours) 1800 M3 Average Hourly Flow 75 M3 Peak Hourly Flow 100 M3 (Not exceeding one hour) Transient Flow 150 M3 (Not exceeding fifteen minutes) Waste Water Analysis before Treatment: pH 11 BOD 2384 mg/Liter COD 3550 mg/Liter TSS 2000 mg/Liter Oil and Grease 400 mg/Liter Treated Water Quality Standards (NEQS, Pakistan): pH 6-9 BOD ≤ 80 mg/Liter COD ≤ 150 mg/Liter TSS ≤ 150 mg/Liter TDS ≤ 3500 mg/Liter The plant is designed to ensure an odorless operation at each stage of the process. It is capable of absorbing BOD and COD up to 2,384 and 3,550 mg/Liter. It is also capable of absorbing hydraulic load up to 100 M3/Hour and transient peak hour load up to 150 M3 per hour. Construction: The major components of the plant are the Reception Sump, Fat Traps, Balancing Tank, Compact Treatment Plant or CTP and Sludge Holding Tank. The components are made out of Reinforced Concrete (RCC), Carbon Steel, Stainless Steel, etc, per requirement of the operation being carried out. .The piping used is of 6” or more than 6”dia. These are made of carbon steel, while the gate valves used in them are made of cast iron. Operations and Sub-Processes: The operations of the process and the sub-processes involved are shown in Fig. 1. The modus operandi of each sub-process is outlined below with the help of notes. Fig. 1 Effluent Screening: The process effluent from different sections of the plant is made to gravitate to the screens installed at the effluent channel. The screens retain any course material present in the effluent.

IJISET - International Journal of Innovative Science, Engineering & Technology, Vol. 1 Issue 10, December 2014.
www.ijiset.com
ISSN 2348 – 7968
805
Reception Sump: The effluent, after passing through the screens gravitates further to an underground RCC reception sump. An acid dozing system and an electrical agitator is installed at the reception sump to adjust pH within 7-8 range that is conducive to the biological treatment. The acid dozing system is composed of pH-Sensor /Indicator/ Controller interlocked with the dozing pump Fat Traps: The effluent from the reception sump, after due treatment, gravitates to the fat traps. Here, the fat and the floating scum are removed with an automatic device. Usually, two underground RCC fat traps are provided out of which one is in operation and the other is a standby. Fat Pit: The fat and scum removed from the effluent in the fat traps is transferred into a fat pit from where it is removed periodically. Balancing Tank: The effluent, after fat and scum removal, gravitates to an aerated balancing tank. The major function of the balancing tank is the homogenization of the mixture to adjust the pH and increase the surface area of the component materials for prompt action of aerobic bacteria in CTP. Compact Treatment Plant: The balanced effluent is then pumped to the compact treatment plant for the activated sludge process with the help of three pumps each rated at 60 M3/hour. The flow is controlled through an electromagnetic flow meter and a manually operated diaphragm control valve. The RCC–CTP provides the required treatment in a single compact unit. It consists of a circular outer shell and a concrete inner tank equipped with slow speed scraper drive system. The outer shell acts as an aerating tank, while the inner one acts as a settling tank. A skimmer is installed at the inner settling tank to remove scum from the surface of water. The aeration is accomplished by means of three Positive Displacement Air Blowers. Of course, two of them are in operation and third is the standby. A baffle wall in the annulus space of the CTP is provided to ensure that the effluent being pumped completes the full circle before being admitted into the inner settlement tank through specially designed pipe work The aerated effluent discharges into a stilling well hung from the overhead walkway. The outward flow from the stilling well causes the heavier sludge particles to settle down, while the clear water overflows into specially constructed RCC channels though a circumferential weir plate. The sludge settled in the central sludge well is expelled outwards through a pipe buried in the bottom of CTP. About 75% of the sludge produced is recycled to aeration chamber with the help of two air lifts for CTP. Sludge Holding Tank: The surplus sludge separated in CTP is driven by gravity into sludge holding tank situated in a place specified for it. It is then pumped to a disposal vehicle such as tractor/ trolley or other for manual disposal. The production of undesirable odors resulting from the fermentation of sludge is controlled by providing aeration in the sludge holding tank. The de-sludging operation is not a routine as it is quite infrequent.
IJISET - International Journal of Innovative Science, Engineering & Technology, Vol. 1 Issue 10, December 2014.
www.ijiset.com
ISSN 2348 – 7968
806
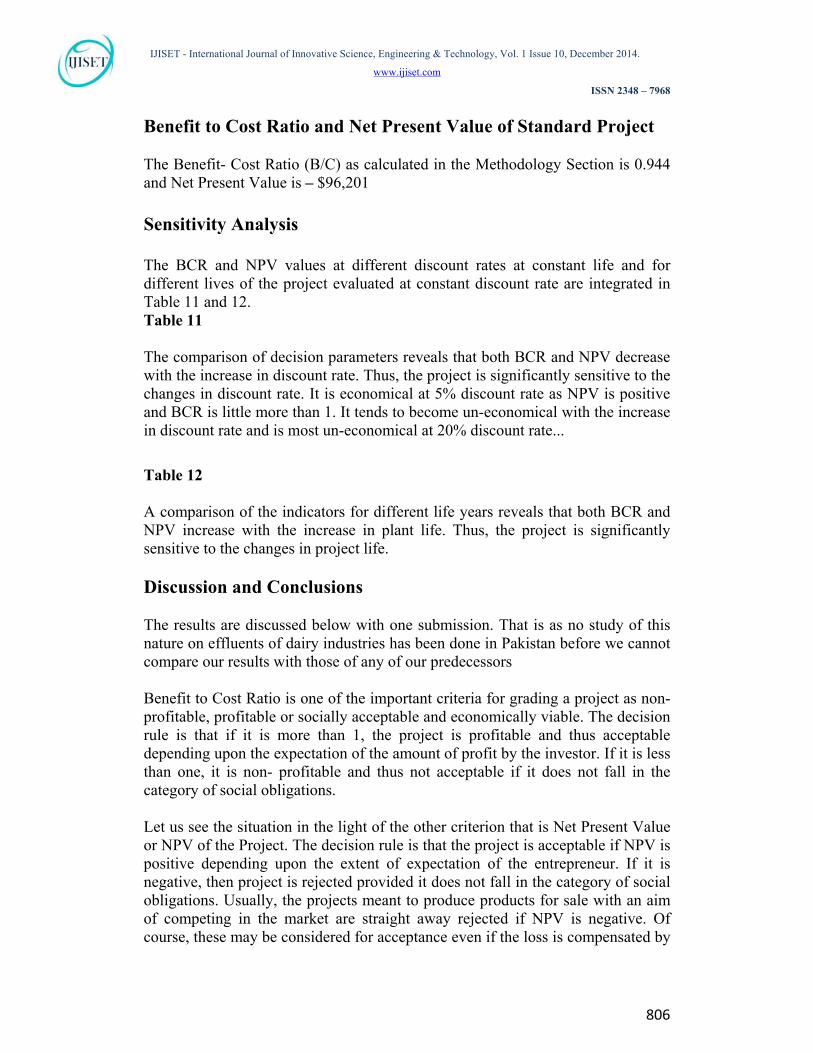
Benefit to Cost Ratio and Net Present Value of Standard Project The Benefit- Cost Ratio (B/C) as calculated in the Methodology Section is 0.944 and Net Present Value is – $96,201 Sensitivity Analysis The BCR and NPV values at different discount rates at constant life and for different lives of the project evaluated at constant discount rate are integrated in Table 11 and 12. Table 11 The comparison of decision parameters reveals that both BCR and NPV decrease with the increase in discount rate. Thus, the project is significantly sensitive to the changes in discount rate. It is economical at 5% discount rate as NPV is positive and BCR is little more than 1. It tends to become un-economical with the increase in discount rate and is most un-economical at 20% discount rate...
Table 12 A comparison of the indicators for different life years reveals that both BCR and NPV increase with the increase in plant life. Thus, the project is significantly sensitive to the changes in project life. Discussion and Conclusions The results are discussed below with one submission. That is as no study of this nature on effluents of dairy industries has been done in Pakistan before we cannot compare our results with those of any of our predecessors Benefit to Cost Ratio is one of the important criteria for grading a project as non-profitable, profitable or socially acceptable and economically viable. The decision rule is that if it is more than 1, the project is profitable and thus acceptable depending upon the expectation of the amount of profit by the investor. If it is less than one, it is non- profitable and thus not acceptable if it does not fall in the category of social obligations. Let us see the situation in the light of the other criterion that is Net Present Value or NPV of the Project. The decision rule is that the project is acceptable if NPV is positive depending upon the extent of expectation of the entrepreneur. If it is negative, then project is rejected provided it does not fall in the category of social obligations. Usually, the projects meant to produce products for sale with an aim of competing in the market are straight away rejected if NPV is negative. Of course, these may be considered for acceptance even if the loss is compensated by

IJISET - International Journal of Innovative Science, Engineering & Technology, Vol. 1 Issue 10, December 2014.
www.ijiset.com
ISSN 2348 – 7968
807
social benefits such as cleanliness of environment, response to a social need if no other appropriate source is available, creation of employment opportunities, etc. The evaluation of Treatment Plant installed by HFL in context of socio-economic profitability, presents B/C Ration slightly less than 1 and NPV that is little negative provided labor and utility costs are added in the expenditure stream over time. Luckily, both parameters do not deviate much from the criteria fixed for decision. Both, roughly, differ by about 5 %. Even, these deviations are eliminated if the labor and utility costs are not added in the main expenditure stream overtime. The BCR becomes 1 and NPV is negligibly small with very small deviation of 0.4%. The inclusion of opportunity cost of land also does not affect the status of the project as the deviation is negligibly small. The results of project sensitivity towards changes in discount rate and plant life are very encouraging. The project is clearly feasible at 5% discount rate as both indicators (Table 11, BCR 1.03 and NPV, +$ 56,338 3) qualify favorable criteria. Pakistan is striving to move toward lower interest as a consequence of its aim at elimination of interest under Islamic Law. The project becomes totally un-economical at 15% and 20% discount rates (Table 11). This is not alarming as there is no likelihood of this height of interest rates in near future of Pakistan. Secondly, it totally suits HFL as it is doing business without interest. At constant discount rate, the increase in both BCR and NPV with the increase in plant life further encourages Pakistani industrialists to opt for these low cost plants as life of machinery and equipment told by the machinery manufacturers is often low as compared to their actual life. Sometimes, it is poles apart. Take the example of vehicles and out of these cars in particular. The manufacturer’s life is five years and some insurance companies actually insure these vehicles at 20% rate of depreciation on the basis of said life. Multiplication of life of cars by 2 is still valid as there are some companies that depreciate them at 10%. A general observation is that well maintained single hand driven cars sometime do well even up to 20 to 25 years. This means that if the industrialists are trained in better maintenance of the effluent disposal plants, these can be highly economical for effluent disposal and refining the environment. Let us now apply it to the current situation. There is no possibility of 5 year life and we did it to complete the evaluation spectrum. Ten year plant life is what the manufacturers tell to the customer. There are better prospects of 15 and 20 or more. The results (Table 12, BCR 1.03 and 1.06, NPV $66,823 and $140,270) provide economic justification of the justification without any reservation. As, the installation of the treatment plant falls in the category of social obligations, over-expectation of returns can be safely put aside if the socio-economic significance of the project is considered in terms of what the Company has achieved as a fruit of fulfilling this social obligation. The achievements of the Company as we view may be as follows:
IJISET - International Journal of Innovative Science, Engineering & Technology, Vol. 1 Issue 10, December 2014.
www.ijiset.com
ISSN 2348 – 7968
808
The Company has implemented the Environment Protection Law of the
Country and has ruled out possibility of any dispute with the Government and law implementing agencies by installing the waste water treatment plant.
The Company, being an early respondent to this social requirement has made a name in implementation of the Environment Protection Rules and Regulations, Thus, Company has earned leadership in the practice of Cleaner Technologies, which is the major objective of Agenda-21 and Sustainable Development.
The Company has done a great service to humanity as it has attempted to make an adequate contribution to the cleanliness of the environment.
The Company has protected the health of its employees and also that of greenery in 37 Acre Plant Area that presents beautiful landscapes,
Finally, the installation has created job opportunities for one Chemical Engineer and four Operators.
Before making any concluding remarks, a few suggestions may be given to improve the B/C ratio and to increase NPV so that the project may become profitable. These are as under: 1. Due to a large number of methodology and processing constraints on
determination of health benefits in terms of pre-mature mortality and morbidity and labor days lost, the social benefits of the project could not be determined. Thus, it is strongly recommended that after development of a standard methodology in the light of the local conditions and environment, the same may be accomplished. It is possible that the B/C ratio may increase significantly. It is also possible that it may even undergo a multiple increase and thus there may be no doubt left in economic and social profitability of the project.
2. Similarly, a detailed economic analysis of different dairy effluent disposal projects in Pakistan may be done and the guidance to this end may be sought from the guidelines provided by National Center for Environmental Economics, US Environmental Protection Agency [12]
3. The fat recovered from the processing of the effluent and being sold at the rate of $0.05 per Kg may be put into a more profitable use. Currently, its sale revenue has been neglected because no quantitative data about its sale was provided. If the Company helps in providing the figures about this minor sale, the same may be included afterwards and cost calculation may be revised after this increment.
4. A feasibility study may be carried to add in the current set up, a sludge processing operation. If feasible, the sludge may be dried for conversion into natural manure that may be sold in the market .It may completely fulfill the fertilizer requirement of the factory landscapes

IJISET - International Journal of Innovative Science, Engineering & Technology, Vol. 1 Issue 10, December 2014.
www.ijiset.com
ISSN 2348 – 7968
809
5. The cleaned water may be supplied to the farmers in the suburbs of the Milk Processing Plant for irrigation of agriculture on nominal charges instead of draining it into Rohi Nullah. If this transaction matures, it may bring significant amount of revenue to the Company.
6. Finally, the Company may engage some Environmental Expert who could work on ‘bettering of the process of treatment’ so that the pollution load after treatment may go further down to lower pollution charge that may, ultimately, translate into enhanced savings.
The main objective of the study was the techno-economic evaluation of the Waste Water Treatment Plant Installed in the Milk Processing Factory of Haleeb Foods Limited, Lahore. On the basis of the requisite information provided by the Officials of the Company, the study concludes that the installation qualifies both socially and economically as it fulfills all the criteria fixed for evaluation with minor deviations that can be eliminated by giving attention to four factors pointed out above. The study gives credit to the Company for taking a lead in the implementation of Environment Protection Rules, Regulations and Laws that will set an example for others to follow. Acknowledgements The author is extremely grateful to Mr. Suleman Daud, Managing Director HFL and his Staff for their full support in the supply of the data essentially required for processing this case. He is especially grateful to Dr. Shahid Amjad Chaudhary, Rector, Lahore School of Economics without whose general and financial support, this study would have been impossible. References
1. The United Nations. 1992. The United Nations Conference on Environment and Development, Rio de Janeiro from 3 to 14 June.1992, Declaration on Environment and Development. habitat.igc.org and www.digital-engine.net
2. COWI Consulting Engineers and Planners AS, Denmark for United Nations Environment Program Division of Technology, Industry and Economics and Danish Environmental protection Agency, Danish Ministry of Environment and Energy. Cleaner Production Assessment in Dairy Processing Purdue Research Foun.1998
3. Purdue Research Foun. Proceedings of the 52nd Purdue Industrial Waste Conference1997 Conference (Purdue Industrial Waste Conference//Proceedings)
4. United States Environmental Protection Agency – (USEPA). !973 www.epa.gov/OWOW/NPS/MMGI/Chapter6/ch6-3b.html
5. KTWMA and UNDP. 2002. Kasur Tanneries Pollution Control Project (A report in summarized form), Kasur Tannery Waste Management Authority, Kasur, Pakistan (Publisher)
6. Khan, MR.2006. Socio-economic Analysis of Kasur Tannery Pollution Control Project. Case 20 in ‘Management Case Studies’, Shukla, B,
IJISET - International Journal of Innovative Science, Engineering & Technology, Vol. 1 Issue 10, December 2014.
www.ijiset.com
ISSN 2348 – 7968
810
Prashar, S and Singh, H (Editors), Amity Business School-AU and Excel Books Put Ltd, Pages 257-273
7. Government of Pakistan. 1997. Pakistan Environmental Protection act 1997. www.cpp.org.pk/legal/ Law-PEPA-1997
8. Kasur Tanneries Water Management Agency.2002. Report on “Kasur Tanneries Pollution Control Project” under UNDP. Published and Available with Proceedings of the International Conference on Pollution Control in Tanning Industry of Pakistan, Naeem Javed and Zaigham Abbas (Editors), KTWMA, Kisser, Pakistan.
9. Asian Development Bank.2001. Guidelines for the Financial Governance and Management of Investment Projects. www.adb.org/Documents/Guidelines/ Fin_Analysis?p=ecopubs
10. Asian Development Bank.2003 Guidelines for the Economic Analysis of Projects. www.adb.org/Documents/Guidelines/Eco_Analysis
11. Pakistan Environmental Protection Agency. Review of Initial Environmental Examination and Environmental Impact Assessment Regulations 2000 (SRO 339 (1) /2000 dated 13 June 2000) http://www.iucn.org/places/pakistan/elaws/PDF/Federal/Chapter-4/4.1%20Legal%20Instruments/4.1.1%20Urban%20and%20Rural%20Development/4.1.1.2%20Pakistan%20---Initial.pdf
12. National Center for Environmental Economics, US Environmental Protection Agency. Economic Analysis of Proposed Effluent Guidelines for the Dairy Processing Industry, Inventory Record #: EE-0362
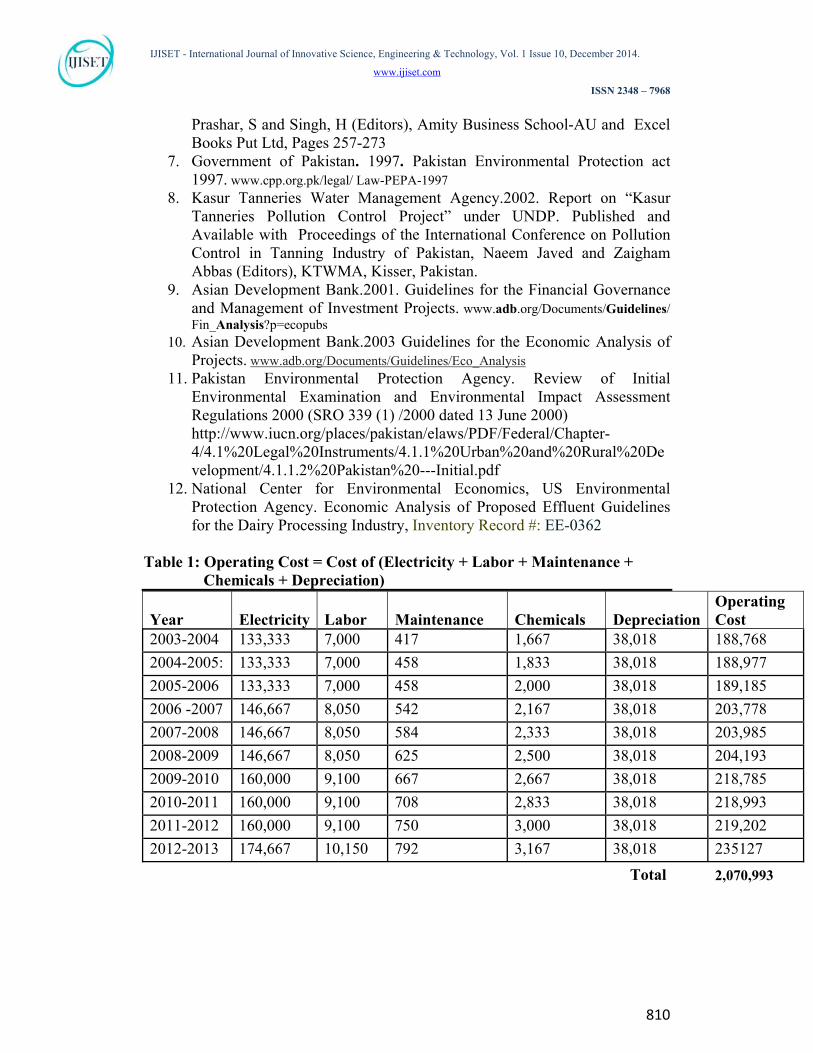
Table 1: Operating Cost = Cost of (Electricity + Labor + Maintenance + Chemicals + Depreciation)
Year Electricity Labor Maintenance Chemicals Depreciation
Operating Cost
2003-2004 133,333 7,000 417 1,667 38,018 188,768
2004-2005: 133,333 7,000 458 1,833 38,018 188,977
2005-2006 133,333 7,000 458 2,000 38,018 189,185
2006 -2007 146,667 8,050 542 2,167 38,018 203,778
2007-2008 146,667 8,050 584 2,333 38,018 203,985
2008-2009 146,667 8,050 625 2,500 38,018 204,193
2009-2010 160,000 9,100 667 2,667 38,018 218,785
2010-2011 160,000 9,100 708 2,833 38,018 218,993
2011-2012 160,000 9,100 750 3,000 38,018 219,202
2012-2013 174,667 10,150 792 3,167 38,018 235127
Total 2,070,993

IJISET - International Journal of Innovative Science, Engineering & Technology, Vol. 1 Issue 10, December 2014.
www.ijiset.com
ISSN 2348 – 7968
811
Table 2: Calculation of chargeable pollution units before treatment of the effluent Waste Water Generation (Q) = 1800 M3/Day, (75 M3 /Hour) Parameters A B C=B-A D E F= Q×E G=
C×F/1000 H=G/D
NEQS-mg/L
Actual Values- mg/L
Charge Values-mg/L
1 Unit (Kg)
W. Days Flow-M3/ Yr
Ann. Pollution-Load (Kg)
Poll. Charge units
COD 150
488 338 50 365 657,000 222,066 4,441
TSS 200
2018 1818 50 365 657,000 1,194,426 23,889
Oil and Greases
10 1255 1245 3 365 657,000 817,965 272,655
Table 3: Pollution charge per unit before treatment Parameters A B
Chargeable Pollution Pollution Charge Pollution Charge Units $/Unit -Year 1 $/Unit- Year 2---10
COD 4,441 0.83 0.83 TSS 23,889 0.83 0.83 Oil and Greases 272,655 0.83 0.83 Total 300,985 2.50 3,75
Table 4: Year wise pollution charges before waste water treatment-Dollars Parameter Base
Year Year 1 Year 2 Year 3 Year 4
C = A×B D = C×0.1 E=A×75×0..2 F=A×75×0.4 G=A×75×0..6
Dollars Dollars Dollars Dollars Dollars
COD 3,701 370 1,110 2,221 3,331
TSS 19,907 1,991 5,972 11,945 17,917
Oil &Gr. 227,213 22,721 68,164 136,328 204,491
Total 250,820 25,082 75,246 150,493 225,739

IJISET - International Journal of Innovative Science, Engineering & Technology, Vol. 1 Issue 10, December 2014.
www.ijiset.com
ISSN 2348 – 7968
812
Table 4 (Continued): Year wise pollution charges before waste water treatment
Year 5 Year 6 Year 7 Year 8 Year 9 Year 10
H= A×75×0.8
I= A×75×1 J=A×75×1 J=A×75×1 J=A×75×1 J=A×75×1
Dollars Dollars Dollars Dollars Dollars Dollars
4,441 5,551 5,551 5,551 5,551 5,551
23,889 29,861 29,861 29,861 29,861 29,861
272,655 340,819 340,819 340,819 340,819 340,819
300,985 376,231 376,231 376,231 376,231 376,231
Table 5: Calculation of chargeable pollution units after the treatment of the effluent Waste Water Generation (Q) = 1800 M3/Day, (75 M3 /Hour) Parameters A B C=B-A D E F= Q×E G=
C×F/1000 H=G/D
NEQS-mg/L
Actual Values- mg/L
Charge Values-mg/L
1 Unit (Kg)
W. Days Per Year
Flow-M3/ Yr
Ann. Pollution-Load (Kg)
Poll. Charge Units
COD 150
165 15 50 365 657,000 9,855 197
TSS 200
342 142 50 365 657,000 93,294 1,866
Oil and Greases
10 61 51 3 365 657,000 33,507 11,169
Table 6: Pollution charge per unit after treatment Parameters A B
Chargeable Pollution Pollution Charge Pollution Charge Units $/Unit -Year 1 $/Unit- Year 2---10
COD 197 0.83 0.83 TSS 1866 0.83 0.83 Oil and Greases 11,169 0.83 0.83 Total 13,262 2.50 3,75
IJISET - International Journal of Innovative Science, Engineering & Technology, Vol. 1 Issue 10, December 2014.
www.ijiset.com
ISSN 2348 – 7968
813
Table 7: Year wise pollution charges after waste water treatment- Dollars Parameter Base
Year Year 1 Year 2 Year 3 Year 4
C = A×B D = C×0.1 E=A×75×0..2 F=A×75×0.4 G=A×75×0..6
Dollars Dollars Dollars Dollars Dollars
COD 164 16 49 99 148
TSS 1,555 156 467 933 1,400
Oil &Gr. 9,308 931 2,792 5,585 8,377
Total 11,027 1,103 3,308 6,616 9,924
Table 7(Continued): Year wise pollution charges after waste water treatment Year 5 Year 6 Year 7 Year 8 Year 9 Year 10
H= A×75×0.8
I= A×75×1 J=A×75×1 J=A×75×1 J=A×75×1 J=A×75×1
Rupees Rupees Rupees Rupees Rupees Rupees
197 246 246 246 246 246
1,866 2,333 2,332 2,332 2,332 2,332
11,169 13,961 13,961 13,961 13,961 13,961
13,232 16,540 16,540 16,540 16,540 16,540
Table 8: Comparison of the pollution charges (Dollars) in different years before and after treatment Base 1 2 3 4 Before 250,820 25,082 75,246 150,493 225,739
After 11,027 1,103 3,308 6,616 9,924
Savings 239,794 23,979 71,938 143,877 215,815
Table 8 (Continued) 5 6 7 8 9 10 300,985 376,231 376,231 376,231 376,231 376,231
13,232 16,540 16,540 16,540 16,540 16,540
287,753 359,691 359,691 359,691 359,691 359,691
IJISET - International Journal of Innovative Science, Engineering & Technology, Vol. 1 Issue 10, December 2014.
www.ijiset.com
ISSN 2348 – 7968
814
Table 9: Present Values of Operating Costs Years Future Values Discount Factor Present Values
(Dollars) (Dollars)
Base Nil
2003-2004 188,768 0.909091 171,608
2004-2005 188,977 0.826446 156,179
2005-2006 189,185 0.751315 142,138
2006-2007 203,778 0.683013 139,183
2007-2008 203,985 0.620921 #VALUE!
2008-2009 204,193 0.564474 115,262
2009-2010 218,785 0.513158 112,271
2010-2011 218,993 0.466507 102,162
2011-2012 219,202 0.424098 92,963
2012-2013 235,127 0.385543 90,651
Total Present Value of the Operating Cost 1,249,075
Present Value of Operating Cost = $1,249,075 PV of Cash Outlay = $(463,517 +1,249,075) = $1,712,592 Table 10: Present Values of Savings Years Future Values Discount Factor Present Values
(Dollars) (Dollars)
Base 239,794
2003-2004 23,979 0.909091 21,799
2004-2005 71,938 0.826446 59,453
2005-2006 143,877 0.751315 108,097
2006-2007 215,815 0.683013 144,071
2007-2008 287,753 0.620921 178,672
2008-2009 359,691 0.564474 203,036
2009-2010 359,691 0.513158 184,578
2010-2011 359,691 0.466507 167,798
2011-2012 359,691 0.424098 152,544
2012-2013 359,691 0.385543 138,676
Total Present Value of Savings 1,598,520
IJISET - International Journal of Innovative Science, Engineering & Technology, Vol. 1 Issue 10, December 2014.
www.ijiset.com
ISSN 2348 – 7968
815
Present Value of Cash Flows (Benefits) =$(1,598,520+ 17,871) = $1,616,391
Net Present Value = $(--1,712,592+ 1,616,391) = --$96,201
Table 11: NPV & BCR at Different Discount Rates for 10 Year Life Years 5 % 10 % 15% 20 %
Annuities of 1 for 10 Year
7.72173 6.14457 5.01877 4.19247
P.V of Benefits-$ 2,103,728 1,616.391 1,290,123 1,052,293 P.V of Costs-$ 2,047,390 1,712,592 1,445,424 1,302,619
NPV-$ 56,338 - 96,201 -155,301 -250,326 BCR 1.03 0.94 0.89 0.81
Table 12: NPV and BCR at Different Discount Rates of 10% for 5, 10,15 and 20 Years Life Years 5 Years 10 Years 15 Years 20 Years
Annuities of 1 Over- time
3.790787 6.14457 7.606080 8.513564
P.V of Benefits-$ 780,666 1,616.391 2,135,308 2,457,512 P.V of Costs-$ 1,199,283 1,712,592 2,068,485 2,317,242
NPV-$ -418616 - 96,201 66,823 140,270 BCR 0.651 0.94 1.03 1.06
IJISET - International Journal of Innovative Science, Engineering & Technology, Vol. 1 Issue 10, December 2014.
www.ijiset.com
ISSN 2348 – 7968
816
Fig. 1 Effluent from Different Processing Sections
Captions Fig. 1: Sub-processes involved in the treatment of the effluent by active sludge process.
Extra Sump
Central Treatment Unit (CTP)
Reception Sump + Agitator
Fat Traps
Fat Pit
Fat Traps
Sludge Tank
Screens
Balancing Tank
Air Blower 1
Air Blower 2
Air Blower 4
Air Blower 3
IJISET - International Journal of Innovative Science, Engineering & Technology, Vol. 1 Issue 10, December 2014.
www.ijiset.com
ISSN 2348 – 7968
817
APPENDIX (Supporting Tables: Not for Printing) Note: Please delete the references to these tables from the text before printing Table A: List of Equipment of the Waste Water Treatment Plant S.N. Item Description Qty Manufacturer Capacity Load 1 Blowers 3 Hick Har Graves ,
England 2750 m3
1480 rpm 75 KW
2 Pumps (ES) 3 KSB, Pakistan 100 m3/hr 1450 rpm
10 HP
3 Pumps (BT) 3 KSB, Pakistan 60 m3/hr 1420 rpm
3 HP
4 Pump 1 Lowara, Italy 50-54 m3/hr 3.97 HP 5 Agitator 1 Local 4 KW 6 Surface Skimmer 1 Local (CPT) 0.75 KW 7 Flow Meter 1 Denfos 8 Acid Dozing Pump 1 Piston Metering
Pump, Italy
9 Fat Skimmer 1 Local 20 – 30 rpm 0.75 KW Table B: Environmental Laboratory Equipment, S.N. Item Description Make Cost- Rupees 1 pH Meter Hanna Total Cost of
Equipment = $10,833 Cost of Civil Works = $2,500 Total = $13,333
2 DO Meter HACH 3 BOD Incubator HACH 4 COD Reactor HACH 5 Spectrophotometer HACH 6 Desiccators 7 Separating Funnels 8 Oven (150oC 9 Pipettes (2,5,10 ml) 10 Beakers (100,500 & 1000ml) 11 Measuring Cylinders-1000ml 12 Thermometers
IJISET - International Journal of Innovative Science, Engineering & Technology, Vol. 1 Issue 10, December 2014.
www.ijiset.com
ISSN 2348 – 7968
818
Table C: Installed Electric Load (IEL) S. N
Item Description Installed Load - KW Qty Total Load- KW
1 Blowers 75 3 225 2 KSB Pumps (Extra Sumps) 7.5 3 22.5 3 KSB-Pumps(Balance Tank) 2,87 3 7.11 4 Sludge Pump 3,97 1 3.97 5 Agitator 4 1 4 6 Surface Skimmer (CTP) 0.75 1 0.75 7 Fat Skimmer 0.75 1 0.75 8 Acid Dozing Pump 0.5 1 0.5 Table D: Total Operational Electrical Load per Day in KW S.N Item
Description Installed Load Actual Load- 85 %
of IEL Qty Hrs Total
1 Blowers
75 63.75 3 24 4590
2 KSB Pumps (Extra Sumps)
7.5 6.375 1 24 153
3 KSB Pumps (Balance Tank)
2.37 2.0145 2 24 96, 696
4 Sludge Pump
3.97 3.3745 0 0 0
5 Agitator
4 3.4 0 0 0
6 Surface Skimmer (CTP)
0.75 0.6375 1 24 0
7 Fat Skimmer
0.75 0.6375 1 24 153
8 Acid Dozing Pump
0.5 0. 425 0 0 0
Total Load per Day = 4870.296 Total Cost per Day = $365,272