ISSN 2094-6198 - psa.gov.ph · Production, Area and Number of Mature Trees . Abaca October-December...
21
ISSN 2094-6198
Transcript of ISSN 2094-6198 - psa.gov.ph · Production, Area and Number of Mature Trees . Abaca October-December...

ISSN 2094-6198

Explanatory Notes
The Non-Food and Industrial Crops Quarterly Bulletin provides
updates on production of major non-food and industrial crops namely,
abaca, coconut, coffee, rubber, sugarcane and tobacco. These crops are
highlighted in the report on the Performance of Agriculture which is
released quarterly by the Bureau of Agricultural Statistics (BAS).
This 4th quarter 2011 issue of the Bulletin presents the final
estimates of production and area planted for permanent crops and
area harvested for temporary crops in July-December 2011 and
preliminary estimates of production in October-December 2011. The
data on area and bearing trees are reported on a semi-annual basis.
Data on area, production and number of bearing trees are based on
the Quarterly Crop Production Survey (CrPS) of the BAS and the
Quarterly Coconut Production Survey (QCPS) of the Philippine
Coconut Authority (PCA) and BAS. Data on canes milled are from the
Sugar Regulatory Administration (SRA).
i

Figure 1. Abaca Production by Region, Philippines, October-December 2011
1
Production, Area and Number of Mature Trees Abaca October-December 2011 • During the October-December period, abaca fiber production was
estimated at 14.68 thousand mt or 0.53 percent above last year’s production of 14.60 thousand mt (Table 1).
• Abaca production in Bicol Region continued to improve. Total regional output increased by 183.28 mt or by 10.49 percent compared to the same period in 2010.
• The replanting program of the Department of Agriculture (DA) and the local government unit in Aklan helped boost production in Western Visayas
• Region VIII (Eastern Visayas) recorded the highest production at 4.56 thousand mt which accounted for 31.04 percent of the total abaca fiber output of the country during the period. This was followed by Region V (Bicol Region) with production of 4.04 thousand mt or 27.51 percent share and Region XI (Davao Region) with 2.05 thousand mt or 13.97 percent share (Figure 1).
• Leyte, Southern Leyte and Davao Oriental were beset by bunchy tops. • In Davao del Sur, frequent rains affected drying of abaca fibers which
caused inferior quality of the production.
January-December 2011 • Annual production of abaca fiber increased by 2.70 percent from 66.51
thousand mt in 2010 to 68.31 thousand mt in 2011 (Table 1). • Area planted increased by 1.33 percent, from 135.09 thousand ha in
2010 to 136.89 ha in 2011 (Table 2). • Bicol Region had the largest share of 33.15 percent in the national
production of abaca. Other top ranking regions were Eastern Visayas and Davao Region with shares of 29.31 percent and 13.29 percent, respectively (Table 3).
2
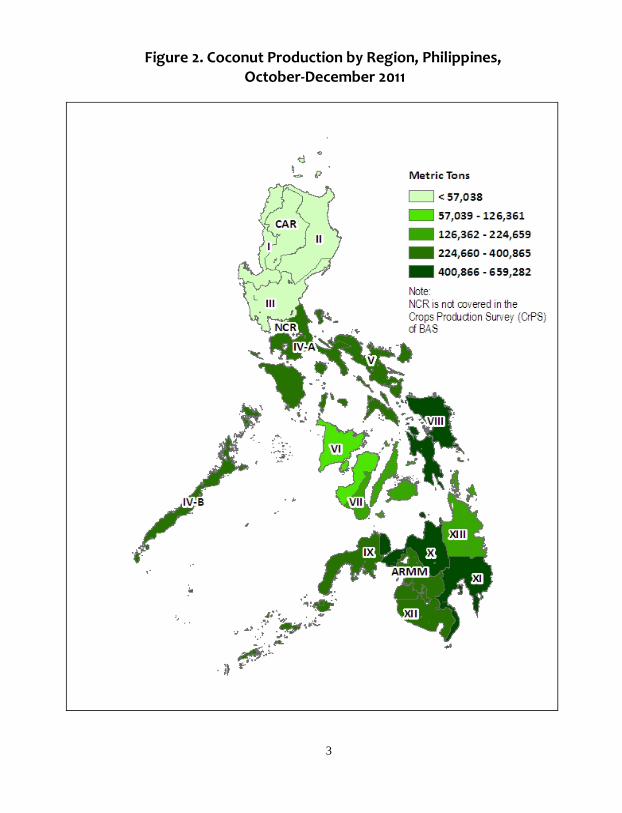
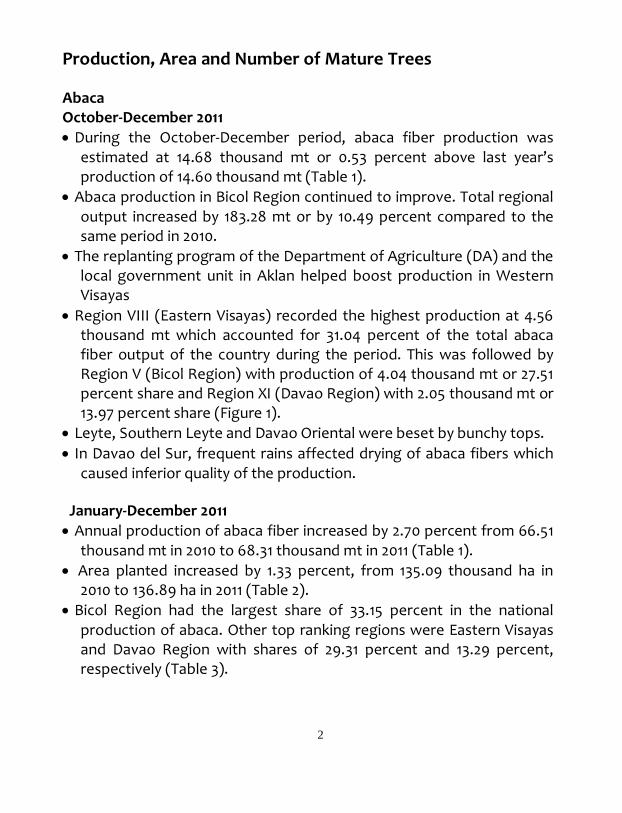
Figure 2. Coconut Production by Region, Philippines, October-December 2011
3

Coconut October-December 2011 • Total production of coconut reached 4.17 million mt in October-
December 2011. This was 1.3o percent more than the 4.11 million mt output in 2010.
• Coconut trees had recovered from the adverse effects of the dry spell in 2010.
• Although production of young nuts declined by 1.71 percent, that of mature coconut was 1.36 percent more than the output in October-December, 2010 (Table 1).
• The increase in production of mature nuts was also attributed to the salt fertilization program and the disease control intervention of PCA. The high price of copra also induced harvesting.
• Preference for mature nuts led to the drop in production of young nuts or buko in Zamboanga Peninsula, SOCCSKSARGEN and Caraga.
• The top coconut producers were Region IV-A (CALABARZON), Region VIII (Eastern Visayas), Region IX (Zamboanga Peninsula), Region X (Northern Mindanao) and Region XI (Davao Region) (Figure 2).
• Frequent rains in Davao del Norte and the adverse effects of typhoons Pedring and Quiel in Isabela, Quirino and Aurora caused the production decline in these provinces.
January-December 2011 • Coconut production in 2011 dropped by 1.95 percent to 15.21 million mt
from 15.51 million mt in 2010 (Table 1). • Area planted to coconut declined by 0.38 percent (Table 2). • Number of bearing trees also went down by 0.34 percent. • Production of both mature and young coconut decreased continuously
in the first 3 quarters of the year. This was the result of the El Nino phenomenon that was experienced in the first six (6) months of 2010.
• The top producing regions in 2011 with their shares in the national output were Davao Region, 17.17 percent; Eastern Visayas, 11.64 percent; Northern Mindanao, 11.47 percent; Zamboanga Peninsula, 10.16 percent; and CALABARZON , 9.15 percent (Table 4).
4
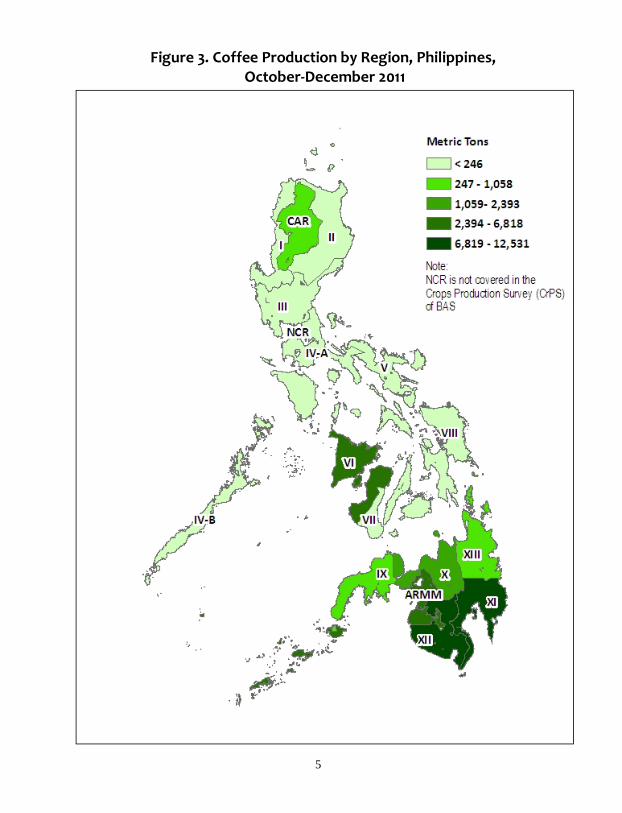
Figure 3. Coffee Production by Region, Philippines, October-December 2011
5

Coffee October-December 2011 • The 4th quarter 2011, coffee production of all varieties reached 39.54
thousand mt. This was 4.32 percent lower than the 41.33 thousand mt output in 2010.
• Strong winds brought about by typhoons Mina, Pedring and Quiel aborted development of berries in Benguet and La Union.
• Frequent rains adversely affected production in Sultan Kudarat. • Land use conversion for residential use in Tugbok and Toril led to the
decreases in area and bearing trees in Davao City. • There were reports of crop shifting to señorita banana in Compostela
Valley and to rubber in Zamboanga Sibugay. • Region Xl (Davao Region), Region Xll (SOCCSKSARGEN) and ARMM
remained the top producers during the period (Figure 3). January-December 2011 • Coffee production in 2011 declined by 6.40 percent (Table 5). • Area planted and number of bearing trees also declined by 1.43
percent and 1.34 percent, respectively. • Robusta remained
the major variety with 71.12 percent share in the 2011 production (Figure 4).
• The top producers of coffee in 2011 were SOCCSKSARGEN, Davao Region and ARMM with respective shares in the national production of 30.94 percent, 23.13 percent and 12.31 percent (Table 5).
6

Figure 5. Rubber Production by Region, Philippines, October-December 2011
7

Rubber October-December 2011 • Production of rubber in the 4th quarter of 2011 was 159.30 thousand
mt. This was 11.56 percent more than the 142.79 thousand mt output in 2010 (Table 1).
• Expansion program in the past had resulted in more mature tappable trees.
• The top producers during the period were Region iX (Zamboanga Peninsula0, Region X (Northern Mindanao) and Region Xll (SOCCSKSARGEN) (Figure 4).
January-December 2011 • Production of rubber was estimated at 425.69 thousand mt in 2011.
This was 7.71 percent more than previous year’s level of 395.24 thousand mt (Table 1).
• Number of mature or tappable trees in 2011 was 42.06 million trees or 6.84 percent more than the 39.37 million trees in 2010
• Area planted to rubber expanded by 16.41 percent to 161.47 thousand hectares from 138.71 thousand hectares in 2010 (Table 2).
• The top rubber producing regions in 2011 were Zamboanga Peninsula. SOCCSKSARGEN and ARMM with respective contributions of 44.38 percent, 37.35 percent and 8.37 percent to the yearly production (Table 6). The combined production of these regions accounted for 90.10 percent of the country’s rubber production.
8

Figure 7. Sugarcane Production by Region, Philippines, October-December 2011
9

Sugarcane October-December 2011 • In the 4th quarter of 2011, production of sugarcane went up by 24.26
percent (Table 1). • Visayas and Mindanao stepped up production during the period. • Higher fertilization rate was reported in Central Visayas. • Sugarcane harvests intended for ethanol were processed as sugar in
Negros Occidental and Negros Oriental due to high price of sugar. • There was less processing of panocha/muscovado due to low export
demand in Negros Occidental. • Low market demand for sugarcane for chewing and lack of planting
material caused production to drop by 10.15 percent. • Production of basi/vinegar had increased due to sufficient rainfall in
Ilocos Norte and the result of the One Town, One Product Program of Santiago City.
• The top producers were Region lll (Central Luzon), Region Vl (Western Visayas), Region Vll (Central Visayas) and Region X (Northern Mindanao) (Figure 5).
• Most of the harvested sugarcane were processed as sugar (Figure 7).
January-December 2011 • Production of sugarcane in 2011 was recorded at 28.38 million mt or
58.27 percent more than the output in 2010. • Area harvested increased by 20.27 percent to 426.82 thousand ha from
354.88 thousand ha in 2010 (Table 2). • The top producing regions were Western Visayas which shared 54.34
percent of the total national output. Other top producing regions were Northern Mindanao and Central Visayas with respective shares of 17.16 percent and 8.87 percent.
10

Figure 9. Tobacco Production by Region, Philippines, October-December 2011
11

Tobacco October-December 2011 • Tobacco production in the 4th quarter of 2011 was recorded only for the
Native variety since Virginia and Other varieties were still at their planting stages.
• Production of Native tobacco dropped by 36.37 percent to 209 mt from 329 mt output in 2010 (Table 1).
• Eighty two (82) percent of the national production during the period came from Region X (Northern Mindanao) particularly in the province of Misamis Oriental (Figure 9).
• Low price of native tobacco caused production to decrease in Northern Mindanao by 40.00 percent.
January-December 2011 • Tobacco production increased by 10.89 percent to 44.94 thousand mt
in 2011 from 40.53 thousand mt in 2010 (Table 8). • In 2011, Virginia was the major variety of tobacco produced with a
share 47.72 in the national production (Figure 10).
• Area harvested to tobacco increased by 8.51 percent to 32.24 thousand ha in 2011 from 29.71 thousand ha in 2010 (Table 2).
• Ilocos Region and Cagayan Valley were the major producing regions. Their combined production accounted for 94.45 percent of the country’s tobacco production during the quarter.
12

Tables

Oct-Dec Jan-Dec2010 2011P 2010 2011P 2011P/2010 2011P/2010
Abaca 14,598 14,676 66,512 68,307 0.53 2.70 Coconut 4,112,587 4,165,979 15,510,283 15,207,176 1.30 (1.95) Matured 4,024,607 4,079,503 15,192,962 14,897,209 1.36 (1.95) Young 87,979 86,476 317,321 309,967 (1.71) (2.32) Coffee 41,325 39,540 94,536 88,484 (4.32) (6.40) Arabica 9,267 8,895 19,421 19,003 (4.02) (2.15) Excelsa 1,877 1,823 6,354 5,920 (2.90) (6.82) Liberica 342 356 639 634 4.02 (0.64) Robusta 29,838 28,467 67,928 62,926 (4.60) (7.36) Others 1 - 195 - (100.00) (100.00) Rubber 142,791 159,296 395,237 425,691 11.56 7.71 Sugarcane (cane) for: 6,548,661 8,137,337 17,929,269 28,376,542 24.26 58.27 Centrifugal sugar 6,488,700 8,077,790 17,579,355 28,150,186 24.49 60.13 Ethanol - - 118,623 - (100.00) Panocha/muscovado 59,435 59,054 225,450 220,740 (0.64) (2.09) Chewing 416 374 1,373 1,241 (10.15) (9.58) Basi/Vinegar 110 119 4,468 4,375 8.23 (2.08) Tobacco 329 209 40,530 44,944 (36.37) 10.89 Native 329 209 10,765 11,546 (36.37) 7.25 Virginia 18,839 21,447 13.84 Others 10,925 11,952 9.39
P-Preliminary
Table 1. Non-Food and Industrial Crops: Production (mt), Philippines, October-December and January-December, 2010-2011P
% ChangeCrop October-December January-December
Production (mt)
14

July-Dec Jan-Dec2011P/2010 2011P/2010
Area (has)
Abaca 133,180 134,984 135,090 136,891 1.35 1.33 Coconut 3,558,608 3,561,463 3,575,944 3,562,493 0.08 (0.38) Coffee 121,264 117,676 121,399 119,666 (2.96) (1.43) Arabica 19,597 19,296 19,622 19,387 (1.54) (1.20) Excelsa 9,525 9,032 9,576 9,140 (5.17) (4.56) Liberica 1,399 1,371 1,410 1,378 (2.01) (2.22) Robusta 90,281 87,977 90,320 89,760 (2.55) (0.62) Others 462 471 (100.00) (100.00) Rubber 138,710 155,075 138,710 161,465 11.80 16.41 Sugarcane (cane) for: 114,204 122,514 354,878 426,818 7.28 20.27 Centrifugal sugar 112,002 120,338 347,936 422,404 7.44 21.40 Ethanol 600 500 2,975 500 (16.67) (83.19) Panocha/muscovado 1,546 1,619 3,740 3,696 4.74 (1.17) Chewing 48 49 105 100 2.15 (4.60) Basi/Vinegar 8 8 122 118 - (3.68) Tobacco 476 358 29,707 32,235 (24.68) 8.51 Native 476 358 7,143 7,965 (24.68) 11.51 Virginia 17,392 18,731 #DIV/0! 7.70 Others 5,172 5,539 #DIV/0! 7.09
Bearing Trees
Coconut 340,982,403 339,168,015 341,020,368 339,849,517 (0.53) (0.34) Coffee 83,844,683 80,784,017 84,544,625 83,408,718 (3.65) (1.34) Arabica 13,877,759 13,698,072 13,999,774 13,764,623 (1.29) (1.68) Excelsa 5,786,639 5,563,691 5,897,929 5,686,817 (3.85) (3.58) Liberica 926,601 910,914 933,034 916,061 (1.69) (1.82) Robusta 63,031,713 60,611,340 63,488,968 63,041,216 (3.84) (0.71) Others 221,970 - 224,920 - (100.00) (100.00) Rubber 39,366,822 42,052,421 39,369,228 42,063,021 6.82 6.84
P-Preliminary
Table 2. Non-food and Industrial Crops: Area in Hectares and Number of Bearing Trees, Philippines, July-December and January-December 2010-2011P
2010 2011P
July-December January-December
2010 2011PCrop
% Change
15

October-December and January-December, 2010-2011P
Oct-Dec Jan-Dec2010 2011P 2010 2011P 2011P/2010 2011P/2010
PHILIPPINES 14,598 14,676 66,512 68,307 0.53 2.70
CAR 4 4 13 13 (4.60) (2.17) Ilocos Region - - - - #DIV/0! #DIV/0!Cagayan Valley - - - - #DIV/0! #DIV/0!Central Luzon 25 34 109 111 36.00 1.46 CALABARZON 1 1 2 4 85.71 77.68 MIMAROPA 12 16 77 89 34.87 15.73 Bicol Region 3,654 4,037 20,264 22,645 10.49 11.75 Western Visayas 371 589 1,492 1,894 58.48 26.92 Central Visayas 36 80 332 397 120.44 19.48 Eastern Visayas 4,721 4,555 20,326 20,023 (3.51) (1.49) Zamboanga Peninsula 66 232 231 631 251.03 173.11 Northern Mindanao 447 453 1,768 1,825 1.39 3.22 Davao Region 2,757 2,050 10,242 9,076 (25.63) (11.38) SOCCSKSARGEN 213 190 828 815 (10.80) (1.64) Caraga 1,232 1,286 6,059 5,898 4.36 (2.65) ARMM 1,059 1,149 4,768 4,886 8.51 2.49
P-Preliminary
Table 3. ABACA : Volume of Production, by Region, Philippines,
RegionProduction (mt) % Change
October-December January-December
Oct-Dec Jan-Dec2010 2011P 2010 2011P 2011P/2010 2011P/2010
PHILIPPINES 4,112,587 4,165,979 15,510,283 15,207,176 1.30 (1.95)
CAR 286 280 914 907 (2.43) (0.74) Ilocos Region 11,451 11,961 37,379 38,476 4.45 2.94 Cagayan Valley 13,566 13,447 67,320 59,761 (0.88) (11.23) Central Luzon 60,825 57,038 210,442 212,648 (6.23) 1.05 CALABARZON 344,087 360,965 1,394,638 1,390,854 4.91 (0.27) MIMAROPA 302,334 351,573 659,219 712,900 16.29 8.14 Bicol Region 343,594 348,258 1,269,538 1,199,154 1.36 (5.54) Western Visayas 116,232 120,134 472,745 461,450 3.36 (2.39) Central Visayas 132,534 126,362 429,717 438,267 (4.66) 1.99 Eastern Visayas 477,056 474,520 1,769,082 1,769,952 (0.53) 0.05 Zamboanga Peninsula 427,918 400,865 1,713,018 1,544,331 (6.32) (9.85) Northern Mindanao 447,374 457,936 1,757,165 1,745,011 2.36 (0.69) Davao Region 643,437 659,282 2,635,867 2,610,609 2.46 (0.96) SOCCSKSARGEN 212,503 224,660 864,270 874,189 5.72 1.15 Caraga 245,351 219,034 974,213 879,400 (10.73) (9.73) ARMM 334,038 339,666 1,254,755 1,269,268 1.68 1.16
P-Preliminary
Table 4. COCONUT: Volume of Production, by Region, Philippines, October-December and January-December, 2010-2011P
RegionProduction (mt)
October-December January-December% Change
16

Oct-Dec Jan-Dec2010 2011P 2010 2011P 2011P/2010 2011P/2010
PHILIPPINES 41,325 39,540 94,536 88,484 (4.32) (6.40)
CAR 1,037 1,058 5,608 5,627 2.03 0.34 Ilocos Region 56 42 106.59 94.34 (25.00) (11.49) Cagayan Valley 1,040 1,012 - (2.70) Central Luzon 118 115 1,768 1,699 (2.37) (3.94) CALABARZON 272 247 8,764 5,550 (9.43) (36.68) MIMAROPA 88 85 204 200 (3.30) (2.20) Bicol Region 181 180 336 327 (0.37) (2.70) Western Visayas 4,442 4,627 5,625 5,916 4.18 5.16 Central Visayas 68 69 213 234 2.36 9.64 Eastern Visayas 82 79 212 201 (3.81) (5.27) Zamboanga Peninsula 514 494 1,202 1,025 (3.90) (14.75) Northern Mindanao 2,439 2,394 5,957 5,858 (1.85) (1.66) Davao Region 11,455 10,190 22,682 20,465 (11.04) (9.77) SOCCSKSARGEN 13,308 12,531 27,761 27,379 (5.84) (1.38) Caraga 627 612 2,252 2,008 (2.48) (10.84) ARMM 6,639 6,818 10,803 10,890 2.70 0.80
P Preliminary
Table 5. COFFEE: Volume of Production, by Region, Philippines, October-December and January-December, 2010-2011P
RegionProduction (mt) % Change
October-December January-December
Oct-Dec Jan-Dec2010 2011P 2010 2011P 2011P/2010 2011P/2010
PHILIPPINES 142,791 159,296 395,237 425,691 11.56 7.71
CARIlocos RegionCagayan ValleyCentral LuzonCALABARZON 4 5 12 27 42.50 117.24 MIMAROPA 5 8 24 37 44.95 50.04 Bicol RegionWestern VisayasCentral VisayasEastern VisayasZamboanga Peninsula 70,304 82,989 171,126 188,921 18.04 10.40 Northern Mindanao 3,567 4,613 10,199 10,718 29.32 5.09 Davao Region 3,607 3,661 15,795 16,110 1.50 1.99 SOCCSKSARGEN 58,717 60,535 149,965 158,996 3.10 6.02 Caraga 2,570 3,103 14,619 15,248 20.72 4.30 ARMM 4,017 4,382 33,497 35,635 9.11 6.38
P Preliminary
Table 6. RUBBER: Volume of Production, by Region, Philippines, October-December and January-December, 2010-2011P
RegionProduction (mt) % Change
October-December January-December
17

Oct-Dec Jan-Dec2010 2011P 2010 2011P 2011P/2010 2011P/2010
PHILIPPINES 6,548,661 8,137,337 17,929,269 28,376,542 24.26 58.27
CAR 38 36 6,992 7,977 (3.61) 14.08 Ilocos Region 1,157 1,160 19,614 18,613 0.21 (5.10) Cagayan Valley 54 101 181,546 176,322 87.85 (2.88) Central Luzon 379,269 273,521 840,863 998,978 (27.88) 18.80 CALABARZON 134,067 324,793 1,665,807 2,132,415 142.26 28.01 MIMAROPA - - - - - - Bicol Region 10,051 10,353 224,001 306,049 3.00 36.63 Western Visayas 4,842,078 5,580,568 9,778,749 15,418,669 15.25 57.68 Central Visayas 293,913 503,250 1,497,817 2,516,978 71.22 68.04 Eastern Visayas 78,535 81,043 352,949 516,706 3.19 46.40 Zamboanga Peninsula 102 82 368 357 (19.08) (3.13) Northern Mindanao 676,909 1,120,587 2,549,197 4,870,725 65.54 91.07 Davao Region 24,641 143,143 256,802 535,122 480.92 108.38 SOCCSKSARGEN 90,913 88,202 505,692 821,536 (2.98) 62.46 Caraga 1 0.3 3 1 (39.35) (72.18) ARMM 16,933 10,496 48,871 56,095 (38.01) 14.78
P Preliminary
October-December and January-December, 2010-2011P Table 7. SUGARCANE: Volume of Production, by Region, Philippines,
RegionProduction (mt) % Change
October-December January-December
Oct-Dec Jan-Dec2010 2011P 2010 2011P 2011P/2010 2011P/2010
PHILIPPINES 329 209 40,530 44,944 (36.37) 10.89
CAR 941 926 - (1.60) Ilocos Region 27,325 30,171 - 10.42 Cagayan Valley 10,502 12,277 - 16.90 Central Luzon 195 168 - (13.75) CALABARZON - - MIMAROPA 563 622 - 10.62 Bicol Region 3 - - Western Visayas 323 298 - (7.62) Central Visayas 16 11 - (32.84) Eastern Visayas 2 2 20 19 (4.87) (5.63) Zamboanga Peninsula 5 5 21 16 (7.65) (24.42) Northern Mindanao 286 172 481 311 (40.00) (35.35) Davao Region 6 5 22 20 (6.47) (5.89) SOCCSKSARGEN 14 10 54 50 (23.95) (7.24) Caraga 1 1 4 2 (40.00) (63.80) ARMM 15 15 61 54 (3.33) (12.30)
P Preliminary
Table 8. TOBACCO: Volume of Production, by Region, Philippines, October-December and January-December, 2010-2011P
RegionProduction (mt) % Change
October-December January-December
18

Department of Agriculture Bureau of Agricultural Statistics
Ben-lor Bldg., 1184 Quezon Avenue, Quezon City Crops Statistics Division
371-2067 [email protected]
http://www.bas.gov.ph