ISSN 1990 - 6587 Volume 3 Number 1 Business...
213
ISSN 1990 - 6587 Volume 3 Number 1 Business Review January – June 2008 RESEARCH JOUNAL of THE INSTITUTE OF BUSINESS ADMINISTRATION KARACHI – PAKISTAN.
Transcript of ISSN 1990 - 6587 Volume 3 Number 1 Business...

ISSN 1990 - 6587
Volume 3 Number 1
Business Review January – June 2008
RESEARCH JOUNAL of
THE INSTITUTE OF BUSINESS ADMINISTRATION KARACHI – PAKISTAN.

Business Review
RESEARCH JOURNAL of
THE INSTITUTE OF BUSINESS ADMINISTRATION KARACHI – PAKISTAN

Business Review
Editorial Board
Danishmand Tufail A. Qureshi Director Editor
Advisory Board
Khadija Malik Bari Javed Hussain Talat A. Wazarat Mirza Sardar Hussain Zeenat Ismail Naved Ahmed
Institute of Business Administration, Karachi, Pakistan
External Editors
Akif Hassan IQRA University, Karachi, Pakistan
Abdul Rashid International Islamic University, Islamabad, Pakistan
Consulting Foreign Editors
Deepak Kapur Institute of Management Technology Ghaziabad, UP, India
Arun Diwaker Nath Bajpai Rani Durgavati University Jabalpur, MP, India
Low Sui Pheng National University of Singapore Singapore
Khurshid M.Kiani Bang College of Business Almaty, Republic of Kazakhstan
S.W.S.B. Dasanayaka University of Moratuwa Sri Lanka
Bettina Robotka Humbolt University Berlin Germany
Toshio Fujita Japan International Cooperation Agency Tokyo, Japan
Khursheed Omer University of Houston Downtown Texas, USA
Faisal Manzoor Arain University of Calgary, Canada

Volume 3 Number 1 January – June 2008 C O N T E N T S Editorial Perspective…………………………………………………………………………….…………..02
ARTICLE
Is Good will Impairment Loss Meaningful Information? Orapin Duangploy, Khursheed Omer, Justo Manrique and Margaret Shelton………………………07 Institution of Bureaucracy and The Conflict in South Asia: Huma Baqai………..………………………..23 Effects of Free Trade Agreements (FTAs) on Construction Firms in Singapore: Low Sui Pheng and June S.Y. Khoo…………………………………………….………………………..33 Economic Reforms and Total Factor Productivity Growth in Pakistan: An Empirical Analysis: Muhammad Sabir and Qazi Masood Ahmed……………………………………………..……………..53 SMEs in Globalized World: A Brief Note on Basic Profiles of Pakistan’s Small and Medium Scale Enterprises and Possible Research Directions: Sarath W.S.B. Dasanayaka……..……………………….69 On Nonlinearities in KSE 100 Index Stock Return: Khurshid M. Kiani………...………………………..79 Discussions
Training within Oil and Gas-Based Industries in the State of Qatar: Hend A. Jolo…………….………….91 Managing Knowledge Worker: Shandana Shuaib………………………….……………………………117 Gradient-Based Edge Detection on a Hexagonal Structure: Xiangjian, Tom Hintz, Qiang Wu and Wenjing Jia………..…………………………………………………………………….133 The Role of Governance and Its Influence on Quality Enhancing Mechanism in Higher Education: Syed Naeem Ahmed………………………..……………………………………………………………..145 Spiritual Basis of Worldly Success: Dr.iur.Menno Aden………………...……………………………....153
Case Studies
Pilot Study of 8 SMEs in Pakistan: Ejaz Ahmed Mian………….……………………………………….165 A Word About the IBA 195 About our Authors 201 Note for Contributors 205 Publications Received 207 Contents of Vol.1, No. 1, Vol. 2, No. 1 and Vol.2, No. 2

Business Review – Volume 3 Number 1 January – June 2008
Editorial Perspective
Call the world if you please “The Vale of soul-making”. Then you will find out the use of the world. John Keats
t has been justly observed that Drucker is a “painter of concepts.” In a less artistic way, we may also add that as a philosopher of business management he was
deeply concerned with the reconstruction of the conceptual structure of corporate thought. However, the observation made about him, so poignant in condensation, has vast ramification in the fields of teaching and research. As an attitude, it says much more than words could ever say. Drawn into the context of teaching and research, it bears upon the situation in which concepts without percepts are philosophically barren and blind and percepts without concepts are empty and devoid of pedagogical significance. Together, the conceptual structures of our perceptual organizations reflect upon the curiosity of an inquiring mind wanting to reach beyond the ken of its comprehension. Simultaneously, they identify the élan vital, the vital urge, of the transcending vision to see beyond the last horizon in anticipation of the yet to be.
I
In the domain of our conceptual framework, if the painter of mental terrain is content with the world as it is, he is not a painter but a captive of a single vision. A real painter is one who suffers from creative discontent with the “given” world, i.e., the world as it is. He paints a picture of the world not as it is but as it ought to be. His concepts and ideas are an intermediate between the “thus it is” and “thus it is not”, between the given world and the world to be. Such a transcending vision unfolds the anticipations which make the worldly existence an unrepeatable once in a life-time venture. It shows that there exists a dynamic relationship between our concept of the world and our way of circumstancing our situated existence in the world. It is in the light of our beliefs about the nature of the world, i.e., our world-view, that we formulate our conceptions of the norms and values that govern the worldliness of the world. And these concepts define the parameters within which we frame our conduct in relation to our being-in-the-world. Our being-in-the-world is a reflection of the values we live by and the nature of the preposition in defines our way of circumstancing the world. A man and his predator are both in the world but not in the same manner of being. It seems that the “world” is a misnomer when it is applied to the world concept. The ‘world’, if it is not a lived-world, means nothing and does not exist. There is no such place as the world. There are as many worlds as there are ways of being-in-the world. The concept of
2

Business Review – Volume 3 Number 1 January – June 2008
the world therefore is relative to our way of making the world our own. We do not live in different worlds but we live in the same world differently. Iqbal made the phenomenological concept of the lived-world strikingly clear;
Such transcendental movement lies at the heart of research orientation, as well as tacit and contextual learning and teaching. As an integral component of the teaching methodology, transcending vision characterizes a continuous and incremental improvement. It enlarges our perspective on life and deepens our world-view. When we embarked upon the publication of Business Review we stressed the need for a collaborative and interdisciplinary eclectic research culture. It continues to be our cherished vision. We believe that in research, as in teaching and learning and more so in life, we should not remain captive of our own narrow vision, unexamined assumptions and unquestioned presuppositions. They can, as they always do, blur and distort our perception of truth and reality. In our search for reality and in our romance with truth, we must therefore take a phenomenologically radical attitude towards self-exploration and self-examination, as an essential feature of our research methodology. Moreover, to augment authentic research awareness we must draw into our business curriculum a recognition of the role humanities and social sciences play in the formulation of a corporate world-view, providing it ethical and moral foundation. Research initiates the advent of new ideas and the beginning of new knowledge. It takes us into the realm of understanding not yet envisioned by the human mind. The anticipatory attitude and the creative joy of research thrives on the gestaltan awareness of the perspectival variation, unfolding the possibilities inherent in the structure of our forward looking movement towards the yet-to-be. Research unfolds the horizons still unmarked by the footprints of human imagination. By demolishing the existing barriers, it pushes the forbidding boundaries further and farther still. Methodologically, that is how research adds new meanings, new values and new ideals to our being-in-the-world; enlarging the familiar meaning of the world. Such value added conceptual knowledge acquires significance in and through its extension into the “world-making” and “world-shaking” acts. The socio-cultural construction of reality is predicated upon the meaning intending and evaluative nature of the constitutive intentionality of our consciousness. The notion of intentional constitution must therefore be drawn into the fold of the concept of corporate reality in order to have a clear and distinct perception of the corporate world-view. The constitution of corporate reality gains significance against the backdrop of our research imperatives becoming increasingly focused on the concept of moral responsibility embedded in the Paradigm of our corporate world-view. Value based knowledge leads to the anticipation of thus it ought to be. When research is conducted with such creative passion, it colours our dreams and brighten the dawn of
3

Business Review – Volume 3 Number 1 January – June 2008
the world-to-be. Our success and failure in this regard will depend entirely upon two things. Firstly, to put it in the Qur’anic parlance, a whole hearted willingness to accept social responsibility for our portion of the world. And, secondly, the invincibility of our political will to translate the existing social issues into ethical issues in order to provide moral foundation to our worldly condition. Again, it means two things. Firstly, the need to draw hermeneutic and axiological principles into the pedagogical philosophy of our business education. And, secondly, to devise and develop a teaching methodology incorporating diverse philosophies, theories and research designs and methods as one of its strengths. The aim should be to inculcate ethical vision and moral proclivity into our corporate culture suffering from congenital self-aggrandisement, voracious and greedy consumerism, self-interest and profit-ridden commercialism. In the light of postmodernist social critiques, it is now becoming more and more evident that we cannot outline the contours of a corporate philosophy of life and culture without drawing into our business education the values which are integral to the ethos of moral character and the discipline of corporate social responsibility and adult maturity. The culture of corporate society and academic scholarship is heterogeneous with overlapping domains of practice and knowledge that need not be antithetical in their ethico-moral orientation, especially within the disciplinary communities such as education, sociology and humanities. The need for interdisciplinary areas of study cannot be over stressed in qualitative research in the realm of corporate culture. The leadership role in this regard goes again to Drucker, a philosopher of management, whose ideas embrace the ‘how’ and the ‘what’ of corporate thinking. His vision is informed by overlapping concepts, converging upon diverse issues of business society replete with profound significance in the field of business education. Together, they present a uniquely exciting picture of the “Knowledge Society”, a futuristic vision of the corporate world. The glory and greatness of a society and the feeling of guilt and shame of man’s failure as a man, provide us with a glimpse into the mind and soul of an age. History of ideas and its connection with the lived-world reveals the structural problems, strengths and weaknesses, and also the creative and defining compulsions inherent in a given paradigm. The stunning collapses and breakdowns of Maxwell, BCCI, Polly Peck and others in the UK, USA and elsewhere and the rise and fall of Enron, have left us wondering about the baffling nature of the ethical and moral flaws inherent in the corporate world-view. Events such as these present powerful indictment of the corporate system suffering from foundational stress. It is now becoming more and more evident that in a self-sustaining corporate world-view, the moral education of our managers, administrators and business executives ought to be an essential component of their role in society. Ironically, in the existing state of affairs, the place of ethics and moral disposition in our business education
4

Business Review – Volume 3 Number 1 January – June 2008
leaves much to be desired. In order to be true to our calling, we need to integrate Business Ethics as a core subject into our syllabus. However, to make such an ideal the summum bonum of our corporate world-view, we must approach the issue with joyful wisdom, to say the things we need to say, to think the thoughts we ought to think. In a constantly changing “world”, the things which matter most are the things which make a difference in our life. Our choices and decisions can radically alter and change our ways of being-in-the-world. Robert Frost has beautifully expressed the poetics of such an experience thus. “I shall be telling this with a sigh somewhere ages and ages hence: Two roads diverged in wood, and I took the one less travelled by, And that has made all the difference.” “Knowing how way leads on to way”, seeking the goal we are seeking, let us keep in mind the following markings:
• the need to work ethics and moral vision into the executive orientation and
evaluative judgements of our business management, • realizing the philosophical refrain that in order to grow ethically and
morally and to add value dimension to our corporate world-view, we need to outgrow our existing disregard and apathy for the humanities,
• and in this regard, exert the creative will to remove from our business education the stigma that the ideal of moral education and ethical persuasion does not harmonize with economic motivation and that such an ideal of business education rests on a scheme of teaching and learning which is un-pragmatic and unpractical,
• knowing that the truth is always out there, within the reach of our reflexive awareness, inviting us – the exponents of morality in business education – to display the wisdom to expose our students to such a catalytic educational experience and to make it the best it can possibly be,
• and to resist no more the passion to critically and creatively will the truth in order to combat the stultifying concepts and falsifications which have crept into the belief that in the scheme of our executive disposition, the propensity for business management and decision making does not correlate with the ethical and moral predilection,
• and then to decisively set aside the dubious belief that in a business society success depends upon manipulation of social norms and cultural sensibilities, exploitation of executive power, idealization of shallow pragmatic belief in the expedient workability of ideas and an obsessively over-riding concern with profit and more profit resulting in a schizophrenic disregard for ethical norms and moral values,
• to realize the existential truth that, in the end, it does not profit a man if he gains the whole world but loses his soul. We must therefore exercise moral exertion to outgrow the fixation on equating economic life with money.
It is pertinent to note, as Jack Beatty in his The World According to Drucker has very aptly pointed out:
5

Business Review – Volume 3 Number 1 January – June 2008
“Drucker discusses economic life in terms of values, integrity, character, knowledge, vision, responsibility, self-control, social integration, teamwork, community, competence, social responsibility, the quality of life, self-fulfillment, leadership, duty, purpose, dignity, meaning – but rarely money. He defends profit, but as if it were broccoli: a distasteful obligation of managers who would rather be reading Kierkegaard.”
Drawn into a road map, the distinctive features outlined above will define the dynamic and creative markings of the corporate world-view. They will generate the pragmatic attitude of using our moral edge for sustainable competitive advantage and profitability. No matter how entirely self-serving in their motivational disposition, attitudes, decisions and ideals, the defining features stipulated above must serve as the essential categories of corporate thinking. Cognitively, such an approach is hermeneutically necessary at any given stage of our business education in order to move to still higher stages of the development of the ethos of our corporate culture. Such a radically altered way of thinking will help us understand that the corporate culture need not be averse to the longings of ethical sensibilities and the yearnings of moral character. By no means should they be antagonistic or antithetical to the practical strivings of corporate compulsions. In fact they should make a compelling case for the assumption that in order to become embedded in the curriculum of our business education, our corporate world-view needs to be a moving target, unfolding always the freshness of the world-to-be. In the words of T.S. Eliot,
“We must not cease from exploration and the end of all our exploring will be to arrive where we began and to know the place for the first-time.”
6

Business Review – Volume 3 Number 1 January –June 2008
ARTICLE
Is Goodwill Impairment Loss Meaningful Information?
Orapin Duangploy
University of Houston-Downtown, U.S.A
Khursheed Omer University of Houston,-Downtown, U.S.A
Justo Manrique
University of Houston-Downtown, U.S.A
Margaret Shelton University of Houston-Downtown, U.S.A
Although this paper focuses on accounting issues in the United States of America, I believe it will have a wider appeal to both researchers and students of accounting and finance in today’s global economy. Especially with the ongoing efforts in Pakistan to privatize Government-owned enterprises, recognition of goodwill and its potential impairment is a topic that should be of interest to our local readers.
Editor ABSTRACT
his study investigates information content of goodwill impairment loss reported under current GAAP (Generally Accepted Accounting Principles). It explains
the market’s negative reaction to goodwill impairment losses. The sequential specification approach is used to analyze the factors affecting the level of normalized stock returns. Cumulative effect and change in debt to total assets were found to be important variables in determining the level of normalized stock returns. The finding suggests that while goodwill write-off may not affect cash flows or tangible assets, it provides information about future change in the earnings potential and increased degree of risk to solvency of the firm.
T
Key words: goodwill, impairment loss, SFAS 141, SFAS 142, business combinations, goodwill write-off INTRODUCTION The Financial Accounting Standards Board (FASB) issued SFAS 141, Accounting for Business Combinations (FASB 2001a), and SFAS 142 (FASB 2001b), Accounting for Goodwill and Intangible Assets in June 2001 bringing about a major overhaul of the accounting rules for mergers and acquisitions. The purpose of this
7
Business Review – Volume 3 Number 1 January – June 2008
study is to empirically investigate the information content of goodwill impairment loss reported under the provisions of these rules. SFAS 141 addresses business combinations completed through acquisitions of assets or equity interests and supersedes APB Opinion No.16 as well as superseding or amending a number of interpretations of APB No.16. Under the provisions of SFAS 141, pooling of interests accounting is no longer allowed. Companies must use the purchase method in accounting for business combinations and must recognize and disclose goodwill as an asset on financial statements if the acquisition cost exceeds the fair value of separately identifiable assets. Thus, SFAS 141 standardizes the procedure for identifying and recognizing goodwill and makes it more transparent for the users of financial statements. SFAS 142 supersedes APB Opinion No. 17 and prescribes different accounting treatment for intangible assets having a finite life and those having an indefinite life, such as goodwill. In case of goodwill, periodic amortization is disallowed. Companies are required to conduct an annual impairment test to determine if goodwill has suffered an apparent permanent decline in value and, if so, this loss is reported currently on the income statement. This is a significant departure from the traditional purchase method where recognized goodwill was amortized. These changes are indeed significant and the result of intense debate for several years. The pooling of interest method has been the target of extensive criticism in accounting circles. Critics have argued that the financial statements produced under the two methods (purchase and pooling) depict very different pictures of the combined companies. The pooling method fails to disclose the fair values exchanged in the combination and, thus, hinders investors in properly assessing the rate of return on investment. The pooling method is only used by a small minority of companies worldwide (Radebaugh and Gray 2002, 166). Therefore, international accounting standards do not allow pooling of interest method which makes performance comparison among multinational entities extremely difficult (Schroeder, Clarke, & Cathey, 2001 p. 478). Pooling of interest method, nonetheless, has not been without supporters. The strongest argument in favor of the pooling method was that some business combinations were mergers of equals where none of the combining entities survived. Furthermore, it was argued that elimination of the pooling method would discourage companies that wished to merge for sound economic reasons. Until recently, senior financial executives were evenly split between the purchase and pooling of interest methods (Davis 2000, 73). SFAS 141 and SFAS 142 have been in effect for a period of more than three years. Questions about the impact of the two pronouncements need to be answered. Most
8

Business Review – Volume 3 Number 1 January –June 2008
important are questions relating to the impact of the recognition of goodwill impairment loss. Would recognition of such loss be detrimental to the financial performance and position of U.S. companies? Given that a goodwill impairment loss is a non-cash charge, will the market ignore it or factor it into the value of the stock? Due to the economic slump and the huge prices U. S. companies paid for acquisitions during the late-1990s boom (Rapoport and Weil 2002, C1), companies, possibly have huge charges in the year of implementation to write off goodwill. While it is true that amortization and impairment loss are both non-cash items, amortization is a constant and relatively small amount over a time period and goodwill impairment loss is an unpredictable and much larger amount. To date, the articles written on the impact of recognizing loss from goodwill impairment have been speculative (for example, Colquitt and Wilson 2002 and Wermert 2003); or have dealt with discretionary announcements of goodwill write-off (for example, Hirschey and Richardson, 2003). In this study, we present empirical evidence about the information content of actual goodwill write-offs pursuant to the implementation of SFAS 141 and SFAS 142. The remainder of the paper proceeds as follows. First, we provide a background of the changes in goodwill accounting and discuss the details of the impairment test under SFAS 142 in order to provide a basis for the development of research hypothesis and methods of testing them. The second section presents a review of previous studies. Conceptual and empirical framework is presented in the third section. A discussion of the results is presented in the fourth section and conclusion is presented in the final section. BACKGROUND The concept of goodwill is well established in accounting literature. However, its interpretation and meaning has evolved over the years. Yang (1927, 29) had described goodwill as an intangible asset, arising out of an acquisition, that contributes to or accompany unusual earning capacity. Later goodwill was described as good and advantageous relations of a proprietor with customers (Catlett and Olson 1968, 9). Over time, the FASB and the AICPA have refined and clarified the definition of goodwill to bring it in line with extant concepts. Goodwill is recognized pursuant to acquisition of one business entity by another entity and is interpreted as the residual value of the purchase price after subtracting the fair value of the net identifiable assets of the acquired company. Consequently, non-quantifiable factors as manufacturing processes, convenient or strategic locations, brand loyalty, and superior management that contribute to an existing business’s higher than average earning potential were incorporated in the definition of goodwill.
9

Business Review – Volume 3 Number 1 January – June 2008
In its November 19, 1997 meeting, the FASB affirmed that goodwill met the definition of assets as stipulated in SFAC No. 6 (FASB 1985) and that it was the residual value of purchase price after the various identifiable net assets acquired are recorded. In the light of this perspective, Johnson and Petrone (1998, 295) documented the following six components that were being included in goodwill: 1) the excess of the fair values over the book value of acquired assets at the date of acquisition, 2) the fair value of other net assets not recognized by the acquired entity at the date of acquisition, 3) the fair value of the “going concern” element of the acquired entity, 4) the fair value of expected synergies from combining the acquiring company’s and acquired company’s businesses and net assets; 5) Overvaluation of the consideration paid the acquiring company attributed to possible errors in valuing the purchase consideration, such as the current market price of the stock issued might be higher than the cash sale of stock; and 6) Overpayment (or underpayment) by the acquiring company which may occur “in the course of bidding” for the acquired company. SFAS 141 defined “core goodwill” as including the fair value of the “going concern” element of the acquired entity and the fair value of expected synergies from combining the acquiring company’s and acquired company’s businesses and net assets Assets should normally satisfy three fundamental criteria: measurability, relevance, and reliability. However, measurability is a difficult criterion to satisfy since goodwill is not a separately identifiable and exchangeable asset. However, the FASB held that exchangeability was not a necessary criterion for asset definition. SFAS 142 addressed the problem of subsequent recognition and measurement of goodwill. The FASB considered four alternatives for subsequent recognition and measurement: 1) write-off all or a portion of goodwill immediately, 2) report goodwill as an amortizable asset, 3) report goodwill as an asset that is not amortized but is reviewed for impairment and 4) report goodwill as an asset, a portion of which is amortized and a portion of which is not. The Board chose the third alternative based on the premise that “not all goodwill declines in value and that goodwill that does decline in value rarely declines on a straight-line basis” (FASB 2001b, par. B79). In field visits conducted by the Board during October-November 2000, fourteen companies had also preferred the non-amortization approach. Relevance of goodwill information has been well established in institutional studies (AICPA 1994 and AIMR 1993) and research published in academic and professional journals. For example, Davis (1992), Chauvin and Hirschey (1994), McCarthy and Schneider (1995), Jennings et al. (1996), Hennings, Lewis, and Shaw (2000) validated the finding of early researchers that the market perceives goodwill as an economic resource.
10

Business Review – Volume 3 Number 1 January –June 2008
The Board also decided that there was no serious damage to reliability of goodwill numbers since component one and two as well as five and six were excluded from core goodwill, (FASB 2001a, par. B123 - 131)
GOODWILL IMPAIRMENT TEST SFAS 142 describes impairment as the condition that exists when the carrying amount of recorded goodwill exceeds its implied fair value (FASB 2001b, par. 18). To determine goodwill impairment, a two-step process is followed. First, the fair value of the reporting unit is determined. If the fair value exceeds its carrying value, no further work is required. Otherwise a second step is necessary to compute the implied fair value of goodwill. This is accomplished by deducting the fair value of all separately identifiable net assets (excluding goodwill) from the fair value of the reporting unit. If the implied fair value of the goodwill is less than its carrying amount, the difference is the goodwill impairment loss which is recognized currently as a separate item in the income statement. The implied fair value becomes the new carrying value of goodwill for that reporting unit. FAIR VALUE MEASUREMENT Fair value is defined in SFAS 142 as the amount at which the unit as a whole could be bought or sold in a current transaction between willing parties (FASB 2001b, Par 23). This definition suggests that the reporting unit could be purchased separately in business combinations. However, if quoted market prices are not available, other estimates of fair value should be made. These include prices for similar assets and liabilities and the results of other valuation techniques. The fair value of each reporting unit does not need to be recomputed every year for the annual impairment test and can be carried forward from year to year if no significant change occurs. Allocation of the acquisition costs to reporting units and estimation of fair values of reporting units may prove to be quite challenging. It is possible that some companies may strategically allocate acquisition costs to reporting units in order to shield themselves from future goodwill impairment. They may practice the big bath strategy by linking as much goodwill as is supportable against a poorly performing unit and disclosing a potential impairment loss in the first year. Therefore, cost allocations and fair value determination under SFAS 141 and SFAS 142 may be highly subjective. TRANSITIONAL IMPAIRMENT TEST Companies are required to complete a transitional impairment test of all goodwill within the first year of adoption. SFAS 142 allows the accounting of the
11
Business Review – Volume 3 Number 1 January – June 2008
impairment loss as a change in accounting principles. Companies that succeed in determining and comparing the fair value of the reporting unit to the reporting unit’s carrying value within six months of adoption are allowed to treat any resulting impairment loss as cumulative effect of a change in accounting principles. This suggests that some core income, i.e. income from continuing operations for the year ended December 31, 2002, may not reflect the goodwill impairment loss. Cumulative effect of a change in accounting principles affects only net income, since it is presented as a line item above net income. PRIOR RESEARCH For the past several years, research on goodwill was focused on the impact of goodwill amortization. Vincent (1997) studied the information content of goodwill amortization in the context of pooling of interests versus purchase. The findings of this study suggest that investors adjust the two methods comparable by adding back amortization of goodwill to income. Lindenberg and Ross (1999) found that investors appeared to ignore amortization of goodwill reported under the purchase method and treated it differently from depreciation. The results of their study show that price earnings increased with goodwill amortization. This indicates that increase in goodwill amortization expense appears to be offset by the increase in price earnings. Hopkins, Houston, and Peters (2000) arrived at a similar conclusion. The results of their study indicated that analysts appear to impute the goodwill amortization under the purchase method by backing it out and treat the total goodwill as a one-time charge in order to discount the effects of a non-cash charge. Moehrle, Reynolds-Moehrle, and Wallace (2001) showed that the relative informativeness of earnings before amortization and earnings before extraordinary items did not differ significantly. They also found that both earnings before amortization and earnings before extraordinary items were more informative than cash flow from operations. As such, they concluded that goodwill amortization disclosures were not decision useful. Similarly, Jennings, LeClere, and Thompson (2001) reported that earnings before goodwill amortization explain significantly more of the observed distribution of share prices than earnings after goodwill amortization and when share valuations are based upon earnings alone, goodwill amortization simply adds noise to the measure. There are two possible explanations for the finding in past research studies that investors tend to ignore goodwill amortization. First, because goodwill does not exist under the pooling-of-interests method, investors may be trying to equate the accounting numbers generated from the two business combination methods. Alternatively, investors may be ignoring goodwill amortization because it is a non-
12

Business Review – Volume 3 Number 1 January –June 2008
cash charge. Moreover, investors may disregard amortization of goodwill because they may consider it to be a double hit on the company’s income statement as business firms generally incur out-of-pocket expense of maintaining the value of goodwill. Hirschey and Richardson (2002) analyzed market-value effects of discretionary goodwill write-off announcements and found a significant association between stock price decline and such announcements. Based on these results they maintain that goodwill write off decisions provide information regarding important future changes in company earnings. In their 2003 study, Hirschey and Richardson applied the same data set to provide a “professional adaptation and extension” of their 2002 study (2003, footnote 1, p. 84). They found that goodwill write-offs do not link to contagious stock reactions; they are “essentially a company-specific event” (Ibid., p.81). Comparison between simple versus messy announcements indicated that in general the stock price experienced a smaller effect when the announcements were just goodwill write-offs as compared to situations where good will write off announcements were accompanied by other announcements.1 They found “statistically significant negative abnormal returns tied to goodwill write-off announcements” (Ibid., p. 84). They also found “a statistically significant link between the magnitude of negative valuation effects during the announcement window and the size of negative returns in the post-announcement period.” (Ibid.). The larger the size of the negative post-announcement effects, the more negative was the stock reaction to goodwill write-off announcements. They concluded that negative valuation effects during the announcement period indicates that goodwill write-off announcements signal to the investors the diminished potential future economic benefits to the company. Moreover, goodwill write-off announcements are “associated with a further fundamental deterioration in the market value of the company during a subsequent year-long period” (Ibid.). Investors appear to under-react to the importance of goodwill write-off announcements. While Hirschey and Richardson (2002 & 2003) focused on goodwill write-off announcements, in the study presented here, we report the market’s reaction to the actual disclosure of goodwill impairment losses in the company’s financial statements. CONCEPTUAL AND EMPIRICAL FRAMEWORK The apparent inconsistency between the market’s disregard of goodwill amortization and the market’s negative reaction to goodwill impairment losses can be rationally
1 It is noteworthy that they did not find significant value relevance by industry classification.
13
Business Review – Volume 3 Number 1 January – June 2008
explained as follows. First, the amount of goodwill impairment loss would generally be much larger than the amount of periodic goodwill amortization. Therefore, it is likely to have a significant impact on income and total assets. The write-down of goodwill will lower the book value of the company and increase the debt to total assets ratio. The presence of such damaging information may depress the market price of the company stock. Second, the units reporting goodwill impairment loss are most likely the reporting segment of a firm. Goodwill amortization, on the other hand, is reported on the consolidated financial statements of the firm. Since segment reporting is relatively more relevant in gauging the risk and return of a firm. Therefore, having goodwill impairment losses measured from each reporting unit produces more incisive and valuable information to investors. Finally, investors find information about goodwill impairment loss more value relevant because this computation is based on the fair value of the goodwill of the reporting unit, whereas the amount of periodic goodwill amortization is purely arbitrary and involves double counting for recognizing both amortization and expenditure in maintaining goodwill. The expenditures incurred in maintaining goodwill are likely to be more relevant in the computation of fair value of goodwill to test for impairment. Conservatism principle requires such expenditures, which can be construed as costs of restoring the purchased goodwill, to be expensed. In addition, such goodwill may be interpreted as internally generated since it is inherent in the reporting unit after the purchase. Unless goodwill is well maintained, the fair values of the reporting unit and goodwill may be less than their respective carrying amounts. Hence, the internally generated goodwill which is incorporated in the fair value of goodwill computation will be used in the computation of impairment. Any goodwill impairment is, therefore, computed net of the internally generated goodwill. This is a significant factor in the analysis of goodwill impairment. However, further analysis on this factor is not possible owing to the lack of separate disclosure of this information in the financial statements Since the year 2001 was the first year of implementation of SFAS 142, a large number of companies announced goodwill write-off and indicated that they take advantage of taking a “big bath” by accounting the impairment loss as a change in accounting principles (Hirschey and Richardson 2003, 77). We, therefore, test the following null hypothesis: HO: There is no information content in goodwill impairment losses reported as cumulative effect
14

Business Review – Volume 3 Number 1 January –June 2008
Previous researchers have studied relative informativeness of accounting disclosures by observing association between accounting measures and stock returns (Amir, Harris, and Venuti 1993, 230). We utilized the sequential specification approach (Studenmund, 1997, 188). Gu and Lev (2004) used a similar approach in determining information content of royalty income. The following regression models were used to analyze the factors affecting the level of normalized stock returns for firms where goodwill impairment loss is reported as cumulative effect. Model 1: reti,t = β1,0 + β1,1 nit + β1,2 nii,t-1 + εi,t Model 2: reti,t = β2,0 + β2,1 nit + β2,2 nii,t-1 + β2,3 cei.t + εi,t Model 3: reti,t = β3,0 + β3,1 nit + β3,2 nii,t-1 + β3,3 cei.t + β3,4 pchdtotai,t + εi,t Model 4: reti,t = β4,0 + β4,1 nit + β4,2 nii,t-1 + β4,3 cei.t + β4,4 pchdtotai,t + β4,5 gwli,t + εi,t Model 1 is the benchmark model against which R2 values will be compared to determine if introduction of additional variables improves the explanatory power of the model. Prior period net income has been included in the regression models to capture the association between normalized stock returns and that part of the current period’s net income that is unpredictable from the prior year’s earnings (Gu and Lev 2004, 5). Information content is determined by examining the t-statistic and by comparing the sum of squared errors from successive pairs of models using the F-test. Names and detailed description of variables are shown Table 1. Table 1. Names and Description of Variables ____________________________________________________________________ Variable Description ____________________________________________________________________ Dependent Variable ret i,t Normalized stock returns for firm “i” in period t. Independent Variables ni t Reported net income for firm “i” in period t. ni i,t-1 Reported net income for firm “i” in period t-1. ce i.t Good will loss reported as cumulative effect on
income for firm “i” in period t. pchdtota i,t Percentage change in debt to total assets ratio for
firm “i” in period t. gwl i,t Goodwill impairment loss for firm “i” in period t
reported in operating income ____________________________________________________________________
15

Business Review – Volume 3 Number 1 January – June 2008
DATA AND SAMPLE COMPANIES Data was collected from the 10K filed with the Securities Exchange Commissions of the 2002 Fortune 500 firms that meet the following criteria: 1) Financial statements are available in the Lexis-Nexis database for 10K. 2) Report of goodwill impairment loss separately as a line item or a
component in the cumulative effect of change in accounting principle. 3) Stock is traded on the New York Exchange. Using these criteria a sample of 126 companies was selected. Sample profile is shown in Table 2. Table 2: Distribution of Sample Companies ____________________________________________________________________ SIC Division Number of Companies ____________________________________________________________________ Mining 1 Manufacturing 49 Transportation, Communications, Electric, Gas, and Sanitary Services 31 Wholesale Trade 7 Retail Trade 15 Finance, Insurance, and Real Estate 8 --------------- Total 126 ========= After the identification of sample companies, stock price three months after fiscal year-end were collected from the Yahoo.com historical quotes database. Table 3 contains the sample statistics for the variables included in the different models. Table 3. Descriptive Statistics ____________________________________________________________________
Variable Mean Standard Deviation ____________________________________________________________________ Dependent Variable ret i,t -.27 .32
16

Business Review – Volume 3 Number 1 January –June 2008
Independent Variables ni t -77.12 528.32 ni i,t-1 -82.10 839.78 ce i.t -48.87 301.24 pchdtota i,t .03 .08 gwl i,t 18.85 175.19 DISCUSSION OF RESULTS Table 4 presents the parameter estimates obtained from the Ordinary Least Squares estimation for models 1-4.
Table 4. Parameter Estimates from Regressions Of Normalized Stock Returns
When Goodwill Impairment Loss Is Reported As Cumulative Effect.
Model 1 Model 2 Model 3 Model 4
Constant -.2726 -.2856 -.2644 -.2650 (-10.25)** (-10.80)** (-9.68)** (-9.49)** ni t 0001 .0009 .0009 .0009 (2.17)** (2.94)** (3.02)** (2.82)** ni i,t-1 -.0002 -.0002 -.0002 -.0002 (-4.98)** (-5.64)** (-5.81)** (-5.68)** ce i.t -.0014 -.0016 -.0016 (-2.61)** (-3.03)** (-3.00)** pchdtota i,t -1.158 -1.124 (-2.47)** (-2.22)** gwl i,t .0001 (0.12) Adjusted R2 0.17 0.20 0.23 0.23 F [2, 123] 13.39
17

Business Review – Volume 3 Number 1 January – June 2008
F [3,122] 11.62 F [4,121] 10.60 F [5,120] 8.41 Durbin-Watson statistic
1.99 1.94 1.93 1.94
Asymptotic t-values are in parenthesis. ** Statistically significant at 5%. As expected, R2 value improved from 0.17 for the benchmark model to 0.20 when the cumulative effect variable was added in model 2. When the variable for percentage change in the ratio of debt to total assets was introduced in model 3, R2
value further improved to 0.23. Introduction of the variable for goodwill impairment loss in model 4 did not improve the R2 value, but all F-ratios were larger than the 95 percent critical value of 1.88. Thus, we rejected the hypothesis that all slopes in the regression equations were zero. Outliers may have a strong undesirable influence on the OLS estimates that could lead to inaccurate inferential statements. The presence of outliers produces a “fat-tailed” distribution of residuals different from the normal distribution. So, a test for outliers is basically a test for normality of the OLS residuals. We performed a Jarque-Bera test for normality of the OLS regression residuals and concluded that the OLS residuals followed a normal distribution, therefore discarding the presence of outliers. We also performed White’s general test for heteroskedasticity. The chi-squared statistics in all models were not significant at 5% level. Therefore we accept the hypothesis of homoskedasticity and concluded that the data were not heteroskedastic. We also measured the interrelationships among the independent variables and concluded that multicollinearity was not a serious problem in this study. Finally, the Durbin-Watson statistics in all models were greater than the upper critical values of these statistics. Consequently, we accepted the hypotheses of no positive autocorrelation and concluded that there was no positive autocorrelation. In general, the analysis showed that most of the independent variables included in the models were statistically significant at the level of 95% or better, suggesting that these variables are important in determining the level of normalized stock returns. Results indicate that nit has a positive influence on the level of normalized stock returns for firms, while ni,t-1 has a negative sign. This is consistent with the results in Gu and Lev (2004). Also, these OLS regression results are characteristic of all firms in the sample. To prove this point, we split the sample between manufacturing and non-manufacturing firms and performed a Chow test to test the null hypothesis that the OLS regression coefficients were the same for manufacturing and non-manufacturing firms. The F
18

Business Review – Volume 3 Number 1 January –June 2008
statistics in all models were not significant at the 5% significance level. Therefore we accepted the null hypothesis and concluded that the regression coefficients were the same for American manufacturing and non-manufacturing firms. Hirschey and Richardson (2002, 2003) found that negative information effect of goodwill write-off announcements were relevant for all manufacturing and non-manufacturing firms included in their sample. The variables for cumulative effect (cei.t) and change in debt to total asset ratio (pchdtotait) have negative signs. Since cumulative effect is an expense, it is bound to have a negative influence on the returns. Moreover, goodwill impairment signals erosion of future earnings potential. Also an increase in the debt to total asset ratio signals a higher solvency risk for the firm thereby depressing stock prices. Specifically considering regression results of model 4, we found that a one percent increase in nit would increase normalized stock return by 0.26 percent and a one percent increase in ni,t-1, cei.t and pchdtotait would decrease normalized stock returns by 0.06 percent, 0.29 percent, and 13.0 percent respectively (these changes were calculated at the sample mean values of the three variables).2 CONCLUSION Results of this study empirically validate earlier expectations (Wermert 2003 and Hirschey & Richardson 2003). Results also indicate that while goodwill write-off may not affect cash flows or tangible assets, it provides information about future change in the earnings potential and increased degree of risk to the solvency of the firm. Unlike goodwill amortization which is computed for the consolidated entity, goodwill impairment loss is computed at the segment level or a level below the segment level. This disaggregated information provides a better means of assessing the overall performance, risks, and prospects of the firm. Research conducted by Balakrishnan, Harris, and Sen in 1990 and Behn, Nichols, and Street in 2002 found segment disclosures outperformed consolidated data in the accuracy of predicting earnings. Hence, the reporting of goodwill impairment losses by segment could be a significant contributor in explaining the overall results. Future research on this topic may also consider the uncertainty related to the effect of prospective goodwill impairment losses on stock returns. Theories of determination of expectations such as adaptive expectations, rational expectations, or a combination of the two could be used to model how firms form their expectations on
2 We also ran regressions for companies that disclosed goodwill impairment loss as line item in arriving at operating income and found identical results.
19

Business Review – Volume 3 Number 1 January – June 2008
future amount of goodwill impairment loss and how they use newly available information to modify their predictions about future values. These theories could also be to analyze the effects of net and/or operating income (whose future values are also uncertain) on stock returns. Further research can also use time-series analysis as more information on the relevant variables becomes available. REFERENCES American Institute of Certified Public Accountants [AICPA] (1970). Accounting Principles Board (APB) Opinion No. 16, Business Combinations, AICPA: New York. Ibid (1994). Improving Business Reporting - A Customer Focus, report of AICPA Special Committee on Financial Reporting. AICPA: New York. Amir, E., T. Harris, and E. Venuti (1993). A Comparison Of Value-Relevance Of U.S. Versus Non-U.S. GAAP Accounting Measures Using Form 20-F Reconciliations. Journal of Accounting Research 31 (Supplement), pp. 230-264. Association for Investment and Management Research [AIMR] (1993). Financial Reporting in the 1990s and beyond, position paper by the Financial Accounting Policy Committee of the Association for Investment and Management Research. Balakrishnan, R., T. Harris, and P. Sen (1990). The Predictive Ability of Geographic Segment Disclosures. Journal of Accounting Research 28 (2), pp. 305-326. Behn, B., N. Nichols, and D. Street. (2002). The Predictive ability of Geographic Segment Disclosures by U.S. Companies: SFAS No. 131 vs. SFAS No. 14. Journal of International Accounting Research (1), pp. 31-45. Catlett, G. R. and N. O. Olson (1968). Accounting for Goodwill. AI.CPA.: New York. Chauvin, K. and M. Hirschey (1994). Goodwill, Profitability, and Market Value of Firm. Journal of Accounting and Public Policy 13 (2), pp. 159-180. Colquitt, L. and A. Wilson (2002). The Elimination of Pooling-Of-Interests and Goodwill Amortization. Journal of Insurance Regulation 20(3), pp. 338-351. Davis, M. (1992). Goodwill Accounting: Time for an Overhaul. Journal of Accountancy 173 (6), pp. 75-81.
20

Business Review – Volume 3 Number 1 January –June 2008
Ibid., (2000). Other Voices: Roiling the Waters. Barron’s 80 (43), p. 73. Financial Accounting Standards Board [FASB] (1985). Elements of Financial Statement: Statement of Financial Accounting Concept No. 6, Norwalk, CT: FASB. Ibid., (2001a). Business Combinations. Statement of Financial Accounting Standards No.141. Norwalk, CT: FASB. Ibid., (2001b). Goodwill and Other Intangible Assets. Statement of Financial Accounting Standards No.142. Norwalk, CT: FASB. Gu, F. and B. Lev (2004). The Information Content of Royalty Income. Accounting Horizons 18(1), pp. 1-12. Hennings, S., B. Lewis, and W. Shaw (2000). Valuation of the Components of Purchased Goodwill. Journal of Accounting Research 38 (2), pp. 375-386. Hirschey, M. and V. Richardson (2002). Information Content of Accounting Goodwill Numbers. Journal of Accounting and Public Policy, 21, pp. 173-191 Ibid., and Ibid (2003). Investor Under-Reaction to Goodwill Write-Offs. Financial Analysts Journal 59 (6), pp. 75- 82. Hopkins, P.; R. W. Houston; and M. F. Peters (2000). Purchase, Pooling, and Equity Analysts’ Valuation Judgments. The Accounting Review 75 (3), pp. 257-281. Jennings, R., J. Robinson, R. Thompson II, and L. Duvall (1996). The Relation between Accounting Goodwill Numbers and Equity Values. Journal of Business Finance and Accounting, 23 (4), pp. 513-533. Ibid., M. LeClere, and R. Thompson (2001). Goodwill Amortization and the Usefulness of Earnings. Financial Analysts Journal 57 (5), pp. 20-28. Johnson, L. T. and K. R. Petrone (1998). Is Goodwill An Asset? Accounting Horizons 12 (3), pp. 293-303. Lindenberg, E. and M. Ross (1999). To Purchase or To Pool: Does It Matter?” Journal of Applied Corporate Finance 12, pp. 32-47. McCarthy, M. and D. Schneider (1995). Market Perception of Goodwill: Some Empirical Evidence. Accounting and Business Research 26 (1), pp. 69-81.
21

Business Review – Volume 3 Number 1 January – June 2008
Moehrle, S., J. A. Reynolds-Moehrle (2001). Say Good-Bye to Pooling and Goodwill Amortization. Journal of Accountancy 191 (9), pp. 31- 38. Moehrle, S., and J. S. Wallace (2001). How Informative Are Earnings Numbers That Exclude Goodwill Amortization?” Accounting Horizons 15 (3), pp. 243-255. Radebaugh, L. and S. Gray (2002). International Accounting and Multinational Enterprises, 5th edition, New York: John Wiley and Sons. Rapoport, M. and J. Weil (2002). Goodwill as A Banker’s Weapon.” Wall Street Journal ( May 23) : C1 & C3. Schroeder, Richard G., Myrtle W. Clarke, and Jack M. Cathey (2001). Financial Accounting Theory and Analysis, 7th edition, New York: John Wiley & Sons, Inc. Studenmund, A. (1997). Using Econometrics: A Practical Guide, 3rd edition, New York: Addison-Wesley. Vincent, L. (1997). Equity Valuation Implications of Purchase Versus Pooling Accounting. Journal of Financial Statement Analysis 2, pp. 5-19. Wermert, J. G. (2000). An Empirical Investigation of the Market’s Assessment of Acquired Intangible Assets. Journal of Accounting and Finance Research 7 (6), pp. 70 – 77. Ibid., (2003). A Crisis of Goodwill? Evidence Using Stock Price Data. Journal of Accounting and Finance Research Winter II, pp.1-12 Yang, J. M. (1927). Goodwill and Other Intangibles, New York: Ronald Press.
I know of no more encouraging fact than the unquestionable ability of man to elevate his life by conscious endeavor
HENRY DAVID THOREAU
22
Business Review – Volume 3 Number 1 January – June 2008
ARTICLE
Institution of Bureaucracy and The Conflict in South Asia
Huma Baqai
Institute of Business Administration, Karachi, Pakistan
he role of bureaucracies is vitally important in the conflict-cooperation balance. Bureaucrates by definition are implementers of policy. This implementation also
sometimes graduates to initiation of policies; therefore, it would be appropriate to say that although they are implementers, they also perform a variety of other functions which enhances their role and importance in the functions of the states, particularly bureaucratic states.
T
Max Weber, the earliest proponent of bureaucratic behavior, applauded the bureaucratic mode of political organization as the most advanced and the best form suited to the administration of complex societies. To him, the bureaucratic mode was a clear advance on its predecessors. However, the model is not in practice anywhere. No bureaucracy in the world functions according to the laid down principles, and therefore, what Weber saw as virtues became vices in the eyes of later observers. What was referred to as predictable and regularized, the critics found it to be restrictive. Rules to provide regularized channels had become ends in themselves and not means to other goals. Injecting fresh approaches became difficult because elected leaders could not break the stranglehold that bureaucracies had on policy. The marshaling of expertise to solve difficult problems became a cover for bureaucrats to serve the interest of their own organizations, at the expense of the public and other bureaucracies with which they competed for resources and influence. What for Weber had been the pinnacle of modern political organization had become the logjam in the machinery of government to successor observers. The factor of permanence associated with the institution of bureaucracy also has relevance to this discourse. Bureaucracies by being the permanent element of the state should have been the most rational component of the government. With politics and politicians being transitionary, do not deal with issues over a stretched period of time. It is the bureaucrats who are the permanent custodians of the nation’s goals and aspirations. The bureaucracy, thus is the system which is responsible for assisting the elected representative of the governments for a fair and faithful dealing of public and private transactions. At the same time, rivalries, interdepartmental hostilities, and divisions are common to all the bureaucracies of the world. The competition and the risk of policy failures causing embarrassment, discourage the taking of bold initiatives, or for that matter even supporting them. The infamous red tapism is also a bureaucratic norm. All of this results in conservatism and routine decision making.
23

Business Review – Volume 3 Number 1 January – June 2008
Bureaucratic behaviors do have an impact on foreign policy decisions of the state. It influences particularly in countries and regions where hostilities exist have been observed. For example in the subcontinent, apparently for bureaucracies, security emanates from the status quo and not change. They continue to be essential both to the domestic and foreign policies BUREAUCRACIES IN SOUTH ASIA The institutions of bureaucracy have an important role in the polity of South Asia. The governments of South Asia are highly bureaucratic, almost linear, and lacking constructive pluralism. The colonial mindset and the legacy of civil service seem to linger on even after sixty years of independent existence. The bureaucracy in the subcontinent is also called Civil Service. One of the earliest demands of the Indian nationalist opinion was to rationalize the structure and function of civil service, to provide a greater share to Indians in the administration of their country. This desirability of civil service of being supportive of the basic goals was transformed into their necessity of being committed to the government of the day. Thus, services were politicized and corrupted right from the onset, partly because the leadership desired it, and partly because the service themselves sought illegitimate favors from the politicians. There was gradual decline in quality, efficiency, and integrity of services even at the higher level. Civil service careers, promotions and postings, job security, all became part of the system of distribution of spoil and patronage. Another facet is the excessive bureaucracy which is again a colonial legacy. Within the colonial structures, policies were formulated by colonial leaders, and subsequently implemented by civil servants (bureaucrats). However, after independence, bureaucrats performed both roles despite their relative inexperience in leadership. This continues and as a result, the role of policy makers and leaders are not distinct, and are fulfilled by inexperienced bureaucrats. Their role hence is taken to be of immense importance in the conflict- cooperation equation in inter-state relations. Indian bureaucracy became politicized partly because the political elite desired it, and partly because the services themselves sought illegitimate favors from the politicians. Due to this, the political neutrality norms of the services suffered grievous erosion. The 73rd and 74th constitutional amendments brought in India (in the name of empowering people and decentralizing power) resulted in more centralization and bureaucratization of power because of the constitutional safeguards. Even after almost sixty years of independence, the bureaucrats have not learnt the simple truth of their being citizens first, and only then officers. They are servants and not masters of the people, thus their job is to serve the people, not rule
24

Business Review – Volume 3 Number 1 January – June 2008
over them. Multilevel and multifaceted corruption and red tapism are two major attributes of Indian bureaucracy. Lack of accountability and patronage of corrupt politicians and greedy businessmen have made the Indian bureaucracy a law unto itself. Bureaucrats have created such a steel frame around themselves that even the might of the state can’t dismantle it. Decline in quality, efficiency, and integrity of the bureaucracy in concert with constitutional safeguards has given the Indian bureaucracy a formidable stature. Role of the Indian bureaucracy in conflict and cooperation has been controversial with procedural stringency being a norm. The politicization of it has impacted India’s relation with all its neighbors, be it Pakistan, Bangladesh or Nepal. Bureaucracies seem comfortable with the status quo, and resist and oppose change. Unfortunately the Indian bureaucratic mindset and approach towards policy making and issues of governance and conflict resolution emerges as a major impediment in its desire for a prominent role in international affairs. This is propelling India towards revamping its policy of confrontation and coercive diplomacy in the region. There is increasing realization in the Indian leadership and think tanks that bureaucratic inefficiency has to be tackled by downsizing the bureaucracy and also by envisaging regulatory rules for the remaining one. However, this particular focus is for the domestic role of the bureaucracy, or maybe the bureaucratic delays caused on the economic front where foreign investors complain about Indian persistence with unnecessary regulations. National security debates in India have also been impaired by the generalist nature of the Indian bureaucracy. The bureaucracy suffers from the tradition of Vikramaditya throne, whereby wisdom and expertise are not acquired through dedication and toil, but are embedded in the chair a person occupies. The conceptual reality of this is that permanent bureaucracy becomes too career-oriented to offer rational policy options to the changing leadership. The bureaucracy because of its limited vision and expertise is unable to demonstrate any imagination so essential to develop the new thinking in the conflict-cooperation balance of the region. The religious zealots, extreme nationalists, and masses continue to mistrust the bureaucracy and have no confidence in them to protect vital national interests. The bureaucracy on the whole is viewed as a corrupt institution. Since early 1920s, Jawahar lal Nehru remained the undisputed architect, articulator, and practitioner of Indian foreign policy. His virtual monopoly over Indian foreign policy decisions not only lasted for over 40 years, but continues to dominate even after his death in 1964. On the domestic front, he did face opposition but never on his stance on external relations. None of his colleagues, contemporaries, or critics had any inclination to seriously confront his foreign policy. In the words of Stephen Cohen, “Even though Nehru encouraged debates on foreign policy issues, few politically strong figures could challenge him on the floor of the Parliament--- Nehru was a one-man policy, planning staff and coordinator, as well as the source of major
25

Business Review – Volume 3 Number 1 January – June 2008
initiatives that put India on the world’s diplomatic map----there was no need for institutional development in foreign policy when Nehru combined both expertise and political power.”11 Even the Sino-India debacle did not erode his diplomatic space, and he completely dominated the foreign and security policies with limited consultations with his colleague and subordinates. The dual role as India’s foreign minister eroded any room for consensus building. This Nahruvian tradition continued for a long time and foreign policy has remained the exclusive prerogative of the prime minister who often doubles as the minister of external affairs as P.V Narasimhma Rao, I.K. Gujral and Atal Behari Vajpayee. Another important tendency which over the years has contributed to the centralization of decision making with the prime minister is the working of the prime minister with a small group of advisers, though the decision-making is supposed to be the joint responsibility of the prime minister and his cabinet. The handpicked group of advisors alone was a part of and privy to the sensitive strategic decisions taken by prime minister, later formally endorsed by the cabinet. Since they were answerable and accountable only to the prime minister, their advice and suggestion tended to circumvent normal democratic institutions as well as parliamentary oversight. Indra Gandhi and Rajiv Gandhi continued with this practice. Vajpayee was also known for independent on the spur foreign policy decisions. J.N. Dixit in his memoirs, talks about how Foreign Minister Narishma Rao was not favorable to the idea of Indo-Sri Lanka accord of 1997. He made three points about the whole process of negotiations. First, India should not rush into this agreement. Second, it should carefully consider the wisdom of being direct signatories to this agreement. He was of the view that Sri Lankan Tamils should sign the agreement with Sri Lankan government and we should just be guarantors. Third, he suggested that India must very carefully assess whether the willingness of the LTTE and Sri Lankan government to come to an agreement was based on a genuine desire for peace and a durable settlement, and not just an interim tactical move. Suggestions of the then Foreign Minster were totally ignored and Rajiv Gandhi went ahead with the controversial accord. Sensitive national decisions, especially in the nuclear arena, were also confined to the prime minister, with the rest of the political leadership, the armed forces, and the bureaucracy remaining completely out of the process. The Foreign Ministry had no knowledge of Indian weaponisation program and was not informed about the goal of India acquiring a full balanced nuclear deterrence capability. The two examples definitely point towards a tradition of bypassing institutions, as well as towards institutional inadequacy in India. The institution of bureaucracy falls short both on the domestic and foreign policy front. The Indian bureaucracy on the whole is subordinate to the office of the Prime Minister, especially in matters of national security. It, however, does perform the usual role of a bureaucracy in a bureaucratic polity, where in routine decision-makings; focus on status quo is maintained and any innovative thinking or bold initiatives for conflict resolution are prevented.
26

Business Review – Volume 3 Number 1 January – June 2008
In Pakistan, bureaucracies agitate more controversies than any other component of the ruling establishment. The tradition of a strong centralized administration and an efficient framework of services, a legacy of the British, could have been an asset for the newly born state. Unfortunately, it became politicized immediately because of the constant interference by politicians and the military. The bureaucratic-military-elite are at the core of Pakistan’s power configuration. The military and bureaucracy are the principle institutions. Their elites are relatively small, cohesive, share similar political attitudes, and enjoy institutional bases of power. After independence, a new era began in which the role of the bureaucracy expanded rapidly, both horizontally and vertically. In place of law and order, development became the new buzzword. To undertake the development work of a newly formed country, the concept of statutory bodies came into existence. Laws were made to establish specialized bodies with specific objects with a great degree of autonomy, so they may function unencumbered with red tape. This changed the power and role of the bureaucracy radically; however, its traditional mindset was not altered at all. Bureaucratic attitudes became redundant to contemporary needs in two ways. First, the primary orientation was not altered from serving the masters to serving the masses. Second, Indian civil services were performance oriented; in that their primary role was to execute authority and justice on the beaten track. The institutional decay set in, which depicts itself by virtue of being heavily politicized and unable to provide basic public service, because the bureaucracy is fully aware that the political superiors are dependant on it for policy advice and administration, which is the key for their own political sustenance. The shift in the institutional balance of power in Pakistan in favor of the military and bureaucracy is interplay of domestic, regional and international, factors. They include the institution of strong central government, problem of asserting authority over provinces, and most critically, the defense imperative of a state besieged by external and internal threats, especially the initiation of hostilities with India over Kashmir. This allowed military-bureaucracy nexus deliberately and systematically weakening the political process by exploiting the rivalries among politicians on one hand, and manipulating their connection with the centers of the international system in London and Washington.16 Pakistan even bartered away its autonomy in foreign affairs to serve the interests of the military bureaucratic oligarchy. The Pakistan’s polity emerges as a textbook case of bureaucratic authoritarianism. The prevalence of this approach in the polity of Pakistan can be gauged by the following:
• Postponing the distribution of resources or even reversing it in order to foster economic growth. The Ayub Khan’s one unit and more recently the controversy and conflict over the allocation of NFC Awards, water distribution and storage (Kalabagh Dam) are examples of it.
• The desire to create a more efficient, internationally competitive economy and cultivating international economic actors, partners in the development
27

Business Review – Volume 3 Number 1 January – June 2008
model. In the past, policies followed by General Ayub Khan which created the dominance of twenty-two families in Pakistan followed this pattern. Pakistan’s continues with this dependence on international monetary agencies (IMF, World Bank and the Asia Development Bank). The macroeconomic reforms introduced at the behest of these agencies are not always people-centric and inclusive.
• Attempts to control or destroy movements which would undermine or resist such policies. Bureaucratic authoritarianism thus gets translated into a form of bureaucratic and technocratic military rule that seeks to curtail popular mobilization, and is built on political coalitions and policy orientation that entails strong ties to international economic actors. It is a form of modern rather than traditional authoritarianism and has a major bureaucratic dimension.
After practically sixty years of Pakistan’s existence, civil and military bureaucracies have had a very important role in the making and implementation of policies, both foreign and domestic. From devising development strategies to preparing fiscal and monetary policies, waging wars, keeping conflicts alive, negotiating foreign assistance, all has been done by senior bureaucrats. Politicians have occasionally barged in, but the impact has been very limited because of implementation constraints. The implementation is the prerogative of the bureaucrats. In Pakistan, the civil and military bureaucracy have always taken all major decisions. The chart below would gives details of the institutional balance in Pakistan
Power Balance in Pakistan
Time Period
Democratic Governments Bureaucracy Military Feudal
Politicians Religious Leaders
1951-58 In name Real Power Supporting Junior Partner
1958-69 Supporting Partner
Real Power Supportive Supportive
1969-71 Real Power Supporting Partner
West-Wing Support Supportive
1971-77 Real Power Downsized Influence Curtailed Partners Neutralized
1977-88 Restored Real Power Partners Very Supportive
1988-99 Competitive Democracy
Supportive Partner
Influence Curtailed Partners Supportive
1999-01 Supportive Partner Real Power Partners Supportive
2001-to date In name Supportive
Partner Real Power Partners Opposed
28

Business Review – Volume 3 Number 1 January – June 2008
The security debate and perceptions in Pakistan become more understandable because of the military-bureaucracy nexus. The unilateral focus on external threats and the India-centric security paradigm actually serves the purpose of this elite group. The gradual increase in internal security problems, because of these linear security perceptions, does not get impressed upon the policy makers of Pakistan. It is actually grounded in a strong tradition of the bureaucratic-organizational imperative. The world view of Pakistan is just divided between states that strengthen Pakistan against India and those who do not. Such a classification is convenient from the standpoint of the civil-military bureaucracy that has control over policy-making. The existence of a continued and formidable threat allows policy makers to get away with a simple security plan. This particular skew in policy making provides greater room for sustaining bureaucratic organizational interests, since military security is given precedence over every other agenda. As a result like any post colonial bureaucratic state structure, Pakistan defined security in tangible terms. More specifically, it is defined as an ability to stave-off a military threat from India. Due to the weak political process in Pakistan, the bureaucracy emerges as a major player in the conflict-cooperation equation in the region. The nexus between the military and bureaucracy makes it even more formidable, promoting patterns of conflict rather than cooperation in inter-state relations. Sri Lanka also inherited a strong framework of civil service at independence. Its composition and nature, however, kept changing. Its merit and political neutrality was compromised because of the ethnicity based civil war in Sri Lanka. The political class in Sri Lanka assumed dominance over the bureaucracy, particularly because of a functioning parliamentary democracy. Nonetheless, politicization of services led to several evils including corruption in administration, overstaffing, and inefficiency. Parliamentary constituencies became more like the fiefdoms of parliamentarians. In effect the role of the civil services in Sri Lanka stands undermined. In Nepal there is largely uninstitutionalized competition for power. The bureaucracy or civil service hardly exists. The policy making in Nepal suffered because of a total absence of political institutions controlling the bureaucracy. The mechanism of parliamentary control did not grow fast enough and, therefore, the old practices of subservience, unquestioning obedience, sycophancy and personal service continued. The 1990 Constitution thus confers the professional civil service commitment to the principle of bureaucratic neutrality, recruitment by competition on merit, and promotion on grounds of efficiency and seniority has not really evolved. In Bhutan, there is a policy of self imposed isolation because of its claustrophobic geographical position where larger, richer, stronger, and occasionally antagonistic neighbors have made external relations crucial not only to its survival as an independent state, but also its internal politics. Like any other buffer state, Bhutan has sought security by pursuing a policy of withdrawal from the surrounding world.
29

Business Review – Volume 3 Number 1 January – June 2008
The rigid postures and maximilist position adopted by the bureaucrats and the politicians of the region have been the bane of cooperation. It often serves the purpose of the political leadership under pressure from various lobbies to let the bureaucrats assume a harsher posture, while maintaining their own mild and friendly tone. This tactic is a mark of India-Pakistan relations. This confuses people, provides sustenance to hawks, and causes despair to those interested in peace. For cooperation to happen in the region there is a need for bold initiatives and out of box solutions. The courage to propose and do what has not happened so far. The bureaucracies of the region will have to fall in line. Rampant corruption, which the bureaucracy is a part and parcel can only be eliminated if more transparency, access to information, and accountability is introduced. The protection mechanisms are also to be abolished. Since the violence in South Asia is structural and the bureaucracies are a part of this violence, South Asia call for a radical change to do away structural violence both at inter and intra-state levels. REFERENCES Proponents of the model claim that bargaining among foreign policy bureaucracies is the key to understanding a state’s foreign policy output. However, the role of both domestic and international politics cannot be subtracted from the equation. The term civil service was first coined for the employees of the East Indian Company, who served in departments other than the military. Subhash C Kashyap, The Political System and Institution Building Under Jawahar lal Nehru (New Delhi: National Publishing House, 1990), p.76. For a detailed analysis see Bardhan P, The Political Economy of Development in India (New Delhi: Oxford, 1990). Subash C. Kashyab, Institutions of Governance in South Asia (New Delhi: Konark Publishers, 2000), p.117. See Muchkund Dubey, Nancy Jetly (eds.) South Asia and its Eastern Neighbors, Building a Relationship in the 21st Century (New Delhi: Konark Publishers, 1999). Indian trade relations with Nepal, Sri Lanka and Bangladesh are pertinent examples. Investors from the US, Japan, Britain, Israel and Singapore have also voiced concerns about the bureaucratic delays. VIKRAMADITYA, a legendary Hindu king of Uzjain, who is supposed to have given his name to the Vikram Samvat, the era which is used all over northern India, except in Bengal, and at whose court the " nine gems " of Sanskrit literature are also
30

Business Review – Volume 3 Number 1 January – June 2008
supposed to have flourished. The Vikram era is reckoned from the vernal equinox of the year 57 B.C., but there is no evidence that that date corresponds with any event in the life of an actual king. As a matter of fact, all dates in this era down to the loth century never use the word Vikram, but that of Malava instead, that being the tribe that gives its name to Malwa, The name Vikramaditya simply means " sun of power," and was adopted by several Hindu kings, of whom Chand-ragupta II. (Chandragupta Vikramaditya), who ascended the throne of the Guptas about A.D. 375, approaches most nearly to the legend. Subrahmanyam, “Introduction” in Jaswant Singh, Defending India (London: MacMillan Press, 1999), p. XXV. P. R. Kumaraswamy, “National security: A critique”, in P.R. Knmara Swany (ed.), Security beyond Survival (New Delhi: Thousand Oaks, London, 2004), p.27. Stephen P. Cohen, India: Emerging Power (Washington DC.: The Brookings Institution, 2001), p.69. Ibid., p. 22. Vajpayee’s invitation to Musharraf to visit Delhi on 24 May 2001. J.N. Dixit, Assignment Colombo (New Delhi: Konark Publishers, 1998), pp. 119-20. Subrahmanyan, “Indian nuclear policy” quoted by P.R Kumaraswami “National security: A critique”, in P.R Kumaraswami (ed.), Security Beyond Survival (New Delhi: Sage Publications, 2004), pp.31-32. Ayesha Jalal, Constructing the State, The State of Martial Law: The Origin of Pakistan’s Political Economy of Defence (Cambridge: Cambridge University Press, 1990). The concept of bureaucratic authoritarianism arose from the study of major episodes of authoritarian rule in South America between the 60s and the 80s. Bureaucratic authoritarianism is a type of a military rule interrupted now and then by elected Governments but it is led by the military .This form of rule has been interpreted as distinctively bureaucratic because national leadership was dominated by individuals who has risen to prominence not through political careers but through bureaucratic careers in large public and private organizations, including international agencies and transnational corporations. Decision making is usually technocratic.
31
Business Review – Volume 3 Number 1 January – June 2008
Robert J. Art, “Bureaucratic authoritarianism”, in Joel Krieger (ed.), The Oxford Companion to the Politics of the World (New York: Oxford University Press, 1993), pp.96-98. Ayesha Jalal, “Pakistan’s security perspective: Problems of linearity”, op. cit. , pp.166-70. De Silva. K. M. The Bureaucracy in Sri Lanka: Problems of Governance (Dehli: Konark Publishers, 1983), pp.83-98. Subhash C. Kashyap, Institutions of Governance in South Asia (New Delhi: Konark Publishers, 2000), pp.101-04.
“The only person over whom you have direct and immediate control is your self. The most important ossets to develop, preserve, and enhance, therefore, are your capabilities. And no one can do it for you. You must cultivate the habits of leadership effectiveness yourself and doing so will be the single best investment you’ll ever make”
STEPHEN R. COVEY
32

Business Review – Volume 3 Number 1 January – June 2008
ARTICLE
Effects of Free Trade Agreements (FTAs) on Construction Firms in Singapore
Low Sui Pheng
National University of Singapore
June S.Y. Khoo National University of Singapore
ABSTRACT Since the 1950s, the international trading system has been characterized by a shift from the multilateral processes towards bilateral and regional arrangements. The signing of the US-Singapore Free Trade Agreement (USSFTA) by the Prime Minister of Singapore and the President of the United States is but part of Singapore’s overall trade initiatives and economic strategy which involves forging free trade agreements (FTA) with other countries outside the ASEAN region. This study seeks to analyze the effect of FTA in the context of the construction industry with respect to local contractors. A questionnaire-based survey and in-depth personal interviews were conducted with the local contractors to understand the implications of FTAs on them. A similar set of questionnaire was also formulated for the foreign contractors to identify the impact of FTAs in the local industry. The discussion of FTAs effectiveness on Singapore contractors was limited by the lack of necessary information. As the pursuit of bilateral FTAs is a relatively new development in Singapore’s trade policy with many new FTAs under negotiations, opportunities for the local contractors on these potential FTA partners remain to be seen. Keywords: Free Trade Agreements, Construction, Contractors, Trade Policy, Singapore INTRODUCTION
A
phenomenal integration of the world economy through multilateral, preferential and bilateral trade liberalization has been observed over the past two decades.
Multilateral liberalization under the General Agreement on Tariffs and Trade (GATT) and later the World Trade Organization (WTO) have resulted in significant reduction of trade barriers and the expansion of the scope of negotiations. However, the problems and delays of recent rounds of multilateral negotiations have led to many countries seeking alternative routes to trade liberalization. In particular, many countries are forming Regional Trading Agreements (RTAs) as a means to maintain forward momentum towards trade and investment liberalization to prevent a return to protectionism (Bergsten, 1998). It is also hoped that such arrangements would bring about more rapid liberalization than is possible multilaterally.
33
Business Review – Volume 3 Number 1 January – June 2008
This surge in RTAs has been termed the “new” or “second” regionalism to distinguish it from the “old” or “first” regionalism of the 1950s and 1960s when many attempts to form regional trading blocs were made in various parts of the world without much success (Krugman, 1993). The term “regionalism” does not have any geographic connotations here and refer to any trade initiatives that are not multilateral in nature (Rajan, et al., 1995). Though some authors have taken the view that another principal force behind the new regionalism is the conversion of the United States from staunch multilateralist to fervent regionalist, this view has been clearly refuted by Baldwin (1997). Singapore’s moves to bolster its integration with the global economy via the Free Trade Agreement (FTA) route find a parallel with that of the United States in the early 1990s. An FTA is a legally binding agreement between two or more trading partners for closer economic integration. FTAs are a form of RTAs due to their discriminatory nature, where preferential and reciprocal market access is provided only to contracting members. Singapore has concluded numerous FTAs, including a regional one with ASEAN (AFTA) and five other bilateral ones with New Zealand, the European Free Trade Association, Japan, Australia and the United States, among others. Singapore’s pursuit of FTAs can be viewed as a form of insurance against the increased economic uncertainty of the region and the problems associated with other trade liberalization paths. FTAs appear to be increasingly regarded by policy-makers as effective and expeditious instruments for achieving trade liberalization among “like-minded” trading partners (Schiff, et al.2000). Formation of bilateral FTAs among such partners is also seen as a way to overcome the so-called “convoy problem”, whereby the pace of trade integration is held back by the least willing member or, as it is sometimes said, those who can run faster should run faster and ought not to be held back by those who choose not to run or do so at a snail’s pace. While the argument that negotiating regional trade pacts are easier to conclude and can be done at a faster pace than global negotiations may not hold true as a general rule (Baldwin, 1997; Bhagwati, 1991), it does seem appropriate in the case of Singapore which sets strict deadlines for completion of discussions. In addition, as trade agreements nowadays go well beyond trade in goods to encompass an increasing number of areas and issues, FTAs could act as a testing ground or pilot project for exploring complex trade issues and may help establish some sort of precedent or benchmark for trade negotiations involving a large number of countries, including one at the multilateral level (Baldwin, 1997). The FTA initiatives by Singapore may also be a means of building political momentum for other ASEAN/APEC member economies to hasten the process of regional and unilateral liberalization (Bergsten, 1998). Simultaneously, to the extent that
34

Business Review – Volume 3 Number 1 January – June 2008
contracting parties to an FTA agree to move beyond their respective WTO commitments, there may be a demonstration effect that motivates future rounds of broader multilateral negotiations under the auspices of the WTO. Singapore’s embrace of the FTA option is clearly aimed at it being “WTO-plus” rather than a “WTO-substitute”. It has therefore taken pains to reaffirm the primacy of the multilateral trading system. With respect to the construction industry, Abdul-Aziz and Tan (1998) have studied the impact of GATT and GATS on the global construction industry. The effect of GATS on the construction industry shows that many of the provisions would only come into force through a process of gradual liberalization. Major changes may be slow in coming to the global construction industry but the transformation is likely to be far from uneventful. Abdul-Aziz and Tan’s (1998) findings also showed that no contractors in Malaysia had any idea of the long-term ramifications of the multilateral trade talks to the industry. Singapore, being one of the most open trading nations with the highest GDP-to-trade ratio in the world (Rajan, at al., 2001) and ever ready to identify changing trends of the international trading system is a strong supporter of the new regionalism. Though a major proponent of global trade and investment liberalization, the slow progress of talks at the WTO and Singapore’s limited influence in affecting liberalization in the multilateral arena have prompted it to pursue a second track to liberalization via the regional route. Singapore’s embrace of the new regionalism took the form of participation in ASEAN (Association of Southeast Asian Nations), APEC (Asia-Pacific Economic Cooperation) Forum and AFTA (ASEAN Free Trade Agreement). The decline of ASEAN as a political force (Hadi, 1991) and its collective economic strength coupled with the slow implementation of AFTA and the incapability of APEC to reach a substantial action plans (Sakong and Lee, 1995) seem to have led to Singapore’s pursuit of FTAs. One of the FTAs’ main objectives is to help Singapore companies establish a presence abroad either through the export of more goods or the setting up of overseas branches and is beneficial to Singapore companies as they help to create bigger markets for products and services. In the construction industry, it will help Singapore contractors to export services/products overseas and contractors should therefore take advantage of the benefits brought about by the FTAs. It would appear that contractors generally show little knowledge about the FTAs and are not aware of the benefits FTAs can bring to the local contractors. It is therefore the aim of this study to find out how the FTAs are beneficial to the local contractors and the effect on the FTAs in relation to the local contractors in Singapore. In addition, this study aims to fill the lack of research on the impact of FTAs in the construction industry.
35

Business Review – Volume 3 Number 1 January – June 2008
The methodology employed in this study consists of a questionnaire-based survey and in-depth personal interviews with senior executives of local construction companies. The questionnaires were designed to solicit information within an academic framework. Phone interviews and personal visits were made to the contractor’s office in order to secure good response for the surveys and interviews. The executives who participated in the field work have all possessed an overview of the way the company is run because this research is largely a policy study and the interviewees had to be in the position to explain how their corporate systems worked. HISTORY OF FREE TRADE AGREEMENTS Free Trade Agreements (FTAs) and Customs Unions, such as the European Union, together comprise the main exception to the Most-Favored-Nation (MFN) principle, the fundamental rule guiding trade in goods among members of the World Trade Organization. Under the MFN rule, members of the WTO must give fellow WTO members no less favorable treatment in terms of tariff rates and other trade measures than they afford to any other country. FTAs and Customs Unions (together defined as Regional Trade Agreements or RTAs in WTO terminology) are exceptions to this rule. WTO rules allow individual countries to afford preferential treatment to partners in an RTA, provided that the RTA conforms to certain strict conditions. The rationale for allowing this exception is set out in Article XXIV of the General Agreement on Tariffs and Trade (GATT) of 1947, which provided the foundation for the later WTO agreements. Article XXIV recognized the desirability of increasing freedom of trade by the development of closer integration between member countries through agreements establishing customs union or free-trade areas. At the same time, strict conditions apply to RTAs to ensure that they perform a truly liberalizing function in international trade and do not encourage the establishment of new barriers, or provide an easy route to introduce new measures discriminating between trading partners. The crucial test of an FTA or Customs Union is that it must eliminate all tariffs and other restrictions on substantially all the trade in goods between its member countries. Although WTO members have differed over how precisely to define "substantially all trade", few would disagree that this means, at the very least, that a high proportion of trade between the parties - whether measured by trade volumes or tariff lines - should be covered by the elimination of tariffs and other restrictive trade regulations. While free trade in goods has been the focus of virtually all FTAs concluded to date, the WTO also provides for bilateral or regional agreements liberalizing trade in services. Technically, these are called "economic integration agreements" (EIAs), sometimes described as "services FTAs". The conditions for concluding EIAs as
36
Business Review – Volume 3 Number 1 January – June 2008
exceptions to the Most Favored Nation principle are set out in Article V of the General Agreement on Trade in Services (GATS). EIAs are allowed so long as they (a) have substantial sector coverage, and (b) provide for the absence or elimination of substantially all discrimination between parties, through the elimination of existing discriminatory measures, and/or prohibition of new or more discriminatory measures. To date, no EIA covering services has been concluded separately from an FTA covering trade in goods as well. While an FTA, as defined under the WTO, does not have to include trade in services, most contemporary agreements that are labeled "Free Trade Agreements" cover both goods and services, reflecting the growing importance of services in the global economy. Such agreements are effectively a combination of FTAs and EIAs. In fact, FTAs together with EIAs provide a framework under which countries can negotiate a range of other bilateral undertakings governing their economic relations. In addition to trade in goods and services, FTAs frequently cover such issues as investment protection and promotion, government procurement and competition policy, which are either not yet encompassed by WTO rules or only partially covered. FTAs often also contain practical provisions in areas such as harmonization or mutual recognition of technical standards, customs cooperation, application of subsidies or anti-dumping policies, electronic commerce, and protection of intellectual property rights. Such provisions do not have to be included in FTAs under WTO rules, but they can play an important role in facilitating trade between the parties and in a broader regional context. Such bilateral or multi-lateral economic agreements are often given titles such as "Closer Economic Agreements" or "Partnerships" to reflect their broad scope, even if FTA provisions eliminating restrictions on trade in goods form the core element. GATT/BRETTON WOODS AGREEMENT GATT was established on a provisional basis after the Second World War in the wake of other new multilateral institutions dedicated to international economic cooperation – notably the “Bretton Woods” institutions now known as the World Bank and the International Monetary Fund. It was an effort at trade liberalization and the correction of protectionist measures which were prevalent in the 1930s. Tariff concessions and rules on world trade disciplines together became known as the GATT and came into force in January 1948. The first round of tariff-reduction negotiations took place in 1947, with 23 participating countries and resulted in 45,000 tariff concessions, affecting about one-fifth of world trade. The subsequent rounds of negotiations were all concerned with tariff reduction. The sixth trade round, the Kenney Round (1963-7), was the first to deal with reduction of certain non-tariff measures. It was also then that the GATT Anti-Dumping Agreement was conceived.
37

Business Review – Volume 3 Number 1 January – June 2008
The Tokyo Round (1973-9) resulted in further tariffs reduction, a series of agreements on non-tariff measures and “framework” agreements, which GATT members must abide by. It brought the average tariff in manufactured products down to 4.7% compared with about 40% at the time of GATT’s creation (WTO, 2000). It also led to the legalization of preferential tariff and non-tariff treatment in favor of developing countries and among developing countries and a number of codes dealing with non-tariff measures (Hoekman and Kostecki, 1995). The Uruguay Round was the latest and most extensive trade round, with an enlarged number of 123 participating countries. The subjects covered include tariffs, non-tariff measures, rules, services, intellectual property rights, dispute settlement and reintegration of agricultural trade and textiles and clothing into the GATT. As more issues came under the auspices of the GATT, it was necessary to have a permanent institution where commitments are full and binding. Hence an agreement to establish the WTO was reached at the end of the Uruguay Round in April 1994. WORLD TRADE ORGANIZATION The World Trade Organization (WTO) was established on 1 January 1995 and is based in Geneva, Switzerland. It is the successor to the GATT and an embodiment of the results from the conclusion of the Uruguay Round. The WTO is the legal and institutional foundation of the multilateral trading system. It provides the main contractual obligations determining how governments frame and implement domestic trade laws. It is charged with the responsibility of implementing the numerous agreements that were reached in the Uruguay Round. The successful establishment of the WTO in 1995 to replace the GATT did not alter the constraints inherent in a multilateral approach. Indeed, in the years following, FTAs blossomed. In 1995, there were 80 FTAs registered with the WTO. In 2003, there were 179. EVOLUTION OF REGIONAL TRADING AGREEMENTS (RTAs) The proliferation of RTAs can be viewed in two waves: the “old” regionalism of the 1950s and 1960s and the “new” regionalism in the 1990s. While the old regionalism involved RTAs of contiguous countries and shallow integration, the new wave involved intercontinental agreements and commitments to harmonization of service sectors, regulatory measures and even human capital. One of the factors contributing to the increase in popularity of RTAs would be the failure of the Uruguay Round of GATT – a reflection of faltering faith in the ability of the multilateral trading system to further sustain the momentum of trade liberalization. Each successive round of negotiation took much longer to complete
38

Business Review – Volume 3 Number 1 January – June 2008
than the preceding round. The first round in Geneva took less than a year to conclude, but the Uruguay Round took eight years (Krugman, 1993). Regional or bilateral agreements may bring faster results than the multilateral process, may enable parties to conclude levels of liberalization beyond the multilateral consensus, and may be able to address specific issues that do not register on the multilateral menu. The resulting achievements in trade liberalization can be substantial complements to the WTO system, and they can be important building blocks for future multilateral liberalization. Countries thus turned to RTAs to serve as an alternative approach towards multilateralism. Baldwin (1997) explained the boom of RTAs via the Domino theory - RTAs commonly result in trade and investment diversion for the participants and this in turn generates pressures on excluded nations to get involved. Baldwn (1997) also argued that US hegemony is vital to the sustenance of GATT and that ensuring a shift from multilateralism to regionalism thus inevitably leads to the increase in RTAs worldwide. Krugman (1993) suggested that RTAs are increasing due to their easy negotiation and implementation as compared to the complexity of multilateral agreements. These FTAs can then serve as building blocks for other countries to join in the liberalization movement. Geo-political considerations have also played a part in the proliferation of FTAs. In Southeast Asia, for instance, China proposed, and ASEAN accepted, to establish an FTA within ten years. China did not want ASEAN to view her economic ascent as a threat and it wished ASEAN to participate in the opportunities arising from its development. Aside from economic considerations, the pursuit of RTAs can also be politically motivated. In Singapore’s case, it provides opportunities to seek political allies and also allows Singapore to gain recognition and raise it status internationally. In particular, Singapore’s FTA with the United States serves to reinforce Singapore’s diplomatic ties with the United States. This is viewed as an important factor to Singapore which relies actively on the United States for military procurements and training grounds. The United States presence is also deemed vital by Singapore for maintaining security and stability in the region. SINGAPORE’S FTA NETWORK Singapore could not afford to wait for other countries in the region to strengthen their commitment towards trade liberalization. Singapore needed to ensure that it remained attractive to investors even if the region as a whole did not. The need to
39

Business Review – Volume 3 Number 1 January – June 2008
liberalize quickly is made more urgent by China’s entry into the WTO and the implications that such a move brings with it. In recent years, China has eroded a substantial share of the total new investments coming into Southeast Asia. With the entry of China into the WTO, the share of investments captured by ASEAN is expected to fall further. In recent years, Singapore’s relatively higher cost of production has led to many firms relocating their production plants to neighboring countries. This is a major concern as it poses a potential risk of having the manufacturing sector hollowed out, resulting in catastrophic implications for employment. In order to cope with this problem, Singapore actively encouraged its companies to go regional by shifting their lower-end production activities to cheaper regional locations while at the same time, maintaining their more important, higher-end activities in Singapore. However, the problems with this regionalization drive of the 1990s meant that a new strategy was needed to cope with this problem. Singapore’s pursuit of bilateral FTAs stemmed partly out of a need to solve this problem. This is because the possible shift of export platforms from regional countries to Singapore, so as to benefit from preferential access to markets of Singapore’s FTA partners, would help alleviate this problem. Singapore has one of the largest FTA networks in the region spanning the United States, Asia, Europe and in the near future, the Middle East. This diverse network helps to expand the economic space by providing Singapore-based companies with preferred access into their FTA partners’ markets. Amongst the FTAs signed and concluded, the integration between Singapore and New Zealand (ANZSCEP) was the first to be launched on 18th August 2000. Singapore and Japan’s FTA (JSEPA) was concluded in October 2001. A free trade pact between Singapore and the European Free Trade Association (EFTA) states of Switzerland, Liechtenstein, Norway and Iceland came into force on 1st January 2003. Besides these, Singapore also engaged into an FTA with Australia on 17th February 2003. Singapore then took a bold step to initiate a bilateral agreement with her largest trading partner, the United States. The negotiation was finally wrapped up and became effective from 1st January 2004. Table 1 shows some of the dates of entry and review for FTAs concluded by Singapore. On the regional front, China is the new economic powerhouse. Singapore is in negotiations to strategically engage it through the ASEAN-China FTA. At the time of writing, ASEAN will commence FTA talks with Japan and India shortly, and in the near future, South Korea. Singapore was similarly in negotiations with India, Canada, Mexico, Jordon and New Zealand-Chile. FTAs with South Korea and Sri Lanka are also in the pipeline. The benefits and costs of Singapore’s FTA network are discussed in the next section to further elaborate on the reasons for Singapore to pursue FTAs.
40
Business Review – Volume 3 Number 1 January – June 2008
OPERATIONAL DETAILS OF FTAs There are basically six main areas of coverage in the FTA: • Trade in Goods • Trade in Services • Investment • Government Procurement • Dispute Settlement • Movement of Natural Persons As far as the construction industry is concerned, in the 4 modes of Supply for Trade in Services, the third mode (i.e. commercial presence) and the fourth mode (i.e. presence of natural persons) are the most frequently employed methods of service delivery. Specific to construction, Market Access and National Treatment would allow foreign contractors to establish a permanent presence in Singapore. In addition, they can expect equal application of tax, investment, licensing, financial and other relevant national policies. In construction, the lack of transparency has paved the way for substantial discrimination against foreign contractors. Complete transparency in construction may be difficult simply because of the vast number of laws and regulations – those specific to construction as well as those indirectly affecting the industry such as investment laws and measures, certification of professional qualifications and licensing requirements. Each of Singapore’s FTAs goes beyond the four basic tenets of liberalization towards deeper economic engagement. One of the salient features of liberalization with the United States agreement relevant to construction is the provision for architects and engineers to boost exchange of building and construction talents. This entails consultation to develop mutually acceptable standards for licensing and certifying professional service providers, especially architects and engineers. Under the investment chapter, local contractors are granted equal treatment with foreign contractors in partner countries. Singaporean contractors may freely transfer profits from investments out of partner countries. These benefits provide local contractors with a stepping-stone to invest in construction operations overseas. With a more predictable operating environment, local contractors can export with less risks and more assurance. Singaporean contractors often face common threats that include entry barriers in favor of indigenous firms and competition with both indigenous contractors and
41

Business Review – Volume 3 Number 1 January – June 2008
other foreign firms. This has impeded many Singaporean contractors from exporting, as they are commonly disadvantaged in both developing and developed countries. In developed countries where greater emphasis is placed on areas such as design, quality and technology, Singaporean contractors have no distinct competitive advantage as compared to the indigenous firms. In developing countries, where the conditions favor financing and Build, Operate and Transfer or BOT arrangements in the larger projects, local contractors are disadvantaged when compared to firms from the United States, United Kingdom, Europe, Japan and South Korea which have the financial resources and back-up from government aid programs and export credit facilities. However, these threats will be slowly removed with Singapore increasing the FTA network with her partner countries. Contractors can enjoy better market access, national treatment and fair domestic regulation with Singapore’s FTA partner countries. With effective exchange of talents and knowledge through stronger bilateral relationships, Singaporean contractors can effectively target their market niche in the relevant markets. Table 2 shows the commitments of some of the FTAs signed so far in relation to construction related sectors. Other than the EFTA, which has some restrictions, all other FTAs are committed to the construction sector. As an FTA partner, Singaporean contractors can make use of the investment advantage by entering into joint investments with contractors of the partner country. By forming consortiums, contractors can then pool their technical, administrative and marketing resources to reduce costs and risks as well as to build on each other’s strengths in technical and management resources. Through the joint investments, Singaporean contractors will be better enabled to build up their brand name in foreign countries. With FTAs being negotiated with countries like China and India, this will further strengthen relations for Singaporean contractors who are currently exporting to these countries and at the same time, help to encourage more Singaporean contractors to export their services overseas. SURVEY FINDINGS The research began with understanding the history of FTAs, their operational details and the FTAs that have been signed with Singapore. The effects of FTAs on the export of construction services were also described. A survey was then conducted to explore the effectiveness of FTAs for Singaporean contractors. Effectiveness in this case can be defined as how the FTAs benefit Singaporean contractors in venturing overseas. At the same time, the survey served to find out more about contractors’ knowledge of FTAs and their awareness level of the benefits. It aims to examine contractors’ interests in FTAs and the current export volume of Singaporean
42

Business Review – Volume 3 Number 1 January – June 2008
contractors in relation to the FTAs. The effectiveness of FTAs on Singaporean contractors can then be evaluated and suggestions made to raise awareness of FTAs to contractors. The sampling frame for the selection of construction companies was taken from the Building and Construction Authority (BCA) Contractor’s Registry. 48 local contractors were randomly surveyed. A questionnaire survey form was prepared and pilot tested before sending to the contractors identified in the sampling frame. 35 local contractors responded, which equates to a response rate of 73%. 10 responses were secured through telephone interviews with senior managers and managing directors involved with managerial and policy matters. Four of the firms belonged to BCA’s list of Top 20 Exporting Construction Firms at the time of the study. Only senior managers who are involved with managerial and policy matters were surveyed. The 35 local companies were all registered in the BCA Contractor’s Registry under the CW 01 General Building Work-head. 25 of the 35 respondents (or 71.4%) are currently exporting construction services overseas. Of the 25 local contractors involved in export, the markets exported to include China, Malaysia, Vietnam, India, Thailand, Taiwan and Australia. Only one respondent was exporting to a FTA partner country, Australia. Most of the contractors are exporting goods and services to China and the Indian subcontinent. As FTAs provide a level playing field and better market access for local contractors exporting overseas, it is important to understand the difficulties local contractors face when exporting to determine how much they can benefit from the FTAs. The respondents involved with export were asked about the barriers they faced. The results in Table 3 show that 80% of Singaporean firms experienced “Discriminatory practices of host government, which favor local companies” and 60% found “Excessive licensing fees” as a barrier. With FTAs being signed, Singaporean contractors can expect to reduce the barriers encountered. For example, discriminatory practices in FTA partner countries will no longer be a problem as “national treatment” will be given to Singaporean firms, i.e. they will be treated like locals upon entering FTA partners’ markets. Although FTAs provide Singaporean firms with the added advantage of better market access and ease of operation overseas, there are other factors that can influence their decisions to export overseas. In Table 4, of the 35 respondents, 34 (97.1%) viewed the economic situation of the country as an important factor affecting their decisions. 30 (86.7%) respondents indicated the political and legal situation as a factor affecting their export decisions. 20 (57.1%) respondents were also concerned with the construction technology adopted in the foreign country. It is interesting to find that none of the respondents viewed social and cultural differences as a factor of concern when venturing overseas.
43

Business Review – Volume 3 Number 1 January – June 2008
This finding suggests that despite opportunities provided by the FTAs, local contractors still have to consider other aspects like construction technology used in FTA partner countries. If construction technology differs between countries, it may be difficult for Singaporean contractors to export to the FTA partner country. The economic situation of the country is an important factor for Singaporean contractors to export and opportunities must also be available in the construction sector of the partner country. So far, the agreements Singapore have signed are with developed countries like the United States, Japan and New Zealand; opportunities for the construction sector in these countries are not as high compared to developing countries. In developed countries, most of the infrastructure and buildings have already been built and thus opportunities for Singaporean contractors would appear to be significantly lower. AWARENESS LEVEL OF FTAs With the opportunities provided, it is important for Singaporean contractors to be aware of the FTAs before they can take advantage of the benefits they provide. From the survey results in Table 5, 17 out of the 35 respondents (48.6%) ranked their awareness level of FTAs at 4 points and above on an a Likert scale of 1 to 5. 12 respondents (34.3%) ranked the awareness of FTAs at the median point of 3. None of the respondents claimed that they are not aware of FTAs. With an average of 3.5, it appears that Singaporean contractors are aware of the existence of FTAs. With this awareness, the respondents were asked what benefits they think FTAs can bring to Singapore. 23 out of 35 respondents (65.7%) felt that “Goods manufactured in Singapore will enjoy lower tariffs” and only 10 respondents (28.6%) found it beneficial for “Service companies to enjoy better market access and ease of operation”. The response indicated that a large proportion of Singaporean contractors found FTAs more beneficial to the manufacturing sector for goods rather than service companies like contractors in the construction sector. The respondents were asked to rank their knowledge of benefits of FTAs for the construction industry on a Likert scale of 1 to 5 (1 being not aware and 5 being fully aware). From Table 6, 32 contractors (91.4%) indicated they were not aware of the benefits of FTAs to the construction industry. None of the contractors were fully aware of the benefits FTAs can bring to them. The average score is 1.9, suggestion that Singaporean contractors were not very aware of the benefits that FTAs can bring to the construction industry. Although local contractors are aware of the FTAs Singapore is actively signing with her foreign partners, only a small proportion of them have specific knowledge of the
44

Business Review – Volume 3 Number 1 January – June 2008
benefits that FTAs can bring to the construction industry. Of those who were aware of the benefits (those who ranked 3 and above), their source of knowledge of these benefits was surprisingly from reports in newspapers, magazines, media and internet and not from governmental bodies or other construction firms. A comparison was made between contractor’s knowledge of FTAs and the export volume. Three contractors (8.6%) ranked their knowledge of FTAs as being aware. All three contractors were exporting overseas. However, interestingly, their export volume was not as high as some other contractors in the survey. This is illustrated in Table 7 for two contractors who were interviewed; one with very high export volume and the other with low export volume. The study suggests that the export volume of the contractors may not necessarily be linked to their knowledge of the FTAs. A contractor with a higher knowledge of FTAs may not necessarily have a high export volume; similarly a contractor with a high volume of overseas contracts may not necessarily have much knowledge about the FTAs. From the two interviews, this phenomenon can be attributed to the following factors: • Contractors were not exporting to FTA partner countries. • Publicity talks have not been sufficient nor beneficial to local contractors. • Emphasis on construction in FTA negotiation was not significant. Contractors with low export volume would appear to have higher knowledge of the benefits of FTAs on the construction industry because they are more interested in opportunities that would allow them to export overseas. This would help them to gain greater market share and establish a niche for themselves in the foreign market. Although the respondents have little knowledge of the benefits which FTAs can bring to the construction industry, 25 of the 35 respondents (71.4%) are still interested in the FTAs. Some of the reasons given by the respondents for their interests in FTAs included: • Increasing market share • Expanding business overseas • Spreading of risks with diversification into new markets • Economies of scale generated by enlarged market base • Encouragement from BCA to export overseas • Dwindling local market demand However, 10 (28.6%) respondents were not interested in FTAs. From the interviews, the main reason appears to be that there was no significant impact of FTAs on the construction industry. This can be further explained through the respondents’ perceptions of the importance of FTAs on construction exports, as shown in Table 8. The respondents generally felt that FTAs were not significant for the construction
45

Business Review – Volume 3 Number 1 January – June 2008
industry (at a Likert scale of 1 being least significant and 5 being most significant). None of the respondents viewed the FTAs as being very significant. The average significance level of FTAs, in the opinion of the respondents, was 2.2. This seems to suggest that from their point of view, most do not find FTAs particularly significant and useful for the construction industry. One reason why Singaporean contractors do not find FTAs significant could be due to the countries involved in the FTAs. These are predominately developed countries like Australia, Japan, the United States, New Zealand, and European countries like Switzerland, Norway, Iceland and Liechtenstein, which appear to provide little opportunities for Singaporean contractors. 26 (74.3%) of the respondents showed interest in exporting to FTA partner countries with preferential treatment. The remaining 26% expressed no such interest. Amongst the 26 respondents who showed interest, 22 of them did not choose any of the FTA partner countries to export to. The four contractors who would consider exporting to FTA partner countries preferred to export to Australia, New Zealand and Japan. None of the contractors chose to export to the United States or countries in the EFTA. No contractors chose the United States and countries in EFTA largely due to the operational difficulties involved when exporting to these countries where they have to compete with the larger and more established firms in their local markets. From the interviews and surveys conducted, it appears that the respondents showed little interests in the FTA partner countries that Singapore currently has an agreement with. Instead they were more interested in the developing countries and Southeast Asian countries. Some of the countries which they were also interested with included Taiwan and countries (such as China and India) that have ongoing negotiations with Singapore. Many respondents viewed China and India as ideal export markets due to their low operating costs and BCA’s incentives for companies to form consortia in China. However, taxes and duties were still high in China and India; therefore FTAs with them will benefit Singaporean contractors. 15 (42.9%) respondents found the preferential treatment for foreign companies entering Singapore a threat. Some of the reasons given by the other 20 contractors for not viewing this as increasing competition were because there was already a low demand for construction in Singapore; therefore foreign contractors were unlikely to be interested in the Singapore market. Moreover, they do not seem to view the benefits of the FTAs as sufficient enough to influence a big influx of foreign contractors into Singapore. Instead, some respondents viewed the entry of foreign contractors as a good chance for technology transfer or acquisition of skills which would help in upgrading their company and gearing them for operations overseas.
46
Business Review – Volume 3 Number 1 January – June 2008
CONCLUSION With Singapore’s pursuit of FTAs, this study examined if FTAs were beneficial to the construction industry and the effect of FTAs on Singaporean contractors. The survey findings suggested that with FTAs being signed and under negotiations, Singaporean contractors have some knowledge of the FTAs. The respondents in general were aware of the FTAs although they may not have full knowledge of the benefits that FTAs can bring to the construction industry. Contractor’s awareness of FTAs was mainly attributed to the media/news. With BCA’s encouragement to export overseas, Singaporean contractors were therefore receptive to any opportunity that can help to facilitate their export of services overseas. However, due to a lack of coordinated dissemination of information from the respective government bodies to the construction industry, Singaporean contractors do not appear to be fully aware of the benefits that FTAs can bring to them. Several suggestions were made to raise awareness of FTAs to Singaporean contractors, one of which would be for the BCA to organize more talks and seminars. The survey findings also seem to suggest that FTAs, despite all the perceived benefits when exporting to the respective FTA partner country, do not necessarily benefit Singaporean contractors. There were several factors that would determine the local decision to export. As Singaporean contractors were not as established and diversified in the technology of construction, one of the main concerns would be the level of sophistication of the construction techniques used in the foreign country. Singapore has signed FTAs with largely developed countries that have a good pool of established contractors with better technological prowess compared to Singaporean contractors. This therefore makes exporting to FTA partner countries difficult. Of the contractors surveyed, only one respondent exported to Australia (an FTA partner country) and most of them showed no interest in the other FTA partner countries which Singapore has an agreement with. Another reason was that little emphasis was placed on the construction sector when negotiating the FTAs. Many respondents have pointed out this problem and hoped that the relevant government bodies or trade associations would be able to participate more pro-actively in the negotiation or review process in order to bring about greater benefits to Singaporean contractors. Some of the contractors interviewed suggested getting the BCA to be more involved with FTA negotiations. In this way, the views and ideas of the construction industry can be taken into consideration in the negotiations. Despite FTAs not having a direct impact on Singaporean contractors presently, the latter showed great interest in FTAs that were still being negotiated at the time of writing. They included markets like India and China where most of Singaporean contractors were exporting their services to. With vast opportunities in these markets,
47
Business Review – Volume 3 Number 1 January – June 2008
Singaporean contractors were keen to find out more about the benefits these FTAs can bring to the construction industry. As it was apparent that many Singaporean contractors were interested in the FTA negotiations with China and India, it would be strategic if future studies can be made to examine the potential impact of these two FTAs on the local construction industry in Singapore.
REFERENCES Abdul-Aziz, A-R & Tan, C.N. (1998). GATT, GATS and the global construction industry. Engineering, Construction and Architectural Management, 1(5), 31-37. Baldwin E. R. (1997). The Causes of Regionalism. World Economy, 7(20), 865-888 Bergsten, F. (1998). Fifty Years of the GATT/WTO: Lessons from the Past for Strategies for the Future. Washington, D.C.: Institute for International Economics. Bhagwati, J. (1991). The World Trading System at Risk. Princeton, N.J.: Princeton University and Harvester Wheatsheaf. Hadi, S. (1991). The ASEAN Free Trade Area (AFTA) and the future of Asian Dynamism. Jakarta: Centre for Strategic and International Studies. Hoekman, B.M. and Kostecki, M.M. (1995). The Political Economy of the World Trading System: From GATT to WTO. Oxford; New York: Oxford University Press. Sakong, I. and Lee, J. (1995). Asia-Pacific Economic Cooperation under the WTO System. Seoul: Institute of East and West Studies. Yonsei University. Krugman, P. (1993). Regionalism versus multilateralism: analytical notes. New Dimensions in Regional Integration, edited by Jaime De Melo and Arvind Panagariya. Cambridge: Cambridge University Press, p.80. Rajan, R.S., Sen, R.and Siregar, R. (2001). Singapore and Free Trade Agreements: Economic Relations with Japan and the United States. Singapore: Institute of Southeast Asian Studies (ISEAS). Schiff, A. et al. (2000). Trade Blocs. Washington, D.C.: World Bank. World Trade Organization (WTO). (2000). Trade Policy Review Singapore 2000. Geneva: WTO.
48

Business Review – Volume 3 Number 1 January – June 2008
Table 1 Dates of entry and review for selected FTAs
ANZSCEP ESFTA JSEPA SAFTA USSFTA
Entry into force 1 Jan 2001 1 Jan 2003 30 Nov
2002 28 Jul 2003 1 Jan 2004
Biannual 2005 Annual review
Date of review November
2001 and (End 2003)
Every 2 years
thereafter (End 2003)
After 1 year of
entry into force
After 1 year of
entry into force
Table 2 Commitments of selected FTA in construction related sectors
ANZSCEP JSEPA EFTA SAFTA USSFTA
Architectural Yes Yes Yes Yes Yes
Engineering Yes Yes Yes except in Switzerland Yes Yes
Urban Planning Yes Yes Yes Yes Yes
Integrated Engineering Yes Yes Yes Yes Yes
Land Surveying No Yes No Yes Yes
Construction (General) Yes Yes except
mining
Yes except in Liechtenstein and Elevators in Switzerland
Yes Yes
Real Estate Yes Yes
No in Liechtenstein,
Deposit Insurance in
Iceland; Yes in Norway and Switzerland
Yes Yes
49

Business Review – Volume 3 Number 1 January – June 2008
Table 3 Barriers when exporting overseas
Difficulties/Barriers Number of respondents Percentage %
Market access restriction imposed by host government 7 28
Discriminatory practices of host government which favor local companies 20 80
Excessive licensing fees 15 60
Entry and extended stay for business personnel 5 20
(Based on 25 firms with experience in exporting construction services)
Table 4 Factors affecting exports
Factors when exporting construction services Number of respondents Percentage %
Social/cultural differences 0 0
Language barrier 10 28.5
Political and legal considerations 30 85.7
Economic situation of the country 34 97.1
Safety and security of the country 5 14.3
Construction technology of the country 20 57.1 Table 5 Awareness of FTAs
Not Aware
1
2
Aware
3
4
Fully Aware
5
Awareness of FTAs - 17.1% 34.3% 28.6% 20.0%
50

Business Review – Volume 3 Number 1 January – June 2008
Table 6 Knowledge of construction industry benefits in FTAs
Not Aware
1
2
Aware
3
4
Fully Aware
5
Awareness of benefits that FTAs bring to the construction industry
20.0% 71.4% 5.7% 2.9% -
Table 7 Knowledge versus export volume
Contractors Export Volume Rank of Knowledge of FTA
Contractor X > S$ 10,000,000 1
Contractor Y < S$ 500,000 4
Table 8 Significance of FTAs to the construction industry
Least significan
t 1
2
3
4
Most significant
5
Significance of FTAs to the construction industry 2.8% 74.3% 22.9% - -
We are what we repeatedly do. Excellence, then, is not an act, but a habit.
ARISTOTLE
51

Business Review – Volume 3 Number 1 January – June 2008
Humility + Will = Level 5
L E V E L 5 L E A D E R S H I P K E Y P O I N T S
• Every good-to-great company had Level 5 leadership during the pivotal
transition years. • “Level 5” refers to a five-level hierarchy of executive capabilities, with
Level 5 at the top. Level 5 leaders embody a paradoxical mix of personal humility and professional will. They are ambitious, to be sure, but ambitious first and foremost for the company, not themselves.
• Level 5 leaders set up their successors for even greater success in the next generation, whereas egocentric Level 4 leaders often set up their successors for failure.
• Level 5 leaders display a compelling modesty, are self-effacing and understated. In contrast, two thirds of the comparison companies had leaders with gargantuan personal egos that contributed to the demise or continued mediocrity of the company.
• Level 5 leaders are fanatically driven, infected with an incurable need to produce sustained results. They are resolved to do whatever it takes to make the company great, no matter how big or hard the decisions.
• Level 5 leaders display a workmanlike diligence – more plow horse than show horse.
• Level 5 leaders look out the window to attribute success to factors other than themselves. When things go poorly, however, they look in the mirror and blame themselves, taking full responsibility. The comparison CEOs often did just the opposite – they looked in the mirror to take credit for success, but out the window to assign blame for disappointing results.
• One of the most damaging trends in recent history is the tendency (especially by boards of directors) to select dazzling, celebrity leaders and to de-select potential Level 5 leaders.
• I believe that potential Level 5 leaders exist all around us, if we just know what to look for, and that many people have the potential to evolve into Level 5.
Jim Collins
52

Business Review – Volume 3 Number 1 January – June 2008
ARTICLE
Economic Reforms and Total Factor Productivity Growth in Pakistan:
An Empirical Analysis
Muhammad Sabir Social Policy and Development Centre (SPDC) Karachi, Pakistan
Qazi Masood Ahmed
Institute of Business Administration Karachi, Pakistan 1. INTRODUCTION
akistan has been following an agenda of economic reform encompassing a broad range of structural adjustment policies (SAP) since 1987-88. These policies have
an adverse impact on the pace of economic growth and are a cause of higher poverty and inequality in the country (see Bengali and Ahmed (2002), Kemal (2003)). The impact of structural adjustment programme on total factor productivity is generally ignored. While the popular belief is that SAP results in low growth in factor inputs, which causes the low economic growth. This paper argues that decline in the growth of total factor productivity is the main cause of low economic growth. The present paper is the first attempt in Pakistan to establish the link between structural adjustment policies and total factor productivity and to quantify the impact of these policies on total factor productivity over the time.
P
This paper compares the average growth rates in GDP, factor inputs and total factor productivity during pre-reform period 1972-73 to 1987-88 and the reform period 1987-88 to 2001-02 and summarizes the historical patterns. Particular attention is given to assessing the impact of structural adjustment policies on total productivity growth directly and indirectly through other determinants of total factor productivity growth, such as human capital etc. The paper is organized in the following six sections: after the introduction, section 2 presents a brief review of recent research on the elements of total factor productivity and its determinants. Section 3 examines alternative approaches to measure total factor productivity. Section 4 highlights the sources of growth in the Pakistan’s economy. Section 5 summarizes the causes of slow growth in total factor productivity based on econometric analysis. Section 6 offers concluding remarks.
2. REVIEW OF LITERATURE In recent years, a growing body of research highlights the role of economic reforms in the growth of total factor productivity (TFP). Generally, the term economic reform
53
Business Review – Volume 3 Number 1 January – June 2008
refers to macroeconomic stabilization and structural adjustment policies which includes trade liberalization, and contractionary fiscal and monetary policies. It is argued that trade liberalization leads to higher competition, which is ultimately met through higher total factor productivity growth. Similarly, reduction in government subsidies, privatization and deregulation also leads to higher competition and has the same affect. However, there are many controversies about the direct and indirect linkages between structural adjustment policies. This section presents a brief review about the impact of structural adjustment programme on total factor productivity growth. Edwards (1997) analyzes the robustness of the relationship between openness and TFP growth by using a comparative data of 93 countries and nine alternative indices of trade policies. He finds positive relationship between openness and TFP growth. Similarly Weihold and Rauch (1997) tested the hypothesis that openness promotes specialization, which translated into higher productivity growth. Based on the dynamic panel analysis for the manufacturing sector in 39 less developed countries, their results show that the index of specialization is positively and significantly correlated with manufacturing productivity growth. Bjurek and Durevall (1998) analyze the contribution of the structural adjustment program to the growth of total factor productivity in Zimbabwe’s manufacturing sector. To evaluate the change in growth of TFP, the authors first estimate indices of total factor productivity for 31 manufacturing sub-sectors for the period 1980-1995. Then they use panel data methods to test for the effects of trade reform and other variables related to SAP. The overall impression is that there was no growth in total factor productivity on average during the whole period of SAP, accept, during the last two years of reform, (1994-1995), when most sub-sectors experienced increases in total factor productivity. Similarly, Isgut, Tello and Veiderpass (1999) measure and analyze total factor productivity and technical efficiency in a large sample of Nicaraguan manufacturing firms. Their analysis indicates that whereas structural reforms may be necessary conditions for the development of developing economies, their expected positive effects on sources of growth such as total factor productivity and technical efficiency could be so slow that it may be necessary to develop policy instruments for spurring economic growth in the short run. Wobst (2001) analyzes the impact of stabilization and structural adjustment policies on Tanzania’s macroeconomic performance, inter-sectoral shifts, and household welfare applying a CGE model based on a 1992 SAM. The results indicate that structural adjustment measures have an adverse effect on the overall performance and the sectoral structure of Tanzania’s economy. Bautista et al (2002) investigates the income and equity effects of macroeconomic policy reforms in Zimbabwe relating to the Economic Structural Adjustment Program. Their CGE model simulations show that trade policy reform alone increases GDP, agricultural
54

Business Review – Volume 3 Number 1 January – June 2008
production, and aggregate disposable household income. In addition, foreign trade expands markedly (by about a quarter of the base year value). These aggregate effects are even larger when trade liberalization is accompanied. The above review of literature reveals three massages: (i) government effort to reduce budget deficit through reduction in input subsidies affected the producer and ultimately TFP, (ii) trade liberalization measures resulted in higher competition and specialization, which in turns also affected TFP, and finally, (iii) government and private expenditures on research and development and infrastructure development increase the level of growth of TFP. 3. METHODOLOGY There are several approaches available to measure productivity. At the most basic level, productivity change is often approximated by changes in labour productivity (output per worker or per hour worked) because the requisite information is usually readily available. However, relying on labour productivity measures can produce misleading results as other inputs such as capital may be being substituted for labour. If this is happening, observed labour productivity will be increasing rapidly but when all inputs are taken into account, overall productivity will be increasing far less rapidly and, in the extreme case, may even be declining. To overcome this deficiency, it is necessary to look at the quantity of all outputs produced relative to the quantity of all inputs used. This comprehensive productivity measure is known as total factor productivity (TFP) and should ideally include not just labour and capital inputs but also land, natural resource, inventory and all other inputs. Most productivity studies tend to concentrate on labour and capital inputs and some analysts recognize the incompleteness of their input coverage by referring to the resulting measures as ‘multifactor’ rather than ‘total factor’ productivity measures. There are two broad approaches used to measure total factor productivity: Growth Accounting Approach and Index Number Approach. 3.1 The Solow Growth Accounting Approach A much-cited 1957 paper by Solow provides a useful frame of reference for the main empirical approaches to measuring TFP known as growth accounting approach. With this approach, TFP is computed as a residual: the contributions of specified input factors to output growth is calculated and then subtracted from the total growth of output. The resulting residual difference is referred to as ‘the Solow residual’. Solow (1957) represents the production function as:
(1) Q = F(K, L; t). In this specification, Q is an output quantity aggregate (usually taken to be real gross domestic product in the national accounting framework), K and L are aggregate
55

Business Review – Volume 3 Number 1 January – June 2008
measures for the capital and labour inputs to the production process, and t denotes time. The variable t appears in F ‘to allow for technical change.’ If technical change is neutral, the shifts in production leave all marginal rates of substitution unchanged, and the production function F in (1) can be written as:
(2) Q = A(t) f(K, L). The multiplicative factor A(t) in (2) represents the cumulative effects of shifts over time after controlling for the growth of K and L. If we differentiate equation (2) totally with respect to time and then divide by Q we obtain
(3) Q
Q
where and
Δ Δ Δ Δ= + +
= =
AA
wK
Kw
LL
w AfK
KQ
w AfL
LQ
K L
K L
,
∂∂
∂∂
Rearranging (3) leads to the following expression for productivity change:
(4)
Δ Δ Δ ΔAA
wK
Kw
LLK L= − −
In other words, productivity change is equal to the rate of output growth less the rates of growth in capital and labour inputs weighted by their respective GDP shares. 3.2 THE INDEX NUMBER APPROACH A productivity index is generally defined as the ratio of an index of output growth divided by an index of input growth, where output refers to the total quantities of all outputs produced by the production sector and the inputs are the total quantities of all inputs utilized by the same production sector over two accounting periods. Most economies have a diverse range of outputs (agricultural products, manufactures, and services) and an equally diverse range of inputs (labour, capital, land and natural resources). Calculating TFP requires a means of adding together these diverse output and input quantities into measures of total output and total input quantity. The TFP index can be written as:
(5) TFP = Qt /It 4. SOURCES OF GROWTH IN PAKISTAN’S ECONOMY It emerged from the review of literature that macroeconomic reforms have dissimilar impact on different sectors of the economy. For, instance openness policies largely affect the manufacturing sector. Taking this into account, this study presents a sector-wise impact analysis of macroeconomic reforms on overall growth performance of the economy, growth in factor inputs and growth in TFP. As a first step four production functions are estimated for the agriculture, manufacturing and
56

Business Review – Volume 3 Number 1 January – June 2008
services sectors, and for the overall GDP. In the second step, growth in factor inputs and overall economy is calculated. 4.1 Estimates of Production Function Table 1 presents the results of the estimates of Cobb Douglas production functions for each sector and the overall economy. All variables except the dummy variables and physical stock of economic infrastructure are taking in the logarithmic form. The sum of coefficients of labour force and physical capital in manufacturing and services sectors is one and, in the rest of the cases, the sum of the coefficients of cropped area, labour and physical capital stock is one. This indicates that the underlying production function is constant return to scale and neutral in technical progress. This also implies that the overall growth rate of factor inputs is the weighted sum of the growth rate of inputs of land, labour and capital, with the weights adding up to unity. 4.2 GROWTH IN FACTORS INPUTS Table-2 presents the sector-wise growth in three standard factor inputs (land, labour, and capital) during the pre-reform (1972-73 to 1987-88) and during the macroeconomic reform (1987-88 to 2001-02) period. It clearly emerges from the constant growth that there is no impact of reform on cropped area. However, there is substantial change in the pattern of growth of capital accumulation, which experiences the highest growth (12 percent) in the agriculture sector, a relatively slower growth of 6 percent in the services sector and remains stagnant in the manufacturing sector during the first period of analysis. This trend reverts in the second period of the analysis with highest capital accumulation growth in the services sector and lowest in the agriculture sector. Interestingly, capital accumulation in the manufacturing sector picks the pace and shows relatively higher growth (4 percent) in the second period of analysis. Overall, the economy experiences relatively high growth in capital accumulation in the second period of analysis. In contrast, growth in employed labour force declines in all sectors of the economy during the macroeconomic reform period. However, the major decline in growth of employed labour force is reflected in the manufacturing sector, which shows almost 40 percent decline in annual average employed labour force during the macroeconomic reform period. Different types of inputs simply cannot be added, e.g. it is not meaningful to add the number of employees to the cropped area. Therefore, based on neoclassical growth theory estimated production functions for each sector are used to obtained the respective weights of input, which are then multiplied with the index of capital, labour and land and finally add to get the Index of Factor Inputs.
57

Business Review – Volume 3 Number 1 January – June 2008
Based on the estimates of sector-wise growth rates of factor inputs presented in Table – 2. It can be concluded that, except for the agriculture sector, growth in factor inputs is relatively higher during the period of reform. The increase in growth of factor inputs is noticeable in the manufacturing sector, which experiences almost one percentage point increase in annual average growth of factor inputs. However, agriculture shows a decline in growth of factor inputs during the macroeconomic reform period. 4.2 GROWTH PERFORMANCE OF THE ECONOMY Table-3 presents the sector-wise economic growth rates during the pre-reform period (972-73 to 1987-88) and during the reform period (1987-88 to 2001-02). Prior to macroeconomic reform, annual average growth rates in agriculture, manufacturing and services sectors were 3.5, 7.4 and 6.9 percent respectively, which change substantially in the reform period to 3.9, 4.3 and 4.5 percent respectively. As a result, growth in overall economy slows down from 5.9 percent to 4.3 percent, and the major contributors to the decline in growth are the manufacturing and services sectors. It is important to notice that the pattern of growth in outputs is entirely different than the pattern of growth in inputs. For instance, in the agriculture sector, the growth in input is high prior to reform; however, growth in output is high during the reform period. Similarly, the high growth in factor inputs is not translated into output growth in the manufacturing and services sectors. As a result, despite the growth in factor inputs in the economy, output growth declines from 5.9 percent to 4.3 percent during the period. This finding indicates that the role of total factor productivity play a substantial part to explaining the pattern of growth in the economy. 4.3 DECOMPOSITION OF ECONOMIC GROWTH It is important to decompose growth in the economy into growth in factor inputs and growth in total factor productivity (TFP) to understand the nature economic growth. In the first step, growth rates of TFP are computed, which are simply the difference of sector wise growth rates of the economy and growth rates of factor inputs. Table-3 also presents the results of this computation during the respective periods and for each sector of the economy. TFP growth shows a mixed pattern: it is highest in manufacturing sector prior to reform and lowest in the services sector during reform. On average, almost half of the growth in the economy prior to reform is the outcome of growth in TFP and the remaining half is contributed by growth in factor inputs. However, during the reform period, annual average growth in TFP has declines from 2.8 percent to 0.7 percent. As a result, the contribution of TFP in overall economic growth also declines from
58

Business Review – Volume 3 Number 1 January – June 2008
48 percent to just 16 percent, which is the main cause of low economic growth during the reform period. 5. IMPACT OF MACROECONOMIC REFORM ON TFP GROWTH Pakistan has adopted an agenda of macroeconomic reforms since 1987-88, which is basically a set of structural adjustment policies. The Structural Adjustment Programme required the slashing of the budget deficit and the current account deficit as well as a range of sectoral reforms. The liberalization of the financial sector in 1991, and the wholesale privatization of state owned industrial enterprises in 1992. However, these policies affect different sectors of the economy with different magnitudes, as a consequence agriculture, manufacturing and services sectors experinace dissimilar impact of reform. Therefore, the impact of macroeconomic reform on each sector of the economy is seprately estimated. This estimation process is also divided into two steps, first we specify a number of common explanatory varaible, which can be used to estbalish the link between economic reforms and TFP. Second based on the estimates of OLS equation the realtive contribution of each sector is computed. Table –4 presents the result of OLS equations with dependent variables are the Index of total factor productivity sector-wise and overall economy. There are many alternative variables are used in estimation which link the structula adjustement and TFP and the best fit model are presented and used for further analysis. In above model all variables are significant without serial correlation and more than 93 percent variation. 5.2 IMPACT OF REFORM ON TFP GROWTH: AGRICULTURE SECTOR Agriculture is the least affected sector of the economy. Generally, three sets of macroeconomic policies affect agriculture sector in Paksitan: (i) the policies related to factor inputs subsidies, (ii) decsions related to support prices for major crops, and finally (iii) tarde liberalization policies. Even though, it is difficult to trace the direct links of these policies on agriclture sector, an attempt is made to establish direct and indirect links and their impact on TFP growth. The major input indirect subsidy is provided to the agriculture sector through subsidized rates of gas tariff to fertilizer sector. However, this input subsidy as a result of macroeconomic reform has been gardually abolished in 1995-96. In contrast to input subsidies culture of support prices still prevails in the economy and even shows higher increase in support prices during reform period specially in sugarcane and wheat, which jointly consumed the large part of government current subsidies. Finally, trade liberalization through reduction in tariff rate reduces the cost of imported pesticide and fertilizer and through devaluation provide insintaive to export
59

Business Review – Volume 3 Number 1 January – June 2008
cotton and cotton based finish goods and ultimately positively affect the cotton grower. There are several alternative models of determinant of TFP in agriculture sector have estimated to compute the impact of macroeconomic reforms. Human capital index, index of fertilizer use per hectre and index of cotton yield are included in final model as determinants of TFP in agriculture. The choice of variabbles based on the following rationales: human capital index is included to capture the impact of increase in labour quality based on education and experience, index of fertilizer use per hectre is used as proxy to capture the impact of currenrt and development subsidies to agriculture sector and finally, index of cotton is incorporated to capture the impact of trade liberalization on TFP. Table-5 presents the result of variance decomposition based on the regression to quantify the relative contribution of different factors. The most important factor in the growth in TFP is human capital. Prior to reform human capital formation contribute significantly and the main engine of growth in TFP. However, it is emerge that during the reform period growth of human capital is decline in the country. This is largely the outcome of reduction in social sector expenditures in real terms. It emerges that food and fertilizer subsidies play an important role in both prior to reform and during reform periods in the growth of TFP in agriculture. Prior to reform government spend big amounts on fertilizer subsidy, which increase the consumption and as a result TFP decline. On the contrary during reform period government subsequently abolish fertilizer subsidy and as a result of high prize of fertilizer efficiently, which leads to increase in TFP. In contrast to fertilizer subsidy, ongoing fiscal does not affect food subsidies and these food subsidies provide incentive to farmers through support price, which in turn try to increase production and ultimately a cause of TFP growth. However, the only variable to capture benefit of trade liberalization is cotton yield does not work according to expectation and can not contribute positively during reform period. 5.3 IMPACT OF REFORM ON TFP GROWTH: MANUFACTURING SECTOR The manufacturing sector is one of the two legs on which the commodity-producing edifice of the economy stands. Prior to macroeconomic reform, this sector enjoyed a substantial rate of effective protection through high import duties and low domestic taxes. However, as a result of macroeconomic reform the maximum tariff rate declined from 150 percent in 1988 to 35 percent in 2001-02- about one-fifth of the 1988, similarly, the effective import duty rate decline from 38.4 percent to 13 per cent in 2001-02. Devaluation Pakistani currency is another important policy of the trade liberalization reform that affects the growth of TFP in manufacturing sectors.
60

Business Review – Volume 3 Number 1 January – June 2008
Finally, the governments strategy of reduction in budget deficit through reduction in development expenditure is also affect the TFP growth. Table-6 presents the estimates of contribution of different factors to growth of TFP in manufacturing sector in both prior to reform and during the reform periods. Contrary to general believe trade liberalization through manufactured export account lesser in TFP growth during reform period as compare to pre reform period. Similarly, share of new investment in capital accumulation negatively contribute in both periods. However, the major cause of low growth of TFP in reduction in development expenditures, which experience negative contribution in TFP growth during reform period. 5.4 IMPACT OF REFORM ON TFP GROWTH: SERVICES SECTOR Services sector in Pakistan accounted for about half of GDP, with varied proportion between early 1970s and 2000s. In early 1970s almost 45 percent of GDP came from services sectors, which increases to 57 percent of GDP in 2002-03. Despite the growing contribution of services sector in GDP, the country has a persistent trade deficit in services sector. Moreover, the disaggregated pattern shows that during the reform period growth in TFP declined from 1.6 percent to the negative 0.9 percent. This is largely the outcome of decline in development expenditure and human capital (see Table 7), which is inline with the findings of other sectors. 5.5 IMPACT OF REFORM ON TFP GROWTH: OVERALL ECONOMY It is important to highlight the impact of economic reform on TFP growth of the overall economy. The empirical result indicates that except new investment all other determinant of TFP growth declined during the reform period. In other words, the productivity of new investment increses in the reform period, however, contribution of human capital, remittances, development expenditures and cotton exports has declined during the reform period. These declines are the outcome of economic reforms and stablization policies. 6. CONCLUSION The role of economic reform on growth is an area of great debate and empirical investigation. This paper provides empirical evidences that the economic reform policies of Government of Pakistan are the major contributor in the change of total factor productivity. In those periods when the fiscal policy is appropriate for growth and allows increase in expenditure on development and social services, it always has positive impact on total factor productivity. Similarly in those period when the total factor productivity was low it can be explained in terms of reduction in government expenditures on social and development services.
61
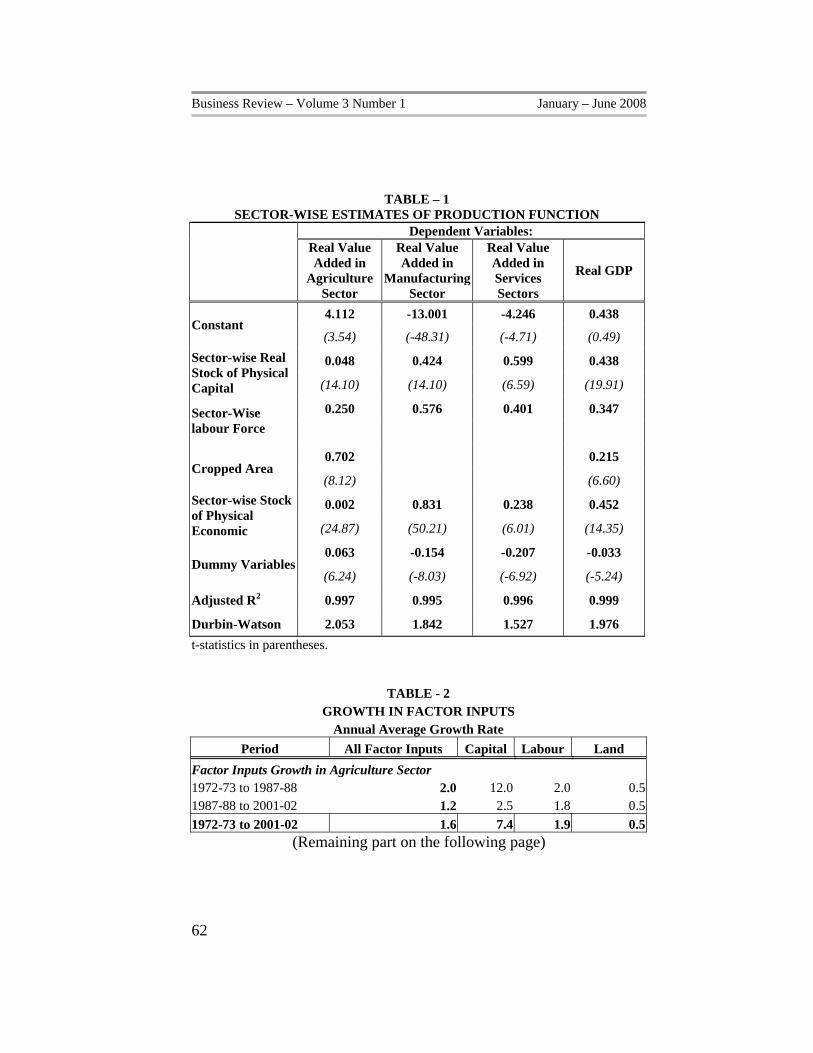
Business Review – Volume 3 Number 1 January – June 2008
TABLE – 1 SECTOR-WISE ESTIMATES OF PRODUCTION FUNCTION
Dependent Variables:
Real Value Added in
Agriculture Sector
Real Value Added in
Manufacturing Sector
Real Value Added in Services Sectors
Real GDP
4.112 -13.001 -4.246 0.438 Constant
(3.54) (-48.31) (-4.71) (0.49)
0.048 0.424 0.599 0.438 Sector-wise Real Stock of Physical Capital (14.10) (14.10) (6.59) (19.91)
0.250 0.576 0.401 0.347 Sector-Wise labour Force
0.702 0.215 Cropped Area
(8.12) (6.60)
0.002 0.831 0.238 0.452 Sector-wise Stock of Physical Economic (24.87) (50.21) (6.01) (14.35)
0.063 -0.154 -0.207 -0.033 Dummy Variables
(6.24) (-8.03) (-6.92) (-5.24)
Adjusted R2 0.997 0.995 0.996 0.999
Durbin-Watson 2.053 1.842 1.527 1.976 t-statistics in parentheses.
TABLE - 2 GROWTH IN FACTOR INPUTS
Annual Average Growth Rate Period All Factor Inputs Capital Labour Land
Factor Inputs Growth in Agriculture Sector 1972-73 to 1987-88 2.0 12.0 2.0 0.5 1987-88 to 2001-02 1.2 2.5 1.8 0.5 1972-73 to 2001-02 1.6 7.4 1.9 0.5
(Remaining part on the following page)
62

Business Review – Volume 3 Number 1 January – June 2008
Factor Inputs Growth in Manufacturing Sector 1972-73 to 1987-88 1.5 0.1 2.5 - 1987-88 to 2001-02 2.4 4.0 1.5 - 1972-73 to 2001-02 1.9 2.0 2.0 - Factor Inputs Growth in Services Sector 1972-73 to 1987-88 5.2 6.1 3.9 - 1987-88 to 2001-02 5.5 6.4 3.0 - 1972-73 to 2001-02 5.3 6.3 3.5 - Factor Inputs Growth in Overall Economy 1972-73 to 1987-88 3.1 4.4 2.6 0.5 1987-88 to 2001-02 3.6 5.0 2.1 0.5 1972-73 to 2001-02 3.3 4.7 2.4 0.5
TABLE - 3 SECTOR-WISE SOURCES OF GROWTH OF PAKISTAN’S ECONOMY
PRE AND DURING MACROECONOMIC REFORM PERIODS Average Annual Growth Rate
Period Agriculture Manufacturing Services GDP Growth Performance of the Economy 1972-73 to 1987-88 3.5 7.4 6.9 5.9 1987-88 to 2001-02 3.9 4.3 4.5 4.3 1972-73 to 2001-02 3.7 5.9 5.7 5.1 Growth in Factor Inputs 1972-73 to 1987-88 2.0 1.5 5.2 3.1 1987-88 to 2001-02 1.2 2.4 5.5 3.6 1972-73 to 2001-02 1.6 1.9 5.3 3.3 Growth in TFP 1972-73 to 1987-88 1.5 5.9 1.7 2.8 1987-88 to 2001-02 2.6 1.9 -1.0 0.7 1972-73 to 2001-02 2.0 4.0 0.4 1.8 Contribution of TFP in Economic Growth (%) 1972-73 to 1987-88 42.3 79.3 24.3 48.2 1987-88 to 2001-02 68.0 45.0 -22.5 16.1 1972-73 to 2001-02 55.3 67.2 6.7 35.3 Source: Pakistan Economic Survey Various Issues & Authors' Estimate
63

Business Review – Volume 3 Number 1 January – June 2008
TABLE - 4 Dependent Variables:
Index of total factor
productivity (Agriculture)
Index of total factor
productivity (Manufacturing)
Index of total factor
productivity (Services)
Index of total factor
productivity (Aggregate)
34.183 -54.258 73.713 49.321 Constant 3.81 -1.80 14.44 11.00
0.535 0.642 0.451 0.250 Sector-wise Index of Human Capital 7.85 2.88 11.03 11.58
-0.005 Fertilizer Subsidy -4.01
0.002 Food Subsidy
4.89
0.131 0.119 Index of Cotton Yield 4.04 2.77
0.221 Index of Real Manufactured Exports 2.09
3.808 -1.985 0.741 Share of New Investment in the Capital 2.77 -6.049 2.18
0.207 0.06 0.062 Index of Development Expenditure 2.97 4.085 2.18
0.0002 0.0004 Remittances in Real Terms
3.77 3.36
-72.962 -13.986 Dummy Variables -3.83 -6.79
Adjusted R2 0.982 0.954 0.938 0.963
Durbin-Watson 1.739 1.550 1.730 1.416 t-statistics in italics.
64

Business Review – Volume 3 Number 1 January – June 2008
TABLE - 5 IMPACT OF REFORM ON GROWTH OF TFP AGRICULTURE
Annual Average Growth Rate Factors 1972-73 to 2001-02 1972-73 to 1987-88 1987-88 to 2001-02
Human Capital 3.9 6.2 1.6 Fertilizer Subsidy -2.1 -4.8 0.6 Food Subsidy 0.1 -0.4 0.5 Cotton Yield 0.8 1.6 -0.1 Unexplained 0.1 0.2 -0.1 Growth in TFP 2.0 1.4 2.6
TABLE – 6 Impact of Reform on Growth of TFP Manufacturing
Annual Average Growth Rate Factors 1972-73 to 2001-02 1972-73 to 1987-88 1987-88 to 2001-02
Human Capital 2.3 2.3 1.5 Manufactured Exports 1.5 1.6 0.9 Vintage of Capital -0.2 -0.3 -0.1 Development Expenditures 0.6 2.8 -0.3 Unexplained -0.2 -0.4 0.0 Growth in TFP 4.0 5.9 2.0
TABLE - 7 Impact of Reform on Growth of TFP Services
Annual Average Growth Rate Factors 1972-73 to 2001-02 1972-73 to 1987-88 1987-88 to 2001-02
Human Capital 0.7 0.9 0.6 Remittances 0.2 0.3 0.0 Vintage of Capital -1.0 -1.4 -0.7 Development Expenditures 0.9 2.2 -0.5 Unexplained -0.3 -0.5 -0.2 Growth in TFP 0.4 1.6 -0.9
65

Business Review – Volume 3 Number 1 January – June 2008
TABLE - 8 Impact of Reform on Growth of TFP IN the Economy
Annual Average Growth Rate Factors 1972-73 to 2001-02 1972-73 to 1987-88 1987-88 to 2001-02
Human Capital 0.93 1.10 0.76 Remittances 0.26 0.47 0.03 Vintage of Capital -0.04 -0.06 -0.03 Development Expenditures 0.33 0.73 -0.09 Cotton Yield 0.26 0.50 0.01 Unexplained 0.01 0.02 0.00 Growth in TFP 1.76 2.77 0.68 REFERENCES Anthony Enisan Akinlo (2005) Impact of Macroeconomic Factors on Total Factor Productivity in Sub-Saharan African Countries” Research Paper No. 39 UN-WIDER Barro, R. J. (1990). ‘Government spending in a simple model of endogenous growth’. Journal of Political Economy 98(5 part 2): S103-S125. Barro, R. J. and Lee, J. (1994). ‘International comparisons of educational attainments’. Journal of Monetary Economics 32: 363-94. Barro, R. J. and Sala-I-Martin, X. (1995). Economic Growth. New York: McGraw-Hill. Coe, D. T. and Helpman, E. (1995). ‘International R&D spillovers’. European Economic Review 39: 859-87. Cororation, C. B. (2004). ‘National Report: Philippines’, in Measuring Total Factor Productivity: Survey Report. Tokyo: Asian Productivity Organization. Edwards, S. (1998). ‘Openness, productivity and growth: What do we really know?’ Economic Journal 108: 383-98. Englander, S. and Gurney, A. (1994). ‘Medium-term determinants of OECD productivity’. OECD Economic Studies 22: 49-109. Goldar, B. N. and Kumari, A. (2002). ‘Import liberalization and productivity growth in India industries in the 1990s’. Working Paper E/219/2002. Delhi: Institute of Economic Growth.
66
Business Review – Volume 3 Number 1 January – June 2008
Griliches, Z. (1980). ‘Returns to research and development expenditures in the private sector’, in J. Kendrick and B. Vaccara (eds), New Development in Productivity Measurement and Analysis. Chicago: University of Chicago Press: pp. 419-54. Griliches, Z. (1992). ‘The search for R&D spillovers’. Scandinavian Journal of Economics 94(supplement): 29-47. Griliches, Z. (1994). ‘Productivity, R&D and the data constraint’. American Economic Review 84(1): 1-23. Government of Pakistan (various Issues), Pakistan Economic Survey, Finance Ministry Grossman, G. M. and Helpman, E. (1991). Innovation and Growth in the Global Economy. Cambridge MA: MIT Press. Haddad, M. (1993). ‘How trade liberalization affected productivity in Morocco’. Policy Research Working Paper 1096. Washington DC: World Bank. Pasha, H.A., Aynul Hasan, and others 1996, Integrated Social-Sector Macroeconometric Model for Pakistan, Pakistan. Development Review, 35(4) 1996. PP 567-79 Hafiz, A. Pasha., Aisha, Ghaus-Pasha. and Kalim Hyder. (2002). “The Slowing Down of the Growth of Total Factor Productivity in Pakistan,” Social Policy and Development Centre, Research Report Number 44. Harrison, A. E. (1994). ‘Productivity, imperfect competition and trade reform: Theory and evidence’. Journal of International Economics 36: 53-73. Harrison, A. E. (1996). ‘Openness and growth: A time-series, cross-country analysis for developing countries’. Journal of Development Economics 48: 419-47. Hercowitz, Z., Lavi, Y., and Melnick, R. (1999). ‘The impact of macroeconomic factors on productivity in Israel, 1960-96’. Bank of Israel Economic Review 72: 103-124. Kanamori, H 1972. “What Accounts for Japan’s High rate of Growth?”, Review of Income and Wealth, 18(2), pp 155-71. Khan, Safdar Ullah. (2006). “Macro Determinants of Total Factor Productivity in Pakistan,” State Bank of Pakistan, Working Paper Number 10. Kim, E. (2000). ‘Trade liberalization and productivity growth in Korean manufacturing industries: Price protection, market power and scale efficiency’. Journal of Development Economics 62: 55-83.
67

Business Review – Volume 3 Number 1 January – June 2008
Kim, K. W. (1994). ‘Trade and industrialization policies in Korea: An overview’, in G. K. Helleiner (ed.), Trade Policy and Industrialization in Turbulent Times. London and New York: Routledge, for UNU-WIDER. Krugman, Paul. 1994 “The Myth of Asia’s Miracle”, Foreign Affairs, 73(6), pp 62. Miller, S. M. and Upadhyay, M. P. (2000). ‘The effects of openness, trade orientation, and human capital on total factor productivity’. Journal of Development Economics 63: 399-423. Mohammad Sabir and Qazi Masood Ahmed. (2003). “Macroeconomic Reforms and Total Factor Productivity Growth in Pakistan: An Empirical Analysis,” Social Policy and Development Centre, Conference Paper No.55 Ramsey, F. P. (1928). ‘A mathematical theory of saving’. Economic Journal 38: 543- 59. Romer, P. M. (1990). ‘Endogenous technological change’. Journal of Political Economy 98(5): 71-102. Romer, P. M. (1992). ‘Two strategies for economic development: using ideas and producing ideas’. World Bank Annual Conference on Economic Development. Washington DC: World Bank. Sachs, F. and Warner, A. (1995). ‘Economic reform and the process of global integation’. Brookings Papers on Economic Activity 1995(1): 1-118. Samuelson, P. A. (1958). ‘An exact consumption-loan model of interest with or without the social contrivance of money’. Journal of Political Economy 66: 467-82. Solow, R. M. (1956). ‘A contribution to the theory of economic growth’. Quarterly Journal of Economics 70: 65-94. Solow, R. M. (1957). ‘Technical change and the aggregate production function’. The Review of Economics and Statistics 39: 312-20. Wizarat, S. 1981 “Technological Change in Pakistan’s Agriculture”, Pakistan. Development Review, 20(4), 1981, pp 427-45. Yanrui Wa (1995) “Productivity Growth, Technological Progress and Technical Efficiency change in China: A Three-sector Analysis” Journal of Comparative Economics, 21, 207-229.
68

Business Review – Volume 3 Number 1 January – June 2008
ARTICLE
SMEs in Globalized World: A Brief Note on Basic Profiles of Pakistan’s Small and Medium Scale Enterprises and Possible
Research Directions
Sarath W.S.B. Dasanayaka University of Moratuwa, Sri Lanka
ABSTRACT The Small and Medium Scale Enterprises (SMEs) are playing very significant role in almost all the economies around the world in irrespective of the countries development stage. However it is obvious that SMEs function as a lifeline in informal sector in Asia, Africa, Latin America and Eastern Europe due to their contribution to overall economy in many aspects such as employment generation, exports, tax income, innovation, competitiveness, equitable income distribution, social stability, domestic resources usage, regional development and ultimately it is the main source of economic growth. The Pakistan is no exception to this phenomenon as a developing country located in South Asian region. Most of these SMEs around the world are struggling to survive in today's globalized competitive economy. They are hampered by the lack of technology, access to credits and markets, lack of infrastructure and competition from foreign products, etc. In spite of the various policy reforms, setting up of SMEs promotional apex bodies, incentives and assistance offered by successive governments in Pakistan with the assistance of private sector, NGOs and donor agencies since political independence, still this SME sector is less dynamic and underdeveloped as against large-scale enterprises in the national economy. The growth and expansion of SMEs are constrained by problems relating to both product and factor markets in Pakistan. Lack of policy and conducive supportive environment, sub sector strategies and cluster development with business development services have further reduced the full potential contribution of SMEs to the national economy. In this context this brief note is covering basic facts about Pakistan SMEs and present an agenda for future SMEs research in Pakistan. Key Words: SMEs, basic profiles, research agenda, Pakistan INTRODUCTION The first part of this paper highlights the various aspects of SMEs in terms of their basic profiles such as definitional problems, sector-wise distribution and their
69

Business Review – Volume 3 Number 1 January – June 2008
contribution to Pakistan economy by using various data indicators. Finally, tentative conclusions and an agenda for Pakistani’s SMEs research will be presented. DEFINITION OF SMEs IN PAKISTAN The Pakistan SMEs are engaging in wide range of business activities in agriculture, mining, fishing, industry/manufacturing, construction, retails and whole sales and services in rural, urban and estate settings by servicing local and international markets. They are active in most of the industry sub sectors such as agricultural inputs/outputs business in rural areas to food and beverages business in city up to more advanced light engineering sectors such as computer, chemical, machinery, apparel and construction business in local and foreign markets. Most Pakistan SME’s are one-person show or are run by few family individuals, usually relatives, friends or business partners, who take most of the decisions. Usually no distinction between private and business assets, and subjective and personal factors play a large role in decision-making. The personal stakes of Pakistan SMEs have in their businesses are much higher than those of corporate executives in their companies. This enhances the attendant risks and commits entrepreneurs even more strongly to the success of their enterprises. Most Pakistani SMEs in informal sector are reporting very low productivity and income therefore owners and workers are ‘working poors’ but SMEs in formal sector report very high productivity and efficiency and provide very high income and decent life for workers and owners. This wide variation of diversity in Pakistan SMEs bring various types of assets, employees, skills, capital, turnover/revenue, sophistication, innovation, productivity and growth orientation. Due to this complexity, it is very hard to define SMEs overtime in Pakistan and currently nationally acceptable single definition is not available. There are very many definitions available based on assets, employees, skills, capital, turnover/revenue in local and exports markets, sophistication, innovation, productivity and growth orientation. But most of these definitions are made according to organizational needs and purpose of interests about SMEs. Financial institutions, public sector authorities, non-governmental organizations (NGOs), trade and industry chambers, international organizations, researchers, SMEs service providers and consultancy firms have their own definitions based on their own criteria selection. Most of these organizations used various terms for SMEs such as Small and Medium Scale Industries (SMIs), Micro Enterprises (MEs), Rural Enterprises (REs), Small and Medium Scale Activities (SMAs), Cottage and Small Scale Industry (CSSI), Informal Sector Activities (ISAs), Micro and Small Scale Activities (MSSA), etc. Generally, enterprise is defined as any business activity or entity engaged in industry, agri-business and/or services whether single proprietorship, partnership or corporate venture. This enterprise definition is universally accepted around the world. The following table shows most popular definitions on SMEs available in Pakistan.
70

Business Review – Volume 3 Number 1 January – June 2008
Table 1 – Definition of SMEs in Pakistan Institution Criterion Medium Scale Small Scale Small and Medium Enterprise Development Authority (SMEDA)
No. of Employees Productive assets
Between 36 – 99 20- 40 Million PKR
Between 10 – 35 2 – 20 Million PKR
SME Bank Total assets Over 100 Million PKR Less than 100 Million PKR
Federal Bureau of Statistics
No. of Employees N/A Less than 10 employees
State Bank of Pakistan
Nature of the business (Manufacturing Trade/Services) No. of Employees Capital employed Net sales value
Less than 250 employees and less than 100 million PK Rs. assets for manufacturing. Less than 50 employees and less than 50 million PK Rs. for trade/services. Net sales less than 300 million PKR
Less than 250 employees and less than 100 million PK Rs. assets for manufacturing. Less than 50 employees and less than 50 million PK Rs. for trade/services. Net sales less than 300 million PKR
Sindh Industries Dept.
Nature of the business Total Investment including land and buildings
Handicrafts or manufacturing capital investment less than 10 million PKR
Handicrafts or manufacturing capital investment less than 10 million PKR
Punjab Industries Dept.
Value of assets other than buildings and lands.
Less than 10 million PKR
Less than 10 million PKR
Punjab Small industries corporation
Capital investment excluding lands and building
Less than 20 million PKR
Less than 20 million PKR
Pakistan Tax Ordinance (2005)
Equity Turn over
Less than 25 million PKR Less than 200 million PKR
Source: SMEDA, Pakistan 2006 and Author of the article. In addition to this, various banks, financial institutions, donor agencies, NGOs, industry related task forces, trade and industry chambers adopted their own definitions for SMEs for their convenience and objectivity of studying SMEs. But almost all these definitions adopted their main criteria as no. of employees, capital
71

Business Review – Volume 3 Number 1 January – June 2008
employed/total assets and turnover. But these criteria have its own limitations overtime and need changes with technology improvement, productivity increases and inflation, etc. Very recently in Pakistan for this SME equation, Micro and Cottage enterprises also came and now Micro, Cottage and Small Scale Enterprises are in picture and in most cases medium scale enterprises are out from the equation. Some policy makers and researchers in Pakistan have pointed out that micro, cottage (less than five employees) and small enterprises should receive government more care and attention not the medium scale enterprises and they have many justifications for that. However overtime this SMEs definition criteria should be changed to fit with changing economic, technology and productivity scenarios. In addition to this various other criteria and range of values should be assigning to define SMEs sector as a whole and sub group-wise. Still in Pakistan, SMEs data base mainly concentrated on manufacturing rather agriculture and service activities. Therefore researchers and authorities should take steps to expand SMEs data base from manufacturing to agriculture and service sectors while finding a proper definition for SMEs and change it overtime looking at the market changes. Recently SMEDA appointed SMEs working committee on SME definition vested power to come up with new definitions for SMEs, micro and large scale industries to more specifically target incentives to promote and develop SMEs. 3) DATA ANALYSIS ON PAKISTAN’S SMEs The Pakistan’s SMEs data base is very fragile and unreliable due to regular change of survey units definitions, partial sector wise coverage with bias to manufacturing, too aggregative nature of the data, non-continuity of surveys, non-compilation of data on important aspects such as overall and sector wise SMEs contribution to value added and net foreign exchange, some parts of the country data can not access due to arms conflict and many organizations involvements in SMEs data compilation, etc. The most reliable data base available with government three statistical bureaus (now these three bodies amalgamated). But that also do not specifically give exact contribution of SMEs alone. But we assume that Pakistan is naturally a SME economy and more than 98% of its enterprises are SMEs (SMEDA, 2005). Normally industrial or establishment surveys cover all size of enterprises and therefore it is very hard to separate data for SMEs due to aggregative nature and survey definitions changes overtime. But most of the enterprises/industries data in household level can assume as micro or small scale and establishment level data as medium and large scale enterprises. Available data mainly categorized under the region-wise (Punjab, Sindh, NWFP, Baluchitan and Islamabad) and urban and rural-wise. The latest available data on Economic Survey of Pakistan 2003-04 reveals that SMEs contribution to manufacturing sector in terms of GDP around 30%, employment 80%, export 25% and value addition 30%. More details information available on industrial survey for year 2000 (Federal Bureau of Statistics in Pakistan, 2000).
72

Business Review – Volume 3 Number 1 January – June 2008
These survey data show that in geographical location-wise of enterprises/industries, 65% enterprises are located in Punjab, 18% in Sindh, 14% in NWFP and other 3% in Balochistan and Islamabad. In concentration of enterprises, 53% are wholesale, retail, restaurants and hotels, 22% community, social and personal services and 20% are in manufacturing. In rural, urban and house holds wise also this concentration is holding true. More than 96% of establishments belong to less than 5 employee category and this is true for region-wise also. This may be a good area to further research to see that most Pakistan establishments are micro level rather SMEs. Another interesting fact is that ownership-wise more than 96% enterprises are belonging to individuals and this picture hold true for regions as well. In age wise, more than 90% of SMEs are less than 20 years old and this picture holds for rural and urban areas as well. This may be the main obstacle to access to finance. Generally small and very young SMEs have many obstacles to access to finance and credits markets. In analyzing ISIC (two digit) industry categories a large proportion of industries are concentrated on few categories: 43% industrial establishment are in textile, apparel and leather, 20% in food, beverage and tobacco, 10% in wood and wood products, 10% in metal and fabricated metal sector and 8% in handicrafts and related other activities. This shows Pakistan’s industrial concentration in textile, apparel and leather sector and foods and beverages sectors. Even in region and rural and urban area wise this picture holds true. This may be the right message policy makers to think to diversify Pakistani industrial structure. In terms of employment status more than 70% of employees are unpaid family workers, partners and self employed people and this is very clearly visible in Pakistan’s house hold level enterprises and it is truly valid for rural, urban and region-wise as well. In gender-wise, female participation is very less even in paid or unpaid, partnerships and self-employed areas. In overall female labour participation is 7%. And it is 3% in unpaid, partnerships and self-employed areas. In rural, urban, households, and region –wise this picture holds true. Building status wise in overall establishments more than 58% are running their business in rented buildings and this is true in urban-wise (74%) but rural-wise majority of business are conducting in their own premises. More than 99% establishment employed capital (not included land and buildings) is less than one million PK Rs. And this picture holds true for rural, urban and region-wise. More than 97% of Pakistan enterprises are earning less than 20 million PK Rs. per year and this is hold true in region-wise as well. SMEs are naturally labour intensive and therefore they contribute heavily for employment, income distribution and poverty eradication. More than 98% of Pakistan enterprises in terms of urban, rural and region-wise employ less than 10 persons.
73
Business Review – Volume 3 Number 1 January – June 2008
4) TENTATIVE CONCLUSIONS
The universally acceptable official definition for SMEs not available in Pakistan overtime as the case in most developing countries and all the existing definitions depend on convenience and objectivity of studying SMEs. But almost all these definitions adopted their main criteria as no. of employees, capital employed/total assets and turnover in local or foreign markets. But these criteria have its own limitations overtime and need changes with technology improvement, productivity increases and inflation, etc. Still in Pakistan, a separate SMEs data base is not available and generally all the surveys (except a very few) or census at establishment level collect data on rural, urban and region-wise. Therefore researchers and authorities should take steps to expand SMEs data base regularly covering manufacturing, agriculture and service sectors while recommending a proper definition for SMEs overtime.
Heavy concentration of SMEs and their supportive organizations in urban areas in Pakistan may be the reason for urban bias unequal development pattern in country. Therefore some polices and strategies have to design to promote SMEs in more disadvantageous regions and SMEs related organizations to provide services for underdeveloped rural areas as well. Furthermore, the non-diversification of Pakistan industrial structure and its heavy concentration in the few low value added industry categories is a main problem for sustainability of industrial development. This may be a valid point for policy makers to take up and to formulate strategies to diversify the Pakistan industrial structure to create more value addition to local economy and to increase resilience of the economy.
In Pakistan’s the main heart of industry is Punjab and most SMEs are very young and owned by individuals and concentrates in service sector activities. In ISIC (two digit) industrial activities they are concentrated on few areas such as textile, apparel, leather, food and beverages sectors.
General assumption is that SMEs is the main contributor for generation of employment and value added in any economy. But that is very hard to prove through the available Pakistan data base. For instance, all the available industry census/survey data confirmed that in terms of number of establishments SMEs account for over 98% employment and enterprises but value added data not collected. However, manufacturing sector-wise value added data available for some years without specifically stating SMEs contribution (SMEDA/ILO: 2002, Bary. F and et.al:2001, 2003). These data shows that large scale industries generate more value addition compared with SMEs.
There are very many organizations and institutions involve in development and promotion of SMEs in Pakistan but overall coordination is very poor among them. In 1998 Pakistan set up SMEDA as an apex body for development and promotion of SMEs. But still most SMEs promotion bodies not under SMEDA and therefore naturally resource wastage and confusion
74

Business Review – Volume 3 Number 1 January – June 2008
among the SMEs is quite normal. It seems like better coordination among various SME stakeholder are badly necessary. Furthermore, the government SME support institutional setup seems like very complex and systems and procedural oriented. Therefore, it should be simplified and customer driven. But government can implement regionalization with centralization and uniformity with diversity in their SME supportive systems and delivery mechanism looking at the special characteristics of regional SMEs. The decentralization of government SMEs supportive organizations and structure may be good to provide more flexible, responsive and customer driven service to the informal sector SMEs who badly need these business development assistance.
SMEDA and SME Bank may be the right places to start this overall coordination of SMEs promotion and development initiatives. Especially proper coordination of various SME stakeholders (government institutions, private sector, NGOs and donors) are badly necessary. But problem is skills and capacities of the above two organizations and trust of SMEs about the efficiency and customer driven-ness of these organizations. Especially SMEDA has to undergone severe restructuring and image building to suit with current needs of Pakistan SMEs. Just appointing expensive committees or formation of common facility centers may be not the solution to SMEs complex problems. Private sector BDS providers should strengthen through fiscal measures and regulatory bodies to give more quality services to regional SMEs and government can take facilitator role in providing services to SMEs through BDS providers by coordinating their activities through regional trade and industry chambers.
5) FUTURE RESEARCH DIRECTIONS FOR PAKISTAN’S SMEs 1) Research agenda need to identify key issues in SMEs in informal sector in Pakistan that are currently affecting operations of SMEs. Can promote research to undertake diagnostic review of public, private, NGOs and donors supported SME institutions. It is better to document earlier SME sector studies, current SME programmes and activities, main donors, policies being implemented and key policies affecting small rural enterprises. 2) Research necessary to identify training needs of SME support institutions and same time can promote case study to see effectiveness of regional programming strategy of key aid agencies working in Pakistan and make a catalogue of rural SME development interventions that highlights successful examples of rural SME development in Pakistan. 3) Research necessary to identify and make recommendations of priority sectors and sub-sectors of SMEs that could be supported and promoted with potential for value addition, employment creation and growth in exports. 4) Research agenda needs to analyze the activities of financial institutions, particularly banks, serving rural areas by defining a range of financial products
75

Business Review – Volume 3 Number 1 January – June 2008
offered in rural areas, evaluating whether the supply of products/services fits local needs and highlighting supply shortfalls and potential opportunities. 5) Research necessary to design operational guidelines providing standards and performance indicators, which donors, NGOs and Government interventions /programmes in rural areas should comply with. 6) More empirical research are necessary to frame national policy framework, strategies, operational guidelines, institutional set-up and support, network development strategies and an implementation plan to a workshop of key stakeholders, providing options for Government consideration. Same time sub research agenda can workout to identify, design and deliver targeted capacity building initiatives for networks and support institutions to support strategy. 7) How far we can use ICT related various E-commerce applications and tools to promote and develop various aspects of SMEs. Especially SMEs competitiveness, productivity, efficiency, operational and production process and connectivity and networking be improve by using ICT may be good areas to research. 8) Research on productivity differences in small, medium and large scale enterprises and their various implications are necessary in Pakistan context (World Bank/SMEDA, 2003). Especially better to explore why competitive markets are not automatically ensure that less productive firms are forced out? Why market leave room for bigger firms with higher productivity but less potential to create employment and social justice? Why is it that small firms still dominate the economic structure even in more developed economies? What is their competitive advantage? Should development strategies ignore small-scale activities in order to raise overall productivity of economies? Does the dominance of small firms hinder or harm poverty reduction? Or is there a way to enhance productivity growth in small and medium enterprises? 9) More quantitative research are necessary to see the exact relationships between the share of employment and value added in SMEs and its relationships to growth of GDP in econometric terms. And the same time more scientific research can be promoted to further develop SMEs vicious cycle idea (Dasanayaka.S: 2006a) and to find strategies and means to break it. Furthermore, SMEs stakeholder integration framework (Dasanayaka.S: 2006b) can be further develop to link the various SMEs stakeholders. 10) Re-establishment and rehabilitation of recent earth quake affected Pakistan SMEs is very slow even with floods and rains of foreign and local assistance to this area. Therefore, action oriented research necessary to find out reasons for this failure and to find new framework and model to implement for disaster affected SMEs rehabilitation. 11) More research can be promoted to see the technology management issues in important SME sub sectors or industry clusters in Pakistan. Especially various business incubator models can be experimented to Pakistan looking at the best practices around the world (Nelson.O and Dasanayaka.S, 2006).
76
Business Review – Volume 3 Number 1 January – June 2008
12) An applied research project can be promoted to see an effectiveness of Pakistani SME apex bodies operational strategies in terms of costs/benefits or impact assessment studies. Especially effectiveness of SME clusters and common facility centers may be right start point for research. REFERENCES Bari, Faisal, Cheema, Ali, and Ehsan-ul-Haque, (2003), ‘SME Development in Pakistan: Analyzing the Constraints on Growth’, Pakistan Residential Mission Working Paper No.3, Islamabad: Asian Development Bank. Dasanayaka. S (2006a) Development and Practice of SMEs – The Case of Sri Lanka Chapter in SME Development and Practice in the Asia Pacific region, Monash University, Malaysia Campus SME network publication (forth coming soon), Edward Elgar. Dasanayaka. S (2006b) Development and Practice of SMEs – The Case of Pakistan in SME Development and Practice in the Asia Pacific region, Monash University, Malaysia Campus SME network publication (forth coming soon), Edward Elgar. Federal Bureau of Statistics (2000), Economic Census – 2000, Pakistan Federal Bureau of Statistics (2004), Economic Survey – 2003-04, Pakistan ILO/SMEDA (2002), Creating a Conducive Policy Environment for Micro, Small & Medium-Sized Enterprises in Pakistan. ILO/SMEDA, SEED Working Paper No.29. (Geneva, 2002). Bari.F and Ul Haq.B (2002), Barriers in SME growth, LUMS (Lahore Management School), Pakistan Nelson.O and Dasanayaka.S (2006), Small and Medium Scale Enterprises Development through Business Incubators, The Case of Sri Lanka, paper presented for SME-Entrepreneurship Global Conference 2006, Monash University Malaysia Campus, 15-17 October 2006. This soon coming as publication in SME Journal. SMEDA (2006), Developing SME Policy in Pakistan, SME Issues Paper for deliberation by SME task force, Policy Planning and Strategy Dept, Ministry of Industries and Production in Pakistan. http://www.smeda.org.pk World Bank/SMEDA (2003) Investment Climate Survey, Pakistan World Bank (2002) Survey for SMEs Policy Note, Pakistan
77

Business Review – Volume 3 Number 1 January – June 2008
“HABITS” DEFINED
“For our purposes, we will define a habit as the intersection of knowledge, skill, and desire.
Knowledge is the theoretical paradigm, the what to do and the why.
Skill is the how to do. And desire is the motivation, the want to do. In order to make something a habit in our lives, we have to have all three.
I may be ineffective in my interactions with my work associates, my
spouse, or my children because I constantly tell them what I think, but I never really listen to them. Unless I search out correct principles of human interaction, I may not even know I need to listen.
Even if I do know that in order to interact effectively with others I really
need to listen to them, I may not have the skill. I may not know how to really listen deeply to another human being.
But knowing I need to listen and knowing how to listen is not enough.
Unless I want to listen, unless I have the desire, it won’t be a habit in my life. Creating a habit requires work in all three dimensions.
The being/seeing change is an upward process – being changing seeing,
which in turn changes being, and so forth, as we move in an upward spiral of growth. By working on knowledge, skill, and desire, we can break through to new levels of personal and interpersonal effectiveness as we break with old paradigms that may have been a source of pseudo-security for years.
It’s sometimes a painful process. It’s a change that has to be motivated
by a higher purpose, by the willingness to subordinate what you think you want now for what you want later. But this process produces happiness, “the object and design of our existence.” Happiness can be defined, in part at least, as the fruit of the desire and ability to sacrifice what we want now for what we want eventually.”
Stephen R. Covey
78

Business Review – Volume 3 Number 1 January – June 2008
ARTICLE
On Nonlinearities in KSE 100 Index Stock Returns
Khurshid M. Kiani
Bang College of Business, Almaty, Republic of Kazakhstan
ABSTRACT: This research investigates possible existence of asymmetries in business cycle fluctuations in Karachi Stock Exchange (KSE) 100 index over money market rates. I model the relationship between excess stock return in KSE 100 index using a number of nonlinear time series models for constructing linearity tests for testing linearity in KSE 100 excess returns. These tests include Keenan test, Ramsay RESET test, and its improved versions i.e. RESET1 and RESET2 tests. The results based on Keenan test show statistically significant evidence of nonlinearities in KSE 100 excess returns. Likewise the results from Ramsay RESET test confirm this behavior. However, the results from RESET1 test fail to reveal statistically significant evidence of nonlinearities in KSE 100 excess returns. Similarly, RESET2 test failed to reject the linearity hypothesis for KSE 100 index excess returns. Key phrases: asymmetries; nonlinearities; principal components; excess stock returns; JEL codes: B22, C32, C45, E32; Word count: Main text – 2065 1. INTRODUCTION It is imperative to detect business cycle asymmetries in macroeconomic and financial time series data for several reasons. For example, nonlinearities in macro-financial variables would imply that the effects of monetary policy and other shocks on output and other macroeconomics and financial time series variables are not symmetric. This means that nonlinearities would invalidate the measure of the persistence of the monetary policy and other shocks on output and the other variables that are based on linear models. This implies that one would not be able to observe the impact of the monetary policy shocks on output and the other coherent variables when the underlying data generating process is nonlinear. This is very important for the policymakers who would be interested in forecasting the impact of the monetary policy and the other shocks on output other time series variables of prime importance in addition to the periods of high and low stock returns volatility. Likewise, it might
79
Business Review – Volume 3 Number 1 January – June 2008
be of interest to identify the candidate time series variables that might include stock returns to help predict future recessions. A number of researchers undertook studies on business cycle asymmetries using macroeconomic time series. In this context those who employed univariate nonlinear time series models to show the existence of asymmetric business cycle fluctuations in macroeconomic time series include Neftici (1984), Beaudry and Koop (1993), Potter (1995), Ramsey and Rothman (1996), Brunner (1997), Bidarkota (1999-2000), and Kiani and Bidarkota (2004). Similarly, Anderson and Vahid (1998), Anderson and Ramsey (2002) and Andreano and Savio, (2002) employed multivariate nonlinear time series models to conclude that business cycles asymmetries do exist in macroeconomic time series they studied. Likewise, Kiani (2005) and Kiani et al. (2005) used artificial neural networks to conclude that significant business cycle asymmetries do exist in macro-financial time series in the group of seven industrialized (G7) countries they studied. However, this type of research has not yet been focused on business cycle asymmetries in stock returns although study by Gabriel and Timmermann (2001) on business cycle asymmetries in stock returns is an exception. I feel that the time series models developed and employed to detect business cycle asymmetries in macroeconomic time series be used in detecting business cycle asymmetries in other macro-financial variables of prime importance including stock return especially in an emerging stock market. In particular, I use such models to detect asymmetries in KSE100 stock price index over money market rates. I believe that while focusing on an emerging stock market the present study will fill this gap adequately. Therefore, in this paper I investigate possible existence of business cycle asymmetries in KSE100 excess stock returns using a number nonlinear time series models. The remaining study is organized in the following sub-sections. Section 2 discusses empirical models that include nonlinear and switching time series models. Section provides empirical results including specification search, parameter estimates, section discusses hypotheses tests, results on hypotheses tests and discussions on results. Finally section provides important conclusions that can be drawn from this study.
3
45
2. EMPIRICAL MODELS In this research I employ four types of nonlinear time series models to construct nonlinearity tests for detecting possible existence of asymmetries in KSE100 excess returns series. These tests are designed for testing departures from linearity in mean that are elaborated in the following sub-sections.
80

Business Review – Volume 3 Number 1 January – June 2008
I prefer to employ Schwarz Bayesian Criterion (SBC) for selecting our model parameterizations which is recommended by Schwarz (1978) compared to Akaike Information Criterion (AIC) that is proposed by Judge et al. (1985) because SBC penalizes heavily for inclusion of miss-specified variables. 2.1. KEENAN TEST This linearity test was proposed by Keenan D. M. (1985) which comprises of four parts. In the first part this test a linear model is estimated regressing excess returns series ( ) on an intercept and its lags ( ) to recover
predictions ( ), residuals ( ), and residual sum of squares
( ). In the second part squared predictions from linear model ( )
are regressed on an intercept and the past values of the excess returns series ( ) to compute residuals ( ). In the third step,
are regressed on to estimate and
predictions (η) using Equation .
ty Msss yyy −−− ,....,,,1 21
tfyhat = tu
∑=
=T
ttuSSE
11 ˆ 2
tf
Msss yyy −−− ,....,,,1 21 tv)ˆ,.....,ˆ(ˆ 1 nMt uuu + )ˆ,.....,ˆ(ˆ 1 nMt vvv + 0η
ˆ 1.22/1
1
20 )(ˆˆ ∑
+=
=n
Mttvηη
( ) 1.2The test statistics for this test is calculated using Equation and and obtained from the previous step.
2.2 1SSE η
( )
)ˆ/())22(ˆ( 21
2 nSSEMnTS −−−η=2.2
Under normality hypothesis this test statistics is distributed (1, ) degrees of freedom. This test examines if squared forecast has any additional predictability. Therefore, the test is designed to test departures from linearity in mean.
F 2M2n −−
2.2. RAMSEY RESET TEST The Ramsey RESET test that was proposed by Ramsey (1969) is an improvement over the Keenan test in an alternate manner because of the form of the model employed in this test. The test consists of three parts. In the first part excess return series ( ) are regressed on the past values of the series ( ) for
to recover predictions ( ), residuals ( ), and residual sum of ty ktt yy −− ,......,,1 1
pk ,......,1= ty tu
81

Business Review – Volume 3 Number 1 January – June 2008
squares ( ) for∑=
=T
ttuSSE
10 ˆ Tt ,.......,1= . In the second part of this test, excess
returns series are now regressed on perditions from the first part ( ), and
polynomials of these predictions using Equation for any to recover
residuals ( ), and residual sum of squares ( ), for
1ˆ tt fy =3.2 2≥k
tv ∑=
=T
ttvSSE
11 ˆ Tt ,....,1= .
( ) t
ktktttt vffffy +β++β+β+= .........3
22
1
3.2In the last part of the test, test statistics is computed using Equation 4.2 ))/(/())1/()(( 010 knSSEkSSESSETS −−−=
( ) 4.2 In Equation , denotes the number of the polynomials of forecasts and n the number of observations in the series. The test statistics is distributed approximately under normality hypothesis with
4.2 k
F 1−k , and kn − degrees of freedom. The RESEST tests are responsive for departures from linearity in mean. 2.3. RESET1 TEST RESET1 test is an improved version of RESET test wherein the collinearity between the repressors is avoided using principal component analysis. In the first part of this test excess returns series ( ) is regressed on an intercept and its lagged values
( ) for ty
ktt yy −− ,......,,1 1 pk ,......,1= to recover predictions ( ), residuals ( ),
and residual sum of squares ( ) for
ty tu
∑=
=T
ttuSSE
10 ˆ Tt ,.......,1= . To avoid
collinearity between the data matrix ( tX~ ) and predictions, principal component of
the prediction series ( ) for are computed. In the third
part, predictions ( ) from the previous part are regressed on
ktt ff .,,.........2 )1(* −< kp
ty tX~ and the principal
components ( ) using Equation to recover residuals ( ), and
residual sum of squares ( ) for
ktt pp .,,.........1 5.2 tv
∑=
=T
ttvSSE
12 ˆ Tt ,....,1= .
82

Business Review – Volume 3 Number 1 January – June 2008
tktktttt vpppfy +β++β+β+= .........2
21
1
( ) 5.2Finally, test statistics is calculated using Equation 2.8. ( )
))/(/())/)(( 2*
12 knSSEpSSESSETS −−=6.2
where, in Equation , is the number of observations, is the number of variables in the model, and is the number of principal components. The test
statistics is distributed approximately with and
6.2 n kn *p
F *p kn − degrees of freedom under normality hypothesis. 2.4. RESET2 TEST RESET2 test is a Lagrange multiplier version of RESET test wherein collinearity is eliminated using principal components analysis in the test. This test comprises of four parts. In the first part, a linear model is employed to regress excess returns series ( ) on an intercept and lags of the series to compute predictions ( ),
residuals ( ), and residual sum of squares ( ) for
ty 1ˆ tt fy =
tu ∑=
=T
ttuSSE
11 ˆ pk ,.......,1= ,
and In the second part, principal components are computed using
predictions ( ) choosing to avoid collinearity between
the prediction series and data matrix (
.,........,1 Tt =k
tt ff ,.......,2 )1(* −< kp
tX~ ). In the third part, residuals ( ) from the
previous part are regressed on principle components ( ) and data
matrix (
tuktt pp .,,.........1
tX~ ), using Equation to compute7.2 2R .
( ) t
ktktttt vpppfy +β++β+β+= .........2
21
1
7.2In the last part, test statistics is calculated using Equation . 8.2 ( )
2nRTS =8.2
where, in Equation is the number of the observations in the series being investigated and the test statistics is distributed under linearity hypothesis.
8.2 n)( *2 pχ
83

Business Review – Volume 3 Number 1 January – June 2008
3. EMPIRICAL RESULTS 3.1. DATA SOURCES Monthly data on KSE 100 stock price index from February, 1989 to February, 2007 along with the money market rates for the corresponding period are used to calculate excess returns series employed in this research. Excess returns are reported as percent per month though out the study. Figure 1 show plots of the KSE100 index excess return series. 4. HYPOTHESES TESTS The chief hypothesis of this study is the hypothesis of linearity versus the alternative hypothesis of nonlinearity. Using linearity tests constructed from nonlinear time series models, this study perform four types of linearity tests. The first type of hypothesis is based on Keenan test, the second on Ramsay RESET test, the third on RESET1 test, and the fourth on RESET2 test. Therefore, for testing possible existence of nonlinearities I test the null hypothesis of linearity against the alternative hypothesis of nonlinearity in KSE100 excess returns series. If the null hypothesis of linearity is true, linearity does prevail in the data series being tested. However, when the null is rejected in favor of the alternative hypothesis, nonlinearities do prevail in the series being tested. These tests are designed to test for departure from linearity in mean. 4.1. RESULTS ON HYPOTHESES TESTS The empirical results on hypotheses tests for Keenan test, Ramsay RESET test, RESET1 test, and RESET2 test are presented in Table 4 . The relevant p-values from
statistics for Keenan, Ramsay RESET test, and RESET1 test, and p-values from distributions for RESET2 test are juxtaposed in the subsequent column in
parenthesis.
F2χ
The Keenan test as well as Ramsay RESET test reject linearity hypothesis against the alternative hypothesis of nonlinearities for KSE100 stock price index based on the relevant p-values obtained for both the tests from distributions. However, RESET1 does not reject the null of linearity against the alternative hypothesis of nonlinearity for KSE100 stock price index using p-values from the distributions. Likewise based on the p-values obtained from distributions the RESET2 test also fails to reject linearity hypothesis in KSE 100 index excess returns.
F
F2χ
84
Business Review – Volume 3 Number 1 January – June 2008
All statistical inferences for these tests are drawn at 5 percent level of significance. The results do not change when I change the significance level from 5 percent to10 percentage level. 4.2. DISCUSSION OF RESULTS ON HYPOTHESES TESTS Our results for nonlinearity tests based on time series models presented in Table 1 show that two out of the four nonlinear time series models employed to test linearity hypothesis for testing nonlinearities in KSE100 index excess return i.e. Keenan test and Ramsay RESET test show statistically significant evidence of nonlinearities in KSE 100 stock excess returns whereas the other two i.e. RESET1 and RESET2 do not. A plausible of reason of which could be because the models that accepted linearity hypotheses were not able to pick the type of nonlinearities inherent in the KSE100 excess return series whereas the models that rejected the null were able to pick them. The reason why two out of the four models employed for testing nonlinearities were not able to find possible existence of nonlinearities in KSE 100 stock price index may have been because our time series models do not encompass features to account for possible existence of conditional heteroskedasticity and fat tails that is widely documented in the literature. 5. CONCLUSIONS I employ nonlinear time series models, for finding possible existence of business cycle nonlinearities in KSE100 stock excess returns series. This approach is fully parametric and accounts for time varying volatility, outlier, and long memory that may be present in the series being investigated. In addition to switching time series models I also employed nonlinear time series models for construction of linearity test for testing nonlinearities in KSE 100 excess returns series. Our results on linearity tests that are based on Keenan test and Ramsay RESET test provide statistically significant evidence of nonlinearities in KSE 100 excess stock returns. These results are in line with earlier study by Gabriel and Timmermann (2001) on business cycle asymmetries in stock returns. However, RESET1 test as well as RESET2 test failed to reveal statistically significant evidence of nonlinearities in KSE100 excess returns. Our study results show statistically significant evidence of nonlinearities in KSE 100 index excess returns in two out of the four models employed for testing nonlinearities in the series. However, future research might come up with further evidence of nonlinearities (if any) in KSE 100 index using additional nonlinear time series models, possibly regime switching models with features that can account for conditional heteroskedasticity and fat tails that is documented in the empirical literature. Likewise, the use of some kind of flexible functional form of nonlinear
85

Business Review – Volume 3 Number 1 January – June 2008
time series models like artificial neural network may also be advantageous to capture nonlinearities in the KSE 100 index return series. FOOT NOTES 1 See Davis, R. (1977) and Andrews, W. (2001) for discussions on the nuisance parameter that appears under the alternative hypothesis. 2 The principal component analysis (PCA) is a variable reduction technique which is designed to explain the variance-covariance structure of a set of variables through a few linear combinations of these variables (Dunteman, 1989). The PCA technique was also employed by Burkowitz, Pistor, and Richard (2003), and Durnev and Kim (2005). The PCA merely being a linear combination of existing variables might not be of much help in interpreting the results properly (Greene 2003). However, it can be helpful to understand how changes in principal components affects the dependent variable or when we are concerned about the direction of the change rather than the magnitude. Therefore, in the PCA analysis I reduce the large number of correlated independent variables into smaller number of interconnected variables that are identical number of linear combinations of existing variables that are easily interpreted (Richard and Wichern, 2002). 3 Thanks are due to Dr. Tufail A. Qureshi, Editor, Business Review, for assistance with the data. 4 French and Sichel (1993) and Brunner (1992, 1997) show existence of conditional heteroskedasticity in real GNP data, and Granger (1995) recommends that linearity be tested using heteroskedasticity-robust tests. 5 Tsay (1988) demonstrate that nonlinearities reported in various studies are due to presence of outlier in the data. Scheinkman and LeBaron (1989) and Balke and Fomby (1994) showed that presence of outlier weakens the evidence of nonlinearities. However, Bidarkota (1999, 2000), Gabriel and Timmermann (2001) and Kiani and Birdarkota (2004) reported strong evidence of nonlinearities in macroeconomic time series even after accounting for outliers. REFERENCES Anderson H, Vahid F. (1998), Testing Multiple Equation Systems for Common Nonlinear Components. Journal of Econometrics, 84, 1-36. Anderson H, Ramsey J. (2002), U.S. and Canadian Industrial Production Indices as Coupled Oscillator. Journal of Economic Dynamics and Control, 26, 33-67.
86

Business Review – Volume 3 Number 1 January – June 2008
Andreano, M. and G. Savio, (2002), Further Evidence on Business Cycle Asymmetries in G7 countries, Applied Economics, 34, 895-904. Andrews, D., (2001), Testing when Parameter is Under the Boundary of the Maintained Hypothesis. Econometrica, 69, 683-734. Balke, N. and T. Fomby, T. (1994), Large Shocks, Small Shocks and Economic Fluctuations: Outliers in Macroeconomic Time Series, Journal of Applied Econometrics, 9, 181-200. Beaudry, P. and G. Koop, (1993), Do Recessions Permanently Change Output? Journal of Monetary Economics, 31, 149-163. Bidarkota, P. (2000), Asymmetries in the Conditional Mean Dynamics of Real GNP: Robust Evidence, Review of Economics and Statistics, 82, 153-157. Bidarkota, P. (1999), Sectoral Investigation of Asymmetries in the Conditional Mean Dynamics of the Real US GDP, Studies in Nonlinear Dynamics and Econometrics, 3, 191-200. Burkowitz, D., K. Pistor, and J. F. Richard, (2003), Economic development, legality, and the transplant effect, European Economic Review, 47, 165-195. Brunner, A. (1997), On the Dynamic Properties of Asymmetric Models of Real GNP, The Review of Economics and Statistics, 79, 321-326 Danielsson J. (1994), Stochastic Volatility in Asset Prices Estimation with Simulated Maximum Likelihood. Journal of Econometrics, 1994, 64, 315-400. Davis, R., (1977), Hypothesis Testing when a Nauisance Parameter is Present Only Under the Alternative, Biometrika, 64, 247-254. Dunteman, G., (1989), Principal Components Analysis, Sage, Newbury Park. Durnev, A. and E. H. Kim, (2005), “To Steal or Not to Steal: Firm Attributes, Legal Environment, and Valuation,” The Journal of Finance, 60, 1461-1493. French, M.W., and Sichel, D.E. (1993), Cyclical Patterns in the Variance of Economic Activity, Journal of Business and Economic Statistics, 11, 113-119. Gabriel P., and Timmermann, A. (2001), Business Cycle Asymmetries in Stock Returns: Evidence in Higher Order Movements and Conditional Densities, Journal of Econometrics, 103, 259-306.
87

Business Review – Volume 3 Number 1 January – June 2008
Granger, C.W.J. (1995), Modeling Nonlinear Relationships Between Extended-Memory Variables, Econometrica, 63, 265-279. Greene, W. H., (2003), Econometric Analysis. Upper Saddle River, NJ Prentice-Hall. Judge, G., Griffith, C. Hills, H. Lutkepol, and T. Lee, (1985), The Theory and Practice of Econometrics, 2nd edition, Wiley: New York. Jensen, D., and de Vries, C. (1991), On the Frequency of Large Stock Returns: Putting Booms and Busts into Perspective. Review of Economics and Statistics, 73, 18-24. Keenan, D., (1985), A Tucky Nonlinear Type Test for Time Series Nonlinearities, Biometrika, 72, 39- 44. Kiani, K., P. Bidarkota, and T. Kastens, (2005), Forecast Performance of Neural Networks and Business Cycle Asymmetries, Applied Financial Economics Letters 1, 025-210. Kiani, K., (2005), Testing Nonlinearities in Using Time Series Models and Artificial Neural Network, Computational Economics 26, 65-89. Kiani, K., and P. Bidarkota, (2004), On Business Cycle Asymmetries in G7 Countries, Oxford Bulletin of Economics and Statistics, 66, 333-353. McQueen, G., and Thorely, S., (1993), Asymmetric Business Cycle Turning Points, Journal of Monetary Economics, 55, 703-708. Neftci, S., (1984), Are Economic Time Series Asymmetric Over the Business Cycle? Journal of Political Economy, 92, 307-328. Potter, S., (1995), A Non-linear Approach to U.S. GNP, Journal of Applied Econometrics, 10, 109-125. Ramsey, J., (1969), Tests for Specification Errors in Classical Linear Least-squares Regression Analysis, Journal of the Royal Statistical Society, 31, 350-371. Ramsey, J., and Rothman, P. (1996), Time Irreversibility and Business Cycle Asymmetry, Journal of Money Credit and Banking, 28, 1-21. Richard A.J., and Wichern, D.W., (2002), Applied Multivariate Statistical Analysis, Prentice Hall, Upper Saddle River, New Jerssy.
88

Business Review – Volume 3 Number 1 January – June 2008
Scheinkman, J., and LeBaron, B., (1989), Non-Linear Dynamics and GNP Data, Cambridge: (Cambridge University Press Cambridge). Schwarz, G., (1978), Estimating the Dimension of a Model, Annals of Statistics, 6, 461-4. Tsay, R., (1986), Nonlinearity Tests for Time Series, Biometrika, 73, 461- 466. Table 1: Linearity Tests Results: Nonlinear Time Series Models Test Type
Test Statistics
p-values
Keenan Test
2.25698E+00
0.0018
Ramsay RESET Test
1.83685E+28
0.0001
RESET1 Test
2.31750E+00
0.1294
RESET2 Test
3.52230E+01
0.9999
NOTES ON TABLE 1 1. Table show linearity test results based on Keenan test, Ramsay RESET test,
and its improved version RESET1, and RESET2 test. The empirical models used for calculating the test statistics reported in this Table are shown in Equations 1.2 to 8.2 in the preceding text.
89

Business Review – Volume 3 Number 1 January – June 2008
2. In this Table for example column 2 row 1 show test statistics for Keenan test and column 3 row 1 presents p-values for this test. The results for the remaining tests are presented in a similar manner.
Sometimes when I consider what tremendous consequences come from little things……. I am tempted to think ………. there are no little things.
BRUCE BARTON
90

Business Review – Volume 3 Number 1 January – June 2008
DISCUSSION
Training Within Oil & Gas-Based Industries In The State of Qatar
Hend A. Jolo
College of Business and Economics Qatar University, Doha, Qatar
ABSTRACT This research is an exploratory study that investigates training in the state of Qatar. It is carried out with the intention to provide an insight into such a process among national workers in the Oil and Gas-based Industries (OGBI), which is one of the most significant economic sectors in the country. Additionally, the study also endeavourss to investigate the training process and its related factors and practices that affects the development of their skills within the industry, such as their educational background, promotion and training incentives. It is found that educational attainment had influenced the Qatari workers' achievement of their training programmes objectives and its effectiveness in developing their general and specific skills, with a stronger link with higher educational attainment and technical education. It was also shown that success and effectiveness of training within the industry in forming and developing Qatari workers’ skills is influenced by other internal organizational factors mainly promotion 1. INTRODUCTION
he State of Qatar, as an oil/gas-rich country, has benefited from its natural resources’ revenues in implementing different social and economic development
projects. However, future development, particularly industrial development, is increasingly significant and may require the full utilization of such resources. As challenging the global economy, Qatar has to benefit from its current natural resources through building up its indigenous human capital, mainly through education and training. Moreover, as a newcomer to industrial development, particularly via oil and gas projects, the Qatari oil co-operations has to realize that competing in such a global production market, with changing technologies, is a difficult task without a qualified and highly-skilled workforce. This study, therefore, seeks to provide in depth understanding of the state of national human capital formation through training at the micro level of the oil/gas-based industry (OGBI). It investigates the training process by analyzing the influence of educational attainment of employees within the OGBI and the related practices on the effectiveness of training within OGBI.
T
91

Business Review – Volume 3 Number 1 January – June 2008
2. OIL AND GAS-BASED INDUSTRIES IN QATAR Oil, natural gas and related manufacturing industries form the backbone of the national economy of the state, and the dominant industrial sector in Qatar, beside the manufacturing industries that have become important in the recent years as an alternative source of national income. The oil sector provides about 90-95% of Qatar's total government revenues. It was and continues to be besides gas, the most important lever for economic development in the country. The Qatari government launched broad-based development projects in many fields since 1970s. As a result of the development of the sector, Qatar Petroleum Company (QP) was established in 1974 by the government to take over the civil service function of monitoring the oil and gas industry, which was followed by other industries. There are five prominent industries in Qatar: crude oil and refining, fertilizers, petrochemicals, steel reinforcing bars and cement. For the purpose of the current study, focus will be on the oil and gas-based industries (OGBI), which depend on oil and/or gas as feedstock to their production, and are part of QP - namely the fertilizer, chemical and petrochemical industries, whose industrial base represents the manufacturing base of the current country’s economy. The country now boasts four petrochemical companies, Qatar Petrochemical Company (QAPCO), Qatar Fertilizer Company (QAFAC), Qatar Vinyl Company (QVC), Qatar Chemical Company (Q-Chem), and one fertilizer company, Qatar Fuel Additive Company (QAFCO), in most of which QP is a major shareholder. Those companies will be the sample of the current study. 3. SIGNIFICANCE OF TRAINING IN THE INDUSTRY Attention has been drawn to the importance of human capital to economic development. Both microeconomic analysis (Becker 1975) and macroeconomic studies (Romer 1986, Lucas, 1988) have stressed the importance of human resources' education and training for increasing productivity and economic growth. The value of education and training is confirmed by studies which point to the high returns on investment in this field. The concluding observation of these studies is that there is a close relationship between formal education and training in developing workforce skills. It is generally agreed that formal pre-employment education is the main institutional body for supplying the basic general skills needed in the workplace. Indeed, basic skills are considered a prerequisite and basis for acquiring and accumulating additional specific-skills in the future. However, though formal education may teach basic or sometimes simple skills that maybe relevant to industry, such skills may only serve the activities of small-scale industries (Lall, 1991: 136). For higher levels of industrialization, both technical and vocational education and training (TVET) and on-the-job training are essential to meet the requirement for constantly changing skills.
92
Business Review – Volume 3 Number 1 January – June 2008
The challenges industrial corporations and organizations, such as those within the OGBI in Qatar, face in the knowledge-based economy are increasing profitability and competing globally. Apart from the normal means of achieving financial and productivity goals through advanced technology, these corporations must expand beyond their current boundaries to meet these challenges. Education, as invested by government, and training, as invested by corporations, should enable corporations to create the opportunities to meet the demands of the new economy. If, therefore, the industry's workforce lacks employees equipped with the skills necessary to perform their tasks efficiently, corporations will not be able to operate in such a competitive sector. This means greater training efforts are needed to meet the job requirements of a variety of industries. The workforce is not generally equipped with the required competitive skills through the formal education system. This suggests a possible option for developing workers' skills in the production sector, which is generally capital intensive and requires a qualified workforce to carry out its complex tasks. The available option is to fill such a gap by increasing the coverage of the school system through intensive compensatory training programs especially of young people (i.e. high-school graduates). The global tendency within manufacturing industry today is to assign companies all kinds of responsibilities, including that of skills training, which had traditionally been provided by the formal/public education system. Thus, training is crucial in any attempt to improve productivity levels within the production sector. 4. LITERATURE REVIEW Different studies have examined the impact of education on particular sectors within an economy. Using industry level data for 61 branches of U.S. manufacturing over the 1960-80 period, Bartel and Lichtenberg (1987) found that the relative demand for educated workers was greater in sectors where more advanced capital equipment had been installed. In the same vein, Wolff (1996) found that in U.S. industries in the period 1970-85 the growth of cognitive skill levels among employees was positively correlated with indicators of recent technological change, including computer intensity. Furthermore, Griliches (1970) uses industry-level manufacturing data from the U.S. to determine whether labour "quality" is correlated with greater output and found out that education has a positive impact on output. In examining the relationship between education and productivity in the manufacturing sector in Ghana, Jones finds evidence that workers with tertiary education are more productive than those with secondary schooling, workers with secondary schooling more productive than those with primary education, and workers with primary education more productive than those with no formal education. In addition, she also found that workers with vocational training are more productive than those with secondary education (2001: 75). This, in turn, may reflect
93
Business Review – Volume 3 Number 1 January – June 2008
the fact that manufacturing industry is shifting towards skilled, well-educated, labor. In this regard, Berman, et al. found that there was a shift in demand away from unskilled and towards skilled labor in U.S. manufacturing over the 1980s, which was due to the increased use of skilled workers within this sector (1994: 367). As to the empirical literature aiming to directly quantify the contribution of training to workers' or a company's productivity, several studies do indeed shows a positive impact on productivity. Generally, the estimates range from very large effects (Bartel, 1994) to minimal effects (de Koning, 1994). Benefits from training investment in the firms include different effects for workers, besides higher company productivity, such as a positive influence on subsequent occupational status (Greenhalgh and Stewart, 1987) and the likelihood of promotion (Bishop, 1990). In terms of educational attainment for example, it was found that inappropriate educational background and lack of training were major obstacles contributing to the limited improvement and development of workers' competence and performance in the Omani Chemical Industry (Al-Muqbali, 2002.:284). Al-Muqbali also found that the lack of firm-specific training has not only kept the production workers within the chemical industry away from carrying out certain production tasks but also inhibited them from learning, acquiring and developing new skills and competencies (ibid.: 290), that may ultimately develop their performance and hence industry's productivity. Within the petroleum industry, it was found that training may not be oriented towards enhancing and developing national workers' skills if this was associated with different problems. In this context, Abdelwahab indicates that lack of incentives, shortage of training staff, their qualifications and their training and development as well as the un-preparedness of managers, supervisors, and experienced colleagues to train others demonstrates how the training of nationals can be affected (1992: 333), and hence their acquisition of skills and knowledge may not achieved. Accordingly, he stressed that training of training staff, at all levels, is essential to prepare them to train others and to ensure that transferred knowledge and skills are efficiently acquired (ibid., 354). 5. RESEARCH METHODOLOGY 5.1 Objectives of the Study The purpose of this paper may be summarized by the following objectives: 1. To examine the relationship between the educational attainments of the
industry's employees and the formation of their specific human capital through training.
2. To assess the training programs effectiveness and the its relation to promotion
94

Business Review – Volume 3 Number 1 January – June 2008
3. To examine to what extent educational attainment of Qatari workers within the OGBI is adequate/matching their current job-tasks, to what extent Qatari workers need training programs to develop their job-related skills, and how far the OGBI is committed to the provision of educational opportunities for Qatari workers within the industry.
4. To suggest and set a strategy in which the future national human capital can be formed through training in the OGBI in more developed terms according to the concluding findings within the current study.
5.2 The main Questions of the Study The current paper investigates the following questions: 1. To what extent do the OGBI provide educational and training opportunities
to national Qatari workers? 2. To what extent do Qatari workers' educational attainments affect the
effectiveness of their training programmes, and related practices? 3. To what extent do other practices such as promotion and training difficulties
influence the training of Qatari workers within the OGBI? 5.3 The Significance of the Study The current research is investigating the effect of education at OGBI on training. It endeavors to analyze the influence of such a relationship on the effectiveness of national workers' training within the investigated industry. This study will attempt to analyze the effectiveness of training according to the trainees' perspective, and its related issues as promotion. In addition it will contribute to the general literature in this field, because it is the first study to examine this issue, particularly with regard to the OGBI. It is also the first study to link educational attainment, as a prime factor, to training in a very significant industry in Qatar. Thus, the most significant aspects of this study pertain to the state of human capital in the OGBI in Qatar. This paper is of descriptive type of research, which is a form of conclusive research that focuses on an accurate description of the variables under investigation. Usually such studies are based on the nature of the research problem and its objectives. In order to gather information relating to the context of the present study and also to provide an assessment of the general background of the study, a wide range of related primary and secondary sources, both published and unpublished documents, were used intensively. The best known resource of primary data collection in the social sciences in general is the survey, which includes structured or semi-structured data collection methods. Official documents and publications along with relating literature review were used as a major source in supporting the background of this study.
95
Business Review – Volume 3 Number 1 January – June 2008
5.5 Sample of the Study The population for this study is comprised of Qatari nationals working at the OGBI. Since the core subject of this study is related directly to employees, junior and senior-level employees were targeted to participate in the study. However, this sample is heterogeneous in terms of different personal characteristics such as age, gender, educational level, and length of service within their position. Accordingly, stratified sampling was used in this study to provide a greater accuracy in comparison to a simple random sample. In addition, this type of sampling is used in order to ensure that different types of respondents are correctly and adequately represented in the sample. A total of (350) questionnaire, were circulated to potential respondents chosen from the investigated industries. A total of 193 usable questionnaires were returned, giving a response rate of (72%). 5.6 Questionnaire The research methodology used both quantitative and qualitative methods of data collecting on a complementary base of each other. In order to gather information relating to the context of the present study and also to provide an assessment of the general background of the study, a range of related primary and secondary sources were used as well. However, related literature review was used as a major source in supporting the background of the study. The following research methodology was employed in Qatar Oil and Gas Based Industry. Following a review of the literature in the field of training, a questionnaire was developed and included directs questions relating to training. In addition, the questionnaire included related demographic questions to provide additional information regarding the subject matter. A five-point Likert scale is used to represent the degree of a respondent's agreement and disagreement with statements ranging from “strongly disagree’ to “strongly agree”. Pre-testing is very important stage in the questionnaire reinforcement process, prior to finalizing questionnaire. The completion of the pre-test provided some valuable comments on related aspects, which in turn ensured that the questionnaire was directed towards the data needed to accomplish the objectives and questions of the study. As a result, the questionnaire’s questions were revised and readjusted before their final distribution amongst population within the investigated sector. Each participant was asked to complete one self-administered questionnaire presented in both languages: Arabic and English.
96

Business Review – Volume 3 Number 1 January – June 2008
5.7 Statistical Methods In order to analyze the results and findings of the study, descriptive statistics and cross-tabulation is applied to determine the presence and degree of association, or absence, of a relationship between any pair of variables chosen to be analyzed. It is also used to explore how demographic variables are related to various attitudes and behaviours, and to analyze how one behavioural attribute is related to another. It also allows examining frequencies of observations that belong to specific categories or more than one variable. For the sake of expressing the relationship between any two variables, the correlation coefficient is usually computed. Nonparametric equivalents to the standard correlation coefficient are Pearson chi-square and Spearman correlation test. In addition, Mann-Whitney U test was also used to examine the attitudes of the trainees towards related issues as promotion. 6. ANALYSIS AND DISCUSSION 6.1 Respondent's Background Table 1 shows that the highest proportion of participants in the current study were from QP (27.5 %) in comparison to other investigated companies where their participants constitute 15.5% in both QAFCO and Q-Chem, 15% in QAFAC, 14% in QAPCO and 12.4 % in QVC. The high percentage of participants of QP is not remarkable since this company is considered not only the major company in the oil and gas industry but also the largest company in terms of size, employing 73.5% of the total workforce in the OGBI. In terms of job classification, it was found that the proportion of senior and junior staff participants' constituted 50.3% and 49.7% respectively. The results show that the vast majority of respondents (80.8 %) were males, while the percentage of female respondents was 19.2%. Indeed, the participation rate of females in the survey is higher than their participation rate in the industry where they constitute only 6.6% of the total workforce, which is due to the nature of the industry and the working environment: in remote areas, hazardous, with long working hours and lack of suitable job opportunities, which made the participation of women in the industry even lower. There is a similar situation in the Arab Gulf states. For example, Al-Muqbali (2002: 152) found that female participation in the chemical industry in Oman accounted for only 11.4%.
97

Business Review – Volume 3 Number 1 January – June 2008
Table (1) Summary of Respondents’ Backgrounds Background Information Frequency % Company QP 53 27.5 QAPCO 27 14 QAFCO 30 15.5 QAFAC 29 15 QVC 24 12.4 Q-Chem 30 15.5 Job Classification Senior Staff 97 50.3 Junior Staff 97 49.7 Gender Male 156 80.8 Female 37 19.2 Age Less than 20 26 13.5 21-30 99 51.3 31-40 44 22.8 41-50 17 8.8 51-60 6 3.1 Working year with the company Less than 5 years 130 67.4 5 – 10 19 9.8 10 – 15 18 9.3 15 – 20 18 9.3 20 + 8 4.1 The highest proportion of respondents according to their age-groups was found in the 21-30 group whose' participants constitute 51.1% followed by the 31-40 age-group. The high percentage of young workers, i.e. the cumulative percentage of first two age-groups accounting for 64.8%, may suggest the industry's high interest in employing these age-groups which are considered the most productive. In addition, such a situation may also refer to the implementation of the ‘Qatarization’ process within the industry, which emphasizes the recruitment of high-school and university graduates most of whom are classified in the younger-age groups. Furthermore, it may also refer to the changing attitudes towards industrial employment amongst young Qataris and their willingness to join such a sector, either to move away from government employment, obtain wider experience or benefit from the sector’s educational, training and financial schemes, as confirmed by the majority of high school students and new recruits in the investigated companies.
98

Business Review – Volume 3 Number 1 January – June 2008
With regard to the job positions' classification, results indicated that the vast majority of respondents 66% are classified as technicians, whereas 32% are classified as administrative workers. The number of Qatari workers in the OGBI has increased over recent years and is expected to increase even more under the strategy of ‘Qatarization’. The results showed that 67.4% of the respondents had been appointed within the last five years. Statistically, Pearson's correlation test has indicated a strong relationship between working years and age of respondents as r = 0.537 and p < 0.01. In turn, such a correlation may confirm that a large number of Qatari workers have been employed in the OGBI over the last 10 years, which may be interpreted either as the success of ‘Qatarization’ over the last decade and hence increased participation of nationals in the industrial sector or as, indicated above, the changing attitudes of Qatari graduates towards industrial employment as stressed by some of the recent Qatari recruits who confirmed that 'the brilliant future of the industry besides its financial and educational benefits' are the most significant reasons for joining the industry'. Additionally, from their initial low participation rate in the industry Qatari females have been more eager and willing to seek employment within industry in recent years. The over-employment in the government sector by national females especially in the education sector, the emergence of the unemployment phenomenon among graduates, and the changing attitudes towards new jobs and positions especially within the public, mixed and industry sectors has encouraged Qatari females to join the industry sector. In terms of working year with the company, the results showed that 67.4% of the respondents had been appointed within the last five years, out of which 51.3% are males and 16.1% are females, followed by 9.8% within the previous 10 years (7.3% males and 2.6% females). Statistically, Pearson's correlation test has indicated a strong relationship between working years and age of respondents as r = 0.537 and p < 0.01. In turn, such a correlation may confirm that a large number of Qatari workers have been employed in the OGBI over the last 10 years, which may be interpreted either as the success of ‘Qatarization’ over the last decade and hence increased participation of nationals in the industrial sector or as the changing attitudes of Qatari graduates towards industrial employment as stressed by some of the recent Qatari recruits who confirmed that 'the brilliant future of the industry besides its financial and educational benefits' are the most significant reasons for joining the industry'. On the other hand, there was also another significant correlation between working years and gender as r = -.204 and p = .004, with recent years appointment associated with higher recruitment of Qatari females, where they accounted for 83.8% of total female respondents that were appointed in the last five years. Indeed, such a result may refer to the implementation of ‘Qatarization’ strategy which emphasizes the employment of Qatari females in the industry.
99
Business Review – Volume 3 Number 1 January – June 2008
6.2 Educational Variables 6.2.1 Educational Attainment Results indicated that most Qatari workers within the OGBI who participated in the survey were graduates, at the time of their appointment, of secondary education (51.3 %) in comparison to graduates of university education (33.6%, N=64), while other certificate holders were less represented (7.3% technical secondary, 4.7% less than secondary education, and 3.6% post-university education). In response to the second question as to whether their education was upgraded within their current company, and though the OGBI emphasis is on providing educational and training opportunities for Qatari workers and confirmed by many interviews, it was revealed that 67.4% of Qatari participants indicated that their education was not upgraded, 31.1% (secondary), 29% (university). On the other hand, participants whose education was upgraded within their current company constituted 32.6% of total respondents, out of whom 20.2% were secondary certificate holders. This may be interpreted in the context of training significance in developing workers' specific-skills rather than education within the OGBI. However, according to the personal interviews with both workers and managers, it was indicated that workers who are encouraged to learn are more willing and able to meet the needs, goals and objectives of the firms. Furthermore, managers stressed that providing workers with educational opportunities creates a workforce capable of applying all the benefits of learning to the growth of their firms. Thus, it may be concluded that though providing educational opportunities in the OGBI is significant in creating a desirable workforce, training remains a higher priority since it is more effective in developing and enhancing workers' general and specific skills. This is also perhaps due to the fact that education is a long-term process that not only generates general-skills but also needs to be complemented by training, while training is a short-term process reflected in direct results. In addition, it may be argued that on-the-job training directs workers towards specific required tasks and gives them a greater opportunity to grow professionally. Nevertheless it was reported from different interviewers that Qatari workers are more concerned with educational opportunities than training. This is basically due to their desire to upgrade their job-classification from junior to senior staff, which usually relates to higher wages and financial benefits either within the industry, as promotion and related incentives, or within the government as benefiting from the 'land and loan' governmental grant.
100

Business Review – Volume 3 Number 1 January – June 2008
On the other hand, the results of respondents' current educational attainment shows that only 6.7% and 5.7% respectively hold technical secondary and diplomas, which underlines the argument regarding low educational outcomes. The majority (46.1%) held university degrees, followed by those with secondary certificates (41.5%). According to these results, it can be deduced that the majority of Qatari workers in the OGBI mostly hold secondary and university qualifications, which may reflect the OGBI’s lack of interest in employing workers with less than secondary education, considering secondary education as the minimum accepted attainment among OGBI workforce. In this regard, a study conducted among operatives within heavy industry in Saudi Arabia, Aramco, Samref, and Yanpet, revealed that the majority of operatives (65.9%) were also holders of high school certificates (Al-Zalabani, 2000: 265), which emphasizes the significance of this education category in the middle-level technical positions. However, another study found that among 15.4% of the total number of Qatari workers in the manufacturing sector, 16.7% were holders of university degrees whereas 15.7% were holders of secondary and diploma certificates (Al-Misnad, 2000: 33-44). Generally, these results may reflect the industry's strict and prudent policy in implementing the recent ‘Qatarization’ strategy, which started in 2000, which emphasizes the quality aspects of recruiting more-qualified, secondary education and above, workers at the expense of the less-educated workers achieving below secondary level. In addition, it may also indicate a positive shift in the attitudes of the new Qatari generation towards technical jobs and hence joining the industrial sector either as a result of over-employment within the government sector or as a result of the newly emerging phenomenon of unemployment amongst young people. 6.2.2 Educational Attainment and Suitability/Adequacy with Current Job Results show that 37.3% of Qatari workers indicated the neutral response " adequate', while 36.8% conceived that their current educational attainments are 'highly suitable' followed by those who indicated 'suitable' (25.9%), which together indicate that a majority of respondents (67.7%) are not only 'satisfied' with their current educational attainment in managing their current job's tasks, but are also endeavouring to enhance their qualifications by further training programmes as 82.4% indicated their need for further training in comparison to 17.6% who indicated that they do not need further training. In determining the statistical significance of the relationship between education/job suitability and respondents' educational attainment, the Pearson chi-square was performed and resulted in the value of 4.972, with 6 degrees of freedom, and associated level of significance of 0.54 which is larger than the alpha value of 0.05. This implies that the relationship between the two variables is not statistically
101

Business Review – Volume 3 Number 1 January – June 2008
significant, and hence not correlated, which in turn may stress the above argument that within the OGBI, training is of greater importance when compared to education. Figure 1 Educational Attainments and its Adequacy to Respondents' Current Job's Tasks
36.8%
25.9%
37.3%
Highly suitbale
Suitable
Not sure
However, such findings maybe worth more investigation especially from the human capital theory perspective. The theory suggests that the ability to absorb new knowledge and acquire new skills depends on the amount of knowledge and education accumulated in the past. This may suggest that Qatari workers within the OGBI with lower educational attainment, i.e. secondary, are less able to absorb knowledge and specific-skills and that such a level of education is not adequate to allow them to manage their jobs effectively. As shown above, 62.7% of respondents had indicated the ‘suitability and ‘high suitability’ degree between their educational attainments and their current job tasks. This may indicate that the majority of Qatari workers employed in the OGBI, even those with higher educational attainment such as university graduates, are emphasizing that they enhance and develop their specific job-related skills, absorbing knowledge and acquiring new skills through on-the-job training rather than education. As a result, the above argument of human capital theory regarding the significance of accumulated knowledge and hence educational level in absorbing and acquiring specific skills can apply in general to any industrial sector, as within the OGBI, but with greater emphasis on the significance of training. As Lall argued (1991: 136) though formal education may create basic, or sometimes simple, skills that may be relevant to industry, such skills may only serve the needs of small-scale industries.
102

Business Review – Volume 3 Number 1 January – June 2008
For a higher level of industrialization as within the OGBI, both technical education and on-the-job training are essential to meet the requirements for new skills needs. These results were also confirmed statistically with a Pearson chi-square value of 19.864 and 2 degrees of freedom (df) and a very strong level of significance of 0.000, which suggests a strong relationship between degree of education/job suitability and respondents' need for further training programmes, particularly with those indicating their ‘neutral, not sure’, responses. On the other hand, the Pearson chi-square indicated no association between the need for further training programmes and respondents' educational attainment. With a value of 2.390, 3 degrees of freedom and a significant level of 0.49, which is greater than the alpha level of 0.05, this suggests that there is no relationship between the two variables. The general conclusion that can be drawn from such analysis is that in an industrial sector, such as the OGBI, education is significant in providing workers with general skills but not specific ones, which in turn points to more important issues in the OGBI, in Qatar in general and in the industrial sector in particular, regarding the significance of continuous training in developing workers' specific-skills. Table 2 Respondents' Educational Attainment and Suitability with Current Job * Need for Further Training Cross-tabulation
70 40 49 15936.3% 20.7% 25.4% 82.4%
2 10 22 341.0% 5.2% 11.4% 17.6%
72 50 71 19337.3% 25.9% 36.8% 100.0%
Count% of TotalCount% of TotalCount% of Total
Yes
No
Do you need furthertraining program?
Total
Not sure SuitableHighly
suitable
Educational attainment and suitability ofcurrent job
Total
However, training seems to be of great significance in filling gaps between formal education and workplace skills (Anderson, 1993: 1). Accordingly, whenever learning of basic and general skills through formal education is lacking, upgrading skills within any industry through training is not only a hard task but may affect the growth and productivity of the industry. In response to the above findings, that stress the absence of any correlation between respondents' educational attainment and their job suitability, as well as their need for further training, one may suggest that education in Qatar plays a significant role in generating and enhancing general skills among nationals, at least from the workers’ perspective. This is evident in the above results, and it affects their ability to absorb and acquire specific skills within the industry.
103

Business Review – Volume 3 Number 1 January – June 2008
It is true that educational institutions may not provide the OGBI with the required qualifications, quantitatively and qualitatively. However, it seems that formal education in Qatar, though isolated from the labour market, industry, and the economy, is generating a 'good level' of general-skills, especially among technical secondary graduates, which will have a positive effect on the workers' ability to generate their specific skills through training in the OGBI. However, if such education is more effective in developing nationals' general skills, then this increasingly strong foundation would have a positive effect on the occupational qualifications of those graduates, leading to success in their transition into employment, and hence developing their specific skills. On the other hand, while the results may reflect this fact, they also underline the significance of training in creating and developing workers' specific skills, which ultimately indicates that education in itself is not enough in operating and managing an industrial sector, rather it should always be complemented by training. The fact that was noted by Middleton et al (1993), who argues that while general education provides students with broad knowledge and basic skills, training develops specific skills which a worker is expected to use on the job. This may imply that human capital formation in the industry is a continuous process that begins with general skills' formation through formal education and ends, and continues, with specific skills' formation through continuous on-the-job training in the industry. 6.3 Training Objectives and Achievement The results indicated that the main objectives of training amongst the majority of respondents were represented in 'enhancing current job-related skills' (82.9%) and 'obtaining new job-related skills' (68.4%) followed by 'implementing new production/technology' and 'increasing wages and promotion,' constituting 66.3 and 64.8% respectively. Other objectives revealed to be less significant were 47.2 and 28.5% of respondents who indicated other objectives such as 'developing general skills' and 'according to employment' as the main objective of their training programmes. In terms of the latter, though the employment agreement of any new Qatari worker within the OGBI stresses training as a preliminary condition before those workers can be post-holders, it was remarkable that only 55 Qatari workers conceived such a factor as the main objective for their training. This may support the above finding that Qatari workers are more "… interested in developing their technical skills even if they decide to leave the industry" as some interviewed workers had confirmed, since such "training is ultimately enhancing their skills though it may not be fully utilized in other jobs or sectors". According to the above results it seems that Qatari workers are looking to enhance and develop their current job-related skills in comparison to other objectives, but the question that arises is to what extent such an objective has been met and achieved.
104

Business Review – Volume 3 Number 1 January – June 2008
Indeed, it was indicated that only 23.3% had 'highly achieved' such an objective and that 39.4% of respondents had indicated that they had achieved the objective of 'implementing new production/technology'. It was also revealed that only 11.4% of respondents had ‘highly achieved’ their objective of 'increasing wages and promotion'. Generally, training within the OGBI is usually designed to reach a particular objective and confirmed by most training managers within the OGBI, such as those listed above which are related directly to the development of workers' skills and/or company performance and production process. However, increasing wages and promotion, though indicated by 64.8% of Qatari workers as a main objective of joining a training programme within the industry, is not the major objective either when designing these programmes or when targeting particular workers. The correlation results revealed a significant relationship between respondents' educational attainment and obtaining new job-related skills as r = .261 and p < 0.01 (.000), enhancing current job-related skills as r = .326 and p = .000, increasing wages and promotion as r = .271 and p = .000, and general skills as r = .195 and p < 0.01 (.007). Such statistical findings may confirm the human capital theory argument that stresses the importance of the level of accumulated knowledge through education to absorb new skills. It may also suggest that the higher the educational attainment of the worker, the higher the degree of achieving the training objective. For example, it was found that respondents with university degrees had recorded the highest percentages in achieving, to a high level, the above objectives, where they accounted for 44.9, 36, 46.1, 19.1, and 47.2% respectively among the other respondents' educational levels. On the other hand, statistical results also revealed that there is no relationship between the respondents' educational attainment and the achievement of implementation of new production/technology, which may suggest that such an objective is influenced directly by workers' training rather than his/her educational attainment. 6.4 Training Effectiveness Indeed, a majority of respondents 'agreed' on the effectiveness of training in developing their general-skills (93.3%), specific-skills (88.1%), know-how skills (83.9%), multi-task skills (83.4%), solving job-related problems skills (67.8%), managing complex skills (65.1%), job positions (57.0%), and finally upgrading their wages and promotion (44.6%). Training related factors were also perceived by respondents as effective in their training programmes as the results revealed. A majority of respondents agreed on the effectiveness of their training curriculum (84.5%), which coincided with training objectives (70.5%). In addition they also indicated the effectiveness of teaching staff (81.4%), facilities (69.4%), and length (69.9%).
105

Business Review – Volume 3 Number 1 January – June 2008
Table 3 Spearman Correlation Test: Current Educational Attainment Independent Variable: Current Educational Attainment
Dependent Variable
Correlation Coefficient ( r )
Sig. ( p )
Targeting right workers r = .038 P = .604 Availability of training facilities r = .043 P = .552 Understanding of training objectives r = - .025 P = .730 Related training curriculum & objectives r = .055 P = .443 Efficient teaching staff r = .082 P = .259 Adequate training length r = .032 P = .660 Developing specific- skills r = .174* P = .016 Developing multi-task skills r = .078 P = .278 Managing complex-tasks r = .155* P = .032 Solving job-related problems r = .230** P = .001 Developing know-how skills r = .180* P = .012 Developing general-skills r = .219** P = .002 Developing job position r = .193** P = .007 Improving wages & promotion r = .278** P = .000 * Correlation is significant at the .05 level ** Correlation is significant at the .01 level The above results answer the study's question regarding the effect of respondents' educational attainment on the effectiveness of their training programmes. In order to enhance such results statistically, it was further tested by the Spearman correlation test. According to these results, it is apparent that such correlation is significant in developing some skills and insignificant with others. First of all, it is clear that respondents' educational attainments do not affect training factors such as related objectives and curriculum, length, teaching staff and facilities, since the significant values of these variables are greater than the alpha value of 0.05. The general conclusion from this result is the fact that workers' educational attainment did not affect the effectiveness of training factors such as facilities, teaching staff, etc., since such factors should be provided by the firms, thus benefiting all the workers within the industry regardless of their educational attainments. Any difficulties with these factors may, therefore, hinder the training process itself. In other words, training may not be orientated towards enhancing and developing workers' skills if it is associated with different problems. Secondly, a remarkable fact needs to be highlighted regarding the absence of a significant correlation between respondents' educational attainment and their job-education adequacy. This is represented in the significant correlation between the respondents' educational attainment and their evaluation of their training programmes in forming
106

Business Review – Volume 3 Number 1 January – June 2008
their human capital within the industry. According to the Spearman correlation test (Table 3), the most significant correlation seems to be within developing respondents' know-how skills (r = .180 and p = .012), specific-skills (r = .016 and p < 0.05), managing complex tasks (r = .155 and p < 0.05), solving job-related skills (r = .230 and p = .001), developing their general-skills (r = .219 and p = .002), enhancing their career positions (r = .193 and p = .007), and finally improving their wages and promotion prospects (r = .278 and p =.000). According to these findings, the research shows that in the OGBI the effectiveness of these training programmes is greatly influenced by the respondents' educational attainment, with a strong association between higher levels of educational attainment and effectiveness of training in enhancing and developing the various skills required within the industry. Accordingly, because the OGBI is constantly changing, workers need to improve their current and existing skills and acquire a wide range of technical skills that will keep them up-to-date with new methods and technology. Thus, training when allied to a 'good' level of general skills, i.e. secondary education and above, seems to be very important in enhancing skills and generating a flow of information and understanding that will allow the effective accomplishment of certain tasks within the industry. However, it has been shown that workers with no qualifications or intermediate-level educational qualifications have high returns from training (Blundell, et al, (1996). Investigating such a finding within the current study revealed, to some extent, a similar result. As Table 4 shows, it is true that respondents with higher educational qualifications, such as university degrees, had clearly benefited from training in forming their skills, but it should be noted that such benefits, and hence correlation, had been with particular skills such as developing specific skills, 92.2%, solving job-related problems, 77.5%, and increasing their wages and promotion prospects, 58.5%. Nevertheless, an unexpected result was also found in the fact that respondents with lower educational qualifications had higher returns from training, as was the case with technical secondary certificate holders, where training was very effective in increasing their ability to manage multi-tasks, 92.1%, to manage complex tasks, 77%, develop their know-how skills, 92.3%, and develop their general skills, 100%, which may highlight the significance of technical education in influencing the skills' formation process within industry. Table 4 Respondents' Current Educational Attainment *Training Effectiveness Cross-tabulation* Item/educational level General Second.
Freq. % Tech. Second. Freq. %
Tech. diploma Freq. %
University Freq. %
Developing specific-skills 67 83.8 11 84.6 10 90.9 82 92.2 Developing multi-tasks 64 80 12 92.1 8 72.8 77 86.5 Managing complex tasks 44 55 10 77 8 72.7 64 71.9
107

Business Review – Volume 3 Number 1 January – June 2008
Solving job-related problems 46 57.6 10 77 6 54.5 69 77.5 Developing general-skills 60 75 11 92.3 10 90 80 89.8 Developing job-position 71 88.8 13 100 11 91 95 95.5 Improving wages & promotion 36 45.1 8 61.6 5 95.5 61 68.6
* Only agree and strongly agree responses are presented here, which are combined together However, the main conclusion that can be drawn from these results is represented in the significance of education in the effectiveness of training in creating workers' skills and knowledge as the human capital theory stresses. However, another important result is represented by the fact that it is difficult to generalize the argument that the higher the educational qualifications, the higher the returns on training, as the above findings suggest. This may suggest the significance of technical education, at least in comparison to general secondary education, in forming both general and specific skills. Though technical education in Qatar is not a major source of qualified people, it seems that, according to the above findings, this type of education is a 'good' source of the technical skills required by the industry, and technical education graduates have an enhanced ability to absorb new general and specific knowledge and skills. 6.5 Promotion Respondents were asked to indicate the kind of promotion/remuneration they had obtained when completing their training programmes. The results show that 41.5% of respondents did not have any kind of promotion/remuneration after the completion of their training programmes in comparison to 27.5% who were promoted, 25.4% who had an increase in salary, and 5.7% who had other types of promotion such as a letter of acknowledgement, appreciation and encouragement by direct department/section manager, and another training programme. In fact, such a result should be considered seriously, particularly amongst workers with secondary certificates, whose cross-tabulation results indicated that about 19.7% in this educational category did not have any type of promotion, only 11.9% had monetary rewards, and 7.8% were promoted. However, this is also the case with university graduates where about 15% indicated that they did not have any kind of promotion when their training programme was complete. The above finding suggests the absence of a significant correlation between respondents' educational attainment and promotion, a fact that was statistically confirmed by the Pearson correlation test which resulted in the coefficient correlation ( r ) value of 0.000 and level of significance of 0.99, which is greater than the alpha value of 0.05. Nevertheless, it may also be concluded according to the above results that completion of any training programme does not necessarily coincide with any promotion or reward. Indeed, such an argument maybe supported by the above
108

Business Review – Volume 3 Number 1 January – June 2008
findings, especially by the fact that 41.5% of respondents indicated that they did not have any kind of promotion or rewards after the completion of their training programmes. In this context, Al-Kuwari (2000: 240) found that promotion practices within an oil company, QP, that recognize and acknowledge employees' work efforts and allocate rewards to those with high levels of performance are likely to have a positive effect on work motivation and organizational commitment. On the other hand, the significance of 'lack of financial rewards' as presented as a lack of incentive, is a major obstacle of training within the OGBI, and lack of promotion can be justified from the human capital theory perspective. This theory assumes that individuals are motivated to invest in their human capital, education and training, with the expectation that such an investment will increase their future earnings. Though this argument applies from the individual perspective in terms of bearing the cost of such an investment, it is believed to be a great influence even when such an investment is fully financed by the firm, as within the OGBI. The lack of such future value for their new acquired skills, such as training incentives and promotion, had, statistically, affected Qatari workers' (chi-square =50.130, df = 3, p = .000) human capital. 6.6 Training Difficulties In order to identify the effect of the educational attainment of Qatari workers within the OGBI on their training programmes, respondents were asked what they considered to be the main obstacle of such a process. While the results show variations among respondents in this matter, which may be related to different personal-demographic variables, the majority of respondents (27.5%) indicated that the main obstacle to proceeding with their training programme is lack of incentive. However, such a result may point to the significance of incentives from the point of view of workers, the majority of whom (41.5%) indicated earlier that they did not have any promotion rewards when completing a training programme. Indeed, lack of incentives that coincide with training represented a 'setback to the development of indigenous skills' in other industries such as the Omani Chemical industry (Al-Muqbali, 2002: 170), which reflects the significance of financial rewards in encouraging the nationals to acquire new skills. On the other hand, this may suggest that the educational background of Qatari workers does not appear to be a major obstacle since only 19.2% (N=37) indicated the significance of such a factor in hindering their training programmes, though it ranked as the second obstacle after lack of incentives. Other factors perceived to hinder training are inefficient training facilities (18.1%), inefficient training context (13%), workers' low motivation towards training programmes and inefficient training teaching staff (10.9%).
109

Business Review – Volume 3 Number 1 January – June 2008
In terms of overcoming training obstacles overcoming, the results indicate that 25.4% of respondents had indicated 'planned matching between educational attainment and training context' as a major alternative to overcome training difficulty, followed by 19.7% of respondents who had indicated increasing the training incentives, 18.1% who had indicated the scholarship scheme, 17.6% who had indicated the option of training abroad,, 15% who had indicated, on-site training, and finally 4.1% who indicated 'other' alternatives such as having intensive English language sessions, employing Arab instructors and training staff rather than non-Arabs, training teaching staff and instructors themselves, and improving training facilities. The above findings, are apparently a contradictory result since previous results indicating training obstacles revealed that most respondents had stressed lack of training incentives as the main training obstacle, while the responses in terms of overcoming training difficulties revealed that a majority of respondents had stressed planned matching between trainees' educational attainment and training context as the main alternative for overcoming training difficulties. However, this can easily be explained by the fact that 59.5% of those who had stated the mismatch between educational attainment and training context as a major difficulty had indicated that planned matching between educational attainment and training context is the right solution to overcome training difficulties. And 45.3% of those who had stated lack of training incentives as a major obstacle, had indicated increasing such incentives as the alternative. Furthermore, 42.9% of those who had stated that inefficient training of teaching staff was the major obstacle of their training programmes had indicated that overseas training was a high priority, where 23.8% who had considered inefficient training facilities as hindering their training had indicated on-site training as the method to overcome such inefficiency, and finally 20% of respondents who stressed the inefficiency of the training context indicated that on-site training and a scholarship scheme was the right alternative . Figure 2 Qatar Workers' Training Difficulties *Difficulties Overcoming Cross-tabulation
Mismatch between E/T
Low motivation
Ineffecient T.staff
Ineffecient T.facilt
Ineffecient T.contxt
Lack of incentives
Other
Percent
2001000
Difficulties overcom
Other
Increase incentives
centives
Trtaining abroad
Scholarship
On-site training
Planned matching E/T
38
38
63
44
29
34
45
110

Business Review – Volume 3 Number 1 January – June 2008
Informal discussion with a number of Qatari workers revealed that they felt that even though the nature of their jobs in the OGBI differed from other industrial occupations within the industrial sector in terms of skills requirements, training remained of great value in supporting them with specific skills. Thus, planned matching between trainees' educational background and training context is very significant to achieve the required objectives of the training programme effectively. Simultaneously, the hazardous nature of technical occupations in the OGBI, as in the operation and production fields, involves a higher degree of risk in comparison to other industries. Although, the wages' structure within the OGBI is considered relatively high when compared to other sectors of the economy, especially the government sector, and to some extent other manufacturing sectors, risk remunerations do not coincide with the current working conditions, where the level of risk increases as a result of skill upgrading. Accordingly, lack of incentives, particularly of technical industrial and professional training, may decrease workers' attitudes towards such training or even the implementation of their acquired knowledge. 6.7 Agreement with Training Policy The result, indicates that 42.5% of respondents agreed with their company’s current training policy, 21% strongly agreed, 17% disagreed, and 10% of respondents neither agreed nor disagreed and strongly disagreed, respectively, with their firms' training policy. Respondents were also asked to indicate whether or not (yes or no) their current firms' training policy is in need of readjustment. The results show that a majority of workers (66.8%) believed that such a policy needed readjustment, while those who had indicated their negative thoughts of such readjustment accounted for 33.2%. In order to highlight the significant correlation between training needing readjustment, and respondents' educational attainment, the Kruskal-Wallis H test was also used to detect differences in such readjustment scores amongst different educational categories. As the results show, there are statistically significant differences among the four categories. The Chi-square value was 9.262 with 3 degrees of freedom and a significance value of .026. In addition, the different mean ranking suggests that since the training readjust variable was coded 1 for 'Yes', and 2 for 'No', the highest educational category indicating the need to readjust training policy was found among secondary certificate holders followed by technical secondary certificate holders.
111

Business Review – Volume 3 Number 1 January – June 2008
Table 5 Kruskal-Wallis Test (Test variable: need to readjust training policy) Educational category N Mean General Secondary 80 86.71 Technical Secondary 13 87.27 Technical Diploma 11 100.09 University Degree 89 107.29 Grouping variable: educational attainment Chi-square = 9.264 df = 3 P=. 026 6.8 Significance of Education as a Pre-requisite for Training Since the study was aiming to assess the significance of Qatari workers' educational background in relation to the effectiveness of their training within the OGBI, respondents were asked to indicate their perceptions towards such matters. The results show that a majority (41.5% and 37.3%) of respondents indicated that education is a significant and very significant, respectively, pre-requisite for the effectiveness and success of their training programmes in forming their human capital within the OGBI. The Spearman's correlation test had indicated the insignificant statistical relationship between this variable and other independent variables such as company, age, gender, job classification, job position, and even educational attainment as the significant levels of these variables were greater than the alpha value 0.05. In turn, this may stress that respondents' perception of education as an important factor affecting their training programmes, is not influenced by their personal variables. As stressed earlier, the human capital prediction that the general-skills level, developed through education, is significant in the development of specific skills, which are formed through training, does not apply to the current study findings. Rather, it may be argued that within the industrial sector, a higher level of education is not necessary to absorb and acquire specific skills. Indeed, secondary education seems to be a good minimum level to generate and develop specific skills, but technical secondary may seem to be a better minimum level for acquiring such skills within any industry, as the current study findings suggest. 6.9 Success of Education/Training Links in Forming Human Capital Finally, respondents were asked about their evaluation of education-training close links as a significant source of forming their human capital. As result shows, 42% of respondents perceived that education and training was the significant source in forming their human capital, followed by 30.6% of respondents indicating these sources as ‘very significant’. Spearman's correlation test indicated a significant relationship between this variable and respondents' educational attainment as r = .199 and p = .005 with a closer association with higher levels of education. On the other hand, the Kruskal-Wallis H
112
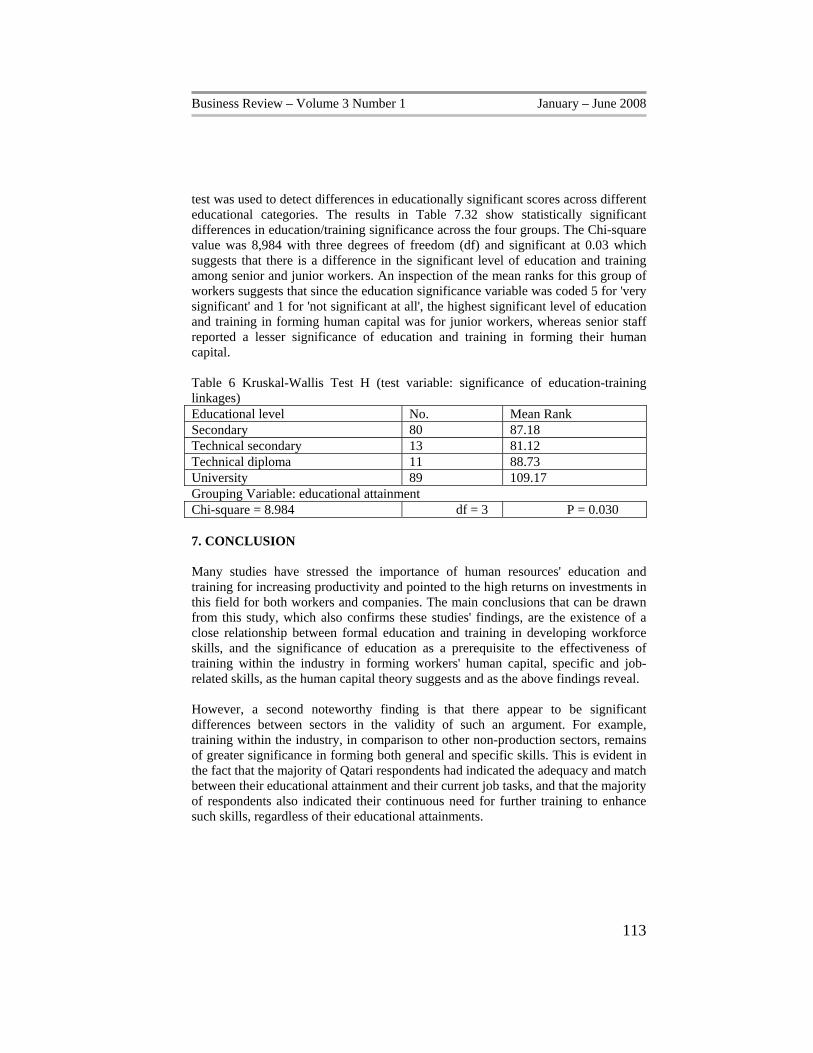
Business Review – Volume 3 Number 1 January – June 2008
test was used to detect differences in educationally significant scores across different educational categories. The results in Table 7.32 show statistically significant differences in education/training significance across the four groups. The Chi-square value was 8,984 with three degrees of freedom (df) and significant at 0.03 which suggests that there is a difference in the significant level of education and training among senior and junior workers. An inspection of the mean ranks for this group of workers suggests that since the education significance variable was coded 5 for 'very significant' and 1 for 'not significant at all', the highest significant level of education and training in forming human capital was for junior workers, whereas senior staff reported a lesser significance of education and training in forming their human capital. Table 6 Kruskal-Wallis Test H (test variable: significance of education-training linkages) Educational level No. Mean Rank Secondary 80 87.18 Technical secondary 13 81.12 Technical diploma 11 88.73 University 89 109.17 Grouping Variable: educational attainment Chi-square = 8.984 df = 3 P = 0.030 7. CONCLUSION Many studies have stressed the importance of human resources' education and training for increasing productivity and pointed to the high returns on investments in this field for both workers and companies. The main conclusions that can be drawn from this study, which also confirms these studies' findings, are the existence of a close relationship between formal education and training in developing workforce skills, and the significance of education as a prerequisite to the effectiveness of training within the industry in forming workers' human capital, specific and job-related skills, as the human capital theory suggests and as the above findings reveal. However, a second noteworthy finding is that there appear to be significant differences between sectors in the validity of such an argument. For example, training within the industry, in comparison to other non-production sectors, remains of greater significance in forming both general and specific skills. This is evident in the fact that the majority of Qatari respondents had indicated the adequacy and match between their educational attainment and their current job tasks, and that the majority of respondents also indicated their continuous need for further training to enhance such skills, regardless of their educational attainments.
113
Business Review – Volume 3 Number 1 January – June 2008
On the other hand, it was found that educational attainment had influenced the respondents' achievement in their training programmes’ objectives as well as effectiveness in developing their skills, with closer association between such practice and higher educational attainment, which was also proved statistically by indicating a significant relationship between these variables. However, this is not to suggest that those with a lower educational attainment did not benefit from training, rather it was shown that even among those groups high returns from training in forming their skills were accomplished. In this regard, the type of education, apart from its level, seemed also to have an influence on the acquisition and developing of such skills. According to the current study findings, it was revealed that technical education had proved its effectiveness not only in achieving training objectives, enhancing and developing different general and specific skills, but also in performing more effectively than other types of education, even a university education. For national skills to be developed effectively there is a need for constant cooperation between educational institutions, especially technical institutions, and the industry to generate and develop workers' job-related skills and hence improve their performance. At the industry level, training should continue to be a major means of generating and developing workers' specific skills and to some extent their general skills. Furthermore, internal organizational factors that affect training effectiveness such as promotion, PAS, and incentives need to be readjusted in accordance with workers' performance rather than job classification, which in turn is expected to enhance stability and the commitment of Qatari workers towards their jobs and hence firms. It has been evident in the current study that the process of human capital formation of indigenous skills is linked, where it began with general skills developed through formal education and continued during employment through continuous on-the-job training in the industry. It was also revealed that though formal education in Qatar is quantitatively and qualitatively isolated from the real requirements of industry, i.e. technical skills, it performed well in terms of the general skills level acquired by Qatari workers within the industry. Apart from the earlier suggestion of a mismatch between formal education in Qatar and the OGBI requirements of qualified workers, it is indicated that, generally, such education performs well in enhancing the general skills of Qataris and that closer education-training links have accelerated the success of such a process. However, such education can generate higher levels of general skills, which may enhance the level of specific skills acquired through training, if a greater co-ordination between the two bodies is well planned. Thus, it may be concluded that in the absence of the above mechanisms, the process of human capital formation in the OGBI through training may continue to be hindered and remain ineffective.
114
Business Review – Volume 3 Number 1 January – June 2008
REFERENCES Abdelwahab, A., (1992), Manpower Recruitment and Training in the United Arab Emirates' Petroleum Industry, ph.D thesis, University of Leeds Al-Kuwari, Ahmed, (2000), An Empirical assessment of Factors Affecting Employees' Organisational Commitment in the Petroleum Industry: The case Study of Qatar General Petroleum Company QGPC, Unpublished ph.D thesis, University of Exeter. Al-Misnad, L, (1999), The Role of National Workforce in the GCCs Manufacturing Industries in the: Reality and Future, working paper presented to the Seventh Industrial Conference of the GCCs, GOIC, Qatar Al-Muqbali, H., (2002), Management of Technology in Oman: the Process of Developing Indigenous Production Skills in the Chemical Industry, ph.D Thesis, University of Exeter Anderson, A. H., (1993), "Training and Management Practice: A Manager Guide to Personnel Development, Blackwell Publishers, England Bartel, A., (1994), "Productivity Gains from the Implementation of Employee Training Programs:, Industrial Relations, A Journal of Economic and Society, vol. 33(4), October, pp. 411-24 Bartel, A. and Lichtenberg F., (1987), "The Comparative Advantage of Educated Workers in Implementing New Technologies", Review of Economics and Statistics, 69, pp. 1-11 Becker, Gary, (1975), Human Capital, New York, National Bureau of Economic Research (NBER), and Columbia University Press Berman, Eli, John Bound, and Zavi Griliches, (1994), “Changes in the Demand for Skilled Labour within U.S manufacturing: Evidence from the Annual Survey of Manufactures”, Quarterly Journal of Economics, vol. 109, pp. 367-98. Bishop, J.H., (1990), 'Job Performance, Turnover and Wage Growth', Journal of Labour Economics, vol.8, pp. 363-86 Blundell, R., Dearden, L., and Meghir, C., (1996), The Determinants of Work-related Training in Britain, London: Institute of Fiscal Studies Dearden, L., Machin, S., Reed, H. and Wilkinson, D., (1997), Labour Productivity and Work-Related Training, London: Institute for Fiscal Studies IFS, London, May
115

Business Review – Volume 3 Number 1 January – June 2008
De Konong, J., (1994), Evaluating Training at the Company Level, in R. McNaab and K. Whitfield (eds.), The Market for Training, Aldershot: Avebury Greenhalgh, C.A. and Stewart, M. B., (1987), The Effects and Determinants of Training, Oxford Bulletin of Economics and Statistics, vol. 49, pp. 171-89 Griliches, Z., (1969), Capital-Skill Complementarity, Review of Economics and Statistics, November. Jones, P., (2001), Are Educated Workers really more Productive?, Journal of Development Economics, vol. 64, pp. 57-79 Lall, S., (1991), "Explaining Industrial Success in the Developing World", in V. Balasubramanyam and S. Lall (ed.), Current Issues in Development Economics, London: Macmillan Lillard, L. A. and Tan, H.W., (1992), Private Sector Training: Who Gets it and What are its Effects?, Research in Labour Economics, vol. 13, pp. 1-62 Lucas, Robert, (1988), On the Mechanism of Economic Development”, Journal of the Monetary Economics, vol. 22 (1), pp. 3-42. Romer, Paul M, (1986),“Increasing returns and Long-run Growth”, Journal of Political Economy, vol. 94 (5), pp. 1002-37 Wolf, E., (1996), "Technology and the Demand for Skills", OECD Science, Technology and Industry Review no. 18, pp. 96-123
How different our lives are when we really know what is deeply important to us, and, keeping that picture in mind, we manage ourselves each day to be and to do what really matters most. If the ladder is not leaning against the right wall, every step we take just gets us to the wrong place faster. We may be very busy, we may be very efficient, but we will also be truly effective only when we begin with the end in mind.
STEPHEN R. COVEY
116

Business Review – Volume 3 Number 1 January – June 2008
DISCUSSION
Managing Knowledge Workers
Shandana Shuaib Institute of Management Sciences, Hayatabad, Peshawar, Pakistan
ABSTRACT Knowledge workers are actually those workers in an organization who are sensitive to change. They constantly respond to the changes in the environment by gathering information and then arranging their work accordingly. With the accelerated pace of change, we should not hesitate in accepting the reality that all knowledge workers have significant place in the organization. The importance of their role to any organization that wants to survive in this dynamic epoch cannot be underestimated. Knowledge workers are indispensable for the organizations. They like to have complete autonomy in the work they perform. Their creativity and inquiry-driven learning may be difficult to achieve within traditional command-and-control paradigm. Too much stringency can be destructive to their creativeness and can have adverse effect on their performance. On the other hand too much leniency means giving them an absolutely freehand. Managers are faced with the dilemma of how to strike a balance between the two extremes. Proper management can best harness their potential and can further enhance their capabilities and get the most from these workers. Improving knowledge worker productivity is the most important task of the century. Yet we have few measures or management interventions to make such improvement possible. Although we can not cent percent identify the pattern which should be followed by knowledge workers because systems and processes in an organization are often regarded as a kiss of death to encouraging creativity, but this need not be the case. Without a system, the generation of ideas and application can be lost for ever. Therefore it is a challenge for the management as how to manage knowledge workers due to their importance and the unique role they play in the organization. The paper simply throws some light on how the interventions can act as tools for proper management of knowledge workers and for enhancing their performance. INTRODUCTION
he study focuses on the importance of knowledge workers to any organization that wants to survive in the dynamic era and how to get the most out of them.
Some of the interventions that can act as tools for proper management of knowledge workers are also discussed in the paper.
T
117

Business Review – Volume 3 Number 1 January – June 2008
Problem Definition Knowledge workers use their creativity and inquiry driven learning in the work and demand more autonomy and authority as compared to the traditional workers. This has created a dilemma for the managers as how to strike a balance between the two extremes so as to best harness their potential and enhances their capabilities to get more from these workers. SCHEME OF THE RESEARCH The research is virtually divided into two main parts. In the first part the importance of knowledge workers to the organization has been explained and in the second part some interventions have been given to the management as how to properly manage Knowledge workers in a proper manner so as to increase productivity. METHODOLOGY This study which is basically a library based research reviews the existing material regarding management of knowledge workers, as primary resource material. Sources of secondary data are the following: Journals Digital Library Research Papers Internet sites Books IMPORTANCE OF KNOWLEDGE WORKERS Change is constant and inevitable. Organizations have to adopt and adapt to the changes in the external environment. Without these twin strategies organization will soon become outdated and unable to compete in the market. Learning through incorporating changes gives them the necessary edge over their competitors. Knowledge workers are actually those workers in an organization who are sensitive to change. They constantly respond to the changes by gathering information and then arranging their work accordingly. With the accelerated pace of change in the environment, we should not hesitate in accepting the reality that all knowledge workers have significant place in the organization. The importance of their role to any organization that wants to survive in this dynamic era cannot be underestimated. “The human sensors that are interacting continuously on the front lines with the external environment have a rich understanding of the complexity of the phenomena and the changes that are occurring therein. Such sensors can help the organization synchronize its programmed routines ('best practices', etc.) with the external reality of the business environment.”
118

Business Review – Volume 3 Number 1 January – June 2008
Knowledge workers are indispensable for the organizations. They like to have complete autonomy in the work they perform. Because of the nature of their work it is very difficult to monitor and evaluate such workers. Too much stringency can be destructive to their creativeness and can have adverse affect on their performance. On the other hand too much leniency means giving them an absolutely freehand. Managers are faced with the dilemma of how to strike a balance between the two extremes. Proper management can best harness their potential and can further enhance their capabilities and get the most from these workers. “Given the human aspect of knowledge management, the dynamic and potential tension between individual and organizational learning is an important consideration. What ideally is required is an approach that links the individual and the organization with learning process, systems and technology which will benefit both in a reciprocal partnership” The nature of work has changed dramatically over the last one hundred years and especially over the last thirty, which has caused many time management practices that worked well for previous generations to become obsolete. In the beginning of this century most the work in organizations was done by traditional workers. They had to repeat the same work over and over again to keep the organizations running. Their work was confined to desk jobs done in the early part of the century Traditional type of management was suitable for these conventional workers management. The management was well aware of how to work from such employees and how to manage them. Knowledge work presents different get management challenges than other types of work because the nature of the work itself is different. Knowledge workers make up a significant portion of the workforce in advanced economies. “Fast forward a hundred years and it is clear that our lives have changed. For many the nature of work itself has changed. We are now in the age of what is commonly called knowledge work.” “Experts estimate that the number of knowledge workers surpassed the number of manual workers in the 1950’s and now represent well over two thirds of the work force” “To make knowledge-work productive will be the great management task of this century, just as to make manual work productive was the great management task of the last century”. “Their expertise determines the success of countless organizations around the world, but still we have limited insight on the management of such workers.”
119

Business Review – Volume 3 Number 1 January – June 2008
WHY SHOULD THE MANAGEMENT WORRY ABOUT THEM? “Knowledge workers could perform much better if we only knew how to manage them, says Thomas Davenport. His suggestion: Don't treat them the all same, and measure them tactfully.” Knowledge workers have an aversion to taking orders from anyone. They don't like to be told what to do. They enjoy more autonomy than other workers. They possess skills which other workers do not have; therefore they are hard to be replaced. Much of their work is invisible as it is of cognitive nature. It is hard to measure because it goes on inside their heads or outside the office. “They're knowledge workers, and they are performing well below their potential because companies still don't know how to manage them, says Thomas Davenport, professor of information technology and management at Babson College, in Wellesley, Mass., and director of research for Babson's executive education program. “Knowledge workers are going to be the primary force determining which economies are successful and which aren't," he says. "They are the key source of growth in most organizations. New products and services, new approaches to marketing, new business models—all these come from knowledge workers. So if you want your economy to grow, your knowledge workers had better be doing a good job.” Yet after studying more than 100 companies and 600 individual knowledge workers, Davenport has come to the conclusion that the old dictum of hiring smart people and leaving them alone isn't the best way to get the most out of knowledge workers. As he writes in his latest book, "Thinking for a Living: How to Get Better Performance and Results from Knowledge Workers" (Harvard Business School Press, July 2005), although Knowledge workers "can't be managed in the traditional sense of the word, you can intervene, but you can't do it in a heavy-handed, hierarchical way.” Studies prove that knowledge workers make up 25-50% of the workforces of advanced economies. Their expertise and experience fuels the success of countless organizations around the world-and their value is reflected in their compensation. But how much do managers really "know" about the knowledge workers whether they are performing up to the mark and whether or not they have exhausted their potential? Often a company's knowledge workers are dispersed across the organization, and increasingly across the globe. They are extremely mobile, their work is inherently emergent and unstructured, and much of what they do is invisible. After all, how can
120

Business Review – Volume 3 Number 1 January – June 2008
you tell whether your employees are working when their job is to think? How can you judge their performance when you rarely see them in person? Peter Drucker has argued often that improving knowledge worker productivity is the most important task of the century. Yet we have few measures or management interventions to make such improvement possible. Most organizations simply hire smart people, and leave them alone. We all know the importance of knowledge worker and learning organization but the importance of their role has created a new dimension in management of such knowledge workers. Although we can not cent percent identify the pattern which should be followed by knowledge workers, without a system, the generation of ideas and application can be lost for ever. The following interventions can act as tools for proper management of knowledge workers and for enhancing their performance.
1. Job Design (team work) 2. Increased Authority or Autonomy at Work Place 3. Loyalty Towards the Organization. 4. Training & Development 5. Motivation (competitive compensation/ reward packages and other
incentives) 6. Communication Channels 7. Monitoring and Evaluation 8. Work Life Balance
1. Job design (team work)
To design the job of knowledge workers is not an easy task for the management. Jobs are designed for pre determined pattern of work but in the case of knowledge workers they lack any such predetermined pattern of activities. Their activities and roles are like chameleon. They have to mould their roles with the requisite of the task at a given point of time. The management has to come up with a technique to design their jobs without any pre set activities. “Knowledge workers are also expected to work on multiple projects simultaneously. It is not uncommon to have several pending large projects with overlapping timelines and an assortment of smaller tasks that all need to get done. It is just not practical to assume that you can simply pick one thing, work exclusively on it until completed, and then move on to the next thing. This is especially true for managers that need to supervise the work of their staff while still getting their own work done.”
121

Business Review – Volume 3 Number 1 January – June 2008
Part of the challenge is that knowledge work can vary a great deal from one moment to the next. Some tasks like making a call or writing an email can be relatively simple and completed quickly. Other tasks like writing a proposal, preparing a client presentation, writing a software module, or doing research can be large and complex multi-step projects that require days or even weeks to complete. Even the same task of writing an email can vary from very small and simple to large and complex depending on the issues involved and the intended audience. The challenge is to keep the large projects moving along while at the same time dealing effectively with all the small stuff that regularly shows up. Having to deal simultaneously with big projects and small tasks is a new challenge for knowledge workers. “Best practice calls for emphasis on relationships, collaboration, and professionalism, and for de- emphasis of formal performance measures. “ The cost structure that drives physical work toward linear, sequential work processes is not inherent in knowledge work. "Retooling" in intellectual domains is often (although not always) much less costly than it is in physical work, and there are fewer "scrap costs." Knowledge work is therefore less constrained than traditional physical work by the need to get it right the first time and can instead be more interactive and more oriented toward exploring, experiencing, trying, and trying again. In knowledge work, rapid experimentation can substitute for detailed planning. Successful knowledge work processes often iterate frequently (e.g., daily). They are characterized by alternating periods of unstructured work by individuals and small groups and structured "pulling in the reins" by managers to integrate work. Such processes often look messy, even when healthy and productive. Team size needs to be controlled, because the complexity of the "reining in" process can become overwhelming if there are too many people involved. When the process is working well, each iteration introduces new ideas into work processes. “One of the problems is we treat all knowledge workers alike. Obviously it's more convenient and efficient to impose the same solution on everybody. Certainly in IT, broadly speaking, we try to. It's troublesome if everyone wants different software and computing environments, so we create common environments. But people work in different ways.
122

Business Review – Volume 3 Number 1 January – June 2008
And politically, we don't want to admit that some knowledge workers are better than others, and that some might deserve different office environments and technologies. We don't mind treating the C-suite differently—why not our most productive knowledge workers? These are the people determining the future of your company. “Designing these knowledge environments for knowledge workers is expensive and hard to do. But if we're serious about making knowledge workers more productive, we're going to have to focus on particular jobs and sometimes even particular individuals. ” For knowledge workers jobs must be designed that reflect more of behavioral element rather then organizational element. Behavioral elements also known as the “core job dimensions” which brings in efficiency in a persons job as opposed to organizational element which aims at efficiency in a job. Their jobs should be based on the core job dimensions i.e., skill variety, autonomy, task identity, task significance and feedback. Jobs should have more of these elements and less of organizational elements in order to make the work of knowledge workers more interesting. “The design of a job reflects organizational, environmental, and behavioral demands placed on it. Job design takes these elements into consideration and tries to create jobs that are more productive and satisfying. Organizational elements of job design are concerned with efficiency.—job designers draw heavily on behavioral research to provide a work environment that helps satisfy individuals.” A number of core job dimensions can be used to characterize any job(1) Skill variety, (2) task identity,(3) task significance,(4) autonomy, and (5) feedback. “---these dimensions affect the degree to which employees find their work meaningful, feel responsibility for the outcomes of their job, and understand the result of their work activities.” 2. INCREASED AUTONOMY AND AUTHORITY Another challenge in the management of knowledge workers is that due to a non existent job description such as the work itself may not always be well defined they have freedom of how to do their work. Knowledge workers have autonomy and discretion over how to perform work tasks; they are frequently given a desired outcome or result and asked to decide for themselves how to make it happen. Autonomy is important to maintain creativity in their work but total autonomy means total freedom. No one in the organization understands their work so no one has the authority to question them regarding their job.
123

Business Review – Volume 3 Number 1 January – June 2008
Part of the job is to figure out what work needs to be done and how to go about doing it. Because of this, there is often no clear-cut way to declare when something is really done. When is the task of writing a marketing report or doing research for a project completed? How good, polished, or thorough does it need to be before it can be considered ‘done’? The real answer is that it depends on many factors: who is going to read it, why it’s being prepared, how it is going to be used, etc. It takes judgment and experience to determine when you’ve reached the point of diminishing returns where additional work will not add enough value to justify the added cost and effort. Of course, such creativity and inquiry-driven learning may be difficult to achieve within traditional command-and-control paradigm. As mentioned earlier, use of the information and control systems and compliance with pre-defined goals, objectives and best practices may not necessarily achieve organizational competence. Knowledge workers have a lot of power, and they don't want things to be imposed on them. They don't like to be told what to do. This power of knowledge makes it difficult to bring knowledge workers under the control of management. They may put up with it for a while, but eventually they'll look for a job that gives them the autonomy they think they deserve. Besides, managers can't easily enforce an order when work takes place in people's heads. You have to make it easy for knowledge workers to do what you want them to do. Given the need for autonomy in learning and decision making, such knowledge workers would also need to be comfortable with self-control and self-learning. In other words, they would need to act in an intrapreneurial mode that involves a higher degree of responsibility and authority as well as capability and intelligence for handling both.” 3. LOYALTY TOWARDS THE ORGANIZATION Another area for management consideration in managing knowledge workers is how to earn their loyalty for the origination. Loyalty translates itself into commitment at work. Commitment is the key to success. The best way to gain their loyalties is to have full trust in these workers which will in turn boost their morale and result in better performance. “You have to make sure that your workers are indeed committed to their work before relying on that commitment in collaboration.”
124

Business Review – Volume 3 Number 1 January – June 2008
“Good research managers understand this implicitly: that relationships based on professionalism and mutual respect work far better than scales of accountability and incentive schemes in most knowledge-work settings.” 4. MOTIVATION Motivation and commitment goes hand in hand. If Knowledge workers are motivated only then they can give their best shot. In order to motivate knowledge workers they have to be given challenging tasks. They should be involved in the development of mission statement so that they feel a part of the organization. “What motivates workers – especially knowledge workers – is what motivates volunteers. Volunteers, we know, have to get more satisfaction from their work than paid employees precisely because they do not get a pay check. They need, above all, challenge. They need to know the organization's mission and to believe in it. They need continuous training. They need to see results. Implicit in this is that employees have to be managed as associates, partners – and not in name only. The definition of a partnership is that all partners are equal.” 5. EXTENSIVE TRAINING AND DEVELOPMENT "The productivity of the knowledge worker is still abysmally low. It has probably not improved in the past 100 or even 200 years – for the simple reason that nobody has worked at improving the productivity. All our work on productivity has been on the productivity of the manual worker…The way one maximizes their performance is by capitalizing on their strengths and their knowledge rather than trying to force them into molds." “-- a good learning program for knowledge workers would combine classroom learning and learning at their workstations.” What most organizations do is hire smart people and leave them alone. A lot of effort goes into recruiting knowledge workers and assessing how capable they might be before they are being hired. But once they're hired they are left alone and nothing is done in objective terms to improve their performance. Even if they are performing satisfactorily there is still room for more. Process improvement has mostly been for other workers: transactional workers, manufacturing workers, and people in call centers. All the serious approaches to improving work have largely escaped knowledge work. “We let knowledge workers get away with saying there's no process to their work, that every day is different. We don't measure much of anything about knowledge work.”
125

Business Review – Volume 3 Number 1 January – June 2008
People improve processes all the time; they just haven't done it with knowledge-work processes as much. It's an extrapolation of the same logic in other work, that processes can be improved. It is absolutely wrong to say that nothing can be done in case of improvement of process of knowledge workers “Here is one number that indicates performance and productivity can be improved: IDC found that 1,000 knowledge workers can lose as much as $6 million a year just searching for nonexistent data, or repeating work that has already been done. Is it possible every knowledge worker is working to his or her potential? It's possible, but unlikely. We can get a lot better at improving their performance.” Huge amount of money and time is spent on bringing in new technology to their company. Most organizations have no training or education on how to use these tools effectively in their work. For example the institute in which I am currently employed has a digital library, which is store house of information and knowledge. But unfortunately, except for a few employees, hardly anyone has the know how to get to this information and utilize it to their benefit or the benefit of the Institute. There are several cases else where. “Even when people are trained on knowledge-oriented applications, such as Excel, PowerPoint, CAD or CRM, the training focuses on how the software package works, not on how it fits into the context of the job. The vast majority of organizations that implemented CRM didn't really help their salespeople figure out how to use the system effectively to help them sell better. It's one of the reasons CRM has had the problems it has had. People were not comfortable using it with the customer around. And there weren't any good examples of how salespeople did their work, so a lot of CRM systems were not effective at all.” 6. MONITORING AND EVALUATION Monitoring and evaluation is the biggest challenge for the management in case of knowledge workers. Basically these workers do not like to be constantly monitored by their supervisors during their work or at their work place. Similarly the work of knowledge workers is of novel and creative nature for which there are no set standards. Due to lack of benchmarks their performance cannot be measured through ordinary monitoring and evaluation machinery. Their work is highly cognitive that requires special system in order to prove whether they are positively contributing something to the organization or not. Their work is result oriented not process oriented. “The difficulties in observing knowledge work are more profound. Not only can't a supervisor observe effort directly in knowledge work, sometimes the supervisor can't understand what the worker is doing and may not be qualified to judge results.
126

Business Review – Volume 3 Number 1 January – June 2008
“Because knowledge work occurs in intellectual domains, it is also more difficult to see causality and to attribute results to particular worker actions. Results measures often don't faithfully capture the results you really care about.” The productivity of knowledge work, in contrast, often has to do with how effort is allocated across multiple dimensions. By definition, knowledge work is more about how smart you work and less about how hard you work. Incentive schemes intended to extract more effort from knowledge workers often distort their effort allocations, forcing them to apply effort in the wrong places.” "The vice president of marketing may have come up the sales route and know a great deal about selling. But he knows little about market research, pricing, packaging, service, sales forecasting. The marketing vice president therefore cannot possibly tell the experts in the marketing department what they should be doing. In that sense, they are associates, not subordinates. The same is true for the hospital administrator or the hospital's medical director with respect to the trained knowledge workers in the clinical laboratory or in physical therapy.” 7. COMMUNICATION CHANNELS Knowledge work also requires more collaboration and communication with coworkers. The complexity and knowledge required to complete their tasks often makes it impossible for any one person to know or be able to accomplish everything single handedly that needs collaboration of teamwork. While this collaboration is absolutely essential, it can also cause problems of its own if not managed properly since productive knowledge workers require large amounts of uninterrupted time to think and get into flow. “---measuring performance is always difficult, and in knowledge work it is especially difficult. If you have no real chance of observing, understanding, or attributing the results of employee work, you become much more dependent on employees' willingness to openly communicate the meaning of their work. Fortunately, knowledge workers often have a commitment to the work itself that makes them inclined toward information sharing.” Knowledge sharing is crucial because it helps organizations promote best practices and reduce redundant learning efforts or 'reinventing the wheel' (Hansen, 2002; McDermott and O'Dell, 2001). In knowledge-intensive industries, firms cannot compete if their employees guard their insights as personal secrets (Teece, 1998). To succeed in a knowledge economy, organizations need to develop systematic processes to create and leverage
127

Business Review – Volume 3 Number 1 January – June 2008
knowledge. However, the failure of firms in their effort to promote knowledge sharing has been documented in many cases because employees are reluctant to share their knowledge with others even when knowledge sharing is actively promoted (e.g., Davenport, De Long, and Beers, 1998). A number of reasons have been given for these failures, such as the influence of organizational culture (Davenport, De Long, and Beers, 1998) or personal concerns of power and self-interest (Jarvenpaa and Staples, 2001). However, these arguments have not been empirically verified, and a coherent account of the factors hindering knowledge sharing is still lacking. In this age, virtually all types of work have some aspects of knowledge work in one form or another. Even work that previously may have discouraged autonomy, discretion, and creative thinking is becoming more knowledge oriented as companies realize that they need help from all their employees if they want to remain competitive. “Knowledge-intensive firms need to share knowledge held by employees if they are to gain the most from their intellectual capital and compete effectively in the marketplace.” 8. WORK LIFE BALANCE The separation between personal and work life is getting more and more blurred, the two have mingled to the extent that it is difficult if not impossible to draw a line. The idea that you can compartmentalize your time into work and personal life just isn’t practical anymore. The job of knowledge workers is such that they have to be very active and work for long hours. Work pressure has disturbed their work life balance. Knowledge workers have to pay a heavy price by sacrificing their personal and family time in line of their duty. Their job is of demanding nature – demanding more and more time for accomplishing their tasks. In this era of competition no body want to be second to best. For best there is a price to pay. That price is paid by these knowledge workers. “Many of today dynamic organizations appear to be at the forefront of the trend towards workaholic cultures. Theses organizations are increasingly expecting people to work from 60 to 70 hours a week.” “People are increasingly finding that work is squeezing out personal lives, and many are questioning this lifestyle. Balancing work life and personal life is likely to become one of the most important upcoming issues for HRM”. “Each affects and influences the other, which is why more and more people are realizing that managing their work and personal life as a whole not only makes
128

Business Review – Volume 3 Number 1 January – June 2008
sense, but is a better way to manage their time and increase their overall productivity. One of the reasons why managing time at the tactical level has become more difficult in the last one hundred years is that the number of ways you can spend your time has increased dramatically, while the number of hours in a day remains the same. “Another aspect of knowledge work that traditional time management practices have not dealt with effectively is the rapid inflow of new work, ideas, and information that knowledge workers have to deal with. There are a number of ways that others can communicate with you: email, telephone, fax, drop in visitors, meetings, memos, and regular mail. Each represents an opportunity for additional work to get added to your plate. A question from a co-worker, an email from your boss, an action item from a meeting, a memo from marketing, not to mention your own ideas and insights that come up while doing your work. All these different sources of input can easily overwhelm you if they are not managed properly. Since none of these communications carry an explicit ‘there is some work in here for you’ label, each has to be filtered and reviewed to determine if there is work involved and what that work actually is. For many people, the image of drowning in a sea of information, emails and paperwork is not too far from reality.’’ CONCLUSION After thorough analysis of the definition of knowledge workers, their role in the organizations, and issues in their management we can now conclude that no matter what the nature of their job is and what level of autonomy and authority they hold it is utmost essential that the management should find ways and means how to get the maximum out of them. Their management is not all that simple like routine workers of the organization. They have to be treated more tactfully and in a way which is slightly different form the traditional orthodox management. They should be considered as partners or supplement to the management and not as subordinates. Knowledge workers could perform much better if we only knew how to manage them, says Thomas Davenport. His suggestion: Don't treat them all same the and measure them tactfully. It is the job of HRM to understand their needs and then act accordingly. A slight mistake in handling them could be very costly to the organization. Knowledge
129

Business Review – Volume 3 Number 1 January – June 2008
workers no doubt are an asset to any organization but this asset can further be enhanced through proper management. Knowledge workers can bring a positive change to the assets of the organization. All they need is proper handling. “HRM and HRD professionals therefore need to take account of the dynamics of the employment relationship or psychological contract in considering enabling intervention and strategy to ensure knowledge creation, transfer and retention.” “We have a choice here. We can get more productive with our knowledge work or we can lose our jobs. There are other parts of the world where people are very serious about being more productive, and are doing it for a lot less money than we charge. People should realize that unless they do knowledge work better, they're not going to be doing it at all.” HRD can properly train these workers. Knowledge workers possess knowledge but this knowledge has to transfer within the organization at three different levels, as mentioned above. Training knowledge workers on how to utilize knowledge to get optimal results and then transferring knowledge through training and guidance from these who are knowledgeable in the brains of those who don’t can be best achieved through HRM and HRD interventions. The knowledge workers should have an understanding of the overall business of their organization and how their work contexts fit within it. Such understanding is necessary for their active involvement in the organizational unlearning and relearning processes. They must be aware of what sort of change will affect their organization and how they will bring about that change .Only if they understand the implications of changes in their work contexts for the business enterprise, they can be influential in harmonizing the organizational 'best practices' with the external reality of the business environment. The main objective is to achieve synergy of the data and information that has been gathered and of the creativity of these knowledge workers. Therefore knowledge workers should apply their knowledge to the organization processes in such a way so as to add overall value to the process and technologies of the organization that will facilitate the organization achieve its overall objective. More importantly, they should have the capability of judging if the organization's 'best practices' are aligned with the dynamics of the business environment. Such knowledge workers are the significant elements of the double loop learning and unlearning cycle that should be designed within the organizational business processes. Thus the interventions given in the paper will help managers better manage their knowledge workers and enhance their productivity but it is also the duty of the knowledge workers to manage their work properly.
130

Business Review – Volume 3 Number 1 January – June 2008
REFERENCES Knowledge Management, Knowledge Organizations & Knowledge Workers: A View from the Front Lines (Published in Maeil Business Newspaper of February 19, 1998) John P. Wilson and Alan Cattel, Knowledge Management, page 115 Time Management for Knowledge Workers: Tactical Time Management Peter Drucker, 1969, p.290) Management of Knowledge Workers�Hans K. Hvide and Eirik G. Kristiansen†June 13, 2006 Roberts (2004), or Need (1999) for evidence on the importance of knowledge workers, January 2006 survey of the Economist. Allan E. Alter August 5, 2005 Knowledge Workers Need Better Management Knowledge Workers Need Better Management by Allan E. Alter, 2005 TOM DAVENPORT on Maximizing Knowledge Worker Productivity; the Next Generation of Management November 8, 2006 Linkage, Inc_ - Distance Learning - Tony Schwartz.htm LPCUBE Aware - Personal Knowledge Management (PKM).htm KW\What is a knowledge worker - Knowledge Management - NeLH Specialist Library.htm Interview of Dr. Yogesh Malhotra, Founding Chairman and CKO of BRINT Institute, by the Knowledge Management editor of the largest Korean business newspaper Maeil Business Newspaper Knowledge Workers Need Better Management.htm William B. Werther, JR. Keith Davis, Human Resource and Personnel Management, 5th Edition, page 140-41. Pamela S. Lewis, Stephen H. Goodman, Patricia M. Fandt, 4th Edition, page 248, Management Challenges for Tomorrow’s Leaders, Knowledge Management, Knowledge Organizations & Knowledge Workers: A View from the Front Lines (Published in Maeil Business Newspaper of February 19, 1998) Knowledge Knowledge Workers Need Better Management.htm Interview of Dr. Yogesh Malhotra, Founding Chairman and CKO of BRINT Institute, by the Knowledge Management editor of the largest Korean business newspaper Maeil Business Newspaper
131

Business Review – Volume 3 Number 1 January – June 2008
ibid. KW\What is a knowledge worker - Knowledge Management - NeLH Specialist Library.htm Drucker, Peter. Management’s new paradigms, Forbes, 1998, 5 October Interview of Dr. Yogesh Malhotra, Founding Chairman and CKO of BRINT Institute, by the Knowledge Management editor of the largest Korean business Knowledge Workers Need Better Management.htm Interview of Dr. Yogesh Malhotra, Founding Chairman and CKO of BRINT Institute, by the Knowledge Management editor of the largest Korean business newspaper Maeil Business Newspaper Knowledge Workers Need Better Management.htm ibid. ibid. Knowledge Management, John P. Wilson and Alan Cattel, page 115 Science Careers_org Managing Knowledge Workers Austin 21 July 2006.htm Interview of Dr. Yogesh Malhotra, Founding Chairman and CKO of BRINT Institute, by the Knowledge Management editor of the largest Korean business newspaper Maeil Business Newspaper Knowledge Workers Need Better Management.htm MKW\from blackwell.htm Management and Organizational Review Juani Swart and Nicholas Kinnie, University of Bath ,Sharing knowledge in knowledge-intensive firms Human Resource Management Journal, Vol 13 No 2, 2003, pages 60-75 David A. DeCenzo, Stephen P. Robins, Human Resource Management, 7th Edition, page 12 mgt of knowledge worker\management of knowledge worker 3.htm,Time Management for Knowledge Workers: Tactical Time Management Knowledge Management, John P Wilson and Allan Cattel, page 127 Interview of Dr.Yogesh Malhotra, Founding Chairman and CKO of BRINT Institute, by the Knowledge Management editor of the largest Korean business newspaper Maeil Business Newspaper Knowledge Workers Need Better Management.htm
132

Business Review – Volume 3 Number 1 January – June 2008
DISCUSSION
Gradient-Based Edge Detection on a Hexagonal Structure
Xiangjian He
University of Technology, Sydney, Australia
Qiang Wu University of Technology, Sydney, Australia
Tom Hintz
University of Technology, Sydney, Australia
Wenjing Jia University of Technology, Sydney, Australia
ABSTRACT Gradient-based edge detection is a straightforward method to identify the edge points in the original grey-level image. It is intuitive that in the human vision system the edge points always appear where the grey-level value is greatly changed. Spiral Architecture is a relatively new image data structure that is inspired from anatomical considerations of the primate’s vision. In Spiral Architecture, each image is represented as a collection of hexagonal pixels. Edge detection on Spiral Architecture has features of fast computation and accurate localization. In this paper, we review the gradient-based edge detection algorithms on Spiral Architecture. An edge point is defined as a hexagonal pixel at which the magnitude of the gradient of brightness function assumes a local maximum. Keywords: Spiral Architecture, Edge Detection, Triple-Diagonal-Gradient, Bilateral Filter, Prewitt Masks, Sobel Operators, Hexagonal Image Structure 1. Introduction
C
omputer vision involves compositions of picture elements (pixels) into edges, edges into object contours and object contours into scenes. The determination of
edges depends on detection of edge points (pixels) of a 3-D physical object in a 2-D image. This first step in the process is critical to the functioning of machine vision. As the success of subsequent steps are sensitive to the quality of results at this step, the performance of higher level processes such as extraction of object contours and object recognition relies heavily on the complete and correct determination of edges [1]. Edges contain major image information and need only a small amount of memory storage space compared to the original image. Hence, edge detection simplifies images and thus facilitates image analysis and interpretation [2].
133

Business Review – Volume 3 Number 1 January – June 2008
Edge detection is based on the relationship a pixel has with its neighbours. It extracts and localizes points (pixels) around which a large change in image brightness has occurred. A pixel is unsuitable to be recorded as an edge if the brightness around a pixel is similar (or close). Otherwise, the pixel may represent an edge. During the last three decades, many algorithms have been developed for edge detection, among which the most important ones are the Marr-Hildreth method [3] based on detecting zero crossings at the output of Laplacian-Gaussian operators of different widths, Haralick's facet model [4] based method that uses the zero crossings of a second directional derivative of Gaussian edge operator, and computational approach [5] to edge detection by formulating the task as a numerical optimization problem. Since 1996, there have been many papers on edge detection based on Spiral Architecture. Spiral Architecture described by Sheridan [6] is a new data structure for computer vision. The image is represented by a collection of hexagons of the same size (in contrast with the traditional rectangular representation). The importance of the hexagonal representation is that it possesses special computational features that are pertinent to the vision process. In [7], edge detection using edge focusing technique was proposed. This method starts from the edge detection of a blurred image with a large scale of Gaussian filter. The scale is gradually decreased for finer images. The final edge map is recorded when it will no longer change the edge map with any smaller scale. The second edge detection method proposed [8] and [9] applied a bilateral filter rather than a Gaussian filter to remove image noise. The bilateral filter combines a domain filter like Gaussian filter with a range filter. A range filter gives more weights to those neighbouring pixels with light intensity that is more similar to the reference pixel value. This method has been proved being more efficient for suppressing image noise for edge detection. Another method for edge detection on Spiral Architecture, as shown in [10] and [11], was based on triple-diagonal gradient. The gradient of grey-level function was defined as a combination of three vectors in three diagonal directions of hexagonal image structure. Note that an edge point is a pixel at which the gradient magnitude assumes a local maximum. Hence, this method is a more accurate detection mechanism where the gradient is implemented in a more accurate way in the discrete image space. In this paper, we will review the above-mentioned edge detection methods on Spiral Architecture. We will also list the problems for future research work. 2. Spiral Architecture In Spiral Architecture, an image is represented as a collection of hexagonal pixels. Each pixel has only six neighbouring pixels with the same distance to it. Each pixel is identified by a number of base 7 called a spiral address. The numbered (or addressed) hexagons form the cluster of size 7n, where n is a positive integer. These
134

Business Review – Volume 3 Number 1 January – June 2008
hexagons starting from address 0 towards address 7n tile the plane in a recursive modular manner along a spiral-like curve. As an example, a cluster with size of 72 and the corresponding spiral addresses are shown in Figure 1.
Figure 1. A collection of 49 hexagonal pixels.
The distribution of cones on the retina (see Figure 2) provides the basis of the Spiral Architecture. In the case of the human eye, these elements would represent the relative positions of the rods and cones on the retina.
Figure 2. Distribution of cones on the retina.
135

Business Review – Volume 3 Number 1 January – June 2008
Spiral Architecture possesses some geometric and algebraic properties, which are very useful and can be interpreted in terms of a mathematical object, Euclidean ring (Refer to [6] for details). Two algebraic operations have been defined on Spiral Architecture based on spiral addresses. They are Spiral Addition and Spiral Multiplication. These two operations correspond to two transformations on Spiral Architecture, which are translation and rotation with a scaling.
3. Edge Focusing Edge Detection Gaussian Multi-scale Theory is one of the best understood multi-resolution techniques available to the computer vision community [12]. Edge detection using Gaussian Multi-scale Theory ensures not only good performance of detection but also accurate localization of edge points. Let be a brightness function of an image which maps the coordinates of a pixel, (x,y) to a value in light intensities. Let be the Gaussian kernel
ℜ→ℜ2:fℜ→+∞×ℜ ),0(: 2g
tyx
et
tyxg 2)( 22
21);,(
+−
=π
.
(1) Then the Gaussian scale-representation of the original image at scale t is
∫∫−+−
−=
∗=
σ πdudve
tvuf
yxftyxgtyxL
tvyux
2)()( 22
21),(
),();,();,(
(2)
when t∈(0, ∞), and ),()0;,( yxfyxL = . Scale-space representation is used to suppress and remove unnecessary and disturbing details so that later stage processing tasks can be simplified. Edge point from a continuous grey-level image represented as L(x, y; t) for given t is defined as a pixel at which the gradient magnitude of L(x, y; t) assumes a local maximum in the gradient direction. The edge focusing technique starts with a blurred image with a large Gaussian scale (or coarse resolution). An edge map consisting edge points is obtained through this strong blurring. The next step is to gradually focus these edge points by continuously decreasing the scale (or resolution). This method compares the edge maps at different levels of resolution (or with different scales) to decide whether to repeat the detection process with a smaller scale or terminate the process.
136

Business Review – Volume 3 Number 1 January – June 2008
4. Edge Detection Using Bilateral Filter Recall that a bilateral filter is defined by the combination of a domain filter and a range filter. Let be a reference pixel and be the six
neighbouring pixels of . Then, the range filter is defined by 0a 654321 ,,,,, aaaaaa
0a[ ]
2
20
2)()(
)( r
i afaf
ear σ−
−
= , 6,..2,1,0=i
where rσ is the standard deviation of intensity value distribution. The domain filter defined by
2
20
2
)],([
)( d
i aad
eag σ−
= , 6,..2,1,0=i
where is the Euclidean distance between and , and),( 0aad i ia 0a dσ is the standard deviation in spatial distribution. Image noise is filtered through the convolution of the image brightness function with the domain and range filters. Through the domain filter, details can be gradually smoothed. Through the range filter, blurring effects across the edges can be reduced and edges can be preserved better than using domain filtering alone. Application of the new bilateral smoothing filter produces, for each pixel in the image, a weighted average such that each pixel contributes more significantly to the resulting grey value of the pixel than all its neighbouring pixels. Meanwhile, the pixels with more similar intensity values or closer to the reference pixel contribute more than those with more different values or further away. Smoothing using the bilateral filter clearly reduces the blurring effect introduced by smoothing to images than Gaussian domain smoothing alone. It implies that edge information would be better retained with less averaging across the kernel under bilateral smoothing. This can be seen in the experimental results shown in Section 6 below. After image noise is filtered, Sobel operator defined on SA as shown in Figure 3 is applied. Using the Sobel operator, the pixels’ gradient values are obtained. At the same time, the edge length and direction can are determined. Edge pixels on SA are fetched using the method similar to Canny edge detection method worked on the traditional square structure. Candidate edge points are located first using local non-minimal suppression [5, 9]. In order to recover missing weak edge points and eliminate false edge points, two edge strength thresholds are set to examine all the candidate edge points. Those candidate edge points whose grey
137

Business Review – Volume 3 Number 1 January – June 2008
levels are below the lower threshold are marked as non-edge points. For each candidate edge point whose grey levels is above the lower threshold, if it can be connected to a edge point whose edge strength is above the higher threshold through a chain of edge points, it is then marked as an edge point.
Figure 3. Sobel operators on hexagonal structure.
5. Using Triple-diagonal Gradient for Edge Detection In this method, three gradient components on three diagonal directions instead of one approximated gradient direction are computed at each pixel. Let vL be the gradient of the brightness function L at a given reference point and Gi
( { }1, 2,3i∈ ) be the three gradient components in the three diagonal directions respectively for a given reference point as shown in Figure 4. We call the three gradient components triple-diagonal gradient components. In the real Spiral Architecture, the distance between the reference point and any of its neighbouring point is same. Without loss of generality, we assume that the distance is 1. It is then easy to see that
),2/3,2/1()2/3,2/1()0,1( 321 −++= GGGLv where the three vectors corresponding to the three diagonal directions as shown in Figure 5.
Figure 4. Prewitt Masks in three diagonal directions on hexagonal structure.
138

Business Review – Volume 3 Number 1 January – June 2008
Figure 5. Three unit vectors in three diagonal directions.
The three gradient components are computed using the Prewitt Masks defined in Figure 4. The gradient magnitude at each hexagonal pixel can hence be computed using
. 6. Experimental results In this section, we show the experimental results using the three different edge detection methods described above. A toy duck and the Lena image represented on Spiral Architecture with 256 grey levels are used as the original image for edge detection. Figure 6 shows three images processed by different filtering operations on different image architecture. Figure 7 shows the edge maps obtained from the three filtered images accordingly. As can be seen in Figure 6, Gaussian operator works better on SA than square structure, and the bilateral operator shows a better filtering result than Gaussian filter. The bilateral filtering process enhances the major edge information and weakens other pixels. It is obvious that after Gaussian filtering edge map obtained on SA is clearer than the one obtained on square architecture. This is mainly due to the uniformly connected. Moreover, one more Sobel operator defined on SA than the two operators on square architecture improves the detection accuracy. The bilateral filtering further improves the edge map quality because it enhances major edge information while suppressing image noise and trivial edge pixels.
Figure6. Results of image filtering.
139

Business Review – Volume 3 Number 1 January – June 2008
Figure 7. Edge maps of the filtered images shown in Figure 6.
Figure 8 shows the gradient edge maps obtained on square structure and on Spiral Architecture using the Triple-Diagonal-Gradient approach. From the results, we can see that, if we focus on the edge map of the circular edges, we can find that a thinner edge map can be acquired on hexagonal-based processing. This is mainly due to the good performance of the triple-diagonal detectors on hexagonal images that are able to highlight the strongest response not only on horizontal and vertical directions, but also on the other two diagonal directions. In order to obtain the similar performance on square images, we need another two additional Prewitt masks in diagonal and inverse diagonal directions. In hexagonal images, we only need total three Prewitt masks.
Figure 8. Gradient-based edge maps of Lena image. (a) Original image, (b) the gradient edge map implemented on square architecture, and (c) gradient map implemented on SA
In order to compare among the edge focusing technique, the bilateral filtering method and the triple-diagonal-gradient approach, a toy duck as shown in Figure 9 is used.
140

Business Review – Volume 3 Number 1 January – June 2008
Figure 9. Image of a toy duck represented on SA.
The edge detection results are displayed in Figure 10.
Figure 10. (a) edge map using edge focusing technique, (b) edge map using bilateral filter, (c) edge map using triple-diagonal gradient Comparison between Figure 10(a) and Figure 10(b) clearly demonstrates better edge-preserving quality of the bilateral smoothing than Gaussian smoothing. Contour of the mouth is again more complete in the final edge map when bilateral smoothing was applied than it is in the edge map obtained after Gaussian smoothing only.
141
Business Review – Volume 3 Number 1 January – June 2008
Comparison between Figure 10(b) and Figure 10(c) shows that the edge noise has been better filtered out using bilateral smoothing than using triple-diagonal gradient. On the other hand, the use of triple-diagonal gradient gives us the sharpest and clearest edge map among the three methods. 9. Conclusions In this paper, we have reviewed the gradient-based edge detection methods on Spiral Architecture. The reviewed techniques include edge focusing, bilateral filter and triple-diagonal gradient. In order to improve the edge detection accuracy, an edge detection scheme combining the bilateral filter and triple-diagonal-gradient methods can be proposed. Bilateral filter can be used to better filter or suppress image noise while triple-diagonal-gradient can be applied for extraction of a clearer edge map. 10. Acknowledgement This work is partly supported by the Australian Research Council Discovery Grant (DP0451666). REFERENCES Nalini K. Ratha, Tolga Acar, Muhittin Gokmen and Anil K. Jain, A distributed edge detection and surface reconstruction algorithm, Proc. Computer Architectures for Machine Perception, Como, Italy, 1995, pp.149-154. G. Economou, S. Fotopoulos, and M. Vemis, A novel edge detector based on nonlinear local operations, Proc. IEEE International Symposium on Circuits and Systems, London, 1994, pp.293-296. D. Marr and E. Hidreth, Theory of edge detection, Proc. Royal Soc., 1980, pp.187-217. R. M. Haralick, Edge and region analysis for digital image data, Computer Vision Graphics and Image Processing, 1980, pp.60-73. J. F. Canny, A computational approach to edge detection, IEEE Transactions on Pattern Analysis and Machine Intelligence, Vol.8 1986, pp.679-698. Phil Sheridan, Sprial architecture for machine vision, Ph.D. thesis, University of Technology, Sydney, 1996.
142

Business Review – Volume 3 Number 1 January – June 2008
Xiangjian He and Tom Hintz, Refining Edge Detection within Spiral Architecture, in Australian Computer Science Communications, Vol. 22, No.1, 2000, J.Edwards (ed.) pp.113-119, IEEE Computer Society Press, Washington. Jun Zhou, Qimei Hu and Xiangjian He, Detection with Bilateral Filtering in Spiral Space, Proc. of The Second International Conference on Information Technology and Applications, Harbin, China, January, 2004, pp.222-225. Qiang Wu, Xiangjian He and Tom Hintz, Bi-lateral Filtering Based Edge Detection on Hexagonal Architecture, Proc. 2005 IEEE International Conference on Acoustics, Speech, and Signal Processing, Philadelphia, PA, USA, Volume II, 2005, pp.713-716. Qiang Wu, Xiangjian He and Tom Hintz, A Triple-Diagonal Gradient-Based Edge Detection, 6th IASTED International Conference on Computers, Graphics, and Imaging (CGIM’2003), Honolulu, USA, August 2003, pp.244-249. Wenjing Jia, Xiangjian He and Qiang Wu, Edge Analysis of Rectangular and Hexagonal Structures, Proc. International Conference of Information Communication Technology, Thailand, December 2004, pp.69-75. Jon Sporring, Mads Nielsen, Luck Florack, and Peter Johansen, Gaussian scale-space theory, Kluwer Academic Publishers, 1997.
What lies behind us and what lies before us are tiny matters compared to what lies within us.
OLIVER WENDELL HOLMES
143

Business Review – Volume 3 Number 1 January – June 2008
AT THE CENTER
“In order to write a personal mission statement, we must begin at the very center of our Circle of Influence, that center comprised of our most basic paradigms, the lens through which we see the world.
It is here that we deal with our vision and our values. It is here that we use our endowment of self-awareness to examine our maps and, if we value correct principles, to make certain that our maps accurately describe the territory, that our paradigms are based on principles and reality. It is here that we use our endowment of conscience as a compass to help us detect our own unique talents and areas of contribution. It is here that we use our endowment of imagination to mentally create the end we desire, giving direction and purpose to our beginnings and providing the substance of a written personal constitution.
It is also here that our focused efforts achieve the greatest results. As we work within the very center of our Circle of Influence, we expand it. This is highest leverage PC (production capability) work, significantly impacting the effectiveness of every aspect of our lives.
Whatever is at the center of our life will be the source of our security, guidance, wisdom, and power.
Security represents your sense of worth, your identity, your emotional anchorage, your self-esteem, your basic personal strength or lack of it.
Guidance means your source of direction in life. Encompassed by your map, your internal frame of reference that interprets for you what is happening out there, are standards or principles or implicit criteria that govern moment by moment decision-making and doing. Wisdom is your perspective on life, your sense of balance, your understanding of how the various parts and principles apply and relate to each other. It embraces judgment, discernment, comprehension. It is a gestalt or oneness, an integrated wholeness.
Power is the faculty or capacity to act, the strength and potency to accomplish something. It is the vital energy to make choices and decisions. It also includes the capacity to overcome deeply embedded habits and to cultivate higher, more effective ones.
These four factors – security, guidance, wisdom, and power – are interdependent. Security and clear guidance bring true wisdom, and wisdom becomes the spark or catalyst to release and direct power. When these four factors are present together, harmonized and enlivened by each other, they create the great force of a noble personality, a balanced character, a beautifully integrated individual.”
Stephen R. Covey
144

Business Review – Volume 3 Number 1 January – June 2008
DISCUSSION
The role of Governance and its influence on quality enhancing mechanism in Higher
Education
Syed Naeem Ahmed Institute of Education and Social Sciences
Hamdard University, Karachi, Pakistan INTRODUCTION:
niversities live in complex contexts, compete in many different marketplaces, and perform a bewildering array of highly sophisticated services for many
diverse constituencies. Although universities focus their efforts primarily on the key dimensions of teaching and research, they engage in a wide range of additional activities derived from the expertise and resources accumulated in support of teaching and research. With the expansion of the assessment of quality at higher education, budgetary allocation, and particularly private sector involvement at higher education for the last five years, institutions became much more complex and the role of Governance and its influence on quality enhancing mechanism became an evermore-popular topic. The purpose of this paper is to highlight different issues among university leaders, teaching community and research students on the role of governance and its influence on quality enhancing mechanism in higher education.
U
WHAT IS GOVERNANCE AND WHAT IS IT ALL ABOUT? Taylor (1996) defined governance as
“A collective effort, through smooth and suitable process, to take actions that advance a shared purpose consistent with the institution’s mission.”
Schuller (2003) defined university governance as
“A social process entailing responsibility for the effective and economical planning and regulation of the operation of the university. In the fulfillment of a given purpose or task, such responsibility may involve judgment and decision making in determining plans, using data to control performance and progress against plans; and guidance, integration, motivation and supervision of the personnel composing the university, carrying out its operation”
145

Business Review – Volume 3 Number 1 January – June 2008
WHAT IS QUALITY? Quality and related issues discussed at Ministerial Round Table on Quality Education, UNESCO, 2003 maintain: “The Quality has become a dynamic concept that has constantly to adapt to a world whose societies are undergoing profound social and economic transformation. Encouragement for future-oriented thinking and anticipation is gaining importance. Old notions of quality are no longer enough….despite the different contexts there are many common elements in the pursuit of a quality education, which should equip all people, women and men, to be fully participating members of their own communities and also citizens of the world”. As quality is a dynamic process and governance is very much involved in the process of institutional operation and management, this paper raises some issues related with the role of governance and quality linkages for Pakistani Universities. EFFECTIVENESS Is a democratic or participative approach more effective than the managerial style? Does decentralization and devolution of power to departments assist or hinder effective management? Do we need more training for leadership and for governance? . It is important to think seriously about management and governance questions because effective management and good governance assist academic performance and strengthen universities’ ability to withstand the vagaries of erratic funding policies and environmental turbulence. The board of governors and the general Faculties Council, at the level of institutional governance, rely on effective structures, powerful instruments and time-honored techniques to ensure that the University honors its mission, mandate, values and vision while complying with legislative requirements Perhaps, above all, the process gives universities confidence in facing the future. HEC (Higher Education Commission) medium term development framework 2005-10 clearly states that
‘Improvement in university governance and management is required to improve the quality of education and research’.
But, how? We have to be very clear in our strategy i.e. to bring change in the institutions. Change in governance structure; Change in planning system; Change in management style; Change in operation and implementation; and change in the evaluation system etc. Shamsh Kassim-Lakha (1998) quoted Tanner in an international seminar at Karachi, the basic statement to bring change:
146
Business Review – Volume 3 Number 1 January – June 2008
“A reasonable university adapts itself to the world around it. An unreasonable one expects the world to change according to its ideas. Therefore, all progress depends on the unreasonable university.”
Change does not mean to make brand new policy initiative or bold restructuring. Improving University effectiveness has more to do with examining each related activity on a holistic basis. Universities are interlocking organizations in which all the parts are interdependent. To improve university management, we need to train and educate a wider proportion of our staff in what the management issues are and how to approach them to bring the desired change? It is not necessary to delay this until they become deans or pro vice chancellors or until they have been consigned to a specialist administrative area for a number of years. If we are to take institutional management seriously, we must prepare a subset of the younger generation of academics and administrators so that when they reach senior positions they understand the issues and approach them professionally. Shamsh Kassim Lakha has also pointed out in his paper that quality of governance in public sector universities has suffered most due to the lack of political will; political appointments to governing bodies; induction of trustees and governors of inadequate quality; polarization of syndicates and senate; and appointment of university leadership solely at the discretion of the chancellor who most often is himself a political appointee or a political figure. Dr. Tariq Rehman rightly stated
“The highest rank in the military goes to military officers, the highest rank in the bureaucracy goes to bureaucrats, and the highest rank in the judiciary goes to a judge. However in university the higher rank may go to someone who started his career as a lieutenant or an assistant commissioner”.
Francis (1998) suggested that good universities make for good governance by screening the best for the top. But they do more too. A university that honestly pursues objective standards of admission, performance and accomplishment, without regard to a person’s affiliation or other qualities, is a school with a moral vision that is badly needed in societies whose governments are endemically corrupted by special loyalties to kin and kind. Regarding private universities it seems that their autonomy for governance, recruitment, enrollment and curriculum have an opportunity to address the change issues, which the public sector finds most troublesome because private universities are not constrained by lack of ability or undue influence.
147

Business Review – Volume 3 Number 1 January – June 2008
We therefore do not need new governance fads or tool kits but more investment in thinking about the effectiveness of university governance. SETTING OBJECTIVES: The second issue relates to the value of setting objectives. There seems to be general agreement that the preparation of institutional plans and missions statements, and university assists management and gives governing bodies a more strategic role. Governance may be treated as the force which lays down the object for which an organization and its management are to strive for and the broad policies under which they are to operate governance may also be treated as the force which leads and directs to the realization of desired goals and objectives. After a careful study of powers of the private and public universities it is found that the university acts are almost more or less same and in some cases (especially in the cases of public universities case), they are merely replicated. It is found that not a single article in universities’ act is related to the assurance of quality in universities. Even the model university act of Government of Pakistan (2002) has nothing to say directly about quality assurance and any kind of standardization. The draft rules and regulations used by public sector universities (which are supposed to be tried and tested) are not conversant with the issue of quality assurance, and the governance and quality linkages. It is therefore highly satisfying that the university act possess the objectives that will not only elevate the level of higher education but will also ensure the quality of higher education through the establishment of Quality Enhancement Cell (QEC) in all universities. Universities can function as quality engines for a nation. They accumulate resources of all kinds to support the highest possible levels of faculty and student quality. Faculty and students, pursuing their individual goals within the context of the university’s academic program and guilds, develop their skills and use them to create additional value either in the form of enhanced capabilities as graduates at all levels, or of contributions to new knowledge through research. In achieving these aims, the quality engine of the Pakistani Universities should operate multiple separate domains. One domain derives the teaching enterprise at the undergraduate level; another connects graduate and professional studies to the work of the faculty. A third sustains the research of the faculty and their much needed collaboration, while a fourth translates those research accomplishments into patents, licenses, and other assets of value to the nation and the world. The Revision of Charters and statutes to alter the composition of the governing bodies may therefore be envisioned as one of the priorities to ensure quality at higher levels of education.
148

Business Review – Volume 3 Number 1 January – June 2008
COMPETITIVENESS AND COLLABORATION A related major issue pertains to the balance between competitiveness and collaboration, both within and between the institutions. The competition and collaboration within an institute to ensure quality rests on two assumptions: First, students, teachers and administrators in the universities are, and should be, homogeneous communities and that they coalesce and should coalesce into a well-integrated university community; Too often academics and administrators in established disciplines pluck out of the already made managerial solutions from elsewhere they may have heard on discussed at a conference and present them as newly minted answers to their own problems. Secondly, universities seem to outside world to be overly democratic but are often extremely hierarchical, excluding the most knowledgeable people on particular management issues from participation in decision making on the issues in which they are the most expert. Universities are often deeply resistant to flat structures where communication lines are short and decisions can be taken quickly, preferring extended decision making structures where process trumps over timeliness. Too often relation between academic and professional managers are confused by considerations of status when it is abundantly clear that partnership, collaboration, a sense of equality and open discussion encourages creative thinking and innovative ideas. Programme quality assurance rightly belongs to knowledgeable peers who are the best judges and most effective guardians of quality standards. This means inviting objective and respective colleagues to review and report to the governing board. Strength and weaknesses of the faculty and board must be identified through review committees. Trustees have then little difficulty convincing either themselves or the faculty of what needed to be done to redress the weaknesses. Many of the issues concerning the competitiveness and collaboration between the governance of different institutions revolve around the relationship between the Federal and provincial government, the national funding bodies and higher education institution. The implementation and safeguarding of the quality of the university’s educational programs should not rely solely on government and its agencies. Autonomy is a condition precedent if the universities are to discharge their duties and obligations effectively and efficiently as regards imparting and advancement of knowledge and also making their unique contribution to the life and development of the nation. Shamsh Kassam-Lakha has pointed out that a young university aiming to learn from an older, established institution and perhaps hoping in the process to gain ‘reflected
149

Business Review – Volume 3 Number 1 January – June 2008
glory’ and improving its image through such a linkage will be disappointed, unless it too can offer something in return to the mature university. This could be done by reimbursement of the cost of such linkages—the most common method; through collaborative working arrangements that envisage exchange of faculty, joint research project and exchange programs for students. Such linkages would require much nurturing and almost every linkage will require some financial support (but, the less money that changes hands, the better). However, the most successful linkages are the faculty members among various instiutions. CONCLUSION It is very important to ensure the role of governance of universities to be effective, so that the institutions control the selection of students, selection and retention of faculty and the curriculum that is offered and the awarding of degrees. What has been achieved so far with respect to quality and governance is only a beginning. We have to be optimistic enough to hope that this issue will be taken seriously to bring quality at higher education. . REFERENCES Coaldrak P. et.al (2003). Issues in Australian University Governance. Retrieved on 01 December, 2006. www.aph.gov.au/LIBRARY/Pubs/RP/1999-2000/2000rp02.htm Edward M. (2004). University Governance—A mapping and some issues. Retrieved on 29 November 2006. www.atem.org.au/pdf/Governance.pdf Higher Education Commission Pakistan, Medium term development Framework 2005-10, pp. 47-50 Kaul J.N. (1990). Governance of Universities—Autonomy of the Universities Community. New Delhi:Abhinav publication. Lakha S. (1998). Higher Education: A Pathway to Development. Karachi: Oxford University Press, . Lombardi J.V. et.al (2002). University Organization, Governance and competitiveness. Retrieved on 26 November 2006. www.thecenter.ufl.edu/UniversityOrganization.pdf Ordinance No. CXX of 2002—an ordinance to constitute and restructure Universities set up by the Federal Government, Pakistan.
150

Business Review – Volume 3 Number 1 January – June 2008
Renson S. et. al (1986). The Changing Government of Education. London: Allen and Unwin. Smith R.H.T. (2002). Higher Education at Cross Roads—Governance, Management and workplace relation. Retrieved on 30 November 2006. www.dest.gov.au/.../key_priorities/documents/HEd_Workplace_Productivity_Programme_DP0705_rtf.htm The Centre for Higher Education Transformation, Islamabad, Pakistan. State of Higher Education in Pakistan 2005: Quality. pp.46-49 Tom S. (1992). The future of Higher Education. USA: Open University Press.
Moral truth can be conceived in thought. One can have feelings about it. One can will to live it. But moral truth may have been penetrated and possessed in all these ways, and escape us still. Deeper even than consciousness there is our being itself – our very substance, our nature. Only those truths which have entered into this last region, which have become ourselves, become spontaneous and involuntary as well as voluntary, unconscious as well as conscious, are really our life – that is to say, something more than property. So long as we are able to distinguish any space whatever between Truth and us we remain outside it. The thought, the feeling, the desire or the consciousness of life may not be quite life. To become divine is then the aim of life. Then only can truth be said to be ours beyond the possibility of loss. It is no longer outside us, nor in a sense even in us, but we are it, and it is we.
AMIEL
151

Business Review – Volume 3 Number 1 January – June 2008
“Change – real change – comes from the inside out. It doesn’t come from hacking at the leaves of attitude and behavior with quick fix personality ethic techniques. It comes from striking at the root – the fabric of our thought, the fundamental, essential paradigms, which give definition to our character and create the lens through which we see the world. In the words of Amiel,
Moral truth can be conceived in thought. One can have feelings about it. One can will to live it. But moral truth may have been penetrated and possessed in all these ways, and escape us still. Deeper even than consciousness there is our being itself – our very substance, our nature. Only those truths which have entered into this last region, which have become ourselves, become spontaneous and involuntary as voluntary, unconscious as well as conscious, are really our life – that is to say, something more than property. So long as we are able to distinguish any space whatever between Truth and us we remain outside it. The thought, the feeling, the desire or the consciousness of life may not be quite life. To become divine is then the aim of life. Then only can truth be said to be ours beyond the possibility of loss. It is no longer outside us, nor in a sense even in us, but we are it, and it is we.”
Stephen R. Covey
152

Business Review – Volume 3 Number 1 January – June 2008
DISCUSSION
Spiritual Basis of Worldly Success
Dr. iur. Menno Adden Technische Universitöät Dortmund, Germany
POINT OF DEPARTURE
akistan is built not on a long national history, not on a common language or the like. The common bond of Pakistanis is the Islam. The whole country is soaked
with religion. For a Western visitor it is both impressing and intriguing to see as to what great extent everybody seems to keep the fasts and does his prayers. It is impressive as we in the West have almost lost this religious fervour. It makes me ask, where we Europeans are bound to go if we lose our Christian religion. On the other hand it is intriguing to see Muslim practising their religion as they do. Now in the holy month of Ramadan, overall speaking, people work less than they normally do, offices are closing by midday and tens of thousand small businessmen, restaurant owners and the like, are virtually laid off during the day and have to make good for their lost turnover in the hours after sun set. So this brings me to the topic of this lecture:
P
Is there a relationship between religion and economic success or failure? Pakistan has done very well in some aspects of economy, but fares behind international standards in other fields. The same is true in other Islamic countries. Dubai is a glittering example for economic success – and still we are let with some misgivings about how it has been done there. Economic progress has lately been made in Malaysia, but we see very little of it in e.g. Syria or Morocco. Is there a common trait in the development of Muslim countries? If so, does Islam as religion play a role in this? Are there any links at all between economic worldly success and religious beliefs? Max Weber (1864 – 1920) raised this question with respect to the conspicuous differences between the progressive protestant and the somehow backward catholic regions of the West. MW today he is mainly known for his treatise on exactly this question: Protestantische Ethik und der Geist des Kapitalismus – Ethics of Protestantism and the Spirit of Capitalism. The essence of this treatise can be put short:
• Protestants are economically more successful than Catholics and followers of other religions
• Worldly success may therefore be somehow connected with being a protestant.
153

Business Review – Volume 3 Number 1 January – June 2008
If we apply this theory to Islam we ask: Is worldly success or failure somehow related to being a Muslim? 1. PROTESTANTISM Protestant is the name for Christian groups and sects which split from the Roman Catholic Church as a consequence of Luther’s reformation 1517. The reformation is a religious and thereby also a cultural revolution. It was based on a complexity of causes:
• Political: The middle ages were over. The traditional concept of one Emperor holding the secular, and one Pope, wielding the spiritual power over all peoples of the world had outlived itself and was openly disproved, i.a. by the sheer existence of Islam and the Turkish empire.
• Technical: Gutenberg’s invention of printing, around 1450, put books in the hands of the hitherto completely unlearned.
• Cultural: The advancement of learning lead people to ask and answer their own questions and to seek answers not only with the priest, the bible and the church.
• Theological: Luther stood up against blatant misuse of the spiritual powers of the church and thereby sparked off the reformation. Gutenberg’s new technique helped to quickly spread this insurrection to all parts of Germany, France, England and elsewhere.
2. PROTESTANT ETHICS UNEARNABLE GRACE Max Weber says: Protestant are for religious reasons constantly busy and thereby produce capital Max Weber`s line of argument can be summed up as follows: Christian teaching is that original sin makes man spiritually unfit for the Kingdom of Heaven. Unless saved by operation of religion (e.g. redemption through Christ), he inevitably will end up in hell. The Catholic Christian developed dogmas with little or no founding in the scriptures, which all but promised man heaven provided he stayed with the teachings of the church. This was the point, when Luther got stuck with St Paul’s word: Römer 3, 28:
Or in the translation of the King James Bible: Therefore we conclude that man is justified by faith without the deeds of the law. Or in Luthers translation: So halten wir nun dafür, dass der Mensch gerecht werde ohne des Gesetzes Werke, allein durch den Glauben.
154
Business Review – Volume 3 Number 1 January – June 2008
Faith was the first step to salvation. But even faith is no guarantee. Salvation cannot be earned. It is a grace of God given to the worthy and unworthy alike. Rituals and formalities, not even prayers and fasting, not pilgrimages nor doing good works or faithful obedience to all religious rites and rules can earn the grace of the Almighty. Ultimately we are led to the conclusion, that it is irrelevant, whether we pray or not, whether we do good, fast or not, God’s majesty will not be forced to grant us pardon for our original sin. So the individual is left to find out by himself, what God wishes him to do and not to do. Most probably God wants him to stay in his place and to be good in his profession. LITERACY - EQUALITY – RULE OF LAW – DEMOCRACY If man is direct to God, he must be able to read the Holy Scriptures. Protestantism therefore insisted right from Luther`s first writings on building municipal schools everywhere for everybody. It is protestant Germany where we find the first laws on compulsory schooling as early as 1598 ( Straßburg/Elsaß). This led to a new curiosity: people, who now could read, wanted to know and judge by themselves, what was going on the world. The first regular newspaper was published in protestant Germany (again Straßburg, 1610) and then in Holland, England. He, who knows, will stop thinking of himself as inferior to others. Knowlegde breeds equality. Nobility step by step lost its monopoly on political power. All this started and was developed in the protestant regions of Europe. Thus reformation led to the age of enlightenment. Inasfar catholic scholars, French and few Italian, took part in this all European process, their Catholicism was imbued by protestant thinking and had come very close to agnosticism, if we think of Diderot (1713 – 84). Enlightenment (German: Aufklärung) therefore was basically a protestant affair in which now English and Scottish scholars took a leading role and which came to an glorious fulfilment with Immanuel Kant ( 1724 – 1804). Enlightenment was about reason. (German: Vernunft). Kant not only wrote about freedom of thought but almost preached it. Famous are his words:
Enlightenment will be brought about by freedom (Freiheit ) under the most harmless aspect of whatever may be called freedom, namely the freedom to openly make use of one`s reason (Vernunft) in all areas of life.
As this freedom directly leads to what we understand as self determination of the individual and also of peoples it follows that there is a direct line from reformation over enlightenment to modern ideas of democracy and even human rights. A further consequence of reformation was the following: If everybody from peasant to King is direct to God, if we are all equal in his eyes – what difference should there be among fellow creatures? If there are to be any differences these must be
155

Business Review – Volume 3 Number 1 January – June 2008
justified by objective reasons. This led to a new concept of the rule of law. The law is the foe of corruption. Is it just a coincidence that protestant countries are widely considered as corruption free? Law and equality leads to new forms of government. So another fruit of Protestantism is modern parliamentarianism and democracy. PREDESTINATION/ PREDETERMINATION God is all knowing. He knows the past and the future. The Almighty therefore has knowledge on my state of salvation before I even make my first breath. If this is so – what can I do? God’s grace will be bestowed on me or not – just as he wills. This situation, so Max Weber’s argument goes, would make a man anxious and to continuously tremble, whether or not he belongs to the chosen flock. This leads to a state of mind, where he tries to dampen his anxiousness by being constantly busy. If he tries by his own industriousness to help himself, God also may help him – and this then could be a sign that God has chosen him. Man therefore is like a student who has written a test. It is now beyond his reach to influence its result. He may now be very uneasy for some time until the result is there. To overcome this uneasiness, he can put himself to working so hard that he forgets about it and while doing so he may gain further insight into the topic of his test, and he may feel that his test should be all right. 3. PREDESTINATION IN ISLAM Islam also knows predetermined destiny (qada). If predetermination has effects as described on Protestants, why not on Muslim? Max Weber´s arguments would be as applicable to the one as for the other. Actually Max Weber`s theory seems to be applicable at least partly to the early Islamic period. Why then did Muslim countries develop so differently from the protestant? The holy book, the Quran, had been written down by Zaid ibn Thabit. A good Muslim was expected to read it, because he should understand it by himself. Illiteracy therefore is not a Quranic virtue! So everything was set to let the Muslim countries develop in almost in the same way as later on did the protestant countries. There are in whole history only few, if any, examples of men so courageous, active and self reliant as where the prophet and his first followers. Out of nothing they built within few decades one of the biggest empires ever. These men were everything, but they were not fatalistic dreamers. The Prophet and his companions put their faith in God, who had spoken to them in the Quran. They were men of action. They wanted to prove to themselves and to the world that they were worthy tools of Allah. They believed in man`s responsibility for his deeds. They did not engage in religious speculations. Rules and rites, regular prayers, fasting etc to them were ways to
156

Business Review – Volume 3 Number 1 January – June 2008
internalise religion, they were not regarded as being the gist of religion. Then in the light of the religion of the Quran the Muslim world developed one of the most splendid periods of world culture. Fatalism, which in the West is often seen as one of the main characteristics of Islam, may be a later distortion of Islam, as is often said. Nevertheless somehow fatalistic ideas became an essential part of the creed of the masses.. ..Mysticism bred fatalistic tendencies it also encouraged indifference to social morality. ..The neglect of social and practical ethics cancelled all programs of humanitarian activity…science disappeared. This neglect and fatalistic state of mind apparently has led to leaving the masses illiterate. There are may reasons for the decline of the Muslim world. Arguably the Mongolian conquest of Central Asia and the annihilation of the caliphat (1258) most the single most important of them all. The teachings of the Quran, however, are not among them. Islam, so it is said, is the very negation of fatalism. But apparently qada did not remain the driving force in Islam. To the contrary. It was misunderstood as passive acquiescence and surrender to the flow of events which is neither knowable nor predictable. Thus, the attitude requisite for technology.. is absent in popular Islam. 4. NEW UNDERSTANDING OF NEW TESTAMENT UNDER PROTESTANTISM Jesus tells the following parable (Matth. 25, 14ff):
A master went on a long journey. He called his servants. To A he gave 1000 pounds of gold; to B 2000 and to C 5000. Master comes back. A returns 1000 pounds and says: Master, I know your harshness, I was afraid of losing your gold, so I hid it – here it is! B returned 2000 and in addition some profit made with it. . C, who had received most, returned the gold plus the huge profit. The master scolded A: Once you knew that I am harsh – how could you dare to return my gold without even trying to put it to the money lenders and earn some interests on it. B fared somewhat better. C, however, was praised. You are indeed my faithful servant. From now on you shall my steward in greater things. And the master took the gold from A and gave it to C, who already had so much.
For Protestants this parable has become something kind of a “leading case”. The Lord gave to each of us certain talents, If we do nothing more with our talents than just refraining from sins, if we live a life in all decency - this - such is the message of this parable - is not, what the Lord expects from us. We are deceiving the Lord for the profit, we could have earned with the talents he bestowed upon us. St. Luke 12, 48 reports a saying of Jesus: For unto whomsoever much is given, of him shall be much required. So Jesus says: If we are hiding our talents, not using them in the
157

Business Review – Volume 3 Number 1 January – June 2008
furtherance of the Kingdom of God, we are committing a grave sin, even if we return our talents received unimpaired to the Lord. MW rightfully sees a new understanding of professional life evolving with the reformation. If all men, irrespective of who they are and what they are, depend on the grace of God, they sure are equal before God; if so there should also be equality among men here on earth. Whatever a man does, be he pope or peasant, it is a service to God, which he owes to the Lord in his respective profession. The only thing that counts is: has he performed well in his respective profession? We sing a hymn Lutheran services saying: Oh Lord, give that I do the work in the profession you have assigned me to diligently and at the right time, and let it be done successfully. 5. ISLAM ISLAM AND CHRISTIANITY The core problem of every religion is the question: What can /should man do, to become befriended with the Almighty? In Christianity and Islam this question is asked more specifically: What must we do or omit, in order to be accepted to paradise? It is well known that Islam and Christian religion have many things in common. Islam also knows about the concept of original sin. In Islam the problem of man’s free will ( i.e. whether at all he is able to choose between good and bad) has been discussed with almost the same arguments as in Christianity. If God is good, how come, that his creature is bad and needs salvation? If man sins, why should he be punishable, if he follows the path of truth why should he be rewarded? God created him exactly as he happens to be. And after all – what is a sin? The concept of man’s punishment and reward would then lead to the heretic assumption, that there is within man’s nature something beyond the Almighty’ s reach, something what he did not create and still it is there. This type of rationalistic thinking came up very soon after the emergence of Christianity and Islam respectively. The Islamic sect of Mutazilism (8th century) seems to ask the same questions and apparently comes up with about the same answers as the Christian Pelagius and his sect did in the 5th century. Both sects have been refuted by their respective orthodox theologians, who for the Christians are personified in St. Augustine. The orthodox and until today prevailing answers in both religions, Christianity and Islam, to these question also seem to be very similar. God created everything and what he created, was good. God cannot do any evil. The Bad as such does not really exist, it is only the negation of the Good, privatio boni. Bad is what is left over, when we take away the Good. This seems to be also the stance of Islam. The Quran says that God created man with a bias towards the good ( S. 82, 7). This Good, which is found in man’s soul, is implanted
158

Business Review – Volume 3 Number 1 January – June 2008
by God, it is his gift. If we subtract this gift from man’s soul, then his pure nature lies before us, and this nature has a tendency to be bad. So whatever evil a man does, this comes from his own soul (S.4, 79). So also under Islam man is saved only by grace of God. For Christians God’s grace has been bestowed on us through Jesus Christ. The traditional view of the Catholic Church says: this Grace of God is administered by us, the church, you as an individual must not worry. If you follow the teachings of the holy Catholic Church you will not be lost in the final judgement. For the Muslim this grace of God has been given by sending down the Quran. If man follows the teachings of Quran in good faith he can be all but certain that he will be allowed to enter paradise. It could therefore be said, that the Quran in its entirety for the Muslim has the same function as the church has for the catholic Christian. ISLAM AND PROTESTANTS It is not easy to draw the line between Catholics and Protestants. Bar one big point: The catholic “believes” in the church as an institution said to have been found by Christ himself. The church has the exclusive authority to, as has been said, administer god‘s grace and thereby to guide man to God and paradise. This concept (extra ecclesiam non est salus = without the church there can be no salvation) was of fundamental importance; it still is, albeit slightly adapted to the facts of the world. The good catholic Christian is expected to content himself with what the Church teaches. It seems that this comes rather close to the Islamic doctrine of taqlid, by which the Muslim passively accepts the teaching of authorities without asking questions. Luther and reformation questioned this doctrine. According to Luther man is direct to God. Priest and church may help him to understand the Holy Scriptures, but they are no mediators between him and God. It is the privilege and duty of everybody to understand the Holy Scriptures by himself. In this Protestantism is very similar to Islam. But there remains a difference. Protestantism did overcome taqlid, Islam not yet. True, there are Islamic writers fighting the doctrine of taqlid, but it is still dominant in Islam. It would be tantamount to an Islamic “Reformation”, if the doctrine of taqlid came to an end. This would open the door to apply Max Weber’s theory directly to Islam. 6. NEGATIVE AND POSITIVE ETHICS Muslim ethics like those of the Catholic Church may be called “positive”. It is about God`s rewards. Man in principle will be saved, but he can forfeit his salvation. Protestant thinking may be called “negative”: it is about avoiding punishment. He must show something to his master, the Lord. The protestant must therefore be
159

Business Review – Volume 3 Number 1 January – June 2008
active, and even then he is not certain that he will avoid damnation. Now, there is a big danger for the Protestant. The more we do, the more active we are, the more possibilities are there to fail and thus to commit sins. And on top of this: sin may also lie in not doing the right thing at the right time. To omit the Good is just as sinful as committing the Bad. In view of the other world, the life of a Protestant is therefore obviously more dangerous than that of a catholic. 7. SPIRIT OF CAPITALISM - ASCETICISM Wealth and riches may follow from our endeavours and from our being busy, but these are not the real aim. The bliss of working lies in the accomplishment of the well done work itself. Work is to the praise and honour of God not for my own gratification. The profit we earn with our master’s gold is not ours. Lust and luxury is not what the servant should aspire to. The master will pay me what has been agreed whether I worked less or more than my fellow servant, viz. Matth. 2, 1 ss. Endeavour means to do more than is usually done, more than is absolutely necessary. Endeavour is work and labour at the expense of leisure and fun. So capital is geronnener Lustverzicht, the aggregate of forgone leisure & fun or overtime turned into tangible worth. As bad breeds bad and good breeds good – as the proverbial saying goes – it follows that capital breeds capital, new capital breeds ever more of it. The more it grows the less we want to spend it – we want to invest it to increase it. Under the protestant ethics the investor does not want to become rich, he wants to show his master, that he is good servant. It may therefore not be just a coincidence that the first Savings Banks, Sparkassen, were established in protestant regions of Germany. The idea behind these Sparkassen was very protestant: small earners should be given a safe, i.e. state guaranteed opportunity to invest their pennies saved and have them grow into capital instead of spending it. It was the same idea which led protestant Friedrich Wilhelm Raiffeisen (1818 – 88) to found the cooperative movement and credit unions. Let us take, under this perspective, a glance at the very rich: Who is there in Monte Carlo or other glitzy places? The Onassis type of people, tennis stars. You would not find Bill Gates there or Warren Buffet. Both are now in the process of setting up one of the biggest foundations ever to the benefit of underdeveloped countries. . Both are obviously behaving in a very protestant way, – whether they are believers and church goers or not the same is true with the likes of Mrs. Quandt, who owns the car maker BMW. The Albrecht brothers, arguably the richest people in Europe, are living in Essen, where the undersigned lives, who can tell from their neighbours that they are known for their parsimoniousness, but nobody ever heard of their big yachts, if they have any, let alone extravagancies. These billionaires are said to eat in the general cantina and to turn the light of, when they leave the room, and Warren Buffet is said to have not change his hair cutter in 50 years.
160

Business Review – Volume 3 Number 1 January – June 2008
8. PROTESTANTISM OR WHAT? Like all big ideas Max Weber’s theory has its critics. Be it enough to cite Max Weber himself: It would be stupid, he says, to infer that Protestantism was the only cause of capitalism or, even more stupid, to say that capitalism as an economic concept originates in the reformation. There are also other reasons to stimulate activity. Times of war and duress can be seen as a stimulator to industrial progress. Is it really so that endeavours have something to do with religion or protestantism? Dubai has made tremendous progress in recent years. Is the Emir of Dubai a protestant? Malaysia has done rather well in many areas – are Malaysians protestants? Well, yes maybe, in a way. Not in the religious understanding of this word, but in the sense which underlies protestant ethics and which ultimately may be also the spirit of the Quran. The Quran teaches that God created the world not for sports; the Almighty intended to achieve something with this world, what is still hidden to us. God wanted men to contribute to this aim. Quran says that man should try to emulate God in his attributes. The sole aim of man is a progressive achievement of all divine attributes. The first and pre-eminent attribute of God is his being Creator of the world and of all what is within and without. This leads us to the conclusion that man according to the Quran may be destined to become a creator himself. I understand an Islamic mythos saying that God originally offered to the angels the divine trust, amanah, by which the world would have been transformed within and without into the likeness of the divine purpose. But these shied away in panic and terror. Then God entrusted this to man. Did we not also shy away from this? The practical ethic of a common Muslim is said to be quite the opposite of what Islamic ethics really are. Thus we would infer that also according to the Quran man is under an obligation to actively emulate God in his “creational spirit”. Man should try to improve the world and what is in it in order to conform it to the Almighty’s aims as evidenced in the Holy Scriptures. Under this perspective, Islam would come very close to or would even coincide with what has here been described as protestant ethics. Maybe this ethic is neither protestant nor Islamic – it is just the common ground on which irrespective of our professed religion mankind stands, as soon we feel responsibility for ourselves and the world as a whole. 9. CONCLUSION I wanted to show that religion, be it Christianity, Islam or others, is not a bed, in which we passively lie until we are led by the angels into paradise. Religion is a state of mind in which we out of responsibility towards God we make our own wings
161

Business Review – Volume 3 Number 1 January – June 2008
grow so that we may fly to heaven, albeit with His help. What can we do to make our wings grow and spread? LITERATURE: The Bible in the Kings James translation. Aden, Menno Christlicher Glaube (Cristian Credo) Münster 2004 Muhammad Ata al Sid Contemporary Attempts at Overcoming Decadence and Revitalizing Quranic Thought Business Review , IBA, Karachi, Pakistan, 2007, Vol.2. No. 1, p.72 Ranke, Leopold v. Deutsche Geschichte im Zeitalter der Reformation (German History in the Time of Reformation)
This is still today the classical treatise on reformation, written between 1839 – 47; see also references in Wikipedia. .
M.M. Sharif, editor, A History of Muslim Philosophy, 2 Volumes, 1963, reprint 1983, referred to as: Sharif + name of author Weber, Max Die protestantische Ethik Eine Aufsatzsammlung Johannes Winckelmann, editor, 7.th ed. 1984 Wikipedia Internet Encyclopedia, English version, unless indicated
otherwise REFERENCES Protestantism: The term derives from the “protestation” on the Imperial Diet of 1529: There a minority of princes and free Imperial cities protested against a resolution of the majority led by the Emperor Charles V which forbade reforms in the church. The argument of this minority was and really is up to this day the very essence of Protestantism: In what concerns God`s honour and the salvation of souls everybody must account individually to God , and nobody can exculpate himself from this accountability by accepting a majority vote. Cf. Ranke.
162

Business Review – Volume 3 Number 1 January – June 2008
Modern democracy, contrary to common belief, was not invented in England. Italy, Germany and Switzerland, until 1648 a part of Germany , had republics, governing themselves and accountable to no king or prince, centuries before the first parliament in the modern sense was convened. Sharif - Qadir Decline of the Muslim World,., p. 1417 ss Sharif – Mohammed Abduh, . S. 1498 Muhammad Ata al sid, loc. Cit., p. 57/8 Talantos (= talent ) used in this parable is the Greek word for a quantity of gold; cf. pound sterling, i.e. quantity of sterling silver. Gib, dass ich tu mit Fleiß, was mir zu tun gebühret, wozu mich dein Befehl in meinem Stande führet. Gib, dass ich`s tue bald, zu der Zeit, da ich sll, und wenn ich`s tu, so gib, dass es gerate wohl. Evangelisches Gesangbuch – German Evangelical Hymnbook Nr. 492: O Gott, du frommer Gott. Sharif, - Ibn Rushd, loc. Cit., S. 550 I hereby rely on: M.M. Sharif, Vol. 1, p. 199 ss (Mutazilism) Sharif, loc. Cit., p. 150 Sharif – Mohammed Abduh, p. 1496 Muhammad Ata al sid, loc. Cit., p.69 Founded 1. August 1786 by Duke Herzog Peter Friedrich Ludwig of Oldenburg. T he oldest Sparkasse of the world, which is still doing business, and quite successfully so, is the Landessparkasse zu Oldenburg/ in protestant northern Germany, founded in 1789. cf. Wikipedia ( German) Cf. Reference in Wikipedia Sharif loc. Cit., p. 142 see Sharif loc. cit. p. 146 Ismail R. al-Faruqi, Science and Traditional Values in Islamic Society, Nr. 3 Vol. II, Sept. 1975, p. 235 –6 ( cited after : Muhammad Ata al sid – loc.cit.
163

Business Review – Volume 3 Number 1 January – June 2008
“One remarkable variation in business ethics arises from the emphasis on individualism in U.S. culture as opposed to the emphasis on groups in many other cultures. Individualism in American social philosophy makes individual conscience the source of ethical control; the individual sin concept in Christianity makes personal guilt the penalty for bad conduct. But in other countries, a combination of the underlying factors discussed above has created far different ethical values.
The Japanese, for instance, have a strong ethic of fidelity to work
groups and corporations. Beginning in about the sixth century Japan, like other Asian societies, began to borrow and adapt Chinese culture. Traditional values in China stressed that an individual’s primary obligation was not to self but to others, including family, clan, and government. The Japanese also built a strong ethic of loyalty to superiors from the emphasis on fidelity in Chinese Confucianism. In medieval times the extreme of loyalty was seen in samurai, who gave their lives for feudal lords. Today it is seen in corporate employees who do ordinary jobs with life-or-death urgency. The concept of sin is foreign to Eastern religion and philosophy, so Japanese are not controlled by guilty consciences. Rather, they are shamed by group disapproval.”
George A. Steiner and John F. Steiner
164

Business Review – Volume 3 Number 1 January – June 2008
CASE STUDY
Pilot Study of 8 SMEs in Pakistan
Ejaz Mian Institute of Business Administration Karachi, Pakistan
ABSTRACT
hese (eight) cases study small firms (with 1-50 employees) in Pakistan to determine marketing factors that lead to success. Information is gathered through
in-depth interviews with owner-managers on their premises. Convenience sampling is used within the city of Karachi. Firms included relate to production, and services (including retail). It was found that most of the firms are not marketing oriented and they do not understand marketing. Thus they will benefit from some kind of marketing training conducted by the government or through their own resources.
T
Keywords: Small Firms; Marketing Philosophy; Strategic Aspects; Entrepreneurial Marketing. It was difficult to assign independent variables in my study of Pakistani SMEs. There was not sufficient basis for the same. Literature was limited to a few studies and these studies were mostly old. None of them focused on marketing in SMEs. Thus a need was felt to conduct a pilot study of some selected firms. This was done by me in Feb to April, 2007. A convenient sample of 8 firms was chosen and in depth interviews were conducted on premises of the firms. Interviews were done in two or more sessions. All interviewees were owner managers of the firms. Sample was chosen on basis of convenience and agreement of owner managers to talk freely and share information unless the nature of information was sensitive. Most of the studied firms are struggling to survive. They are still in the product oriented stage or sales oriented stage. They are interested in day to day existence. There was a strange feeling of hopelessness that is difficult to explain. It is some kind of despondency. Culturally Pakistanis leave things to God. Thus they seem to resign to their fate and hope that things will settle one day. It appears that apart from a few cases most of them are not taking charge of their business. The attitude is generally of being inactive or reactive. Proactiveness was not visible nor was interactiveness with the forces in the environment. This is a cultural trait which needs in depth study.
165

Business Review – Volume 3 Number 1 January – June 2008
Marketing philosophy, planning and strategic aspects of SMEs studied Essa
Ping Fashion vibes MPL Applied engineering
Karsaz estate
Ego Husain Minimart
Philosophical aspects of marketing
Product oriented. Using product development as tool.
Sales oriented. Pushing product. Not into customer knowledge seeking.
Medium marketing orientation. But no active market research yes. Some entrepreneurial marketing
Medium market orientation. Strong inside and outside sales
Medium customer orientation. B2B business.
Sales oriented. Now wanting to be MO. Strong inside and outside sales.
Highly marketing oriented. Involves customer in product design.
Sales oriented
Planning aspects
No formal plan. No written plan. Sales forecast made by retail outlets
No formal plan. No written plan. Informal planning in head of owner manager
No formal plan. No written plan. Sales forecast in head of owner manager
Some formal and written planning. Sales forecast done by owner manager.
No formal plan. No written plan. Sales forecast done by owner manager.
No formal plan. No written plan. Sales forecast done by owner manager with employees
No formal plan. No written plan Only 5 months old. Lifestyle business. wants only to break even
No formal plan. No written plan. Interested in bottom line only.
Strategic aspects
Essa Ping Fashion Vibes
MPL Applied Engineering
Karsaz estate
Ego Hussain Minimart
product
Continuous product development. Introducing new equipments
No product development. No enhanced product
Constant introduction of new products in line with market demands
Constantly developing enhanced product
Product differentiated from competitors in quality and reliability
Standard product. Some efforts at niche marketing
Product developed in participation with elite customers (brand ambassadors)
Standard product. Home delivery and credit offered to some.
pricing
Competitor based pricing
Competitor based pricing
Competitor based pricing. Some premium pricing
Standard pricing. Enhanced product
Bid based pricing.
Standard pricing.
Premium pricing based on high quality image
Standard price
promotion Personal selling and PR. Strong word of mouth
Personal selling. Aggressive branding. Some word of mouth
Some advertising and PR. Some branding
Strong personal selling. Strong word of mouth
Strong PR and networking
Some advertising. Strong PR
Strong PR. Strong word of mouth. Strong branding
Point of sale advertising
Creativity/ innovation
Medium Weak Medium Strong Medium Low High Weak
Ent Mktg
High High High High Medium Medium High Medium
166

Business Review – Volume 3 Number 1 January – June 2008
From their conversation it appeared that the macro forces were against the small business. And that no one cared. There was also an impression of owner managers being entangled in lot of unproductive stuff. There were complaints of having to fill too many forms and answer too many questions. Complaints were aplenty regarding lack of infra structure. And failing utilities in spite of exorbitant costs of the same. None of the firms studied including medium sized ones did any planning. Some did say they planned but what was planning to them was not what is academically called planning. These so called plans were mostly in the heads of the owners. They were not written down. And they were not done at regular intervals of time. There was also no indication of crisis planning or opportunistic planning. There was the usual reaction that they knew what they had to do so they saw no need to plan. Product development was visible with some. Product line additions were also seen. But they were mostly done on judgment and not on basis of any formal research. Most owners had a good practical sense of their business and in a way knew their markets. But they were not used to out of box thinking. They were not striving to come up with something new all the time. And if suggestion was given they had ready answers as to why the idea needed to be killed. Some of them during discussions agreed that they knew they had to do some activities but no reason was given as to why the same was not done. For example one of the interviewees said that he had asked some one to do planning some time ago but was not sure if that person actually did it. This showed a low priority to conceptual thinking including using modern tools of management and marketing. It seemed they had the belief that they knew the market and that there was nothing that could be done to improve the situation. I found an empty look in the face of some when told what they were doing about marketing. Networking was one thing which most of them did quite well. And this was their way of survival. It was as if they knew their survival was in togetherness. Networking was found even among competitors. And they shared work overloads with each other. Many among them were close friends with their competitors. They all used word of mouth for promoting themselves. This was done in a creative way. And as the number of customers was small and only few additional customers were expected to be added word of mouth was adequate enough to do the job. There was little use of advertising. If any was done it was through give aways or local leaflets. Surprisingly none used mailing lists, even though they had access to computers. Direct mail was used by MPL through qualified lists which they bought from the market at attractive rates. MPL also used e marketing and had a kind of cotton exchange working through the net and serving the buyer and seller of cotton.
167

Business Review – Volume 3 Number 1 January – June 2008
Most of the firms were set up by the owners themselves or their fathers. All owners had college education. Out of the eight owners half had some kind of similar experience from before but none had a firm before. One of them was managing director of a firm doing same kind of business till he started his own business and became a competitor. All had strong professional and personal network. Out of eight only two firms were started by a team. And these were doing well. All firms were located in high buyer areas. All of them believed in and delivered high quality. None did any active branding. But some were aware of the need to brand. Most of the firms were taking reasonable care of the employees. Training was also being provided to the employees on the job. Staff was being adequately paid except in one case. And in this case strangely the owner was complaining that it was difficult to find and retain good people. None of the firms were using professional advisers. There appeared to be no belief in the usefulness of advisers and there was no culture of using them, though it appeared that they could be quite useful. All firms had a good product. But the product was not sufficiently perceived to be such. This shows lack of use of promotions to the firm’s advantage. In case of fashion products there was some niche strategy to be seen. Innovation was also observed in these two firms. But what I found lacking the most was strategic marketing. This might have made the difference. There was no scientific analysis of all aspects of the situation and designing of a strategy to suit it. Nor was there evidence of dynamism and quick response to the changing market realities. All this leaves a lot to be desired in running of small firms in Pakistan. And it is not surprising that they are not doing all that well as reported by Rana et al., 2003 in their assessment of 650 manufacturing firms. GAP IN LITERATURE Almost nothing is known in a scientific way about the Pakistani SMEs. Study by Rana et al., 2003 is more than 4 years old. The study relates to manufacturing firms only with no mention of services or of trading firms. These now comprise of a high percentage of the firms. 15 % of labor is in services and 14 % in commerce or trade (Pakistan Statistical Yearbook, 2006). In the meantime a lot has changed in the Pakistani environment. There have been changes in macro environment including the media scene and growth of foreign investment in Pakistan. Also return of some Pakistani professionals living abroad and getting into their own business has changed the scene to an extent. There also has been tremendous growth in telecommunications. Media has come in a big way to play a role in marketing. Due to the proliferation of media (there being more than 70 local channels in Pakistan) TV is now becoming approachable by the SME sector. E commerce is also emerging. Broadband internet has seen drastic reduction in rates. And computer and
168

Business Review – Volume 3 Number 1 January – June 2008
computer literacy is increasing rapidly. Thus e commerce role in SMEs marketing cannot be ruled out. And there have been some changes in government policy in SMEs. New SME policy was announced in May, 2006. It promised SMEs many incentives but it is in press that same is slow to come about in practice. Founder characteristics of Pakistan small business owner needs to be studied. We need to know across the board in all industries what the typical characteristics of business owner are. What is his education, his industrial experience, his entrepreneurial background? We need to know the effect of age of owner on performance. We need to study how he conducts his business. Is he alert or proactive? Does he go and create opportunities or wait for customers to approach him. How does he motivate his employees? Does he have a climate in the firm that promotes commitment of employees? Does he train them in the important areas of his business? Can he hire and retain his employees. In case of Taiwan soft skills have assumed great importance. It needs to be studied what kind of skills Pakistani small business owner has. We need to take a bigger picture in terms of businesses including services and trading. Owner manager is the most important entity in small business. Without his education, his understanding of some of the modern management techniques he cannot steer his firm toward success. We also need to study role of partnership in success. Joint ownership/joint management is important factor to examine. Firm attributes is another area of great importance in small firms. It needs to be seen if all vital systems are in place. What is keeping small firm from having HR, Finance, Marketing and other important functions? What about accounting? Do they have bank accounts? Why they do not have confidence in financial institutions and why they don’t apply for loans. It is about time Pakistani SME start using professional advice where it does not have expertise of its own. Why there is no culture of using advisors. Is it lack of education and related shyness or is it the costs. It needs to be seen if marketing can play a role in these firms and can owner managers be made to understand marketing in a simple way in their language. How do they do marketing now and what improvements can be made in their use of marketing. Do they for instance now do things which are related to marketing but are not understood by them as such. What about the role of entrepreneurial marketing. and how about strategic marketing. How about marketing planning. Is it happening? If not why they don’t plan. And if they do what is the level of sophistication of their plans.
169

Business Review – Volume 3 Number 1 January – June 2008
CASE ONE : ESSA LABS (Medium sized enterprise, 230 employs)
HISTORY Essa labs were established in 1987 by Dr. Essa father of Dr. Farhan Essa. It is a family owned business and is mostly run by the father and son team. They started with one lab in North Nazimabad. From that they have expanded to over 96 branches over the next twenty years. It is basically a pathological laboratory but expanding into other types of diagnostics. Thus growth of Essa has been phenomenal and this is attributed to hard work, a good product which is essential for most people’s health and shortage of supply of quality set ups doing the same. Pathological labs business is a kind of business in which there is ample scope as there are significant entry barriers and few good labs. Health sector in Pakistan is inadequate to say the least. Most people have no proper health coverage. In both rural and urban areas western medicine, i.e. Allopathy is still not in line with culture and most people believe in traditional healthcare including hakims (herbal medicine), ayurvedic or homoeopathy. Or even no treatment at all, depending on the will of God to heal them. Going to doctors is a chore for most of them. Doctors are not available in rural areas and those that are available are not up to the mark. This also means there is no demand for pathological tests. Even those that do go to the doctors in rudimentary rural health centers end up not following doctors’ instructions or getting tests done. This means that market for such labs is essentially an urban phenomenon. In spite of this market in the urban areas remains quite large due to almost 45 % of population now residing in urban or suburban areas. And even if most of them do not have health cover there is a large segment of population which has need for testing whether it is in government hospitals or in private ones. As government labs have poor quality if at all one is able to get tests done through government facilities, need for private labs is indeed quite huge. And this is specially the case for those established on professional lines. Essa labs finds itself in this comparatively small group of labs. It is said out of the nearly 2000 labs or so in the country, about 80 % are quacks, an unbelievable number! Government regulation is weak and cannot control proliferation of such outlets. Therefore those who need to have reliable tests done have to go to the private albeit expensive labs. Among them foremost is the Aga Khan Labs associated with the Aga Khan University of Medical Sciences. This is the penultimate facility in the country established some 20 years ago by the Aga Khan Foundation. Their elaborate network of labs is connected to the main facility in the heart of Karachi. Pick up points serve as collection units and specimens are taken to the main labs within the hospital by
170

Business Review – Volume 3 Number 1 January – June 2008
their collection vans and results are displayed on computers mostly within 24 hours. They are available online to the treating doctors. It is in this scenario that Essa has found a gap for its services. Though Aga Khan has almost 50 % of the market share there of the professional market, there is still a large unfilled gap which is met through the private labs. There are almost 4 or 5 chain of labs in Karachi. But Essa has the biggest network within Karachi having 96 labs strategically situated throughout the city. Thus they do have an extensive distribution in Karachi. The gap that is filled in by the likes of Essa is the one for professional service at affordable prices. Prices of Essa thus being about 50 % of those charged by Aga Khan. Even then in a city of a population of 16 million the demand is far short of supply. And the prices are out of reach of most people. Thus the logic of quack labs which give semblance of medical care where none exists. MACROENVIRONMENT ECONOMIC As majority of the people in Pakistan cannot afford allopathic medicine market for pathological labs is much less that expected. Thus most of those who go for tests out of sheer need look for cheapest labs. Due to low education levels they cannot distinguish between the properly equipped labs and those that are not. The ‘quacks’ are having a good time. Some of them are alleged not to even conduct the tests at all and just make fake results. Or at best their results are not reliable. A small percentage of people can afford the expensive tests and they don’t care how much they cost. And others who work for organizations get some sort of cover for medical expense. But this seldom allows them to use the top labs. Thus they also sometime go to the less than reliable labs. CULTURAL AND SOCIAL There is hardly and tradition among the rural population to go for pathological tests. They only do when forced by a life and death issue. In the urban areas those who can afford do use these facilities whereas the vast majority does so very infrequently. Thus majority of people remain ignorant of what such labs have to offer. Even when some of them do use these tests they may not follow the results and usually leave treatment half way due to traditional disbelief in western system of medicine. COMPETITIVE There are only a few chains of labs in the country. In Karachi there may be 4 or 5. Others are isolated ones with each one or few outlets. They do not have highly
171

Business Review – Volume 3 Number 1 January – June 2008
motivated owners dedicated to growth or to acquiring latest technology by increase of revenue through growth. Competition is still not very high for professional labs as market is growing rapidly. This is due to secular increase of about 3 % in population as well as growth in incomes of people and the influence of education with increased awareness of preventive health and diagnosis of disease. It can be said that in future there is likely to be a vast increase in the lab business as new hospitals come into existence and as more and more people come into the health cover bracket. In this situation value for money is the USP of Essa. They want to create image that they are offering value for money for the market which is value and price conscious. And to do this they need to emphasize their competitive edge which is lower prices and distribution. TECHNOLOGICAL In this industry there is rapid growth in technology. It is known that medical engineering is one of the fastest growing technologies in the world. And this fast growth also finds itself into leading labs in Pakistan. Now for most of the sophisticated tests one does not have to go abroad and they can be done locally. Still there is a wide gap between demand and supply. Newer and more sophisticated equipments are making their way into Pakistan. In order to compete, Essa is investing a lot in the newer machines including CT SCAN and other state of the art diagnostic equipment. It is one of the main points in the unwritten Essa philosophy to keep ahead of technology in their field and remain a change agent rather than just a place where one goes to get tests done. They want to be a part of introducing the most sophisticated technology in the country at affordable prices. Each lab of Essa is equipped to get the basic tests done on sight unlike Aga Khan which has to transport specimens to their central lab which may take several hours and according to Essa may compromise the quality of results. REGULATORY Though laws do exist in general about all kinds of foul play and quackery these are seldom applied. The public has to pay the price for this poor governance. And labs like Essa have their task made more difficult in their difficulty to explain the community why their service is high priced compared to the non professional labs. The burden of quackery is thus shifted from the government to the business community and the consumers in this highly sensitive product. MICROENVIRONMENT Essa has enough capital available for expansion now due to a good and rapidly growing business in the last 20 years or so. Also it has one of the better trained manpower in the industry. It is said by Farhan that manpower trained by them is
172

Business Review – Volume 3 Number 1 January – June 2008
absorbed quickly in the industry with as prestigious a hospital as Aga Khan. Essa are one of the leaders in training of manpower in this field and have collaboration with Dow Medical College and others for training of technical staff and for programs leading to a degree in diagnostic sciences. Also their programs are popular and have demand. And they are thinking of going into academics and research. Farhan is himself an academic and is a lecturer in Dow Medical University. Essa believe in value added services. They achieved ISO 9001 qualification in 2003. This qualification has helped them enhance quality. They also have Pakistan Nuclear Regulatory Authority certification. They were declared Best Lab in Pakistan for the year 2005-6. Having each outlet as independent one and not needing specimens to be taken to head office each time is an advantage in terms of quality of the tests performed. Specimen does not expire and is more reliable. All tests can be done under one roof. Essa also have certification from IQAS (International Quality Assurance Society). MARKETING Now the question remains what Essa is doing in terms of marketing. And what are marketing problems of Essa. And what is the kind of marketing that can be done by a firm like this. Marketing within Essa is not the marketing of the 4 Ps. No doubt there is the product, price, promotion and place but not at the conscious level. Firstly what is the meaning of product of Essa to the typical consumer? Whether it is the issue of being a tool in achievement of health, as it may be for some; or it is the difference between life and death as it is surely for many others. And what is it that the customer is paying for. In other words what is the total product concept of Essa? It is not the test itself for sure. It is what the test can do. For some it can be a back breaker and useless activity leading to vast expenses. In other words for Essa to understand why a consumer comes into his outlet they have to understand what does the product mean for the customer. What is the core product and what is the enhanced product. And what ancillary products are associated with it. As the product is a service the four characteristics of product assume significance. Pathological service is intangible. So how is Essa to tell the customer that what they will do will be good. To this aspect they have hired 10 executives dedicated to customer service. They are consciously trying to improve their product in terms of the range and comfort of the patients. And the technology. This is the first thing that needs to be done as the first thing is the product itself. Essa are not doing any formal marketing research to establish the need of the market but are using their judgment and think that they already know what their customer wants. With regard to price they have knowledge of what price of their competitors is. But they are not selling on
173

Business Review – Volume 3 Number 1 January – June 2008
price. With regard to promotion they say they have no formal promotion and no significant advertising. The small amount of advertising they do is in professional journals locally. They are using below the line advertising in terms of conferences, seminars, free camps, and other such events. Distribution of Essa appears to be their main strength. They are present in all of Karachi. At the same time they have not presented themselves in rest of the country. This is like a local chain of service outlets. And they consider Karachi and its vicinities as their prime trading area. HOW ESSA ACTUALLY DO MARKETING? Essa do not have conventional marketing. In discussion with Farhan, he said marketing is important but so far they have not been able to do it. They think it is now the time to take a look at their marketing and do something about it. There are no written marketing objectives. And no analysis of the overall situation of business in the country though this is all in the head of the top management including the father and the son. Marketing strategy has not been chalked out. Recently Essa have appointed 10 customer relationship persons. They are responsible to improve customer relationships. And these employees are also making calls on organizations to introduce Essa and promote business. This is the first conscious effort on the part of Essa to increase sales in an organized way. Essa are in a kind of oligopolistic situation. There is far more to do than they can handle. Medical field in Pakistan is critically short of capacity and allopathic treatment is not available to majority of population. The middle class who can partly afford treatment and tests looks for cheaper version. Whereas all lab facilities together are short in capacity. So consciously or unconsciously marketing does not occur to them. What takes place instead is image building. As most of the facilities available are fake and according to Dr. Essa they do not perform tests as they should, quality services are in great demand. Some thoughts have been given to branding in terms of a uniform color theme and projection in professional journals but there is no active branding as such. He feels though that the time has arrived when this needs to be done. Under image building are softer measures such as trying to get into academics. Essa wish to establish a medical university in the next 5 years. They are already training personnel for some medical colleges in Karachi. They would like to start research facilities. Dr. Essa himself is on faculty in one of the top medical colleges in Karachi and is also writing his PhD dissertation on a local topic. Image building also includes free camps they run from time to time.
174
Business Review – Volume 3 Number 1 January – June 2008
Image building in Essa consists of customer friendliness and good service to the satisfaction of customer. Quality is part of this. And CME, (continuous medical education) is a means to achieve this. There are newer challenges in Pakistan today, e.g. Dengue fever, depression, etc. Recently Essa got certification from Nuclear Regulatory Authority for safety in use of nuclear diagnostic facilities. Also they are now consciously engaged in CSR, corporate social responsibility. Essa is adding top of the line facilities and machinery in its labs. They are now installing CT SCAN. They have established new departments including clinical chemistry, infectious diseases, etc. As mentioned before most of the customers for Essa are through word of mouth. They do not depend on advertising. Marketing planning is not done as understood by the marketing text. Planning is in terms of each branch giving an estimate of what they intend to do in the next year and then trying to meet this target. MARKETING ORIENTATION. It is clear that marketing orientation in this business is practiced to an extent only. And that is to understand customer satisfaction and improve it. It is not in terms of doing marketing research with an effort to find out what is it that the customer really wants. This in part is due to the fact that it is very much a sellers’ market in this business. There is no effort at gathering marketing intelligence. And since it is not available it cannot be consciously be disseminated. As mentioned above, efforts are made starting recently to improve customer satisfaction but this is based on the judgment of the owner managers rather than as a result of any market search. MARKETING PLANNING Marketing planning is not done. There is no written plan. Though there is indication that at least verbally planning is considered as important, no systematic efforts are made to plan. There are inputs regarding what is happening in the market based on observations and this translates into expectations of increased revenues on the part of individual outlets. These outlets are supposed to give their next six months forecast to the top management. This is mostly an educated guess. Typical increase in yearly revenues is about 10%. And not much pressure seems to be put on managers of individual labs to meet these projections. In discussions with Essa it was found that they are aware of their weakness in the field of marketing and expressed the desire to hold some kind of marketing training for their staff. In this regard they said they would appreciate if a business school were to hold some kind of short course in marketing for their lab managers and the new 10 employees of the customer service department.
175

Business Review – Volume 3 Number 1 January – June 2008
Planning as done in marketing function starting with the vision and mission and moving on to objectives is unknown in this set up. It is indeed an eye opener that a professionally run organization full of doctors and other highly technical personnel does not seemed inclined to consider marketing as important. This in part reflects on the discipline of marketing and its inability to penetrate where it is most needed that is in the SMEs which form the backbone of the economy of a country like Pakistan. It is a surprise that marketing in most of these firms is considered to be only a means of enhancing revenues, i.e. a short term approach without regard to the long term role of marketing in society and in business community as a means of maximizing stakeholders value and interest. BRANDING This is one area that Essa consider as one which needs emphasis. And brand building within Essa is image building. Concerted efforts are made to improve image. As mentioned above image building consists of adding activities to the already existing ones. This may be training, academics, conferences and providing leadership in the industry on issues of importance, including technology, total service at your doorstep”, etc. Still brand building does not include promotion as such. The brand name itself is not pushed as being something to plant in the mind of the audience. There is no effort to acquire brand logos, themes, colors, trademarks, and any such other brand assets which make big brands. Efforts at public service and philanthropy also do not push the brand name or add to its advantage. There is no advertising carried out by Essa. Some very limited one may include inclusion of a few ads in local medical professional journals to announce presence in some areas or in acquiring new technology. NETWORKING Now we come to the foremost tool used by Essa, i.e. networking. This is what is considered by them important in theory and in practice. Efforts are made to keep in the evoked set of doctors and the medical community. Business of Essa is split between organizational and individual. To get organizational business and be constantly referred by doctors Essa has to keep constantly in touch with them. This is not easy. There is constant need to be in forefront and be visible. Essa is in always ahead of others in taking lead in the industry and this aspect of their operations is emphasized in networking. Medical schools and colleges are another segment which is approached through networking. OTHER MARKETING ACTIVITIES Product development is the most important activity in business development and it must respond to the needs of the market. And it depends on market intelligence. But
176
Business Review – Volume 3 Number 1 January – June 2008
in Essa market intelligence is not carried out and dependence is made on judgment. Then as regards other promotion activities are concerned, personal selling is the one they consider as most important marketing activity. Public relationing is also emphasized and carried out naturally but not consciously as a business development activity but as an image building activity. It is clear that with increased capacity now available to Essa in terms of the number and types of tests they can do as well as other related activities, they can benefit from a conscious effort to market themselves. ANALYSIS AND LEARNING It can be concluded that conventional marketing does not find place within Essa. There is no 4 Ps seen. Conscious product development is there to an extent but not due to understanding of market’s need. Rather it is competition and technology driven. Pricing is to an extent based on what market is offering. But pricing methods are not clear. Also there is no conscious promotion. There are efforts at building image but it is not clear what image is aimed for. Also why image building is done and with what purpose? The only thing going for Essa as regards 4 Ps is placement or distribution. They are good at that. And it is not in order to meet requirements of the 4 Ps but to be everywhere in order to saturate Karachi. This does not need a genius or an understanding of marketing. Word of mouth is the main thing which Essa is using in order to generate customers. But even this is being done not consciously but rather unconsciously. That is it would have happened even if Essa did not think about it. If the product or service is good the word will spread around. The kind of product has a lot to do in this case with what works in the Karachi market. Pathology labs diagnostic service is a product which is in great demand. And it is an essential product in which the customer does not have a choice. As it is health related even those who cannot afford it try and get service from a reliable outlet even if they have to cut off budgets for other purchase items which are more discretionary. Networking is practiced in Essa labs with the medical profession. Essa are very active in many social services including activities of Rotary Club. There it is an ideal place to meet lot of elite of the city who are there to be seen in such circles. Networking is extremely important for Essa in case of organizational clients. They need to have organizations on their panel to create a relationship base. Here networking plays a major role. This is done in two ways now. One is Farhan’s own efforts with the medical community. And the other with the help of the customer relationship people who are supposed to call on organizations.
177
Business Review – Volume 3 Number 1 January – June 2008
Actually marketing for Essa is just being there and being visible. Their marketing might be successful for the time being but it is unlikely that they can carry on this passive marketing approach in the face of growing competition. In marketing if you are not doing it and others are you either face lost business or you have to also react. In this situation it is better to be proactive rather be reactive.
CASE NO. 2: PING SYSTEMS HISTORY Ping Systems is established and owned by Asaf Maruf Ali. He is a graduate of King Fahd University, Saudi Arabia where he did MS Engineering in 1996. He has been in business for the last 6 years. Ping has recently relocated themselves to a new office on the mezzanine floor of a commercial building occupying about 1700 sqft. This area in an upscale suburban locality of Karachi. They have 6 full time employees. Ping has a Novell Practicum testing lab in their premises, the only one in Pakistan. This means they can conduct Novell certification exams on their premises. There are two marketing persons and four application and technical persons in the company. Asaf supervises most of the projects that Ping undertakes. It seems marketing is not a prime activity in this organization. And there is not enough emphasis to generate orders but to serve those that are in hand. Their main product is Linux which is an answer to Windows of Microsoft Corp. Linux has the unique privilege of being an open system. That is changes can be made by the user to the system based on his needs. Linux was introduced by Linus Torvalds (a Finnish man). He was helped by Richard Stallman a very active and energetic man who together created the FSF (free software foundation). Idea behind this move was to freely provide users with a system which is more flexible and far more stable and effective. And in the process they wanted to do a social service for the community. Linux was the glue that connected all this together and was created in 1991. On other services like installation of mail, web, proxy server has a different cost structure. This results in saving of a vast amount on the part of businesses adopting the Linux system. For example for a company using ten desktops the costs of non-pirated software and services from windows will be approximately Rs. 900,000 compared with only Rs. 150,000 with the Linux system. And the system will be far more stable, flexible and fast. Thus it is clear that Linux makes an offer to the user which the user ‘cannot refuse’, or should not refuse. Then why most companies fail to see this. Of the 3.2 million economic units in the country at least a third should be such as to be able to benefit from and use a computer. Thus there are a million users of computers. Of these if only 10% have 10
178

Business Review – Volume 3 Number 1 January – June 2008
or more desktops to justify such a migration it is a figure of 100,000 to say the least. Of these at least 25 % should be in Karachi. That leaves a figure of at least 25,000 installations in Karachi. These will include mostly the small and medium enterprise. The MNCs usually have either the system installed or have to have head quarter permission to do so. Thus they are out in most cases. With only about 5 competitors in the field it gives a figure of 5,000 per Linux dealer to achieve in the next few years. It is our understanding that only a minuscule fraction of this has already been sold by the firms in this market. Not more than 200 systems appear to have been installed in Karachi. This leaves a market for a lot of sales to the remaining organizations. The interesting question is why has such an attractive product not been sold in the market which is very cost conscious. The most obvious reason seems to be lack of awareness in the market of the existence of such a system and appreciation of its benefits. Ping lacks the manpower to spread the word around in the market. And even if they are able to get the orders they do not seem to be in a position to service them. This is classic example of a ‘gold mine’ left unexplored waiting for some one else to do it. The most obvious reason for lack of awareness on the part of the market is absence of any worthwhile campaign to inform the prospect of about the product. MACROENVIRONMENT ECONOMIC Main customer segment for Linux are small organizations. There has been a growth in the economy of nearly 6.5 % last year. The number of cars on the road have increased by about 40 % in the last one year indicating there is money in the market. Personal computers ownership in Pakistan is growing at the rate of 50,000 to 70,000 per year. This indicates there is a substantial market for computer related products. As the import of computer is duty free, pcs have made great inroads into Pakistan market. SOCIAL AND CULTURAL Computer culture is fast growing in the country. Even small retailers who did not know the name of computer 15 years ago have removed their ‘fear’ of computer and are learning how to use them. If for nothing else then for emails, web surfing and typing only. Though a great segment of the organizational users are doing more with computers, i.e., using sophisticated software related to their field. Computer is no longer a novelty in Pakistan. And like mobile phones which are in excess of 50 million in the country, personal computers are fast becoming a household thing, and
179

Business Review – Volume 3 Number 1 January – June 2008
even those who do not use them are familiar with them and know roughly the purpose of them. Any small organization will be shy to be caught without one. COMPETITIVE As far as another operating system is concerned, windows is the only competitor for Linux. And almost all personal computers come with windows installed. But this is usually a pirated one. The price of a non pirated one which organized sector uses is about Rs. 20,000, which is prohibitive for an individual or a small organizational buyer. There are 5 main competitors in the field in Karachi offering Linux. They include Emergen, Arpatech, IKS, and Khawar Nehal and Ping. Ping consider themselves to be number one or two occupying about 25 % market share. So far they have sold only 30 systems. Their competitors also have been slow in sale of this valuable system which offers unique and obvious advantages to users compared to windows. Ping do not feel there is much competition at this stage in their business. Karachi is a vast market of 15 million people and the 5 competitors leave a lot of ground to be covered. Most of the prospects do not know about Linux and thus are left untapped. There is good understanding between competitors. Often they share work overloads and also ask each other to do tasks they cannot do themselves. For example one of the competitors recently requested them to do training on their behalf as they could not handle it themselves. So networking with competitors is good. TECHNOLOGICAL In this business technology is the name of the game. Most of the computer users know in which direction technology is going and thus can be called technology savvy. At the same time in computer technology it is important to keep abreast of what is happening in the field and what typical customer wants. They also need to know how to help consumers achieve satisfaction and how the system can help integrate with their requirements. This business also requires constant knowledge update and knowing what is happening in the field and which way the newer technologies are headed. Thus this is not a business for the novice. It requires substantial know-how. This may be an entry barrier. It needs understanding of the Linux system and how to install, apply, and modify to suit the users’ needs and how to trouble shoot later. REGULATORY This is relevant to the extent that due to anti piracy laws it is getting tougher for at least the organized sector to buy pirated products. And this will eventually help Linux as most of the windows installed in the country is pirated.
180

Business Review – Volume 3 Number 1 January – June 2008
MICROENVIRONMENT Ping has sufficient assets to do business. Recently they have acquired new premises in the new location. But they do not have sufficient number of qualified and clever staff who can take the challenge. Asaf believes in hiring university graduates as he thinks it is important to have a degree to be able to think scientifically. His major problem is to find the right kind of manpower to hire. He says deserving manpower just does not exist or do not want to join or stay long enough in the company. In discussions it came out that he needed greater liaison with universities and business schools to not only introduce product early to the future users but also to be able to attract manpower to work with Ping. Also getting financing in Pakistan is not difficult any more for a going business. And hardware required to do the job is available with Ping in terms of about 20 desktops for demo and training for potential clients; and to do the expansion into other areas which Asaf is thinking about. Motivation seems to be a problem as staff seems to feel they are under paid. This is the chicken and egg situation. Should Asaf pay them highly first and then expect them to do the job or vice versa. MARKETING In the interview with Asaf it came out that marketing was mentioned as important but actions needing to be taken for marketing were lacking. As found in SMEs literature the world over, most emphasis in Ping is on personal selling. Selling is done mostly by one individual Emmad Hameed a young man, energetic, fast and abrupt wanting to do many things but needing to plan and organize efforts in a planned way. Marketing in Ping relates to selling only. Emmad goes out to make presentations to some organizations to generate their interest in Linux He is usually accompanied by a technical person who answers the technical questions. And they are recently accompanied by a young female Mahrukh who has joined in the past week and is being groomed to take on the role from others. In depth interviews carried out by me twice in the premises of Ping led to some understanding of how they operate. They are mostly waiting for word of mouth from their customers to their prospects who they expect will talk to others of their good product. But word of mouth is not generated consciously. In other words word of mouth is left to itself to generate. It may or may not happen. There is no incentive provided to anyone to do word of mouth. The thumb rule that a satisfied customer tells 3 others is not used to advantage. And customers are not actively asked to do word of mouth. Ping has not given thought to a vision or mission of the company. But they would like to have one.
181

Business Review – Volume 3 Number 1 January – June 2008
MARKETING ORIENTATION This is not well understood within Ping. Though their product is standard, it needs some tailoring to suit the needs of the buyer. But at the same time much needs to be done to find out why customers are not buying in big numbers. Is it lack of awareness, or lack of understanding of the benefits of Linux? Or is it the perceived risk of going for something new? Sufficient market intelligence does not exist regarding who the prime prospects in the market are and how they can be reached. Thus there is lack of communication with the prospects. This kind of product needs for the marketer to saturate the market with information about the product and what it can do and the value for money it offers. As there is no formal or informal intelligence generation there is nothing to disseminate among employees. Except once in a while sales meeting are held to discuss efforts. These meetings seem to discuss what was done and not what was not done which could have been done. INTELLIGENCE GENERATION This aspect is lacking. Ping agree on the need to work on it. They mostly depend on in house research for this. And personnel in the field who go out to meet customers bring in the news of what is going on in the market. Regarding response to customer product preferences, it is a bit slow. They take up to two days or more to respond to customers’ product preferences. They do not talk to end users to assess quality of product. And talking to those who can influence sale of product is not structured. Meetings with industry are also not taking place often. Similarly gathering information on competitors is also not formalized. They however do keep abreast of industry changes but are not fast enough. INTELLIGENCE DISSEMINATION Ping does talk about competitors’ tactics and strategies. They discuss differences in prices, and scope of supply. Marketing personnel are always discussing needs with other departments. In fact they are often working hand in hand as they call together and discuss each customer’s requirement in house. RESPONSIVENESS Ping does not respond to competitors’ price changes immediately. As the customer base is small there is no formal segmentation in this business though informally Ping understands the difference between say educational institutions and business houses regarding needs. Needs of customers are not changing appreciably in this business as Linux is just starting to enter Pakistan. There is little product development in this field. Yet once the order is obtained the product is developed according to customer’s requirements. Most of the work is done for a particular customer thus it is
182

Business Review – Volume 3 Number 1 January – June 2008
a customization business. In other words the product is designed for the customer. Business plans are not driven by technological advances but by market considerations. Emphasis is on core business issues with standard technology. It does not happen often that competitors target customers of Ping for sale of their service. Customer complaints are taken care of quickly. If a new marketing idea was generated it can be and is quickly implemented. Requests for modification are addressed as part of the nature of business. Compared to the competitors, level of customer service in Ping is average. They are striving to be better. Emergen is doing good. They give that impression. They are smart marketers. MARKETING PLANNING They do not have a formal marketing plan. They do make plans from time to time but they are not formal. They do not do critical point planning or opportunistic planning. Planning is an unusual activity. A so called plan that I saw was no more than a list of ‘things to do’ in day to day work. Benefit of planning is not understood well. Objectives of marketing are not sufficiently understood or disseminated. Purpose of marketing plan, the target customer, benefits of product, or the USP (based on SWOT Analysis), positioning of company, marketing strategy and tactics, and marketing budget all need to be established. PERSONAL SELLING Usual marketing technique on which Asaf seems sold is making presentations with customers including companies and educational institutes. This presentation is generally made by the sole salesman Emmad along with the support staff including applications engineer/s. In the half day workshop, focus is on exposure to what Linux is, its applications, cost savings, value for money, after sales service, flexibility of the system and compatibility with old hardware. This area also needs improvement. Presentations need to be more professional. They need to focus on customer’s needs and therefore a meeting with the customer is important before this presentation is made. Presentation itself needs to be attractive, connect with the customer and dwell on value for money. And after sales support and other things of value to the customer need to be included. PUBLIC RELATIONING AND DIRECT MAIL This can be very useful for this company. Ping had a news letter which was discontinued after 4 months of publication. This was a good opportunity for projection which should be used to put their name in front of prospects. This was in
183

Business Review – Volume 3 Number 1 January – June 2008
form of a leaflet of one page. It would be better to make it a bit longer and Ping can support it with some ad material and include some text to appeal to readers. INSIDE THE ORGANIZATION There is a reward system that allows for opportunity for initiative including bonuses, dinners, etc. Ping employees have good commitment but need to be pushed a bit to accomplish more. Lack of infrastructure is the common problem in all of Pakistan's industries. There is frequent shortage of electricity and power interruption is happening many times a day. This results in disruption of work and erosion of motivation. In the new location of Ping, transport is also a limiting factor. There are no public buses available for the staff and it is inconvenient specially for the female staff to commute. Karachi is a huge city, and many living in the far flung areas find it hard to come to the place of work. BRANDING Asaf considers branding to be important but accepts they have not been able to do much in this regard. They are now thinking of using give-aways as one economical way to promote themselves. Advertising is considered as expensive and out of reach. It was suggested to them to adopt banners and roadside hoardings but it does not appear to be very attractive for them. Word of mouth is the main source of promotion in addition to presentations made by marketing personnel. Value of branding is not understood fully. And the magic and dynamics of powerful brand names needs to be exploited. OVERALL PERFORMANCE Asaf thinks his is a clean business. And he is happy with this aspect of the business. There are no under hand deals to be made, and no bribes to be given to the government officers. It is a knowledge based business and this is a source of satisfaction. Also this poses serious entry barriers. So how successful is Ping. In terms of financial measures it is still to realize its potential profitability. And though this is confidential, it is felt that the business could not have achieved break-even if salary and all overheads of the organization were accounted for. Specially since the new office was bought by Asaf for Rs. 7 million amounting to Rm. 420,000. ANALYSIS AND LEARNING In essence if we look at Ping Systems we can arrive at the following conclusions:
184

Business Review – Volume 3 Number 1 January – June 2008
Ping is not marketing oriented. They do not study the market before offering their product. Their contention is that irrespective of whatever marketing study they do the product offered will remain the same. It cannot be changed. It is a standard product. If any modifications are required they can be done at the time of installation of the product. And all buyers need this modification. And everyone who has 10 or more computers installed is a prospect for Linux. Ping is selling just what the others in the business are selling. They think the product it the core product itself. There is no effort to differentiate the product from others. This can be done in many simple ways. Some include financial arrangements. Others may include related products which can be tied to the product or can be separately offered. Still other options not considered seriously are of expansion of the market or going into diversification using the existing arrangements. Asaf has the option of either offering products that his customers need in addition to Linux or offering other products related to his field to other customer, i.e. new market. He is looking at this now. One of the areas he is considering is education and training in various computer related areas using his impressive set up including classrooms and desktop computers. Company does not offer any financial packages though this may be one of the things to explore. There may be some prospects that want the product but may not be able to put up front the money. Leasing arrangements could be considered for them in collaboration with some leasing companies. Another dilemma seems to be that on the one hand there is such a big market out there but on the other hand there is not enough capacity within Ping to cope with that. Actually this is the problem due to lack of planning. There has not been enough forecasting for the coming years and there is not enough medium term and long term vision. Without this it is difficult to hire and train enough manpower. It is the chicken and egg situation which comes first. Whether Ping should invest more in manpower and then look for market or whether it should wait for market to come and then add manpower. This is a strategic decision and requires cash inputs and thus needs thorough analysis and study. Next point is about networking. It appears enough networking is not happening with either the competitors or with customers. If so there would be much more business flowing into the company. Ping only has 30 customers which means that they are able to gain only 5 customers per year. Whereas the market is such that at least 100 new customers may be gained per year. This means the company is only achieving 5 % of its potential. This business is a gold mine if tapped well. USP of Ping is not clear or at least not being put across effectively enough to motivate the prospect to buy. There is not enough homework before calling on a client. Ping is waiting for word of mouth but are not making it happen. Word of mouth means someone else will do your job, but it does not happen automatically.
185

Business Review – Volume 3 Number 1 January – June 2008
Someone has to urge others to do it or create conditions for it to happen. This means you make it known to your customers that you will appreciate their involvement in your business by sending others to be your customers. It is also to be appreciated that it will pay in the long run to create your advocates in the market. Advocates are those customers who are so satisfied with your product that they start selling it for you on your behalf to others. Emailing also has not been fully exploited. Lists are available in Karachi. A list of 100,000 emails is available for Rs. 5,000 or so. And even if there are 100 queries resulting out of it and only 25 result in sale, it would mean doubling their customer base. CONCLUSION Moving from Essa to Ping what do we see? Both companies are not doing planning. Both are dependent on word of mouth. Both lack marketing orientation. And both do not think in terms of the 4 Ps. If they do it is done on a sub conscious level. There is lot of scope to play with the product but this is not happening. Both products can benefit from creativity and creation of competitive edge but this is not happening. Though Essa is a medium sized organization with much more resources and money to spend, efforts at marketing have been lukewarm. Both consider advertising to be expensive and not fruitful. Low budget advertising has not been seriously considered. Public relationing has been used by both to some effect. Social marketing has also been touched upon but the objectives of marketing are not very clear. There are no well defined laid down targets to achieve. Business is taken as it comes. Aggressive marketing is not practiced. There is no evidence of marketing planning in both firms. Branding is only done as an image building activity. The power of brand names, brand logos, typesets trade marks, themes, brand themes and brand associations is not there at all. Market is not saturated with promotion of brand and thus an opportunity to gain share is lost. Networking seems to be done extensively. But networking is not stretched to the limit. There are many gaps in the networking efforts. For Ping it was suggested to offer presentations to colleges specially those offering IT related education. This will put the name of Ping in the evoked set of Linux solution outlets in the minds of the graduating class. Many possibilities of publicity can be created for Linux as well as Essa by appearance on the vast TV networks in the country. Educational programs can be offered for public by both organizations.
186
Business Review – Volume 3 Number 1 January – June 2008
Judgment seems to be the dominant modus operandi in case of Ping and to an extent Essa. It seems entrepreneurs in Pakistan are making marketing decisions by themselves without involvement of professionals. And marketing occupies a back seat in the organization.
(To Be Continued)
REFERENCES Aldrich, H., and E. Auster (1986). Even Dwarfs Started Small: Liabilities of Size and Their Strategic Implications, In Research in Organizational Behavior, Vol. 8 Ed. B.M. Staw and L. L. Cummings. Greenwich, Conn.: JAI Press, 165-198. Amit, R., Schoemaker, P. (1993). Strategic assets and organizational rent. Strategic Management Journal, Vol. 14 No.1, pp.33-46. Appiah-Adu, Kwaku (1998). Marketing activities and business performance: evidence from foreign and domestic manufacturing firms in a liberalized developing economy. Marketing Intelligence & Planning, 16/7 1988 pp 436-442. Audretsch, David B. (1990). The Economic Role of Small and Medium-sized Enterprises: The United States. Paper prepared for the June 11-12, World Bank Workshop on Small and Medium Enterprises. Barney, J.B. (1986). Strategic factor markets: expectations, luck and business strategy. Management Science, Vol. 32 No.10, pp.1231-41. Barney, J.B. (1991). Firm resources and sustained competitive advantage. Journal of Management, Vol. 17 No.1, pp.99-120. Barringer, B. R., F. F. Jones and D. O. Neubaum (2005). Journal of Business Venturing 20 (2005), pp. 663-687. Beam, H.H. and Carey, T. A. (1989). Could you succeed in small business? Business Horizons, Vol. 32 No. 5, September/October, pp. 65-9. Benedetto, C. Anthony Di, Song, M. (2003). The relationship between strategic type and firm capabilities in Chinese firms. International Marketing Review, Vol. 20, No.5. Berry, Albert, and Dipak Mazumdar (1991). Small-scale Industry in East and Southeast Asia: A Review of the Literature and Issues. Asian Pacific Economic Literature 5: 2, 35-67.
187

Business Review – Volume 3 Number 1 January – June 2008
Braggs, S. M. (1999). Managing Explosive Corporate Growth. New York: Wiley. Brickau, R. (1994). Responding to the Single Market: A Comparative Study of UK and German Food Firms. Unpublished Ph.D. Dissertation. University of Plymouth, Plymouth, UK. Bruno, A.V. and Leidecker, J.K. (1988). Causes of new venture failure: 1960s vs. 1980s. Business Horizons, Vol. 31 No. 6, November/December, pp. 34-49. Burns, P. (1994). Keynote address. Proceedings of the 17th ISBA Sheffield Conference, ISBA, Leeds, UK. Capron, L., Hulland, J. (1999). Redeployment of brands, sales forces and general marketing management expertise following horizontal acquisitions: a resource-based view. Journal of Marketing, Vol. 63 No. April, pp.41-54. Carland, J.W., F. Hoy, W. R. Boulton, and J. C. Carland (1984). Differentiating Entrepreneurs from Small Business Owners: A Conceptualization. Academy of Management Review 9(2), 354-359. Carson, D. (1985). The evolution of marketing is small firms. European Journal of Marketing, Volume 19, No. 5, pp 7-16. Carson, D. (1990). Some explanatory models for assessing small firms’ marketing performance (a qualitative approach). European Journal of Marketing, Vol. 24 No. 11, pp. 5-51. Carson, D. (1993). A philosophy for marketing education in small firms. Journal of Marketing Management, Vol. 19 No. 2, pp. 189-204. Chaston, I. and Terry Mangles (1997). Core capabilities as predictors of growth potential is small manufacturing firms. Journal of small business management, Jan. Chell, E., J.Haworth, and S. Bearley. (1991). The Entrepreneurial Personality: Concepts, Cases and Categories, Routledge, London. Chen, J.S. (1993). Networking and Life Structure: Social and Economic Analysis of Small and Medium Enterprises in Taiwan. Taipei: Lian Geing Publishing Co. (in Chinese). Coopers & Lybrand (1994). Made in the UK: The Middle Market Survey. London: Coopers & Lybrand.
188
Business Review – Volume 3 Number 1 January – June 2008
Coulter, M. (2002). Strategic Management in Action, 2nd ed., Prentice-Hall, Englewood Cliffs, NJ. Davis, C.D, Hills, G.E, LaForge, R.W. (1985). The marketing/small enterprise paradox. International Small Business Journal, Vol. 3 pp.31-42. Deeds, D. L.., Hill, C.W.L. (1996). Strategic alliances and the rate of new product development: an empirical study of entrepreneurial bio technology firms. Journal of Business Venturing 11 (1), 41-55. Dierickx, I., Cool, K. (1989). Asset stock accumulation and sustainability of competitive advantage, Management Science, Vol. 35 pp.1504-11. Doorley, T.L., Donovan, J.M. (1999). Value creating growth. San Francisco: Jossey-Bass. Doyle, Peter & Graham Hooley. . (1992). Strategic orientation and corporate performance. International Journal of Research in Marketing. 9(1): 59-73. Drucker, P. (1986). Innovation and Entrepreneurship, Heinemann, London. Ellis, Paul D. (2005). Marketing orientation and marketing practice in a developing economy. European Journal of Marketing, Vol. 39, No. 5/6. Ennew, C. T. and M. R. Binks. (1998). Marketing and Entrepreneurship: some contextual issues, in Hubert, B., Day, J. and Shaw, E. (Eds), Proceedings of the Academy of Marketing Symposia on the Marketing and Entrepreneurship Interface 1996-1998, Nene University College, Northampton. Evans, S.J. (1991). Strategic flexibility for high technology maneuvers: a conceptual framework. Journal of Management Studies, Vol. 28 No. January, pp.69-89. Fleisher, C.S., Bensoussan, B.E. (2003). Strategic and Competitive Analysis: Methods and Techniques for Analyzing Business Competition, Prentice-Hall, Englewood Cliffs, NJ. Giamartino, Gary (1991). Will Small Business be the Answer for Developing Economies? Journal of Small Business Management. 29(1) pp. 91 -93. Grant, R.M. (2002). Contemporary Strategic Analysis, 4th ed., Blackwell, Oxford, Haber, Siegal and Reichel, Arie (2003). The cumulative nature of the entrepreneurial process: The contribution of human capital, planning and environment resources to small venture performance. Journal of Business Venturing 22 (2007) 119-145.
189

Business Review – Volume 3 Number 1 January – June 2008
Henderson, R., Cockburn, I. (1994), Measuring competence? Exploring firm effects in pharmaceutical research, Strategic Management Journal, Vol. 15 No.S2, pp.63-84. Hankinson Alan, (2000). The key factors in the profiles of small firm owner-managers that influence business performance. The South Coast Small Firms Survey, 1997-2000, Industrial and Commercial Training. Vol. 32, No. 3, pp. 94- 98. Hannan (1987). Fast Growth Strategies. New York: McGraw Hill. Hansen, E. L. (1995). Entrepreneurial networks and new organizational growth. Entrepreneurial theory and practice 19 (4), 7-19. Harrison, J., Taylor, B. (197). Supergrowth companies. Oxford: Reed Educational and Professional Publishing. Heunks, F. (1998). Innovation, creativity and success. Small Business Economics 10 (3), 263-272. Hills, G. E. (1987). Marketing and entrepreneurship research issues: scholarly justification, in Hills, G. E. (Eds), Research at the Marketing/Entrepreneurship Interface. The university of Illinois at Chicago, IL, pp. 3-15. Hisrich, R.D (1988). The entrepreneur in N. Ireland: characteristics, problems and recommendations for the future. Journal of Small Business Management, Vol. 26, pp.32-9. Hisrich, R.D., and M. P. Peters (1992). Entrepreneurship: Starting, Developing, and Managing a New Enterprise. Boston, Mass.: Irwin. Hogarth-Scott, S., Watson, K. and Wilson, N. (1996). Do small business have to practice marketing to survive and grow? Marketing Intelligence & Planning, 14/1, pp. 6-18. Hooley, G. J. and Jobber, D. (1986). Five common factors in top performing industrial firms”, Industrial Marketing Management, Vol. 15 No. 2, pp. 89-96. Jaworski, Bernard J. & Ajay K. Kohli (1993). Market orientation: Antecedents and consequences. Journal of Marketing. 57(3): 53-70. Johnstone, H, Kirby, D. (1992). Small firms and the recovery of the economic environment in Britain. Enterprising in Partnership with the Environment, Proceedings of International Council for Small Business, Toronto, pp.669.
190
Business Review – Volume 3 Number 1 January – June 2008
Kaplan, R. S., Norton, D. P. (1996). The Balanced Scorecard: Translating Strategy into Action, Harvard Business School Press, Boston, MA. Kazmil, Azhar & Farooquie, Jamal. Awareness and Management of Productivity in Small Scale Enterprises in the Indian State of Uttar Pradesh. Journal of Enterprising Culture 8(3) Sep 2000: pp. 255-270. Kenny, B. and Dyson, K. (1989). Marketing in Small Business. Routledge, London. Kohli, A. J. and Jaworski, B. (1990). Market orientation: The construct, research propositions, and managerial implications. Journal of Marketing 54 (April), 1-18. LaFuente, A, Salas, V. (1989). Types of entrepreneurs and firms: the case of new Spanish firms. Strategic Management Journal, Vol. 10 pp.17-30. Leigh, R., North, D. and Smallbone, D. (1990). Growth in small and medium sized manufacturing enterprises during the 1980s. Paper presented to the 13th National Small Firms’ Policy and Research Conference, Harrogate. Lin, C. Y. (1998). Success Factors of Small- and Medium-Sized Enterprises in Taiwan: An Analysis of Cases. Journal of Small Business Management, Oct 98, Vol. 36 Issue 4, p. 43-56. Lin, Y. Y. (1996). The Training and Development Practices in Taiwan: A Comparative Study of Taiwanese, USA, and Japanese Firms in Taiwan. Asia Pacific Journal of Human Resources 34(1), 45-62. Lussier, R.N. and Pfeifer, S. (2001). A Crossnational Prediction Model for Business Success. Journal of Small Business Management 2001 39(3), pp. 228-239. Masurel, Enno, Smit, Hidde, P. (2000). The planning behavior of small firms in Central Vietnam. Journal of Small Business Management, 00472778, April 2000 Vol. 38, Issue 2. Medium Term Development Framework (MTDF), 2005-2010, Planning Division, Government of Pakistan. Montague-Pollock, M. (1991). All the Right Connections. Asian Business, January, 20-24. Narver, John C. & Stanley F. Slater. 1990. The effect of market orientation on business profitability. Journal of Marketing. 54(4): 20-35.
191

Business Review – Volume 3 Number 1 January – June 2008
Oakley, R. (1991). Innovation and the management of marketing in high technology small firms. Journal of Marketing Management, Vol. 7 No. 4, pp. 343-56. O’Regan, N. and Ghobadian, E. (2004). The importance of capabilities for strategic direction and performance. Management Decision Volume 42 Number 2 2004 pp. 292-313 Pakistan Statistical Yearbook (2006). Statistics Division, Ministry of Economic Affairs and Statistics, Government of Pakistan. Patten, D. (1989). Successful Marketing for the Small Business. Routledge, London. Pelham, A. M. and D. T. Wilson. (1996). A longitudinal study of the impact of market structure, firm structure, strategy, and market orientation culture on dimensions of small-firm performance. Journal of the academy of marketing science 24(1), 27-43. Peteraf, M.A. (1993. The cornerstones of competitive advantage: a resource-based view. Strategic Management Journal, Vol. 14 No.3, pp.179-91. Poutziouris, P. (2003). The strategic orientation of owner managers of small ventures: evidence from the UK small business economy. International Journal of Entrepreneurial Behavior & Research Volume 9 Number 5 pp. 185-214. Rana, A., Khan, J., Asad, A. and Mian, S. A. (2003). The SME Pulse: An exploratory Study of the Performance of SME’S in Pakistan and the Characteristics of Successful Firms. Small and Medium Enterprise Center, Lahore University of Management Sciences. Risseeuw, RA., and E. Masurel (1994). The Role of Planning in Small Firms: Empirical Evidence from a Service Industry. Small Business Economics 6, 313-322. Reynolds, P. (1987). : New Firms: Societal Contribution Versus Potential,” Journal of Business Venturing 3, 231-246. Rich, J. T. (1999). The growth imperative. Journal of Business Strategy 20 (2), 27-31. Robert N. Lussier and Sanja Pfeifer (2000). Journal of Small Business Management 39(3), pp. 228-239.
192

Business Review – Volume 3 Number 1 January – June 2008
Roomi, M. A. and Hussain, S. T. (1998). SMEs in Pakistan: A survey of their problems and prospects. Small and Medium Enterprise Center, Lahore University of Management Sciences. Roper, S. (1997). Product innovation and small business growth: a comparison of the strategies of German, UK, and Irish companies. Small Business Economics 9(6), 523-537. Rumelt, R.P. (1991). How much does industry matter? Strategic Management Journal, Vol. 12 No.3, pp.167-85. Salleh, A.H.M. (1995). Marketing Management Challenges of S.M.E. Bumiputera Enterprises in Malaysia. An International Conference Nov 24-26, 1995, Bandar Seri Begawan. Sapienza, H., Grimm, C. (1997). Founder characteristics, start-up process and strategy/structure variables as predictors of shortline railroad performance. Entrepreneurship: Theory and Practice 22 (1), 5-24. Simon, H. (1996). Hidden Champions. Boston, Mass.: Harvard Business School Press. Siu, Wai-sum (2000). Marketing and company performance of Chinese small firms in Hong Kong. Marketing Intelligence & Planning, 18/5 (2000), pp. 292-307. Singer, B. (1995). Contours of development. Journal of Business Venturing 10 (4), 303-329. Shane, S. (1993). “Cultural Influences on National Rates of Innovation,” Journal of Business Venturing 8, 59-73. Stanworth, J. and Gray, C. (1991). Bolton 20 Years On: The Small Firm in the 1990s, Paul Chapman, London. Stokes, D. (2000). Entrepreneurial marketing: a conceptualization from qualitative research. Qualitative Market Research: An International Journal Volume 3 Number 1, 2000 pp. 47-54. Stokes, D.R., Fitchew, S., Blackburn, R. (1997). Small Business Research Centre, Kingston University, Kingston-upon-Thames, Marketing in small firms: a conceptual approach. Report to the Royal Mail. Szarka, Joseph (1990). Networking and Small Firms. International Small Business Journal 2 (January to March).
193

Business Review – Volume 3 Number 1 January – June 2008
Teece, D.J., Pisano, G., Shuen, A. (1997). Dynamic capabilities and strategic management. Strategic Management Journal, Vol. 18 pp.509-33. Teece, D. J. (1998). Technological change and the nature of the firm, in Dosi, G. (Eds), Technological Change and Economic Theory, Francis Pinter, London. Tiessen, J.H. (1997).Individualism, Collectivism, and Entrepreneurship: A Framework for International Comparative Research. Journal of Business Venturing 12, 367-384. Tradenz (1990). Export Manufacturing—Framework for Success. Wellington, New Zealand: New Zealand Trade Development Board. Urata, Shujiro, and Hiroki Kawai (1998). Technological Progress by Small and Medium Enterprises in Japan. Paper prepared for the June 11-12, World Bank Workshop on Small and Medium Enterprises. Watson, W., Steward, W., BarNir, A. (2003). The effects of human capital, organizational demography, and interpersonal processes on venture partner perceptions of firm profit and growth. Journal of Business Venturing 18 (2), 145-164. Weinrauch, J.D., Man, K., Robinson, P.A., Pharr, J. (1991). Dealing with limited financial resources: a marketing challenge for small business. Journal of Small Business Management, Vol. 29 No.4, pp.4-54. Wernerfelt, B. (1984). A resource-based view of the firm. Strategic Management Journal, Volume 5, issue 2, April-June. Wijewardena, H., A. De Zoysa, T. Fonseka and B. Perera (2004). The Impact of Planning and Control Sophistication on Performance of Small and Medium-Sized Enterprises: Evidence from Sri Lanka. Journal of Small Business Management 2004 42(2), pp. 209-217. Wilson, N., Hogarth-Scott, S. and Watson, K. (1994). Winners and losers: a study of the performance and survival of TEC supported new start businesses in West Yorkshire. Paper presented to the Entrepreneurship Research Conference, Babson College and Kauffman Foundation, Boston, MA. Yusuf, A. (1995). Critical Success Factors for Small Business: Perceptions of South Pacific Entrepreneurs. Journal of Small Business Management 33 (2), 68-74. Zontanos, G. and A.R. Anderson (2004). Relationships, marketing and small business: an exploration of links in theory and practice. Qualitative Market Research: An International Journal Volume 7 Number 3 pp. 228-236.
194

Business Review – Volume 3 Number 1 January – June 2008
A Word About The IBA
Our logo reflects “our resolve to meet the future challenges with integrated and multi - disciplinary knowledge and its creative
application in a changing global environment.” FOREWORD
t the institute of Business Administration we recognize the importance both theory and application. In our teaching practices we celebrate a very strong
sense of our, future encouraging our students to welcome change, growth and becoming. By exposing them to the problematic issues and a wide variety of perspectives we invite them to see the world from the standpoint of the role they will assume tomorrow. Besides deepening their knowledge, by placing their specialized concerns in a broader perspective, we expect them to develop an understanding of our national issues in a large global context.
A
In teaching we follow a research oriented methodology, characterized by both, passion and objectivity, revision and anticipation. As an academic and intellectual discipline, future oriented and goal seeking research and teaching methodology aims to focus on our cores. These courses with well defined areas of specialization and integrative analysis aim at drawing various insights into the fold of a larger perspective of discovery. We believe that when teaching is pursued with such a pronounced bias, and discovery is made an integral part of our teaching methodology, skills and insights developed in one field become meaningfully relevant in many fields, enriching both the analytic and synthetic approaches to the perrspectival unfoldment of our view of life. More importantly, it deepens our interpretative approach, broadening at the same time our descriptive skills. Also, by combining the application of these skills with a broad and general view of education, fusing theoretical with practical, weaving the realities of the lived – world with the academic analysis in the class room, it enriches both the theoretical and the applied components of our teaching methodology. As a radically pursued creative approach, such a pedagogical orientation is bound to result in a deeper appreciation of the nature and scope of the operational and strategic management of our corporate affairs. In the present day academic world, corporate concerns derive their relevance and significance from the specialized competence of various academic departments. Beside providing the material and insights, our departmental studies offer guidance
195

Business Review – Volume 3 Number 1 January – June 2008
and direction in the fields of teaching core and collaborative courses, conducting and promoting pure and applied research and applied research in the related fields of specialization. In this focused and yet diversified approach, as we engage in research, we experience the joy of moving beyond the way things are towards the anticipation of the way they can be and there ought to be. With each perspectival variation and horizontal unfoldment we see the future expanding into a large and still larger horizon, merging with the existing picture of the “given” reality, adding to it new dimension and new profiles, making it larger than the sum total of its parts. As members of the IBA community we celebrate the holistic approach and the gestaltan view of life and knowledge and truth. We uphold the academic and the corporate concerns of the Institute of Business Administration. Essentially, our reflections in this regard converge upon two fundamental thematic concerns: teaching and research. Individually and in conjunction with all other factors that bear upon the process of education, these two concerns define our forte and our calling which is ours not by compulsion or imposition but as a consequence of the divine ordinance of our privileged choice. At the IBA, we emphasize the importance of making choices and decisions. We believe that he who is taught to be well educated knows that not to choose is also a way of making a choice and not to choose is also a way of making a choice and not to decide is also a way of making a decision. We are free to choose not to decide and we are free to decide not to choose. But our choices and our decisions have consequences. So, we can, if we will, decide to live creatively; we and therefore we ought to live transcendentally. These are matters of serious educational significance, inspiring the passion for authenticity, integrity, excellence and research. The passion for excellence defines the creative and dynamic orientation of the IBA research culture and its belief in the principle of growth and development. They who live in knowledge societies, for them the most critical idea is their belief in the creative principle of movement towards a higher and still higher stage of development inherent in their culture. They believe that they can disentangle themselves from the petrifying weight of necessity becoming or wanting to become larger than who they are. We are not what we could have become; we are the possibility of what we are capable of becoming. By living the kind of life we decide to live, we assume a fate, a destiny and a character. They who live with that knowledge are, according to the Quran, “without excuses”. At the IBA, we believe that research orientation, in varying degrees of emphasis, is always dominated by the questions we did not care to ask and the answers we carelessly look for granted. It is also dominated by our ability to creatively welcome the phenomena of change and more so, our ability to draw the principle of movement
196

Business Review – Volume 3 Number 1 January – June 2008
towards the future into our world – view. Therefore, we recognize the importance of change and emphasize the need to grow by out growing ourselves. We trust to let education define the goal we ought to be seeking and to let research determine the direction in which we ought to be moving to reach our goal. INTRODUCTION The IBA is the oldest business school outside North America. It was established with technical collaboration of U Penn’s Wharton School of Finance and later University of Southern California. The IBA set the standards of educational and professional excellence. It seeks to advance and encourage new ideas and to promote enduring values to guide the practice of management. Over the years, the IBA has built a reputation for producing graduates of unmatched professionalism and sound ethical and moral values. The IBA has an academic environment in which talented and outstanding young men and women are inspired to reach out to the farthest limits of their vision and capacities. The IBA is proud of its nearly 7,500 accomplished alumni who are engaged in highly specialized and professional undertaking all over the world. Many of them hold demanding positions of administrative responsibilities in various fields of governance in Pakistan and abroad. We proudly celebrate their association with the IBA. CORE VALUES We uphold: • Merit • Truth • Integrity • Humility • Creativity • Discipline • Tolerance as the creative dimensions of the “highest good” – summum bonum – of an ethically motivated academic life based on moral foundations. MISSION At the IBA our mission is to provide education and training for management leadership in business and public sector in Pakistan. We aspire to be the best business school in Asia and amongst the best in the world. It is our cherished mission to establish links with renowned business schools in the world and with business and public sector organization in Pakistan and to try to introduce the knowledge, current and contemporary business culture and work - ethics for making Pakistan amongst the most competitive countries in the world.
197

Business Review – Volume 3 Number 1 January – June 2008
IBA PHILOSOPHY Our philosophy is rooted in the creative urge to strive continuously to improve upon all components of our system: culture, people and infrastructure; and to turn bright students with leadership potential into outstanding human beings and business professionals and leaders for tomorrow. MEETING THE CHALLENGES A fine blend of our academic environment, research culture and the highly qualified and devoted faculty at the IBA, moulds bright and intelligent students with leadership potential into high performing entrepreneurs and professional managers. THE GOAL AHEAD The IBA is set on a path of constant improvement, introducing changes in all critical fields of its undertaking. Its delete partnership with MICROSOFT has given a new dimension to the Center for Computer Studies, enabling students and faculty to remain abreast with the most advance technologies in software as well as hardware. It has entered into agreements with CBR to impart not only the qualify education to its probationers but also to its senior members in the field of management in order to realize the government’s policy to change the culture and the managerial practices of this sensitive department and to bring them to the accomplished level of modern-day needs and expectations. PROGRAMS OF STUDY AT THE IBA Our programs have been growing steadily in keeping with the needs of the society and the competence of the Institute of Business Administration. We offer courses in the fields of: • Doctor of Philosophy – Ph.D. (MIS/ICT/CSE) • Master of Business Administration – MBA (Morning Program) • Master of Business Administration – Management Information System
MBA- MIS (Morning Program) • MS (Economics) • MS (Finance) • Master of Business Administration – MBA (Evening Program) • Master of Business Administration – Management Information Systems
MBA- MIS (Evening Program) • Postgraduate Diploma in Business Administration – PGD (Evening
Program)
198

Business Review – Volume 3 Number 1 January – June 2008
• Certificate Courses (Evening Program) • Visiting Students Program (Evening Program) • Master of Business Administration – Tax Management (Morning Program) • Bachelor of Business Administration – BBA (Morning Program) • Bachelor of Business Administration – Management Information Systems
MBA- MIS (Morning Program) • Bachelor of Computer Studies – BCS (Morning Program) • Preparatory Program for Rural Students (Talent Hunt) • Business English Program CAREER OPPORTUNITIES The Institute offers a flexible curriculum, diverse and focused, to the committed and highly motivated students who are willing to embrace change and ready to experiment with new ideas and though patterns, anxious to assume the leadership role in the corporate world of today and tomorrow. CENTER OF EXECUTIVE EDUCATION The Center of Executive education is a state-of-the-art learning and training center. It focuses on training the managers and providing them with educational opportunities aimed at the refinement of the skills and attitudes they will need to succeed in the highly volatile, competitive and complex business environment of today’s corporate world. The programs designed by the center aim at helping organizations gain competitive advantage by developing their most important resources - the people. The center encourages activities designed to enhance organizational effectiveness of the professionals and their training in various areas of professional interest by providing them with the tools and knowledge to improve their managerial skills. The programs offered are designed to strengthen the participants’ leadership skills with a focus on personal development, productivity improvement and strategic thinking. The Center Specializes in executive education and management development activities through “open-enrollment’ courses, client- specific programs, consultancy and applied research. CENTRAL BOARD OF REVENUE (CBR) – CAPACITY BUILDING PROGRAM The IBA is providing training to the Tax and Customs officers of CBR in Karachi, Lahore and Islamabad. Up till now, 350 officers of grade 17 – 21 have been trained in Karachi. All the courses are designed by the faculty at IBA, which include Computer Skills, Communication and Presentation Skills, Management Skills, Leadership and Teambuilding Skills.
199

Business Review – Volume 3 Number 1 January – June 2008
CENTER FOR ENTREPRENEURSHIP IN PAKISTAN United States has chosen the IBA establishing a Center for Entrepreneurship in Pakistan under its broader Middle East and North African Initiative. There will be a distinguished advisory panel, ‘Blue Ribbon Panel’, consisting of the Directors of Entrepreneurship Institutes at MIT, Babson, Harvard and Stanford. This panel will not only advise but also assist and support the new Pakistani Center. Dr. Peter Bearse, who is an International Consulting Economist and an Expert in developing Entrepreneurial Center, is supervising the project. This project will start functioning by the end of 2007. RESEARCH CENTER The Research Center at City Campus plays a key role in the development of industrial and financial sectors of Pakistan by providing useful research and evaluation guidance. The activities of the Research Center consist of both core and collaborative research to provide help to the federal and provincial governments, non-governmental organizations and the private sector. The Center is a repository of the core research done by the IBA faculty, scholars and students. The research papers written are documented, archived and made available to other researchers and industry. The IBA faculty and students can access these research papers via the IBA internet. HIGH PROFILE FACULTY The IBA faculty comprises of teachers with academic achievements as well as successful practical business management experience. The faculty ensures that the system of education at the IBA is a unique blend of the best in classroom instruction, case studies, role-playing, business games, research and practical training in business organizations. HIGH ACHIEVING STUDENTS
Our students win distinctions and praises from foreign and local dignitaries for their confident, reasoned discourse, organized team work and knowledge. The IBA student groups arrange dozens of seminars and conferences every year. As individual contestants our students have been successful in national and international competitions. Two of our students; Muniva Mahmood and Asim Ali Raza were chosen to go to Geneva in an international seminar. They joined 30 other business students from around the world. The IBA was the only school in the world which had the distinction of having two students accepted for the seminar. Last year Asnia Asim topped contestants from 109 countries to win the World Bank Essay Contest. The IBA team won Pakistan round of Microsoft India’s Imagine Cup 2006.
200
Business Review – Volume 3 Number 1 January – June 2008
BUSINESS REVIEW
Research Journal of
The Institute of Business Administration Karachi, Pakistan
About Our Authors
Sarath WSB Dasanayaka earned his Ph.D. Degree at the University of Erasmus in Rotterdam, the Netherlands in Jan. 1997. He has obtained his Master degree also from the Netherlands in 1990 and his B.A Special Hon's degree earned in 1986 from University of Peradaniya in Sri Lanka. Currently he is the most senior academic staff member to Management of Technology Department. in the Faculty of Engineering in the University of Moratuwa, Sri Lanka. His current research and consultancy interests include Industrial and Managerial Economics, Economics of Technology, SMEs and Maritime Transport. Dr Sarath has 20 years experience in industry and academia in many parts of the world. Khurshid M. Kiani Khurshid Kiani holds an M.A. in Economics from the University of Punjab, Lahore, Pakistan an M.A. in Economics from the Kansas State University, Manhattan Kansas, and a Ph.D. in Economics from Kansas State University, Manhattan Kansas USA, in 2003. Kiani worked as Assistant Professor in the Department of Economics at Wilfrid Laurier University, Waterloo, Ontario, Canada, Assistant Economic Adviser, and Research Officer to the Government of Pakistan, Ministry of Finance, Islamabad, and Assistant Director, National Tariff Commission, Ministry of Commerce, Islamabad Pakistan. At present he is a faculty member in the Department of Economics at the University of the West Indies at their Mona Campus at Kingston Jamaica and teaches econometrics at all level and sequence of financial economics courses at graduate level. His research interests center on conventional statistical modeling that encompasses stable distributions, conditional heteroskedasticity, and long memory, and unconventional statistical predictive modeling, using techniques such as neural
201

Business Review – Volume 3 Number 1 January – June 2008
networks, genetic algorithms, and entropy in an out-of-sample predictive framework. His research work appears in Oxford Bulletin of Economics and Statistics, Computational Economics, Applied Financial Economics, Quarterly Review of Economics and Finance, Applied Economics and International Development, Transition Studies Review, Pakistan Development Review, International Journal of Applied Economics and Business Review. Orapin Duangploy, Ph.D., CPA, is the Fiesta Professor of Accounting at the University of Houston-Downtown. She has published numerous articles on financial accounting and international accounting in journals such as the International Journal of Accounting, Bank Accounting and Finance, and Journal of International Accounting, Auditing, and Taxation. Khursheed Omer, Ph.D., D.B.A., CPA, is an alumnus of IBA, The Institute of Business Administration, Karachi, Pakistan (1964) and a former faculty member at the IBA (1964 – 1973). He is the chairman of the Finance, Accounting, and Computer Information Systems and professor of accounting at the University of Houston Downtown. He has published numerous articles in journals such as Research in Accounting Regulations, Bank, Accounting & Finance, Review of Quantitative Finance and Accounting, Managerial Finance, Indian Accounting Review, Indian Journal of Accounting, Advances in Financial Planning and Forecasting, Journal of the Operations Research Society. He has also served as a contributing co-editor of Applications of Fuzzy Logic and Theory of Evidence to Accounting, in the monograph series, Studies in Financial and Managerial Accounting. Justo Manrique, Ph.D. is an Assistant Professor of Economics in the Finance, Accounting, and Computer Information Systems Department at the University of Houston Downtown. He does research in applied econometrics, applied microeconomics, and demand studies. Dr. Manrique has published several papers in peer reviewed journals in economics, finance, and accounting. Margaret Shelton Ph.D., CPA, is an Associate Professor of Accounting in the Finance, Accounting, and Computer Information Systems Department at the University of Houston Downtown. Her research interest is in financial reporting and accounting theory. She has published in such journals as Bank Accounting and Finance, Journal of Business Entrepreneurship. Huma Baqai is a Ph.D., presently teaching at the Institute of Business Administration, Karachi, Pakistan area of interests includes conflict and sources of conflict in South Asia. She has published in journal of repute and presented papers in both national and international conferences. She is also visiting faculty at Intstitutions of repute. She is also a certified political trainer from Germany, working with NGO's and National Political Parties and Journalists. Dr. Baqai appears
202

Business Review – Volume 3 Number 1 January – June 2008
regularly on electronic media in the capacity of International Relations Expert/Analyst on both national and private channels. Hend Jolo is an Assistant professor of Human Resources Management of Management and Marketing Department, and serves as the director of Human Resources Department at Qatar University since 2004. Her main interest includes human capital issues in the perspective of human resources, mainly training and education in addition to other management issues as labor turnover, performance appraisal and recruitment. Xiangjian He received his PhD degree in Computing Sciences in 1999. He is a Senior Member of IEEE. He is a Deputy Director of the Centre for Innovation in IT Services and Applications (iNEXT), a University Level key research centre at the University of Technology, Sydney, Australia. His research interests are in the areas of Computer Vision, Image Processing, Video Surveillance, Motion Tracking and Wireless Computer Networks. He has had about 150 refereed publications in books, journals and conferences. Qiang Wu received his PhD in Computer Science from the University of Technology, Sydney in 2003. He is currently a Senior Lecturer at the Faculty of Information Technology, University of Technology, Sydney. His current research interests include object detection and recognition, biometrics, human behaviour analysis and image retrieval. Tom Hintz received his Doctor of Science degree from New Mexico State University. He is currently appointed as the Dean of the Faculty of Information technology, University of Technology, Sydney (UTS), Australia. He has been a consultant to NASA on the first manned flight to the moon. He was a Specialist Member of the Technical Staff of Bell Laboratories. His current research in processing images focuses on algorithms that are inspired by primate vision systems. He is the author of over 200 refereed conference papers and journal articles. Wenjing Jia received her PhD degree from University of Technology, Sydney in 2007. Currently, she is a UTS Chancellor's Postdoctoral Research Fellow at University of Technology, Sydney (UTS). Her current research interests include image processing, pattern recognition, and computer vision, particularly in the filed of object detection. Shandana Shuaib holds an MPA degree. Presently, she teaches BBA and MBA students at the Institute of of Management Sciences, Hayatabad Peshawar, Pakistan. She specializes in Human Resource Development and Management. Shandana has worked extensively in the field of Research Methodologies and Techniques.
203
Business Review – Volume 3 Number 1 January – June 2008
Low Sui Pheng is a professor of construction technology and project management at the Department of Building, National University of Singapore. He received his PhD from University College London and is a Fellow of the Chartered Institute of Building. His research interests include international construction, productivity and quality. Menno Aden Dr. iur has his Doctorate Bonn thesis on French-German comparative law. He is a member of various international Bodies. Dr. Aden has published scholarly papers in various International Journals. He has some 300 entries on commercial law, especially banking and international law. He is an author of four books. Presently he is a Professor of Law at Fachhochschule, (University of Applied Sciences) Essen. Dr. Qazi Masood Ahmed is an Associate Professor at the Institute of Business Administration, Karachi, Pakistan. Mr. Mohammad Sabir is Senior Economist, at the Social Policy and Development Centre, Karachi, Pakistan. Syed Naeem Ahmed is Coordinator projects and Lecturer at Hamdard Institute of Education and Social Sciences, Hamdard University Karachi, Pakistan. He has done his M.Phil in Education with specialization in Educational Planning and Management. He has also done a postgraduate Diploma in TEFL in Higher Education. He has been associated with the administration of different educational institutions in multilingual, multicultural settings in many countries, including UAE, Saudi Arabia, Turkey and Pakistan.
204

Business Review – Volume 3 Number 1 January – June 2008
BUSINESS REVIEW
Research Journal of
The Institute of Business Administration Karachi, Pakistan
Note for Contributors
This Journal is biannual publication of the Institute of Business Administration, Karachi, Pakistan. It is a multidisciplinary Journal covering wide range of issues in the area of business, social and management sciences, administration and governance, mathematics and computer studies, finance, economics, psychology, business ethics, logic, history of ideas, and philosophy of comparative religion. GUIDELINES FOR AUTHORS 1. Manuscript should be submitted to the Editor, Business Review, Institute of
Business Administration, University Road, Karachi, Pakistan. 2. Three copies of the manuscript should be submitted. 3. The text should be double spaced, on one side of the quarto paper allowing
wide margins for referee’s comments. 4. All illustrations, tables, etc., should be placed on separate sheets, included
with each copy. Their placement should be indicated in the text. 5. Footnotes should be numbered consecutively throughout the text. 6. The first page of the manuscript should contain the following information:
(i) title of the paper; (ii) the name(s) and institutional affiliation(s) of the
205

Business Review – Volume 3 Number 1 January – June 2008
authors(s); (iii) a footnote should give the name, postal address, telephone and fax number, and an email address of the authors.
7. The second page must contain the title, an abstract not exceeding 300
words, a maximum of 5 key words or phrases and the appropriate JEL codes to be used for indexing purposes. The text will start on page number 3.
8. Acknowledgements of all sorts should be included on the first page. 9. All mathematical derivations should be presented on a separate sheet (note
to be published) to help the referees. 10. Manuscript should include only those references that are cited in the text.
Authors are advised to follow American Psychological Association (APA) style of referencing.
11. All literary material, including books, journals and manuscript for review
should be submitted in triplicate to the Editor, Business Review, Institute of Business Administration, University Road, Karachi, Pakistan.
12. It is assumed that the paper submitted is an original unpublished work and it
has not already been published or submitted for publication elsewhere. 13. The opinion, ideas and evaluations expressed in the articles printed in the
Business Review do not necessarily represent the views or polices of The Institute of Business Administration or the Editorial Board. They should be considered as representative examples of opinions and analysis now current in the academic field on various subjects of intellectual, educational and cultural interest.
14. After internal evaluation, the Editor will send the selected articles to the
external referees or the consulting foreign editors for their evaluation. Selection of the referees will be the discretion of the Editor.
For advance electronic submission of the material: [email protected] [email protected] All enquiries should be addressed to the Editor, Business Review, Research Journal of The Institute of Business Administration, Karachi, Pakistan.
206

Business Review – Volume 3 Number 1 January – June 2008
BUSINESS REVIEW ISSN 1990-6587
P U B L I C A T I O N S R E C E I V E D 1. Scratching The Surface: Democracy, Traditions, Gender
Edited by Jennifer Bennett Published by Heinrich Boll Foundation Regional Office, Pakistan / Afghanistan, 76-B, Nisar Road Lahore Cantt 54800, Pakistan 369 pp Price Not Given ISBN No: 969-9080-00-0
2. Different Facets of the Islamic Ummah in A Globalised World Edited by Naveed Ahmad Tahir Printed by B.C.C & T. Press University of Karachi and Goethe Institute of Karachi 214 pp, Price Rs 350.00 ISBN No: 969-8551-13-1 3. Corporate Pakistan Edited and Published by Taha Turabi Printed at Noorani Press Karachi, Pakistan Volume 02 No 03, June 2007 62 pp, Price 100.00 4. Paradigm Vol 1 No 1 January – June, 2007 The Research Journal of Institute of Management Technology Ghaziabad (India) Editor : G.D Sardana Published by: Institute of Management Technology, Ghaziabad, India
Printed at : First Impression Advertising, A – 169, 1st Floor Dilshad Colony Delhi 95, India
ISSN No 971-8907
207

Business Review – Volume 3 Number 1 January – June 2008
5. Journal of Social Sciences and Humanities Editor: Professor Dr. Tanweer Khalid Published by Faculty of Arts, University of Karachi – 75270, Pakistan Printed at BCC & T Press University of Karachi, Pakistan ISSN No 0257 – 4276
6. Women and Religion, Problems and Prospects, Vol 1 Heinrich Boll Foundation
Regional Office for South Asia Published by: Mazin Printer Lahore, Pakistan
162 pp, Price not given
7. Women and Religion, Vol V Text and Context: Critical Alternatives Edited by: Durre Ahmed Printed by: Arqam Lahore, Pakistan 151 pp, Price not given
8. Women and Religion, Vol VI Religious Violence: Conflict and Resolution
Edited by: Durre Ahmed Published by: Heinrich Boll Foundation Regional Office for South Asia
Printed by Star Press Lahore, Pakistan 151 pp, Price not given 9. Working Series on Traditional Societies and Democracy Analytical Reports of the Three Symposia by Jennifer Bennett Heinrich Boll Foundation Regional Office Pakistan / Afghanistan 76 – B Nisar Road, Lahore Cantt Pakistan 165 pp, Price not given 10. Biannual Journal of Gender and Social Issues Edited by: Prof Dr. Najma Najam Fatima Jinnah Women University Publication The Mall, Rawal Pindi, Pakistan ISSN No 1813 – 9892 11. The Business Review
Bi-annual Publication of the Faculty of Commerce and Management Studies
Chief Editor: Prof Mohiuddin Sangmi University of Kashmir, Srinagar, India Volume 12, No 2 March 2007 ISSN 0972 – 8384
208

Business Review – Volume 3 Number 1 January – June 2008
12. Proceeding: Innovations in Reducing Non point Source Pollution, Methods Policies, Programs and Measurement. A conference Organized by the Rivers Institute at Hanover College Indianapolis, Indiana, USA Editor Dennis Wichelns Published by Rivers Institute at Hanover College, Hanover, Indiana pp. 384, Price not given.
13. The Journal of Management Vol 9 No 1, July 2007 Edited by: Zia Islam Published by: NIM Karachi, Pakistan Printed by: Print Proofs, Karachi, Pakistan 159 pp, Price not given National Institute of Management Gulshan-e-Iqbal, University Road, Karachi, Pakistan 14. Grassroots (Culture) Biannual Research Journal Vol. No XXXV, 2007
Prof. Dr. Khalida Jamali Published by: Mr. Ayaz Channa
Printed by: Intel Communications, Hyderabad, Pakistan 212 pp, Price 300.00 ISSN No. 1726-0396 Pakistan Study Centre University of Sindh Allama I.I. Kazi Campus, Jamshoro, Sindh, Pakistan
209

ISSN 1990 - 6587
Volume 3 Number 1
Business Review January – June 2008
Institute of Business Administration
Karachi - Pakistan
Main Campus, University Road, Karachi. UAN: 111-422-422 Tel: (92-21) 9243090-5 Fax: (92-21) 9243421
Printed at BCC & T Press, University of Karachi-Pakistan