ISSN: 1576-0162 Eduardo Garzón Espinosa Universidad ...
28
REVISTA DE ECONOMÍA MUNDIAL 43, 2016, 133-160 ISSN: 1576-0162 UNIT LABOUR COSTS IN THE SUCCESS OF GERMAN EXPORTS (1999-2007) COSTES LABORALES UNITARIOS EN EL ÉXITO DE LAS EXPORTACIONES ALEMANAS (1999-2007) Eduardo Garzón Espinosa Universidad Complutense de Madrid [email protected] Rafael Fernández Sánchez Universidad Complutense de Madrid [email protected] Recibido: agosto de 2015; aceptado: febrero de 2016 ABSTRACT The German commercial success is often associated to the strategy of internal devaluation that entailed a moderate wage growth. However, the main argument in this paper is that necessarily there have to be other important and different factors that explain the outstanding trade performance, especially the evolution of productivity derived from different export specializations between commercial partners. Therefore, the German export performance is studied in relation to the evolution of the unit labour costs focusing on both unit wages and productivity dynamics sorted by manufacturing branches and particularly in comparison with the four largest economies in the Euro Zone: Spain, Italy, France and the Netherlands. The main conclusion of the study is that the favourable German export dynamic was positively related to the development of unit labour costs primarily through the productivity performance and not via the evolution of wages. Keywords: Trade; Exports; Productivity; Specialization; German; Eurozone.
Transcript of ISSN: 1576-0162 Eduardo Garzón Espinosa Universidad ...

Revista de economía mundial 43, 2016, 133-160
ISSN: 1576-0162
Unit laboUr coStS in the SUcceSS of German exportS (1999-2007)
Costes laborales unitarios en el éxito de las exportaCiones alemanas (1999-2007)
Eduardo Garzón EspinosaUniversidad Complutense de Madrid
Rafael Fernández SánchezUniversidad Complutense de Madrid
Recibido: agosto de 2015; aceptado: febrero de 2016
abStract
The German commercial success is often associated to the strategy of internal devaluation that entailed a moderate wage growth. However, the main argument in this paper is that necessarily there have to be other important and different factors that explain the outstanding trade performance, especially the evolution of productivity derived from different export specializations between commercial partners. Therefore, the German export performance is studied in relation to the evolution of the unit labour costs focusing on both unit wages and productivity dynamics sorted by manufacturing branches and particularly in comparison with the four largest economies in the Euro Zone: Spain, Italy, France and the Netherlands. The main conclusion of the study is that the favourable German export dynamic was positively related to the development of unit labour costs primarily through the productivity performance and not via the evolution of wages.
Keywords: Trade; Exports; Productivity; Specialization; German; Eurozone.
reSUmen
El éxito comercial alemán se suele asociar a la estrategia de devaluación interna lograda a través de un crecimiento moderado de los salarios. Sin embargo, la principal hipótesis de la que se parte en este documento es que necesariamente tiene que haber otros factores que expliquen los buenos resultados comerciales de la economía alemana, destacando entre ellos la evolución de la productividad derivada de las diferencias de especialización exportadora que existen entre los socios comerciales. En consecuencia, se estudia la relación entre el comportamiento exportador alemán y la evolución de los costes laborales unitarios (prestando atención tanto al crecimiento de los salarios unitarios como a la evolución de la productividad) por ramas manufactureras. La contrastación se realiza tanto para las transacciones de Alemania con la Eurozona como para las registradas con las cuatro economías más importantes de la zona monetaria: España, Italia, Francia y los Países Bajos. La principal conclusión del estudio es que la favorable dinámica exportadora de Alemania estuvo positivamente relacionada con la evolución de los costes laborales unitarios principalmente a través del aumento de la productividad y no tanto del comportamiento de los salarios.
Keywords: Trade; Exports; Productivity; Specialization; German; Eurozone.
JEL Classification: F14, D24.

Revista de economía mundial 43, 2016, 133-160
1. introdUction
The German economy grew significantly less than other European economies since the late 90s until the beginning of the economic crisis in 2008. This was mainly due to a very weak performance of domestic demand, which was partly offset by a dynamic external demand thanks to the excellent performance of its exports. This commercial success is often associated in the literature and in the dominant political discourse to the strategy of internal devaluation that was applied in the German economy and that entailed a moderate wage growth. However, this work was initiated under the suspicion that, although the above argument can partially explain the phenomenon, necessarily there had to be other important and different factors that elucidate the outstanding trade performance.
On the other hand, this favourable trend in exports increased the German current account surplus to exorbitant levels. The counterpart of this phenomenon has been the emergence of large current account deficits in selected countries of the Euro Zone, particularly in peripheral countries. However, the known data indicated that has not happened the same with other countries located in the centre of Europe, as their current account balances have also been positive. Again, the most common discourse often attributes this phenomenon to differences in competitiveness (measured by unit labour cost) between the different economies that could not be compensated through currency devaluation due to the single currency.
From both issues the following questions arise: Is the German export success related to the evolution of unit labour cost? If so, is this evolution explained mainly by lower wages or rather by the good performance of productivity? Which industrial branches had better performance and which is the source of their competitiveness? Are successful branches as well as the causes of their success the same for all countries, or there are notable differences between trade relations with peripheral countries and central European countries?
The main hypothesis of this paper is that the favourable export dynamic of Germany has been positively related to the development of unit labour costs primarily through productivity performance, not via the evolution of wages. The conjecture is that this has happened both generally and vis-à-vis the most important countries in the Euro Zone: France, Italy, Netherlands and Spain.
The analysis period begins in 1999 and ends in 2007. The starting point coincides with the introduction of the single currency in the European Union for
136 Eduardo Garzón Espinosa, rafaEl fErnándEz sánchEz
two reasons. The first one is that from this date the German commercial success becomes more remarkable, with the consequence that many perpetrators attribute it to the euro’s loss of competitiveness by trading partners of the European periphery (Hein, 2012; Ubide, 2013). The second reason is to avoid working with the exchange rate when analysing trade among countries in the EMU1. The choice of 2007 as the final year of the period is due to the interest in leaving out of the analysis the years of economic crisis, as it represents an important turning point in international trade flows.
The research is carried out only in the manufacturing sector, since their products make up about 90% of exports and 80% of imports. The manufacturing sectors will be catalogued considering the statistical classification of economic activities in the European Community (‘NACE’ by its French acronym), specifically according to the review 1.1. In this classification four groups of manufacturing branches are identified in terms of the technological component of their products: high (HT), medium-high (MHT) medium-low (MLT) and low (LT)2.
The nominal unit labour cost is calculated as follows:
Where ULC is the nominal unit labour costs, Wn is the average compensation per hour worked in nominal terms, Prod is labour productivity, VAr is value-added in real terms, VAn is value added in nominal terms, P is the value added deflator, and L the number of hours worked.
The work is divided into five sections that follow this introduction. In the next one theoretical issues are presented. In the third section, the evolution and composition of German exports as well as the evolution of productivity and wages in different manufacturing industries are analysed. In the fourth section, the main features of the German trade are set against the four largest economies in the Eurozone. In the fifth section, it is studied the link between German exports and unit labour costs and the four selected economies. The sixth and final section summarizes the conclusions of the work.
1 We consider EMU-12: Austria, Belgium, Denmark, Spain, Finland, Germany, Greece, Ireland, Italy, Luxembourg, Netherlands and Portugal.2 The category of HT is composed by the branches of pharmacy products (PHAR), computer and office equipment (COMP), communications equipment (CMEQ), specialized equipment (SPEQ), and aeronautics (AERO). MHT: chemical (CHEM), machinery (MACH), electrical equipment (ELEQ), automotive (AUTO) and other transportation equipment (OTEQ). MLT: petroleum and oil derivatives (PETR), rubber-plastics (RUPL), non-metallic minerals derivatives (NMMD), metallurgy (META), finished metal products (FMPR), and ships (SHIP). LT: food (FOOD), tobacco (TOBA), textiles (TEXT), clothing (CLOT), leather derivatives (LEAT), wood derivatives (WOOD), paper products (PAPE), other manufactured products (OMPR), graphics (GRAP) and recycling (RECY).
ULC =w!
Prod =w!
(VA!L )=
w!
(VA!P )/L

137
Revista de economía mundial 43, 2016, 133-160
unit labouR costs in the success of GeRman expoRts (1999-2007)
2. theoretical framework.
The analysis of competitiveness –understood as the ability of an economy to compete with others in the international trade– stems from two basic premises. The first one is that competitiveness is closely linked to the productive and technological capabilities of the economy, so that it depends much more on the productive structure and the evolution of investment and productivity than on variations in wages, prices or exchange rates (Landesman, 2003; Fontagné and Freudenberg, 1999). The second premise is that the way to improve this competitive capacity depends on both internal and external factors to the company, among which are such diverse elements as the quality of the education system and the national system of innovation, efficiency, size and sophistication of domestic markets, technology transfer mechanisms between branches and sectors, depth of the financial system, strategic and political capacity of the authorities, basic patterns of political, legal and economic organization, scale of values, etc3.
In foreign trade, the sum of these capabilities (internal and external to the company) is embodied in the marketed products through two pathways: price and differentiation. The first approach consists in lowering the prices of products below the prices of the products of other economies (Krugman, 1996; 2003; Bibow, 2012); the second one seeks to present the product as unique or different from the rest, such that the buyer find useful to acquire it due to their special characteristics, whether quality (vertical differentiation) or other such as package, brand, customer service, etc. (horizontal differentiation) (Caetano and Galego, 2006; Gracia, 2011). This competitive advantage often implies an increase in costs, but at the same time gives the seller greater scope to raise the price, in such a way that increased productivity compensates the rising cost. This method of competitiveness via product differentiation is especially relevant in the branches of higher technological content.
Returning to competitiveness via price it is important to note that it depends on reductions in production costs, although other factors may also be involved. Among these factors state intervention stands out, acting through different mechanisms ranging from public subsidies to companies to the imposition of tariffs (Chudnosky and Porta, 1990; Cicowiez and Galperin, 2005). Another factor is the business benefit. The final price is the sum of production costs and profit margin. Therefore, although the first remaining unchanged the final price could increase (decrease) if the seller increases (decreases) the profit margin (Garzón, A., 2011, Sanabria, 2013).
Diminishing production costs can be achieved by reductions in the price of inputs, but also by increases in labour productivity. About the first pathway wage policies are often important since the salary is considered the main production cost (Cesaratto, 2012; Bibow, 2012; Wray, 2012). This way of
3 Rodrik, 2006; Ministry of Economics and Technology of Germany, 2010; Porter, 1991; Coriat, 1997; Chesnais, 1991; Giannitsis and Kager, 2009; Fajnzylber, 1988.
138 Eduardo Garzón Espinosa, rafaEl fErnándEz sánchEz
obtaining competitiveness is particularly relevant in labour-intensive and low-tech industries. However, in other activities (capital- and technology-intensive) wages are not the most prominent component of costs nor the main way to gain competitiveness (Bianco, 2007; Gutiérrez, 2011). The rest of the production costs are financial costs, storage, logistics, procurement, and others. As these costs are low or being reduced at a significant rate, there will be a higher margin to decrease the price of the final product (Chudnosky and Porta, 1990; Fontagné and Freudenberg, 1999; Bianco, 2007). The opposite occurs if these costs are important or being rapidly increased.
About improving productivity as a way to gain competitiveness via price it is understood that the higher productivity, the more will be the production in relation to labour employed and consequently greater the margin to decrease the final product price without losing mark-up (Landesmann, 2003; Felipe and Kumar, 2011). Productivity can be increased through different ways. One of them comes directly from investment, particularly through technical progress: improving and modernizing the production process enable higher production volumes without increasing the number of working hours (Giannitsis and Kager, 2009). Another way is the improvement in work organization, which allows to exploit work efforts in less time (Gauron and Billaudot, 1987). Finally, the cost per unit of output may be reduced by a scale effect if an increase in demand (external and / or internal) (Palazuelos and Fernández, 2008) occurs.
If productivity enhancements are put in relation to changes in the cost of labour input, the nominal unit labour cost (ULC hereinafter) is obtained. This indicator is defined in nominal terms by dividing the total compensation of the employee (the nominal salary plus other costs for the company as payment in kind, social security, severance payments, contributions to pension plans, life insurance or health, etc) by unit of labour and labour productivity (Felipe and Kumar, 2011).
Therefore, increases in average compensation per employee imply greater ULC (if no change in productivity), while increases in labour productivity carry lower unit labour costs (if no change in unit wages). The greater ULC, lower margin to reduce the price of the product, and vice versa.
When competitiveness is measured against an economy that has a different currency, price comparison is also affected by the exchange rate. This indicator relates the value of one currency in comparison with another, thus it expresses how many units of one currency it is needed to obtain one unit of the other one (Krugman and Obstfeld, 2006).
In this paper special attention will be given to nominal unit labour cost as an indicator of competitiveness, but focusing on changes in its two components (wages and productivity), as it is shown in Figure 1. This is very important because it means that there will be a reading of ULC significantly different from the one that is usually performed in much of the specialized literature, mainly due to three reasons. Firstly, the approach presented here denies that the evolution of ULC is due solely to the behaviour of unit wages or the exchange

139
Revista de economía mundial 43, 2016, 133-160
unit labouR costs in the success of GeRman expoRts (1999-2007)
rate; therefore it rejects the assumption of constant productivity and considers that changing the productivity can significantly alter the ULC4. That allows ULC to decrease even with an increase in costs (wage). Secondly, productivity changes are due to multiple causes and they may be expressing modifications related to competitiveness which are very different from price elements. Thirdly, given the above, in industry, especially in the fields of higher technological content, improving competitiveness is not so much about reducing costs but about increasing productivity.
fiGUre 1: factorS explaininG trade reSUltS.
Source: Own compilation.
3. exportS, prodUctivity and waGeS
3.1. evolution and Composition of exports
The German manufacturing exports grew at an annual rate of 8.4% during the analysis period (1999-2007) and its trade balance went from +12.6 billion euros in 1999 to +126.2 in 2007, as shown in Table 1 and Table 2. Therefore there is no exaggeration when the good performance of the German export industry is underlined. Moreover, the share of exports in the Eurozone rose
4 Some authors consider insignificant and irrelevant the changes in productivity in the short term, so they only focus on the evolution of unit wage when the analysis period is reduced (Alonso, 2013).
Source: own compilation.
3. EXPORTS, PRODUCTIVITY AND WAGES
3.1. EVOLUTION AND COMPOSITION OF EXPORTS
The German manufacturing exports grew at an annual rate of 8.4% during the analysis period (1999-2007) and its trade balance went from +12.6 billion euros in 1999 to +126.2 in 2007, as shown in Table 1 and Table 2. Therefore there is no exaggeration when the good performance of the German export industry is underlined. Moreover, the share of exports in the Eurozone rose in these years from 28.8% to 31.5% (see Table 2). This remarkable increase means that the German dynamism has been much higher than that of the rest of the countries in the area5.
TABLE 1: GROWTH RATES OF EXPORTS, WAGES, PRODUCTIVITY AND UNIT LABOUR COSTS (1999-2007). EXPORT WEIGHT AND INDEX OF SPECIALIZATION IN 2007.
5 The notorious export growth has been greater to the outside of the Monetary Union than to the inside. In 2007 only 40% of German exports went to other EMU countries.

140 Eduardo Garzón Espinosa, rafaEl fErnándEz sánchEz
in these years from 28.8% to 31.5% (see Table 2). This remarkable increase means that the German dynamism has been much higher than that of the rest of the countries in the area5.
table 1: Growth rateS of exportS, waGeS, prodUctivity and Unit laboUr coStS (1999-2007). export weiGht and index of Specialization in 2007.
Source: Compiled from data from EU KLEMS and COMEXT. Notes: *World exports; **Index of specialization expressed as the share of German exports of one branch in the total German exports divided by the share of Eurozone exports of that branch in total Eurozone exports.
Distinguishing by categories, higher technological branches (HT and MHT) grew above the industry average, at rates of 8.6% and 7.7%, respectively. The
5 The notorious export growth has been greater to the outside of the Monetary Union than to the inside. In 2007 only 40% of German exports went to other EMU countries.

141
Revista de economía mundial 43, 2016, 133-160
unit labouR costs in the success of GeRman expoRts (1999-2007)
growth of exports in the branches of MLT was even higher, at a rate of 11.6%. However this growth must be tempered due to the sharp rise in commodity prices that contributed to overstate the dynamism of branches such as petroleum and oil derivatives, rubber-plastics, metals and metal products. In fact, when the rates are calculated in kilograms the result of these branches turn out to be equivalent to that of the branches of MHT and lower than those of HT6.
Observing the behaviour of the trade balance, the prominent role played by the branches of HT and MHT in the German export success is confirmed. The largest contribution to the trade surplus (96.4%) corresponded to MHT, whose branches have presented strong surpluses during every year of the analysis. Secondly, the category of HT made a positive contribution of 21.3%, having turned a trade deficit of 1.7 billion euros in 1999 into a surplus of 22.5 in 2007. The category of LT also contributed to the improvement of the trade balance with 15.5%, thanks to the reduction of the trade deficit that it already experienced at the beginning of the period, while the only negative contribution (-32.1%) corresponded to the category of MLT, whose deficit balance was increased throughout the period.
Turning to the evolution of the export composition, it is confirmed that the branches of higher technological content have not only been the most dynamic, but also those that have more weight in the German export structure. The branches of HT and MHT contribute with about 70% of manufactured exports, and only MHT category accounts for about half of the sales.
Although the share of this category in the trade within the euro area has decreased by five points over the analysed period, in any other economy of the Monetary Union this group presents a ratio below 40%, which shows that the German economy is clearly specialized (with an index of 1.14 in 2007) in the industries of MHT.
Diving into the disaggregated analysis, it is established that the machinery and automotive industries are those that provide most of the sales of the category of MHT. Only these two branches generate more than one third of the total manufacturing exports and their specialization indices are 1.05 and 1.49, respectively7. The index of specialization within this category is also high in electrical equipment (1.13). Only chemistry has an index lower than 1. In the categories of MLT and LT specialization rates are 0.91 and 0.78, respectively.
It is therefore confirmed that German industry is specialized in branches with high technological content, which in recent years have been particularly dynamic, leading the growth of industrial exports and contributing overwhelmingly to both the amount and the growth of trade surplus.
6 MLT rate is 5.7% while HT rate is 7.7% and MHT rate is 5.3%.7 These results are consistent with those of Belitz et al, 2009.

142 Eduardo Garzón Espinosa, rafaEl fErnándEz sánchEz
table 2: world trade balanceS and exportS ShareS.
Notes: *Export shares expressed as world German exports divided by Eurozone exports.
3.2. exportS, prodUctivity and Unit laboUr coSt: an imperfect relationShip.
Table 1 shows that the branches of HT and MHT were precisely those that more have increased their productivity over the analysed period. In the branches of HT, where there are no job losses, productivity grew at an annual rate of 7.3%, especially standing out the branch of ‘communication equipment’, with a rate greater than 14.2%. In MHT the growth was not that strong (4.7%), but it was clearly above the industrial average. Growth rates were 2.3% and 5.2% in machinery and automotive, respectively. At the opposite side, all the branches with lower technological content presented significant job losses and, nevertheless, very moderate growth in productivity.

143
Revista de economía mundial 43, 2016, 133-160
unit labouR costs in the success of GeRman expoRts (1999-2007)
Conversely, unit wages grew at an above-average rate in high technology industries (3% in HT and 3.1% in MHT), while the branches of MLT and LT had rates of 1.4% and 1.6% respectively. The fastest growing branches were pharmacy (4.7%), electrical equipment (3.9%), automotive (3.8%) and communication equipment (3.6%). In the categories of MLT and LT only petroleum and oil derivatives, apparel and leather derivatives had rates higher than average.
Thus, the analysis by categories seems to confirm the intuition that export growth is positively related to productivity, but not to the evolution of wages. However, using a disaggregated analysis by branches it is easy to see that the trend in exports does not directly correspond with the behaviour of productivity, or with the ratio formed by the variation in productivity and unit labour costs. As shown in Table 1, unit wage grew below productivity in most of the branches, but the export behaviour of these branches was very heterogeneous, recording some growth rates much higher than the average and other rates well below average. Even more striking is that some of the most dynamic branches with regard to exports were of the few in which the unitary wage rose above productivity. The case of finished metal products and food is especially shocking because the productivity grew less than the industry average and below the growth in unit wage, recording however strong export growth.
These inconsistent results are mainly explained by the lack of a mirror with which to compare the different rates of growth. The strong productivity growth of an industry will not necessarily translate into higher export growth if that productivity growth has been common in the same industry in the other countries. Likewise, a reduction in the unit labour costs of a branch does not have to lead to an improved export performance if that reduction was smaller than that of the other countries with which Germany competes. Finally, the strong export growth of a branch may be attenuated if it is found that this rate is similar to that of other economies.
4. Germany trade with major economieS of the eUro area: differentiated featUreS.
To avoid the problem identified in the previous section, Germany´s indicators are placed in relation to the four largest economies of the Eurozone: Spain, Italy, France and the Netherlands. The fact that these four economies have distinct features (both in the composition of trade and in the sign and composition of the balance) adds interest to the results obtained from the analysis.
Firstly, Spain and Italy are well settled in the typical German export pattern described in the previous section. German sales to these two countries consist mainly of HT and MHT products, especially the second ones, which represents 56% of the sales to Spain and 49% of the exports to Italy. Within this category the strong presence of the automotive industry highlights in both countries (about 25%), followed by non-electrical machinery.

144 Eduardo Garzón Espinosa, rafaEl fErnándEz sánchEz
Similarly, trade balances have almost identical features in the two countries: surpluses have been increasing during the period and they stem mainly from the rapid growth of German exports against the more moderate increase in imports. Given a similar increase in sales (around 25 billion euros), the smallest increase in purchases from Spain explains why the surplus with this country has grown faster and is much higher than the one with Italy. Most of the German surplus and of their largest increases with both countries are explained by trade in products of MHT and, within these, by the automotive, with great weight in exports and reduced in imports. The surplus generated by the machinery is also important vis-à-vis Spain. HT and MLT products also contributed to the German surplus with regard to both countries; while LT branches have inverted the previous deficit balance that they had with Spain and reduced the amount of commercial deficit with Italy.
Regarding France, German sales also are mostly composed by HT and MHT products, but the presence of products of HT is much higher (26%) due to the importance of the aeronautics (13%) under the collaboration of the EADS Airbus project. In return, the prevalence of MHT products is lower due to the less prominent presence of the automotive, equivalent to the machinery’s weight.
table 3: German trade balanceS in billionS of eUroS and exportS weiGhtS in percentaGeS.
Source: Compiled from data from EU KLEMS and COMEXT.Notes: *World exports.
Source: Compiled from data from EU KLEMS and COMEXT. Notes: *World exports The favourable German trade balance with respect to France has also increased over the period, but its magnitude is smaller than that with Italy and Spain: German exports to the Gallic country have grown more than those to the two southern countries, but imports have grown much more. At the same time the contribution to the increase in the surplus with France differs from the presented balance with Spain and Italy, since the categories that have most changed the balance are the products of HT and LT. Thus, although the balance of MHT products favourable to Germany continues being the highest, the sharp increase in HT products is noteworthy. The surplus of MLT is minor. The MHT category sustains surplus in machinery and only marginally in automotive, unlike the trade with Italy and Spain, while they coincide with the deficit sign of electrical equipment. The surplus featured in HT is based on specialized instrument and aeronautics. On the bottom, basic metal and rubber-plastics sustain the positive balances, while the German deficit is relevant in non-metallic minerals as well as in food, textile and clothing. German sales to the Netherlands have markedly different features from those destined to the three previous countries: there is only a slight predominance of HT-MHT products against those of MLT-LT composition, along with a balanced allocation between these last two. The lower prevalence of MHT products (33%) is due to a relatively minor participation of automotive and machinery, with rates of around 10%. The significant presence of HT products (although lower than in France) is due to the weight of pharmaceuticals and specialized equipment. The greater involvement of MLT products (25%) and LT goods (22%) is mainly due to metallurgy, petroleum and

145
Revista de economía mundial 43, 2016, 133-160
unit labouR costs in the success of GeRman expoRts (1999-2007)
The favourable German trade balance with respect to France has also increased over the period, but its magnitude is smaller than that with Italy and Spain: German exports to the Gallic country have grown more than those to the two southern countries, but imports have grown much more. At the same time the contribution to the increase in the surplus with France differs from the presented balance with Spain and Italy, since the categories that have most changed the balance are the products of HT and LT. Thus, although the balance of MHT products favourable to Germany continues being the highest, the sharp increase in HT products is noteworthy. The surplus of MLT is minor. The MHT category sustains surplus in machinery and only marginally in automotive, unlike the trade with Italy and Spain, while they coincide with the deficit sign of electrical equipment. The surplus featured in HT is based on specialized instrument and aeronautics. On the bottom, basic metal and rubber-plastics sustain the positive balances, while the German deficit is relevant in non-metallic minerals as well as in food, textile and clothing.
German sales to the Netherlands have markedly different features from those destined to the three previous countries: there is only a slight predominance of HT-MHT products against those of MLT-LT composition, along with a balanced allocation between these last two. The lower prevalence of MHT products (33%) is due to a relatively minor participation of automotive and machinery, with rates of around 10%. The significant presence of HT products (although lower than in France) is due to the weight of pharmaceuticals and specialized equipment. The greater involvement of MLT products (25%) and LT goods (22%) is mainly due to metallurgy, petroleum and oil derivatives, and products made of non-metallic minerals in the first case (MLT), and due to food products, textiles and clothing in the second one (LT).
Therefore, the negative sign in the trade balance is more explained by the side of German imports
The trade deficit associated to the Netherlands stems from an increase in sales similar to the one experienced with the other three countries, but offset by a much higher growth in purchases. Therefore, the negative sign in the trade balance is more explained by the increase of German imports (40 billion euros) than by the rise of its exports (increased by 27 billion). The negative balance was of nearly 24 billion in 2007, doubling the amount recorded in 1999. The deficit is registered in the four product categories and at most branches except for automotive, pharmacy, specialized equipment, metal finishes and a few more. Deficits are high in some MLT branches such as petroleum derivatives, non-metallic minerals and metallurgy. But they are also important in the majority of MHT branches (chemical products, non-electrical machinery and electrical equipment), in two of the HT branches (communications equipment and computers); and in most of the LT sub-divisions (food, textiles and clothing).
Ultimately, two conclusions that are useful for subsequent analysis about German trade with these four countries can be drawn. The first one is that trade balances are significantly disparate: very strong in relation to Spain and Italy, moderated with France, and negative with regard to the Netherlands.

146 Eduardo Garzón Espinosa, rafaEl fErnándEz sánchEz
But these differences are not derived unilaterally or mainly from German exports, but mostly from its imports. The second conclusion is that the relative composition of German exports presents considerable variations even though their fates are four developed economies. With respect to Spain and Italy the export structure corresponds with the general pattern, while in what it concerns to France the greater relative share of high-tech industries highlights. The composition of trade with the Netherlands is the most special since it is very different from what in principle one would expect of the trade between two of the most developed economies in the monetary area.
5. exportS and Unit laboUr coStS in German trade with Spain, italy, france and netherlandS.
The analysis presented below relates the evolution of German exports by branch to the four selected countries and with relative variations of ULC. The results are shown in tables, combining the export behaviour in rows and the evolution of ULC in columns. In the rows, branches are classified into two groups, depending on whether the growth rate of German exports to the selected country is higher or lower than the growth rate of the world exports of that branch destined to that country. In the columns, manufacturing branches are sorted according to the evolution of German ULC vis-à-vis their partners’ ratios and by a dual breakdown. Firstly, the branches are classified into two groups depending on whether the German relative ULC increases or decreases. Secondly, there are three different subgroups depending on whether the evolution of the ratio was due to changes in productivity, wages, or both variables.
This analysis is shown in Table 4 for the four manufacturing categories. The main relevant results that can be drawn are:
a) From the point of view of the evolution of ULC, it is found that the German ULC declined in 14 of the 16 analysed cases. By country and category, the highlighted findings are:
1) Vis-à-vis Spain and Italy, Germany scored advantages in every category. These advantages combined improvements in unit wage and productivity or solely in productivity in 7 of the 8 analysed cases. 2) With respect to France and the Netherlands, Germany scored advantages in 6 of the 8 analysed cases. In the 6 cases wherein a drop of German ULC was recorded, the advantage is well explained by a lower growth in unit wage in the categories of MLT and LT (which together account for 32.1% of sales to France and 47.1% to the Netherlands) or by a lower wage growth along with higher productivity growth in MHT (France) and HT (Netherlands). None of the cases is explained solely by the higher productivity growth in Germany.3) The remaining two cases are only narrowly worse in ULC: The
147
Revista de economía mundial 43, 2016, 133-160
unit labouR costs in the success of GeRman expoRts (1999-2007)
difference is 0.08 in the category of HT facing France and 0.13 in MHT versus Netherlands. They are, however, two very relevant cases given their weight in the export composition: 26.5% and 32.6% respectively. In both cases these results were due solely to the worse performance of the German relative productivity.4) Therefore, the analysis by categories seems to show that German wages increased more moderately than those of France and the Netherlands. This fact played a more decisive role than productivity in explaining the evolution of ULC. By contrast, productivity differentials for Germany were clearly more decisive than the wage gap in relation to Spain and Italy.
b) From the point of view of the relationship between the evolution of ULC and the better/worse export performance of each category (measured by the differential between the growth rate of German exports to the country and the growth rate of world imports from that country), a positive correspondence is observed in 10 of the 16 analysed cases. By country and category, the highlighted findings are:
1) 4 of the 6 exceptions correspond to the category of MLT. The sales of these products registered a negative relationship between ULC and export performance in the four countries. Vis-à-vis Spain and Italy, the fall of German ULC is more intense and results from differences in both productivity and wages; while when facing France and the Netherlands the advantage is more modest and it only corresponds to wages. However, in the four countries these declines are accompanied by a very negative difference between the imports from Germany and those from the rest of the world: -5%, -4.3%, -1.9% and -2.5% respectively. This result could be explained by the insensitiveness of MLT products to changes in relative ULC8 and/or by a reduction in ULC much more notorious in other competing economies than in Germany.
2) The other two cases in which the export-ULC relationship is negative are found in relations with France, whereby only LT products show a positive correlation between the evolution of the export and the ULC quota. For the HT category, the increase in the ULC ratio is accompanied by a positive differential of exports, although the increase is very small. For the category of MHT, the worse performance of ULC is complemented by a negative differential, although that differential is very close to zero.
8 In this category are included products such as petroleum and oil derivatives, rubber-plastics and non-metallic minerals derivatives, which by nature have a fairly stable demand due to their importance for the production cycle and to its exclusivity.

148 Eduardo Garzón Espinosa, rafaEl fErnándEz sánchEz
table 4: relationShip between the evolUtion of Ulc and export performance. analySiS by cateGorieS.
Source: Compiled from data from EU KLEMS and COMEXT. Notes: Differential in German exports to the respective country and world imports of that country in the first parenthesis and evolution of the ULC-ratio in the second one.
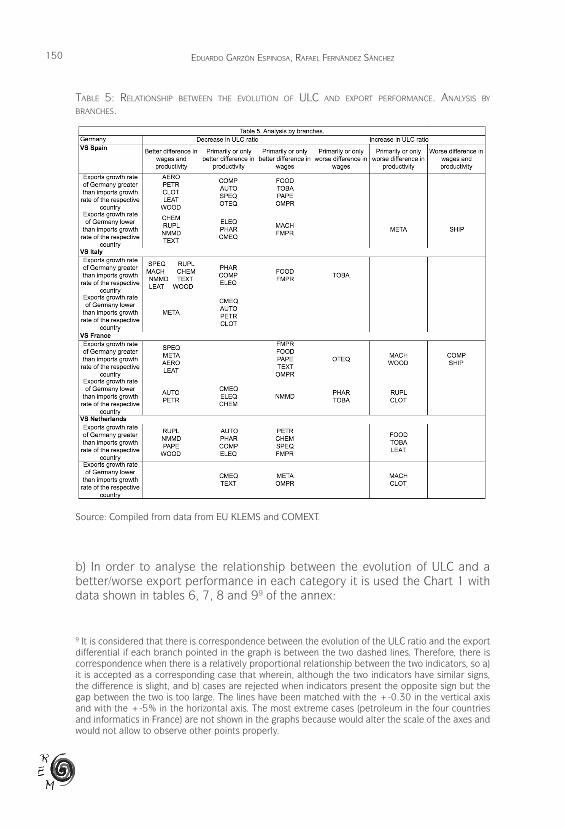
When the same analysis is performed by manufacturing branches, casuistry becomes wider because the number of cases rises to 89. However, Table 5 confirms substantially the same outstanding features in what it respects to the four categories. The main extracted results are:
a) From the point of view of the evolution of ULC, Germany shows a decrease in the ratio of 71 of the 89 analysed cases. By country and branches, the highlighted outcomes are as follows:
MLT products to changes in relative ULC8 and/or by a reduction in ULC much more notorious in other competing economies than in Germany.
TABLE 4: RELATIONSHIP BETWEEN THE EVOLUTION OF ULC AND EXPORT PERFORMANCE. ANALYSIS BY CATEGORIES.
Source: Compiled from data from EU KLEMS and COMEXT Notes: Differential in German exports to the respective country and world imports of that country in the first parenthesis and evolution of the ULC-ratio in the second one.
2) The other two cases in which the export-ULC relationship is negative are found in relations with France, whereby only LT products show a positive correlation between the evolution of the export and the ULC quota. For the HT category, the increase in the ULC ratio is accompanied by a positive differential of exports, although the increase is very small. For the category of
8In this category are included products such as petroleum and oil derivatives, rubber-plastics and non-metallic minerals derivatives, which by nature have a fairly stable demand due to their importance for the production cycle and to its exclusivity.

149
Revista de economía mundial 43, 2016, 133-160
unit labouR costs in the success of GeRman expoRts (1999-2007)
1) In relation to Spain and Italy there are only 3 of 44 cases in which there is an increase of German ULC (with a very small weight in the total exports of 4.3% and 0.8%, respectively), whereas in reference to France and the Netherlands there are 9 and 5 cases (exporting weight of these exceptions is approximately 26% for both countries).
2) The better performance of German ULC is primarily based on the greater productivity growth or both productivity and unit wage growth, although not in the same degree for every country. The benefit only or primarily based on productivity is more important vis-à-vis Spain and Italy (7 cases per country, 51% of exports to Spain and 38% of exports to Italy) than regarding France (3 cases; 13% of the exports) or the Netherlands (6 cases, 28%). The same applies to the advantage from both variables: 9 cases in Spain and in Italy (though the first country only accounts for 18% of the exports, while the second represents the 46%), 6 in France (43%) and 4 in the Netherlands (13%). On the other hand, the advantage only or primarily based on the unitary wage occurs in 6 cases with regard to Spain (accounting for 27% of exports), 2 vis-à-vis Italy (11% of exports), 6 in what it concerns to France (16%), and 6 regarding the Netherlands (34%).3) Wage differentials were decisive for Germany in the branches belonging to the categories of MLT and LT of the four countries. All branches in which the ULC is reduced only through wages belong to the categories of LT and MLT, except for the case of machinery concerning Spain and chemistry and specialized equipment regarding Netherlands. At the same time, productivity differentials were generally determinant for Germany in the branches belonging to the categories of HT and MHT.4) Within the 17 cases in which the Germans increased ULC, 9 were with respect to France and 5 vis-à-vis the Netherlands, whereas only 2 were facing Spain and 1 with respect to Italy. Regarding the Netherlands, the disadvantage was due solely to productivity and only one of the branches (machinery) does not belong to the categories of MLT and LT. Versus France the decrease in the ULC ratio was caused by a German disadvantage exclusively in productivity for 4 of 9 cases (again machinery included) while 2 were caused by both variables and 3 were due to the disadvantage only based in unit wages. 5) Overall, the analysis by branches shows that Germany clearly outstripped Spain and Italy in productivity and also (although in a less widespread manner) in wages; while it surpassed Netherlands and France in wages and also (although in a less widespread way) in productivity. This conclusion confirms and clarifies the results that were obtained in the aggregate analysis by categories, which suggested that the German advantage over France and the Netherlands lay almost exclusively on wages.
150 Eduardo Garzón Espinosa, rafaEl fErnándEz sánchEz
table 5: relationShip between the evolUtion of Ulc and export performance. analySiS by brancheS.
Source: Compiled from data from EU KLEMS and COMEXT.
b) In order to analyse the relationship between the evolution of ULC and a better/worse export performance in each category it is used the Chart 1 with data shown in tables 6, 7, 8 and 99 of the annex:
9 It is considered that there is correspondence between the evolution of the ULC ratio and the export differential if each branch pointed in the graph is between the two dashed lines. Therefore, there is correspondence when there is a relatively proportional relationship between the two indicators, so a) it is accepted as a corresponding case that wherein, although the two indicators have similar signs, the difference is slight, and b) cases are rejected when indicators present the opposite sign but the gap between the two is too large. The lines have been matched with the +-0.30 in the vertical axis and with the +-5% in the horizontal axis. The most extreme cases (petroleum in the four countries and informatics in France) are not shown in the graphs because would alter the scale of the axes and would not allow to observe other points properly.
5) Overall, the analysis by branches shows that Germany clearly outstripped Spain and Italy in productivity and also (although in a less widespread manner) in wages; while it surpassed Netherlands and France in wages and also (although in a less widespread way) in productivity. This conclusion confirms and clarifies the results that were obtained in the aggregate analysis by categories, which suggested that the German advantage over France and the Netherlands lay almost exclusively on wages.
TABLE 5: RELATIONSHIP BETWEEN THE EVOLUTION OF ULC AND EXPORT PERFORMANCE. ANALYSIS BY BRANCHES.
Source: Compiled from data from EU KLEMS and COMEXT b) In order to analyse the relationship between the evolution of ULC and a better/worse export performance in each category it is used the Chart 1 with data shown in tables 6, 7, 8 and 99 of the annex:
9 It is considered that there is correspondence between the evolution of the ULC ratio and the export differential if each branch pointed in the graph is between the two dashed lines. Therefore, there is correspondence when there is a relatively proportional relationship between the two indicators, so a) it is accepted as a corresponding case that wherein, although the two indicators have similar signs, the difference is slight, and b) cases are

151
Revista de economía mundial 43, 2016, 133-160
unit labouR costs in the success of GeRman expoRts (1999-2007)
These are the main results:1) The correspondence between ULC and the export differentials are verified in 13 of the 24 branches in the case of Spain (accounting for 52% of exports), in 11 of the 20 branches in regard to Italy (62.6%), in 15 of the 24 branches in the case of France (69.5%) and in 16 of the 21 branches when considering the Netherlands (74.4%). That is, the positive correspondence is majoritarian in the four cases but not in the same way, placing the Netherlands in the first place and Spain in the last one. The worse fit of relations with Spain is due to ULC falls ‘too’ large in relation to the low gain (or even slight reduction) of the export quota.2) Within the 32 cases in which there is no correspondence, most are in the categories of HT and MLT: 11 and 10, respectively. In the analysis by categories we had already found this anomaly in the case of MLT, but not for the HT. The mismatch in the branches of MHT and LT are rare: 5 and 6, respectively.3) These cases of mismatch are distributed relatively homogeneously per categories in the four economies. The only difference is in Italy, where the LT branches prevail against the rest: 3 versus 2 of the others.4) The branches of communication equipment (HT) and petroleum (MLT) have a mismatch in relation to the four economies, and it is very high in the second case. Other branches that repeat twice the mismatch are base metals, pharmaceuticals, rubber-plastics, textiles, specialized equipment, tobacco, clothing and computers.
Therefore, cases in which there is no correspondence between the evolution of the ULC ratio and the differential in exports are a minority, being more important those regarding Spain and Italy than the ones concerning France and, above all, the Netherlands. Instead, the mismatch is starring by branches of HT and MLT, especially in the fields of communication equipment and petroleum. It could be deduced that in these branches sales are not very sensitive to changes in ULC or that other economies have reduced their ULC much more than Germany.
In relation to the latter issue, it should be added a reflection about the method of analysis used. The bilateral study of ULC is useful to know which of the two economies involved has done better than the other, but it ignores how well or badly the rest of competing economies have done it. It is incorrect to conclude that if Germany gets ULC advantages against the Netherlands, sales to that economy will necessarily increase. It may be that, although Germany has done better than the Dutch economy, there are other economies that have done even better, and therefore they may be able to attract the purchases from Netherlands. The same is true in reverse: the German loss of ULC advantage against the Netherlands does not mean a reduction of their sales, because the rest of competing economies may have lost even more ground. Therefore, bilateral relations do not exhaust the analysis of relations between ULC and exports.

152 Eduardo Garzón Espinosa, rafaEl fErnándEz sánchEz
chart 1: relationShip between the evolUtion of the Ulc ratio and export performance aGainSt Spain, italy, france and the netherlandS.
mean a reduction of their sales, because the rest of competing economies may have lost even more ground. Therefore, bilateral relations do not exhaust the analysis of relations between ULC and exports. CHART 1: RELATIONSHIP BETWEEN THE EVOLUTION OF THE ULC RATIO AND EXPORT PERFORMANCE AGAINST SPAIN, ITALY, FRANCE AND THE NETHERLANDS.
Source: Compiled from data from EU KLEMS and COMEXT However, the bilateral approach yields concordant results with the formulation of the hypothesis that is part of the working paper: the possible competitive advantage of Germany, derived from the decline of unit labour costs in manufacturing, is mainly due to a growth of its productivity and therefore is not necessarily due to the fall or weak growth of unit wages. However, it is necessary to make two important clarifications. The first one is that what has been previously stated is especially true for HT and MHT industries (since it is in these that productivity growth is outstanding) and therefore for the countries to which Germany predominantly exports such products (as Spain, Italy and France), but not for both MLT and LT branches (with moderated productivity growth) and therefore nor for the countries in which these branches are relatively more important in bilateral trade (as Netherlands). The second one is that advantages in the ULC ratio against economies such as Spain and Italy are also due to the very poor productivity growth of their manufacturing branches, not just because of the good German performance. Precisely for this reason some of the German branches that go well in terms of ULC evolution in comparison to Spain and Italy loose when they are contrasted with France or the Netherlands, whose productivity gains are much more prominent than the former. 6. CONCLUSIONS. After analysing the export performance of the German economy during the period 1999-2007 in relation to the components of unit labour costs, a main conclusion is drawn: the favourable German export dynamic was positively related to the development of unit labour costs primarily through the productivity performance and not via the evolution of wages. This is especially true for HT and MHT industries

153
Revista de economía mundial 43, 2016, 133-160
unit labouR costs in the success of GeRman expoRts (1999-2007)
Source: Compiled from data from EU KLEMS and COMEXT.
However, the bilateral approach yields concordant results with the formulation of the hypothesis that is part of the working paper: the possible competitive advantage of Germany, derived from the decline of unit labour costs in manufacturing, is mainly due to a growth of its productivity and therefore is not necessarily due to the fall or weak growth of unit wages.
However, it is necessary to make two important clarifications. The first one is that what has been previously stated is especially true for HT and MHT industries (since it is in these that productivity growth is outstanding) and therefore for the countries to which Germany predominantly exports such products (as Spain, Italy and France), but not for both MLT and LT branches (with moderated productivity growth) and therefore nor for the countries in which these branches are relatively more important in bilateral trade (as Netherlands). The second one is that advantages in the ULC ratio against economies such as Spain and Italy are also due to the very poor productivity growth of their manufacturing branches, not just because of the good German performance. Precisely for this reason some of the German branches that go well in terms of ULC evolution in comparison to Spain and Italy loose when they are contrasted with France or the Netherlands, whose productivity gains are much more prominent than the former.
6. conclUSionS.
After analysing the export performance of the German economy during the period 1999-2007 in relation to the components of unit labour costs, a main conclusion is drawn: the favourable German export dynamic was positively related to the development of unit labour costs primarily through the productivity performance and not via the evolution of wages. This is especially true for HT and MHT industries where productivity growth (and
Source: Compiled from data from EU KLEMS and COMEXT However, the bilateral approach yields concordant results with the formulation of the hypothesis that is part of the working paper: the possible competitive advantage of Germany, derived from the decline of unit labour costs in manufacturing, is mainly due to a growth of its productivity and therefore is not necessarily due to the fall or weak growth of unit wages. However, it is necessary to make two important clarifications. The first one is that what has been previously stated is especially true for HT and MHT industries (since it is in these that productivity growth is outstanding) and therefore for the countries to which Germany predominantly exports such products (as Spain, Italy and France), but not for both MLT and LT branches (with moderated productivity growth) and therefore nor for the countries in which these branches are relatively more important in bilateral trade (as Netherlands). The second one is that advantages in the ULC ratio against economies such as Spain and Italy are also due to the very poor productivity growth of their manufacturing branches, not just because of the good German performance. Precisely for this reason some of the German branches that go well in terms of ULC evolution in comparison to Spain and Italy loose when they are contrasted with France or the Netherlands, whose productivity gains are much more prominent than the former. 6. CONCLUSIONS. After analysing the export performance of the German economy during the period 1999-2007 in relation to the components of unit labour costs, a main conclusion is drawn: the favourable German export dynamic was positively related to the development of unit labour costs primarily through the productivity performance and not via the evolution of wages. This is especially true for HT and MHT industries

154 Eduardo Garzón Espinosa, rafaEl fErnándEz sánchEz
also the wage rate) was very noticeable, and not for both MLT and LT branches where the evolution of productivity and unit wage was very modest. The key is that HT and MHT products represent the most prominent share of the German exports and explain the most prominent increase of exports during the analysed period.
On the other hand, analysis of Germany’s trade relations with key countries in the Euro Zone reveals two outcomes. First, trade balances are not only explained by the increase in exports, but also (and sometimes significantly) by the development of imports. Second, the German export success is not explained in the same way with regard to economies such as Italy and Spain (whose productivity growth was very moderate) than regarding French and Dutch economies (whose productivity growth was more dynamic).
These results are especially important because they contradict some misunderstandings relatively widespread in trade literature (Felipe and Kumar, 2011; Wray, 2012; Bibow, 2012; Alonso, 2013; Armingeon, 2012). The first one is to ignore or underestimate the importance of productivity when explaining the gains in competitiveness, thus just erroneously concluding that the German advantages are primarily due to a reduced wage growth. The second one is to conceive price differentials as the major determinants of trade relations, when in fact much of the trade depends on factors different from the price, such as the diverse production and export structures of economies and the strategies of product differentiation. This is particularly relevant in the German economy because it is highly specialized in products with high technological content, which are less susceptible to compete via price.
The results of this study demonstrate the importance of taking into account the productive structure of the economies when foreign trade is analysed. This case is a modest and tentative study that attempts to shed some light on this issue. The door for other inquiries about how to improve the study of the relationship between productive structure and foreign trade is open, as well as for researches on how to identify and analyse other factors that can best explain the commercial behaviour of economies (activities of transnational corporations, styles of growth, trends in imports...).
7. referenceS
Alonso, L. (2013): ‘El euro, en entredicho’, Ágora Económica, Espacio Público.Armingeon, K. and Baccaro, L. (2012): ‘Political Economy of the Sovereign
Debt Crisis: The Limits of Internal Devaluation’, Industrial Law Society.Belitz, H., Clemes, M., and Gornig, M. (2009): ‘Germany’s Technological
Specialization Assures Growth Opportunities’, Weekly Report, German Institute for Economic Research, Vol. 5, Berlin, Germany.
Bianco, C. (2007): ‘¿De qué hablamos cuando hablamos de competitividad?’, Centro de Estudios sobre ciencia, Desarrollo y Educación Superior, Working Paper No. 31.

155
Revista de economía mundial 43, 2016, 133-160
unit labouR costs in the success of GeRman expoRts (1999-2007)
Bibow, J. (2012): ‘The Euro Debt Crisis and Germany’s Euro Trilemma’, Levy Economics Institute of Bard College, Working Paper No. 721.
Caetano, J. And Galego, A. (2006): ‘In Search for Determinants of Intra-Industry Trade within an Enlarged Europe’, Universidad de Évora, Documento de trabajo nº 2006/02.
Cesaratto, S. (2012): ‘La crisis sin fin de la eurozona: una visión clásica-kaleckiana’, Papeles de relaciones ecosociales y cambio global, pp. 69-88.
Chesnais, F. (1991): ‘Competitividad internacional y gastos militares’, Ministerio de Defensa. Centro de publicaciones, Barcelona.
Chudnovsky, D. and Porta, F. (1990): ‘La competitividad internacional. Principales cuestiones conceptuales y metodológicas’, Centro de Estudios e Investigación de Postgrado (CEIPOS), Universidad de la República, Uruguay.
Cicowiez, M. and Galperín, C. (2005): Análisis cuantitativo de cambios en las cuotas arancelarias: el caso de las exportaciones de carne vacuna a la UE, Centro de Economía Internacional y Universidad de la Plata.
Coriat, B. (1997): ‘Los desafíos de la competitividad’, Asociación Trabajo y Sociedad, Oficina de Publicaciones del CBC-UBA, Buenos Aires, February, p. 9.
Fajnzylber F. (1988): ‘Competitividad internacional, evolución y lecciones’, Revista de la CEPAL, Number 36, December, Santiago de Chile.
Felipe, J. and Kumar, U. (2011): ‘Unit Labor Costs in the Eurozone: The Competitiveness Debate Again’, Levy Economics Institute of Bard College, working paper Number 651.
Fontagné L. and Freudenberg, M. (1999): ‘Marché unique et développement des échanges’, Économie et Statistique, number 326-327, pp. 71-95.
Garzón, A. (2011): ‘Costes laborales y distribución de la renta: explicación completa para no economistas’, blog Pijus Economicus, June 26.
Gauron, A. and Billaudot, B. (1987): ‘Crecimiento y Crisis. Hacia un nuevo crecimiento’. Siglo XXI de España, Madrid.
Giannitsis, T. and Kager, M. (2009): ‘Technology and Specialization: Dilemmas, Options and Risks?’, Expert group ‘Knowledge for Growth’.
Gracia, M. (2011): ‘Crisis y asimetrías estructurales en la UE: el caso de Alemania y España’, XIV Reunión Económica Mundial, Comercio e Inversión.
Gutiérrez, C. (2011): ‘Competitividad y costes laborales en España’, Fundación 1º de mayo, Madrid.
Hein, E. (2012): ‘The Crisis of Finance-dominated Capitalism in the Euro Area, Deficiencies in the Economic Policy Architecture, and Deflationary Stagnation Policies’, Levy Economics Institute of Bard College, Working paper no 734.
Krugman, P. (1996): ‘Making sense of the competitiveness debate’, Oxford Review of Economic Policy, Vol 12, Number 3.
Krugman, P. and Obstfeld, M. (2006): Economía internacional. Teoría y política., Pearson/Addison Wesley, Madrid, 7 edition, chapter 1.
156 Eduardo Garzón Espinosa, rafaEl fErnándEz sánchEz
Landesmann, L. (2003): ‘Rasgos estructurales de la integración en una Europa ampliada: convergencia económica y especialización industrial’, in La Quinta Ampliación de la Unión Europea, Number 809. Manufactured Exports, 1995–98’, Oxford Development Studies, 28(3): 337–369.
Ministry of Economics and Technology of Germany (2010): ‘In focus: Germany as a competitive industrial nation’, General Economic Policy, Industrial Policy.
Palazuelos, E. and Fernández, R. (2008): ‘Demand, employment, and labour productivity in the European economies’, Structural Change and Economic Dynamics.
Porter, M. (1991): ‘La ventaja competitiva de las naciones’, Revista Facetas, Number 91.
Wray, L. R. (2012): ‘Imbalances? What Imbalances? A Dissenting View’, Levy Economics Institute of Bard College, Working Paper No. 704.
Rodrik, R. (2006): ‘What’s So Special About China’s Exports?’, China & World Economy, 14(5): 1-19.
Sanabria, A. (2013): ‘Algunos apuntes en torno al mito de la competitividad en España’, Debate Económico, Fundación 1º de Mayo.
Ubide, A. (2013) "Reengineering EMU for an Uncertain world" Peterson Institute for International Economics, number PB13-4.
157
Revista de economía mundial 43, 2016, 133-160
unit labouR costs in the success of GeRman expoRts (1999-2007)
8. annex
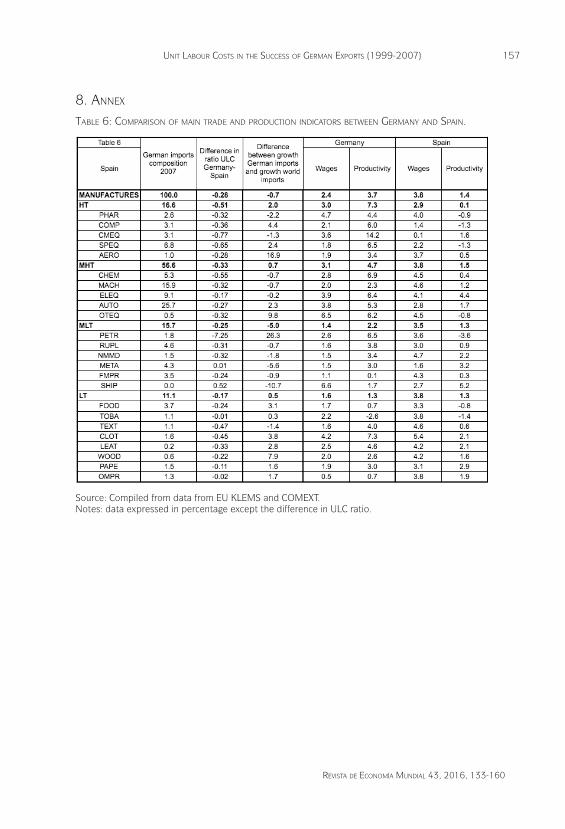
table 6: compariSon of main trade and prodUction indicatorS between Germany and Spain.
Source: Compiled from data from EU KLEMS and COMEXT.Notes: data expressed in percentage except the difference in ULC ratio.
Source: Compiled from data from EU KLEMS and COMEXT. Notes: data expressed in percentage except the difference in ULC ratio. TABLE 7: COMPARISON OF MAIN TRADE AND PRODUCTION INDICATORS BETWEEN GERMANY AND ITALY.

158 Eduardo Garzón Espinosa, rafaEl fErnándEz sánchEz
table 7: compariSon of main trade and prodUction indicatorS between Germany and italy.
Source: Compiled from data from EU KLEMS and COMEXT.Notes: data expressed in percentage except the difference in ULC ratio; ND: no data available.
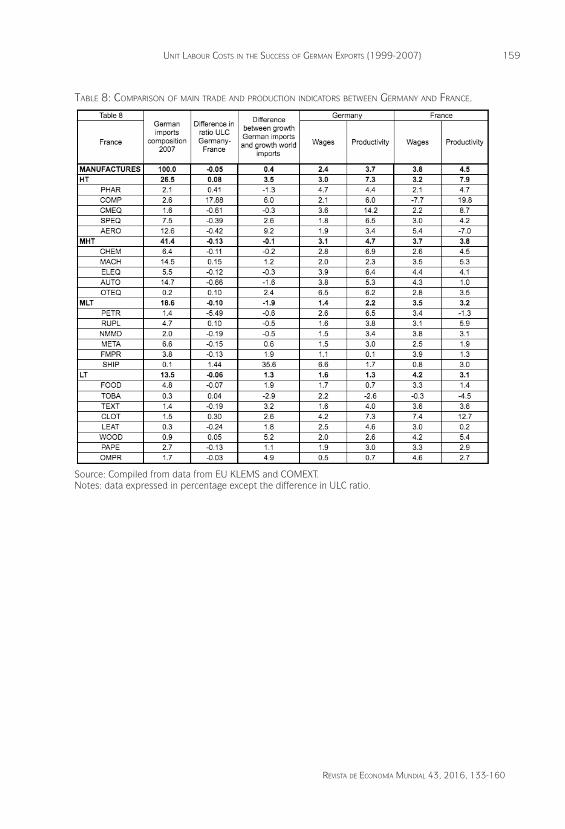
Source: Compiled from data from EU KLEMS and COMEXT. Notes: data expressed in percentage except the difference in ULC ratio; ND: no data available. TABLE 8: COMPARISON OF MAIN TRADE AND PRODUCTION INDICATORS BETWEEN GERMANY AND FRANCE.
159
Revista de economía mundial 43, 2016, 133-160
unit labouR costs in the success of GeRman expoRts (1999-2007)
Source: Compiled from data from EU KLEMS and COMEXT. Notes: data expressed in percentage except the difference in ULC ratio. TABLE 9: COMPARISON OF MAIN TRADE AND PRODUCTION INDICATORS BETWEEN GERMANY AND THE NETHERLANDS.
table 8: compariSon of main trade and prodUction indicatorS between Germany and france.
Source: Compiled from data from EU KLEMS and COMEXT.Notes: data expressed in percentage except the difference in ULC ratio.

160 Eduardo Garzón Espinosa, rafaEl fErnándEz sánchEz
table 9: compariSon of main trade and prodUction indicatorS between Germany and the netherlandS.
Source: Compiled from data from EU KLEMS and COMEXT.Notes: data expressed in percentage except the difference in ULC ratio; ND: no data available.
Source: Compiled from data from EU KLEMS and COMEXT Notes: data expressed in percentage except the difference in ULC ratio; ND: no data available.