ISSI 2005 MS-Word Template for Submission of...
19
.Boyack, Kevin W., Katy Börner, Richard Klavans. 2009 Mapping the Structure and Evolution of Chemistry Research. Scientometics, 79,1: 45-60 Digital Object Identifier (DOI): 10.1007/s11192-009-0403-5 Mapping the Structure and Evolution of Chemistry Research Kevin W. Boyack * , Katy Börner ** and Richard Klavans *** * [email protected] * Sandia National Laboratories, P.O. Box 5800, MS-1316, Albuquerque, NM 87185, USA 1 SciTech Strategies, Inc., Albuquerque, NM 87122, USA ** [email protected] SLIS, Indiana University, 10 th Street and Jordan Avenue, Bloomington, IN 47405, USA *** [email protected] SciTech Strategies, Inc., Berwyn, PA 19312, USA Abstract How does our collective scholarly knowledge grow over time? What major areas of science exist and how are they interlinked? Which areas are major knowledge producers; which ones are consumers? Computational scientometrics – the application of bibliometric/scientometric methods to large-scale scholarly datasets – and the communication of results via maps of science might help us answer these questions. This paper represents the results of a prototype study that aims to map the structure and evolution of chemistry research over a 30 year time frame. Information from the combined Science (SCIE) and Social Science (SSCI) Citations Indexes from 2002 was used to generate a disciplinary map of 7,227 journals and 671 journal clusters. Clusters relevant to study the structure and evolution of chemistry were identified using JCR categories and were further clustered into 14 disciplines. The changing scientific composition of these 14 disciplines and their knowledge exchange via citation linkages was computed. Major changes on the dominance, influence, and role of Chemistry, Biology, Biochemistry, and Bioengineering over these 30 years are discussed. The paper concludes with suggestions for future work. Keywords Mapping chemistry; journal mapping; dynamics; diffusion; Introduction Chemistry is a field that is undergoing significant change. Interdisciplinary research has increased over time and the lines 1 . This work was supported by NSF award CHE-052466. Sandia is a multiprogram laboratory operated by Sandia Corporation, a Lockheed Martin Company, for the United States Department of Energy under Contract DE-AC04-94AL85000. Color versions of all figures are available from the authors.
Transcript of ISSI 2005 MS-Word Template for Submission of...
.Boyack, Kevin W., Katy Börner, Richard Klavans. 2009Mapping the Structure and Evolution of Chemistry Research.
Scientometics, 79,1: 45-60Digital Object Identifier (DOI): 10.1007/s11192-009-0403-5
Mapping the Structure and Evolution of Chemistry Research
Kevin W. Boyack*, Katy Börner** and Richard Klavans***
* [email protected] * Sandia National Laboratories, P.O. Box 5800, MS-1316, Albuquerque, NM 87185, USA 1
SciTech Strategies, Inc., Albuquerque, NM 87122, USA
** [email protected], Indiana University, 10th Street and Jordan Avenue, Bloomington, IN 47405, USA
*** [email protected] Strategies, Inc., Berwyn, PA 19312, USA
AbstractHow does our collective scholarly knowledge grow over time? What major areas of science exist and how are they interlinked? Which areas are major knowledge producers; which ones are consumers? Computational scientometrics – the application of bibliometric/scientometric methods to large-scale scholarly datasets – and the communication of results via maps of science might help us answer these questions. This paper represents the results of a prototype study that aims to map the structure and evolution of chemistry research over a 30 year time frame. Information from the combined Science (SCIE) and Social Science (SSCI) Citations Indexes from 2002 was used to generate a disciplinary map of 7,227 journals and 671 journal clusters. Clusters relevant to study the structure and evolution of chemistry were identified using JCR categories and were further clustered into 14 disciplines. The changing scientific composition of these 14 disciplines and their knowledge exchange via citation linkages was computed. Major changes on the dominance, influence, and role of Chemistry, Biology, Biochemistry, and Bioengineering over these 30 years are discussed. The paper concludes with suggestions for future work.
KeywordsMapping chemistry; journal mapping; dynamics; diffusion;
IntroductionChemistry is a field that is undergoing significant change. Interdisciplinary research has increased over time and the lines between Chemistry and the life sciences have seemingly blurred. Funding for chemistry-related activities now comes from more than just agencies and organizations that have been historically interested only in the physical sciences. For example, a long-time NIH (U.S. National Institutes of Health) grantee, Dr. Roger Kornberg of the Stanford University School of Medicine, was awarded the 2006 Nobel Prize in Chemistry, illustrating the reach of the life and medical sciences into chemistry.
This paper reports on a pilot study that we undertook to map the structure of Chemistry over time using journal citation patterns. Of particular interest were the interactions between mainstream Chemistry and the fields of Biochemistry, Biology, and Bioengineering, which were presumed to be impinging upon Chemistry. The balance of the paper proceeds as follows. First, we give a brief background on the mapping of science using journals. We then describe the data and processes used to generate our base map of science. Given our need to map the evolution of fields, we describe our method for linking unique journals from additional years into the base map. We then further characterize the maps, and conclude with a discussion of findings and suggestions for future work.
1. This work was supported by NSF award CHE-052466. Sandia is a multiprogram laboratory operated by Sandia Corporation, a Lockheed Martin Company, for the United States Department of Energy under Contract DE-AC04-94AL85000. Color versions of all figures are available from the authors.
BackgroundJournals are a unit of analysis that allows one to understand how science is organized at an aggregated level (Leydesdorff, 1987). Thomson Scientific (TS, formerly ISI) has published the Journal Citation Reports (JCR) for many years now, compiling citation counts between journal pairs that allow for studies of the structure of science.
One of the pioneering journal maps looked at relationships among fields (Narin, Carpenter, & Berlt, 1972). Yet, the majority of such maps have typically focused on single disciplines (Ding, Chowdhury, & Foo, 2000; McCain, 1998; Morris & McCain, 1998; Tsay, Xu, & Wu, 2003). Recently, several larger-scale journal maps have been published. Leydesdorff (2004a) used the 2001 JCR data to map 5,748 journals from the Science Citation Index Expanded (SCIE) and 1,682 journals from the Social Science Citation Index (SSCI) (Leydesdorff, 2004b) in two separate studies. Leydesdorff uses a Pearson correlation on citing counts as the edge weights and the Pajek program for graph layout, progressively lowering thresholds to find articulation points (i.e., single points of connection) between different network components. These network components define journal clusters, which can be considered as disciplines or sub-disciplines. Samoylenko et al. (2006) mapped all journals in the SCIE with an impact factor of 5 or more using minimum spanning trees to show dominant linkages between fields. Leydesdorff (2006) has combined the SCIE and SSCI for a single study. Rather than generating a map of the entire set of journals, he generates centrality measures and shows them in the perspective of local citation environments (small sets of journals where citing is above a certain threshold). Boyack, Klavans & Börner (2005) combined the year 2000 SCIE and SSCI, generating maps of 7,121 journals. They studied the accuracy of maps generated using eight different inter-citation and co-citation similarity metrics, which were compared using an entropy-based measure.
Data and MethodsPrior to this mapping chemistry effort, two of the authors generated a journal-based map of science using the combined SCIE and SSCI from 2002. Although this map has not appeared in a peer-reviewed publication, it has nonetheless been shown in various capacities. In particular, it has been used as a base map on which funding information from several U.S. government agencies has been overlaid. This map, its structure, and the funding overlays are familiar to our project managers, and played a role in generating interest in this project. Thus, we chose to use this particular map as the base map for mapping the structure and evolution of Chemistry.
2002 Base MapThe 2002 journal map was generated using a new multi-step process. This process reduces the effect of over-aggregation due to highly-linked, multidisciplinary journals that tend to distort a journal map because they link to so many other journals in a variety of disciplines. It also helps place journals that might equally well fit in multiple journal clusters. The procedure is as follows:
Bibliographic coupling counts were calculated at the paper level for the 1.07 million papers using the 24.5 million cited references indexed in the 2002 combined data set. These coupling counts were aggregated at the journal level (7,227 journals), thus giving bibliographic coupling counts between pairs of journals. The counts were then normalized using the cosine index to give a similarity value between 0 and 1 for pairs of journals.
Using the top 15 similarity values per journal, the position of each journal was calculated using the VxOrd graph layout algorithm. Previous studies have established the accuracy of VxOrd with a variety of similarity measures for journal mapping (Boyack et al., 2005; Klavans & Boyack, 2006a). Details about the algorithms are also available elsewhere (Davidson, Wylie, & Boyack, 2001; Klavans & Boyack, 2006b).
A breadth value was then calculated for each journal as SUM(distance * counts) where distance is the Euclidean distance on the graph, and the counts are the number of bibliographic coupling counts between pairs of journals, summed over all journals with which a particular journal has any counts. The breadth is thus an indicator of how tightly coupled a journal is in its local environment: a small breadth value means that the journal is very tightly coupled to its local environment, while a large breadth value means that the journal has substantial links outside of its local environment, and thus may be distorting the overall graph.
Journals were ordered by descending breadth, and a scree plot of breadth vs. rank was used to find a natural break in the sequence. A break was identified after 25 journals. Thus, those 25 journals were labelled as distorting journals (e.g. J Biol Chem, PNAS, JACS, etc.).
The 25 distorting journals were temporarily omitted from the bibliographic coupling matrix (and thus from the resulting map), and cosine values were recalculated for the remaining journals. Once again, using the top 15 similarity values per journal, the position of each journal was calculated using VxOrd. An average link clustering algorithm was then run using the journal positions and edges to generate a cluster solution. 646 clusters of journals were identified.
The 25 distorting journals include many major journals that should not be omitted from a map of science. These journals were added back into the list, each as its own journal cluster. Thus, the number of journal clusters was now considered to be 646+25 = 671.
To produce the final visualization, the bibliographic coupling counts from all 7,227 journals were aggregated at the cluster level, cosine indexes were calculated, and the graph layout algorithm was run again, this time to generate positions for the 671 clusters of journals. A visualization of the clusters is more pleasing than a visualization of all 7,227 journals in that it is far less cluttered, and can show the dominant relationships between fields while preserving the white space that is important to cognition. The resulting visualization of the 671 journal clusters is shown in Figure 1 (top). Lines between the journal clusters indicate the strongest cosine linkages between journal clusters.
The 2002 base map represents journal cluster interrelations but is invariant to rotation and mirroring. The map was oriented to place mathematics at the top and the physical sciences on the right. The ordering of disciplines is similar to what has been shown in other maps of science (Boyack et al., 2005; Moya-Anegón et al., 2004; Small, Sweeney, & Greenlee, 1985): as one progresses clockwise around the map, one progresses from mathematics through the physical sciences (Engineering, Physics, Chemistry), to the earth sciences, life sciences, medical sciences, and social sciences. The social sciences link back to computer science (near the top of the map), which has strong linkages to mathematics and engineering.
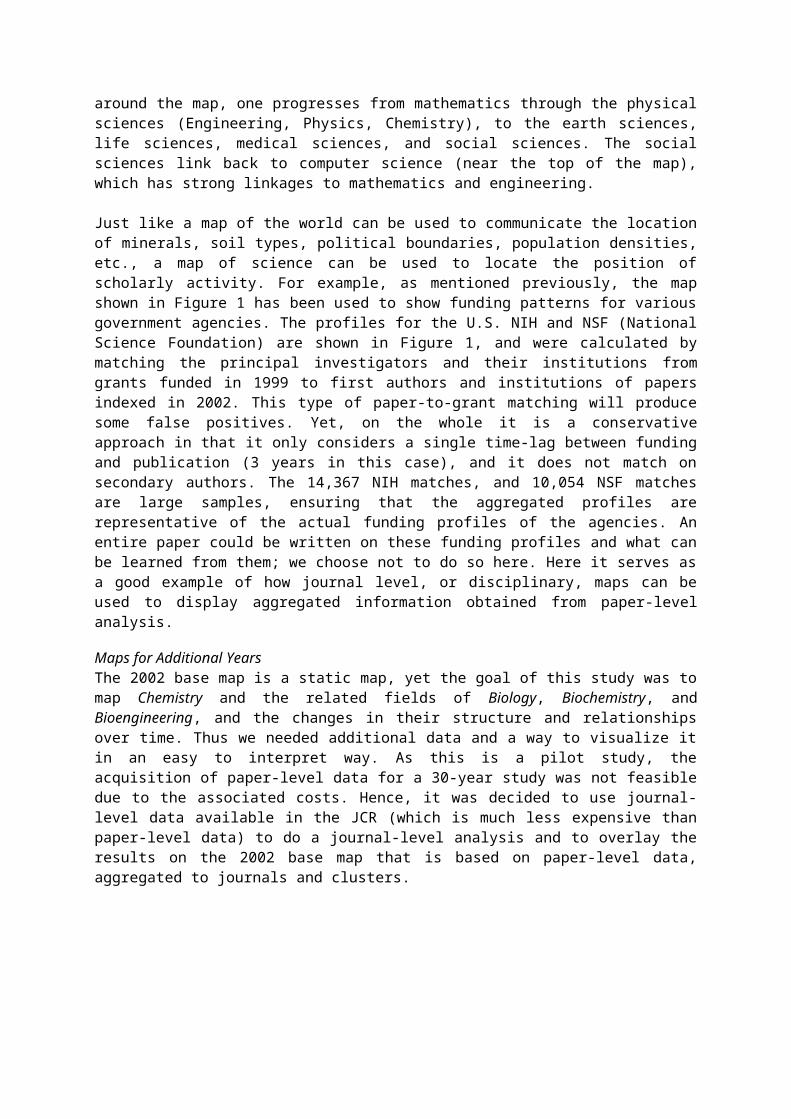
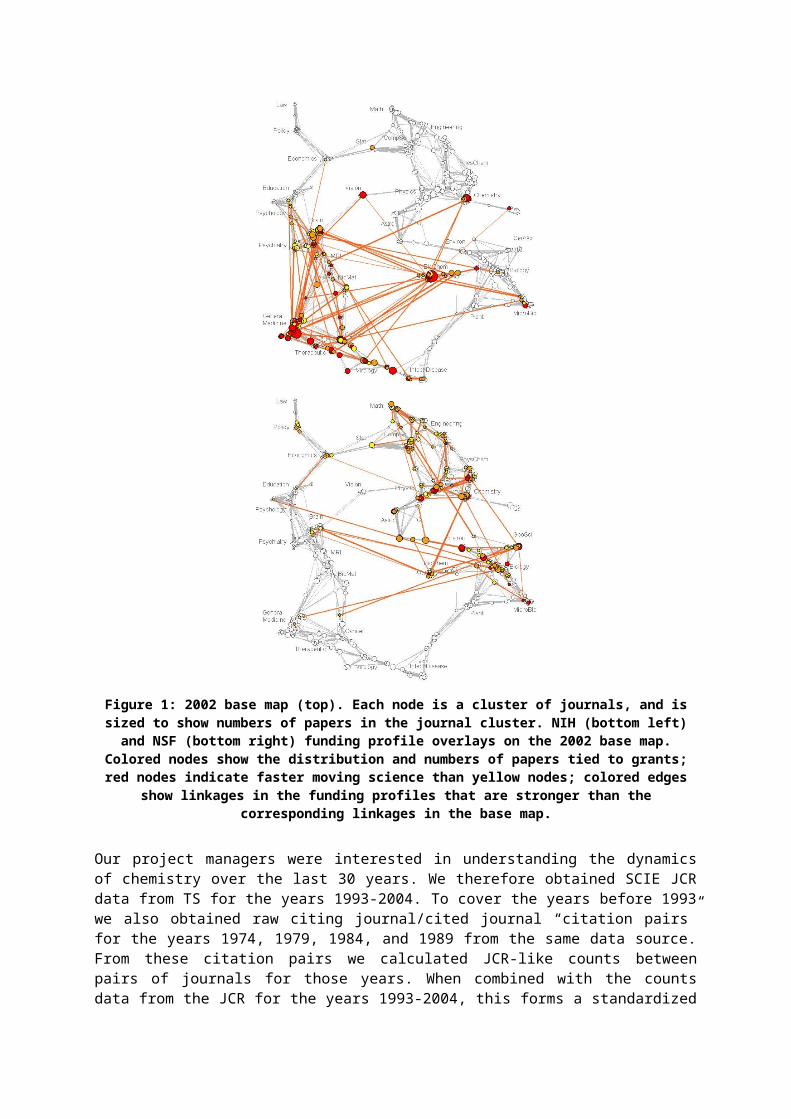
Just like a map of the world can be used to communicate the location of minerals, soil types, political boundaries, population densities, etc., a map of science can be used to locate the position of scholarly activity. For example, as mentioned previously, the map shown in Figure 1 has been used to show funding patterns for various government agencies. The profiles for the U.S. NIH and NSF (National Science Foundation) are shown in Figure 1, and were calculated by matching the principal investigators and their institutions from grants funded in 1999 to first authors and institutions of papers indexed in 2002. This type of paper-to-grant matching will produce some false positives. Yet, on the whole it is a conservative approach in that it only considers a single time-lag between funding and publication (3 years in this case), and it does not match on secondary authors. The 14,367 NIH matches, and 10,054 NSF matches are large samples, ensuring that the aggregated profiles are representative of the actual funding profiles of the agencies. An entire paper could be written on these funding profiles and what can be learned from them; we choose not to do so here. Here it serves as a good example of how journal level, or disciplinary, maps can be used to display aggregated information obtained from paper-level analysis.
Maps for Additional YearsThe 2002 base map is a static map, yet the goal of this study was to map Chemistry and the related fields of Biology, Biochemistry, and Bioengineering, and the changes in their structure and relationships over time. Thus we needed additional data and a way to visualize it in an easy to interpret way. As this is a pilot study, the acquisition of paper-level data for a 30-year study was not feasible due to the associated costs. Hence, it was decided to use journal-level data available in the JCR (which is much less expensive than paper-level data) to do a journal-level analysis and to overlay the results on the 2002 base map that is based on paper-level data, aggregated to journals and clusters.
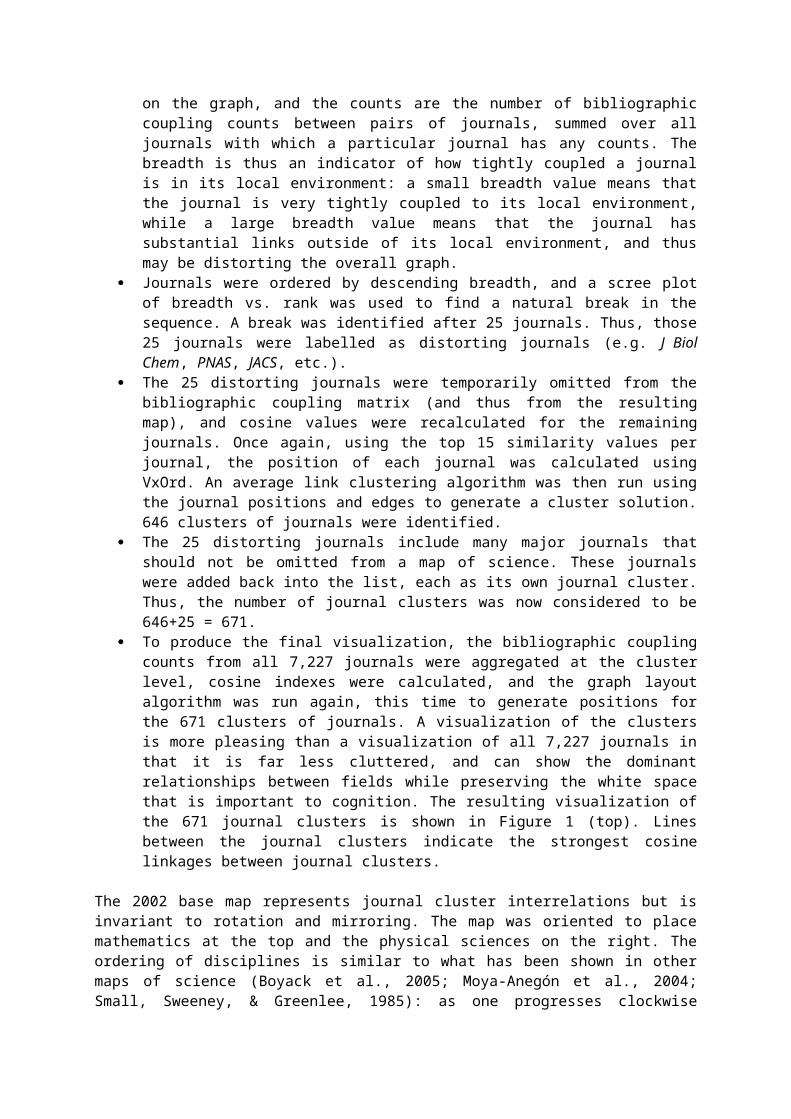
Figure 1: 2002 base map (top). Each node is a cluster of journals, and is sized to show numbers of papers in the journal cluster. NIH (bottom left) and NSF (bottom right) funding profile overlays on the 2002 base map. Colored nodes show the distribution and numbers of papers tied to grants; red nodes indicate faster moving science than yellow nodes; colored edges show linkages in the funding profiles that are stronger
than the corresponding linkages in the base map.
Our project managers were interested in understanding the dynamics of chemistry over the last 30 years. We therefore obtained SCIE JCR data from TS for the years 1993-2004. To cover the years before 1993 we also obtained raw citing journal/cited journal “citation pairs” for the years 1974, 1979, 1984, and 1989 from the same data source. From these citation pairs we calculated JCR-like counts
between pairs of journals for those years. When combined with the counts data from the JCR for the years 1993-2004, this forms a standardized set of data from which science maps can be generated every five years over a period of 30 years.
When choosing to visualize science dynamics there are various options. Maps can be generated for different time periods, and be associated or morphed to communicate structural change (Chen, 2006). We consider this to be an area of research in and of itself. A second option is to use a static map and to visualize the change in number of papers, citations, and inter-linkage strength using data overlays of changing size, shape, color, etc. This second option is much easier to read as the viewer only needs to understand one reference system, and it will be used here.
Use of a static map presented us with an additional challenge: the journal coverage of the TS databases changes over time. Hence, we needed a way to add 2,350 journals that were not covered in 2002 into the base map. Since we did not have paper-level data, we could not use the bibliographic coupling technique that formed the base map. We chose to use inter-citation data and the cosine index to determine which of the 671 clusters a journal should be added to, using the following process. For each of the years 2004, 1999, 1994, 1989, 1984, 1979, and 1974, in that order:
Inter-citation counts were obtained for pairs of journals from the JCR-like data source described previously. For each journal pair, we defined inter-citation counts as the sum of the counts from journal A to B and journal B to A. Summing of counts in this way gives a symmetric count matrix with journals as rows and columns. Only those counts to years within the previous 9 years were included. (The JCR only lists counts to individual cited years for the previous 9 years.) For instance, for citing year 2004, all citations to cited years of 1995 and more recent were included, but citations to years 1994 and earlier were not.
The columns in the count matrix were aggregated by journal cluster number where cluster numbers were available. This gives a matrix with journals as rows and clusters of journals as columns, and thus gives the citation counts of journals to clusters. Cosine index values were then calculated for this matrix, giving each journal-to-cluster a similarity value between 0 and 1. New journals, those not previously assigned to a cluster because they were not in the 2002 data, were then assigned to the clusters with which they had the largest cosine values. This technique makes use of the affinity of journals to an entire cluster rather than to single journals.
The result of this set of calculations was that each journal occurring in any of the data, from 1974-2004, was assigned to one of the 671 clusters of journals in the 2002 base map, thus allowing us to use the 671 clusters for each of the years in the study.
Mapping ChemistryOnce all journals were assigned, we characterized the four fields of interest in this study. This was done using JCR journal categories. Relevant JCR categories were grouped into one of our four fields using the breakdown shown in Table 1. The well-known journals Science, Nature, and the Proceedings of the National Academy of Sciences of the USA, although considered multidisciplinary journals, are in reality highly slanted toward biochemistry. Thus, they were included in the Biochemistry field. In addition, the category GC was not available in the data before 1994. Thus, any journal found in category GC in years 1994-2004 was also considered to be a Chemistry journal in the years before 1994.
We also accounted for the fact that many journals are classified in multiple categories by the JCR. For example, the journal Bioelectrochemistry has four different JCR category designations:
CQ – Biochemistry DA – BioengineeringCU – Biology HQ – Chemistry
Since we have no detailed information that would allow us to know how much this journal falls into each of the categories, we assume a straight fractional basis. Thus, for the purpose of counting how many papers from Bioelectrochemistry should count toward each of our four fields, we count ¼ of the
papers for each of the four fields. This journal is an extreme example. Most journals are only assigned to one or two categories.
Table 1. JCR categories comprising the fields of Chemistry, Biology, Biochemistry, and Bioengineering
Field JCR CategoriesChemistry DW – Chemistry, Applied EI – Chemistry, Physical
DX – Chemistry, Medicinal HQ – ElectrochemistryDY – Chemistry, Multidisciplinary II – Engineering, ChemicalEA – Chemistry, Analytical GC – Geochemistry & GeophysicsEC – Chemistry, Inorganic & Nuclear UH – Physics, Atomic, Molecular & ChemicalEE – Chemistry, Organic
Biology CU – Biology HT – Evolutionary BiologyCX – Biology, Miscellaneous PI – Marine & Freshwater BiologyDR – Cell Biology QU – MicrobiologyHY – Developmental Biology WF – Reproductive Biology
Biochemistry CO – Biochemical Research Methods individual journals: Science, Nature, PNASCQ – Biochemistry & Molecular Biology
Bioengineering DA – Biophysics DB – Biotechnology & Applied MicrobiologyIG – Engineering, Biomedical QE – Materials Science, Biomaterials
Given the assignments of journals to clusters, fractional assignments of journals to the four fields of interest, and the number of papers per journal by year, we can calculate the number of papers in each of our four fields for each of the 671 clusters in each year. Figure 2 (left) shows the distribution of Chemistry papers on the 2002 map. Although there are some chemistry papers in the medicine area, and some in engineering, the large majority lie within the box that comprises the physics, chemistry, and life sciences portion of the map. Subsequently, we focus on that part of the map, which is shown in an enlarged view in Figure 2 (right), with distributions of papers from all four categories. However, the true fractional distributions cannot be easily discerned as nodes of one color lie on top of nodes of another color, causing partial or complete overlaps. In addition, with so many journal clusters, it would be difficult to characterize and visualize diffusion patterns. Thus, we decided to manually group journal clusters into higher-level groupings based on the natural aggregation of journal clusters, spacing between groups of journal clusters, and distributions of the papers of the four fields, as shown in Figure 2 (right). The areas in astrophysics were ignored due to the low chemistry content in that part of the map.
Figure 2: 2002 base map (left) with blue nodes showing the distribution and number of Chemistry papers.
The inset map (right), also 2002, shows paper distributions for all four fields (Chemistry, Biology, Biochemistry, and Bioengineering) along with 14 hand-drawn groupings of 259 journal clusters
(disciplines) that are used for further analysis.
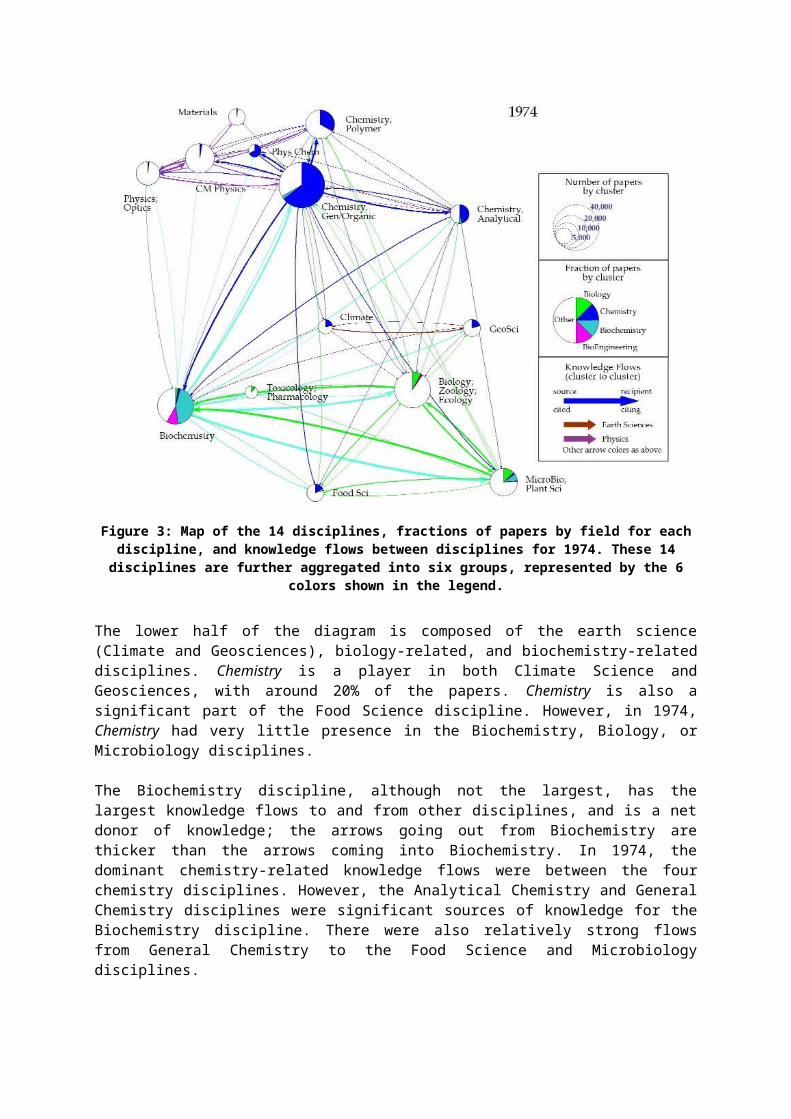
Paper counts for each of the four fields for each journal cluster were summed to give counts by field for each of the 14 groupings (hereafter called disciplines) shown in Figure 2 (right). Figure 3 shows the sizes of the 14 disciplines in 1974. Pie charts are used to show the fraction of papers in each of the four fields for each of the 14 disciplines, which have been labeled using their dominant ISI journal categories. Pie chart diameters are scaled by the square root of the number of papers; thus, the areas of the pie charts are accurate representations of the relative sizes of the disciplines.
Figure 3 also shows the flow of knowledge between pairs of the 14 disciplines. Knowledge flow occurs when one discipline cites another (Narin et al., 1972). Numbers of citations from each discipline to each other discipline were calculated from the original JCR and citation data. The source of the knowledge flow is the cited discipline, while the recipient of the knowledge flow is the citing discipline. Arrows in Figure 3 denote the flow of information from the source to the recipient of the knowledge. Arrows inherit the color of the knowledge source, and are proportional in thickness to the square root of the number of citations. There are knowledge flows between nearly all pairs of disciplines in the diagram; to avoid clutter a threshold of 500 citations was used to show only the dominant knowledge flows.
The map in Figure 3 can be interpreted as follows. The majority of Chemistry papers are found in the four chemistry-dominated disciplines at the upper right of the diagram. The Gen/Organic Chemistry discipline is the largest, and also has a high fraction of chemistry papers. The Physical Chemistry discipline is the smallest of the chemistry disciplines, but is comprised of about 70% Chemistry papers. The remaining 30% of the papers are primarily in physics journals or journals that have both chemistry and physics designations. The three disciplines at the upper left of the diagram have only small fractions (<5%) of chemistry papers, and are primarily composed of Physics and Materials Science papers.
Figure 3: Map of the 14 disciplines, fractions of papers by field for each discipline, and knowledge flows between disciplines for 1974. These 14 disciplines are further aggregated into six groups, represented by
the 6 colors shown in the legend.
The lower half of the diagram is composed of the earth science (Climate and Geosciences), biology-related, and biochemistry-related disciplines. Chemistry is a player in both Climate Science and Geosciences, with around 20% of the papers. Chemistry is also a significant part of the Food Science discipline. However, in 1974, Chemistry had very little presence in the Biochemistry, Biology, or Microbiology disciplines.
The Biochemistry discipline, although not the largest, has the largest knowledge flows to and from other disciplines, and is a net donor of knowledge; the arrows going out from Biochemistry are thicker than the arrows coming into Biochemistry. In 1974, the dominant chemistry-related knowledge flows were between the four chemistry disciplines. However, the Analytical Chemistry and General Chemistry disciplines were significant sources of knowledge for the Biochemistry discipline. There were also relatively strong flows from General Chemistry to the Food Science and Microbiology disciplines.
Similar diagrams of the 14 disciplines have been created at 5-year intervals to show the changes in size, fractional distribution, and knowledge flow over a 30-year period, and are shown sequentially in 6 different charts comprising Figure 4. The scales for discipline and knowledge flow size have been kept constant in Figures 3 and 4 to enable easy visual inspection of any changes.
A close inspection of Figures 3 and 4 reveals many changes, more than we can attempt to describe here. Thus, we highlight the dominant features and changes, especially with regard to impacts on the field of Chemistry. First, all of the disciplines grow more or less consistently over time. The knowledge flows also grow, but at a higher rate than the growth in publications.
30 years ago, Bioengineering had almost no presence outside the Biochemistry discipline. As of 2004, Bioengineering had not only increased its presence in the Biochemistry discipline, but had gained a significant role in Microbiology. In addition, Bioengineering is starting to be seen in three of the Chemistry disciplines: Polymer Chemistry, Analytical Chemistry, and General Chemistry. Biology has increased its fractional presence in the Biochemistry, Biology, and Microbiology disciplines, but has not yet gained a foothold in the chemistry disciplines. However, its influence in Chemistry has increased significantly, as shown by the growth in the knowledge flows (green arrows) from the Biology and Microbiology disciplines to the chemistry disciplines. On the whole, Biology supplies more base knowledge to Chemistry than Chemistry does to Biology.
The Biochemistry field has more or less maintained its place in the Biochemistry, Biology, and Microbiology disciplines over time. However, it has made steady gains in Analytical Chemistry, comprising roughly 20% of its papers in 2004. Biochemistry’s presence in General Chemistry is also starting to grow, although it is still small.
As for the field of Chemistry, it has maintained or grown its presence in its home disciplines. It has increased its presence in the Geosciences and in Toxicology, but now plays a much smaller role in Climate Science. Interestingly, the knowledge flows from chemistry disciplines to non-chemistry disciplines have not grown as quickly as the knowledge flows from other disciplines into Chemistry.
ConclusionsMaps showing the growth, distribution, and knowledge flows between Chemistry, Biology, Biochemistry, and Bioengineering have been generated from journal-level data, and show many of the changes that have taken place over the past 30 years. Large trends can be seen, suggesting that Biochemistry and Bioengineering are moving steadily into Chemistry territory, and are having a large influence on the general knowledge base. Chemistry’s impact on the knowledge base is growing, but at a slower rate. However, journal-level data provide no information about the topics at the interface between fields, thus limiting the strategic decisions that can be made based on the mapping exercise.
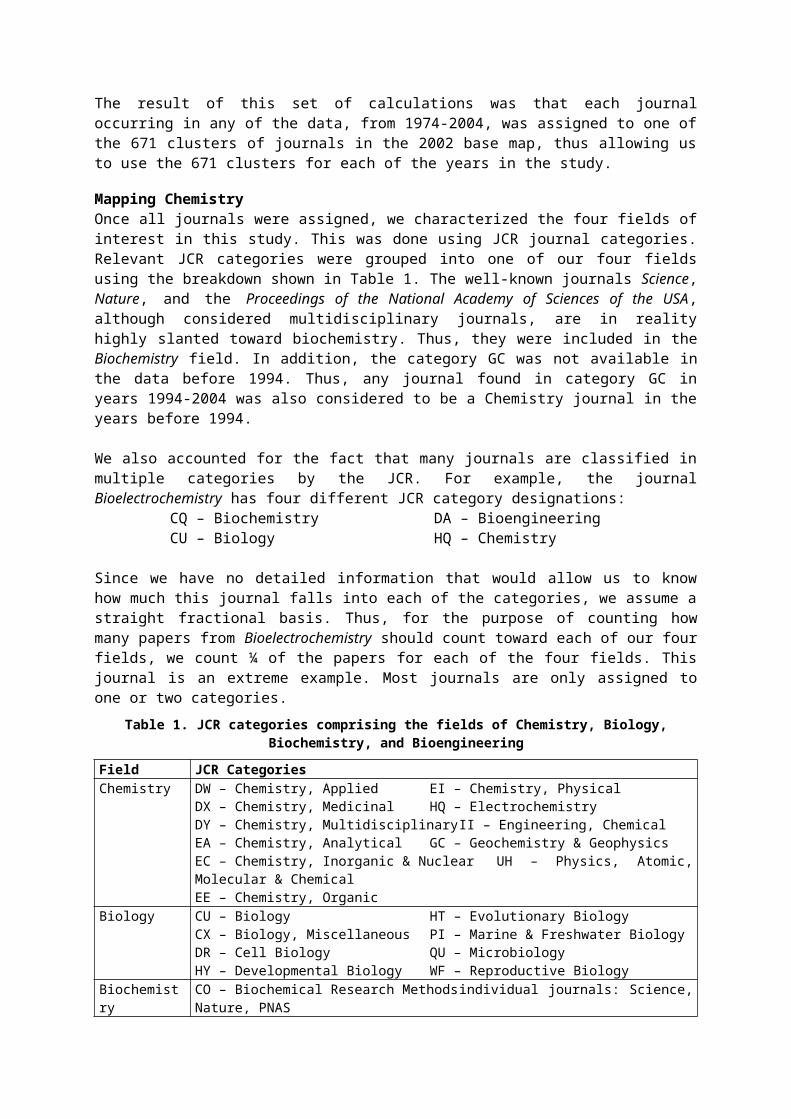
Figure 4a: Maps of the 14 disciplines, fractions of papers by field for each discipline, and knowledge flows between disciplines for 1979 and 1984. The legend is found in Figure 3.
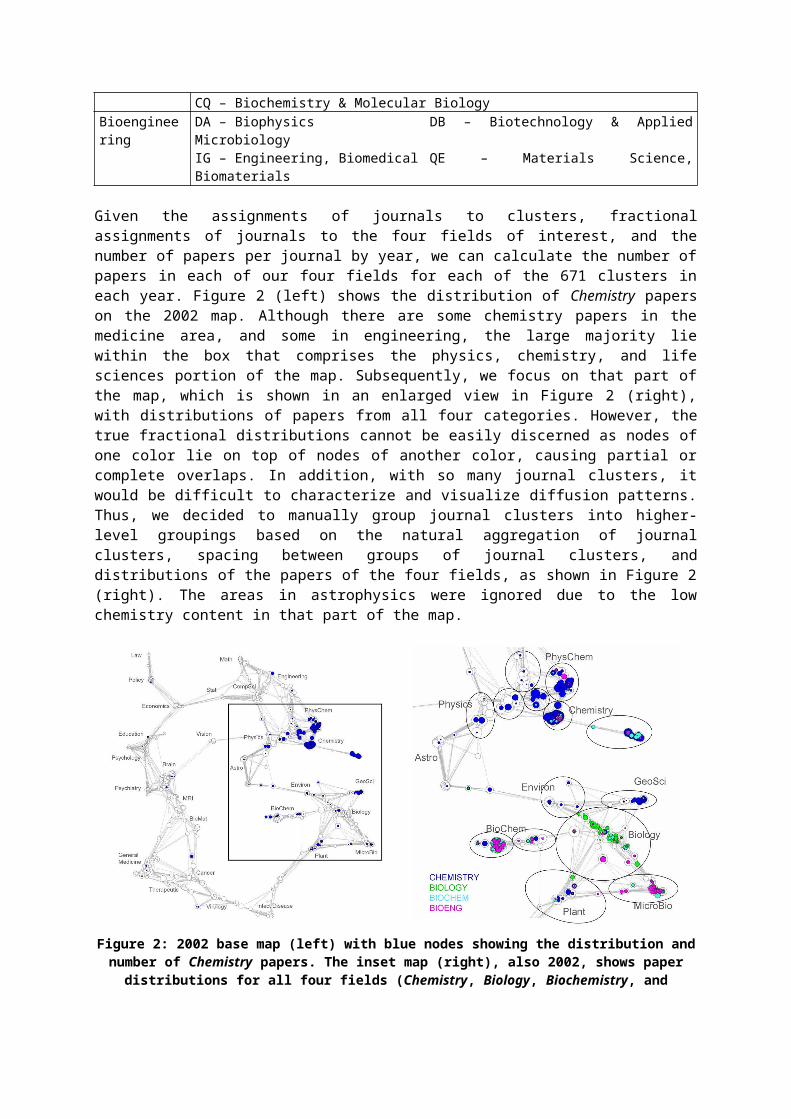
Figure 4b: Maps of the 14 disciplines, fractions of papers by field for each discipline, and knowledge flows between disciplines for 1989 and 1994. The legend is found in Figure 3.
Figure 4c: Maps of the 14 disciplines, fractions of papers by field for each discipline, and knowledge flows between disciplines for 1999 and 2004. The legend is found in Figure 3.
Folding in patent and or commercial data would provide a basis to study the impact of research on innovation and product development. It might very well be the case that some areas of science change their impact from a generator of cited scholarly knowledge to a generator of commercially valuable and hence patented and/or disclosed knowledge. An additional study should be done using paper-level data that can identify topics on the interfaces between fields, knowledge flows at topical levels, and detailed trends at these micro-levels. Paper-level data would also support the analysis of the trajectories and impact of single researchers, teams, institutions, or nations. Correlation of these data with funding data may further support strategic decisions by both funding agencies and researchers.
ReferencesBoyack, K. W., Klavans, R., & Börner, K. (2005). Mapping the backbone of science. Scientometrics, 64(3), 351-
374.Chen, C. (2006). CiteSpace II: Detecting and visualizing emerging trends and transient patterns in scientific
literature. Journal of the American Society for Information Science and Technology, 57(3), 359-377.Davidson, G. S., Wylie, B. N., & Boyack, K. W. (2001). Cluster stability and the use of noise in interpretation of
clustering. Proceedings IEEE Information Visualization 2001, 23-30.Ding, Y., Chowdhury, G., & Foo, S. (2000). Journal as markers of intellectual space: Journal cocitation analysis
of information retrieval area, 1987-1997. Scientometrics, 47(1), 55-73.Klavans, R., & Boyack, K. W. (2006a). Identifying a better measure of relatedness for mapping science. Journal
of the American Society for Information Science and Technology, 57(2), 251-263.Klavans, R., & Boyack, K. W. (2006b). Quantitative evaluation of large maps of science. Scientometrics, 68(3),
475-499.Leydesdorff, L. (1987). Various methods for the mapping of science. Scientometrics, 11(5-6), 295-324.Leydesdorff, L. (2004a). Clusters and maps of science journals based on bi-connected graphs in the Journal
Citation Reports. Journal of Documentation, 60(4), 371-427.Leydesdorff, L. (2004b). Top-down decomposition of the Journal Citation Report of the Social Science Citation
Index: Graph- and factor-analytical approaches. Scientometrics, 60(2), 159-180.Leydesdorff, L. (2006). Betweenness centrality as an indicator of the interdisciplinarity of scientific journals.
Paper presented at the 9th International Conference on Science & Technology Indicators.McCain, K. W. (1998). Neural networks research in context: A longitudinal journal cocitation analysis of an
emerging interdisciplinary field. Scientometrics, 41(3), 389-410.Morris, T. A., & McCain, K. W. (1998). The structure of medical informatics journal literature. Journal of the
American Medical Informatics Association, 5(5), 448-466.Moya-Anegón, F., Vargas-Quesada, B., Herrero-Solana, V., Chinchilla-Rodríguez, Z., Corera-Álvarez, E., &
Munoz-Fernández, F. J. (2004). A new technique for building maps of large scientific domains based on the cocitation of classes and categories. Scientometrics, 61(1), 129-145.
Narin, F., Carpenter, M., & Berlt, N. C. (1972). Interrelationships of scientific journals. Journal of the American Society for Information Science, 23(5), 323-331.
Samoylenko, I., Chao, T.-C., Liu, W.-C., & Chen, C.-M. (2006). Visualizing the scientific world and its evolution. Journal of the American Society for Information Science and Technology, 57(11), 1461-1469.
Small, H., Sweeney, E., & Greenlee, E. (1985). Clustering the Science Citation Index using co-citations. II. Mapping science. Scientometrics, 8(5-6), 321-340.
Tsay, M.-Y., Xu, H., & Wu, C.-W. (2003). Journal co-citation analysis of semiconductor literature. Scientometrics, 57(1), 7-25.