ISS-Oekom Corporate Responsibility Review 2018 oekom CR Revi… · 1 oekom Corporate Responsibility...
31
1 oekom Corporate Responsibility Review 2018 The Materiality and Impact of Sustainability Research
Transcript of ISS-Oekom Corporate Responsibility Review 2018 oekom CR Revi… · 1 oekom Corporate Responsibility...

1
oekomCorporate Responsibility Review 2018The Materiality and Impact of Sustainability Research
32
Forewordsby Daniel C. Esty, Hillhouse Professor of Environmental Law and Policy, Yale University (USA)by Heidemarie Wieczorek-Zeul, former Federal Minister of Germany for Economic Cooperation and Development by Professor Ernst Ulrich von Weizsäcker, Co-President of the Club of Rome
Editorials by Robert Hassler, Head of ISS-oekomby Gary Retelny, President & CEO Institutional Shareholder Services
Key Findings
25 Years of Expertise in Sustainable Development: from Niche to Mainstream Scandals and disasters: lessons learnt No concessions to independence and qualityThe evolution of sustainability researchMateriality: one principle – many definitionsUnderstanding complexity and applying leverage correctlyImpact: effects without side effects
ESG Performance of Global Companies – an OverviewComparison of industriesLong-term industry trendsDifferences in performance between industrial and emerging countriesTop performers in each industryGeographic distribution of sustainability leaders
Opportunities and Risks: Product Portfolios and Climate ManagementOpportunities: How products and services contribute to the achievement of the SDGsRisks: Selected results on climate performance
When Corporate Responsibility falls short: Controversial ActivitiesFocus on controversial business practicesCorruptionLabour rights controversiesHuman rights abusesEnvironmental controversiesTobacco and controversial weapons
A Look AheadInside oekom / Disclaimer Imprint
44
5
6
779
10
13
141516161818
232733343537
41
42
44
47
48 5152525455
575859
Contents
25 Years of Expertise in Sustainable Development: from Niche to Mainstream
ESG Performance of Global Companies – an Overview
When Corporate Responsibility falls short: Controversial Activities
Opportunities and Risks: Product Portfolios and Climate Management
13
23
41
47
4 5
Momentum toward clean energy and a decarbonized future has started to build. This trend holds true even in the United States as hundreds of Mayors, Governors, and corporate leaders have pushed forward with their climate action agendas even while Washington pulls back. The same trend can be found all across the globe. Indeed, one of the notable features of the 2015 Paris Agreement is the shift from reliance on top-down national gov-ernment leadership toward bottom-up implementation of a diverse set of sustainable development projects and programs that draw in cities, states and provinces, and companies as well as non-governmental organizations.
Likewise, the 2015 UN-led adoption of the Sustainable Development Goals (SDGs) has galvanized new interest in the sustainability agenda. In the past year, particular emphasis has centered on how the SDGs cascade from gov-ernments to the business community. This set of goals and underlying indica-tors as well as the associated monitoring framework has the corporate world taking up the “sustainability imperative” with new vigor.
Recognition is also growing that success in achieving the global policy com-mitment to the SDGs and to climate change action depends not just on gov-ernment follow-through but also on private sector initiatives. The requisite changes to the energy and economic foundations of modern life will demand hundreds of billions of dollars (and euros and yen and renminbi) in investments and a much sharper focus on sustainable development in the years ahead.
The finance world thus has a major role to play in terms of capital allocation to the investments required for sustainable development. And capital markets and finance institutions are indeed beginning to respond. Recent years have seen huge growth in the placement of “green bonds” and a rising demand for metrics that track the sustainability performance of companies. But the flow of capital toward sustainable finance and expanded mainstream investor in-terest in aligning their portfolios with their values and sustainability concerns requires more carefully constructed and broad-gauge Environmental/Social/Governance (ESG) performance metrics and data. The oekom CR Review that follows highlights these emerging trends and more generally the changing foundations for business and finance. It also shows the importance of reliable and high-quality data on various dimensions of corporate performance to de-livering on the promise of a more sustainable future.
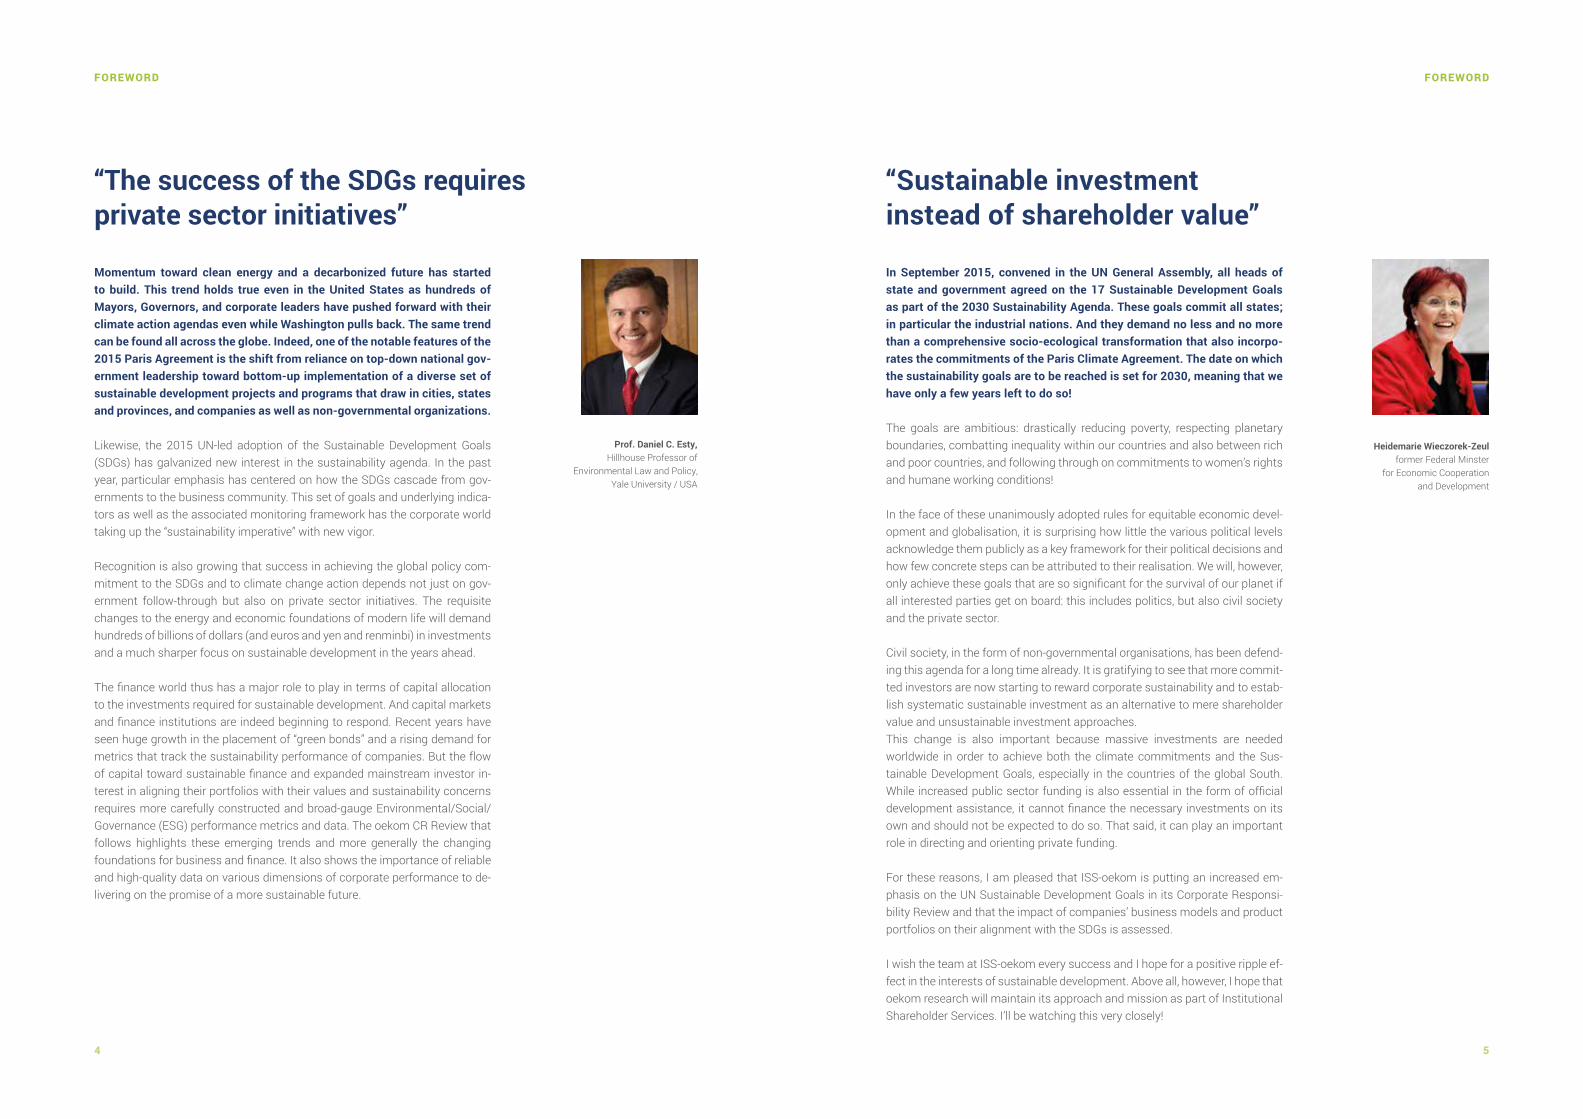
“The success of the SDGs requires private sector initiatives”
“Sustainable investment instead of shareholder value”
In September 2015, convened in the UN General Assembly, all heads of state and government agreed on the 17 Sustainable Development Goals as part of the 2030 Sustainability Agenda. These goals commit all states; in particular the industrial nations. And they demand no less and no more than a comprehensive socio-ecological transformation that also incorpo-rates the commitments of the Paris Climate Agreement. The date on which the sustainability goals are to be reached is set for 2030, meaning that we have only a few years left to do so!
The goals are ambitious: drastically reducing poverty, respecting planetary boundaries, combatting inequality within our countries and also between rich and poor countries, and following through on commitments to women’s rights and humane working conditions!
In the face of these unanimously adopted rules for equitable economic devel-opment and globalisation, it is surprising how little the various political levels acknowledge them publicly as a key framework for their political decisions and how few concrete steps can be attributed to their realisation. We will, however, only achieve these goals that are so significant for the survival of our planet if all interested parties get on board: this includes politics, but also civil society and the private sector.
Civil society, in the form of non-governmental organisations, has been defend-ing this agenda for a long time already. It is gratifying to see that more commit-ted investors are now starting to reward corporate sustainability and to estab-lish systematic sustainable investment as an alternative to mere shareholder value and unsustainable investment approaches.This change is also important because massive investments are needed worldwide in order to achieve both the climate commitments and the Sus-tainable Development Goals, especially in the countries of the global South. While increased public sector funding is also essential in the form of official development assistance, it cannot finance the necessary investments on its own and should not be expected to do so. That said, it can play an important role in directing and orienting private funding.
For these reasons, I am pleased that ISS-oekom is putting an increased em-phasis on the UN Sustainable Development Goals in its Corporate Responsi-bility Review and that the impact of companies’ business models and product portfolios on their alignment with the SDGs is assessed.
I wish the team at ISS-oekom every success and I hope for a positive ripple ef-fect in the interests of sustainable development. Above all, however, I hope that oekom research will maintain its approach and mission as part of Institutional Shareholder Services. I’ll be watching this very closely!
FOREWORD FOREWORD
Prof. Daniel C. Esty, Hillhouse Professor of
Environmental Law and Policy, Yale University / USA
Heidemarie Wieczorek-Zeulformer Federal Minster
for Economic Cooperation and Development

6 7
EDITORIAL
“Ecological investment is when you buy a cow and receive its milk as the return on investment.” This quite seriously intended quote from the begin-nings of our work in 1993 is testament to the long journey that not just we ourselves, but also the general understanding of and awareness for sus-tainability, have taken in the meantime.
The fact that companies, investors and ultimately the general public today talk about sustainability in a completely different way is the result of year-long ef-forts by numerous actors who have emphasised the necessity, rationality and usefulness of this approach from a wide variety of perspectives. We also be-long to this group: over the past 25 years, we have made it clear with our work that sustainability issues cannot always be merely a “nice to have”. At times they can literally be material to the success of an investment.
In addition to the very high commitment and first-class know-how of our ad-visors and rating experts, our clients in particular have greatly supported us in achieving this feat. They believed in us and in our work. This was especially important in the early days, when there was little or no empirical evidence of a positive correlation between sustainability and investment success. I am thus particularly grateful to the numerous clients who have been loyal to us for so many years. And I am confident that this will also be the case in our new phase of life as part of the ISS family.
The work of oekom research has helped to improve some fundamental things compared with the early 1990s: there is now a broad consensus with regard to climate change and the need for full decarbonisation. Even though the actual implementation at both national and company level is still very variable, it is hard to imagine that the trend as a whole will be reversed. And the market for sustainable investment, which at that time was a tiny pioneer market, has long since left its niche and has meanwhile reached the mainstream.
Of course, there is still a lot of work to be done. The perceived need for action is actually increasing rather than declining, but on the whole, things are mov-ing forward. The strength of this momentum can be seen in the evaluation of our research results from the past year. The slow but steady upward trend in companies’ overall sustainability performance has recently accelerated. The number of “good” companies and the midfield both continue to grow, while the “bad” or underperforming companies are becoming less numerous. Over the past five years, the average sustainability performance of companies in industrialized countries rose from 27.31 (on a scale of 0 to 100) to 31.50. Com-panies in emerging markets even improved from 14.78 to 21.73.
It goes without saying that we do not claim all the laurels for this gradual improvement, even if our impact study published last October once again
Robert HaßlerHead of ISS-oekom
“Public welfare and returns are no longer mutually exclusive”
The increasingly tangible effects of climate change, the continuing de-struction of numerous animal and plant species, oppressive social ine-qualities, and many people’s growing feeling of helplessness with regard to a liveable future… all these patterns call for a strong change of course in politics and the economy. Despite the encouraging effects of the Paris Cli-mate Agreement and the 2030 Sustainability Agenda, adopted unanimous-ly at the United Nations, the achievement of sustainable development is still a distant reality and there are until now only a few concrete political measures in place.
Outside politics, however, a lot is already happening. General awareness of the meaning of sustainable development is growing and more and more compa-nies and consumers are willing to make a contribution to sustainability. In ad-dition, there are strong indications for a “double dividend” in sustainable invest-ment. Societal needs and returns on investment have now been compatible for a long time. What used to be an exception is fast becoming the rule, proving that sustainable investment pays off.
In order for this lever to become even stronger, political leaders must make bold corrections to the legal framework. In this regard, sustainability ratings can provide political leaders, but also investors and companies with reliable policy orientations and control measures. Specialised rating agencies like ISS-oekom demonstrate this in an impressive way. For 25 years now, the ex-perts there have been developing clear analyses and assessments to provide the financial market with the decision-making criteria they need for sustaina-ble investment. It would be great if the message met with such strong reso-nance in the political sector.
The report at hand shows which parts of the economy are assuming their responsibility towards society, which in turn is also leading to improvements in their interactions with the environment and fellow human beings. This devel-opment may be slow, but it is also steady.
I wish the team continued success going forward and hope that the impetus of its work continues to impact sustainable development as positively in the years to come as it has until now.
Prof. Dr. Ernst Ulrich von WeizsäckerCo-President of the Club of Rome
FOREWORD
“Sustainability has become Mainstream”
8 9
demonstrated the strong influence that sustainability ratings exert over rated issuers. Rather, over the past few years, a diverse ecosystem of actors has emerged, working together in numerous ways to promote corporate sustain-ability and sustainable investment. Within this broader picture, sustainability ratings play a central role: they are the main yardstick by which progress can be measured. In this sense, we see ourselves as pilots and as guides who con-tribute to the redirection of capital flows onto a sustainable path.
The stronger the push towards a sustainable financial economy becomes, the more this operating principle will gain in importance. The topic has long reached the international political agenda. As globally recognised guidelines, the SDGs have defined a global framework within which concrete implemen-tation measures must now follow at all levels. Thus, the SDGs were the foun-dation for the work of the EU’s High Level Expert Group (HLEG), whose recom-mendations to create a sustainable financial economy were published by the EU Commission at the end of January 2018 and now dominate the debate in Europe. The HLEG’s work confirms and recognises the materiality of non-fi-nancial aspects, including in the investment sector. This is an important step and an essential signal, which appears all the more significant when we con-sider the initial situation 25 years ago.
The topic of sustainability and the consideration of environmental, social and governance (ESG) factors in capital investment decisions have arrived in the conventional financial world. They will henceforth exert an even greater influ-ence over companies’ sustainability performance. But this by no means makes our work obsolete. You could even say that it is needed now more than ever.
For this reason, too, we decided to become part of Institutional Shareholder Services at the beginning of 2018. This step will take our impact and reach to a whole new level and helps us to pursue our mission of creating sustainable development in the economy and society even more fully. We now belong to a worldwide team of over 1,200 colleagues in 13 countries working exclusively in the ESG area – this makes ISS unique as the world´s first outfit of its kind.
At this point, I would like to extend my express thanks to Mrs Wieczorek-Zeul, Professor Esty and Professor von Weizsäcker for their opening words to this year’s CR Review. I wish you an interesting and informative read.
“ESG ratings are the yardstick for measuring and evaluating progress”
EDITORIAL
Gary RetelnyPresident & Chief Executive Officer
Institutional Shareholder Services Inc.
“The investment community sharpens its focus on responsible investing”
On behalf of Institutional Shareholder Services (ISS), I am extremely pleased to wel-come the publication of oekom research’s 2018 Corporate Responsibility Review. Findings from this year’s report will be encouraging to all with an interest in respon-sible investment and corporate sustainability. The share of Prime companies—those with a top rating designation — has reached an all-time high, while, conversely, those classed with the lowest ratings now represent the smallest share of studied compa-nies since the analysis was first conducted.
These findings suggest that as the investment community sharpens its focus on re-sponsible investing, there is growing momentum by companies to disclose their ESG policies and practices, to have meaningful dialogue around ESG issues, and to recognize the potential cost of capital when lagging peers and falling short of ESG norms. In this context, these findings also affirm ISS’ mission of empowering investors to effectively manage governance, environmental, and social investment opportunities and risks to realize long-term value.
Readers of this report will be familiar with the storied history of oekom research, which is today one of the world’s leading rating firms in the area of sustainable investment and which in March joined with ISS. For 25 years, oekom has served clients with high quali-ty data, world-class ratings, responsible investment research and insights, and superior client service. Now under the banner of “ISS-oekom,” these solutions and services will be enhanced and expanded with the richness of oekom’s offerings made available to a broader group of global investors.
For readers of the report who may be new to ISS, our organization was founded in 1985 with the goal of promoting good corporate governance and raising the level of active ownership among institutional investors. Since its inception, ISS has worked with a broad cross-section of stakeholders to provide expert guidance and leading solutions that help shareholders manage portfolio company risk and drive value. ISS has expanded its offerings over the years and is now unique in its offering of comprehensive, stand-alone ESG solutions that enable investors to develop and integrate responsible investing policies and practices into their investment decisions, inform company engagements, and execute upon these policies through end-to-end voting.
ISS is today a global company with more than 1,200 employees spread across 19 offices in 13 countries and whose responsible investment research covers more than 20,000 companies across the globe.
Against this backdrop, the recent addition of oekom research and its highly talented team of professionals to the ISS family underscores our continued commitment to achieving our aforementioned mission of empowering investors.
EDITORIAL
10 11
Key Findings
Positive trend in the overall assessment continues
In a long-term comparison, the average assessment of rated companies shows a consistent upward trend: while the average performance score of the companies from developed countries in 2013 was still 27.31 (on a scale from 0 to 100), it had reached 31.50 by the end of 2017. The average assessment of companies from emerging countries over the same time period has improved even more significantly from 14.78 to 21.73. This is all the more encouraging when one considers that the assessment methodology is continuously reviewed to integrate the latest stand of international scientific consensus and new sustainability norms.
The group of companies assessed as “very good” and “good” now represents 17.19% of the overall universe, a record high. Also for the first time, the group of companies achieving medium scores (with a passable sustainability performance) is, at 43.62%, now larger than the proportion of laggard companies with largely inadequate sustainabil-ity performances. The laggards now account for mere-ly 39.19% of the rating universe, the lowest share since oekom began publishing its annual Corporate Responsi-bility Review.
Moreover, this change can also be seen on a more fun-damental level. In the product sustainability assessment, the proportion of companies with products that are rather harmful from a sustainability perspective has decreased continuously over recent years – such as in the Oil, Gas & Consumable Fuels, Automobile and Food & Beverages industries. At the same time, the proportion of industries developing possible solutions to global problems has in-creased, above all in the health care sectors.
Industry comparison: leaders and underachievers
In industrialised countries, the Household and Consumer Goods industry at present achieves the best results with an average company assessment of 43.07 (on a scale from 0 to 100). It is closely followed by Health Care Fa-cilities & Services with an average score of 41.18. The Semiconductor industry ranks third with 40.51. At the oth-
er end of the scale, the Retail industry (24.53) and, as in 2016, the Real Estate industry (23.48) bring up the rear.
In emerging countries, the Semiconductor industry leads the league table with an average assessment of 38.24, while the Electronic Components sector is close on its heels with a 37.42 average. After a clear margin, House-hold & Consumer Goods comes in third at 33.15 out of 100. At the low end of the scale, Trading Companies &Distributors and the Real Estate sector achieve very lowaverage values of 12.68 and 8.97, respectively.
“Share of Prime companies in industrial countries: 17.19%”
Compared to last year, notable climbers include the Health Care Equipment & Supplies and Health Care Facilities Ser-vices sectors with improvements in their industry averag-es of 5.68% and 5.47%, respectively. Underachievers with a marked deterioration in the average evaluation include the Automobile sector (with a -6.35% drop) and the Food & Beverages sector (-1.79%)
Company ranking: the top performers
Due to the broader basis (global corporate universe) used to establish this year’s ranking, the list of the top three companies per sector is distinctly different to the previous year’s ranking in some respects. For example, in the Auto-mobile sector, Peugeot (FR), Tesla (US) and BMW (DE) are now in the lead. In the Energy Suppliers sector, Ørsted (DK – formerly DONG Energy), Verbund AG (AT) and the power plants Linth-Limmern AG (CH) now take the top spots.
Across all sectors, the highest numbers of companies in the top three positions come from Germany and France, each with 12 companies in ranks 1, 2 or 3, followed by United Kingdom with 10 companies and Switzerland and the USA with 9 each.
The German companies in first position in their sectors are: Evonik Industries (Chemicals), Drägerwerk AG & Co.
KEY FINDINGS KEY FINDINGS
KGaA (Health Care Equipment & Supplies), Henkel AG & Co. KGaA (Household & Personal Products), SAP SE (Software & IT Services) and Deutsche Bahn (Transport & Logistics).
French companies in pole position this year include: Valeo (Auto Components), Peugeot (Automobile), Schneider Electric S.E. (Electronic Components), Amundi (Financials / Commercial Banks & Capital Markets), CNP Assurances S.A. (Insurance) and Sanofi (Pharmaceuticals & Biotech-nology).
The companies from United Kingdom achieving the best assessment in their sector are: Berkeley Group Holdings plc (Construction), Coca-Cola European Partners plc (Food & Beverages), Relx plc (Media) as well as British Land Company plc (Real Estate).
Assessment of products and services
Of the 2,315 companies analysed to date under the de-tailed oekom Sustainability Solutions Assessment (oSSA) methodology, close to 36% contribute on balance to the achievement of the UN sustainability goals with their products and services.
With a share of 7.8%, only a very small leading group makes an overall clearly positive net contribution to achieving the sustainability goals (“significant contribution”). A further 28.3% of the companies currently assessed fall into the “limited contribution” category. They either generate only a low proportion of turnover with high positive-impact products or offer mainly products with a limited positive impact on the sustainability goals.
Selected results on climate performance
At the end of 2017, the average oekom Carbon Risk Rat-ing (oCRR) of all companies in the oekom universe was a mere 25.7 (on a scale from 0 to 100). Only 5.6% of the companies can be classed as “Climate Performers” (>50), demonstrating a satisfactory management of their busi-nesses’ carbon risk exposure, while a meagre 2.8% reach the advanced level of “Climate Leaders” (>75).
Controversial business practices
Among companies based in developed countries, the most controversial industries still belong to the raw ma-terials sectors. In the Oil, Gas & Consumable Fuels sector, for example, almost every second company (47.83%) ex-hibits significant controversies with regard to at least one of the principles of the UN Global Compact.
Regarding corruption, the Aerospace & Defence sector takes the (negative) top position in the ranking of the most controversial sectors, with 15.38% of companies implicat-ed in controversies in this area alone.
In the area of labour rights violations, meanwhile, the list of the most controversial sectors is headed by the Textiles & Apparel sector with a 23.3% involvement rate.
Human rights abuses were particularly rife in Metals & Mining this year, with 11.9% of companies affected. After being in third position in the previous year’s ranking, the sector now tops the list of the most controversial indus-tries from a human rights perspective.
Similarly, environmental controversies occur most fre-quently in raw materials sectors due to the activities and locations involved. In the Oil, Gas & Consumable Fuels sec-tor, for example, this encompasses 43.48% of companies.
The newly expanded exclusion list of the UN Global Com-pact now also refers to the production of tobacco and banned weapons. With regard to tobacco, at the end of 2017 the only large companies from developed countries involved in its production belonged to the Tobacco sector. Banned weapons, in contrast, are produced by companies from several sectors: in addition to the Aerospace & Defence sector, a number of companies from the Construction, Commercial Services & Supplies, Electronic Devices & Ap-pliances and Software & IT Services sectors are concerned.
12 13
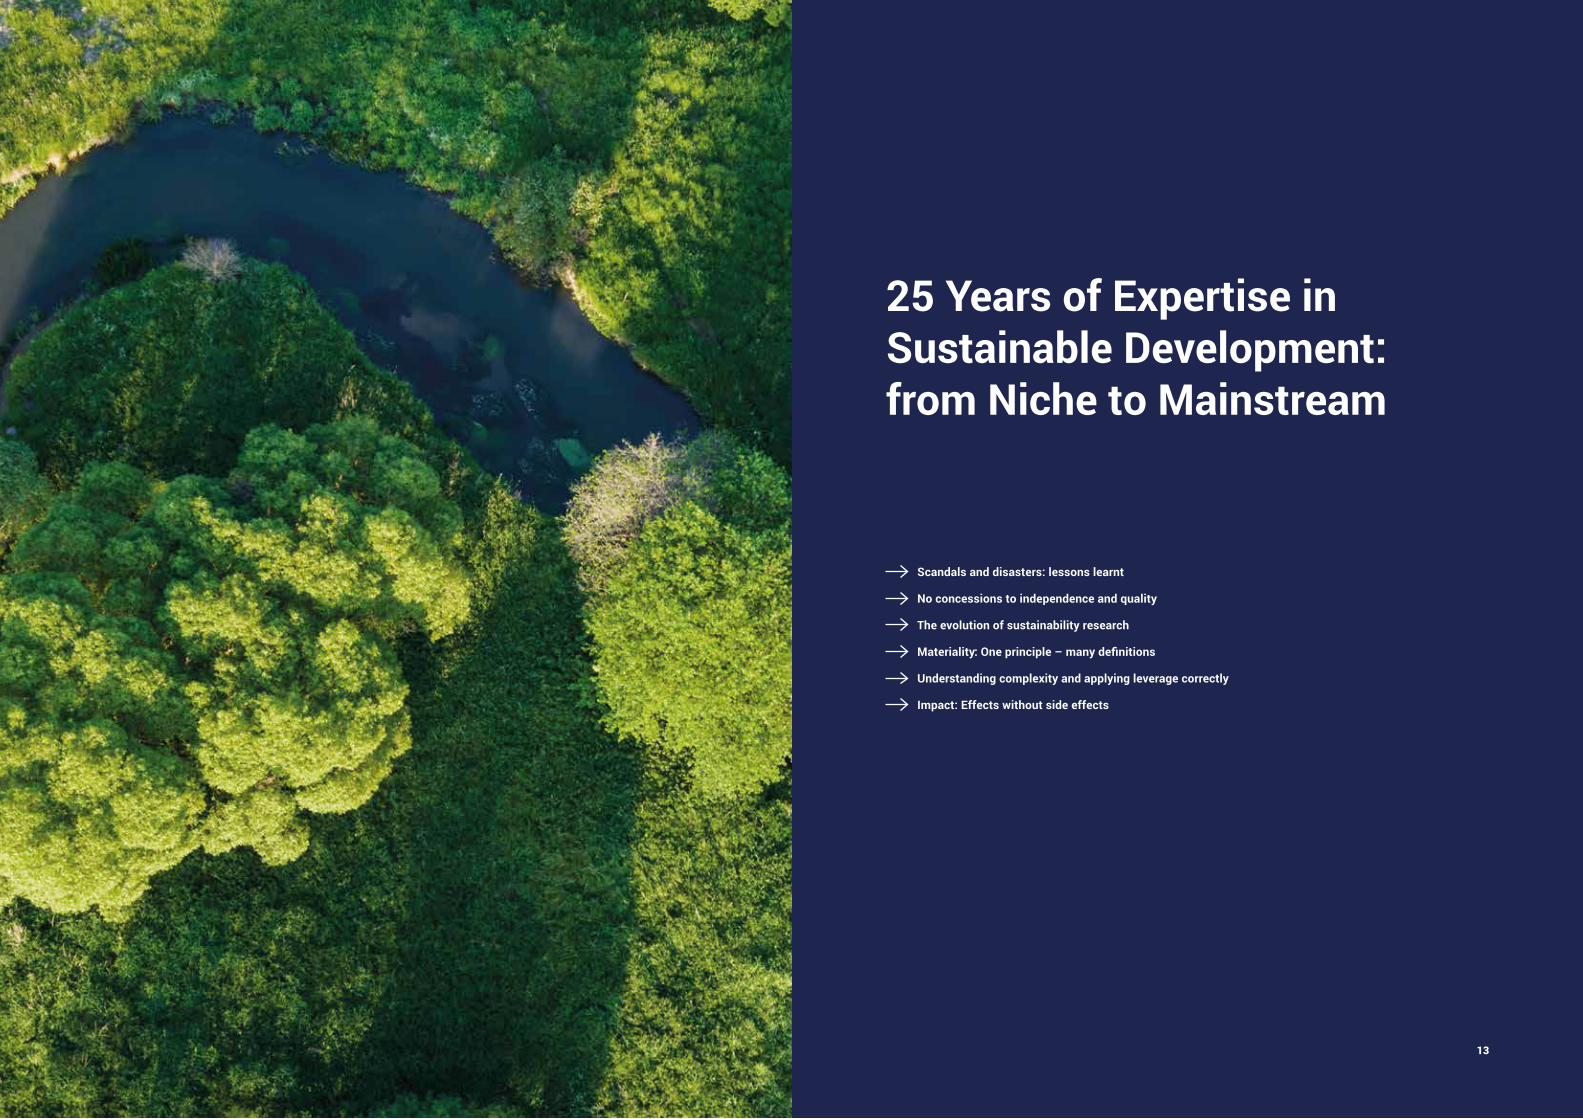
25 Years of Expertise in Sustainable Development: from Niche to Mainstream
Scandals and disasters: lessons learnt
No concessions to independence and quality
The evolution of sustainability research
Materiality: One principle – many definitions
Understanding complexity and applying leverage correctly
Impact: Effects without side effects

1514
25 Years of Expertise in SustainableDevelopment: from Niche to Mainstream
Over the past 25 years, the availability and the impor-tance of sustainability information – whether for inves-tors, asset managers or companies – have undergone a striking development to reach today’s maturity. In the early 1990s, sustainability ratings were still a niche service provided to a select audience, primarily seek-ing to uphold ethical values, such as church investors, ethical funds or small special banks. Today, in contrast, sustainability research is seen by a large part of the capital markets as an indispensable source of intelli-gence. Many actors now systematically integrate it into the assessment of material opportunities and risks and of the future return potential of their investments.
oekom research, in the early days of its existence, often had to perform pioneering work towards companies and investors – such as explaining the basic concepts and the relevance of sustainability topics. Many of these areas have since developed into a global societal consensus, particularly in the last ten years. We have now collectively reached the realisation that, for the long-term conserva-tion of our planet and even of humanity, decisive action and a far-reaching transformation of economic systems are necessary.
Scandals and disasters: lessons learnt
Over the past 25 years, the availability and the importance of sustainability information – whether for investors, as-set managers or companies – have undergone a striking development to reach today’s maturity. In the early 1990s, sustainability ratings were still a niche service provided to a select audience, primarily seeking to uphold ethical values, such as church investors, ethical funds or small special banks. Today, in contrast, sustainability research is seen by a large part of the capital markets as an indis-pensable source of intelligence. Many actors now system-atically integrate it into the assessment of material oppor-tunities and risks and of the future return potential of their investments.
This realisation did not come easily. A number of painful experiences and events over the last few decades helped to raise fundamental questions and triggered a learning
process, both in the world of politics and in the financial economy:
• Already in the early 2000s, the huge balance sheetscandals and subsequent company bankruptcies andplunges in value (e.g. Enron, Parmalat) caused manyinvestors to listen up, as did a string of corruptionscandals over the same period (e.g. the Siemens inves-tigations starting in 2006). From 2007 on, on the backof the financial crisis, the validity of financial analysesas the sole basis of decision-making for investmentscame to be challenged and interest in sustainability re-search increased noticeably as a result.
• Soon after, the crisis in Greece and the Eurozone, which came to a point from 2010 onwards, alerted the worldto the fact that seemingly “soft” ethical topics, such aspoor governance and corruption, could seriously jeop-ardise entire currency systems.
• Most recently, events such as the Deepwater Horizonenvironmental disaster (2010), the nuclear catastro-phe in Fukushima (2011) and the diesel emissionsscandal (2015) have demonstrated in a dramatic waythe significance of environmental risks and societalimpacts conventionally seen as externalities. In eachcase, the knock-on effects were dramatic not only forthe local populations and the environment, but also forthe companies and investors involved.
In some cases, these developments could be identified in good time by certain ESG rating agencies. For exam-ple, even before the relevant events took place, oekom research assessed BP and Tepco, as well as Greece and other countries affected by the Eurozone crisis, as “Not Prime”. Despite these warning bells, each event still hit large parts of society, the economy and the (capital) mar-kets largely unprepared.
But lessons were learned and consequences have fol-lowed. The initial shift in awareness was particularly reflected in legislation such as the Sarbanes Oxley and Dodd Franck Acts of 2007 and other measures taken to address the reliability of reporting, increase transparency and improve corporate governance. In Germany, the Fuk-ushima disaster led to the definitive decision to phase out
nuclear power by 2022 and thereby strengthened measures to support a com-prehensive energy transition. More recently, a new awareness of the urgency of climate change, combined with a better understanding of the risks posed by investments in stranded assets, culminated in a broad coal divestment move-ment, the Paris Climate Agreement and a volley of legal measures which is still on-going, such as the French law requiring investors to measure and publish their exposure to climate risks and opportunities.
Although the past years have also brought disturbing political developments in some countries and even, in isolated cases, a rejection of basic social and ecological values and treaties, the prominence and the appreciation of sustain-ability topics and services continue to grow. Notable examples include the sus-tainable finance initiatives on a European level – including the recommenda-tions of the so-called High Level Expert Group – as well as the steady growth of the green bond market.
“ESG analyses influence the general corporate strategy of more than one third of companies”
Companies increasingly recognise this and an ever-growing number claims to integrate sustainability into their business strategies. According to the oekom Impact Study published in October 2017 , sustainability research already influ-ences the general corporate strategy of more than a third of companies sur-veyed. As one of the strongest levers for the sustainable transformation of the economy, the capital markets are today increasingly referring to information – relevant to decision-making and financial success – that only specialisedsustainability research can provide.
No concessions to independence and quality
The seismic shift from a values-oriented niche to the mainstream capital mar-kets, with a stronger emphasis on risk management and fiduciary duty, is very positive for sustainable development. Nevertheless, it has also created certain pitfalls.
Thus, the on-going consolidation of specialised, quality-oriented independent ESG rating agencies has led to discontinuities in research methodologies. At the same time, with the arrival on the market of financial rating agencies fol-lowing a rather more superficial sustainability approach, information with less
MATERIALITY AND IMPACT MATERIALITY AND IMPACT
Kristina RüterHead of Research
ISS-oekom

16 17
depth, reliability and informative value is pushing onto the market. These new actors’ differing business model also comes with problems regarding objectivity and inde-pendence: financial rating agencies are commissioned to perform the research by the issuers themselves. Whereas the very business model of sustainability rating agencies, such as oekom research ensures the basic objectivity and independence of the assessment, as they are solely man-dated by investors and financial service providers.
The evolution of sustainability research
oekom research’s high-quality, holistic and forward-look-ing analyses over the past 25 years have played an in-strumental role in the sustainable investment market’s growth. In this respect, one of the most important devel-opments was surely the transition from an absolute best-in-class approach to a cross-sector, modular ESG rating model with a clear SDG impact component.
“Evaluations are increasingly demanded on a granular top-ic level and across the entire portfolio”This development stays abreast of the growing and multi-faceted demands of an increasingly diverse client base. In the past, an aggregated, sector-specific rating and a set of classic exclusion criteria would have satisfied a majority of client needs. Nowadays, evaluations are increasingly demanded on a granular topic level and across the entire corporate portfolio. The strengths of oekom research’s analyses have from the outset been the range of the top-ics covered, the depth of the evaluations and the inclusion of companies’ entire value chains. In addition, in recent years the size of the corporate universe, the frequency of updates, the cross-sector comparability of results and the transparency regarding scoring and weighting have been decisively expanded.Furthermore, whereas in the early days, sustainability rat-ings primarily assessed companies’ operational sustaina-
bility management, oekom research’s corporate research now includes a heavily weighted and strongly differentiat-ed assessment of companies’ product portfolios. This lat-est innovation ensures that the ratings capture the entire business model with its opportunities and risks and so make a stronger statement on the future viability of each company in a sustainable economy.
As a result, oekom research is able – better than ever before – to provide differentiated, resilient and mean-ingful sustainability information and evaluations, which can be adapted to a diversity of approaches and strate-gies, thanks to their range, depth, quality, topicality and usability. With a flexible combination of raw data, anal-ysis results and innovative end products, investors are empowered to consider material, sustainability-relevant aspects in their investment decisions. This includes both adequately managing material risks and externalities, and seizing new opportunities and future trends. Ultimately, the aim is also to meet the so-called “triple bottom line” by achieving the highest possible positive impact.
Impact in this sense is to be understood as the outcomes achieved on the basis of individually specified, value-ori-ented goals, while materiality refers to the relevance of sustainability information with regard to risk minimisation and the potential to achieve financial returns.
Over the years, oekom research has developed a deep un-derstanding and first-rate expertise of these two key sus-tainable investment concepts, as is regularly confirmed by the agency’s investor clients, rated companies, aca-demic research and other stakeholders.
Materiality
One principle – many definitions
The fact that sustainability research has been able, over the past 25 years, to make its way so successfully into the mainstream financial markets, from a niche historically characterised by social and ecological values, has a lot to do with this single key concept: materiality.
In general terms, any information that can change the ba-sis for a given decision can be considered material. To-day, in the context of the corporate reporting and in the world of (sustainable) investment, two highly simplified methods to interpret the concept of materiality are often contrasted:
1. On the one hand, a strictly financial and microeconom-ic interpretation of materiality: information is materialif it immediately and very directly impacts the currentbalance sheet.
2. On the other hand, a broader (sustainability-oriented)view of materiality that encompasses all conceivablestakeholders: any information that substantially af-fects stakeholders or the environment is material.
Whichever approach is followed, materiality analyses are often performed with the objective of classifying infor-mation into “material” and “not material” categories. The information deemed as material is then accordingly con-sidered in reporting and/or in investment decisions, while the information found not to be material is set aside.
Understanding complexity and applying leverage correctly
In oekom research’s view, the distinction between strictly “financial” materiality and broader “sustainability-oriented” or “stakeholder-related” materiality is unrealistic, as is the desire to sort all information into “material” and “not materi-al” categories. Most importantly, such an approach will not always succeed in identifying and adequately integrating the most significant opportunities and risks in investment decisions – or in strategic corporate business decisions.
“ESG aspects are alsomaterial from an economicperspective”At the same time, the majority of sustainability aspects are indeed material from an economic point of view. They
Side note: Performance confirms materiality of oekom Corporate and Country Ratings
Numerous studies bear out the materiality of the oekom Corporate Rating, both in terms of the under-lying materiality understanding and of the materiality assessment of individual companies and their key sustainability challenges. For instance, a recent perfor-mance study conducted by DPG and oekom research (2018), comparing the performance of an oekom Prime portfolio with conventional indices, clearly demonstrates the outperformance of companies with goodsustainability ratings. The study examined the performance of a test portfolio composed of large companies that were positively assessed according to sustainability aspects by oekom research (“oekom Prime Portfolio Large Caps”). In the period from 1 January 2005 to 31 December 2017, the test portfo-lio achieved a better yield - 8.69% p.a. - than the share index MSCI World Total Return Index® with 8.38% p.a. Similar results were found for the oekom Country Rat-ings by Andreas Höpner et al. in their 2016 study enti-tled „The effects of corporate and country sustainabil-ity characteristics on the cost of debt: an international investigation”. The study compared credit ratings and sustainability ratings of those European countries most strongly affected by the debt crisis that followed the global financial crisis. The authors found that the countries’ sustainability ratings, conducted by oekom research, deteriorated faster and earlier than the coun-tries’ financial ratings, conducted by Moody’s & Co. This result suggests that oekom research’s ratings had, at least in this case, a stronger predictive power regarding material risks.Another particularly impressive example is the perfor-mance of the Global Challenges Index, a sustainable stock index initiated in 2007 by Hanover stock ex-change in cooperation with oekom research. With a performance of close to 114% since inception (as at 31 August 2017), the GCX clearly outdistances leading benchmark indices such as the DAX30 (+60%) and the Euro Stoxx 50 (+10%).
MATERIALITY AND IMPACT MATERIALITY AND IMPACT
1918
can often directly or indirectly co-determine the short- or long-term financial success of a company, and are thus highly relevant for investors. It is thus crucial to recognise, to correctly evaluate and to quantify the ESG factors that can influence a company’s future profitability and finan-cial performance. In doing so, however, the complex re-lationships and interdependency of a variety of factors and parameters must be recognised and considered. This exercise requires very specific experience and expertise.
oekom research’s comprehensive materiality analysis takes account of these variables and is performed for all sectors and for every company, with regard to all as-sessed areas and sustainability topics.
The results of this analysis are translated into sector-spe-cific and often company-specific applications, operation-alisations and weightings of the topics assessed and of the respective rating indicators.
ImpactEffects without side effects
One of the central objectives of many sustainable inves-tors, in addition to achieving a return on investment, is to make a measurable positive impact on certain chosen as-pects of sustainable development. The UN Sustainable De-velopment Goals are recognised worldwide as a key orien-tation framework for such impact investment approaches.
Investments aiming to contribute to the attainment of the SDGs face many challenges. The detailed targets formu-lated under each of the SDGs must first be broken down according to their particular relevance for different invest-ments and issuers. This means identifying both the posi-tive and/or negative impacts (i.e. contribution vs. obstruc-tion) on a given goal, at the level of single investments/issuers as well as on an overall portfolio basis. In cases where different objectives and impacts compete or con-flict, these must then also be coherently and meaningfully weighted and prioritised against one another.Sustainability research used in impact investment must
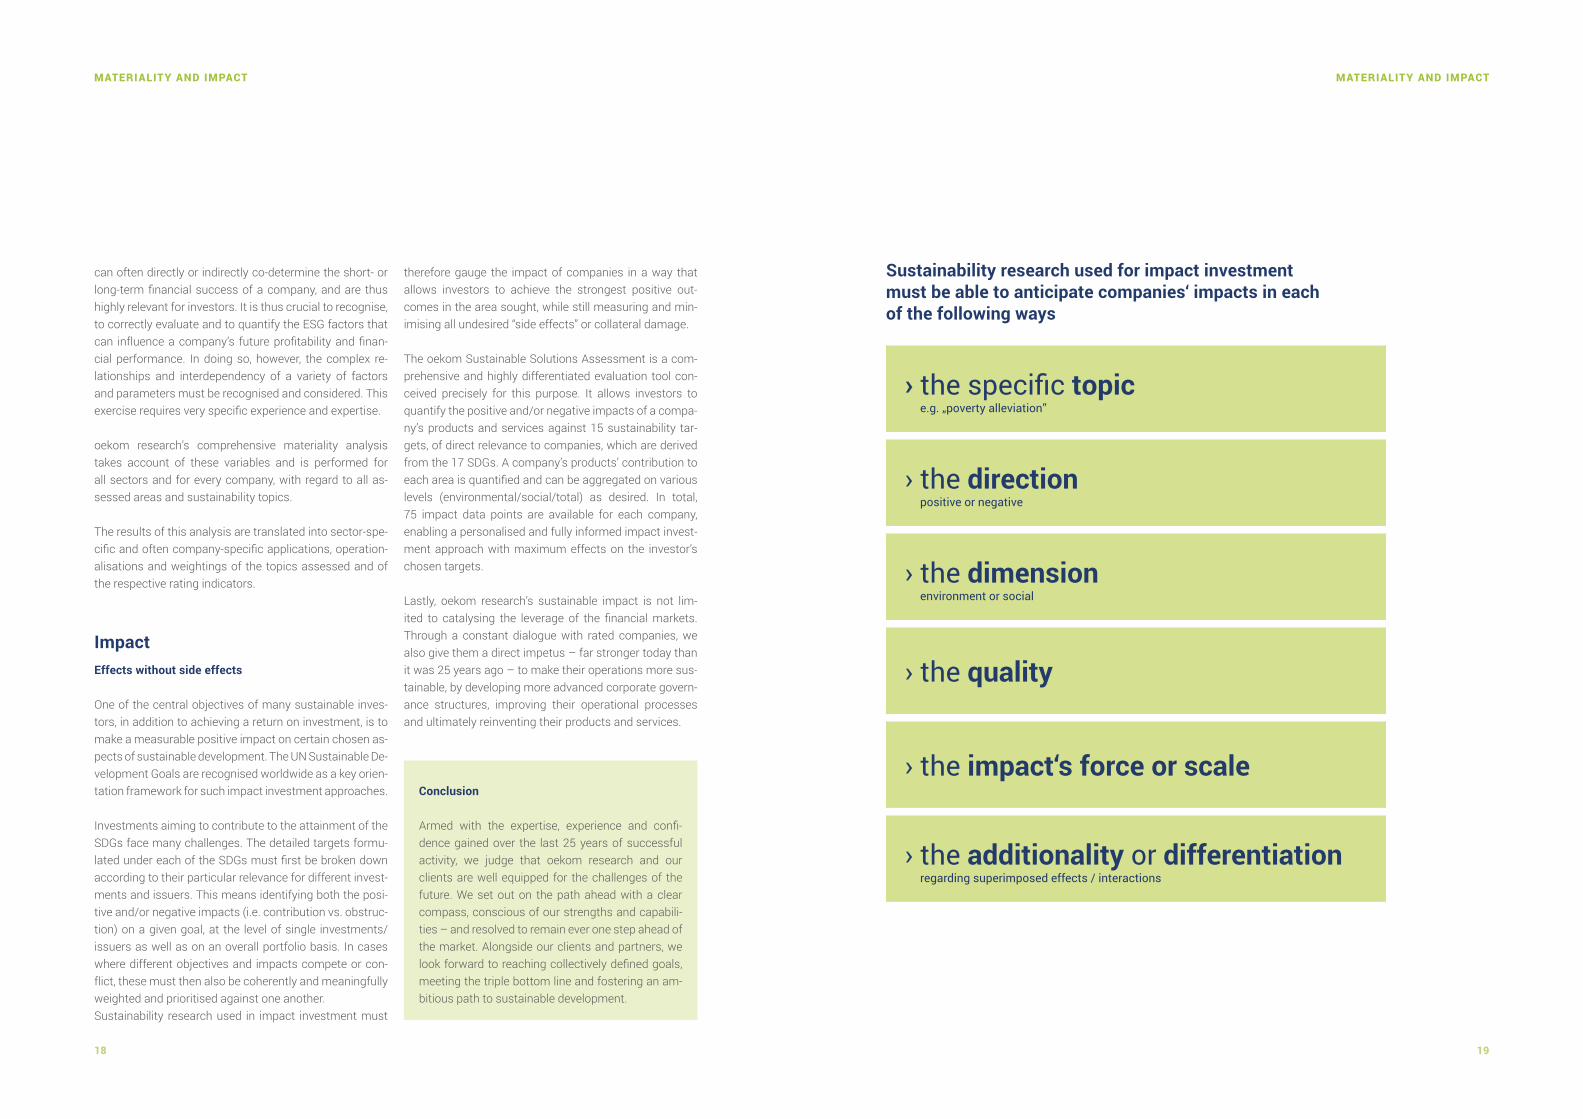
therefore gauge the impact of companies in a way that allows investors to achieve the strongest positive out-comes in the area sought, while still measuring and min-imising all undesired “side effects” or collateral damage.
The oekom Sustainable Solutions Assessment is a com-prehensive and highly differentiated evaluation tool con-ceived precisely for this purpose. It allows investors to quantify the positive and/or negative impacts of a compa-ny’s products and services against 15 sustainability tar-gets, of direct relevance to companies, which are derived from the 17 SDGs. A company’s products’ contribution to each area is quantified and can be aggregated on various levels (environmental/social/total) as desired. In total, 75 impact data points are available for each company, enabling a personalised and fully informed impact invest-ment approach with maximum effects on the investor’s chosen targets.
Lastly, oekom research’s sustainable impact is not lim-ited to catalysing the leverage of the financial markets. Through a constant dialogue with rated companies, we also give them a direct impetus – far stronger today than it was 25 years ago – to make their operations more sus-tainable, by developing more advanced corporate govern-ance structures, improving their operational processes and ultimately reinventing their products and services.
MATERIALITY AND IMPACT MATERIALITY AND IMPACT
Conclusion
Armed with the expertise, experience and confi-dence gained over the last 25 years of successful activity, we judge that oekom research and our clients are well equipped for the challenges of the future. We set out on the path ahead with a clear compass, conscious of our strengths and capabili-ties – and resolved to remain ever one step ahead of the market. Alongside our clients and partners, we look forward to reaching collectively defined goals, meeting the triple bottom line and fostering an am-bitious path to sustainable development.
› the dimensionenvironment or social
› the directionpositive or negative
› the specific topice.g. „poverty alleviation”
› the quality
› the impact‘s force or scale
› the additionality or differentiationregarding superimposed effects / interactions
Sustainability research used for impact investment must be able to anticipate companies‘ impacts in each of the following ways
HIGHLIGHTS 2017
Basis of the analysis: the oekom corporate universe
The oekom universe provides complete coverage of all important international and numerous national share indices, in addition to major unlisted bond issuers. The coverage can be divided into three groups:
1. major listed companies from conventional sectors;2. listed companies, often small or medium-sized, from
sectors with a high contribution to sustainability,such as renewable energy, energy efficiency, recy-cling technologies, water treatment or education;
3. major unlisted bond issuers, such as state banks, su-pranational organisations and railroad companies.
All companies are assessed following the same pro-cess, using a regularly updated catalogue of criteria that covers a large range and depth of topics. The ob-jective of the oekom Corporate Rating is to comprehen-sively assess the sustainability performance and future viability of rated companies and to identify those com-panies that demonstrate the best and most successful strategies in this respect. Hence, a “successful” com-pany does not merely succeed in reducing negative im-pacts along its value chain or in actively contributing to sustainable development. Success also entails the proper management of factors relevant from a purely
economic perspective in order to ensure a long-term competitive advantage over competitors.
The criteria applied are drawn from all areas of ESG per-formance: environmental, social and governance. Each company is assessed against approximately 100 indi-vidual indicators, many of which are sector-specific. Within the rating’s overarching parts (“dimensions”), in-dicators are organised by research area, such as Staff, Suppliers, Tax practices, Climate protection, Water, Bi-odiversity, Resource efficiency and Energy efficiency. All indicators are individually weighted, assessed and finally aggregated into an overall rating. The indicators underpinning four to five sector-specific key issues make up at least 50% of the total weighting.
All indicators are regularly reviewed and updated in or-der to reflect the latest stand of new scientific, techni-cal, societal and/or legal developments. Most recently, for example, new indicators were introduced on com-panies’ Tax practices, while the assessment of product portfolios, which was already performed for some sec-tors, was deepened and extended to all sectors. This latest innovation quantifies the positive or negative contributions that a company’s products and services
make towards achieving the UN Sustainable Develop-ment Goals. The new methodology also looks at each company’s strategy to further develop and future-proof its product portfolio in line with the concepts of sus-tainability.
In order to reach a comprehensive and balanced pic-ture of rated companies’ ESG performance, our analysts draw on relevant information both from the companies themselves and from independent sources. During the rating process, the analysts also enter into an active di-alogue with rated companies, giving them the opportu-nity to comment and expand on the results. Finally, an external rating committee supports oekom research’s analysts in shaping the content of sector-specific as-sessment criteria and checks the plausibility of the rat-ing results.
Alongside this ESG rating process, oekom research conducts additional analyses for all companies regard-ing their possible involvement in controversies in 20 topic areas. A distinction is made between controversial business areas, such as nuclear energy, fossil fuels or armaments, and controversial business practices, such as labour rights and human rights violations – for which three levels of severity are distinguished.
Thanks to their flexibility and depth, oekom’s analyses form the basis for a wide variety of sustainable invest-ment strategies, ranging from best-in-class approaches and the application of exclusion criteria to ESG integra-tion, impact investment and engagement.
In the following analysis, in order to ensure optimal comparability, the evaluation results – with regard to both ESG performance and UN Global Compact contro-versies – generally refer to two partial research univers-es. These universes, chosen for their relative stability between years, include large international companies and groups domiciled in:
• developed countries: a total of about 1,600 largecompanies – henceforth referred to as the Devel-oped Markets Universe (DMU);
• emerging countries: a total of about 800 large com-panies – henceforth referred to as the Emerging Mar-kets Universe (EMU).
Where the content allows, certain individual evaluation results refer to the entire oekom universe of approxi-mately 3,800 companies and groups. In all graphs, the research universe on which results are based is explic-itly indicated.
The number of companies individually assessed in the oekom universe has grown continuously in recent years and reached 3,800 at the end of December 2017. In addition, oekom research’s analysts are in the process of investigating to which extent the rating content of parent companies can be applied to their subsidiaries issuing bonds or shares. This is only done where the subsidiary’s ESG profile is similar or less problematic than that of the parent. So far, a further 2,000 affiliated issuers could be assigned in this way, bringing the oekom corporate universe to a total of almost 5,900 issuers.
OEKOM UNIVERSE OEKOM UNIVERSE
20 21

22 23
ESG Performance of Global Companies – an Overview
Comparison of industries
Long-term industry trends
Differences in performance between industrial and emerging countries
Top performers in each industry
Geographic distribution of sustainability leaders

2524
ESG Performance of Global Companies
Due to the constant change of the environmental, social and govern-ance-related framework conditions in which companies operate, the indi-cators used in the ESG rating are reviewed on a continuous basis. As a rule, this results in gradually increasing stringency in the assessment – when, for instance, regulatory conditions are tightened with stricter limit values or when the technical possibilities for reducing environmental impacts improve and thus raise the benchmark for best practice. In addition, the scope of the rating is often expanded to cover completely new and nascent areas, in order to provide research users with an early warning system of the potential future opportunities and risks that companies could face. The total results shown here are to be interpreted in the context of this contin-uous methodological development.
Although the demands on companies have increased over the years, the overall rating results have continued to improve (see figure 1). In other words, companies’ sustainability management has on the whole improved even more strongly than the diagram initially suggests.
Against this background, the developments of recent years, in particular be-tween 2016 and 2017, can be seen positively, both for large internationally active companies in developed markets (DMU) and for large companies from emerging markets (EMUs, figure 2). The overall evaluation of these compa-nies’ sustainability management and performance shows a slow but steady upward trend, which has gained momentum over the last two years.
The average score of all companies reviewed has also continued its upward trend. More and more countries are introducing mandatory reporting on ESG topics, helping to improve transparency – both in range and in depth – in rat-ing-relevant areas. Although improved transparency alone cannot initially be equated with improved performance, it provides fundamental information that allows analysts to identify companies’ ESG-related initiatives. Thus, transpar-ency can itself already lead to an improvement in companies’ scores, in par-ticular for those companies that were still situated at the lower range of the rating due to a basic lack of basic transparency on key sector risks.
At the same time, a generally higher awareness for the topic of sustainability can now be observed across the board. This may in part be due to stricter legal requirements, but it is also a reflection of the increasing economic relevance of sustainability issues, which feature ever more strongly in the decisions of many companies. This often reflects a response to customer demands, and is also the result of the increased attention that investors now pay to sustainabil-ity themes. The leverage of consumers and investors was recently corroborat-ed by oekom’s 2017 Impact Study, an empirical survey that also confirmed the important influence exerted on companies by sustainability rating agencies.
The proportion of DMU companies awarded the oekom Prime Status (clas-sification as “good” or “very good”) increased in the last year from 16.48% to just over 17.19%. This is partly a knock-on effect of the growing number of companies situated in the middle range. The group of companies with inter-mediate performance has been broadening steadily for several years, while an increasing number of these intermediate companies have now begun to move up into the Prime group.
The spread among Prime companies also reveals some interesting trends. A clear shift can be seen following the increase in the weighting of companies’ business models and products portfolios – assessed for their alignment with global sustainability targets, such as the SDGs – in the oekom Corporate Rat-ing. The proportion of companies whose products are rather harmful from a sustainability perspective has decreased continuously over recent years (see figure 3: examples taken from the Oil, Gas & Consumable Fuels, Automobile and Food & Beverages sectors). Concurrently, the proportion of companies from sectors developing possible solutions to global problems has grown, above all in the health care sectors (examples given in figure 3 based on the sectors Health Care Equipment & Supplies, Health Care Facilities & Services, Managed Health Care, and Pharmaceuticals & Biotechnology). From the com-panies’ perspective, this on the one hand follows clear ecological and social necessities; but on the other hand, it also mirrors changes in the purely eco-nomic opportunities and risks that they face.
“From 16.48 to 17.19%: the Prime quota in the industrial countries has reached a new high”
Looking beyond the minority of companies reaching the Prime threshold’s wide-reaching minimum sustainability standards, more than 2 in 5 companies now find themselves in the aforementioned middle range. The proportion of these companies, characterised by basic sustainability management, has now grown to 43.62% (from 40.15% in 2016). For the first time, it has thus now out-grown the group of laggard companies with a distinctly inadequate sustaina-bility performance. Of course, the latter group still represents a large propor-tion (39.19%) of all companies assessed, which is nevertheless disappointing in light of the growing urgency of many global sustainability problems. But the middle range’s remarkable growth (by 13.5% in the space of a few years) leaves us optimistic and gives us reason to hope that the acceleration will continue in years to come.
Fig. 3: Prime group: Proportion of companies with rather problematic products from a sustainability point of view (red) compared to the pro-portion of companies with potential solutions to global problems (green)
Fig. 1: Assessment of the sustainability performance of major international com-panies domiciled in developed countries (DMU) in a year-on-year comparison
Fig. 2: Assessment of the sustainabili-ty performance of major international companies domiciled in emerging market countries (EMU) in a year-on-year comparison
OVERVIEW OF ESG PERFORMANCE OVERVIEW OF ESG PERFORMANCE
43.6240.1535.8634.0730.09
39.1943.3147.8549.7253.14
17.0716.4816.1616.1516.71
0.120.060.130.060.06
2013 2014 2015 2016 2017
65.2670.4774.1477.3579.22
29.6524.3321.3819.1817.27
0.000.000.000.000.13
2013 2014 2015 2016 2017
5.095.204.483.473.38
11.30 %
5.80 %
10.30%
6.10%
7.50%
8.60%
poor medium good excellent
Share of companies in the Oil, Gas & Consumable Fuels, Automobile and Food & Beverage sectors.
Share of companies in the Health Care Equipment & Supplies, Health Care Facilities & Services, Managed Health Care as well as Pharmaceuti-cals & Biotechnology sectors.
2015 2016 2017
Matthias Bönning Head of IT & Research
ISS-oekom
26 27
31.51
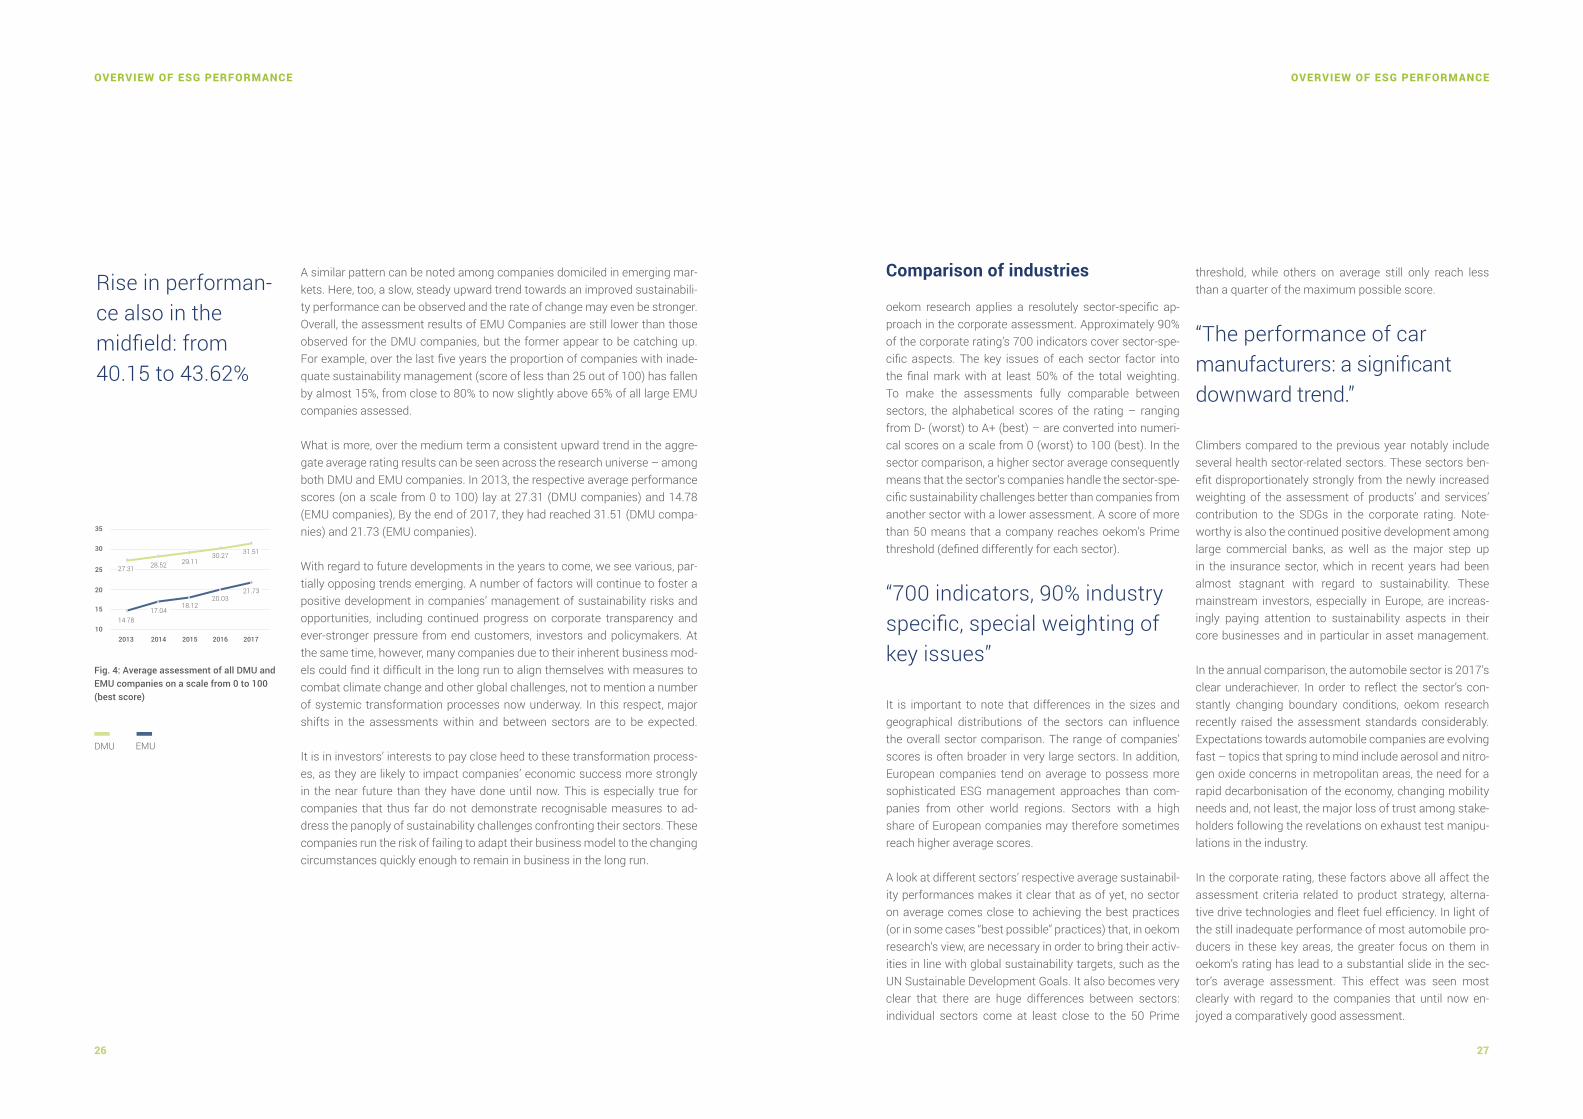
Rise in performan-ce also in the midfield: from 40.15 to 43.62%
Fig. 4: Average assessment of all DMU and EMU companies on a scale from 0 to 100 (best score)
A similar pattern can be noted among companies domiciled in emerging mar-kets. Here, too, a slow, steady upward trend towards an improved sustainabili-ty performance can be observed and the rate of change may even be stronger. Overall, the assessment results of EMU Companies are still lower than those observed for the DMU companies, but the former appear to be catching up. For example, over the last five years the proportion of companies with inade-quate sustainability management (score of less than 25 out of 100) has fallen by almost 15%, from close to 80% to now slightly above 65% of all large EMU companies assessed.
What is more, over the medium term a consistent upward trend in the aggre-gate average rating results can be seen across the research universe – among both DMU and EMU companies. In 2013, the respective average performance scores (on a scale from 0 to 100) lay at 27.31 (DMU companies) and 14.78 (EMU companies), By the end of 2017, they had reached 31.51 (DMU compa-nies) and 21.73 (EMU companies).
With regard to future developments in the years to come, we see various, par-tially opposing trends emerging. A number of factors will continue to foster a positive development in companies’ management of sustainability risks and opportunities, including continued progress on corporate transparency and ever-stronger pressure from end customers, investors and policymakers. At the same time, however, many companies due to their inherent business mod-els could find it difficult in the long run to align themselves with measures to combat climate change and other global challenges, not to mention a number of systemic transformation processes now underway. In this respect, major shifts in the assessments within and between sectors are to be expected.
It is in investors’ interests to pay close heed to these transformation process-es, as they are likely to impact companies’ economic success more strongly in the near future than they have done until now. This is especially true for companies that thus far do not demonstrate recognisable measures to ad-dress the panoply of sustainability challenges confronting their sectors. These companies run the risk of failing to adapt their business model to the changing circumstances quickly enough to remain in business in the long run.
Comparison of industries
oekom research applies a resolutely sector-specific ap-proach in the corporate assessment. Approximately 90% of the corporate rating’s 700 indicators cover sector-spe-cific aspects. The key issues of each sector factor into the final mark with at least 50% of the total weighting. To make the assessments fully comparable between sectors, the alphabetical scores of the rating – ranging from D- (worst) to A+ (best) – are converted into numeri-cal scores on a scale from 0 (worst) to 100 (best). In the sector comparison, a higher sector average consequently means that the sector’s companies handle the sector-spe-cific sustainability challenges better than companies from another sector with a lower assessment. A score of more than 50 means that a company reaches oekom’s Prime threshold (defined differently for each sector).
“700 indicators, 90% industry specific, special weighting of key issues”
It is important to note that differences in the sizes and geographical distributions of the sectors can influence the overall sector comparison. The range of companies’ scores is often broader in very large sectors. In addition, European companies tend on average to possess more sophisticated ESG management approaches than com-panies from other world regions. Sectors with a high share of European companies may therefore sometimes reach higher average scores.
A look at different sectors’ respective average sustainabil-ity performances makes it clear that as of yet, no sector on average comes close to achieving the best practices (or in some cases “best possible” practices) that, in oekom research‘s view, are necessary in order to bring their activ-ities in line with global sustainability targets, such as the UN Sustainable Development Goals. It also becomes very clear that there are huge differences between sectors: individual sectors come at least close to the 50 Prime
threshold, while others on average still only reach less than a quarter of the maximum possible score.
“The performance of car manufacturers: a significant downward trend.”
Climbers compared to the previous year notably include several health sector-related sectors. These sectors ben-efit disproportionately strongly from the newly increased weighting of the assessment of products’ and services’ contribution to the SDGs in the corporate rating. Note-worthy is also the continued positive development among large commercial banks, as well as the major step up in the insurance sector, which in recent years had been almost stagnant with regard to sustainability. These mainstream investors, especially in Europe, are increas-ingly paying attention to sustainability aspects in their core businesses and in particular in asset management.
In the annual comparison, the automobile sector is 2017’s clear underachiever. In order to reflect the sector’s con-stantly changing boundary conditions, oekom research recently raised the assessment standards considerably. Expectations towards automobile companies are evolving fast – topics that spring to mind include aerosol and nitro-gen oxide concerns in metropolitan areas, the need for a rapid decarbonisation of the economy, changing mobility needs and, not least, the major loss of trust among stake-holders following the revelations on exhaust test manipu-lations in the industry.
In the corporate rating, these factors above all affect the assessment criteria related to product strategy, alterna-tive drive technologies and fleet fuel efficiency. In light of the still inadequate performance of most automobile pro-ducers in these key areas, the greater focus on them in oekom’s rating has lead to a substantial slide in the sec-tor’s average assessment. This effect was seen most clearly with regard to the companies that until now en-joyed a comparatively good assessment.
27.31
17.04
21.73
201310
20
25
30
35
15
2014 2015 2016 2017
14.78
28.52
18.12
29.11
20.03
30.27
OVERVIEW OF ESG PERFORMANCE OVERVIEW OF ESG PERFORMANCE
DMU EMU

28 29
Similarly, in the Food & Beverages sector, the impact of product-related meth-odological changes has been largely negative, if somewhat less pronounced than for auto companies. The stronger focus on product portfolios’ contribu-tions to the achievement of the SDG objective “Achieving Health” has resulted in a decrease in the sector’s average rating results. This fall from grace stands in stark contrast to the corresponding improvement in health care companies’ assessments, whose products’ positive impacts are less disputed.
Side note: Slow movement – the Metals & Mining sector
Sector improvements can also be seen in areas where they might at first glance be unexpected. In the 2017 oekom Corporate Rating, the Metals & Mining sector was able to gain considerable ground (relative to the entire DMU portfolio). The sector comprises companies special-ised in mining and industrial metal processing, as well as a number of integrated groups that cover multiple steps between raw material ex-traction and the production of raw metals or metal-based components.
Triggered by the constantly growing pressure exerted by civil society and investors, and in some cases also due to the potential liability risks in the event of accidents, the sector as a whole has made progress on various key topics over the past few years. For instance, following the dam breach at the Rio Doce in Brazil at the end of 2015, both the International Council of Metals and Mining (ICMM, a global industry association) and other mining companies not affiliated with the ICMM revised their standards for tailings management and/or improved rele-vant policies and management systems.
In addition, more and more companies in the sector acknowledge their responsibility to protect human rights and are taking measures to fulfil their duty of care in the area. Historically, the pressure to change has come mainly from civil society and from various political initiatives to recognise the human rights obligations of multinationals. In recent times, investors have been playing an important role by articulating their expectations to companies and ensuring that changes take place. The Interfaith Center on Corporate Responsibility (ICCR), an US group of ethical investors, has recently initiated the “Investor Alliance for Human Rights” to push for further progress among large companies. Considering the high proportion of companies with controversies in the area of human rights, it is clear that there is still a lot of work to be done.
Despite the above-mentioned positive developments, however, the cen-tral sustainability challenge for the sector remains the conservation of natural resources, in other words the long-term transformation from the extraction of limited resources to a closed-loop model in line with the circular economy. Companies with strategic initiatives to transi-tion their business models towards recycling are few and far between.
Constanze Boulanger, Senior Analyst
Constanze BoulangerSenior Analyst
“Triggered by pressure from civil society and investors, among others, the Metals & Mining industry showed showed progress in some key areas last year.”
Fig. 5: Climbers and underachievers compared to the previous year; as at: 31 December of the respective year
overall change average performance2016
average performance2017
OVERVIEW OF ESG PERFORMANCE OVERVIEW OF ESG PERFORMANCE
Health Care Equipment & Supplies
Health Care Facilities & Services
Insurance
Metals & Mining
Pharmaceuticals & Biotechnology
Financials / Commercial Banks & Capital Markets
Food & Beverages
Electronic Components
Automobile
5.6829.80
35.47
5.4735.71
41.18
3.7026.14
29.84
2.9830.90
33.88
2.8931.33
34.22
-1.8834.43
32.55
-6.3546.48
40.13
-1.7933.34
31.55
29.693.39
33.08

30 31
Side note: Healthy food and corporate responsibility
The Food & Beverages industry is as closely intertwined with the at-tainment of global sustainability as any sector. Its largely negative impacts on difficult areas such as climate, water and biodiversity are mitigated by the sector’s principal and central positive impact, namely the supply of food to an ever-growing world population.
In this context, the health impacts of the sector’s products have in-creasingly become the subject of attention in recent years. Due to their strong influence over the food options available on the market, Food & Beverages companies bear a large responsibility. The need for action is immense: the product portfolios of a large majority of com-panies still largely consist of products whose regular consumption is associated with negative health impacts. These include, in particular, industrially processed foodstuffs containing high levels of saturated fatty acids, salt, sugar and artificial additives, often in addition to a high calory content.
Companies can be roughly divided into three groups regarding their response to this challenge:
1. Only a very small proportion addresses the topic systematically,such as by defining concrete reduction targets for whole productgroups. Kellogg‘s, for example, has adopted a target to reduce thesalt content of its breakfast cereals by 30% by 2020 compared to a2007 baseline.
2. A larger group of companies has introduced new versions of exist-ing products with improved nutritional value, but the extent of theseefforts is often limited. Moreover, these new products are often rath-er questionable from a health perspective and merely serve to ex-pand the existing product portfolio. The original products generallycontinue to be widely advertised and, as a rule, to account for a large share of sales.
3. The third group of companies, also large, acknowledges its respon-sibility in the area either only half-heartedly or not at all, continuinginstead to pass the responsibility on to end customers.
Malte Kolb, Senior Analyst
Malte KolbSenior Analyst
“Due to their strong influence on food supply, companies in the industry have a great res-ponsibility with regard to consumer health.”
Meanwhile, the rating results of the Electronic Components sector – one of last year’s rising stars in the sector comparison – have also fallen. This is not, however, due to content-related reasons, but has rather occurred for purely technical reasons: the sector coverage has been substantially expanded, in large part by companies that demonstrate a comparatively weak ESG perfor-mance, thus causing the sector average to fall.
In a similar way, what appears at first sight to be a slight upward trend in the Transport & Logistics sector’s average assessment is primarily due to the inte-gration at the end of 2017 of the – previously separate – Rail subsector, which on average achieves relatively high rating results.
Fig. 6: Average assessment of the companies from selected sectors in developed market countries on a scale from 0 to 100 (best score)
OVERVIEW OF ESG PERFORMANCE OVERVIEW OF ESG PERFORMANCE
Household & Personal Products Health Care Facilities & Services
SemiconductorsAutomobileMachinery
Health Care Equimpment & SuppliesTelecommunications
Auto ComponentsFin./Commercial Banks & Capital Markets
Electronic Devices & AppliancesPharmaceuticals & Biotechnology
Textiles & ApparelMetals & Mining
Electronic Components Utilities
Transport & LogisticsFood & Beverages
Software & IT ServicesConstruction Materials
Fin./Asset Managers & Security BrokeragesMedia
ChemicalsInsurance
ConstructionOil, Gas & Consumerable Fuels
RetailReal Estate
43.0741.1840.5140.13
35.9635.4734.9634.82
34.2234.0933.8833.2733.0832.5532.0731.8931.5531.4231.2530.9930.85
30.1229.8429.49
25.0524.53
23.48

32 33
Side note: High transformation pressure and good initiatives
With a 24% share (2015) of global CO2 emissions, the transport sector is the second-largest CO2 emitter worldwide. It thus has an important role to play in achieving the Paris climate targets. In Germany alone, transport-related emissions must decrease by 95% until 2050, which comes close to complete decarbonisation. If this ambitious goal is to be achieved in the transport sector, biofuel, natural gas or liquid natural gas (LNG) can only serve as bridge technologies during the near-complete transition to e-mobility.
Postal service providers are today leading the vanguard of Transport & Logistics companies, demonstrating with positive examples how this future could be achieved. The share of electric and hybrid vehicles in their fleets is already considerable, and several seek to develop propri-etary electric vehicles. In a similar vein, certain postal companies are also taking a leading role regarding targets to reduce greenhouse gas emissions. For example, the International Post Cooperation, a union of 24 postal companies, has set a scientifically substantiated green-house gas emissions target for its members, based on the 2-degree target of the Paris Climate Agreement.
Trailing far behind them are the companies of the aviation and ship-ping industries, regarding both the definition of similarly ambitious tar-gets for greenhouse gas emissions and the development and adoption of alternative drive systems in their fleets. Isolated initiatives in ship-ping are currently concentrated on the use of LNG, methane and wind power, but as yet the share of alternative drive systems in companies’ fleets is still negligible. In the aviation sector, the use of alternative drive systems is currently principally limited to the partial use of biofuels. Although research into the possible uses of hybrid and electric drives in aviation is underway, with the promise to break current dependence on fossil fuels, for technical and financial reasons commercial applica-tions still seem unlikely to materialise in the near future.
Regina Warth, Senior Analyst
Regina WarthSenior Analyst
“Within the trans-port and logistics sector, the postal service providers in particular are leading by positive example.”
Long-term industry trends
The slight upward trend over the past few years in oekom’s corporate rating re-sults (described in chapter 1.2. above) is also reflected largely in the sector-lev-el year-on-year trends. In many sectors, a slow but steady increase in the sector average can be observed. At the same time, this year’s results reveal a more var-ied picture than the previous year. Due once more to the stronger consideration of the sustainability contributions of companies’ product portfolios against the background of the SDGs (in the oekom Corporate Rating), a clear turning point can be seen in the long-term progression of some sectors’ average perfor-mances – notably in the Automobile or Food & Beverages sectors (see figure 7).
If considered a seven-year “sustainability profit-and-loss statement” of sorts, this comparison also demonstrates the striking disparity in the speed of different sectors’ progress towards better sustainability performance. Some appear to stagnate over the years while other sectors have made marked improvements over the years.
Fig. 8: Absolute change in the average assessments of selected sectors between 2010 and 2017
6.29
Fig. 7: Average assessments of companies from selected sectorsin recent years, on a scale from 0 to 100 (best score)
2010 2011 2012 2013 2014 2015 2016 201710
20
30
40
50Automobile
Financials / Commercial Banks & Capital Markets
Food & Beverages
Insurance
Oil, Gas & Consumable Fuels
Pharmaceuticals & Biotechnology
Utilities
OVERVIEW OF ESG PERFORMANCE OVERVIEW OF ESG PERFORMANCE
UtilitiesTelecommunications
Pharmaceuticals & BiotechnologyOil, Gas & Consumable Fuels
Insurance Household & Personal Products
Food & BeveragesFin. / Commercial Banks & Capital Markets
ChemicalsAutomobile
7.087.01
4.292.45
-2.560.6
13.198
-2.52

34 35
Differences in performance between industrial and emerging countries
For the first time this year, oekom’s annual CR Review also undertakes a comparison of sector performances between industrialised countries and emerging countries. This comparison is somewhat influenced by differences in size and in geographic distribution of the each sector’s research universe. Nevertheless, some interesting find-ings can be deduced.
As is to be expected, the overall level of average assess-ments in emerging countries is significantly lower – by approximately 10% on average. The gap is significantly narrower, however, in sectors where listed companies in emerging countries principally operate as suppliers to companies in industrial countries – and nowhere more so than in the IT-related sectors. One reason for this is that these contract manufacturers often receive clear ESG guidelines from their corporate buyers, requiring them to avoid the use of harmful substances and to apply and monitor minimal working standards, for example. Many of these companies consequently demonstrate a very
high degree of transparency and are often just as active in relevant industry initiatives as their counterparts from industrial nations. In the Electronic Components sector, this even leads remarkably to the average assessment of EMU companies outpacing that of the DMU comparison group at the end of 2017 .
In the Oil, Gas & Consumable Fuels sector, meanwhile, there is also only a narrow difference in the averages of DMU and EMU companies, but the reasons are quite dif-ferent. While as in the IT sectors, many of the EMU oil & gas companies meanwhile demonstrate a comparatively high degree of transparency in their ESG reporting – such as in Thailand or in India – the most important reason is that the DMU average is based on very heterogeneous individual assessments. European companies in the sec-tor are, generally speaking, progressively switching to fu-els that are less harmful to the climate, such as natural gas, and demonstrate higher investments in the area of alternative energies. But the majority of US and Canadian companies are lagging behind, in particular with regard to regressive climate policies and problematic activities in areas such as fracking and oil sands. In many cases,
Fig. 9: Average assessments of companies in selected sectors from emerging market countries, on a scale from 0 to 100 (best score)
their ESG performance is actually poorer than the results of their peers from emerging countries. The disappoint-ing ratings of many North American companies thus drag down the overall average of DMU oil & gas companies.In many other sectors, the comparison of the average scores produces disproportionately large differences between industrial and emerging market countries. The Financials/Commercial Banks & Capital Markets sector illustrates this well. In recent years, many banks in indus-trial nations have ramped up their efforts to integrate ESG issues into their core businesses, notably in asset man-agement and in the lending business. Among emerging market companies, such developments are so far only seen in isolated cases. But the proportion of EMU banks active on sustainability topics is growing and in the years to come, a gradual narrowing of the assessment gap be-tween industrial and emerging market countries can be expected in this sector.
Top performers in each industry
The lists of the top three companies per sector contain mainly companies that have been active in the area of sustainability for many years and have successfully and systematically integrated important sustainability topics into their activities. They accordingly perform compara-tively well in the oekom Corporate Rating. Nevertheless, these companies also face significant challenges. The framework ESG conditions in which they operate are changing ever more rapidly. Their current strategic ad-vantage may well allow them to adapt to new challenges faster than their competitors in the coming years, But one must ask: might they eventually be outdistanced by com-panies with completely new business models and more sustainable products?
In certain sectors, such a shift has already occurred – in the Oil, Gas & Consumable Fuels sector, for instance. Where historically, conventional, integrated oil companies were often at the top of the sector ranking, for some time now these positions have been occupied by gas pure play-ers. Gas is a less problematic fossil fuel than oil, in particu-lar from a climate perspective. At the end of 2017, for the
first time, there were no longer any classic oil companies in the top three.Similarly, in the Construction Materials sector, the classic construction materials companies have now been over-taken by new arrivals generating a significant share of their turnover from segments with ecological benefits, in particular insulation materials.In the Utilities sector, the top three ranking has also com-pletely changed in the 2017 assessment, but the reason for this is purely methodical. In recent years, the top spots were occupied by network operators, which have now been spun off into a separate sector. This means that pow-er plant operators with the most ecologically sound ener-gy mixes now lead the Utilities sector’s ranking. Likewise, recent movements in the Transport & Logistics sector are mainly due to technical reasons following the integration of companies from the hitherto separate rail division.
“Transformation within the Oil, Gas & Consumable Fuels sector: natural gas pure play-ers are now in the lead.”
In addition, across all sectors, the ranking has also changed substantially due to the enlargement of the ref-erence universe used for the calculation. Until last year, oekom’s annual “top three” lists were only published for large listed companies from industrial market countries (DMU). This year‘s results are for the first time based on the entire oekom Corporate Rating universe, meaning that the ranking now also includes all rated companies from emerging markets, as well as small and mid-cap compa-nies and unlisted bond issuers. This expanded scope has been introduced to better reflect the worldwide leading companies in each sector.
OVERVIEW OF ESG PERFORMANCE OVERVIEW OF ESG PERFORMANCE
SemiconductorsElectronic Components
Household & Personal ProductsElectronic Devices & Appliances
Construction MaterialsSoftware & IT Services
UtilitiesMetals & Mining
Oil, Gas & Consumable FuelsAutomobile
TelecommunicationsInsurance
Transport & LogisticsFood & Beverages
ConstructionFin./Commercial Banks & Capital Markets
Auto ComponentsPharmaceuticals & Biotechnology
ChemicalsMachinery
Transportation InfrastructureRetail
Textiles & ApparelTrading Companies & Distributors
Real Estate 8.9712.6813.6214.4915.17
16.8316.9017.0417.77
19.0119.31
21.0321.3121.60
23.7724.2424.3424.3824.8925.27
27.4330.78
33.1537.4238.24

36 37
Table : The top three companies in selected sectors; basis: entire oekom corporate universe
Fig. 10: Number of top three ranked companies according to home country; basis: entire oekom corporate universe
Sector # 1 # 2 # 3
Auto Components Valeo S.A. FR B- Georg Fischer AG CH C+ZF Friedrichshafen AG
DE C+
Automobile Peugeot S.A. FR C+ Tesla Inc. US C+Bayerische Motoren Werke AG
DE C+
ChemicalsEvonik Industries AG
DE B- Covestro AG DE B- BASF SE DE B-
ConstructionBerkeley Group Holdings plc/The
GB C+ VINCI S.A. FR C+Salini Impregilo S.p.A.
IT C+
Construction Materials Geberit AG CH B Owens Corning US B-Rockwool Internatio-nal A/S
DK B-
Electronic ComponentsSchneider Electric S.E.
FR B Philips Lighting N.V. NL B OSRAM Licht AG DE B-
Electronic Devices & Appliances
Telefonaktiebola-get LM Ericsson
SE B- HP Inc. US B-Koninklijke Philips N.V.
NL B-
Financials/Asset Managers & Securities Brokerages
Amundi FR C+Standard Life Aberdeen plc
GB CBank J. Safra Sara-sin AG
CH C
Financials/Commercial Banks & Capital Markets
De Volksbank N.V. NL C+ABN AMRO Group N.V.
NL C+Raiffeisen Bank International AG
AT C+
Food & BeveragesCoca-Cola Euro-pean Partners plc
GB B- Nestlé S.A. CH C+ Danone FR C+
Health Care Equipment & Supplies
Drägerwerk AG & Co. KGaA
DE B- Sonova Holding AG CH B- Coloplast A/S DK C+
Household & Personal Products
Henkel AG & Co. KGaA
DE B L'Oréal S.A. FR B- Essity AB SE B-
InsuranceCNP Assurances S.A.
FR B- Swiss Re AG CH C+ Allianz SE DE C+
Machinery Atlas Copco AB SE B- AB Volvo SE B- SKF AB SE B-
Media RELX PLC GB B- Pearson plc GB C+ Sky plc GB C+
Metals & Mining Norsk Hydro ASA NO BAnglo American Platinum Ltd.
ZA B-Newmont Mining Corp.
US B-
Oil, Gas & Consumable Fuels Enagás, S.A. ES B ERG S.p.A. IT B- Snam S.p.A. IT B-
Pharmaceuticals & Biotechnology
Sanofi FR B-GlaxoSmithKline plc
GB B- Merck & Co. Inc. US B-
Real EstateBritish Land Com-pany Plc
GB B- Gecina FR C+ Unibail-Rodamco SE FR C+
Sector # 1 # 2 # 3
RetailCoop Group Cooperative
CH B-Marks and Spencer Group plc
GB C+ Tesco PLC GB C+
SemiconductorsTaiwan Semicon-ductor Manufactu-ring Co. Ltd.
TW B-STMicroelectronics N.V.
CH B- Intel Corp. US B-
Software & IT Services SAP SE DE B- Microsoft Corp. US B-International Business Machines Corp.
US B-
TelecommunicationsMagyar Telekom Telecommunica-tions PLC
HU BDeutsche Telekom AG
DE B AT&T Inc. US B-
Textiles & ApparelGildan Activewear Inc.
CA B-H & M Hennes & Mauritz AB
SE C+Industria de Diseño Textil, S.A.
ES C+
Transport & Logistics Deutsche Bahn AG DE B-Canadian National Railway Co.
CA B- Air France-KLM S.A. FR C+
Utilities Ørsted A/S DK B VERBUND AG AT BKraftwerke Lin-th-Limmern AG
CH B
Utilities / Network Operators Alliander N.V. NL B+Red Eléctrica Corp., S.A.
ES B+TERNA - Rete Elett-rica Nazionale SpA
IT B
Geographic distribution of sustainability leaders
In terms of the geographic distribution of best-in-sector companies, even in the newly expanded basis universe, European companies continue to dom-inate. 85% of all top-three companies are domiciled in Europe, whereas Eu-ropean companies only make up around 45% of the total research universe. The highest numbers of companies in the top three positions come from Germany and France, followed by the United Kingdom. Some countries have become more present in the ranking compared to the previous year, such as Switzerland: following the expansion of the reference universe, sev-eral smaller or unlisted Swiss companies are now included in the ranking of worldwide sustainability leaders. The USA also achieves more top-three positions than it did a year ago. In contrast, not a single Japanese compa-ny remained in the top-three rankings at the end of 2017; at the end of 2016 there were still four companies from Japan in the list, albeit all in third place.
12
DE
10
GB
9
CH
9
US
6
SE
5
NL
12
FR
OVERVIEW OF ESG PERFORMANCE OVERVIEW OF ESG PERFORMANCE
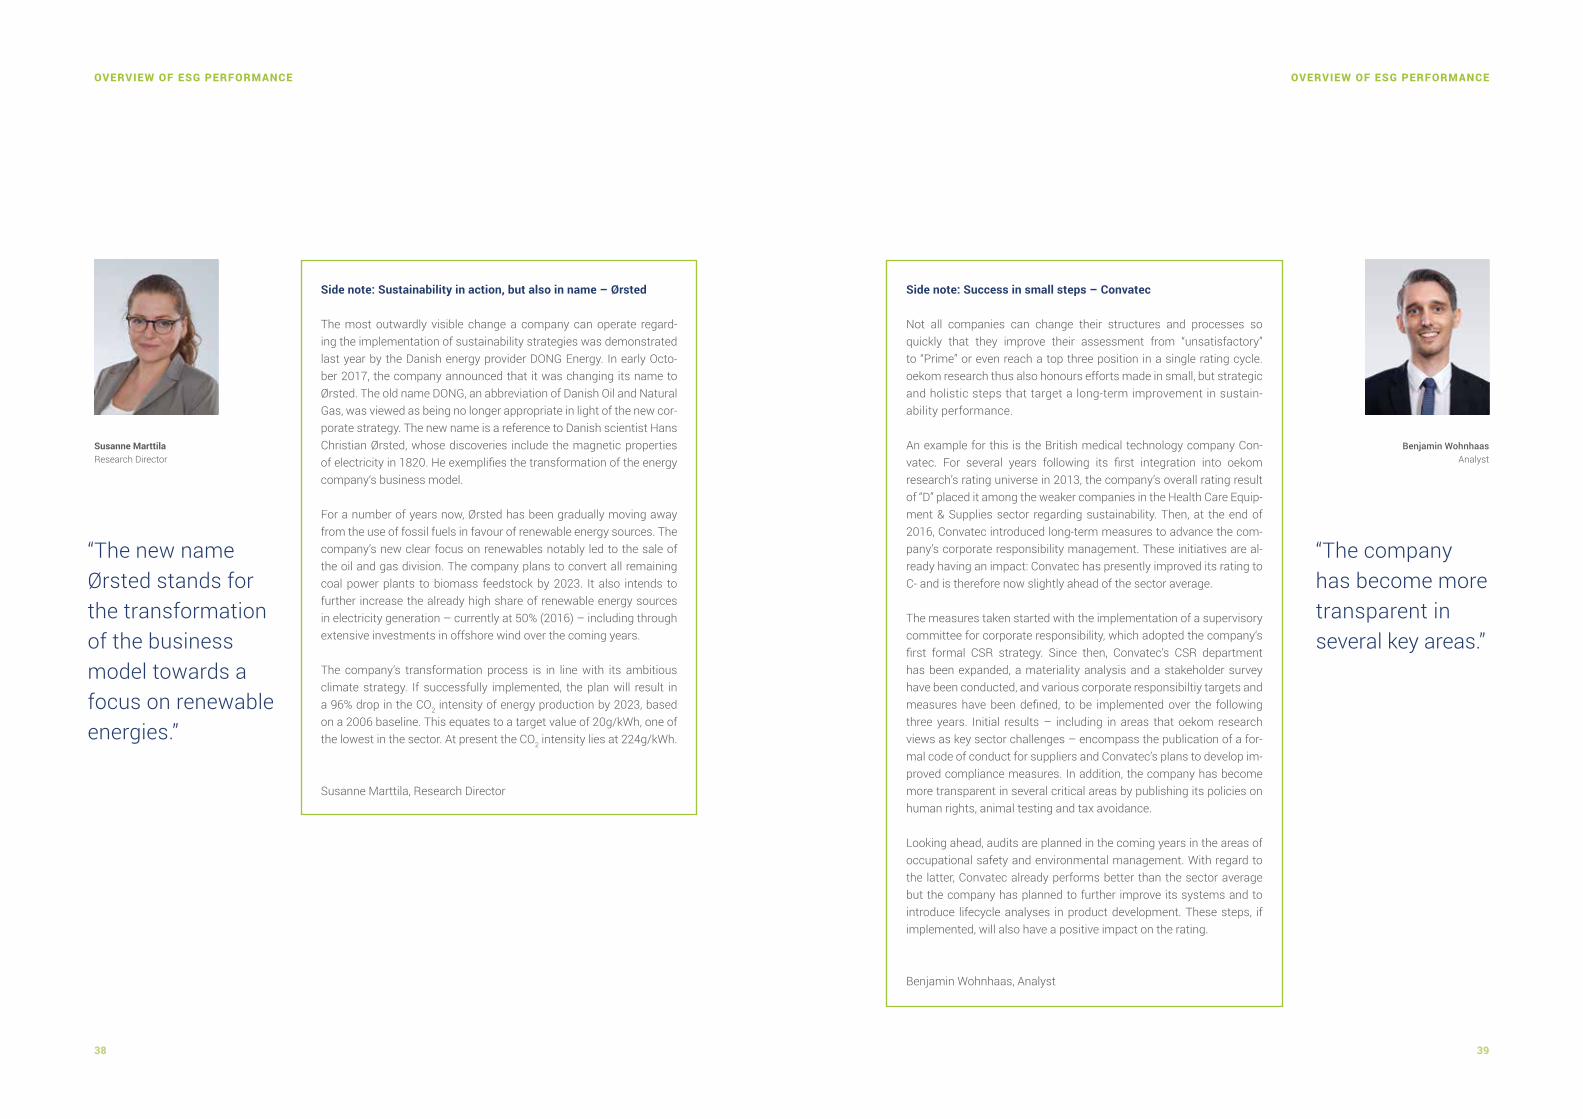
38 39
Side note: Sustainability in action, but also in name – Ørsted
The most outwardly visible change a company can operate regard-ing the implementation of sustainability strategies was demonstrated last year by the Danish energy provider DONG Energy. In early Octo-ber 2017, the company announced that it was changing its name to Ørsted. The old name DONG, an abbreviation of Danish Oil and Natural Gas, was viewed as being no longer appropriate in light of the new cor-porate strategy. The new name is a reference to Danish scientist Hans Christian Ørsted, whose discoveries include the magnetic properties of electricity in 1820. He exemplifies the transformation of the energy company‘s business model.
For a number of years now, Ørsted has been gradually moving away from the use of fossil fuels in favour of renewable energy sources. The company’s new clear focus on renewables notably led to the sale of the oil and gas division. The company plans to convert all remaining coal power plants to biomass feedstock by 2023. It also intends to further increase the already high share of renewable energy sources in electricity generation – currently at 50% (2016) – including through extensive investments in offshore wind over the coming years.
The company’s transformation process is in line with its ambitious climate strategy. If successfully implemented, the plan will result in a 96% drop in the CO2 intensity of energy production by 2023, based on a 2006 baseline. This equates to a target value of 20g/kWh, one of the lowest in the sector. At present the CO2 intensity lies at 224g/kWh.
Susanne Marttila, Research Director
Side note: Success in small steps – Convatec
Not all companies can change their structures and processes so quickly that they improve their assessment from “unsatisfactory” to “Prime” or even reach a top three position in a single rating cycle. oekom research thus also honours efforts made in small, but strategic and holistic steps that target a long-term improvement in sustain-ability performance.
An example for this is the British medical technology company Con-vatec. For several years following its first integration into oekom research’s rating universe in 2013, the company’s overall rating result of “D” placed it among the weaker companies in the Health Care Equip-ment & Supplies sector regarding sustainability. Then, at the end of 2016, Convatec introduced long-term measures to advance the com-pany’s corporate responsibility management. These initiatives are al-ready having an impact: Convatec has presently improved its rating to C- and is therefore now slightly ahead of the sector average.
The measures taken started with the implementation of a supervisory committee for corporate responsibility, which adopted the company‘s first formal CSR strategy. Since then, Convatec’s CSR department has been expanded, a materiality analysis and a stakeholder survey have been conducted, and various corporate responsibiltiy targets and measures have been defined, to be implemented over the following three years. Initial results – including in areas that oekom research views as key sector challenges – encompass the publication of a for-mal code of conduct for suppliers and Convatec’s plans to develop im-proved compliance measures. In addition, the company has become more transparent in several critical areas by publishing its policies on human rights, animal testing and tax avoidance.
Looking ahead, audits are planned in the coming years in the areas of occupational safety and environmental management. With regard to the latter, Convatec already performs better than the sector average but the company has planned to further improve its systems and to introduce lifecycle analyses in product development. These steps, if implemented, will also have a positive impact on the rating.
Benjamin Wohnhaas, Analyst
Susanne Marttila Research Director
Benjamin WohnhaasAnalyst
“The new name Ørsted stands for the transformation of the business model towards a focus on renewable energies.”
“The company has become more transparent in several key areas.”
OVERVIEW OF ESG PERFORMANCE OVERVIEW OF ESG PERFORMANCE

40 41
Opportunities and Risks: Product Portfolios and Climate Management
Opportunities: How products and services contribute
to the achievement of the SDGs
Risks: Selected results on climate performance

42 43
Alongside the overview of companies’ and sectors’ general ESG performance, it was decided in this year’s CR Review to delve into certain detailed aspects that are gaining in significance as parts of the broad sustainability analysis. These include the assessment of products’ and services’ contributions to sustaina-ble development, in line with the UN SDGs, as well as the exposure to climate risks in companies’ production lines, supply chains and product portfolios.
Opportunities: How products and services contribute to the achievement of the SDGs
The oekom Sustainability Solutions Assessment follows a total of 15 sustain-ability objectives, derived from the UN SDGs, according to which the positive or negative impact of products and services is assessed. The 15 objectives are divided into 7 social and 8 environmental areas. Examples of social ob-jectives are “alleviating poverty” and “safeguarding peace”. The environmental objectives include fighting climate change and protecting global ecosystems, for example.The results are aggregated in the form of the oekom Sustainability Solutions Score (oSSS), based on the classification of the products and their respec-tive share in the total turnover of a company. The oSSS scale ranges from -10 (strongly negative contribution to the objective in question) to 10 (stronglypositive contribution) and is divided into five assessment categories:
Performance of product portfolios
As of the end of 2017, 2,315 companies out of the 3,800 in the global research universe had been assessed according to the new sustainability solutions methodology. 7.8% of them can be classed as sustainability leaders whose product and service offerings fall into the “significant contribution” category. In other words, a high percentage of their products and services make a strong, positive contribution to the achievement of one or several sustainability objec-tives. This group in particular includes many specialised providers of solutions to sustainability challenges, such as education services, health care services, medical products or clean technology.A further 28.3% of the companies assessed to date fall into the “limited contri-bution” category. They either generate only a relatively low proportion of turn-over with strongly positive-impact products or market mainly products with a limited, less direct positive impact on the key sustainability objectives in their sector. Overall, more than a third of all companies assessed thus contribute in
a strong or moderate way to the achievement of the SDGs. At 41.9%, the largest share of the reference universe are currently situated in the “no net impact” range. Some of these companies only sell products or ser-vices with no direct, inherent sustainability impact (although their activities – production lines, supply chains and so forth – may still generate positive ornegative impacts, assessed elsewhere in the corporate rating). Other compa-nies in this group simply generate a similar proportion of their turnover withpositive and negative products.
At the other end of the scale, companies in the “limited obstruction” category (15%) either primarily sell products with a slightly negative sustainability im-pact or generate a low share of their turnover from strongly negative-impact products. And finally, a good 7% of product portfolios are assessed in the “sig-nificant obstruction” category, meaning that a high proportion of the products and services marketed by the companies in question directly and significantly obstruct the achievement of one or more sustainability goals. This group con-tains, amongst others, many of the oil companies, arms manufacturers, and alcohol and tobacco producers assessed in oekom’s corporate ratings. A detailed insight into the product portfolio performance of selected sectors is given in Fig. 12, which depicts the range of company-level scores in each sector (horizontal lines) as well as the respective average value (small circles along the lines):
The highest average oSSS – at 8.4 and 7.9, respectively - is achieved by the Pharmaceuticals & Biotechnology and Cleantech sectors. Particularly large spreads in the assessment results, meanwhile, can be seen in the Utilities, Net-
Opportunities and Risks: Product Portfolios and Climate Management
Fig. 11: Distribution of the oekom Sus-tainability Solutions Scores across all companies assessed to date in the oekom universe (n = 2,315)
OPPORTUNITIES AND RISKS OPPORTUNITIES AND RISKS
15.03 %
41.86 %
7 %
7.82 %
28.29 %
Significant obstruction-10.0 to -5.0
Limitedobstruction-4.9 to -0.2
No net impact-0.1 to 0.1
Limited contribution0.2 to 4.9
Significant contribution5.0 to 10.0
Pharmaceuticals & BiotechnologyCleantech
Health Care Facilities, Equipment & ServicesTelecommunications
Utilities & Network OperatorsFin./Commercial Banks
& Capital MarketsTransport & Logistics
ChemicalsRetail
MachineryAerospace & Defence
Food & BeveragesAutomobile
Oil, Gas & Consumable FuelsTobacco
-10 -5 5 100
8.4
7.9
6.6
1.5
-0.1
-0.6
-2.8
-3.5
-3.9-6.1
-8.4
0.0
0.4
-0.1
-0.1
Fig. 12: Sector comparison of the oekom Sustainability Solutions Scores of selected sectors: average value and range of company-level scores on a scale from -10 (strongly negative contri-bution to the objective in question) to 10 (strongly positive contribution)
Lisa Kim BreitenbruchSenior Analyst

44 45
work Operators and Food & Beverages sectors, showing a strong divergence between companies within the sectors. In the food industry, for example, the product portfolio assessment is strongly weighted towards the nutritional and health value of companies’ products as well as their contribution to sustainable agriculture (substantiated by relevant certifications). Here, the oSSS ranges from -10 – a score achieved by companies producing high-alcoholcontent beverages, such as Bacardi – to 7.1 for the vege-table producer Bonduelle.
In many sectors, the average oSSS ranges around the 0 mark (no net impact) – independent of the range of in-dividual scores recorded. In other words, in a majority of sectors, on average (although not at the individual com-pany level) the products and services do not have a clear positive or negative impact. By contrast, the tobacco sec-tor is characterised both by its relatively narrow spread and by a particularly bad average score of -8.4. The rela-tively broad assessment spreads in the likewise (on aver-age) poorly rated oil & gas and automobile sectors show that here, at least, individual pioneering companies have been able to begin shifting their business models towards less harmful products (such as gas) and positive-impact solutions (such as e-mobility).
Risks: Selected results on climate performance
At the beginning of 2018, the Global Risk Report published annually at the World Economic Forum in Davos attracted wide attention. Three of the five main risks identified for the economy and worldwide prosperity - both according to the probability of their occurrence and to the magnitude of the expected consequences - relate directly to the en-vironment and especially to climate change. They include extreme weather events, natural catastrophes and the risk of a disintegration of global climate protection and adaption efforts.
The growing relevance of companies’ climate perfor-mance is reflected by a dedicated overview of the topic in this year’s CR Review. The following cross-sector as-sessment of climate performance expands on the more general discussion above.
The oekom Carbon Risk Rating (oCRR) is a comprehen-sive assessment of companies‘ current management of the climate risks and impacts to which their business-es are exposed. Measured on a scale from 0 (worst) to 100 (best), the oCRR is based on more than a hundred qualitative and quantitative indicators, most of them sec-tor-specific. The swathe of issues taken into account in-cludes production lines, supply chains and product port-folios. The score’s calculation also integrates a sector and sub-sector classification of climate risk exposure. As a consequence, the oCRR extends far beyond a mere assessment of the status quo or of isolated key figures. Rather, it delivers a comprehensive climate and carbon performance assessment that gives due consideration to forward-looking targets and strategic transformation processes.
Current climate performance
At the end of 2017, the average oekom Carbon Risk Rating of all companies in the oekom universe stood at a rather underwhelming score of 25.7 (out of 100).As shown in Fig. 13, more than half the companies as-sessed are currently still classified as “climate laggards”.These companies appear to underestimate the risks of climate change and associated transformation process-es and are not yet addressing them adequately. A further third of all rated companies fall into the category of “cli-mate underperformers”, meaning that they have begun to address the topic, but as yet have only taken measures with superficial impact or limited scope. The proportion of companies that can at present be seen as “climate per-formers” (score of 50 to 75) or even “climate leaders” (75 to 100) stands, at a meagre 5.6% and 2.8%, respectively, of the global universe. Not all sectors are equally prepared and strong differences in climate performance can be seen between sectors. This is clearly illustrated by the se-lected examples in Fig. 14.
Fig. 13: Distribution of the oekom Carbon Risk Rating; entire oekom universe
Fig. 14: Comparison of the oekom Carbon Risk Rating of selected sectors: Average values and assessment range
Climate Laggard0 - 24
Climate Underperformer25 - 49
Climate Perfomer50 - 74
Climate Leader75 - 100
34.28%
2.82 %57.27 %
5.61 %
Climate Leader
Climate Performer
Climate Underperformer
Climate Laggard
The highest average oCRR (represented by dots in Fig. 14) - at 94.5 out of 100 - is reached by the two renewables sectors: Renewable Energy Operation andRenewable Energy & Energy Efficiency Equipment.After a substantial lead, they are followed by the Utilities sector, which also still achieves a comparatively high average score of 39.0. That said, the disparities in performance among Utilities companies (represented by the length of thevertical line in Fig. 14) are especially broad, ranging from 0 to 85 on the oCRRscale. This is due to a variety of factors. On the one hand, the Utilities sector ismore directly exposed to climate risks than many other sectors. On the otherhand, it is up to the companies themselves to minimise their risk exposure, inparticular through the choice of energy sources used to generate electricityor heat. For a majority of sectors, the average oCRR ranges between 20 and30 – in the “climate underperformer” range – with a more or less pronouncedspread. The average performance of the Oil, Gas & Consumable Fuels sector is particularly worrying with an average score of 9.8 accompanied by a remarka-bly low spread in company-level scores.
Even if the first “climate performers” and “climate leaders” are now appearing in many sectors (see vertical lines crossing the ‘50’ threshold in Fig. 14), it seems as if a majority of companies are still held back by the many uncer-tainties that accompany climate change. There is reason to hope that this is starting to change. At the end of January 2018, 89 companies had adopted so-called “science-based targets” recognised by the Science-Based Target initiative (SBTi). Considered a best practice in the oekom Corporate Rating, this refers to an emissions reduction target that is explicitly aligned with the achievement of the 2-degree target set out in the Paris Climate Agreement. A further 250 companies have pledged to develop science-based targets in the near future.
OPPORTUNITIES AND RISKS OPPORTUNITIES AND RISKS
27.62
Renewable Energy (Operation) & Energy Efficiency EquipmentUtilities & Network Operators
Electronic ComponentsTransport & Logistics
Financials / Commercial Banks & Capital Markets
MachineryTransportation Infrastructure
Food & BeveragesOil & Gas Equipment / Services
Oil, Gas & Consumable Fuels0 10050
25.87
94.48
29.29
39.01
9.82
13.89
20.52
21.29
21.63

46 47
When Corporate Responsibility falls short: Controversial Activities
Focus on controversial business practices
Corruption
Labour rights controversies
Human rights abuses
Environmental controversies
Tobacco and controversial weapons

48 49
The impacts of economic activities on humans and on the natural environment are complex. In the past, a company’s positive impacts as an employer and guarantor for material prosperity were considered the most important. In today’s world, however, companies are exposed to completely new societal expectations and responsibilities, such as minimising their negative impacts on the environment and following basic moral standards, even when they are not bound by the law to do so.
In parallel, the scope of the societal responsibility attrib-uted to companies has grown significantly. For instance, the UN Guiding Principles on Business and Human Rights clearly recognise companies’ shared responsibility for in-direct labour and human rights impacts along their entire value chain. Indeed, in individual cases, companies are al-ready required by law to report on their measures to safe-guard these rights. Their liability for labour and human rights abuses in the supply chain is likewise being invoked more and more often.
The directly resulting expansion of financial risks – through reputational damage, but also in terms of dra-conian fines, compensation claims and other measures faced in the event of misconduct – mean that companies’ economic success is increasingly affected by their com-pliance with such minimum standards. In the worst cas-es, a company’s licence to operate in a given location or country can be at stake. This link has incited more and more mainstream investors to pay close attention to many aspects of corporate social responsibility and to put increasing pressure on companies to comply with these conditions.In this context, the UN Global Compact (UNGC) repre-sents the most important mechanism worldwide through which companies make an auto-commitment to abide by responsible business conduct. Many of the companies rated by oekom research are UNGC signatories. Struc-tured around ten universal principles, the initiative sets out minimum requirements in four areas: human rights, labour rights, environmental protection and anti-corrup-tion measures. In 2017, the UNGC expanded its “black-list” of business activities that in the UNGC’s view are so
problematic that companies exposed to them must be excluded from the initiative. The newly excluded activities include the production and distribution of banned weap-ons and the production of tobacco products.
Focus on controversial business practices
As part of the extensive controversy screening per-formed for all companies, oekom research investigates – amongst other topics – companies’ compliance with the requirements enshrined in the Global Compact’s four areas Various degrees of severity are distinguised in or-der to better capture the scope of controversial conduct. The following analysis is confined to severe and very se-vere controversies detected by oekom research that con-travene the UNGC’s ten principles. In some places, less severe (i.e. moderate) controversies are also considered; this is explicitly indicated.
In principle, controversies are only recorded where relia-ble information from credible sources can be found. Sus-pected malpractice is assessed separately as a “potential controversy” until sufficient evidence comes to light. In addition to the source’s credibility, the substantiated fac-tual basis of any allegation must be deemed sufficiently reliable, based on the experience of analysts specialised in the field. In practice, the availability of information on controversies is often more comprehensive for large, in-ternationally operating companies than for less promi-nent companies, as large companies are more often the focus of public and media attention.
The following overview presents the proportion of compa-nies from different sectors for which oekom research has identified current severe - or very severe - controversies in at least one of the four areas of the Global Compact:
Fig. 15: Proportion (in %) of the companies from industrial countries in the top ten sectors implicated in severe or very severe controver-sies contravening the principles of the UN Global Compact
Among companies from industrialised countries, the most controversial sectors this year are once again those involved in raw materials extraction. In the Oil, Gas & Consumable Fuels sector, for example, almost every second company is involved in significant controver-sies in the UNGC topic areas. This proportion rises from 47.8% to 76.8% if moderate UNGC controversies are also considered. Controversial conduct in direct conflict with the Global Compact’s principles is therefore a matter of course, notwithstanding the fact that many companies in the sector are UNGC signatories committed to abide by its basic principles. The Metals & Mining sector follows with 35.7% of companies affected. The Oil & Gas Equipment/Services sector, meanwhile – which topped last year’s ranking – is not included in the analysis this year for meth-odological reasons: following a number of mergers and acquisitions, the sector’s research universe has become too small to produce a reliable result.
Looking at the bigger picture, the high exposure of raw materials sectors is not all too surprising. The extrac-tion of most raw materials – whether oil, metal ore, rare earths, or others – is often accompanied by conflicts over land use and associated human rights violations. Similar-ly, the operation of processing plants and refineries often poses risks to sensitive ecosystems and to the livelihoods of local populations. In addition, many extraction and pro-cessing activities involve dangerous working conditions,
such that the number of fatal accidents is comparatively high. These factors are further aggravated by the reality that extraction and processing sites are often located in developing and emerging market countries with inade-quate minimum standards on environmental protection, human rights and labour rights.
In the sector ranking of exposure to UNGC controversies, the automobile sector follows in third place. This is clear-ly less structurally conditioned than in the raw materials sectors, as it in part reflects topical and presumably tem-porary events. Examples include the emissions manipu-lation scandal and individual cases of labour rights viola-tions. In contrast, the problems in the Construction and Aerospace & Defence sectors are clearly structural: their prominent position in the ranking is due in large part to the prevalence of corruption cases observed in connec-tion with major infrastructure and defence contracts.
Supply chain-related controversies are another problem area that explains several sectors’ appearance in the rank-ing. For example, in the Textiles & Apparel sector, the out-sourcing of production to countries with very low wages and working conditions leads to regular supply chain vio-lations of internationally recognised labour standards. The Food & Beverages sector, a new arrival in the top ten list, has also seen numerous new cases of labour rights viola-tions in supply chains, in addition to a swathe of contro-
If “moderate controversies” are also considered for the Oil, Gas & Consumable Fuels sector, the share rises from 47.83 to 76.80%.
CONTROVERSIAL ACTIVITIES CONTROVERSIAL ACTIVITIES
When Corporate Responsibility falls short: Controversial Activities
Oil, Gas & Consumable FuelsMetals & Mining
AutomobileTextiles & Apparel
MediaAerospace & Defence
ConstructionFood & Beverages
Fin./Commercial Banks & Capital Markets
Utilities
35.7147.83
23.5323.33
21.2119.23
17.2416.8816.49
15.19

5150
versial forest clearings by palm oil and cocoa suppliers.
Also new among the top ten controversial sectors (at least with regard to UNGC violations) are the Media sector – due to various labour rights violations, in particular in the area of discrimination – and the Financial/Commer-cial Banks & Capital Markets sector. The latter’s inclusion is largely down to a single environmental case: numerous banks in the sector granted loans to the controversial Russian mining company Norilsk Nickel, which is alleged to have caused severe pollution in Siberia through the emission of large quantities of heavy metals .
“Newcomers in the ten most controversial sectors accord-ing to UNGC: Media, Food & Beverages, Financials / Commercial Banks & Capital Markets.”
With regard to companies from emerging markets, similar patterns can be identified. In this group too, the extrac-tive sectors are most frequently implicated in problemat-ic conduct. Additionally, a number of sectors are present due to their position in the upstream value chain of com-panies from industrialised countries. The UNGC-relevant controversies in which they are involved thus also affect their business clients. For instance, the Food & Beverages sector reaches third place because quite a few EMU com-panies are implicated in the labour rights violations and environmental controversies already mentioned above for their DMU counterparts. Overall compared to companies from developed markets, the proportion of EMU compa-nies for which corresponding controversies were identi-fied is slightly lower. This could, however, mainly be due to a lack of available information. Companies from industri-alised countries are often simply subject to more intense scrutiny by the media and by NGOs than companies from emerging markets.
This theory is corroborated by the fact that the three most controversial companies in 2017, according to oekom research’s Global Compact assessment, are nevertheless all based in emerging markets. The top spot, for example, is as last year occupied by agriculture and palm oil com-pany Wilmar International Ltd., domiciled in Singapore.The methodological basis for this company-level calcula-tion is the oekom Controversy Score. A measure of a com-pany’s exposure to controversies, the score is based on the number and severity of active controversies in which a company is involved in oekom’s database. To calculate the score, all recorded cases are first assessed individual-ly according to a proprietary system, before being weight-ed and aggregated to a sum total. The resulting score starts at 0; a lower limit is not defined.At the end of 2017, according to this methodology, a re-cord value of -156 was attributed to Wilmar. This excep-tional score is largely due to the operation of numerous controversial palm oil plantations, both company-owned and supplier-owned. According to NGO and media reports, primary rainforest (including orangutan habitats in Indo-nesia) was cleared on a large scale to make way for the plantations. Moreover, extreme working conditions are believed to prevail on many of the plantations, including child labour. Finally various human rights problems (such as land use conflicts) have also been reported in some cases. The Brazilian mining company Vale SA follows at some distance with a still exceptionally low value of -90. At the end of 2015, the company was implicated in one of the largest natural catastrophes in the history of Brazil. Two
large dams failed at a basin for tailings near an opencast mine, releasing more than 60 million cubic metres of iron ore tailings into the wider environment. The resulting mudslide stretched for over 440 kilometres along the Rio Doce basin, Brazil‘s fifth-largest river system. Beyond the Rio Doce disaster, several of the company’s other mining projects have also been denounced in NGO and media reports due to inadequate working standards, human rights violations and environmental issues, including a number of smaller accidents.
Last but not least, the third place in the 2017 ranking is occupied by a further palm oil producer. Golden Agri-Resources Ltd., also a Singapore-domiciled company, is implicated in the widespread clearing of primary rainforests, typi-cally by the company’s suppliers.
Corruption
As Transparency International puts it: corruption not only causes material damage but undermines the very foundations of a society. Although corruption levels vary between countries and world regions, the unswerving fight against it is of elementary importance in all regions of the world in order to promote fair competition and to foster trust in public institutions. Improved transparen-cy conditions are especially important in the fight against corruption. The top two sectors ranked by their exposure to corruption scandals are the Aerospace & Defence and Construction sectors. This is not entirely surprising: defence contracts and infrastructure projects are especially prone to corrup-tion, as they are often complex, lengthy, negotiated behind closed doors and involve large sums of money.
More generally, in 2017 numerous corruption cases once again came to light in many different sectors and countries, leading in some instances to severe penalties for those involved. Legal instruments such as the Foreign Corrupt Practices Act in the USA continue to play a central role here. For instance, at the beginning of 2017, the US medical technology company Zimmer Biomet
Particularly susceptible to corruption: military and infrastructure projects
Fig. 16: Proportion (in %) of companies in the top ten emerging mar-ket sectors with severe or very severe controversies regarding the principles of the UN Global Compact
Metals & MiningOil, Gas & Consumable Fuels
Food & BeveragesTrading Companies & DistributorsElectronic Devices & Appliances
Electronic ComponentsChemicals
Transport & LogisticsUtilities
Fin. / Multi-Sector Holdings
32.3619.15
14.8914.29
13.3312.0012.00
11.119.76
8.33
CONTROVERSIAL ACTIVITIES CONTROVERSIAL ACTIVITIES
Fig. 17: Proportion (in %) of companies in the top ten sectors affected by severe or very severe controversies
Aerospace & DefenceConstruction
Pharmaceuticals & BiotechnologySemiconductors
Health Care Facilities & Services Metals & Mining
Fin./Asset Managers & Security BrokeragesMedia
Electronic ComponentsOil, Gas & Consumable Fuels
13.7915.38
8.625.265.134.76
4.002.903.132.53
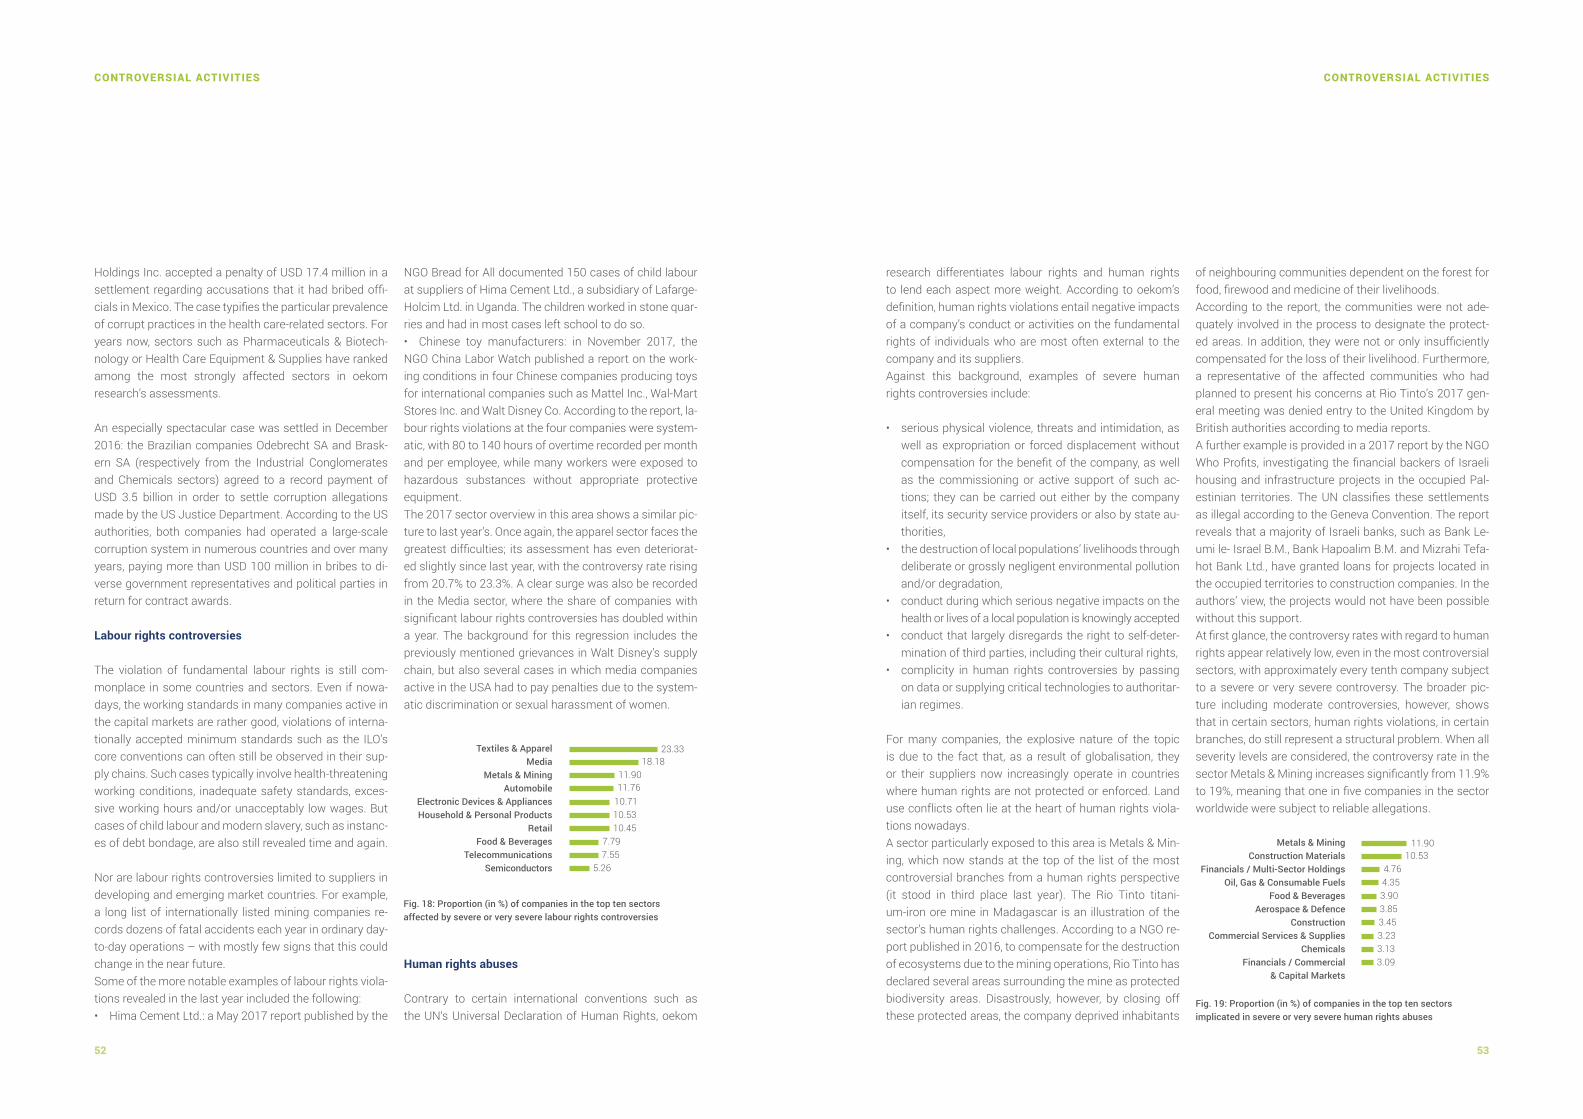
52 53
research differentiates labour rights and human rights to lend each aspect more weight. According to oekom’s definition, human rights violations entail negative impacts of a company’s conduct or activities on the fundamental rights of individuals who are most often external to the company and its suppliers.Against this background, examples of severe human rights controversies include:
• serious physical violence, threats and intimidation, as well as expropriation or forced displacement without compensation for the benefit of the company, as well as the commissioning or active support of such ac-tions; they can be carried out either by the company itself, its security service providers or also by state au-thorities,
• the destruction of local populations’ livelihoods through deliberate or grossly negligent environmental pollution and/or degradation,
• conduct during which serious negative impacts on the health or lives of a local population is knowingly accepted
• conduct that largely disregards the right to self-deter-mination of third parties, including their cultural rights,
• complicity in human rights controversies by passing on data or supplying critical technologies to authoritar-ian regimes.
For many companies, the explosive nature of the topic is due to the fact that, as a result of globalisation, they or their suppliers now increasingly operate in countries where human rights are not protected or enforced. Land use conflicts often lie at the heart of human rights viola-tions nowadays.A sector particularly exposed to this area is Metals & Min-ing, which now stands at the top of the list of the most controversial branches from a human rights perspective (it stood in third place last year). The Rio Tinto titani-um-iron ore mine in Madagascar is an illustration of the sector’s human rights challenges. According to a NGO re-port published in 2016, to compensate for the destruction of ecosystems due to the mining operations, Rio Tinto has declared several areas surrounding the mine as protected biodiversity areas. Disastrously, however, by closing off these protected areas, the company deprived inhabitants
of neighbouring communities dependent on the forest for food, firewood and medicine of their livelihoods.According to the report, the communities were not ade-quately involved in the process to designate the protect-ed areas. In addition, they were not or only insufficiently compensated for the loss of their livelihood. Furthermore, a representative of the affected communities who had planned to present his concerns at Rio Tinto’s 2017 gen-eral meeting was denied entry to the United Kingdom by British authorities according to media reports.A further example is provided in a 2017 report by the NGO Who Profits, investigating the financial backers of Israeli housing and infrastructure projects in the occupied Pal-estinian territories. The UN classifies these settlements as illegal according to the Geneva Convention. The report reveals that a majority of Israeli banks, such as Bank Le-umi le- Israel B.M., Bank Hapoalim B.M. and Mizrahi Tefa-hot Bank Ltd., have granted loans for projects located in the occupied territories to construction companies. In the authors’ view, the projects would not have been possible without this support.At first glance, the controversy rates with regard to human rights appear relatively low, even in the most controversial sectors, with approximately every tenth company subject to a severe or very severe controversy. The broader pic-ture including moderate controversies, however, shows that in certain sectors, human rights violations, in certain branches, do still represent a structural problem. When all severity levels are considered, the controversy rate in the sector Metals & Mining increases significantly from 11.9% to 19%, meaning that one in five companies in the sector worldwide were subject to reliable allegations.
Holdings Inc. accepted a penalty of USD 17.4 million in a settlement regarding accusations that it had bribed offi-cials in Mexico. The case typifies the particular prevalence of corrupt practices in the health care-related sectors. For years now, sectors such as Pharmaceuticals & Biotech-nology or Health Care Equipment & Supplies have ranked among the most strongly affected sectors in oekom research’s assessments.
An especially spectacular case was settled in December 2016: the Brazilian companies Odebrecht SA and Brask-ern SA (respectively from the Industrial Conglomerates and Chemicals sectors) agreed to a record payment of USD 3.5 billion in order to settle corruption allegations made by the US Justice Department. According to the US authorities, both companies had operated a large-scale corruption system in numerous countries and over many years, paying more than USD 100 million in bribes to di-verse government representatives and political parties in return for contract awards.
Labour rights controversies
The violation of fundamental labour rights is still com-monplace in some countries and sectors. Even if nowa-days, the working standards in many companies active in the capital markets are rather good, violations of interna-tionally accepted minimum standards such as the ILO’s core conventions can often still be observed in their sup-ply chains. Such cases typically involve health-threatening working conditions, inadequate safety standards, exces-sive working hours and/or unacceptably low wages. But cases of child labour and modern slavery, such as instanc-es of debt bondage, are also still revealed time and again.
Nor are labour rights controversies limited to suppliers in developing and emerging market countries. For example, a long list of internationally listed mining companies re-cords dozens of fatal accidents each year in ordinary day-to-day operations – with mostly few signs that this could change in the near future.Some of the more notable examples of labour rights viola-tions revealed in the last year included the following:• Hima Cement Ltd.: a May 2017 report published by the
NGO Bread for All documented 150 cases of child labour at suppliers of Hima Cement Ltd., a subsidiary of Lafarge-Holcim Ltd. in Uganda. The children worked in stone quar-ries and had in most cases left school to do so. • Chinese toy manufacturers: in November 2017, the NGO China Labor Watch published a report on the work-ing conditions in four Chinese companies producing toys for international companies such as Mattel Inc., Wal-Mart Stores Inc. and Walt Disney Co. According to the report, la-bour rights violations at the four companies were system-atic, with 80 to 140 hours of overtime recorded per month and per employee, while many workers were exposed to hazardous substances without appropriate protective equipment.The 2017 sector overview in this area shows a similar pic-ture to last year’s. Once again, the apparel sector faces the greatest difficulties; its assessment has even deteriorat-ed slightly since last year, with the controversy rate rising from 20.7% to 23.3%. A clear surge was also be recorded in the Media sector, where the share of companies with significant labour rights controversies has doubled within a year. The background for this regression includes the previously mentioned grievances in Walt Disney’s supply chain, but also several cases in which media companies active in the USA had to pay penalties due to the system-atic discrimination or sexual harassment of women.
Human rights abuses
Contrary to certain international conventions such as the UN‘s Universal Declaration of Human Rights, oekom
Fig. 18: Proportion (in %) of companies in the top ten sectors affected by severe or very severe labour rights controversies
Textiles & ApparelMedia
Metals & Mining Automobile
Electronic Devices & AppliancesHousehold & Personal Products
RetailFood & Beverages
TelecommunicationsSemiconductors
18.1823.33
11.9011.76
10.7110.5310.45
7.797.55
5.26
Fig. 19: Proportion (in %) of companies in the top ten sectors implicated in severe or very severe human rights abuses
Metals & Mining Construction Materials
Financials / Multi-Sector HoldingsOil, Gas & Consumable Fuels
Food & BeveragesAerospace & Defence
ConstructionCommercial Services & Supplies
ChemicalsFinancials / Commercial
& Capital Markets
10.5311.90
4.764.353.903.853.453.233.133.09
CONTROVERSIAL ACTIVITIES CONTROVERSIAL ACTIVITIES
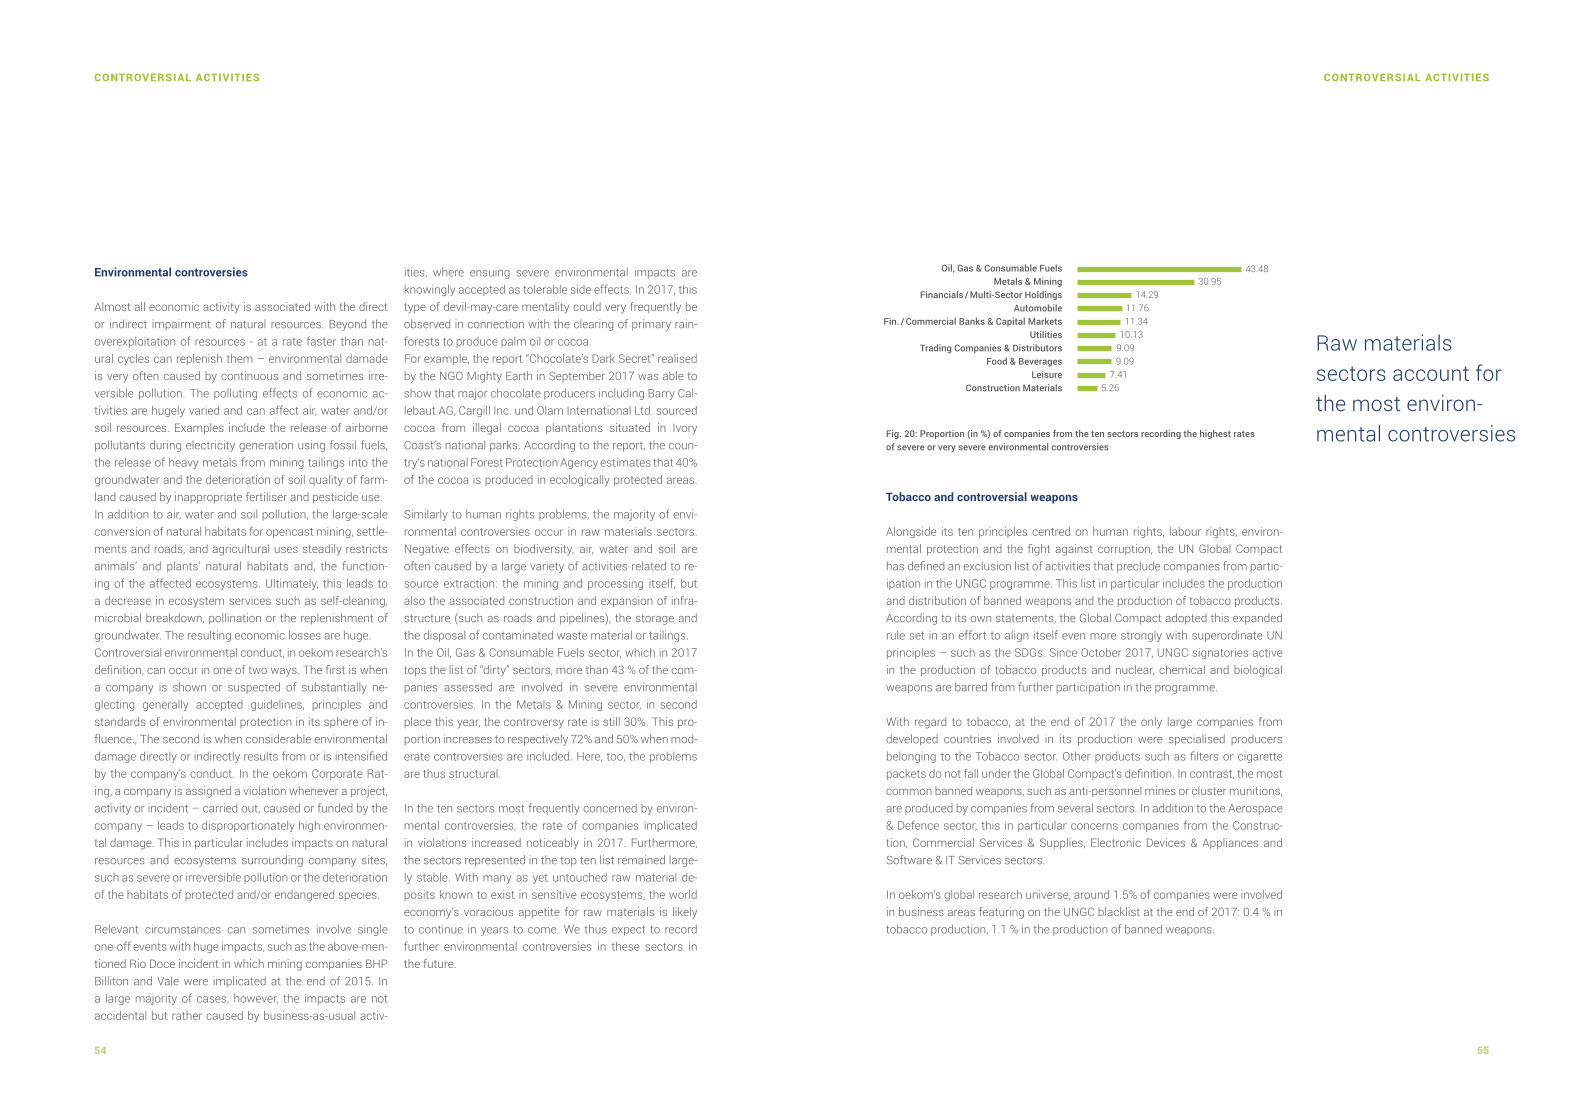
5554
Environmental controversies
Almost all economic activity is associated with the direct or indirect impairment of natural resources. Beyond the overexploitation of resources - at a rate faster than nat-ural cycles can replenish them – environmental damade is very often caused by continuous and sometimes irre-versible pollution. The polluting effects of economic ac-tivities are hugely varied and can affect air, water and/or soil resources. Examples include the release of airborne pollutants during electricity generation using fossil fuels, the release of heavy metals from mining tailings into the groundwater and the deterioration of soil quality of farm-land caused by inappropriate fertiliser and pesticide use.In addition to air, water and soil pollution, the large-scale conversion of natural habitats for opencast mining, settle-ments and roads, and agricultural uses steadily restricts animals’ and plants’ natural habitats and, the function-ing of the affected ecosystems. Ultimately, this leads to a decrease in ecosystem services such as self-cleaning, microbial breakdown, pollination or the replenishment of groundwater. The resulting economic losses are huge.Controversial environmental conduct, in oekom research’s definition, can occur in one of two ways. The first is when a company is shown or suspected of substantially ne-glecting generally accepted guidelines, principles and standards of environmental protection in its sphere of in-fluence., The second is when considerable environmental damage directly or indirectly results from or is intensified by the company’s conduct. In the oekom Corporate Rat-ing, a company is assigned a violation whenever a project, activity or incident – carried out, caused or funded by the company – leads to disproportionately high environmen-tal damage. This in particular includes impacts on natural resources and ecosystems surrounding company sites, such as severe or irreversible pollution or the deterioration of the habitats of protected and/or endangered species.
Relevant circumstances can sometimes involve single one-off events with huge impacts, such as the above-men-tioned Rio Doce incident in which mining companies BHP Billiton and Vale were implicated at the end of 2015. In a large majority of cases, however, the impacts are not accidental but rather caused by business-as-usual activ-
ities, where ensuing severe environmental impacts are knowingly accepted as tolerable side effects. In 2017, this type of devil-may-care mentality could very frequently be observed in connection with the clearing of primary rain-forests to produce palm oil or cocoa.For example, the report “Chocolate’s Dark Secret” realised by the NGO Mighty Earth in September 2017 was able to show that major chocolate producers including Barry Cal-lebaut AG, Cargill Inc. und Olam International Ltd. sourced cocoa from illegal cocoa plantations situated in Ivory Coast’s national parks. According to the report, the coun-try‘s national Forest Protection Agency estimates that 40% of the cocoa is produced in ecologically protected areas.
Similarly to human rights problems, the majority of envi-ronmental controversies occur in raw materials sectors. Negative effects on biodiversity, air, water and soil are often caused by a large variety of activities related to re-source extraction: the mining and processing itself, but also the associated construction and expansion of infra-structure (such as roads and pipelines), the storage and the disposal of contaminated waste material or tailings. In the Oil, Gas & Consumable Fuels sector, which in 2017 tops the list of “dirty” sectors, more than 43 % of the com-panies assessed are involved in severe environmental controversies. In the Metals & Mining sector, in second place this year, the controversy rate is still 30%. This pro-portion increases to respectively 72% and 50% when mod-erate controversies are included. Here, too, the problems are thus structural.
In the ten sectors most frequently concerned by environ-mental controversies, the rate of companies implicated in violations increased noticeably in 2017. Furthermore, the sectors represented in the top ten list remained large-ly stable. With many as yet untouched raw material de-posits known to exist in sensitive ecosystems, the world economy’s voracious appetite for raw materials is likely to continue in years to come. We thus expect to record further environmental controversies in these sectors in the future.
Tobacco and controversial weapons
Alongside its ten principles centred on human rights, labour rights, environ-mental protection and the fight against corruption, the UN Global Compact has defined an exclusion list of activities that preclude companies from partic-ipation in the UNGC programme. This list in particular includes the production and distribution of banned weapons and the production of tobacco products. According to its own statements, the Global Compact adopted this expanded rule set in an effort to align itself even more strongly with superordinate UN principles – such as the SDGs. Since October 2017, UNGC signatories active in the production of tobacco products and nuclear, chemical and biological weapons are barred from further participation in the programme.
With regard to tobacco, at the end of 2017 the only large companies from developed countries involved in its production were specialised producers belonging to the Tobacco sector. Other products such as filters or cigarette packets do not fall under the Global Compact’s definition. In contrast, the most common banned weapons, such as anti-personnel mines or cluster munitions, are produced by companies from several sectors. In addition to the Aerospace & Defence sector, this in particular concerns companies from the Construc-tion, Commercial Services & Supplies, Electronic Devices & Appliances and Software & IT Services sectors.
In oekom’s global research universe, around 1.5% of companies were involved in business areas featuring on the UNGC blacklist at the end of 2017: 0.4 % in tobacco production, 1.1 % in the production of banned weapons.
Fig. 20: Proportion (in %) of companies from the ten sectors recording the highest rates of severe or very severe environmental controversies
Oil, Gas & Consumable FuelsMetals & Mining
Financials / Multi-Sector HoldingsAutomobile
Fin. / Commercial Banks & Capital MarketsUtilities
Trading Companies & DistributorsFood & Beverages
LeisureConstruction Materials
30.9543.48
14.2911.7611.34
10.139.099.09
7.415.26
Raw materials sectors account for the most environ-mental controversies
CONTROVERSIAL ACTIVITIES CONTROVERSIAL ACTIVITIES

5756
1 http://www.oekom-research.com/homepage/german/oekom-Impact-Studie%202017_DE.pdf 2 http://www.oekom-research.com/homepage/german/oekom-Impact-Studie%202017_DE.pdf 3 see also http://oekom-research.com/homepage/english/oekom_cr_review_E_2017.pdf4 https://www.unglobalcompact.org/what-is-gc/mission/principles 5 e.g. http://www.worstpolluted.org/docs/TopTenThreats2013.pdf and https://www.theguardi-
an.com/cities/2016/sep/15/norilsk-red-river-russias-most-polluted-city-clean6 e.g. https://www.amnesty.org/download/Documents/ASA2151842016ENGLISH.PDF,
http://www.wilmar-international.com/sustainability/wp-content/uploads/2016/06/160627_Grievance-update.pdf, https://d3n8a8pro7vhmx.cloudfront.net/rainforestactionnetwork/pages/17392/attachments/original/1486495650/RAN_Leuser_Watch_PT_Agra_Bumi_Nia-ga_20170207.pdf?1486495650 und https://d3n8a8pro7vhmx.cloudfront.net/rainforestac-tionnetwork/pages/17162/attachments/original/1481648206/Leuser_Watch_DPL.pdf?1481648206
7 e.g. http://www.ohchr.org/en/NewsEvents/Pages/DisplayNews.aspx-?NewsID=16803&LangID=E , http://www.dw.com/en/clearer-picture-emerg-ing-over-brazils-mining-disaster/a-19006554 and http://www.mst.org.br/2015/06/10/vale-e-condenada-a-pagar-rusd-804-milhoes-por-acidentes-de-trabalho.html?O_NewsItem-Links1Dir=Asc&s_O_NewsItems_Id=411422
8 e.g. https://d3n8a8pro7vhmx.cloudfront.net/rainforestactionnetwork/pages/17920/attach-ments/original/1499897185/Leuser_Watch_PT_Agra_Bumi_Niaga_July2017_%281%29.pdf?1499897185 and www.greenpeace.org/archive-international/en/publications/Cam-paign-reports/Forests-Reports/A-Deadly-Trade-off/
9 https://www.justice.gov/opa/pr/zimmer-biomet-holdings-inc-agrees-pay-174-million-resolve-foreign-corrupt-practices-act
10 https://www.justice.gov/opa/pr/odebrecht-and-braskem-plead-guilty-and-agree-pay-least-35-billion-global-penalties-resolve
11 https://brotfueralle.ch/content/uploads/2016/12/Report-on-child-labor-LafargeHolcim-Ugan-da.pdf
12 http://www.wrm.org.uy/wp-content/uploads/2016/04/RioTintoBiodivOffsetMadagascar_ r eport_EN_web.pdf
13 https://www.theguardian.com/global-development/2017/apr/07/madagascar-farmer-mining-firm-rio-tinto-agm-ousted-from-land-athanase-monja
14 https://www.whoprofits.org/sites/default/files/financing_land_grab_web.pdf15 http://www.mightyearth.org/wp-content/uploads/2017/09/chocolates_dark_secret_
english_web.pdf
Sources
The steady improvement in companies’ sustainability per-formance over recent years is a good sign that the world economy is largely on the right track. Whether with regard to environmental protection, labour and human rights, the more frugal use of limited resources or adequate corpo-rate governance, the values underpinning sustainability thinking are increasingly guiding decisions, among large companies and in the capital markets. Even in countries where the current political doctrine regarding sustainabili-ty remains rather regressive, momentum has continued to build at a local level, in civil society and finally also in the economy, making the general trend irreversible.
The SDGs and their formulated targets have set the di-rection in which future economic development must move. Sustainability research measures the current sta-tus quo by determining where the world stands regarding the Goals’ achievement and tells us how far we are from achieving them. There is therefore no reason to stop here and rest on our laurels. The central objectives remain to be achieved, be they curbing global warming to below 2°C, ensuring a sufficient food supply for the world population or safeguarding freshwater resources in the distant future.
Capital constitutes a key lever to fund comprehensive sustainable development and support those companies that are already making good progress. Investors are set to play a key role and are increasingly being called upon by politicians. The recommendations published at the be-ginning of the year by the EU’s High Level Expert Group on Sustainable Finance have precisely this end in mind. Ac-cordingly, ESG research is henceforth to be regarded as an integral part of the fiduciary obligations of investors and systematically integrated into the investment process.
This raises the topic of sustainability to a whole new level – far beyond its historic niche and into the mainstream economy. As a result, however, very different interests and priorities emerge, which entails both great opportunities and substantial risks.
In a best-case scenario, ESG mainstreaming may in the medium term lead to an ever-increasing recognition of the importance of sustainability, giving it an even greater
role in investment decisions. As a part of fiduciary duty and comprehensive risk management, the consideration of ESG factors would already significantly increase the leverage effect of invested capital towards greater sus-tainability. At the same time, however, there is a risk that the financial market will only choose sustainability on a pro-forma basis, seeking to capitalise on its opportunities without taking the materiality of sustainability factors and the values associated with them seriously enough.
The progress of sustainable development has therefore reached a point where the question is no longer a “wheth-er or not”, but a “how”. The HLEG‘s recommendations can in combination with the SDGs be seen as a concrete road-map in the effort to achieve sustainable development, with sustainability ratings playing a central enabling role. All will now depend on how this lever is activated. Or, to come back to the image alluded to at the beginning of this report: we must now grab the cow by its horns.
A Look Ahead
SOURCES A LOOK AHEAD

58 59
OEKOM INSIDE / DISCLAIMER
Since March 2018, ISS-oekom has been a member of the ISS family of high quality solution providers for sustain-able and responsible investment and corporate govern-ance. Originally founded in 1993 and formerly known as oekom research, the company is one of the world’s lead-ing ESG research and rating agencies for sustainable in-vestments with an unsurpassed rating methodology and quality recognition. ISS-oekom analyses companies and countries with respect to their environmental social and governance performance. As an experienced partner of institutional investors and financial service providers, we identify those equity and bond issuers whose businesses exercise a high level of responsibility towards society and the environment. Under the new ownership, ISS-oekom completes the ESG research and RI services offerings of ISS, making it a worldwide pure-player in the area of RI Research & Solutions. ISS-oekom is headed by Robert Haßler, former CEO and co-founder of oekom-research.
About ISSFounded in 1985 as Institutional Shareholder Services Inc., ISS is the world’s leading provider of corporate govern-ance and responsible investment (RI) solutions for asset owners, asset managers, hedge funds, and asset service providers. ISS’ solutions include: objective governance re-search and recommendations; RI data, analytics, adviso-ry and research; end-to-end proxy voting and distribution solutions; turnkey securities class-action claims manage-ment (provided by Securities Class Action Services, LLC); and reliable global governance data and modelling tools. Clients rely on ISS’ expertise to help them make informed corporate governance decisions, integrate responsible in-vesting policies and practices into their strategy, and ex-ecute upon these policies through end-to-end voting. For more information, please visit www.issgovernance.com.
About ISS-oekom Disclaimer
Copyright © 2018 Institutional Shareholder Services Inc. (“ISS”).
oekom research AG is a subsidiary of ISS. This document and all of the information contained in it is the property of ISS or its subsidiaries. The Information may not be repro-duced or redisseminated in whole or in part without the prior written permission of ISS. This document has not been submitted to, nor received approval from, the United States Securities and Exchange Commission or any other regulatory body. While ISS and/or its subsidiaries have exercised due care in compiling this report, they make no warranty, express or implied, regarding the accuracy, com-pleteness or usefulness of this information and assume no liability with respect to the consequences of relying on this information for investment or other purposes. In par-ticular, the research, analyses and conclusions provided are not intended to constitute an offer, solicitation or ad-vice to buy or sell securities nor are they intended to solicit votes or proxies.
ISS-oekomoekom research AGGoethestraße 28D-80336 MünchenTel. +49 89 5441 8490www.issgovernance.com
Imprint
IMPRINT
Editorial staff
Picture creditsCover: Pexels, Anastasia ZheninaPage 12: Fotolia, © Jag_czPage 22: Fotolia, fulltimegipsyPage 40: Fotolia, © KalyakanPage 46: Fotolia, © oneinchpunch
DesignC MA – charlottemayr.com
Munich, April 2018Printed on 100% recycling paper
Dieter Niewierra
Theres Scherzinger
Alexander Russell