ISS Fiber Optic Failure Investigation Root Cause Report ... · ISS Fiber Optic Failure...
56
ISS Fiber Optic Failure Investigation Root Cause Report August 1, 2000 ISS Fiber Root Cause Investigation Team Lead organization NASA GSFC Sponsored by: NASA JSC and the Boeing Company https://ntrs.nasa.gov/search.jsp?R=20000093964 2018-10-04T04:55:48+00:00Z
-
Upload
phamkhuong -
Category
Documents
-
view
222 -
download
0
Transcript of ISS Fiber Optic Failure Investigation Root Cause Report ... · ISS Fiber Optic Failure...

ISS Fiber Optic Failure Investigation
Root Cause Report
August 1, 2000
ISS Fiber Root Cause Investigation TeamLead organization NASA GSFC
Sponsored by: NASA JSC and the Boeing Company
https://ntrs.nasa.gov/search.jsp?R=20000093964 2018-10-04T04:55:48+00:00Z

Table of Contents
Executive Summary .............................................................................. 1
1.0 Introduction ........................................ ........................................... 1
2.0 Background ................................................................................... 1
3.0 Cable History ................................................................................. 3
3.1 The Specification... ..................................................................... 3
3.2 The Cable Design and The Performance Requirements Used ..................... 4
3.3. Indicted Stock ............................................................................ 7
4.0 Manufacturing Processes .................................................................... 9
4.1 Distributor ........................................................................... 9
4.2 Cabler ..................................................................................... 94.2.1
4.2.2
4.2.3
4.2.4
4.2.5
4.2.6
Record Keeping ..................................................... , ........... 9
Storage and Factory Environment Control .................................. 9
Respooler ...................................................................... 10
Extruder- Buffer and Jacket Processing .................................. 10Strength Members ...................................................... 11
Optical Measurements ...................................................... .. 11
4.3 Fiber ...................................................................................... 11
4.3.1 Raw Materials for Preform Manufacture .................................. 11
4.3.2 Preform Fabrication ........................................................... 12
4.3.3 Fiber Manufacture .............................................................. 13
5.0 Inspection Techniques and Failure Analyses ............................................ 15
5.1 Optical Detection of the Defect .................................................... 15
5.2 DPA Results ......................................................................... 16
6.0 Material Behaviors and Interactions ....................................................... 24
6.1 FEP Decomposition .................................................................. 24
6.2 Polyimide Related Issues ........................................................... 25
6.3 HF Etching ............................................................................ 27
6.4 Carbon Layer ............. _.......................................................... 30
6.5 Electro Static Discharge (ESD) ................................................... 31
6.6 Aeolian Motion - Vibration of Fiber Under Tension ........................... 33
7.0 Strength Testing .............................................................................. 35
7.1 Initial Testing of'96 Vintage Cable and '99 Vintage Fiber. " ..357.1.1 Test Approach.... ...................................................... 35
7.2 Strength Testing of Fiber Throughout Cabling .................................. 38
7.2.1 Results: Strength Testing of Fiber Throughout Cabling ......... 39
ii 8/1/00

7.3 StrengthTestingNon-CarbonCoatedFiber.............................................. 467.3.1Results:StrengthTestingNon-CarbonCoatedFiber.......................... 47
7.4MandrelTestScreeningof CabledFiber................................................... 50
8.0 Conclusions ................................................................................... 53
9.0 Recommendations .............................................................. .............. 54
9.1 Processes Which Create Defects ................................................... 55
9.2 Screening Methods ................................................................... 55
9.3 Reducing Risks Associated with NFOC-2FFF- 1GRP- 1 Cable ................ 56
10.0 References ...................................................... . ............................. 56
11.0 Acknowledgements .................................................................. 57
"In this work, when it shall be found that much is omitted, let it not be forgotten, that
much likewise is performed..."
Samual Johnson, A.M.
For the last paragraph of Preface to his two-volume Dictionary of the English Language,
Vol. 1, page 5, 1755, London, Printed by Strahan.
iii 8/1/00
Table
Table
Table
Table
Table
Table
Table
Table
Table
Table
Table
Figure 1
Figure 2
Figure 3
Figure 4
Figure 5
Figure 6
Figure
Figure
Figure
Figure
Figure 11
Figure 12
Figure 13
Figure 14
Figure 15
Figure 16
Figure 17
Figure 18
Figure I9
Figure 20
Figure 21
Figure 22
Figure 23
Figure 24
Figure 25
Figure 26
Figure 27
Figure 28
Tables
1 NFOC-2FFF- 1GRP- 1 Optical & Mechanical Characteristics ........................ 5
2 Deliveries of PFA Jacketed Cable ........................................................ 5
3 NFOC-2FFF-1GRP-1 Cable Delivered by SEA Wire and Cable ................... 7
4 Shipments Containing Reels of Cable Found with Rocket Engine Defects ........ 8
5 Electrostatic Field Measurements Taken Around "Color Line" ................... 10
6 Electrostatic Field Measurements Taken Around the Extrusion Line During aBuffering Operation ...................................................................... I i
7 Coating Issues & Findings ............................................................... 14
8 Strength Testing Samples and Conditions ............................................ 35
9 Second Strength Test Approach ........................................................ 38
10 HF Etch Results .......................................................................... 44
11 Strength Testing Non-Carbon Coated Fiber .......................................... 46
Figures
"Rocket Engine" Defect ...................... . ......................... . ................ 2
NFOC-2FFF- 1GRP- 1 Cable Design .................................................. 4
Crossection of the NFOC-2FF-1GRP-1 Cable... ...5
Preform Index Profile ................................................................. 12
Sink in the Polyimide Coating ....................................................... 16
SiO2 Balls in PolyimideVoid ..................... . .................. . ............... 16
7 GeO2 Crystals in Etch Pit ............................................................ 17
8 GeO2 and SiO2 Debris on Outside Of Coating .................................... 17
9 Si-spire in Deep Etch Pit ............................................................... 18
10 Characteristic Void in Polyimide Above Shallow Etch Pit ..................... 18
Defect Inspection Using Index Matching Oil ..................................... 19
Depressions and Bubble in Polyimide Coating in Fiber CD0588XD .......... 20
Hourglass Shape on Bubble and Polyimide ....................................... 20
Distribution of Features Along a 6" Sample of CD0588XD Fiber ............. 21
Carbon Defects Seen Below Polyimide on Sample of CD0588XD Fiber ..... 21
E. Banks' Sample With a Broken Fiber Whose Ends Overlap .................. 22Debris-Laden Fiber ....................................... i ........................... 22
Cleaned Fiber .......................................................................... 22
Feature Statistics for CD0588XD ................................................... 23
Feature Statistic for CD0384XC .................. .................................. 23
Set-up for Mass Spectrometer Measurements of Fluorine Species
Released From Fiber Optic Cable .................................................. 25
Burn Mark Form DWV Testing of"Rocket Engine Defect" - Free
Fiber .................................................................................... 26
Burn Mark Form DWV Testing of"Rocket Engine Defect". ................... 27
Model of "Rocket Engine" Defect .................................................. 28
Stress Predicted by Fiber Model .................................................... 29
Etch Pit Resulting From Experimentation ..... . ............... . .................... 30
Experimentally Produced ESD Damage ........................................ ...32
Electrical Discharge Induced Damage on Fiber Surface ...................... . .32
iv 8/1/00

Figures (Conl."d)
Figure 29
Figure 30
Figure 31
Figure 32
Figure 33
Figure 34
Figure 35
Figure 36
Figure 37
Figure 38
Figure 39
Test Set-up ........................................... .............................. 36
Weibull Plot for Strength of 1996 Vintage Cable from Several
Cable Reels ......................................................................... 37
Strength Data for 1996 Cable by Strain Rate .................................. 37
Strengths ofDC0384 and DC0588 Fiber During Cabling ................... 42
Example of Low Strength Breaks .............................................. 43
Optical Throughput During HF Etch Test .................................... 45
Strength for the Non-carbon Coated Fibers ................................... 49
Mandrel arrangements and Sizes Used ......................................... 50
Hypothetical Break Strengths During Screen Compared to Actual
Break Strengths on Proof Test Screened Sample ............................. 51
Mandrel Used for Screening Evaluation ....................................... 51
Dynamic Strength Data for the Pre-ProofTest Screened Cables .... . ...... 52
v 8/1/00
Executive Summary
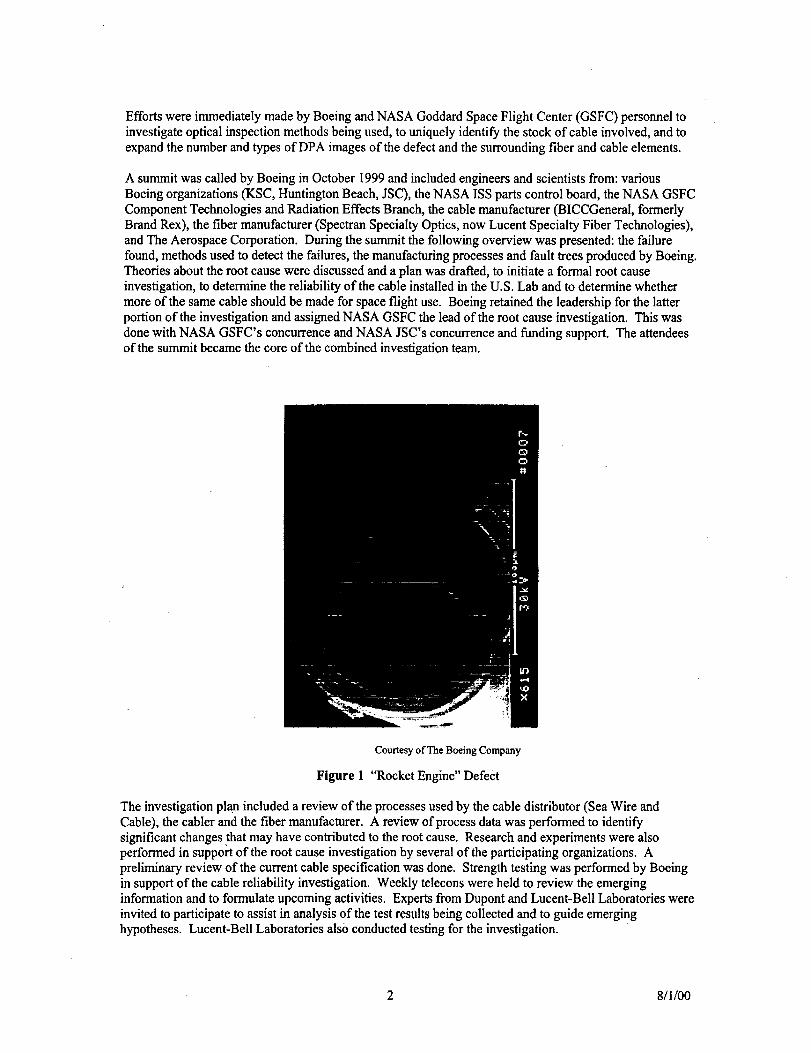
In August of 1999, Boeing Corporation (Boeing) engineers began investigating failures of optical fiberbeing used on International Space Station flight hardware. Catastrophic failures of the fiber were linked to
a defect in the glass fiber (see Figure 1, "Rocket Engine Defect"). Following several meetings of Boeingand NASA engineers and managers, Boeing created and led an investigation team, which examined the
reliability of the cable installed in the U.S. Lab. NASA Goddard Space Flight Center's Components
Technologies and Radiation Effects Branch (GSFC) led a team investigating the root cause of the failures.Information was gathered from: regular telecons and other communications with the investigation team,investigative trips to the cable distributor's plant, the cable manufacturing plant and the fiber manufacturing
plant (including a review of build records), destructive and non-destructive testing, and expertise suppliedby scientists from Dupont, and Lucent-Bell Laboratories. Several theories were established early on whichwere not able to completely address the destructive physical analysis and experiential evidence. Lucent
suggested hydrofluoric acid (HF) etching of the glass and successfully duplicated the "rocket engine"defect. Strength testing coupled with examination of the low strength break sites linked features in the
polyimide coating with latent defect sites. The information provided below explains what was learnedabout the susceptibility of the pre-cabled fiber to failure when cabled as it was for Space Station and thenature of the latent defects.
1.0 INTRODUCTION
This report presents the work done to understand the "rocket engine" defects found in optical cable beingused by the International Space Station and to understand their impact on the cable's reliability for use in
space. Detailed information is given about:The failure of optical cable used for the International Space StationTechniques which can be used to inspect for the presence of "rocket engine" defects and
coding defectsThe ability of the manufacturers of the fiber and cable to supply cable within the specification
limitsThe suitability of the governing specification for this cable.
- Important manufacturing processes and material interactions which support HF generation
from fluoropolymer cable components- The affect of the manufacturing processes used to make NFOC-2FFF-1GRP-1 on its
reliability- The nature of the low break strength found for this cable
The members of Team 2, who generated this report and other contributors, are listed in Section 12.0.Conclusions and recommendations are summarized at the end of the report.
2.0 BACKGROUND
In mid- 1999 Boeing engineers were finding multiple failures of 1999 vintage NFOC-2FFF- 1GRP- 1 optical
cable being used to fabricate harnesses for the Intemational Space Station (ISS) program. This cable wasused in U.S. Laboratory module, an element of the International Space Station, a deliverable under contractNAS15 10000. Not only were fiber breaks being detected during handling, but breaks were found over
time with no handling (sitting on the shelf). This was believed to be a much different experience than wasencountered during population of the U.S. Lab module with 6982 feet [ref-1] of 1996 vintage cable of the
same part number. The Boeing materials and processes engineers performed destructive physical analysis
(DPA) on the fiber at the break locations. Figure 1 shows one of the first images resulting from the DPA.The cone and bulb shape of the defect earned it the name "rocket engine". This description replaced the
term "bubble" which according to the fiber manufacturer, is associated with a topology that is unique andnot represented by Figure 1.
1 8/1/00
EffortswereimmediatelymadebyBoeingandNASAGoddardSpaceFlightCenter(GSFC)personneltoinvestigateopticalinspectionmethodsbeingused,touniquelyidentifythestockofcableinvolved,andtoexpandthenumberandtypesofDPAimagesofthedefectandthesurroundingfiberandcableelements.
A summitwascalledbyBoeinginOctober1999andincludedengineersandscientistsfrom:variousBoeingorganizations(KSC,HuntingtonBeach,JSC),theNASAISSpartscontrolboard,theNASAGSFCComponentTechnologiesandRadiationEffectsBranch,thecablemanufacturer(BICCGeneral,formerlyBrandRex),thefibermanufacturer(SpectranSpecialtyOptics,nowLucentSpecialtyFiberTechnologies),andTheAerospaceCorporation.Duringthesummitthefollowingoverviewwaspresented:thefailurefound,methodsusedtodetectthefailures,themanufacturingprocessesandfaulttreesproducedbyBoeing.Theoriesabouttherootcausewerediscussedandaplanwasdrafted,toinitiateaformalrootcauseinvestigation,todeterminethereliabilityof thecableinstalledintheU.S.Labandtodeterminewhethermoreofthesamecableshouldbemadeforspaceflightuse.BoeingretainedtheleadershipforthelatterportionoftheinvestigationandassignedNASAGSFCtheleadoftherootcauseinvestigation.This wasdone with NASA GSFC's concurrence and NASA JSC's concurrence and funding support. The attendees
of the summit became the core of the combined investigation team.
Courtesyof TheBoeing Company
Figure 1 "Rocket Engine" Defect
The investigation plan included a review of the processes used by the cable distributor (Sea Wire and
Cable), the cabler and the fiber manufacturer. A review of process data was performed to identify
significant changes that may have contributed to the root cause. Research and experiments were alsoperformed in support of the root cause investigation by several of the participating organizations. Apreliminary review of the current cable specification was done. Strength testing was performed by Boeing
in support of the cable reliability investigation. Weekly telecons were held to review the emerginginformation and to formulate upcoming activities. Experts from Dupont and Lucent-Bell Laboratories were
invited to participate to assist in analysis of the test results being collected and to guide emerginghypotheses. Lucent-Bell Laboratories also conducted testing for the investigation.
2 8/1/00
Awebsitewasestablishedfortheteam.All photographsanddocumentsbeingdistributedthroughouttheteamwerepostedthere.A passwordprotectionsystemwasputinplacetolimitaccesstoonlyteammembersandtoprotectmanufacturer'sproprietaryinformation.
Thepresentationof the hypothesis by Lucent-Bell Laboratories, which proposed that the root cause of thedefect was hydrofluoric acid (HF) etching and their subsequent duplication of the defect using HF, was a
turning point in the investigation. Subsequent activities focused on understanding the circumstances, both
chemically and environmentally, which would support etching of the glass in this way. By understandingthe conditions, which would support HF etching of the glass fiber, the failure causing defects could beidentified. The team also started to consider the manufacturability of cable without these defects and/or
methods, which could be used to screen them out,
In parallel with the research on the HF etching mechanism, Boeing wrote a test plan and constructed the
test equipment to conduct strength testing of fiber from lots of the same manufacturing period associatedwith the installed cable. The intention was to make a life expectancy prediction using a statistical
parameter, which determines the life of glass which ages due to stress corrosion. The lifetime predictionwould also consider the stress and temperature conditions the installed fiber will experience due to how itwas installed within the cable and within the spacecraft structure, the stresses associated with launch, and
the presence of a moist ambient environment in space. Testing was performed on fiber that was still
contained in the cable (finished product) and though the data did not clearly provide a quantifiablereliability number, it did show that even after the "rocket engine" defects were screened out, the fiber had
low break strength. End faces of the cabled fibers, which broke at low strength, were inspected and they allfeatured a characteristic bubble-like feature in the polyimide coating and bare glass surfaces, which havebeen etched or corroded. This evidence is believed to indicate that discontinuities in the fiber coating are
allowing both the "rocket engine" etch pit and low strength associated with moisture enhanced stresscorrosion.
A second summit was held by Boeing in February 2000 to summarize the progress made by the team, to
formulate a plan for future use of the installed cable and to plan for the purchase of new cable. New teamswere established for the following action areas: 1) cable redesign, specification rewrite and cable
qualification, 2) Root cause wrap-up, 3) Maintenance plan for on-orbit repair inside the module, 4)Maintenance plan for extra-vehicular on-orbit repair, and 5) Plan for a shuttle mission experiment to
understand in-flight risks associated with this cable. This report is the final deliverable for Team 2.
3.0 CABLE HISTORY
3.1 The Specification
The optical cable being used by Boeing on ISS is governed by the NASA specification SSQ 21654, "Cable,
Single Fiber, Multimode, Space Quality, General Specification for". The custodian of the specification isMcDonnell Douglas Space Systems Company in Huntington Beach, CA. This organization is now owned
and operated by Boeing. The most recent approved version is Revision B, dated June 28, 1996 [ref-2]. Achange revision was made by Boeing, named SSCN 000904, which affected most of the paragraphs. This
change notice is not dated. A draft of revision C also exists, but was never approved for use.
A cursory review of Revision B by GSFC identified significant problems with the specification andindicated that it does not accurately describe the physical characteristics and performance of the cable that
is being used and does not adequately define the qualification requirements. The condition of thespecification is not considered to be a leading cause of the failure of the cable. Team 1, described in the
Background section above, may produce a new version, which will supercede all of these previousversions.
3 8/1/00

3.2 The Cable Design and The Performance Requirements Used
Two part numbers were defined in Revision B and the change notices: NFOC-2TFF-1GRP-I and NFOC-2FFF- I GRP- 1. The former was for a PFA jacketed and PFA buffered design and the latter was for a FEPjacketed and FEP buffered design. Table A-1 of SSQ 21654, Revision B., SSCN 000904 summarizes the
optical performance ratings and cable component materials and dimensions, and is included here as Figure2 and Table 1 below. The corresponding part number to Figure 2 and Table 1 is NFOC-2FFF-1GRP-I. A
erossection is shown in Figure 3.
Find
AB
C
D
E
F
G
Item Dimension Material Construction
Core 100 + 2lam
Cladding 140 + 2[tm Doped Silica Drawn
Hermetic Coating 0.025-0.05 _tm Carbon Based Chemical VaporThickness Hermetic Sealer Deposition
Fiber Coating Buffer 170 +2 [am Polyimide Coat with HeatCure
Cable Buffer FEP-Teflon Extruded
Strength Member
Cable Jacket
380-760 + 251xm
1.6mm OD
2.10 + 0.05mm.25mm Thick
Teflon
Impregnated
FiberglassFEP-Teflon
Braided
Extruded
G E [ C&D A&B
Figure 2 NFOC-2FFF-1GRP-1 Cable Design
4 8/1/00

CourtesyofNASAGSFCFigure 3 Crossection of the NFOC-2FF-IGRP-I Cable
Table 1 NFOC-2FFF- 1GRP- 1 Optical & Mechanical Characteristics
Characteristic From SSQ 21654,SSCN 00904
Attenuation
Numerical ApertureBandwidth
Proof Strength
Core Ovality
Cladding Ovality
Core/Cladding Offset
Cable WeightColor
Temperature
4 dB/krn @ 1290 + 10 nm
0.30 + 0.02 @ 1290 + 10 nm
200 MFIz-km @ 1290 + 10 nm
200 kpsi minimum5%
4%98% minimum
5.5 ibs/1000 ft. maximum
Violet per Mil-Std- 104
Operating: - 100°C/+75°C
Storage: -100°C/+85°C
Order sheets were reviewed by Boeing and an inspection of the U.S. Lab was done by Boeing tounderstand how much of the NFOC-2TFF-1GRP-1 (PFA/PFA) cable may have been used in the U.S. Lab.
SEA Wire and Cable (SEA) provided information about orders delivered for both the NFOC-2TFF-1GRP-1and NFOC-2FFF-1GRP-1 cable. Table 2 shows the lengths of NFOC-2TFF-IGRP-1 cable ordered byseveral users.
Table 2 Deliveries of PFA Jacketed Cable
Invoice Period No. ofOrders
8/11/93 1
3/6/95 & 8/14/95 2
9/6/95 1
9/18/95 1
12/95 1
3/30/95 1
4/20/95 1
Customer Name Total length
ordered (ft)
MTP Aircraft 525
Boeing Huntsville 45
Spar Aerospace (CAE Electronics) 700
McDAC (Boeing HB) 5000
ITT Cannon 4500
Space Systems Loral (for Japan) 197
Standard Wire and Cable 434
5 8/1/00

TheequipmentinspectiondidnotfindanyNFOC-2TFF-1GRP-1(PFA/PFA)cableintheU.S.Lab.Evidenceisnotdefiniteabouttheuseof-2TFF-inISSelementNode1.A listofNode1harnesses,preparedaspartofanothereffort,indicates1harnesscontaining10linksisconstructedof-2TFF-.Thetotallengthof-2TFFcable,perthislist,isapproximately200feet[ref-3].ThematerialdeliveredtoITTCannonisbelievedtohavebeenusedin thedevelopmentandqualificationoftheconnectorsusedbyISS.NFOC-2TFF-1GRP-1isnolongerbeingusedbecauseitsopticallosswasfoundtoincreaseafterthermalcyclingduetoexcessiveshrinkingofthePFAmaterial(jacketandbuffershrinkagewasnotcontrolledbythespecificationrequirements).
Table3 inSection3.3showstheNFOC-2FFF-1GRP-1cabledeliveredbythesoledistributor,SEAWireandCabletovariouscustomers.BICC'sshippingcertificateofcompliancereferencesthecabler'sinternalpartnumber,OC-1614,andcontainsasentenceatthebottomindicatingthatthecablewas"manufacturedtoandacceptancetestedinaccordancewiththeSSQ21654,andCRSSQ21654-008".
SEAperformedcableouterdiameter (OD) measurements at each end of the reel as an acceptancemeasurement. For all other acceptance measurements, SEA used BICCGeneral generated "Certified Test
Data" to document the conformance of the cable to the specification requirements. Samples of these
documents were provided by SEA and BICCGeneral. Ten of the 25 design characteristics reported byBICCGeneral are recorded on a go/no go basis; ten are referenced to a "Spectran" inspection, and five are
shown as a measured characteristic. ["Spectran " refers to the fiber manufacturer, formally known asSpectran Specialty Optics Company and now called Lucent Specialty Fiber Technologies or Lucent-SFT].
Several other identifying numbers are shown on the sheet including reel number, date, customer ordernumber, BICCGeneral part number, Date of Manufacture (DOM) and length. The BICCGeneral partnumber used was OC-1614. A footnote at the bottom of the sheet indicates that the material is made and
tested in accordance with SSQ 21654.
All of the requirements referenced on the test data sheet correspond to those listed in Figure 2 above.
During a review of the processes used at BICCGeneral, the attenuation and cable layer dimensionsmeasurements done by BICCGeneral were found to be in accordance with the specification requirements.
BICCGeneral ordered the fiber from Lucent-SFT in accordance with a build specification numberedBF04515. A review of the processes used at Lucent-SFT showed that they were performing optical and
visual inspections correctly including fiber geometry measurements.
Issues were identified with respect to the manner in which the proof test is executed at Lucent-SFT. An
industry standard proof test is defined by EIA-FOTP-455-31, Fiber Tensile Proof Test. This test method
specifies that the user specified minimum tensile stress is maintained on the fiber for a minimum time of 1second. Lucent-SFT's implementation of the proof test in-line with the fiber draw process does not achievethis dwell time. It was recommended that Lucent-SFT also add a bend in a fourth axis to achieve a test that
exposed more of the fiber surface to the tensile load. Strength testing done by Boeing on virgin BF04515fiber (never put through any of the cabling processes) showed results above 5 lbs.
The cable specification requires the fiber used to meet a minimum proof strength of 200 kpsi, (which
corresponds to 5 lbs of tension for this fiber), though it does not detail how that strength should beestablished. Since in-line proof testing is fairly common throughout the industry, the EIA test method
needs to be revisited to provide a high-speed test or to disallow it. The SSQ documentation will have to dothe same.
Both the fiber manufacturer, Lucent-SFT, and the cabler, BICCGeneral, were found to be delivering
product in accordance with the details shown in Figure 2 and Table 1 above with the exception that thefiber proof test was not achieving a 200 kpsi load on the fiber.
6 8/1/00
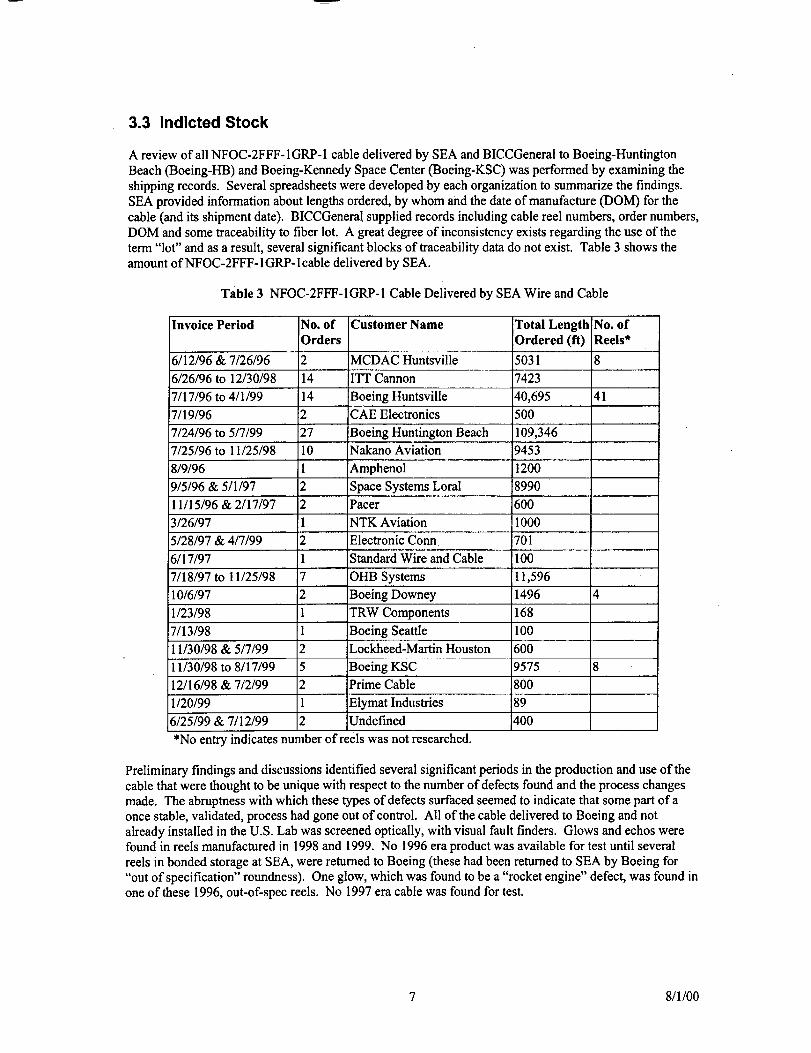
3.3 Indicted Stock
A review of all NFOC-2FFF-1GRP-I cable delivered by SEA and BICCGeneral to Boeing-Huntington
Beach (Boeing-HB) and Boeing-Kennedy Space Center (Boeing-KSC) was performed by examining the
shipping records. Several spreadsheets were developed by each organization to summarize the findings.
SEA provided information about lengths ordered, by whom and the date of manufacture (DOM) for thecable (and its shipment date). BICCGenera! supplied records including cable reel numbers, order numbers,DOM and some traceability to fiber lot. A great degree of inconsistency exists regarding the use of the
term "lot" and as a result, several significant blocks of traceability data do not exist. Table 3 shows theamount ofNFOC-2FFF- 1GRP- I cable delivered by SEA.
Table 3 NFOC-2FFF-1GRP-1 Cable Delivered by SEA Wire and Cable
Invoice Period No. ofOrders
6/12/96 & 7/26/96 2
6/26/96 to 12/30/98 14
7/17/96 to 4/1/99 14
7/19/96 !2
7/24/96 to 5/7/99 27
7/25/96 to 11/25/98 10
8/9/96 1
9/5/96 & 5/1/97 2
11/15/96 & 2/17/97 2
3/26/97 1
5/28/97 & 4/7/99 2
6/17/97 1
7/18/97 to 11/25/98 7
10/6/97 2
1/23/98 1
7/13/98 1
11/30/98 & 5/7/99 2
11/30/98 to 8/17/99 5
12/16/98 & 7/2/99 2
1/20/99 1
6/25/99 & 7/12/99 2
Customer Name Total Length No. ofOrdered (ft) Reels*
MCDAC H_tsville 15031 8
ITT Cannon 7423
Boeing Huntsville 40,695 41cAE Electronics 500
Boeing Huntington Beach 109,346
Nakano Aviation 9453
Amphenol 1200
Space Systems Loral 8990
Pacer 600
NTK Aviation 1000
Electronic Conn 701
Standard Wire and Cable 100
OHB Systems " I 1,596 ...........
Boeing Downey 1496 4
TRW Components 168
Boeing Seattle 100
600
9575 8
800
89
400
Lockheed-Martin Houston
Boeing KSCPrime Cabie
Elymat Industries
Undefined
*No entry indicates number of reels was not researched.
Preliminary findings and discussions identified several significant periods in the production and use of thecable that were thought to be unique with respect to the number of defects found and the process changes
made. The abruptness with which these types of defects surfaced seemed to indicate that some part of aonce stable, validated, process had gone out of control. All of the cable delivered to Boeing and not
already installed in the U.S. Lab was screened optically, with visual fault finders. Glows and echos werefound in reels manufactured in 1998 and 1999. No 1996 era product was available for test until several
reels in bonded storage at SEA, were returned to Boeing (these had been returned to SEA by Boeing for"out of specification" roundness). One glow, which was found to be a "rocket engine" defect, was found inone of these 1996, out-of-spec reels. No 1997 era cable was found for test.
7 8/1/00

Table4 ShipmentsContainingReelsofCableFoundwithRocketEngineDefects
Cable LengthDlvrd to SEA (ft)
BICCGeneral SHIP
DATE
(always within 1 wkof manufacture
date)12/22/95
4/30/99
Number of ReelsScreened*
20286
Number of Reels
Found with
Defect(s)
545
2/16/96 200
6/12/96 1900
6/17/96 1718
6/18/96 640
6/25/96 2555
8/1/96 2655 5 0
8/29/96 6836
9/26/96 22060
12/19/96 7048 6 1
11/21/97 15574
2/28/98 3847/21/98 4998 5 2
8/25/98 6988/27/98 95948/28/98 3402 4 0
11/24/98 20044 1 13/31/99 15710 14 13
4/1/99 7092 9 712 3
*No entry indicated and no screening performed on associated lot.
No uncabled fiber of 1996 vintage was available for examination. Five reels of 1998 BF05202 fiber,which had never been cabled, were available at GSFC through another flight project (BF05202 fiber uses
the same preforms and draw processes as the BF04515 except that slightly different cladding and coatingouter diameter specifications are used). No glows were found in these reels (-3,000 ft of fiber).
The links installed in the U.S. Lab were not each inspected with either a visual faultfinder or an OTDR due
to the lack of equipment and manpower resources. This precludes determining the relationship between the
quality of the installed cable and the quality of the samples that were available for test, but were of adifferent manufacturing period.
Oral histories were taken from people involved in the assembly of the harnesses used in the U.S. Lab. Thetechnicians indicated that there was an unusually high amount of scrap but that it wasn't considered high
enough to stop production for failure analyses. The failures were attributed to handling, which may havebeen a logical assumption for a team new to working with fiber. It may also have been the result of aninadvertent defect screen. Some breaks were found in integrated harnesses in the U.S. Lab but they were
typical of failures due to overstress at connector backshells.
The "rocket engine" defect in the 1996 cable and the speculation that some "rocket engine" defects mayhave been discarded in the scrap associated with the U.S. Lab harness builds, caused the team to suspect
that the "rocket engine" defect and the low strength failure mode was ubiquitous to the NFOC-2FFF-GRPI-I cable.
8 8/1/00

4.0 MANUFACTURING PROCESSES
The manufacturing processes used by SEA, BICC and Lucent-SFT were discussed regularly during theinvestigation. Reviews at each of the respective plants (two for Lucent-SFT) were performed in order to
understand the processes being used and their possible contribution to the creation of the defect.
4.1 Distributor
Boeing-HB led the review and performed a data traceability review for six NFOC-2FFF-1GRP-I 1996 eracable reels. Some records were found while others were not. SEA processing required only measuring
OD, cutting cable to length (including a respooling process) and re-labeling the spools of cable receivedfrom BICC. All cable shipped to Boeing-Huntsville (Boeing-HSV) was respooled to plastic reels from
wood reels. There were no processes found at SEA to be damaging the cable and causing the rocket enginedefect.
4.2 Cabler
BICC generally delivered the cable to SEA within six days of its manufacture. Twenty (20) deliveries toSEA were made between 12/95 and 4/99, mainly centered around: the second half of 1996 (46 kfl total),
11/21/97 (15 kit), 10/98 (39 kit), and 4/99 (43 kit). The records show no production other than these four
periods.
A comparison of the shipment records to the reels identified with the "rocket engine" defects did not clearly
show an abrupt increase in defective cable corresponding to large changes in either production volume orcable length. There were distinct periods of high throughput and shipment of multiple short lengths. Areview of some of the corresponding purchase order information indicates that the short lengths were not
specified by the buyer.
The processes given the most attention during the review at the BICC facility were the records keeping,fiber respooling, extrusion and the optical measurement processes. Later discussions focused on the
extrusion process because findings were revealing that the extrusion conditions were very likely causing a
generation of HF which acts as an etchant when it contacts glass.
4.2.1 Record Keeping
Records for six reels of cable were exhumed. Most of the materials traceability was not recorded. A buffer
run sheet, which specifies manufacturing settings/conditions and specifications for a given product, is
provided to the extruder operator to record the events of the run. These sheets were not filled out properlyfor the reels of interest, more so for the 1996 timeframe. The record keeping has improved over the periodthat the NFOC-2FFF-1GRP-1 has been made at BICC, however it is still not sufficient to show a complete
traceability history. There is no fiber traceability, for example, for most of the reels made in 1996 - the
vintage used to populate the US Lab module.
4.2.2 Storage and Factory Environment Control
"The environmental conditions of the extrusion facility were kept to 21 to 24 degree C and 45% to 50%
relative humidity. Fiber storage was controlled in a separate area with limited access. The cable
manufacturing location, containing two extrusion lines, were also outside of the general walking traffic.All processes following re-spooling and fiber storage were performed in the same room.
9 8/1/00
4.2.3 Respooler
Correspondence records supplied by BICC showed that in January of 1997 McDonnell Douglas (NowBoeing-HB) notified them that the polyimide coating on the fiber in the NFOC-2FFF-IGRP-1 cable, wasdimensionally out-of-specification. This was confirmed by Boeing-liB personnel who were not able to
terminate the fiber in the connector ferrules because its outer diameter (OD) was too big (following return
of the product it was realized that the wrong fiber part number was cabled and shipped). Between 3/97 and
10/97 arrangements were made to use a LaserMike TM laser based measurement device installed on a fiber
coating machine to screen the fiber for out-of-spec OD. This equipment, a Nokia OFC52, was normallyused to add colored coatings to fiber for identification purposes, and is often referred to as a color-line. Use
of this system as a screen was first used on 10/7/97 and became a permanent process for the NFOC-2FFF-
IGRP-1 cable thereafter. Adjustments were made in April of 1998 to resolve calibration issues.
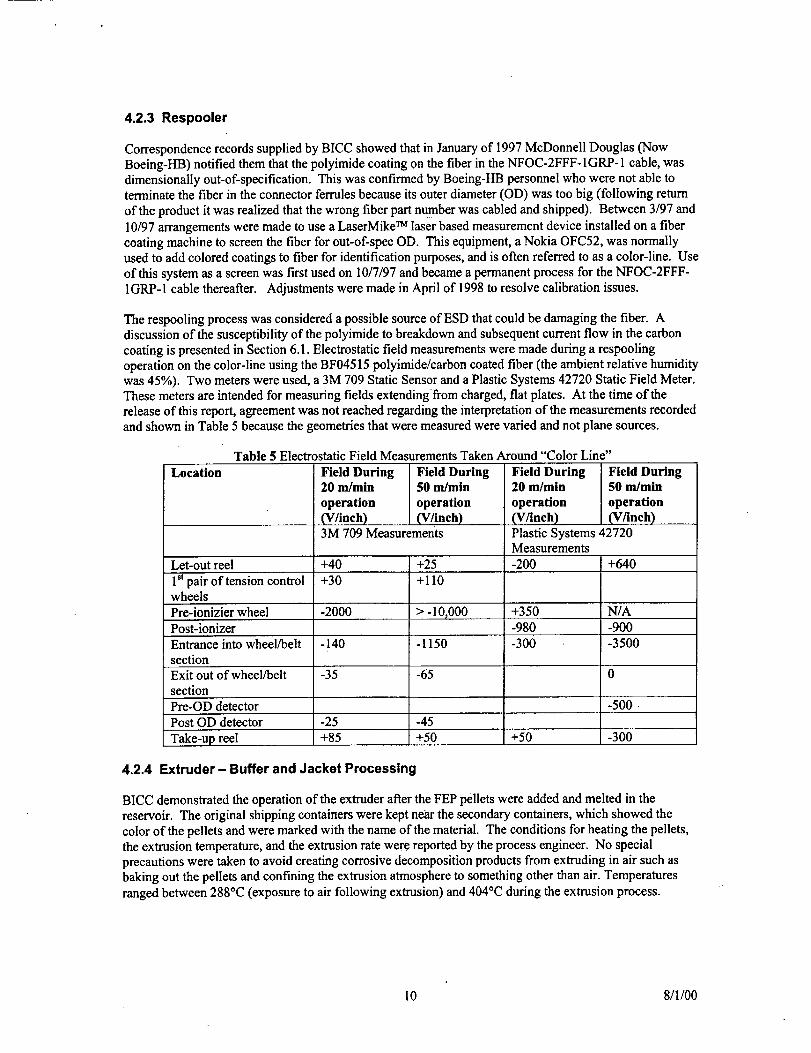
The respooling process was considered a possible source of ESD that could be damaging the fiber. Adiscussion of the susceptibility of the polyimide to breakdown and subsequent current flow in the carbon
coating is presented in Section 6.1. Electrostatic field measurements were made during a respoolingoperation on the color-line using the BF04515 polyimide/carbon coated fiber (the ambient relative humidity
was 45%). Two meters were used, a 3M 709 Static Sensor and a Plastic Systems 42720 Static Field Meter.These meters are intended for measuring fields extendingfrom charged, fiat plates. At the time of the
release of this report, agreement was not reached regarding the interpretation of the measurements recordedand shown in Table 5 because the geometries that were measured were varied and not plane sources.
Table 5 Electrostatic Field Measurements Taken Around "Color Line"
Location Field During Field During20 m/min 50 m/min
operation operation(V/inch) (V/inch)3M 709 Measurements
Field During Field During20 m/min 50 m/min
operation operation(V/inch) (V/inch)
Plastic Systems 42720Measurements
Let-out reel +40 +25 -200 +640
+30 +110I st pair of tension controlwheels
> -10,000Pre-ionizier wheel -2000 +350 N/A
Post-ionizer -980 -900
Entrance into wheel/belt -140 -1150 -300 -3500section
Exit out of wheel/belt -35 -65 0
section
Pre-OD detector -500
Post OD detector -25 -45
Take-up reel +85 +50 +50 -300
4.2.4 Extruder- Buffer and Jacket Processing
BICC demonstrated the operation of the extruder after the FEP pellets were added and melted in the
reservoir. The original shipping containers were kept near the secondary containers, which showed thecolor of the pellets and were marked with the name of the material. The conditions for heating the pellets,
the extrusion temperature, and the extrusion rate were reported by the process engineer. No special
precautions were taken to avoid creating corrosive decomposition products from extruding in air such asbaking out the pellets and confining the extrusion atmosphere to something other than air. Temperatures
ranged between 288°C (exposure to air following extrusion) and 404°C during the extrusion process.
10 811/00

Immediately following extrusion, the cable passes through two water baths. The same process, with adifferent extrusion head, is used when applying the jacket. The extrusion line was reviewed with the fieldmeters the results of which are shown in Table 6.
Table 6 Electrostatic Field Measurements Taken Around
the Extrusion Line During a Buffering Operation
Location Field
(V/inch)Let-out reel , -750
-150Air space between quenching baths
Exit of second quenching bath
Length counter (wheel & belt)
Rubber belts - entryRubber belts - exit
Tension wheels - 1_t
Tension wheels - 2 nd
Tension wheels - 3 rd
-10
-110
-45
+2000
+2250
+75
Ground chain - 100Metal feeder wheel +305
Take up reel (in path of de-ionizing fan) -1500
* Did not capture numerical data but recollection is that it was near theminimum floor of 50V/inch.
4.2.5 Strength Members
The equipment and materials used for applying the braided strength members to the buffered fiber were
briefly reviewed and found to be industry standard with no detail that seemed related to the fiber failure.BICC reported that the only time they rejected finished NFOC-2FFF-1GRP-1 cable was when lumps werefound under the jacket due to the strength members (associated with the change out of a spool of the
strength member material, Teflon TM impregnated fiberglass). Lengths with this defect were cut out and notdelivered to SEA.
4.2.6 Optical Measurements
Both a Tektronix TM TFP2 FiberMaster and a GNNettest TM CMA 4000 are used, at 1300 nm wavelength, for
measuring attenuation. The equipment and set-up were witnessed and nothing was found that wouldindicate incorrect measurements were being recorded or that the method being used contributed to the fiber
defect. BICC reported that they had not rejected any reels of cable based on optical performance.
4.3 Optical Fiber
Great attention was also paid to the details of the fiber production processes in order to understand the rootcause of the defects and if any conditions were found which could isolate them to specific lots or periods of
production.
4.3.1. Raw Materials for Preform Manufacture
Lucent-SFT makes their own glass preforms. The applicable raw materials are the natural quartz cladding
tubes and the gases. The gases are monitored for quality on an incoming sample basis and are monitoreddaily, in-line, for water content. The tank farm for most of these gases (some come in transportable
cylinders) was moved between 1996 and 1997. There was no strong evidence indicating that the move ofthe tank farm or the handling of the gases allowed contamination of the gases or contamination of the
preform manufacturing processes.
11 8/1/00

The pure fused silica substrate tubes are reviewed for defects and records are kept allowing traceabilitybetween the raw material and the finished preform. Many of the preform build records showed a great
degree of "flaws" in the tubes however this is normal in natural quartz. These features in the receivedquartz tubes have not been connected with the "rocket engine" defects or the low break strength and have
not been investigated further.
4.3.2 Preform Fabrication
The BF04515 fiber is drawn from preforms uniquely identified by a part number containing the number
320-R. All "320-R" preforms are made on one lathe, which is reflected in the preform part number. Thislathe is also used to fabricate several other preforms whose recipes use all of the same ingredients as those
used for the "320-R" product or a subset thereof. The "320-R" preforms are also the originating material
for several other variations of fiber dissimilar to the BF04515 only in the glass and coating tolerances. The"320-R" lathe is located apart from the main production area in an area reserved for R&D activity, is air-
conditioned and is humidity controlled. R&D operators are selected from the experienced pool of operatorswho make standard Lucent product.
The build sheets include requirements for the gas mixture, the process recipe and spaces for recording
observations and process variations. Tweaking of the process recipe is allowed within engineered specifiedlimits and is performed by the specially trained preform technicians who run the equipment and monitor the
fabrication run. When a slight change is made for this purpose, it is saved as part of the current preformrecipe. The recipe revision in place during each preform run is recorded on the build sheet. That recipe
revision will stand until another change supercedes it. The dimensions of the finished preform and defectsor features, such as bubbles and airlines, observed in the preform are also recorded. A refractive index
profile is measured for each preform in a separate laboratory. An example of one is shown in Figure 4 [ref-4]. The "MESA" database is used to link the preform records with the records for the finished fiber. Thisautomated filing system was started in the second half of 1996. A paper system predated the use of the
"MESA" system.
"5
1,49
1,48
1,47
1,46
.__/-
I I
-80
i i i I ' ' ' ! ' t i I ' ' ' I '
Index distribution for FlightGuide fiber
AtY
. n = 1.490I V
I , t , I , , l I J i t ! , i , I t , , I
-60 -40 -ZO 0 ?0 40
Displacement from center (micrometers)
i | i ! i
1 I
6O
"x__.i | i
8O
Figure 4 Preform Index Profile
12 8/1/00

Preformprocessingincludescleaningandetchingthesubstratetubeandthefinishedpreform.Bothahydrofluoricacidbathandfirepolishareused.ThesemethodsalongwiththeCVDmethodforgrowingthecore/claddingtransitionallayerandthecore,eliminatethepossibilitythatcontaminationwastrappedbetweenthecoreandcladding,insideofthecoreorinthesurfaceofthecladdinglayerofthepreform.Thecreationofavoidinsideofthepreformduetoaninsidecontaminantcouldonlytakeplaceduringthemajorneck-downofthepreformduringthefiberdrawprocess.Thiswouldproduceadefectelongatedbyatleastsomesignificantfractionofthedrawdownratio,whichisapproximately12,000:1inthelongitudinaldirection.Thisamountofelongationisquitetheoppositeoftheshapeoftheradiallyelongated,bulbshapeddefectthatisthesubjectofthisreport.
Areviewof the preform records showed manufacture of 181 "320-R" preforms between 11/94 and 8/98,
the heaviest period of production of being between July of '96 and April of '97. Of these 181, 17 weretraceable to NFOC-2FFF-1GRP-1 cable. Eight were associated with reels found with a "rocket engine"
defect. All preforms used for the Boeing fiber were produced prior to August of '98, and were held in
stock up to a year before they were drawn into fiber.
4.3.3 Fiber Manufacture
A review of the fiber draw and cabling facility in Avon, CT was performed. Though the traceabilitybetween the cable and the fiber is not complete for much of the pre-1997 cable, the records indicate that atleast 81kft of fiber in the NFOC-2FFF-1GRP-1 cable was drawn at the current facility and 53kft was drawn
at a facility which has since been decommissioned. The fiber drawn for the NFOC-2FFF-1GRP-1 cable is
called BFO4515 by Lucent-SFT.
The current facility, at Darling Drive in Avon, CT, contains several draw towers although all of theBFO4515 fiber was drawn on a single tower that is part of the fiber reel number. The draw room is
temperature controlled to around 22°C and limited to traffic through a clean-room entrance (approvedpersonnel only, smocks required, etc.). An auxiliary glass lathe for fire polish is kept in the same area asthe draw tower. In-line and end-of-line test equipment are run along side the tower controllers and
computers.
The build records start by instructing the draw operator how to manually set the tower settings which
include draw speed, iris settings, gas flows and cure temperatures. A two-axis laser based micrometer isused with an active control feedback to the glass furnace. The control loop allows real-time adjustment of
the draw speed in order to maintain the required glass outer diameter. The reactor for the carbon coating islocated immediately below the draw furnace, which is at the top of the tower. The polyimide coating is
applied in several stages below the draw furnace. The polyimide forming material is delivered to thecoating applicator cups. Coating die size, incoming fiber size, draw speed, and material viscosity(temperature controlled) determine the actual volume per unit length deposited onto the fiber. The coating
application dies are fabricated from specialized materials in order to preserve the ultra high precision
required over multiple draws.
The draw operator looks for defects in the coating as an in-line acceptance screen during draw. Coating
defects are inspected visually and by "feel". A LaserMike TM -based, four-axis inspection system is in place
in-line to detect coating thicknessess out of specification. This second set of laser micrometers do not havean active control loop with the coating process. They trigger an alarm when the geometry limits are not net
and the draw operator must react appropriately.
All of the BF04515 fiber was proof-tested in-line during the draw/coating process using a 3-plane mandrel
system. Lucent has recently increased the number of mandrels/planes to 4. The review team is not inagreement regarding the proper execution of an in-line proof test that will expose the coated fiber to aminimum 200 kpsi for a minimum length of time. Recommendations about how an in-line proof testshould be done, will be submitted under separate cover to the EIA/TIA for inclusion in the standard test
method.
13 8/1/00
Followingthecompletionofthedraw/coatingprocess,thefiberismeasuredforitsopticalperformance,aresistancemeasurementforthecarboncoatingistakenandcoatinggeometrymeasurementsaremadeatatestbench.Bandwidthmeasurementsaremadeatthreewavelengths,lossmeasurementsaremadeatapproximately6wavelengthsincluding1380nmforthewaterpeak.NumericalAperture(NA)ismeasuredatanunspecifiedwavelength.Theresistancemeasurementisusedforscreeningthequalityofthecarboncoating.Geometrymeasurementsinclude:coreandcladdingdiameter,coreandcladdingnoncircularity,clad/coreconcentricity,polyimidecoatingdiameter,andcoatingconcentricity.
Whennon-conformingsectionsoffiberneedtoberemovedfromthereel,thefiberisrespooledunderade-ionizingfanusedtoremovecharge.Sub-spoolsofasingledrawlotareassignedthesamedrawlotnumberandauniqueletteridentifiersuffixforthespool.
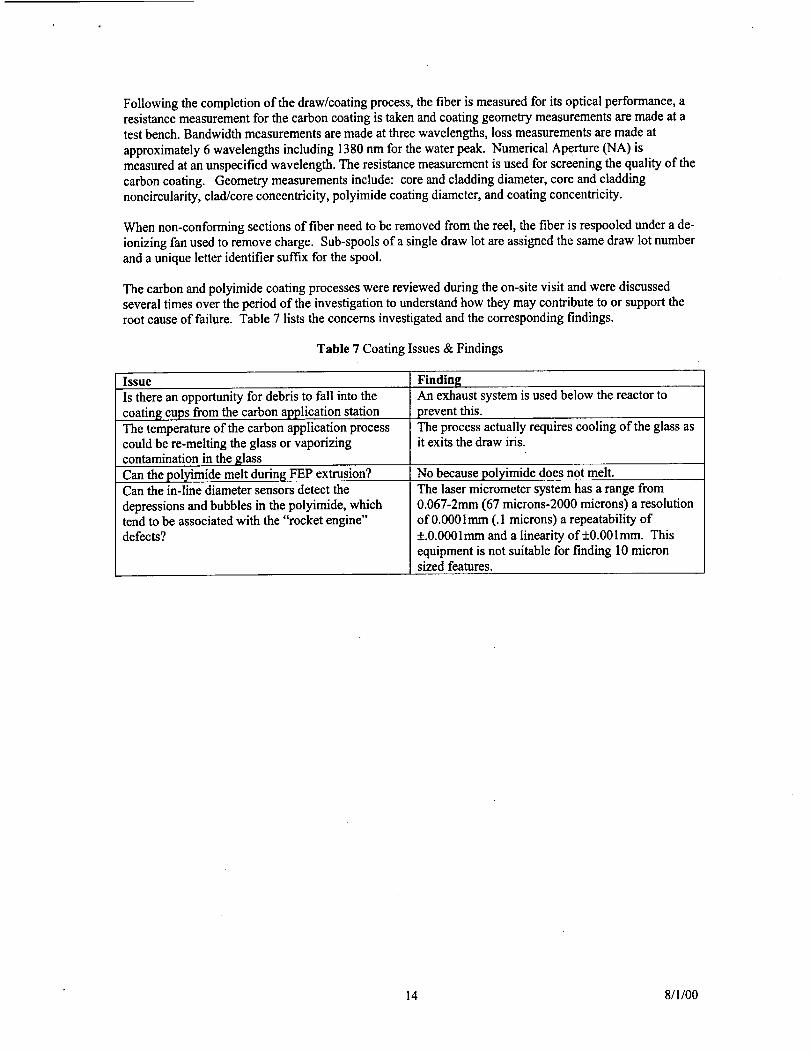
The carbon and polyimide coating processes were reviewed during the on-site visit and were discussedseveral times over the period of the investigation to understand how they may contribute to or support theroot cause of failure. Table 7 lists the concerns investigated and the corresponding findings.
Table 7 Coating Issues & Findings
Issue
Is there an opportunity for debris to fall into the
coating cups from the carbon application station
The temperature of the carbon application processcould be re-melting the glass or vaporizing
contamination in the glass
Can the polyimide melt during_FEP extrusion?Can the in-line diameter sensors detect the
depressions and bubbles in the polyimide, whichtend to be associated with the "rocket engine"defects?
FindingAn exhaust system is used below the reactor to_revent this.
The process actually requires cooling of the glass asit exits the draw iris.
No because polyimide does not melt.The laser micrometer system has a range from
0.067-2mm (67 microns-2000 microns) a resolutionof 0.0001mm (. I microns) a repeatability of
+.0.0001mm and a linearity of+0.001mm. This
equipment is not suitable for finding 10 micronsized features.
14 8/1/00

Thearrangementofthebubblesanddepressionswerefoundtobeinafairlystraightlineandparallelwiththelongitudinalaxisofthefiber.Figure14isaplotofthedistributionofthefeaturesalongthelengthofoneofthe"588"samples.
16
14
12
8 8
i°4
2
0
0 oo
5
o
o o
o
0
0
oo
o o
10 15
Hok) #
6
5
4-=__.
3g2_
1
" 0
20
Figure 14 Distribution of Features Along a 6" Sample of CD0588XD Fiber
Additional work with these samples was done to catalogue their relationship to breaches in the carbon
coating below them. Not only were breaches found below some of the bubbles, but others were found inthe vicinity of the bubbles but with no bubble on top of them as seen in Figure 15a and b.
Courtesy of The Aerospace Corporation Courtesy of The Aerospace Corporation
a. Features Below Polyimide Bubble, b. Polyimide Etched off with Sulfuric
Reflection Mode lOOx, 0.3/am Resolution Acid, Multiple Bright Spots at CarbonCoating Surface, Transmission Mode
Figure 15 Carbon Defects Seen Below Polyimide on Sample of CD0588XD Fiber
X-ray was used to see if defects on the surface of the coated fiber could be detected. Figure 16 shows thatX-ray can be used to look at the fiber without removing the cable elements which is useful for inspecting
for fiber which may be too long for the jacketing (in cases where the jacket and/or buffer has shrunken).
21 8/1/00

Courtesy of TheBoeing Corporation
Figure 16 E. Banks' Sample With a Broken'Fiber Whose Ends Overlap
A fiber inspection system, built by the US Army Aviation & Missile Command for their own internal use,
was used to try to inspect for 10 _tm sized features in the polyimide surface that might indicate the presenceof the bubble feature that has been consistently associated with "rocket engine" defects and low strength
breaks. The system uses an infrared detector and looks for signal scatter off of the surface at featurelocations. The feature is described with respect to the voltage of the returned scattered signal. When a
feature is found that corresponds to a minimum signal voltage, the system takes a picture of the
corresponding location. The inspection system is very sensitive to any surface feature, especiallycontamination such as lint and dust (Figure 17). A lint free dust capture stage was arranged around the
fiber and the inspection was continued. Figure 18 shows the image of a debris-free fiber with polyimidesurface features.
Courtesy of USArmy Aviation & Missile Command Courtesy of US ArmyAviation & Missile Command
Figure 17 Debris-Laden Fiber Figure 18 Cleaned Fiber
To see if, using a more typical inspections speed, 0.5 m/sec, the machine could provide useful statisticswhich would differentiate the two reels. Figure 19 and Figure 20 show the results of running
approximately 400 m through the machine, looking for a 0. IV feature size or greater. Additional work isrequired to understand the usefulness of a system such as this to identify defects in the polyimide coating.
22 8/1/00

2.5 ...........
,z
2 i .......
! 4,
i
I
1 .
!+ _'_ . aat,• ,i, 4
o,5o• •4 . + +Z* _,T=h*_,.eI* •-- _'. ll.Jt" _-t
41, +i,_ mt,d+dl..._... _.lldll_. •O• •
0 50 10P 150 200 250 300 350 400 450
Location (m)
Figure 19 Feature Statistics for CD0588XD ,
2,5 - - - ....... -- ......................
2I+. + ..... -- ........
_-_ !.5
| +I++
4,
i "+,m,. • $ • " +:o,sI ...... +_; . ._- , +* + •. +
+ - " l& +flo!_+ __'+,+_,41t,,....... o+..++ •......................o 5o +oo +m :,oo ++o +oo 35o
Location (m)
400
Figure 20 Feature Statistic for CD0384XC
23 8/1/00

i
6.0 MATERIAL BEHAVIORS AND INTERACTIONS
The interactions between the materials used for the fiber, its coating, and the cabling components are
believed to be at the root of the "rocket engine" defects. These materials were examined, as were theirinteractions in the environments created by the manufacturing processes. Artifacts found during the DPA's
led the investigation team to hypothesize about various material reactions including: decomposition of the
FEP buffer, discontinuities in the carbon/polyimide-flber coating leaving the glass exposed to etchants and
moisture, the electrical properties of the carbon/polyimide coating and the thermal stability of the
polyimide layer.
6.1 FEP Decomposition
FEP is a copolymer of tetrafluoroethylene (TFE) using hexafluoropropylene (HFP). It is sometimes
generally described as a Teflon® however its properties and processing requirements can be very differentthan those of the homopolymer PTFE. FEP is applied in optical cable manufacture using a melt extrusion
process. The maximum service temperature for FEP is 206°C (400°F) and the maximum processing
temperature is 400°C (746°F). The temperatures used in the BICC General process extend close to the
maximum processing temperature.
Decomposition of FEP depends upon the composition and temperature of the ambient environment. In amoist or dry environment containing oxygen, FEP decomposes at a rate of 0.05% and lower, by weight,
below 325°C (612°F) and at a rate of 2.5% and higher, by weight per hour at 400°C (746°F) [ref 9,10, 11].
In a moist or dry nitrogen environment the decomposition rate at 400°C (746°F) drops to 0.40°/dhour.When the atmosphere contains oxygen, the decomposition product is mainly COF2. In a dry, nitrogen
atmosphere COF2 is not created.
Though the COF2 was the majority decomposition component measured by Baker and Kasprzak, theynoted that it was difficult to capture all of it in the measurement because it so rapidly reacts with air, water
and the quartz chamber the FEP sample was heated in. Baker and Kasprzak remind us that at thetemperature and humidity (50% RH) of their experiments COF2 "hydrolyzes considerably according to:"
COF2 + H20 = CO2 + 2 HF (D
Testing was performed by NASA GSFC to confirm the evolution of reactive, fluorine containing gases,such as HF or COF2 from the NFOC-2FFF-IGRP-1 cable due to mechanical agitation and exposure to anelectric field. The set-up is shown in Figure 21. The NFOC-2FFF-1GRP-1 cable and OC1260 cable weretested. The OC1260 cable uses the same cable materials as NFOC-2FFF-1GRP-I except that its optical
fiber does not have the carbon layer under the polyimide coating. In both cases, the length of cable was
hooked up to a mass spectrometer. After pumping out all the gasses for between 16 and 72 hours, the cablewas stressed in the two different ways, mechanically twisting and exposure to an electric field.
24 8/1/00

Courtesyof NASA GSFC
Figure 21 Set-up for Mass Spectrometer Measurements of Fluorine Species Released From Fiber OpticCable
Mechanically twisting the NFOC-2FFF-1GRP-I cable resulted in the release of fluorinated species that
persisted for about five minutes. Mechanically twisting the OC 1260 released three orders of magnitudeless Fluorine. The spark from a Tesla coil was run over a length of the cable to induce charge breakdownby the cable components and the polyimide coating ending at the grounded carbon coating in the NFOC-
2FFF-1GRP-1 cable. This condition also resulted in a release of fluorinated materials, in larger quantities,lasting again about five minutes. In the case of minimal air leakage into the cable, a longer distancebetween the spark and the mass spectrometer corresponded to a lower rfiass flux rate from the cable and a
longer mass flow. After 48 hours, a significant fraction of the gasses entering the mass spectrometer waswater.
6.2 Polyimide Related Issues
The polyimide coating is intended to protect the fiber from mechanical insults. Its operating temperaturerange allows it to perform this function from -269°C (-452°F) to 400°C (752°F). This range makes it
suitable for use by ISS external vehicular applications where coating materials normally used forcommercial applications would fail. The polyimide coating also plays a role with respect to damage thatmay occur to the carbon layer and the glass when the fiber is exposed to a static electric field and how HF
generation may be occurring. DPA's of the "rocket engine" defects showed that the polyimide layer at
these defect sites often contains a void (Figure 7). It is not known how these voids occur, though they areconsistently associated with the rocket engine defects, and the low strength defects. They have been found
in coated fiber obtained directly from Lucent-SFT indicating that they are created prior to shipment andprocessing by SEA or BICC. Their root cause and their role in the reduction of fiber strength following themany processes used at BICC is not yet understood.
The polyimide is applied to the fiber through a polymerization process, not a melt process. DuPont's
recommendations for fully polimerizing polyimide could not be located. We were however, able to find
the glass transition temperature (Tg =325°C,), the dielectric withstanding voltage (DWV = 4 kV/mil) andthe modulus of the material used on this fiber (245 kg/mm 2) [ref 12]. Polyimide should not melt when its
glass transition temperature is exceeded. Lucent-SFT does not exceed the Tg when it processes thepolyimide coating. Though Lucent-SFT utilizes cure temperatures that are recommended by DuPont todrive off the solvents, the rapid travel speed through the cure ovens may not allow complete solventoutgassing.
25 8/1/00

Polyimide's hygroscopic nature provides a sink for ambient H20. This H20 can, in the presence of COF2 atroom temperature and above, result in the creation of HF during manufacture of this cable. COF2 and HF
can diffuse into polyimide. Polyimide will act as a sink for I-IF as it does for H20. Diffusion of HF intoand within the polyimide will continue until equilibrium is reached. I-IF will diffusion into some species of
carbon and not into others. If the amorphous carbon layer directly under the polyimide has a species, suchas carbon black, which absorbs HF, then the carbon black will be part of the equalibrium dynamics. Some
species of carbon do not absorb or react with HI 7 and so will not be part of the I-IF sink. Bare SiO2 or GeO2react with HF and so, are also part of the FIT sink in the polyimide/carbon coated glass system. The HF
will diffuse into the polyimide as long as there is more HF outside of its outer diameter than there is inside
of its volume, plus the volume of the absorbing carbon species plus the amount not yet consumed at the
bare glass interface.
Polymers used in electronic packaging have been tested to identify the risks associated with trapped water
when the part is suddenly exposed to high temperatures, such as happens during soldering [ref 13,14].Plastic encapsulated microcircuits have been found to fail due to delaminations at the plastic-to-metal leadframe interface when the trapped water expanded. These type of failures, known as popcorning, were
found to occur at material interfaces rather than within the homogeneous material, even if voids were
present. Better adhesion of the materials by the use of a primer or by roughing the surfaces is reported tobe possible solutions for reducing water collection at these interfaces. Popcorning as a root cause has notbeen investigated as of the date of this report.
The final thickness of the polyimide on the BF04515 is 15 _tm (0.60 mils). The cure schedule used maymake its mechanical and electrical characteristics differ from DuPont's published values [ref-12]. The
polyimide coating on a sample of BF04515 fiber, which had never been cabled, was tested for dielectric
strength. Several lots were not tested so we do not know how the value may vary on a lot basis. A value of6.5 kV/mil in 50% humidity [ref-15] was measured (See Section 6.5 below for the test set-up and morediscussion about ESD testing). DuPont's published value for fully cured polyimide is 4.0 kV/mil at 50%
RH. Burn marks were found on the sample tested (Figure 22).
Courtesy of The Aerospace Corporation
Figure 22 Bum Mark From DWV Testing of"Rocket Engine Defect"- Free Fiber
26 8/1/00
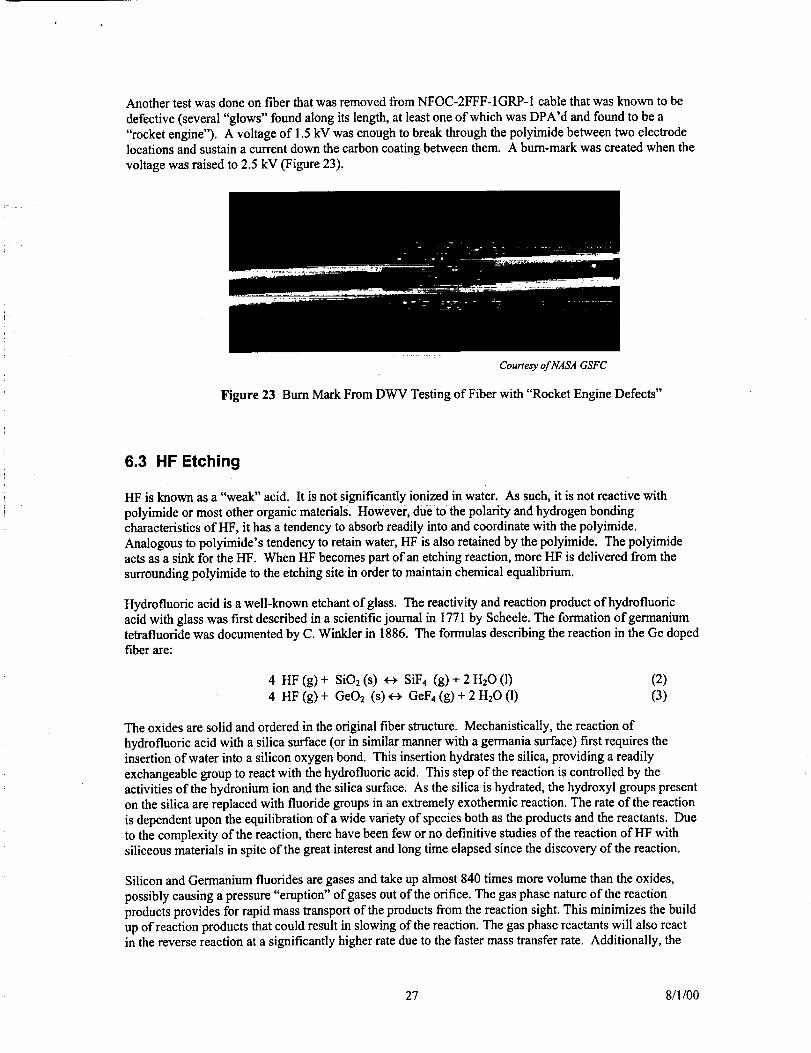
AnothertestwasdoneonfiberthatwasremovedfromNFOC-2FFF-IGRP-1cablethatwasknowntobedefective(several"glows"foundalongitslength,atleastoneofwhichwasDPA'dandfoundtobea"rocketengine").A voltageof 1.5kVwasenoughtobreakthroughthepolyimidebetweentwoelectrodelocationsandsustainacurrentdownthecarboncoatingbetweenthem.Abum-markwascreatedwhenthevoltagewasraisedto2.5kV(Figure23).
Courtesy of NASA GSFC
Figure 23 Bum Mark From DWV Testing of Fiber with "Rocket Engine Defects"
6.3 HF Etching
HF is known as a "weak" acid. It is not significantly ionized in water. As such, it is not reactive with
polyimide or most other organic materials. However, due to the polarity and hydrogen bondingcharacteristics of HF, it has a tendency to absorb readily into and coordinate with the polyimide.
Analogous to polyimide's tendency to retain water, HF is also retained by the polyimide. The polyimideacts as a sink for the I-IF. When HF becomes part of an etching reaction, more HF is delivered from the
surrounding polyimide to the etching site in order to maintain chemical equalibrium.
Hydrofluoric acid is a well-known etchant of glass. The reactivity and reaction product of hydrofluoricacid with glass was first described in a scientific journal in 1771 by Scheele. The formation of germaniumtetrafluoride was documented by C. Winkler in 1886. The formulas describing the reaction in the Ge dopedfiber are:
4 HF (g) + SiO2 (s) _ SiF4 (g) + 2 H20 (1)
4 HF (g) + GeO2 (s) _ GeF4 (g) + 2 H20 (1)
(2)
(3)
The oxides are solid and ordered in the original fiber structure. Mechanistically, the reaction of
hydrofluoric acid with a silica surface (or in similar manner with a germania surface) first requires theinsertion of water into a silicon oxygen bond. This insertion hydrates the silica, providing a readily
exchangeable group to react with the hydrofluoric acid. This step of the reaction is controlled by the
activities of the hydronium ion and the silica surface. As the silica is hydrated, the hydroxyl groups presenton the silica are replaced with fluoride groups in an extremely exothermic reaction. The rate of the reaction
is dependent upon the equilibration of a wide variety of species both as the products and the reactants. Dueto the complexity of the reaction, there have been few or no definitive studies of the reaction of I-IF withsiliceous materials in spite of the great interest and long time elapsed since the discovery of the reaction.
Silicon and Germanium fluorides are gases and take up almost 840 times more volume than the oxides,
possibly causing a pressure "eruption" of gases out of the orifice. The gas phase nature of the reactionproducts provides for rapid mass transport of the products from the reaction sight. This minimizes the build
up of reaction products that could result in slowing of the reaction. The gas phase reactants will also reactin the reverse reaction at a significantly higher rate due to the faster mass transfer rate. Additionally, the
27 8/1/00

reactioncreatesheatinthe forward direction, adding to the force of the eruption. The ejected material is
SiO2 and GeO2. The escaped fluoride gases, in the presence of water, will be in equilibrium with SiO3H2,
GeO2 and HF; this is essentially the reverse of the reaction proceeding from the point of the protonation of
the glass surface. This regenerates the HF in a catalytic manner. There are some side reactions that mayslightly decrease the active HF concentration; however, the HF is recoverable for reaction with the glass
until the HF is physically removed from the system. The SiO2 precipitates as a silica gel when the water
around it evaporates giving rise to spherical shapes surrounding the hole. The spheres are silica in ahydration state, but not vitreous glass. The same occurs for the GeO2, except that it forms a shard-like
crystalline structure. The reaction conserves mass and energy.
The shape of the cup in the cladding area reflects the speed at which the reaction occurs in the pure silicamaterial and its increasing speed in the Ge rich material. A FEA model was constructed for the BF04515
fiber to understand the internal stresses in the glass with a "rocket engine" defect when the fiber is under a
25% strain (Figure 24a through c). Figure 25a through c shows that the internal stress in the fiber in thiscase rises by a factor of three over a section, which is experiencing the same amount of strain with no
"rocket-engine" defect.
a. Element Mesh of Flawed Fiber Geometry
b. Side View of "Rocket Engine"Defect
c. Crossectional View of "RocketEngine" Defect
Figure 24 Model of "Rocket Engine" Defect
28 8/1/00

a. Stress in Flawed Fiber Under 25% Strain (view from top looking down into the hole)
_/PATRAHV,e_slOn O0 74-F_.00 1G:45.01
:._,: _r_.,_ ylaol.lotelltme. I: StJo'_ CompoOemC_.(/_l.l.AYl'R£Ol (MhJOR) ;?_38<)3
2.,?3.0
208-0
! 92.03
a.77-03
1.61-0_ ¸
_k4S:O,
5=37-0_
3.83.0,
2.29_0,
7,51-o'_
Mix 2,38:03 elkl tM_ 7.5_,05 e_ 1,4
b. Top View of Stress Model
'flng_ Oe_v_ _l_pt;lot,J_.t: Ylr_._ Co_-(HON4AVI_D) (MAJOR)
c. 45°Cutaway View of Stress Model
Figure 25 Stress Predicted by Fiber Model
29 8/1/00

LucentTechnologies experimented with BF04515 fiber from a cable with "glows". The polyimide coating
was stripped and the grounded, carbon coated fiber was exposed to a 1 kV source (wire electrode). An arc
discharged through the air between the wire and the fiber. The sample was then exposed to both aqueousand vapor HF (in a humid environment) [ref-16]. HeNe light was transmitted through the fiber during the
test and when light began to leak out of the side, the test was stopped. Figure 26 shows the resulting defectwith the characteristic bulb pattern and ringed structure seen in the Boeing photographs (Figures 9). The
sample was rinsed to drive off the highly corrosive HF, so it is not known whether there were any GeO2
crystals or SiO2 balls resulting from the experiment.
Lucent observed that the Ge-doped core etches considerably faster than the cladding. If the etch time is too
long, then the entire core can be removed, leaving a silica tube with a pinhole in it. This indicates that theamount of I-IF present at the site is the limiting factor in the degree of etching.
Figure 26 Etch Pit Resulting From Experimentation
Experiments were performed on 2 inch long samples of fiber removed from NFOC-2FFF-1GRP-1 cable
and exposed to the vapor over liquid HF. Some of the samples had been exposed electrostatic dischargefrom a Tesla coil, that breached the carbon coating in small discrete points. The polyimide was removed
from one half of the sample and left in place on the other half. The entire sample was exposed to HF in a
liquid form for approximately 36 hours. The samples were monitored throughout the test to look for theevolution of etch pits at the induced carbon breaches. The glass was found to be etched through the pin-holes and through the endfaces of the fiber. The etching on the end without the polyimide continued into
the carbon/polyimide coated section and the carbon left behind fell to the bottom of the fluid. The glasswas also etched from the endface of the carbon/polyimide coated half but there was not sufficient time to
allow the etch to occur past the end of the polyimide coated section. A control sample of fiber taken fromOC-1260 cable with acrylic coating showed similar results in the half where the coating was left in place,
however it showed a necking down of the glass from the outside in the uncoated portion of the fiber fromcontact with condensing HF. This showed that the carbon protects the fiber from HF attack when it iscontinuous.
6.4 Carbon Layer
BF04515 fiber is coated with a 25 nm coating of carbonaceous material which is intended to serve as a
hermetic coating which increases the fiber's strength and increases its reliability. Lindholm, Li et al. [ref-
17] performed reliability studies with Lucent-SFT carbon coated fiber and found high strength associatedwith various thickness of carbon on fiber. The carbon is deposited pyrolytically as the fiber exits the draw
furnace. A mixture of hydrocarbon gases enters into a chamber in the presence of a nitrogen purge. This
then cracks the hydrocarbons onto the surface of the fiber, Some of the carbon species lumped into the
30 8/1/00
"amorphous carbon" group are electrically conductive and others are not. Some act as a diffusion barrier toHF and some absorb I-IF and act as a catalyst in etching reactions. The species of carbon, which result on
the surface of the quartz cladding and their order, is not completely understood.
Breaches in the carbon coating allow the "rocket engine" defects to occur when the environment around the
exposed glass contains HF. They also allow moisture corrosion of the exposed glass. Finally, when large
enough, they can be located by observing light, which escapes out of the fiber through them.
During examination of the polyimide surface and the bubbles in the polyimide, a 6" sample of fiber fromlot CD0588DX was believed to have a carbon breach below a prominent bubble. The polyimide was
removed with sulfuric acid_ which is not damaging to the carbon. Not only was a light emitting breachfound below the bubble site, but compmaion breaches were found around it and were not associated with
prominent bubble-like features. A better understanding of the molecular structure of the carbon created by
Lucent-SFT's process will allow exploration of the process or handling conditions which cause breaches init and leave the glass exposed to etchants such as water and HF. [ref-18]
6.5 Electro Static Discharge (ESD)
Respooling processes used on uncabled fiber by Lucent-SFT and BICC, are believed to expose the cable tosignificant levels of electrostatic charging, which when discharged, may damage the fiber coatings.To understand the signs and magnitudes of the static charges present around the "color line" used to respool
fiber at BICC, measurements were made with ESD meters (see _spiggy.gsfc.nasa.gov/tva/librarv/essays.htm for background on static charges). The values measured are presented above in Table 4.Measurements of the field strengths at several spots in the fiber draw and coating process at Lucent-SFT
were similar to those measured at BICC. The respooling process at SEA was not reviewed because they donot handle uncabled BF04515 fiber.
Dupont's value for the dielectric breakdown field strength for the poiyimide used by Lucent-SFT is 4
kV/mil for a 1 mil sample, at 50% relative humidity. This number will decrease at 100% and increase at0% RH, however those values were not provided in the reference used. The thickness of the polyimide
coating applied to the BF04515 fiber is 0.60 mil, thus the dielectric breakdown voltage of the coatingshould be at least 2.4 kV. The polymerization process used by Lucent-SFT and the presence of thinned
spots at bubble sites makes it difficult to predict what level of charge will cause an ESD event terminating
at the conductive carbon layer.
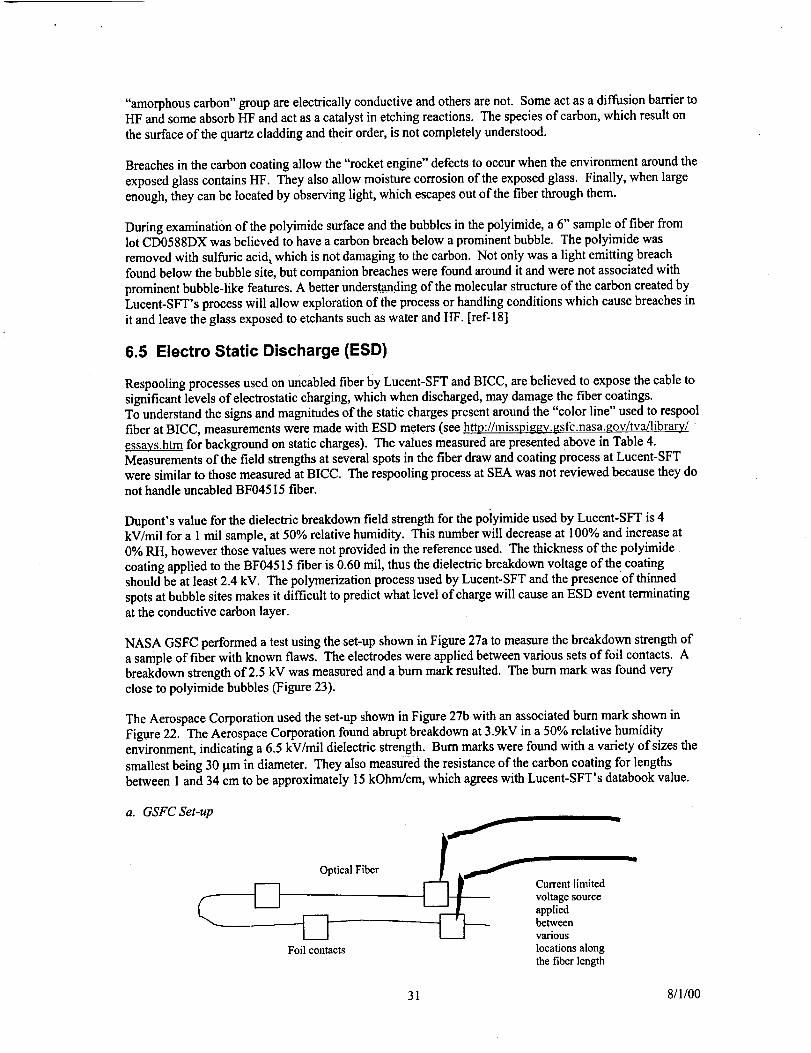
NASA GSFC performed a test using the set-up shown in Figure 27a to measure the breakdown strength of
a sample of fiber with known flaws. The electrodes were applied between various sets of foil contacts. Abreakdown strength of 2.5 kV was measured and a bum mark resulted. The burn mark was found very
close to polyimide bubbles (Figure 23).
The Aerospace Corporation used the set-up shown in Figure 27b with an associated bum mark shown inFigure 22. The Aerospace Corporation found abrupt breakdown at 3.9kV in a 50% relative humidityenvironment, indicating a 6.5 kV/mil dielectric strength. Burn marks were found with a variety of sizes the
smallest being 30 lam in diameter. They also measured the resistance of the carbon coating for lengthsbetween 1 and 34 cm to be approximately 15 kOhm/cm, which agrees with Lucent-SFT's databook value.
a. GSFC Set-up
Optical Fiber
Foil contacts
Current limitedvoltage sourceappliedbetweenvariouslocationsalongthefiberlength
31 8/1/00

b. Aerospace Corporation Set-up
110 - 6kV
20Mohm
20Mohm
DigitalVolt
Meter
Fiber
Figure 27 Experimentally Produced ESD Damage
Testing was also done with a 30 kV Tesla coil to demonstrate the conducting behavior of the NFOC-2FFF-
1GRP-1 cable. When the Tesla coil tip was placed about a centimeter from the cable, the tip of the coil
emitted a spark that was drawn to the cable. This spark was drawn along as the tip of the coil was movedalong the cable. Upon removal of the fiber from the cable sample, the trench shown in Figure 28 wasobserved. Though it is not obvious in the photograph, particles believed to be polyimide surround the
blackened edges of the trench suggesting that all of the polyimide did not vaporize and some of it was
redeposited around the site near the trench. This demonstrated that high electric fields can cause chargetravel all the way through the cable layers and damage the fiber coating.
Courtesy of NASA GSFC
Figure 28 Electrical Discharge Induced Damage on Fiber Surface
32 8/1/00

Anotherrunofthistestwasperformedon1996vintagecableandthesparkwasfoundto"stick"toaparticularsiteuntilthecoilwasmovesufficientlyfarawayandthenthesparkwouldmovewiththecoiltip.Thisbehaviorwasnotinvestigatedfurther.ThewiderportionofthetrenchseeninFigure28maybedemonstratingtheresultsofsucha"sticking"behavior.
TheTeslacoiltestwasrunagainusingBICCGeneral'sOC1260product,whichcontainsanacrylate,coatedfiberWithnocarbonlayer.Thiscablewasfoundtobeelectricallyinactive.Nosparkwasdrawnfromthecoilevenwhenthetipwascloserthanonecentimetertothecable.WhenthetestwasdonewiththeOC1260cableonatable,thesparkwentaroundthecabletofindthegrounded,conductivetable.
6.6 Aeolian Motion - Vibration of Fiber Under Tension
When a steady flow of fluid passes an obstacle with a large enough speed, it is usually found that eddies are
formed behind the obstacle. Such effects are familiar in the case of a stream of water "swirling" past a rock.Similar effects are also produced in a stream of air. A cylindrical obstacle, such as a rod or wire, in a stream
of air sets up a double series of vortices [ref 19]. The stream of air past the wire is thus set into transversevibrations, as alternate left- and right-handed eddies are formed and detached. This results in alternating
pressure waves, which can be audible under certain circumstances. An experimental investigation of thesevortex vibrations was first undertaken by Strouhal (1878) and later by Kohlrausch (1881). The frequency
"P' of the tone in the air was independent of the length of the wire and also the tension of the wire, and
varied only with the thickness "d" and the speed "s" of the wire through the air:
f= 0.185 (s/d) (4)
The detachment of the alternating vortices, and the wavering of the stream of air, produces an alternating
transverse force on the wire, which sets it into forced vibration at the frequency "f". We have a pronouncedresonance when this frequency coincides with one of the natural modes of vibration of the stretched wire,
fn = (n / 2*L) * sqrt[T/mp.] (5)
where "n" = 1, 2, 3, is the number of loops in the wire between its fixed ends, spaced a distance "L" apart,
"T" is the tension of the wire, and "mu" is the mass per length of the wire. This resonance can result in alarge amplitude of displacement of the wire.
The music of the Aeolian harp is produced this way. The harp consists.of a number of wires of graduated
thickness mounted on a sounding board. The wires are all turned to the same low fundamental note, whichconsequently has a wide range of overtones in the audible region. When a wind moves past these wires, and
"plays" it, one or more of these wires will resonate and emit the note of the appropriate overtone. Otherexamples include the "singing" of overhead wires, the "sighing" and "roaring" of wind in trees, and the"whistling" of wind through tall grasses. [ref 20]
Aeolian motion may be occuring with the fiber in the draw tower. Using equations (4) and (5), one can
predict the periodicity of defects which may be coincident with the resonant frequencies of the fiber intension. The draw speed being known, we can determine that the defects spaced as shown in Figure 14
move past a fixed point at a frequency of 33 to 83 Hz.
T = L/S_fib (6)f= 1/T (7)
Snb = Fiber Draw SpeedL = Spacial Period Between Latent Defects
T = Temporal Period Between Latent Defectsf = Frequency which the Latent Defects Pass a Point
33 8/1/00

Severalaspectsof the process including the glass temperature, the viscosity of the polymer in the coatingcups and the speed of the capstan contribute to the tension extended to the fiber. An assumption of 4 lbsfor the tension is made based on the proof test value of 5 lbs. The mass per unit length of the fiber is
calculated as 42.6 mg/m. The distance between fixed points is estimated as 5 m. Equation (5) above, using
these values, gives the natural vibration modes occurring at 65, 130, 195,260 Hz and so on. Equation (4),
for a fiber with a 140 to 170 p.m diameter, can be used to show that an air speed of 0.7 cm/sec to 0.9 cm/sec
would be required to cause the fiber to oscillate with frequencies listed above.
An experiment was done to measure the displacement amplitude for the fiber excited into motion by a
shaker. A length of BF05202 (similar to BF04515 fiber was hung from a shaker, and attached to a weight
of 5.96 g at its bottom. The total length that was free to vibrate was 60.0 cm. The first mode was at 30.2Hz, the second was near 60 Hz, the third was at 90.4 Hz, and the fourth was at 120.8 Hz.
The quality factor, judged from decay times and from the full-width between half-maxima, was more than100 for these modes. When vibrating in the fundamental mode, an amplitude of about a centimeter at the
midpoint was easy to observe when the amplitude at the shaker was invisibly small (less than 0.1 mm), andthe rest of the fiber was hard to see without a solid light colored background. When vibrating in higher
modes, the fiber was hard to see near the "loops" but seemed to be completely stationary at its nodes: a
gauge placed near a node would detect little motion. A wind directed sideways across the fiber caused it tooscillate with an amplitude of a few millimeters.
34 8/1/00

7.0 STRENGTH TESTING
Strength testing was proposed to help Boeing establish a basis for a risk assessment associated with the lifeof the cable already installed in the US Lab module. The findings ultimately were critically important to
the understanding of the latency of the carbon breach as a defect and the prominent role of the polyimidebubbles.
7.1 Initial Testing of '96 Vintage Cable and '99 Vintage Fiber
7.1.1 Test Approach
Fiber which had no._.3tbeen cabled and which had been cabled were strength tested. Fiber, which had never
been processed by BICC, was tested before and throughout the cabling process to understand how each step
of that process affects the strength of the fiber. The testing was performed in accordance with EIA Fiber
Optic Test Procedure 28, EIA-TIA-455-28B, "Method for Measuring Dynamic Tensile Strength of OpticalFiber". The set-up is shown in Figure 29. When the test was run on cabled fiber, as much of the cable wasleft intact as possible during the test and laser light was used to identify the locations of the breaks inside of
the cable. Table 8 shows the gauge lengths and pull conditions used on the various samples. The cable andfiber that was available from which samples were selected, had already been proof tested to 141 kpsi and
screened optically for the "rocket engine" defects. This provided some confidence that no large defects ofthat kind would factor into the strength data. For high strength samples, the breaks were expected to occur
between the range of 11.2 to 12.7 lbs, based on the set-up, loading and the intrinsic strength of the fiber (>450 kpsi). The resulting data would be plotted as a Weibull distribution which was expected to be bi-modal,
one slope expected for the high strength breaks and one for the low strength breaks caused by a defect.
Table 8 Strength Testing Samples and Conditions
Uncabled
Fiber Lot
Number
Date of
Mfr
Cabled
Fiber Reel
Number
Date of Mfr Gauge
Length
(inches)20
8O
Pull Speed
(ln/min)
Effective Strain
Rate (%)
2.5
2.5
CD0384X 1/21/99 0.52.0
CD0588X 7/22/99 80 2.0 2.5
04055 8/1/96 80 2.0 2.5
04056 8/ID6 20 0.05 0.25
20 0.5 2.5
20 5.0 25
80 2.0 2.5
04162 8/1/96 20 0.05 0.25
2O 0.5 2.5
20 5.0 25
80 2.0 2.5
04165 12/19/96
04233 12/19/96
20
20
80
20
2O
80
0.5
5.0
2.0
0.5
5.0
2.0
2.5
25
2.5
2.5
25
2,5
04240 12/19/96 80 2.0 2,5
04244 12/19/96 20 0.05 0.25
20 0.5 2.5
20 5.0 25
80 2.0 2.5
04245 12/I9/96 20 0.05 0.25
20 0.5 2.5
20 5.0 25
80 2.0 2.5
04250 12/19/96 80 2.0 2.5
35 8/1/00

Courtesyof TheBoeing Corporation
Figure 29 Test Set-up
7.1.2.1 Results: Initial Tests On Cabled Fiber
The results of the initial strength tests are shown in the Weibull plots in Figures 30 and 31. Prior analysis
showed that the fiber shipped by Lucent-SFT was proof tested to 141 kpsi (@ 3.36 lbs). The cable
specification requirement is for a fiber strength of 200 kpsi (@ 4.76 lbs). Lindholm, et. al., report strengthsof 500 kpsi (11.90 lbs) and higher for four carbon coated fibers they have manufactured. The plots showed
the high strength of the cabled fiber to be around 252 kpsi (6 lbs) and the low strength to go as low as 126
kpsi (3 lbs).
The inspections found that defects were present in large numbers that were either small etch pits at the
surface of the cladding or corrosion sites in the same location. The knees in the Weibull plots, anassociated slopes, show that there is more than one dominant failure mode. According to the physics of
glass, the order of the curves should show the black circles (highest strain rate) located to the fight of theother curves, not to the left. Figure 31 shows that the distribution of low strength breaks among the reels
was significantly different even for reels with the same date of manufacture. These distributions could notbe used to quantify the expected life of the cable using classical methods.
36 8/1/00

u
In(1-
3
2
1
0
-1
-2
-3
-4
-5
-6
2
o 25%
0
[] 2.50% A 0.25% I
Low strength ,,,-'-
0 An
An
I I
4 6In (stress ksi)
high streng
8
Figure 30 Weibull Plot for Strength of 1996 Vintage Cable from Several Cable Reels
2
0
It.|
" 2C
n|
"" 3e'- -m
-4
-5
"96 Cable" _ .t.- +
,._L
2.5 3.5 4.5 5.5 6.5 7.5
I I
_4055-s-4056
_,- 04162a'.,o 04162b_
--,_- 4165a 4233
+ 4240- 4244
--x-- 4245
--E_-4250
In (Stress [ksq)
Figure 31 Strength Data for 1996 Cable by Strain Rate
37 8/1/00

7.2 Strength Testing of Fiber Throughout Cabling and Including HF
Exposure
The results of the initial testing showed that more than one type of defect is affecting the strength of the
cabled fiber. A second round of strength testing was performed to look at each of the cabling process
steps' affect on the cabled fiber strength. The significant process steps studied were: respooling, buffering,
strength member application and jacketing. After each of these steps, the fiber was strength tested and
samples were exposed to HF vapor. Table 9 shows the test approach.
Table 9 Second Strength Test Approach
Seq. # Operation or Test
Starting Sample Lengths (m)
1, Visible Fault Location
2 Initial Dynamic TensileStrength TestsOTDR (850nm??)
4 Loss (1300nm)
5 Retain Individual Control
Sample6 Remove HF Etch
Samples7 Remove Dynamic Tensile
Samples8 Dynamic Tensile
Strength9 HF Exposure/Visual
Exam
10 Respool/Laser MikeExam
11 Visible Fault Location
12 Remove Dynamic TensileSamp es
13 Remove HF EtchSamples
14 Dynamic TensileStren0th
15:HF Exposure/VisualExam
16 Extrude FEP Loose TubeBuffer
17 Visible Fault Location
(respool?)18 Remove Dynamic Tensile
Samples19 Remove HF Etch
Samples20 Dynamic Tensile
Strength21 !HF Exposure/Visual
Exam
221Apply Strength Member
LengthUsed Test
Location
Remaining Sample Lengths at End of Test]Operation (meters)
CDO384XB CDO384XC CDO384XE CDO588XB CDO588XC(Control) (HF) (Strength) (HF) (Strength)
1870 489 483
1870 489 483
1847 460 459
BHB 1847 460 459
BHB 1847 460 459
50 BHB 410 409
10 BHB 400
30 BHB 379
BHB
GSFC
BICC 400 379 444
BICC 400 379 444
30 BICC 349
10 BICC 390 434
BHB
GSFC
40 BICC
CDO588XD(Control)
518 809 935
518 809 935
504 787 918
504 787 918
504 787 918
454 737
444
707
707
707
677
350 309 394 637
350 309 394 637
.-J
BICC
30 BICC 279 607
10 BICC 340 384
BHB
340 279 384' 607
GSFC
BICC
38 8/1/00

Seq. # Operation or Test
23 Visible Fault Location
(respool?)26 Dynamic Tensile
Strength29 Visible Fault Location
(respool?)30 Remove Dynamic Tensile
Samples31 Remove HF Etch
Samples32 Dynamic Tensile
Strength33 HF Exposure/Visual
Exam
[ref-21 ]
Table 9 Second Strength Test Approach (Cont'd)
LengthUsed Test
Location
BICC
BHB
BICC
30 BICC
10 BICC
BHB
GSFC
Remaining Sample Lengths at End of TestJOperation (meters)
CDO384XB(Control)
CDO384XC
(HF)
340
CDO384XEi(Strength)
279
CDO588XB(HF)
384
CDO588XC(Strength)
607
290 209 334 537
179 507
280 324
CDO588XD(Control)
7.2.1 Results: Strength Testing of Fiber Throughout Cabling and Including HF Exposure
The results of the second round of strength testing are shown in Figures 32a through 32d. [ref-22, 23, 24]
Figures 33a through 33d show the endfaces of the fibers at the low strength breaks.
a.
CDO384XE-Respooled
0.7 1.0 1.4 2.0 Ib=. 2.8 4.0 6.4 10, 14.0 20.0
=r
Z
Z.J
LN(Breaklng Slrength(Ib=))
39 8/I/00

bo
0.7 1.0
CDO588XC-Respooled
1.4 2.0 Ibs. 2.8 4.0 6.4 10. 14. 20.0
v
,.i
LN(Breaklng strength(Ibs))
.02
- .01
40 8/1/00

C,
A
v-
Z
5
0.7 1.0 1.4 2.0 Ibs. 2.8
CDO384XB-No Respool
4.0 6.4 10.0 14.0 20.0
,60
.40
LN(Breaklng Strength(Ibs))
41 8/1/00

d.
0.7 1.0
COOSSSX_ Respool
1.4 2.0 Ibs. 2.8 4.0 6.4 10.0 14.0 20.0
A
z
z.,,,.I
.Ol •
LN(area_ngStrength(_))
Figure 32 Strengths ofDC0384 and DC0588 Fiber During Cabling
42 8/1/00

a. Stationary Fixture End, Fiber CDO588XCB,CDO588XCB, Sample 11
b. Moving Fixture End, Fiber
Sample 11
c. Stationary Fixture End, CDO588XCB,Buffered, Sample 11
d. Moving Fixture End, Fiber,CDO588XCB, Buffered, Sample 11
Figure 33 Example of Low Strength Breaks
Figure 32a through 32d show that the fiber starts the process with high strength and every process stepseems to weaken it, including the respooling process. They also show that the 588 fiber lot experienced
greater weakening due to the cabling process that the 384 lot did, though they started with similar baselinestrength. More bubbles were found in the polyimide coating during DPA on the 588 samples than on the
384 samples leading to continued interest in the correlation between the presence of the bubbles and latentdefect sites.
Exposure to HF was used to try to measure the increase in etch related defects due to the respool and
buffering cabling processes. Table 10 shows the results of this testing. The results point again to thepropensity of the 588 lot to allow etch related defects versus the 384 lot. The 384 lot in this test, appears tobe more robust with respect to defect creation or exacerbation associated with the respooling process.
Figures 34a and 34b show the optical throughput during the etching period. [ref-25]
43 8/1/00

Table 10 HF Etch Results
Run Sample ID Condition Monitor Total# wavelengt time
h
(rim) hr:min
1 CDO588XBRS#1 after respool 632.8 0:48
2 CDO588XBRS#2 after respool 632.8
Time tochange
rain
0:44 7 1,4
2:10 ii06 3 1(_
2:53 0:35 to 0:39 0 -_
2:551 NA 0 1
3 CDO384XCRS#1 after respool 632.8
4iCDO384XCRS#2 after respool 1310
5 CDO384XCCP#1 before respool
6 CDO384XCCP#2 before respool 1310
7 CDO588XBCP#1 before respool
8 CDO588XBBF#1
9 CDO588XBBF#2
after buffer, in tube
after buffer, removed fromtube
#Breaks #Scatters
10 CDO384XCBF#1 after buffer, removed from 1310tube
1310 1:17 0:17 1 C
2:33 NA 0 C
1310 2:02 NA 1 i 0
13113 2:40 NA.j 0 O
1310 1:29 0:45 3 34
2:22 1st 0:11 0 2
2nd 1:30
In all cases approximately 8 meters of fiber was subjected to HF vapor;,approximately 1.5 to 2 meters was required toattach to monitoring equipment
44 8/1/00

HF-EIch HENE Throughput
-12.00
-20.00
-16.00
Time (Ihr)
a. Run 1 through 3 with a HeNe source
-24.00
b. Run 4 through 7 with an 1030 LED source
Figure 34 Optical Throughput During HF Etch Test
45 8/1/00

7.3 Strength Testing Non-Carbon Coated Fiber
A third round of testing was performed to see if the weakening of the fiber due to the respooling processwas unique to the carbon coated fiber. Table l 1 shows the test plan used.
Table 11 Test Plan for Strength Testing of Non-Carbon Coated Fiber
Sequence#
Operation or Test Length Facility CDO38used 4XB
(m)
Starting Sample Lengths
1 OTDRNisible Fault location
2 Loss (1300 nm)
3
4
5
6
7
8
9
10
11
12
13
14
15
16
17
18
19
20
21
22
23
24
25
26
27
28
29
30
31
32
33
34
35
Retain Top of Spool Individual Control Sample
Baseline Dynamic Tensile Strength Samples
Baseline HF-Etch Samples
Retain Top of Spool Individual Control Sample
Baseline Dynamic Tensile Strength Samples
Baseline HF-Etch Samples
Respool/LaserMikeru/Current & Field Probe
'Respool/LaserMikerWCurrent & Field Probe
OTDR/Visible Fault location
Remove Dynamic Tensile Strength samples
Remove HF-etch samples
Extrude loose tube buffer
Retain End of Section Individual Control Sample 'n
Remove EOS Dynamic Tensile Strength Samples
Remove End of Section HF-Etch Samples
Remove excess fiber from process account
Extrude loose tube buffer
Insert Buffered fibers (step 14) into remainingstepsiOTDR/Visible Fault location
'Remove Dynam!c Tensile Strength samples
Remove HF-etch samples
Apply strength member
OTDR/Visible Fault location
Remove Dynamic Tensile Strength samples
Remove HF-etch samples
Extrude Jacket
OTDR/Visible Fault location
Remove Dynamic Tensile Strength samples
Remove HF-etch samples
Complete Dynamic Strength Tests-BaselineSamplesComplete HF-Etch Tests-Baseline Samples
Complete Dynamic Strength Tests-RespoolSamplesComplete HF-Etch Tests-Respool Samples
NA
1
50
30
30
50
30
30
1go
600
0
30
30
540
50
30
30
40
0
30
30
0
0
30
30
40
0
3O
3O
CDO588 CDO858 CDO731XD XB1 XB
1847 918 2200 2200
BICC 2200 2200
BICC 2199 2170
BICC 2149 2120
BICC 2119 2090
BICC 2089 2060
BHB 1797 868
BHB 1767 838
BHB 1737 808
BICC 1587 658
BICC 1489 1460
BICC 1489 1460
BICCf
BICC
BICC 1047 118 949 920
BICC 997 68 899 870
BICC 967 38 869 840
BICC 937 8 839 810
0 0 0 0
BICC
500 500 500 500
BICC 500 500 500 500
BICC 470 470 470 470
BICC 440 440 440 440
BICC 4401 440 440 440I
BICC 4401 440 440 440i
BICC 410 410 410 410
BICC 380 380 380 380
BICC 340 340 340 340
BICC 340 340 340 340
BICC 310 310 310 310
BICC 280 280 280 280
BHB
BHB
BHB
BHB
46 8/1/00

Table 11 Test Plan for Strength Testing of Non-Carbon Coated Fiber (Cont'd)
Sequence Operation or Test#
36
38
39
Complete Dynamic Strength Tests-BraidedSamplesComplete Dynamic Strength Tests-JacketedSamplesComplete HF-Etch Tests-Jacketed Samples
40 Complete Dynamic Strength Tests-EOS Samples
41 Complete HF-Etch Tests-End of Section Samples
Virgin Fiber Left at end of tests
Length Facility CDO38used 4XB(m)
BHB
BHB
BHB
BHB
BHB
CDO588 CDO858 CDO731XD XB1 XB
937 8 839 810
The fiber from the non-carbon coated lots, CD0858XB1 and CD073 IXB are polyimide coated but do not
have the carbon under-layer. The Lucent-SFT product number for this fiber is BF04455. The preform is
SG320, not the rad-tolerant "320R" type used in the preform used to make BF04515 fiber.
7.3.1 Results: Strength Testing Non-Carbon Coated Fiber
Figure 35a through 35c show the affect of the various cabling processes on the fiber strength for the non-
carbon-coated fibers. The unprocessed fiber has high strength, however as it goes through cabling, its
strength is again increasingly reduced. The difference in the behavior between the two non-carbon coated
fiber lots is still under study. [ref-26]
a,
¢
CDO731XB-Respooled
0.7 1.0 1.4 2.0 Ibs. 2.8 4,0 6,4 10.0 14.0 20.0
LN(Breaklng StrengthObs))
47 8/1/00

b.
0.7 1.0
CO858XBIA-Respooled
1.4 2.0 Ibs. 2.8 4.0 6.4 10.0 14.0 20.0
LN(Breaklng Strength(Ibs))
48 8/1/00

C.
0.7 1.0
_IA.No Respool
1.4 2.0 I1_ 2.8 4.0 6.4 10.0 14.0 20.0
99.8
5
t.N(am,_ng_))
Figures 35 Strength for the Non-carbon Coated Fibers
49 8/1/00
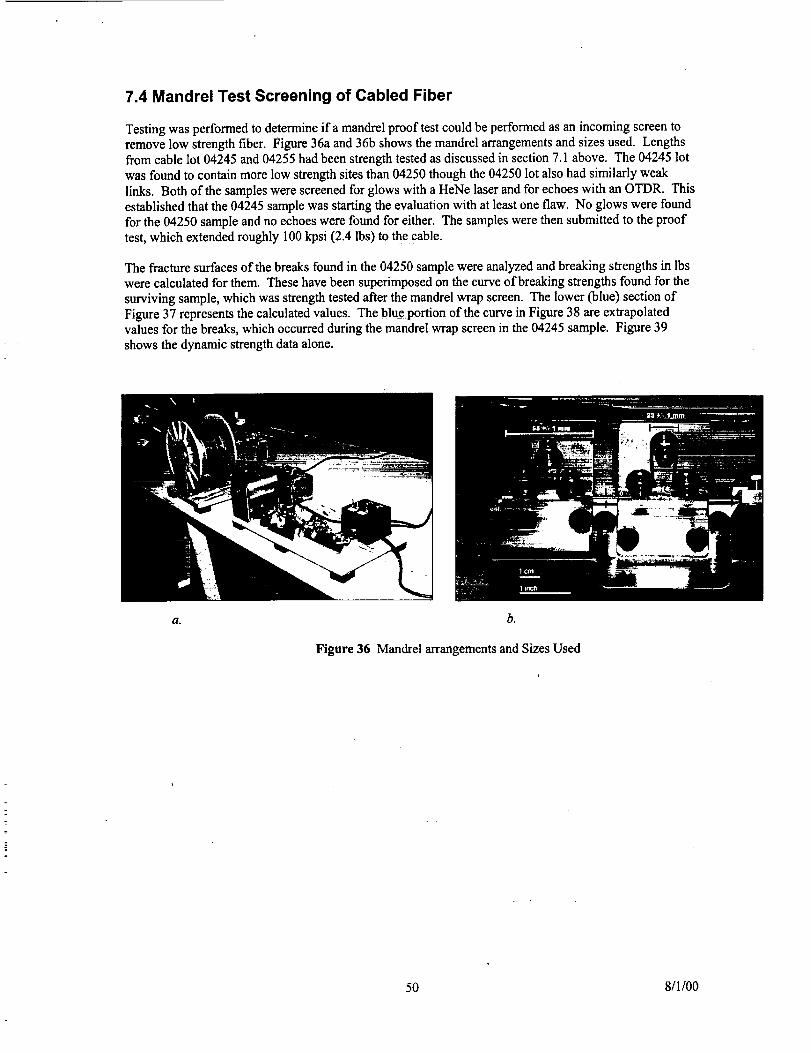
7.4 Mandrel Test Screening of Cabled Fiber
Testing was performed to determine if a mandrel proof test could be performed as an incoming screen toremove low strength fiber. Figure 36a and 36b shows the mandrel arrangements and sizes used. Lengthsfrom cable lot 04245 and 04255 had been strength tested as discussed in section 7.1 above. The 04245 lot
was found to contain more low strength sites than 04250 though the 04250 lot also had similarly weak
links. Both of the samples were screened for glows with a HeNe laser and for echoes with an OTDR. Thisestablished that the 04245 sample was starting the evaluation with at least one flaw. No glows were found
for the 04250 sample and no echoes were found for either. The samples were then submitted to the proof
test, which extended roughly 100 kpsi (2.4 lbs) to the cable.
The fracture surfaces of the breaks found in the 04250 sample were analyzed and breaking strengths in lbs
were calculated for them. These have been superimposed on the curve of breaking strengths found for the
surviving sample, which was strength tested after the mandrel wrap screen. The lower (blue) section of
Figure 37 represents the calculated values. The blue portion of the curve in Figure 38 are extrapolatedvalues for the breaks, which occurred during the mandrel wrap screen in the 04245 sample. Figure 39
shows the dynamic strength data alone.
a. b.
Figure 36 Mandrel arrangements and Sizes Used
50 8/1/00
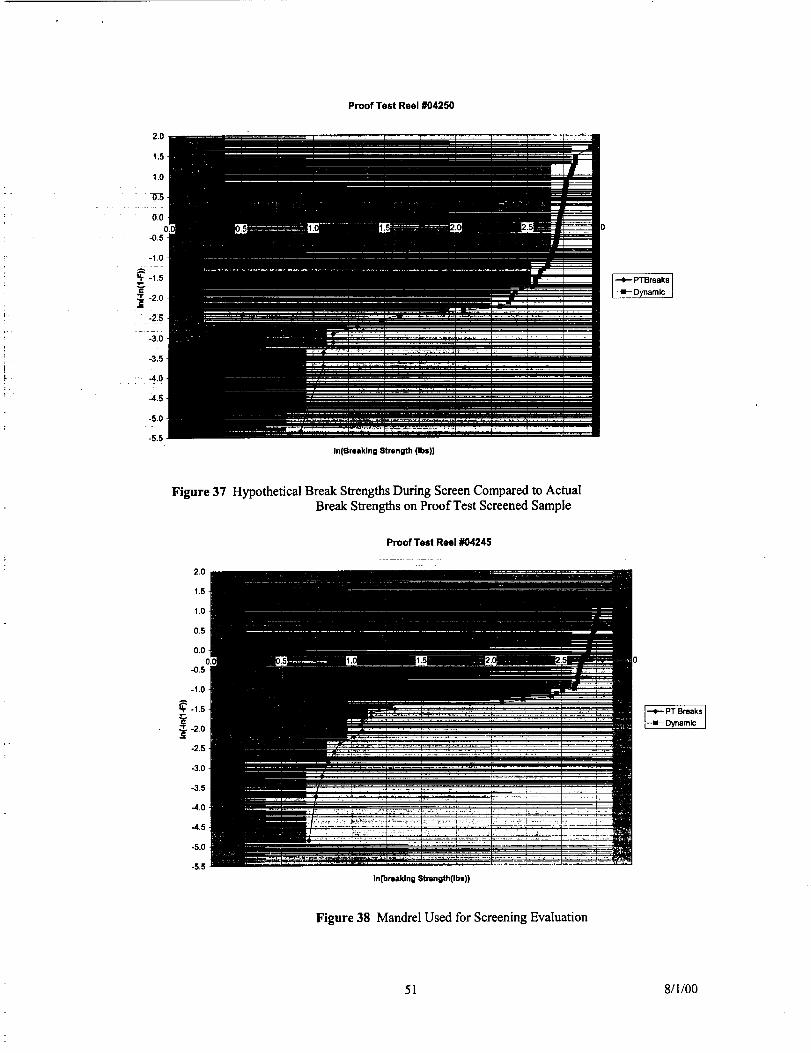
Proof Test Reel #04250
In(Breaking Strength (Ibs))
Figure 37 Hypothetical Break Strengths During Screen Compared to ActualBreak Strengths on Proof Test Screened Sample
Proof Test Reel #04245
In(breaking Strength(Ibs))
Figure 38 Mandrel Used for Screening Evaluation
PT Breaks Ii
--ll- Dynamc J
51 8/1/00

-1.0
-1.5
-2.0
-2.5
-3.0
-3.5
-4.0
-4.5
-5.0
-5.5
Dynamic Strength After 100 KPSI Prooftest
Figure 39 Dynamic Strength Data for the Pre-ProofTest Screened Cables
52 8/1/00

8.0 CONCLUSIONS
The cable design which has been associated with "rocket engine" defects, within the optical fiber, and
later with low breaking strengths of the fiber, has been that defined by the ISS specification SSQ21654
(plus engineering modifications) and given the Boeing Company part number NFOC-2FFF- 1GRP- 1.Some small amounts of a similar part number, NFOC-2TFF-1GRP-I was also used in ISS hardware;however, the problem investigation reported here does not concern this second part number. The
production period of concern spans between June of 1996 to July of 1999. End users were Boeing-HB,
ISS partners, and their subcontractors.
The fiber and cable build history indicates only two major process changes over the period in which theNFOC-2FFF-1GRP-1 was made; (1) use of different draw towers at different plants of the fiber
manufacturer, and (2) implementation of a respooling operation at the cabling plant. Upon initial review,the available traceability data did not conclusively indicate that these process changes were the sole cause
of the "rocket engine" defect. The investigation has brought into light a better understanding of the
latency of the defects, warranting another review of the traceability data for pointers to weaker cable lots./
The manufacturing process review identified several processes that contribute to the creation of "rocket
engine" defects and of fiber strength reducing defects. Though none of the processes used are outside ofnormal practice for making specialty fiber or cable, they become uniquely undesirable for this cable
because of the materials involved in this cable design.
The conditions present in the cabling processes, specifically with respect to the behavior of FEP at thetemperature at which it is extruded while surrounded by air, create carbonal difluoride (COF2). CarbonalDifluoride reacts with water resident in the polyimide to create hydrogen fluoride 0-IF) which etches the
glass fiber wherever it is not covered by the carbon coating. The "rocket engine" defect is the result ofHF etching, the products of which can be found in and around the etch pit and which are silica balls andgermania crystals.
The root cause for the breaches in the carbon coating is still not understood well enough to predict the
frequency of their occurrence. These breaches have been found to be 1 to 3 I.tm in size, and are often in
the vicinity or directly below a distinct feature in the polyimide coating. This size makes them invisibleto a screen, which uses electrical resistance as a measure of coating quality. The size may also make
hydrogen ingression, and proof testing, incapable of identifying fiber that contains breaches at the rate of
one per millimeter, or less. No practical screening method has been found which can be used to findthese carbon breaches.
The polyimide features which accompany the "rocket engine" defects and low strength breaks have beenfound in at least three configurations: cups, buffed voids (bubbles) and thinned areas (sink holes).
Surface blisters are not being considered in this investigation. Data book values cannot be used to
predict how the polyimide will perform mechanically and electrically because the polyimide is applied tothe fiber in a way that differs substantially from the convention preparation ofpolyimide. Testing showed
that the polyimide will break down at voltages between 3.5 kV and 4.0 kV where the features are notpresent, and at as little as 1.5 kV where thinning exists because of the presence of a feature. We believethat ESD events will be focused at the polyimide features because they reduce the dielectric's thickness
from 15 txm to as little as several micrometers. Though geometric analyses of the static fields measuredaround the fiber during fiber and cable manufacturing (specifically around the proof test during fiber
manufacture and during respooling during cable manufacture) have not been done, it is believed that the
actual potentials at the fiber surface during those processes are sufficiently high to support dischargeevents through the polyimide coating at these features. Testing showed that high current discharges willdamage the polyimide severely and the carbon as well. It is believed that lower current events, which
may not result in observable damage to the polyimide, are causing breaches in the carbon coating and the
glass below it.
53 8/1/00

Theco-locationof the potyimide features and the carbon breaches has been shown; however, the
preference for etching at some carbon breaches and not at others has not been explained. Periodicity hasbeen seen with respect to the distribution of the etch sites and with respect to the distribution of the
polyimide features. A better understanding of this periodicity may point to the process sources of the
polyimide features and the carbon breaches.
Many screening and analysis methods were used in the study of this problem; some were successful andsome others were not. Optical performance methods such as the use of commercial optical fault finders
(OFF; 1 mW power) and specialty fault finders (OFF using 20 mW to 30 mW) tended to be more easily
and successfully applied than the various OTDR's that are available. The farther the etch pit reached intothe core, the more effective the OFF and OTDR screen was. Optical power meters were similarly useful:
these detect deep etch pits. All three were not useful as a screening method when a shallow crackoccurred in the exposed glass at a carbon breach (which reduces the fiber's life), but no etch pit removing
waveguide material was present, which would effect the light throughput. In-line laser micrometers werenot able to detect the polyimide surface features that indicate a fiber which contains latent defects. An IR
laser based system may be useful in this way; however, more investigation will be required. Mandrel
wrap screening gave promising results in its ability to screen low strength breaks from cabled fiber.
SEM and optical microscopy were very useful in DPA analyses. The use of index matching fluid was
very useful for optical microscope inspection. X-ray has limited applicability with respect to fibersurface features however it is useful for understanding the configuration of fiber breaks still inside of thecable.
Strength testing has demonstrated the initial high strength of the fiber, even with the presence of what arebelieved to be latent defects. Prior study of carbon coated glass has shown it to have high strength over a
wide range of strain rates. The Weibull plots of the breaking strength data for the respooled, partiallycabled, and cabled fiber (using processes defined for NFOC-2FFF-1GRP-1) show that those cabling
operations and other ancillary processes, including handling, introduce a population of low strengthbreaks into the BFO4515 fiber. The fiber was found to break with a distribution tail normally associated
with non-hermetic glass whose surface defects are growing into cracks with handling stress. Non-hermetic fiber was tested throughout the cabling process as well and similar results were found.
Conventional n-theory-based life predictions could not be made using the dynamic fatigue data collectedbecause it did not follow the basic laws of that theory. It is believed that one reason is that multiple
failure modes were occurring in the fiber that was tested. Fiber life predicting using n-theory is designedfor fiber whose only failure mode is crack propagation due to strain rate. It may not be impossible to
develop similar predictive theory for the NFOC-2FFF-1GRP-1 system; however, it was outside of thescope of this investigation to accomplish that task.
9.0 RECOMMENDATIONS
The initial goal of this investigation was to understand the cause of the "rocket engine" defects found inthe fiber contained in the NFOC-2FFF-1GRP-1 optical cable being used by Boeing in International
Space Station hardware. It was believed that if the root cause of the rocket engine defect could be found,the handling or the manufacturing processes (or both) could be engineered to eliminate the defect from
future hardware. As the investigation progressed, these defects began to be understood as distinct andrelated to synergistic processes occurring during fiber and cable manufacturing. While interest continued
in tracking down the root causes of what was now a collection of defects, additional approaches to the
problem resolution were explored. They included using screening to eliminate the defects from theproduct used to build flight hardware, and risk assessment to understand what level of defects may betolerable given the reliability requirements established for ISS and the installation conditions used.
54 8/1/00

9.1 Processes Which Create Defects
It has been established that the cabling process being uscd to make the NFOC-2FFF-IGRP-l cable, using
the BF04515 fiber, will create COF2 and ultimately HF. Processing FEP under dry nitrogen (to remove
oxygen), during FEP processing and eliminating the water in the polyimide coating during bufferextrusion, will reduce the volume of HF produced during cabling by several orders of magnitude.
Breaches in the carbon on the fiber allow HF ctching and strength reduction of the glass fiber. Direct
inspections have shown the frequency of the etch pits varies widely along a given fiber and also varies
between different fiber runs. More study of the carbon layer through materials analysis could provideinsight into why this is so.
The frequency ofpolyimide features is also variable with the fiber draw lot. Their connection with
carbon breaches and exposure of the fiber to ESD events of a lower strength than that afforded by acontinuous, uniformly thick layer, indicates that they too should be eliminated. More study in many
areas, including materials analyses and electrical and mechanical environmental analyses, is required tounderstand how the bubbles are formed. The development of successful screening methods for both
carbon defects and the polyimide features will greatly contribute to understanding when the defects areoccurring, as well as supporting the removal of these defects.
9.2 Screening Methods
The transparency of the fiber and its polyimide coating, and the fiber's geometry (especially itscylindrical shape and aspect ratio which is on the order of 109 to 10 I°) make it extremely challenging to
inspect. Screens, which can detect polyimide features, now associated with carbon breaches, should be
developed to eliminate known latent defects. A similar screen for carbon breaches would be criticallyuseful.
Dynamic strength testing should be used as part of a qualification; also, this testing should be repeated onsome schedule. Development of the madrel wrap test should continued through repeatability andvalidation testing so that it can be demonstrated to be a non-destructive, 100% screen. Standardization of
the test method through the EIA/TIA is also recommended. Future specification documents should usethese tests to qualify and screen flight lots.
Lessons were learned during the investigation about improvements that could be made to the
procurement specifications. Several improvements can be made with respect to specific definitions forfiber and cable production lots. Traceability of all finished cable harnesses back to all raw material lots
and the fiber lot should be required. The fiber should be qualified by the end user and the cablespecification should require use of qualified fiber in its construction (reference MIL-PRF-27500 forcable, which requires the use of MIL-PRF-22759 wire). The fiber lot should be defined and traceable
back to the preform. The fiber and cable specifications should contain: lot-based screening (non-destructive, 100% basis, "Group A"), lot-based inspections (non-destructive and destructive mechanicaland environmental tests, sample basis, every lot, "Group B" tests) and periodic qualification tests
(destructive and non-destructive mechanical and environment tests and reliability validation, schedulebased on production schedule, "Group C" tests). Self-auditing by the user should be used to confirm that
the traceability requirements are being met.
The new failure modes associated with the etch pits and low strength will need to be addressed in thenew specification. As new screens become available, as recommended above, they should be added to
the specification.
55 8/1/00

9.3 Reducing Risks Associated with NFOC-2FFF-1GRP-1 Cable
Logistical and budget pressures will force the use in flight hardware of product produced by the same
processes which created the latent defects and failures discussed in this report. Measures can be taken toreduce some of the risks associated with this cable stock. It has been established that the cable has an
ESD sensitivity. This report states that a threshold of 1.5 kV was measured although that value could beless depending on the thinness of the polyimide at a defect site. More work could be done to further
quantify the ESD sensitivity of this cable and to establish handling and installation requirements, whichwill protect the cable from ESD damage. It is strongly recommended that cablers and manufacturers of
carbon coated fiber measure the electrostatic conditions in their plants and make modifications to
equipment and handling processes which can introduce discharge events involving the fiber.
Any stress reduction that can be obtained by modifications to the installation plans for future builds will
extend the life of this cable. Opportunities may exist for reducing stress on the cables when in-flightrepairs are made where vibration conditions don't have to be accounted for (open supports rather thantie-downs can be used).
Finally, in order to gain insight about the rate at which the links are expected to break in flight, a static
fatigue test (hanging weights from lengths of fiber in an environment at fixed temperature and humidity)should be performed.
10.0 REFERENCES
[ref-l:
[ref-2:[ref-3:[ref-4:[ref-5:[ref-6:
[ref-7:[ref-8:
[refg:
email: 3/20/00, From: William Weisenberger, "U.S. Lab ROM for Bending of Fiber"]email: From: Ray Prestridge, RE: Fiber Optice, Attachment: SSQ_21654RB.PDF]email: Ray Prestridge, "Words for 'PFA in ISS Node 1' paragraph", 7/23/00]
email: Henning Leidecker, "Fwd: RE: Fwd[2]:latest pictures", 11/12/99]email: Brad Cothran, Boeing-KSC, "RE: Acceptance limit for finished harnesses", 3/14/00]
email: Dale Zevotek, "RE: OTDR that you use", Attachment: OC-1614.tif, 2/24/00]Reference Manual, Model OFM, Optical Fiber Monitor, Opto-Electronics Inc., 1996]
C.T. Mueller and J.G. Coffer, "Polyimide/Carbon Defects", The Aerospace Corporation, 6/21/00]Teflon Mechanical Design Data, Du Pont Company, no date]
[ref10: Guide to the Safe Handling of Fluoropolymer Resins, The Society of the Plastics Industry, Inc.,1998]
[ref 11: Thermal degradation of commercial fluoropolymers in air, Bertsil B. Baker, Jr., Daniel J.Kasprzak, Polymer Degradation and Stability 42, 1993][ref-12: http://hdmicrosystems.com/2produts/prodlist.html][ref 13: The Nature of Water Absorbed by Polymeric Electronic Packaging Materials, Brian Dickens,
G.T. Davis, http://www.nist.gov/msel/div854felectapps/1995_proiects/nature3.html ][ref 14: Moisture Effects in Electronic Packaging Polymers, no author,
http://www.nist.gov/msel/div854/electapps/1996_proiects/moisture2.html]
[ref 15: C.T.Mueller, J.G. Coffer, and T. Giants, "ISS Fiber Status", The Aerospace Corporation, 3/9/00][ref-16: email: D. DiGiovanni, "Re: Fw: Anyone have Jay Lee's new email address?", Lucent-BellLaboratories, 4/26/00]
[ref-17: Eric A. Lindholm, Jie Li, Adam S. Hokansson, and Jaroslaw Abromczyk, Spectran SpecialtyOptics Company, and Sara E. Arthur, David R. Tallant, Sandia National laboratories, "Low SpeedCarbon Deposition Process for Hermetic Optical Fibers", "International Wire and Cable Symposium,1999".1
[ref-18: email: Craig Mueller, "Charts showing Carbon Pinhole and Bubble Defect Shape", 07/05/00][ref-19: Mallock, Proceedings of the Royal Society, vol 9, page 262, 1907]
[ref-20: A.B. Wood, "A Textbook of Sound: being an account of the physics of vibrations with specialreference to recent theoretical and technical developments", 1930]
[ref-21: email: Gary Bickel, "Detail Coating Penetration Test Plan and Schedule", 3/15/00, Attachment:CoatingTstPln.xls]
56 8/1/00

[ref-22:email:GaryBickel,Boeing-I/B,FiberB&A.xls>><<CoatingTestData.xls>><<Respoo1384.xls>>,3/25/00><<Respoo1588.xls>>][ref-23:email:GaryBickel,CoatingPenetrationTests:StrengthTestResultsonCD0588XB,4/4/00][ref-24:email:GaryBickel,CoatingPenetrationTests:StrengthTestonCD0588XC,4/4/00][ref-25:GaryBickel,StrengthandHF-EtchTests,4/7/00][ref-26:GaryBickel,"RevisedNon-carbon-coatedtestResults",7/18/00]
11.0 ACKNOWLEDGEMENTS
The Team 2, Root Cause Investigation Team, gratefully acknowledges the contributions of the followingindividuals whose efforts made this work and this report possible:
Jerry Amett, The Boeing CompanyMarvin E. Banks Jr., Boeing M&P, Kennedy Space Center
Harold Battaglia, The Boeing CompanyDave Beverly, NASA GSFC
Dr. Gary Bickel, The Boeing CompanyDr. John Canham, Unisys CorporationAnna Cantwell, SEA Wire and Cable
Brad Cothran, The Boeing CompanyDavid Gill, The Boeing CompanyJohn Kolasinski, NASA GSFC
?
Dr. Henning Leidecker, NASA GSFC
Jim Holt, US Army Aviation & Missile CommandJie Li, Lucent Specialty Fiber Technologies
Eric Lindholm, Lucent Specialty Fiber TechnologiesBilly-Jo Mitchell, BICCGeneralCarmen Moore, The Boeing Company
Pete Mueggler, The Boeing CompanyDr. Craig Mueller, The Aerospace Corporation
Mike O'Cormer, Lucent Specialty Fiber TechnologiesMelanie Ott, Sigma Research
Chris Pegge, BICCGeneralJeannette Plante, Swales Aerospace
Ray Prestridge, Lockheed-Martin CorporationDave Rothermel, BICCGeneral
Martin Seifert, Lucent Specialty Fiber TechnologiesJohn White, The Boeing CompanyDale Zevotek, BICCGeneral
Special Thanks are extended for report production assistance to:
Jesse Frank, Swales Aerospace
Silvia Romero, Swales AerospaceCarl Szabo, Swales Aerspace
Special thanks are extended for ISS Fiber website maintenance to:
Jesse Frank, Swales Aerospace
57 8/1/00


![Improving Functional Characteristics of Wool and Some ... · wool fiber led to the fiber to move towards their root end under mechanical action in the wet state [6]. Many methods](https://static.fdocuments.in/doc/165x107/5e6391e0a540fd5cc242663d/improving-functional-characteristics-of-wool-and-some-wool-fiber-led-to-the.jpg)