Israel Telecom Services: Why Israel is different
47
EQUITY RESEARCH 20 September 2012 ISRAEL TELECOM SERVICES Why Israel is different The two new mobile operators launched what we believe are unsustainable disruptive pricing business models in attempt to grab market share. While there is a risk that the price collapse and profitability fall we have seen over the past six quarters might continue, we believe this is not likely. We downgrade HOT to UW from EW, upgrade Cellcom to EW, and reiterate our OW on Partner and Bezeq. Unlimited is not the way to go: We argue that HOT Mobile and Golan Telecom miscalculated in launching unlimited plans below the ILS 100 (€20) price level. 1) They underestimated the reaction by PTNR, CEL and BEZQ to respond quickly and drastically; 2) offering unlimited voice and SMS, they boxed themselves in as low cost/high usage providers and forfeited potential future price hikes; 3) their data packages are 3x-1.5x larger than competitors and are included in the monthly €20 price. Why Israel is different: We examine disruptive pricing plans across Europe and show that though successful in the EU, the models differ from Israel for a few reasons: 1) New M obile N etwork O perators lowered prices for unlimited plans by c. 55%, but the price gap with the incumbents is still narrow; 2) The MNOs launched services with minimal network coverage and use national roaming agreements to supplement coverage; 3) HOT’s cash flow from fixed line can not fund the mobile network build out and Golan has no fixed line infrastructure at all. We believe that for these reasons the new MNOs will struggle to gain market share and generate FCF to finance new wireless networks. Bitstream access creates opportunity for some and challenges for others: We downgrade HOT to UW, which based on our analysis is facing serious challenges heading into 2013. As we detail in the note below, HOT can currently manage its mobile business plans as the fixed line provides FCF to fund investment. Once the wholesale market is opened we expect the market dynamics to change (see our Bezeq note; “Time to look deeper at the opportunity”, dated August 6 th ), and that HOT’s FCF from fixed line will fall. We upgrade CEL to EW as we see the wholesale market creating opportunities for it and PTNR as they enter the fixed line through “triple play” and begin to market IPTV. Though BEZQ will face some of the same challenges as HOT, the opening of the market will unlock large efficiency opportunities for BEZQ. Valuations not challenging: Trading in line with European peers at 4.7x EV/EBITDA vs. 4.8x in Europe we believe that BEZQ and PTNR offer good opportunities for investors. In Israel equity allocation, we continue to prefer the Energy E&P and Technology industries that have greater growth and upside potential relative to Telecom and Banks that are still reeling from regulation and disruptive competition. Barclays Capital Inc. and/or one of its affiliates does and seeks to do business with companies covered in its research reports. As a result, investors should be aware that the firm may have a conflict of interest that could affect the objectivity of this report. Investors should consider this report as only a single factor in making their investment decision. This research report has been prepared in whole or in part by equity research analysts based outside the US who are not registered/qualified as research analysts with FINRA. PLEASE SEE ANALYST(S) CERTIFICATION(S) AND IMPORTANT DISCLOSURES BEGINNING ON PAGE 38. INDUSTRY UPDATE Israel Telecom Services NEGATIVE Unchanged For a full list of our ratings, price target and earnings changes in this report, please see table on page 2. Israel Telecom Services David Kaplan 972.3.623.8747 [email protected] Barclays, London Tavy Rosner 972.3.623.8628 [email protected] Barclays, London
Transcript of Israel Telecom Services: Why Israel is different

EQUITY RESEARCH 20 September 2012
ISRAEL TELECOM SERVICES Why Israel is different
The two new mobile operators launched what we believe are unsustainable disruptive pricing business models in attempt to grab market share. While there is a risk that the price collapse and profitability fall we have seen over the past six quarters might continue, we believe this is not likely. We downgrade HOT to UW from EW, upgrade Cellcom to EW, and reiterate our OW on Partner and Bezeq.
Unlimited is not the way to go: We argue that HOT Mobile and Golan Telecom miscalculated in launching unlimited plans below the ILS 100 (€20) price level. 1) They underestimated the reaction by PTNR, CEL and BEZQ to respond quickly and drastically; 2) offering unlimited voice and SMS, they boxed themselves in as low cost/high usage providers and forfeited potential future price hikes; 3) their data packages are 3x-1.5x larger than competitors and are included in the monthly €20 price.
Why Israel is different: We examine disruptive pricing plans across Europe and show that though successful in the EU, the models differ from Israel for a few reasons: 1) New Mobile Network Operators lowered prices for unlimited plans by c. 55%, but the price gap with the incumbents is still narrow; 2) The MNOs launched services with minimal network coverage and use national roaming agreements to supplement coverage; 3) HOT’s cash flow from fixed line can not fund the mobile network build out and Golan has no fixed line infrastructure at all. We believe that for these reasons the new MNOs will struggle to gain market share and generate FCF to finance new wireless networks.
Bitstream access creates opportunity for some and challenges for others: We downgrade HOT to UW, which based on our analysis is facing serious challenges heading into 2013. As we detail in the note below, HOT can currently manage its mobile business plans as the fixed line provides FCF to fund investment. Once the wholesale market is opened we expect the market dynamics to change (see our Bezeq note; “Time to look deeper at the opportunity”, dated August 6th), and that HOT’s FCF from fixed line will fall. We upgrade CEL to EW as we see the wholesale market creating opportunities for it and PTNR as they enter the fixed line through “triple play” and begin to market IPTV. Though BEZQ will face some of the same challenges as HOT, the opening of the market will unlock large efficiency opportunities for BEZQ.
Valuations not challenging: Trading in line with European peers at 4.7x EV/EBITDA vs. 4.8x in Europe we believe that BEZQ and PTNR offer good opportunities for investors. In Israel equity allocation, we continue to prefer the Energy E&P and Technology industries that have greater growth and upside potential relative to Telecom and Banks that are still reeling from regulation and disruptive competition.
Barclays Capital Inc. and/or one of its affiliates does and seeks to do business with companies coveredin its research reports. As a result, investors should be aware that the firm may have a conflict of interestthat could affect the objectivity of this report.
Investors should consider this report as only a single factor in making their investment decision.
This research report has been prepared in whole or in part by equity research analysts based outside theUS who are not registered/qualified as research analysts with FINRA.
PLEASE SEE ANALYST(S) CERTIFICATION(S) AND IMPORTANT DISCLOSURES BEGINNING ON PAGE 38.
INDUSTRY UPDATE Israel Telecom Services NEGATIVE Unchanged For a full list of our ratings, price target and earnings changes in this report, please see table on page 2.
Israel Telecom Services David Kaplan 972.3.623.8747 [email protected] Barclays, London Tavy Rosner 972.3.623.8628 [email protected] Barclays, London

Barclays | Israel Telecom Services
20 September 2012 2
Summary of our Ratings, Price Targets and Earnings Changes in this Report (all changes are shown in bold)
Company Rating Price Price Target EPS FY1 (E) EPS FY2 (E)
Old New 19-Sep-12 Old New %Chg Old New %Chg Old New %Chg
Israel Telecom Services Neg Neg
Bezeq (BEZQ IT / BEZQ.TA) OW OW 4.75 5.50 5.50 - 0.65 0.65 - 0.60 0.60 -
Cellcom Israel Ltd. (CEL IT / CEL.TA) UW EW 31.75 24.00 34.00 42 5.68 5.57 -2 4.96 5.11 3
Hot Telecommunication System (HOT IT / HOT.TA) EW UW 35.87 39.00 35.00 -10 3.29 0.95 -71 3.88 0.92 -76
Partner Communications Co. (PTNR IT / PTNR.TA) OW OW 19.45 22.00 22.00 - 2.75 3.18 16 2.49 3.22 29
Source: Barclays Research. Share prices and target prices are shown in the primary listing currency and EPS estimates are shown in the reporting currency.
FY1(E): Current fiscal year estimates by Barclays Research. FY2(E): Next fiscal year estimates by Barclays Research.
Stock Rating: OW: Overweight; EW: Equal Weight; UW: Underweight; RS: Rating Suspended
Industry View: Pos: Positive; Neu: Neutral; Neg: Negative
Valuation Methodology and Risks
Israel Telecom Services
Cellcom Israel Ltd. (CEL IT / CEL.TA)
Valuation Methodology: Our price target is derived from the average of our DCF model which assumes a 10.5% WACC and 0% terminal growth rate, and our sum of the parts model that attributes ILS 6,784mn to the Mobile segment and ILS 1,667mn to the Fixed line segment.
Risks which May Impede the Achievement of the Barclays Research Price Target: Some of the risks facing Cellcom are: pricing pressure, new MVNOs, significant changes to the regulatory regime and the fact that Cellcom's potential merger with an ISP company may cost more than initially expected may present downside risk to our estimates.
Hot Telecommunication System (HOT IT / HOT.TA)
Valuation Methodology: We value HOT using a DCF model. Our assumptions include a WACC of 9.0% and terminal growth rate of 1%. The net present value of the cash flows equals ILS 5,692m, from which we subtract ILS 2,882m in net debt and add back ILS 121m in deffered tax benefits to arrive at and equity valuation of ILS 2,931m. With 76m share outstanding, the implied PT is ILS 39.
Risks which May Impede the Achievement of the Barclays Research Price Target: HOT's shareholder structure and changes in the regulatory enviornment may prevent HOT from acheiving our forecasted EPS estimates.
Partner Communications Co. (PTNR IT / PTNR.TA)
Valuation Methodology: Our price target is derived from the average of our DCF model which assumes a 10.5% WACC and 0% terminal growth rate. Our derived entreprise value is ILS 7,904m, to which we add ILS 477m of financial assets and substract ILS4,927 of financial liabilities. That gives us an EV of ILS 3,454m or ILS 22 per share.
Risks which May Impede the Achievement of the Barclays Research Price Target: Regulatory approval for stated acquisition is not received; and product launches do not gain market share and have to be rolled back.
Source: Barclays Research.

Barclays | Israel Telecom Services
20 September 2012 3
Valuation sheet
Figure 1: European Telecoms – Valuation sheet
Closing Price
Market Cap
PE EV/EBITDA EV/OpFCF Dividend YieldCompany Ticker CCY Rating
18/09/12
Price Target
EURbn 2012E 2013E 2012E 2013E 2012E 2013E 2012E 2013E
Belgacom BCOM EUR UW 23.47 23.0 7.4 10.8x 11.5x 5.3x 5.3x 9.6x 9.5x 9.3% 8.5%
BT Group BT.L GBP OW 2.27 2.60 22.0 8.9x 8.7x 4.8x 4.8x 8.3x 8.3x 4.2% 4.8%
Deutsche Telekom DTEGn EUR OW 9.65 11.00 42.1 15.6x 15.5x 4.6x 4.7x 8.7x 9.3x 7.3% 7.3%
Elisa ELI1V EUR UW 16.59 16.00 2.6 12.1x 11.6x 6.7x 6.5x 10.6x 9.8x 8.8% 8.6%
France Telecom FTE.PA EUR UW 10.02 10.00 26.6 7.9x 8.6x 4.2x 4.3x 7.3x 7.7x 12.0% 10.0%
KPN KPN.AS EUR OW 6.49 10.00 9.3 8.7x 8.4x 4.3x 4.2x 9.0x 7.1x 5.4% 5.4%
OTE OTE.rA
T EUR EW 3.36 3.34 1.6 3.1x 5.1x 3.2x 3.3x 4.7x 5.4x - -
Portugal Telecom PTC.LS EUR EW 3.96 4.40 3.5 11.3x 10.3x 4.7x 4.8x 10.3x 10.7x 8.2% 8.2%
Swisscom SCMN.
VX CHF OW 379.80 425.00 16.3 11.1x 10.5x 6.6x 6.6x 13.1x 12.7x 5.8% 6.1%
TDC TDC.CO DKK UW 41.00 48.00 4.5 10.1x 10.9x 5.3x 5.3x 7.0x 7.9x 11.2% 11.2%
Telecom Italia (blend)
TIT-Blend EUR - 0.77 - 14.9 6.0x 5.8x 4.2x 4.3x 7.8x 7.4x 5.7% 5.6%
Telecom Italia (ordinary) TIT-MIL EUR OW 0.80 1.10 - 6.3x 6.1x 4.3x 4.4x 8.0x 7.5x 5.4% 5.4%
Telecom Italia (saver)
TITR-MIL EUR OW 0.68 0.95 - 5.4x 5.2x 4.1x 4.2x 7.6x 7.2x 7.9% 7.9%
Telefonica TEF.MC EUR UW 11.38 8.50 51.3 11.5x 9.8x 4.9x 4.9x 9.2x 9.0x - 6.6%
Telekom Austria TELA.VI EUR EW 6.30 7.70 2.8 13.8x 11.8x 4.9x 4.9x 9.9x 13.4x 6.0% 7.4%
Telenor TEL.OL NOK OW 109.80 130.00 23.6 13.0x 10.2x 6.7x 6.1x 10.3x 8.8x 5.4% 6.9%
TeliaSonera TLSN.S
T SEK EW 48.90 46.00 25.0 11.4x 10.9x 6.3x 6.1x 10.4x 9.8x 6.5% 7.2%
ISRAEL TELECOMS
Bezeq BEZQ ILS OW 4.70 5.5 2.1 7.3 7.9 5.1 5.5 7.3 7.8 21.8% 20.5%
Cellcom CEL ILS EW 30.90 34.0 0.5 5.5 6.0 4.4 4.5 6.3 7.0 7.9% 8.3%
Hot HOT ILS UW 34.66 35.0 0.4 36.4 37.7 3.9 4.0 16.3 15.3 0.0% 0.0%
Partner PTNR ILS OW 18.37 22.0 0.5 5.8 5.7 4.5 4.4 6.1 5.8 9.6% 8.8%
Israeli Median 13.8 14.3 4.5 4.6 9.0 9.0 9.8% 9.4%
EU Incumbent Median 11.0 10.1 4.8 4.8 9.0 8.6 7.3% 7.3%
EU Altnet/Other Median 13.8 12.2 5.7 5.2 10.6 9.5 5.5% 6.3%
Source: Company reports, Barclays Research

Barclays | Israel Telecom Services
20 September 2012 4
Unlimited is not the way to go We argue that in launching unlimited plans below ILS 100 (€20), HOT Mobile and Golan Telecom made some miscalculations and underestimations that may create barriers to the long term success of the operations. These underestimations may also make the build of the required new network more costly to finance.
1) Underestimated the incumbent reaction
In May, HOT Mobile and Golan Telecom launched no-contract unlimited plans for ILS 89 (€20) and ILS 99 (€18) respectively. The plans include unlimited voice, SMS, and data (with data speed reduced after reaching 3GB).
Although pricing in the industry has been in a downward spiral for over 15 months, the unlimited plans of BEZQ PTNR and CEL were still 2.7x more expensive at the time of the new launch in May.
The first incumbent to react was PTNR: it took about 3 weeks before PTNR decreased its unlimited plan from ILS 269 to ILS 125 and to announce the launch of a sub-brand 012 Mobile with unlimited plans for ILS 88.
Bezeq also decreased its Pelephone plans from ILS 279 to ILS 119; with rebates to ILS 99 during the first year.
Cellcom launched a family plan costing about ILS 119 per family member.
The incumbents’ response was quick: by matching the offers of the disruptive pricers, they slowed subscriber losses and reduced the value proposition introduced by the two new operators.
Figure 2: Israel Mobile: Price evolution of unlimited mobile plans (ILS/month)
80
120
160
200
240
280
11/02/2012 15/05/2012 03/06/2012 19/06/2012 02/07/2012 16/07/2012 22/07/2
Pelephone Partner Cellcom Hot Mobile Golan 012
Disruptive arrival
Source: Company data, Barclays Research
2) Underestimated unlimited voice usage patterns
HOT Mobile and Golan entered the market with disruptive pricing that was based on maintaining slight losses while winning market share and building out a new network. Two things stand in the way of that happening: 1) each currently uses wholesale agreements for the vast majority of network traffic as they build out a network 2) unlimited plans generate close to two times the amount of traffic that limited or “pay as you go” plans do.

Barclays | Israel Telecom Services
20 September 2012 5
In previous research reports we have argued that unlimited plans are only profitable if customers use less than 600 minutes, 600 SMS and 300 MB of data (see our report). By offering unlimited voice and SMS, MNOs boxed themselves in as low-cost high usage providers and have forfeited the potential for future price hikes.
Figure 3: Israel unlimited plans
Bezeq Partner Cellcom Hot Mobile Golan 012
Price (ILS) 99 109 119 89 99 88
Voice UL UL UL UL UL UL
SMS UL UL UL UL UL UL
Data 1GB 500MB 1GB 3GB* 3GB* 500MB
Additional services UL Calls to 31
countries
*Based on fair usage Source: Company data, Barclays Research
Roaming on competitor networks isn’t cheap
In the two figures below we break down the mobile termination rates (MTRs) which are the basis of the MNO wholesale cost model. We argue that the mobile termination rates are too high to allow the MNOs to generate a sustainable profit.
Figure 4: Israel Mobile Termination Rates
Service Cost (ILS)
Price for initiating a call (MTR -50%) 0.035
Price for call completion (MTR) 0.070
Price per MB of data (MTR -25%) 0.053
Price per SMS (SMS MTR) 0.02
Source: Barclays Research
Figure 5: MNO cost model
Voice usage (mn) 100 200 300 400 500 600 700 800 900 1000
SMS usage (units) 50 100 150 200 250 300 350 400 450 500
Data usage (MB) 100 200 300 400 500 600 700 800 900 1000
Cost to MNO (ILS) 13 27 40 53 66 80 93 106 119 133
Source: Barclays Research
3) Underestimated data usage
The disruptive operators offer unlimited data in their €20 based on a fair usage; i.e. 3GB of usage then surf speed is decreased. This is 3-6x over the incumbents’ offers of 500MB (PTNR, 012), and 1GB (BEZQ, CEL); who also charge for “overuse”.
We estimate the data roaming cost for the MNOs to be ILS 0.053 per MB or ILS 53 per GB (see figure 3 below). This means that customers using between 1GB and 2GB imply a net loss for the MNOs even before they start using voice and SMS.
Figure 6: Data Roaming MNO cost
Usage 100 MB 200 MB 300 MB 1GB 2GB 3GB
Cost (ILS) 5.3 10.5 26.3 52.5 105 157.5
Source: Barclays Research

Barclays | Israel Telecom Services
20 September 2012 6
And they still need to build out a network HOT and Golan launched services with minimal 3G UMTS/HSPA mobile network infrastructure; this leads to a higher operating costs and lower free cash flow generation. Moreover, the lack of free cash flow means that the borrowing costs needed to build a new network may come at a high price. Presuming that the new network will cost in the range of $350m - $700m these concerns are significant.
Building a network is very expensive
HOT Mobile and Golan Telecom, are both in the process of rolling out nationwide 3G 2.1 GHz networks over 2x10MHz spectrum. The most recent roll out of a similar UMTS/HSPA+ network was by Pelephone over the course of 2008-2011. We estimate that the cost to Pelephone was c. EUR 100m.
Ahead of the roll out Pelephone already had a CDMA network running on 850MHz band over 2x10MHz spectrum and a tower infrastructure that included 1500 towers. This made the upgrade to UMTS relatively inexpensive as it needed to add only 600 new towers. The rest of the cost was in carriers and not the more costly cell splitting. The new MNOs are likely to be facing similar investments over the next five years (according to the license agreement with the government).
HOT and Golan acquired their mobile licenses through a tender. HOT was awarded the first license for ILS 705m (EUR 140m) and Golan the second license for ILS 360m (EUR 72m). According to the tender’s terms if the new MNOs achieve a 7% market share within 5 years the tender and licence fees will be reimbursed.
We take a shot at estimating how much HOT and Golan will spend on building their wireless networks (see appendix for detailed calculations). When building a mobile network, much of the cost in greenfield operation is in the tower construction which we estimate is c.€100k per radio site. Once the sites are built, operators can add additional frequencies and carriers, often requiring additional backhaul/power.
We estimate that Golan will need approximately 2,000 radio sites to cover the country, implying an expense of c. €210m (c. ILS 1bn). To this we need to add the cost of acquiring extra spectrum as they grow.
HOT’s situation is slightly different since it can use the MIRS (acquired in July 2011) network with its 600 radio sites as a starting point. We estimate that HOT will need to spend c. €162m (c. ILS 810m) to build approximately 1,500 additional radio sites.
Our calculations are based on what Bezeq spent on network development/upgrade over the past few years as well as on the proprietary research of our colleagues, found in the appendix.
Reiterating out Negative sector view Our Negative industry rating is based on continuing competitive pressure in the mobile sector and imminent new competition in fixed line. The changes and the intense competition lead to our modelling for net income to fall over 5% in 2013.
We prefer the Technology and Energy industries to Telecoms. In technology we see growth opportunities across the hardware, semis and chip companies as the need to deal with big data grows. The energy sector will begin producing positive cash flows in 2013 once the local natural gas resources begin commercial production.

Barclays | Israel Telecom Services
20 September 2012 7
Why Israel is different
We examine similar cases of disruptive pricing plans across Europe. In particular, the markets where “disrupters”/”challengers” like Iliad and 3 Europe have an impact. We conclude that the business models implemented there do not copy to Israel despite the success in Israel. We also note that France proves a better comparison than the others for two reasons. 1) Israeli and French new network operators all launched in 2012 and are all building greenfield 3G networks. 2) The new mobile businesses of Iliad and HOT are in addition to existing fixed line networks whose FCF is used as a counter balance to the initial investment phase of the mobile network.
1) Narrow price gap
In Israel
Although the new MNO’s arrivals brought prices down c. 55% for unlimited plans (see fig. 1), the price gap with the incumbents is not significant enough to make the new MNOs truly attractive. The ILS 89 and ILS 99 for unlimited plans at HOT and Golan compare with ILS 99 at Bezeq, ILS 109 at Partner and ILS 119 at Cellcom. Customers might be discouraged to switch operators for such a small difference.
It is important to note that the new operators are essentially sim-only operators and offer handsets from third party equipment retailers. The handsets are not subsidized and the ability to subsidize lies with the retailers and not with HOT and Golan.
Figure 7: Israel Mobile: Price evolution of unlimited mobile plans (ILS/month)
80
120
160
200
240
280
11/02/2012 15/05/2012 03/06/2012 19/06/2012 02/07/2012 16/07/2012 22/07/2
Pelephone Partner Cellcom Hot Mobile Golan 012
Disruptive arrival
Source: Company data, Barclays
In France
This compares with the launch by Iliad of unlimited mobile plans on the French market. Although French incumbents (FT, SFR, Bouygues Telecom) have lowered the prices of their unlimited mobile plans by c.35% since Iliad’s arrival, those are still c. 2-2.5x more expensive than Iliad’s prices. The Incumbents have however launched sub-brands (Sosh, Red and B&You) that are priced very closely to Iliad’s prices.

Barclays | Israel Telecom Services
20 September 2012 8
In Austria
Austria has experienced a similar development where aggressive pricing by Orange and Austria 3 Network has resulted in rapid pricing declines and brand segmentation. The situation is now similar to France where “no-frills” brands are now priced similarly to aggressive players and premium brands are still at a significant premium. For the incumbent operators this has resulted in years of service revenue declines as offers such as 1000Mins, 1000SMS and 1GB of data have been prolific and caused cannibalization of their premium brands.
In UK, Italy, Denmark, and Sweden
Pricing in all of these countries has eroded with 3 Europe leading the charge. Where it differs from Israel is that the “challenger” 3 has aggressively subsidised handsets and committed capital in an effort to win market share, while in Israel the “challengers” are sim only, and the “incumbents” have stopped all subsidies. See (“European Telcos: 3 Europe (not covered) - Continuing to commit capital”)
Figure 8: French Mobile: Price evolution of unlimited mobile plans (€/month)
€ 15
€ 25
€ 35
€ 45
€ 55
€ 65
€ 75
€ 85
Dec-11 Jan-12 Feb-12 Mar-12 Apr-12 May-12 Jun-12
FT SFR Bouygues Sosh
Red B&You ILIAD
Disruptive arrival
Source: Barclays Research
2) No network infrastructure
In Israel
HOT and Golan had a requirement to roll out 10% of network coverage prior to launching service. With minimal coverage and relatively only a small market share (c. 100k clients for Golan and c. 350k for HOT) the amount of calls generated on competing networks and completing on competing networks is high. This raises the costs for the new operators and minimizes the profit.
In France
Iliad already had 27% network coverage prior to launching commercial mobile services. This was a requirement by the French regulator when Iliad acquired the 3G license for EUR242.7m.

Barclays | Israel Telecom Services
20 September 2012 9
In UK, Italy, Denmark, Austria and Sweden
The networks in these countries are all fully built out 3G UMTS/HSPA networks. This creates more efficiencies in the business model and allows for further price erosion.
3) Mobile termination rates impact income as well as costs
In Israel
Israel has symmetric Mobile Termination Rates (MTRs), in other words, all operators pay the same amount for calls completed on competing networks (see fig. 4). This places HOT and Golan at a disadvantage to peers. The disadvantage is based on the fact that HOT and Golan have relatively few customers and so pay out a larger amount of MTRs for calls completed on competing networks than they receive for calls completed on their own network.
In France
This compares with the asymmetric MTR rates granted to Iliad to allow the company to compete in the first few years while increasing market share.
Figure 9: French MTRs
MTRs ( c€/min) 1 July to 31
December 20111 January to 30
June 2012 1 July to 31
December 20121 January to 31 December 2013
French Incumbents 2.0 1.5 1.0 0.8
Iliad N/A 2.4 1.6 1.1
Source: Arcep, Barclays Research
In UK, Italy, Denmark, Austria and Sweden
These examples all began with asymmetric MTRs but have slowly made there way to symmetry.
4) No cushion from fixed line infrastructure.
In Israel
Based on the reasons above, we believe the Israeli MNOs will struggle to gain significant market share and generate enough FCF to finance their wireless networks.
This is particularly true for Golan Telecom, which is a pure mobile play and therefore doesn’t have any other income source. As a private company though, the depth of the balance sheet and the ultimate ability to sustain losses is an unknown entity.
HOT is different from Golan since it has a fixed line business that provides FCF to fund investment. Nevertheless, we believe that once the wholesale market is opened that market dynamics will change (see our Bezeq note; “Time to look deeper at the opportunity”, dated August 6th) and that HOT’s FCF from fixed line will fall.
In France
This compares with Iliad’s strong position in the French wireline market, with over 20% market share over several years prior to launching its mobile offering.
In UK, Italy, Denmark, Austria and Sweden
The 3 Group is mobile only and so like Golan requires a well capitalized balance sheet to fund investment in the mobile business

Barclays | Israel Telecom Services
20 September 2012 10
Opening the fixed line market to wholesale creates opportunity for some and challenges for others
Bezeq remains our top pick for the sector and we continue to prefer PTNR to CEL in the mobile sector. We upgrade CEL to EW from UW and downgrade HOT to UW from EW believing that CEL will out perform HOT over the next 12 months.
Bezeq still the top pick Bezeq is the strongest and best managed and has significant cost savings opportunities from regulatory relaxation over the next 12-18 months. We reiterate our OW rating on Bezeq.
Bezeq’s dividend yield of 21% in 2013e is made up of the regular dividend of ILS 0.60 and capital reduction paid out in cash of ILS 0.97. While the yield does stand out we point out that it is not coming at the expense of investing in Bezeq’s future. Bezeq invested in a new UMTS network, new fibre network and will be investing additional infrastructure to shorten the “last mile” over the next few years.
The cost savings opportunities are tied closely to the regulatory decision to open the fixed line to wholesale/bitstream access. On the one hand, Bezeq will sign agreements with Partner, Cellcom and any other potential third party fixed line operator to allow them to offer television, broadband and telephony services over fibre. On the other hand, the regulator said that it will remove the current corporate structural separation at Bezeq “within” nine months from when a bitstream access agreement is signed. We already model ILS 200m in savings during 2014 vs. 2013 but believe that in a best case scenario the savings could be 3x that.
We downgrade HOT to UW from EW We believe HOT’s investment in its mobile business plus the expected pricing pressure on FCF from the fixed plans will prove challenging in 2013. We therefore downgrade HOT to UW from EW and lower our PT to ILS 35.
HOT’s two main challenges are connected. The first challenge is to increase mobile market share in a highly competitive market while building out and upgrading the network to 3G. The second challenge is related to the fixed line which is going to be opened to operators through whole sale agreements.
For specifics on the mobile challenges we refer you to pages 1-8 of this research note where we lay out what is going on in the Israeli market and why we believe it is different than other European markets.
Fixed line markets in Israel are about to undergo some significant changes. The first is the regulatory requirement to open fixed line infrastructure to new competition. This means that Bezeq and HOT will need to come to agreements with Cellcom, Partner and any other third party service provider on a price for wholesale/bitstream access. We believe that Bezeq will win more wholesale market share than will HOT and that HOT’s 2013 FCF generation from the fixed line will suffer. It will decline for three reasons: 1) as more service providers enter the triple play market (TV, broadband and telephony) the prices will fall. For the past five years HOT has been the only operator in Israel allowed to offer a subsidized triple play, and that will end in 2013. 2) Revenues from wholesale will mitigate some of the lower revenues from subscribers but it is our view that HOT’s share of the whole sale market will not be significant.

Barclays | Israel Telecom Services
20 September 2012 11
See our note: “Time to look deeper at the opportunity”, dated August 6th for full implications of regulatory updates.
Cool's tender offer not HOT enough
On 26 August, Cool Holdings submitted a tender for the remaining 30.75% of HOT's outstanding shares at a price of ILS 37. According to the letter by Cool Holdings, the offer implies a valuation of ILS 2,700m and a 12.5% premium over the average share price during the month of July. Cool set no time frame set for completing the tender other than to say that it hoped to do so within 30 days.
We believe that the first tender offer attempt to take HOT private at a 12.5% premium (as close of 23 August) will not be enough to entice investors to give up their shares. Although in our view the price is fair. On the other hand, we do not believe that HOT's owners "Cool Holdings" will improve the offer and so we believe that the tender offer may not be successful. In our view, HOT is facing a challenging next 12 months as all of its markets are faced with high levels of competition and approaching changes in regulation and we see the ILS 37 offer as appropriate and in-line with our price target of ILS 35.
Changes to our model
We leave our revenues forecast practically unchanged at ILS 4,180m and ILS 4,479m for 2012 and 2013 versus ILS 4,171m and ILS 4,493m previously forecasted.
On the cost side, we have increased our depreciation and amortisation expenses from ILS 943m to ILS 1,039 in 2012 and from ILS 983m to ILS 1,074m in 2013.
We have also increased our share based compensation expense forecast to ILS 41m up from our ILS 7m in 2012 and to ILS 40m in 2013 up from no compensation expense.
Our operating profit drops to ILS 439m in 2012 (15.0% operating margin) from ILS 625m and to ILS 403m (15.4% operating margin) in 2013E down from ILS 690m.
Our new net income forecast is now ILS 74m and ILS 71m in 2012 and 2013 respectively, down from ILS 255m and ILS 301m.
EPS for 2012 and 2013 are now ILS 0.95 and ILS 0.92 versus our previous ILS 3.29 and ILS 3.88.

Barclays | Israel Telecom Services
20 September 2012 12
Figure 10: HOT Changes to the model P&L (ILSm)
New 2011 2012 2013
Revenues 3374.0 4180.2 4478.6
Operating Costs 1996.0 2661.1 2961.5
EBITDA 1378.0 1519.1 1517.1
Depreciation and Amortization 841.0 1039.3 1073.7
Operating Profit 640.0 438.9 403.5
Net Income (Reported) 328.0 73.7 71.5
Net Income Excl one-offs 341.0 73.7 71.5
Basic EPS (ILS) 4.4 0.95 0.92
Capex 539.0 1158.0 1119.7
OpFCF 839.0 361.2 397.5
Old
Revenues 3374.0 4171 4493
Operating Costs 1996.0 2596 2819
EBITDA 1378.0 1575 1673
Depreciation and Amortization 841.0 943 983
Operating Profit 640.0 625 690
Net Income (Reported) 328.0 255 301
Net Income Excl one-offs 341.0 255 301
Basic EPS (ILS) 4.4 3.29 3.88
Capex 539.0 1,276 1,348
OpFCF 839.0 886.4 835.3
Change (%)
Revenues 0.2 -0.3
Operating Costs 2.5 5.1
EBITDA -3.5 -9.3
Depreciation and Amortization 10.2 9.2
Operating Profit -29.8 -41.5
Net Income (Reported) -71.1 -76.3
Net Income Excl one-offs -71.1 -76.3
Basic EPS (ILS) -71.2 -76.3
Capex -9.2 16.9
OpFCF -59.3 -52.4
Source: Company reports, Barclays
We upgrade CEL to EW from UW We see the wholesale market creating opportunities for CEL and PTNR as they enter the fixed line through “triple play” and begin to market IPTV. Though BEZQ will face some of the same challenges as HOT the opening of the market will unlock large efficiency opportunities for BEZQ. Cellcom’s skipping of the 2Q 12 dividend was, in our view, a prudent step towards strengthening the balance sheet and putting the company on a track to de-lever. We increase our 2013 EPS estimates for CEL to ILS 5.11 from ILS 4.96, upgrade the stock to EW from UW and raise our price target to ILS 34 from ILS 24.
Barclays | Israel Telecom Services
20 September 2012 13
Changes to our model
We have increased mobile churn from 26% to 30.6% in 2012 and 32.4% in 2013.
We further decrease mobile net subscriber losses from -49k to -56k, reducing total subscribers from 3,398 to 3,293 in 2012; for 2013 we lower net subscriber losses to -40k from 58k, reducing our total subscriber base to 3,253 from. 3,446.
We maintain mobile ARPU unchanged at ILS 88 in 2012 and ILS 79 in 2013.
We decrease equipment sales down to ILS 1,177m from ILS 1,565m in 2012 to ILS 1,026m from ILS 1,593m in 2013.
We maintain mobile operating margins at 19%.
Mobile revenues decrease to ILS 4,755m from ILS 5,155m in 2012 and to ILS 4,151m from ILS 4,832m in 2013. The decrease is mainly driven by lower handset sales. The first half of 2012 has seen a change in the market as Cellcom and its peers have moved away from handset subsidies. In the long run, this will prove to be positive for margins.
We maintain our fixed line business forecast unchanged.
We reduce CEL dividends payout ratio down from 75% to 50% in 2012 and 2013.
Our EPS forecast decrease to ILS 5.57 down from ILS 5.68 in 2012 and up to ILS 5.11 from ILS 4.96 in 2013.

Barclays | Israel Telecom Services
20 September 2012 14
Figure 11: CEL Changes to the model New (ILSm) 2011 2012E 2013E
Net Sales 6,506 5,849 5,283
Gross Profit 3,098 2,508 2,264
Depreciation, amortization and impairment losses -
738 -
735 -
728
Sales and marketing 990 818 779
Gen and admin 685 609 578
Total Opex 1,675 1,426 1,357
Operating Income 1,422 1,087 995
Income after financial items 1,129 751 678
Net income 825 554 508
Reported diluted EPS ILS 8.29 ILS 5.57 ILS 5.11
Operating free cash flow 999 945 813
Old 2011 2012E 2013E
Net Sales 6,506 5,868 5,462
Gross Profit 3,098 2,486 2,311
Depreciation, amortization and impairment losses -
738 -
680 -
680
Sales and marketing 990 821 808
Gen and admin 685 609 599
Total Opex 1,675 1,429 1,408
Operating Income 1,422 1,065 976
Income after financial items 1,129 754 658
Net income 825 565 493
Reported diluted EPS ILS 8.29 ILS 5.68 ILS 4.96
Operating free cash flow 999 625 1,075
Change (%) 2011 2012E 2013E
Net Sales -0.3 -3.3
Gross Profit 0.9 -2.0
Depreciation, amortization and impairment losses 8.1 7.1
Sales and marketing -0.4 -3.6
Gen and admin 0.0 -3.6
Total Opex -0.2 -3.6
Operating Income 2.1 2.0
Income after financial items -0.4 3.0
Net income -2.0 3.0
Reported diluted EPS -2.0 3.0
Operating free cash flow 51.1 -24.4
Source: Company reports, Barclays

Barclays | Israel Telecom Services
20 September 2012 15
We reiterate our OW rating on PTNR PTNR will be a beneficiary of a new wholesale market that is likely to begin operating in early 2013. The wholesale market will allow PTNR to launch IPTV services and compete with Bezeq and HOT and offer a triple play (TV, broadband and telephony) to its customers without having to carry the heavy load of capex development. Beyond the opportunities on the top line PTNR has plenty of opportunities on the cost side. Its merger with 012 Smile has not yet been fully implemented leaving room for cost savings in 2013. We reiterate our OW rating on PTNR.
Changes to our model
We slightly decrease 2012 total sales to ILS 5,838m from ILS 6,011m, and 2013 to ILS m from ILS 5,251m.
In the mobile segment, we leave ARPU unchanged at ILS 98 in 2012 and 89 in 2013. We lower our equipment sales forecast to ILS 929m from ILS 1,131 in 2012 and to ILS 827m from ILS 1,128m in 2013. As a result, mobile revenues decrease to ILS 4,613m from ILS 4,837m in 2012 and to ILS 4,059m from ILS 4,495m in 2013.
We leave EBITDA relatively unchanged at ILS1,665m in 2012 compared to our previous ILS1,699m and at ILS 1,591m in 2013 compared to our previous ILS 1,637m.
We increase our net income forecast to ILS 493m and ILS 502m in 2012 and 2013, compared to our previous ILS 428m and ILS 389m respectively.
Our EPS for 2012 is now ILS 3.18 up from our previous ILS2.75; and ILS 3.22 in 2013 compared to our previous ILS 2.49.

Barclays | Israel Telecom Services
20 September 2012 16
Figure 12: PTNR Changes to the model
New 2011 2012E 2013E
Net Sales 6998 5838 5251
Gross Profit 2020 1782 1536
Depreciation, amortisation and impairment losses -782 -686 -626
Sales and marketing 711 656 461
Gen and admin 291 288 203
Total Opex 1107 815 571
Operating Income 1036 967 965
Income after financial items 742 690 670
Net income 443 493 502
Diluted EPS ILS 2.82 ILS 3.18 ILS 3.22
Operating free cash flow 1221 550 703
Old 2011 2012E 2013E
Net Sales 6998 6011 5698
Gross Profit 2020 1698 1623
Depreciation, amortisation and impairment losses -782 -698 -667
Sales and marketing 711 597 553
Gen and admin 291 264 244
Total Opex 1107 756 700
Operating Income 1036 942 923
Income after financial items 742 569 519
Net income 443 428 389
Diluted EPS ILS 2.82 ILS 2.75 ILS 2.49
Operating free cash flow 1221 446 580
Change (%) 2011 2012E 2013E
Net Sales 0.0 -2.9 -7.8
Gross Profit 0.0 5.0 -5.4
Depreciation, amortisation and impairment losses 0.0 -1.8 -6.2
Sales and marketing 0.0 9.8 -16.5
Gen and admin 0.0 9.3 -17.0
Total Opex 0.0 7.8 -18.5
Operating Income 0.0 2.6 4.6
Income after financial items 0.0 21.2 29.1
Net income 0.0 15.0 29.1
Diluted EPS 0.0 15.4 29.1
Operating free cash flow 0.0 23.4 21.2
Source: Company reports, Barclays

Barclays | Israel Telecom Services
20 September 2012 17
COMPANY SNAPHOTS

Barclays | Israel Telecom Services
20 September 2012 18
COMPANY SNAPSHOT
Bezeq Israel Telecom Services
Income statement (ILSmn) 2011A 2012E 2013E 2014E CAGRRevenue 11,373 10,464 10,088 9,880 -4.6%EBITDA 4,637 4,480 4,253 4,259 -2.8%EBIT 3,242 3,052 2,894 2,992 -2.6%Finance costs - net -210 -198 -286 -314 N/APre-tax income 2,816 2,517 2,438 2,312 -6.4%Tax rate (%) 26.8 28.5 32.3 32.0 6.1%Net income 2,061 1,801 1,650 1,571 -8.6%EPS (reported) (ILS) 0.76 0.65 0.60 0.57 -9.4%Diluted shares (mn) 2,825.0 2,825.0 2,825.0 2,825.0 0.0%DPS (ILS) 1.13 1.02 0.96 0.57 -20.5%
Margin and return data AverageEBITDA margin (%) 40.8 42.8 42.2 43.1 42.2EBIT margin (%) 28.5 29.6 28.9 28.6 28.9Pre-tax margin (%) 24.8 24.1 24.2 23.4 24.1Net margin (%) 18.1 17.2 16.4 15.9 16.9Operating CF margin (%) 28.0 33.7 31.9 30.8 31.1ROIC (%) 22.3 16.9 14.6 17.1 17.8RONTA (%) N/A N/A N/A N/A N/AROA (%) 15.0 12.7 11.6 12.9 13.1ROE (%) 51.2 78.9 78.5 89.5 74.5
Balance sheet and cash flow (ILSmn) CAGRTangible fixed assets 6,022 6,089 5,996 5,959 -0.3%Intangible fixed assets 2,369 2,203 2,203 2,203 -2.4%Cash and equivalents 1,352 1,716 567 310 -38.8%Total assets 17,331 17,162 15,805 15,397 -3.9%Short and long-term debt 9,578 11,025 10,825 10,625 3.5%Other long-term liabilities 1,246 774 774 774 -14.7%Total liabilities 14,643 15,284 14,889 14,460 -0.4%Net debt/(funds) 7,280 8,691 9,660 9,736 10.2%Shareholders' equity 2,688 1,878 915 936 -29.6%Cash flow from operations 3,186 3,530 3,216 3,038 -1.6%Capex and acquisitions -4,772 -1,848 -1,266 -1,230 N/AFree cash flow 1,638 2,163 1,950 1,808 3.3%NOPAT 2,373 2,183 1,959 2,034 -5.0%
Valuation and leverage metrics AverageP/E (reported) (x) 6.2 7.3 8.0 8.4 7.5EV/EBITDA (x) 4.5 4.8 5.3 5.5 5.0Equity FCF yield (%) 12.2 16.1 14.5 13.5 14.1EV/sales (x) 1.8 2.1 2.2 2.4 2.1P/BV (x) 5.0 7.1 14.7 14.3 10.3Dividend yield (%) 23.8 21.6 20.3 12.0 19.4Total debt/capital (%) 78.1 85.4 92.2 91.9 86.9Net debt/EBITDA (x) 1.6 1.9 2.3 2.3 2.0
Selected operating metrics
Stock Rating OVERWEIGHTIndustry View NEGATIVEPrice (19-Sep-2012) ILS 4.75Price Target ILS 5.50Ticker BEZQ.TA
Investment case Why Overweight? Bezeq is Israel's largest telecom operator. Despite the challenges that the industry faces, we view Bezeq as the most likely to outperform. Its advantages stem from the fact that it owns infrastructure in all four of its operating businesses.
Upside case ILS 6.50The main catalyst in our upside case is the potential synergies that would be brought about by a removal of structural separation. We do not give this a very high probability although it is currently being discussed by the government sponsored Hayek Committee.
Downside case ILS 4.00The downside case scenario sees the mobile business enter into significant pricing wars with its competitors that may drag on results and require the company to find a new strategy.
Upside/Downside scenarios
23568
10
20- Sep- 11 13- Sep- 12
4.00( - 15.8% )
DownsideCase
5.50
PriceTarget
( 15.8% )
6.50
UpsideCase
( 36.8% )
Source: Barclays Research
Service Revenues (ILSm)
0
1,0002,000
3,000
4,0005,000
6,000
2010 2011 2012E 2013E
fixed line yes pelephone
Source: Company Data, Barclays Research
Source: Company data, Barclays Research Note: FY End Dec

Barclays | Israel Telecom Services
20 September 2012 19
COMPANY SNAPSHOT
Cellcom Israel Ltd. Israel Telecom Services
Income statement (ILSmn) 2011A 2012E 2013E 2014E CAGRRevenue 6,506 5,849 5,283 5,201 -7.2%EBITDA 2,163 1,822 1,724 1,737 -7.1%EBIT 1,425 1,087 995 980 -11.7%Finance costs - net -293 -337 -318 -318 N/APre-tax income 1,129 751 678 662 -16.3%Tax rate (%) 26.9 26.2 25.0 25.0 -2.4%Net income 825 554 508 497 -15.6%EPS (reported) (ILS) 8.29 5.57 5.11 4.99 -15.6%Diluted shares (mn) 99.5 99.5 99.5 99.5 0.0%DPS (ILS) 7.90 2.44 2.55 2.50 -31.9%
Margin and return data AverageEBITDA margin (%) 33.2 31.2 32.6 33.4 32.6EBIT margin (%) 21.9 18.6 18.8 18.8 19.5Pre-tax margin (%) 17.4 12.8 12.8 12.7 13.9Net margin (%) 12.7 9.5 9.6 9.5 10.3Operating CF margin (%) 20.5 25.7 26.7 30.7 25.9ROIC (%) 19.0 9.4 7.9 7.7 11.0RONTA (%) N/A N/A N/A N/A N/AROA (%) 11.3 6.2 5.5 5.1 7.0ROE (%) 312.5 116.9 99.6 86.2 153.8
Balance sheet and cash flow (ILSmn) CAGRTangible fixed assets 2,168 2,116 2,133 1,952 -3.4%Intangible fixed assets 1,680 1,632 1,686 1,735 1.1%Cash and equivalents 920 1,053 1,231 1,950 28.5%Total assets 8,557 9,340 9,735 10,334 6.5%Short and long-term debt 6,276 6,702 6,702 6,702 2.2%Other long-term liabilities 246 251 268 284 4.9%Total liabilities 8,370 8,865 9,188 9,544 4.5%Net debt/(funds) -5,356 -4,675 -4,497 -3,778 N/AShareholders' equity 187 474 547 789 61.6%Cash flow from operations 1,332 1,502 1,413 1,598 6.3%Capex and acquisitions -333 -557 -600 -424 N/AFree cash flow 999 945 813 1,174 5.5%NOPAT 825 554 508 497 -15.6%
Valuation and leverage metrics AverageP/E (reported) (x) 3.8 5.7 6.2 6.4 5.5EV/EBITDA (x) 4.0 4.4 4.6 4.2 4.3Equity FCF yield (%) 31.6 29.9 25.7 37.2 31.1EV/sales (x) 1.3 1.4 1.5 1.4 1.4P/BV (x) 16.9 6.7 5.8 4.0 8.3Dividend yield (%) 24.9 7.7 8.0 7.9 12.1Total debt/capital (%) 97.1 93.4 92.5 89.5 93.1Net debt/EBITDA (x) 2.5 2.6 2.6 2.2 2.5
Selected operating metrics
Stock Rating EQUAL WEIGHTIndustry View NEGATIVEPrice (19-Sep-2012) ILS 31.75Price Target ILS 34.00Ticker CEL.TA
Investment case Why Equal Weight? The mobile sector seems to be stabilizing after facing severe pressure from pricing competition that was brought on even prior to disruptive MVNOs launching service.
Upside case ILS 40.00In the upside case we see value rising to ILS 40 assuming that it excution well on its entrance into the fixed line market that we expect will begin in 2013.
Downside case ILS 20.00In our downside case, the potential increased competitive climate from MVNOs and MNOs may drive subscriber acquisition costs higher and revenue per minute lower, impacting Cellcom’s profitability.
Upside/Downside scenarios
0
18
36
54
72
90
20- Sep- 11 13- Sep- 12
20.00( - 37% )
DownsideCase
34.00
PriceTarget
( 7.1% )
40.00
UpsideCase
( 26% )
Source: Barclays Research
Revenues and GM (%)
1,500
1,5501,600
1,6501,700
1,750
Q110
Q210
Q310
Q410
Q111
Q211
Q311
Q4 11
Q112
0%10%20%30%40%50%60%Revenues GM
Source: Company data, Barclays Research
Source: Company data, Barclays Research Note: FY End Dec

Barclays | Israel Telecom Services
20 September 2012 20
COMPANY SNAPSHOT
Hot Telecommunication System Israel Telecom Services
Income statement (ILSmn) 2011A 2012E 2013E 2014E CAGRRevenue 3,374 4,180 4,479 4,695 11.6%EBITDA 1,378 1,519 1,517 1,528 3.5%EBIT 2,219 2,558 2,591 2,604 5.5%Finance costs - net 199 288 308 308 15.7%Pre-tax income 441 151 95 104 -38.2%Tax rate (%) 22.7 51.1 25.0 25.0 3.3%Net income 328 74 71 78 -38.0%EPS (reported) (ILS) 4.41 0.95 0.92 1.01 -38.9%Diluted shares (mn) 77.7 77.7 77.7 77.7 0.0%DPS (ILS) 0.00 0.00 0.00 0.00 N/A
Margin and return data AverageEBITDA margin (%) 40.8 36.3 33.9 32.5 35.9EBIT margin (%) 65.8 61.2 57.8 55.5 60.1Pre-tax margin (%) 13.1 3.6 2.1 2.2 5.3Net margin (%) 9.7 1.8 1.6 1.7 3.7Operating CF margin (%) 36.8 24.4 20.6 30.5 28.1ROIC (%) 42.1 25.4 38.9 39.3 36.4RONTA (%) 0.0 0.0 0.0 0.0 0.0ROA (%) 28.5 17.9 27.7 27.2 25.3ROE (%) 19.0 4.3 4.5 5.0 8.2
Balance sheet and cash flow (ILSmn) CAGRTangible fixed assets 3,763 4,171 4,217 4,314 4.7%Intangible fixed assets 2,101 2,082 2,082 2,082 -0.3%Cash and equivalents 16 146 -150 9 -18.2%Total assets 6,663 7,286 7,233 7,260 2.9%Short and long-term debt 2,500 3,334 3,234 3,134 7.8%Other long-term liabilities 922 952 952 952 1.1%Total liabilities 4,732 5,815 5,651 5,560 5.5%Net debt/(funds) -2,484 -3,188 -3,384 -3,125 N/AShareholders' equity 1,931 1,471 1,582 1,700 -4.2%Cash flow from operations 1,240 1,021 923 1,433 4.9%Capex and acquisitions -539 -1,158 -1,120 -1,174 N/AFree cash flow 701 -137 -197 259 -28.2%NOPAT 1,716 1,250 1,943 1,953 4.4%
Valuation and leverage metrics AverageP/E (reported) (x) 8.1 37.7 39.0 35.7 30.1EV/EBITDA (x) 3.8 3.9 4.1 3.9 3.9Equity FCF yield (%) 25.2 -4.9 -7.1 9.3 5.6EV/sales (x) 1.6 1.4 1.4 1.3 1.4P/BV (x) 1.4 1.9 1.8 1.6 1.7Dividend yield (%) 0.0 0.0 0.0 0.0 0.0Total debt/capital (%) 56.4 69.4 67.1 64.8 64.4Net debt/EBITDA (x) 1.8 2.1 2.2 2.0 2.0
Selected operating metrics
Stock Rating UNDERWEIGHTIndustry View NEGATIVEPrice (19-Sep-2012) ILS 35.87Price Target ILS 35.00Ticker HOT.TA
Investment case Why Underweight? HOT is positioned to compete with Bezeq across all infrastructures; however we believe that 1) increased competition on the fixed line side and 2) liquidity concerns and low trading volumes are weighing on the stock.
Upside case ILS 45.00The advantages of a quad play would be unmatched in the market and allow HOT significant competitive advantages over its peers. IF HOT were to be able to secure long term cheap financing we belive the stock could outperform.
Downside case ILS 25.00HOT's main risks lie in the financing requirements and capex needed to establish itself as a credible player in mobile while maintaining its positive momentum in fixed line.
Upside/Downside scenarios
102030405060
20- Sep- 11 13- Sep- 12
25.00( - 30.3% )
DownsideCase
35.00
PriceTarget
( - 2.4% )
45.00
UpsideCase
( 25.5% )
Source: Barclays Research
ARPU by segment (% of total)
0%20%40%60%80%
100%
2Q10 4Q10 2Q11 4Q11 2Q12
fixed line cable internet
Source: Company data, Barclays Research
Source: Company data, Barclays Research Note: FY End Dec

Barclays | Israel Telecom Services
20 September 2012 21
COMPANY SNAPSHOT
Partner Communications Co. Israel Telecom Services
Income statement (ILSmn) 2011A 2012E 2013E 2014E CAGRRevenue 6,998 5,838 5,251 5,215 -9.3%EBITDA 2,178 1,665 1,591 1,578 -10.2%EBIT 1,396 979 245 243 -44.2%Finance costs - net -294 -277 -296 -268 N/APre-tax income 742 690 670 707 -1.6%Tax rate (%) 40.3 28.6 25.0 25.0 -14.7%Net income 443 493 502 530 6.2%EPS (reported) (ILS) 2.82 3.18 3.22 3.43 6.7%Diluted shares (mn) 155.6 155.1 156.1 154.6 -0.2%DPS (ILS) 2.25 1.76 1.61 1.71 -8.7%
Margin and return data AverageEBITDA margin (%) 31.1 28.5 30.3 30.3 30.0EBIT margin (%) 19.9 16.8 4.7 4.7 11.5Pre-tax margin (%) 10.6 11.8 12.8 13.6 12.2Net margin (%) 6.3 8.4 9.6 10.2 8.6Operating CF margin (%) 22.4 17.1 20.3 24.8 21.2ROIC (%) 70.8 115.9 87.4 78.0 88.0RONTA (%) N/A N/A N/A N/A N/AROA (%) 7.0 7.1 7.1 7.4 7.1ROE (%) 84.3 88.0 65.8 55.3 73.4
Balance sheet and cash flow (ILSmn) CAGRTangible fixed assets 2,051 2,049 2,209 2,369 4.9%Intangible fixed assets 1,290 1,171 910 666 -19.8%Cash and equivalents 532 203 561 1,086 26.8%Total assets 7,087 6,847 7,175 7,614 2.4%Short and long-term debt 5,171 4,735 4,735 4,735 -2.9%Other long-term liabilities 10 9 9 9 -3.5%Total liabilities 6,662 6,159 6,169 6,329 -1.7%Net debt/(funds) -4,639 -4,532 -4,093 -3,649 N/AShareholders' equity 425 695 952 1,231 42.6%Cash flow from operations 1,570 998 1,068 1,294 -6.2%Capex and acquisitions -349 -449 -365 -359 N/AFree cash flow 1,221 550 703 936 -8.5%NOPAT 443 493 502 530 6.2%
Valuation and leverage metrics AverageP/E (reported) (x) 6.9 6.1 6.0 5.7 6.2EV/EBITDA (x) 3.5 4.5 4.5 4.2 4.2Equity FCF yield (%) 40.3 18.2 23.2 31.1 28.2EV/sales (x) 1.1 1.3 1.4 1.3 1.3P/BV (x) 7.1 4.3 3.2 2.4 4.3Dividend yield (%) 11.6 9.1 8.3 8.8 9.4Total debt/capital (%) 92.4 87.2 83.3 79.4 85.6Net debt/EBITDA (x) 2.1 2.7 2.6 2.3 2.4
Selected operating metrics
Stock Rating OVERWEIGHTIndustry View NEGATIVEPrice (19-Sep-2012) ILS 19.45Price Target ILS 22.00Ticker PTNR.TA
Investment case Why Overweight? The mobile sector is under severe pressure from pricing competition that was brought on even prior to disruptive MVNOs launching service. However, we believe that PTNR's underperformance relative to CEL is unjustified.
Upside case ILS 30.00Our upside case takes into account margin recovery in the mobile business presuming that one of the new network operators fails. We also beloive that successful launch and executinon of its fixed line business would lead to further outperformance.
Downside case ILS 15.00If we were to remove 012 from our valuation we would arrive at an ILS 31 valuation. We believe that investors are not yet ready to give PTNR credit for this acquistion and often view PTNR's volumes as making it untradeable.
Upside/Downside scenarios
0
9
19
28
37
47
20- Sep- 11 13- Sep- 12
15.00( - 22.9% )
DownsideCase
22.00
PriceTarget
( 13.1% )
30.00
UpsideCase
( 54.2% )
Source: Barclays Research
Revenue & Gross Margin (ILSm)
1,4001,5001,6001,7001,8001,9002,000
Q110
Q210
Q310
Q410
Q111
Q211
Q311
Q411
Q112
0%
10%20%
30%40%
50%Revenue Gross Margin
Source: Company data, Barclays Research
Source: Company data, Barclays Research Note: FY End Dec

Barclays | Israel Telecom Services
20 September 2012 22
Appendix 1 - Economics of Mobile Data
(This article was first published in Watch out for Mobile Data MVNOs! (20 September 2010). To view analysts’ certifications and important disclosures, please refer to the report or click on the hyperlink above).
Costs
Assessing the ‘cost per Gbyte per month’ is more complicated. First, the cost of a network varies with peak capacity (in Mbps), not the average over a period. Second, the cost of adding capacity varies with the amount of spectrum, the network architecture, and technology itself.
1) Peak capacity and average per month. To translate 1Gbyte into a peak throughput, assumptions need to be made as to: 1) amount of traffic in the busy hour; and 2) number of days per month, adjusting bits to bytes and hours to seconds. Assuming 12% of traffic in the busy hour, with 30 days per month, we calculate 1Gbyte/mth equates to 9.7kbps on average.
Figure 10: Converting Gbytes/mth in Mbps
Source: Barclays Research
2) Varying cost of capacity. The cost of adding capacity depends on a number of factors, which is covered in detail in Appendix 1. The key building blocks are initially the cost of the radio base station + civil works along with supporting backhaul and core infrastructure which offers a base capacity. More carriers are then added with more spectrum which add capacity at relatively lower incremental cost, although backhaul/power upgrades scale also. Technology migration to HSPA+ and LTE should drive higher efficiency and therefore lower cost per bit.
We break down the cost into a new site build (Greenfield site), an upgrade to an existing site (such as W-CDMA to HSPA), and adding new carriers (on an existing HSPA-enabled site). Our analysis of the base configuration cost of a radio site indicates that the majority of capex per site cost is civil-related, whereas much of the opex is rental and backhaul.
Barclays | Israel Telecom Services
20 September 2012 23
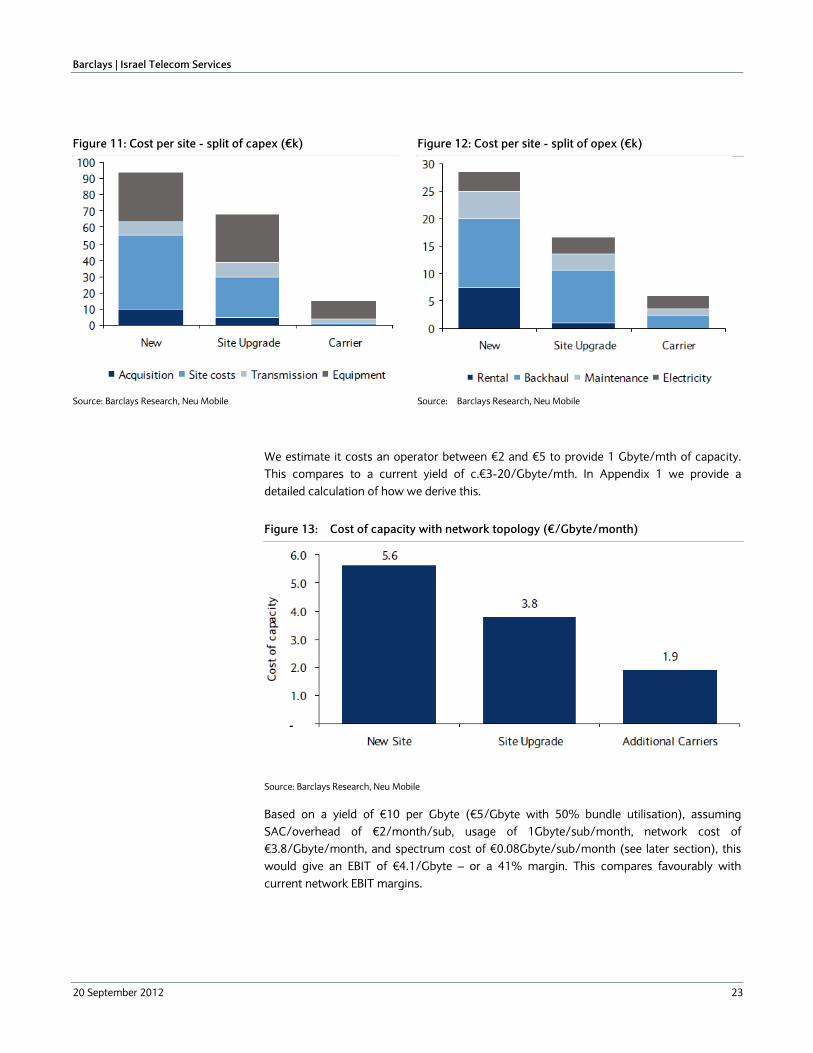
We estimate it costs an operator between €2 and €5 to provide 1 Gbyte/mth of capacity. This compares to a current yield of c.€3-20/Gbyte/mth. In Appendix 1 we provide a detailed calculation of how we derive this.
Figure 13: Cost of capacity with network topology (€/Gbyte/month)
Source: Barclays Research, Neu Mobile
Based on a yield of €10 per Gbyte (€5/Gbyte with 50% bundle utilisation), assuming SAC/overhead of €2/month/sub, usage of 1Gbyte/sub/month, network cost of €3.8/Gbyte/month, and spectrum cost of €0.08Gbyte/sub/month (see later section), this would give an EBIT of €4.1/Gbyte – or a 41% margin. This compares favourably with current network EBIT margins.
Figure 11: Cost per site - split of capex (€k)
Figure 12: Cost per site - split of opex (€k)
Source: Barclays Research, Neu Mobile Source: Barclays Research, Neu Mobile

Barclays | Israel Telecom Services
20 September 2012 24
Figure 14: Implied EBIT margins of mobile data
Amount
Traffic per data subscriber 1.0 Gbyte/sub
Revenue per Gbyte 10.0 €/Gbyte
Overhead cost – per sub 2.0 €/sub
Overhead cost – per Gbyte 2.0 €/Gbyte
Gross Profit 8.0 €/Gbyte
Gross Margin 80.0 %
Network Cost 3.8 €/Gbyte
Spectrum Cost 0.1 €/Gbyte
EBIT 4.1 €/Gbyte
EBIT margin 41.2 %
Source: Barclays Research
The table below flexes revenue per Gbyte with cost per Gbyte, with the output being the incremental EBIT margin. As can be seen in the table, as long as revenue/Gbyte remains above €6, and cost/Gbyte below €3, then returns will be above the cost of capital, but the model is clearly sensitive to changes in parameters.
Figure 15: Incremental EBIT margin - Flexing Revenue/Gbyte and Network Cost/Gbyte
Revenue/Gbyte
41.2 2 4 6 8 10 12 14 16 18 20
1 -54 23 48.7 61.5 69.2 74.3 78 80.8 82.9 84.6
2 -104 -2 32 49 59.2 66 70.9 74.5 77.3 79.6
3 -154 -27 15.3 36.5 49.2 57.7 63.7 68.3 71.8 74.6
4 -204 -52 -1.3 24 39.2 49.3 56.6 62 66.2 69.6
5 -254.0 -77 -18 11.5 29.2 41 49.4 55.8 60.7 64.6
6 -304.0 -102 -34.7 -1 19.2 32.7 42.3 49.5 55.1 59.6
7 -354.0 -127 -51.3 -13.5 9.2 24.3 35.1 43.3 49.6 54.6
Net
wor
k C
ost/
Gby
te
8 -404.0 -152 -68 -26 -0.8 16 28 37 44 49.6
Source: Barclays Research
Importance of spectrum
Much of the cost of radio networks is the initial install (c.€100k - finding/building the site, installing power/backhaul, rental). However, once a mobile operator has built a radio site for coverage, additional frequencies (carriers) can be added at relatively low incremental cost (although this does often require additional backhaul/power). We estimate an extra 2x5MHz of spectrum can reduce the incremental cost per Gbyte/month by up to 50%. Significantly, spectrum allocations across Europe are about to double with the auctioning of 2.6GHz and 800MHz auctions.
Operators want lower frequencies, because they transmit farther, hence the historical preference for 900MHz over the 1800MHz and 2100MHz bands. This is because signals at higher frequencies decrease faster than at lower frequencies, and so operators using 1800MHz (rather than 900MHz) requires more cell sites per square km for coverage. Using Okumura-Hata, the radius is 40% smaller for 1800MHz operators, requiring 3.5x as many sites for coverage. This was a problem for GSM late entrants, where the original analogue operators got the lower frequencies. A new radio base station costs c.€100k to build

Barclays | Israel Telecom Services
20 September 2012 25
(including civil engineering), whereas the equipment element is c.€20k and additional units of capacity cost c.€1k each.
Once all the frequencies have been used up on the base stations, operators have to do cell splitting, which involves building new base stations, on which carriers (capacity) is added. In many urban locations it is now hard to find new sites, and so smaller microcells are required, which can be even less economic.
Figure 16: Adding coverage --- then capacity
Source: Barclays Research
Because the main element of the cost of a base station is coverage related, and incremental capacity costs are relatively inexpensive, having more spectrum allows the €100k upfront cost to be spread over a greater number of calls/users/Mbytes. In addition, most urban networks are not coverage-constrained (capacity is the major issue), due to extensive cell splitting over the past eight years.
In-building coverage is becoming increasingly important for mobile data. The superior propagation characteristics of lower frequencies mean that 800/900MHz gives much better in-building coverage than the 1.8/2.1/2.6GHz ranges, as the higher frequencies degrade quicker. As most data usage in in-building, operators want to ensure high levels of coverage.
Figure 17: Network drivers --- coverage, capacity, quality, speed
Source: Barclays Research

Barclays | Israel Telecom Services
20 September 2012 26
3G/4G capacity degrades as the signal weakens. Unlike GSM networks, 3G and 4G mix the original signal with a code, and sends over all frequencies, and all base stations use the same frequency band. This is not the same as GSM networks. As a result, other signals are seen as noise, and this is what limits the capacity. As more users are added, each additional user creates more traffic, which contributes to the overall noise level. At some point the mobile and radio site will be unable to distinguish the original signal due to the noise level. The cell size is thus limited by noise. By transmitting in buildings, the noise level rises quicker, and the capacity of the site decreases.
Quality versus quantity. As a result of the propagation characteristics of wireless spectrum, operators should want lower frequencies to ensure good quality of coverage, but also lots of it. The problem (and trade-off) is that most of the new spectrum is at the higher frequency ranges. So the problem is to quantify the relative value of 5MHz of 800MHz spectrum against 5MHz of 2.6GHz spectrum.
Value of 800/900MHz = 2x1800MHz. We estimate that 900MHz spectrum is twice as valuable as 1800Mhz spectrum. Although 3.5x as many radio sites are required for coverage for 1800MHz vs 900MHz, this has become less of an issue for larger operators, as the networks have become denser (via cell splitting) due to higher traffic levels, and so the coverage ‘advantage’ from 900MHz has lessened.
Value of 800/900MHz = 4x2.6GHz. As mobile data will be the principal user of additional incremental spectrum, indoor penetration (we estimate 95% of mobile data is indoor) will become increasingly important. The weaker propagation characteristics of 2.6GHz will likely reduce the cell capacity compared to 800MHz. We therefore estimate a further 2x value delta versus 1800MHz.
We estimate the cost per Gbyte falls by 50% for an additional 2x5MHz of spectrum if an operator can add additional carriers to an existing site rather than site upgrades or a new site.
Figure 18: Cost of capacity with network topology
Source: Barclays Research
It is worth putting this in some context – if the cost per Gbyte/month/sub can be reduced by 50%, then this can be compared with the total spectrum acquired.
Cost of acquiring spectrum. Assuming a cost of €0.2/MHz/pop, along with assumed market share, data penetration and licence length, we can derive a monthly cost per
Barclays | Israel Telecom Services
20 September 2012 27
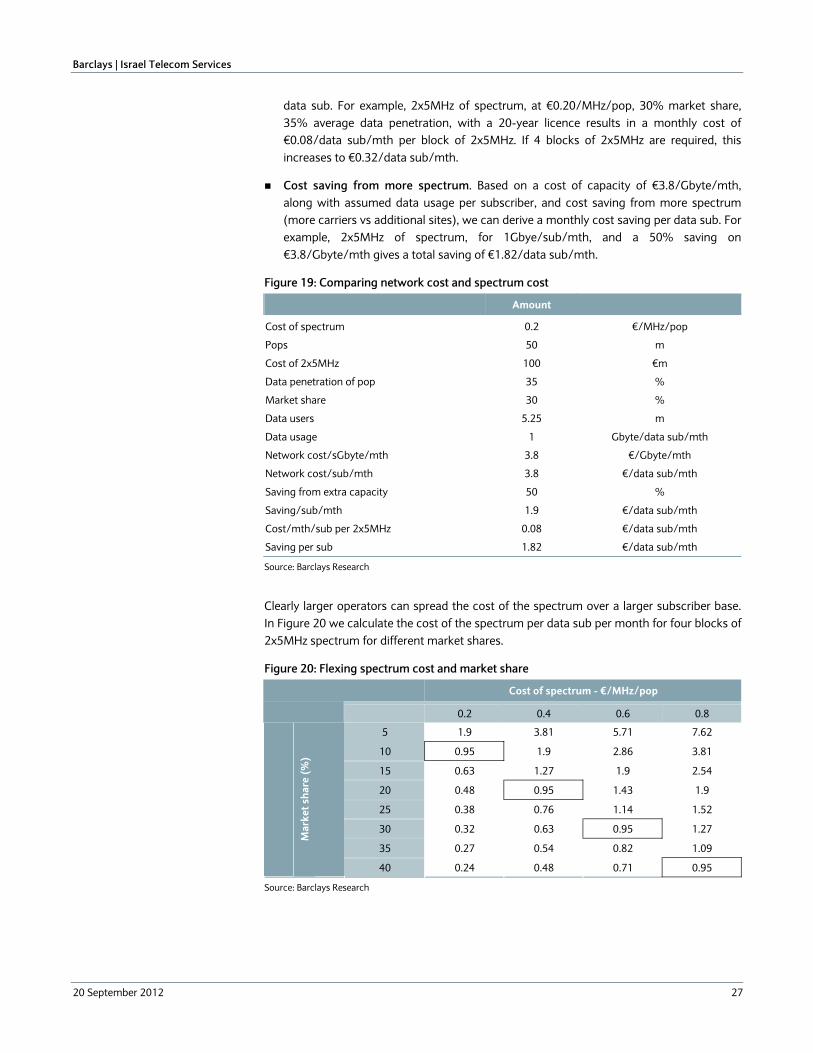
data sub. For example, 2x5MHz of spectrum, at €0.20/MHz/pop, 30% market share, 35% average data penetration, with a 20-year licence results in a monthly cost of €0.08/data sub/mth per block of 2x5MHz. If 4 blocks of 2x5MHz are required, this increases to €0.32/data sub/mth.
Cost saving from more spectrum. Based on a cost of capacity of €3.8/Gbyte/mth, along with assumed data usage per subscriber, and cost saving from more spectrum (more carriers vs additional sites), we can derive a monthly cost saving per data sub. For example, 2x5MHz of spectrum, for 1Gbye/sub/mth, and a 50% saving on €3.8/Gbyte/mth gives a total saving of €1.82/data sub/mth.
Figure 19: Comparing network cost and spectrum cost
Amount
Cost of spectrum 0.2 €/MHz/pop
Pops 50 m
Cost of 2x5MHz 100 €m
Data penetration of pop 35 %
Market share 30 %
Data users 5.25 m
Data usage 1 Gbyte/data sub/mth
Network cost/sGbyte/mth 3.8 €/Gbyte/mth
Network cost/sub/mth 3.8 €/data sub/mth
Saving from extra capacity 50 %
Saving/sub/mth 1.9 €/data sub/mth
Cost/mth/sub per 2x5MHz 0.08 €/data sub/mth
Saving per sub 1.82 €/data sub/mth
Source: Barclays Research
Clearly larger operators can spread the cost of the spectrum over a larger subscriber base. In Figure 20 we calculate the cost of the spectrum per data sub per month for four blocks of 2x5MHz spectrum for different market shares.
Figure 20: Flexing spectrum cost and market share
Cost of spectrum - €/MHz/pop
0.2 0.4 0.6 0.8
5 1.9 3.81 5.71 7.62
10 0.95 1.9 2.86 3.81
15 0.63 1.27 1.9 2.54
20 0.48 0.95 1.43 1.9
25 0.38 0.76 1.14 1.52
30 0.32 0.63 0.95 1.27
35 0.27 0.54 0.82 1.09
Mar
ket s
hare
(%)
40 0.24 0.48 0.71 0.95
Source: Barclays Research

Barclays | Israel Telecom Services
20 September 2012 28
Appendix 2 – Company charts

Barclays | Israel Telecom Services
20 September 2012 29
Figure 21: Israel mobile Subscriber share %
Figure 22: Israel mobile Cumulative net adds, m
30.3 30.4 30.3 30.5 30.1 30.6
36.3 36.1 36.2 35.6 35.9 35.8
33.4 33.5 33.6 33.9 33.9 33.5
0102030405060708090
100
2Q09
4Q09
2Q10
4Q10
2Q11
4Q11
Q21
2Bezeq Cellcom Partner
050
100150200250300350400450500550600
2Q07
4Q07
2Q08
4Q08
2Q09
4Q09
2Q10
4Q10
2Q11
4Q11
Q21
2
Bezeq Cellcom Partner
Source: Company data, Barclays Research Source Company data, Barclays Research
Figure 23: Israel – Service Revenue market share, ILS bn
Figure 24: Israel-Service Revenue growth, %
1.0 1.0 1.3 1.1 1.1 1.2 1.1 0.9 0.9 0.9 0.8 0.8 0.9
1.4 1.51.4 1.4 1.5 1.5 1.4
1.2 1.1 1.1 1.0 0.9 0.9
1.4 1.4 1.41.4 1.4 1.4 1.4
1.1 1.1 1.11.0 1.0 0.9
0.0
0.5
1.0
1.5
2.0
2.5
3.0
3.5
4.0
4.5
2Q09
3Q09
4Q09
1Q10
2Q10
3Q10
4Q10
1Q11
2Q11
3Q11
4Q11
1Q12
2Q12
Bezeq Cellcom Partner
Source: Company data, Barclays Research Source: Company data, Barclays Research
-40
-30
-20
-10
0
10
20
30
1Q07
3Q07
1Q08
3Q08
1Q09
3Q09
1Q10
3Q10
1Q11
3Q11
1Q12
Bezeq Cellcom Partner
72% MTR

Barclays | Israel Telecom Services
20 September 2012 30
Figure 24: CEL P&L
ILSm 2011 Q1 12 Q2 12 Q3 12E Q4 12E 2012E 2013E
Net Sales 6,506 1,585 1,498 1,398 1,369 5,849 5,283
Costs of sales 3,408 899 838 808 797 3,342 3,019
Gross Profit 3,098 686 660 590 572 2,508 2,264
Sales and marketing 990 236 220 184 177 818 779
Gen and admin 685 175 164 138 132 609 578
Total Opex 1,675 411 384 322 309 1,426 1,357
EBITDA 2,163 475 474 441 432 1,822 1,724
Depreciation, amortization and impairment losses -738 -200 -192 -173 -170 -735 -728
Write downs / exceptional 0 0 0 0 0 0 0
Operating Income 1,422 275 282 268 262 1,087 995
Finance costs, and other financial items, net -293 -36 -117 -92 -92 -337 -318
Income after financial items 1,129 239 165 176 170 751 678
Income taxes -304 -66 -44 -44 -43 -197 -169
Effective tax rate 27% 28% 27% 25% 25% 26% 25%
Net income 825 173 121 132 128 554 508
Weighted average basic and diluted shares 99.46 99.46 99.46 99.46 99.46 99.46 99.46
Reported diluted EPS 8.29 1.74 1.22 1.33 1.29 5.57 5.11
Adjusted EPS 8.85 1.74 1.13 1.19 1.15 5.30 5.11
Total DPS 7.90 1.30 0.00 0.66 0.64 2.44 2.55
Total dividends paid 786 130 0 66 64 242 254
Source: Company data, Barclays Research

Barclays | Israel Telecom Services
20 September 2012 31
Figure 25: CEL Balance sheet
ILSm 2011E 2012E 2013E
Intangible fixed Assets 1680 1632 1686
Tangible fixed Assets 2,168 2,116 2,133
Trade and other receivables 1,377 1,411 1,411
Fixed Assets 5,225 5,159 5,231
Inventories etc. 170 118 153
Receivables 1,859 1,943 2,054
Interest bearing receivables 93 93 93
Cash and equivalents 920 1,053 1,231
Other 290 974 974
Current Assets 3,332 4,181 4,505
TOTAL ASSETS 8,557 9,340 9,735
Debentures 5,452 5,929 5,929
Long Term Loans 19 15 15
Deferred tax and Other provisions 184 192 209
Other long-term liabilities 62 59 59
Long-term liabilities 5,717 6,195 6,212
Other short term liabilities 822 1,107 1,425
Short Term Loans 805 758 758
Trade payables and other current liabilities 1,026 806 794
Short-term liabilities 2,653 2,671 2,976
Cash flow hedge and minorities 7 8 8
Retained earnings 179 465 538
Shareholders Equity 187 474 547
EQUITY AND LIABILITIES 8,557 9,339 9,735
Source: Company data, Barclays Research

Barclays | Israel Telecom Services
20 September 2012 32
Figure 26: HOT P&L
ILS 2011 1Q12 2Q12 3Q12E 4Q12E 2012E 2013E
Revenues 3,374 1,027 1,032 1,060 1,061 4,180 4,479
Operating Costs 1,996 632 664 675 691 2,661 2,962
EBITDA 1,378 395 368 386 371 1,519 1,517
EBITDA margin (%) 41 38 36 36 35 36 34
Depreciation and Amortization 841 242 265 266 267 1,039 1,074
Share based compensation -103 7 14 10 10 41 40
Operating Profit 640 146 89 110 94 439 403
Net finance costs 199 65 70 76 77 288 308
Profit before tax 441 81 19 33 17 151 95
Net Income (Reported) 328 59 4 7 4 74 71
Net Income Excl one-offs 341 59 4 7 4 74 71
Weighted average number of shares 7,767 7,684 7,767 7,767 7,767 7,767 7,767
Diluted weighted average number of shares 7,725 7,684 7,767 7,767 7,767 7,746 7,767
Basic EPS (ILS) 4.39 0.77 0.05 0.09 0.05 0.95 0.92
Diluted EPS (ILS) 4.41 0.77 0.05 0.09 0.05 0.95 0.92
DPS 0 0 0 0 0 0 0
Source: Company data, Barclays Research

Barclays | Israel Telecom Services
20 September 2012 33
Figure 26: HOT Balance sheet
ILSm 2011 2012E 2013E
Property Plant and Equipment, net 3763 4170 4216
Goodwill 1264 1264 1264
Other intangible assets, net 837 818 818
Other assets 301 288 288
Total non-current assets 6165 6540 6586
Inventories 24 35 35
Trade receivables, net 379 481 679
Other current assets 79 82 82
Cash designated for projects 0 0 0
Cash and cash equivalents 16 146 -150
Total current assets 498 745 646
Total assets 6663 7285 7233
Contributed Capital 1750 1567 1567
Other reserves 31 42 42
Hedging reserves 21 4 4
Retained loss 129 -142 -30
Total equity 1931 1470 1582
Long term debt, less current portion 2064 2732 2632
Other liabilities 922 952 952
Total non-current liabilities 2986 3684 3584
Short-term borrowings 436 602 602
Accounts payable 341 302 289
Accrued expenses and other current liabilities 801 1060 1009
Unearned revenue 168 166 166
Total current liabilities 1746 2131 2067
Total liabilities 4732 5815 5651
Total equity and liabilities 6663 7285 7233
Source: Company data, Barclays Research

Barclays | Israel Telecom Services
20 September 2012 34
Figure 27: PTNR P&L
ILSm 2011 Q1 12 Q2 12 Q3 12E Q4 12E 2012E 2013E
Net Sales 6,998 1,571 1,428 1,431 1,408 5,838 5,251
Costs of sales 4,978 1,128 1,000 971 956 4,055 3,716
Gross Profit 2,020 443 428 459 452 1,782 1,536
Sales and marketing 711 154
148
178
176 656 461
Gen and admin 291 68
65
78
77 288 203
Other income (IFRS) 105 27
30
36
36 129 94
Total Opex 1,107 195 183 220 217 815 571
EBITDA 2,178 438 423 406 398 1,665 1,591
Depreciation, amortisation and impairment losses -782 -180 -176 -166 -164 -686 -626
Capitalization of handsets -97 -45 -45 -45 -45 -180 -180
Operating Income 1,036 248 245 239 234 967 965
Finance costs, and other financial items, net -294 -55 -73 -74 -75 -277 -296
Income after financial items 742 193 172 166 159 690 670
Income taxes -299 -47 -52 -50 -48 -197 -167
Effective tax rate 40% 24% 30% 30% 30% 29% 25%
Net income 443 146 120 116 111 493 502
EPS diluted 2.82 0.94 0.77 0.75 0.72 3.18 3.22
Weighted average basic and diluted 155.65 155.65 155.65 154.64 154.64 155.14 156.06
Total DPS 2.25 0.00 1.03 0.37 0.36 1.76 1.61
Total dividends paid 350 0 160 58 56 274 251
Source: Company data, Barclays Research

Barclays | Israel Telecom Services
20 September 2012 35
Figure 28: PTNR Balance sheet
ILSm 2011E 2012E 2013E
Intangible fixed Assets 1,290 1,171 910
Tangible fixed Assets 2,051 2,049 2,209
Financial Assets 582 437 437
Fixed Assets 3,923 3,657 3,556
Inventories etc. 162 140 114
Receivables 1,518 1,863 1,958
Interest bearing receivables 41 54 54
Cash and equivalents 532 203 561
Deferred Income Tax 55 55 55
Current Assets 2,308 2,314 2,742
LT receivables 856 729 729
Other assets 1 148 148
TOTAL ASSETS 7,087 6,847 7,175
Debentures 2,605 2,623 2,623
Long Term Loans 2,068 2,031 2,031
Deferred tax and Other provisions 90 85 85
Other long-term liabilities 10 9 9
Long-term liabilities 4,773 4,748 4,748
Short Term Loans 498 81 81
Trade payables 913 784 747
Other current liabilities 478 546 593
Short-term liabilities 1,889 1,411 1,421
Share Capital 2 2 2
Capital Surplus 1,100 1,100 1,100
Accumulated Deficit (earnings) -326 -56 201
Treasury shares at cost -351 -351 -351
Total Equity 425 695 952
EQUITY AND LIABILITIES 7,087 6,853 7,121
Source: Company data, Barclays Research

Barclays | Israel Telecom Services
20 September 2012 36
Figure 29: BEZQ P&L
ILSm 2011 Q1 12 Q2 12 Q3 12E Q4 12E 2012E 2013E
Net Sales 11,373 2,740 2,595 2,567 2,563 10,464 10,088
% Change -5.1% -5.9% -10.3% -12.0% -3.3% -8.0% -3.6%
EBITDA 4,637 1,208 1,104 1,085 1,083 4,480 4,253
Margin 40.8% 44.1% 42.6% 42.3% 42.3% 42.8% 42.2%
% Change -10.0% 20.8% -13.9% -16.6% 2.8% -3.4% -5.1%
Underlying EBITDA 4,802 1,181 1,114 1,055 1,053 4,403 4,133
Margin 42.2% 43.1% 42.9% 41.1% 41.1% 42.1% 41.0%
% Change -3.5% -7.8% -8.0% -11.7% -5.6% -8.3% -6.1%
Clean EBITDA 4,802 1,181 1,114 1,055 1,053 4,403 4,133
Depreciation, amortization and impairment losses -1,395 -358 -358 -356 -356 -1,429 -1,359
Wages -2,103 -511 -505 -513 -519 -2,048 -2,060
G&A -4,494 -1,044 -969 -969 -969 -3,951 -3,876
Other Operating Expenses 139 -23 17 -30 -30 -66 -120
Operating Income 3,242 850 746 758 748 3,102 2,912
Operating Margin % 29% 31% 29% 30% 29% 30% 29%
Finance income (expenses), net -210 44 -77 -81 -84 -198 -286
Income after financial items 3,032 894 669 676 664 2,905 2,626
Equity in Profits (losses) -216 -58 -83 -122 -123 -387 -188
Income Before Taxes 2,816 836 586 554 541 2,517 2,438
Income taxes -755 -245 -174 -151 -146 -716 -787
Effective tax rate 27% 29% 30% 27% 27% 28% 32%
Net income 2,061 591 412 403 395 1,801 1,650
Diluted Shares 2,825 2,825 2,825 2,825 2,825 2,825 2,825
Reported EPS 0.76 0.21 0.15 0.15 0.14 0.65 0.60
Diluted EPS 0.74 0.21 0.15 0.15 0.14 0.65 0.60
Source: Company data, Barclays Research

Barclays | Israel Telecom Services
20 September 2012 37
Figure 30: BEZQ Balance Sheet
ILSm 2011 2012E 2013E
Intangible fixed Assets 2,369 2,203 2,203
Tangible fixed Assets 6,022 6,089 5,996
Financial Assets 3,070 2,886 2,886
Fixed Assets 11,461 11,179 11,085
Assets for Sale 23 28 28
Inventories etc. 204 203 197
Receivables 3,059 3,077 2,980
Interest bearing receivables 286 341 350
Investments and loans 946 618 599
Cash and equivalents 1,352 1,716 567
Current Assets 5,870 5,984 4,719
TOTAL ASSETS 17,331 17,162 15,805
Long Term Loans 8,813 10,290 10,090
Deferred tax and Other provisions 138 -40 -327
Other long-term liabilities 1,246 774 774
Long-term liabilities 10,197 11,024 10,537
Short Term Loans 765 735 735
Trade payables 890 889 861
Other current liabilities 2,791 2,636 2,756
Short-term liabilities 4,446 4,260 4,352
Share premium 68 82 82
Reserves 608 593 593
Deficit (profit) -1,852 -2,628 -3,591
Minority Interests 38 0 0
Shareholders Equity 2,688 1,878 915
EQUITY AND LIABILITIES 17,331 17,162 15,805
Source: Company data, Barclays Research

Barclays | Israel Telecom Services
20 September 2012 38
ANALYST(S) CERTIFICATION(S)
I, David Kaplan, hereby certify (1) that the views expressed in this research report accurately reflect my personal views about any or all of thesubject securities or issuers referred to in this research report and (2) no part of my compensation was, is or will be directly or indirectly related to the specific recommendations or views expressed in this research report.
IMPORTANT DISCLOSURES CONTINUED
Barclays Research is a part of the Corporate and Investment Banking division of Barclays Bank PLC and its affiliates (collectively and each individually, "Barclays"). For current important disclosures regarding companies that are the subject of this research report, please send a writtenrequest to: Barclays Research Compliance, 745 Seventh Avenue, 17th Floor, New York, NY 10019 or refer to http://publicresearch.barcap.com orcall 212-526-1072.
The analysts responsible for preparing this research report have received compensation based upon various factors including the firm's totalrevenues, a portion of which is generated by investment banking activities.
Research analysts employed outside the US by affiliates of Barclays Capital Inc. are not registered/qualified as research analysts with FINRA.These analysts may not be associated persons of the member firm and therefore may not be subject to NASD Rule 2711 and incorporated NYSERule 472 restrictions on communications with a subject company, public appearances and trading securities held by a research analyst’saccount.
Analysts regularly conduct site visits to view the material operations of covered companies, but Barclays policy prohibits them from acceptingpayment or reimbursement by any covered company of their travel expenses for such visits.
In order to access Barclays Statement regarding Research Dissemination Policies and Procedures, please refer tohttps://live.barcap.com/publiccp/RSR/nyfipubs/disclaimer/disclaimer-research-dissemination.html.
The Corporate and Investment Banking division of Barclays produces a variety of research products including, but not limited to, fundamental analysis, equity-linked analysis, quantitative analysis, and trade ideas. Recommendations contained in one type of research product may differfrom recommendations contained in other types of research products, whether as a result of differing time horizons, methodologies, orotherwise.
Primary Stocks (Ticker, Date, Price)
Bezeq (BEZQ.TA, 19-Sep-2012, ILS 4.75), Overweight/Negative
Cellcom Israel Ltd. (CEL.TA, 19-Sep-2012, ILS 31.75), Equal Weight/Negative
Hot Telecommunication System (HOT.TA, 19-Sep-2012, ILS 35.87), Underweight/Negative
Partner Communications Co. (PTNR.TA, 19-Sep-2012, ILS 19.45), Overweight/Negative
Materially Mentioned Stocks (Ticker, Date, Price)
Belgacom (BCOM.BR, 18-Sep-2012, EUR 23.47), Underweight/Positive
BT Group PLC (BT.L, 18-Sep-2012, GBp 227.0), Overweight/Positive
Deutsche Telekom AG (DTEGn.DE, 18-Sep-2012, EUR 9.63), Overweight/Positive
Elisa Oyj (ELI1V.HE, 18-Sep-2012, EUR 16.59), Underweight/Positive
France Telecom SA (FTE.PA, 18-Sep-2012, EUR 10.02), Underweight/Positive
KPN (KPN.AS, 18-Sep-2012, EUR 6.49), Overweight/Positive
OTE (OTEr.AT, 18-Sep-2012, EUR 3.36), Equal Weight/Positive
Portugal Telecom SGPS SA (PTC.LS, 18-Sep-2012, EUR 3.97), Equal Weight/Positive
Swisscom (SCMN.VX, 18-Sep-2012, CHF 379.80), Overweight/Positive
TDC (TDC.CO, 18-Sep-2012, DKK 41.00), Underweight/Positive
Telecom Italia SpA (TLIT.MI, 18-Sep-2012, EUR 0.80), Overweight/Positive
Telecom Italia-RSP (TLITn.MI, 18-Sep-2012, EUR 0.68), Overweight/Positive
Telefónica SA (TEF.MC, 18-Sep-2012, EUR 11.38), Underweight/Positive
Telekom Austria (TELA.VI, 18-Sep-2012, EUR 6.30), Equal Weight/Positive
Telenor ASA (TEL.OL, 18-Sep-2012, NOK 109.80), Overweight/Positive
TeliaSonera AB (TLSN.ST, 18-Sep-2012, SEK 48.90), Equal Weight/Positive
Other Material Conflicts
BT.L: A non-executive director of Barclays Bank PLC is a chairman of BT Group PLC.
Guide to the Barclays Fundamental Equity Research Rating System:
Our coverage analysts use a relative rating system in which they rate stocks as Overweight, Equal Weight or Underweight (see definitions below)relative to other companies covered by the analyst or a team of analysts that are deemed to be in the same industry (the "industry coverage

Barclays | Israel Telecom Services
20 September 2012 39
IMPORTANT DISCLOSURES CONTINUED
universe").
In addition to the stock rating, we provide industry views which rate the outlook for the industry coverage universe as Positive, Neutral orNegative (see definitions below). A rating system using terms such as buy, hold and sell is not the equivalent of our rating system. Investors should carefully read the entire research report including the definitions of all ratings and not infer its contents from ratings alone.
Stock Rating
Overweight - The stock is expected to outperform the unweighted expected total return of the industry coverage universe over a 12-month investment horizon.
Equal Weight - The stock is expected to perform in line with the unweighted expected total return of the industry coverage universe over a 12-month investment horizon.
Underweight - The stock is expected to underperform the unweighted expected total return of the industry coverage universe over a 12-month investment horizon.
Rating Suspended - The rating and target price have been suspended temporarily due to market events that made coverage impracticable or to comply with applicable regulations and/or firm policies in certain circumstances including where the Corporate and Investment Banking Divisionof Barclays is acting in an advisory capacity in a merger or strategic transaction involving the company.
Industry View
Positive - industry coverage universe fundamentals/valuations are improving.
Neutral - industry coverage universe fundamentals/valuations are steady, neither improving nor deteriorating.
Negative - industry coverage universe fundamentals/valuations are deteriorating.
Below is the list of companies that constitute the "industry coverage universe":
European Telecom Services
Belgacom (BCOM.BR) Bouygues SA (BOUY.PA) BT Group PLC (BT.L)
Cable & Wireless Communications PLC (CWC.L) Cable & Wireless Worldwide PLC (CWW.L) Colt (COLT.L)
Daisy (DAY.L) Deutsche Telekom AG (DTEGn.DE) Elisa Oyj (ELI1V.HE)
France Telecom SA (FTE.PA) Iliad SA (ILD.PA) Inmarsat plc (ISA.L)
Jazztel Plc (JAZ.MC) Kabel Deutschland (KD8Gn.DE) KCOM (KCOM.L)
KPN (KPN.AS) Mobistar (MSTAR.BR) OTE (OTEr.AT)
Portugal Telecom SGPS SA (PTC.LS) Sonaecom SGPS SA (SNC.LS) Swisscom (SCMN.VX)
TalkTalk Telecom Group (TALK.L) TDC (TDC.CO) Tele2 AB (TEL2b.ST)
TeleCity Group Plc (TCY.L) Telecom Italia SpA (TLIT.MI) Telecom Italia-RSP (TLITn.MI)
Telefónica SA (TEF.MC) Telekom Austria (TELA.VI) Telenet Group Holding NV (TNET.BR)
Telenor ASA (TEL.OL) TeliaSonera AB (TLSN.ST) Virgin Media Inc. (VMED.L)
Vodafone Group Plc (VOD.L) Ziggo (ZIGGO.AS) Zon Multimedia (ZON.LS)
Israel Telecom Services
Bezeq (BEZQ.TA) Cellcom Israel Ltd. (CEL.TA) Hot Telecommunication System (HOT.TA)
Partner Communications Co. (PTNR.TA)
Distribution of Ratings:
Barclays Equity Research has 2464 companies under coverage.
42% have been assigned an Overweight rating which, for purposes of mandatory regulatory disclosures, is classified as a Buy rating; 54% ofcompanies with this rating are investment banking clients of the Firm.
42% have been assigned an Equal Weight rating which, for purposes of mandatory regulatory disclosures, is classified as a Hold rating; 48% of companies with this rating are investment banking clients of the Firm.
13% have been assigned an Underweight rating which, for purposes of mandatory regulatory disclosures, is classified as a Sell rating; 41% of companies with this rating are investment banking clients of the Firm.
Guide to the Barclays Research Price Target:
Each analyst has a single price target on the stocks that they cover. The price target represents that analyst's expectation of where the stock will trade in the next 12 months. Upside/downside scenarios, where provided, represent potential upside/potential downside to each analyst's pricetarget over the same 12-month period.
Barclays offices involved in the production of equity research:
Barclays | Israel Telecom Services
20 September 2012 40
IMPORTANT DISCLOSURES CONTINUED
London
Barclays Bank PLC (Barclays, London)
New York
Barclays Capital Inc. (BCI, New York)
Tokyo
Barclays Securities Japan Limited (BSJL, Tokyo)
São Paulo
Banco Barclays S.A. (BBSA, São Paulo)
Hong Kong
Barclays Bank PLC, Hong Kong branch (Barclays Bank, Hong Kong)
Toronto
Barclays Capital Canada Inc. (BCCI, Toronto)
Johannesburg
Absa Capital, a division of Absa Bank Limited (Absa Capital, Johannesburg)
Mexico City
Barclays Bank Mexico, S.A. (BBMX, Mexico City)
Taiwan
Barclays Capital Securities Taiwan Limited (BCSTW, Taiwan)
Seoul
Barclays Capital Securities Limited (BCSL, Seoul)
Mumbai
Barclays Securities (India) Private Limited (BSIPL, Mumbai)
Singapore
Barclays Bank PLC, Singapore branch (Barclays Bank, Singapore)

Barclays | Israel Telecom Services
20 September 2012 41
IMPORTANT DISCLOSURES CONTINUED
Bezeq (BEZQ IT / BEZQ.TA) Stock Rating Industry View
ILS 4.75 (19-Sep-2012) OVERWEIGHT NEGATIVE
Rating and Price Target Chart - ILS (as of 19-Sep-2012) Currency=ILS
Date Closing Price Rating Price Target
06-Aug-2012 4.40 5.50
11-Jun-2012 4.61 5.90
06-Feb-2012 6.48 7.80
05-Jan-2012 6.85 8.20
10-Nov-2011 7.70 8.40
31-Aug-2011 7.84 Overweight
15-Jul-2011 N/A 8.98
09-Mar-2011 9.52 10.83
06-Jan-2011 10.58 Equal Weight
15-Oct-2010 N/A 10.44
29-Jul-2010 8.22 10.15
24-May-2010 8.39 10.24
16-Feb-2010 9.64 10.73
08-Dec-2009 8.43 9.76
Closing Price Target Price Rating Change
Jan- 10 Jul- 10 Jan- 11 Jul- 11 Jan- 12 Jul- 12
3.75
4.50
5.25
6.00
6.75
7.50
8.25
9.00
9.75
10.50
11.25
19-Oct-2009 8.11 9.37
Link to Barclays Live for interactive charting
D: Barclays Bank PLC and/or an affiliate has received compensation for investment banking services from Bezeq in the past 12 months.
J: Barclays Bank PLC and/or an affiliate trades regularly in the securities of Bezeq.
L: Bezeq is, or during the past 12 months has been, an investment banking client of Barclays Bank PLC and/or an affiliate.
Valuation Methodology: Our price target is derived from a sum-of-the-parts, DCF-based valuation. Our assumptions include a 10.5% WACC and terminal growth rates of 0% for the fixed, mobile and ISP businesses. We apply a 1% terminal growth rate for the multi-channel television business, of which Bezeq owns 49.8%. After subtracting net debt, we arrive at a value of ILS per share 5.50.
Risks which May Impede the Achievement of the Barclays Research Price Target: A severe economic slowdown impacting usage behavior of mobile and fixed line telephones may cause the company results to differ from our expectations.

Barclays | Israel Telecom Services
20 September 2012 42
IMPORTANT DISCLOSURES CONTINUED
Cellcom Israel Ltd. (CEL IT / CEL.TA) Stock Rating Industry View
ILS 31.75 (19-Sep-2012) EQUAL WEIGHT NEGATIVE
Rating and Price Target Chart - ILS (as of 19-Sep-2012) Currency=ILS
Date Closing Price Rating Price Target
09-Aug-2012 24.92 24.00
11-Jun-2012 26.59 26.00
06-Feb-2012 55.80 56.00
24-Jan-2012 58.26 59.00
29-Nov-2011 63.04 61.00
16-Nov-2011 73.31 74.00
31-Aug-2011 80.10 Underweight 79.00
15-Jul-2011 N/A 101.00
16-Mar-2011 111.50 111.00
06-Jan-2011 119.10 116.00
10-Nov-2010 123.00 130.00
15-Oct-2010 N/A 128.00
24-May-2010 105.00 111.00
07-Jan-2010 122.00 131.00
Closing Price Target Price Rating Change
Jan- 10 Jul- 10 Jan- 11 Jul- 11 Jan- 12 Jul- 12
0
25
50
75
100
125
150
01-Oct-2009 115.10 Equal Weight 120.00
Link to Barclays Live for interactive charting
J: Barclays Bank PLC and/or an affiliate trades regularly in the securities of Cellcom Israel Ltd..
K: Barclays Bank PLC and/or an affiliate has received non-investment banking related compensation from Cellcom Israel Ltd. within the past 12 months.
M: Cellcom Israel Ltd. is, or during the past 12 months has been, a non-investment banking client (securities related services) of Barclays BankPLC and/or an affiliate.
Valuation Methodology: Our price target is derived from the average of our DCF model which assumes a 10.5% WACC and 0% terminal growthrate, and our sum of the parts model that attributes ILS 6,784mn to the Mobile segment and ILS 1,667mn to the Fixed line segment.
Risks which May Impede the Achievement of the Barclays Research Price Target: Some of the risks facing Cellcom are: pricing pressure, new MVNOs, significant changes to the regulatory regime and the fact that Cellcom's potential merger with an ISP company may cost more thaninitially expected may present downside risk to our estimates.
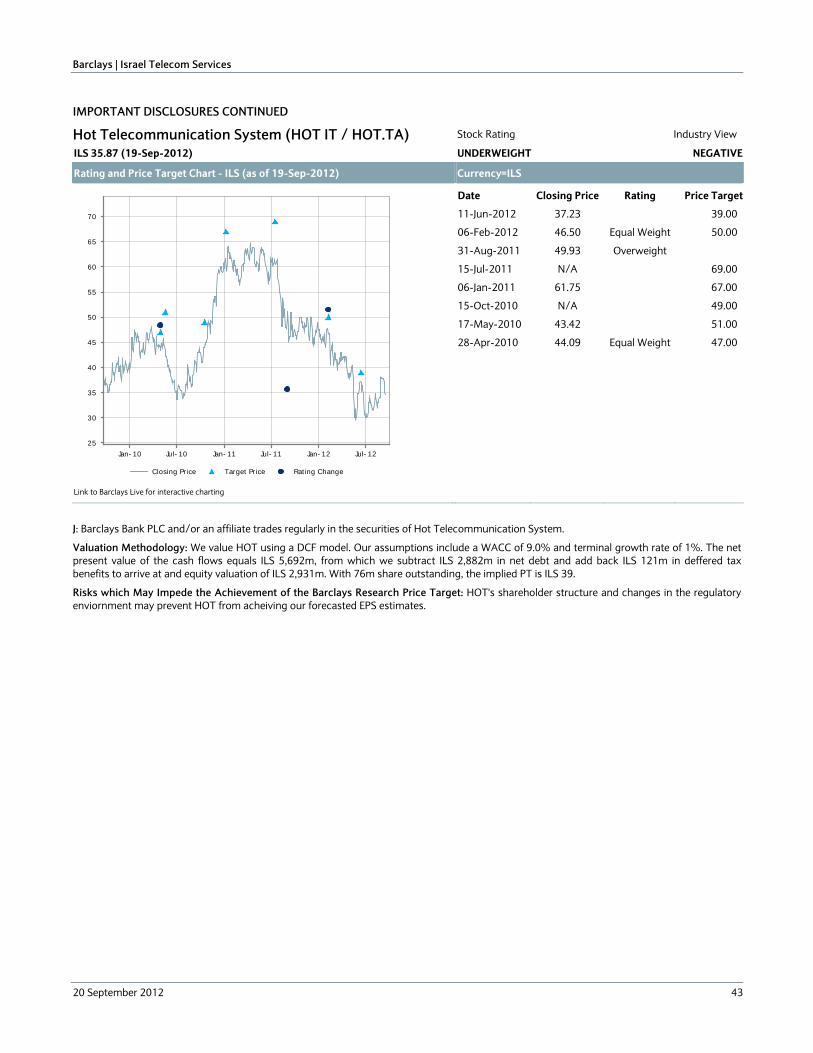
Barclays | Israel Telecom Services
20 September 2012 43
IMPORTANT DISCLOSURES CONTINUED
Hot Telecommunication System (HOT IT / HOT.TA) Stock Rating Industry View
ILS 35.87 (19-Sep-2012) UNDERWEIGHT NEGATIVE
Rating and Price Target Chart - ILS (as of 19-Sep-2012) Currency=ILS
Date Closing Price Rating Price Target
11-Jun-2012 37.23 39.00
06-Feb-2012 46.50 Equal Weight 50.00
31-Aug-2011 49.93 Overweight
15-Jul-2011 N/A 69.00
06-Jan-2011 61.75 67.00
15-Oct-2010 N/A 49.00
17-May-2010 43.42 51.00
Closing Price Target Price Rating Change
Jan- 10 Jul- 10 Jan- 11 Jul- 11 Jan- 12 Jul- 12
25
30
35
40
45
50
55
60
65
70
28-Apr-2010 44.09 Equal Weight 47.00
Link to Barclays Live for interactive charting
J: Barclays Bank PLC and/or an affiliate trades regularly in the securities of Hot Telecommunication System.
Valuation Methodology: We value HOT using a DCF model. Our assumptions include a WACC of 9.0% and terminal growth rate of 1%. The netpresent value of the cash flows equals ILS 5,692m, from which we subtract ILS 2,882m in net debt and add back ILS 121m in deffered taxbenefits to arrive at and equity valuation of ILS 2,931m. With 76m share outstanding, the implied PT is ILS 39.
Risks which May Impede the Achievement of the Barclays Research Price Target: HOT's shareholder structure and changes in the regulatory enviornment may prevent HOT from acheiving our forecasted EPS estimates.

Barclays | Israel Telecom Services
20 September 2012 44
IMPORTANT DISCLOSURES CONTINUED
Partner Communications Co. (PTNR IT / PTNR.TA) Stock Rating Industry View
ILS 19.45 (19-Sep-2012) OVERWEIGHT NEGATIVE
Rating and Price Target Chart - ILS (as of 19-Sep-2012) Currency=ILS
Date Closing Price Rating Price Target
09-Aug-2012 14.10 22.00
11-Jun-2012 17.80 24.00
06-Feb-2012 32.14 Overweight
29-Nov-2011 34.90 38.00
31-Aug-2011 39.40 Underweight 48.00
15-Jul-2011 N/A 72.00
15-Oct-2010 N/A 80.00
24-May-2010 67.50 84.00
07-Jan-2010 67.82 82.06
30-Nov-2009 63.63 76.65
Closing Price Target Price Rating Change
Jan- 10 Jul- 10 Jan- 11 Jul- 11 Jan- 12 Jul- 12
0
25
50
75
100
01-Oct-2009 63.93 Overweight 73.04
Link to Barclays Live for interactive charting
J: Barclays Bank PLC and/or an affiliate trades regularly in the securities of Partner Communications Co..
Valuation Methodology: Our price target is derived from the average of our DCF model which assumes a 10.5% WACC and 0% terminal growthrate. Our derived entreprise value is ILS 7,904m, to which we add ILS 477m of financial assets and substract ILS4,927 of financial liabilities. Thatgives us an EV of ILS 3,454m or ILS 22 per share.
Risks which May Impede the Achievement of the Barclays Research Price Target: Regulatory approval for stated acquisition is not received; and product launches do not gain market share and have to be rolled back.

DISCLAIMER:
This publication has been prepared by the Corporate and Investment Banking division of Barclays Bank PLC and/or one or more of its affiliates (collectively and eachindividually, "Barclays"). It has been issued by one or more Barclays legal entities within its Corporate and Investment Banking division as provided below. It is provided to our clients for information purposes only, and Barclays makes no express or implied warranties, and expressly disclaims all warranties of merchantability or fitness fora particular purpose or use with respect to any data included in this publication. Barclays will not treat unauthorized recipients of this report as its clients. Prices shownare indicative and Barclays is not offering to buy or sell or soliciting offers to buy or sell any financial instrument.
Without limiting any of the foregoing and to the extent permitted by law, in no event shall Barclays, nor any affiliate, nor any of their respective officers, directors,partners, or employees have any liability for (a) any special, punitive, indirect, or consequential damages; or (b) any lost profits, lost revenue, loss of anticipated savingsor loss of opportunity or other financial loss, even if notified of the possibility of such damages, arising from any use of this publication or its contents.
Other than disclosures relating to Barclays, the information contained in this publication has been obtained from sources that Barclays Research believes to be reliable,but Barclays does not represent or warrant that it is accurate or complete. Barclays is not responsible for, and makes no warranties whatsoever as to, the content of anythird-party web site accessed via a hyperlink in this publication and such information is not incorporated by reference.
The views in this publication are those of the author(s) and are subject to change, and Barclays has no obligation to update its opinions or the information in thispublication. The analyst recommendations in this publication reflect solely and exclusively those of the author(s), and such opinions were prepared independently of any other interests, including those of Barclays and/or its affiliates. This publication does not constitute personal investment advice or take into account the individualfinancial circumstances or objectives of the clients who receive it. The securities discussed herein may not be suitable for all investors. Barclays recommends thatinvestors independently evaluate each issuer, security or instrument discussed herein and consult any independent advisors they believe necessary. The value of and income from any investment may fluctuate from day to day as a result of changes in relevant economic markets (including changes in market liquidity). Theinformation herein is not intended to predict actual results, which may differ substantially from those reflected. Past performance is not necessarily indicative of futureresults.
This communication is being made available in the UK and Europe primarily to persons who are investment professionals as that term is defined in Article 19 of the Financial Services and Markets Act 2000 (Financial Promotion Order) 2005. It is directed at, and therefore should only be relied upon by, persons who have professionalexperience in matters relating to investments. The investments to which it relates are available only to such persons and will be entered into only with such persons.Barclays Bank PLC is authorised and regulated by the Financial Services Authority ("FSA") and a member of the London Stock Exchange.
The Corporate and Investment Banking division of Barclays undertakes U.S. securities business in the name of its wholly owned subsidiary Barclays Capital Inc., a FINRAand SIPC member. Barclays Capital Inc., a U.S. registered broker/dealer, is distributing this material in the United States and, in connection therewith accepts responsibility for its contents. Any U.S. person wishing to effect a transaction in any security discussed herein should do so only by contacting a representative ofBarclays Capital Inc. in the U.S. at 745 Seventh Avenue, New York, New York 10019.
Non-U.S. persons should contact and execute transactions through a Barclays Bank PLC branch or affiliate in their home jurisdiction unless local regulations permitotherwise.
Barclays Bank PLC, Paris Branch (registered in France under Paris RCS number 381 066 281) is regulated by the Autorité des marchés financiers and the Autorité decontrôle prudentiel. Registered office 34/36 Avenue de Friedland 75008 Paris.
This material is distributed in Canada by Barclays Capital Canada Inc., a registered investment dealer and member of IIROC (www.iiroc.ca).
Subject to the conditions of this publication as set out above, Absa Capital, the Investment Banking Division of Absa Bank Limited, an authorised financial servicesprovider (Registration No.: 1986/004794/06. Registered Credit Provider Reg No NCRCP7), is distributing this material in South Africa. Absa Bank Limited is regulated by the South African Reserve Bank. This publication is not, nor is it intended to be, advice as defined and/or contemplated in the (South African) Financial Advisory andIntermediary Services Act, 37 of 2002, or any other financial, investment, trading, tax, legal, accounting, retirement, actuarial or other professional advice or servicewhatsoever. Any South African person or entity wishing to effect a transaction in any security discussed herein should do so only by contacting a representative of Absa Capital in South Africa, 15 Alice Lane, Sandton, Johannesburg, Gauteng 2196. Absa Capital is an affiliate of Barclays.
In Japan, foreign exchange research reports are prepared and distributed by Barclays Bank PLC Tokyo Branch. Other research reports are distributed to institutional investors in Japan by Barclays Securities Japan Limited. Barclays Securities Japan Limited is a joint-stock company incorporated in Japan with registered office of 6-10-1 Roppongi, Minato-ku, Tokyo 106-6131, Japan. It is a subsidiary of Barclays Bank PLC and a registered financial instruments firm regulated by the Financial ServicesAgency of Japan. Registered Number: Kanto Zaimukyokucho (kinsho) No. 143.
Barclays Bank PLC, Hong Kong Branch is distributing this material in Hong Kong as an authorised institution regulated by the Hong Kong Monetary Authority.Registered Office: 41/F, Cheung Kong Center, 2 Queen's Road Central, Hong Kong.
This material is issued in Taiwan by Barclays Capital Securities Taiwan Limited. This material on securities not traded in Taiwan is not to be construed as 'recommendation' in Taiwan. Barclays Capital Securities Taiwan Limited does not accept orders from clients to trade in such securities. This material may not bedistributed to the public media or used by the public media without prior written consent of Barclays.
This material is distributed in South Korea by Barclays Capital Securities Limited, Seoul Branch.
All equity research material is distributed in India by Barclays Securities (India) Private Limited (SEBI Registration No: INB/INF 231292732 (NSE), INB/INF 011292738(BSE), Registered Office: 208 | Ceejay House | Dr. Annie Besant Road | Shivsagar Estate | Worli | Mumbai - 400 018 | India, Phone: + 91 22 67196363). Other research reports are distributed in India by Barclays Bank PLC, India Branch.
Barclays Bank PLC Frankfurt Branch distributes this material in Germany under the supervision of Bundesanstalt für Finanzdienstleistungsaufsicht (BaFin).
This material is distributed in Malaysia by Barclays Capital Markets Malaysia Sdn Bhd.
This material is distributed in Brazil by Banco Barclays S.A.
This material is distributed in Mexico by Barclays Bank Mexico, S.A.
Barclays Bank PLC in the Dubai International Financial Centre (Registered No. 0060) is regulated by the Dubai Financial Services Authority (DFSA). Principal place ofbusiness in the Dubai International Financial Centre: The Gate Village, Building 4, Level 4, PO Box 506504, Dubai, United Arab Emirates. Barclays Bank PLC-DIFC Branch, may only undertake the financial services activities that fall within the scope of its existing DFSA licence. Related financial products or services are only available toProfessional Clients, as defined by the Dubai Financial Services Authority.
Barclays Bank PLC in the UAE is regulated by the Central Bank of the UAE and is licensed to conduct business activities as a branch of a commercial bank incorporatedoutside the UAE in Dubai (Licence No.: 13/1844/2008, Registered Office: Building No. 6, Burj Dubai Business Hub, Sheikh Zayed Road, Dubai City) and Abu Dhabi

(Licence No.: 13/952/2008, Registered Office: Al Jazira Towers, Hamdan Street, PO Box 2734, Abu Dhabi).
Barclays Bank PLC in the Qatar Financial Centre (Registered No. 00018) is authorised by the Qatar Financial Centre Regulatory Authority (QFCRA). Barclays Bank PLC-QFC Branch may only undertake the regulated activities that fall within the scope of its existing QFCRA licence. Principal place of business in Qatar: Qatar FinancialCentre, Office 1002, 10th Floor, QFC Tower, Diplomatic Area, West Bay, PO Box 15891, Doha, Qatar. Related financial products or services are only available to BusinessCustomers as defined by the Qatar Financial Centre Regulatory Authority.
This material is distributed in the UAE (including the Dubai International Financial Centre) and Qatar by Barclays Bank PLC.
This material is distributed in Saudi Arabia by Barclays Saudi Arabia ('BSA'). It is not the intention of the publication to be used or deemed as recommendation, option or advice for any action (s) that may take place in future. Barclays Saudi Arabia is a Closed Joint Stock Company, (CMA License No. 09141-37). Registered office Al Faisaliah Tower, Level 18, Riyadh 11311, Kingdom of Saudi Arabia. Authorised and regulated by the Capital Market Authority, Commercial Registration Number: 1010283024.
This material is distributed in Russia by OOO Barclays Capital, affiliated company of Barclays Bank PLC, registered and regulated in Russia by the FSFM. Broker License#177-11850-100000; Dealer License #177-11855-010000. Registered address in Russia: 125047 Moscow, 1st Tverskaya-Yamskaya str. 21.
This material is distributed in Singapore by the Singapore branch of Barclays Bank PLC, a bank licensed in Singapore by the Monetary Authority of Singapore. For matters in connection with this report, recipients in Singapore may contact the Singapore branch of Barclays Bank PLC, whose registered address is One Raffles QuayLevel 28, South Tower, Singapore 048583.
Barclays Bank PLC, Australia Branch (ARBN 062 449 585, AFSL 246617) is distributing this material in Australia. It is directed at 'wholesale clients' as defined byAustralian Corporations Act 2001.
IRS Circular 230 Prepared Materials Disclaimer: Barclays does not provide tax advice and nothing contained herein should be construed to be tax advice. Please beadvised that any discussion of U.S. tax matters contained herein (including any attachments) (i) is not intended or written to be used, and cannot be used, by you for thepurpose of avoiding U.S. tax-related penalties; and (ii) was written to support the promotion or marketing of the transactions or other matters addressed herein.Accordingly, you should seek advice based on your particular circumstances from an independent tax advisor.
© Copyright Barclays Bank PLC (2012). All rights reserved. No part of this publication may be reproduced in any manner without the prior written permission ofBarclays. Barclays Bank PLC is registered in England No. 1026167. Registered office 1 Churchill Place, London, E14 5HP. Additional information regarding this publication will be furnished upon request.

US08-000001