Israel (State of) - · PDF fileWe forecast the current account ... while Israeli officials...
15
Israel (State of) Primary Credit Analyst: Elliot Hentov, PhD, London (44) 207-176-7071; [email protected] Secondary Contact: Trevor Cullinan, Dubai (971) 4372-7113; [email protected] Research Contributor: Madhav Pathak, CRISIL Global Analytical Center, an S&P affiliate, Mumbai Table Of Contents Major Rating Factors Rationale Outlook Political Analysis: 2013 Elections Introduced More Uncertainty Economic Analysis: Moderate Slowdown in Growth Expected To Continue Through 2013 External Analysis: External Account is Now a Major Credit Strength Fiscal Analysis: Revenue Shortfalls Expose Structural Weaknesses Monetary Policy Analysis: Exchange Rate Considerations Are As Important As Inflation Local Currency Rating And T&C Assessment Related Criteria And Research WWW.STANDARDANDPOORS.COM/RATINGSDIRECT MAY 30, 2013 1 1138891 | 301135087
Transcript of Israel (State of) - · PDF fileWe forecast the current account ... while Israeli officials...

Israel (State of)
Primary Credit Analyst:
Elliot Hentov, PhD, London (44) 207-176-7071; [email protected]
Secondary Contact:
Trevor Cullinan, Dubai (971) 4372-7113; [email protected]
Research Contributor:
Madhav Pathak, CRISIL Global Analytical Center, an S&P affiliate, Mumbai
Table Of Contents
Major Rating Factors
Rationale
Outlook
Political Analysis: 2013 Elections Introduced More Uncertainty
Economic Analysis: Moderate Slowdown in Growth Expected To Continue
Through 2013
External Analysis: External Account is Now a Major Credit Strength
Fiscal Analysis: Revenue Shortfalls Expose Structural Weaknesses
Monetary Policy Analysis: Exchange Rate Considerations Are As Important
As Inflation
Local Currency Rating And T&C Assessment
Related Criteria And Research
WWW.STANDARDANDPOORS.COM/RATINGSDIRECT MAY 30, 2013 1
1138891 | 301135087

Israel (State of)
Major Rating Factors
Strengths:
• Prosperous and resilient economy.
• Short but solid track record of fiscal consolidation.
• Robust external finances.
Sovereign Credit Rating
A+/Stable/A-1
Weaknesses:
• Heavy public debt burden.
• Significant geopolitical risks, somewhat mitigated by U.S. support.
Rationale
The rating reflects our view of Israel's prosperous and diverse economy as well as the medium-term impact of natural
gas production on the external account. However, risks to fiscal consolidation and threats to Israel's trend growth rate
currently constrain the rating.
The January 2013 election brought about a new coalition government that spans a broad ideological spectrum. This
suggests less stability and durability than in previous years. That said, however, our fiscal and growth forecasts assume
that this summer the four-party government coalition will pass the 2013-2014 biannual budget as well as labor and
consumer product market reforms. There is little policy visibility after this time.
The immediate challenge of fiscal consolidation is formidable, in our view. The 2012 general government deficit was
4.5% of GDP (relative to expenditures amounting to 42.1% of GDP) and the 2013 budget balance will be worse, absent
policy change. The government intends to reduce the fiscal gap with a blend of measures slightly biased toward
expenditure cuts, versus tax increases. Given that the details remain subject to political negotiations and will not take
effect until the middle of this year, we forecast the 2013 deficit to be larger than last year's. The budget plan should
lower deficits thereafter so that the 2013-2016 average annual change in general government debt would be 3.6% of
GDP, and by 2016 net general government debt would stabilize at around 65% of GDP and general government
interest at about 10% of revenues. Our base-case scenario assumes Israel's annual real GDP growth reaching 3.5%
over the forecast period, which would mean the long-term per capita growth rate declining to just above 1.6%
annually. We would still consider this high given the country's wealth levels.
While the beginning of natural gas production in the Mediterranean Sea should make a consistent contribution, there
are offsetting external and domestic risks to economic growth. In the short term, demand for Israeli exports could drop
due to economic weakness in core markets, especially in Europe and less so North America. This risk is compounded
by the potential for continued currency appreciation, which could hurt Israel's competitiveness. Israel's recent decision
to establish a sovereign wealth fund that will invest some of the natural gas proceeds externally could mitigate some of
these risks.
WWW.STANDARDANDPOORS.COM/RATINGSDIRECT MAY 30, 2013 2
1138891 | 301135087
Israel's penchant for innovation and its ability to produce ever-higher-value products also contributes to less elastic
demand for its exports. A domestic risk is the housing market, where price appreciation in second-half 2012 has
generated concerns. In response, the Bank of Israel has passed measures requiring higher down-payments on
mortgages (especially for second-home or speculative buyers) and raising capital requirements on mortgage lending by
banks. In our view, these measures should contain credit growth to the housing sector and prevent an asset bubble.
Israel's external fundamentals remain strong. We forecast the current account will turn positive again in 2013 at 0.9%
of GDP. The country's gross financing needs continue to decline and stand just below 80% of current account receipts
(CARs) and usable reserves. Israel continues to improve its net creditor position vis-à-vis the rest of the world with
narrow net external debt, which equals 38% of CARs. A balanced current account, strong FDI, and volatile financial
account flows have, however, placed upward pressure on the shekel and complicated the flexibility of monetary and
foreign exchange policy, which we otherwise consider to be a credit strength.
Geopolitical risks are a perennial rating constraint. The November 2012 outbreak of hostilities with Gaza and the
intermittent skirmishes on the Golan Heights remind us how easily Israel can be drawn into armed conflict. In this
respect, relations with the Palestinians, the war in Syria, and instability in Sinai signal a greater chance for deterioration
in the medium term.
Outlook
The stable outlook reflects our opinion that Israel's governmental consensus about containing public debt will
reemerge despite current fiscal consolidation pressures.
We could consider raising our ratings on Israel if it makes material progress in defusing external security risks, since
such progress would have positive repercussions for domestic stability, economic growth, and investor confidence.
Conversely, we believe that a significant setback in reducing the government's high debt burden, a decline in growth
prospects, or a substantial deterioration of the security situation in Israel could put downward pressure on the rating.
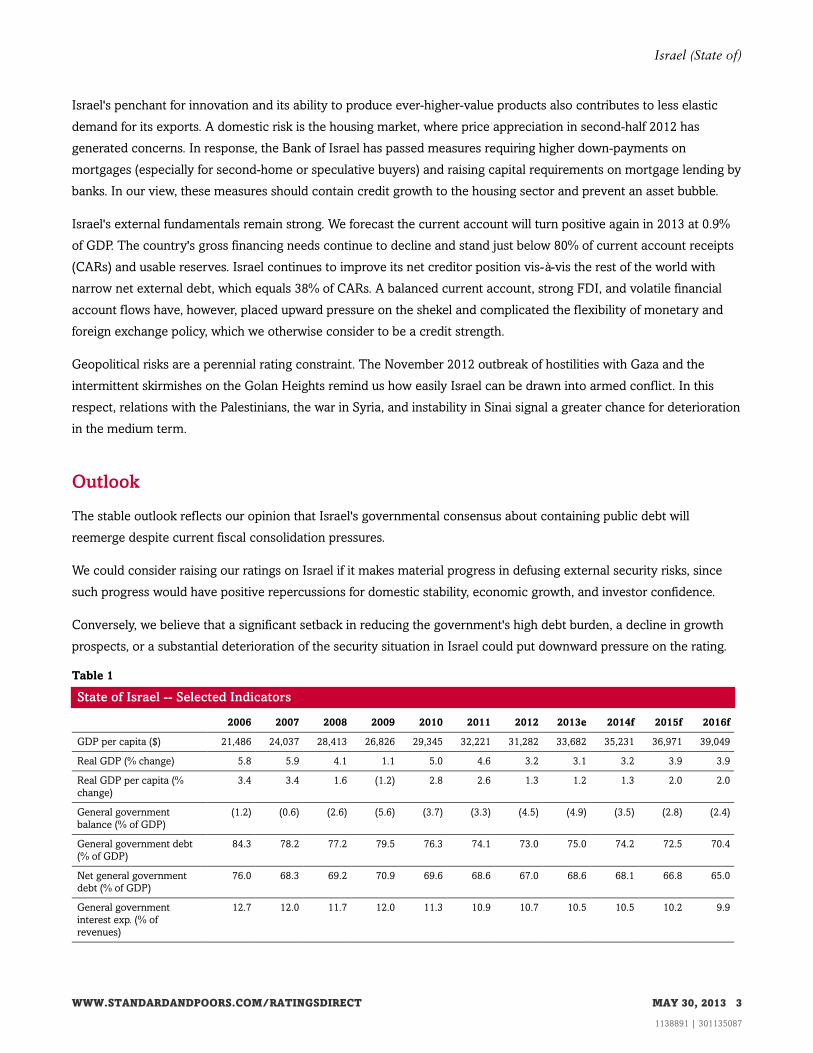
Table 1
State of Israel -- Selected Indicators
2006 2007 2008 2009 2010 2011 2012 2013e 2014f 2015f 2016f
GDP per capita ($) 21,486 24,037 28,413 26,826 29,345 32,221 31,282 33,682 35,231 36,971 39,049
Real GDP (% change) 5.8 5.9 4.1 1.1 5.0 4.6 3.2 3.1 3.2 3.9 3.9
Real GDP per capita (%
change)
3.4 3.4 1.6 (1.2) 2.8 2.6 1.3 1.2 1.3 2.0 2.0
General government
balance (% of GDP)
(1.2) (0.6) (2.6) (5.6) (3.7) (3.3) (4.5) (4.9) (3.5) (2.8) (2.4)
General government debt
(% of GDP)
84.3 78.2 77.2 79.5 76.3 74.1 73.0 75.0 74.2 72.5 70.4
Net general government
debt (% of GDP)
76.0 68.3 69.2 70.9 69.6 68.6 67.0 68.6 68.1 66.8 65.0
General government
interest exp. (% of
revenues)
12.7 12.0 11.7 12.0 11.3 10.9 10.7 10.5 10.5 10.2 9.9
WWW.STANDARDANDPOORS.COM/RATINGSDIRECT MAY 30, 2013 3
1138891 | 301135087
Israel (State of)

Table 1
State of Israel -- Selected Indicators (cont.)
Domestic credit to private
sector & NFPEs (% of GDP)
86.7 97.9 99.9 93.6 95.6 94.8 92.5 92.2 92.1 92.6 92.9
Consumer price index
(average; % change)
2.1 0.5 4.6 3.3 2.7 3.5 1.7 2.0 2.8 2.5 2.6
Gross external financing
needs* (% of CARs and
usable reserves)
99.1 103.5 108.5 93.2 84.2 84.1 84.5 79.9 75.5 73.5 72.5
Current account balance (%
of GDP)
4.8 3.1 1.5 4.2 3.7 1.4 (0.1) 0.9 2.0 2.5 3.1
Narrow net external debt§
(% of CARs)
24.3 24.1 13.2 2.1 (10.5) (18.7) (29.5) (37.7) (43.6) (43.2) (43.4)
*Gross external financing needs are defined as current account outflows plus short-term debt by remaining maturity. §Narrow net external debt
is defined as the stock of foreign and local currency public and private sector borrowings from nonresidents (including nonresident deposits in
resident banks) minus liquid nonequity external assets, which include official foreign exchange reserves, other liquid public sector foreign assets,
and financial institutions' deposits with and lending to nonresidents. A negative number indicates net external lending. f--Forecast. e--Estimate.
NFPEs--Nonfinancial public sector enterprises. CARs--Current account receipts.
Political Analysis: 2013 Elections Introduced More Uncertainty
• Elections in January 2013 produced a new coalition government that we believe is unlikely to be as stable as the
previous government.
• Policymaking will therefore become more unpredictable, particularly beyond 2014, after the passage of the
2013-2014 budget and some landmark reforms.
• Some reform proposals, such as changing electoral threshold or military conscription could have long-term
implications.
• Security risks remain very high.
The new government is composed of only four parties and is small by Israeli standards. However, the highly diverse
ideological mix from center-left to far right heralds greater policymaking uncertainty. At the same time, the rare
exclusion of ultra-Orthodox (Haredi) parties also suggests that long-delayed socio-economic reforms could see
passage in the current parliament.
At the heart of this would be new regulations that could greatly boost Israeli labor participation rates. The current
proposals center on a) allowing adult Haredi men over the age of 22 to enter employment without serving in the
military and b) to increase existing conscription of teenage Haredi men which raises likelihood of employment later
and c) to cut regular military service by 8-12 months. On the political front, there is discussion about amending
electoral laws, e.g. raising electoral threshold for small parties and restricting ability of sitting parliamentarians to
establish new factions in parliament. These measures could have unpredictable consequences on Israel's policymaking
context. The most immediate challenge is the passage of the 2013-2014 budget, which is likely to contain several
unpopular austerity measures. However, once passed, it will free up space for greater political disputes and thus raise
policy uncertainty.
We also note the challenges regarding foreign policy, where Israel faces increasing security risks on three fronts. First,
the lack of any peace process, the bifurcation of the Palestinians into two quasi-entities (the Fatah-led Palestinian
Authority and Hamas-led Gaza), have increased the potential for violent confrontations, as the recent flare-up in Gaza
WWW.STANDARDANDPOORS.COM/RATINGSDIRECT MAY 30, 2013 4
1138891 | 301135087
Israel (State of)

illustrated. In the West Bank, this is compounded by radicalized minority groups among Israeli settlers whose actions
appear aimed at provoking a larger confrontation. Second, the power transition in Egypt has created lawlessness in the
bordering Sinai Peninsula, allowing for increased weapons supply to Gaza as well as direct attacks on Israeli territory.
And third, while Israeli officials hope that any future Syrian regime is less likely to support Hezbollah, which could
improve the security situation on Israel's northern border in the long term, immediate concerns relate to spillover
violence. Israel's involvement in the war would be particularly grave if it led to another fully-fledged war with
Hezbollah because such a conflict would likely be significantly more damaging to Israel's economy than the recent
Gaza conflict or the 2006 war.
More broadly, we continue to consider the likelihood of an Israeli military attack on Iran as very low in the short term.
The lack of U.S. support and the unpredictability of the consequences lead us to believe that the Israeli government
will, for now, further delay such a decision.
While Israel has learned to cope with the security challenges, an outbreak of large-scale violence could fundamentally
undermine growth prospects and investor confidence as well as derail the consolidation of Israel's public finances.
Economic Analysis: Moderate Slowdown in Growth Expected To ContinueThrough 2013
• Israel is an advanced, open, high-income economy, which has a proven resilience to shocks.
• Structural reforms have improved competitiveness and support consumer and investor confidence.
• The global slowdown will, in turn, hamper Israel's growth performance in 2013, and a return to growth rates above
4.0% may take time.
• An increasingly visible challenge for the government is to accommodate demands from the population for more
equitable income distribution, within a framework of ongoing fiscal consolidation.
Table 2
State of Israel -- Economic And Financial Indicators
2006 2007 2008 2009 2010 2011 2012 2013e 2014f 2015f 2016f
Nominal GDP (bil. NIS) 646.7 683.4 723.0 766.0 813.9 871.8 929.5 978.8 1,038.6 1,106.1 1,179.1
Nominal GDP (bil. $) 145.1 166.3 201.5 194.8 217.7 243.7 241.0 264.4 281.8 301.4 324.4
GDP per capita ($) 21,486.5 24,037.4 28,412.9 26,826.3 29,344.6 32,220.9 31,281.5 33,682.4 35,231.0 36,971.1 39,049.2
Real GDP (% change) 5.8 5.9 4.1 1.1 5.0 4.6 3.2 3.1 3.2 3.9 3.9
Real GDP per capita (%
change)
3.4 3.4 1.6 (1.2) 2.8 2.6 1.3 1.2 1.3 2.0 2.0
Real domestic demand
(% change)
4.8 6.9 2.0 0.6 4.4 6.8 4.6 2.9 2.8 3.6 3.7
Real investment (%
change)
6.4 7.6 3.2 (8.1) 3.8 23.5 11.6 4.0 3.5 4.7 5.0
Gross domestic
investment (% of GDP)
18.2 18.8 17.9 15.4 14.7 17.6 19.3 19.3 19.0 18.9 18.8
Gross domestic savings
(% of GDP)
23.0 21.9 19.3 19.6 18.5 19.0 19.2 20.1 21.0 21.4 21.9
Real exports (% change) 5.5 9.2 7.1 (12.3) 13.5 5.5 0.1 0.2 2.0 4.8 5.0
WWW.STANDARDANDPOORS.COM/RATINGSDIRECT MAY 30, 2013 5
1138891 | 301135087
Israel (State of)
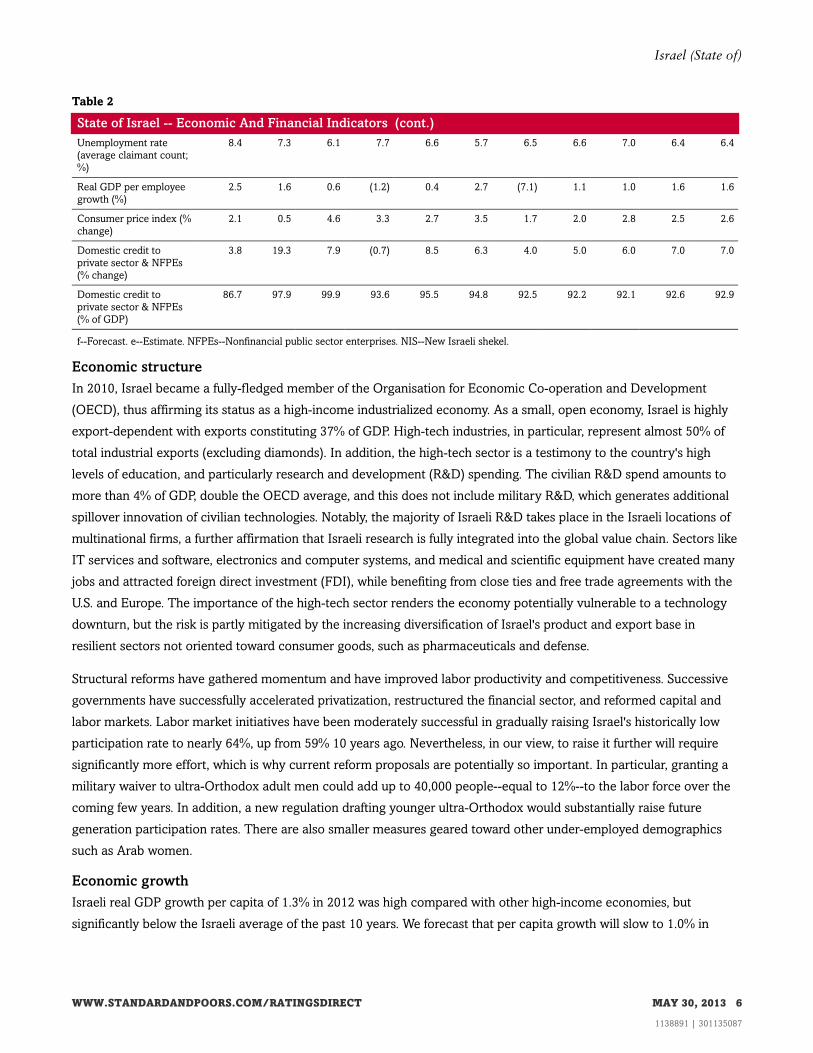
Table 2
State of Israel -- Economic And Financial Indicators (cont.)
Unemployment rate
(average claimant count;
%)
8.4 7.3 6.1 7.7 6.6 5.7 6.5 6.6 7.0 6.4 6.4
Real GDP per employee
growth (%)
2.5 1.6 0.6 (1.2) 0.4 2.7 (7.1) 1.1 1.0 1.6 1.6
Consumer price index (%
change)
2.1 0.5 4.6 3.3 2.7 3.5 1.7 2.0 2.8 2.5 2.6
Domestic credit to
private sector & NFPEs
(% change)
3.8 19.3 7.9 (0.7) 8.5 6.3 4.0 5.0 6.0 7.0 7.0
Domestic credit to
private sector & NFPEs
(% of GDP)
86.7 97.9 99.9 93.6 95.5 94.8 92.5 92.2 92.1 92.6 92.9
f--Forecast. e--Estimate. NFPEs--Nonfinancial public sector enterprises. NIS--New Israeli shekel.
Economic structure
In 2010, Israel became a fully-fledged member of the Organisation for Economic Co-operation and Development
(OECD), thus affirming its status as a high-income industrialized economy. As a small, open economy, Israel is highly
export-dependent with exports constituting 37% of GDP. High-tech industries, in particular, represent almost 50% of
total industrial exports (excluding diamonds). In addition, the high-tech sector is a testimony to the country's high
levels of education, and particularly research and development (R&D) spending. The civilian R&D spend amounts to
more than 4% of GDP, double the OECD average, and this does not include military R&D, which generates additional
spillover innovation of civilian technologies. Notably, the majority of Israeli R&D takes place in the Israeli locations of
multinational firms, a further affirmation that Israeli research is fully integrated into the global value chain. Sectors like
IT services and software, electronics and computer systems, and medical and scientific equipment have created many
jobs and attracted foreign direct investment (FDI), while benefiting from close ties and free trade agreements with the
U.S. and Europe. The importance of the high-tech sector renders the economy potentially vulnerable to a technology
downturn, but the risk is partly mitigated by the increasing diversification of Israel's product and export base in
resilient sectors not oriented toward consumer goods, such as pharmaceuticals and defense.
Structural reforms have gathered momentum and have improved labor productivity and competitiveness. Successive
governments have successfully accelerated privatization, restructured the financial sector, and reformed capital and
labor markets. Labor market initiatives have been moderately successful in gradually raising Israel's historically low
participation rate to nearly 64%, up from 59% 10 years ago. Nevertheless, in our view, to raise it further will require
significantly more effort, which is why current reform proposals are potentially so important. In particular, granting a
military waiver to ultra-Orthodox adult men could add up to 40,000 people--equal to 12%--to the labor force over the
coming few years. In addition, a new regulation drafting younger ultra-Orthodox would substantially raise future
generation participation rates. There are also smaller measures geared toward other under-employed demographics
such as Arab women.
Economic growth
Israeli real GDP growth per capita of 1.3% in 2012 was high compared with other high-income economies, but
significantly below the Israeli average of the past 10 years. We forecast that per capita growth will slow to 1.0% in
WWW.STANDARDANDPOORS.COM/RATINGSDIRECT MAY 30, 2013 6
1138891 | 301135087
Israel (State of)

2013, which equates to nearly 3% real GDP growth this year. In light of Israel's weak export markets, this is
nevertheless a relatively good growth performance, which is helped by natural gas production commencing in the
Mediterranean Sea.
In this regard, we estimate per capita growth to gradually rise in the coming years, averaging 1.6% from 2013-2016.
This is high for Israel's peer group and requires real GDP growth to average 3.5% over the same period (see chart 1).
We believe this can be achieved as Israel's continued expansion into new export markets in Asia and Eastern Europe
helps compensate for stagnant demand in the West. And Israel's competitive position as a research and knowledge
center continues to attract high levels of FDI. Nevertheless, uncertainty surrounding the political and security
situations will continue to overshadow confidence and add to downside risks, in our opinion.
Chart 1
External Analysis: External Account is Now a Major Credit Strength
• Strong export performance and large transfer payments continue to support external liquidity.
• Investment inflows are expected to remain on an upward trend over the medium term, although political and
economic uncertainties remain high.
• The forecast growing surplus in the current account should boost Israel's position as a net external creditor.
WWW.STANDARDANDPOORS.COM/RATINGSDIRECT MAY 30, 2013 7
1138891 | 301135087
Israel (State of)

Table 3
State of Israel -- External Indicators
2006 2007 2008 2009 2010 2011 2012 2013e 2014f 2015f 2016f
(% of GDP)
Current account balance 4.8 3.1 1.4 4.2 3.7 1.4 (0.1) 0.9 1.9 2.5 3.1
Trade balance (2.2) (3.1) (3.1) 0.4 (0.8) (3.2) (4.1) (4.2) (3.6) (3.4) (3.1)
Net foreign direct investment (0.1) 0.1 1.8 1.4 (1.6) 3.2 3.0 3.0 2.8 0.0 0.0
(% of CARs)
Current account balance 8.8 5.8 3.0 9.8 8.4 3.1 (0.2) 2.0 4.4 5.5 6.4
Net external liabilities 6.0 7.0 (9.2) (11.2) (40.3) (52.1) (67.4) (71.4) (75.5) (79.1) (82.2)
Gross external debt 105.7 96.3 85.2 105.0 85.4 69.9 61.9 51.3 40.2 36.2 32.3
General government external
debt
37.8 30.9 24.3 29.8 16.1 8.0 3.6 10.0 5.6 5.0 6.4
Narrow net external debt* 24.3 24.1 13.2 2.1 (10.4) (18.7) (29.5) (37.7) (43.6) (43.2) (43.4)
Net public sector external debt 4.0 2.6 (15.6) (39.7) (53.3) (57.6) (62.9) (57.5) (59.1) (57.3) (55.9)
Net nonfinancial private sector
external debt
(25.5) (31.8) (19.4) (26.2) (23.6) (20.0) (19.8) (33.3) (31.5) (27.5) (24.6)
Net financial sector external debt (13.0) (11.1) (2.0) 4.2 8.5 8.7 2.8 5.2 3.2 2.2 1.9
Net investment payments 1.0 0.3 4.2 6.3 5.3 4.6 7.0 4.3 3.7 3.5 3.4
Net interest payments 1.0 0.5 0.5 0.6 0.5 0.5 0.5 0.6 0.1 0.0 0.2
Reserves/CAPs (months) 4.7 4.1 3.6 6.9 8.2 8.1 8.3 8.1 8.0 7.6 7.3
Gross external financing needs§
(% of CARs and usable reserves)
99.1 103.5 108.5 93.2 84.2 84.1 84.5 79.9 75.5 73.5 72.5
*Narrow net external debt is defined as the stock of foreign and local currency public and private sector borrowings from nonresidents
(including nonresident deposits in resident banks) minus liquid nonequity external assets, which include official foreign exchange reserves,
other liquid public sector foreign assets, and financial institutions' deposits with and lending to nonresidents. A negative number indicates net
external lending. §Gross external financing needs are defined as current account outflows plus short-term debt by remaining maturity.
f--Forecast. e--Estimate. CARs--Current account receipts. CAPs--Current account payments.
External liquidity
Israel's structural balance of payments position appears to turn positive after the forecast period. While it recorded a
slight current account deficit in 2012 of -0.1% of GDP, starting in 2013 surpluses should again become the norm with
an average of 1.9% of GDP in 2013-2016.
These surpluses are boosted by domestic natural gas production starting this year, which provides for energy import
substitution equivalent to 0.8% of GDP. The current account should also benefit from fairly good prospects for the
services account and the net transfer position.
The ratio of gross external financing needs to CARs and usable reserves has declined steadily to 80% in 2013, from
109% in 2008 as reserves accumulated. These currently amount to $77 billion, which will cover about eight months of
current account payments.
Narrow net external debt
Israel became a net foreign creditor in 2010. Narrow net external debt (a more restrictive measure of external
indebtedness that broadly subtracts liquid external assets of the public and financial sectors from gross external debt)
also turned positive in 2010 at 10.5%, and we expect it to reach 37.7% of CARs in 2013, further underlining Israel's
WWW.STANDARDANDPOORS.COM/RATINGSDIRECT MAY 30, 2013 8
1138891 | 301135087
Israel (State of)

standing as a net creditor. Lastly, the non-bank private sector enjoys a strong net foreign asset position while we
expect the banking sector will remain a debtor at about 5% of CARs.
Fiscal Analysis: Revenue Shortfalls Expose Structural Weaknesses
• Despite decent growth, Israel's government revenues have fallen short of our expectations and we now forecast the
fiscal deficit to reach 4.9% of GDP this year, even higher than in 2012.
• The medium-term fiscal path is less predictable but our base-case scenario assumes that the government will
achieve partial fiscal consolidation, bringing average deficits for 2014-2016 down to around 3% of GDP.
• Such a trajectory leaves debt levels basically flat with gross general government debt declining slightly to 70.4% in
2016 on account of lower interest rates and higher economic growth rates.
• Off-budget and contingent liabilities should remain modest, although unplanned military operations could suddenly
require higher expenditures.
Table 4
State of Israel -- Fiscal Indicators
(% of GDP) 2006 2007 2008 2009 2010 2011 2012 2013e 2014f 2015f 2016f
General government revenues 43.6 43.3 40.5 37.6 38.8 38.8 37.6 37.6 38.4 39.0 39.2
Of which central government 32.6 32.7 30.2 26.8 27.4 27.4 26.5 27.2 27.9 28.3 28.3
General government expenditures 44.9 43.9 43.1 43.3 42.6 42.1 42.1 42.5 41.9 41.8 41.6
Of which central government 33.8 33.0 32.3 32.1 31.2 30.7 30.8 32.1 31.4 31.1 30.7
General government balance (1.2) (0.6) (2.6) (5.6) (3.7) (3.3) (4.5) (4.9) (3.5) (2.8) (2.4)
Of which central government (1.2) (0.4) (2.1) (5.3) (3.8) (3.3) (4.3) (4.9) (3.5) (2.8) (2.4)
Of which local authorities -- -- -- -- -- -- -- -- -- -- --
General government primary balance 4.3 4.6 2.2 (1.1) 0.7 0.9 (0.4) (0.9) 0.5 1.2 1.5
Central government primary balance 4.2 4.7 2.5 (0.9) 0.5 0.8 (0.3) (1.0) 0.5 1.1 1.4
General government balance (% of revenues) (2.8) (1.4) (6.3) (14.9) (9.6) (8.6) (11.9) (13.0) (9.1) (7.2) (6.1)
General gov't interest payments (% of revenues) 12.7 12.0 11.7 12.0 11.3 10.9 10.7 10.5 10.5 10.2 9.9
Central gov't interest payments (% of revenues) 16.7 15.5 15.3 16.5 15.6 15.2 14.9 14.2 14.2 13.8 13.5
General government debt 84.3 78.2 77.2 79.5 76.3 74.1 73.0 75.0 74.2 72.5 70.4
Of which central government debt 82.3 75.9 75.4 77.6 75.0 72.7 71.6 73.7 72.9 71.3 69.3
General government net debt 76.0 68.3 69.2 70.9 69.6 68.6 67.0 68.6 68.1 66.8 65.0
Of which central government net debt 74.0 66.0 67.4 69.0 68.3 67.2 65.6 67.2 66.9 65.6 63.9
f--Forecast. e--Estimate.
Expenditure, revenue, and balance performance
The slippage, beginning in 2012, has revealed a structural weakness in Israel's fiscal accounts. The source of the
weakness lies in the timing of the two-year budget for 2011-2012 in late 2010. The draft budget at the time was
conceived shortly after indirect tax revenues began to constitute a majority of government revenues. Furthermore, this
occurred in a high-growth environment with real GDP increasing by 5% in 2010. As a result, revenue forecasts grossly
overestimated future income; this started to become evident in 2012, the second year of the budget. In detail, the
revenue gap was new Israeli shekels 18.4 billion (roughly 2% of GDP), a slight majority of which came from a shortfall
in indirect tax revenues (see chart 2). As a result, the general government deficit reached 4.5% of GDP, in contrast to
WWW.STANDARDANDPOORS.COM/RATINGSDIRECT MAY 30, 2013 9
1138891 | 301135087
Israel (State of)

the government's 2% target.
Chart 2
In September 2012, the government passed austerity measures that focus on increasing government revenues, mainly:
a 1% rise in VAT from 16% to 17%; additional income taxes on high-income individuals; and tax increases on tobacco
and alcohol products. But despite these measures, the 2013-2014 budget is likely to include further tax increases in all
segments (VAT, personal and corporate income) as well as expenditure cuts in politically sensitive areas such as
defense, welfare, education, and public sector benefits. Our forecast assumes that many, but not all, austerity measures
will be implemented. Nevertheless, this would still leave a higher deficit of 4.9% of GDP for 2013, before gradually
dropping below 3% by 2015.
It remains to be seen how the Israeli political system will respond, as the regressive nature of many measures runs
counter to the motives of the 2011 protests and the election results in January 2013. Both were in response to the
higher cost of living and middle-class struggles, which partially result from higher consumption taxes. This analysis
also does not account for any unforeseen military expenditures, such as the Gaza conflict in November 2012, which
had added 0.2% of GDP in spending.
WWW.STANDARDANDPOORS.COM/RATINGSDIRECT MAY 30, 2013 10
1138891 | 301135087
Israel (State of)

Government debt and interest burden
Viewed over the long term, we estimate the general government debt-to-GDP ratio to have dropped to 73% of GDP in
2012, from 99% of GDP in 2003. Looking ahead, in our view, debt reduction has now stalled at least until 2016 when
higher growth should lower gross debt levels to 70.4% of GDP. This is still high and represents a constraint on Israel's
fiscal flexibility. In terms of interest burden, we forecast that Israel's general government interest payments as a
percentage of revenues will remain high, only going below 10% by 2016, at the earliest. Regarding the debt stock, the
proportion of foreign currency debt has been steadily declining over the past decade, amounting to 16% of total
government debt in 2012 (12% of GDP). The overwhelming share of foreign currency debt (84%) is denominated in
U.S. dollars, and about 17% of it is backed by U.S. loan guarantees. Israel has not issued any new debt under the U.S.
loan guarantee program since 2004, but is entitled to issue up to $3.8 billion (equivalent to 1.4% of GDP) until 2016,
having recently been extended. However, in practice, Israel will only be able to issue up to $2.15 billion due to U.S.
disapproval of civil construction in the West Bank. This program nevertheless provides funding flexibility in times of
political uncertainty, while, more generally, the government intends to further reduce the share of U.S.
dollar-denominated debt.
Off-budget and contingent liabilities
We consider off-budget and contingent liabilities emanating from the financial system to be modest. The majority of
Israel's formerly public companies have been divested, although the government is likely to keep majority stakes in key
industrial entities, such as the Israel Electric Corp. Ltd, which has required several emergency support measures from
the government over the past two years to stave off a liquidity crisis. Most of these measures have been in the form of
government-guaranteed debt, which we now estimate at a total of 1.9% of GDP, covering all guarantees.
The economic slowdown put pressure on banks' earnings and increased nonperforming loans (NPLs) last year. We
expect credit cost to continue to put negative pressure on banks' asset quality in the next 12-18 months. Primarily, this
is due to the challenging refinancing environment for the local highly leveraged conglomerates, whose dividend
income from operating companies has markedly fallen this year. As a result, we recognize some residual downside
risks for the banking sector stemming from spillover effects from holding companies.
In contrast, the housing market appears to have a fundamental supply shortage, with a limited stock of affordable
housing. Furthermore, housing starts are now again close to the level of new household formations. However, the
second half of 2012 saw a sudden appreciation in housing prices, which led to regulatory responses as in 2010. First, in
November 2012, LTV mortgage limits were imposed (75% on first-home buyers, 50% on second-home buyers).
Assuming that investors constituted 20%-30% of transactions during that period, average LTV should trend downward.
This is what initial data suggests. Second, in February 2013, the Bank of Israel raised capital requirements for bank
mortgages, with particular penalization of higher LTV mortgages. This measure effectively approximated a 25 basis
point interest rate hike for home buyers. Overall, loan-to-income and household debt levels remain low and do not
portend a housing bubble.
In our view, Israeli banks only have a moderate direct exposure to eurozone sovereign debt and eurozone banks. In
the medium term, we expect regulatory requirements will be implemented to improve banks' capital levels. Regarding
liquidity, the solid domestic deposit base has ensured that banks remain sufficiently liquid. In a reasonable worst-case
scenario, we estimate contingent liabilities for the sovereign arising from a banking crisis to be "limited" as our criteria
WWW.STANDARDANDPOORS.COM/RATINGSDIRECT MAY 30, 2013 11
1138891 | 301135087
Israel (State of)

defines this term.
Monetary Policy Analysis: Exchange Rate Considerations Are As Important AsInflation
• The Bank of Israel (BoI) is a strong institution that pursues an active interest rate policy to contain inflationary
pressures and adjust to global trends.
• In line with global weakness, the BoI recently eased monetary policy, but recent currency appreciation and high
fiscal deficits limit the scope for much further easing.
• The BoI has again intervened in the foreign exchange market to stem appreciation trends.
• Domestic capital markets have deepened rapidly in recent years, with the notable introduction of a 30-year
government bond. However, there are residual risks and the volatility of portfolio flows is high, while FDI inflows
remain steady.
Strengthened by the 2010 Bank of Israel Law, the BoI's main policy objective is to maintain price stability in the long
run, with policy goals set by the Monetary Policy Committee. Currently, this means an inflation target of 1%-3%.
Despite current inflation running toward the bottom of the target range, we forecast that consumer price inflation in
2013 will average 2.0%, due to a pick-up in the second half of the year due to tax increases.
The BoI has stated that the future trajectory of the key lending rate will be governed by the inflation environment, the
strength of the Israeli shekel, and global economic growth. Given current inflation levels, the policy rate of 1.5% would
provide some, but not much further scope for more easing.
Yet, inflationary concerns are balanced by the simultaneous appreciation of the shekel and concomitant threat to
Israel's export industries. Since the Gaza conflict in November, the shekel initially gained up to 8% against the U.S.
dollar even though the interest rate differential had shrunk and Israel's growth prospects had been revised downward.
Until 2010, similar trends had prompted the BoI to repeatedly intervene in the currency markets. In addition, in 2011,
to lessen the volatility of portfolio flows and reduce the appeal of a carry trade, the BoI instituted a 10% reserve
requirement on foreign exchange derivative transactions by non-residents. One drawback has been the accumulation
of accounting losses since 2010. These have been a result of the interest differential accrued due to the sterilization
measures and the associated revaluation of foreign reserves. In May 2013, the BoI announced that it will intervene
sufficiently to at least offset the yearly foreign currency savings of natural gas production estimated at $2.1 billion. This
would restart another phase of regular foreign exchange interventions similar to 2010-2011 (see chart 3).
WWW.STANDARDANDPOORS.COM/RATINGSDIRECT MAY 30, 2013 12
1138891 | 301135087
Israel (State of)

Chart 3
Looking ahead, we expect that the advantages of inflation-targeting and the flexible exchange rate framework, coupled
with credit-supporting and financial stability initiatives, will help maintain the effectiveness of the domestic monetary
transmission mechanism. This should also allow monetary policy to effectively address external weaknesses and
uncertainties and provide strong support to economic stability.
In our view, Israel enjoys effective transmission mechanisms via financial systems and capital markets. The central
government issues meaningful amounts of local-currency fixed-rate bonds with an original maturity greater or equal to
10 years at market-determined rates and with an active secondary market. In total, domestic claims in local currency
represent 78% of GDP and total capitalization of the fixed income market is estimated at 85% of GDP. In addition,
reforms implemented in recent years have not only deepened Israeli capital markets and increased competition
between the various players and products--they have also raised exposure to financial developments abroad and, as a
result, heightened risks. Nonetheless, a conservative regulatory regime for the Israeli financial sector remains in place.
Local Currency Rating And T&C Assessment
Our local currency rating is equalized with the foreign currency rating despite Israel's monetary flexibility and
WWW.STANDARDANDPOORS.COM/RATINGSDIRECT MAY 30, 2013 13
1138891 | 301135087
Israel (State of)

substantial local currency debt market. This is due to our belief that fiscal weakness prevents any capacity to better
service shekel-denominated debt issued in the domestic market. Our T&C assessment expresses our view of the
likelihood of the sovereign restricting access to foreign exchange needed by Israel-based non-sovereign issuers for
debt service as moderately lower than the likelihood of the sovereign defaulting on its foreign currency obligations.
While there are few foreign exchange restrictions, they could be used more extensively in a severe downside scenario,
as has been the case in the past.
Related Criteria And Research
All articles listed below are available on RatingsDirect on the Global Credit Portal, unless otherwise stated.
• Local Currency Ratings on Israel Lowered to 'A+/A-1' on Fiscal Slippage; FC Ratings Affirmed at 'A+/A-1'; Outlook
Stable, May 2, 2013
• Sovereign Defaults And Rating Transition Data, 2012 Update, March 29, 2013
• Banking Industry Country Risk Assessment: Israel, Dec. 5, 2012
• The Syrian Conflict Is Ratcheting Up The Sovereign Rating Risks Of Its Neighbors, Sept. 18, 2012
• Sovereign Government Rating Methodology and Assumptions, June 30, 2011
Ratings Detail (As Of May 30, 2013)
Israel (State of)
Sovereign Credit Rating A+/Stable/A-1
Transfer & Convertibility Assessment AA
Senior Secured AA+
Senior Unsecured A
Senior Unsecured A+
Sovereign Credit Ratings History
09-Sep-2011 Foreign Currency A+/Stable/A-1
30-Oct-2008 A/Stable/A-1
27-Nov-2007 A/Positive/A-1
02-May-2013 Local Currency A+/Stable/A-1
27-Nov-2007 AA-/Stable/A-1+
13-Feb-2007 A+/Positive/A-1
*Unless otherwise noted, all ratings in this report are global scale ratings. Standard & Poor's credit ratings on the global scale are comparable
across countries. Standard & Poor's credit ratings on a national scale are relative to obligors or obligations within that specific country.
Additional Contact:
SovereignEurope; [email protected]
WWW.STANDARDANDPOORS.COM/RATINGSDIRECT MAY 30, 2013 14
1138891 | 301135087
Israel (State of)

S&P may receive compensation for its ratings and certain analyses, normally from issuers or underwriters of securities or from obligors. S&P
reserves the right to disseminate its opinions and analyses. S&P's public ratings and analyses are made available on its Web sites,
www.standardandpoors.com (free of charge), and www.ratingsdirect.com and www.globalcreditportal.com (subscription) and www.spcapitaliq.com
(subscription) and may be distributed through other means, including via S&P publications and third-party redistributors. Additional information
about our ratings fees is available at www.standardandpoors.com/usratingsfees.
S&P keeps certain activities of its business units separate from each other in order to preserve the independence and objectivity of their respective
activities. As a result, certain business units of S&P may have information that is not available to other S&P business units. S&P has established
policies and procedures to maintain the confidentiality of certain nonpublic information received in connection with each analytical process.
To the extent that regulatory authorities allow a rating agency to acknowledge in one jurisdiction a rating issued in another jurisdiction for certain
regulatory purposes, S&P reserves the right to assign, withdraw, or suspend such acknowledgement at any time and in its sole discretion. S&P
Parties disclaim any duty whatsoever arising out of the assignment, withdrawal, or suspension of an acknowledgment as well as any liability for any
damage alleged to have been suffered on account thereof.
Credit-related and other analyses, including ratings, and statements in the Content are statements of opinion as of the date they are expressed and
not statements of fact. S&P's opinions, analyses, and rating acknowledgment decisions (described below) are not recommendations to purchase,
hold, or sell any securities or to make any investment decisions, and do not address the suitability of any security. S&P assumes no obligation to
update the Content following publication in any form or format. The Content should not be relied on and is not a substitute for the skill, judgment
and experience of the user, its management, employees, advisors and/or clients when making investment and other business decisions. S&P does
not act as a fiduciary or an investment advisor except where registered as such. While S&P has obtained information from sources it believes to be
reliable, S&P does not perform an audit and undertakes no duty of due diligence or independent verification of any information it receives.
No content (including ratings, credit-related analyses and data, valuations, model, software or other application or output therefrom) or any part
thereof (Content) may be modified, reverse engineered, reproduced or distributed in any form by any means, or stored in a database or retrieval
system, without the prior written permission of Standard & Poor's Financial Services LLC or its affiliates (collectively, S&P). The Content shall not be
used for any unlawful or unauthorized purposes. S&P and any third-party providers, as well as their directors, officers, shareholders, employees or
agents (collectively S&P Parties) do not guarantee the accuracy, completeness, timeliness or availability of the Content. S&P Parties are not
responsible for any errors or omissions (negligent or otherwise), regardless of the cause, for the results obtained from the use of the Content, or for
the security or maintenance of any data input by the user. The Content is provided on an "as is" basis. S&P PARTIES DISCLAIM ANY AND ALL
EXPRESS OR IMPLIED WARRANTIES, INCLUDING, BUT NOT LIMITED TO, ANY WARRANTIES OF MERCHANTABILITY OR FITNESS FOR
A PARTICULAR PURPOSE OR USE, FREEDOM FROM BUGS, SOFTWARE ERRORS OR DEFECTS, THAT THE CONTENT'S FUNCTIONING
WILL BE UNINTERRUPTED, OR THAT THE CONTENT WILL OPERATE WITH ANY SOFTWARE OR HARDWARE CONFIGURATION. In no
event shall S&P Parties be liable to any party for any direct, indirect, incidental, exemplary, compensatory, punitive, special or consequential
damages, costs, expenses, legal fees, or losses (including, without limitation, lost income or lost profits and opportunity costs or losses caused by
negligence) in connection with any use of the Content even if advised of the possibility of such damages.
Copyright © 2013 by Standard & Poor's Financial Services LLC. All rights reserved.
WWW.STANDARDANDPOORS.COM/RATINGSDIRECT MAY 30, 2013 15
1138891 | 301135087