ISPI Energy Watch Geopolitics of energy Scuola Superiore Sant'Anna, Pisa – 24 April 2015 Matteo...
65
ISPI Energy Watch Geopolitics of energy Scuola Superiore Sant'Anna, Pisa – 24 April 2015 Matteo Verda Istituto per gli Studi di Politica Internazionale - Milano
-
Upload
kory-shepherd -
Category
Documents
-
view
217 -
download
3
Transcript of ISPI Energy Watch Geopolitics of energy Scuola Superiore Sant'Anna, Pisa – 24 April 2015 Matteo...

ISPI Energy Watch
Geopolitics of energy
Scuola Superiore Sant'Anna, Pisa – 24 April 2015
Matteo VerdaIstituto per gli Studi di Politica Internazionale - Milano

ISPI Energy Watch
CONTENTS
Introduction
Geopolitics of oilCase: North America
Case: Sovereign Wealth Funds
Geopolitics of natural gasCase: Europe and Russia
Geopolitics of other sources
Geopolitics of GHG emissions

ISPI Energy Watch
INTRO / BASICS
What is energy? Energy is the ability to do work.
Energy can be produced from a variety of sources.
Energy can be also transformed into other forms of energy.
The amount of energy we can use depends on the availability of technology and external inputs.
Geopolitics is politics (esp. relations between states) as influenced by geographical factors (OED).
Geopolitics of energy is based on the uneven distribution of energy sources, technology, and final consumption.

ISPI Energy Watch
Mtoe
INTRO / ENERGY CONSUMPTION
Source: elaboration on IEA.

ISPI Energy Watch
Mtoe
Source: elaboration on IEA.
INTRO / ENERGY MIX

ISPI Energy Watch
INTRO / ENERGY MIX, PER COUNTRY
Source: elaboration on IEA.

ISPI Energy Watch
INTRO / ENERGY SOURCES
SOURCE PRO CONTRA
coal - availability- costs
- local emissions- GHG emissions
oil - calorific value- existing stock of technology
- costs- GHG emissions- concentration of reserves
natural gas - costs- GHG emissions
- GHG emissions- concentration of reserves
nuclear- reliability of supply- GHG emissions- duality
- investment costs- dismantling costs- social issues
renewables - reliability of supply- GHG emissions
- costs- discontinuity of supply

ISPI Energy Watch
GEOPOLITICS OF OIL

ISPI Energy Watch
COUNTRYRESERVES(TH. MBBL)
SHARE Σ SHAREAREA(MKM2)
ENDOWMENT
(KBBL/KM2)
1 Venezuela 298,3 17,7% 17,7% 0,9 327,1
2 Saudi Arabia 265,9 15,8% 33,4% 2,1 123,7
3 Canada 174,3 10,3% 43,8% 10,0 17,5
4 Iran 157,0 9,3% 53,1% 1,6 95,3
5 Iraq 150,0 8,9% 61,9% 0,4 342,2
6 Kuwait 101,5 6,0% 68,0% 0,0 5.696,5
7 United Arab Emirates 97,8 5,8% 73,7% 0,1 1.169,9
8 Russian Federation 93,0 5,5% 79,3% 17,1 5,4
9 Libya 48,5 2,9% 82,1% 1,8 27,5
10 USA 44,2 2,6% 84,8% 9,8 4,5
World 1.687,9 136,4 12,4
OIL / RESERVES AND GEOGRAPHICAL DISTRIBUTION
Source: elaboration on BP and CIA.

ISPI Energy Watch
OIL / MAJOR PRODUCERS
Source: Eni.

ISPI Energy Watch
Kazakhstan
Iran
Canada
Norway
Qatar
Venezuela
Kuwait
UAE
Russia
Saudi Arabia
0 1 2 3 4 5 6 7 8 9
Source: elaboration on BP.
Mbbl/d
OIL / MAJOR EXPORTERS
The World Top 10 (2013)

ISPI Energy Watch
OIL / GLOBAL TRADE
Source: BP.

ISPI Energy Watch
OIL / MARITIME CHOKEPOINTS

ISPI Energy Watch
OIL / RESERVES DISTRIBUTION
Source: Eni.

ISPI Energy WatchSource: Eni.
OIL / YEARS OF PRODUCTION LEFT, PER COUNTRY

ISPI Energy WatchSource: Eni.
OIL / YEARS OF PRODUCTION LEFT, PER REGION

ISPI Energy Watch
OIL / RESERVES HOLDERS
Source: Eni.
Majors: Eni, BP, Repsol, Total, Shell, Chevron, ExxonMobil.

ISPI Energy WatchSource: Eni.
OIL / RESERVES HOLDERS PER REGION

ISPI Energy Watch
OIL / PRICE TRENDS
Brent Spot Price (USD/bbl), monthly average – Source: EIA.
$/bbl

ISPI Energy Watch
OIL / LONG-TERM PRICE TRENDS
Brent Spot Price, yearly average – Source: EIA and BP.
$/bbl

ISPI Energy Watch
CASE: NORTH AMERICA

ISPI Energy Watch
USA USA + Canada
Source: elaboration on BP and IEA.
OIL / AMERICAN TRENDS

ISPI Energy WatchSource: elaboration on IEA.
OIL / US IMPORTS
Mbbl/d

ISPI Energy Watch
CASE: ENERGY, ECONOMY AND POLITICAL
STABILITY

ISPI Energy WatchSource: elaboration on World Bank.
RENTS / DEPENDENCE ON EXPORT

ISPI Energy Watch
RENTS / ENERGY RENTS AND POLITICAL STABILITY
$/bbl
Source: elaboration on IMF and Deutsche Bank.

ISPI Energy Watch
RENTS / SOVEREIGN WEALTH FUND IN THE MENA REGION
FUND COUNTRYRESERVES
(BN$)
1 Abu Dhabi Investment Authority UAE 589
2 Kuwait Investment Authority Kuwait 548
3 Qatar Investment Authority Qatar 305
4 Saudi Arabian Monetary Agency Investment Portfolio Saudi Arabia 230
5 Abu Dhabi Investment Council UAE 90
6 International Petroleum Investment Company UAE 69
7 Mubadala Development Co. UAE 61
8 Libyan Investment Authority Libya 60
9 State General Reserve Fund of the Sultanate of Oman Oman 35
10 Emirates Investment Authority UAE 22
11 Oman Investment Fund Oman 17
12 Bahrain Mumtalakat Holding Company Bahrain 11
Source: elaboration on official statistics by Antonino Alì.

ISPI Energy Watch
GEOPOLITICS OF NATURAL GAS

ISPI Energy Watch
GEOPOLITICS OF NATURAL GAS
COUNTRYRESERVES
(TMC)SHARE Σ SHARE
AREA(MKM2)
ENDOWMENT
(MCM/KM2)
1 Iran 36,3 18,2% 18,2% 1,6 22,0
2 Russian Federation 33,5 16,8% 35,0% 17,1 2,0
3 Qatar 26,5 13,3% 48,3% 0,0 2.286,6
4 Turkmenistan 18,8 9,4% 57,7% 0,5 38,4
5 USA 10,0 5,0% 62,8% 9,8 1,0
6 Saudi Arabia 8,8 4,4% 67,2% 2,1 4,1
7 United Arab Emirates 6,5 3,3% 70,5% 0,1 78,2
8 Venezuela 6,0 3,0% 73,5% 0,9 6,6
9 Nigeria 5,5 2,7% 76,2% 0,9 5,9
10 Algeria 4,8 2,4% 78,6% 2,4 2,0
World 199,4 136,4 1,5
Source: elaboration on BP and CIA.

ISPI Energy WatchSource: Eni.
GAS / PRODUCERS

ISPI Energy WatchSource: Eni.
GAS / CONSUMERS

ISPI Energy WatchSource: Eni.
GAS / EXPORTERS

ISPI Energy WatchSource: Eni.
GAS / IMPORTERS

ISPI Energy WatchSource: BP.
GAS / TRADE FLOWS

ISPI Energy Watch
GAS / LIQUEFIED NATURAL GAS EXPORTS
Source: GIIGNL.

ISPI Energy Watch
GAS / REGIONAL MARKETS

ISPI Energy WatchSource: European Commission.
GAS / REGIONAL MARKETS AND PRICE TRENDS
$/MMBTU

ISPI Energy WatchSource: Eni.
GAS / RESERVES

ISPI Energy Watch
GAS / YEARS OF PRODUCTION LEFT, PER REGION
Source: Eni.

ISPI Energy WatchSource: Eni.
GAS / YEARS OF PRODUCTION LEFT, PER COUNTRY

ISPI Energy Watch
Majors: Eni, BP, Repsol, Total, Shell, Chevron, ExxonMobil.
Source: Eni.
GAS / RESERVES HOLDERS

ISPI Energy WatchSource: Eni.
GAS / RESERVES HOLDERS, PER REGION

ISPI Energy Watch
CASE:EUROPE AND RUSSIA

ISPI Energy Watch

ISPI Energy Watch
GAS / EU SUPPPLY
2014 – Source: elaboration on Eurostat.

ISPI Energy Watch

ISPI Energy Watch

ISPI Energy Watch
ISPI Energy Watch
Gazprom Export
Gazprom Export
Ukrainetransit
Ukrainetransit
transit/total
transit /total
Russian gas
/consump.2012 2013 2012 2013 2012 2013 2013
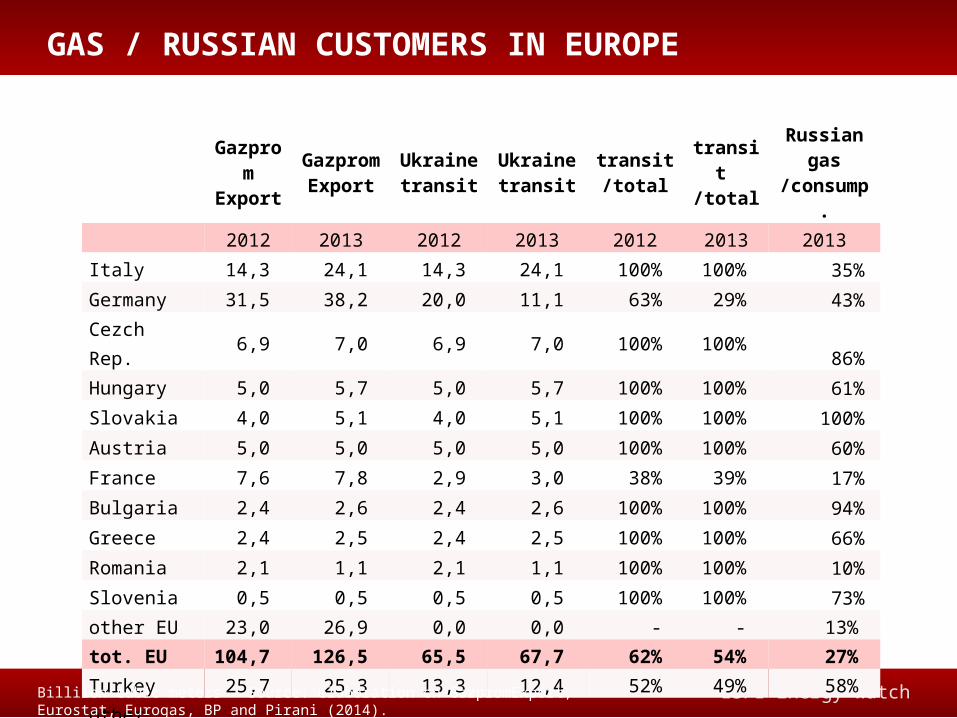
Italy 14,3 24,1 14,3 24,1 100% 100% 35%Germany 31,5 38,2 20,0 11,1 63% 29% 43%Cezch Rep. 6,9 7,0 6,9 7,0 100% 100% 86%Hungary 5,0 5,7 5,0 5,7 100% 100% 61%Slovakia 4,0 5,1 4,0 5,1 100% 100% 100%Austria 5,0 5,0 5,0 5,0 100% 100% 60%France 7,6 7,8 2,9 3,0 38% 39% 17%Bulgaria 2,4 2,6 2,4 2,6 100% 100% 94%Greece 2,4 2,5 2,4 2,5 100% 100% 66%Romania 2,1 1,1 2,1 1,1 100% 100% 10%Slovenia 0,5 0,5 0,5 0,5 100% 100% 73%other EU 23,0 26,9 0,0 0,0 - - 13%tot. EU 104,7 126,5 65,5 67,7 62% 54% 27%Turkey 25,7 25,3 13,3 12,4 52% 49% 58%other Europe 1,3 1,7 1,3 1,7 100% 100%tot. Europe 131,7 153,5 80,1 81,8 61% 53%
GAS / RUSSIAN CUSTOMERS IN EUROPE
Billiion cubic meters – Source: elaboration on GazpromExport, Eurostat, Eurogas, BP and Pirani (2014).

ISPI Energy Watch
Entry pointdaily max yearly max
(Mmc) (Bmc)
Ukrainian system 452 148Slovakia 281 92Romania 103 34Hungary 55 18Poland 12 4
Nord Stream Germany 160 53
Yamal-Europe Poland 102 34
Blue Stream Turkey 49 16
other Finland, Baltics 72 24
total 835 274
GAS / RUSSIAN EXPORT INFRASTRUCTURE
2014. Yearly max based on a 90% utilisation factor – Source: elaboration on ENTSOG.

ISPI Energy Watch
GAS / EU DEMAND DECLINE
Bcm
Source: elaboration on European Commission.

ISPI Energy Watch2014 – Source: UNCTAD, FT, IMF, BBC, EBRD.
RUSSIA / DEPENDENCE ON ENERGY PRODUCTION

ISPI Energy Watch
GEOPOLITICS OF OTHER SOURCES

ISPI Energy Watch
Mtoe
Source: elaboration on IEA.
NUCLEAR / CONSUMPTION

ISPI Energy Watch
NUCLEAR / STATUS OF NUCLEAR POWER PROGRAMMES
End-2013 – Source: IEA.

ISPI Energy WatchSource: elaboration on IEA.
COAL / CONSUMPTION
Mtoe

ISPI Energy WatchSource: elaboration on BP.
COAL / RESERVES
COUNTRYRESERVES
(MT)SHARE Σ SHARE P/R RATIO
1 USA 237.295 27% 27% 266
2 Russian Federation 157.010 18% 44% 452
3 China 114.500 13% 57% 31
4 Australia 76.400 9% 66% 160
5 India 60.600 7% 72% 100
6 EU 56.082 6% 79% 103
7 Ukraine 33.873 4% 83% 384
8 Kazakhstan 33.600 4% 86% 293
9 South Africa 30.156 3% 90% 117
10 Indonesia 28.017 3% 93% 67
World 891.531 113

ISPI Energy WatchSource: elaboration on IEA.
RENEWABLES / CONSUMPTION
Mtoe

ISPI Energy Watch
GEOPOLITICS OF GHG EMISSIONS

ISPI Energy WatchSource: elaboration on IEA.
GHG EMISSIONS / EXPECTED TRENDS
Mt CO2

ISPI Energy WatchSource: elaboration on IEA.
GHG EMISSIONS / EU AND THE REST OF THE WORLD

ISPI Energy WatchSource: elaboration on IEA.
GHG EMISSIONS / EU AND THE REST OF THE WORLD
Mt CO2

ISPI Energy Watch
GHG EMISSIONS / COP-21 COMMITMENTS
EU: 40% emission reduction commitment by 2030 compared to 1990.
China: peak of emissions in 2030, wihtout any quantitative commitment.
USA: 26-28% emission reduction commitment by 2025 compared to 2005.
India: no commitment on emissions; perspective increase of taxation on coal.
Russia: 25-30% emission reduction commitment by 2030 compared to 1990.
Japan: 20% emission reduction commitment by 2030 compared to 2005.

ISPI Energy Watch
Matteo VerdaIstituto per gli Studi di Politica Internazionale (ISPI) – Milano
mail: [email protected]
blog: www.sicurezzaenergetica.it
twitter: @matteoverda
linkedin: Linkedin.com/in/matteoverda
CONTACTS

ISPI Energy Watch