Isotope hydrology of southern Nevada groundwater:...
24
Isotope hydrology of southern Nevada groundwater: Stable isotopes and radiocarbon M. L. Davisson, D. K. Smith, J. Kenneally, and T. P. Rose Isotope Sciences Division, Lawrence Livermore National Laboratory, Livermore, California Abstract. A new 18 O map of southern Nevada groundwater shows a systematic decrease in 18 O of 5‰ from 36 to 39N latitude. The variation is consistent with higher-latitude recharge following continuous flow paths along north-south trending graben valleys and systematically increasing in 18 O due to mixing with lower-latitude, higher- 18 O recharge. The data do not suggest that large masses of groundwater with unusually low 18 O values were recharged during the last pluvial period as suggested by previous workers. Many 18 O-D pairs in groundwater indicate variable amounts of evaporation relative to the global meteoric water line. The precipitation rate and type (rain versus snow) for a given geographic area controls the extent of evaporation. A “model” 18 O value was calculated from evaporated groundwaters by subtracting postcloud evaporation. The distribution of these model 18 O values suggest new regional groundwater flow paths previously undocumented. Dissolved inorganic carbon in groundwaters collected from deep regional flow systems typically has low 14 C concentrations (12% modern carbon). In contrast, groundwaters collected from the carbonate rock of the Spring Mountains and alluvium of Forty Mile Canyon have higher 14 C contents, indicating more recent recharge. Because of nonlinear mixing of 14 C, groundwater in the regional flow system likely acquired most of its observable 14 C from mixtures of young, locally recharged groundwater. 1. Introduction Isotope measurements complement hydrogeologic observa- tions by providing direct evidence for groundwater sources and transport rates. This has been demonstrated for many simple groundwater flow systems [e.g., Stute et al., 1992; Ekwurzel et al., 1994]. However, as a flow system becomes more complex or more regional in extent, geochemical and isotopic data do not necessarily provide simple source and age interpretations. This is mainly due to (1) an increase in the number of recharge mixing end-members contributing to groundwater flow, which significantly complicates any groundwater age determination, (2) multiple water-rock reactions working simultaneously or at different times within the flow history, and (3) climate change and its effect on isotopic abundances. Interpreting isotopic data in regional groundwater flow systems requires an account- ability of all atmospheric, surface, and subsurface (unsaturated and saturated zones) environmental effects controlling their abundance. The data interpretations also must be consistent with hydrogeologic data. Regional groundwater flow in southern Nevada follows a complex system of interconnected, structurally controlled ba- sins incorporating multiple lithologies with both fracture and matrix dominated flow [Blankennagel and Weir, 1973; Winograd and Thordarson, 1975; Thomas et al., 1996]. Groundwater can flow for distances in excess of a hundred miles before it dis- charges [Harrill et al., 1988], originating in alpine recharge areas and transcending extreme desert-basin environments. Southern Nevada has been the focal point of many detailed investigations related to potential risk of radionuclide migra- tion from the Nevada Test Site (NTS; see work by Laczniak et al. [1996] for a review). The hydrogeologic framework estab- lished by Winograd and Thordarson [1975] designated northern boundaries of regional flow at 38N latitude. In contrast, other work [Eakin, 1966] recognized that recharge boundaries were further north for a similar system. However, later isotope hydrology and paleoclimate studies of groundwater [e.g., Claassen, 1986; White and Chuma, 1987; Winograd et al., 1988; Benson and Klieforth, 1989; Winograd et al., 1992; Thomas et al., 1996] mostly followed the hydrogeologic framework of Wino- grad and Thordarson [1975]. In this paper we have reevaluated these boundary conditions and some of the interpretations of interbasin flow. We present new isotopic data that extend north of 38N latitude and com- bine them with existing data for groundwater in southern Ne- vada. Our analysis shows evidence for new flow paths previ- ously undocumented. We furthermore suggest that almost all the groundwater isotopic variations observed can be explained by modern environmental conditions and groundwater mixing and that evidence of past climate preserved in the groundwater is limited only to areas of near closed-basin conditions. We suggest that these results have bearing on the interpretations for 18 O in the Devil’s Hole calcite. In addition, our analysis indicates that 14 C concentrations in regional groundwater are predominantly controlled by mixing and water-rock interac- tion, which limits the usefulness of age calculations. Finally, our study serves to emphasize that consistent and defensible interpretations of isotopic data in regional flow systems such as southern Nevada require consideration of the entire flow sys- tem, not just parts of it. 2. Background 2.1. Hydrogeologic Framework Structurally complex and geologically diverse rocks spanning Precambrian to Quaternary ages characterize the geology of This paper is not subject to U.S. copyright. Published in 1999 by the American Geophysical Union. Paper number 1998WR900040. WATER RESOURCES RESEARCH, VOL. 35, NO. 1, PAGES 279 –294, JANUARY 1999 279
Transcript of Isotope hydrology of southern Nevada groundwater:...

Isotope hydrology of southern Nevada groundwater:Stable isotopes and radiocarbon
M. L. Davisson, D. K. Smith, J. Kenneally, and T. P. RoseIsotope Sciences Division, Lawrence Livermore National Laboratory, Livermore, California
Abstract. A new !18O map of southern Nevada groundwater shows a systematic decreasein !18O of !5‰ from 36" to 39"N latitude. The variation is consistent with higher-latituderecharge following continuous flow paths along north-south trending graben valleys andsystematically increasing in !18O due to mixing with lower-latitude, higher-!18O recharge.The data do not suggest that large masses of groundwater with unusually low !18O valueswere recharged during the last pluvial period as suggested by previous workers. Many!18O-!D pairs in groundwater indicate variable amounts of evaporation relative to theglobal meteoric water line. The precipitation rate and type (rain versus snow) for a givengeographic area controls the extent of evaporation. A “model” !18O value was calculatedfrom evaporated groundwaters by subtracting postcloud evaporation. The distribution ofthese model !18O values suggest new regional groundwater flow paths previouslyundocumented. Dissolved inorganic carbon in groundwaters collected from deep regionalflow systems typically has low 14C concentrations ("12% modern carbon). In contrast,groundwaters collected from the carbonate rock of the Spring Mountains and alluvium ofForty Mile Canyon have higher 14C contents, indicating more recent recharge. Because ofnonlinear mixing of 14C, groundwater in the regional flow system likely acquired most ofits observable 14C from mixtures of young, locally recharged groundwater.
1. Introduction
Isotope measurements complement hydrogeologic observa-tions by providing direct evidence for groundwater sources andtransport rates. This has been demonstrated for many simplegroundwater flow systems [e.g., Stute et al., 1992; Ekwurzel etal., 1994]. However, as a flow system becomes more complex ormore regional in extent, geochemical and isotopic data do notnecessarily provide simple source and age interpretations. Thisis mainly due to (1) an increase in the number of rechargemixing end-members contributing to groundwater flow, whichsignificantly complicates any groundwater age determination,(2) multiple water-rock reactions working simultaneously or atdifferent times within the flow history, and (3) climate changeand its effect on isotopic abundances. Interpreting isotopicdata in regional groundwater flow systems requires an account-ability of all atmospheric, surface, and subsurface (unsaturatedand saturated zones) environmental effects controlling theirabundance. The data interpretations also must be consistentwith hydrogeologic data.
Regional groundwater flow in southern Nevada follows acomplex system of interconnected, structurally controlled ba-sins incorporating multiple lithologies with both fracture andmatrix dominated flow [Blankennagel and Weir, 1973; Winogradand Thordarson, 1975; Thomas et al., 1996]. Groundwater canflow for distances in excess of a hundred miles before it dis-charges [Harrill et al., 1988], originating in alpine rechargeareas and transcending extreme desert-basin environments.Southern Nevada has been the focal point of many detailedinvestigations related to potential risk of radionuclide migra-tion from the Nevada Test Site (NTS; see work by Laczniak et
al. [1996] for a review). The hydrogeologic framework estab-lished by Winograd and Thordarson [1975] designated northernboundaries of regional flow at !38"N latitude. In contrast,other work [Eakin, 1966] recognized that recharge boundarieswere further north for a similar system. However, later isotopehydrology and paleoclimate studies of groundwater [e.g.,Claassen, 1986; White and Chuma, 1987; Winograd et al., 1988;Benson and Klieforth, 1989; Winograd et al., 1992; Thomas et al.,1996] mostly followed the hydrogeologic framework of Wino-grad and Thordarson [1975].
In this paper we have reevaluated these boundary conditionsand some of the interpretations of interbasin flow. We presentnew isotopic data that extend north of 38"N latitude and com-bine them with existing data for groundwater in southern Ne-vada. Our analysis shows evidence for new flow paths previ-ously undocumented. We furthermore suggest that almost allthe groundwater isotopic variations observed can be explainedby modern environmental conditions and groundwater mixingand that evidence of past climate preserved in the groundwateris limited only to areas of near closed-basin conditions. Wesuggest that these results have bearing on the interpretationsfor !18O in the Devil’s Hole calcite. In addition, our analysisindicates that 14C concentrations in regional groundwater arepredominantly controlled by mixing and water-rock interac-tion, which limits the usefulness of age calculations. Finally,our study serves to emphasize that consistent and defensibleinterpretations of isotopic data in regional flow systems such assouthern Nevada require consideration of the entire flow sys-tem, not just parts of it.
2. Background2.1. Hydrogeologic Framework
Structurally complex and geologically diverse rocks spanningPrecambrian to Quaternary ages characterize the geology of
This paper is not subject to U.S. copyright. Published in 1999 by theAmerican Geophysical Union.
Paper number 1998WR900040.
WATER RESOURCES RESEARCH, VOL. 35, NO. 1, PAGES 279–294, JANUARY 1999
279

southern Nevada. Most of the sedimentary section is Precam-brian- to Paleozoic-age marine rock of the North Americanwestern Cordillera miogeocline [Stewart, 1980] (Figure 1a).Previous groundwater investigators have divided these rocksinto hydrostratigraphic units [Winograd and Thordarson, 1975](Figure 1b). The lower clastic aquitard forms the basal sectioncomprising mostly Precambrian- to lower Paleozoic-agequartzite of low transmissibility. Overlying at nearly equivalentthickness, the lower carbonate aquifer consists of higher trans-missibility limestones and dolomites of Paleozoic age. Thisaquifer is regional in extent and channels much of the regionalgroundwater flow in southern Nevada [Eakin, 1966; Winogradand Thordarson, 1975; Mifflin and Hess, 1979; Thomas et al.,1996; Dettinger et al., 1995].
Whereas Mesozoic-age rocks are poorly represented insouthern Nevada, thick sequences of Tertiary-age volcanic de-posits cover large areas of the lower carbonate aquifer. LateTertiary, poorly sorted alluvial fan deposits of poor consolida-tion overlay the volcanic rocks in graben valleys. Matrix-dominated groundwater flow is probable in the alluvium butlikely varies from matrix to fracture-dominated flow in thevolcanic rocks. The lower carbonate aquifer transports ground-water by fracture or solution-channel flow paths [Winograd andThordarson, 1975].
The topography in southern Nevada is marked by alternat-ing basins and ranges oriented roughly north–south, whichresulted from mid to late Tertiary crustal extension [Eaton,1982; Hamilton, 1987]. This topography causes local ground-water flow systems to be superimposed onto regional ground-water flow. Local groundwater flow is common in horst-blockranges and is characterized by zones of perched groundwaterand intermittent spring discharge [Winograd and Thordarson,1975]. The regional groundwater flow system in southern Ne-vada has been divided into at least four independent units: (1)the White River, (2) the Ash Meadows, (3) the Oasis Valley,and (4) the Las Vegas Valley groundwater basins. Recently,workers [Laczniak et al., 1996] have subdivided these basinsfurther, but we present our data in the context of the fouroriginal divisions for simplicity. Groundwater divides inferredfrom potentiometric data, lithostratigraphy, faults, and distri-bution of modern precipitation delineate these basins [Malm-berg, 1965; Eakin, 1966; Blankennagel and Weir, 1973; Winogradand Thordarson, 1975].
The White River and Ash Meadows groundwater systemsare underlain by continuous sections of the Lower CarbonateAquifer (Figure 1a). According to Eakin [1966], the WhiteRiver Basin is an interbasin flow system, whose inferred re-charge origin is as far north as Long Valley at 40"N latitude.Flow is thought to be laterally continuous southward until itterminates at the Muddy River area north of Lake Mead. Ofthe 104,000 acre-feet (128,300,000 m3) of annual estimatedrecharge, nearly 78% originates north of the Pahranagat Val-ley. Most of this groundwater discharges as natural springs inthe White River, Pahranagat, Kanes Springs, and Moapa val-leys.
Regional groundwater flow in the Ash Meadows flow systemis predominantly through the lower carbonate aquifer [Wino-grad and Thordarson, 1975]. Inferred recharge is from theSheep Range to the east, the Spring Mountains to the south,and the Belted, Timpahute, and Pahranagat ranges in thenorth. Groundwater discharge in the Ash Meadows systemoccurs in part at the Ash Meadows spring discharge zone in theeastern Amargosa Desert (Figure 1a). The surface or near-
surface exposure of the lower clastic aquitard has been used todenote basin boundaries in the Sheep Ranges, Spring Moun-tains, and Emigrant Valley [Winograd and Thordarson, 1975].Its absence in the northeast part of the basin, combined withstable isotope evidence, lead to the interpretation that ground-water flows through the lower carbonate aquifer from thePahranagat Valley into the Ash Meadows flow system [Wino-grad and Friedman, 1972]. The inferred western margin of thebasin extends from the Belted Range southward to the JackassFlats area.
To the west of this margin is the Oasis Valley (Forty MileCanyon) groundwater basin, described by Blankennagel andWeir [1973], which consists largely of thick Tertiary volcanicsequences hosting caldera complexes (Figure 1a). Calderas areringed fractures thought to downcut in excess of 13,000 feet(4000 m). The lower carbonate aquifer is not observed withinthe caldera areas but may lie deeply buried outside the ringfracture system. Southward flow through the caldera com-plexes is poorly understood. However, groundwater levels in-dicate that general subsurface flow is southwestward fromPahute Mesa toward the Amargosa Desert via Oasis Valley,Crater Flat, and western Jackass Flats. Up to 70% of thegroundwater beneath Pahute Mesa is probably through-flowfrom Kawich Valley and Gold Flat [Blankennagel and Weir,1973]. In these areas, regional groundwater flows through vol-canic rocks, but possible recharge sources further north fromthe lower carbonate aquifer have not been investigated.
Malmberg [1965] characterized the 3000 square mile (7800km2) Las Vegas Valley groundwater basin, which is boundedon the north by the southern Indian Springs and Three Lakesvalleys and on the south by northern Ivanpah valley (Figure1a). The aquifer system consists of a shallow, unconfined allu-vial layer overlying a thicker artesian alluvial aquifer. Beforegroundwater overdrafting in the basin, natural artesian dis-charge occurred over a 75 square mile (194 km2) region thatincluded the city of Las Vegas, Paradise Valley, and the TuleSprings areas. Predevelopment water levels indicated thatgroundwater recharges (!50,000 acre-feet (61,700,000 m3)) atthe high-elevation (6000–12,000 feet (1800–3600 m)), high-precipitation (#20 inches/yr (51 cm/yr)) areas of the SpringMountains and flows toward the eastern side of Las VegasValley [Malmberg, 1965].
2.2. Stable Isotope StudiesThe variation of !18O and !D values in natural waters is
governed by the temperature of water evaporation and con-densation, such that geographic variations are primarily con-trolled by differences in latitude and altitude [e.g., Epstein andMayeda, 1953; Craig, 1961; Dansgaard, 1964]. For example,rain-out effects during continental migration of storm tracksdepletes meteoric water of their heavy isotopes [e.g., Dans-gaard, 1964; Sheppard, 1986]. This has been documented insome detail for California and Nevada [Ingraham and Taylor,1991]. These stable isotope variations are preserved in shallowgroundwater environments [Ingraham and Taylor, 1991] andhave been used as tracers in regional groundwater flow systems[Gat, 1971], including areas of California [Davisson and Criss,1993; Criss and Davisson, 1996].
The global meteoric water line (MWL) of !D $ 8!18O % 10[Craig, 1961] reflects the isotopic abundance of water vaporcondensed under isotopic equilibrium at different tempera-tures. The slope and the y intercept (i.e., deuterium excess)result from kinetic isotope fractionation between water and
DAVISSON ET AL.: ISOTOPE HYDROLOGY280

water vapor over open ocean [Craig and Gordon, 1965]. Con-tinental surface water and shallow groundwater also undergoeskinetic isotope enrichment during evaporation and enrichesalong trajectories with slopes between 2.0 and 6.0 on a !D-!18O plot [Craig et al., 1963; Stewart, 1975; Barnes and Allison,1988]. This is particularly relavent in desert areas where shiftsin !18O-!D pairs away from the global MWL result from evap-
oration of raindrops and shallow groundwater during recharge[Gat, 1971; Friedman et al., 1962; Stewart, 1975; Allison et al.,1984; Barnes and Allison, 1988].
Previous work in Nevada showed that rainfall collected inthe Yucca Mountain area of southern Nevada defined a localMWL with the equation !D $ 6.6!18O & 7.2 [Benson andKlieforth, 1989]. However, when only snow samples were con-
Figure 1. Southern Nevada basin and range-style deformation forms graben basins that when intercon-nected transport groundwater southwards or across topographic divides. The White River and Ash Meadowsgroundwater basins transport groundwater through fracture flow in thick carbonate rocks. Tertiary-agevolcanic rocks transport regional flow through the Oasis Valley groundwater basin, although the influence ofcarbonate rocks in the subsurface are unknown. Also unknown is the extent to which groundwater rechargeoriginating in Central Nevada is transported into these groundwater basins.
281DAVISSON ET AL.: ISOTOPE HYDROLOGY

sidered, the local MWL was !D $ 8.0!18O % 8.9, almostidentical to the global MWL of Craig [1961]. Most of theprecipitation events in southern Nevada that conform to theglobal MWL have mean isotopic values of less than &9.0‰ in!18O and &60‰ in !D. Friedman et al. [1992] for desertregions of southeastern California observed a similar result.
Stable isotope values of modern precipitation in Nevadadecrease with increasing latitude and altitude [Sheppard, 1986;Ingraham et al., 1991]. Similar geographic variations have beenshown in !D values of hydrous minerals in weathered rocks[Taylor, 1974]. Different storm sources are also responsible forthese regional-scale isotopic variations, since winter stormsoriginating from the Pacific Ocean are isotopically depletedrelative to isotopically heavier summer storms from the Gulf ofCalifornia [Hale, 1974; Ingraham et al., 1991; Friedman et al.,1992].
Winograd and Friedman [1972] exploited the geographicvariation of stable isotopes in precipitation as a means ofquantifying groundwater recharge sources in the Ash Meadowsflow system. They found that groundwater from the Pahrana-gat Valley in the north had lighter deuterium values thangroundwater in the Sheep Range and Spring Mountains re-gions. From this observation they concluded that up to 35% ofthe groundwater discharge at Ash Meadows might be derivedfrom the Pahranagat Valley region of the White River ground-water basin. Most of the remaining 65% was inferred to orig-inate in the Spring Mountains and the Sheep Range (see Fig-ure 1a). One of the assumptions in this interpretation was thatstable isotope signatures in precipitation were constant overthe timescales of the groundwater flow from recharge to dis-charge. The authors recognized the need to test this assump-tion, which raised subsequent questions regarding the isotopicrecord of Quaternary pluvial period recharge in the regionalgroundwater flow system [Winograd et al., 1988].
2.3. Radiocarbon StudiesNumerous studies using 14C to age-date groundwater have
been published since the early 1960s (see work by Fontes andGardnier [1979] and Mook [1980] for reviews]. Most of theseworks focused on determining the sources and evolution ofdissolved inorganic carbon (DIC) in the groundwater in orderto correct apparent 14C ages. At least half of the carbon ingroundwater originates as soil zone CO2 produced by plantroot respiration or from decomposition of humic material[Pearson and Hanshaw, 1970], while the remaining carbon isfrom dissolution of carbonate minerals in the unsaturated andsaturated zones. Some exceptions have been reported [Mook,1980; Andrews et al., 1994; Rose and Davisson, 1996]. Thedistinctive !13C signatures between organic and inorganic car-bon (&25 to &12‰ for plants, &2 to %2‰ for marine car-bonates, and &12.0 to %2.0‰ for soil carbonates) have beenused to characterize sources of DIC and estimate their relativecontributions from water-rock reactions within the groundwa-ter environment, particularly during recharge [e.g., Deines etal., 1974]. This isotopic correction method has led to the de-velopment of isotopic mass balance approaches [Pearson andHanshaw, 1970; Mook, 1980], combined isotopic and aqueouschemical mass balance approaches [e.g., Fontes and Garnier,1979], and isotopic exchange models under open and closedconditions [e.g., Wigley, 1975]. These approaches are valid onlywhere the carbon sources are uniform and the groundwaterflow system is simple. A prerequisite for any groundwaterage-dating study is to identify recharge zones, flow paths, and
mixing zones before applying mass balance approaches for 14Ccorrections.
Previous studies of southern Nevada groundwater haveshown that apparent 14C ages typically are #10 kyr [Grove etal., 1969]. In addition, !13C measurements indicate significantwater-rock interaction in the lower carbonate aquifer [Wino-grad and Pearson, 1976], and carbon isotope evolution alongflow paths suggests both open and closed geochemical condi-tions [White and Chuma, 1987]. Furthermore, !13C values ofsoil CO2 and pedogenic carbonate decreased up to 8.0‰ withincreasing pCO2 content and elevation [Quade et al., 1989].This reduces the utility of 14C corrections that depend on anisotopic mass balance approach since the source input is vari-able.
In this report we identify young recharge contributing to theregional flow in southern Nevada, using a limited radiocarbondatabase. We also estimate general flow rates where ground-water flow paths are well established.
2.4. Paleoclimate StudiesConsiderable attention has been focused on climatic condi-
tions during pluvial periods in the Great Basin of the south-western United States [Smith and Street-Perrott, 1983; Spauld-ing et al., 1983]. The most striking evidence comes from thepast occurrence of large closed-basin lakes, in particular LakeBonneville and Lake Lahontan [Benson et al., 1990]. Theselakes existed as far south as 37"N in Nevada and even furthersouth in eastern California. Their existence required an in-creased flux of water into the Great Basin due to decreasedrates of evapotranspiration, increased annual precipitation,and/or intensified snowmelt runoff.
Claassen [1986] observed that groundwaters in the alluvialand tuff aquifers of the eastern Amargosa Desert showed adecrease in !18O with increasing model radiocarbon age. Heinterpreted the lower !18O values to be pluvial period ground-water recharged !17–10 kyr ago during a colder climate. Whiteand Chuma [1987] observed similar stable isotope variations inthe Oasis Valley but concluded that some groundwater floworiginated from Pahute Mesa where elevation and tempera-tures effects could account for the lower stable isotope signa-tures. They further suggested that the persistent 5 per mildepletion in the deuterium excess of these groundwaters rela-tive to the global MWL was due to increased marine humidityin storm source regions. Benson and Klieforth [1989] followedwith a study of stable isotopes and uncorrected 14C ages ofgroundwater under Yucca Mountain. They concurred with theinterpretations of Claassen [1986] and suggested that the re-charge was synchronous with highstands of Lake Lahontan ofnorthern Nevada. However, they also acknowledged thatgroundwater under Yucca Mt. could be a mixture of localrecharge from Forty Mile Canyon and regional flow from as faraway as Pahute Mesa. It should be noted that the study area ofClaassen [1986] is directly downgradient of Yucca Mountain,and that mixing of local and regional groundwater sources areequally valid for his area. In short, these paleoclimate studiesassumed that groundwater with lower !18O values that aredepleted relative to modern local precipitation must have re-sulted from pluvial period recharge during cooler, climaticconditions.
Evidence for pluvial period vegetation patterns in the GreatBasin have been gathered from pollen records and plant re-mains found in fossilized packrat middens [Martin and Me-hringer, 1965; Spaulding et al., 1983]. The occurrence of differ-
DAVISSON ET AL.: ISOTOPE HYDROLOGY282

ent types of plant remains coupled with radiocarbon dates hasprovided direct evidence for moisture and temperature re-gimes [Spaulding et al., 1983]. The Sonoran and Mojave desertsof southern California, Nevada, and Arizona experienced dra-matic shifts in plant types during the Late Wisconsin period. Atabout 18 ka fossils suggest dry conditions and that winterprecipitation was an important moisture source during theglacial maximum. From !12–8 ka, fossils suggest increasedtemperatures and precipitation rates from southern summerstorms [see Spaulding and Graumlich, 1986]. This paleoclimaticscenario is the opposite of those of Claassen [1986], White andChuma [1987], and Benson and Klieforth [1989], suggestinginstead low precipitation rates during the glacial maximumfollowed by higher rates in the Late Pleistocene to Early Ho-locene. If this latter period was warmer and wetter, then itshould contribute to a higher !18O signature for any ground-water recharge.
Measurements of layered carbonate precipitated fromgroundwater in Devil’s Hole of Ash Meadows records varia-tions in the !18O and !13C of groundwater over the past !500kyr [Winograd et al., 1988; Winograd et al., 1992; Coplen et al.,1994]. The last 50 kyr of the record are absent. Nevertheless,these stable isotope records vary approximately 2‰ in !18Oand 1.5‰ in !13C, with the highest !18O values correlatingwith the lowest !13C. Winograd et al. [1988] correlated !18Omaxima in the Devil’s Hole core with stage II and stage IIImaxima in the marine record and the Vostok Antarctic icecores and concluded that the Devil’s Hole !18O variations werecaused by changes in global temperature. Likewise, the co-variations in !13C in the Devil’s Hole data were hypothesizedto reflect changes in the density of vegetation in the ground-water recharge areas [Coplen et al., 1994]. The Devil’s Holestudies are set apart from the other groundwater paleoclimatestudies in that the carbonate layers record information on amuch longer time scale and provide no direct evidence forclimate in this region over the past 50 kyr.
3. Analytical MethodsThis report combines existing isotopic data with new data
generated at the Isotope Sciences Division of Lawrence Liv-ermore National Laboratory (LLNL) and is compiled by Roseet al. [1997]. The existing data incorporates up to 30 years ofstable isotope and radiocarbon analyses.
Almost half the LLNL samples were collected from pumpedwells flushed for an appropriate length of time. Samples werecollected from the main pump discharge or from water qualitysampling taps. For the remaining well samples, groundwaterswere collected from open holes, equipped with a cover, usingevacuated stainless steel bailers (!2 L total volume) vacuumsealed to a wireline tool. Additional samples were collectedfrom flowing water at spring discharge areas. Field measure-ments for pH, temperature, and conductivity were measuredwith standard electronic instruments.
Samples collected for stable isotopes of 18O and deuteriumwere collected untreated in 15–50 mL glass bottles with poly-seal caps to prevent evaporation and were analyzed using theCO2 equilibration method [Epstein and Mayeda, 1953] and thezinc-reduction method [Coleman et al., 1982] followed by anal-ysis on an isotope ratio mass spectrometer. All stable isotopedata are reported in the usual ! notation, where ! $ (R/RSTD
& 1)1000, R represents either the 18O/16O, D/H , or 13C/12Cratio of the sample, and RSTD is the isotope ratio of the
SMOW (standard mean ocean water) or PDB (Pee Dee Be-lemnite) standard.
Samples for 13C and 14C were collected in a glass bottle(50–1000 mL) with either a polyseal cap or a Teflon-linedrubber septa cap to prevent exchange with atmospheric CO2.Approximately four drops of a saturated HgCl2 solution wereadded as a preservative, and most samples were kept refriger-ated until analysis. The inorganic carbon was acid strippedunder high vacuum and purged with an ultrapure carrier gas[Davisson and Velsko, 1994] in a manner similar to methods ofMcNichol et al. [1994]. The liberated CO2 was then reduced tographite on a separate vacuum line using a cobalt catalyst andhydrogen gas at a 570"C reaction temperature. All 14C con-centrations were determined on the accelerator mass spec-trometer at LLNL. The 14C results are reported as a percent ofmodern carbon (pmc) relative to a NBS oxalic acid standard[Stuiver and Polach, 1977]. Apparent ages are calculated usinga half-life of 5730 years [Walker et al., 1989]. All data presentedin subsequent figures and by Rose et al. [1997] are uncorrectedpmc values.
4. Results and Discussion4.1. Regional Groundwater !18O Variations
A !18O contour map of southern Nevada groundwater showsa 5.0‰ variation between latitudes 36" and 39"N (Figure 2).The !18O values average around &16.0‰ east–west acrossNevada at 39"N, although a single sample with this value wasobserved as far south as Cactus Flat (!37.5"N latitude).Groundwater between &15.0 and &16.0‰ was measured asfar south as northern Pahranagat Valley (37"45'N) and PahuteMesa (37"15'N); !18O values less than &14.0‰ occur west oflongitude !116"W and north of 37"N. The &14.0 contour at!116"W roughly parallels the western terminus of the lowercarbonate aquifer as delineated by Mifflin and Hess [1979]. Ingeneral, a good correlation exists between increasing latitudeand decreasing !18O values in accord with previous studies inthis region [e.g., Sheppard, 1986; Taylor, 1974].
In the Spring Mountains northwest of Las Vegas, !18O val-ues decrease with increasing elevation, which is consistent withwell-known altitude effects [e.g., Dansgaard, 1964; Smith et al.,1979; Ingraham and Taylor, 1991]. Springs and surface runofffrom high elevations in the Spring Mountains are consistently"&14.0‰ and contrast higher !18O values observed at lowerelevations in this region. The exception is &14.0‰ groundwa-ter that occurs in the natural artesian areas of Las VegasValley. The isotopic similarity between this artesian dischargearea and springs in the Spring Mountains recharge area sup-ports the earlier hydrologic interpretations of Malmberg [1965].
In the White Pine Range, west of the White River Valley,!18O values increase with elevation, in an apparent reversal ofthe altitude effect. A similar effect is observed in the Pintwater,Groom, and Sheep Ranges. Samples from higher altitudes arefrom shallow wells and springs and represent groundwater inlocal flow systems. Samples collected in the adjacent valleys arefrom alluvium or deeper aquifer units that are part of regionalflow systems. This latter groundwater has a lower !18O and islikely transported from higher latitudes.
An isolated pocket of groundwater with !18O values#&13.0‰ occurs in Forty Mile Canyon (37"N, 116.3"W; Fig-ure 1a). These values are higher than groundwater measuredin the adjacent areas of Crater Flat and Jackass Flats and aresimilar to modern precipitation measured by Benson and Klie-
283DAVISSON ET AL.: ISOTOPE HYDROLOGY

forth [1989]. This suggests that groundwater in Forty MileCanyon is locally recharged [Blankennagel and Weir, 1973;White and Chuma, 1987]. It has previously been suggested thatthe lower !18O values in the Crater Flat and Jackass Flats areasrepresent Late Wisconsin–age paleowaters that were re-charged during cooler climatic conditions [Claassen, 1986;White and Chuma, 1987]. However, it is equally plausible that
they represent groundwater that has been transported alongregional flow paths from recharge areas much further north.The high elevation mountains of central Nevada (!39"N lati-tude) receive relatively large amounts of annual precipitationduring the cold winter months. Spring snowmelt in these areasprovides a critical source of recharge to the regional flowsystem with the necessary hydrologic head to maintain south-
Figure 2. The !18O values measured in groundwater of southern Nevada show regular decreases withincreasing latitude, illustrated by prominent “plumes” of depleted !18O values extending southward fromcentral Nevada. The !18O decrease locally with increasing elevation. The exception is in the White PineRange, which shows a reversal of the !18O-elevation effect. Circles indicate sample locations, where solidcircles are samples that plot to the right of the MWL and open circles generally surround the MWL (seeFigures 3a and 3b).
DAVISSON ET AL.: ISOTOPE HYDROLOGY284

ward flow. Furthermore, with the exception of the White Riverflow system, the hydrologic connection between central Ne-vada recharge areas and the NTS has largely been unexplored.The geographic continuity of groundwater with low !18O val-ues from central Nevada to the NTS (see Figure 2) suggests ahydrologic interconnection that is consistent with interpreta-tions from previous hydrogeologic work in this region [Blan-kennagel and Weir, 1973]. In particular, the contours have beendrawn to suggest that low !18O values are continuous betweenRailroad Valley groundwater and Pahute Mesa. Although ourdata are limited in regions connecting these two areas, wejustify the contouring by citing data from Roth and Campana[1989]. They report !D values to as low as &118‰ for ground-water south of Railroad Valley.
4.2. !D-!18O Evaporation EffectsMany of the southern Nevada groundwaters have isotopic
values that plot to the right of the global MWL on a !D-!18Oplot (Figures 3a and 3b). The main exceptions are groundwaterin Las Vegas Valley, the southern Sheep Range, southernThree Lakes Valley, and the Spring Mountains (also see Fig-ure 2), all areas which encompass the Las Vegas Valleygroundwater basin. Modern precipitation in Las Vegas Valleyand southeastern California that have !18O values less than&9.0‰ generally adheres to the global MWL [Benson andKlieforth, 1989; Friedman et al., 1992]. In light of this fact, it isnotable that many other groundwaters in southern Nevadawith !18O values (&9.0‰ plot to the right of the global MWL(Figures 3a and 3b), most notably groundwaters in the AshMeadows, Oasis Valley, and White River groundwater basins.
Two explanations have been considered for the shifts awayfrom the MWL. White and Chuma [1987] proposed thatgroundwater in Oasis Valley and Jackass Flats originated frompluvial period recharge events (i.e., 10–18 kyr), whose mois-ture sources were developed under different conditions (high-er humidity) than present day precipitation. This interpreta-tion implies that the local MWL for southern Nevada changedovertime. This interpretation originated from the model ofMerlivat and Jouzel [1979], who suggested that the deuterium
excess of the global MWL decreases during maximum glacia-tion, and the MWL described by Pleistocene-age groundwatershould therefore reflect this shift. We rule this out as a majorcontrol because groundwaters that are isotopically shifted fromthe global MWL show a geographic dependence that does notcorrelate to age information gleaned from radiocarbon datapresented later in this paper.
An alternative explanation for the shift is the process ofevaporation. This includes evaporation of raindrops on theirdescent to the ground [Friedman et al., 1962], a phenomenonwell documented in semiarid to arid regions [Gat and Dans-gaard, 1972]. In addition, evaporation of surface runoff andshallow groundwater can also occur [e.g., Gat and Dansgaard,1972; Allison et al., 1984; Ingraham and Taylor, 1991]. A lessdocumented, but potentially significant process is the isotopicenrichment that occurs in aging winter snowpack during re-crystallization and partial melting [Friedman et al., 1991].
Most precipitation derived from maritime sources has iso-topic values that lie along the global MWL [Craig, 1961; Craigand Gordon, 1965; Gat and Carmi, 1970]. This has been ob-served in precipitation derived from the Pacific Ocean, theGulf of Mexico, and the Gulf of California [Ingraham andTaylor, 1991; Friedman et al., 1992; Davisson and Criss, 1993;Cortes and Farvolden, 1989; Benson and Klieforth, 1989], areasrelevant to our discussion. On the basis of results from Bensonand Klieforth [1989], it is reasonable to assume that snowfall incentral Nevada also adheres to the global MWL, since vaporexchange has a negligible affect on snowfall. The first-orderconclusion from Figures 3a and 3b is that the difference in thedeuterium excess between groundwater and precipitation re-sults from evaporation effects.
Recall that most stable isotope values of groundwater in theLas Vegas Valley basin adhere to the global MWL, whilegroundwaters in the Ash Meadows, Oasis Valley, and WhiteRiver groundwater basins lie to the right of the MWL (Figures3a and 3b). Fundamental differences between the Las VegasValley groundwater basin and the other basins include (1) theprecipitation rates in the recharge areas, (2) the size of therecharge areas, and (3) the length of groundwater flow paths.
Figure 3. Groundwater !D-!18O values typically plot to the right of the global meteoric water line(GMWL), with the exception of most in the Las Vegas Valley groundwater basin. The high-precipitationregion of the Spring Mountains recharges this basin, which shows little evidence for postprecipitation evap-oration. See sample locations in Figure 2.
285DAVISSON ET AL.: ISOTOPE HYDROLOGY

The main recharge area of the Las Vegas Valley basin is theSpring Mountains [Malmberg, 1965], which seasonally averages#20 inches (51 cm) of precipitation, mostly as snow. In the AshMeadows, Oasis Valley, and White River basins recharge isderived over a broad area where precipitation rates typicallyaverage between 6 and 18 inches (15 and 45 cm) per year(Figure 4). The deuterium shift in these latter basins correlatesto their lower precipitation rates and is similar to geographic/orographic variations in deuterium excess observed in Israel[Gat and Dansgaard, 1972]. Most groundwater in Las VegasValley flows under confined and artesian conditions along rel-atively short flow paths. In contrast, groundwater in the largerregional flow systems ranges from confined to unconfined, inmany cases is not under artesian conditions, and has flowcomponents that have been transported over distances in ex-cess of 100 miles [Eakin, 1966; Blankennagel and Weir, 1973;Winograd and Thordarson, 1975]. Therefore, in the case of theLas Vegas Valley groundwaters, high precipitation rates, rapidrecharge, and near confined aquifer conditions may limit thepostsnowmelt evaporation.
4.3. Regional Groundwater Model !18O VariationsThe !18O variation in Figure 2 results from two different
effects: (1) geographic variations in !18O of annual precipita-tion and (2) subsequent evaporation effects, whose extent also
varies geographically. If we make the assumption that allgroundwater in southern Nevada originated as precipitationthat initially conformed to the global MWL, then we can cor-rect the isotopic values for postcloud evaporation effects. Wecan accomplish this by projecting the evaporated data pointsback to the global meteoric water line along a constant slope of3.5 on a !D-!18O plot. The slope of 3.5 was selected to repre-sent an approximate average value for evaporation trajectoriesin surface and groundwaters in arid environments [e.g., Craig etal., 1963; Barnes and Allison, 1988]. We acknowledge that thisslope can vary depending on temperature, humidity, moisturecontent of the soil, and depth to water [Craig et al., 1963;Stewart, 1975; Barnes and Allison, 1988]. The basis for thecorrection is an attempt to benchmark geographic variations inthe !18O values as they reflect different moisture sources only.The benchmarking is achieved by assuming that all isotopicdata originated on the MWL and meet the condition
!D $ 8!18O % 10
and that the applied isotopic correction is simply the differencein measured values and the pre-evaporated values,
!m$3.5 $ !m & )!,
Figure 4. Isohyetal map of southern Nevada shows that the high elevations of central Nevada receive asignificant amount of precipitation available for groundwater recharge and is a plausible origin for much ofthe low-!18O groundwater observed in southern Nevada. Map is from Lamke and Moore [1965].
DAVISSON ET AL.: ISOTOPE HYDROLOGY286

where !m$3.5 is the model isotopic value corrected along aslope of 3.5 and !m is the measured value. Since the followingcondition must also be met,
)!D $ 3.5 )!18O
a correction formula can easily be derived for pre-evaporation!18O values:
!18Om$3.5 $ !18Om & [(8!18Om % 10) & !Dm]0.22
The geographic distribution of these model !18O values (shownon a contour map in Figure 5) differs from actual values of Figure
2 in minor ways. The model !18O values are more depleted thanactual values, particularly in the northern region. These low !18Ovalues reflect unevaporated mean annual precipitation, althoughmany values have a high uncertainty since exact evaporationslopes are not known. The amount of uncertainty is a function ofthe length of the correction line for a particular point. Neverthe-less, relative differences among the model !18O values are in-structive and provide further insight.
The largest difference between Figures 2 and 5 is in thenorthwestern part of southern Nevada, where much lowermodel !18O values occur in the groundwater of Gold and
Figure 5. These model !18O values were derived by projecting measured !D and !18O values back to theMWL along a theoretical evaporation slope of 3.5. Although the uncertainty in these model !18O values canbe high, they do represent relative differences in isotopic values of precipitation before postcloud evaporation.The !18O patterns in this map reinforce interpretations derived from Figure 2.
287DAVISSON ET AL.: ISOTOPE HYDROLOGY

Cactus Flats. Note that the single sample of &16.0‰ in CactusFlat (!37.5"N latitude) from Figure 2 is now approximately&18.0‰ but still does not conform spatially to adjacentgroundwaters in Figure 5. This will be discussed further in alater section. The model values in groundwater beneath north-western Pahute Mesa are similar to Gold and Cactus Flats,while actual !18O values (Figure 2) suggest a similarity toKawich Valley. Groundwater flow from both these areas havebeen previously suggested [Blankennagel and Weir, 1973]. Notethat a component of this low !18O groundwater plume contin-ues southward into eastern Amargosa desert where it meetsthe higher !18O groundwaters of the Ash Meadows dischargearea.
The &17.0‰ groundwater in Figure 5 represents one mix-ing end-member for groundwater recharge in the northernWhite River groundwater basin. Groundwater !18O valuesprogressively increase toward the south, reaching values#&14.0‰ because of mixing with local groundwater withhigher !18O values. In the White River groundwater basin thispattern is confined to a strip less than 50 miles (80 km) widethat terminates in Pahranagat Valley. This distribution is con-sistent with conclusions of Eakin [1966], who showed that in-terbasin flow is confined to a narrow strip from the LongValley in the north to the Moapa Valley in the south. A similarplume of low !18O groundwater stretches from north of Emi-grant Valley to eastern Yucca and Frenchman Flats. Theseplumes are separated by a region of higher !18O values thatextends from the southern Sheep Range north-northeast to theGrant Range at approximately 38"N. Note also that the reverse!18O-elevation trend in the White Pine Range seen in Figure2 no longer exists in Figure 5.
The model !18O values of Figure 5 tend to accentuate fea-tures observed in Figure 2. In particular, the model !18O valuesemphasize the fact that low-!18O groundwater migrates southfrom interbasin flow and strongly contrasts with higher-!18Ovalues in groundwater derived from local precipitation such asthe Sheep Ranges.
Winograd and Friedman [1972] suggested that the stableisotope signatures in the Ash Meadows discharge area could bemodeled as a mixture of groundwater from the PahranagatValley area with groundwater from the Spring Mountains. Forthis interpretation to be correct, it would require groundwaterfrom the Pahranagat Valley to flow southwesterly beneath thewestern boundary of the White River basin. The ridge ofhigher !18O values west of the Pahranagat Valley, observed inFigures 2 and 5, do not support this hypothesis, although sam-ples from prominent basins such as Tikaboo Valley are lacking.
On the basis of the available data, a more consistent hypoth-esis is that low-!18O groundwater from the Railroad Valleyarea flows south through Emigrant Valley and eastern Yuccaand Frenchman Flats. This interpretation requires a continu-ous flow path from Railroad Valley through the lower clasticaquitard on the southern side of Emigrant Valley. Alterna-tively, low-!18O groundwater flowing south from the PahuteMesa area through the caldera complexes could provide thelower-!18O component to the Ash Meadows springwaters. Onthe basis of the distribution of groundwater isotopic composi-tions in Figures 2 and 5, the two latter hypothesis for sourcesof lower-!18O groundwater in the Ash Meadow spring watersare more plausible than underflow from Pahranagat Valley.
Finally, it should be noted that zones of low annual precip-itation dominate much of southern Nevada (Figure 4). Manyof these areas have precipitation rates below 10 inches (25 cm)
per year, and local recharge is therefore limited. As a result,most of the groundwater in these arid regions is probablyderived from higher-precipitation areas in central Nevadawhere stable isotope values are more depleted.
4.4. Timing of Groundwater Flow
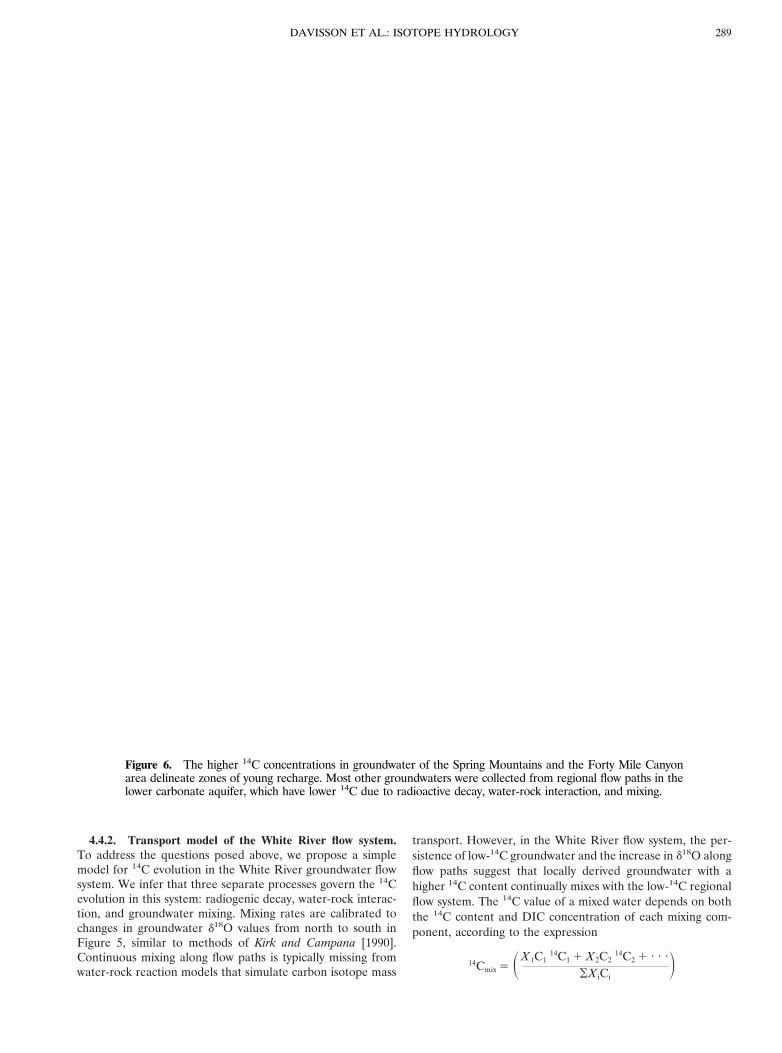
4.4.1. Distribution of 14C data. A large radiocarbon database exists for groundwaters in southern Nevada (Figure 6).However, the available data is densely clustered in localizedareas around the Spring Mountains and Las Vegas Valley, theAsh Meadows discharge area, the NTS, and Pahranagat Val-ley. Data are limited in the White River flow system and absentin its recharge areas. There is essentially no data available fromareas where most of the low-!18O recharge is inferred to occur.The majority of available data represent groundwater in theLower Carbonate Aquifer with the exception of those samplesfrom immediately north of the NTS, under Pahute Mesa and inthe Oasis Valley. Contour lines in Figure 6 distinguish between14C values #25 pmc and those (25 pmc, except in the SpringMountains and the Forty Mile Canyon region where contoursfor 50 and 75 pmc are also included. In the Spring Mountainsthe 14C values systematically increase with elevation, showingthe significant loading of modern recharge at high elevations inthis area. A similar pattern occurs in the Forty Mile Canyonregion. These data highlight the value of 14C measurements fordistinguishing recharge areas in southern Nevada. Note thegeneral correlation between high-14C contents of groundwaterin Figure 6 and high precipitation rates in Figure 4.
There are also isolated cases of high-14C groundwater in thePahranagat Valley spring discharge area, in springs from east-ern Cactus Flat, and in Oasis Valley (Figure 6). These partic-ular cases are groundwater that is extensively evaporated (seeFigures 2 and 5), and higher 14C concentrations likely resultfrom exchange with atmospheric CO2 [e.g., White and Chuma,1987]. One exception is a groundwater sample from a well(WT-3 of Rose et al. [1997]) northeast of the NTS that showsno evaporative signature in its stable isotopes but has a 14Cvalue of 27 pmc. Another exception is well U12s on PahuteMesa (not shown on map), which is a shallow emplacementhole completed in granitic rock. It has a 100 pmc 14C contentand a !18O value of local precipitation (&12.6‰). Most re-maining groundwater samples have very low 14C values that liebetween (1 to 12 pmc, and most of these occur in the LowerCarbonate Aquifer.
Groundwater in the northern part of the White Rivergroundwater basin has 14C values between 2 and 14 pmc (Fig-ure 6). Given that this area is presumably close to the rechargeareas for this basin, these 14C values appear to be unusuallylow. Groundwater further south in the White River basin has14C values between 6 and 11 pmc, with the exception of thehighly evaporated waters. Therefore we do not observe a sys-tematic decrease in the 14C concentration of groundwater go-ing from recharge to discharge areas of this basin, even thoughthe !18O values clearly show southerly interbasin flow (e.g.,Figure 5). The lack of a systematic decrease in the 14C alongthese flow paths suggests an unaccounted for complexity, andtwo questions arise from this observation: (1) Why are the 14Cvalues low near the recharge areas of the White River flowsystem?, and (2) Why do the 14C values remain essentiallyconstant along its subsequent flow to the Pahranagat Valleysprings discharge area?
DAVISSON ET AL.: ISOTOPE HYDROLOGY288
4.4.2. Transport model of the White River flow system.To address the questions posed above, we propose a simplemodel for 14C evolution in the White River groundwater flowsystem. We infer that three separate processes govern the 14Cevolution in this system: radiogenic decay, water-rock interac-tion, and groundwater mixing. Mixing rates are calibrated tochanges in groundwater !18O values from north to south inFigure 5, similar to methods of Kirk and Campana [1990].Continuous mixing along flow paths is typically missing fromwater-rock reaction models that simulate carbon isotope mass
transport. However, in the White River flow system, the per-sistence of low-14C groundwater and the increase in !18O alongflow paths suggest that locally derived groundwater with ahigher 14C content continually mixes with the low-14C regionalflow system. The 14C value of a mixed water depends on boththe 14C content and DIC concentration of each mixing com-ponent, according to the expression
14Cmix $ !X1C114C1 % X2C2
14C2 % · · ·¥X iCi
"
Figure 6. The higher 14C concentrations in groundwater of the Spring Mountains and the Forty Mile Canyonarea delineate zones of young recharge. Most other groundwaters were collected from regional flow paths in thelower carbonate aquifer, which have lower 14C due to radioactive decay, water-rock interaction, and mixing.
289DAVISSON ET AL.: ISOTOPE HYDROLOGY
where Ci is the inorganic carbon concentration, and X i is thefraction of each mixing end-member. Mixing between waterswith similar DIC concentrations and different 14C contents isnonlinear, resulting in calculated 14C ages biased towardyounger end-members.
For our model we assume groundwater flow occurs understeady state conditions and has a uniform velocity along a flowpath from Long Valley to the Pahranagat Valley Springs dis-charge area. The remainder of the flow system south of Pahr-anagat Valley is not included in this model. The total geo-graphic area is estimated at 5900 square miles (15,300 km2,!78% of total basin area) with an average aquifer thickness of3000 feet (900 m). Total annual groundwater flow is 81,120acre-feet (100,100,000 m3), or 78% of the total 104,000 acre-feet (128,300,000 m3) as suggested by Eakin [1966]. We assumea 7% average effective porosity. Drill cores from the AshMeadows flow system suggested a similar porosity for thelower carbonate aquifer, although effective fracture porositymay be a fraction of 1% [Winograd and Thordarson, 1975, pp.C17, C28]. Nevertheless, if 7% porosity is used as an upperlimit, then the groundwater flow rate is estimated to be !10kyr along the path length of !310 km, or 31 m/yr. This rate isconsistent with previous estimates for the lower carbonateaquifer [Winograd and Thordarson, 1975].
The reaction rate of the groundwater DIC with the lowercarbonate aquifer is a function of the surface area, grain size,and water chemistry. In a fracture flow system the surface areawill be a function of fracture aperture. In simplifying this prob-lem, we assume that fractures have the shape of a circularcapillary whose surface area is a function of its radius. If theradius is 2.5 mm for instance, then the total surface area of thepore space would be 7.8 * 1018 cm2.
We assume that the initial 14C content in the upper mostpart of the flow system is 80 pmc. No data are available for therecharge areas, which likely comprise carbonate rocks sur-rounding Long Valley. However, the use of 80 pmc is consis-tent with observed 14C content of high-elevation recharge inthe Spring Mountains (Figure 6) and with methods of Vogel[1970]. We also assume a constant DIC concentration alongthe flow path. Detailed analysis of the DIC and !13C along thisgroundwater flow may reveal variable calcite/dolomite satura-tion conditions that result in precipitation and dissolution re-actions [e.g., Thomas et al., 1996]. Because of our limited datafor this part of the flow system, we assume the entire flow pathundergoes a simultaneous dissolution-precipitation reaction,resulting in no net gain or loss of DIC over the entire flow pathlength. Therefore a fixed amount of carbonate rock must dis-solve into solution in order to reduce the dissolved 14C from 80to 7 pmc between the recharge areas and the northern mostdata point in Figure 6 (!60 miles, or 97 km).
In order to introduce mixing, we divided the flow system intothree equal lengths from the top of Long Valley to the Pahr-anagat Springs discharge area. Note that the !18O contours of&17.0, &16.0, and &15.0 in Figure 5 approximately correspondto these three equal divisions. We assume that no change in!18O occurs in the first third, since much of the recharge areasbetween 39" and 40"N latitude have !18O values around&17.0‰. However, we introduce a local mixing component of&17.0 in the upper third of the flow system for purposes ofmodeling the 14C change. The change in the !18O values in thesecond and third part of the flow system suggests a constantmixing rate of local recharge. We assume that the local ground-water recharge has a !18O value of &14.5‰ in the mid region
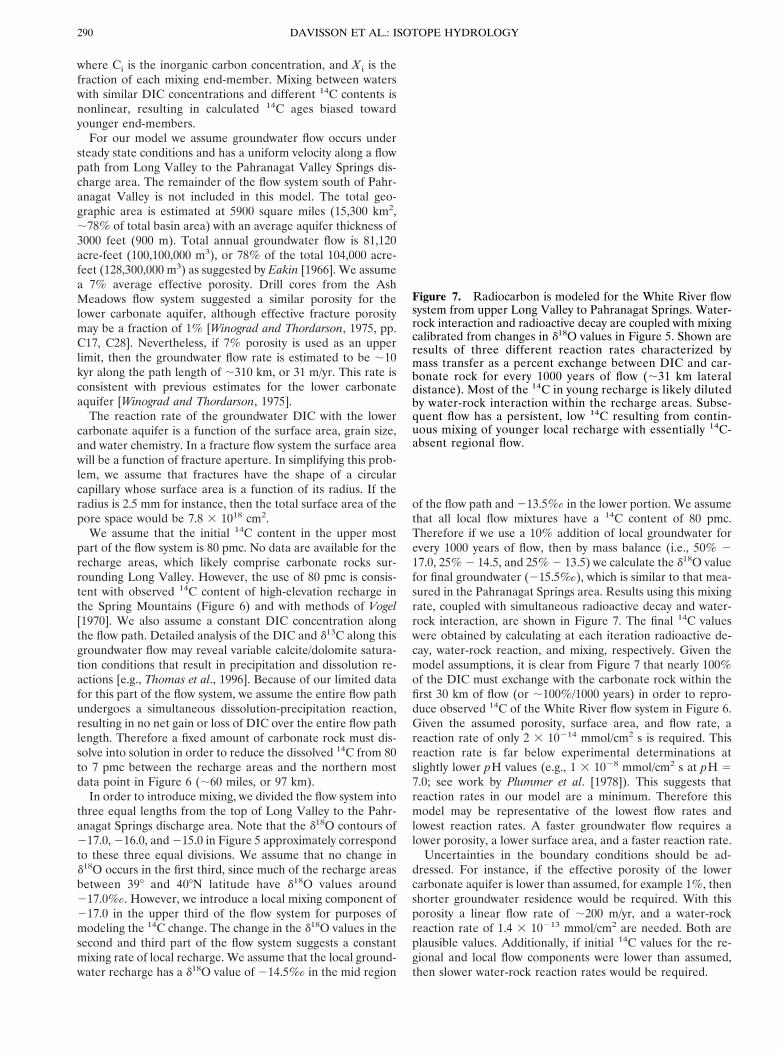
of the flow path and &13.5‰ in the lower portion. We assumethat all local flow mixtures have a 14C content of 80 pmc.Therefore if we use a 10% addition of local groundwater forevery 1000 years of flow, then by mass balance (i.e., 50% &17.0, 25% & 14.5, and 25% & 13.5) we calculate the !18O valuefor final groundwater (&15.5‰), which is similar to that mea-sured in the Pahranagat Springs area. Results using this mixingrate, coupled with simultaneous radioactive decay and water-rock interaction, are shown in Figure 7. The final 14C valueswere obtained by calculating at each iteration radioactive de-cay, water-rock reaction, and mixing, respectively. Given themodel assumptions, it is clear from Figure 7 that nearly 100%of the DIC must exchange with the carbonate rock within thefirst 30 km of flow (or !100%/1000 years) in order to repro-duce observed 14C of the White River flow system in Figure 6.Given the assumed porosity, surface area, and flow rate, areaction rate of only 2 * 10&14 mmol/cm2 s is required. Thisreaction rate is far below experimental determinations atslightly lower pH values (e.g., 1 * 10&8 mmol/cm2 s at pH $7.0; see work by Plummer et al. [1978]). This suggests thatreaction rates in our model are a minimum. Therefore thismodel may be representative of the lowest flow rates andlowest reaction rates. A faster groundwater flow requires alower porosity, a lower surface area, and a faster reaction rate.
Uncertainties in the boundary conditions should be ad-dressed. For instance, if the effective porosity of the lowercarbonate aquifer is lower than assumed, for example 1%, thenshorter groundwater residence would be required. With thisporosity a linear flow rate of !200 m/yr, and a water-rockreaction rate of 1.4 * 10&13 mmol/cm2 are needed. Both areplausible values. Additionally, if initial 14C values for the re-gional and local flow components were lower than assumed,then slower water-rock reaction rates would be required.
Figure 7. Radiocarbon is modeled for the White River flowsystem from upper Long Valley to Pahranagat Springs. Water-rock interaction and radioactive decay are coupled with mixingcalibrated from changes in !18O values in Figure 5. Shown areresults of three different reaction rates characterized bymass transfer as a percent exchange between DIC and car-bonate rock for every 1000 years of flow (!31 km lateraldistance). Most of the 14C in young recharge is likely dilutedby water-rock interaction within the recharge areas. Subse-quent flow has a persistent, low 14C resulting from contin-uous mixing of younger local recharge with essentially 14C-absent regional flow.
DAVISSON ET AL.: ISOTOPE HYDROLOGY290

4.4.3. Further effects of groundwater mixing. In southernNevada, regional groundwater flow occurs through the frac-tured Lower Carbonate Aquifer or volcanic rocks and connec-tions between topographically closed basins. In some cases theregional fracture flow system may transcend basin boundariesas defined by hydraulic heads in wells [Winograd and Thordar-son, 1975]. In the Ash Meadows basin, groundwater, migratinggreat distances from disparate sources, mixes and dischargesinto a single area. Groundwater flow beneath Pahute Mesa andinto the Oasis Valley may originate further north than Rail-road Valley. In all, the isotope contour maps presented here(Figures 2 and 5) suggest that groundwater in southern Nevadais highly mixed, integrating several flow paths from differentaquifers over the entire flow system. The exception would bethe Las Vegas Valley groundwater basin where groundwatermixing is minimized by the geographically limited flow. Longerflow paths with greater mixing can have a profound impact onthe 14C abundance in the groundwater (e.g., Figure 7).
In cases where groundwater of disparate 14C contents mix inthe subsurface, the resulting mixed 14C age will in almost allcases be weighted toward the younger groundwater. For ex-ample, in the Ash Meadows discharge area, a portion of thisgroundwater is transported over a hundred miles from thenorth and northeast, while the remaining portion is rechargedby the Spring Mountains [Winograd and Friedman, 1972].Groundwater in the recharge area of the Spring Mountains hasdistinctly higher 14C contents than regional groundwater flow(Figure 6). This component mixed into the Ash Meadowsdischarge will contribute the majority of the inorganic 14Cobserved in these springs. It is therefore possible that much ofthe groundwater discharge in Ash Meadows has no 14C andthat the small quantities measured in the spring water areentirely from Spring Mountain contributions.
4.4.4. Paleoclimate and groundwater transport. On thebasis of the hydrogeologic constraints of aquifer volume anddischarge in the White River flow system, groundwater trans-port rates from upper Long Valley to the Pahranagat Springsregion probably require (10 kyr. The coupled 14C-!18O modelpresented in this paper is consistent with this argument. Thismodel is also applicable to and consistent with 14C observa-tions in the Las Vegas Valley flow system. On the basis of theseresults we conclude that both the White River and Las VegasValley systems are dominated by Holocene-age groundwater.Pleistocene groundwater with unusually low !18O values mayoccur locally in low-permeability zones, but it has not beenobserved in these basins. However, isolated pockets of Pleis-tocene age groundwaters with unusually low !18O have beenobserved in the Central Valley of California [Davisson andCriss, 1993] and in the Honey Lake Basin in Northern Califor-nia and Nevada (T. P. Rose, Isotopic characterization ofclosed-basin groundwater flow, Honey Lake basin, Californiaand Nevada, submitted to Water Resources Research, 1998,hereinafter referred to as submission, 1998). These observa-tions suggest that late Pleistocene precipitation with depleted!18O values probably occurred in southern Nevada as well.
Large-scale groundwater systems such as the Oasis Valleyand Ash Meadows basins have superimposed local and re-gional flow components that likely mix, forming a spectrum ofgroundwater ages and stable isotope values. A key question iswhether recharge during the last glacial maximum contributeda sufficient recharge volume to cause large stable isotope per-turbations in slower moving parts of the groundwater systemsin southern Nevada. At this time we conclude that the ground-
water !18O variations in Figures 2 and 5 primarily reflect re-gional patterns of !18O in modern precipitation. This pattern isreflected in !18O variations of Holocene groundwater (i.e.,White River and Las Vegas Valley systems). However, at leastone case was found where an unusually low !18O sample,collected from Cactus Flat (37.5"N latitude), indicated a rem-nant pocket of paleowater. In this example the groundwater!18O value is unusually low with respect to adjacent ground-waters in both actual and model maps (Figures 2 and 5).Further sampling and analyses in this region may elucidate thetotal geographic extent of this possible paleogroundwater. It isnotable that similar pockets of groundwater were observed inHoney Lake Basin area in northeastern California (T. P. Roseet al., submission, 1998). Both the Cactus Flat and Honey LakeBasins are nearly closed basins. In the Honey Lake Basinpaleogroundwater is found at depth, although mixing with Ho-locene water occurs in the discharge areas.
Rather than appealing to pluvial period recharge mecha-nisms to explain isotopic variations in the Oasis Valley ground-water system, we suggest that mixing between local rechargeand regional flow is likely more important. In Figure 8 we haveplotted 14C against all the measured !18O values (with corre-sponding 14C data) of the Oasis Valley groundwater system. Inaddition, we have computed and plotted mixing lines betweengroundwater from NTS wells J-12, J-13 and UE19c (mixingmodel 1), and U12s and UE19c (mixing model 2). Thesegroundwaters were chosen to represent mixing between ayoung, locally recharged end-member with an older, regionallyrecharged end-member. The data distribution in Figure 8 sug-gests that mixing combined with 14C decay will explain theseisotopic variations, including data originally interpreted to re-sult from paleoclimate. Paleoclimate and mixing effects aretwo opposing hypotheses for explaining isotopic data. Giventhe regional pattern of !18O and 14C values, we suggest thatmultiple recharge areas within a broad geographic area, fol-lowed by mixing during long range transport, can account formost of the isotopic variation observed in southern Nevada
Figure 8. Groundwater !18O and 14C in the Oasis Valleygroundwater basin can be interpreted as resulting from mix-tures of regional groundwater flow with depleted !18O valuesand local groundwater with higher !18O. Model mixing curvesare presented between wells (1) UE-19c and U-12s (solid line)and between well (2) UE-19c and the J wells in Forty MileCanyon (dashed line). Abbreviations OVGMS, LCA AMGWS, and LCA WR GWS stand, respectively, for Oasis Valleygroundwater system, Lower Carbonate Aquifer Ash Meadowsgroundwater system, and Lower Carbonate Aquifer WhiteRiver groundwater system.
291DAVISSON ET AL.: ISOTOPE HYDROLOGY

groundwater. The dynamic nature of these groundwater sys-tems is not consistent with large pockets of static paleowater.
Mixing may also explain part of the long-term variationsobserved in !18O of the Devil’s Hole carbonate samples ofWinograd et al. [1988, 1992]. Groundwater sources to the AshMeadows discharge area are likely a mixture of Spring Moun-tain and Sheep Range recharge (modern !18O $ &14.0‰)with regional flow from the lower carbonate aquifer (modern!18O $ &16.0‰ in central Nevada [Winograd and Friedman,1972]). Climate induced changes to the amount and isotopiccomposition of each mixing end-member would depend onlocal and regional climatic conditions. For example, almost noconsideration has been given to possible impacts of summerversus winter precipitation sources, which have distinctly dif-ferent !18O values [Ingraham et al., 1991]. However, the rela-tive importance of each and its temporal variability are sug-gested in the fossil record [Spaulding and Graumlich, 1986]. Inaddition, changes in precipitation rates in central Nevada inthe past 500,000 years could affect the hydraulic head andmixing proportion of different groundwater flow paths contrib-uting to Devil’s Hole groundwater. Likewise, the extent ofisotopic enrichment from evaporation during groundwater re-charge may also change with climate. Therefore we suggestthat more careful consideration is needed before interpretingthe calcite !18O values strictly in terms of temperature varia-tions without first considering the impact of groundwater mix-ing and changes in recharge sources.
5. ConclusionsIn southern Nevada, interbasin flow is the dominant mech-
anism for regional groundwater transport. This mechanism isvalidated by the continuity of large-scale, low-!18O groundwa-ter “plumes” that originate from high-latitude recharge areasand follow southward trends along graben valleys. Regionalmixing with higher !18O groundwater at lower latitudes isclearly defined by the systematic increase in the !18O alongthese interbasin flow paths. These !18O values are independentof 14C ages. Groundwater stable isotope values systematicallyplot to the right of the global meteoric water line and indicatepostcloud evaporation. This evaporation can occur in fallingraindrops, melting and refreezing of snowpacks, during runoff,and by shallow groundwater evaporation. Evaporative signa-tures in groundwater are limited in the Las Vegas Valleygroundwater basin.
Groundwater mixing biases the 14C content of groundwaterDIC towards the younger end-member. Ages that are calcu-lated from mixed groundwaters are suspect unless mixing end-members are defined and their individual transport rates areknown. Nevertheless, qualitative differences between the lowercarbonate aquifer system of the White River basin and pre-dominantly volcanic aquifers of the Oasis Valley system indi-cate that transport is faster through the White River basin. Ourmass transport and mixing model for this basin is consistentwith transport rates of (10 kyr from the Long Valley to thePahranagat Valley. The inorganic 14C has little bearing ongroundwater age since water-rock interaction, coupled withmixing between local and regional flow, dominates the ob-served 14C concentration. Paleoclimate evidence in groundwa-ter is limited and may be found only in slower moving parts oflocalized flow systems.
Acknowledgments. We thank R. E. Criss, J. Beiriger, J. Rego, C.Zhu, Ron Hershey, and Greg Nimz for valuable discussion and review.Work was performed under the auspices of the U.S. Department ofEnergy by the Lawrence Livermore National Laboratory under con-tract W-7405-Eng-48.
ReferencesAllison, G. B., C. J. Barnes, M. W. Hughs, and F. W. J. Leaney, Effects
of climate and vegetation on oxygen-18 and deuterium profiles insoil, in Isotope Hydrology: Proceedings of the International Symposiumon Isotope Hydrology for Water Resources Development, pp. 105–123,Int. At. Energy Agency, Vienna, Austria, 1984.
Andrews, J. N., et al., The evolution of alkaline groundwaters in thecontinental intercalaire aquifer of the Irhazer Plain, Niger, WaterResour. Res., 30, 45–61, 1994.
Barnes, C. J., and G. B. Allison, Tracing of water movement in theunsaturated zone using stable isotopes of hydrogen and oxygen, J.Hydrol., 100, 143–176, 1988.
Benson, L. V., and H. Klieforth, Stable isotopes in precipitation andgroundwater in the Yucca Mt. region, southern Nevada, in Paleo-climatic Implications: Aspects of Climate Variability in the Pacific andWestern Americas, Geophys. Monogr. Ser., vol 55, edited by D. H.Peterson, pp. 41–59, AGU, Washington, D. C., 1989.
Benson, L. V., D. R. Currey, R. I. Dorn, K. R. Lajoie, C. G. Oviatt,S. W. Robinson, G. I. Smith, and S. Stine, Chronology of expansionand contraction of four Great Basin lake systems during the past35,000 years, Palaeogr. Palaeoclim. Palaeoecol., 78, 241–286, 1990.
Blankennagel, R. K., and J. E. Weir, Geohydrology of the eastern partof Pahute Mesa, Nevada Test Site, Nye County, Nevada, U.S. Geol.Surv. Prof. Pap. 712-B, 35 pp., 1973.
Claassen, H. C., Late-Wisconsin paleohydrology of the west-centralAmargosa Desert, Nevada, U.S.A., Chem. Geol., 58, 311–323, 1986.
Coleman, M. L., T. J. Sheperd, J. J. Durham, J. E. Rouse, and G. R.Moore, Reduction of water with zinc for hydrogen isotope analysis,Anal. Chem., 54, 993–995, 1982.
Coplen, T. B., I. J. Winograd, J. M. Landwehr, and A. C. Riggs,500,000 year stable carbon isotopic record from Devil’s Hole, Ne-vada, Science, 263, 361–365, 1994.
Cortes, A., and R. N. Farvolden, Isotope studies of precipitation andgroundwater in the Sierra de Las Cruces, Mexico, J. Hydrol., 107,147–153, 1989.
Craig, H., Isotopic variations in meteoric waters, Science, 133, 1702–1703, 1961.
Craig, H., and L. I. Gordon, Deuterium and oxygen-18 variations in theocean and the marine atmosphere, in Proceedings of the Third Spo-leto Nuclear Geology Conference on Paleotemperatures and IsotopicOceanography, edited by E. Tongiorgi, 378 pp., Cons. Naz. delle Ric.,Lab. di Geol. Nucl., Pisa, Italy, 1965.
Craig, H., L. I. Gordon, and Y. Horibe, Isotopic exchange effects in theevaporation of water, J. Geophys. Res., 68, 5079–5087, 1963.
Criss, R. E., and M. L. Davisson, Isotopic imaging of surface water/groundwater interactions, Sacramento Valley, California, J. Hydrol.,178, 205–222, 1996.
Dansgaard, W., Stable isotopes in precipitation, Tellus, 16(4), 436–468, 1964.
Davisson, M. L., and R. E. Criss, Stable isotope imaging of a dynamicgroundwater system in the southwestern Sacramento Valley, Cali-fornia, USA, J. Hydrol., 144, 213–246, 1993.
Davisson, M. L., and C. A. Velsko, Rapid extraction of dissolvedinorganic carbon from small volumes of natural waters for 14C de-termination by accelerator mass spectrometry, Rep. UCRL-JC-119176, 23 pp., Lawrence Livermore Natl. Lab., Livermore, Calif.,1994.
Deines, P., D. Langmuir, and R. S. Harmon, Stable isotope ratios andthe existence of a gas phase in the evolution of carbonate ground-waters, Geochim. Cosmochim. Acta, 38, 1147–1164, 1974.
Dettinger, M. D., J. R. Harrill, D. L. Schmidt, and J. W. Hess, Distri-bution of carbonate-rock aquifers and the potential for their devel-opment, southern Nevada and adjacent parts of California, Arizona,and Utah, U.S. Geol. Surv. Water Res. Invest. Rep. 91-4146, 100 pp.,1995.
Eakin, T. E., A regional interbasin groundwater system in the WhiteRiver area, southeastern Nevada, Water Resour. Res., 2, 251–271,1966.
Eaton, G. P., The Basin and Range province: Origin and tectonicsignificance, Ann. Rev. Earth Planet. Sci., 10, 409–440, 1982.
DAVISSON ET AL.: ISOTOPE HYDROLOGY292

Ekwurzel, B., et al., Dating of shallow groundwater: Comparison of thetransient tracers 3H/3He, chlorofluorocarbons, and 85Kr, Water Re-sour. Res., 30, 1693–1708, 1994.
Epstein, S., and T. Mayeda, Variation of 18O content of waters fromnatural sources, Geochim. Cosmochim. Acta, 4, 213–224, 1953.
Fontes, J. C., and J. M. Garnier, Determination of the initial 14Cactivity of the total dissolved carbon: A review of the existing modelsand a new approach, Water Resour. Res., 15, 399–413, 1979.
Friedman, I., L. Machta, and R. Soller, Water-vapor exchange betweena water droplet and its environment, J. Geophys. Res., 67, 2761–2766,1962.
Friedman, I., C. Benson, and J. D. Gleason, Isotopic changes duringsnow metamorphism, in Stable Isotope Geochemistry: A Tribute toSamuel Epstein, Spec. Publ. 3, edited by H. P. Taylor et al., pp.211–221, Geochem. Soc., San Antonio, Tex., 1991.
Friedman, I., et al., Stable isotope composition of waters in southeast-ern California, 1, Modern precipitation, J. Geophys. Res., 97, 5795–5812, 1992.
Gat, J. R., Comments on the stable isotope method in regional ground-water investigations, Water Resour. Res., 7, 980–993, 1971.
Gat, J. R., and I. Carmi, Evolution of the isotopic composition of theatmospheric waters in the Mediterranean Sea area, J. Geophys. Res.,75, 3039–3048, 1970.
Gat, J. R., and W. Dansgaard, Stable isotope survey of the fresh wateroccurrences in Israel and the northern Jordan Rift Valley, J. Hydrol.,16, 177–212, 1972.
Grove, D. B., M. Rubin, B. B. Hanshaw, and W. A. Beetem, Carbon-14dates of groundwater from a Paleozoic carbonate aquifer, south-central Nevada, U.S. Geol. Surv. Prof. Pap. 650-C, p. C215–C218,1969.
Hale, J. E., Southwestern United States summer monsoon source-Gulf of Mexico or Pacific Ocean, J. Appl. Meteorol., 13, 331–342,1974.
Hamilton, W., Crustal extension in the Basin and Range province,Southwestern United States, in Continental Extensional Tectonics,Spec. Pub. 28, edited by M. P. Coward et al., pp. 155–176, Geol. Soc.,1987.
Harrill, J. R., J. S. Gates, and J. M. Thomas, Major ground-water flowsystems in the Great Basin region of Nevada, Utah, and adjacentstates, U.S. Geol. Surv. Hydrol. Invest. Atlas HA-694-C, scale1:1,000,000, 2 sheets, 1988.
Ingraham, N. L., and B. E. Taylor, Light stable isotope systematics oflarge-scale hydrologic regimes in California and Nevada, Water Re-sour. Res., 27, 77–90, 1991.
Ingraham, N. L., B. F. Lyles, R. L. Jacobson, and J. W. Hess, Stableisotopic study of precipitation and spring discharge in southernNevada, J. Hydrol., 125, 243–258, 1991.
Kirk, S. T., and M. E. Campana, A deuterium-calibrated groundwaterflow model of a regional carbonate alluvial system, J. Hydol., 119,357–388, 1990.
Laczniak, R. J., J. C. Cole, D. A. Sawyer, and D. A. Trudeau, Summaryof hydrogeologic controls on ground-water flow at the Nevada TestSite, Nye County, Nevada. U.S. Geol. Surv. Water Resour. Invest. Rep.96-4109, 59 pp., 1996.
Lamke, R. D., and D. O. Moore, Interim inventory of surface waterresources of Nevada, Water Resour. Bull. 30, 38 pp., State of Nev.Dep. of Conserv. and Nat. Resour., Carson City, Nev., 1965.
Malmberg, G. T., Available water supply of the Las Vegas groundwa-ter basin, Nevada, U.S. Geol. Surv. Water Supply Pap. 1780, 116 pp.,1965.
Martin, P. S., and P. J. Mehringer Jr., Pleistocene pollen analysis andbiogeography of the southwest, in The Quaternary of the UnitedStates, edited by H. E. Wright and D. G. Frey, pp. 433–451, PrinctonUniv. Press, Princton, N. J., 1965.
McNichol, A. P., et al., The rapid preparation of seawater sigma-CO2for radiocarbon analysis at The National Ocean Sciences AMS Fa-cility, Radiocarbon, 36, 237–246, 1994.
Merlivat, L., and J. Jouzel, Global climatic interpretation of the deu-terium-oxygen 18 relationship for precipitation, J. Geophys. Res., 84,5029–5033, 1979.
Mifflin, M. D., and J. W. Hess, Regional carbonate flow systems inNevada, J. Hydrol., 43, 217–237, 1979.
Mook, W. G., Carbon-14 in hydrogeological studies, in Handbook ofEnvironmental Isotope Geochemistry, vol. 1, edited by P. Fritz andJ. C. Fontes, pp. 49–74, Elsevier, New York, 1980.
Pearson, F. J., and B. B. Hanshaw, Sources of dissolved carbonatespecies in groundwater and their effects on carbon-14 dating, IsotopeHydrol., 1970, 271–286, 1970.
Plummer, L. N., T. M. L. Wigley, and D. L. Parkhurst, The kinetics ofcalcite dissolution in CO2-water systems at 5"C to 60"C and at 0.0 to1.0 atm CO2, Am. J. Sci., 278, 179–216, 1978.
Quade, J., T. E. Cerling, and J. R. Bowman, Systematic variations incarbon and oxygen isotopic composition of pedogenic carbonatealong elevation transacts in the southern Great Basin, United States,Geol. Soc. Am. Bull., 101, 464–475, 1989.
Rose, T. P., and M. L. Davisson, Radiocarbon in hydrologic systemscontaining dissolved magmatic carbon dioxide, Science, 273, 1367–1370, 1996.
Rose, T. P., J. M. Kenneally, D. K. Smith, M. L. Davisson, G. B.Hudson, and J. H. Rego, Chemical and isotopic data for groundwa-ter in southern Nevada, Rep. UCRL-ID-128000, 35 pp., LawrenceLivermore Natl. Lab., Livermore, Calif., 1997.
Roth, J. G., and M. E. Campana, A mixing-cell model of the RailroadValley regional groundwater flowsystem, central Nevada, Publ.41123, 175 pp., Desert Res. Inst. Water Resour. Cent., Las Vegas,Nev., 1989.
Sheppard, S. M. F., Characterization and isotopic variations in naturalwaters, in Stable Isotopes in High Temperature Geological Processes,Rev. Mineral., vol. 16, edited by J. W. Valley et al., pp. 165–184,Mineral. Soc. of Am., Washington, D. C., 1986.
Smith, G. I., and F. A. Street-Perrott, Pluvial lakes of the westernUnited States, in Late-Quaternary Environments of the United States,vol. 1, edited by S. C. Porter, pp. 190–212, Univ. of Minn. Press,Minneapolis, 1983.
Smith, G. I., I. Friedman, H. E. Klieforth, and K. Hardcastle, Aerialdistribution of deuterium in eastern California precipitation, 1968–1969, J. Appl. Meteorol., 18, 172–188, 1979.
Spaulding, G. W., and L. J. Graumlich, The last pluvial climatic epi-sodes in the deserts of southwestern North America, Nature, 320,441–444, 1986.
Spaulding, G. W., E. B. Leopold, and T. R. Van Devender, LateWisconsin paleoecology of the American southwest, in Late-Quaternary Environments of the United States, vol. 1, edited by S. C.Porte, pp. 259–293, Univ. of Minn. Press, Minneapolis, 1983.
Stewart, J. H., Geology of Nevada—a discussion to accompany thegeologic map of Nevada, Spec. Publ. 4, 136 pp., Nev. Bur. of Minesand Geol., Reno, Nev., 1980.
Stewart, M. K., Stable isotope fractionation due to evaporation andisotopic exchange of falling waterdrops: Applications to atmosphericprocesses and evaporation of lakes, J. Geophys. Res., 80, 1133–1146,1975.
Stuiver, M., and H. Polach, Reporting of 14C data, Radiocarbon, 19,355–363, 1977.
Stute, M., P. Schlosser, J. F. Clark, and W. S. Broecker, Paleotem-peratures in the southwestern United States derived from noblegases in groundwater, Science, 256, 1000–1003, 1992.
Taylor, H. P., Jr., The application of oxygen and hydrogen isotopestudies to problems of hydrothermal alteration and ore deposition,Econ. Geol., 69, 843–883, 1974.
Thomas, J. M., A. H. Welch, and M. D. Dettinger, Geochemistry andisotope hydrology of representative aquifers in the Great Basinregion of Nevada, Utah, and adjacent states, U.S. Geol. Surv. Prof.Pap. 1409-C, 100 pp., 1996.
Vogel, J. C., Carbon-14 dating of groundwater, in Isotope Hydrology1970, pp. 225–239, Int. At. Energy Agency, Vienna, Austria, 1970.
Walker, F. W., J. R. Parrington, and F. Feiner, Nuclides and isotopes,57 pp., Gen. Electr. Co. Nucl. Energy Oper., San Jose, Calif., 1989.
White, A. F., and N. J. Chuma, Carbon and isotopic mass balancemodels of the Oasis Valley-Fortymile Canyon groundwater basin,southern Nevada, Water Resour. Res., 23, 571–582, 1987.
Wigley, T. M. L., Carbon-14 dating of groundwater from closed toopen systems, Water Resour. Res., 11, 324–328, 1975.
Winograd, I. J., and I. Friedman, Deuterium as a tracer of regionalgroundwater flow, southern Great Basin, Nevada and California,Geol. Soc. Am. Bull., 83, 3691–3708, 1972.
Winograd, I. J., and F. J. Pearson, Major carbon 14 anomaly in aregional carbonate aquifer: Possible evidence for megascale chan-neling, south central Great Basin, Water Resour. Res., 12, 1125–1143,1976.
Winograd, I. J., and W. Thordarson, Hydrogeologic and hydrochemi-cal framework, south-central Great Basin, Nevada-California, with
293DAVISSON ET AL.: ISOTOPE HYDROLOGY

special reference to the Nevada Test Site, U.S. Geol. Surv. Prof. Pap.712-C, 126 pp., 1975.
Winograd, I. J., B. J. Szabo, T. B. Coplen, and A. C. Riggs, A 250,000year climatic record from Great Basin vein calcite: Implication forMilankovitch Theory, Science, 242, 1275–1280, 1988.
Winograd, I. J., et al., Continuous 500,000-year climate record fromvein calcite in Devils-Hole, Nevada, Science, 258, 255–260, 1992.
M. L. Davisson, J. Kenneally, T. P. Rose, and D. K. Smith, IsotopeSciences Division, Lawrence Livermore National Laboratory, P.O. Box808 L-231, Livermore, CA 94550. ([email protected])
(Received February 27, 1998; revised September 22, 1998;accepted September 22, 1998.)
DAVISSON ET AL.: ISOTOPE HYDROLOGY294


![[hydrology] groundwater hydrology - david k. todd (2005).pdf](https://static.fdocuments.in/doc/165x107/577c77961a28abe0548cb0b1/hydrology-groundwater-hydrology-david-k-todd-2005pdf.jpg)


![[Hydrology] Groundwater Hydrology - David K. Todd (2005)](https://static.fdocuments.in/doc/165x107/548ce7beb47959e2288b45f9/hydrology-groundwater-hydrology-david-k-todd-2005.jpg)