Isotope Hydrology of Groundwater in Bangladesh ... · Isotope Hydrology of Groundwater in...
65
_______________________________________________________________________________________________________________________________________________________________________________________________________________________________ Isotope Hydrology of Groundwater in Bangladesh (IAEA-TC Project : BGD/8/016) i A Report on Isotope Hydrology of Groundwater in Bangladesh: Implications for Characterization and Mitigation of Arsenic in Groundwater Work Performed within an IAEA – TC Project (BGD/8/016) By Pradeep K. Aggarwal Head, Isotope Hydrology Section International Atomic Energy Agency, Vienna with Prof. Asish R. Basu Prof. Robert J. Poreda Department of Earth Sciences, University of Rochester Rochester, New York, USA K.M. Kulkarni Isotope Hydrology Section Bhabha Atomic Research Centre Trombay, Mumbai. India. K. Froehlich Former Head, Isotope Hydrology Section International Atomic Energy Agency, Vienna S.A. Tarafdar, Mohamed Ali, Nasir Ahmed Bangladesh Atomic Energy Commission Dhaka, Bangladesh Alamgir Hussain, Mizanur Rahman, Syed Reazuddin Ahmed Bangladesh Water Development Board Dhaka, Bangladesh December 2000
Transcript of Isotope Hydrology of Groundwater in Bangladesh ... · Isotope Hydrology of Groundwater in...
_______________________________________________________________________________________________________________________________________________________________________________________________________________________________
Isotope Hydrology of Groundwater in Bangladesh (IAEA-TC Project : BGD/8/016) i
A Report on
Isotope Hydrology of Groundwater in Bangladesh: Implications for Characterization and Mitigation of
Arsenic in Groundwater
Work Performed within an IAEA – TC Project (BGD/8/016)
By
Pradeep K. Aggarwal Head, Isotope Hydrology Section
International Atomic Energy Agency, Vienna
with
Prof. Asish R. Basu Prof. Robert J. Poreda
Department of Earth Sciences, University of Rochester Rochester, New York, USA
K.M. Kulkarni
Isotope Hydrology Section Bhabha Atomic Research Centre
Trombay, Mumbai. India.
K. Froehlich Former Head, Isotope Hydrology Section
International Atomic Energy Agency, Vienna
S.A. Tarafdar, Mohamed Ali, Nasir Ahmed Bangladesh Atomic Energy Commission
Dhaka, Bangladesh
Alamgir Hussain, Mizanur Rahman, Syed Reazuddin Ahmed Bangladesh Water Development Board
Dhaka, Bangladesh
December 2000
_______________________________________________________________________________________________________________________________________________________________________________________________________________________________
Isotope Hydrology of Groundwater in Bangladesh (IAEA-TC Project : BGD/8/016) ii
Summary
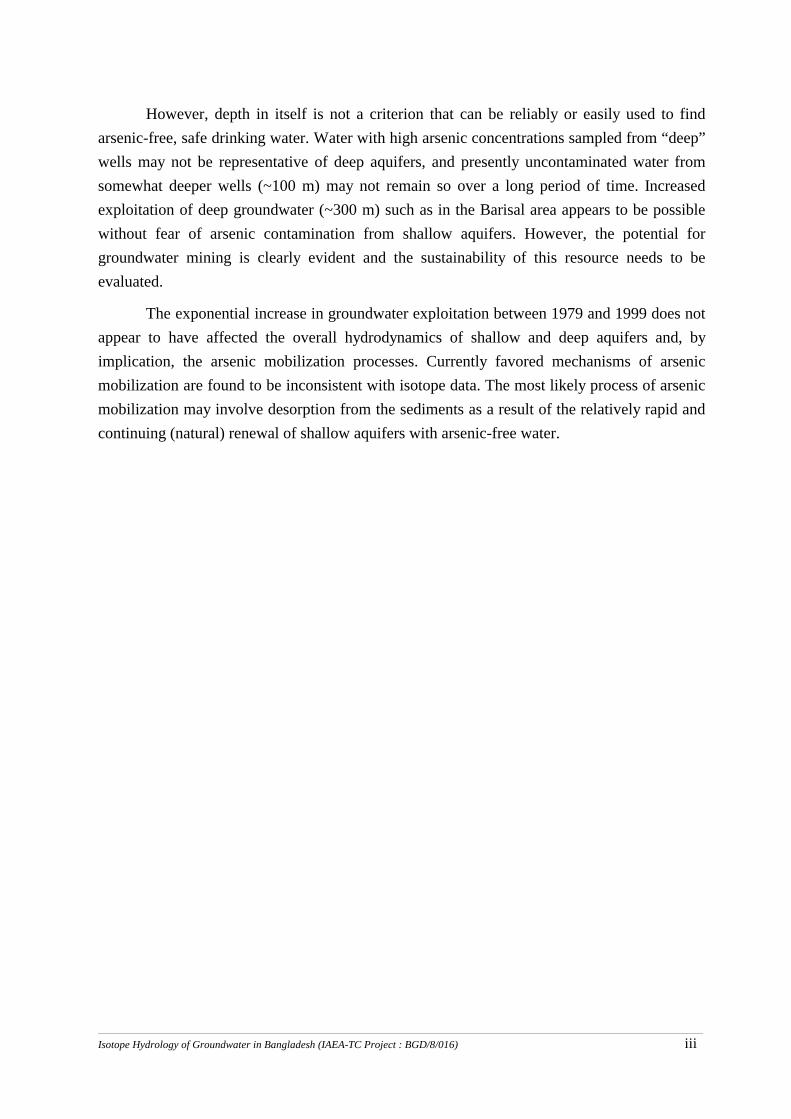
An investigation of the source and dynamics of groundwater in Bangladesh has been conducted with environmental isotope tracers. The primary objective of this study was to provide a scientific basis for developing mitigation strategies by characterizing the mechanism of arsenic mobilization in groundwater and the present and future status of arsenic contamination in deeper aquifers. About 55 shallow and deep groundwater samples ranging in depth from 10 to 335 m were collected and analyzed for their chemical and isotopic compositions. Distinct patterns of isotope compositions are found in shallow and deep groundwaters. Arsenic contamination is found to be present mostly in shallow groundwater to depths of less than 70 m. Groundwater samples from deep wells containing elevated arsenic concentrations are found to contain water mostly from shallow aquifers and do not indicate arsenic contamination of deeper aquifers.
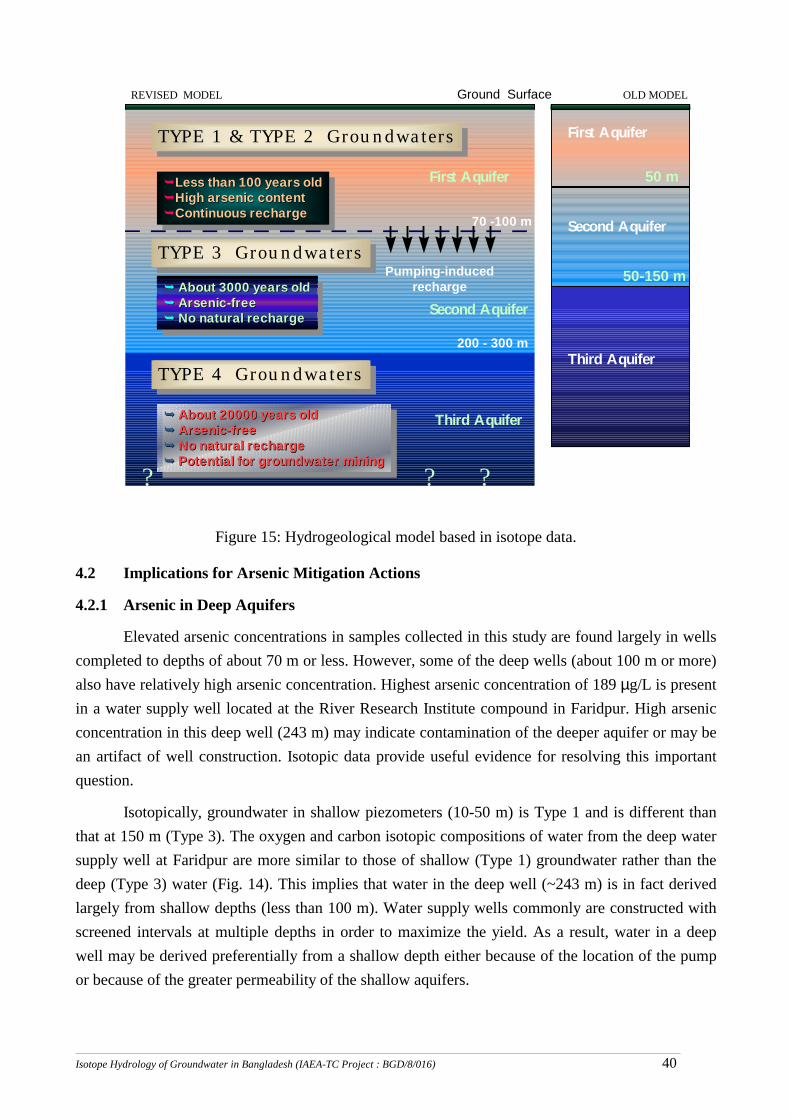
The revised hydrogeological model based on isotopic and hydrogeochemical data is shown below.
TYPE 1 & TYPE 2 GroundwatersTYPE 1 & TYPE 2 Groundwaters
TYPE 3 GroundwatersTYPE 3 Groundwaters
TYPE 4 GroundwatersTYPE 4 Groundwaters
�Less than 100 years old�High arsenic content�Continuous recharge
��Less than 100 years oldLess than 100 years old��High arsenic contentHigh arsenic content��Continuous rechargeContinuous recharge
� About 3000 years old� Arsenic-free� No natural recharge
�� About 3000 years oldAbout 3000 years old�� Arsenic-free Arsenic-free�� No natural recharge No natural recharge
� About 20000 years old� Arsenic-free� No natural recharge� Potential for groundwater mining
�� About 20000 years oldAbout 20000 years old�� Arsenic-free Arsenic-free�� No natural recharge No natural recharge�� Potential for groundwater mining Potential for groundwater mining
First Aquifer
Second Aquifer
Pumping-inducedrecharge
Third Aquifer
70 -100 m
200 - 300 m
Ground Surface
???
First Aquifer
Second Aquifer
Third Aquifer
50 m
50-150 m
REVISED MODEL OLD MODEL
_______________________________________________________________________________________________________________________________________________________________________________________________________________________________
Isotope Hydrology of Groundwater in Bangladesh (IAEA-TC Project : BGD/8/016) iii
However, depth in itself is not a criterion that can be reliably or easily used to find arsenic-free, safe drinking water. Water with high arsenic concentrations sampled from “deep” wells may not be representative of deep aquifers, and presently uncontaminated water from somewhat deeper wells (~100 m) may not remain so over a long period of time. Increased exploitation of deep groundwater (~300 m) such as in the Barisal area appears to be possible without fear of arsenic contamination from shallow aquifers. However, the potential for groundwater mining is clearly evident and the sustainability of this resource needs to be evaluated.
The exponential increase in groundwater exploitation between 1979 and 1999 does not appear to have affected the overall hydrodynamics of shallow and deep aquifers and, by implication, the arsenic mobilization processes. Currently favored mechanisms of arsenic mobilization are found to be inconsistent with isotope data. The most likely process of arsenic mobilization may involve desorption from the sediments as a result of the relatively rapid and continuing (natural) renewal of shallow aquifers with arsenic-free water.
_______________________________________________________________________________________________________________________________________________________________________________________________________________________________
Isotope Hydrology of Groundwater in Bangladesh (IAEA-TC Project : BGD/8/016) iv
TABLE OF CONTENTS 1. INTRODUCTION 1 1.1 Background 1 1.2 Objectives 1 1.3 Scope of the Study 2 1.4 Principles of Isotope Hydrology 2
2. GEOLOGY AND HYDROGEOLOGY 7 2.1 Physiography, Structure and Stratigraphy 7 2.2 Climate 8 2.3 Hydrogeology 8 2.3.1 Classification of Aquifers 8 2.3.2 Historical Trends in Water Levels 10 2.3.3 Recharge to Groundwater 10 2.3.4 Groundwater and Surface Water Relationship 27 2.3.5 Groundwater Quality 27
3. ANALYTICAL RESULTS 31 3.1 Arsenic 31 3.2 Stable Oxygen and Hydrogen Isotopes 32 3.3 Tritium and Carbon-14 34
4. DISCUSSION 38 4.1 Isotopic Signatures of Shallow and Deep Groundwater 38 4.2 Implications for Arsenic Mitigation Actions 40 4.2.1 Arsenic in Deep Aquifers 40 4.2.2 Safety of Deep Groundwater 41 4.2.3 Mechanism(s) of Arsenic Mobilization 45
5. CONCLUSIONS 46
BIBLIOGRAPHY 47
_______________________________________________________________________________________________________________________________________________________________________________________________________________________________
Isotope Hydrology of Groundwater in Bangladesh (IAEA-TC Project : BGD/8/016) 1
1. INTRODUCTION
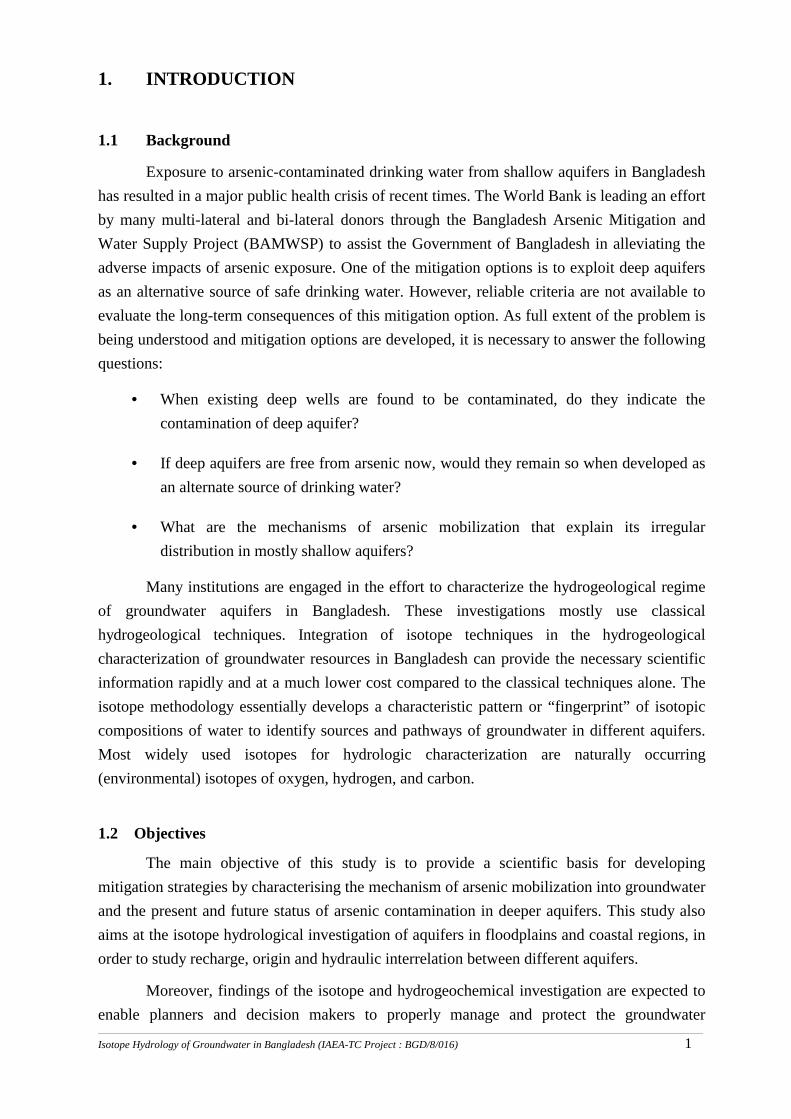
1.1 Background
Exposure to arsenic-contaminated drinking water from shallow aquifers in Bangladesh has resulted in a major public health crisis of recent times. The World Bank is leading an effort by many multi-lateral and bi-lateral donors through the Bangladesh Arsenic Mitigation and Water Supply Project (BAMWSP) to assist the Government of Bangladesh in alleviating the adverse impacts of arsenic exposure. One of the mitigation options is to exploit deep aquifers as an alternative source of safe drinking water. However, reliable criteria are not available to evaluate the long-term consequences of this mitigation option. As full extent of the problem is being understood and mitigation options are developed, it is necessary to answer the following questions:
• = When existing deep wells are found to be contaminated, do they indicate the contamination of deep aquifer?
• = If deep aquifers are free from arsenic now, would they remain so when developed as an alternate source of drinking water?
• = What are the mechanisms of arsenic mobilization that explain its irregular distribution in mostly shallow aquifers?
Many institutions are engaged in the effort to characterize the hydrogeological regime of groundwater aquifers in Bangladesh. These investigations mostly use classical hydrogeological techniques. Integration of isotope techniques in the hydrogeological characterization of groundwater resources in Bangladesh can provide the necessary scientific information rapidly and at a much lower cost compared to the classical techniques alone. The isotope methodology essentially develops a characteristic pattern or “fingerprint” of isotopic compositions of water to identify sources and pathways of groundwater in different aquifers. Most widely used isotopes for hydrologic characterization are naturally occurring (environmental) isotopes of oxygen, hydrogen, and carbon.
1.2 Objectives
The main objective of this study is to provide a scientific basis for developing mitigation strategies by characterising the mechanism of arsenic mobilization into groundwater and the present and future status of arsenic contamination in deeper aquifers. This study also aims at the isotope hydrological investigation of aquifers in floodplains and coastal regions, in order to study recharge, origin and hydraulic interrelation between different aquifers.
Moreover, findings of the isotope and hydrogeochemical investigation are expected to enable planners and decision makers to properly manage and protect the groundwater
_______________________________________________________________________________________________________________________________________________________________________________________________________________________________
Isotope Hydrology of Groundwater in Bangladesh (IAEA-TC Project : BGD/8/016) 2
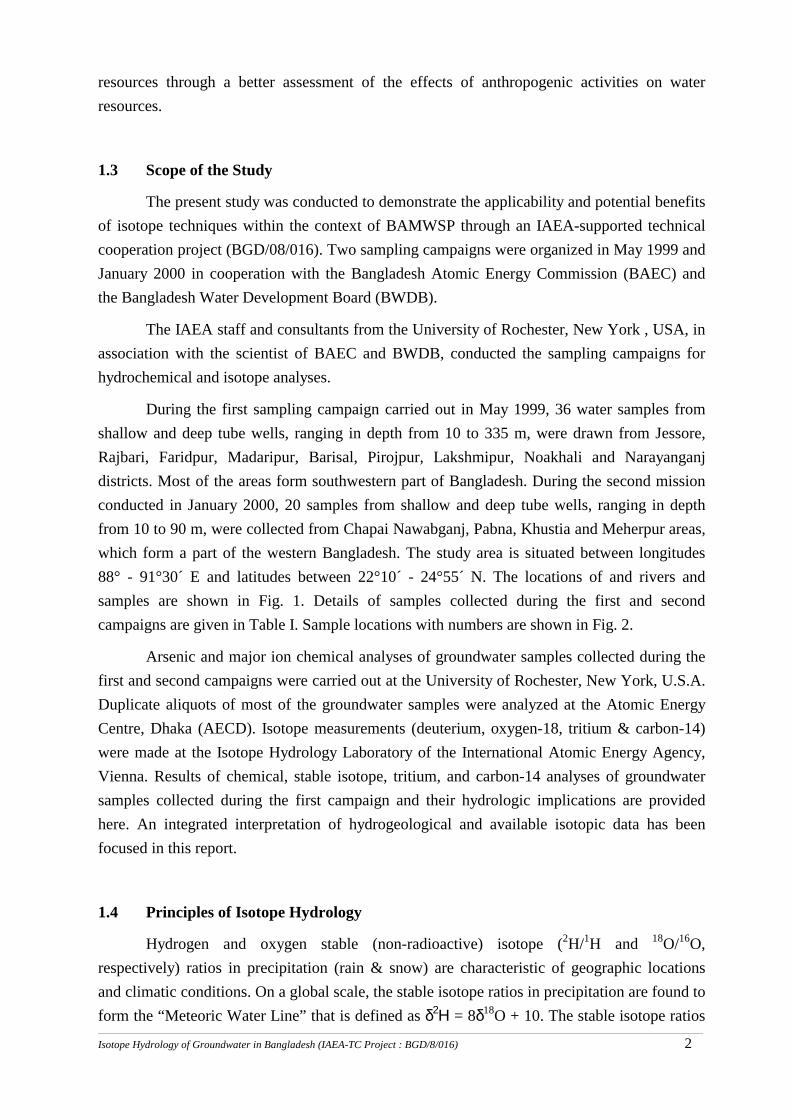
resources through a better assessment of the effects of anthropogenic activities on water resources.
1.3 Scope of the Study
The present study was conducted to demonstrate the applicability and potential benefits of isotope techniques within the context of BAMWSP through an IAEA-supported technical cooperation project (BGD/08/016). Two sampling campaigns were organized in May 1999 and January 2000 in cooperation with the Bangladesh Atomic Energy Commission (BAEC) and the Bangladesh Water Development Board (BWDB).
The IAEA staff and consultants from the University of Rochester, New York , USA, in association with the scientist of BAEC and BWDB, conducted the sampling campaigns for hydrochemical and isotope analyses.
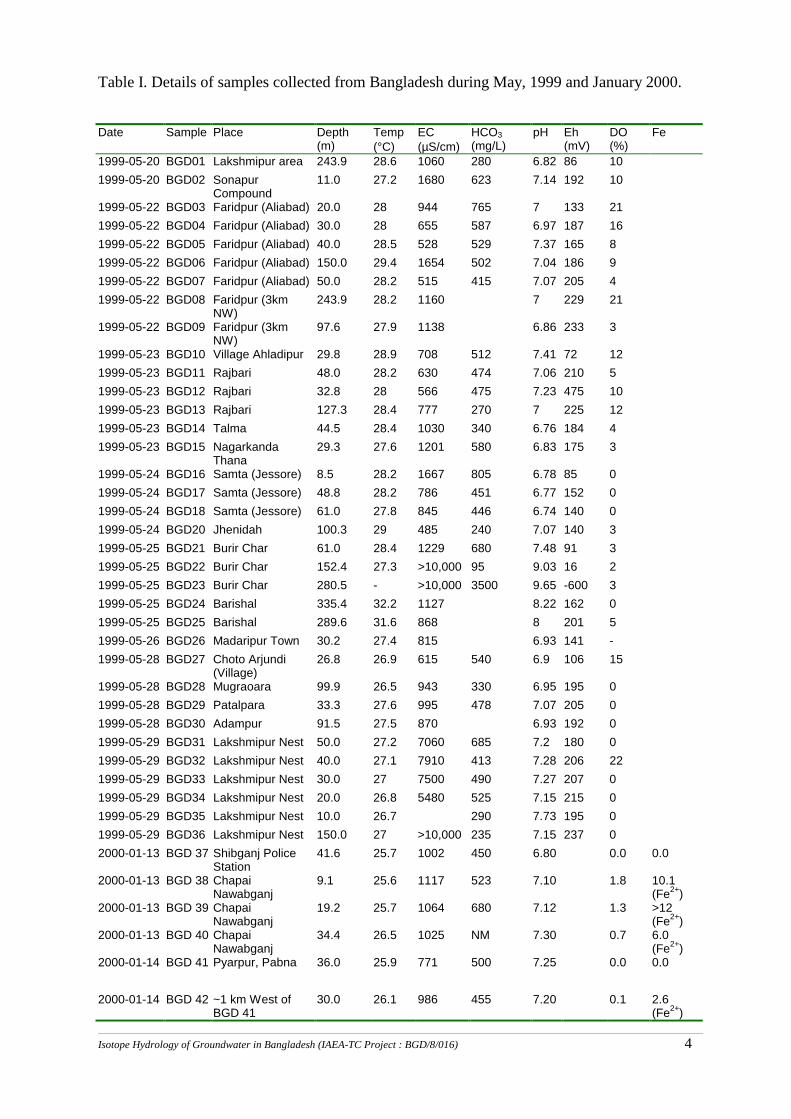
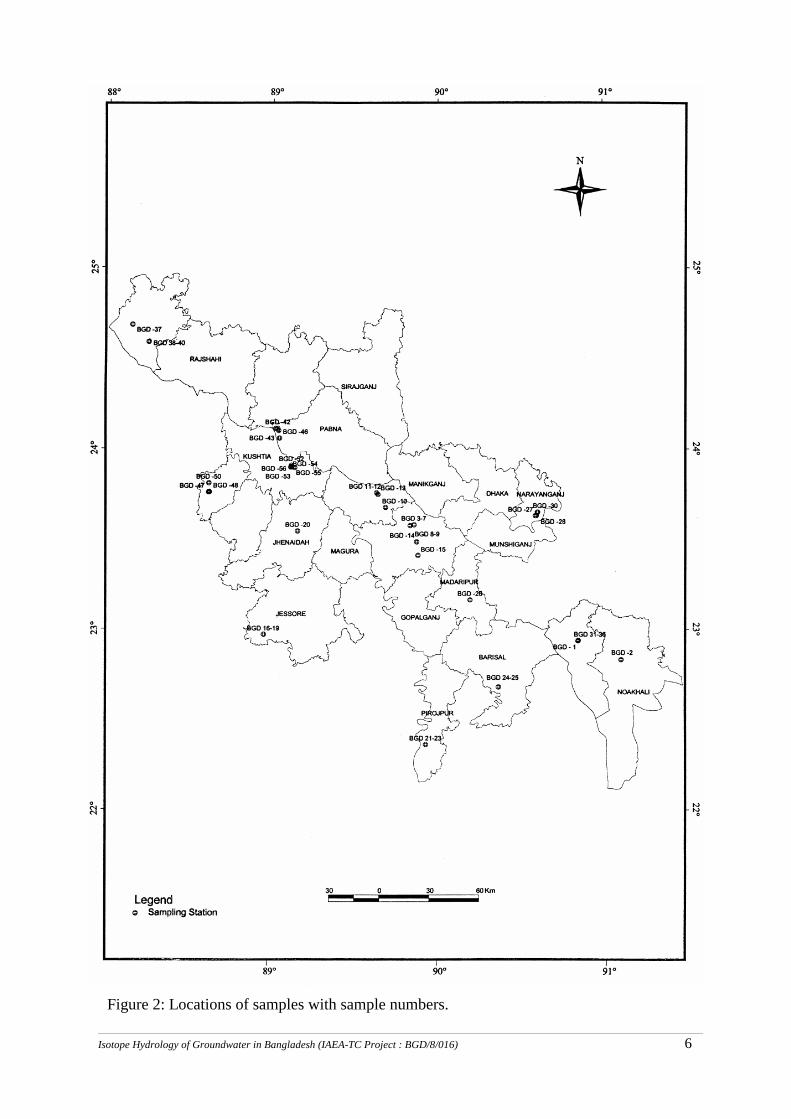
During the first sampling campaign carried out in May 1999, 36 water samples from shallow and deep tube wells, ranging in depth from 10 to 335 m, were drawn from Jessore, Rajbari, Faridpur, Madaripur, Barisal, Pirojpur, Lakshmipur, Noakhali and Narayanganj districts. Most of the areas form southwestern part of Bangladesh. During the second mission conducted in January 2000, 20 samples from shallow and deep tube wells, ranging in depth from 10 to 90 m, were collected from Chapai Nawabganj, Pabna, Khustia and Meherpur areas, which form a part of the western Bangladesh. The study area is situated between longitudes 88° - 91°30´ E and latitudes between 22°10´ - 24°55´ N. The locations of and rivers and samples are shown in Fig. 1. Details of samples collected during the first and second campaigns are given in Table I. Sample locations with numbers are shown in Fig. 2.
Arsenic and major ion chemical analyses of groundwater samples collected during the first and second campaigns were carried out at the University of Rochester, New York, U.S.A. Duplicate aliquots of most of the groundwater samples were analyzed at the Atomic Energy Centre, Dhaka (AECD). Isotope measurements (deuterium, oxygen-18, tritium & carbon-14) were made at the Isotope Hydrology Laboratory of the International Atomic Energy Agency, Vienna. Results of chemical, stable isotope, tritium, and carbon-14 analyses of groundwater samples collected during the first campaign and their hydrologic implications are provided here. An integrated interpretation of hydrogeological and available isotopic data has been focused in this report.
1.4 Principles of Isotope Hydrology
Hydrogen and oxygen stable (non-radioactive) isotope (2H/1H and 18O/16O, respectively) ratios in precipitation (rain & snow) are characteristic of geographic locations and climatic conditions. On a global scale, the stable isotope ratios in precipitation are found to form the “Meteoric Water Line” that is defined as δ2Η = 8δ18O + 10. The stable isotope ratios

_______________________________________________________________________________________________________________________________________________________________________________________________________________________________
Isotope Hydrology of Groundwater in Bangladesh (IAEA-TC Project : BGD/8/016) 3
are conventionally reported as parts per thousand (‰) or per mil deviation from a standard using the delta (δ) notation. For oxygen and hydrogen isotope ratios, ocean water (V-SMOW) is used as the standard: its isotopic ratios, by definition, are zero. Except for evaporation before or during infiltration, the stable oxygen and hydrogen isotope ratios remain mostly unchanged as surface water percolates down to groundwater. Evaporation increases the oxygen and hydrogen isotope ratios of the residual fraction and this residual water no longer follows the trace of the Meteoric Water Line. Among other factors affecting the isotope composition of precipitation are seasonal changes, altitude, latitude, amount of precipitation, etc.
87° 88° 89° 90° 91° 92° 93°21 °
22 °
23 °
24 °
25 °
26 °
Faridpur
Rajbari
Lakshmipur
Barisal Noakhali
G a n g e s R .
Farakka
TistaRx
x
Brahmaputra R.x x
Dhaleshwari R.
Megh
naR
Calcutta
Dhaka
SonargaonMadaripur
Burir Char
Jhenidah
Samta
Meherpur
Kustia
IshurdiShibganj Nawabganj
Figure 1: Locations of groundwater samples, Bangladesh.
_______________________________________________________________________________________________________________________________________________________________________________________________________________________________
Isotope Hydrology of Groundwater in Bangladesh (IAEA-TC Project : BGD/8/016) 4
Table I. Details of samples collected from Bangladesh during May, 1999 and January 2000.
Date Sample Place Depth (m)
Temp(°C)
EC (µS/cm)
HCO3 (mg/L)
pH Eh (mV)
DO (%)
Fe
1999-05-20 BGD01 Lakshmipur area 243.9 28.6 1060 280 6.82 86 10 1999-05-20 BGD02 Sonapur
Compound 11.0 27.2 1680 623 7.14 192 10
1999-05-22 BGD03 Faridpur (Aliabad) 20.0 28 944 765 7 133 21 1999-05-22 BGD04 Faridpur (Aliabad) 30.0 28 655 587 6.97 187 16 1999-05-22 BGD05 Faridpur (Aliabad) 40.0 28.5 528 529 7.37 165 8 1999-05-22 BGD06 Faridpur (Aliabad) 150.0 29.4 1654 502 7.04 186 9 1999-05-22 BGD07 Faridpur (Aliabad) 50.0 28.2 515 415 7.07 205 4 1999-05-22 BGD08 Faridpur (3km
NW) 243.9 28.2 1160 7 229 21
1999-05-22 BGD09 Faridpur (3km NW)
97.6 27.9 1138 6.86 233 3 1999-05-23 BGD10 Village Ahladipur 29.8 28.9 708 512 7.41 72 12 1999-05-23 BGD11 Rajbari 48.0 28.2 630 474 7.06 210 5 1999-05-23 BGD12 Rajbari 32.8 28 566 475 7.23 475 10 1999-05-23 BGD13 Rajbari 127.3 28.4 777 270 7 225 12 1999-05-23 BGD14 Talma 44.5 28.4 1030 340 6.76 184 4 1999-05-23 BGD15 Nagarkanda
Thana 29.3 27.6 1201 580 6.83 175 3
1999-05-24 BGD16 Samta (Jessore) 8.5 28.2 1667 805 6.78 85 0 1999-05-24 BGD17 Samta (Jessore) 48.8 28.2 786 451 6.77 152 0 1999-05-24 BGD18 Samta (Jessore) 61.0 27.8 845 446 6.74 140 0 1999-05-24 BGD20 Jhenidah 100.3 29 485 240 7.07 140 3 1999-05-25 BGD21 Burir Char 61.0 28.4 1229 680 7.48 91 3 1999-05-25 BGD22 Burir Char 152.4 27.3 >10,000 95 9.03 16 2 1999-05-25 BGD23 Burir Char 280.5 - >10,000 3500 9.65 -600 3 1999-05-25 BGD24 Barishal 335.4 32.2 1127 8.22 162 0 1999-05-25 BGD25 Barishal 289.6 31.6 868 8 201 5 1999-05-26 BGD26 Madaripur Town 30.2 27.4 815 6.93 141 - 1999-05-28 BGD27 Choto Arjundi
(Village) 26.8 26.9 615 540 6.9 106 15
1999-05-28 BGD28 Mugraoara 99.9 26.5 943 330 6.95 195 0 1999-05-28 BGD29 Patalpara 33.3 27.6 995 478 7.07 205 0 1999-05-28 BGD30 Adampur 91.5 27.5 870 6.93 192 0 1999-05-29 BGD31 Lakshmipur Nest 50.0 27.2 7060 685 7.2 180 0 1999-05-29 BGD32 Lakshmipur Nest 40.0 27.1 7910 413 7.28 206 22 1999-05-29 BGD33 Lakshmipur Nest 30.0 27 7500 490 7.27 207 0 1999-05-29 BGD34 Lakshmipur Nest 20.0 26.8 5480 525 7.15 215 0 1999-05-29 BGD35 Lakshmipur Nest 10.0 26.7 290 7.73 195 0 1999-05-29 BGD36 Lakshmipur Nest 150.0 27 >10,000 235 7.15 237 0 2000-01-13 BGD 37 Shibganj Police
Station 41.6 25.7 1002 450 6.80 0.0 0.0
2000-01-13 BGD 38 Chapai Nawabganj
9.1 25.6 1117 523 7.10 1.8 10.1 (Fe2+)
2000-01-13 BGD 39 Chapai Nawabganj
19.2 25.7 1064 680 7.12 1.3 >12 (Fe2+)
2000-01-13 BGD 40 Chapai Nawabganj
34.4 26.5 1025 NM 7.30 0.7 6.0 (Fe2+)
2000-01-14 BGD 41 Pyarpur, Pabna 36.0 25.9 771 500 7.25 0.0 0.0 2000-01-14 BGD 42 ~1 km West of
BGD 41 30.0 26.1 986 455 7.20 0.1 2.6
(Fe2+)
_______________________________________________________________________________________________________________________________________________________________________________________________________________________________
Isotope Hydrology of Groundwater in Bangladesh (IAEA-TC Project : BGD/8/016) 5
2000-01-14 BGD 43 Near river & BGD41
32.9 29.5 919 502 7.25 0.4 2.6 (Fe2+)
2000-01-14 BGD 44 3km SE of BGD 43
35.0 27.0 754 390 7.05 0.4 0.1 (Fe2+)
2000-01-14 BGD 45 15m from BGD 44 35.0 26.4 894 356 7.10 0.0 1.8 (Fe2+)
2000-01-14 BGD 46 Ishwardi 18.3 25.8 664 315 7.20 0.0 0.3 (Fe2+)
2000-01-15 BGD 47 Meherpur Town 32.3 25.6 795 283 7.15 0.0 0.1 (Fe2+)
2000-01-15 BGD 48 Meherpur 27.0 26.2 808 356 7.15 0.3 0.5 (Fe2+)
2000-01-15 BGD 49 1 km from BGD 48 36.0 26.0 1108 ?? 7.21 0.3 7.3 (Fe2+)
2000-01-15 BGD 50 Ujjalpur Village 40.0 24.8 842 465 7.11 0.2 7.6 (Fe2+)
2000-01-15 BGD 51 Betw. BGD48 and 49
36.0 26.2 926 508 7.25 NM? 7.7 (Fe2+)
2000-01-16 BGD 52 Kustia Town 33.0 24.8 895 580 7.25 0.2 1.1 (Fe2+)
2000-01-16 BGD 53 Kustia, 2km BGD 52
36.6 25.4 721 503 7.05 0.5 10.5 (Fe2+)
2000-01-16 BGD 54 Kustia, 1.5km BGD 53
? 25.3 688 472 7.18 0.0 0.1 (Fe2+)
2000-01-16 BGD 55 Paurosabha Tube Well
82.3 25.8 821 519 7.21 0.0 0.4 (Fe2+)
2000-01-16 BGD 56 Kushtia Mun. Well 10
88.4 26.5 0.2 775 7.30 2.4 (Fe2+)
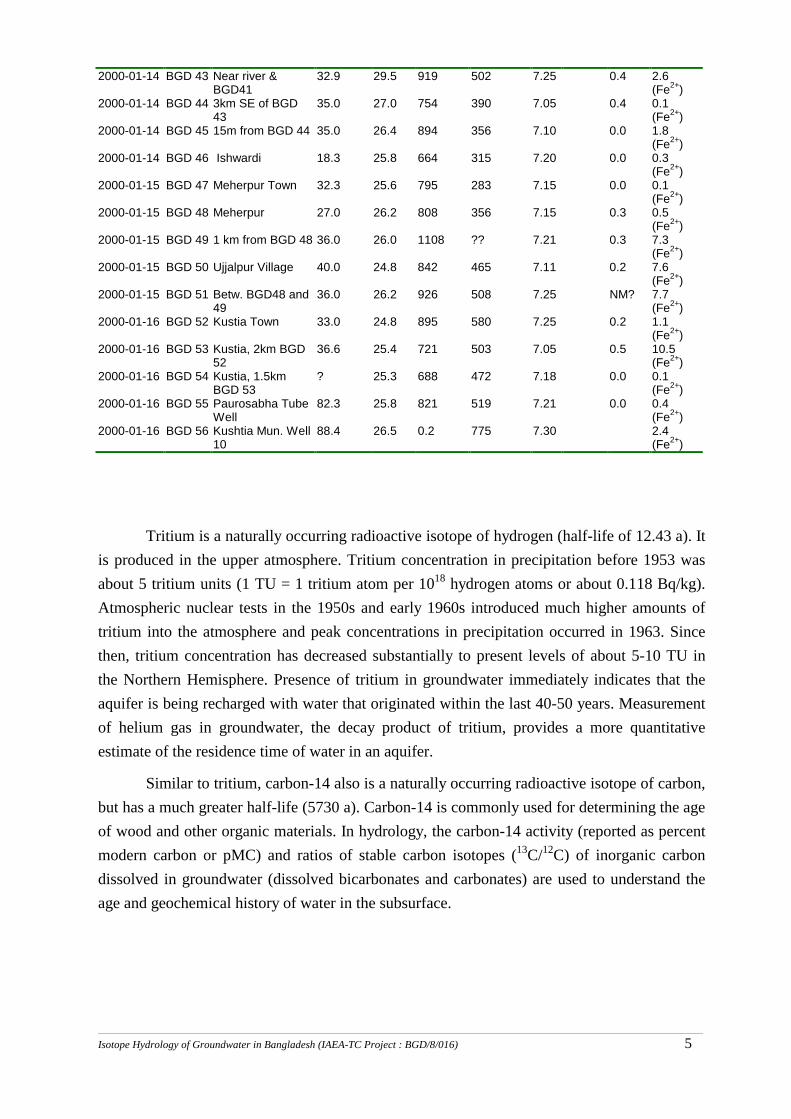
Tritium is a naturally occurring radioactive isotope of hydrogen (half-life of 12.43 a). It is produced in the upper atmosphere. Tritium concentration in precipitation before 1953 was about 5 tritium units (1 TU = 1 tritium atom per 1018 hydrogen atoms or about 0.118 Bq/kg). Atmospheric nuclear tests in the 1950s and early 1960s introduced much higher amounts of tritium into the atmosphere and peak concentrations in precipitation occurred in 1963. Since then, tritium concentration has decreased substantially to present levels of about 5-10 TU in the Northern Hemisphere. Presence of tritium in groundwater immediately indicates that the aquifer is being recharged with water that originated within the last 40-50 years. Measurement of helium gas in groundwater, the decay product of tritium, provides a more quantitative estimate of the residence time of water in an aquifer.
Similar to tritium, carbon-14 also is a naturally occurring radioactive isotope of carbon, but has a much greater half-life (5730 a). Carbon-14 is commonly used for determining the age of wood and other organic materials. In hydrology, the carbon-14 activity (reported as percent modern carbon or pMC) and ratios of stable carbon isotopes (13C/12C) of inorganic carbon dissolved in groundwater (dissolved bicarbonates and carbonates) are used to understand the age and geochemical history of water in the subsurface.
_______________________________________________________________________________________________________________________________________________________________________________________________________________________________
Isotope Hydrology of Groundwater in Bangladesh (IAEA-TC Project : BGD/8/016) 6
Figure 2: Locations of samples with sample numbers.
_______________________________________________________________________________________________________________________________________________________________________________________________________________________________
Isotope Hydrology of Groundwater in Bangladesh (IAEA-TC Project : BGD/8/016) 7
2. GEOLOGY AND HYDROGEOLOGY
2.1 Physiography, Structure and Stratigraphy
The landforms of Bangladesh can be divided into three major classes: (i) the northern and eastern hills, (ii) the Pleistocene terraces, and (iii) the Holocene floodplains. Sedimentary deposits of Bangladesh mainly consist of those laid down by the Ganges, Brahmaputra and Meghna (GBM) river systems. Holocene floodplain deposits cover most of the surface area of present-day Bangladesh. Arsenic contaminated groundwater mainly occurs at shallow depths beneath the Holocene floodplains.
The major Pleistocene terraces include the Modhupur Tract in Dhaka, Tangail and Mymensingh districts and the Barind Tracts in Rajshahi and Bogra districts. Smaller terraces occur in Comilla, Sylhet, Dinajpur and Rangpur districts.
According to geographic and geomorphic distribution, the Holocene floodplains are divided in four classes: (a) piedmont plains, (b) meander floodplains, (c) tidal floodplains, and (d) estuarine floodplains.
The Faridpur and Barisal areas have deltaic deposits. The Pabna, Khustia and Jessore districts have alluvial deposits of the Gangetic floodplains. The Lakshmipur-Noakhali area is covered by floodplain-, interstream-, and alluvial deposits, whereas most of the Chapai Nawabganj area has terrace and meander deposits. Rajshahi area is mainly of interstream deposits.
Bangladesh constitutes a part of the Bengal Basin, which lies at the head of the Bay of Bengal. The basin is about 200 km wide in the northeast and broadens to about 500 km in the vicinity of the Bay of Bengal. It is bordered by the Himalayan ranges and the Shillong massif to the north, the Indian Shield to the west and the Arakan Chin massif to the east. The area is underlain by poorly consolidated or unconsolidated sediments of Tertiary and Quaternary ages. A buried basement complex of Precambrian crystallines and Gondwana sedimentary rocks slopes southwards from shallow depths along the northern border with India to more than 3500 m beneath Dhaka and at greater depth to the south. Marine sedimentary rocks of Tertiary age overlie basement complex. Small patches of sedimentary rocks are exposed along the eastern and northern borders and include folded rocks of the Chittagong Hills and then northern extension into Sylhet. Unconsolidated alluvial deposits overlie the marine sediments. The alluvial deposits range in thickness from a few meters bordering the main sedimentary rocks of the northeast and east to at least 600 m near Dhaka. In northwestern Bangladesh (Dinajpur) the alluvium is at least 150 m thick.
The geologic structure of Bangladesh is related to two major factors- tectonic deformation of pre-Tertiary consolidated sediments and deltaic sedimentation. Folding, faulting and other structural features are generally masked by surficial deposits but structural
_______________________________________________________________________________________________________________________________________________________________________________________________________________________________
Isotope Hydrology of Groundwater in Bangladesh (IAEA-TC Project : BGD/8/016) 8
movement undoubtedly controlled the development, alignment and changes in drainage systems. Nearly all faults and folds mapped in Bangladesh are north of the confluence of Ganges-Meghna Rivers.
The Pleistocene alluvial terraces, originally deposited as floodplains of the Ganges and Brahmaputra rivers, are highly oxidized, weathered and more compact, compared to recent floodplain sediments. These deposits are composed primarily of silt and sand, and in the lower delta they are principally silt, clay and peat. The Holocene sediments, overlying the Dupi Tila Formation of the Pleistocene age, comprise varying degrees of alternate layers of unconsolidated sand, silt and clay. These sediments are mostly floodplain, back swamps and near-shore tidal deposits.
The geologically different catchments of the Ganges and Brahmaputra rivers influence the character of sediments deposited within the Bengal basin. Sediments from the Ganges are composed of highly weathered sedimentary and volcanic rocks, and therefore, have heavy clay load. Sediments from the Brahmaputra are predominantly unweathered and relativity coarser.
2.2 Climate
Bangladesh is characterized by tropical monsoon climatic condition, with bulk of rainfall occurring between the months of May to October, moderate to high temperature and humidity. The average annual rainfall varies from about 1600 mm in the western districts of Rajshahi, Pabna, Kushtia and Jessore to more than 2500 mm in the southeastern and northeastern parts of the country. The mean annual temperature is about 25°C, with extremes between 4°C and 43°C. Humidity ranges between 60 % in the dry season and 98 % during the monsoon. Parts of Pirojpur, Barisal, Lakshmipur and Noakhali areas are often subject to severe cyclones and tidal surges of the Bay of Bengal.
2.3 Hydrogeology
The sources of sediments and changes in the mode of deposition have resulted in the great variations in the lateral and vertical continuity of the aquifers. Major rivers are shown in Fig. 1.
2.3.1 Classification of Aquifers
A baseline study of aquifers was conducted by Bangladesh Water Development Board under the UNDP assistance on groundwater survey and investigation in the country (UNDP, 1982). The study included drilling of deep (300 m) and shallow (100 m) exploratory boreholes, aquifer tests, and periodic monitoring of groundwater level and quality at selected locations in the country. Figure 3 shows E-W cross section of the southern part of the country. Geological
_______________________________________________________________________________________________________________________________________________________________________________________________________________________________
Isotope Hydrology of Groundwater in Bangladesh (IAEA-TC Project : BGD/8/016) 9
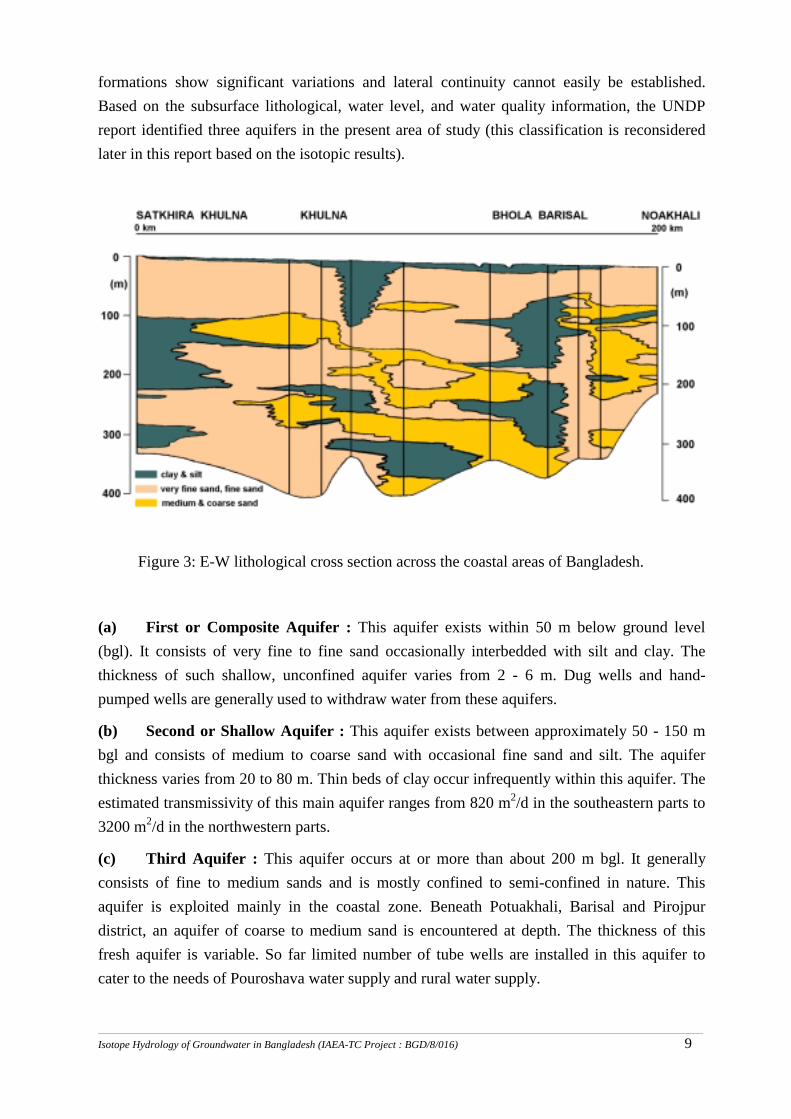
formations show significant variations and lateral continuity cannot easily be established. Based on the subsurface lithological, water level, and water quality information, the UNDP report identified three aquifers in the present area of study (this classification is reconsidered later in this report based on the isotopic results).
(a) First or Composite Aquifer : This aquifer exists within 50 m below ground level (bgl). It consists of very fine to fine sand occasionally interbedded with silt and clay. The thickness of such shallow, unconfined aquifer varies from 2 - 6 m. Dug wells and hand-pumped wells are generally used to withdraw water from these aquifers.
(b) Second or Shallow Aquifer : This aquifer exists between approximately 50 - 150 m bgl and consists of medium to coarse sand with occasional fine sand and silt. The aquifer thickness varies from 20 to 80 m. Thin beds of clay occur infrequently within this aquifer. The estimated transmissivity of this main aquifer ranges from 820 m2/d in the southeastern parts to 3200 m2/d in the northwestern parts.
(c) Third Aquifer : This aquifer occurs at or more than about 200 m bgl. It generally consists of fine to medium sands and is mostly confined to semi-confined in nature. This aquifer is exploited mainly in the coastal zone. Beneath Potuakhali, Barisal and Pirojpur district, an aquifer of coarse to medium sand is encountered at depth. The thickness of this fresh aquifer is variable. So far limited number of tube wells are installed in this aquifer to cater to the needs of Pouroshava water supply and rural water supply.
Figure 3: E-W lithological cross section across the coastal areas of Bangladesh.
_______________________________________________________________________________________________________________________________________________________________________________________________________________________________
Isotope Hydrology of Groundwater in Bangladesh (IAEA-TC Project : BGD/8/016) 10
2.3.2 Historical Trends in Groundwater Levels
As a part of regular monitoring work by the BWDB, the depths to groundwater are measured in piezometric observation wells situated in different parts of the study area. The observed variations are due to: regional groundwater flow, head difference between the aquifers, and confining clay. The piezometric levels drop during the dry period and are replenished completely during the rainy season.
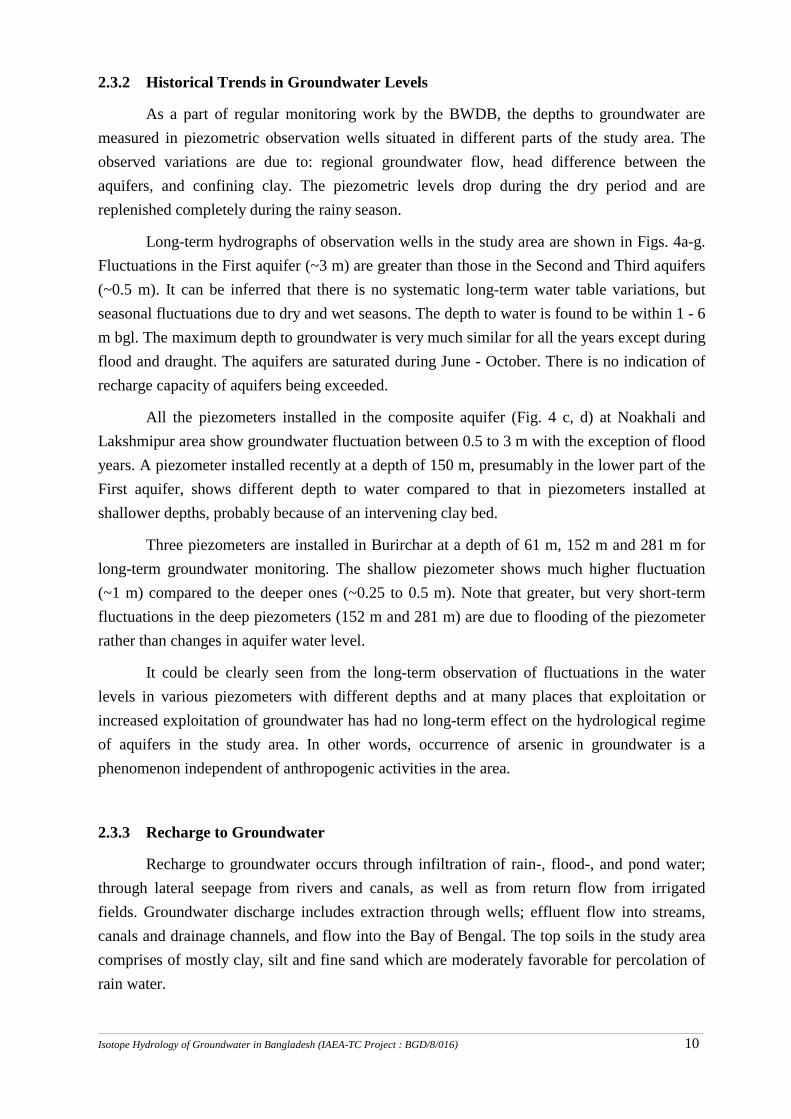
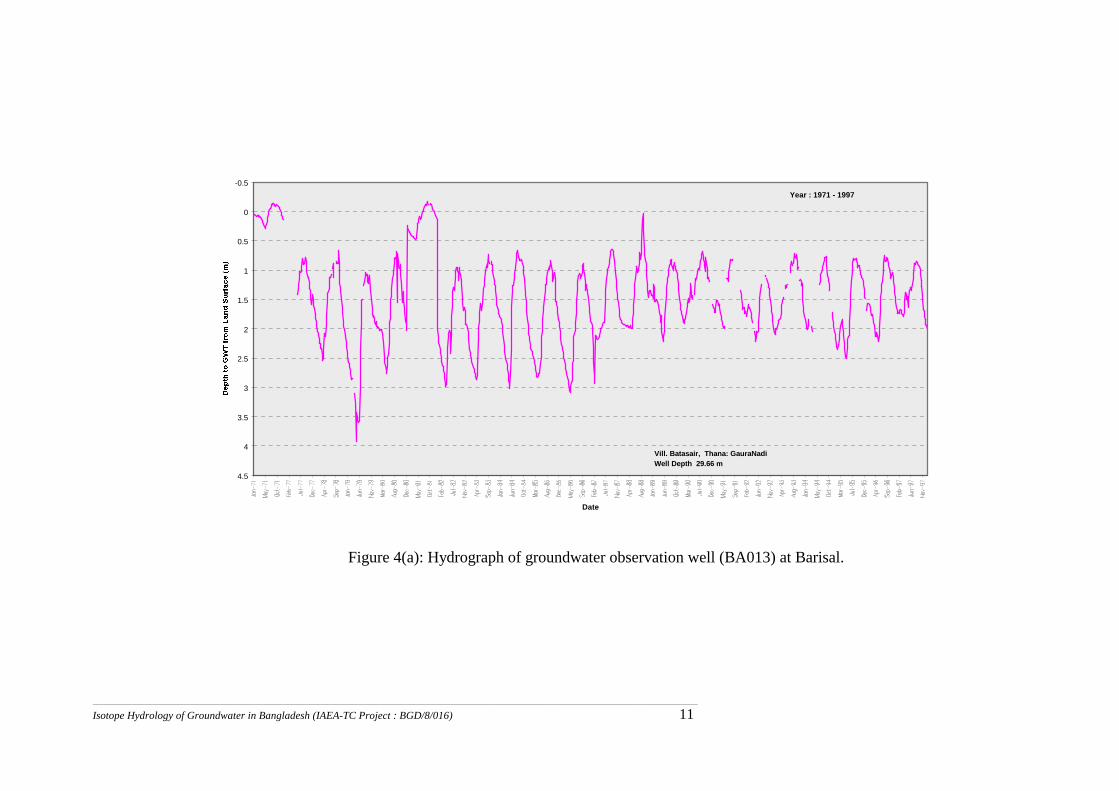
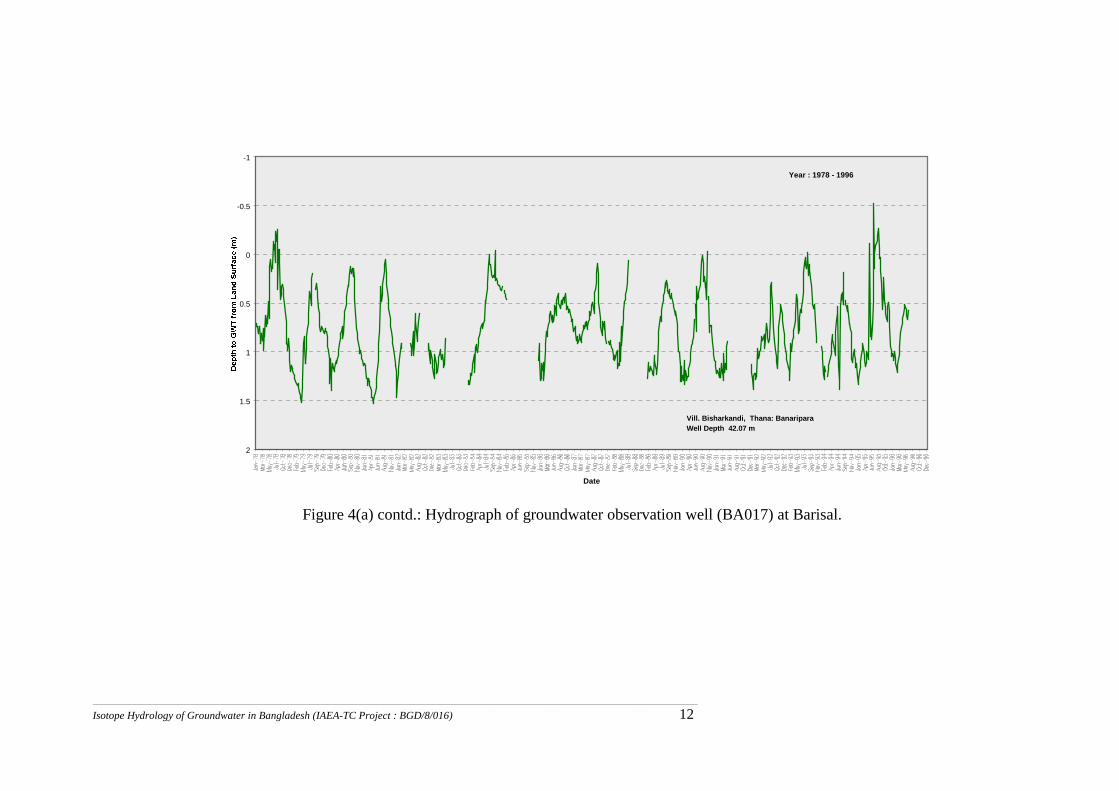
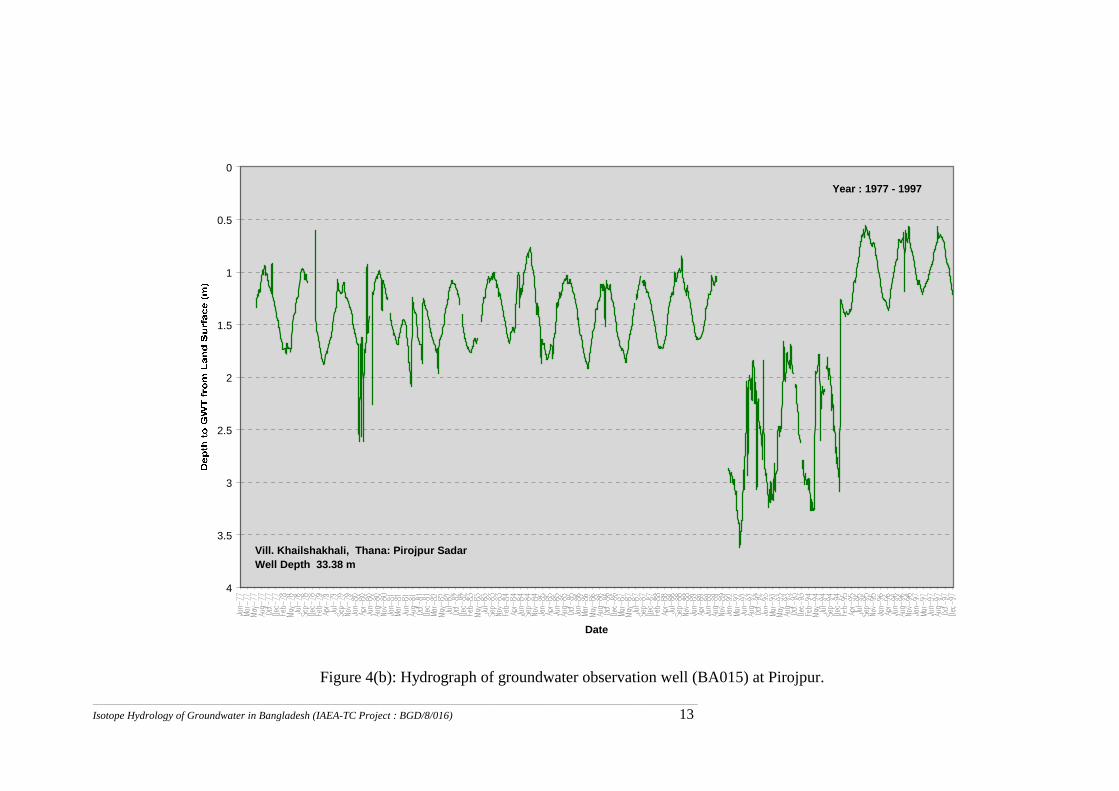
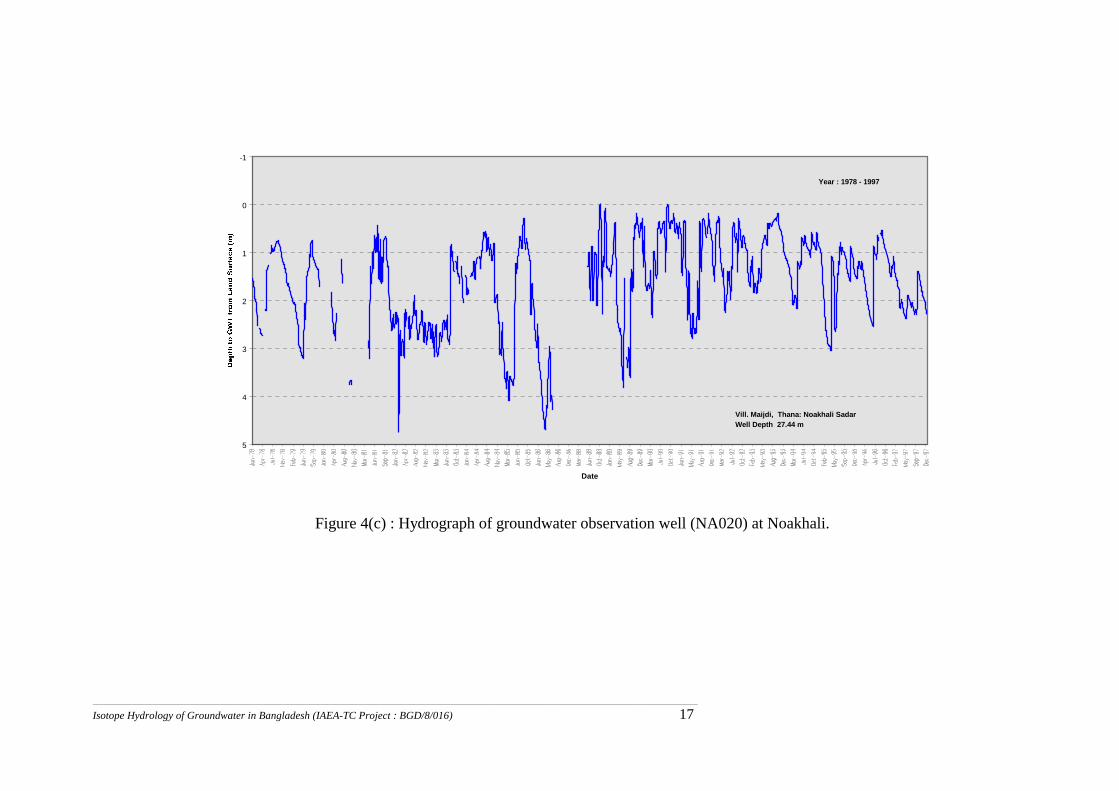
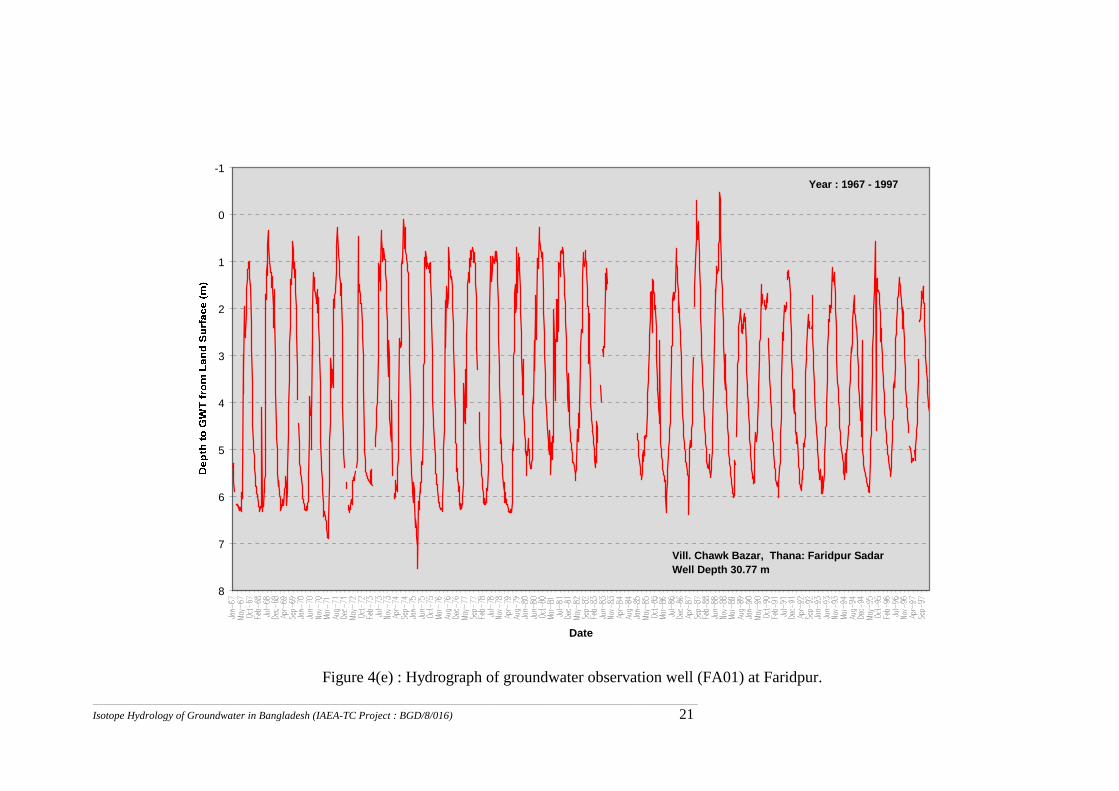
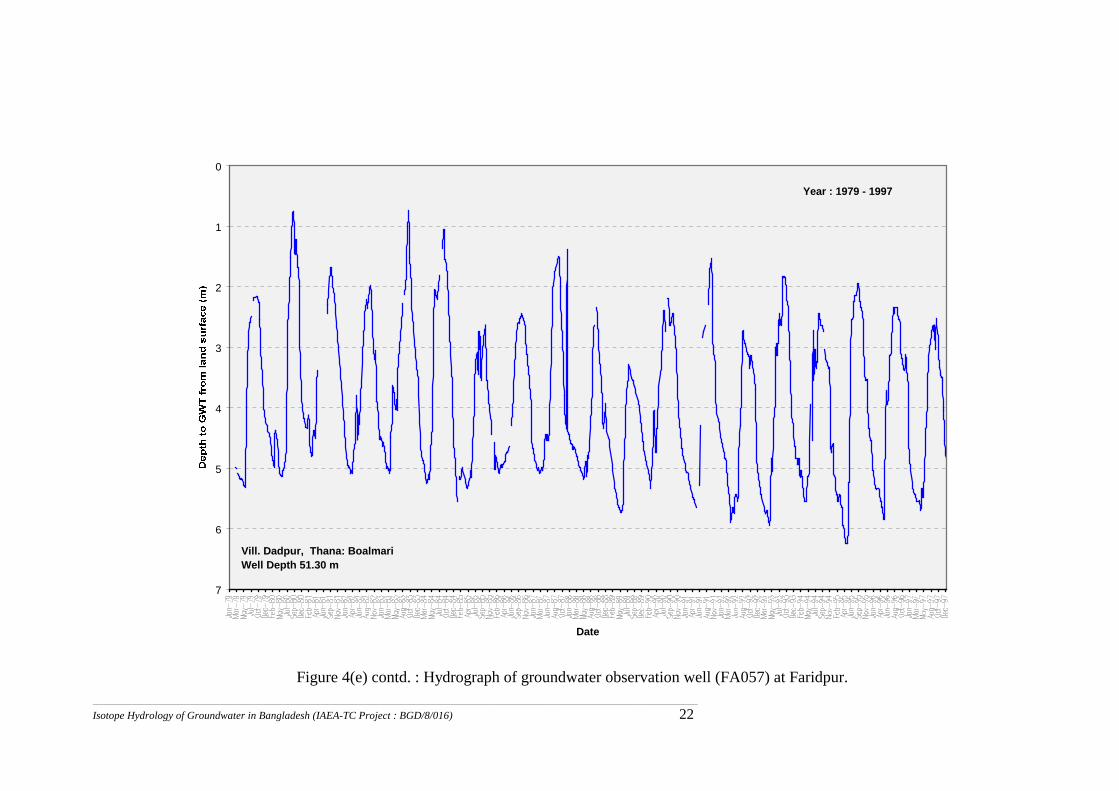
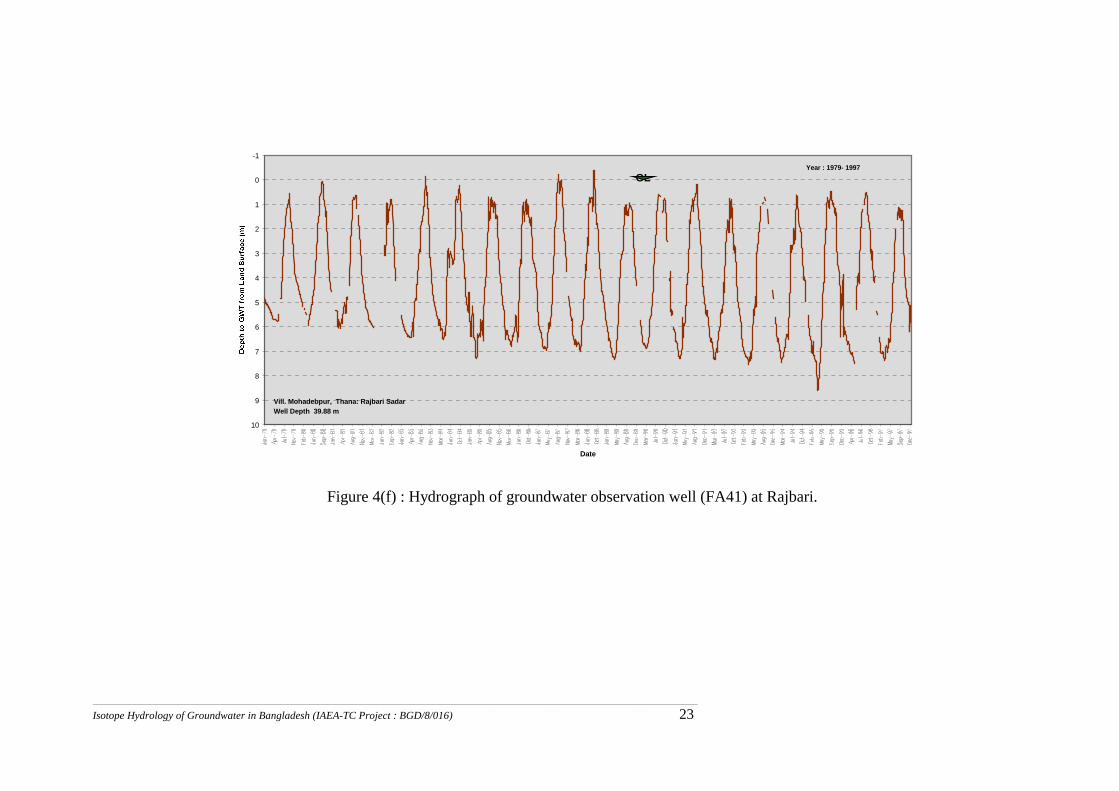
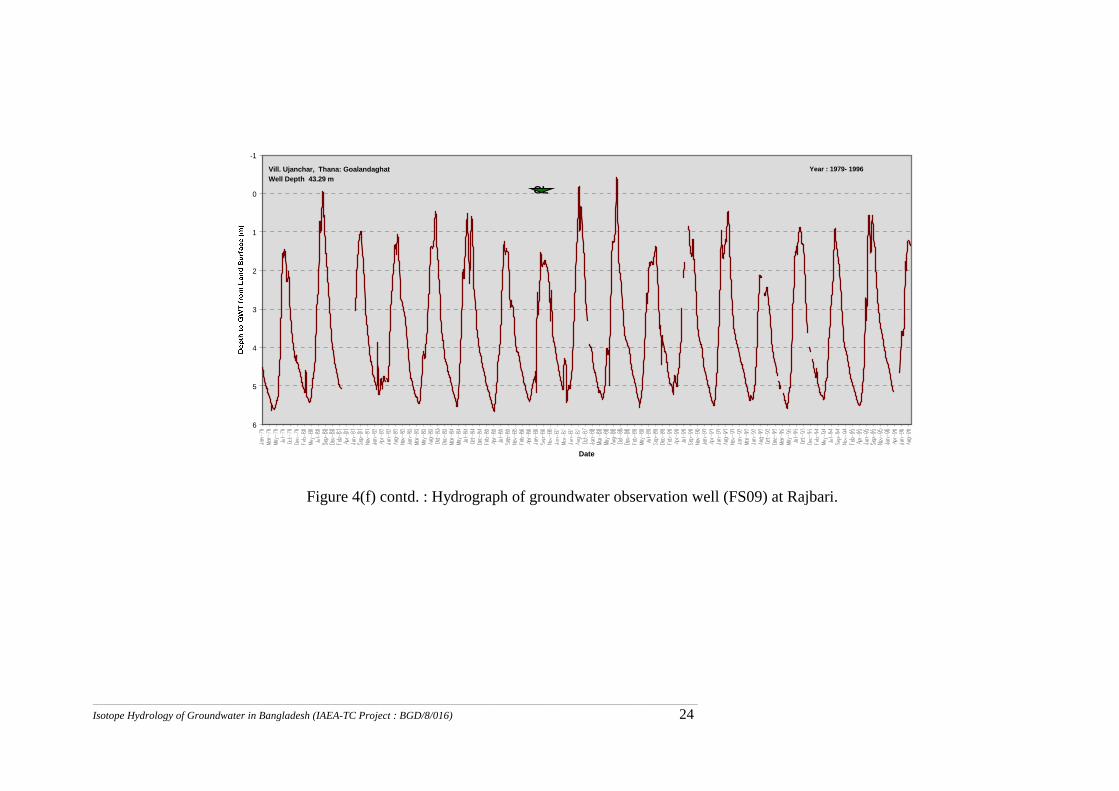
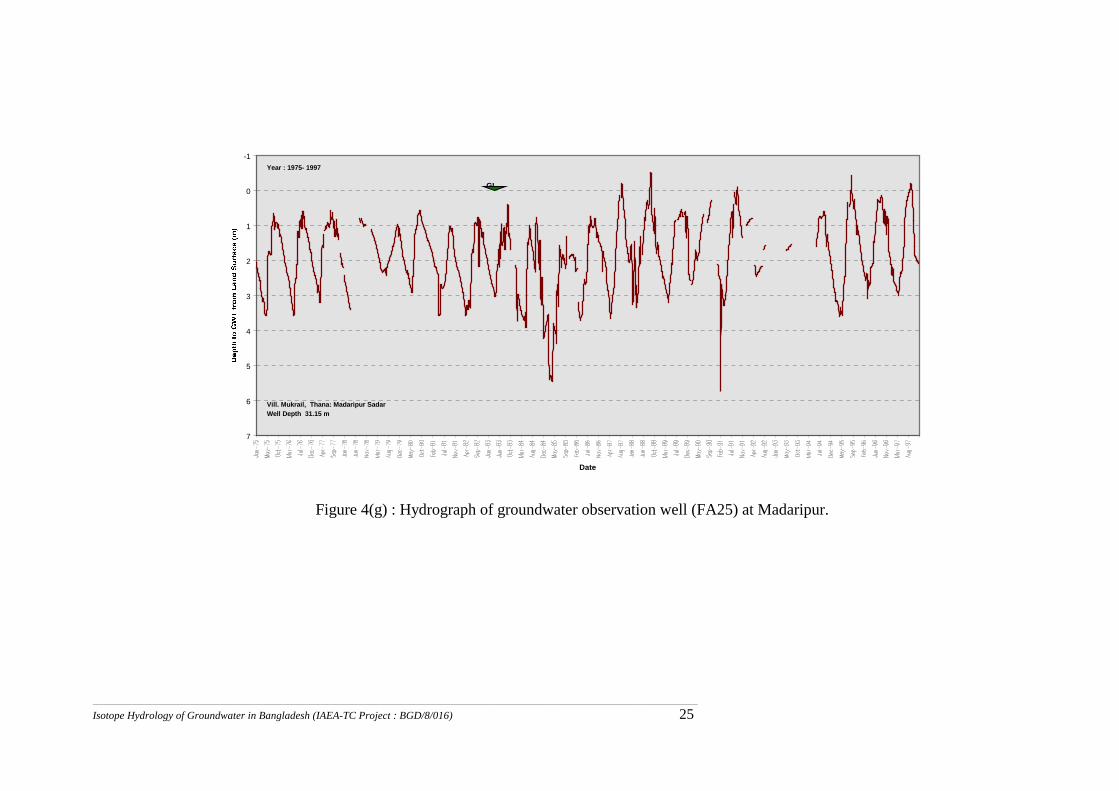
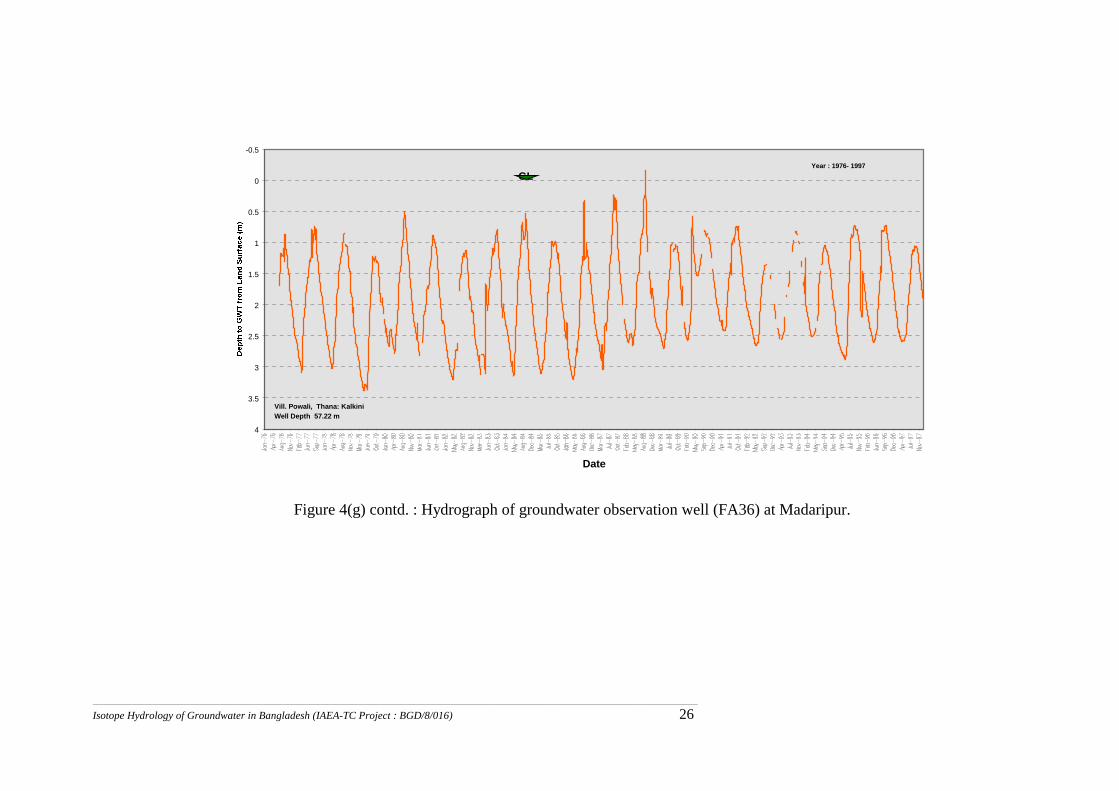
Long-term hydrographs of observation wells in the study area are shown in Figs. 4a-g. Fluctuations in the First aquifer (~3 m) are greater than those in the Second and Third aquifers (~0.5 m). It can be inferred that there is no systematic long-term water table variations, but seasonal fluctuations due to dry and wet seasons. The depth to water is found to be within 1 - 6 m bgl. The maximum depth to groundwater is very much similar for all the years except during flood and draught. The aquifers are saturated during June - October. There is no indication of recharge capacity of aquifers being exceeded.
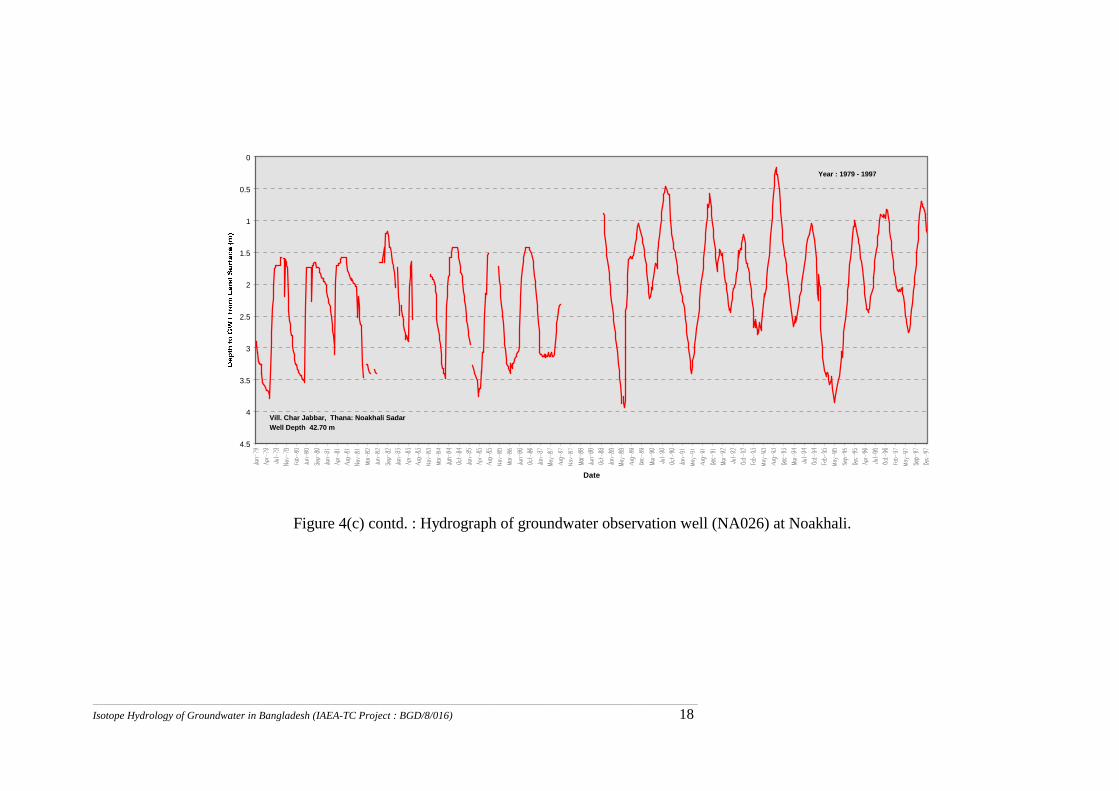
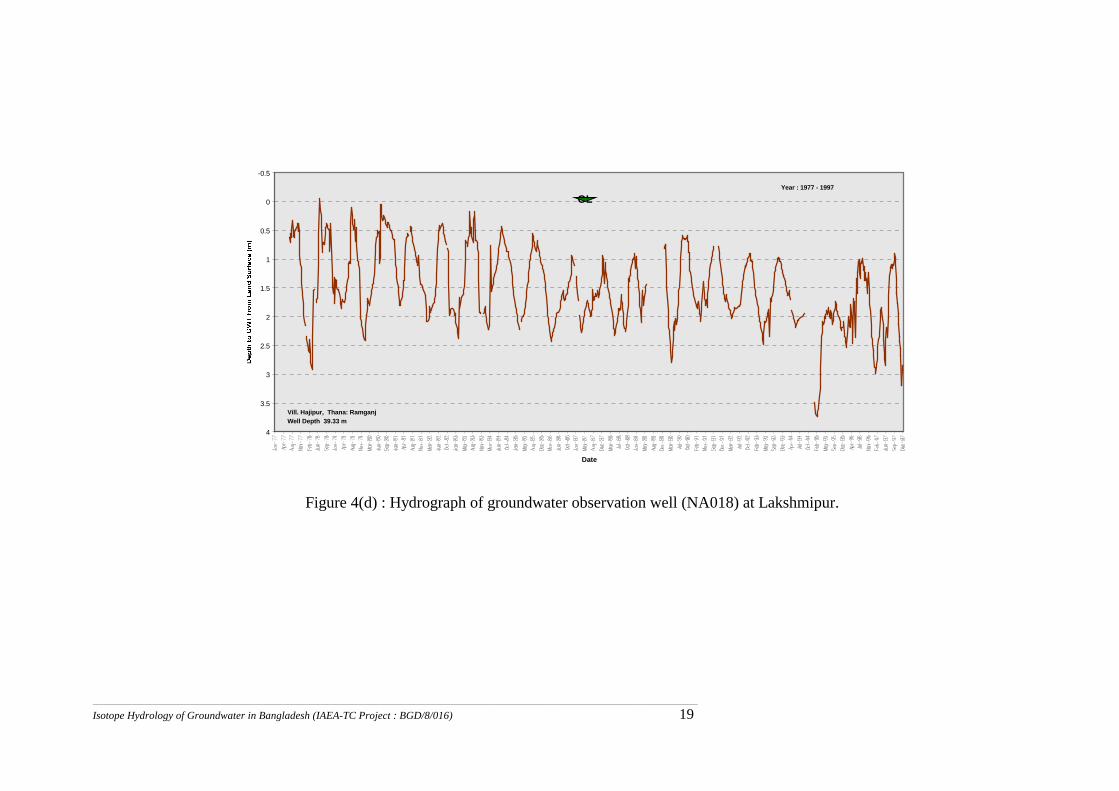
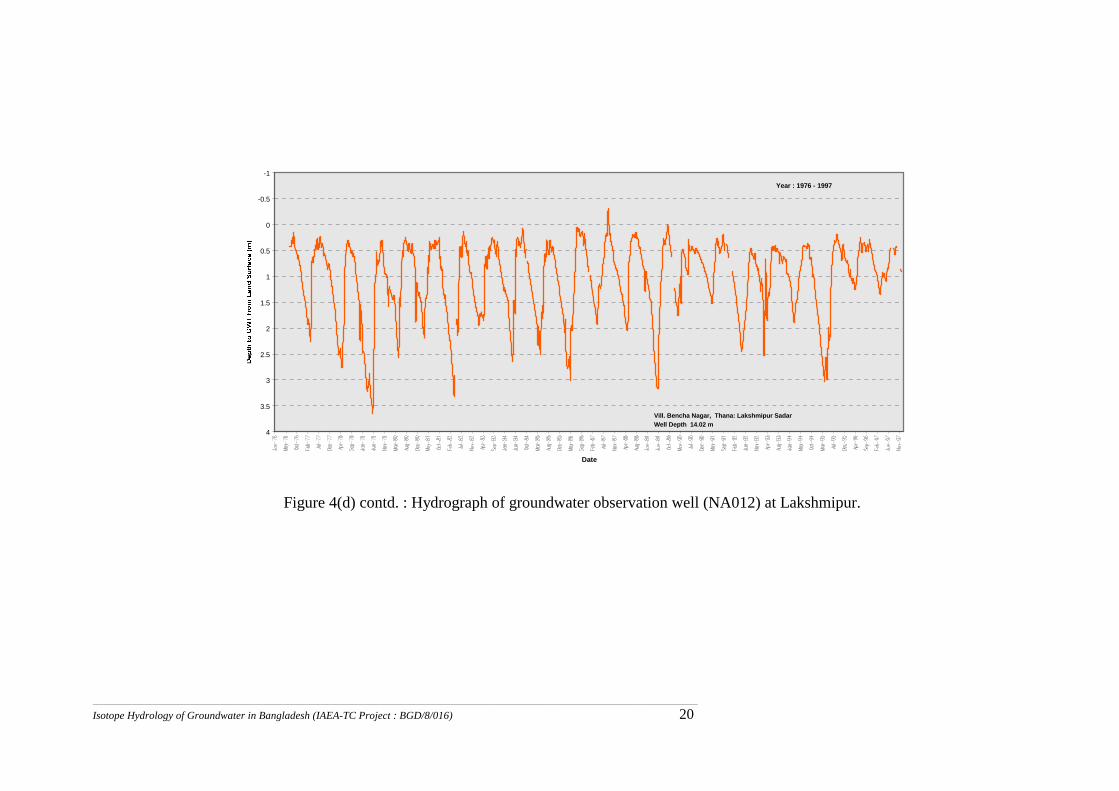
All the piezometers installed in the composite aquifer (Fig. 4 c, d) at Noakhali and Lakshmipur area show groundwater fluctuation between 0.5 to 3 m with the exception of flood years. A piezometer installed recently at a depth of 150 m, presumably in the lower part of the First aquifer, shows different depth to water compared to that in piezometers installed at shallower depths, probably because of an intervening clay bed.
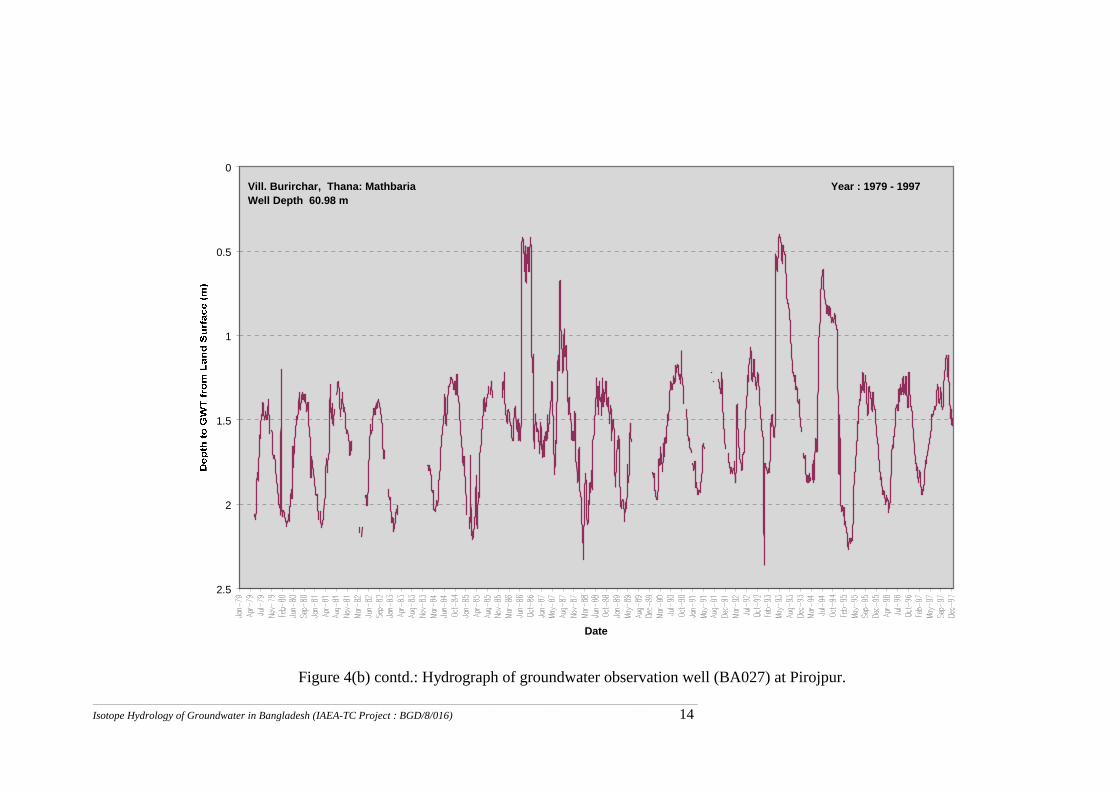
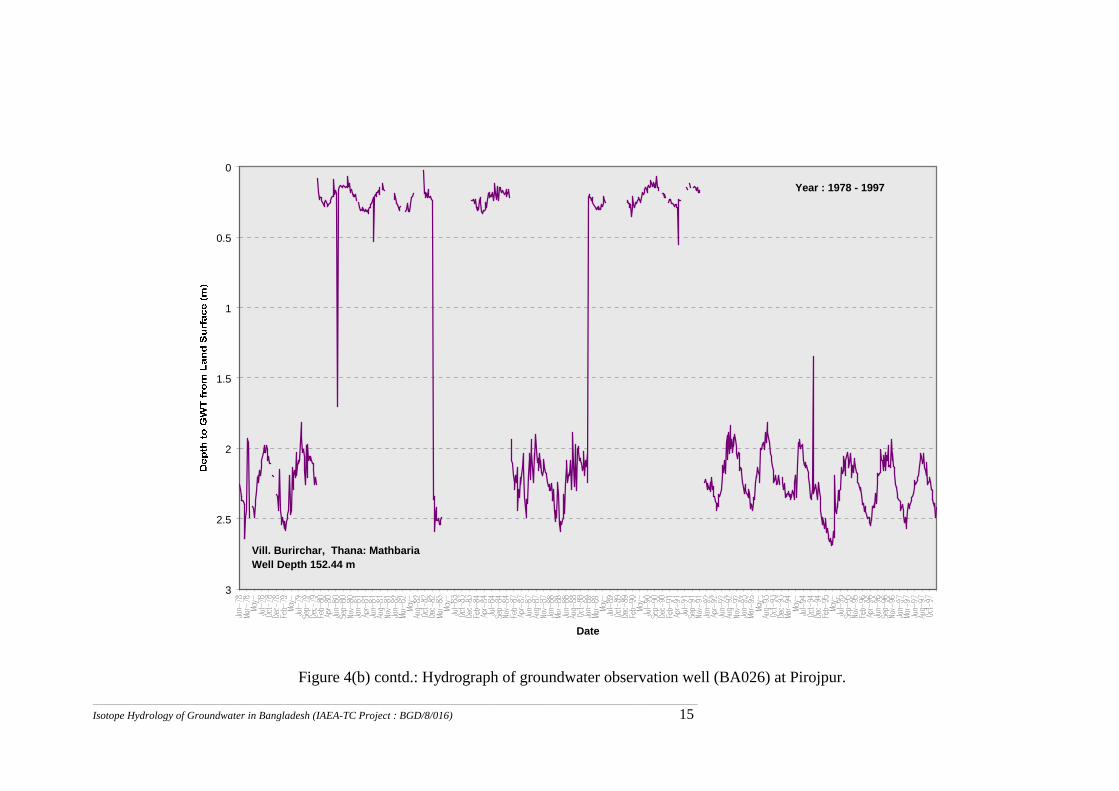
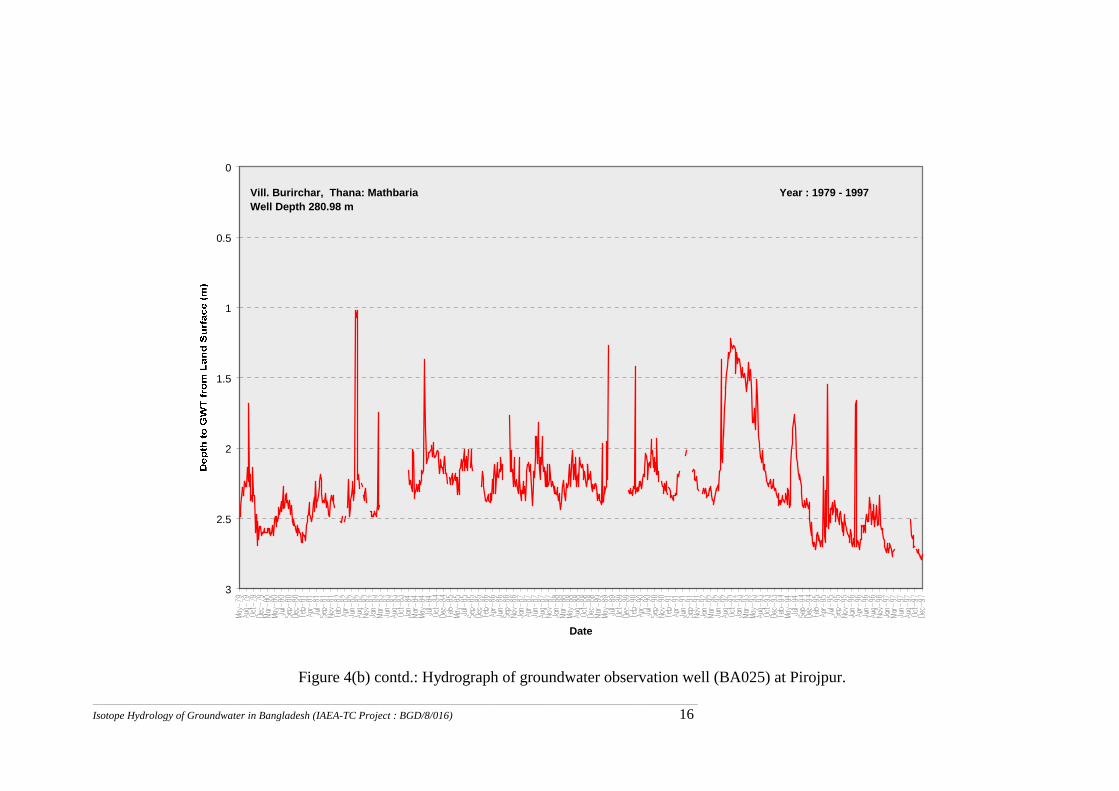
Three piezometers are installed in Burirchar at a depth of 61 m, 152 m and 281 m for long-term groundwater monitoring. The shallow piezometer shows much higher fluctuation (~1 m) compared to the deeper ones (~0.25 to 0.5 m). Note that greater, but very short-term fluctuations in the deep piezometers (152 m and 281 m) are due to flooding of the piezometer rather than changes in aquifer water level.
It could be clearly seen from the long-term observation of fluctuations in the water levels in various piezometers with different depths and at many places that exploitation or increased exploitation of groundwater has had no long-term effect on the hydrological regime of aquifers in the study area. In other words, occurrence of arsenic in groundwater is a phenomenon independent of anthropogenic activities in the area.
2.3.3 Recharge to Groundwater
Recharge to groundwater occurs through infiltration of rain-, flood-, and pond water; through lateral seepage from rivers and canals, as well as from return flow from irrigated fields. Groundwater discharge includes extraction through wells; effluent flow into streams, canals and drainage channels, and flow into the Bay of Bengal. The top soils in the study area comprises of mostly clay, silt and fine sand which are moderately favorable for percolation of rain water.
_______________________________________________________________________________________________________________________________________________________________________________________________________________________________
Isotope Hydrology of Groundwater in Bangladesh (IAEA-TC Project : BGD/8/016) 11
-0.5
0
0.5
1
1.5
2
2.5
3
3.5
4
4.5
Date
Vill. Batasair, Thana: GauraNadiWell Depth 29.66 m
Year : 1971 - 1997
Figure 4(a): Hydrograph of groundwater observation well (BA013) at Barisal.
_______________________________________________________________________________________________________________________________________________________________________________________________________________________________
Isotope Hydrology of Groundwater in Bangladesh (IAEA-TC Project : BGD/8/016) 12
-1
-0.5
0
0.5
1
1.5
2
Date
Vill. Bisharkandi, Thana: BanariparaWell Depth 42.07 m
Year : 1978 - 1996
Figure 4(a) contd.: Hydrograph of groundwater observation well (BA017) at Barisal.
_______________________________________________________________________________________________________________________________________________________________________________________________________________________________
Isotope Hydrology of Groundwater in Bangladesh (IAEA-TC Project : BGD/8/016) 13
0
0.5
1
1.5
2
2.5
3
3.5
4
Date
Vill. Khailshakhali, Thana: Pirojpur SadarWell Depth 33.38 m
Year : 1977 - 1997
Figure 4(b): Hydrograph of groundwater observation well (BA015) at Pirojpur.
_______________________________________________________________________________________________________________________________________________________________________________________________________________________________
Isotope Hydrology of Groundwater in Bangladesh (IAEA-TC Project : BGD/8/016) 14
0
0.5
1
1.5
2
2.5
Date
Vill. Burirchar, Thana: MathbariaWell Depth 60.98 m
Year : 1979 - 1997
Figure 4(b) contd.: Hydrograph of groundwater observation well (BA027) at Pirojpur.
_______________________________________________________________________________________________________________________________________________________________________________________________________________________________
Isotope Hydrology of Groundwater in Bangladesh (IAEA-TC Project : BGD/8/016) 15
0
0.5
1
1.5
2
2.5
3
Date
Year : 1978 - 1997
Vill. Burirchar, Thana: MathbariaWell Depth 152.44 m
Figure 4(b) contd.: Hydrograph of groundwater observation well (BA026) at Pirojpur.
_______________________________________________________________________________________________________________________________________________________________________________________________________________________________
Isotope Hydrology of Groundwater in Bangladesh (IAEA-TC Project : BGD/8/016) 16
0
0.5
1
1.5
2
2.5
3
Date
Vill. Burirchar, Thana: MathbariaWell Depth 280.98 m
Year : 1979 - 1997
Figure 4(b) contd.: Hydrograph of groundwater observation well (BA025) at Pirojpur.
_______________________________________________________________________________________________________________________________________________________________________________________________________________________________
Isotope Hydrology of Groundwater in Bangladesh (IAEA-TC Project : BGD/8/016) 17
-1
0
1
2
3
4
5
Date
Vill. Maijdi, Thana: Noakhali SadarWell Depth 27.44 m
Year : 1978 - 1997
Figure 4(c) : Hydrograph of groundwater observation well (NA020) at Noakhali.
_______________________________________________________________________________________________________________________________________________________________________________________________________________________________
Isotope Hydrology of Groundwater in Bangladesh (IAEA-TC Project : BGD/8/016) 18
0
0.5
1
1.5
2
2.5
3
3.5
4
4.5
Date
Vill. Char Jabbar, Thana: Noakhali SadarWell Depth 42.70 m
Year : 1979 - 1997
Figure 4(c) contd. : Hydrograph of groundwater observation well (NA026) at Noakhali.
_______________________________________________________________________________________________________________________________________________________________________________________________________________________________
Isotope Hydrology of Groundwater in Bangladesh (IAEA-TC Project : BGD/8/016) 19
-0.5
0
0.5
1
1.5
2
2.5
3
3.5
4
Date
Vill. Hajipur, Thana: RamganjWell Depth 39.33 m
Year : 1977 - 1997
GL
Figure 4(d) : Hydrograph of groundwater observation well (NA018) at Lakshmipur.
_______________________________________________________________________________________________________________________________________________________________________________________________________________________________
Isotope Hydrology of Groundwater in Bangladesh (IAEA-TC Project : BGD/8/016) 20
-1
-0.5
0
0.5
1
1.5
2
2.5
3
3.5
4
Date
Vill. Bencha Nagar, Thana: Lakshmipur SadarWell Depth 14.02 m
Year : 1976 - 1997
Figure 4(d) contd. : Hydrograph of groundwater observation well (NA012) at Lakshmipur.
_______________________________________________________________________________________________________________________________________________________________________________________________________________________________
Isotope Hydrology of Groundwater in Bangladesh (IAEA-TC Project : BGD/8/016) 21
-1
0
1
2
3
4
5
6
7
8
Date
Vill. Chawk Bazar, Thana: Faridpur SadarWell Depth 30.77 m
Year : 1967 - 1997
Figure 4(e) : Hydrograph of groundwater observation well (FA01) at Faridpur.
_______________________________________________________________________________________________________________________________________________________________________________________________________________________________
Isotope Hydrology of Groundwater in Bangladesh (IAEA-TC Project : BGD/8/016) 22
0
1
2
3
4
5
6
7
Date
Vill. Dadpur, Thana: BoalmariWell Depth 51.30 m
Year : 1979 - 1997
Figure 4(e) contd. : Hydrograph of groundwater observation well (FA057) at Faridpur.
_______________________________________________________________________________________________________________________________________________________________________________________________________________________________
Isotope Hydrology of Groundwater in Bangladesh (IAEA-TC Project : BGD/8/016) 23
-1
0
1
2
3
4
5
6
7
8
9
10
Date
Vill. Mohadebpur, Thana: Rajbari SadarWell Depth 39.88 m
Year : 1979- 1997GL
Figure 4(f) : Hydrograph of groundwater observation well (FA41) at Rajbari.
_______________________________________________________________________________________________________________________________________________________________________________________________________________________________
Isotope Hydrology of Groundwater in Bangladesh (IAEA-TC Project : BGD/8/016) 24
-1
0
1
2
3
4
5
6
Date
Vill. Ujanchar, Thana: GoalandaghatWell Depth 43.29 m
Year : 1979- 1996
GL
Figure 4(f) contd. : Hydrograph of groundwater observation well (FS09) at Rajbari.
_______________________________________________________________________________________________________________________________________________________________________________________________________________________________
Isotope Hydrology of Groundwater in Bangladesh (IAEA-TC Project : BGD/8/016) 25
-1
0
1
2
3
4
5
6
7
Date
Vill. Mukrail, Thana: Madaripur SadarWell Depth 31.15 m
Year : 1975- 1997
GL
Figure 4(g) : Hydrograph of groundwater observation well (FA25) at Madaripur.
_______________________________________________________________________________________________________________________________________________________________________________________________________________________________
Isotope Hydrology of Groundwater in Bangladesh (IAEA-TC Project : BGD/8/016) 26
-0.5
0
0.5
1
1.5
2
2.5
3
3.5
4
Date
Vill. Powali, Thana: KalkiniWell Depth 57.22 m
Year : 1976- 1997GL
Figure 4(g) contd. : Hydrograph of groundwater observation well (FA36) at Madaripur.
_______________________________________________________________________________________________________________________________________________________________________________________________________________________________
Isotope Hydrology of Groundwater in Bangladesh (IAEA-TC Project : BGD/8/016) 27
2.3.4 Groundwater and Surface Water Relationship
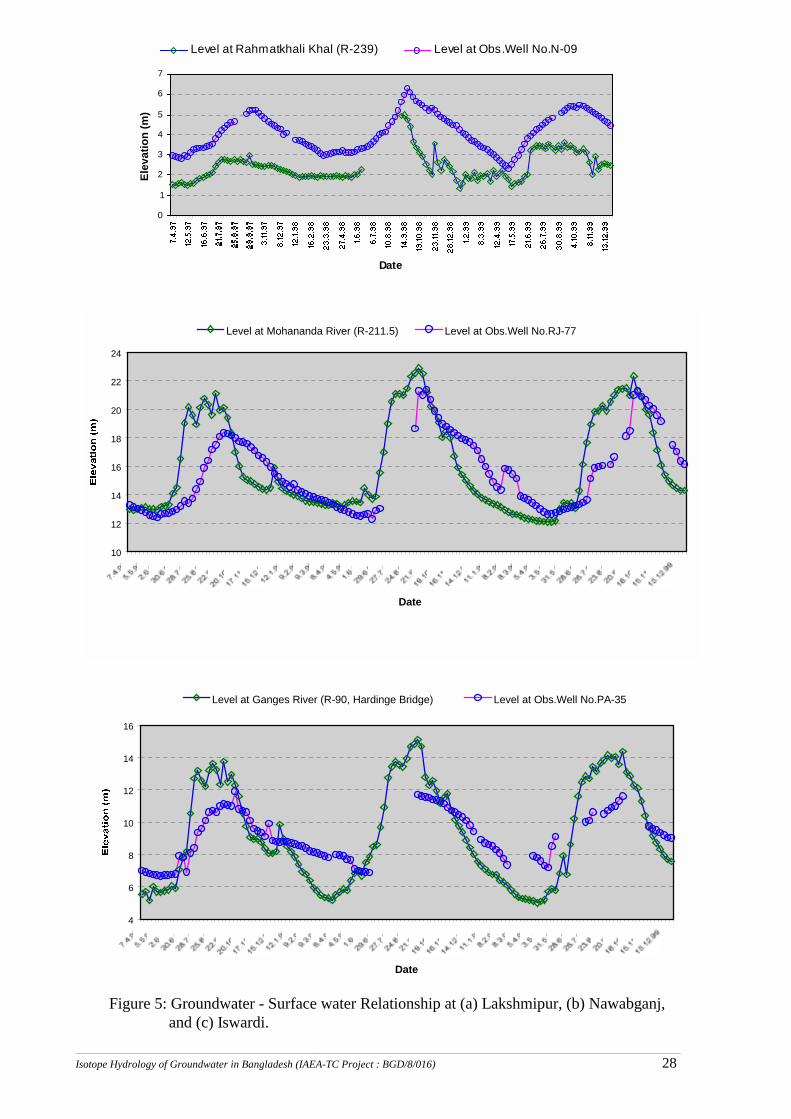
Surface water - groundwater relationship varies in different parts of Bangladesh. Rivers gain and lose water to aquifers in different part and in different seasons. Long-term hydrographs of three piezometers (Well Nos. RJ-77, PA-35 and N-09) and corresponding river stages (Station Nos. WL-211.5, WL-90 and WL-239) for the period 1979-1999 (Fig. 5 a-c) show the typical relationships.
The hydrographs of representative observation wells illustrate the behavior of aquifers. From Fig. 5a it can be seen that water level fluctuations in the piezometer follow that of the river and the water level in the river is higher compared to that of the piezometer. Thus, there appears to be a strong influence of river on the groundwater. In Chapai Nawabganj area, the river level is higher during the rainy season but lower during the dry season (Fig. 5b). In this case, reasonable influence of river on groundwater is expected during the monsoon season only whereas in the Iswardi area (Fig. 5c) there appears to be no influence of river on the groundwater. In this case, the fluctuations reflected are seasonal.
In the western and central parts, the river gains water from the surrounding aquifers throughout the year except during the wet season. Thus, hydraulic continuity exists between surface water and groundwater system and is expected at various other places also.
2.3.5 Groundwater Quality
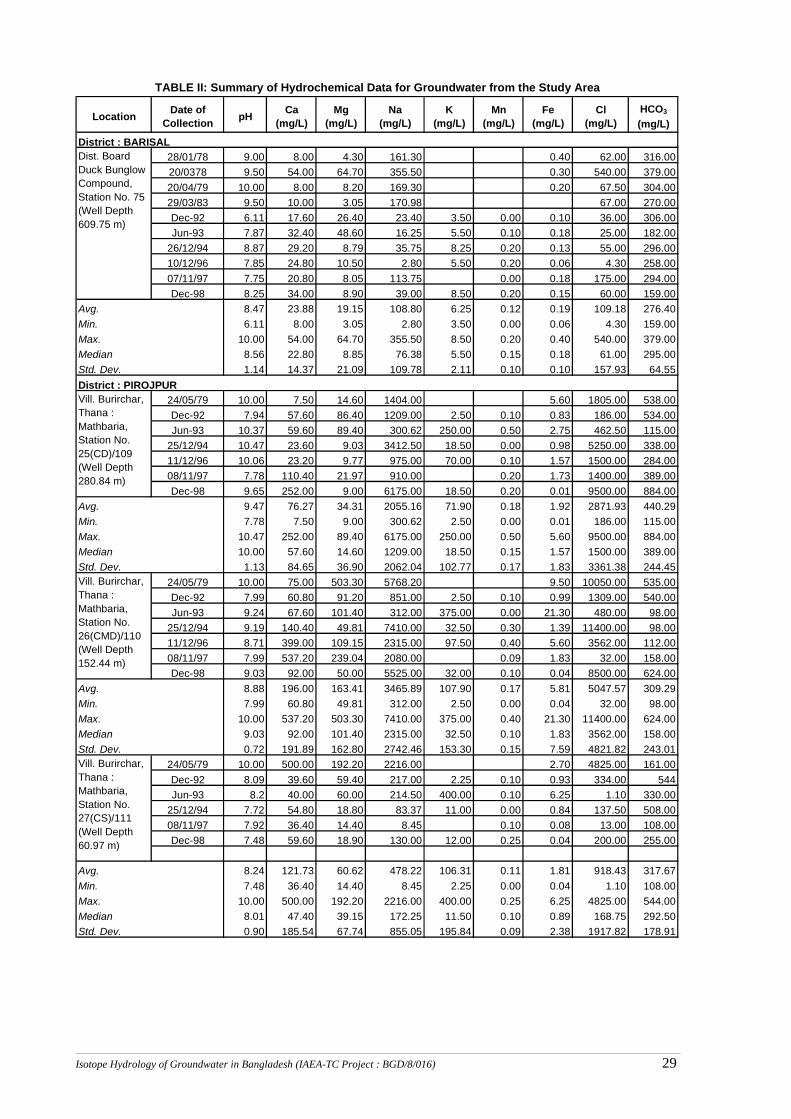
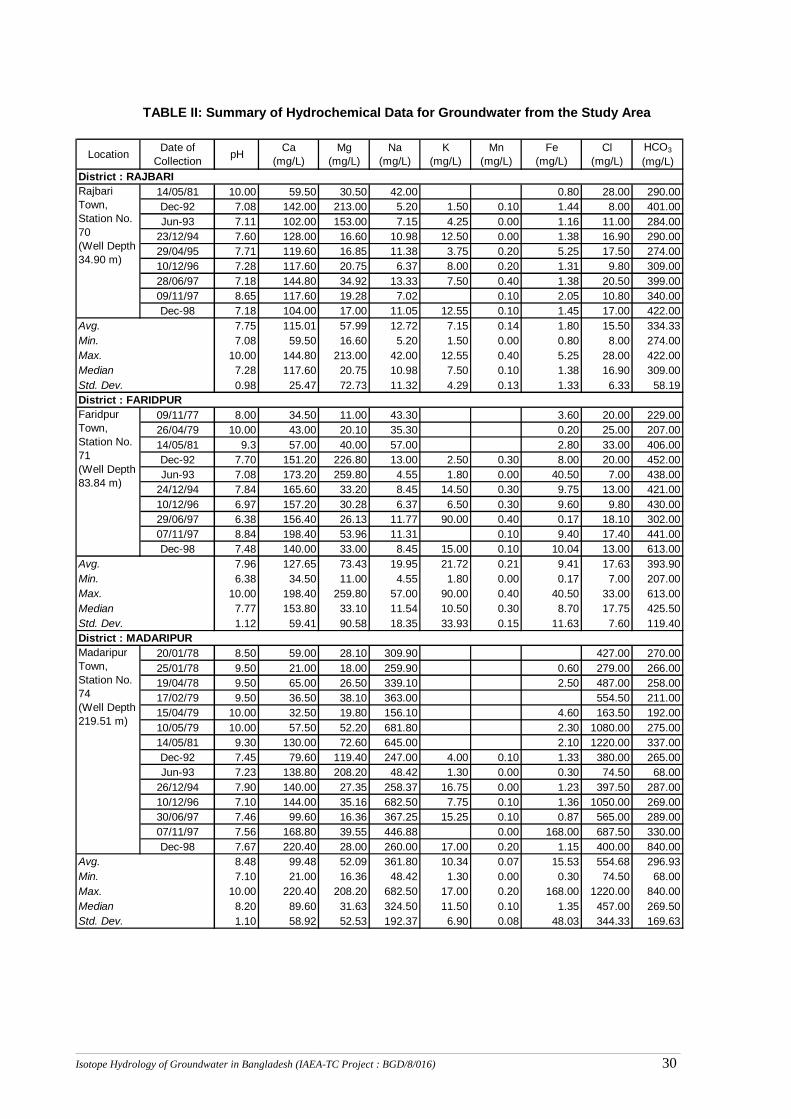
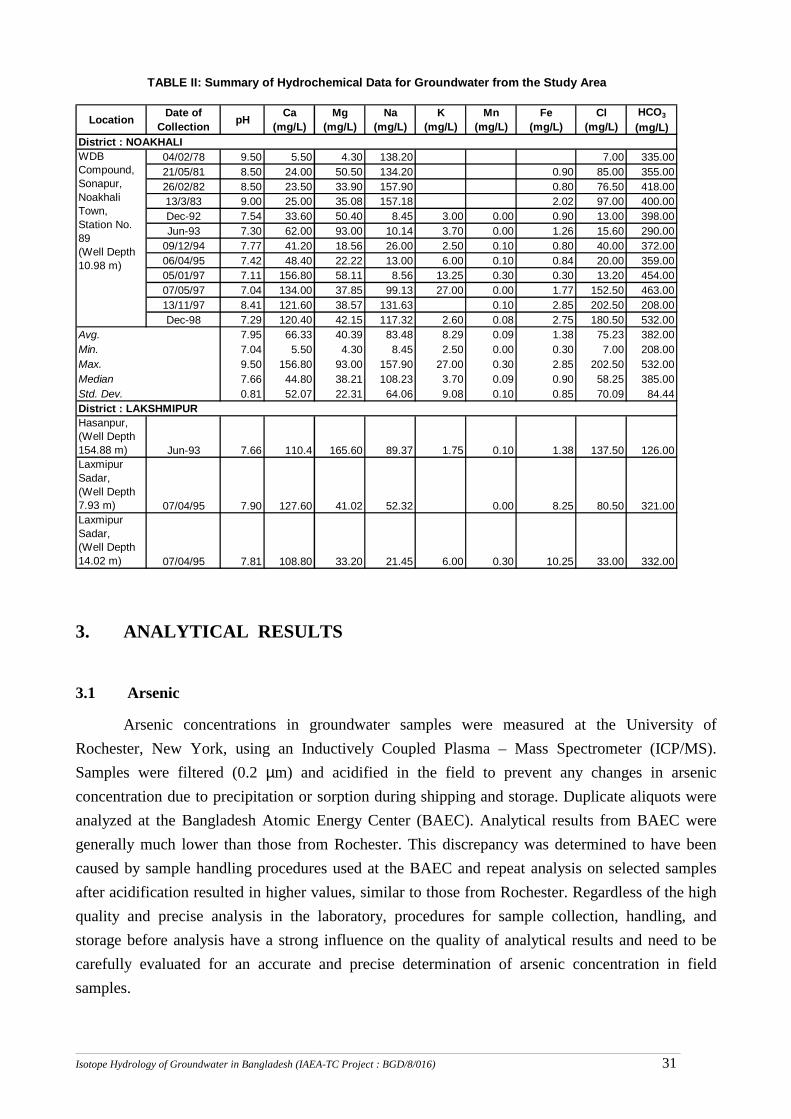
Groundwater Quality Monitoring Program is a routine work of Ground Water Hydrology Circle of BWDB. As a part of long-term groundwater quality monitoring program, groundwater samples are collected during the post-monsoon period for chemical analysis. Analysis of groundwater has indicated that the quality changes from place to place and also depth wise. Interpretation of the major ion hydrogeochemical data of groundwater both in shallow and deep aquifers indicates that groundwater in the deep aquifers is of Na-Ca-Mg-Cl-HCO3 type and that in the shallow aquifers is of Na-Cl-HCO3 type. The arsenic-contaminated aquifers yield mainly bicarbonate type groundwater and have a relatively high concentration of iron and manganese. Table II summarizes the major ion chemical quality of the groundwater in various parts of Bangladesh.
The chemistry of both iron and arsenic is known to be sensitive to redox conditions. Groundwater from the Pleistocene terraces is quite distinct and is relatively oxidizing. Groundwater beneath the Meghna and Ganges floodplains is strongly reducing. Groundwater beneath the Brahmaputra floodplains has intermediate redox potential. Very high arsenic concentrations occur in strongly reducing waters with relatively high concentrations of iron and manganese.
_______________________________________________________________________________________________________________________________________________________________________________________________________________________________
Isotope Hydrology of Groundwater in Bangladesh (IAEA-TC Project : BGD/8/016) 28
0
1
2
3
4
5
6
7
Date
Elev
atio
n (m
)
Level at Rahmatkhali Khal (R-239) Level at Obs.Well No.N-09
10
12
14
16
18
20
22
24
Date
Level at Mohananda River (R-211.5) Level at Obs.Well No.RJ-77
4
6
8
10
12
14
16
Date
Level at Ganges River (R-90, Hardinge Bridge) Level at Obs.Well No.PA-35
Figure 5: Groundwater - Surface water Relationship at (a) Lakshmipur, (b) Nawabganj, and (c) Iswardi.
_______________________________________________________________________________________________________________________________________________________________________________________________________________________________
Isotope Hydrology of Groundwater in Bangladesh (IAEA-TC Project : BGD/8/016) 29
Location Date of Collection pH Ca
(mg/L)Mg
(mg/L)Na
(mg/L)K
(mg/L)Mn
(mg/L)Fe
(mg/L)Cl
(mg/L)HCO3
(mg/L)District : BARISAL
28/01/78 9.00 8.00 4.30 161.30 0.40 62.00 316.0020/0378 9.50 54.00 64.70 355.50 0.30 540.00 379.0020/04/79 10.00 8.00 8.20 169.30 0.20 67.50 304.0029/03/83 9.50 10.00 3.05 170.98 67.00 270.00Dec-92 6.11 17.60 26.40 23.40 3.50 0.00 0.10 36.00 306.00Jun-93 7.87 32.40 48.60 16.25 5.50 0.10 0.18 25.00 182.00
26/12/94 8.87 29.20 8.79 35.75 8.25 0.20 0.13 55.00 296.0010/12/96 7.85 24.80 10.50 2.80 5.50 0.20 0.06 4.30 258.0007/11/97 7.75 20.80 8.05 113.75 0.00 0.18 175.00 294.00Dec-98 8.25 34.00 8.90 39.00 8.50 0.20 0.15 60.00 159.00
Avg. 8.47 23.88 19.15 108.80 6.25 0.12 0.19 109.18 276.40Min. 6.11 8.00 3.05 2.80 3.50 0.00 0.06 4.30 159.00Max. 10.00 54.00 64.70 355.50 8.50 0.20 0.40 540.00 379.00Median 8.56 22.80 8.85 76.38 5.50 0.15 0.18 61.00 295.00Std. Dev. 1.14 14.37 21.09 109.78 2.11 0.10 0.10 157.93 64.55District : PIROJPUR
24/05/79 10.00 7.50 14.60 1404.00 5.60 1805.00 538.00Dec-92 7.94 57.60 86.40 1209.00 2.50 0.10 0.83 186.00 534.00Jun-93 10.37 59.60 89.40 300.62 250.00 0.50 2.75 462.50 115.00
25/12/94 10.47 23.60 9.03 3412.50 18.50 0.00 0.98 5250.00 338.0011/12/96 10.06 23.20 9.77 975.00 70.00 0.10 1.57 1500.00 284.0008/11/97 7.78 110.40 21.97 910.00 0.20 1.73 1400.00 389.00Dec-98 9.65 252.00 9.00 6175.00 18.50 0.20 0.01 9500.00 884.00
Avg. 9.47 76.27 34.31 2055.16 71.90 0.18 1.92 2871.93 440.29Min. 7.78 7.50 9.00 300.62 2.50 0.00 0.01 186.00 115.00Max. 10.47 252.00 89.40 6175.00 250.00 0.50 5.60 9500.00 884.00Median 10.00 57.60 14.60 1209.00 18.50 0.15 1.57 1500.00 389.00Std. Dev. 1.13 84.65 36.90 2062.04 102.77 0.17 1.83 3361.38 244.45
24/05/79 10.00 75.00 503.30 5768.20 9.50 10050.00 535.00Dec-92 7.99 60.80 91.20 851.00 2.50 0.10 0.99 1309.00 540.00Jun-93 9.24 67.60 101.40 312.00 375.00 0.00 21.30 480.00 98.00
25/12/94 9.19 140.40 49.81 7410.00 32.50 0.30 1.39 11400.00 98.0011/12/96 8.71 399.00 109.15 2315.00 97.50 0.40 5.60 3562.00 112.0008/11/97 7.99 537.20 239.04 2080.00 0.09 1.83 32.00 158.00Dec-98 9.03 92.00 50.00 5525.00 32.00 0.10 0.04 8500.00 624.00
Avg. 8.88 196.00 163.41 3465.89 107.90 0.17 5.81 5047.57 309.29Min. 7.99 60.80 49.81 312.00 2.50 0.00 0.04 32.00 98.00Max. 10.00 537.20 503.30 7410.00 375.00 0.40 21.30 11400.00 624.00Median 9.03 92.00 101.40 2315.00 32.50 0.10 1.83 3562.00 158.00Std. Dev. 0.72 191.89 162.80 2742.46 153.30 0.15 7.59 4821.82 243.01
24/05/79 10.00 500.00 192.20 2216.00 2.70 4825.00 161.00Dec-92 8.09 39.60 59.40 217.00 2.25 0.10 0.93 334.00 544Jun-93 8.2 40.00 60.00 214.50 400.00 0.10 6.25 1.10 330.00
25/12/94 7.72 54.80 18.80 83.37 11.00 0.00 0.84 137.50 508.0008/11/97 7.92 36.40 14.40 8.45 0.10 0.08 13.00 108.00Dec-98 7.48 59.60 18.90 130.00 12.00 0.25 0.04 200.00 255.00
Avg. 8.24 121.73 60.62 478.22 106.31 0.11 1.81 918.43 317.67Min. 7.48 36.40 14.40 8.45 2.25 0.00 0.04 1.10 108.00Max. 10.00 500.00 192.20 2216.00 400.00 0.25 6.25 4825.00 544.00Median 8.01 47.40 39.15 172.25 11.50 0.10 0.89 168.75 292.50Std. Dev. 0.90 185.54 67.74 855.05 195.84 0.09 2.38 1917.82 178.91
TABLE II: Summary of Hydrochemical Data for Groundwater from the Study Area
Vill. Burirchar, Thana : Mathbaria, Station No. 26(CMD)/110 (Well Depth 152.44 m)
Vill. Burirchar, Thana : Mathbaria, Station No. 27(CS)/111 (Well Depth 60.97 m)
Dist. Board Duck Bunglow Compound, Station No. 75 (Well Depth 609.75 m)
Vill. Burirchar, Thana : Mathbaria, Station No. 25(CD)/109 (Well Depth 280.84 m)
_______________________________________________________________________________________________________________________________________________________________________________________________________________________________
Isotope Hydrology of Groundwater in Bangladesh (IAEA-TC Project : BGD/8/016) 30
TABLE II: Summary of Hydrochemical Data for Groundwater from the Study Area
Location Date of Collection pH Ca
(mg/L)Mg
(mg/L)Na
(mg/L)K
(mg/L)Mn
(mg/L)Fe
(mg/L)Cl
(mg/L)HCO3
(mg/L)District : RAJBARI
14/05/81 10.00 59.50 30.50 42.00 0.80 28.00 290.00Dec-92 7.08 142.00 213.00 5.20 1.50 0.10 1.44 8.00 401.00Jun-93 7.11 102.00 153.00 7.15 4.25 0.00 1.16 11.00 284.00
23/12/94 7.60 128.00 16.60 10.98 12.50 0.00 1.38 16.90 290.0029/04/95 7.71 119.60 16.85 11.38 3.75 0.20 5.25 17.50 274.0010/12/96 7.28 117.60 20.75 6.37 8.00 0.20 1.31 9.80 309.0028/06/97 7.18 144.80 34.92 13.33 7.50 0.40 1.38 20.50 399.0009/11/97 8.65 117.60 19.28 7.02 0.10 2.05 10.80 340.00Dec-98 7.18 104.00 17.00 11.05 12.55 0.10 1.45 17.00 422.00
Avg. 7.75 115.01 57.99 12.72 7.15 0.14 1.80 15.50 334.33Min. 7.08 59.50 16.60 5.20 1.50 0.00 0.80 8.00 274.00Max. 10.00 144.80 213.00 42.00 12.55 0.40 5.25 28.00 422.00Median 7.28 117.60 20.75 10.98 7.50 0.10 1.38 16.90 309.00Std. Dev. 0.98 25.47 72.73 11.32 4.29 0.13 1.33 6.33 58.19District : FARIDPUR
09/11/77 8.00 34.50 11.00 43.30 3.60 20.00 229.0026/04/79 10.00 43.00 20.10 35.30 0.20 25.00 207.0014/05/81 9.3 57.00 40.00 57.00 2.80 33.00 406.00Dec-92 7.70 151.20 226.80 13.00 2.50 0.30 8.00 20.00 452.00Jun-93 7.08 173.20 259.80 4.55 1.80 0.00 40.50 7.00 438.00
24/12/94 7.84 165.60 33.20 8.45 14.50 0.30 9.75 13.00 421.0010/12/96 6.97 157.20 30.28 6.37 6.50 0.30 9.60 9.80 430.0029/06/97 6.38 156.40 26.13 11.77 90.00 0.40 0.17 18.10 302.0007/11/97 8.84 198.40 53.96 11.31 0.10 9.40 17.40 441.00Dec-98 7.48 140.00 33.00 8.45 15.00 0.10 10.04 13.00 613.00
Avg. 7.96 127.65 73.43 19.95 21.72 0.21 9.41 17.63 393.90Min. 6.38 34.50 11.00 4.55 1.80 0.00 0.17 7.00 207.00Max. 10.00 198.40 259.80 57.00 90.00 0.40 40.50 33.00 613.00Median 7.77 153.80 33.10 11.54 10.50 0.30 8.70 17.75 425.50Std. Dev. 1.12 59.41 90.58 18.35 33.93 0.15 11.63 7.60 119.40District : MADARIPUR
20/01/78 8.50 59.00 28.10 309.90 427.00 270.0025/01/78 9.50 21.00 18.00 259.90 0.60 279.00 266.0019/04/78 9.50 65.00 26.50 339.10 2.50 487.00 258.0017/02/79 9.50 36.50 38.10 363.00 554.50 211.0015/04/79 10.00 32.50 19.80 156.10 4.60 163.50 192.0010/05/79 10.00 57.50 52.20 681.80 2.30 1080.00 275.0014/05/81 9.30 130.00 72.60 645.00 2.10 1220.00 337.00Dec-92 7.45 79.60 119.40 247.00 4.00 0.10 1.33 380.00 265.00Jun-93 7.23 138.80 208.20 48.42 1.30 0.00 0.30 74.50 68.00
26/12/94 7.90 140.00 27.35 258.37 16.75 0.00 1.23 397.50 287.0010/12/96 7.10 144.00 35.16 682.50 7.75 0.10 1.36 1050.00 269.0030/06/97 7.46 99.60 16.36 367.25 15.25 0.10 0.87 565.00 289.0007/11/97 7.56 168.80 39.55 446.88 0.00 168.00 687.50 330.00Dec-98 7.67 220.40 28.00 260.00 17.00 0.20 1.15 400.00 840.00
Avg. 8.48 99.48 52.09 361.80 10.34 0.07 15.53 554.68 296.93Min. 7.10 21.00 16.36 48.42 1.30 0.00 0.30 74.50 68.00Max. 10.00 220.40 208.20 682.50 17.00 0.20 168.00 1220.00 840.00Median 8.20 89.60 31.63 324.50 11.50 0.10 1.35 457.00 269.50Std. Dev. 1.10 58.92 52.53 192.37 6.90 0.08 48.03 344.33 169.63
Rajbari Town, Station No. 70 (Well Depth 34.90 m)
Faridpur Town, Station No. 71 (Well Depth 83.84 m)
Madaripur Town, Station No. 74 (Well Depth 219.51 m)
_______________________________________________________________________________________________________________________________________________________________________________________________________________________________
Isotope Hydrology of Groundwater in Bangladesh (IAEA-TC Project : BGD/8/016) 31
Location Date of Collection pH Ca
(mg/L)Mg
(mg/L)Na
(mg/L)K
(mg/L)Mn
(mg/L)Fe
(mg/L)Cl
(mg/L)HCO3
(mg/L)District : NOAKHALI
04/02/78 9.50 5.50 4.30 138.20 7.00 335.0021/05/81 8.50 24.00 50.50 134.20 0.90 85.00 355.0026/02/82 8.50 23.50 33.90 157.90 0.80 76.50 418.0013/3/83 9.00 25.00 35.08 157.18 2.02 97.00 400.00Dec-92 7.54 33.60 50.40 8.45 3.00 0.00 0.90 13.00 398.00Jun-93 7.30 62.00 93.00 10.14 3.70 0.00 1.26 15.60 290.00
09/12/94 7.77 41.20 18.56 26.00 2.50 0.10 0.80 40.00 372.0006/04/95 7.42 48.40 22.22 13.00 6.00 0.10 0.84 20.00 359.0005/01/97 7.11 156.80 58.11 8.56 13.25 0.30 0.30 13.20 454.0007/05/97 7.04 134.00 37.85 99.13 27.00 0.00 1.77 152.50 463.0013/11/97 8.41 121.60 38.57 131.63 0.10 2.85 202.50 208.00Dec-98 7.29 120.40 42.15 117.32 2.60 0.08 2.75 180.50 532.00
Avg. 7.95 66.33 40.39 83.48 8.29 0.09 1.38 75.23 382.00Min. 7.04 5.50 4.30 8.45 2.50 0.00 0.30 7.00 208.00Max. 9.50 156.80 93.00 157.90 27.00 0.30 2.85 202.50 532.00Median 7.66 44.80 38.21 108.23 3.70 0.09 0.90 58.25 385.00Std. Dev. 0.81 52.07 22.31 64.06 9.08 0.10 0.85 70.09 84.44District : LAKSHMIPURHasanpur, (Well Depth 154.88 m) Jun-93 7.66 110.4 165.60 89.37 1.75 0.10 1.38 137.50 126.00Laxmipur Sadar, (Well Depth 7.93 m) 07/04/95 7.90 127.60 41.02 52.32 0.00 8.25 80.50 321.00Laxmipur Sadar, (Well Depth 14.02 m) 07/04/95 7.81 108.80 33.20 21.45 6.00 0.30 10.25 33.00 332.00
WDB Compound, Sonapur, Noakhali Town, Station No. 89 (Well Depth 10.98 m)
TABLE II: Summary of Hydrochemical Data for Groundwater from the Study Area
3. ANALYTICAL RESULTS
3.1 Arsenic
Arsenic concentrations in groundwater samples were measured at the University of Rochester, New York, using an Inductively Coupled Plasma – Mass Spectrometer (ICP/MS). Samples were filtered (0.2 µm) and acidified in the field to prevent any changes in arsenic concentration due to precipitation or sorption during shipping and storage. Duplicate aliquots were analyzed at the Bangladesh Atomic Energy Center (BAEC). Analytical results from BAEC were generally much lower than those from Rochester. This discrepancy was determined to have been caused by sample handling procedures used at the BAEC and repeat analysis on selected samples after acidification resulted in higher values, similar to those from Rochester. Regardless of the high quality and precise analysis in the laboratory, procedures for sample collection, handling, and storage before analysis have a strong influence on the quality of analytical results and need to be carefully evaluated for an accurate and precise determination of arsenic concentration in field samples.
_______________________________________________________________________________________________________________________________________________________________________________________________________________________________
Isotope Hydrology of Groundwater in Bangladesh (IAEA-TC Project : BGD/8/016) 32
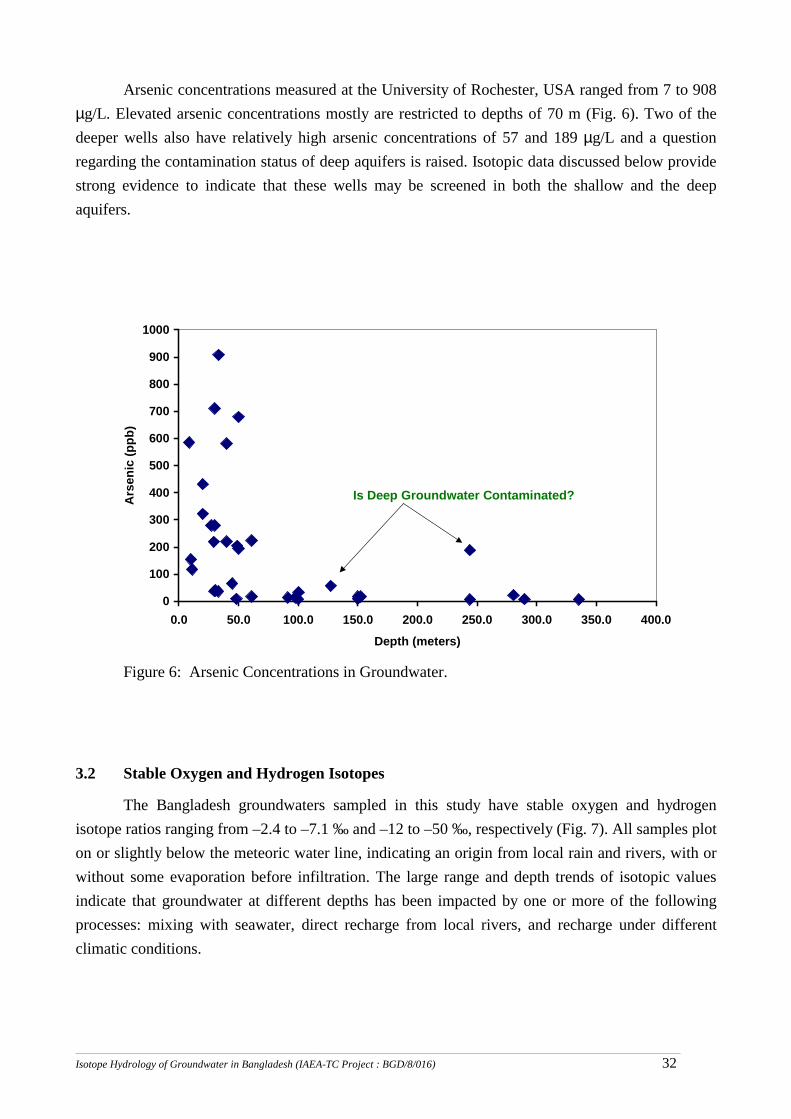
Arsenic concentrations measured at the University of Rochester, USA ranged from 7 to 908 µg/L. Elevated arsenic concentrations mostly are restricted to depths of 70 m (Fig. 6). Two of the deeper wells also have relatively high arsenic concentrations of 57 and 189 µg/L and a question regarding the contamination status of deep aquifers is raised. Isotopic data discussed below provide strong evidence to indicate that these wells may be screened in both the shallow and the deep aquifers.
Figure 6: Arsenic Concentrations in Groundwater.
3.2 Stable Oxygen and Hydrogen Isotopes
The Bangladesh groundwaters sampled in this study have stable oxygen and hydrogen isotope ratios ranging from –2.4 to –7.1 ‰ and –12 to –50 ‰, respectively (Fig. 7). All samples plot on or slightly below the meteoric water line, indicating an origin from local rain and rivers, with or without some evaporation before infiltration. The large range and depth trends of isotopic values indicate that groundwater at different depths has been impacted by one or more of the following processes: mixing with seawater, direct recharge from local rivers, and recharge under different climatic conditions.
0
100
200
300
400
500
600
700
800
900
1000
0.0 50.0 100.0 150.0 200.0 250.0 300.0 350.0 400.0Depth (meters)
Ars
enic
(ppb
)
Is Deep Groundwater Contaminated?
_______________________________________________________________________________________________________________________________________________________________________________________________________________________________
Isotope Hydrology of Groundwater in Bangladesh (IAEA-TC Project : BGD/8/016) 33
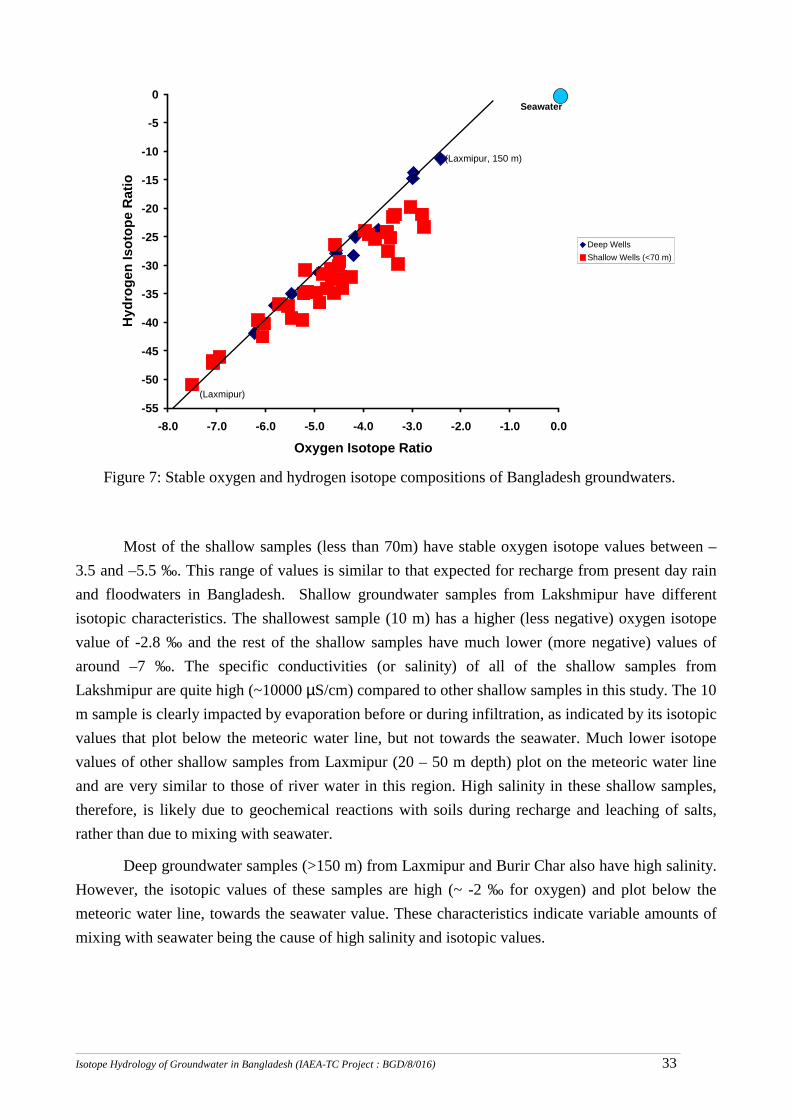
Figure 7: Stable oxygen and hydrogen isotope compositions of Bangladesh groundwaters.
Most of the shallow samples (less than 70m) have stable oxygen isotope values between –3.5 and –5.5 ‰. This range of values is similar to that expected for recharge from present day rain and floodwaters in Bangladesh. Shallow groundwater samples from Lakshmipur have different isotopic characteristics. The shallowest sample (10 m) has a higher (less negative) oxygen isotope value of -2.8 ‰ and the rest of the shallow samples have much lower (more negative) values of around –7 ‰. The specific conductivities (or salinity) of all of the shallow samples from Lakshmipur are quite high (~10000 µS/cm) compared to other shallow samples in this study. The 10 m sample is clearly impacted by evaporation before or during infiltration, as indicated by its isotopic values that plot below the meteoric water line, but not towards the seawater. Much lower isotope values of other shallow samples from Laxmipur (20 – 50 m depth) plot on the meteoric water line and are very similar to those of river water in this region. High salinity in these shallow samples, therefore, is likely due to geochemical reactions with soils during recharge and leaching of salts, rather than due to mixing with seawater.
Deep groundwater samples (>150 m) from Laxmipur and Burir Char also have high salinity. However, the isotopic values of these samples are high (~ -2 ‰ for oxygen) and plot below the meteoric water line, towards the seawater value. These characteristics indicate variable amounts of mixing with seawater being the cause of high salinity and isotopic values.
-55
-50
-45
-40
-35
-30
-25
-20
-15
-10
-5
0
-8.0 -7.0 -6.0 -5.0 -4.0 -3.0 -2.0 -1.0 0.0
Oxygen Isotope Ratio
Hyd
roge
n Is
otop
e R
atio
Deep WellsShallow Wells (<70 m)
Seawater
(Laxmipur)
(Laxmipur, 150 m)
_______________________________________________________________________________________________________________________________________________________________________________________________________________________________
Isotope Hydrology of Groundwater in Bangladesh (IAEA-TC Project : BGD/8/016) 34
In addition, there are groundwater samples from intermediate (~100-150 m) and greater depths (~300 m) that plot on the meteoric water line, but have either low (about -6 ‰) or high (about –3 ‰) oxygen isotope values. These wates are relatively fresh, with specific conductivity of less than about 1000 µS/cm. Based on an evaluation of the climatic history of the region over the last 30,000 years and its effect on the isotopic composition of rainwater (Appendix I), these samples are considered to represent rainwater from a different climatic regimes about 3 to 30 thousand years ago.
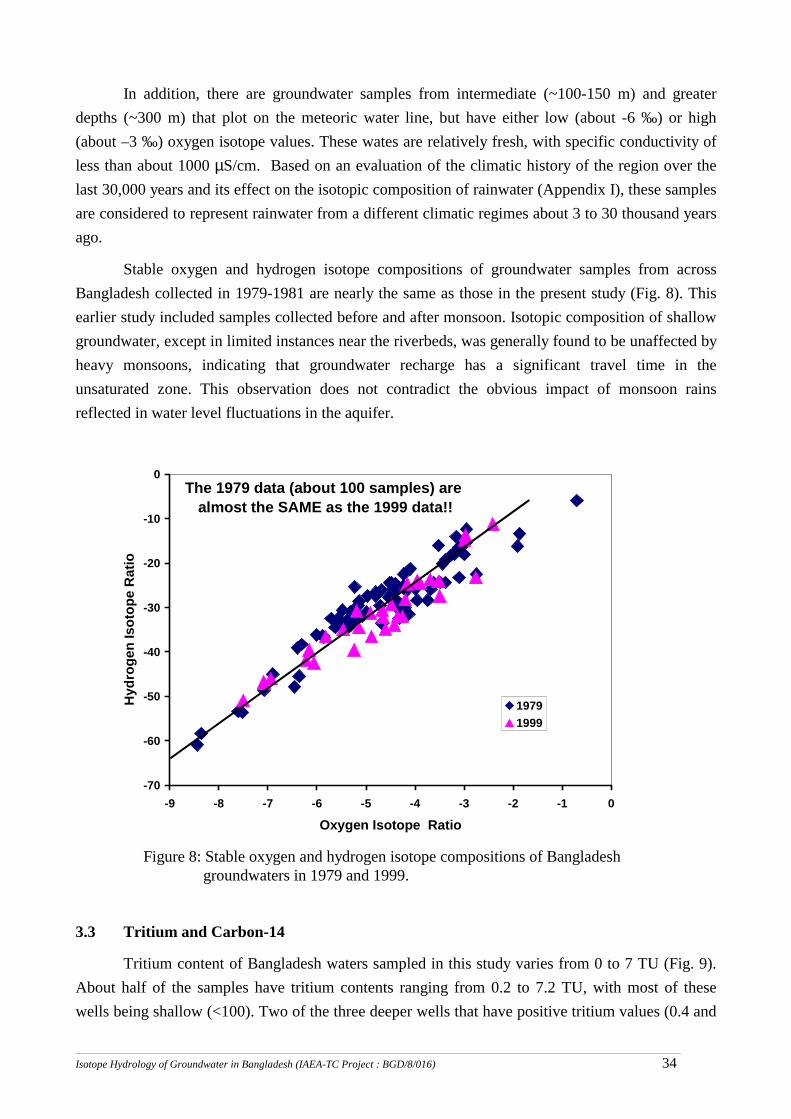
Stable oxygen and hydrogen isotope compositions of groundwater samples from across Bangladesh collected in 1979-1981 are nearly the same as those in the present study (Fig. 8). This earlier study included samples collected before and after monsoon. Isotopic composition of shallow groundwater, except in limited instances near the riverbeds, was generally found to be unaffected by heavy monsoons, indicating that groundwater recharge has a significant travel time in the unsaturated zone. This observation does not contradict the obvious impact of monsoon rains reflected in water level fluctuations in the aquifer.
Figure 8: Stable oxygen and hydrogen isotope compositions of Bangladesh groundwaters in 1979 and 1999.
3.3 Tritium and Carbon-14
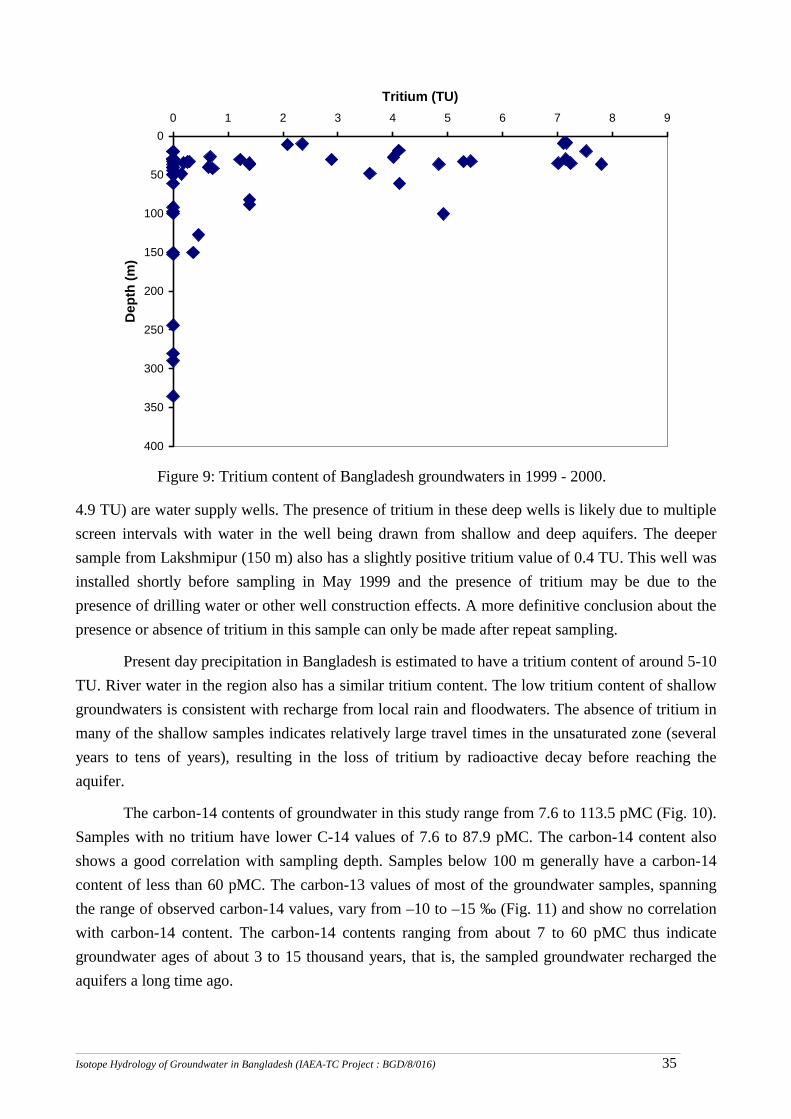
Tritium content of Bangladesh waters sampled in this study varies from 0 to 7 TU (Fig. 9). About half of the samples have tritium contents ranging from 0.2 to 7.2 TU, with most of these wells being shallow (<100). Two of the three deeper wells that have positive tritium values (0.4 and
-70
-60
-50
-40
-30
-20
-10
0
-9 -8 -7 -6 -5 -4 -3 -2 -1 0
Oxygen Isotope Ratio
Hyd
roge
n Is
otop
e R
atio
19791999
The 1979 data (about 100 samples) are almost the SAME as the 1999 data!!
_______________________________________________________________________________________________________________________________________________________________________________________________________________________________
Isotope Hydrology of Groundwater in Bangladesh (IAEA-TC Project : BGD/8/016) 35
4.9 TU) are water supply wells. The presence of tritium in these deep wells is likely due to multiple screen intervals with water in the well being drawn from shallow and deep aquifers. The deeper sample from Lakshmipur (150 m) also has a slightly positive tritium value of 0.4 TU. This well was installed shortly before sampling in May 1999 and the presence of tritium may be due to the presence of drilling water or other well construction effects. A more definitive conclusion about the presence or absence of tritium in this sample can only be made after repeat sampling.
Present day precipitation in Bangladesh is estimated to have a tritium content of around 5-10 TU. River water in the region also has a similar tritium content. The low tritium content of shallow groundwaters is consistent with recharge from local rain and floodwaters. The absence of tritium in many of the shallow samples indicates relatively large travel times in the unsaturated zone (several years to tens of years), resulting in the loss of tritium by radioactive decay before reaching the aquifer.
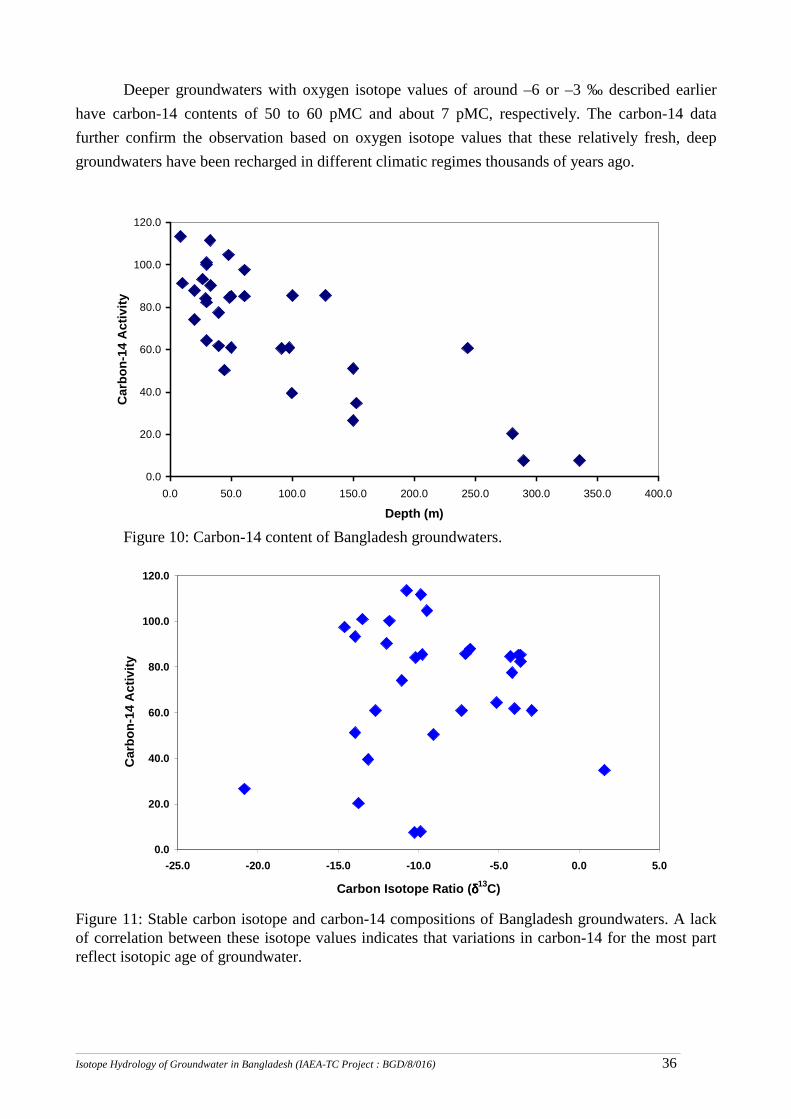
The carbon-14 contents of groundwater in this study range from 7.6 to 113.5 pMC (Fig. 10). Samples with no tritium have lower C-14 values of 7.6 to 87.9 pMC. The carbon-14 content also shows a good correlation with sampling depth. Samples below 100 m generally have a carbon-14 content of less than 60 pMC. The carbon-13 values of most of the groundwater samples, spanning the range of observed carbon-14 values, vary from –10 to –15 ‰ (Fig. 11) and show no correlation with carbon-14 content. The carbon-14 contents ranging from about 7 to 60 pMC thus indicate groundwater ages of about 3 to 15 thousand years, that is, the sampled groundwater recharged the aquifers a long time ago.
0
50
100
150
200
250
300
350
400
0 1 2 3 4 5 6 7 8 9
Tritium (TU)
Dep
th (m
)
Figure 9: Tritium content of Bangladesh groundwaters in 1999 - 2000.
_______________________________________________________________________________________________________________________________________________________________________________________________________________________________
Isotope Hydrology of Groundwater in Bangladesh (IAEA-TC Project : BGD/8/016) 36
Deeper groundwaters with oxygen isotope values of around –6 or –3 ‰ described earlier have carbon-14 contents of 50 to 60 pMC and about 7 pMC, respectively. The carbon-14 data further confirm the observation based on oxygen isotope values that these relatively fresh, deep groundwaters have been recharged in different climatic regimes thousands of years ago.
Figure 10: Carbon-14 content of Bangladesh groundwaters.
Figure 11: Stable carbon isotope and carbon-14 compositions of Bangladesh groundwaters. A lack of correlation between these isotope values indicates that variations in carbon-14 for the most part reflect isotopic age of groundwater.
0.0
20.0
40.0
60.0
80.0
100.0
120.0
0.0 50.0 100.0 150.0 200.0 250.0 300.0 350.0 400.0
Depth (m)
Car
bon-
14 A
ctiv
ity
0.0
20.0
40.0
60.0
80.0
100.0
120.0
-25.0 -20.0 -15.0 -10.0 -5.0 0.0 5.0
Carbon Isotope Ratio (δδδδ13C)
Car
bon-
14 A
ctiv
ity
_______________________________________________________________________________________________________________________________________________________________________________________________________________________________
Isotope Hydrology of Groundwater in Bangladesh (IAEA-TC Project : BGD/8/016) 37
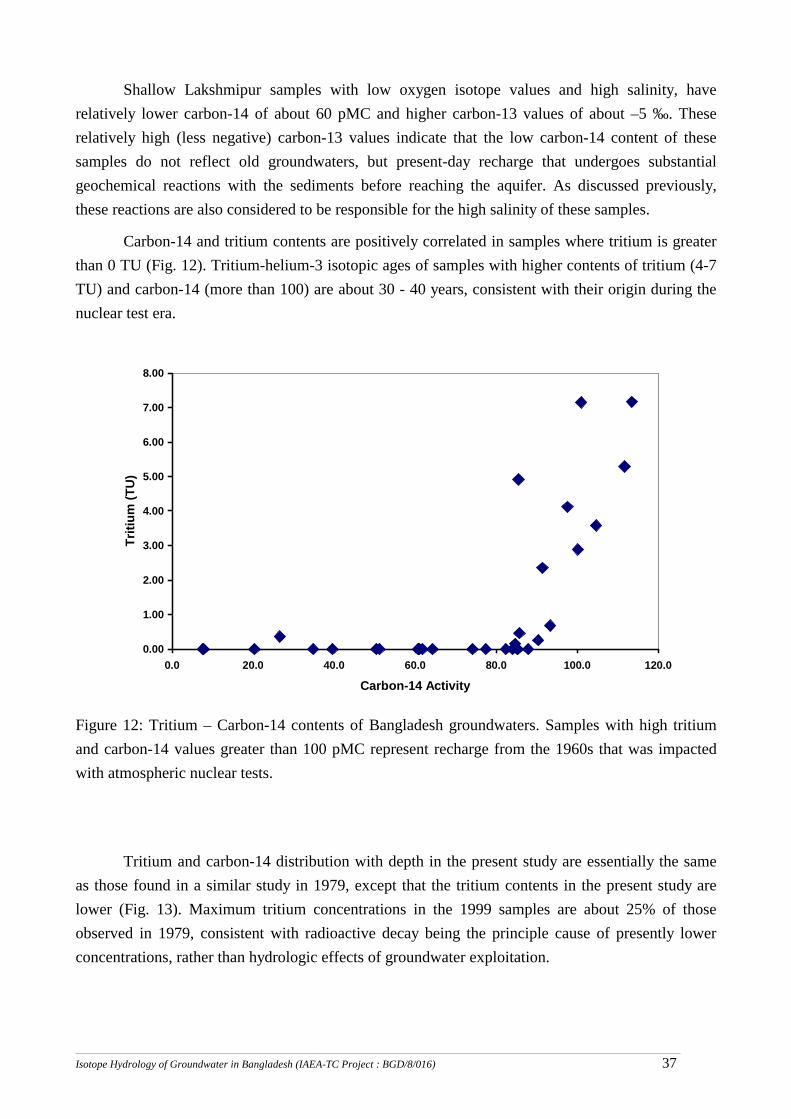
Shallow Lakshmipur samples with low oxygen isotope values and high salinity, have relatively lower carbon-14 of about 60 pMC and higher carbon-13 values of about –5 ‰. These relatively high (less negative) carbon-13 values indicate that the low carbon-14 content of these samples do not reflect old groundwaters, but present-day recharge that undergoes substantial geochemical reactions with the sediments before reaching the aquifer. As discussed previously, these reactions are also considered to be responsible for the high salinity of these samples.
Carbon-14 and tritium contents are positively correlated in samples where tritium is greater than 0 TU (Fig. 12). Tritium-helium-3 isotopic ages of samples with higher contents of tritium (4-7 TU) and carbon-14 (more than 100) are about 30 - 40 years, consistent with their origin during the nuclear test era.
Figure 12: Tritium – Carbon-14 contents of Bangladesh groundwaters. Samples with high tritium and carbon-14 values greater than 100 pMC represent recharge from the 1960s that was impacted with atmospheric nuclear tests.
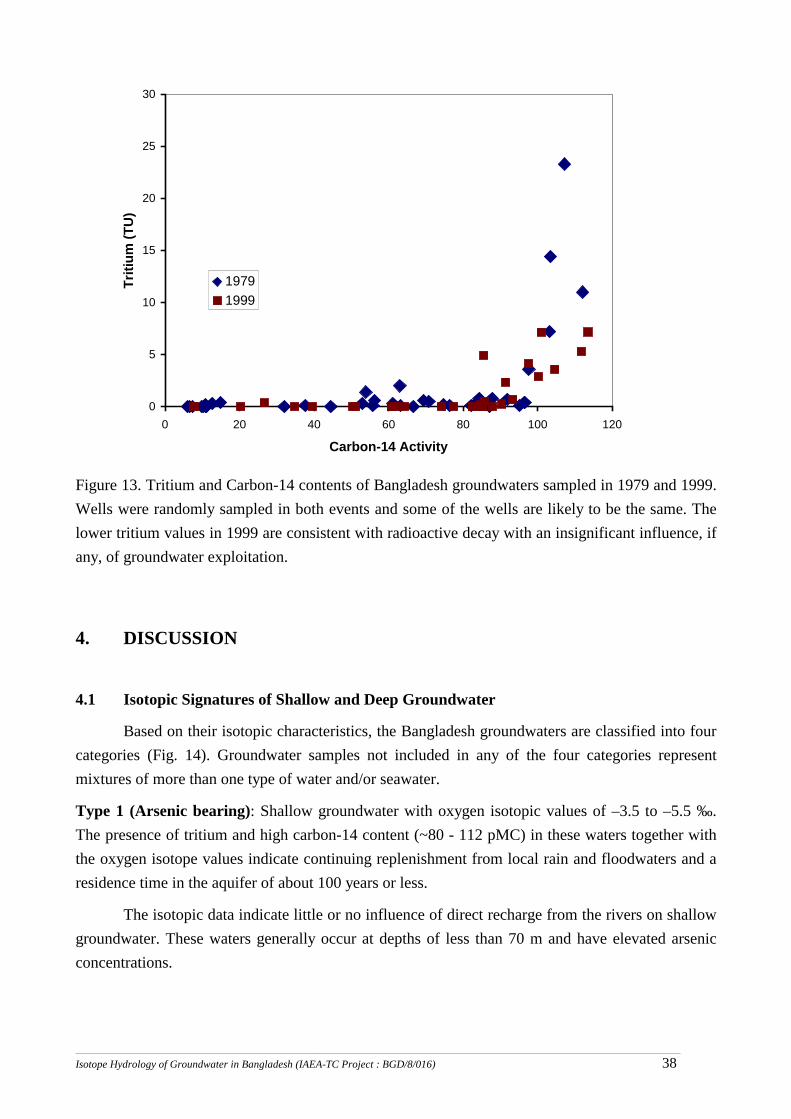
Tritium and carbon-14 distribution with depth in the present study are essentially the same as those found in a similar study in 1979, except that the tritium contents in the present study are lower (Fig. 13). Maximum tritium concentrations in the 1999 samples are about 25% of those observed in 1979, consistent with radioactive decay being the principle cause of presently lower concentrations, rather than hydrologic effects of groundwater exploitation.
0.00
1.00
2.00
3.00
4.00
5.00
6.00
7.00
8.00
0.0 20.0 40.0 60.0 80.0 100.0 120.0
Carbon-14 Activity
Triti
um (T
U)
_______________________________________________________________________________________________________________________________________________________________________________________________________________________________
Isotope Hydrology of Groundwater in Bangladesh (IAEA-TC Project : BGD/8/016) 38
Figure 13. Tritium and Carbon-14 contents of Bangladesh groundwaters sampled in 1979 and 1999. Wells were randomly sampled in both events and some of the wells are likely to be the same. The lower tritium values in 1999 are consistent with radioactive decay with an insignificant influence, if any, of groundwater exploitation.
4. DISCUSSION
4.1 Isotopic Signatures of Shallow and Deep Groundwater
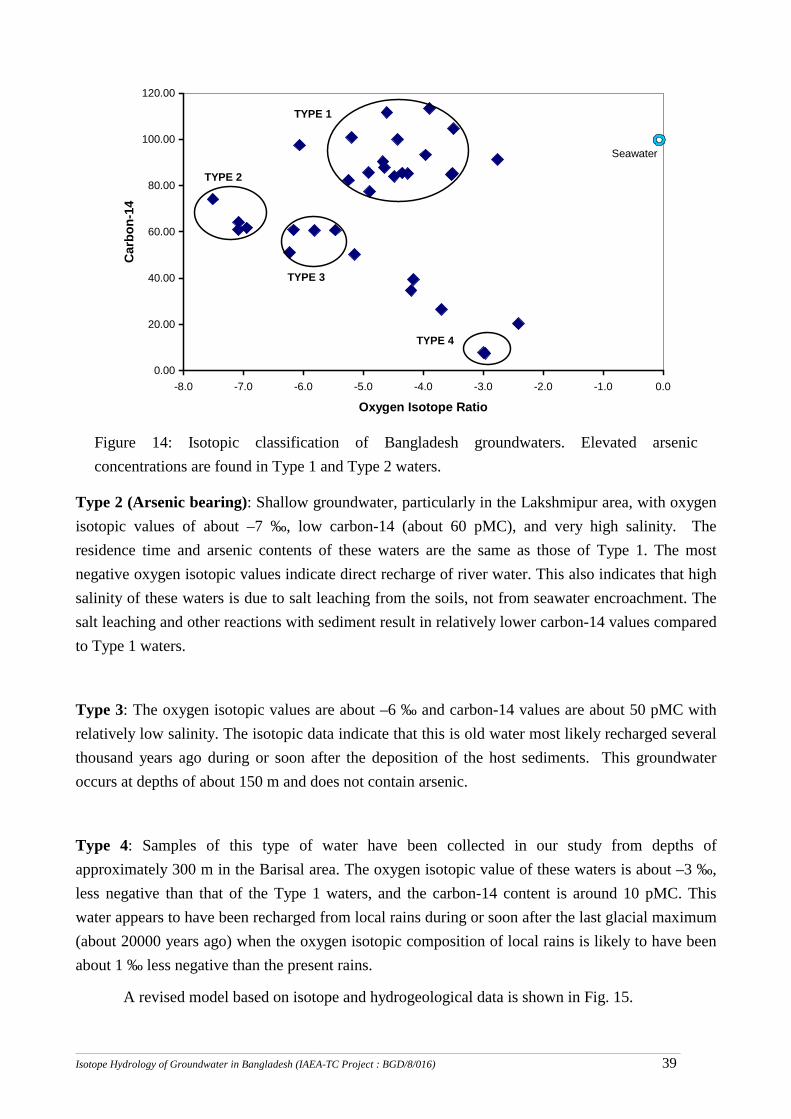
Based on their isotopic characteristics, the Bangladesh groundwaters are classified into four categories (Fig. 14). Groundwater samples not included in any of the four categories represent mixtures of more than one type of water and/or seawater.
Type 1 (Arsenic bearing): Shallow groundwater with oxygen isotopic values of –3.5 to –5.5 ‰. The presence of tritium and high carbon-14 content (~80 - 112 pMC) in these waters together with the oxygen isotope values indicate continuing replenishment from local rain and floodwaters and a residence time in the aquifer of about 100 years or less.
The isotopic data indicate little or no influence of direct recharge from the rivers on shallow groundwater. These waters generally occur at depths of less than 70 m and have elevated arsenic concentrations.
0
5
10
15
20
25
30
0 20 40 60 80 100 120
Carbon-14 Activity
Triti
um (T
U)
19791999
_______________________________________________________________________________________________________________________________________________________________________________________________________________________________
Isotope Hydrology of Groundwater in Bangladesh (IAEA-TC Project : BGD/8/016) 39
Figure 14: Isotopic classification of Bangladesh groundwaters. Elevated arsenic concentrations are found in Type 1 and Type 2 waters.
Type 2 (Arsenic bearing): Shallow groundwater, particularly in the Lakshmipur area, with oxygen isotopic values of about –7 ‰, low carbon-14 (about 60 pMC), and very high salinity. The residence time and arsenic contents of these waters are the same as those of Type 1. The most negative oxygen isotopic values indicate direct recharge of river water. This also indicates that high salinity of these waters is due to salt leaching from the soils, not from seawater encroachment. The salt leaching and other reactions with sediment result in relatively lower carbon-14 values compared to Type 1 waters.
Type 3: The oxygen isotopic values are about –6 ‰ and carbon-14 values are about 50 pMC with relatively low salinity. The isotopic data indicate that this is old water most likely recharged several thousand years ago during or soon after the deposition of the host sediments. This groundwater occurs at depths of about 150 m and does not contain arsenic.
Type 4: Samples of this type of water have been collected in our study from depths of approximately 300 m in the Barisal area. The oxygen isotopic value of these waters is about –3 ‰, less negative than that of the Type 1 waters, and the carbon-14 content is around 10 pMC. This water appears to have been recharged from local rains during or soon after the last glacial maximum (about 20000 years ago) when the oxygen isotopic composition of local rains is likely to have been about 1 ‰ less negative than the present rains.
A revised model based on isotope and hydrogeological data is shown in Fig. 15.
0.00
20.00
40.00
60.00
80.00
100.00
120.00
-8.0 -7.0 -6.0 -5.0 -4.0 -3.0 -2.0 -1.0 0.0
Oxygen Isotope Ratio
Car
bon-
14TYPE 1
TYPE 2
TYPE 3
TYPE 4
Seawater
_______________________________________________________________________________________________________________________________________________________________________________________________________________________________
Isotope Hydrology of Groundwater in Bangladesh (IAEA-TC Project : BGD/8/016) 40
4.2 Implications for Arsenic Mitigation Actions
4.2.1 Arsenic in Deep Aquifers
Elevated arsenic concentrations in samples collected in this study are found largely in wells completed to depths of about 70 m or less. However, some of the deep wells (about 100 m or more) also have relatively high arsenic concentration. Highest arsenic concentration of 189 µg/L is present in a water supply well located at the River Research Institute compound in Faridpur. High arsenic concentration in this deep well (243 m) may indicate contamination of the deeper aquifer or may be an artifact of well construction. Isotopic data provide useful evidence for resolving this important question.
Isotopically, groundwater in shallow piezometers (10-50 m) is Type 1 and is different than that at 150 m (Type 3). The oxygen and carbon isotopic compositions of water from the deep water supply well at Faridpur are more similar to those of shallow (Type 1) groundwater rather than the deep (Type 3) water (Fig. 14). This implies that water in the deep well (~243 m) is in fact derived largely from shallow depths (less than 100 m). Water supply wells commonly are constructed with screened intervals at multiple depths in order to maximize the yield. As a result, water in a deep well may be derived preferentially from a shallow depth either because of the location of the pump or because of the greater permeability of the shallow aquifers.
TYPE 1 & TYPE 2 GroundwatersTYPE 1 & TYPE 2 Groundwaters
TYPE 3 GroundwatersTYPE 3 Groundwaters
TYPE 4 GroundwatersTYPE 4 Groundwaters
�Less than 100 years old�High arsenic content�Continuous recharge
��Less than 100 years oldLess than 100 years old��High arsenic contentHigh arsenic content��Continuous rechargeContinuous recharge
� About 3000 years old� Arsenic-free� No natural recharge
�� About 3000 years oldAbout 3000 years old�� Arsenic-free Arsenic-free�� No natural recharge No natural recharge
� About 20000 years old� Arsenic-free� No natural recharge� Potential for groundwater mining
�� About 20000 years oldAbout 20000 years old�� Arsenic-free Arsenic-free�� No natural recharge No natural recharge�� Potential for groundwater mining Potential for groundwater mining
First Aquifer
Second Aquifer
Pumping-inducedrecharge
Third Aquifer
70 -100 m
200 - 300 m
Ground Surface
???
First Aquifer
Second Aquifer
Third Aquifer
50 m
50-150 m
REVISED MODEL OLD MODEL
Figure 15: Hydrogeological model based in isotope data.
_______________________________________________________________________________________________________________________________________________________________________________________________________________________________
Isotope Hydrology of Groundwater in Bangladesh (IAEA-TC Project : BGD/8/016) 41
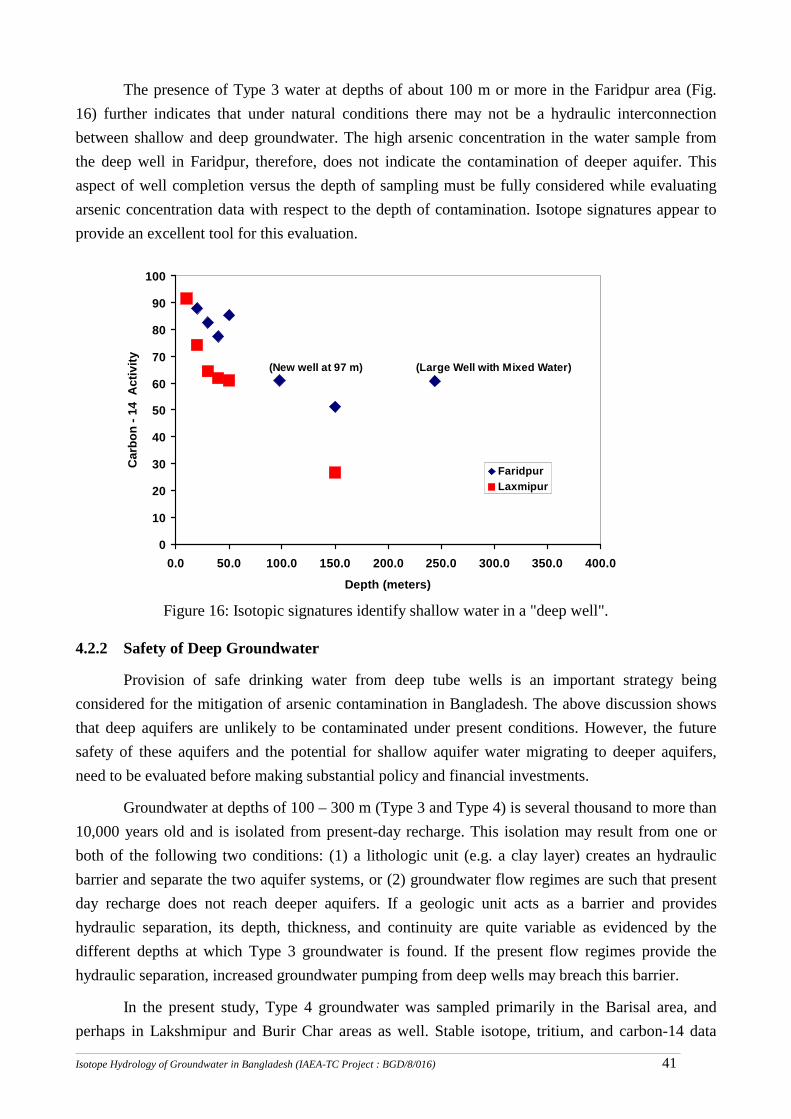
The presence of Type 3 water at depths of about 100 m or more in the Faridpur area (Fig. 16) further indicates that under natural conditions there may not be a hydraulic interconnection between shallow and deep groundwater. The high arsenic concentration in the water sample from the deep well in Faridpur, therefore, does not indicate the contamination of deeper aquifer. This aspect of well completion versus the depth of sampling must be fully considered while evaluating arsenic concentration data with respect to the depth of contamination. Isotope signatures appear to provide an excellent tool for this evaluation.
Figure 16: Isotopic signatures identify shallow water in a "deep well".
4.2.2 Safety of Deep Groundwater
Provision of safe drinking water from deep tube wells is an important strategy being considered for the mitigation of arsenic contamination in Bangladesh. The above discussion shows that deep aquifers are unlikely to be contaminated under present conditions. However, the future safety of these aquifers and the potential for shallow aquifer water migrating to deeper aquifers, need to be evaluated before making substantial policy and financial investments.
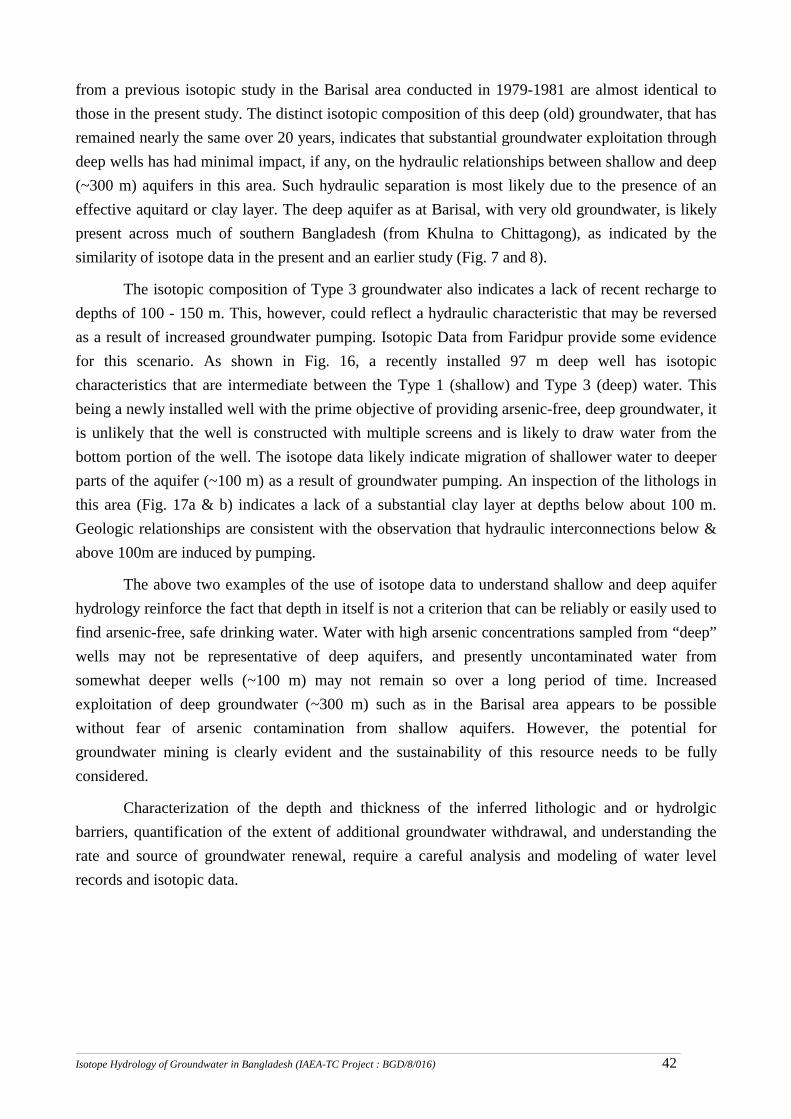
Groundwater at depths of 100 – 300 m (Type 3 and Type 4) is several thousand to more than 10,000 years old and is isolated from present-day recharge. This isolation may result from one or both of the following two conditions: (1) a lithologic unit (e.g. a clay layer) creates an hydraulic barrier and separate the two aquifer systems, or (2) groundwater flow regimes are such that present day recharge does not reach deeper aquifers. If a geologic unit acts as a barrier and provides hydraulic separation, its depth, thickness, and continuity are quite variable as evidenced by the different depths at which Type 3 groundwater is found. If the present flow regimes provide the hydraulic separation, increased groundwater pumping from deep wells may breach this barrier.
In the present study, Type 4 groundwater was sampled primarily in the Barisal area, and perhaps in Lakshmipur and Burir Char areas as well. Stable isotope, tritium, and carbon-14 data
0
10
20
30
40
50
60
70
80
90
100
0.0 50.0 100.0 150.0 200.0 250.0 300.0 350.0 400.0Depth (meters)
Car
bon
- 14
Act
ivity
FaridpurLaxmipur
(Large Well with Mixed Water)(New well at 97 m)
_______________________________________________________________________________________________________________________________________________________________________________________________________________________________
Isotope Hydrology of Groundwater in Bangladesh (IAEA-TC Project : BGD/8/016) 42
from a previous isotopic study in the Barisal area conducted in 1979-1981 are almost identical to those in the present study. The distinct isotopic composition of this deep (old) groundwater, that has remained nearly the same over 20 years, indicates that substantial groundwater exploitation through deep wells has had minimal impact, if any, on the hydraulic relationships between shallow and deep (~300 m) aquifers in this area. Such hydraulic separation is most likely due to the presence of an effective aquitard or clay layer. The deep aquifer as at Barisal, with very old groundwater, is likely present across much of southern Bangladesh (from Khulna to Chittagong), as indicated by the similarity of isotope data in the present and an earlier study (Fig. 7 and 8).
The isotopic composition of Type 3 groundwater also indicates a lack of recent recharge to depths of 100 - 150 m. This, however, could reflect a hydraulic characteristic that may be reversed as a result of increased groundwater pumping. Isotopic Data from Faridpur provide some evidence for this scenario. As shown in Fig. 16, a recently installed 97 m deep well has isotopic characteristics that are intermediate between the Type 1 (shallow) and Type 3 (deep) water. This being a newly installed well with the prime objective of providing arsenic-free, deep groundwater, it is unlikely that the well is constructed with multiple screens and is likely to draw water from the bottom portion of the well. The isotope data likely indicate migration of shallower water to deeper parts of the aquifer (~100 m) as a result of groundwater pumping. An inspection of the lithologs in this area (Fig. 17a & b) indicates a lack of a substantial clay layer at depths below about 100 m. Geologic relationships are consistent with the observation that hydraulic interconnections below & above 100m are induced by pumping.
The above two examples of the use of isotope data to understand shallow and deep aquifer hydrology reinforce the fact that depth in itself is not a criterion that can be reliably or easily used to find arsenic-free, safe drinking water. Water with high arsenic concentrations sampled from “deep” wells may not be representative of deep aquifers, and presently uncontaminated water from somewhat deeper wells (~100 m) may not remain so over a long period of time. Increased exploitation of deep groundwater (~300 m) such as in the Barisal area appears to be possible without fear of arsenic contamination from shallow aquifers. However, the potential for groundwater mining is clearly evident and the sustainability of this resource needs to be fully considered.
Characterization of the depth and thickness of the inferred lithologic and or hydrolgic barriers, quantification of the extent of additional groundwater withdrawal, and understanding the rate and source of groundwater renewal, require a careful analysis and modeling of water level records and isotopic data.
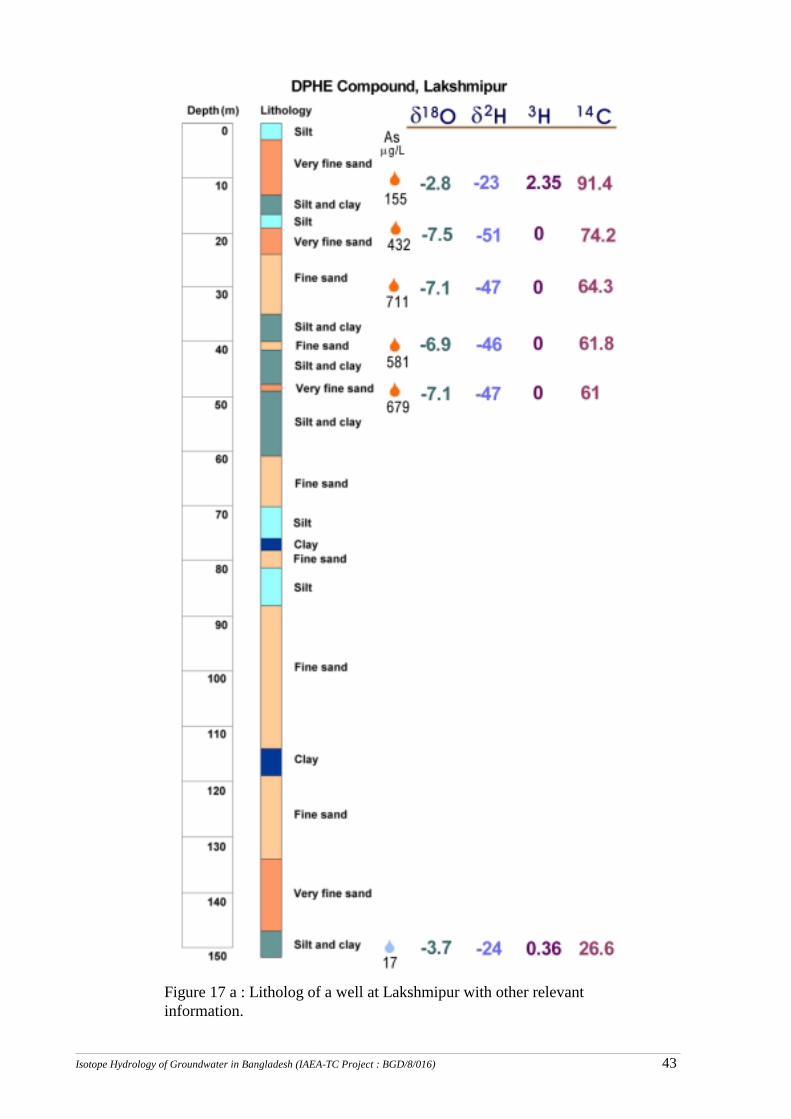
_______________________________________________________________________________________________________________________________________________________________________________________________________________________________
Isotope Hydrology of Groundwater in Bangladesh (IAEA-TC Project : BGD/8/016) 43
Figure 17 a : Litholog of a well at Lakshmipur with other relevant information.
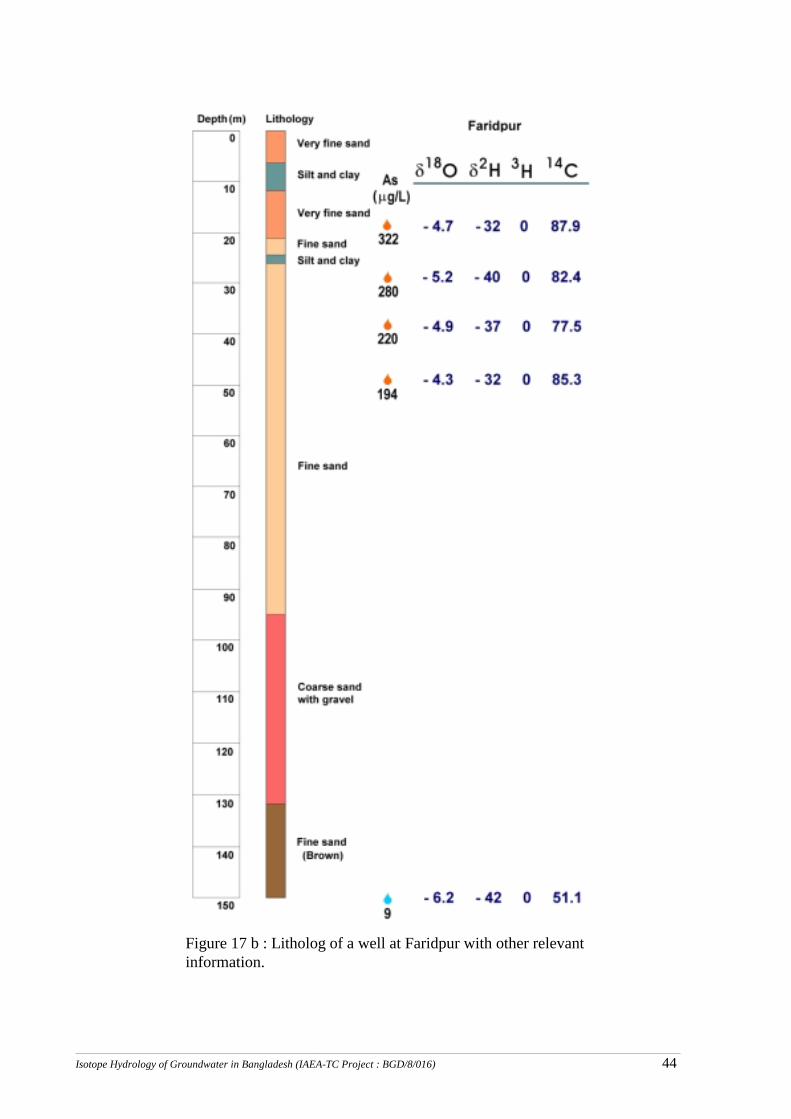
_______________________________________________________________________________________________________________________________________________________________________________________________________________________________
Isotope Hydrology of Groundwater in Bangladesh (IAEA-TC Project : BGD/8/016) 44
Figure 17 b : Litholog of a well at Faridpur with other relevant information.
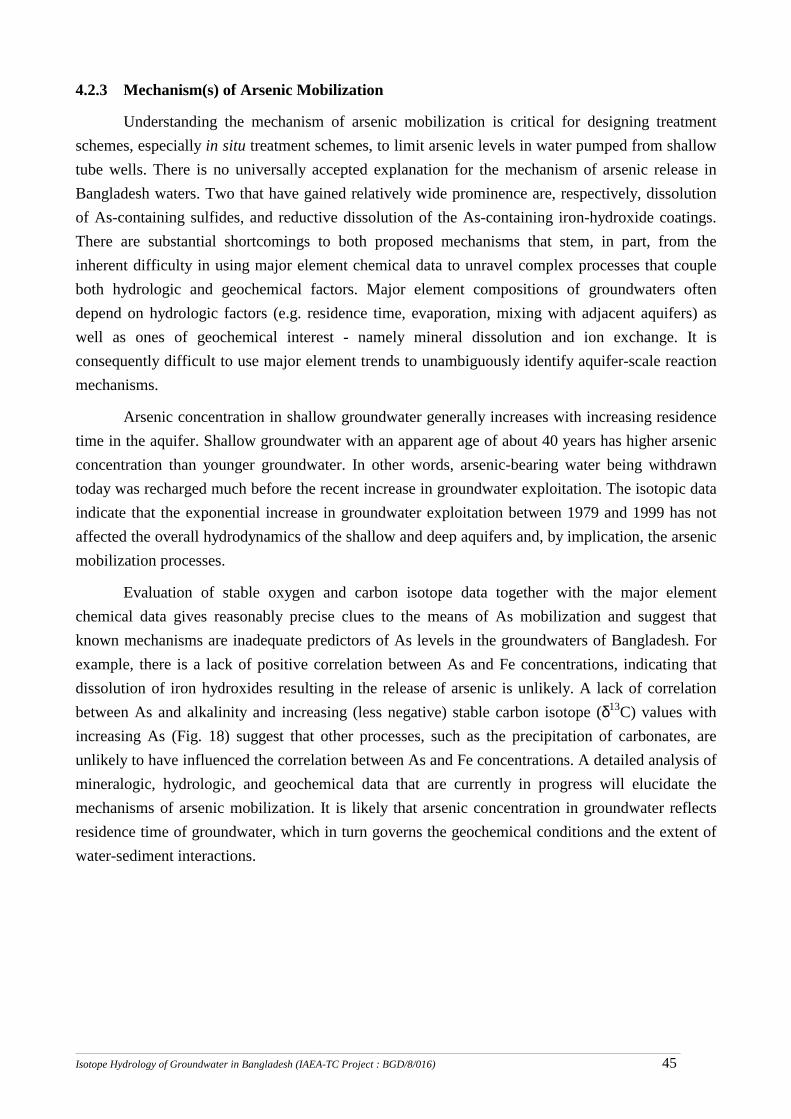
_______________________________________________________________________________________________________________________________________________________________________________________________________________________________
Isotope Hydrology of Groundwater in Bangladesh (IAEA-TC Project : BGD/8/016) 45
4.2.3 Mechanism(s) of Arsenic Mobilization
Understanding the mechanism of arsenic mobilization is critical for designing treatment schemes, especially in situ treatment schemes, to limit arsenic levels in water pumped from shallow tube wells. There is no universally accepted explanation for the mechanism of arsenic release in Bangladesh waters. Two that have gained relatively wide prominence are, respectively, dissolution of As-containing sulfides, and reductive dissolution of the As-containing iron-hydroxide coatings. There are substantial shortcomings to both proposed mechanisms that stem, in part, from the inherent difficulty in using major element chemical data to unravel complex processes that couple both hydrologic and geochemical factors. Major element compositions of groundwaters often depend on hydrologic factors (e.g. residence time, evaporation, mixing with adjacent aquifers) as well as ones of geochemical interest - namely mineral dissolution and ion exchange. It is consequently difficult to use major element trends to unambiguously identify aquifer-scale reaction mechanisms.
Arsenic concentration in shallow groundwater generally increases with increasing residence time in the aquifer. Shallow groundwater with an apparent age of about 40 years has higher arsenic concentration than younger groundwater. In other words, arsenic-bearing water being withdrawn today was recharged much before the recent increase in groundwater exploitation. The isotopic data indicate that the exponential increase in groundwater exploitation between 1979 and 1999 has not affected the overall hydrodynamics of the shallow and deep aquifers and, by implication, the arsenic mobilization processes.
Evaluation of stable oxygen and carbon isotope data together with the major element chemical data gives reasonably precise clues to the means of As mobilization and suggest that known mechanisms are inadequate predictors of As levels in the groundwaters of Bangladesh. For example, there is a lack of positive correlation between As and Fe concentrations, indicating that dissolution of iron hydroxides resulting in the release of arsenic is unlikely. A lack of correlation between As and alkalinity and increasing (less negative) stable carbon isotope (δ13C) values with increasing As (Fig. 18) suggest that other processes, such as the precipitation of carbonates, are unlikely to have influenced the correlation between As and Fe concentrations. A detailed analysis of mineralogic, hydrologic, and geochemical data that are currently in progress will elucidate the mechanisms of arsenic mobilization. It is likely that arsenic concentration in groundwater reflects residence time of groundwater, which in turn governs the geochemical conditions and the extent of water-sediment interactions.
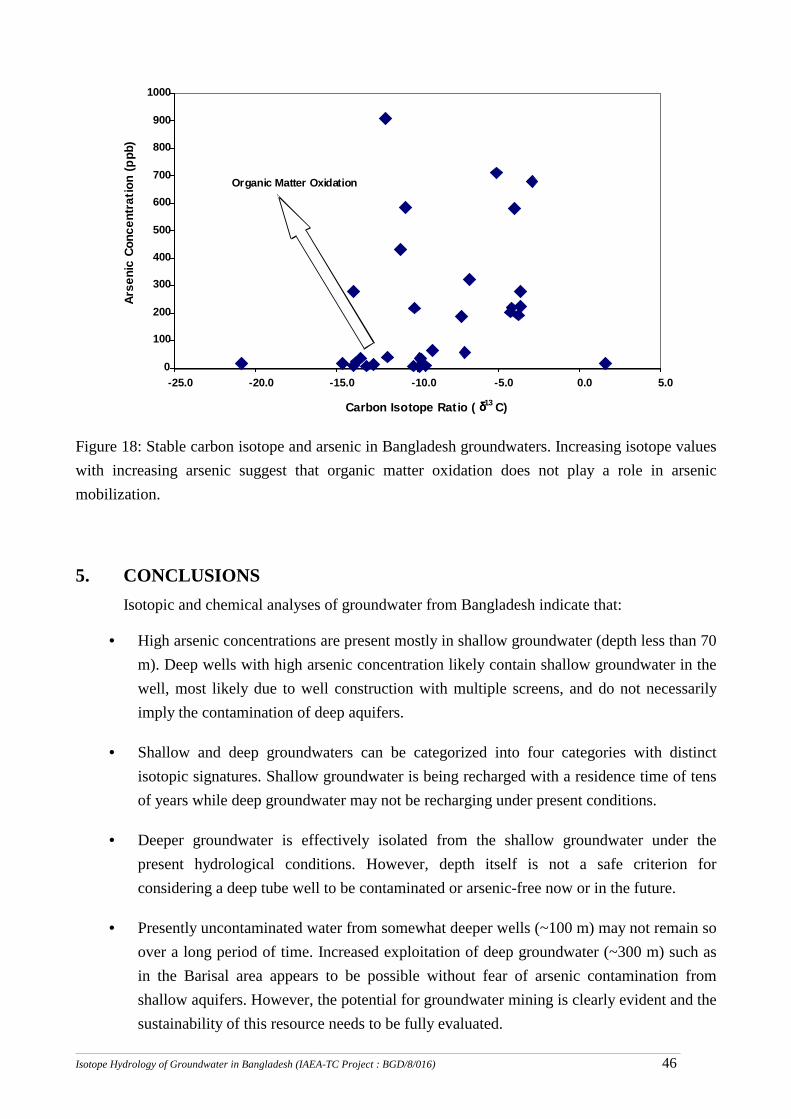
_______________________________________________________________________________________________________________________________________________________________________________________________________________________________
Isotope Hydrology of Groundwater in Bangladesh (IAEA-TC Project : BGD/8/016) 46
Figure 18: Stable carbon isotope and arsenic in Bangladesh groundwaters. Increasing isotope values with increasing arsenic suggest that organic matter oxidation does not play a role in arsenic mobilization.
5. CONCLUSIONS Isotopic and chemical analyses of groundwater from Bangladesh indicate that:
• = High arsenic concentrations are present mostly in shallow groundwater (depth less than 70 m). Deep wells with high arsenic concentration likely contain shallow groundwater in the well, most likely due to well construction with multiple screens, and do not necessarily imply the contamination of deep aquifers.
• = Shallow and deep groundwaters can be categorized into four categories with distinct isotopic signatures. Shallow groundwater is being recharged with a residence time of tens of years while deep groundwater may not be recharging under present conditions.
• = Deeper groundwater is effectively isolated from the shallow groundwater under the present hydrological conditions. However, depth itself is not a safe criterion for considering a deep tube well to be contaminated or arsenic-free now or in the future.
• = Presently uncontaminated water from somewhat deeper wells (~100 m) may not remain so over a long period of time. Increased exploitation of deep groundwater (~300 m) such as in the Barisal area appears to be possible without fear of arsenic contamination from shallow aquifers. However, the potential for groundwater mining is clearly evident and the sustainability of this resource needs to be fully evaluated.
0
100 200
300 400 500
600 700
800 900
1000
-25.0 -20.0 -15.0 -10.0 -5.0 0.0 5.0 Carbon Isotope Ratio ( δδδδ 13 C)
Arse
nic
Conc
entr
atio
n (p
pb)
Organic Matter Oxidation
_______________________________________________________________________________________________________________________________________________________________________________________________________________________________
Isotope Hydrology of Groundwater in Bangladesh (IAEA-TC Project : BGD/8/016) 47
• = Isotopic data indicate that the exponential increase in groundwater exploitation between 1979 and 1999 has not affected the overall hydrodynamics of the shallow and deep aquifers and, by implication, the arsenic mobilization processes.
• = Currently favored mechanisms of arsenic mobilization are inconsistent with isotope data. The most likely process of arsenic mobilization may involve desorption from the sediments as a result of continuing recharge of fresh, arsenic free water in the shallow aquifers.
BIBLIOGRAPHY 1. BGS and Mott MacDonald Ltd., 1998, “Groundwater Studies for Arsenic Contamination in
Bangladesh”. 2. BWDB, 1989, “The compilation of aquifer test analysis results as on June, 1988”, BWDB Water
Supply Paper-502. 3. BWDB, 1993, “The hydro-geochemistry of the western border belt of Bangladesh with special
emphasis to assess the arsenic contamination in groundwater”, BWDB Water Supply Paper-548. 4. BWDB, 1999, “Groundwater Quality Report”, Report No. 3(99), Groundwater Hydrology
Division-1. 5. BWDB, 1999, “Groundwater Quality Report”, Report No. 2(99), Groundwater Hydrology
Division-2. 6. Hussain, M. Sultan, 1992, “Soil Classification”, with special reference to the soils of
Bangladesh, University of Dhaka, Dhaka. 7. Khan, F. H., 1991, “Geology of Bangladesh”, The University Press Ltd., Dhaka. 8. Reimann, Klaus-Ulrich, 1993, “Geology of Bangladesh”, Stuttgart, Berlin, Germany. 9. UNDP, 1982, “The hydrogeological condition of Bangladesh”, Technical Report.
_______________________________________________________________________________________________________________________________________________________________________________________________________________________________
Isotope Hydrology of Groundwater in Bangladesh (IAEA-TC Project : BGD/8/016) 48
ENVIRONMENT CHANGES IN BANGLADESH AND VICINITY AND THE ISOTOPIC
VARIABILITY IN PRECIPITATION AND SURFACE WATER
1. INTRODUCTION
In Bangladesh, isotope techniques are expected to help better understand the processes in the
subsurface, which mobilize and transport arsenic. To this end, it is essential to know the past and
present variability of the isotopic composition in the water recharging the groundwater. The major
source of groundwater recharge is local rainfall. In addition, surface water from the Ganga-
Brahmaputra system, especially during the rainy season, is a potential source of groundwater
replenishment. Shallow groundwater represents more recent precipitation and surface water, while
deeper water can be of much higher age and bear the isotopic signature of past hydroclimatic
conditions.
In the following, an attempt is made to compile the state of knowledge on environment changes
in the region of interest. These changes are related to post-glacial processes including sea level
fluctuations, sedimentation history, climate change and the contemporary isotopic composition of
rainfall and river water. An estimate of the (theoretical) age – depth structure, typical for the region
is given to characterize the hydrological regime relevant to the considerations on the mobilization of
arsenic.
2. ENVIRONMENT AND CLIMATE IN SOUTH ASIA SINCE THE LATE PLEISTOCENE
2.1. SEA LEVEL FLUCTUATIONS
At the end of the last ice age, about 15,000 years ago, the ice sheets which covered the high
latitudes of northern America and Eurasia, began to melt. During the following 8,000 years, about
50 million km3 of glacial meltwater were introduced into the ocean, resulting in a sea level rise of
about 120 meters. A large number of strandlines above and below mean sea level evidences this
post-Glacial rise in sea level. But, in the presence of tectonic and isostatic movements, it is difficult
to isolate the eustatic component of the rise in sea level from that occasioned by land movements.
The post-glacial marine transgression was nearly completed by 5,500 B.P., after having been at –
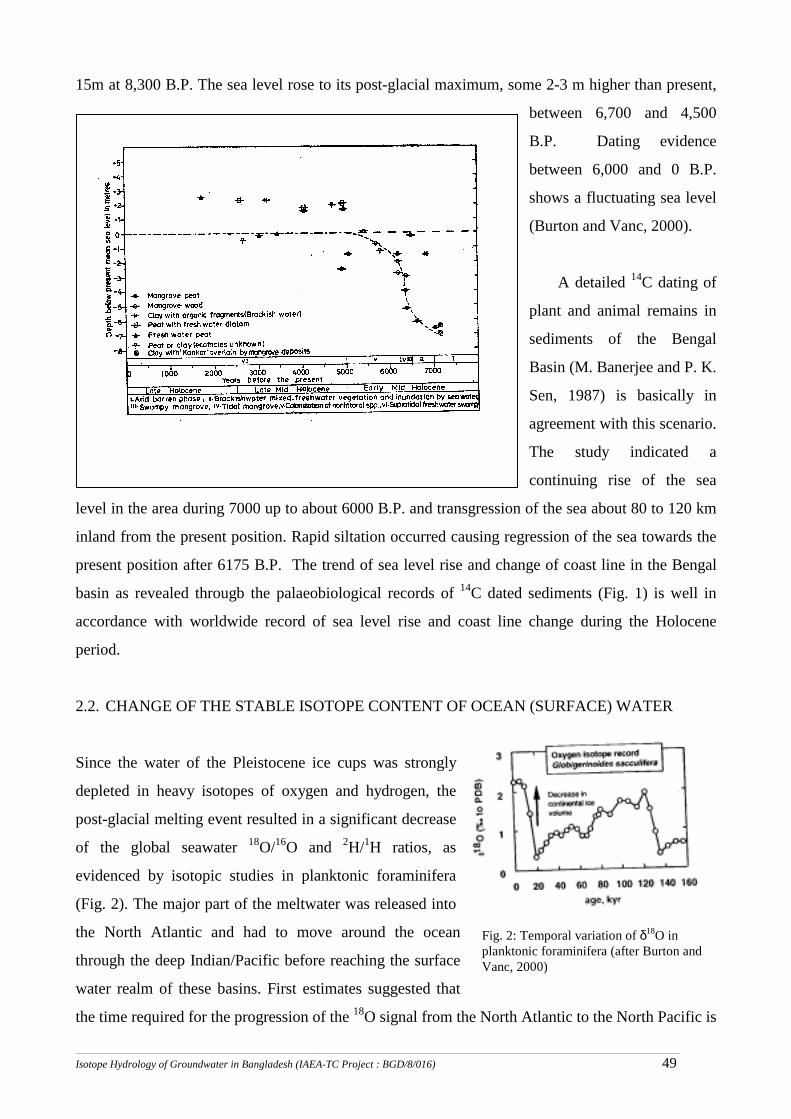
_______________________________________________________________________________________________________________________________________________________________________________________________________________________________
Isotope Hydrology of Groundwater in Bangladesh (IAEA-TC Project : BGD/8/016) 49
15m at 8,300 B.P. The sea level rose to its post-glacial maximum, some 2-3 m higher than present,
between 6,700 and 4,500
B.P. Dating evidence
between 6,000 and 0 B.P.
shows a fluctuating sea level
(Burton and Vanc, 2000).
A detailed 14C dating of
plant and animal remains in
sediments of the Bengal
Basin (M. Banerjee and P. K.
Sen, 1987) is basically in
agreement with this scenario.
The study indicated a
continuing rise of the sea
level in the area during 7000 up to about 6000 B.P. and transgression of the sea about 80 to 120 km
inland from the present position. Rapid siltation occurred causing regression of the sea towards the
present position after 6175 B.P. The trend of sea level rise and change of coast line in the Bengal
basin as revealed througb the palaeobiological records of 14C dated sediments (Fig. 1) is well in
accordance with worldwide record of sea level rise and coast line change during the Holocene
period.
2.2. CHANGE OF THE STABLE ISOTOPE CONTENT OF OCEAN (SURFACE) WATER
Since the water of the Pleistocene ice cups was strongly
depleted in heavy isotopes of oxygen and hydrogen, the
post-glacial melting event resulted in a significant decrease
of the global seawater 18O/16O and 2H/1H ratios, as
evidenced by isotopic studies in planktonic foraminifera
(Fig. 2). The major part of the meltwater was released into
the North Atlantic and had to move around the ocean
through the deep Indian/Pacific before reaching the surface
water realm of these basins. First estimates suggested that
the time required for the progression of the 18O signal from the North Atlantic to the North Pacific is
Fig. 2: Temporal variation of δ18O in planktonic foraminifera (after Burton and Vanc, 2000)
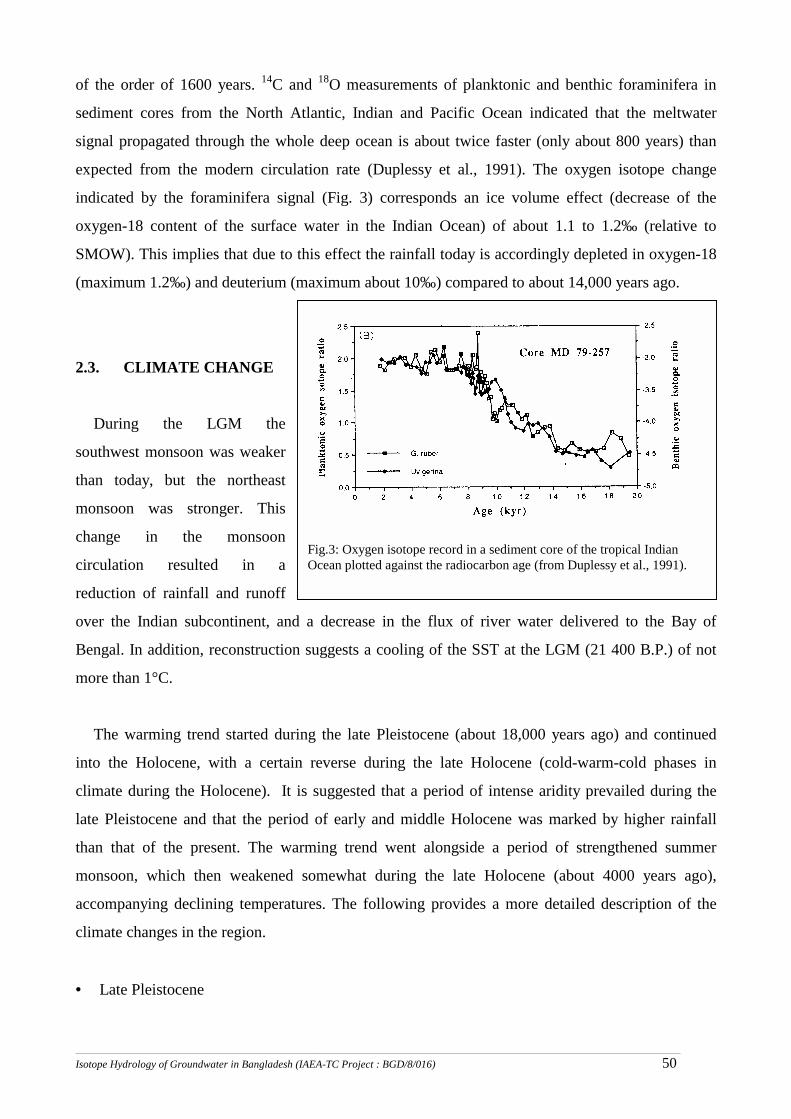
_______________________________________________________________________________________________________________________________________________________________________________________________________________________________
Isotope Hydrology of Groundwater in Bangladesh (IAEA-TC Project : BGD/8/016) 50
Fig.3: Oxygen isotope record in a sediment core of the tropical Indian Ocean plotted against the radiocarbon age (from Duplessy et al., 1991).
of the order of 1600 years. 14C and 18O measurements of planktonic and benthic foraminifera in
sediment cores from the North Atlantic, Indian and Pacific Ocean indicated that the meltwater
signal propagated through the whole deep ocean is about twice faster (only about 800 years) than
expected from the modern circulation rate (Duplessy et al., 1991). The oxygen isotope change
indicated by the foraminifera signal (Fig. 3) corresponds an ice volume effect (decrease of the
oxygen-18 content of the surface water in the Indian Ocean) of about 1.1 to 1.2‰ (relative to
SMOW). This implies that due to this effect the rainfall today is accordingly depleted in oxygen-18
(maximum 1.2‰) and deuterium (maximum about 10‰) compared to about 14,000 years ago.
2.3. CLIMATE CHANGE
During the LGM the
southwest monsoon was weaker
than today, but the northeast
monsoon was stronger. This
change in the monsoon
circulation resulted in a
reduction of rainfall and runoff
over the Indian subcontinent, and a decrease in the flux of river water delivered to the Bay of
Bengal. In addition, reconstruction suggests a cooling of the SST at the LGM (21 400 B.P.) of not
more than 1°C.
The warming trend started during the late Pleistocene (about 18,000 years ago) and continued
into the Holocene, with a certain reverse during the late Holocene (cold-warm-cold phases in
climate during the Holocene). It is suggested that a period of intense aridity prevailed during the
late Pleistocene and that the period of early and middle Holocene was marked by higher rainfall
than that of the present. The warming trend went alongside a period of strengthened summer
monsoon, which then weakened somewhat during the late Holocene (about 4000 years ago),
accompanying declining temperatures. The following provides a more detailed description of the
climate changes in the region.
• = Late Pleistocene
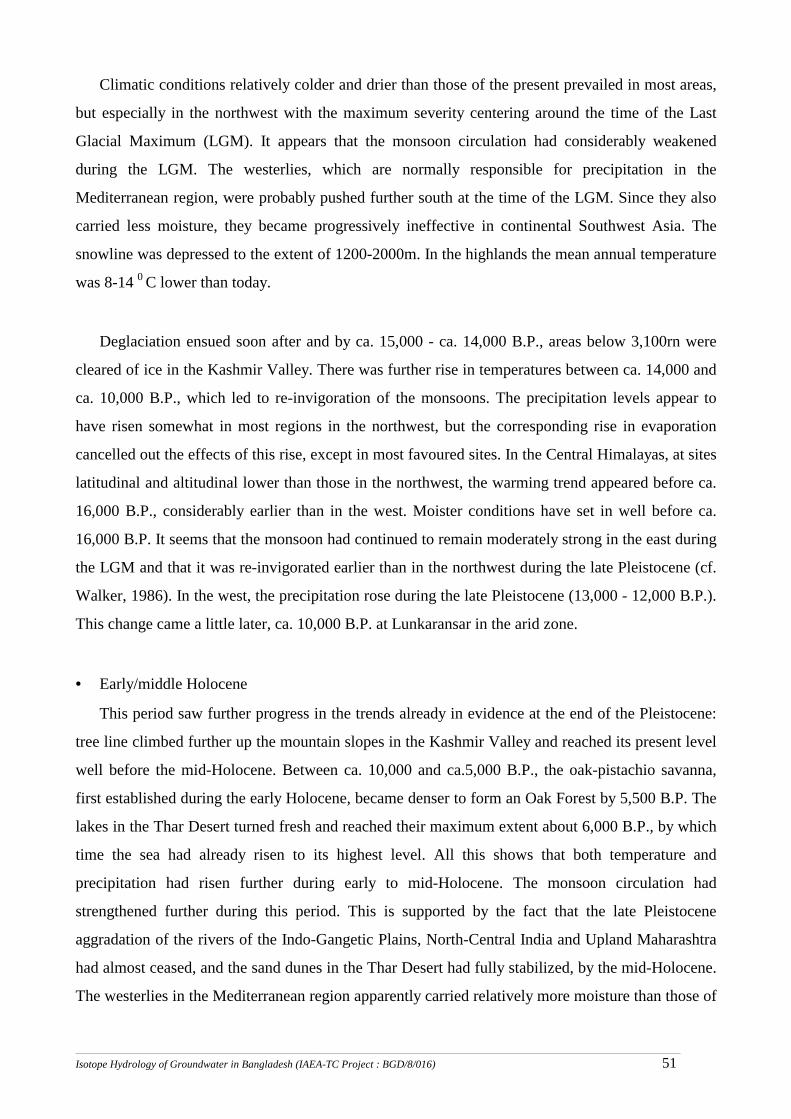
_______________________________________________________________________________________________________________________________________________________________________________________________________________________________
Isotope Hydrology of Groundwater in Bangladesh (IAEA-TC Project : BGD/8/016) 51
Climatic conditions relatively colder and drier than those of the present prevailed in most areas,
but especially in the northwest with the maximum severity centering around the time of the Last
Glacial Maximum (LGM). It appears that the monsoon circulation had considerably weakened
during the LGM. The westerlies, which are normally responsible for precipitation in the
Mediterranean region, were probably pushed further south at the time of the LGM. Since they also
carried less moisture, they became progressively ineffective in continental Southwest Asia. The
snowline was depressed to the extent of 1200-2000m. In the highlands the mean annual temperature
was 8-14 0 C lower than today.
Deglaciation ensued soon after and by ca. 15,000 - ca. 14,000 B.P., areas below 3,100rn were
cleared of ice in the Kashmir Valley. There was further rise in temperatures between ca. 14,000 and
ca. 10,000 B.P., which led to re-invigoration of the monsoons. The precipitation levels appear to
have risen somewhat in most regions in the northwest, but the corresponding rise in evaporation
cancelled out the effects of this rise, except in most favoured sites. In the Central Himalayas, at sites
latitudinal and altitudinal lower than those in the northwest, the warming trend appeared before ca.
16,000 B.P., considerably earlier than in the west. Moister conditions have set in well before ca.
16,000 B.P. It seems that the monsoon had continued to remain moderately strong in the east during
the LGM and that it was re-invigorated earlier than in the northwest during the late Pleistocene (cf.
Walker, 1986). In the west, the precipitation rose during the late Pleistocene (13,000 - 12,000 B.P.).
This change came a little later, ca. 10,000 B.P. at Lunkaransar in the arid zone.
• = Early/middle Holocene
This period saw further progress in the trends already in evidence at the end of the Pleistocene:
tree line climbed further up the mountain slopes in the Kashmir Valley and reached its present level
well before the mid-Holocene. Between ca. 10,000 and ca.5,000 B.P., the oak-pistachio savanna,
first established during the early Holocene, became denser to form an Oak Forest by 5,500 B.P. The
lakes in the Thar Desert turned fresh and reached their maximum extent about 6,000 B.P., by which
time the sea had already risen to its highest level. All this shows that both temperature and
precipitation had risen further during early to mid-Holocene. The monsoon circulation had
strengthened further during this period. This is supported by the fact that the late Pleistocene
aggradation of the rivers of the Indo-Gangetic Plains, North-Central India and Upland Maharashtra
had almost ceased, and the sand dunes in the Thar Desert had fully stabilized, by the mid-Holocene.
The westerlies in the Mediterranean region apparently carried relatively more moisture than those of
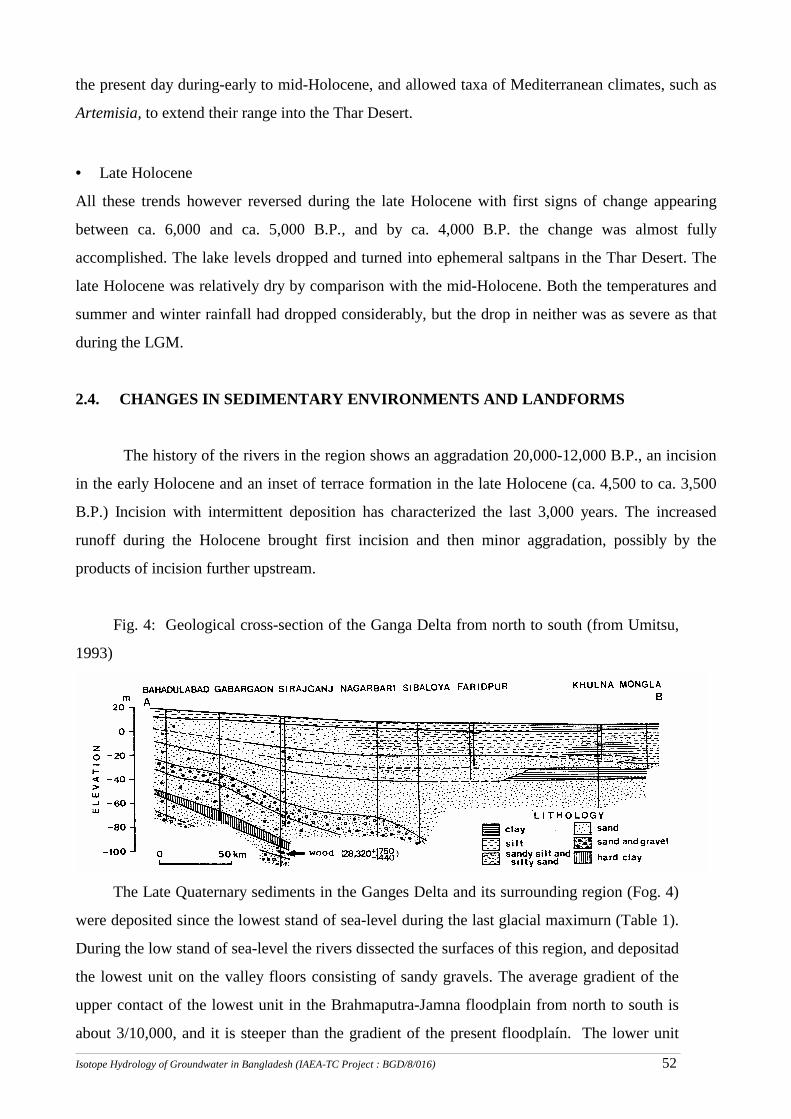
_______________________________________________________________________________________________________________________________________________________________________________________________________________________________
Isotope Hydrology of Groundwater in Bangladesh (IAEA-TC Project : BGD/8/016) 52
the present day during-early to mid-Holocene, and allowed taxa of Mediterranean climates, such as
Artemisia, to extend their range into the Thar Desert.
• = Late Holocene
All these trends however reversed during the late Holocene with first signs of change appearing
between ca. 6,000 and ca. 5,000 B.P., and by ca. 4,000 B.P. the change was almost fully
accomplished. The lake levels dropped and turned into ephemeral saltpans in the Thar Desert. The
late Holocene was relatively dry by comparison with the mid-Holocene. Both the temperatures and
summer and winter rainfall had dropped considerably, but the drop in neither was as severe as that
during the LGM.
2.4. CHANGES IN SEDIMENTARY ENVIRONMENTS AND LANDFORMS
The history of the rivers in the region shows an aggradation 20,000-12,000 B.P., an incision
in the early Holocene and an inset of terrace formation in the late Holocene (ca. 4,500 to ca. 3,500
B.P.) Incision with intermittent deposition has characterized the last 3,000 years. The increased
runoff during the Holocene brought first incision and then minor aggradation, possibly by the
products of incision further upstream.
Fig. 4: Geological cross-section of the Ganga Delta from north to south (from Umitsu,
1993)
The Late Quaternary sediments in the Ganges Delta and its surrounding region (Fog. 4)
were deposited since the lowest stand of sea-level during the last glacial maximurn (Table 1).
During the low stand of sea-level the rivers dissected the surfaces of this region, and depositad
the lowest unit on the valley floors consisting of sandy gravels. The average gradient of the
upper contact of the lowest unit in the Brahmaputra-Jamna floodplain from north to south is
about 3/10,000, and it is steeper than the gradient of the present floodplaín. The lower unit
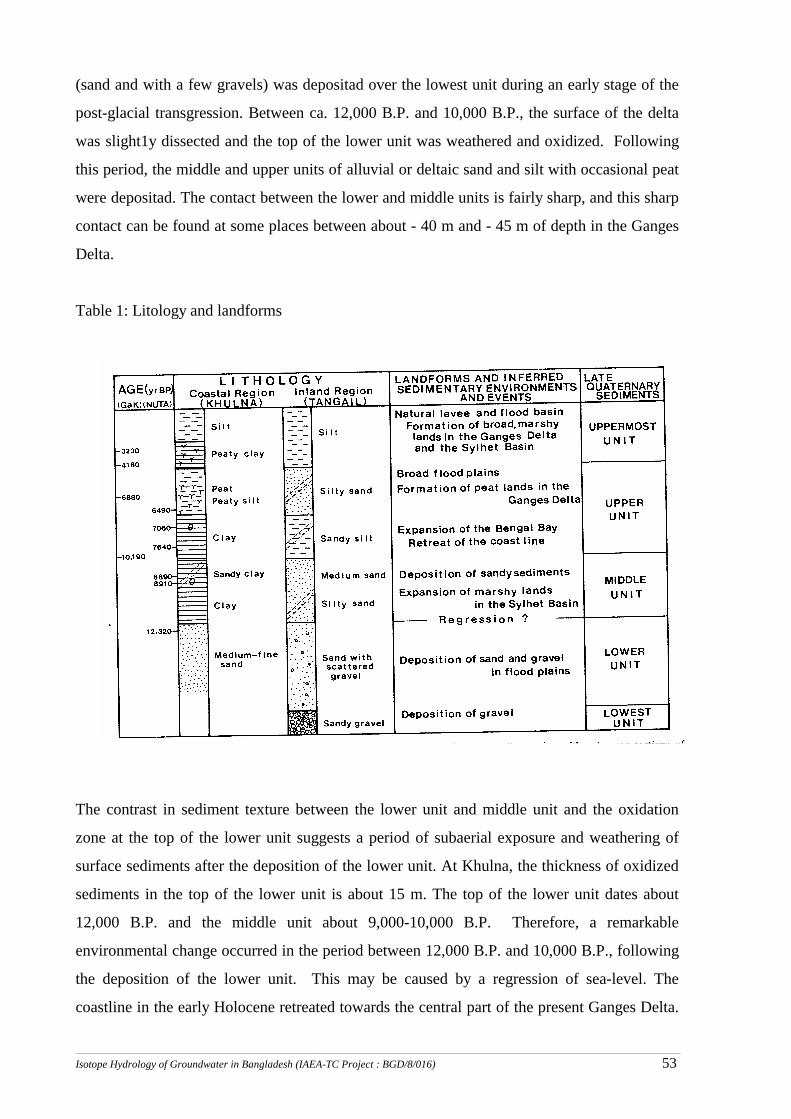
_______________________________________________________________________________________________________________________________________________________________________________________________________________________________
Isotope Hydrology of Groundwater in Bangladesh (IAEA-TC Project : BGD/8/016) 53
(sand and with a few gravels) was depositad over the lowest unit during an early stage of the
post-glacial transgression. Between ca. 12,000 B.P. and 10,000 B.P., the surface of the delta
was slight1y dissected and the top of the lower unit was weathered and oxidized. Following
this period, the middle and upper units of alluvial or deltaic sand and silt with occasional peat
were depositad. The contact between the lower and middle units is fairly sharp, and this sharp
contact can be found at some places between about - 40 m and - 45 m of depth in the Ganges
Delta.
Table 1: Litology and landforms
The contrast in sediment texture between the lower unit and middle unit and the oxidation
zone at the top of the lower unit suggests a period of subaerial exposure and weathering of
surface sediments after the deposition of the lower unit. At Khulna, the thickness of oxidized
sediments in the top of the lower unit is about 15 m. The top of the lower unit dates about
12,000 B.P. and the middle unit about 9,000-10,000 B.P. Therefore, a remarkable
environmental change occurred in the period between 12,000 B.P. and 10,000 B.P., following
the deposition of the lower unit. This may be caused by a regression of sea-level. The
coastline in the early Holocene retreated towards the central part of the present Ganges Delta.
Table1
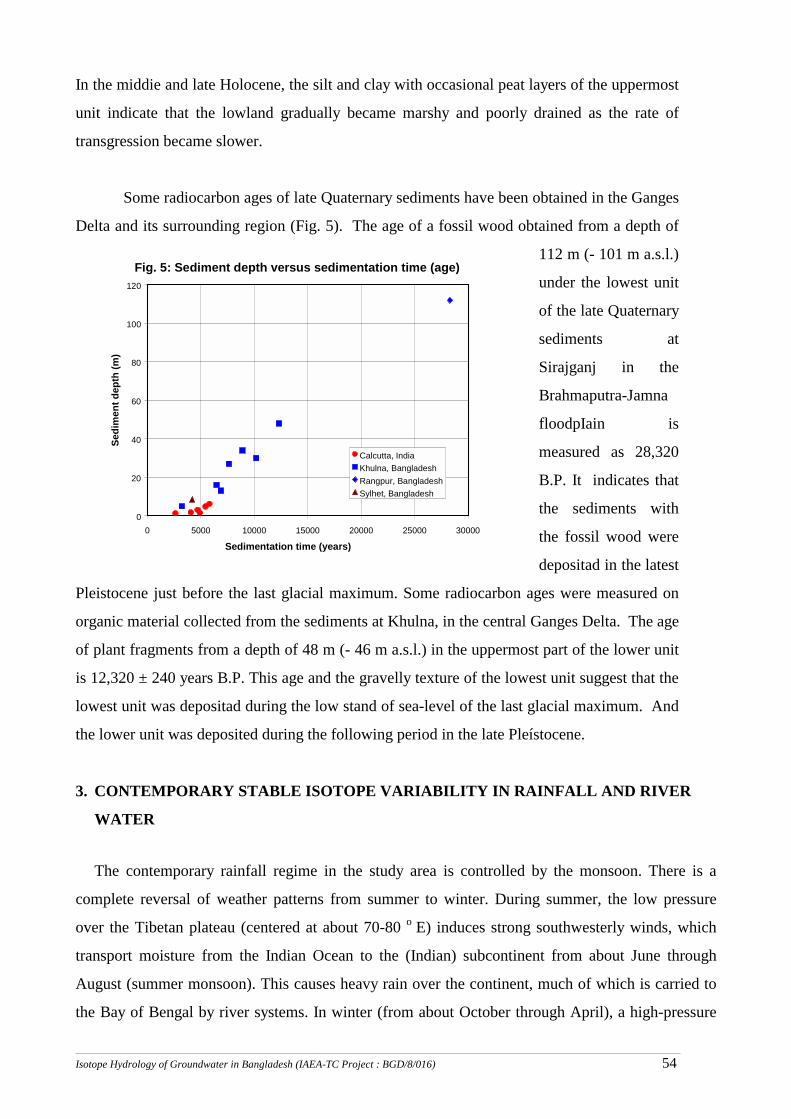
_______________________________________________________________________________________________________________________________________________________________________________________________________________________________
Isotope Hydrology of Groundwater in Bangladesh (IAEA-TC Project : BGD/8/016) 54
In the middie and late Holocene, the silt and clay with occasional peat layers of the uppermost
unit indicate that the lowland gradually became marshy and poorly drained as the rate of
transgression became slower.
Some radiocarbon ages of late Quaternary sediments have been obtained in the Ganges
Delta and its surrounding region (Fig. 5). The age of a fossil wood obtained from a depth of
112 m (- 101 m a.s.l.)
under the lowest unit
of the late Quaternary
sediments at
Sirajganj in the
Brahmaputra-Jamna
floodpIain is
measured as 28,320
B.P. It indicates that
the sediments with
the fossil wood were
depositad in the latest
Pleistocene just before the last glacial maximum. Some radiocarbon ages were measured on
organic material collected from the sediments at Khulna, in the central Ganges Delta. The age
of plant fragments from a depth of 48 m (- 46 m a.s.l.) in the uppermost part of the lower unit
is 12,320 ± 240 years B.P. This age and the gravelly texture of the lowest unit suggest that the
lowest unit was depositad during the low stand of sea-level of the last glacial maximum. And
the lower unit was deposited during the following period in the late Pleístocene.
3. CONTEMPORARY STABLE ISOTOPE VARIABILITY IN RAINFALL AND RIVER
WATER
The contemporary rainfall regime in the study area is controlled by the monsoon. There is a
complete reversal of weather patterns from summer to winter. During summer, the low pressure
over the Tibetan plateau (centered at about 70-80 o E) induces strong southwesterly winds, which
transport moisture from the Indian Ocean to the (Indian) subcontinent from about June through
August (summer monsoon). This causes heavy rain over the continent, much of which is carried to
the Bay of Bengal by river systems. In winter (from about October through April), a high-pressure
Fig. 5: Sediment depth versus sedimentation time (age)
0
20
40
60
80
100
120
0 5000 10000 15000 20000 25000 30000
Sedimentation time (years)
Sedi
men
t dep
th (m
)
Calcutta, IndiaKhulna, BangladeshRangpur, BangladeshSylhet, Bangladesh
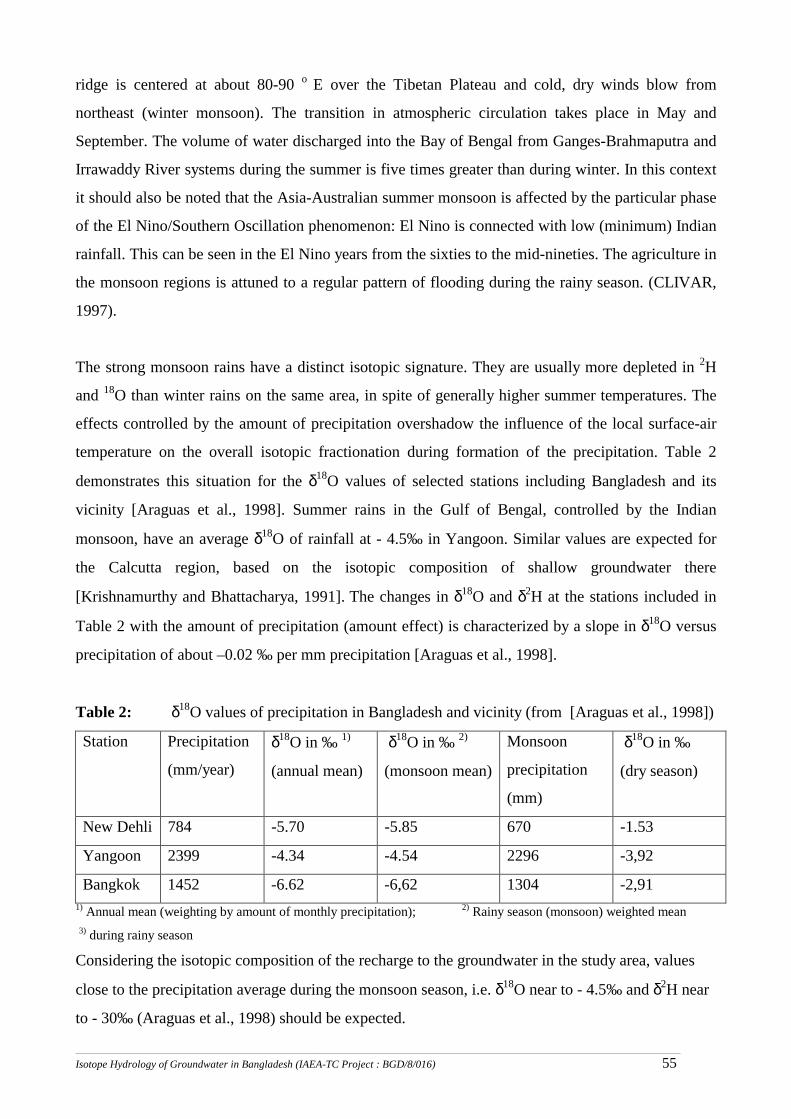
_______________________________________________________________________________________________________________________________________________________________________________________________________________________________
Isotope Hydrology of Groundwater in Bangladesh (IAEA-TC Project : BGD/8/016) 55
ridge is centered at about 80-90 o E over the Tibetan Plateau and cold, dry winds blow from
northeast (winter monsoon). The transition in atmospheric circulation takes place in May and
September. The volume of water discharged into the Bay of Bengal from Ganges-Brahmaputra and
Irrawaddy River systems during the summer is five times greater than during winter. In this context
it should also be noted that the Asia-Australian summer monsoon is affected by the particular phase
of the El Nino/Southern Oscillation phenomenon: El Nino is connected with low (minimum) Indian
rainfall. This can be seen in the El Nino years from the sixties to the mid-nineties. The agriculture in
the monsoon regions is attuned to a regular pattern of flooding during the rainy season. (CLIVAR,
1997).
The strong monsoon rains have a distinct isotopic signature. They are usually more depleted in 2H
and 18O than winter rains on the same area, in spite of generally higher summer temperatures. The
effects controlled by the amount of precipitation overshadow the influence of the local surface-air
temperature on the overall isotopic fractionation during formation of the precipitation. Table 2
demonstrates this situation for the δ18O values of selected stations including Bangladesh and its
vicinity [Araguas et al., 1998]. Summer rains in the Gulf of Bengal, controlled by the Indian
monsoon, have an average δ18O of rainfall at - 4.5‰ in Yangoon. Similar values are expected for
the Calcutta region, based on the isotopic composition of shallow groundwater there
[Krishnamurthy and Bhattacharya, 1991]. The changes in δ18O and δ2H at the stations included in
Table 2 with the amount of precipitation (amount effect) is characterized by a slope in δ18O versus
precipitation of about –0.02 ‰ per mm precipitation [Araguas et al., 1998].
Table 2: δ18O values of precipitation in Bangladesh and vicinity (from [Araguas et al., 1998])
Station Precipitation
(mm/year)
δ18O in ‰ 1)
(annual mean)
δ18O in ‰ 2)
(monsoon mean)
Monsoon
precipitation
(mm)
δ18O in ‰
(dry season)
New Dehli 784 -5.70 -5.85 670 -1.53
Yangoon 2399 -4.34 -4.54 2296 -3,92
Bangkok 1452 -6.62 -6,62 1304 -2,91 1) Annual mean (weighting by amount of monthly precipitation); 2) Rainy season (monsoon) weighted mean
3) during rainy season
Considering the isotopic composition of the recharge to the groundwater in the study area, values
close to the precipitation average during the monsoon season, i.e. δ18O near to - 4.5‰ and δ2H near
to - 30‰ (Araguas et al., 1998) should be expected.
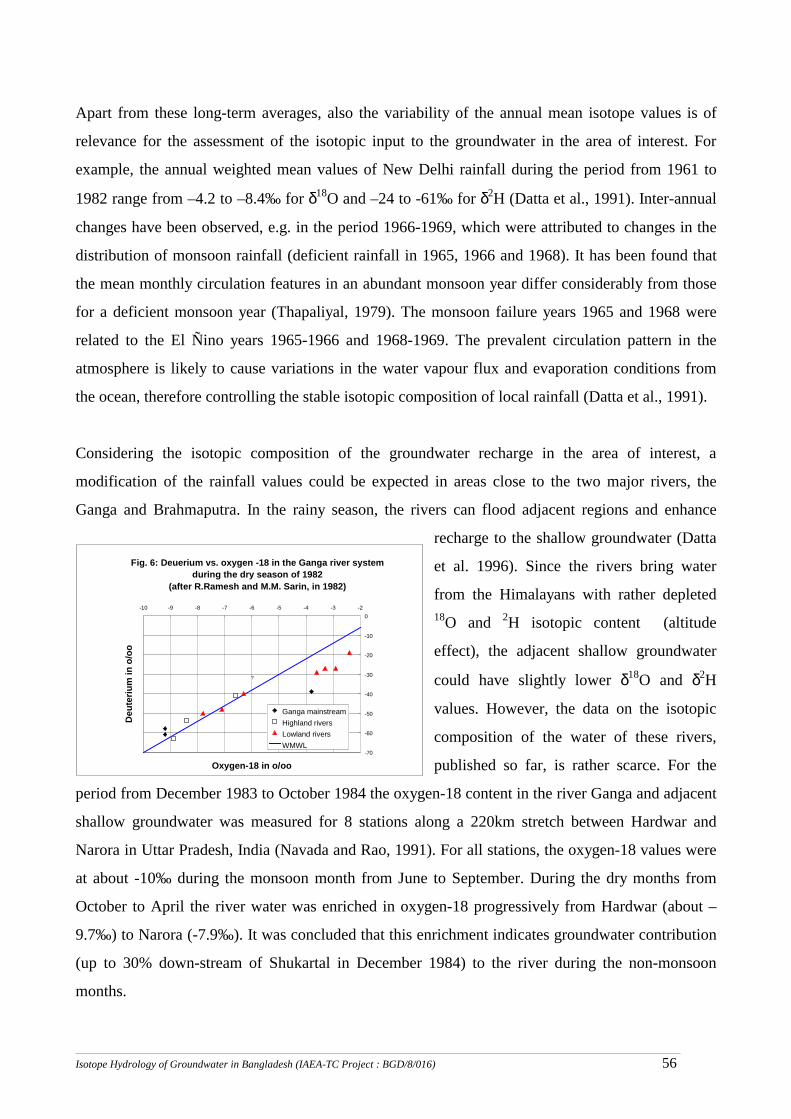
_______________________________________________________________________________________________________________________________________________________________________________________________________________________________
Isotope Hydrology of Groundwater in Bangladesh (IAEA-TC Project : BGD/8/016) 56
Apart from these long-term averages, also the variability of the annual mean isotope values is of
relevance for the assessment of the isotopic input to the groundwater in the area of interest. For
example, the annual weighted mean values of New Delhi rainfall during the period from 1961 to
1982 range from –4.2 to –8.4‰ for δ18O and –24 to -61‰ for δ2H (Datta et al., 1991). Inter-annual
changes have been observed, e.g. in the period 1966-1969, which were attributed to changes in the
distribution of monsoon rainfall (deficient rainfall in 1965, 1966 and 1968). It has been found that
the mean monthly circulation features in an abundant monsoon year differ considerably from those
for a deficient monsoon year (Thapaliyal, 1979). The monsoon failure years 1965 and 1968 were
related to the El Ñino years 1965-1966 and 1968-1969. The prevalent circulation pattern in the
atmosphere is likely to cause variations in the water vapour flux and evaporation conditions from
the ocean, therefore controlling the stable isotopic composition of local rainfall (Datta et al., 1991).
Considering the isotopic composition of the groundwater recharge in the area of interest, a
modification of the rainfall values could be expected in areas close to the two major rivers, the
Ganga and Brahmaputra. In the rainy season, the rivers can flood adjacent regions and enhance
recharge to the shallow groundwater (Datta
et al. 1996). Since the rivers bring water
from the Himalayans with rather depleted 18O and 2H isotopic content (altitude
effect), the adjacent shallow groundwater
could have slightly lower δ18O and δ2H
values. However, the data on the isotopic
composition of the water of these rivers,
published so far, is rather scarce. For the
period from December 1983 to October 1984 the oxygen-18 content in the river Ganga and adjacent
shallow groundwater was measured for 8 stations along a 220km stretch between Hardwar and
Narora in Uttar Pradesh, India (Navada and Rao, 1991). For all stations, the oxygen-18 values were
at about -10‰ during the monsoon month from June to September. During the dry months from
October to April the river water was enriched in oxygen-18 progressively from Hardwar (about –
9.7‰) to Narora (-7.9‰). It was concluded that this enrichment indicates groundwater contribution
(up to 30% down-stream of Shukartal in December 1984) to the river during the non-monsoon
months.
Fig. 6: Deuerium vs. oxygen -18 in the Ganga river system during the dry season of 1982
(after R.Ramesh and M.M. Sarin, in 1982)
-70
-60
-50
-40
-30
-20
-10
0-10 -9 -8 -7 -6 -5 -4 -3 -2
Oxygen-18 in o/oo
Deu
teriu
m in
o/o
o
Ganga mainstreamHighland riversLowland riversWMWL
?
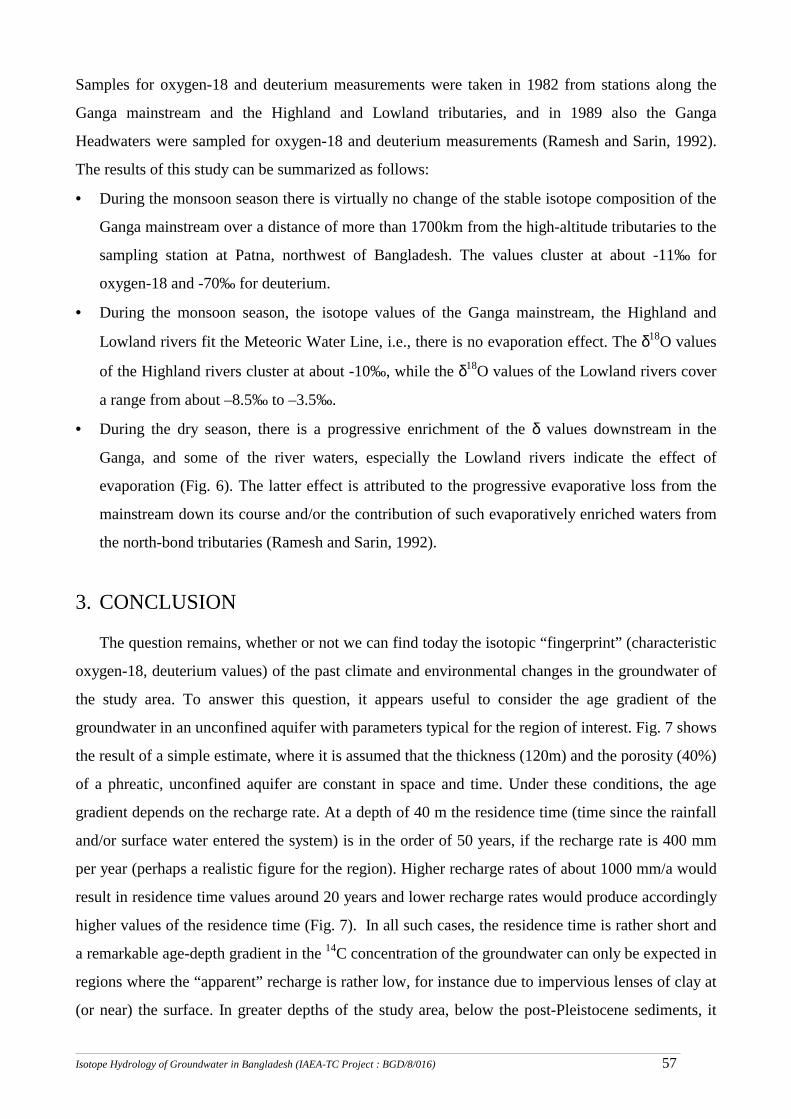
_______________________________________________________________________________________________________________________________________________________________________________________________________________________________
Isotope Hydrology of Groundwater in Bangladesh (IAEA-TC Project : BGD/8/016) 57
Samples for oxygen-18 and deuterium measurements were taken in 1982 from stations along the
Ganga mainstream and the Highland and Lowland tributaries, and in 1989 also the Ganga
Headwaters were sampled for oxygen-18 and deuterium measurements (Ramesh and Sarin, 1992).
The results of this study can be summarized as follows:
• = During the monsoon season there is virtually no change of the stable isotope composition of the
Ganga mainstream over a distance of more than 1700km from the high-altitude tributaries to the
sampling station at Patna, northwest of Bangladesh. The values cluster at about -11‰ for
oxygen-18 and -70‰ for deuterium.
• = During the monsoon season, the isotope values of the Ganga mainstream, the Highland and
Lowland rivers fit the Meteoric Water Line, i.e., there is no evaporation effect. The δ18O values
of the Highland rivers cluster at about -10‰, while the δ18O values of the Lowland rivers cover
a range from about –8.5‰ to –3.5‰.
• = During the dry season, there is a progressive enrichment of the δ values downstream in the
Ganga, and some of the river waters, especially the Lowland rivers indicate the effect of
evaporation (Fig. 6). The latter effect is attributed to the progressive evaporative loss from the
mainstream down its course and/or the contribution of such evaporatively enriched waters from
the north-bond tributaries (Ramesh and Sarin, 1992).
3. CONCLUSION
The question remains, whether or not we can find today the isotopic “fingerprint” (characteristic
oxygen-18, deuterium values) of the past climate and environmental changes in the groundwater of
the study area. To answer this question, it appears useful to consider the age gradient of the
groundwater in an unconfined aquifer with parameters typical for the region of interest. Fig. 7 shows
the result of a simple estimate, where it is assumed that the thickness (120m) and the porosity (40%)
of a phreatic, unconfined aquifer are constant in space and time. Under these conditions, the age
gradient depends on the recharge rate. At a depth of 40 m the residence time (time since the rainfall
and/or surface water entered the system) is in the order of 50 years, if the recharge rate is 400 mm
per year (perhaps a realistic figure for the region). Higher recharge rates of about 1000 mm/a would
result in residence time values around 20 years and lower recharge rates would produce accordingly
higher values of the residence time (Fig. 7). In all such cases, the residence time is rather short and
a remarkable age-depth gradient in the 14C concentration of the groundwater can only be expected in
regions where the “apparent” recharge is rather low, for instance due to impervious lenses of clay at
(or near) the surface. In greater depths of the study area, below the post-Pleistocene sediments, it
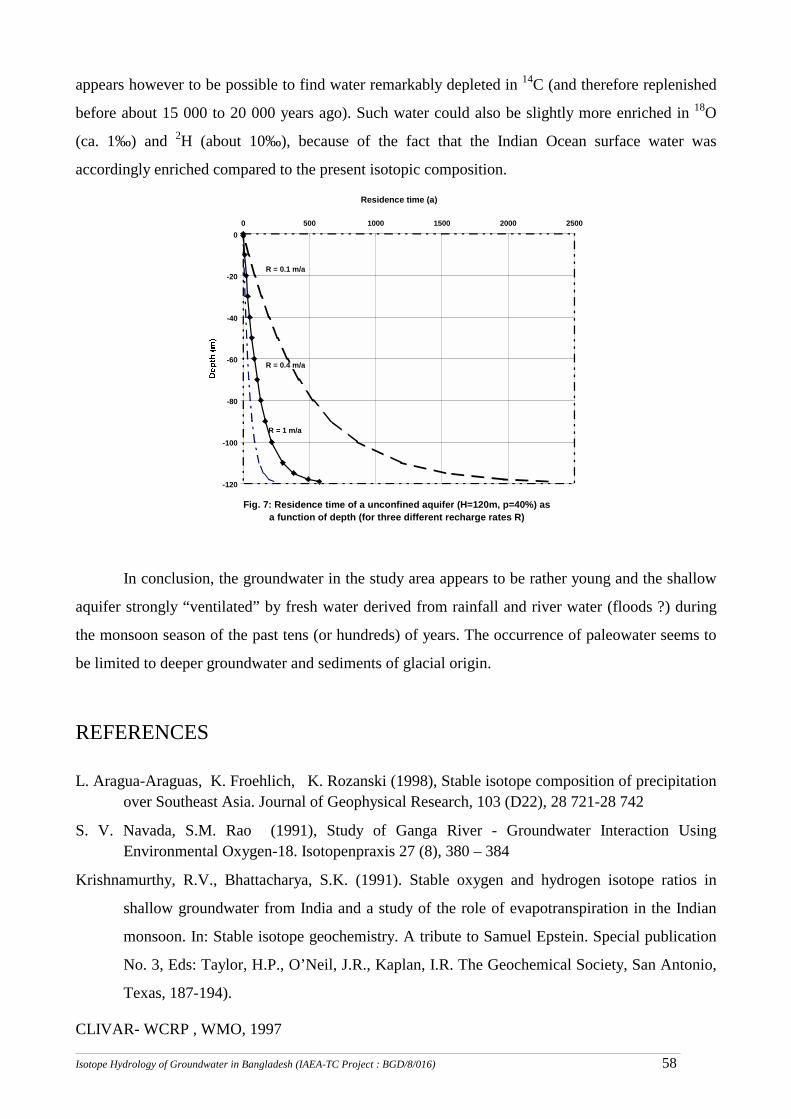
_______________________________________________________________________________________________________________________________________________________________________________________________________________________________
Isotope Hydrology of Groundwater in Bangladesh (IAEA-TC Project : BGD/8/016) 58
appears however to be possible to find water remarkably depleted in 14C (and therefore replenished
before about 15 000 to 20 000 years ago). Such water could also be slightly more enriched in 18O
(ca. 1‰) and 2H (about 10‰), because of the fact that the Indian Ocean surface water was
accordingly enriched compared to the present isotopic composition.
Fig. 7: Residence time of a unconfined aquifer (H=120m, p=40%) as a function of depth (for three different recharge rates R)
-120
-100
-80
-60
-40
-20
00 500 1000 1500 2000 2500
Residence time (a)
R = 0.1 m/a
R = 0.4 m/a
R = 1 m/a
In conclusion, the groundwater in the study area appears to be rather young and the shallow
aquifer strongly “ventilated” by fresh water derived from rainfall and river water (floods ?) during
the monsoon season of the past tens (or hundreds) of years. The occurrence of paleowater seems to
be limited to deeper groundwater and sediments of glacial origin.
REFERENCES
L. Aragua-Araguas, K. Froehlich, K. Rozanski (1998), Stable isotope composition of precipitation over Southeast Asia. Journal of Geophysical Research, 103 (D22), 28 721-28 742
S. V. Navada, S.M. Rao (1991), Study of Ganga River - Groundwater Interaction Using Environmental Oxygen-18. Isotopenpraxis 27 (8), 380 – 384
Krishnamurthy, R.V., Bhattacharya, S.K. (1991). Stable oxygen and hydrogen isotope ratios in
shallow groundwater from India and a study of the role of evapotranspiration in the Indian
monsoon. In: Stable isotope geochemistry. A tribute to Samuel Epstein. Special publication
No. 3, Eds: Taylor, H.P., O’Neil, J.R., Kaplan, I.R. The Geochemical Society, San Antonio,
Texas, 187-194).
CLIVAR- WCRP , WMO, 1997
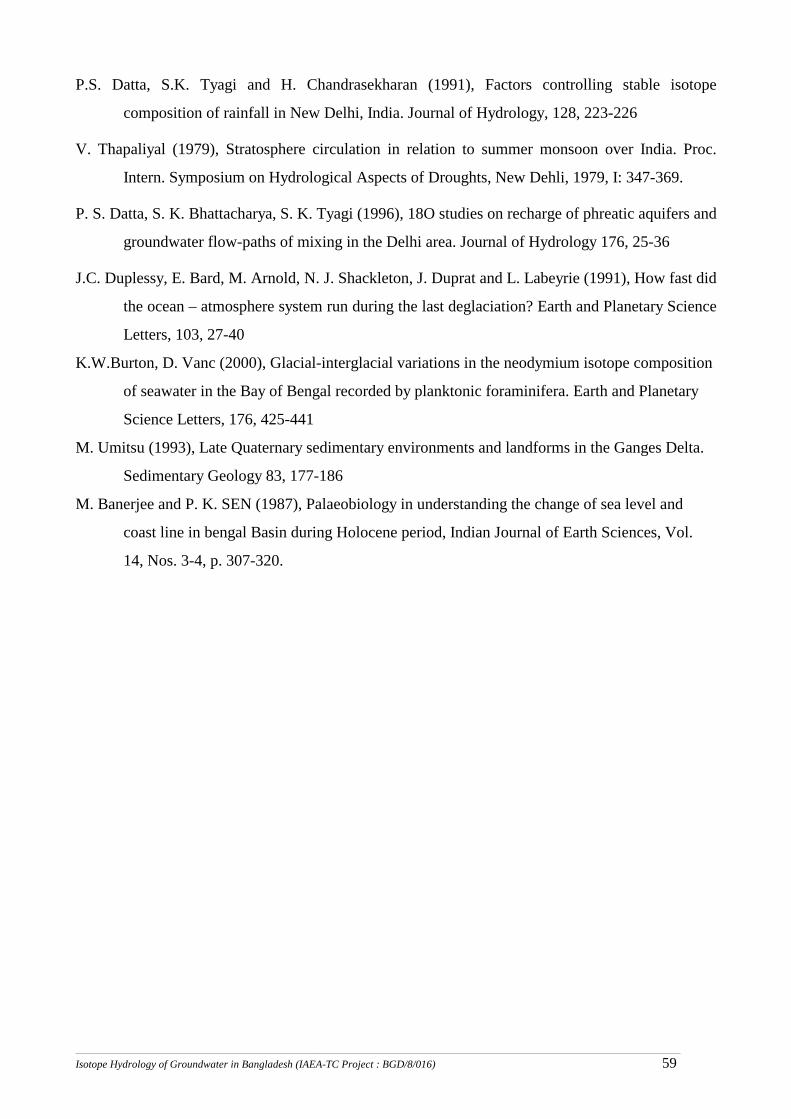
_______________________________________________________________________________________________________________________________________________________________________________________________________________________________
Isotope Hydrology of Groundwater in Bangladesh (IAEA-TC Project : BGD/8/016) 59
P.S. Datta, S.K. Tyagi and H. Chandrasekharan (1991), Factors controlling stable isotope
composition of rainfall in New Delhi, India. Journal of Hydrology, 128, 223-226
V. Thapaliyal (1979), Stratosphere circulation in relation to summer monsoon over India. Proc.
Intern. Symposium on Hydrological Aspects of Droughts, New Dehli, 1979, I: 347-369.
P. S. Datta, S. K. Bhattacharya, S. K. Tyagi (1996), 18O studies on recharge of phreatic aquifers and
groundwater flow-paths of mixing in the Delhi area. Journal of Hydrology 176, 25-36
J.C. Duplessy, E. Bard, M. Arnold, N. J. Shackleton, J. Duprat and L. Labeyrie (1991), How fast did
the ocean – atmosphere system run during the last deglaciation? Earth and Planetary Science
Letters, 103, 27-40
K.W.Burton, D. Vanc (2000), Glacial-interglacial variations in the neodymium isotope composition
of seawater in the Bay of Bengal recorded by planktonic foraminifera. Earth and Planetary
Science Letters, 176, 425-441
M. Umitsu (1993), Late Quaternary sedimentary environments and landforms in the Ganges Delta.
Sedimentary Geology 83, 177-186
M. Banerjee and P. K. SEN (1987), Palaeobiology in understanding the change of sea level and
coast line in bengal Basin during Holocene period, Indian Journal of Earth Sciences, Vol.
14, Nos. 3-4, p. 307-320.
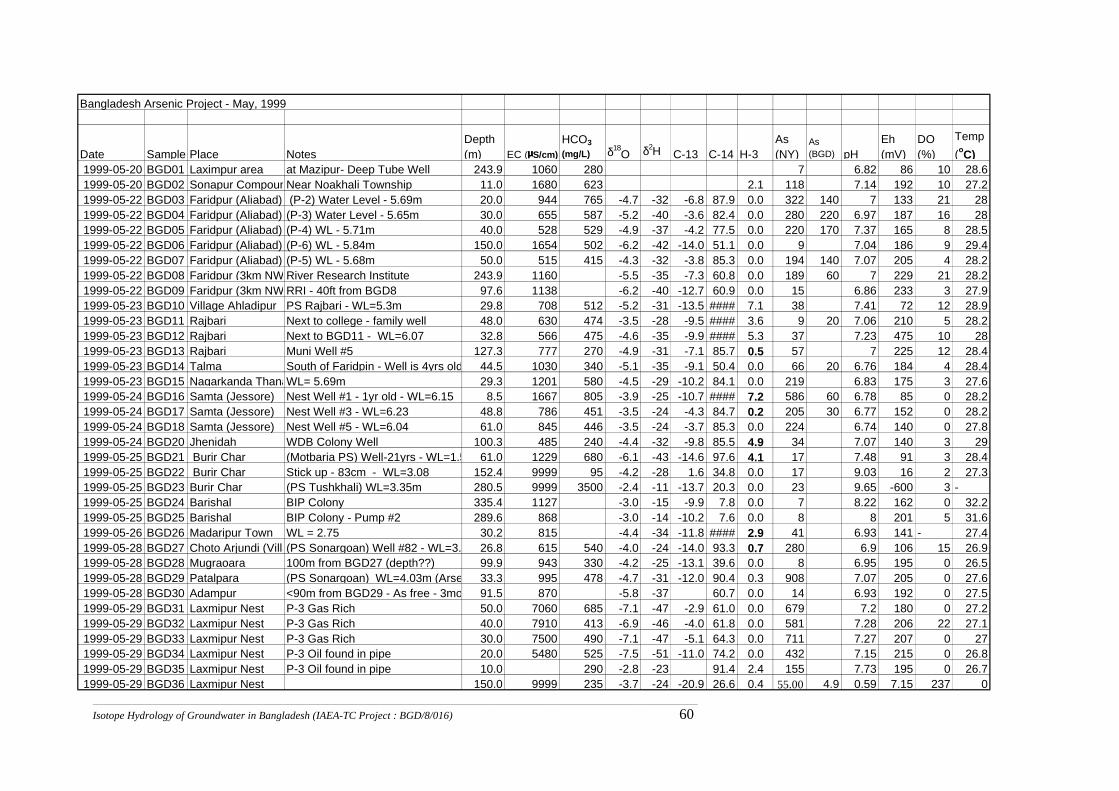
_______________________________________________________________________________________________________________________________________________________________________________________________________________________________
Isotope Hydrology of Groundwater in Bangladesh (IAEA-TC Project : BGD/8/016) 60
Bangladesh Arsenic Project - May, 1999
Date Sample Place NotesDepth (m) EC (µµµµS/cm)
HCO3 (mg/L) δ18O δ2Η C-13 C-14 H-3
As (NY)
As (BGD) pH
Eh (mV)
DO (%)
Temp (oC)
1999-05-20 BGD01 Laximpur area at Mazipur- Deep Tube Well 243.9 1060 280 7 6.82 86 10 28.61999-05-20 BGD02 Sonapur CompounNear Noakhali Township 11.0 1680 623 2.1 118 7.14 192 10 27.21999-05-22 BGD03 Faridpur (Aliabad) (P-2) Water Level - 5.69m 20.0 944 765 -4.7 -32 -6.8 87.9 0.0 322 140 7 133 21 281999-05-22 BGD04 Faridpur (Aliabad) (P-3) Water Level - 5.65m 30.0 655 587 -5.2 -40 -3.6 82.4 0.0 280 220 6.97 187 16 281999-05-22 BGD05 Faridpur (Aliabad) (P-4) WL - 5.71m 40.0 528 529 -4.9 -37 -4.2 77.5 0.0 220 170 7.37 165 8 28.51999-05-22 BGD06 Faridpur (Aliabad) (P-6) WL - 5.84m 150.0 1654 502 -6.2 -42 -14.0 51.1 0.0 9 7.04 186 9 29.41999-05-22 BGD07 Faridpur (Aliabad) (P-5) WL - 5.68m 50.0 515 415 -4.3 -32 -3.8 85.3 0.0 194 140 7.07 205 4 28.21999-05-22 BGD08 Faridpur (3km NW River Research Institute 243.9 1160 -5.5 -35 -7.3 60.8 0.0 189 60 7 229 21 28.21999-05-22 BGD09 Faridpur (3km NW RRI - 40ft from BGD8 97.6 1138 -6.2 -40 -12.7 60.9 0.0 15 6.86 233 3 27.91999-05-23 BGD10 Village Ahladipur PS Rajbari - WL=5.3m 29.8 708 512 -5.2 -31 -13.5 #### 7.1 38 7.41 72 12 28.91999-05-23 BGD11 Rajbari Next to college - family well 48.0 630 474 -3.5 -28 -9.5 #### 3.6 9 20 7.06 210 5 28.21999-05-23 BGD12 Rajbari Next to BGD11 - WL=6.07 32.8 566 475 -4.6 -35 -9.9 #### 5.3 37 7.23 475 10 281999-05-23 BGD13 Rajbari Muni Well #5 127.3 777 270 -4.9 -31 -7.1 85.7 0.5 57 7 225 12 28.41999-05-23 BGD14 Talma South of Faridpin - Well is 4yrs old 44.5 1030 340 -5.1 -35 -9.1 50.4 0.0 66 20 6.76 184 4 28.41999-05-23 BGD15 Nagarkanda ThanaWL= 5.69m 29.3 1201 580 -4.5 -29 -10.2 84.1 0.0 219 6.83 175 3 27.61999-05-24 BGD16 Samta (Jessore) Nest Well #1 - 1yr old - WL=6.15 8.5 1667 805 -3.9 -25 -10.7 #### 7.2 586 60 6.78 85 0 28.21999-05-24 BGD17 Samta (Jessore) Nest Well #3 - WL=6.23 48.8 786 451 -3.5 -24 -4.3 84.7 0.2 205 30 6.77 152 0 28.21999-05-24 BGD18 Samta (Jessore) Nest Well #5 - WL=6.04 61.0 845 446 -3.5 -24 -3.7 85.3 0.0 224 6.74 140 0 27.81999-05-24 BGD20 Jhenidah WDB Colony Well 100.3 485 240 -4.4 -32 -9.8 85.5 4.9 34 7.07 140 3 291999-05-25 BGD21 Burir Char (Motbaria PS) Well-21yrs - WL=1.5 61.0 1229 680 -6.1 -43 -14.6 97.6 4.1 17 7.48 91 3 28.41999-05-25 BGD22 Burir Char Stick up - 83cm - WL=3.08 152.4 9999 95 -4.2 -28 1.6 34.8 0.0 17 9.03 16 2 27.31999-05-25 BGD23 Burir Char (PS Tushkhali) WL=3.35m 280.5 9999 3500 -2.4 -11 -13.7 20.3 0.0 23 9.65 -600 3 -1999-05-25 BGD24 Barishal BIP Colony 335.4 1127 -3.0 -15 -9.9 7.8 0.0 7 8.22 162 0 32.21999-05-25 BGD25 Barishal BIP Colony - Pump #2 289.6 868 -3.0 -14 -10.2 7.6 0.0 8 8 201 5 31.61999-05-26 BGD26 Madaripur Town WL = 2.75 30.2 815 -4.4 -34 -11.8 #### 2.9 41 6.93 141 - 27.41999-05-28 BGD27 Choto Arjundi (Villa(PS Sonargoan) Well #82 - WL=3. 26.8 615 540 -4.0 -24 -14.0 93.3 0.7 280 6.9 106 15 26.91999-05-28 BGD28 Mugraoara 100m from BGD27 (depth??) 99.9 943 330 -4.2 -25 -13.1 39.6 0.0 8 6.95 195 0 26.51999-05-28 BGD29 Patalpara (PS Sonargoan) WL=4.03m (Arse 33.3 995 478 -4.7 -31 -12.0 90.4 0.3 908 7.07 205 0 27.61999-05-28 BGD30 Adampur <90m from BGD29 - As free - 3mo 91.5 870 -5.8 -37 60.7 0.0 14 6.93 192 0 27.51999-05-29 BGD31 Laxmipur Nest P-3 Gas Rich 50.0 7060 685 -7.1 -47 -2.9 61.0 0.0 679 7.2 180 0 27.21999-05-29 BGD32 Laxmipur Nest P-3 Gas Rich 40.0 7910 413 -6.9 -46 -4.0 61.8 0.0 581 7.28 206 22 27.11999-05-29 BGD33 Laxmipur Nest P-3 Gas Rich 30.0 7500 490 -7.1 -47 -5.1 64.3 0.0 711 7.27 207 0 271999-05-29 BGD34 Laxmipur Nest P-3 Oil found in pipe 20.0 5480 525 -7.5 -51 -11.0 74.2 0.0 432 7.15 215 0 26.81999-05-29 BGD35 Laxmipur Nest P-3 Oil found in pipe 10.0 290 -2.8 -23 91.4 2.4 155 7.73 195 0 26.71999-05-29 BGD36 Laxmipur Nest 150.0 9999 235 -3.7 -24 -20.9 26.6 0.4 55.00 4.9 0.59 7.15 237 0
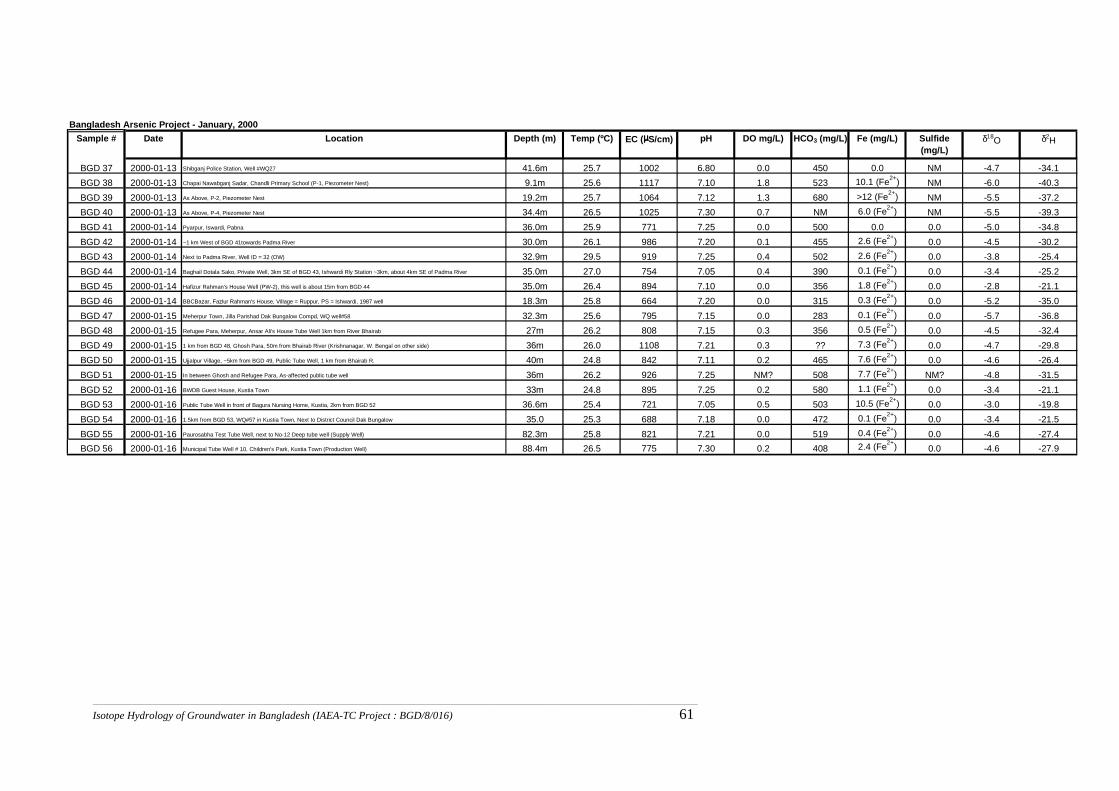
_______________________________________________________________________________________________________________________________________________________________________________________________________________________________
Isotope Hydrology of Groundwater in Bangladesh (IAEA-TC Project : BGD/8/016) 61
Bangladesh Arsenic Project - January, 2000Sample # Date Location Depth (m) Temp (ºC) EC (µµµµS/cm) pH DO mg/L) HCO3 (mg/L) Fe (mg/L) Sulfide
(mg/L)δ18O δ2H
BGD 37 2000-01-13 Shibganj Police Station, Well #WQ27 41.6m 25.7 1002 6.80 0.0 450 0.0 NM -4.7 -34.1BGD 38 2000-01-13 Chapai Nawabganj Sadar, Chandli Primary School (P-1, Piezometer Nest) 9.1m 25.6 1117 7.10 1.8 523 10.1 (Fe2+) NM -6.0 -40.3BGD 39 2000-01-13 As Above, P-2, Piezometer Nest 19.2m 25.7 1064 7.12 1.3 680 >12 (Fe2+) NM -5.5 -37.2BGD 40 2000-01-13 As Above, P-4, Piezometer Nest 34.4m 26.5 1025 7.30 0.7 NM 6.0 (Fe2+) NM -5.5 -39.3BGD 41 2000-01-14 Pyarpur, Iswardi, Pabna 36.0m 25.9 771 7.25 0.0 500 0.0 0.0 -5.0 -34.8BGD 42 2000-01-14 ~1 km West of BGD 41towards Padma River 30.0m 26.1 986 7.20 0.1 455 2.6 (Fe2+) 0.0 -4.5 -30.2BGD 43 2000-01-14 Next to Padma River, Well ID = 32 (OW) 32.9m 29.5 919 7.25 0.4 502 2.6 (Fe2+) 0.0 -3.8 -25.4BGD 44 2000-01-14 Baghail Dotala Sako, Private Well, 3km SE of BGD 43, Ishwardi Rly Station ~3km, about 4km SE of Padma River 35.0m 27.0 754 7.05 0.4 390 0.1 (Fe2+) 0.0 -3.4 -25.2BGD 45 2000-01-14 Hafizur Rahman's House Well (PW-2), this well is about 15m from BGD 44 35.0m 26.4 894 7.10 0.0 356 1.8 (Fe2+) 0.0 -2.8 -21.1BGD 46 2000-01-14 BBCBazar, Fazlur Rahman's House, Village = Ruppur, PS = Ishwardi, 1987 well 18.3m 25.8 664 7.20 0.0 315 0.3 (Fe2+) 0.0 -5.2 -35.0BGD 47 2000-01-15 Meherpur Town, Jilla Parishad Dak Bungalow Compd, WQ well#58 32.3m 25.6 795 7.15 0.0 283 0.1 (Fe2+) 0.0 -5.7 -36.8BGD 48 2000-01-15 Refugee Para, Meherpur, Ansar Ali's House Tube Well 1km from River Bhairab 27m 26.2 808 7.15 0.3 356 0.5 (Fe2+) 0.0 -4.5 -32.4BGD 49 2000-01-15 1 km from BGD 48, Ghosh Para, 50m from Bhairab River (Krishnanagar, W. Bengal on other side) 36m 26.0 1108 7.21 0.3 ?? 7.3 (Fe2+) 0.0 -4.7 -29.8BGD 50 2000-01-15 Ujjalpur Village, ~5km from BGD 49, Public Tube Well, 1 km from Bhairab R. 40m 24.8 842 7.11 0.2 465 7.6 (Fe2+) 0.0 -4.6 -26.4BGD 51 2000-01-15 In between Ghosh and Refugee Para, As-affected public tube well 36m 26.2 926 7.25 NM? 508 7.7 (Fe2+) NM? -4.8 -31.5BGD 52 2000-01-16 BWDB Guest House, Kustia Town 33m 24.8 895 7.25 0.2 580 1.1 (Fe2+) 0.0 -3.4 -21.1BGD 53 2000-01-16 Public Tube Well in front of Bagura Nursing Home, Kustia, 2km from BGD 52 36.6m 25.4 721 7.05 0.5 503 10.5 (Fe2+) 0.0 -3.0 -19.8BGD 54 2000-01-16 1.5km from BGD 53, WQ#57 in Kustia Town, Next to District Council Dak Bungalow 35.0 25.3 688 7.18 0.0 472 0.1 (Fe2+) 0.0 -3.4 -21.5BGD 55 2000-01-16 Paurosabha Test Tube Well, next to No-12 Deep tube well (Supply Well) 82.3m 25.8 821 7.21 0.0 519 0.4 (Fe2+) 0.0 -4.6 -27.4BGD 56 2000-01-16 Municipal Tube Well # 10, Children's Park, Kustia Town (Production Well) 88.4m 26.5 775 7.30 0.2 408 2.4 (Fe2+) 0.0 -4.6 -27.9

![[Hydrology] groundwater hydrology david k. todd (2005)](https://static.fdocuments.in/doc/165x107/55a8e6001a28ab6c2f8b4687/hydrology-groundwater-hydrology-david-k-todd-2005-55b0d9a792c06.jpg)


![[Hydrology] Groundwater Hydrology - David K. Todd (2005)](https://static.fdocuments.in/doc/165x107/548ce7beb47959e2288b45f9/hydrology-groundwater-hydrology-david-k-todd-2005.jpg)