Isolation and purification of AZAs from naturally ...mtwiner/PDFs/ASTOX final_june 2007.pdf8.1. Safe...
128
Philipp Hess Pearse McCarron Nils Rehmann Jane Kilcoyne Terry McMahon Gavin Ryan Michael P. Ryan Michael J.Twiner Gregory J. Doucette Masayuki Satake Emiko Ito Takeshi Yasumoto Isolation and purification of AZAs from naturally contaminated materials, and evaluation of their toxicological effects (ASTOX) Marine Environment & Health Series No. 28 2007 www.marine.ie ISSN 1649 0053 MARINE INSTITUTE 80 Harcourt Street Dublin 2 Tel: +353 1 4766500 Fax: +353 1 4784988 MARINE INSTITUTE Furnace Newport Co. Mayo Tel: +353 98 42300 Fax: +353 98 42340 www.marine.ie MARINE INSTITUTE Rinville Oranmore Co. Galway Tel: +353 91 387 200 Fax: +353 91 387 201 Email: [email protected] MARINE INSTITUTE REGIONAL OFFICES HEADQUARTERS & LABORATORIES
Transcript of Isolation and purification of AZAs from naturally ...mtwiner/PDFs/ASTOX final_june 2007.pdf8.1. Safe...

Philipp HessPearse McCarron
Nils RehmannJane Kilcoyne
Terry McMahonGavin Ryan
Michael P. RyanMichael J.Twiner
Gregory J. DoucetteMasayuki Satake
Emiko ItoTakeshi Yasumoto
Isolation and purification of AZAs from naturally
contaminated materials, and evaluation of their
toxicological effects (ASTOX)
Marine Environment & Health Series No. 28 2007www.marine.ie
ISSN 1649 0053
MARINE INSTITUTE80 Harcourt StreetDublin 2Tel: +353 1 4766500Fax: +353 1 4784988
MARINE INSTITUTEFurnaceNewportCo. MayoTel: +353 98 42300Fax: +353 98 42340
www.marine.ie MARINE INSTITUTERinville Oranmore Co. GalwayTel: +353 91 387 200Fax: +353 91 387 201Email: [email protected]
MARINE INSTITUTE REGIONAL OFFICESHEADQUARTERS & LABORATORIES

Isolation and purification of AZAs from naturally contaminated materials,
and evaluation of their toxicological effects (ASTOX)
May 2007 Philipp Hess*, Pearse McCarron, Nils Rehmann, Jane Kilcoyne, Terry McMahon. Marine Institute, Rinville, Oranmore, Co. Galway, Ireland.
Gavin Ryan, Michael P. Ryan. University College Dublin, School of Biomedical & Biomolecular Sciences, Conway Institute, Belfield, Dublin 4, Ireland.
Michael J. Twiner, Gregory J. Doucette. Center for Coastal Environmental Health and Biomolecular Research, Marine Biotoxins Program - NOAA/NOS/NCCOS 219 Fort Johnson Road; Charleston, SC 29412-9110 USA. Masayuki Satake. Graduate School of Agricultural Science, Tohoku University, 1-1 Tsutsumi-dori, Amamiya, Aoba-ku Sendai 981-8555, Japan.
Emiko Ito. Research Centre for Pathogenic Fungi & Microbial Toxicoses, Chiba University, 1-8-1, Inohanam, Chuo-ku, Chiba 260-8673, Japan. Takeshi Yasumoto. Japan Food Research Laboratories, Tama Laboratory, 6-11-10, Nagayama, Tama-shi, Tokyo 2060025 Japan.
* corresponding author’s contact: Fax: intl. + 353 91 387246 [email protected]

Acknowledgements This project (Grant Aid Agreement no. ST/02/02) was carried out with the support of the Marine Institute and the Marine RTDI Measure, Productive Sector Operational Programme, National Development Plan 2000 – 2006. Firstly, the authors would like to thank the Irish shellfish industry for whose benefit this study was carried out. In particular, we would like to express our gratitude to Bantry Bay Seafoods, John McCloskey, John Harrington and William and Richard Murphy who have contributed to the success of this study through their supply of mussels and dissection services at industrious speed, when times were difficult for the industry and at a premium for the researchers involved in this project. We also acknowledge the perseverance of Mr. Richie Flynn (Secretary, Irish Farmers Association - Aquaculture) in outlining to stakeholders and the public the problems caused by shellfish toxins to professional shellfish farmers; without public knowledge of the difficulties it would not be possible to scientifically address the issues. These difficulties have been taken from the political stage and translated into constructive project euros with the significant input of Mr. Micheal O’Cinneide, Director of the Marine Environment and Food Safety Services at the Marine Institute. We also acknowledge the strategic support from Mr. Alan Reilly, Deputy CEO of the Food Safety Authority Ireland, through the organisation of the stakeholder forum: the Molluscan Shellfish Safety Committee; the discussions and challenges from this forum are invaluable in formulating our applied research. Finally, we would like to thank all our colleagues from the Biotoxin Chemistry Team and the Shellfish Safety Section who had an input into this study, our special thanks go to Gearoid Nicholson for administrative support and Dr. Ronel Biré who has contributed with great enthusiasm through his discussions, organisational support and hands-on approach to getting things done.

I
Table of Contents Page No. List of abbreviations 1 1. Executive Summary 3
1.1. Background 3 1.2. Project design 3 1.3. Retrieval of shellfish tissues and preparation of reference materials 3 1.4. Isolation and purification studies 4 1.5. Toxicology studies 4 1.6. Mechanistic studies 4 1.7. Risk assessment 5 1.8. Scientific publication output 5
2. Introduction 6
2.1. History of occurrence of AZA and DTX2 poisoning 6 2.2. Previous lack of reference materials and gaps in toxicological knowledge 9
3. Study Design 11 3.1. Aims of study 11 3.2. Modular design and timeframe 11 3.3. Interdependence of work packages and project risks 12
4. Toxins & Reference Materials – Tools for Analysis & Toxicology 15 4.1. Retrieval of contaminated materials 15
4.1.1. Retrieval and storage of materials prior to ASTOX project 15 4.1.2. Retrieval of materials during ASTOX 15 4.1.3. Bulk processing of shellfish 17 4.1.4. Storage conditions and options 17
4.2. Isolation of AZA1, -2, -3, and DTX2 18 4.2.1. Introduction 18 4.2.2. Early developmental work 18
4.2.2.1. Isolation of AZA1 18 4.2.2.2. Isolation of AZA2, -3, -4 and -5 18
4.2.3. Implementation of previously developed protocol 19 4.2.3.1. Isolation 19 4.2.3.2. Clarification 20
4.2.4. Improved isolation procedure at MI 21 4.2.5. NRC-IMB isolation procedure 22 4.2.6. Comparison of MI/TU and NRC-IMB schemes 26 4.2.7. Isolation of DTX2 26 4.2.8. Characterisation by NMR 27

II
4.2.8.1. Purity assessment of AZAs by NMR 27 4.2.8.2. Purity assessment of DTX2 by NMR and LC-MS 29
4.2.9. Obtained materials 29 4.2.10. Alternative ways to standards 30
4.2.11. Provision of purified materials for additional studies 31 4.2.11.1. AZA provided to NRC-IMB, Halifax, Canada 31 4.2.11.2. Provision of AZA1 for toxicological research 31 4.2.11.3. Provision of DTX2 for toxicological research 31 4.2.11.4. Provision of AZA and DTX2 for matrix effect studies 31 4.2.11.5. Provision of material to the European CRL 31
4.2.12. Gaps in current studies 31
4.3. Preparation and characterisation of tissue reference materials 33 4.3.1. Introduction 33 4.3.2. Parameters affecting homogeneity 34
4.3.2.1. Assessing homogeneity 34 4.3.2.2. Optimising methodology in terms of homogeneity 35 4.3.2.3. Homogeneity on a large scale 37
4.3.3. Parameters affecting stability 37 4.3.3.1. Heat stabilisation 38 4.3.3.2. Freeze drying 40 4.3.3.3. Additives 43 4.3.3.4. Irradiation 43 4.3.3.5. Additional steps to improve stability of materials 45 4.3.3.6. General discussion on stabilisation techniques 45
4.3.4. Standardisation of procedure 46 4.3.5. Overview of materials produced at MI 48 4.3.6. Overview of materials produced at NRC-IMB 49 4.3.7. Use of materials produced 49
4.3.7.1. Single laboratory validation 49 4.3.7.2. Collaborative studies 50 4.3.7.3. Proficiency testing and interlaboratory studies 50 4.3.7.4. Feasibility of certification and candidate CRMs 51
4.3.8. Further developments 51 4.3.8.1. Gaps in current studies 51 4.3.8.2. Sustainable supply of tissue reference materials 51
4.4. Synopsis of progress on AZA standards and reference materials 52
5. Mechanisms Underlying the Toxicity of AZAs 54
5.1. Cellular functions affected by AZAs 54
5.1.1. Introduction 54 5.1.2. Cytotoxic effects of AZA in different cell types 55 5.1.3. Membrane integrity: effect of AZA in lymphocytes 58 5.1.4. TEER: an in vitro model of the gastrointestinal tract 59
5.1.4.1. AZA 59 5.1.4.2. Other toxins in the in vitro model of the gastrointestinal tract 61 5.1.4.3. Combinations 63
5.1.5. Cell morphology and cytoskeletal effects in lymphocytes 64

III
5.1.6. Signalling pathways and junctional regulation in human 67 gastrointestinal cells 5.1.7. Neuro-inhibitory effects 70 5.1.7.1. Neuronal networks 70
5.1.7.2. Whole-cell patch clamp recordings following exposure to AZA1 72 5.1.8. Teratogenic effects in fish 73 5.1.9. Protein phosphatase 2A inhibition 77
5.2. In vitro gene expression studies 78
5.2.1. Gene microarray studies on Caco-2 cells 78 5.2.2. Gene chip studies on lymphocyte T cells 83 5.2.3. Gene expression summary 86
5.3. Design of in vivo studies 87 5.3.1. Defining the objectives of in vivo studies 87 5.3.2. Requirements for in vivo studies 87
5.4. Synopsis of knowledge gained on AZA toxicology 88 5.4.1. Cellular functions 88 5.4.2. Genetic interactions 89 5.4.3. Comparison of in vitro and in vivo studies 89 5.4.4. Functional assays as a non-animal method to detect AZA 89 5.4.5. Functional assays as a validation tool for other non-animal methods 89 5.4.6. Gaps and future developments 90
6. Risk Assessment of AZAs 91 6.1. Risk assessments prior to ASTOX 91
6.1.1. FSAI risk assessment 2001 91 6.1.2. EU review in 2001 91 6.1.3. FAO/IOC/Codex expert consultation 2004 91 6.1.4. CRLMB working group on toxicology 2005 92
6.2. Risk assessment supported by ASTOX 92
6.2.1. FSAI risk assessment 2006 92
7. Additional Research and Potential Outcomes 94 7.1. Toxicity of DTX2 relative to OA 94 7.2. Effects of heat treatments on AZA concentration of mussels in shell 95 7.3. Effects of heat treatments on DA concentration of mussels in shell 96 7.4. Feasibility and production of certified reference materials for AZAs 97
7.4.1. NRC-IMB 97 7.4.1.1. Mussel tissue CRM 97 7.4.1.2. Calibration solution CRM 98 7.4.2. IRMM 98
7.5. Structure activity relationships of AZA1 and synthetic analogues in mice 99

IV
8. Recommendation to Regulators, Risk Managers and Shellfish Industry 101 8.1. Safe levels of AZAs in shellfish 101 8.2. Pitfalls of commercial processing and gaps in current EU legislation 102
9. Dissemination 103
9.1. List of publications arising from the project 103 9.2. List of conferences at which results from ASTOX were presented 104 9.3. Proceedings of the ASTOX dissemination workshop 106
9.3.1. Presentations given (related research) 106 9.3.2. Future research directions 108
10. References 110

1
Abbreviations ARfD acute reference dose AZA azaspiracid AZP azaspiracid poisoning ASP amnesic shellfish poisoning BCR Bureau Communautaire de Reference BHT Butylated hydroxyl toluene COSY correlation spectroscopy CRL community reference laboratory CRM certified reference material CU Chiba University CV coefficient of variation DA domoic acid DCMNR Department of Communications, Marine and Natural Resources DIC differential interference contrast DiFMUP 6, 8-difluoro-4-methylumbelliferyl phosphate DTX dinophysistoxin DSP diarrhetic shellfish poisoning ECVAM European Centre for the Validation of Alternative Methods EGFR epidermal growth factor receptor EMP epithelial membrane proteins EMT epithelial mesenchymal transition EQUIV equivalents ER endoplastic reticulum ERK extracellular regulated kinase EtOAc ethyl acetate EU European Union FAO Food and Agricultural Organisation FSAI Food Safety Authority Ireland GABA gamma aminobutyric acid GPC gel permeation chromatography G6PD glucose-6-phosphate dehydrogenase HABs harmful algal blooms HP hepatopancreas HPLC high performance liquid chromatography HYOU1 hypoxia up-regulated 1 IOC Intergovernmental Oceanographic Commision IUPAC International Union of Pure and Applied Chemistry IRMM Institute for Reference Materials and Measurements ISO International Standards Organisation JRFL Japan Food Research Laboratory KLF4 Kruppel-like factor 4 LC-MS liquid chromatography - mass spectrometry LDLR low density lipoprotein receptor LOAEL lowest observable adverse effect level LPLC low pressure liquid chromatography LRM laboratory reference material MAPK mitogen activated protein kinase MBA mouse bioassay MEA microelectrode arrays MI Marine Institute MeOH methanol MTS 3-(4, 5-dimethylthiazol-2-yl)-5-(3-carboxymethoxyphenyl)-2-(4-sulfophenyl)-2H-
tetrazolium, inner salt MTT 3-(4, 5-dimethylthiazol-2-yl)-2, 5-diphenyltetrazolium bromide NDP National Development Plan NIST National Institute for Standards and Technology NOAA National Oceanic and Atmospheric Administration NOAEL no observable adverse effect level NOESY nuclear overhause effect spectroscopy NMR nuclear magnetic resonance NRC-IMB National Research Council – Institute of Marine Biosciences

2
NRL National Reference Laboratory NSVS Norwegian School of Veterinary Science NVI Norwegian Veterinary Institute OA okadaic acid OECD Organisation for Economic Co-operation and Development PCR polymerase chain reaction PF post fertilization PMVK phosphomevalonate kinase PP1 protein phosphatase 1 PT proficiency testing PTX pectenotoxin PSP paralytic shellfish poisoning QC quality control RP reverse phase RM reference material ROESY rotating frame overhause effect spectroscopy SD standard deviation SEC size exclusion chromatography SEM scanning electron microscopy SLV single laboratory validation SMST Standard Measurement and Testing SOP standard operating procedure SPX spirolide toxin TDI tolerable daily intake TEER transepithelial electrical resistance TOCSY total correlated spectroscopy TRC Tropical Research Centre TTX Tetrodotoxin TU Tohoku University UCD University College Dublin UME uncooked mussel extract UV ultra violet VEGF vascular endothelial growth factor VLC vacuum liquid chromatography WHO World Health Organisation WP work package YTX yessotoxin
1. Executive Summary _________________________________________________________________________________________
3
1. Executive Summary 1.1. Background
Since 1995, when several people became ill following consumption of shellfish from Ireland, azaspiracids (AZAs) have been known as shellfish toxins, causing symptoms associated with gastro-intestinal disorders, including diarrhea, vomiting, headaches and others. The aims of the ASTOX-project were to provide control tools for the analysis of AZAs in shellfish, i.e. calibration standards and tissue reference materials (RMs), and to clarify the toxicity of AZAs in qualitative and quantitative terms, i.e. to understand the mode of action of AZAs and to derive a No Observable Adverse Effect Level (NOAEL) for safe consumption of shellfish. 1.2. Project design
Activities relating to the retrieval of contaminated shellfish, the preparation of homogeneous and stable RMs and the isolation and purification of AZAs and dinophysistoxin-2 (DTX2) were mainly carried out at the Marine Institute (MI), Ireland, with advice and quality control (QC) being provided by Tohoku University, (TU; Japan), the Japan Food Research Laboratory, (JFRL), and the Tropical Research Centre, (TRC; Okinawa, Japan). Further collaboration also included external partners such as the Norwegian Veterinary Institute, (NVI; Oslo, Norway) and the National Research Council, Institute for Marine Biosciences, (NRC-IMB; Halifax, Canada). Activities relating to the evaluation of the toxic effects of AZAs were mainly carried out at the Conway Institute, University College Dublin, (UCD; Ireland), Chiba University, (CU; Japan) and at the Center for Coastal Environmental Health and Biomolecular Research, NOAA (Charleston, US). Additional collaborators included the Norwegian School of Veterinary Science, Oslo (Norway), the Centre for Bio/molecular Science and Engineering, Naval Research Laboratory (US) and the University of Modena (Italy).
1.3. Retrieval of shellfish tissues and preparation of RMs
Tissues obtained from natural toxin occurrences in 2000, 2001, 2004 and 2005 were contaminated with up to 5 mg/kg AZA1 and up to 1.5 mg/kg with DTX2, and were successfully used to prepare 17 different shellfish tissue RMs (100 to 3,700 portions of 1 to 8 g). Factors affecting homogeneity were mostly related to water content and dispensing procedures; improved procedures were published. Factors affecting stability were temperature, water content and container sealing; methods investigated to improve stability included the addition of antibiotics and antioxidants, γ-irradiation, heat treatments and freeze-drying. Some of the materials resulting from these studies have been and continue to be employed, in the QC of the Irish national statutory monitoring for marine biotoxins; others have been used for comparison of the detection method used at MI, with up to 16 other laboratories worldwide, through proficiency testing and method validation exercises. The collaboration with NRC-IMB allowed for the preparation of a candidate mussel tissue CRM for AZAs, which will be made available globally once certification is complete (ca. 3,700 portions of 8 g).

1. Executive Summary _________________________________________________________________________________________
4
1.4. Isolation and purification studies
Isolation and purification studies included a total of 14 isolation batches and led to ca. 8 mg purified AZA1. The initial isolation procedure developed by the TU collaborators was implemented and tested; a detailed standardised protocol for the purification of AZAs has been established. The amount of toxin obtained was not sufficient to conduct formal long-term oral exposure studies in mice since this would require more than 250 mg. However, aliquots of the purified standard have been provided for in vitro toxicology as well as method validation studies. The collaboration with NRC-IMB allowed for the preparation of a candidate CRM for pure AZA1, which will be made available globally once certification is complete (ca. 3,500 ampoules of 0.5 mL at ca. 1.5 µM AZA1). The collaboration with NRC-IMB is continuing and 4 reference standards are under development (AZA1, -2, -3 and DTX2). Small amounts of AZA1 standard and shellfish tissues contaminated with AZAs have already been made available to the EU Community Reference Laboratory (CRL), individual National Reference Laboratories (NRLs) and the Public Analyst Laboratory in Galway, another Irish official control laboratory.
1.5. Toxicology studies
A summary of toxicological observations in humans and animals was prepared for a risk assessment on AZAs, and cellular and molecular studies were designed to investigate the mode of action underlying the toxicity of AZAs. Studies conducted on seven different mammalian cell lines showed that AZAs strongly affect most cell types, an important observation in light of the initial report of multiple organ damage in mice following exposure to AZAs. In addition, a functional assay was developed for the specific detection of AZAs using morphological changes of pseudopodia in lymphocyte-T cells (Jurkat). These cytoskeletal effects provided some of the first insights as to the molecular target of AZAs. In parallel, cytoskeletal effects have also been observed in human colon cells (Caco-2), used in a separate functional assay developed to mimic the effects of AZAs in the human digestive tract. Caco-2 cells form a tight layer, across which an electrical resistance can be measured in the assay. When the cell-layer is exposed to AZAs, it is disrupted and the electrical resistance decreases. These assays reflect the in vivo effects of gastrointestinal upset in humans.
1.6. Mechanistic studies
At molecular level, the cytoskeletal effects in Caco-2 cells were shown to be related to the proteins actin and claudin-2 and -4. These studies demonstrate that AZAs strongly interfere with the intestinal barrier, consistent with the human symptom of diarrhoea. Parallel studies on enzymes affected by okadaic acid (OA), namely protein phosphatase-1 (PP1) and –2a (PP2A), showed that AZAs do not bind to these enzymes, thereby, distinguishing their toxic mechanisms clearly from that of OA and DTX2. Using intraperitoneal injection into mice, the toxicity of DTX2 was compared to that of OA, and DTX2 was found to have only ca. 60% of the potency of OA (Aune et al., 2007); a similar reduced potency of DTX2 compared to OA was also noted in the protein-phosphatase inhibition assay. AZAs also showed toxic effects on neuronal cells in spinal cord networks and in the expression of E-cadherin in MCF-7 and Caco-2 cells. Structure-activity relationship of AZAs was further clarified to be stereo-specific, since a C1-20 epi-AZA1 showed significantly reduced toxicity in mice at up to 4 times higher concentrations as AZA1. The studies in this project did not unequivocally demonstrate the primary target(s) of AZA; however, alterations of gene expression in lymphocyte-T and Caco-2 cells following exposure to AZA1 were investigated

1. Executive Summary _________________________________________________________________________________________
5
and point toward possible pathways of molecular interaction related to wound healing and lipid metabolism pathways.
1.7. Risk assessment
The project was initially designed to carry out long-term animal exposures to derive a lowest observed adverse effect level (LOAEL), and subsequently a no observed adverse effect level (NOAEL) for a safe level of AZAs in shellfish. However, following international guidance, the risk assessment, to which scientists of this project contributed, was based on data from human illness. The Food Safety Authority Ireland (FSAI) risk assessment from 2001 was reviewed in light of the experience gained in Ireland since then. Evidence from routine monitoring on profiles of analogues, studies on the heat-stability of AZAs, as well as the distribution of AZA throughout different mussel tissues allowed the revision of the initial intake for people involved in one of the first poisoning incidents in Ireland. Those data, in combination with the experience from risk management during 2001 and 2005, allowed the establishment of a safe level of AZA in shellfish at 0.16 mg/kg shellfish flesh. This risk assessment was adopted by the FSAI in August 2006, and has been made available to international bodies, e.g. the European Food Safety Authority and Codex alimentarius.
1.8. Scientific publication output
The scientific aspects of this work have led to 22 presentations at international conferences and 12 peer-reviewed papers. At least 8 further peer-reviewed publications are in preparation (3 submitted).

2. Introduction _________________________________________________________________________________________
6
2. Introduction 2.1. History of occurrence of AZAs and DTX2
The first known cases of food poisoning due to AZAs occurred in autumn 1995, following consumption in The Netherlands of shellfish originating from Killary Harbour, on the West coast of Ireland. (McMahon and Silke, 1996). Mussels were subsequently collected from the production area and isolation of the causative agent was successfully completed during 1996 at Tohoku University, Sendai, Japan, by the group of Profs. Yasumoto and Satake, who were also collaborators in this project. The next known poisoning incident related to AZAs occurred in 1997 on Arranmore Island, off the Northwest coast of Ireland, where local people got sick after consuming the first crop of mussels from a new production site. Even though the event was closely followed by a physician who documented the onset and extent of symptoms as well as consumption data, it was only possible to obtain shellfish from the site ca. 6 weeks after the incident, which introduces a significant uncertainty on the actual levels of toxin consumed. Further poisoning events were very isolated and either could not be directly related to AZA or occurred in very few individuals, such as a voluntary poisoning by a shellfish farmer in 2005, on the Northwest coast of Ireland, following prolonged closure of the production area. The symptoms of AZA poisoning (AZP) are very similar to those of diarrhetic shellfish poisoning (DSP) and include nausea, vomiting, diarrhea, abdominal cramps and others. Like DSP, for which it is estimated that only ca. 1% of all cases are reported, it can be assumed that most cases of AZP are not reported. Overall, the poisoning can be classified as rare, as only 5 intoxication incidents have been reported since the first occurrence in 1995 (2006 FSAI risk assessment). Prior to 2000, there was no systematic compound-specific monitoring in Ireland and apart from the 2 events in 1995 and 1997 when expert laboratories investigated the full toxin profile present in samples, very little was known about the regularity of occurrence of AZAs in shellfish. During 2000, the Department of Communications, Marine and Natural Resources (DCMNR) contracted analyses out to a research laboratory at Cork Institute of Technology and some confirmation of AZAs were carried out using ion-trap mass spectrometry. Analysis carried out in 2003 and 2004 by this project on shellfish that had been kept frozen since 2000 at Bantry Bay Seafoods, also confirmed that, during 2000, AZAs occurred in Bantry Bay. Since 2001, the MI has carried out a surveillance programme for lipophilic toxins occurring in shellfish produced in Ireland and the levels observed during the summer 2001 in Bantry Bay exceeded the 0.1 mg/kg limit estimated safe in the 2001 FSAI risk assessment (Anderson et al., 2001). During 2002, 2003 and 2004 relatively low levels were observed in Ireland, with the 0.16 mg/kg level established by the European Commission in 2002, being reached very rarely. In 2005, very high levels were observed in Bruckless, in the Northwest and in 2006, the EU regulatory limit was exceeded in mussels from production areas along the Southwest and West coasts. Scientists in the UK also detected the presence of AZAs in their shellfish during 2000 (unpublished data), while Norwegians detected significant levels of AZAs in their shellfish during 2003 (Aasen et al., 2006). Lower confirmed levels have been reported from France and Spain by Magdalena et al. (2003a). Since September 2006, the MI has collaborated with

2. Introduction _________________________________________________________________________________________
7
the Portuguese NRL on confirmation of the AZA-levels in their shellfish and Moroccan scientists have also reported the presence of AZAs in their shellfish (Taleb et al., 2006), but no confirmation of levels has been obtained. DTX2 is also a toxin of particular importance to shellfish grown in Ireland. This toxin was initially discovered in mussels from Ireland following prolonged closures in 1991 (Hu et al., 1992). Since then, DTX2 has been responsible for a large number of bay closures in the Southwest of Ireland. An added difficulty with this toxin is that it occurs late in the summer (typically peaks during August to September) and natural depuration from shellfish in Irish waters may be slow due to cooling water temperatures (Hess et al., 2003). Regular monitoring using Liquid Chromatography Mass Spectrometry (LC-MS) through the Irish statutory monitoring programme since 2001 has shown that DTX2 occurs every year in shellfish grown in the southwest and is associated with Dinophysis acuta, an alga that has not yet been cultured. Since the initial discovery and isolation in 1991/2, the toxin was also discovered in a number of other European countries, including Portugal, Spain, France, UK and more recently also Norway (Aune et al., 2007). However, due to difficulties in retrieving bulk amounts of shellfish or phytoplankton and due to the difficulty in culturing Dinophysis spp., bulk isolation has not been carried out. Also, since the toxin has not been found outside Europe, international priority was low. As DTX2 occurs regularly in Ireland, and as this project has a bulk retrieval and isolation component, the project also aimed to isolate DTX2 and prepare DTX2 RMs for use in validation studies. The structures of AZAs and the main toxins of the OA group are shown in Figures 2.1 and 2.2 respectively.

2. Introduction _________________________________________________________________________________________
8
Figure 2.1. Structure of AZAs with substitution points and list of all previously observed AZA analogs.
Figure 2.2. Structure of OA group.
8
O O
O15
O
O 3334
NH
O
O
27
23
2221
O
20
H
H
H
H
H
H
R2
3
2
1
R3
R1
R4
O
OH
OH
H
HO
AB
C D
E
F
GH
I
Abbr. Chemical name MW R1 (C8) R2 (C22) R3 (C3) R4 (C23)
AZA1 Azaspiracid 841.5 H H H
AZA2 8-methyl-azaspiracid 855.5 H HAZA3 22-desmethyl-azaspiracid 827.5 H H H HAZA4 22-desmethyl-3-hydroxy-azaspiracid 843.5 H H OH HAZA5 22-desmethyl-23-hydroxy-azaspiracid 843.5 H H H OH
AZA6 22-desmethyl-8-methyl-azaspiracid 841.5 H H H
AZA7 3-hydroxy-azaspiracid 857.5 H OH H
AZA8 23-hydroxy-azaspiracid 857.5 H H OH
AZA9 22-desmethyl-3-hydroxy-8-methyl-azaspiracid 857.5 H OH H
AZA10 22-desmethyl-23-hydroxy-8-methyl-azaspiracid 857.5 H H OH
AZA11 3-hydroxy-8-methyl-azaspiracid 871.5 OH H
AZA12 23-hydroxy-8-methyl-azaspiracid 871.5 H OH
CH3
CH3 CH3
CH3
CH3
CH3
CH3
CH3
CH3
CH3
CH3
CH3
O
O O
O
O O
OHO
OH
R1
OH
O OH
OH
R3
R2
Abbr. Chemical name MW R1 (C31) R2 (C35eq) R3 (C35ax)OA Okadaic acid 804.5 H HDTX1 35-methyl-okadaic acid 818.5 HDTX2 31-desmethyl-35-methyl-okadaic acid 804.5 H H
CH3
CH3 CH3
CH3

2. Introduction _________________________________________________________________________________________
9
2.2. Previous lack of RMs and gaps in toxicological knowledge RMs are either pure substances, e.g. pure AZA, or matrix RMs, e.g. shellfish homogenates contaminated with AZA. The need for RMs, highlighted regularly at national and international fora, is mainly driven by the QC requirements of official regulatory laboratories concerned with demonstrating the adequacy of their tests. Globally, there are very few independent bodies that produce CRMs for QC in analysis of foodstuffs. In the US and Canada, RM producers such as the National Institute for Standards and Technology (NIST) and the NRC-IMB produced a range of RMs for the analysis of environmental contaminants. Similarly, bodies such as the European “Bureau Communautaire de Reference” (BCR), later the “Standards Measurement and Testing” Programme (SM&T), and currently the Institute for Reference Materials and Measurements (IRMM), have facilitated the production of a number of primary standards and tissue RMs in the field of environmental contaminants, with the field of natural toxins remaining largely uncovered. Figure 2.3 shows the stages involved in the production of a CRM, as outlined by Hess et al., 2007. The greatest difficulty is observed in the initial assessment of the need for a CRM in the first place. Even when people have fallen ill following shellfish consumption, it is not always clear whether this illness was created by: (a) microbiological contamination, (b) a known toxin, or (c) other toxins yet to be discovered. If a novel compound is found responsible for the illness, the compound first needs to be isolated and identified, and then quantified in the shellfish initially causing the illness, thereby allowing epidemiological and toxicological evaluation. Thereafter, a regulatory limit is likely to be set and the need for QC tools in the monitoring of shellfish becomes evident. This step can take from as little as 1 year, e.g. discovery of domoic acid (DA) as a shellfish toxin up to regulation for DA in shellfish in Canada (Quilliam and Wright, 1989), up to as long as 5 years that elapsed between the initial AZA poisoning after consumption of mussels from Ireland in 1995 (McMahon and Silke., 1996) to regulation of AZA concentrations in shellfish in Ireland (Anderson et al., 2001). The difference in duration can be understood when realising that DA was already a known compound and occurred at relatively high concentrations (mg/kg range) when it was identified as a shellfish toxin, while AZAs were previously totally unknown and occurred at lower levels (µg/kg range). Indeed, the current EU regulatory limit differs by a factor of 125 between the two toxins (Regulation EC 953/2004). Once the need for a CRM has been established, the feasibility of its production needs to be investigated. The feasibility is determined by both the availability of naturally contaminated material and the chemical nature of the toxin. The availability of contaminated shellfish is often reduced due to the lack of toxin-specific monitoring: statutory surveillance in most countries is still based on animal testing using mice or rats, i.e. unspecific toxicity tests (Hess et al., 2006a). Also, some of the phytoplankton organisms that produce the toxins cannot be cultured, hence production of pure compounds is difficult and calibrants for toxin-specific monitoring are not always widely available at this stage. If contaminated shellfish tissue can be obtained, studies need to be undertaken to establish the stability of the toxin in shellfish and in solution. After these preliminary studies, if appropriate procedures have been established, a bulk quantity for the CRM production must be obtained. Such a quantity may be retrieved easily if the toxin occurs frequently and if monitoring procedures have been established in the relevant region. However, in some cases, e.g. AZAs, the occurrence is relatively sporadic, i.e. events only occur every 3 to 4 years, hence long-term monitoring may have to be established prior to the availability of internationally acceptable QC tools such as the CRM.

2. Introduction _________________________________________________________________________________________
10
This requirement for monitoring of a novel toxin group prior to a CRM becoming available also strongly suggests that there is a need for the production of LRMs in those laboratories where surveillance for novel compounds is established. Finally, when bulk quantities have been obtained and a candidate CRM is produced, the certification process must be carried out. The certification traces the quantity of the toxin in the CRM to a known reference substance and this means that prior to the production of a matrix CRM, a certified calibrant must have been prepared and methods for analysis must have been developed, to determine the values of the toxin in the matrix material.
Discovery of new illnessor toxin
Toxicological evaluationof epidemiological data
Isolation and purificationof toxin
Toxicological evaluationof pure compound
Regulatory limit
Retrieval of studymaterials
Scaled-up isolationof toxin
Behaviour of new toxinin solution + matrix
Preparation of trialmaterials and studieson homogeneity + stability
Retrieval of relevantmaterials (species, concentrations, profiles)
Production of purestandard
Production of tissuematerial
Homogeneity + stabilitystudies
Certification
Establish Need for CRM Feasibility of CRM Production of CRM
Figure 2.3. Schematic of the steps involved in the production of a CRM
While purified AZAs have been available to the MI since 2001, first donated by Tohoku University and then also produced in a collaboration between the MI and Tohoku University, these standards were not available at international level, i.e. at EU-level or globally. This was a clear impediment to progress since it meant that it was very difficult to establish definitive levels and methods of analysis for AZAs. Also, no shellfish tissue RM was available to the MI prior to the ASTOX project, resulting in a lack of QC necessary for the monitoring of AZAs in Ireland (and elsewhere).
As abovementioned, reported cases of AZP are relatively rare and hence, epidemiological data are very limited. Therefore, toxicological studies using live animals become very important in the evaluation of the toxicity of AZAs. However, these studies require large amounts of toxin and, due to the lack of these amounts, such studies had been very limited as well. All the studies on acute toxicity of AZAs in mice had been conducted using a limited number of animals, both for intraperitoneal and for oral exposure (Satake et al., 1998a, 1998b; Ito et al., 1998, 2000, and 2002). Nevertheless, these acute toxicity studies provided clear evidence that AZAs pose a potentially serious threat to human health and required further investigation. Flanagan et al. (2001), demonstrated that AZAs most likely have a different mode of action from okadaic acid, as their study showed that AZAs do not inhibit PP1. However, the mode of action of AZAs remained largely unexplained prior to the ASTOX project. Also, the level that would cause no harm to humans was not well studied due to the general lack of information on the toxin behaviour.

3. Study Design _________________________________________________________________________________________
11
3. Study Design
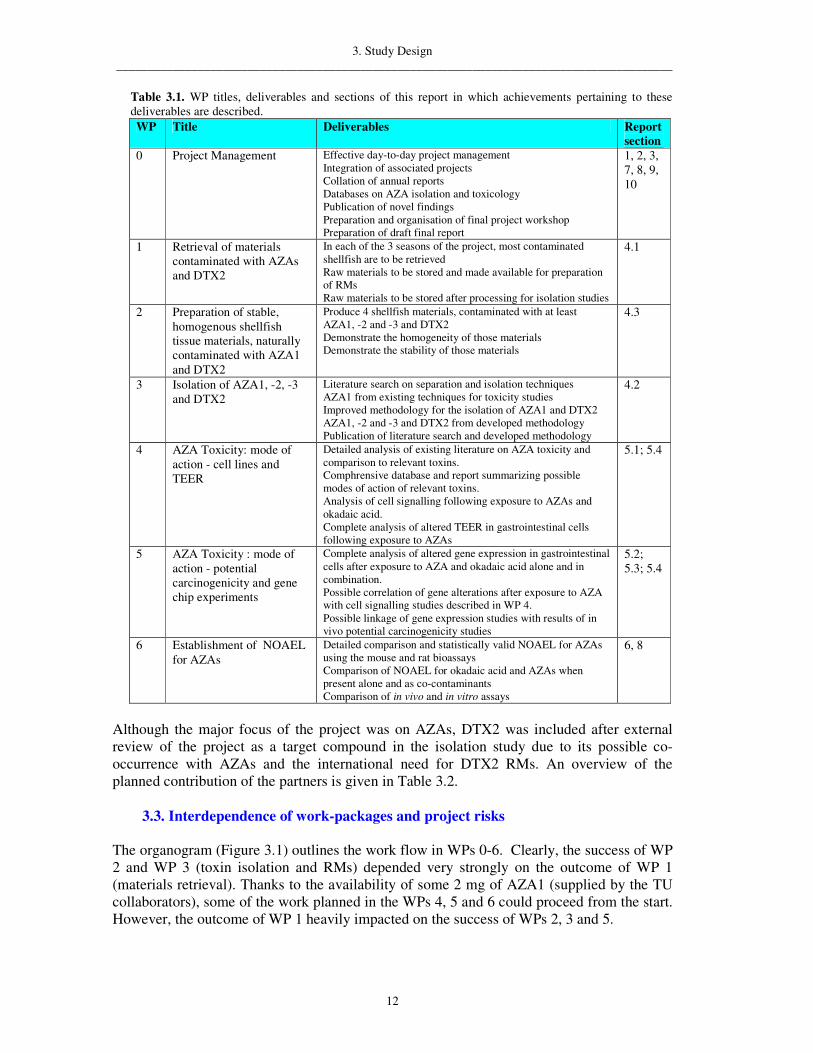
3.1. Aims of the study The ASTOX project was designed to overcome some of the difficulties related to the occurrence of AZAs in Irish shellfish. The difficulties come from two separate standpoints: firstly the nature and extent of the toxicity and secondly the monitoring and management of shellfish production areas. The first question relates to the toxicity relevant to humans: are these compounds toxic to mice only or will they make people sick following consumption of contaminated shellfish? Since there were several reports of people falling ill after consuming AZA contaminated shellfish prior to the start of this project, there was no doubt about whether AZAs make people sick after ingesting toxic shellfish. Hence, the follow-up question in toxicology concerns the level of compound causing toxic effects and the nature of the effects caused; in other words, what concentration can be allowed in shellfish without observing an effect, and what would be the effects in humans after consumption of contaminated shellfish. This project aimed at investigating both the nature of the toxicity caused by AZAs and what a safe level in shellfish could be. The nature of the toxicity was to be investigated through studies using live animals, cell cultures and molecular biology tools, while the safe levels were to be determined through the estimation of a NOAEL for AZAs. The second question concerns the management of shellfish production and public health. This difficulty arises once a safe limit has been established and needs to be implemented but has also already been addressed at the time an ill effect from a compound is known, i.e. prior to the establishment of a safe level. Establishing widely accepted monitoring protocols necessitates the validation of methods of detection for AZAs and the establishment of QC tools for the long-term use of such validated methods. Since most legislation is driven by international agreements, such as EU legislation, and since shellfish trade in Ireland is largely an export-driven economy, it is necessary to establish these methods and tools for world-wide or at least EU-wide use. A first step preceding any method development and validation is the availability of pure compound to establish methods of detection and quantitation. Thus a major goal of this project was to establish a significant source of AZA standard that could serve the development and validation of such methods. This pure compound was also needed for the studies mentioned in the previous paragraph on toxicology. A further goal of the project was to develop techniques for the production of stable and homogenous shellfish tissue RMs that could be used in inter-laboratory comparison studies and/or between different methods as well as in routine QC once methods were established and validated. Once these techniques were established, the project was also to produce several such materials for use in ongoing work on method validation. 3.2. Modular design and timeframe The project was organised into seven individual work packages (WPs) with WPs 1-3 focusing on collection of contaminated material, production of RMs and isolation of AZAs and DTX2, while WPs 4-6 focused on establishing the nature of the toxicity and the NOAEL (Table 3.1). WP 0 concerned the overall project management and was led by the MI. WPs 1-3 were equally led by the MI but had a strong input by the associated partners in Japan. WPs 4-6 were led by the Conway Institute of UCD, with a strong input by scientists from NOAA.
3. Study Design _________________________________________________________________________________________
12
Table 3.1. WP titles, deliverables and sections of this report in which achievements pertaining to these deliverables are described. WP Title Deliverables Report
section 0 Project Management Effective day-to-day project management
Integration of associated projects Collation of annual reports Databases on AZA isolation and toxicology Publication of novel findings Preparation and organisation of final project workshop Preparation of draft final report
1, 2, 3, 7, 8, 9, 10
1 Retrieval of materials contaminated with AZAs and DTX2
In each of the 3 seasons of the project, most contaminated shellfish are to be retrieved Raw materials to be stored and made available for preparation of RMs Raw materials to be stored after processing for isolation studies
4.1
2 Preparation of stable, homogenous shellfish tissue materials, naturally contaminated with AZA1 and DTX2
Produce 4 shellfish materials, contaminated with at least AZA1, -2 and -3 and DTX2 Demonstrate the homogeneity of those materials Demonstrate the stability of those materials
4.3
3 Isolation of AZA1, -2, -3 and DTX2
Literature search on separation and isolation techniques AZA1 from existing techniques for toxicity studies Improved methodology for the isolation of AZA1 and DTX2 AZA1, -2 and -3 and DTX2 from developed methodology Publication of literature search and developed methodology
4.2
4 AZA Toxicity: mode of action - cell lines and TEER
Detailed analysis of existing literature on AZA toxicity and comparison to relevant toxins. Comphrensive database and report summarizing possible modes of action of relevant toxins. Analysis of cell signalling following exposure to AZAs and okadaic acid. Complete analysis of altered TEER in gastrointestinal cells following exposure to AZAs
5.1; 5.4
5 AZA Toxicity : mode of action - potential carcinogenicity and gene chip experiments
Complete analysis of altered gene expression in gastrointestinal cells after exposure to AZA and okadaic acid alone and in combination. Possible correlation of gene alterations after exposure to AZA with cell signalling studies described in WP 4. Possible linkage of gene expression studies with results of in vivo potential carcinogenicity studies
5.2; 5.3; 5.4
6 Establishment of NOAEL for AZAs
Detailed comparison and statistically valid NOAEL for AZAs using the mouse and rat bioassays Comparison of NOAEL for okadaic acid and AZAs when present alone and as co-contaminants Comparison of in vivo and in vitro assays
6, 8
Although the major focus of the project was on AZAs, DTX2 was included after external review of the project as a target compound in the isolation study due to its possible co-occurrence with AZAs and the international need for DTX2 RMs. An overview of the planned contribution of the partners is given in Table 3.2.
3.3. Interdependence of work-packages and project risks The organogram (Figure 3.1) outlines the work flow in WPs 0-6. Clearly, the success of WP 2 and WP 3 (toxin isolation and RMs) depended very strongly on the outcome of WP 1 (materials retrieval). Thanks to the availability of some 2 mg of AZA1 (supplied by the TU collaborators), some of the work planned in the WPs 4, 5 and 6 could proceed from the start. However, the outcome of WP 1 heavily impacted on the success of WPs 2, 3 and 5.

3. Study Design _________________________________________________________________________________________
13
Table 3.2. Partnership Activity Chart Project partner Normal Activity Activity within this project Work
Packages involved
Partner 1. (Project Leader):MI
National Reference Laboratory for marine biotoxins, co-ordinator of national monitoring programme for marine biotoxins, biological and chemical testing of marine biotoxins in irish shellfish, phytoplankton surveillance of Irish waters
Overall co-ordination, retrieval of contaminated materials, preparation of tissue RMs, isolation and purification of toxins.
0, 1, 2, 3
Partner 2. University College Dublin (Conway Institute)
Research Institute, Co-ordinator for the Centre of Integrative Biology, ECVAM projects, Conway Institute of Biomolecular and Biomedical Research, Dublin Molecular Medical Centre
Literature study, mode-of-action studies for AZA toxicology, determination of NOAEL and safe level of AZA in shellfish
0, 4, 5, 6
Partner 3. Marine Biotoxin Program NOAA
Public Research Institute Mode-of-action toxicity studies
4
Partner 4. Chiba University
Third level - Research Institute Long term exposure studies for potential carcinogenicity of AZA
5
Partner 5. Japan Food Research Laboratory
Public Agency Routine monitoring of marine biotoxins in Japanese shellfish, methodological research on the determination of marine biotoxins, + as below.
Advice on isolation, purification and toxicity studies
3, 5, 6
Partner 6. Tohoku University
Third level - Research Institute Research in the isolation, purification, structural chemistry and structure activity relationships of marine biotoxins
Advice on isolation and purification studies and NMR analysis of purified toxins
3
The occurrence of AZAs was, and remains, unpredictable. The only material available to the project at the beginning of the study was ca. 200 kg of mussels, naturally contaminated with AZAs, collected from Castletownbere, in Bantry Bay in August 2001. The concentrations in this material (AZA1 ca. 1-1.5 mg/kg whole flesh) were adequate for the preparation of RMs (WP 2) but relatively low for the isolation of pure reference toxin (WP 3). Since the availability of sufficient toxin was a major hindrance factor for OECD-type studies on animals (WP 5) to prove or disprove carcinogenicity of AZAs, the success of WP1 would heavily impact on the success of WP 5. WP 4, 5 and 6, however, would not impact on the feasibility of the other three WPs.

3. S
tudy
Des
ign
____
____
____
____
____
____
____
____
____
____
____
____
____
____
____
____
____
____
____
____
____
____
_
14
Figu
re 3
.1.
W
P 0:
Initi
al M
eetin
g, P
roje
ct M
anag
emen
t and
est
ablis
hmen
t of d
etai
led
rese
arch
pla
n
WP
1 (P
1):
R
etri
eval
of c
onta
min
ated
m
atric
es
WP
3 (P
1, 5
, 6):
Isol
atio
n +
puri
ficat
ion
of A
ZA
1 , -
2 an
d -3
+
DT
X2
WP
2 (P
1):
Prep
arat
ion
of ti
ssue
RM
s
WP
4 (P
2, 3
): Li
tera
ture
+ in
itial
to
xici
ty s
tudi
es
WP
5 (P
2, 4
, 5):
Mod
e of
act
ion
of
AZ
A1,
2 a
nd 3
(c
arci
noge
nici
ty)
WP
6 (P
1, 2
, 5):
NO
AE
L fo
r AZ
A1,
2
and
3
Fina
l rep
ort o
n Pr
ojec
t and
Wor
ksho
p in
clud
ing
reco
mm
enda
tions
on
safe
leve
l of A
ZAs
in s
hellf
ish.
Ope
n W
orks
hop
on A
ZAs:
Pre
sent
atio
n of
stu
dy a
nd d
iscu
ssio
n of
leve
ls w
ith re
gula
tors
, ind
ustr
y an
d ot
her r
esea
rche
rs. P
ublic
atio
ns in
sc
ient
ific
jour
nals
.
Dis
trib
utio
n an
d st
orag
e of
sta
ndar
ds
and
cont
amin
ated
tiss
ue R
Ms
prod
uced
dur
ing
proj
ect.
Dat
a sy
nthe
sis
incl
udin
g re
port
s on
the
isol
atio
n +
puri
fica
tion
of A
ZAs
and
DTX
2 an
d th
e to
xico
logy
of A
ZAs.
Del
iver
able
s:
• Sh
ellfi
sh
cont
amin
ated
with
A
ZA
1, -2
+ -3
•
Shel
lfish
co
ntam
inat
ed w
ith
DT
X2
Del
iver
able
s:
• R
M h
ighl
y co
ntam
inat
ed w
ith
AZ
A1,
-2 a
nd -3
•
RM
hig
hly
cont
amin
ated
with
D
TX
2 •
RM
with
low
co
ntam
inat
ion
of
AZ
A1,
-2 a
nd -3
•
RM
with
low
co
ntam
inat
ion
of
DT
X2
Del
iver
able
s:
• Lite
ratu
re re
sear
ch
• Iso
late
AZA
1, -2
and
-3
usin
g ex
istin
g te
chni
que
• Im
prov
e te
chni
ques
for
A
ZA
isol
atio
n • I
nves
tigat
e te
chni
ques
for
isol
atio
n of
DT
X2
• Iso
late
AZA
1, -2
and
-3 +
D
TX
2 w
ith b
est
avai
labl
e te
chni
ques
• P
ublic
atio
n in
pee
r-re
view
ed jo
urna
ls
Del
iver
able
s:
• A
naly
sis
of a
ltere
d TE
ER
(AZ
A1,
-2 +
-3
and
DT
X2
sepa
rate
+
com
bine
d)
• A
naly
sis
of
intr
acel
lula
r sig
nalli
ng
• N
ovel
in v
itro
assa
y
Del
iver
able
s:
• A
naly
sis
of a
ltere
d ge
ne e
xpre
ssio
n (A
ZA
1, -2
+ -3
and
D
TX
2 se
para
te +
co
mbi
ned)
•
Poss
ible
cor
rela
tion
of
gene
alte
ratio
ns w
ith
intr
acel
lula
r sig
nalli
ng
• E
vide
nce
as to
whe
ther
A
ZA
has
pot
entia
l ca
rcin
ogen
icity
Del
iver
able
s:
• St
atis
tical
ly v
alid
N
OA
EL
for A
ZA
usin
g bi
oass
ays
• C
ompa
rison
of
NO
AE
L fo
r AZA
and
O
A s
epar
ate
and
com
bine
d •
Com
paris
on b
etw
een
in v
ivo
and
vitr
o as
says

4. Toxins & Reference Materials – Tools for Analysis & Toxicology _________________________________________________________________________________________
15
4. Toxins & Reference Materials – Tools for Analysis & Toxicology 4.1. Retrieval of contaminated materials 4.1.1. Retrieval and storage of materials prior to ASTOX project ca. 100 kg of stock mussels from Castletownbere, containing high levels of DTX2 and AZAs, were obtained following a toxic episode in 2001; these shellfish were already stored at MI. Additional lots (ca. 100 kg) of contaminated shellfish, also containing high levels of DTX2 and AZAs were retrieved from Bantry Bay originating from previous toxic episodes. See Table 4.1. 4.1.2. Retrieval of materials during ASTOX Two 100 kg lots of mussels (out of shell) were obtained from Castletownbere and Ardgroom in August 2004. Both were contaminated with DTX2 and esters of DTX2 at significant levels. In addition, material was obtained from Whiddy point (containing OA and DTX2), Norway (containing AZA and OA/DTX toxins) and Japan (containing OA/DTX toxins). The summer of 2005 saw a major toxic episode of AZAs in the South and Northwest of Ireland. ca. 1 ton of material from Bruckless (Donegal), contaminated with AZAs, was acquired by the MI. See Table 4.2.

4. T
oxin
s &
Ref
eren
ce M
ater
ials
– T
ools
for A
naly
sis
& T
oxic
olog
y __
____
____
____
____
____
____
____
____
____
____
____
____
____
____
____
____
____
____
____
____
____
___
16
Tab
le 4
.1. I
nven
tory
of c
onta
min
ated
mat
eria
ls re
trie
ved
prio
r to
AST
OX
D
ate
of
Sam
plin
g L
ocat
ion
Spec
ies
Tis
sue
Qua
ntity
O
A
[mg/
kg]
OA
es
ter
(mg/
kg)
DT
X2
(mg/
kg)
DT
X2
este
r (m
g/kg
)
DT
X1
(mg/
kg)
DT
X1
este
rs
(mg/
kg)
OA
eq
uiv
(mg/
kg)
OA
eq
uiv.
+
este
rs
(mg/
kg)
AZ
A3
(mg/
kg)
AZ
A1
(mg/
kg)
AZ
A2
(mg/
kg)
AZ
A
equi
v (m
g/kg
)
2001
C
astle
tow
nber
e M
ytilu
s ed
ulis
W
hole
10
0 kg
0.
25
- 1.
32
- -
- 1.
58
- -
- -
0.62
2001
B
antr
y B
ay
Myt
ilus
edul
is
Who
le
100
kg
0.07
-
0.25
-
- -
0.32
-
- -
- 0.
6
Tab
le 4
.2. I
nven
tory
of c
onta
min
ated
mat
eria
ls re
trie
ved
duri
ng A
STO
X.
Dat
e of
Sa
mpl
ing
Loc
atio
n Sp
ecie
s T
issu
e Q
uant
ity
OA
(m
g/kg
) O
A
este
r (m
g/kg
)
DT
X2
(mg/
kg)
DT
X2
este
r (m
g/kg
)
DT
X1
(mg/
kg)
DT
X1
este
rs
(mg/
kg)
OA
eq
uiv
(mg/
kg)
OA
eq
uiv.
+
este
rs
(mg/
kg)
AZ
A3
(mg/
kg)
AZ
A1
(mg/
kg)
AZ
A2
(mg/
kg)
AZ
A
equi
v (m
g/kg
)
Aug
-04
Ard
groo
m
Myt
ilus
edul
is
Who
le
100
kg
0.55
0.
22
1.53
0.
00
0.00
-
2.08
2.
30
Aug
-04
Cas
tleto
wnb
ere
Myt
ilus
edul
is
Who
le
100
kg
0.45
0.
96
1.34
1.
08
0.00
-
1.78
3.
83
Nov
-04
Whi
ddy
Poin
t M
ytilu
s ed
ulis
W
hole
80
kg
0.32
0.
51
1.20
0.
60
0.00
-
1.51
2.
63
- -
- -
Dec
-04
Nor
way
(T
verr
fjel
let
in
Ryf
ylke
)
Myt
ilus
edul
is
Who
le
10 k
g -
- -
- -
- -
- 0.
04
0.11
0.
05
0.26
Nov
-04
1161
/04
NW
M
ytilu
s ed
ulis
W
hole
45
0 g
0.09
0.
08
0.00
0.
00
1.21
0.
73
1.30
2.
11
0.01
0.
02
0.01
0.
06
Nov
-04
1223
/04
NW
M
ytilu
s ed
ulis
W
hole
45
0 g
0.06
0.
04
0.00
0.
00
0.66
0.
40
0.72
1.
16
0.01
0.
01
0.01
0.
04
Dec
-04
Japa
n A
equi
pec
ten
oper
cula
ris
HP
475
g 0.
00
0.10
-
- 0.
17
1.21
0.
19
1.30
-
- -
-
Aug
200
5 B
ruck
less
M
. edu
lis
Who
le
100
kg
- -
- -
- -
- -
0.28
5.
36
1.21
7.
97

4. Toxins & Reference Materials – Tools for Analysis & Toxicology _________________________________________________________________________________________
17
4.1.3. Bulk processing of shellfish Bulk samples of shellfish (100-500 kg) were processed by the shellfish processing companies (Bantry Bay Seafoods, Shellfish de la Mer), in one of four ways before arrival into the MI; i) Cooked, shucked and frozen individually
ii) Cooked, unshucked and frozen individually iii) Cooked, unshucked and frozen in a vacuum pack
iv) Uncooked, unshucked and frozen in a vacuum pack The first method of processing is costly but is the preferred method as it can save a considerable amount of time in the preparation of the shellfish (easy handling and dissection of HP) in house, for use in toxin isolation or preparation of RMs. The second method is a little less costly than the first and the mussels are easily shucked, while the remaining two methods are cheaper but require more processing time spent in house. During the project, steps were developed for dealing with the handling and processing of shellfish in the MI (usually 30 kg of uncooked mussels in the shell is required to obtain 1 kg of HP for one isolation batch). Contaminated raw mussels that were used in the isolation procedure were firstly microwaved to aid shucking, the byssus threads removed and then the HP dissected leaving the remainder tissue, which was used in the preparation of RMs. Once shucked it was necessary to remove the byssus threads to prevent the homogenising equipment (Waring™ blender, Polytron™ or mixer) used in the preparation of RMs, becoming clogged. Both the HP and remaining tissues were labelled and stored seperately in plastic containers in a calibrated freezer. Throughout ASTOX a substantial amount of remainder tissue was accrued. A large-scale batch mixer suitable for homogenising a minimum of 10 kg of shellfish tissue was purchased in February 2005 and was used in the processing of materials retrieved as part of WP 1, as well as for materials obtained prior to this. Whole mussel tissue was also used in the preparation of RMs. Mussels received in the shell for this purpose were steamed to aid the shucking process, however, steaming left the tissue quite dry and the subsequent homogenisation difficult. To deal with this, water was added, which facilitated the procedure. The homogenised tissue was then divided into lots, autoclaved (heat stabilised), recombined, re-homogenised and subdivided into 1 kg portions, labelled and stored in plastic containers in the freezer. See section 4.3 for more detailed information. All batches that were received into the MI, which were processed in house, were subsampled and analysed to determine the toxin profile.
4.1.4. Storage conditions and options Due to space limitations, it was not feasible for the MI to store all of the acquired shellfish stocks in house, hence, much of the material was sent to cold storage facilities. In March 2005 the MI moved to its new facility with walk-in freezer spaces and such spaces are now used for storage of bulk materials in addition to the cold storage facilities. To enable easy location of all the tissues stored, an inventory was created which identified the location and sampling date of the shellfish, type of tissue, quantity, location and toxin concentrations. In some cases, certain batches were given a code generated from the MI Harmful Algal Blooms (HABs) database in which all the tissue information is stored. Any processing that was performed on the shellfish tissues was recorded in a referenced laboratory notebook. Following ASTOX, all of the materials obtained during the project will be retained in the current storage facilities for use in other projects.

4. Toxins & Reference Materials – Tools for Analysis & Toxicology _________________________________________________________________________________________
18
4.2. Isolation of AZA1, -2, -3 and DTX2 4.2.1. Introduction After an unexplained food poisoning where at least nine people became ill after consuming mussels grown in Killary Harbour, Co. Galway, Ireland, investigations indicated that a new biotoxin might be responsible for the illness (McMahon and Silke, 1996). Identifying a novel and unknown biotoxin poses some difficulties. To identify the compound responsible for human poisonings and to elucidate its structure a multistep purification process is necessary. Satake (Satake et al., 1998a) purified AZA1 using bioassay guided fractionation to monitor the toxic fractions of the isolation procedure. This method is used frequently when trying to isolate toxic unknowns and has proven to be very efficient e.g. in the identification of DA as the main toxin in a series of food poisonings in 1987 in Atlantic Canada (Quilliam and Wright, 1989). After the structural elucidation in 1998 some toxicological studies were carried out with the isolated material and a LC-MS method was developed (Ito et al., 2000, 2002). The obtained material was quickly used up for toxicological assessment and for method development by LC-MS and other analytical techniques. WP 3 of the ASTOX project was aimed at the isolation of pure toxin for preparation of instrument calibration standards, method development and further toxicological studies. The targeted compounds were AZA1 and its two major analogues AZA2 and AZA3 as well as DTX2, the predominant OA group toxin in Irish waters. 4.2.2. Early developmental work 4.2.2.1. Isolation of AZA1 To identify the toxin, Satake used 20 kg of blue mussels harvested during the incident in Killary Harbour in February 1996. The material was extracted with acetone, partitioned with hexane and 80/20 v/v MeOH/water. Following this a series of chromatographic steps were performed, including silica gel normal phase chromatography with a step gradient of acetone and MeOH. This was followed by size exclusion chromatography (SEC) on HW-40 material from Tosoh and ion exchange chromatography using CM650 M and DEAE materials. A final purification was achieved on the HW-40 material. This work yielded 2 mg of a compound then named Killary-toxin 3 (Satake et al., 1998a). The structural elucidation showed a structure possessing a tertiary amino group, unique spiro ring assemblies and a carboxyl group. This lead to the name AZA-SPIR-ACID. In 2003, Nicolaou’s group succeeded in the synthesis of the molecule described by Satake in 1998. However, the synthesised molecule exhibited different properties to the natural product isolated by Satake's group (Nicolaou et al., 2003). Minor mistakes in the first reported structure were corrected which lead to the total synthesis of AZA1 and the correction of the structure one year later (Nicolaou et al., 2004a, b). 4.2.2.2. Isolation of AZA2, -3, -4 and -5 Shortly after the discovery of AZA1, two more analogues, 8-methyl-AZA (AZA2) and 22-demethyl-AZA (AZA3), were isolated from mussel material (Ofuji et al., 1999b). Using the isolation scheme reported by Satake, Ofuji succeeded in isolating AZA1, AZA2 and AZA3. To improve the purification of the compounds Ofuji introduced a clean up step using a low pressure ODS material (Develosil) before the ion exchange chromatography and replacing the final clean up by SEC with a C18-Polymer column (ODP-50, Asahipak) to separate the three analogues sufficiently.

4. Toxins & Reference Materials – Tools for Analysis & Toxicology _________________________________________________________________________________________
19
During the isolation, Ofuji worked from whole flesh as well as HP from blue mussels. Working with just the HP alone, a higher concentration of toxin per kg of tissue was obtained, thereby increasing the compound to matrix ratio. Ofuji also isolated small amounts of hydroxylated AZA3 (AZA4 and AZA5, Ofuji et al., 2000). Currently eleven different AZA analogues have been identified (Ofuji et al., 1999b, 2001, James et al., 2003a) with one other (AZA12), being postulated (James et al., 2003a). All AZAs show two hydroxylated versions, where there is an additional hydroxyl group either at C-4 or C-23, leading to AZA4 to AZA12. The identification of those hydroxy-AZAs has been carried out by mass spectroscopy and structures of AZA7 to AZA12 were proposed based on structures reported for AZA4 and AZA5 by Ofuji. 4.2.3. Implementation of previously developed protocol In 2001 Dr. Hess visited Prof. Satake’s laboratory in Tohoku University, to gain knowledge of the isolation procedures employed for AZAs so the techniques could be implemented at the MI in Galway. The following is the isolation scheme described by Dr. Hess in his report (MI, unpublished information).
4.2.3.1. Isolation Extraction ca. 1 kg of previously isolated and blended HP are extracted with 3 L of acetone once and twice with 3 L of MeOH. The extracts are filtered over a large Buchner funnel and combined for rotary evaporation. Liquid/liquid partitioning The dry extract is dissolved with 100 mL of ethyl acetate followed by 100 mL of water. This is repeated five times. All solvent is combined in a large separation funnel and a further 500 mL of each solvent is added. The funnel is shaken and then let stand to settle for 10-15 min. The aqueous phase is re-extracted with 1 L of ethyl acetate. The two organic phases are combined and dried by rotary evaporation. Following the extraction with ethyl acetate, the sample is then partitioned in the same manner as before using n-hexane and 80/20 v/v MeOH/water. The hexane phase was re-extracted an additional time with 1 L of 80/20 v/v MeOH/water. The two phases are combined and the sample dried by rotary evaporation. Silica chromatography (gravity) The dry sample is suspended in acetone and loaded on silica gel (SiO2 60, Merck). The column is eluted with three times the bed volume of acetone followed by three times the bed volume of MeOH. Elution may be forced by gentle positive pressure. SEC on HW-40 The two fractions collected from the silica chromatography are analysed by LC-MS and the fraction containing the target compound (MeOH fraction) is evaporated to dryness and taken up in 700/300/1 v/v/v propanol/water/acetic acid and loaded onto a column packed with Toyopearl HW-40. The column is then eluted at 1 mL/min with 700/300/1 v/v/v propanol/water/acetic acid and 5 mL fractions are collected continuously. All fractions are analysed by LC-MS and the fractions containing the majority of AZAs are combined and evaporated to dryness.

4. Toxins & Reference Materials – Tools for Analysis & Toxicology _________________________________________________________________________________________
20
Low-pressure reverse phase on Develosil C18 The dried fractions containing the toxin are dissolved in 80/20 v/v MeOH/water containing 0.1% acetic acid and loaded onto a glass column (1 cm i.d. x 20 cm) and eluted at 1 mL/min with 80/20 MeOH/water at 1 mL/min. Fractions (5 mL) are continuously collected and tested by LC-MS for presence of AZA. Fractions containing the target compounds are combined and the solvent evaporated. DEAE ion exchange The dried sample is taken up in 80/20 v/v MeOH/ water and loaded onto the IEX material. After application of the sample, the column is eluted using a step gradient with 80% MeOH/water at 0.5 mL/min and 85% MeOH/water with 0.1% acetic acid at 1 mL/min. The toxins should be contained in the acidic fraction. CM-650 ion exchange The dried sample is applied to an ion exchange material (CM-650, Tosoh) dissolved in 80% MeOH 20% water. Elution of the column is carried out in the same manner as the DEAE ion exchanger. C18-HPLC on ODP-50 (Asahipak) The final purification of the toxins is carried out on a polymeric C18 column using UV detection to collect fractions manually with a fraction collector. The toxins are separated using a gradient elution. The gradient starts at 50% MeOH and 50% water both containing 0.1% acetic acid. The concentration is held for 5 min and then rises linear to 100% MeOH over 50 min at 0.5 mL/min. The isolated toxins are analysed by LC-MS and NMR. Purification of toxin on HW-40 If purity does not seem sufficient a further chromatography step using Toyopearl HW-40 can be carried out. MeOH containing 1% acetic acid is used as mobile phase. The elution of the toxin is monitored by UV and the compound is collected manually. 4.2.3.2. Clarification During the implementation of the TU isolation scheme in the MI several difficulties were encountered. The extraction procedure used a lot of solvent (>9 L), that in return all had to be evaporated. Analysis of the extraction efficiency using just MeOH showed that over 95% of the AZAs could be recovered. Acetone extracts more lipids and phospholipids causing problems in the subsequent clean up steps. Therefore, it was decided to omit the acetone extraction from the isolation procedure. During the liquid/liquid partitioning with ethyl acetate a firm emulsion can form which is very difficult to dissolve. Carrying out the partitioning with hexane beforehand extracts most lipids that are responsible for this emulsion. This switching of the partitionings also helps the chromatography on silica. The extract should not contain any water when loaded onto the silica and carrying out the ethyl acetate partitioning directly beforehand reduces this risk. Chromatography on Develosil can be difficult when the sample is still very crude and oily. It was decided to use a second SEC material (Sephadex LH-20) before the reverse phase chromatography to reduce the sample weight to a minimum for application to the Develosil material. While the anion exchange material (DEAE) proved to be a highly reliable and reproducible material the cation exchange material CM-650 did not retain the toxins as anticipated. Changing the temperature from 20 to 35 oC led in one case to a good performance of the

4. Toxins & Reference Materials – Tools for Analysis & Toxicology _________________________________________________________________________________________
21
material. However, this could not be regularly reproduced. It is possible that an overloading effect of the material takes place and that other cationic compounds reduce the activity of the material. This step was ommitted from the subsequent isolation scheme, as it did not perform in a reproducible manner. The flow rates used for the final purification step on the polymeric C18 material (6 mm i.d. 15 cm) were optimised for this specific application. Using 1 mL/min instead of 0.5 mL/min improved separation slightly. Using 1.5 mL/min did not achieve a good separation indicating 1 mL/min to be the optimum. Different matrices i.e. mussels from different locations show a significantly different behaviour throughout the isolation procedure. This is most likely dependant on fat content and amount of phospholipids present within the matrix. Salt concentration and other factors contribute as well to variations in behaviour throughout the different clean up steps. These circumstances make it very difficult to generalise an isolation scheme for the purification of AZAs from contaminated mussel material and slight adaptations of the procedures are often necessary.
4.2.4. Improved isolation procedure at MI Several adaptations have been made to the original TU isolation scheme to improve the overall yield and purity of the target compounds. To conserve solvents and reduce the extracted lipophilic matrix to a minimum only MeOH was used for the extraction of AZA from the HP tissue. Analysis of the extracted amount has shown that a double extraction procedure with two times 3 L of MeOH recovered over 95% of toxin from the material. The extract did not appear as dark in colour and the dry sample residue after evaporation was less oily. The total extraction and evaporation time has decreased due to the incorporated change to the procedure. The separation during the ethyl acetate/water partitioning was improved by switching the two partitioning steps, thereby, eliminating highly lipophilic contaminants before the hydrophilic compounds. In addition, the formation of an emulsion was greatly reduced and the dry extract was more soluble in acetone making it easier to load onto the silica column. Using a wider diameter column and a larger bed volume of silica gel increased the performance and flow rate of the column, thereby reducing the level of interaction of the sample with the stationary phase, which improved the recovery for this step slightly (ca. 10%). Introducing a second SEC step before the HW-40 using Sephadex LH-20 improved the clean up of the sample before the RP low pressure chromatography. Sephadex LH-20 is a dextran based gel that adds other physico-chemical properties to size exclusion. The separation is slightly different than the pure size exclusion of the HW-40 gel. This reduced the sample size and improved flow and performance of the Develosil column following the size exclusion steps. Obtaining satisfactory and reproducible results from the cation exchanger CM650 step proved difficult. As this step was near the end of the purification process and the sample had been reduced to a very small size at this stage (ca. 20-40 mg) it was decided to exclude the cation exchanger from the process. Separation and purification on the ODP-50 column from Asahipak proved to be laborious but exchanging this column with other reversed phase stationary phases such as Zorbax Eclipse from Agilent resulted in a large loss of toxin. Multiple injections on an ODP-50 proved to be a good way to separate the various AZA analogues.

4. Toxins & Reference Materials – Tools for Analysis & Toxicology _________________________________________________________________________________________
22
A final clean up using a HW-40 column with MeOH as mobile phase increased the purity of the material and enabled the attainment of pure AZA. However, the overall recovery was still low (ca. 10% in batch AIL-05-04). The improved isolation scheme at MI is shown in Figure 4.1.
4.2.5. NRC-IMB isolation procedure In January 2006, the MI participated in a collaboration with the NRC-IMB, enabling an ASTOX research student to use the laboratories of the NRC-IMB and become familiar with the isolation technique previously developed by the Canadians. The procedure was similar to the isolation technique used in the MI but differed in some key aspects. The contaminated material used for this isolation was gathered in Bruckless in 2005. Due to the high concentration of the matrix only 500 g of HP was used for each isolation batch. To reduce solvent waste and shorten the evaporation procedure a triple extraction using 300 mL of ethanol each time was used to extract the toxins from the HP matrix. The ethanol also helped to evaporate any water that was extracted in the process. The volume of solvent was also reduced for the partitioning steps. The ethyl acetate partitioning was carried out using only 300 mL of organic solvent and 100 mL of 1 N sodium chloride solution. The salt content in the aqueous phase increased its density and improved separation significantly. No emulsion was formed and analysis of a third extraction of the aqueous phase showed that more than 95% of the toxin was extracted in the process. The hexane partitioning was carried out with 200 mL of organic solvent and 200 mL of 90% MeOH. This reduced the amount of water that had to be evaporated thereby speeding up the procedure. As for the ethyl acetate partitioning a double extraction was sufficient to extract all of the toxin. Instead of using gravimetric flow or positive pressure for the silica column a vacuum assisted column was used. The stationary phase selected was finer than the previously used material and the bed height was reduced to 6.5 cm. A multiple step gradient using hexane, ethyl acetate and different mixtures of ethyl acetate and MeOH as well as pure MeOH was used to elute the column. The sample was loaded with a pre-absorption technique, which eliminated the dissolvation problems encountered previously at the MI. The clean up effect of this step was also improved and only a small sample mass containing all toxin was recovered. AZAs eluted with a 70% ethyl acetate: 30% MeOH mixture. Sephadex LH-20 was used for GPC, and the column length was increased from ca. 40 cm to just over 80 cm. This column was then eluted using MeOH and gravity flow. Instead of using a C18 material for low pressure chromatography a C8 flash column (LiChroPrep RP8, Merck) was used as a last clean up step before the final purification. The flash column was eluted with combinations of acetonitrile and water increasing the organic percentage in 10% steps from 50%-70% and washing the column with 100% acetonitrile. The sample mass following this step was ca. 12 mg (half of what it was in previous batches). Final purification was achieved on a Phenomenex Luna C8 column with 50% acetonitrile 50% water as mobile phase. The mobile phase contained a small amount of buffer to improve the peak shape and separation from other AZA analogues. The system used for the final purification was an Agilent LC-MSD system that used active splitting to monitor compounds eluting. Fraction collection was triggered by the mass spectrometer so that a more precise fraction collection was possible. The buffer was eliminated from the collected

4. Toxins & Reference Materials – Tools for Analysis & Toxicology _________________________________________________________________________________________
23
material by extraction with ethyl acetate. Application of this procedure and the use of highly contaminated mussel tissue (Bruckless 2005), enabled the isolation of 2.1 mg (14% overall recovery) of highly pure AZA1 in one isolation batch, compared to 10% overall recovery achieved with the modified TU scheme on the same material. The NRC-IMB isolation scheme is shown in Figure 4.2.

4. Toxins & Reference Materials – Tools for Analysis & Toxicology _________________________________________________________________________________________
24
Figure 4.1. Schematic isolation procedure used in MI (improved TU scheme).
Extraction MeOH (6L)
80% MeOH
Normal phase chromatography on silica gel (gravity)
Hexane
Ethyl acetate Water
Gel permeation chromatography on LH-20 and HW-40 (LPLC)
Final purification on C-18 polymer (HPLC)
Ion exchange chromatography (DEAE)
Reverse phase chromatography on C-18 silica (LPLC)
Partitioning 1
Partitioning 2
Step gradient of acetone and MeOH, or mixtures of ethyl acetate and MeOH
Consecutive fraction collection and testing by LC-MS
Step gradient using neutral and acidic MeOHic mobile phase
Fraction collection by UV (manually)

4. Toxins & Reference Materials – Tools for Analysis & Toxicology _________________________________________________________________________________________
25
Figure 4.2. Schematic of NRC-IMB isolation scheme.
Extraction ethanol
(900mL)
Ethyl acetate
Normal phase chromatography on silica gel (vlc)
1N NaCl
Hexane 80% aq. MeOH
Gel permeation chromatography on LH-20 (gravity)
Final purification on C-8 silica (HPLC)
Reverse phase chromatography on C-8 silica (flash)
Partitioning 2
Step gradient of hexane, EtOAc, 90% EtOAc/MeOH, 70% EtOAc/MeOH, 50% EtOAc/MeOH and MeOH
Consecutive fraction collection and testing by LC-MS
MS directed fraction collection
Partitioning 1

4. Toxins & Reference Materials – Tools for Analysis & Toxicology _________________________________________________________________________________________
26
4.2.6. Comparison of MI/TU and NRC-IMB schemes A total of 14 isolation batches were performed throughout the course of the project. The isolation batches performed at the NRC-IMB have proven to yield the most amount of pure AZA1 (3.4 mg in total). Only the last four isolation batches were performed using material from Bruckless 2005. This material is three times higher in toxin concentration (ca. 15 mg/batch) than the material used for the previous ten batches (Castletownbere 2001, ca. 5 mg/batch), and the overall mass of matrix is only half as much (500 g vs. 1 kg) as in the previous 11 batches. The method used at the NRC-IMB does not involve any C18 silica material. Both of the steps using C18 chromatography have been replaced with C8 silica. The critical clean up step using normal phase silica gel has been shortened using vlc instead of a light positive pressure. This not only decreases the time of contact of the toxin with the stationary phase but also requires less packing, reducing the number of active silanol sites present, thereby reducing the loss of toxin. Although the NRC-IMB scheme does not involve an ion exchange chromatography step, separation on C8 silica by HPLC is sufficient to separate the different toxin analogues and any other impurities. The downside of this step is the use of ammonium formate and formic acid as a buffer. These acidic conditions should be eliminated as soon as fractions are collected to inhibit rearrangement of the target molecule. Chromatography on C18-polymer material did not achieve a good separation and re-chromatographing was needed in most cases. This resulted in a large loss of target compound. The AZA1 obtained from batches AIL-03-01, -03-02, -03-03, -03-04, -04-01, -04-03 was combined (ca. 2.1 mg) and re-chromatographed on ODP-50 using double distilled MeOH to remove small amounts of AZA3 and AZA2 that had not been sufficiently separated beforehand. A yield of 1 mg of pure AZA1 was achieved. This material was sent to Japan for extensive NMR assessment, after being purified again on HW-40. In both procedures the end purity can be increased by using a final clean up on SEC material (HW-40, Tosoh) eluting with just MeOH and 1% acetic acid. This step has a high recovery (95% +) whilst chromatography on ODP-50 only shows a recovery of 50-60%. Overall the NRC-IMB scheme uses less solvent during the extraction and partitioning steps, and therefore saves time during the evaporation of solvents in between the clean up steps. Leaving out the ion exchange and the second size exclusion step, and having a shorter procedure for the silica column, also reduce working time. In both procedures the final clean up on HPLC was significantly time consuming. Using mass directed fraction collection enables automisation of the clean up and therefore greatly reduces labour time. 4.2.7. Isolation of DTX2 In addition to the isolation of AZAs, a further aim of WP 3 was to obtain pure DTX2. The material from Castletownbere 2001 contained ca. 10 mg of DTX2 alongside the 5 mg of AZA1. It could therefore be used for the isolation of both toxins. The isolation of DTX2 followed the isolation of AZA. The improved TU scheme has been used to isolate DTX2 and 800 ug of this toxin was obtained. As a final purification step a C18 silica column (Zorbax Eclipse, semi-prep, Agilent) was used. The elution was monitored using a split flow into a mass spectrometer. Fractions were collected manually. During the final purification 5 compounds with identical masses were observed and all of these were collected. Analysis of these compounds ca. 6 months later on an ion trap instrument in the NVI showed that the majority of these compounds were in fact DTX2, with one being OA. This indicates that these compounds might be stereoisomers that are the result of an equilibration mechanism, and when isolated revert back to the main isomeric form.
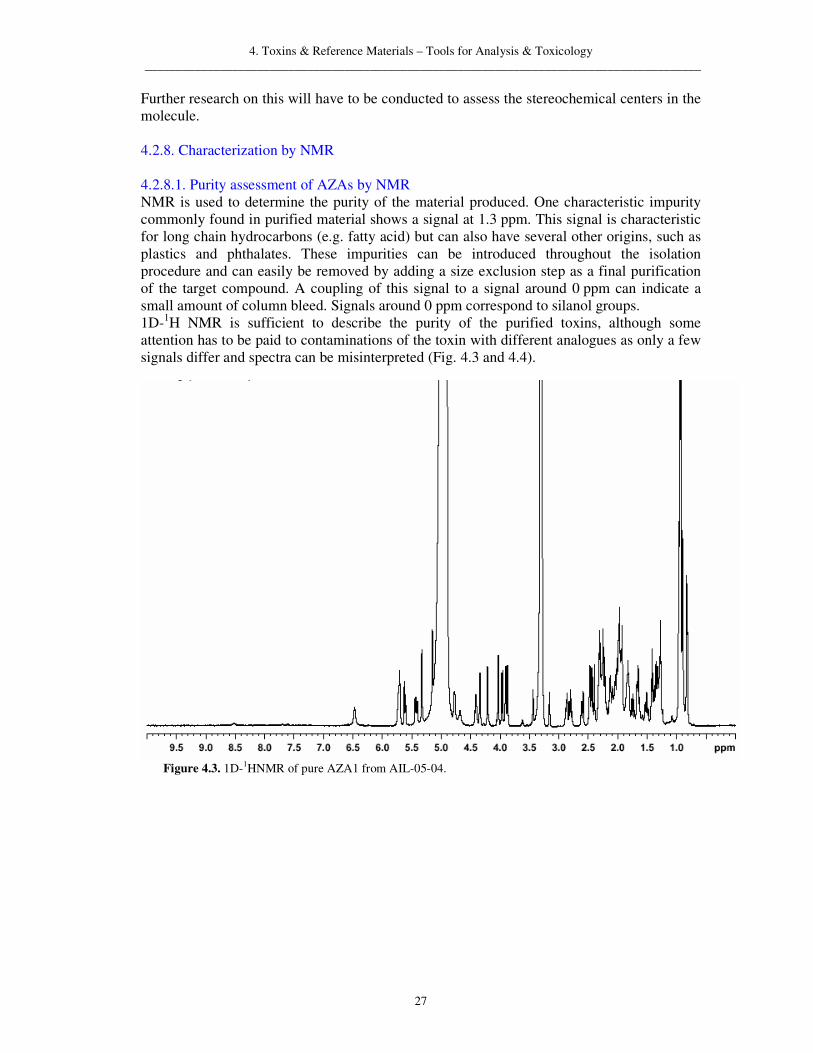
4. Toxins & Reference Materials – Tools for Analysis & Toxicology _________________________________________________________________________________________
27
Further research on this will have to be conducted to assess the stereochemical centers in the molecule.
4.2.8. Characterization by NMR
4.2.8.1. Purity assessment of AZAs by NMR NMR is used to determine the purity of the material produced. One characteristic impurity commonly found in purified material shows a signal at 1.3 ppm. This signal is characteristic for long chain hydrocarbons (e.g. fatty acid) but can also have several other origins, such as plastics and phthalates. These impurities can be introduced throughout the isolation procedure and can easily be removed by adding a size exclusion step as a final purification of the target compound. A coupling of this signal to a signal around 0 ppm can indicate a small amount of column bleed. Signals around 0 ppm correspond to silanol groups. 1D-1H NMR is sufficient to describe the purity of the purified toxins, although some attention has to be paid to contaminations of the toxin with different analogues as only a few signals differ and spectra can be misinterpreted (Fig. 4.3 and 4.4).
Figure 4.3. 1D-1HNMR of pure AZA1 from AIL-05-04.

4. Toxins & Reference Materials – Tools for Analysis & Toxicology _________________________________________________________________________________________
28
Figure 4.4. 1D-1HNMR of pure AZA1 zoomed in.
The methyl-group at position C-8 in AZA2 initiates a slight shift of the double duplet at 5.4 ppm up field. This effect can clearly be seen when looking at a mixture of AZA1 and AZA2 (Fig. 4.5). The NMR spectrum looks clean and it could be interpreted as a pure compound, although the sample is in fact a mixture of two analogues. NMR has not only aided the assessment of purity but has also helped to quantify the amounts of toxins present Burton et al. (2005). This method uses an external caffeine standard to quantify specific protons and exactly calculate the amount of toxin present. Since there is no other quantification method, apart from LC-MS, existing for AZAs this technique is very helpful in the production of RMs.
Figure 4.5. 1D-1HNMR of a mixture of AZA1 and AZA2. The triple duplet at 5.4 ppm results out of two overlapping double duplets.

4. Toxins & Reference Materials – Tools for Analysis & Toxicology _________________________________________________________________________________________
29
4.2.8.2. Purity assessment of DTX2 by NMR and LC-MS The same purity assessment as for AZA was carried out for DTX2. NMR analysis showed no significant further signals other than those belonging to DTX2. The analysis was carried out on a 600 MHz instrument with presaturation to suppress the water signal. A concentrated sample of the purified toxin was analysed by LC-MS as no significant peaks other than DTX2 were present. The scan range was set from 50-1500 and a gradient elution from 10% acetonitrile to 100% acetonitrile over 10 min holding for 5 min was run.
2.00 4.00 6.00 8.00 10.00 12.00 14.00Time30
100
%
TIC1.94e4
0.50
0.85
0.99
1.76 5.612.513.01 4.46 6.68 9.537.09
8.74 11.4910.24 12.98 14.9413.26
Figure 4.6. Chromatogram from LC-MS scan of DTX2 isolated in AIL-04-02.
4.2.9. Obtained materials Over the course of the ASTOX project, 8.35 mg of pure AZA1 was isolated, 6.3 mg of those in the last four isolation batches (AIL-05-03 to AIL-06-02) using the highly contaminated material originating from Bruckless in 2005 (Table 4.3). The main difficulty encountered at the start of the project was achieving a good yield and purity (the first isolation batch yielded 150 µg of AZA1 at a purity of 30-40%). However, significant improvements in the method have been made such that the MI will be able to produce pure AZA for future needs and secure the supply of standards for the coming years. Collaboration with the NRC-IMB has resulted in the production of a CRM that will shortly be commercially available. In addition, during the last three isolation batches we were able to purify AZA2 and AZA3 in sufficient quantities and purity to plan the production of certified RMs and provision of material for toxicology research for these two analogues. Approximately 900 µg and 1.3 mg of high purity AZA2 and AZA3, respectively have been isolated. 800 µg of pure DTX2 have also been obtained during the course of the project and it is planned to produce enough for a DTX2 CRM in the near future.
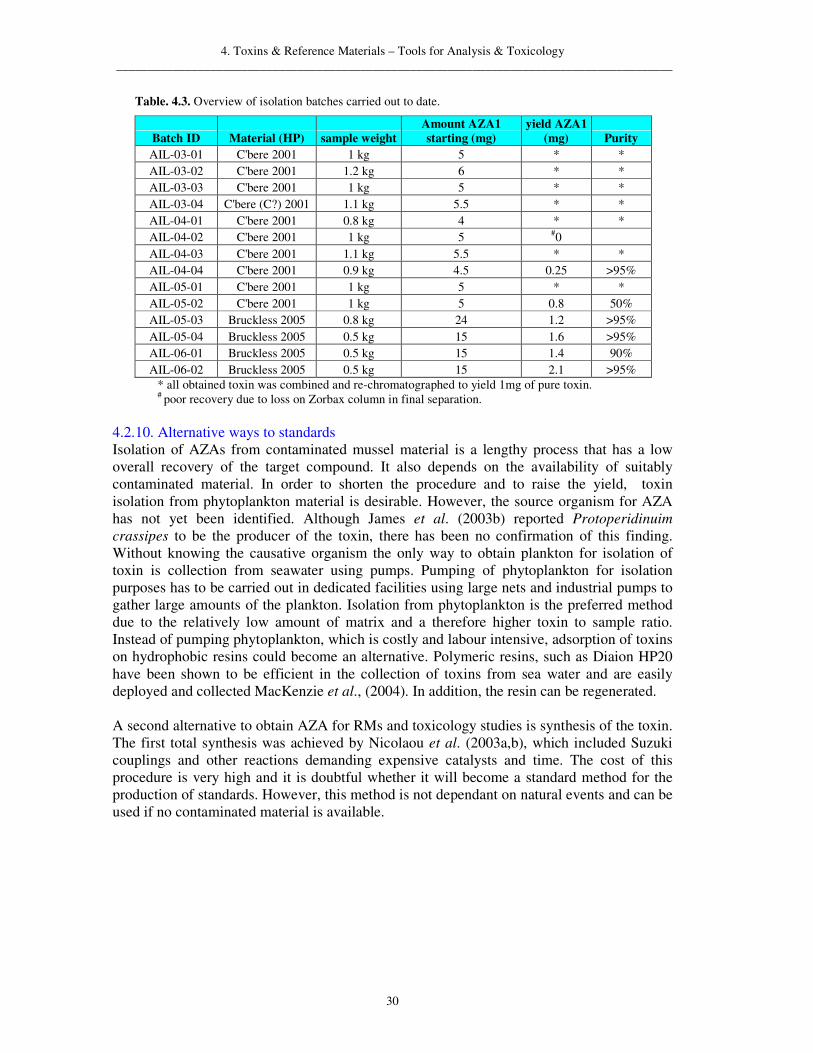
4. Toxins & Reference Materials – Tools for Analysis & Toxicology _________________________________________________________________________________________
30
Table. 4.3. Overview of isolation batches carried out to date.
Batch ID Material (HP) sample weight Amount AZA1 starting (mg)
yield AZA1 (mg) Purity
AIL-03-01 C'bere 2001 1 kg 5 * * AIL-03-02 C'bere 2001 1.2 kg 6 * * AIL-03-03 C'bere 2001 1 kg 5 * * AIL-03-04 C'bere (C?) 2001 1.1 kg 5.5 * * AIL-04-01 C'bere 2001 0.8 kg 4 * * AIL-04-02 C'bere 2001 1 kg 5 #0 AIL-04-03 C'bere 2001 1.1 kg 5.5 * * AIL-04-04 C'bere 2001 0.9 kg 4.5 0.25 >95% AIL-05-01 C'bere 2001 1 kg 5 * * AIL-05-02 C'bere 2001 1 kg 5 0.8 50% AIL-05-03 Bruckless 2005 0.8 kg 24 1.2 >95% AIL-05-04 Bruckless 2005 0.5 kg 15 1.6 >95% AIL-06-01 Bruckless 2005 0.5 kg 15 1.4 90% AIL-06-02 Bruckless 2005 0.5 kg 15 2.1 >95%
* all obtained toxin was combined and re-chromatographed to yield 1mg of pure toxin. # poor recovery due to loss on Zorbax column in final separation.
4.2.10. Alternative ways to standards Isolation of AZAs from contaminated mussel material is a lengthy process that has a low overall recovery of the target compound. It also depends on the availability of suitably contaminated material. In order to shorten the procedure and to raise the yield, toxin isolation from phytoplankton material is desirable. However, the source organism for AZA has not yet been identified. Although James et al. (2003b) reported Protoperidinuim crassipes to be the producer of the toxin, there has been no confirmation of this finding. Without knowing the causative organism the only way to obtain plankton for isolation of toxin is collection from seawater using pumps. Pumping of phytoplankton for isolation purposes has to be carried out in dedicated facilities using large nets and industrial pumps to gather large amounts of the plankton. Isolation from phytoplankton is the preferred method due to the relatively low amount of matrix and a therefore higher toxin to sample ratio. Instead of pumping phytoplankton, which is costly and labour intensive, adsorption of toxins on hydrophobic resins could become an alternative. Polymeric resins, such as Diaion HP20 have been shown to be efficient in the collection of toxins from sea water and are easily deployed and collected MacKenzie et al., (2004). In addition, the resin can be regenerated. A second alternative to obtain AZA for RMs and toxicology studies is synthesis of the toxin. The first total synthesis was achieved by Nicolaou et al. (2003a,b), which included Suzuki couplings and other reactions demanding expensive catalysts and time. The cost of this procedure is very high and it is doubtful whether it will become a standard method for the production of standards. However, this method is not dependant on natural events and can be used if no contaminated material is available.

4. Toxins & Reference Materials – Tools for Analysis & Toxicology _________________________________________________________________________________________
31
4.2.11. Provision of purified materials for additional studies The material obtained through purification from contaminated mussel tissue was provided for several uses. The main aim of the ASTOX project was to produce a reference standard for LC-MS calibration, method validation and toxicological research. 4.2.11.1. AZA provided to the NRC-IMB, Halifax, Canada The NRC-IMB was provided with 6.2 mg of pure AZA1. A candidate CRM has been produced containing ca. 1.5 µM of AZA1. For the production of 4,000 ampoules, 2.52 mg of toxin were used. A second CRM solution with the same concentrations is being prepared. Further to the provided AZA1 the NRC-IMB has obtained 1.3 mg of pure AZA3 and 0.9 mg of AZA2. These materials will also be used in the production of a CRM, but no decision has been made at this point regarding concentration levels. It is possible that more material will be needed for these CRMs in particular. 4.2.11.2. Provision of AZA1 for toxicological research Portions of pure AZA1 were provided for toxicological research to the Conway Institute in UCD as well as to NOAA in Charleston, SC, USA. These portions were used for in vitro studies on AZA and its mode of action. Small amounts were also provided to the University of Modena, Italy. 4.2.11.3. Provision of DTX2 for toxicological research 500 µg of pure DTX2 from AIL-04-01 have been provided to the NSVS in Oslo, Norway. The material was used to determine the difference in toxicity between OA and DTX2 (Aune et al., 2007). 4.2.11.4. Provision of AZA and DTX2 for matrix effect studies For investigation of matrix effects and recovery studies, several portions of purified AZA and DTX2 were provided to the Biotoxin Chemistry department of the MI and to a group working under the EU funded BIOTOX (FP6 2003 - #514074) project. The research is ongoing and results will be published separately. 4.2.11.5. Provision of material to the European CRL in Vigo, Spain AZA1 purified in this project (10 µg) was also provided for a method validation study initiated by the CRL, Vigo, Spain. The toxins were diluted to a standard series as ready-to-use solutions. Small amounts were also provided to the NSVS (10 µg) and the Public Analyst Laboratory in Galway (solutions at calibration levels), due to their immediate need for quantifying AZAs in shellfish samples as part of public health surveillance programmes. 4.2.12. Gaps in current studies Isolation of AZA1 and two of its analogues was successfully carried out in this project. During the isolation, many different isomers of this toxin have been observed, and most of these have been reported earlier (James et al., 2003, Ofuji et al., 2001). The hydroxylated isomers AZA4 and AZA5 have been isolated by Ofuji and characterized by NMR. Hydroxylated versions of AZA1 and AZA2 (AZA7 to AZA11) have been reported by James et al. (2003), but these were only observed by MS and structure elucidation has been based solely on the MS data and their similar fragmentation pattern to AZA4 and AZA5. Isolation of these compounds followed by NMR analysis is necessary to confirm the reported structures. AZA12 has also been reported to exist in theory by James et al. (2003a) but its existence has not been empirically proven. Using bulk amounts of toxin and concentrating the sample further and further during the isolation should make it possible to find AZA12 and other minor AZA analogues that have not yet been discovered.

4. Toxins & Reference Materials – Tools for Analysis & Toxicology _________________________________________________________________________________________
32
The discovery and structure elucidation of all the different analogues may help to clarify the detoxification mechanism of mussels. In addition to the hydroxylated analogues of AZA some isomers with identical masses and very similar fragmentation patterns to their main peers have been found by LC-MS. These show different retention times to the known toxins and it would be of interest to find the structural changes responsible for this behavior. Although these isomers are only present in low quantities, purification should be attempted. NMR analysis using NOESY and ROESY experiments as well as 1D COSY and 1D TOCSY experiments can help to clarify the stereochemistry of these isomers. Attempts to use alumina-B as a stationary phase for a clean up step have resulted in the production of many of the aforementioned stereo-isomers. Further investigations have shown that the pH used during this procedure was mainly responsible for the conversion. More studies focusing on the behaviour of AZA in acidic and basic environments may be helpful to clarify the mode of action of this toxin and give clues towards the actual toxicity of the compound.

4. Toxins & Reference Materials – Tools for Analysis & Toxicology _________________________________________________________________________________________
33
4.3. Preparation and characterisation of tissue RMs 4.3.1. Introduction A module of the ASTOX project was dedicated to the development of matrix tissue RMs naturally contaminated with this new class of toxin. Monitoring of AZAs, like any other toxin group, is necessary to prevent or minimise the risk of intoxications. In surveillance programmes, RMs have an important role as they enable development and validation of analytical monitoring methods. RMs are also necessary for the continuous assessment of the entire analytical process including sample extraction, clean up and concentration as well as the final separation and detection. They are equally helpful in the evaluation of the proficiency of official laboratories, one of the main tasks of the MI as a NRL for marine biotoxins in Ireland. Therefore, as monitoring and other duties carried out by the Irish NRL are ultimately concerned with determining the suitability of shellfish for human consumption, the necessity of high quality RMs to facilitate the production of accurate and reliable scientific data is great. The two most important parameters in order for RMs to be fit for purpose are that they must be homogeneous and stable, as has been highlighted in the most recent definition of a RM (Emons et al., 2006): “Material, sufficiently homogeneous and stable with respect to one or more specified properties, which has been established to be fit for its intended use in a measurement process”. Homogeneity is defined in ISO guide 30 as: “A condition of being of uniform structure or composition with respect to one or more specified properties. A RM is said to be homogeneous with respect to a specified property if the property value, as determined by tests on samples of a specified size, is found to lie within the specified uncertainty limits, the samples being taken either from different supply units (bottles, packages, etc.) or from a single supply unit”. In simplified terms this means that the separate portions of an individual RM must differ from each other only to an extent that does not affect the interpretation of the results when the material is in its intended use (Thompson 2004). Stability is defined in ISO guide 30 as: “Ability of RM, when stored under specified conditions, to maintain a stated property value within specified limits for a specified period of time”. Therefore, if a RM has been prepared and is being used for the continuous assessment of an analytical method, changes to its value would influence interpretation of the data produced. Currently the main institution producing CRMs for phycotoxins internationally is the NRC-IMB, and while CRMs are available for the ASP and DSP toxin groups, no CRMs for AZAs or DTX2 have been produced. This work package set out to examine existing procedures used to prepare RMs at the MI, and to determine how methodology could be improved to maximize homogeneity and stability. Using the best existing and available technologies this work made use of the bulk contaminated materials retrieved as part of the ASTOX project (WP 1, section 4.1). The various RMs produced were utilised in the various RM applications mentioned above. The feasibility of applying the experience gained in the various studies of this work package, to the preparation of a candidate CRM, was investigated in collaboration with the NRC-IMB.

4. Toxins & Reference Materials – Tools for Analysis & Toxicology _________________________________________________________________________________________
34
4.3.2. Parameters affecting homogeneity 4.3.2.1. Assessing homogeneity Homogeneity is assessed based on the coefficients of variance (% CV) obtained from analysis of a representative number of aliquots from a RM. One focus of this work was to prepare homogenous AZA and DTX2 RMs. Emphasis was placed on the individual steps involved in the preparation of material, and how these can possibly impact on homogeneity. However, the contribution that the analytical method makes to the apparent homogeneity of a material is of equal importance. Essentially a material can only be as good as the analytical method used for its characterisation. The overall variability of the analytical method comprises the variabilities associated with each step: sampling, weighing, extraction, making up to volume, injection, separation and final detection. Figure 4.7 shows how different methods can impact on the apparent homogeneity of a material.
Overall Variability (method & material)
0
1
2
3
4
5
6
7
HPLC-DAD LCMSMethod
%C
V
MethodMaterial
Figure 4.7. Illustration of the role that the method can play in overall variability when assessing the homogeneity of a RM.
As is demonstrated in Figure 4.7 even though two materials can have similar homogeneities, the impact that the method used for analysis can have on the apparent variability is significant. Therefore, before beginning homogeneity testing it is important that the variability of the method being used has been assessed and is known. It is also desirable to assess the variability of the method as homogeneity testing samples are being analysed, so as to be able to account for run specific variability, if necessary. For AZA analysis a LC-MS method is used and as a guideline figure a CV of 5% is followed, based on the within-batch injection repeatability of the instrument. In order to select the number of samples to be used in homogeneity testing a formula, 3(n)1/3, is used (Bermudo et al., 1998), where n equals the total number of aliquots dispensed. When selecting the samples from the fill series a random stratified selection procedure is followed to have the best possible representation of the material.

4. Toxins & Reference Materials – Tools for Analysis & Toxicology _________________________________________________________________________________________
35
4.3.2.2. Optimising methodology in terms of homogeneity Prior to commencement of work on the ASTOX project there had been difficulty in the preparation of mussel RMs with satisfactory homogeneity for AZAs at the MI. Initial studies involved the preparation of small-scale materials (<1 kg) using the existing methodology and available equipment. Through homogeneity testing of the RMs prepared and evaluation of the existing techniques, the aim was to optimise the preparation procedure. The procedure for preparing shellfish tissue RMs for toxins consisted of the following steps:
• Designing the material (shellfish type, toxin profile, quantity), • Homogenising using Waring blenders and polytrons • Sample dividing in portions suitable for dispensing • Dispensing into bijou tubes manually with pipette while mixing with ultra-turrax • Capping of bijous and storage (-20 °C) • Homogeneity testing Following this procedure a material was prepared containing AZAs, as well as OA and DTX2. Table 4.4 shows the concentrations and associated homogeneity of the material.
Table 4.4. Homogeneity testing of DSP LRM 03-2-R (n=170)
AZA3 [mg/kg]
AZA1 [mg/kg]
AZA2 [mg/kg]
AZA equiv.
(mg/kg)
OA [mg/kg]
DTX2 [mg/kg]
OA equiv. [mg/kg]
Average 0.04 0.17 0.03 0.28 0.19 1.15 1.34
stdev 0.00 0.02 0.01 0.04 0.03 0.12 0.13
% CV 10.9 13.4 18.5 13.3 17.5 10.2 9.74
The results demonstrated that the method produced a RM with unsatisfactory homogeneity for the toxins present. Evaluation of this and other data obtained from previously prepared RMs, and consideration of the method used suggested that a number of factors played an important role in the preparation of homogeneous RMs for the toxins of interest. One of the most unsatisfactory steps in the preparation procedure was the dispensing step. This involved division of the entire RM homogenate in quantities sufficient for mixing using an ultra-turrax and dispensing manually using an air displacement pipette. This was undesirable in that it required that the bulk material be sub-divided, increasing the possibility of heterogeneity across the entire fill series. To overcome this problem a peristaltic pump was purchased (Manostat). This allowed the entire material to be mixed and dispensed as a single lot, facilitating a less laborious, more time efficient dispensing procedure allowing for the bulk material to be mixed automatically during dispensing. Table 4.5 displays the homogeneity testing results of medium scale material (<3 kg) produced using the developed method.

4. Toxins & Reference Materials – Tools for Analysis & Toxicology _________________________________________________________________________________________
36
Table 4.5. Homogeneity testing of DSP LRM 04-1-R (n=1105)
AZA3 [mg/kg]
AZA1 [mg/kg]
AZA2 [mg/kg]
AZA equiv.
(mg/kg)
OA [mg/kg]
DTX2 [mg/kg]
OA equiv. [mg/kg]
Average 0.12 0.32 0.10 0.68 0.22 1.35 1.57
stdev 0.01 0.01 0.01 0.03 0.02 0.06 0.08
% CV 4.4 4.5 5.2 4.2 10.0 4.6 5.03
The use of a peristaltic pump had a positive influence on the homogeneity of the material with CVs for AZA and OA equivalents being <5%. Further RMs were prepared demonstrating that the improved methodology produced materials in the small to medium range with good homogeneity. Continued development of the procedure resulted in the inclusion of a step to accurately adjust the moisture content of the material. In RM preparation every effort should be made to prepare a material that mimics the routine samples for toxin analysis as closely as possible. However, it is not practical to prepare a RM that is identical to the day-to-day samples that come into a laboratory due to all the processing required to ensure homogeneity and stability. However, adjustment of moisture content is one controllable parameter. Moisture content adjustment involves measuring the water content of a homogenate, calculation of the water required to adjust to the moisture content of the material to a specific level, and consideration of the impact on the concentration of analytes. The selected moisture content should be chosen to reflect that of the natural shellfish matrix. In the preparation of a mussel tissue RM in collaboration with the NSVS, failing to adjust the moisture content appropriately produced a RM with unsatisfactory homogeneity. The moisture content was adjusted to 80%, even though the content of a typical whole mussel tissue is closer to 85%. This moisture content was selected so as to avoid having some analytes present at lower than desired concentrations. However, not having a high enough moisture content negatively impacted on the homogeneity (Table 4.6).
Table 4.6. Concentrations and % CV of AZAs in IRNO LRM 05-1 n=38
AZA3 [mg/kg] AZA1 [mg/kg] AZA2 [mg/kg] AZA equiv. (mg/kg)
Average 0.04 0.30 0.09 0.52
stdev 0.00 0.02 0.01 0.04
% CV 8.22 6.81 8.20 7.03
The material had been dispensed as 1 and 2 g portions, to facilitate the sample intake of the collaborating laboratories (1 g at NSVS, 2 g at MI). The low water content meant that the tissue was quite viscous and resulted in it being difficult to dispense the 1 g aliquots reproducibly using the peristaltic pump. This was carried out using pipettes meaning that the dispensing procedure took much longer than was desirable. Homogeneity testing of the material revealed that the difference in AZA concentrations in the different aliquot sizes were statistically significant. During the prolonged dispensing process it was noted that the bulk tissue homogenate had heated up due to the mixing and this may have caused water loss through evaporation. This resulted in an increased concentration (on average) in the 2 g aliquots, which were dispensed last. While the homogeneity of this RM was unsatisfactory, valuable information was obtained with regard to the importance of having the correct

4. Toxins & Reference Materials – Tools for Analysis & Toxicology _________________________________________________________________________________________
37
moisture content to ensure rapid dispensing of materials. 4.3.2.3. Homogeneity on a large scale Up to this point even though the materials had been prepared in quantities sufficient for the developmental exercises and for use as LRMs, the largest homogenate was still ca. 3 kg. In terms of processing and characterising bulk quantities of shellfish, and even for preparation of candidate CRMs, equipment and procedures for homogenising quantities in excess of 10 kg would be necessary. A large batch mixer (Silverson Ltd.) was purchased on a process satisfaction guarantee. In order to assess the efficiency of the instrument, a trial was carried out using ca. 18 kg of mussel remainder tissues. These tissues were accumulated during isolation of AZAs (WP 3, section 4.2), as this work used dissected HP tissues only. The remainder tissues were homogenised in a 30 L container. Some water was added to aid homogenisation, although the content was not adjusted accurately as is carried out in the improved RM preparation procedure. The homogenised material was then divided into 2 L containers (ca. 1.85 kg). A total of 10 containers were filled, and sub-samples were taken from each for characterisation.
Table 4.7. Homogeneity testing of bulk homogenised remainder tissues (n=10)
AZA3 [mg/kg] AZA1 [mg/kg] AZA2 [mg/kg] AZA equiv. (mg/kg)
Average 0.04 0.21 0.04 0.35
stdev 0.00 0.01 0.00 0.01
% CV 8.14 5.25 9.05 4.21
The analysis demonstrated that it was possible to homogenise bulk quantities of tissue easily with the appropriate equipment. The % CV for AZA1 and AZA equivalents were ca. 5%. The higher CVs for AZA2 and -3 could be attributed to the low concentration of these analogues present. This process will be carried out periodically as bulk quantities of tissues are accumulated. The advantage of bulk homogenisation is that large quantities of well homogenised and characterised materials are produced and are available for immediate use, as opposed to numerous portions of tissues with varying toxin concentrations and profiles. 4.3.3. Parameters affecting stability In the field of RMs, stability is of the utmost importance, as RMs find their utility because analysts can use them when they are required (Quevauviller and Maier 1999). The stability of a material can be influenced by chemical and biological activity as well as by physical effects. Of these various factors, biological activity poses the biggest threat to the stability of biological RMs. RMs are prepared in quantities sufficient to last long periods of time and because of this they need to be stable. Therefore typically in the preparation of a RM a step is included to stabilise the material. Such steps can be included as part of the actual preparation procedure (e.g. freeze drying), or are carried out after the material has been dispensed (e.g. heat stabilisation). There are a number of techniques employed to promote the stability of RMs. The choice of procedure used does, however, depend on the analyte of interest, and the representativeness of the material not being adversely affected. Heat treatment is a technique that the NRC-IMB has used in the preparation of biological CRMs for shellfish toxins. Removal of water during the preparation by freeze-drying is a stabilisation method routinely employed by the IRMM in the preparation of many different biological CRMs. Another method of stabilisation is

4. Toxins & Reference Materials – Tools for Analysis & Toxicology _________________________________________________________________________________________
38
gamma irradiation, although the technique is typically applied in the preparation of RMs to be certified for inorganic analytes as many organic compounds are destroyed by such treatment. Additives have also been used to improve the stability of materials. The feasibility and practicality of these various stabilisation techniques were investigated.
4.3.3.1. Heat stabilisation Heat treatment is a procedure with wide application for the stabilisation of RMs, and is desirable because of its efficiency and relatively low cost. However, recent studies by Quilliam et al. (2006) have shown that it is not entirely suitable for AZAs as AZA3 is unstable at the high temperatures typically used. The impact of heat treatment was investigated further as part of this work. Triplicate samples of a homogenous mussel RM, containing AZAs, were autoclaved at 121 °C for 15 min (Figure 4.8).
0.00
0.05
0.10
0.15
0.20
0.25
AZA3 AZA1 AZA2 AZA equiv.
conc
. mg/
kg
Initial conc.
Conc after treatment
Figure 4.8. Heat treatment at 121 oC for 15 min of AZAs in muscle tissue matrix. Error bars represent ±1 SD (n=3).
The data show complete degradation of AZA3 and more than 50% reduction in AZA1 and -2 values, supporting the results of the previous study. While heat treatment is a popular stabilisation technique, it is not desirable for AZA RMs due to the destruction of AZA3. However, if no suitable alternatives were available this technique could still have an application in the preparation of materials containing only AZA1 and -2. While the treatment does reduce AZAs, these studies have shown that AZA concentrations of lots treated in the same batch are lowered reproducibly. Similar trials were carried out with RMs containing OA and DTX2. Figure 4.9 displays concentrations after autoclaving.

4. Toxins & Reference Materials – Tools for Analysis & Toxicology _________________________________________________________________________________________
39
Figure 4.9. Heat treatment of OA and DTX2 at 121 oC for 15 min in mussel tissue. Error bars represent ±1 SD (n=3).
Reductions in OA and DTX2 concentrations were also observed after autoclaving, but only partially, and were reproducible between bottles of the same treatment batch. Heat stabilisation using a steam retort was applied by the NRC-IMB in the preparation of their mussel HP CRM for OA and DTX1 (NRC-IMB, 2005); however, no data is available describing the influence on analyte concentration. A short study was carried out to determine the influence of increasing temperature on AZA3 concentration in mussel tissue. A fresh mussel sample contaminated with AZAs was homogenised and hermetically sealed in 5 mL tubes. Triplicate samples were then heated using an oil bath at increasing temperatures (50 °C - 150 °C) for 10 min.
0.000
0.074
0.067
0.056
0.034
0.0160.003
0.066
0.041
0.0210.018
0.012
0.00
0.01
0.02
0.03
0.04
0.05
0.06
0.07
0.08
0.09
Con
trol
50°C
60°C
70°C
80°C
90°C
100°
C
110°
C
120°
C
130°
C
140°
C
150°
C
10 min @...
AZA
-3 c
onc.
mg/
kg
Figure 4.10. AZA3 concentration in 2 g aliquots of whole mussel flesh naturally incurred with AZAs heated at a range of temperatures for 10 min. Error bars represent ± 1 SD (n=3).
Significant increases were observed for AZA3 up to 90 °C, ranging from 0.01 mg/kg in the controls to 0.07 mg/kg in the aliquots heated at 90 °C (Figure 4.10.). At temperatures > 90 °C, the concentration of AZA3 began to decrease with none of the analogue being detected at 150 °C. AZA1 and -2 also present in the tissue were stable up to temperature of 110 °C, with gradual degradation occurring at the higher temperatures (data not shown). This correlates with the previous information from the autoclaving exercise.
0.00
0.10
0.20
0.30
0.40
0.50
0.60
0.70
0.80
0.90
OA DTX-2 OA equiv.
conc
. mg/
kg
Initial conc.
Conc after treatment

4. Toxins & Reference Materials – Tools for Analysis & Toxicology _________________________________________________________________________________________
40
The apparent release of AZA3 during heating of fresh mussels, as demonstrated by these results, requires attention in the preparation of RMs containing AZAs. Although these materials will be stored at low temperature conditions, there is the possibility of changes to AZA3 concentrations during transport, for instance. This is particularly important information for the preparation of a CRM, due to the risk of changes to certified values. It may be necessary that bulk lots of material, harvested for the preparation of RMs, be heated to release all the bound AZA3. 4.3.3.2. Freeze drying A collaborative project was carried out between the MI and the IRMM comparing the extractability, homogeneity, and stability of wet and freeze-dried OA and AZA group RMs prepared from naturally contaminated mussels (McCarron et al., 2007b). From a naturally contaminated bulk tissue homogenate, wet and freeze-dried RMs were prepared at the MI and the IRMM respectively for an equivalence study. Characterisation of the materials was performed at the MI. Extractability of the toxins was comparable for the wet and freeze dried materials once a sonication step was carried out for reconstitution prior to extraction. Homogeneity was also found to be similar for the wet and freeze dried materials (% CV for AZA equiv. in both <5%). Stability studies were performed over an 8 month period and the AZA1 results are displayed in Figure 4.11.

4. Toxins & Reference Materials – Tools for Analysis & Toxicology _________________________________________________________________________________________
41
Day
0 50 100 150 200 2500.0
0.2
0.4
0.6
0.8
1.0
1.2
1.4
conc
. nor
mal
ised
to -2
0°C
mea
n
0.0
0.2
0.4
0.6
0.8
1.0
1.2
1.4
-20°C+4°C+20°C+40°Caverage+/- 2 x StDev
-20°C+4°C+20°C+40°Caverage+/- 2 x StDev
Figure 4.11. Stability graphs of AZA1 in equivalence study. A) Wet frozen homogenate. B) Freeze-dried material. Error bars represent ± 1SD (n=3).
AZA1 was stable in both the wet and freeze dried materials at all conditions over the length of the stability study. AZA2 displayed similar good stability in the different materials (data not shown). However, there was some instability for AZA3 in both materials (Figure 4.12). In the wet material AZA3 was stable at -20 °C, but concentrations changed significantly throughout the study at the other temperatures. At +40 °C the AZA3 concentration on day 4 was ca. six times greater than that measured at -20 °C and for the remaining time points AZA3 concentration gradually decreased at this temperature, eventually falling below the -20 °C after 5 months. The AZA3 concentration at 20 °C on day 4 was ca. three times greater than at -20 °C, and this increased significantly until 32 days, at which point degradation was observed. At 4 °C AZA3 levels also increased, but much slower than what was observed at 40 °C and 20 °C. After 8 months AZA3 levels appeared to be still increasing at 4 °C. In the freeze-dried material AZA3 appeared to be much more stable, however, changes in concentration were measured. In the freeze-dried material AZA3 was stable at -20 °C and 4 °C. In comparison to the -20 °C values the measured AZA3 concentration at 40 °C increased over days 4 and 8, and the value remained stable until day

4. Toxins & Reference Materials – Tools for Analysis & Toxicology _________________________________________________________________________________________
42
32, with subsequent degradation taking place. A very gradual increase was measured at 20 °C, which continued for over the 8 month study period.
Day
0 50 100 150 200 2500
2
4
6
8-20°C+4°C+20°C+40°Caverage+/- 2 x StDevco
nc. n
orm
alis
ed to
-20°
C m
ean
0
2
4
6
8-20°C+4°C+20°C+40°Caverage+/- 2 x StDev
Figure 4.12. Stability graphs of AZA3 in equivalence study. A) Wet frozen homogenate. B) Freeze-dried material. Error bars represent ± 1SD (n=3).
This study shows that while there was no difference in AZA1 and -2 stability in both materials, AZA3 was significantly more stable in the freeze-dried matrix. These results also support the previous heat treatment studies where it was suggested that significant quantities of AZA3 are bound to the matrix, and released by degradation of the mussel matrix over time. This process is accelerated at elevated temperatures.

4. Toxins & Reference Materials – Tools for Analysis & Toxicology _________________________________________________________________________________________
43
4.3.3.3. Additives Additives have been used frequently to enhance the stability of a variety of RMs (Quevauviller and Maier 1999). Antioxidants such as ethoxyquin and butylated hydroxy toluene (BHT) have been used in the preparation of CRMs for phycotoxins (NRC-IMB, 2005), however, there is little information available on their effectiveness. As part of these studies the influence of ethoxyquin and a combination of antibiotics on the stability of DA in mussel tissue RMs was investigated (McCarron et al., 2007d). Antibiotics, namely ampicillin, erythromycin and oxytetracycline were used. The studies showed that using the antioxidant and the mixture of antibiotics individually improved the stability of DA. However, it was a combination of the antibiotics and ethoxyquin which produced the best results. There was no significant reduction in DA concentration at all temperature conditions after 8 days, and after 32 days the decrease at 40 °C was still < 20%. The additives did not show any interference with analytes of interest, and did not appear to alter the physical representativeness of the materials. In addition to improving the stability of the analyte, the additives also improved the stability of the mussel matrix. Considerable fouling of the samples without additives stored at the higher temperature conditions was apparent. This was not the case for the materials with additives. Heat treatment and freeze-drying are methods typically used to inhibit microbial activity but these techniques may not always be desirable. For instance, heat stabilisation can cause significant alteration of a matrix and may result in destruction of some analytes. While freeze-drying is a technique used commonly in biological RM preparations, emphasis is increasingly being placed upon preparation of RMs that are more representative of natural samples. Because of the minimal impact that additives would generally have on analytes of interest, as well as on the physical representativeness of materials, their use should be considered in combination with, or as a feasible alternative to more traditional stabilisation techniques. Based on the initial study with DA the combination of additives studied has been incorporated in all subsequent shellfish toxin RM preparations at the MI.
4.3.3.4. Irradiation Irradiation is a method traditionally used to prevent the microbiological spoilage of food products and it has been employed in the stabilisation of a seawater RM for nutrients, but there have been few reports in the literature for its use in the preparation of biological RMs (Clancy and Willie, 2004). The technique is typically applied in the preparation of RMs to be certified for inorganic contents, as many organic compounds are destroyed by such treatment. The aim of this study was to investigate the feasibility of using gamma irradiation as a stabilisation technique in the preparation of tissue RMs for AZAs. The influence of various doses on AZAs in mussel tissues and in solution was investigated (McCarron et al., 2007a). Aliquots of an AZA1 standard (43.3 ng/mL) and a mussel RM containing AZAs, OA and DTX2 were sent on dry ice to the Isotron irradiation facility in Ede, the Netherlands. Five replicates of each standard and tissue material were treated at each of the selected doses: 6 kGy, 12 kGy and 24 kGy. A test scale irradiator was used (cobalt 60-source). In addition control materials were also dispatched, but these were not irradiated. After treatment all materials were sent back to the MI for analysis. Figure 4.13 shows the influence the treatment had on AZA1 in the samples at the various doses.

4. Toxins & Reference Materials – Tools for Analysis & Toxicology _________________________________________________________________________________________
44
AZA1
0
0.2
0.4
0.6
0.8
1
1.2
Control 6 kGy 12 kGy 24 kGy
AZA
1 co
nc. n
orm
alis
ed
to c
ontr
ol
Mussel tissueSpikeMeOH solution
Figure 4.13. AZA1 concentrations measured in MeOH, naturally contaminated tissue and spiked tissue after irradiation. Error bars represent ± 1 SD (n=5).
For the AZA1 that was treated in MeOH, decreasing concentrations in the samples corresponded to the increasing doses. In comparison with the controls there was a ca. 50% reduction in AZA1 concentration for the samples given the 24 kGy dose (dose 3). The differences between the average concentrations recorded for the samples at the different doses were all statistically significant, except for the dose 1 and dose 2 samples. For AZA1 in tissue no reduction in concentration was observed between the different doses. AZA2 and -3 were also present in the tissue samples and similarly to AZA1 no significant reductions in the measured concentrations were observed (data not shown). In the tissue samples no statistically significant difference was detected between any of the samples. The results of the spiked mussel tissue show again that AZA1 was protected from the treatment when in a mussel matrix, even when spiked. These results indicate that irradiation may be a suitable treatment for the stabilisation of AZA RMs post-production. In addition to AZAs, irradiation trials were carried out for a range of toxins including OA/DTX, PTX2, YTX and DA. The influence of irradiation on OA in MeOH solution and in the tissue RM is displayed in Figure 4.14.
OA
0
0.2
0.4
0.6
0.8
1
1.2
Control 6 kGy 12 kGy 24 kGy
OA
con
c. n
orm
alis
ed
to c
ontr
ol
Mussel tissueMeOH solution
Figure 4.14. Normalised OA values in MeOH solution and tissue samples used in the study. Error bars represent ± 1 SD (n=3).

4. Toxins & Reference Materials – Tools for Analysis & Toxicology _________________________________________________________________________________________
45
OA was influenced by irradiation in both solution and tissue. The reduction in the tissue samples subjected to 24 kGy is lower than that of the equivalent MeOH solution, again showing that the mussel matrix has a protective influence for the toxins. While in the tissue matrix some degradation was seen for OA, and not AZA, it is worth noting that the largest reduction in the solution samples (ca. 30%) was still less than that of AZA1 in the corresponding samples (ca. 50%). DTX2 present in the tissue was influenced in the same way as OA. 4.3.3.5. Additional steps to improve stability of materials Section 4.3.3.3 on the use of additives dealt with how the stability of RMs can be at risk from oxidation (as well as from biological activity). In terms of oxidation measures can be taken during the preparation of material, in addition to the use of additives, to minimise this risk. De-aeration of the bulk homogenate before dispensing is one such possibility. This technique is applied by the NRC-IMB in the preparation of their phycotoxin RMs. This step will be implemented in future RM preparations at the MI. Another important factor with regard to the stability of a material is the choice of packaging. The type of container into which RMs are dispensed can influence the stability of toxins. Ideally the packaging material used should be inert to the analyte of interest, and the materials used. Prior to commencement of this project RMs prepared at the MI were dispensed into 7 mL bijou vials, with plastic screw caps. Initial stability studies demonstrated that these were not appropriate (data not shown), as desiccation of the materials was observed at temperatures above freezing, and even at temperatures below zero “freezer-burn” was observed with water from the tissue partitioning and forming as ice on the top of the aliquot. As a result, alternative, more suitable packaging was sourced. Borosilicate glass tubes (5 mL) with wadded screw caps were tested, and although no evaporation was observed even at temperatures up to 40 °C, they had limitations because of their durability. Subsequently, trials were carried out using polypropylene tubes (5 mL) (Teklab Ltd.). The advantage of this type of container is that it provides a hermetic seal through the use of an aluminium seal closure applied by heat (Seal-it-Systems Ltd.). After dispensing the aliquot the tube is purged with an inert gas (e.g. argon) followed by immediate sealing. A plastic screw cap is then attached to ensure the integrity of the seal until use. This type of container was also found to be more suitable for freezer storage and for shipment thanks to their robustness. No contamination from the plastic was observed in these studies, or has been reported to interfere with the analysis of toxins.
4.3.3.6. General discussion on stabilisation techniques The various studies performed as part of this work package have produced some very interesting results. Heat treatment trials for AZAs in mussel RMs, both in our laboratory and externally, have shown that the technique may not be desirable as a postproduction stabilisation technique due to partial degradation of AZA1 and -2 and complete degradation of AZA3. However, a milder treatment may be necessary to prevent changes in concentration during the life of a material, in particular for AZAs. The freeze-drying study demonstrated good equivalence between wet and freeze-dried RMs for AZAs, with AZA1 and -2 showing excellent stability in both materials. The results for the wet material were unexpected following stability studies over a 6 month period on an in-house LRM (McCarron P., 2006, IRNO DSP/AZA LRM-05-2), which showed degradation of AZAs after 5 months at 40 °C. What makes the results more intriguing is that the bulk tissue used to prepare the LRM had been heat stabilised by autoclaving before preparation, and during preparation of the materials additives were added. Whereas in the IRMM collaborative study a raw untreated tissue was used. Therefore, all the currently available data would suggest that for AZA1 and -2 the best way to stabilise a wet tissue RM would be

4. Toxins & Reference Materials – Tools for Analysis & Toxicology _________________________________________________________________________________________
46
to leave it untreated. However, the co-occurrence of AZA3, and its incorporation in EU regulations, does not facilitate this simplistic approach. For this analogue a variety of effects were observed in the different studies. In particular the rapid increases in the raw mussel RM as part of the IRMM study confirmed that bulk homogenates should be heated prior to preparation of a material in order to enable measurement of all the AZA3 present, and to avoid changes to AZA3 concentrations during the life of a material. While the equivalence study showed that AZA3 was much more stable in a freeze-dried material, preparation of freeze-dried materials is not always a practical option for the preparation of in-house RMs. This is due to both the expensive equipment necessary, and the expertise required for such work. In addition, RMs should ideally be as similar to “real samples” as possible, and this is best achieved with wet homogenates. The effectiveness of additives for promoting the stability of DA in mussel RMs was demonstrated, and while no similar study was carried out for AZAs, additives were used in all subsequent RM preparations. The decision, in addition to the DA data, was based on the influence that the additives have on the stability of the actual tissue matrix. In terms of wet homogenates irradiation was investigated. The feasibility study showed that the treatment could be used as a post-production stabilisation technique for AZAs. Stability studies are on-going assessing the impact that irradiation has on the stability of AZA RMs. 4.3.4. Standardisation of procedure Based on the above studies a procedure has been standardised for the production of tissue RMs for AZAs, and other naturally occurring marine toxins. A standard operating procedure has been drafted.

4. Toxins & Reference Materials – Tools for Analysis & Toxicology _________________________________________________________________________________________
47
Gentle Heat Treatment(e.g. steaming for 10 min., facilitates opening
of shells and prevents enzymatic degradations)
Initial Blending(e.g. household or Waring blender,
mincing of streaky shellfish tissues)
Dispensing(pre-labelled containers, peristaltic pump speeds up
process, sample must be mixed/stirred during process)
Fluidising(UltraTurrax or Polytron
remove heavy particles, sand and broken shells)
Purging + Sealing of Containers(argon or nitrogen purge, aluminium lids heat-
sealed onto polypropylene vials, MK-1)
Frozen Storage(e.g. box in chest freezer, -20 ºC)
Characterisation(homogeneity and stability testing)
Adjustment of watercontent to ca. 85 %
Addition of antioxidantand antibiotics
Production of a RM for Shellfish Toxins
LRM Design(shellfish species, bulk amount and portion size,
toxin profile, concentrations, anticipated duration of use)
Figure 4.15. Flow diagram illustrating the standardised procedure at the MI for the preparation of an in-house LRM for phycotoxins.
The procedure illustrated in Figure 4.15 has been applied in the preparation of in-house RMs for AZAs, OA/DTXs, DA, as well as for multi-toxin materials, in a variety of shellfish matrices including mussels (Mytilus edulis), oysters (Ostrea edulis, Crassostrea gigas), scallops (Pecten maximus) and clams (Tapes phillipinarium).

4. Toxins & Reference Materials – Tools for Analysis & Toxicology _________________________________________________________________________________________
48
4.3.5. Overview of materials produced at MI Table 4.8. AZA/DSP mussel tissue RMs produced at MI during the ASTOX project.
LRM Date Prepared by # Bottle Size AZA-e (mg/kg) % CV OA eq.
(mg/kg) % CV Use
DSP LRM 03-1-R 2003 ST, PMcC 700 4 g 0.26 11.5 1.28 6.9
DSP LRM 03-2-R 2003 AO, PMcC 170 4 g 0.28 13.3 1.34 9.7 stability (18used)
DSP LRM 03-2-R2 2003 AO, PMcC 206 4 g 0.01 26.9 0.20 11.5 stability (18used)
DSP LRM 03-2-R3 2003 AO, PMcC 170 4 g 0.01 20.4 0.23 5.8 small intercomparison
DSP LRM 03-2-R4 2003 AO, PMcC 109 4 g 0.02 7.2 0.73 11.8
DSP LRM 03-2-R5 2003 PMcC 185 4 g 0.18 6.0 1.19 6.8
DSP LRM 03-2-R6 2003 PMcC 155 4 g 0.25 7.7 0.13 8.8
AZP/DSP LRM 03-2-R7 2003 PMcC 143 4 g 0.32 5.0 0.92 5.1 Intercomparison, Irradiation feasibility
DSP LRM 04-1-R 2004 PMcC 1105 2 g 0.68 4.2 1.57 5.0 Routine Testing, intercomparison
IRMM DSP/AZP wet 2005 PMcC 262 2 g 0.34 4.5 3.12 4.9 Commutability study
IRMM DSP/AZP fd 2005 PMcC 150 0.3 g 1.64 2.9 0.55 7.6 Commutability study
IRNO DSP/AZP LRM 05-1 2005 PMcC 1000 (a), 875 (b) 1 g (a), 2 g (b) 0.52 7.0 0.49 7.7 Intercomparison, QC at NSVS
IRNO DSP/AZP LRM 05-2 2005 PMcC 900 (a), 983 (b) 1 g (a), 2 g (b) 0.57 3.2 1.64 7.0 LRM: MI, NSVS, NVI. Biotox pre-validation

4. Toxins & Reference Materials – Tools for Analysis & Toxicology _________________________________________________________________________________________
49
4.3.6. Overview of materials produced at NRC-IMB Based on the various studies performed as part of WP2 a collaboration was carried out with the NRC-IMB on the production of an AZA mussel tissue CRM (detailed information given in section 7.4). The various materials prepared as part of this work are shown in Table 4.9. In addition to the actual AZA-mus candidate CRM other small-scale feasibility materials were prepared for use in development of extraction procedures to be used in an eventual certification exercise, as well as for various stability studies. Table 4.9. AZA mussel tissue RMs produced at NRC-IMB during collaborative visit.
LRM Matrix Date # Bottle Size AZA-e (mg/kg) % CV Use
AZA-RadTrial homogenate
Bruckless Whole Flesh 20-Jan-06
50 4 g 1.28 6.88
Feasibility
AZA-mus CRM (candidate)
Bruckless Whole Flesh & ZERO-mus* 15-Mar-06
ca.3700 8 g 1.57 5.01
CRM
AZA-mus no additives
Bruckless Whole Flesh & ZERO-mus* 16-Mar-06
60 4 g Stability
AZA-mus irradiation
Bruckless Whole Flesh & ZERO-mus* 16-Mar-06
60 4 g Stability
* Mussels not containing any toxins at detectablable levels harvested in early May 2005 in Prince Edward Island 4.3.7. Use of materials produced 4.3.7.1. Single laboratory validation Two of the LRMs prepared at the MI (Table 4.8) have been used in the single laboratory validation (SLV) of the regulatory DSP/AZA toxin monitoring method for Irish shellfish. DSP LRM 04-1-R was prepared using the improved procedure, with the exception of purging and heat-sealing bottles before capping. Figure 4.16 below shows a shewart chart of the LRM being used in each batch over the period of July 2005 to March 2006. A multi-toxin LRM (IRNO DSP/AZP LRM 05-2) was prepared as a replacement material and is currently in use with the routine method.
LRM AZA EQUIV Control Chart QCC166
0
0.2
0.4
0.6
0.8
1
1.2
1.4
1 9 17 25 33 41 49 57 65 73 81 89 97 105
113
121
Batch number
AZA
con
c m
g/kg
UAL
LAL
UWL
LWL
Mean
Figure 4.16. Shewart chart for DSP LRM 04-1-R used in the analysis of AZAs at the MI from July 2005 to March 2006.

4. Toxins & Reference Materials – Tools for Analysis & Toxicology _________________________________________________________________________________________
50
4.3.7.2. Collaborative studies Many of the materials prepared as part of the method development exercise have been supplied to laboratories internationally for various collaborative studies. A multi-toxin RM (IRNO DSP/AZP LRM 05-2-R-2), prepared using the optimised procedure (with the exclusion of the de-aeration step before dispensing) in collaboration with the NSVS and the NVI and is being used to assess the performance of individual laboratories on a long term basis. This material has also been distributed to laboratories internationally as part of a multi-toxin LC-MS method validation exercise as part of the BIOTOX project (FP6 2003 - #514074). 4.3.7.3. Proficiency testing and interlaboratory studies The RMs prepared have also been used in proficiency testing (PT) and interlaboratory studies. Since October 2005 the MI has been preparing and characterising RMs for a DSP analysis PT scheme, which is run by PT providers Quality Assurance of Information for Marine Environmental Monitoring in Europe (QUASIMEME). To date four tissue RMs containing various combinations of OA, DTX1, DTX2 and esters of these have been supplied. Figure 4.17 illustrates the successful use of one of the materials with 10 out of 13 participating laboratories achieving acceptable z-scores (<2) for the determination of DTX2. The PT scheme for DSP analysis is still in its development stage, and depending on progress, and the availability of standards and tissue RMs, the possibility of a PT scheme for AZAs is under consideration.
AG748AG789
AG764AG796
AG741AG750
AG762AG794
AG736AG718
AG729AG808
AG782
Z-sc
ore
-6
-5
-4
-3
-2
-1
0
1
2
3
4
5
6
Figure 4.17. Z-scores for DTX2 results of participants in developmental DSP QUASIMEME exercise (DE-10, R 43) using material prepared at MI.
As the MI is the Irish NRL for marine toxins, it has a duty to arrange interlaboratory studies for laboratories involved in the testing of marine toxins nationally. This is particularly important in terms of toxin groups for which there are no PT schemes being run (e.g. QUASIMEME), such as is the case for AZAs. Twice a year materials are distributed to official laboratories. The participating laboratories send back the results of the analyses, and the results are collated and reported by the MI.

4. Toxins & Reference Materials – Tools for Analysis & Toxicology _________________________________________________________________________________________
51
4.3.7.4. Feasibility of certification and candidate CRMs Some of the materials prepared have been used in exercises examining the feasibility of producing RMs. Examples are the use of LRMs to examine the influence of treatments such as irradiation and heat treatment, to determine if these would be suitable stabilisation techniques for candidate CRMs (see also section 7.4). 4.3.8. Further developments
4.3.8.1. Gaps in current studies Although the work described examined a variety of approaches to improve the stability of RMs, there are still some studies, which would be desirable. For instance, while the work investigating the influence of additives on the stability of DA produced some important results it would be ideal if a similar study were carried out on a material containing lipophilic toxins. An additives study would be particularly interesting for AZAs due to the unusual occurrences with AZA3 in untreated tissues. The influence of additives on the stability of the OA group would also be of interest, particularly with regard to the esters of these compounds, which have been shown to hydrolyse to the free parent toxin in some raw shellfish matrices over time (MI unpublished information). 4.3.8.2. Sustainable supply of tissue RMs At laboratory level, sustainable supply of tissue RMs needs to be ensured. This has been helped by a number of factors:
• Standardisation of preparation procedure • Drafting of RM preparation SOP • Familiarisation of technical staff in preparation method • Frequent review of RMs available, and assessment of future needs • Obtaining bulk quantities of tissues
On a broader level, preparation of LRMs in house, and their use in QC monitoring avoids excessive use of CRMs, which are only available in limited supply.

4. Toxins & Reference Materials – Tools for Analysis & Toxicology _________________________________________________________________________________________
52
4.4. Synopsis of progress on AZA standards and RMs Bulk shellfish materials secured from natural AZA occurrences in 2000, 2001, 2004 and 2005 were contaminated at ca. 1 to 8 mg/kg with AZAs and DTX2. The materials collected from Bantry Bay in 2000 and 2001 were lower in AZA contamination (ca. 0.6 mg/kg) compared to those from 2005 (8 mg/kg). These materials contained up to 1.3 mg/kg DTX2. The materials collected in 2004 contained exclusively OA and DTXs, with a maximum DTX2 concentration of ca. 1.5 mg/kg. Mussels from Bruckless, 2005, contained very little DTX2, however, up to 5 mg/kg AZA1 were present, with a total AZA-equivalent of ca. 8 mg/kg. Isolation and purification studies included a total of 14 isolation batches and led to purified AZA1 (ca. 8 mg). The initial isolation procedure developed by the TU collaborators was implemented and tested; a detailed standardised protocol for the purification of AZAs has been established. Due to the comparatively low concentration of AZAs in the bulk materials from 2000 and 2001, the amount of AZA1 obtained from seven of the first nine batches (ca. 1 mg) was pooled together to be able to prove purity. All four isolation batches carried out on the shellfish from Bruckless, 2005, yielded quantities above 1 mg each. The amount obtained overall (8 mg AZA1) was not sufficient to conduct formal long-term oral exposure studies in mice since this would require more than 250 mg; however, aliquots of the purified standard have been provided for in vitro toxicology studies as well as method validation studies. The collaboration with NRC-IMB allowed for the preparation of a candidate CRM for pure AZA1, which will be made available globally once certification is complete (ca. 3,500 ampoules of 0.5 mL at ca. 1.5 µM AZA1). The collaboration with NRC-IMB is continuing and 4 further reference standards are under development (AZA1, -2, -3 and DTX2). Small amounts of AZA1 standard and shellfish tissues contaminated with AZAs have already been made available to the EU CRL, individual NRLs and the Public Analyst laboratory in Galway, another Irish official control laboratory. The stock of AZA1 from the candidate CRM will suffice for several years of worldwide use as calibration standards in LC-MS analysis. However, the standard may be depleted earlier if large quantities are required for further in vivo toxicity testing. It is rather advisable that further bulk amounts of toxin should be isolated if the need for toxicology studies persists. The abovementioned bulk materials were successfully used to prepare 17 different shellfish tissue RMs (100 to 3,700 portions of 1 to 8 g). Factors affecting homogeneity were mostly related to water content and dispensing procedures; improved procedures were published (Hess et al., 2007). Factors affecting stability were temperature, water content and container sealing; methods investigated to improve stability included the addition of antibiotics, antioxidants, γ-irradiation, heat treatments and freeze-drying. The use of additives was shown to improve the stability of the matrix overall, thus guaranteeing a microbiologically safer way of shipping and handling wet shellfish tissue RMs. Heat treatment at ca. 121 °C was shown to be a major problem for AZAs, however, irradiation proved to be a very effective stabilisation technique for the elimination of microbial activity without affecting AZA contents. Freeze-drying was an equally good alternative and may be used in further preparations if the materials require combinations of toxin profiles that exclude the use of irradiation. Some of the materials resulting from these studies have been and continue to be used, in the QC of the Irish national statutory monitoring for marine biotoxins; others have been used for comparison of the detection method used at MI with up to 16 other laboratories worldwide through proficiency testing and method validation exercises. The collaboration with NRC-IMB allowed for the preparation of a candidate CRM for AZAs, which will be made available globally once certification is complete (ca. 3,700 portions of

4. Toxins & Reference Materials – Tools for Analysis & Toxicology _________________________________________________________________________________________
53
8 g). Existing tissues are sufficient to prepare more CRMs and further preparations will depend on international demand for such materials (see also section 7.4).

5. Mechanisms underlying the Toxicity of AZAs _________________________________________________________________________________________
54
5. Mechanisms underlying the Toxicity of AZAs 5.1. Cellular functions affected by AZAs 5.1.1. Introduction Epidemiological data gathered from the various AZA incidents has provided information on human symptoms, identifying gastrointestinal disturbances. In depth analysis of the functional changes involved in AZA toxicity has required the use of in vitro and in vivo models. The in vivo mouse model has expanded on the epidemiological data, providing information about organ susceptibility to AZA toxicity. In vitro models have enabled an in depth examination of direct functional changes in a simplified environment. Due to the organ-selective nature of many toxic xenobiotics, in vitro methods have become an invaluable tool for the study of the mechanisms involved in causing toxicity. In the intact animal, it is difficult to detect direct effects due to higher order regulatory systems influencing changes. Direct assessment of the functional properties of these cells is necessary for a complete understanding of how the cell regulates its many physiological processes. Several in vitro systems have been developed to further examine the processes involved. Cell culture techniques have gained importance due to improved methodologies for growing homogeneous populations of cells. Established cell lines and primary cells provide a powerful tool for in vitro studies (Gstraunthaler, 1988). The benefits of long-term exposure, controlled conditions, indefinite growth, large cell number and the absence of a need for isolation procedures makes established cell line a useful tool (Boogaard et al., 1990). In addition these cells are generally well characterised, and can be easily standardised. The development of human cell lines has further enabled the study of species-specific immunological responses. Epithelial cells form a barrier between the external and internal environment and are capable of initiating the local immune response. Disruptions to this barrier can result in gastrointestinal disturbances e.g. diarrhoea. Several laboratories have reported that enteropathogenic E. coli are capable of increasing the permeability of the gastrointestinal barrier, increasing the flux of paracellular fluid into the lumen of the gut. This was accompanied by the altered distribution of the proteins responsible for maintaining this barrier i.e. tight junction proteins (Collington et al., 1998). However, this functional change was not accompanied by cell death. In vitro, epithelial cells form a polarised monolayer of cells capable of forming cell-cell contacts, recreating the epithelial barrier observed in vivo. By culturing these adherent cells on a microporous support the flux of fluid and ions can be measured in isolation. In contrast to epithelial cells T-lymphocytes are a non-adherent cell type involved in the immune response. During adaptive immunity, cytokines are produced by activated T-lymphocytes in response to specific foreign antigen recognition. T-cells produce various cytokines that serve primarily to regulate the growth and differentiation of various lymphocyte populations and play important roles in the activation phase of T-cell dependent immune responses (Morel and Oriss, 1998). CD4+ T-cells can be divided into two main subsets, T helper 1 (Th1) and Th2. Regulation of growth and differentiation of T-cells into Th1 or Th2 is determined by cytokines. Each of these subsets can produce multiple different cytokines that are capable of driving the immune reaction towards a particular response. Th1 cells are involved in cell-mediated inflammatory reactions and can induce cytotoxic T-lymphocytes and immunoglobulin IgG subclass switching to favour complement fixation and opsonisation; Th1 clones can also induce delayed-type hypersensitivity reactions

5. Mechanisms underlying the Toxicity of AZAs _________________________________________________________________________________________
55
(Holdsworth et al., 1999). Th2 cytokines promote antibody production and enhance eosinophil proliferation and function (Mosmann and Sad, 1996). Although Th1 and Th2 cells are major sources of their respective cytokines, many other non-immune cell types also produce cytokines, for example endothelial cells (Pober and Cotran, 1990) and epithelial cells (van Kooten et al., 1999). 5.1.2. Cytotoxic effects of AZA in different cell types Recent efforts to determine the mode of action of AZA have been conducted by several investigators using in vitro techniques. Due to the similar nature of the symptoms of AZP with DSP, a mode of action similar to the DSP toxins on protein phosphatase (PP) activity was proposed by Flanagan et al. (2001). However, unlike DSP toxins, bioactive extracts containing AZAs did not have any inhibitory effect on PP1 activity, yet were clearly cytotoxic to both human hepatoblastoma and bladder carcinoma cell lines (Flanagan et al., 2001), suggesting that the mode of action of AZA1 is different from that of the DSP toxins. Using a combination of neuroblastoma cells and human lymphocytes, it was shown that AZA1 reduces cellular F-actin content in a non-apoptotic manner following the elevation of cytosolic calcium and cAMP levels (Roman et al., 2002). The authors suggested that AZA1 may be targeting the cytoskeleton. In the present studies the effect of AZA1 on cellular viability was carried our using different cell types and different assays. In the UCD laboratory the effect of AZA was examined on Caco-2 human epithelial cells grown to confluency using the alamar blue assay. Reduction of alamar Blue from an oxidised (non-fluorescent, blue) form to a reduced (fluorescent, red) form was used as a measure of metabolic activity. Caco-2 cells were exposed continuously to AZA1 (0.01 – 100 nM) for periods of 24, 48 and 72 hr. This assay did not detect any loss in cellular viability, but an increasing trend in viability was observed at 24 hr with concentrations of 5 nM or higher (Figure 5.1). This increase could be due to increased cellular proliferation, although further work would be necessary in order to confirm this.
0
20
40
60
80
100
120
140
160
180
Ctrl 0.01 0.1 0.5 1 5 10 100
AZA-1 [nM]
% C
ontr
ol V
iabi
lity
24 hr
Figure 5.1. Effect of AZA1 on the viability of Caco-2 cells after 24 hr.
In the Marine Biotoxin laboratory of NOAA, the effect of AZA on a number of different cell types grown in suspension culture was examined. A second assay used for assessing AZA cytotoxicity consisted of a microplate-formatted assay modified for seven cell types where

5. Mechanisms underlying the Toxicity of AZAs _________________________________________________________________________________________
56
cytotoxicity and general cellular alterations were assessed according to the MTS tetrazolium-based assay protocol. The MTS cytotoxicity assay quickly and accurately assesses cellular viability following exposure of a cell type to a toxicant for a given time period. The use of MTS as a cytotoxicity indicator dye yields results that correlate exceptionally well with the similar MTT dye, yet also remedies many of the disadvantages that are typically associated with MTT. This screening excercise served to identify cell type(s) exhibiting the highest sensitivity to AZA1. The most sensitive cell type(s) then served as the model system for subsequent, more targeted experimentation. The cell lines used in this initial set of experiments (Table 5.1) were chosen based, in part, on the results of other, recently published studies of AZA1 effects in both in vivo and in vitro systems (Ito et al., 2000; Ito et al., 2002; Roman et al., 2002; Ito et al., 2006). Table 5.1. Cell lines selected for AZA1 toxicity testing.
Tissue Type Cell line ATCC code Origin Adherent or Not-Adherent
Monocyte THP-1 TIB-202 Human NA Lymphocyte B Raji CCL-86 Human NA Lymphocyte T Jurkat TIB-152 Human NA
Embryonic kidney HEK CRL-1573 Human A Lung epithelial A549 CCL-185 Human A
Neuronal N2A CCL-131 Mouse A Pituitary GH4C1 CCL-82.2 Rat A
For each cell line, a concentration-response curve was generated for AZA1 for three different exposure periods (24, 48, and 72 hr). Toxin concentrations ranged from 10-7 M to 10-12 M AZA1. As seen below (Figure 5.2), AZA1 has a diverse range of effects that is time-, concentration- and cell type-dependent. For each cell type, viability was determined using the MTS assay and graphed as a percent of the control, when no AZA1 was present. An EC50 value (the 50% effective concentration of AZA1) was calculated for each cell type and exposure time (Table 5.2). Although very different values were obtained depending on the exposure time, EC50 values were typically in the low nanomolar range (0.92 – 16.8 nM), with AZA1 toxicity generally increasing with the longer exposure times (i.e. lower EC50
values). However, in a few cell types that were exposed to AZA1 for 24 hr, EC50 values could not be obtained, although significant compromises in viability relative to the control were observed. In fact, only the Jurkat and the GH4C1 cell types showed consistent toxicity following 24 hr of AZA1 exposure. The EC50 values were subsequently used to determine the relative sensitivities of each cell type to AZA1. The apparent sensitivities of the cell types to AZA1 are suggested to be as follows (from most sensitive to least sensitive): Jurkat > Raji > A549 > Neuro2A = THP = HEK > GH4C1. The findings suggest that immune cells are particularly sensitive to AZA.

5. Mechanisms underlying the Toxicity of AZAs _________________________________________________________________________________________
57
Figure 5.2. Effect of AZA1 on the viability of seven cell types as determined using the MTS assay. Cells were continuously exposed for 24, 48, or 72 hr.
A549 cells
control0
25
50
75
100
125
24 hr48 hr72 hr
-12 -11 -10 -9 -8 -7
log [Azaspiracid-1] (M)
% c
ontr
ol
GH4C1 cells
control
0
25
50
75
100
125
-12 -11 -10 -9 -8 -7
log [Azaspiracid-1] (M)
% c
ontr
ol
HEK cells
control0
25
50
75
100
125
-12 -11 -10 -9 -8 -7
log [Azaspiracid-1] (M)
% c
ontr
ol
Jurkat cells
control0
25
50
75
100
125
-12 -11 -10 -9 -8 -7
log [Azaspiracid-1] (M)
% c
ontr
ol
N2A cells
control0
25
50
75
100
125
-12 -11 -10 -9 -8 -7
log [Azaspiracid-1] (M)
% c
ontr
ol
Raji cells
control0
25
50
75
100
125
-12 -11 -10 -9 -8 -7
log [Azaspiracid-1] (M)
% c
ontr
ol
THP cells
control0
25
50
75
100
125
-12 -11 -10 -9 -8 -7
log [Azaspiracid-1] (M)
% c
ontr
ol

5. Mechanisms underlying the Toxicity of AZAs _________________________________________________________________________________________
58
Table 5.2. Relative sensitivities of each cell type to AZA1 according to EC50 values (given as means for n> 3 replicates). Note: ‘-’ indicates that an EC50 value was not obtainable for a minimum of three separate experiments.
Cell line AZA1 EC50 (nM)
24 hr 48 hr 72 hr Jurkat 3.5 1.1 0.92 Raji - 1.6 1.1
A549 - 1.5 2.0 Neuro2A - 2.3 2.3
THP - 2.4 2.5 HEK - 4.6 2.8
GH4C1 16.8 7.9 5.5 5.1.3. Membrane Integrity: effect of AZA in lymphocytes Visual and biochemical (see above section) observations of the cell lines outlined in Table 5.1 were suggestive of cytotoxicity concurrent with membrane lysis. Using the human T lymphocyte cell line (Jurkat) in a microplate-formatted assay, release of the cytosolic enzyme glucose-6-phosphate dehydrogenase (G6PD) was fluorometrically assessed (Molecular Probes cat. # V-23111) following exposure to AZA1. A concentration-response curve was generated for AZA1 for two exposure periods (24 and 48 hr) and all data expressed as a percentage of G6PD detected from lysed cells of untreated controls. Toxin concentrations ranged from 10-7 M to 10-12 M AZA1. AZA1 had a significant effect on the membrane integrity of T lymphocyte (Jurkat) cells that was both time- and concentration-dependent (Figure 5.3). This result is consistent with our finding of broad-spectrum cytotoxicity to all cell types tested, in addition to our visual observation of disrupted Jurkat cell membranes following prolonged AZA1 exposure. These data collectively provide evidence suggestive of cytotoxicity induced by AZA1. EC50 values (the 50% effective concentration of AZA1) were calculated to be 0.19 ± 0.01 nM and 0.12 ± 0.03 nM for the 24 and 48 hr exposure times, respectively. For this assay under these conditions, 72 hr exposure times were not reliable.
Figure 5.3. Effect of AZA1 on membrane integrity of human T lymphocyte (Jurkat) cells. Jurkat cells were continuously exposed to various concentrations of AZA1 (10-12 to 10-8 M) for 24 hr () or 48 hr () prior to testing for cellular lysis via release of glucose-6-phosphate dehydrogenase (G6PD). G6PD release was quantified and is given as the percentage of total G6PD from untreated control cells that were lysed at the end of the exposures. Data are mean ± SD in triplicate wells with three independent experiments. Controls were cells treated with equivalent amounts of the MeOH vehicle. Mean ± SD (nM) EC50 values of 0.19 ± 0.01 and 0.12 ± 0.03 were determined by a variable slope sigmoidal regression analysis using GraphPad Prism™ software for the 24 and 48 hr exposures, respectively.
control0
10
20
30
40
5024 hr48 hr
-12 -11 -10 -9 -8 -7
log [AZA] (M)
G6P
D r
elea
se(%
of t
otal
G6P
D)
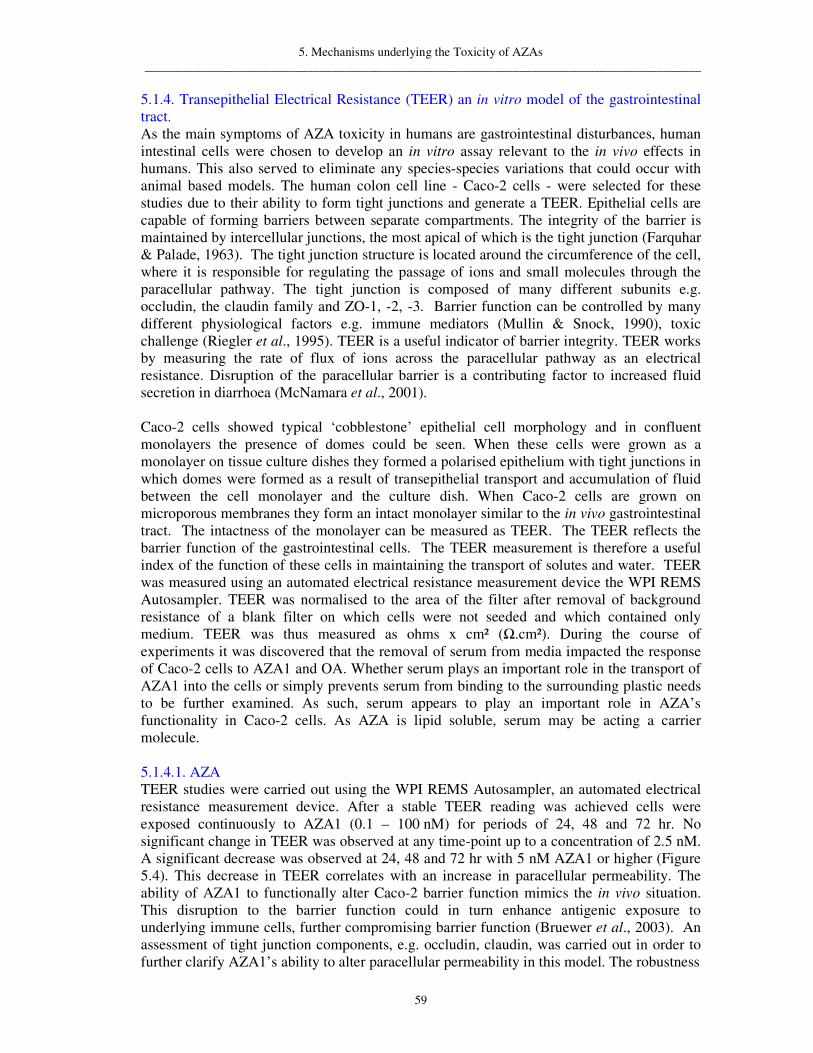
5. Mechanisms underlying the Toxicity of AZAs _________________________________________________________________________________________
59
5.1.4. Transepithelial Electrical Resistance (TEER) an in vitro model of the gastrointestinal tract. As the main symptoms of AZA toxicity in humans are gastrointestinal disturbances, human intestinal cells were chosen to develop an in vitro assay relevant to the in vivo effects in humans. This also served to eliminate any species-species variations that could occur with animal based models. The human colon cell line - Caco-2 cells - were selected for these studies due to their ability to form tight junctions and generate a TEER. Epithelial cells are capable of forming barriers between separate compartments. The integrity of the barrier is maintained by intercellular junctions, the most apical of which is the tight junction (Farquhar & Palade, 1963). The tight junction structure is located around the circumference of the cell, where it is responsible for regulating the passage of ions and small molecules through the paracellular pathway. The tight junction is composed of many different subunits e.g. occludin, the claudin family and ZO-1, -2, -3. Barrier function can be controlled by many different physiological factors e.g. immune mediators (Mullin & Snock, 1990), toxic challenge (Riegler et al., 1995). TEER is a useful indicator of barrier integrity. TEER works by measuring the rate of flux of ions across the paracellular pathway as an electrical resistance. Disruption of the paracellular barrier is a contributing factor to increased fluid secretion in diarrhoea (McNamara et al., 2001). Caco-2 cells showed typical ‘cobblestone’ epithelial cell morphology and in confluent monolayers the presence of domes could be seen. When these cells were grown as a monolayer on tissue culture dishes they formed a polarised epithelium with tight junctions in which domes were formed as a result of transepithelial transport and accumulation of fluid between the cell monolayer and the culture dish. When Caco-2 cells are grown on microporous membranes they form an intact monolayer similar to the in vivo gastrointestinal tract. The intactness of the monolayer can be measured as TEER. The TEER reflects the barrier function of the gastrointestinal cells. The TEER measurement is therefore a useful index of the function of these cells in maintaining the transport of solutes and water. TEER was measured using an automated electrical resistance measurement device the WPI REMS Autosampler. TEER was normalised to the area of the filter after removal of background resistance of a blank filter on which cells were not seeded and which contained only medium. TEER was thus measured as ohms x cm² (.cm²). During the course of experiments it was discovered that the removal of serum from media impacted the response of Caco-2 cells to AZA1 and OA. Whether serum plays an important role in the transport of AZA1 into the cells or simply prevents serum from binding to the surrounding plastic needs to be further examined. As such, serum appears to play an important role in AZA’s functionality in Caco-2 cells. As AZA is lipid soluble, serum may be acting a carrier molecule. 5.1.4.1. AZA TEER studies were carried out using the WPI REMS Autosampler, an automated electrical resistance measurement device. After a stable TEER reading was achieved cells were exposed continuously to AZA1 (0.1 – 100 nM) for periods of 24, 48 and 72 hr. No significant change in TEER was observed at any time-point up to a concentration of 2.5 nM. A significant decrease was observed at 24, 48 and 72 hr with 5 nM AZA1 or higher (Figure 5.4). This decrease in TEER correlates with an increase in paracellular permeability. The ability of AZA1 to functionally alter Caco-2 barrier function mimics the in vivo situation. This disruption to the barrier function could in turn enhance antigenic exposure to underlying immune cells, further compromising barrier function (Bruewer et al., 2003). An assessment of tight junction components, e.g. occludin, claudin, was carried out in order to further clarify AZA1’s ability to alter paracellular permeability in this model. The robustness

5. Mechanisms underlying the Toxicity of AZAs _________________________________________________________________________________________
60
of our model was also tested using AZA1 of lower purity. No alteration in sensitivity was observed compared to AZA1 of higher purity, indicating that impurities in the preparation did not alter the responses to AZA (data not shown).
Figure 5.4. Effect of AZA1 on the transepithelial electrical resistance across Caco-2 cell monolayers using the REMS autosampler after various concentration and exposure periods. **Indicates statistically different to control : p<0.01.
In order to address the potential problems of matrix interference in our model a range of experiments examining the effect of uncooked mussel extract (UME) on Caco-2 cells were carried out. No effect on TEER was observed with a 10% concentration of UME or lower (Figure 5.5).

5. Mechanisms underlying the Toxicity of AZAs _________________________________________________________________________________________
61
Figure 5.5. Effect of AZA1 and UME on the TEER across Caco-2 cell monolayers using the REMS autosampler after various concentration and exposure periods. **Indicates statistically different to control: p<0.01.
The effect of UME in combination with a range of toxins was also examined. UME did not appear to have any significant effect on the toxicity of AZA1, OA or PTX2 in this model system. The effect of UME on DTX2 needs to be clarified. The data to date suggests that UME will not interfere with the sensitivity of our model to a range of marine biotoxins. The current regulatory limit of AZA is 0.16 mg/kg edible mollusc part. This equates to approximately 190 nM. The ability of this assay to detect levels of 5 nM (0.0042 mg/kg) is potentially very useful. While the sensitivity of this model in detecting pure AZA1 induced alterations in epithelial function are clear, it must be stressed that in a real life in vivo human situation, dilution factors and possible breakdown in the gastrointestinal tract would have to be taken into account in determining a NOAEL. 5.1.4.2. Other toxins in the in vitro model of the gastrointestinal tract We have also assessed the ability of the marine toxin okadaic acid (10 – 500 nM) to alter TEER in the model. A significant decrease in TEER was observed at 24, 48 and 72 hr with 100 nM OA (Figure 5.1.6). This indicates that the model is significantly more sensitive in the detection of AZA1 than OA. Additional marine biotoxins were examined in the model; DTX2 and PTX2. OA (100 nM) and DTX2 (100 nM) both reduced TEER significantly at 24 hr, with OA (500 nM) reducing TEER to basal levels (Figure 5.6). DTX2 (500 nM) did not reduce TEER to basal levels until 48 hr, this was significantly less than the equivalent concentration of OA (p 0.05). PTX2 (100 nM) reduced TEER to basal levels at 24 hr, while a significant decrease was observed as early as 4 hr. In summary, while OA, DTX2 and PTX2 affected the barier function of the in vitro model of gastrointestinal tract, the concentrations required (100 nM) were much higher than those of AZA (5 nM).
-800
-700
-600
-500
-400
-300
-200
-100
0C trl U M E 1 0% 1 1 +1 0% 1 0 1 0 +1 0%
∆∆ ∆∆T
ER
( ΩΩ ΩΩ.c
m2 )
24 h48 h72 h
[AZA1] nM
**
** **
** ** **
Ctrl UME 1 1 + 10 10 + 10% 10% 10%

5. Mechanisms underlying the Toxicity of AZAs _________________________________________________________________________________________
62
Figure 5.6. Effect of OA, DTX2 or PTX2 on TEER across Caco-2 cell monolayers using the REMS autosampler. **Indicates statistically different to control : p<0.01.
The ability of TEER to recover after exposure to AZA1, OA, PTX2 and DTX2 was examined. Monolayers that had TEER decrease to basal levels did not recover at the timepoints examined (96 hr) i.e. AZA1 (10 nM), PTX2 (100 nM), OA (500 nM), DTX2 (500 nM). However, monolayers exposed to OA (100 nM) or DTX2 (100 nM) showed a significant recovery (p 0.05 and p 0.01 respectively) by 48 hr. This again indicates that the model system is more sensitive to AZA. The ability of PTX2 to significantly decrease TEER in the nanomolar range, despite in vivo evidence showing very low oral toxicity in mice, is something that needs to be further investigated. The non-interference of UME with several biotoxin profiles is promising for the use of this in vitro model. To further assess our models ability to detect shellfish toxins we applied yessotoxin (YTX) standards to our model and assessed its ability to alter TEER. YTX 6.85 ng/mL (ca.6 nM) resulted in a significant increase in paracellular permeability as observed by a decrease in TEER after 24 hr of exposure (Fig. 5.7). As reported incidents involving YTX have not resulted in diarrhea in humans, coupled with a regulatory level of 1 mg of yessotoxin equivalent/mg of edible tissue, this observation was unexpected. This functional change observed in our gastrointestinal model requires further examination.
-800
-700
-600
-500
-400
-300
-200
-100
01 2 3 4
∆∆ ∆∆TE
R ( ΩΩ ΩΩ
.cm
2 )
24 h48 h72 h
-800
-700
-600
-500
-400
-300
-200
-100
01 2 3 4
∆∆ ∆∆TE
R ( ΩΩ ΩΩ
.cm
22 22)
24 h48 h72 h
-800
-700
-600
-500
-400
-300
-200
-100
0
100
1 2 3
∆∆ ∆∆TE
R ( ΩΩ ΩΩ
.cm
2 )
24 h48 h72 h
[PTX2] nM
[DTX2] nM [OA] nM
Control 10 100 500 Control 10 100 500
Control 10 100
**
** **
** ** **
**
** ** **
** **
** ** **
**

5. Mechanisms underlying the Toxicity of AZAs _________________________________________________________________________________________
63
Figure 5.7. Effect of YTX on the TEER across Caco-2 cell monolayers using the REMS autosampler. **Indicates statistically different to control : p<0.01.
5.1.4.3. Combinations In nature AZA1 and OA have often been found to co-occur. We examined the effect of combinations of AZA1 and OA in the model system. No additional decrease in TEER was seen when both toxins were added together compared to findings with either AZA or OA alone (Figure 5.8).
Figure 5.8. Effect of AZA1 in combination with OA on the TEER across Caco-2 cell monolayers using the REMS autosampler.

5. Mechanisms underlying the Toxicity of AZAs _________________________________________________________________________________________
64
5.1.5. Cell morphology and cytoskeletal effects in lymphocytes Photomicrographs of T lymphocyte (Jurkat) cells were taken following exposure to AZA1 and various other phycotoxins. Jurkat cells were exposed to 10-8 M AZA1 for 24, 48 and 72 hr prior to photographs being taken. Control cells were exposed to equivalent volumes of the MeOH vehicle. Nomarski differential interference contrast (DIC) imaging was used. Jurkat cells exposed to AZA1 over the 72 hr time course became rounded with accentuated organelles, were absent of pseudopodia (see arrows of control cells), and showed signs of lysis (Figure 5.9). The absence of pseudopodia is particularly interesting as these cytosolic appendages are dense with F actin and function primarily in cell-to-cell signaling, mobility, and chemotaxis. Reduced functionality of lymphocyte cells in an organism due to AZA1 exposure may result in immunosuppression.
3 µm
A CB
D E F
3 µm
A CB
D E F
Figure 5.9. Photomicrographs of Jurkat T lymphocyte cells following exposure to AZA1. Jurkat cells were exposed to AZA1 for 24, 48, and 72 hr prior to photographs being taken. Panels A, B, and C illustrate control cells 24, 48, and 72 hr after incubation with equivalent volumes of the MeOH vehicle, respectively. Panels D, E, and F illustrate cells exposed to 10 nM AZA1 for 24, 48, and 72 hr, respectively. Arrows indicate presence of pseudopodia.
Exposure of Jurkat cells to a variety of other phycotoxins was subsequently performed in order to evaluate the specificity of AZA1 on pseudopodial extensions (Figure 5.10). The other marine phycotoxins tested in this experiment were DA, dinophysistoxin-1, maitotoxin, okadaic acid, brevetoxin-3, and saxitoxin. It is clear that only the Jurkat cells treated with AZA1 were devoid of pseudopodia.
3 µm
A CB D
FE G H
3 µm
A CB D
FE G H
Figure 5.10. Photomicrographs of Jurkat T lymphocyte cells following exposure to various phycotoxins. Jurkat cells were exposed to (A) MeOH vehicle (1% v/v final), (B) 3 nM AZA1, (C) 5 nM DA, (D) 2 nM dinophysistoxin-1, (E) 0.7 nM maitotoxin, (F) 2 nM okadaic acid, (G) 1 nM brevetoxin-3, and (H) 2.3 nM saxitoxin for 24 hr prior to photographs being taken. Arrows indicate presence of pseudopodia.

5. Mechanisms underlying the Toxicity of AZAs _________________________________________________________________________________________
65
To further examine the absence of Jurkat cell pseudopodia, cells were exposed to 10 nM AZA1 for various time periods (2, 4, 8, 12, 18, and 24 hr) followed by enumeration of pseudopodia per cell. Pseudopodia were counted manually on unstained cells using Nomarski interference contrast microscopy. Treatment data are normalised to parallel controls in which cells were exposed to equivalent amounts of the MeOH vehicle for each time course indicated. To further visualise the effect of AZA1 on extended pseudopodia, exposed Jurkat cells were stained with the F actin-binding, fluorescent dye Oregon Green 488 phalloidin (Molecular Probes cat. # O-7466). The stained F actin was visualized on a Zeiss Axiovert S100 epifluorescence microscope at 480 nm excitation and 535 nm emission wavelengths.
Jurkat cells exposed to AZA1 at concentrations > 1 nM were absent of their pseudopodia. To quantify the effect of AZA1 on Jurkat cell pseudopodial number, we fluorescently visualised and enumerated the pseudopodial extensions on individual cells, following various exposure times of Jurkat cells to 10 nM AZA1 or MeOH vehicle (Figure 5.11). For exposure times of 12-18 hr, pseudopodia numbers per cell significantly decreased in a time-dependent manner from ca. 2 per cell to ca. 1 (ca. 50% of control) per cell. After 24 hr of exposure, the average number of pseudopodia per cell was ca. 0.2 (10% of control). Subsequently, as F actin plays a major role in the extension and retraction of pseudopodia, F actin was stained fluorometrically to better visualize the effects of AZA1 on pseudopodia (Figure 5.12). These observations suggest that cells treated with AZA1 rearrange their F- actin in a different configuration relative to the control. This was particularly evident with the absence of pseudopodia in certain cases.
Figure 5.11. Effect of AZA1 on pseudopodia number of Jurkat T lymphocyte cells. Jurkat cells were exposed to the MeOH vehicle (1% v/v final) or 10 nM AZA1 for 2, 4, 8, 12, 18, and 24 hr and the number of pseudopodia per cell was enumerated visually and recorded. For each treatment, pseudopodia on 50 randomLy selected, individual cells were examined. An asterisk (*) denotes a significant difference (p < 0.05) between the control and the AZA1 treatment for a given time point according to Tukey T-test.
2 4 8 12 18 240
25
50
75
100
125
*
*
*
controlaza
Exposure Time (hr)
Pse
udop
odia
per
cel
l(%
of
cont
rol)

5. Mechanisms underlying the Toxicity of AZAs _________________________________________________________________________________________
66
Figure 5.12. Fluorescence staining and visualization of F-actin in Jurkat T lymphocyte cells following exposure to AZA1. Jurkat cells were exposed to the MeOH vehicle (1% v/v final) for (A) 2 hr, (B) 4 hr, (C) 8 hr, (D) 12 hr, (E) 18 hr, and (F) 24 hr prior to staining for fluorescence visualization of F-actin using Oregon Green 488 phalloidin. Similarly, cells were exposed to 10 nM AZA1 for (G) 2 hr, (H) 4 hr, (I) 8 hr, (J) 12 hr, (K) 18 hr, and (L) 24 hr.
To assess the concentration dependence of AZA1 on retraction of Jurkat cell pseudopodia, cells were exposed to various concentrations of AZA1 for 24 hr prior to manual enumeration of pseudopodia. AZA1 concentrations ranged from 10-7 M to 10-12 M AZA1. In addition, Jurkat cells were also exposed to contaminated mussel (Mytilus edulis) homogenates from animals harvested in Castletownbere, during August 2001. AZA toxins were extracted by tissue homogenisation with water, extraction with 80% MeOH (2 mL per gram), vortexing and sonication, followed by centrifugation (1000 x g for 10 min at 4 oC), and 0.22 µm filtration of the supernatant. By separate LC-MS analysis at the MI, this sample contained 0.17 µg/g AZA1, 0.03 µg/g AZA2, 0.04 µg/g AZA3 (= 0.24 µg/g AZAtotal) and 0.19 µg/g OA and 1.15 µg/g DTX2. Extracts from uncontaminated mussels that contained no detectable phycotoxins were used as controls.
In Figure 5.13, the mean number of pseudopodia is plotted versus AZA1 concentration (10-12 to 10-7 M) following a 24 hr exposure. The EC50 value of this assay was calculated to be 0.8 nM, based on a variable slope sigmoidal regression analysis. Analysis of uncontaminated mussel extract had no effect on pseudopodia number (<0.1%); however, a similar volumetric addition of AZA-contaminated mussel extract significantly reduced the mean pseudopodia number per cell. The corresponding toxin concentration derived from the calibration curve shown in Figure 5.13 was determined to be 0.5 nM AZA1 equivalents (data not shown). Previous analysis of this shellfish extract by mass spectrometry yielded a value of 0.14 nM AZAtotal. This ca. three-fold discrepancy may have resulted from the different extraction procedures employed, the unknown specific toxicities of AZA2 and AZA3, and/or the potential synergistic effects of OA and DTX2 present in the extracts.
5. Mechanisms underlying the Toxicity of AZAs _________________________________________________________________________________________
67
Figure 5.13. Calibration curve for AZA1 assay based on the concentration-dependent reduction of pseudopodia number per cell during AZA exposure. Jurkat cells were exposed to known amounts of AZA1 (10-12 to 10-7 M) for 24 hr and pseudopodia numbers per cell were visually recorded. For each treatment, pseudopodia on 50 randomLy selected, cells were enumerated.
5.1.6. Signalling pathways and junctional regulation in human gastrointestinal cells The mode of action of AZA in altering barrier function in human gastrointestinal cells has been explored in our laboratory. To date tight junction dysfunction as well as cytoskeletal changes involving actin, claudin-2 and claudin-4 in response to AZA1 have been observed. When confluent monolayers of Caco-2 cells were exposed to increasing concentrations of AZA1 there was a dose- and time-dependent decrease in TEER. This modulation of tight junction function was paralleled by the altered expression of members of the claudin family. Additional structural cellular changes, as observed by the loss of perijunctional F-actin staining and formation of stress fibres may contribute further to the increase in barrier permeability. This is the first study that we are aware of, that confirms the ability of AZA1 to alter epithelial cell barrier function. The mechanism by which AZA1 influences tight junction function was illustrated by the organisation of claudin-2 and -4 in the detergent -soluble and -insoluble cellular fractions. An increase in claudin-2 levels was observed with AZA1 (5 nM), with claudin-4 also increasing to a lesser degree (Figure 5.14). A particularly interesting finding was that the increase in claudin-2 showed a dose-dependent effect.
control
0.0
0.5
1.0
1.5
2.0
2.5
-12 -11 -10 -9 -8 -7 -6
[Azaspiracid-1] (M)
Pse
udop
odia
per
cel
l(m
ean
+ S
E)

5. Mechanisms underlying the Toxicity of AZAs _________________________________________________________________________________________
68
Figure 5.14. Western blot analysis of triton-x-soluble (s) and triton-x-insoluble (i) fractions from Caco-2 cells treated with AZA1. Claudin-2 and claudin-4 protein levels were analysed. Confluent cells were treated with increasing concentrations of AZA1 (2.5 - 10 nM) for a period of 24 hr, fractions were separated by SDS-PAGE and subjected to Western blot analysis.
Another claudin family member claudin-1 showed no alteration when exposed to AZA1. The detergent-insoluble fraction contained those proteins within the membrane/tight junction complex, whereas the detergent-soluble fraction reflected cytoplasmic and loosely associated membrane proteins. Increased claudin-2 expression in the detergent-insoluble fraction, with increased claudin-4 expression in detergent-soluble fractions is consistent with previous reported findings relating to a decrease in TEER. The imbalance of tight junction components appears to play an important role in junctional integrity.
In order to assess the possible signalling mechanism involved in these AZA1 induced alterations in tight junction protein levels exposure, we examined the mitogen activated protein kinase (MAPK) signalling pathways. AZA1 stimulation was associated with increased activation of the MAPK signalling pathways, ERK 1/2 and p38 at 24 hr (Figure 5.15).
Figure 5.15. Western blot analysis of phosphorylated and total ERK 1/2 from Caco-2 cells treated with AZA1. Confluent cells were treated with increasing concentrations of AZA1 (2.5 - 10 nM) for a period of 24 hr, fractions were separated by SDS-PAGE and subjected to Western blot analysis.
The observation that AZA1 increases phosphorylation through the MAPK pathways while decreasing TEER supports existing evidence that MAPK signalling is involved in regulating
Control 2.5 5 10
Claudin-1
Claudin-2
Claudin-4
s i s i s i s i
[AZA1] nM
phospho ERK 1/2
total ERK 1/2
Ctrl 2.5 5 10
[AZA1] nM
phospho p38
total p38
Ctrl 2.5 5 10
[AZA1] nM

5. Mechanisms underlying the Toxicity of AZAs _________________________________________________________________________________________
69
tight junction function. Further examination of the role of ERK 1/2 signalling in regulating barrier function was illustrated using the MEK 1, 2 inhibitor U0126. Inhibition of MEK 1, 2 block the phosphorylation/activation of ERK 1/2 (Figure 5.16). The ability of U0126 to reduce the AZA1 induced decrease in TEER (Figure 5.17), coupled with the reduction in stimulated claudin-2 upregulation supports this suggestion that AZA induced decrease in TER involves ERK 1, 2 (Figure 5.18). As previously mentioned decreased levels of claudin-2 have been reported to increase TEER levels. The present series of studies demonstrate a relationship between paracellular barrier function and tight junction proteins and suggest a mechanism for AZA induced decrease in TEER.
Figure 5.16. Effect of AZA1 (10 nM) in the presence or absence of the MEK 1, 2 inhibitor, U0126 (10 µM) or p38 inhibitor, SB203580 (10 µM) on ERK 1/2 activity in Caco-2 cells at 24 hr.
Figure 5.17. Effect of AZA1 (10 nM) in the presence or absence of the MEK 1, 2 inhibitor U0126 on TEER in Caco-2 cells at 4, 8 and 24 hr. Data are mean ± SD (n = 3). Indicates statistically different to control : * p<0.05.
Ctrl AZA1 AZA U0 AZA SB +U0 +SB
phospho ERK 1/2
total ERK 1/2
-700
-600
-500
-400
-300
-200
-100
0
100
A Z A Z +U O U O
∆∆ ∆∆ T
ER ( ΩΩ ΩΩ
.cm
2 )
4 h8 h24 h
*
*
*
AZA1 AZA1 + U0126 U0126

5. Mechanisms underlying the Toxicity of AZAs _________________________________________________________________________________________
70
Figure 5.18. Western blot analysis of triton-x-soluble (s) and triton-x-insoluble (i) claudin-1, (d) claudin-2 and (e) ZO-1 protein levels at 24 hr after exposure to AZA1. Confluent cells were pretreated with U0126 (10 µM) either alone or in combination with AZA1 (10 nM) ± U0126 (10 µM).
These studies to date suggest that AZA1 is capable of modulating intestinal barrier function via modulation of claudin localisation. Activation of the MAPK pathways, ERK 1/2, p38 and JNK/SAPK may be involved in this process. The dose-dependant upregulation of claudin-2 in response to AZA provides novel insights in the toxicity of AZA. 5.1.7. Neuro-inhibitory effects 5.1.7.1. Neuronal networks The primary objective of these experiments was to investigate the pharmacological effects of AZA1 on spinal cord neuronal networks grown on microelectrode arrays (MEAs). Electrophysiological measurements were performed using a portable cell-based recording system with on-line monitoring of neuronal spike rates derived from MEAs. Control HEPES medium perfusion usually continued for at least 30-40 min until stable baselines of network bioelectrical activity was established. AZA1 (0.2 to 10 nM final) and MeOH (vehicle control) were added to the medium reservoir in a concentration-increasing manner and maintained until a baseline was obtained. Pharmacological experiments were initiated by pre-treating the neuronal networks with bicuculine, a GABA receptor inhibitor, and observing the effect of bicuculine on AZA1-induced inhibition.
As observed below (see Figures 5.19A and 5.19B), AZA1 had a significant effect on the spike rates of spinal cord neuronal networks that was concentration-dependent. Inhibition of bioelectrical activity induced by AZA1 was slow and at least 40 min was usually required to establish a new baseline after introduction of additional AZA1. This result is consistent with our previous findings of broad-spectrum, slow-onset effects to all cell types tested to date. These data provide the first evidence suggestive of neurotoxicity for AZA1. The IC50 value (the 50% inhibitory concentration of AZA1) calculated from Figure 5.18B was 2.1 ± 0.5 nM (mean ± SD, n = 4). This inhibitory concentration corresponds very closely to the range of cytotoxicity EC50 values (0.9 to 16.8 nM) determined for multiple cell lines as described above. For the AZA1 concentrations illustrated, parallel experiments with MeOH (vehicle control) had no significant effect on spike rates (data not shown). Following exposure of spinal cord neuronal networks to AZA1, networks were perfused with control medium and recovery in mean spikes rates were monitored (Figure 5.20). The inhibitory effect of AZA1 was only partially reversible after washing the network with HEPES buffered medium for at least 4 hr. Recovery corresponded to 40 ± 32% (mean ± SD, n = 4) relative to the original
Control AZA1 AZA U0126 10 nM + U0126 10 µµµµM
Claudin-1
Claudin-2
s i s i s i s i
ZO-1

5. Mechanisms underlying the Toxicity of AZAs _________________________________________________________________________________________
71
baseline prior to AZA1 introduction.
Time (min)0 50 100 150 200 250
Nor
mal
ized
mea
n sp
ike
rate
0.0
0.3
0.6
0.9
1.2
1.50.2 0.5 1 2 5 10
Azaspiracid-1 (nM)A
AZA-1 concentration (nM)0.1 1 10
Mea
n sp
ike
rate
(%
of c
ontro
l)
0
20
40
60
80
100
120B
Time (min)0 50 100 150 200 250
Nor
mal
ized
mea
n sp
ike
rate
0.0
0.3
0.6
0.9
1.2
1.50.2 0.5 1 2 5 10
Azaspiracid-1 (nM)A
Time (min)0 50 100 150 200 250
Nor
mal
ized
mea
n sp
ike
rate
0.0
0.3
0.6
0.9
1.2
1.50.2 0.5 1 2 5 10
Azaspiracid-1 (nM)
Time (min)0 50 100 150 200 250
Nor
mal
ized
mea
n sp
ike
rate
0.0
0.3
0.6
0.9
1.2
1.50.2 0.5 1 2 5 10
Azaspiracid-1 (nM)A
AZA-1 concentration (nM)0.1 1 10
Mea
n sp
ike
rate
(%
of c
ontro
l)
0
20
40
60
80
100
120B
AZA-1 concentration (nM)0.1 1 10
Mea
n sp
ike
rate
(%
of c
ontro
l)
0
20
40
60
80
100
120
AZA-1 concentration (nM)0.1 1 10
Mea
n sp
ike
rate
(%
of c
ontro
l)
0
20
40
60
80
100
120B
Figure 5.19. Effect of AZA1 on spike rates of spinal cord neuronal networks. (A) Representative recording trace of normalized mean spike rates during perfusion of increasing concentrations of AZA1 (0.2 to 10 nM). (B) Mean concentration-dependent effects of AZA1 on spinal cord neuronal network spike rates (mean ± SD, n 3). Curve fitting was performed by using 3 parameter logistical functions, reversible after washing the network with HEPES buffered medium for at least 4 hr. Recovery corresponded to 40 ± 32% (mean ± SD, n = 4) relative to the original baseline prior to AZA1 introduction.
Per
cent
bas
elin
e re
cove
ry
0
30
60
90
Control Washing
**
Per
cent
bas
elin
e re
cove
ry
0
30
60
90
Control Washing
**
Figure 5.20. Following exposure of spinal cord neuronal networks to AZA1, networks were perfused with control medium and recovery in mean spikes rates (mean ± SD, n = 4) were monitored. The inhibitory effect of AZA1 was only partially reversible after washing the network with HEPES buffered medium for at least 4 hr. Asterisk (**) represent a significant (p < 0.01) change relative to the control.
Inhibition of the GABA neurotransmitter pathways by receptor inhibition enhanced neuronal activity by ca. 40% as demonstrated by the increase in mean spike rate (Figure 5.21A). This result is in agreement with previously published observations for a typical bicuculine effect. Introduction of 2 nM AZA1, the calculated IC50 (see above), irreversibly inhibited bioelectrical activity of spinal cord networks to 54 ± 13% (mean ± SD, n = 4) from the original baseline (see Figure 5.18 or Figure 5.20B). However, the effect of same amount of AZA1 (2 nM) in the presence of bicuculine induced almost complete inhibition to 6.5 ± 3.5% (mean ± SD, n = 2). The difference between the effects in the presence and absence of bicuculine were significant (**p < 0.01). Treatment of networks with 5 µM bicuculine after their exposure to 10 nM AZA1 did not cause any significant changes in neuronal activity (data not shown).

5. Mechanisms underlying the Toxicity of AZAs _________________________________________________________________________________________
72
Figure 5.21. Effect of pre-treatment with bicuculine, a GABA receptor inhibitor, on AZA1 induced inhibition in spinal cord neuronal networks. (A) Representative recording trace of mean spike rates after introduction of bicuculine (5 µM) and AZA1 (2 nM). Lines represent exposure periods for each exposure treatment. (B) Inhibition of network spike rates (mean ± SD, n 3) due to exposure of AZA1 alone versus AZA1 exposed following bicuculine pre-treatment.
5.1.7.2. Whole-cell patch clamp recordings following exposure to AZA1 Whole-cell patch clamp experiments were conducted on spinal cord neurons. Patch pipettes were pulled with a Narishige PP-83 two-stage puller and heat-polished with a CPM-2 microforge to a resistance of 5-10 MΩ when filled with the pipette solution. An Axopatch 200B patch-clamp amplifier coupled with pClamp data acquisition software was used for recordings. Signals were filtered at 5 kHz with the patch amplifier’s built-in four pole, Bessel low-pass filter and digitized at 10 kHz. Whole cell currents were measured using 75 ms step depolarization from a holding potential of –80 mV. Ohmic leak currents were subtracted using the P/N4 leak subtraction of pClamp. For calcium current measurements, 1 M tetrodotoxin (TTX) was added to the bath to inhibit sodium currents. Evoked sodium currents were measured in two neurons before and four minutes after addition of 10 nM AZA1 in MeOH. No significant changes were noted in the sodium currents evoked from a resting potential of –80 mV to potentials ranging from –60 mV to 70 mV. Results were identical to two control experiments where only the MeOH carrier was added to the neurons (Figure 5.22A). Because of significant calcium current rundown in the neurons, the effects of AZA1 on voltage-gated calcium currents was determined by comparing the mean peak calcium current densities between 8 cells treated with 10 nM AZA1 to 8 cells treated only with the MeOH carrier (Figure 5.22B). The results were a change in current density (mean ± SD, n = 8) of -20.4 ± 1.6 pA/pF for control versus -15.7 ± 2.4 pA/pF for AZA1 treated cells. There was no significant difference (p = 0.127) as determined by Student’s t-test. These findings are not conclusive due to the small sample size owing to limited AZA1 availability; however, they suggest that the actions of AZA1 noted on the neuronal networks were likely not due to effects on either the voltage-gated sodium or calcium channels. Further studies are needed to confirm that AZA1 does not modulate these channels.
Mea
n sp
ike
rate
(% o
f con
trol)
0
30
60
90
120
Time (min)
0 20 40 60 80 100 120 140
Nor
mal
ized
mea
n sp
ike
rate
0.0
0.5
1.0
1.5
2.0 Wash5 µµµµM Bicuculine
2 nM AZA
Control 2 nM AZA-1 Bicuculine+ 2 nM AZA-1
**
A B
Mea
n sp
ike
rate
(% o
f con
trol)
0
30
60
90
120
Time (min)
0 20 40 60 80 100 120 140
Nor
mal
ized
mea
n sp
ike
rate
0.0
0.5
1.0
1.5
2.0 Wash5 µµµµM Bicuculine
2 nM AZA
Control 2 nM AZA-1 Bicuculine+ 2 nM AZA-1
**
A B

5. Mechanisms underlying the Toxicity of AZAs _________________________________________________________________________________________
73
Figure 5.22. Effect of AZA1 on voltage-gated sodium (A) and calcium (B) currents in murine spinal cord neurons. (A) There were no significant changes in sodium current (mean ± SD) 4 minutes after addition of either 0.01% MeOH (vehicle) (n=3) or 10 nM AZA1 (n=2). (B) No significant change in calcium current densities (mean ± SD) were found when comparing results from 8 control (, dashed line) neurons treated with 0.01% MeOH (vehicle) and 8 neurons exposed to 10 nM AZA1(, solid line).
Eliminating the involvement of voltage-gated channels in AZA1 action on bioelectrical activity raises questions about possible role of various neurotransmitter systems and their receptors. Spinal cord tissue is dense with glutamate and GABA receptors that play roles in neuronal activity. In fact, these data show that blocking the GABA neurotransmitter system by bicuculine not only altered the concentration-dependent response characteristics of AZA1, but also caused complete irreversibility of mean spike rates. However, we cannot rule out the possibility that irreversibility characteristics of AZA1 are associated with neuronal death. Although more studies are needed to determine the role of GABA neurotransmission pathways in AZA1 toxicity, our findings suggest that GABA receptors could play an important neuroprotective role during AZA1 intoxication. 5.1.8. Teratogenic effects in fish The aim of these experiments was to evaluate the possible teratogenic activity of AZA1 using a well-established finfish model system. Six to eight hr post fertilization (gastrula), healthy Japanese medaka (Oryzia latipes) eggs were selected for microinjection. Micropipettes were set in a three dimensional manipulator and front loaded with triolein oil vehicle by means of a nitrogen gas pico-injector. All injections were carried out and visualized with the aid of a stereomicroscope with an ocular micrometer, as was development of the fish embryos. Digital images were captured using a RGB autoimagecam. After injection, each egg was transferred to one well in a sterile 24-well plate containing Yamamoto’s solution. Egg plates were maintained at 25 ºC under the same light regimen as the adult fish. Photomicrographs were taken for both control and treatment embryos and characteristics such as heart rates, hatching success, and viability were recorded.
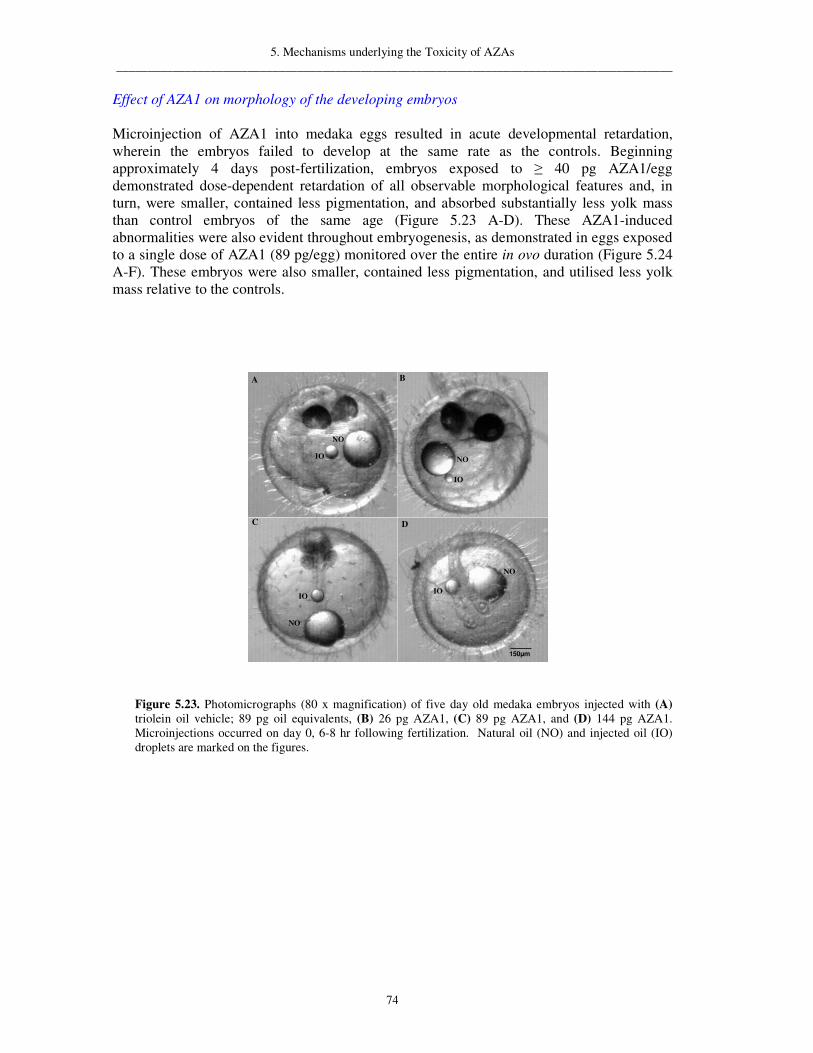
5. Mechanisms underlying the Toxicity of AZAs _________________________________________________________________________________________
74
Effect of AZA1 on morphology of the developing embryos Microinjection of AZA1 into medaka eggs resulted in acute developmental retardation, wherein the embryos failed to develop at the same rate as the controls. Beginning approximately 4 days post-fertilization, embryos exposed to 40 pg AZA1/egg demonstrated dose-dependent retardation of all observable morphological features and, in turn, were smaller, contained less pigmentation, and absorbed substantially less yolk mass than control embryos of the same age (Figure 5.23 A-D). These AZA1-induced abnormalities were also evident throughout embryogenesis, as demonstrated in eggs exposed to a single dose of AZA1 (89 pg/egg) monitored over the entire in ovo duration (Figure 5.24 A-F). These embryos were also smaller, contained less pigmentation, and utilised less yolk mass relative to the controls.
IO
NO
IO
NO
IO
NO
150µm
IO
NO
BA
C D
IO
NO
IO
NO
IO
NO
150µm
IO
NO
BA
C D
Figure 5.23. Photomicrographs (80 x magnification) of five day old medaka embryos injected with (A) triolein oil vehicle; 89 pg oil equivalents, (B) 26 pg AZA1, (C) 89 pg AZA1, and (D) 144 pg AZA1. Microinjections occurred on day 0, 6-8 hr following fertilization. Natural oil (NO) and injected oil (IO) droplets are marked on the figures.

5. Mechanisms underlying the Toxicity of AZAs _________________________________________________________________________________________
75
150µm
A
C D
B
E F
Day 3
Day 5
Day 7
Control AZA-1
150µm
A
C D
B
E F
Day 3
Day 5
Day 7
150µm150µm
A
C D
B
E F
Day 3
Day 5
Day 7
Control AZA-1
Figure 5.24. Photomicrographs (80 x magnification) of developing medaka embryos injected with AZA1. Embryos were injected with 89 pg equivalents of triolein oil (A, C, E) or 89 pg AZA1 (B, D, F) and photomicrographs were taken on day 3 (A, B), day 5 (C,D), and day 7 (E,F). Microinjections occurred on day 0, 6-8 hr following fertilization. In all frames the smaller droplet is the injected oil and the larger droplet is the natural oil.
Effect of AZA1 on developing cardiac function and hatching success in medaka embryos
Microinjections exceeding 20 pg AZA1/egg elicited several observable adverse cardiac effects in the developing Japanese medaka embryos. In healthy embryos, a heart beat is visible by the end of day 3 post-fertilization (PF). Prior to the normal hatching time (9-10 days PF) embryos dosed with 1-40 pg AZA1/egg were not different from control embryos (p = 0.06); however, microinjections of 40 pg AZA1/egg showed significantly lower heart rates (bradycardia) on days 3, 5, 7 and 9 in a dose-dependent manner (Figure 5.25). As doses increased, heart rates were depressed wherein embryos exposed to the highest doses never obtained heart rates greater than 75 beats/min during the first 9 days.
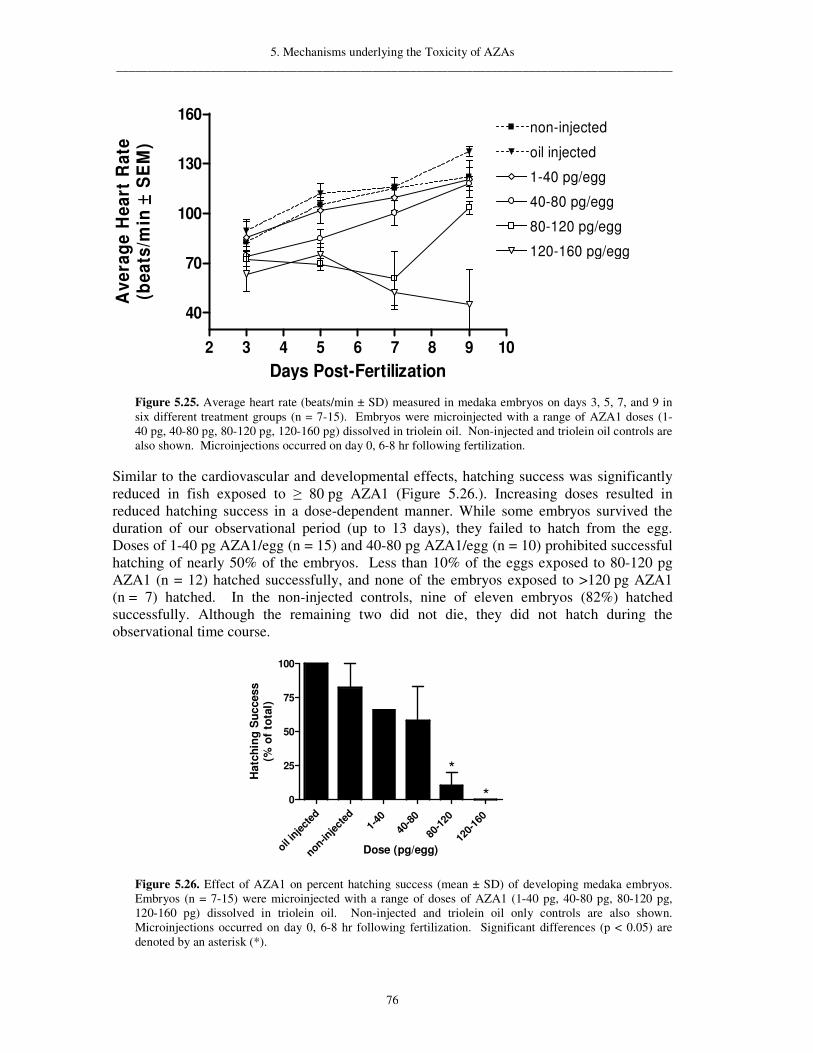
5. Mechanisms underlying the Toxicity of AZAs _________________________________________________________________________________________
76
2 3 4 5 6 7 8 9 10
40
70
100
130
160non-injected
oil injected
1-40 pg/egg
40-80 pg/egg
80-120 pg/egg
120-160 pg/egg
Days Post-Fertilization
Ave
rage
Hea
rt R
ate
(bea
ts/m
in±± ±±
SE
M)
Figure 5.25. Average heart rate (beats/min ± SD) measured in medaka embryos on days 3, 5, 7, and 9 in six different treatment groups (n = 7-15). Embryos were microinjected with a range of AZA1 doses (1-40 pg, 40-80 pg, 80-120 pg, 120-160 pg) dissolved in triolein oil. Non-injected and triolein oil controls are also shown. Microinjections occurred on day 0, 6-8 hr following fertilization.
Similar to the cardiovascular and developmental effects, hatching success was significantly reduced in fish exposed to 80 pg AZA1 (Figure 5.26.). Increasing doses resulted in reduced hatching success in a dose-dependent manner. While some embryos survived the duration of our observational period (up to 13 days), they failed to hatch from the egg. Doses of 1-40 pg AZA1/egg (n = 15) and 40-80 pg AZA1/egg (n = 10) prohibited successful hatching of nearly 50% of the embryos. Less than 10% of the eggs exposed to 80-120 pg AZA1 (n = 12) hatched successfully, and none of the embryos exposed to >120 pg AZA1 (n = 7) hatched. In the non-injected controls, nine of eleven embryos (82%) hatched successfully. Although the remaining two did not die, they did not hatch during the observational time course.
oil injec
ted
non-injec
ted 1-40
40-8
0
80-12
0
120-1
60
0
25
50
75
100
*
*
Dose (pg/egg)
Hat
chin
g S
ucce
ss(%
of
tota
l)
Figure 5.26. Effect of AZA1 on percent hatching success (mean ± SD) of developing medaka embryos. Embryos (n = 7-15) were microinjected with a range of doses of AZA1 (1-40 pg, 40-80 pg, 80-120 pg, 120-160 pg) dissolved in triolein oil. Non-injected and triolein oil only controls are also shown. Microinjections occurred on day 0, 6-8 hr following fertilization. Significant differences (p < 0.05) are denoted by an asterisk (*).

5. Mechanisms underlying the Toxicity of AZAs _________________________________________________________________________________________
77
These studies demonstrate that AZA1 is a potent teratogen to finfish. Our findings suggest that should AZA accumulation and transfer occur in marine fishes, these toxins could induce teratogenic effects and in turn detrimentally affect fecundity and population fitness of species exposed to AZAs. 5.1.9. Protein phosphatase 2A inhibition Some of the recent AZA in vivo pathophysiology data using mouse exposures suggest gastrointestinal alterations somewhat characteristic of DSP. However, in contrast to the DSP toxins, initial investigations using a PP1-based, enzyme inhibition assay indicate that AZA does not inhibit ser/thr protein phosphatases (Flanagan et al., 2001). Nevertheless, PP2A is approximately 100-fold more sensitive than PP1 to inhibition by DSP toxins and, since AZA levels were not quantified by Flanagan et al. (2001), the ability to inhibit PP2A cannot be ruled out. Additional studies of protein phosphatase inhibition by AZA are therefore still warranted to evaluate the potential for this toxin to differentially inhibit PP1 and PP2A, as is the case with DSP toxins. To determine if AZA1 has the ability to inhibit PP2A, a fluorometric microplate assay was conducted. Briefly, this assay (modified from Vieytes et al., 1997) is based on the kinetic ability of PP2A to metabolize DiFMUP into a fluorescent compound. In other words, if the activity of PP2A is not inhibited by the test compound / toxin, fluorescence of the dephosphorylated DiFMUP will increase. OA was used as the assay calibration standard and served as a positive control. OA yielded an EC50 value of 1.5 nM. In addition, an internal QC standard of 1 nM OA was detected at 0.98 nM. Over the same concentration range, and at concentrations that well exceeded the EC50 values for all cell types tested (see above), AZA1 was assessed for its ability to inhibit PP2A (Figure 5.27). Inhibition of PP2A activity by AZA1 was not observed at any concentration tested. It should be noted that the slightly reduced fluorescence values for the AZA1 treatments are likely caused by the presence of small amounts of MeOH in the assay.
control0
10000
20000
30000
40000
Okadaic acidAZA-1
-11 -10 -9 -8
log [OA or AZA-1] (M)
Rel
ativ
e Fl
uore
scen
t U
nits
Figure 5.27. Effect of AZA1 and OA on PP2A activity. RFU = relative fluorescence units of DiFMUP.

5. Mechanisms underlying the Toxicity of AZAs _________________________________________________________________________________________
78
5.2. In vitro gene expression studies 5.2.1. Gene microarray studies on Caco-2 cells The Affymetrix GeneChip Human Genome U133A 2.0 Array is a single gene array capable of analysing the expression level of 18,400 transcripts and variants, including 14,500 well-characterised human genes. Caco-2 cells were exposed to a concentration of 10 nM AZA1 for 24 and 48 hr, RNA was extracted and processed for analysis on the genechips. The data was analysed using bioinformatic approaches. This enabled us to examine changes in gene expression after exposure to AZA1 (Figures 5.28 and 5.29). Our current analysis has identified 132 genes significantly upregulated and 15 downregulated at 24 hr following exposure to AZA, and 209 genes upregulated and 18 downregulated at 48 hr. Further bioinformatics analysis has allowed us to group these genes into the most significant cellular roles.
Differentiation
Protein synthesis
RNA processing/modification
Cell stress
Amino-acid metabolism
Pol II transcription
Chromatin/chromosomestructureOther metabolism
Protein degradation
Protein translocation
Other
Figure 5.28. Significantly upregulated genes with cellular roles after exposure to AZA1 for 24 hr in Caco-2 cells.

5. Mechanisms underlying the Toxicity of AZAs _________________________________________________________________________________________
79
Table 5.3. Differentially expressed genes identified in Caco-2 cells following 24 hr AZA1 exposure. Differentiation
Gene Title Gene Symbol Fold change basic helix-loop-helix domain containing, class B, 2 BHLHB2 4.84 epithelial membrane protein 1 EMP1 9.03 ephrin-B2 EFNB2 7.52 aryl hydrocarbon receptor AHR 2.82 epithelial membrane protein 3 EMP3 3.34 dual specificity phosphatase 6 DUSP6 15.87
Protein synthesis
Gene Title Gene Symbol Fold change tryptophanyl-tRNA synthetase WARS 2.68 glycyl-tRNA synthetase GARS 2.81 cysteinyl-tRNA synthetase CARS 2.80 methionine-tRNA synthetase MARS 2.57
RNA processing/modification
Gene Title Gene Symbol Fold change aryl hydrocarbon receptor AHR 2.82 DNA-damage-inducible transcript 3 DDIT3 2.33 dual specificity phosphatase 5 DUSP5 8.98
Cell stress
Gene Title Gene Symbol Fold change arginase, type II ARG2 2.79 cystathionase (cystathionine gamma-lyase) CTH 3.82
Amino-acid metabolism
Gene Title Gene Symbol Fold change v-ets erythroblastosis virus E26 oncogene homolog 2 (avian)
ETS2 3.25
aryl hydrocarbon receptor AHR 2.82 transcription factor AP-2 gamma (activating enhancer binding protein 2 gamma)
TFAP2C 2.94
v-fos FBJ murine osteosarcoma viral oncogene homolog FOS 6.39 v-maf musculoaponeurotic fibrosarcoma oncogene homolog F (avian)
MAFF 6.66
Protein degradation
Gene Title Gene Symbol Fold change matrix metallopeptidase 1 (interstitial collagenase) MMP1 5.79
Protein translocation
Gene Title Gene Symbol Fold change low density lipoprotein receptor (familial hypercholesterolemia)
LDLR 3.33

5. Mechanisms underlying the Toxicity of AZAs _________________________________________________________________________________________
80
Cell stress
Cell structure
Protein synthesis
Protein translocation
Amino-acid metabolism
RNA processing/modification
Differentiation
Pol II transcription
Nuclear-cytoplasmic transport
Chromatin/chromosomestructurePol I transcription
Protein degradation
DNA repair
Figure 5.29. Significantly upregulated genes with cellular roles after exposure to AZA1 for 48 hr in Caco-2 cells.
Table 5.4. Differentially expressed genes identified in Caco-2 cells following 48 hr AZA1 exposure. Cell stress
Gene Title Gene Symbol Fold change hypoxia up-regulated 1 HYOU1 2.38 stress-associated endoplasmic reticulum protein 1 SERP1 2.02 dual specificity phosphatase 1 DUSP1 2.58 stress 70 protein chaperone, microsome-associated, 60kDa STCH 2.91 DnaJ (Hsp40) homolog, subfamily B, member 4 DNAJB4 2.01 activating transcription factor 6 ATF6 2.11 growth arrest and DNA-damage-inducible, beta GADD45B 2.28 DNA-damage-inducible transcript 3 DDIT3 2.25
Cell structure
Gene Title Gene Symbol Fold change nebulette NEBL 3.10 keratin 10 (epidermolytic hyperkeratosis; keratosis palmaris et plantaris)
KRT10 2.54
filamin C, gamma (actin binding protein 280) FLNC 3.17 rho/rac guanine nucleotide exchange factor (GEF) 2 ARHGEF2 2.04 outer dense fiber of sperm tails 2 ODF2 2.07 Rho family GTPase 3 RND3 2.12 peripherin PRPH 2.13 tubulin, beta polypeptide paralog TUBB-
PARALOG 2.26
Protein synthesis
Gene Title Gene Symbol Fold change tryptophanyl-tRNA synthetase WARS 3.39 glutamyl-prolyl-tRNA synthetase EPRS 2.10 isoleucine-tRNA synthetase IARS 2.03 glycyl-tRNA synthetase GARS 2.25 eukaryotic translation initiation factor 2-alpha kinase 3 EIF2AK3 3.20
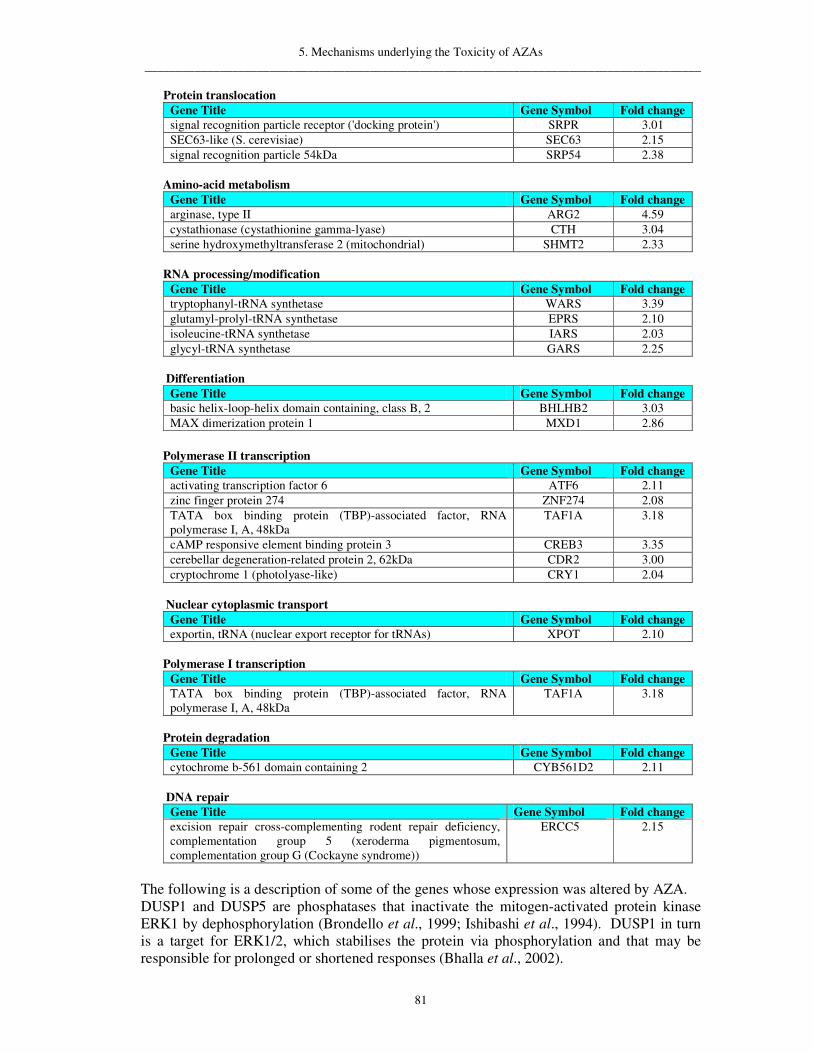
5. Mechanisms underlying the Toxicity of AZAs _________________________________________________________________________________________
81
Protein translocation
Gene Title Gene Symbol Fold change signal recognition particle receptor ('docking protein') SRPR 3.01 SEC63-like (S. cerevisiae) SEC63 2.15 signal recognition particle 54kDa SRP54 2.38
Amino-acid metabolism
Gene Title Gene Symbol Fold change arginase, type II ARG2 4.59 cystathionase (cystathionine gamma-lyase) CTH 3.04 serine hydroxymethyltransferase 2 (mitochondrial) SHMT2 2.33
RNA processing/modification
Gene Title Gene Symbol Fold change tryptophanyl-tRNA synthetase WARS 3.39 glutamyl-prolyl-tRNA synthetase EPRS 2.10 isoleucine-tRNA synthetase IARS 2.03 glycyl-tRNA synthetase GARS 2.25
Differentiation
Gene Title Gene Symbol Fold change basic helix-loop-helix domain containing, class B, 2 BHLHB2 3.03 MAX dimerization protein 1 MXD1 2.86
Polymerase II transcription
Gene Title Gene Symbol Fold change activating transcription factor 6 ATF6 2.11 zinc finger protein 274 ZNF274 2.08 TATA box binding protein (TBP)-associated factor, RNA polymerase I, A, 48kDa
TAF1A 3.18
cAMP responsive element binding protein 3 CREB3 3.35 cerebellar degeneration-related protein 2, 62kDa CDR2 3.00 cryptochrome 1 (photolyase-like) CRY1 2.04
Nuclear cytoplasmic transport
Gene Title Gene Symbol Fold change exportin, tRNA (nuclear export receptor for tRNAs) XPOT 2.10
Polymerase I transcription
Gene Title Gene Symbol Fold change TATA box binding protein (TBP)-associated factor, RNA polymerase I, A, 48kDa
TAF1A 3.18
Protein degradation
Gene Title Gene Symbol Fold change cytochrome b-561 domain containing 2 CYB561D2 2.11
DNA repair
Gene Title Gene Symbol Fold change excision repair cross-complementing rodent repair deficiency, complementation group 5 (xeroderma pigmentosum, complementation group G (Cockayne syndrome))
ERCC5 2.15
The following is a description of some of the genes whose expression was altered by AZA. DUSP1 and DUSP5 are phosphatases that inactivate the mitogen-activated protein kinase ERK1 by dephosphorylation (Brondello et al., 1999; Ishibashi et al., 1994). DUSP1 in turn is a target for ERK1/2, which stabilises the protein via phosphorylation and that may be responsible for prolonged or shortened responses (Bhalla et al., 2002).

5. Mechanisms underlying the Toxicity of AZAs _________________________________________________________________________________________
82
DUSP6 prevented both the activation and phosphorylation of ERK2 by mitogens (Muda et al., 1996). These dual specificity phosphatases inactivate MAPK by dephosphorylating phosphotyrosine and phosphothreonine residues (Muda et al., 1996). Epithelial membrane proteins (EMP) EMP1 and EMP3 are believed to be involved in cell-cell interaction and cellular proliferation (Ben Porath & Benvensity, 1996). Differential expression of these proteins have been associated with gastric cancer (Hippo et al., 2001). EMP1 is believed to confer resistance to gefitinib (a molecule that competes for the binding site on the epidermal growth factor receptor (EGFR)) chemotherapy in lung cancer and suggests a cross talk between EMP1 and the EGFR signalling pathway (Jain et al., 2005). Matrix metalloproteinases are involved in the breakdown of extracellular matrix proteins in normal physiological processes (Nagase et al., 1992). This is essential for remodelling that occurs under normal conditions and the diseased process. It was observed that genes involved in fatty acid and cholesterol synthesis were altered Caco-2 cells after exposure to AZA1. Low density lipoprotein receptor (LDLR) is a cell surface receptor important in cholesterol homeostasis. LDL binds to the receptor and is endocytosed where upon the protein is then degraded making the cholesterol available for repression of microsomal enzyme 3-hydroxy-3-methylglutaryl coenzyme A (HMG CoA) reductase (Brown & Goldstein, 1974). Very low density lipoprotein receptor (VLDLR) was also upregulated at 48 hr. Apolipoprotein H (APOH) another gene involved in this process was downregulated (9.26 fold). Presence of apoH has been reported to decrease cellular accumulation of cholesterol by decreasing its influx and increasing its efflux from cells (Lin et al., 2001). This has been suggested to play an important role in preventing atherosclerosis.
One observation of note was the number of genes significantly altered in response to AZA exposure that are associated with wound repair. Ephrin ligands and Eph receptors are found in epithelial cells and have been associated with cell-cell interactions. EFNB2 (Ephrin B2) is a ligand for the EphB receptor, as part of a bidirectional cell-cell contact signalling system that directs epithelial cell movements in development. It has been reported to contribute to accelerated epithelial wound healing in the intestine (Hafner et al., 2005). Another report found an association between ephrin receptor A2 (EphA2) (upregulated 6.3 fold at 24 hr) and claudin-4 (Tanaka et al., 2005). This study observed that EphA2 modulated the localisation and function of claudin-4. By attenuating the interaction of claudin-4 with ZO-1 there was decreased cell-cell contact coupled with increased paracellular permeability. With EphA2 exhibiting a greater than six-fold increase in expression after exposure to AZA1 in our model it is possible that this may contribute to the increased permeability observed. This finding, coupled with the observed changes in claudin protein levels, suggests that ephrin could play an important role in mediating some of the AZA1 induced alterations. This provides a clear linkage between the gene microarray findings and the TEER findings. Vascular endothelial growth factor (VEGF) is a mitogen for endothelial cells capable of promoting angiogenesis, this gene was upregulated after exposure to AZA1 at 24 and 48 hr (2.6 and 2.1 fold respectively). It is also involved in embryogenesis, tumour growth and wound healing (Roy et al., 2006). Hypoxia up-regulated 1 (HYOU1/ORP150) was demonstrated to enhance wound healing while suppression of this gene delayed the reparative process (Ozawa et al., 2001). In addition, Ozawa and colleagues also observed that HYOU1 colocalised with VEGF, with overexpression of HYOU1 being associated with increased secretion of VEGF. HYOU1 is an endoplasmic reticulum (ER) stress protein that serves as a protein chaperone under normal conditions, targeting defective proteins for

5. Mechanisms underlying the Toxicity of AZAs _________________________________________________________________________________________
83
degradations (Inagi et al., 2005). With HYOU1 and VEGF upregulated after exposure to AZA1 the activation of additional reparative processes have been further highlighted.
The evidence for the ability of AZA1 to promote tumour formation or act as a carcinogenic agent is inconclusive. Altered expression of different genes associated with cancer remission and progression have been observed. In addition, a review of current literature suggests that dysregulation of these genes on cancer progression occurs in a tissue-specific manner. ERBB2 is an oncogene, overexpression of which has been implicated in increased taxol-resistance in breast cancer (Yu et al., 1998). We observed a decrease in the expression of this gene. Another example is the gene s100P which we found to be upregulated. There is reported to be a positive association between overexpression of S100P and high-risk lesions for breast cancer (Schor et al., 2006). The gene, plasminogen activator, urokinase receptor (PLAUR/uPAR) (3.94 fold upregulation at 24 hr) has been associated with increased metastasis in gastrointestinal cancer (Sier et al., 1993). Interaction of this receptor with urokinase-type plasminogen activation (uPA) has been highlighted as an important marker of metastasis and invasion. Kruppel-like factor 4 (KLF4) is a transcription factor that was upregulated at 24 hr after exposure to AZA1, evidence has been found that indicates that this gene is responsible for the regulation of uPAR and its synthesis at the luminal surface epithelial cells of the colon (Wang et al., 2004). KLF4 has also been shown to attenuate tumour cell growth in colorectal cancer and a decrease in KLF4 transcript levels was observed compared to paired normal colonic tissues (Zhao et al., 2004). 5.2.2. Gene chip studies on lymphocyte T cells To aid in the determination of the mechanism of action of AZA1, the effects of AZA1 on Jurkat lymphocyte T cells gene expression was assessed. For these experiments, we employed Agilent’s whole human genome expression microarray where cells were continuously exposed to AZA1 (10 nM) over a 24 hr period and differential expression for >37000 genes was assessed at three time points (1, 4, 24 hr). Gene expression levels were compared to basal gene expression in control cells exposed to the equivalent amounts of the MeOHic vehicle at the same time points. Rigorous filtering and mining of the data permitted identification and analysis of signalling pathways that were significantly affected by AZA1 exposure. Transcript levels for 20 genes were confirmed via quantitative-PCR.

5. Mechanisms underlying the Toxicity of AZAs _________________________________________________________________________________________
84
Table 5.5. Known differentially expressed genes in lymphocyte T cells induced by AZA1 (10 nM) exposure for 1 hr. Ratio data are the ratio of expression relative to controls.
1 hr Sequence Description Ratio P-value
Neuronatin (NNAT), transcript variant 1 -1.01 1.8E-06 Yolk sac permease-like molecule 1 (YSPL-1) -0.99 1.0E-04 Cell adhesion molecule L1 (CAM-L1) -0.97 1.6E-04 Transcription factor 7-like 2 (T-cell specific, HMG-box) (TCF7L2) -0.95 5.2E-04 Alpha 1,4-galactosyltransferase (A4GALT) -0.94 8.7E-04 Tissue plasminogen activator -0.91 1.0E-05 Melanoma inhibitory activity 2 (MIA2) -0.90 4.9E-04 6-phosphofructo-2-kinase/fructose-2,6-bisphosphatase (PFKFB3) -0.89 3.1E-06 CBP/MORF chimaeric fusion protein -0.87 8.9E-04 Cytochrome c oxidase subunit IV isoform 2 precursor (COX IV) -0.85 3.9E-04 Claudin 5 (transmembrane protein) (CLDN5) -0.79 1.3E-07 Sodium potassium ATPase (gamma subunit) -0.75 5.7E-04 RNA binding motif protein 21 (RBM21) -0.72 7.0E-04 Glucagon receptor (GCGR) -0.67 8.0E-05 ADP-ribosylation factor-like 7 (ARL7) -0.67 1.2E-04 Frizzled homolog 9 (Drosophila) (FZD9) -0.65 5.0E-05 S100 calcium binding protein A4 (S100A4) -0.64 4.2E-04
Table 5.6. Known differentially expressed genes in lymphocyte T cells induced by AZA1 (10 nM) exposure for 4 hr. Ratio data are the ratio of expression relative to controls.
4 hr Sequence Description Ratio P-value
3-hydroxy-3-methylglutaryl coenzyme A synthase (HUM3H3M) 2.21 <1.0E- 45 3-Hydroxy-3-methylglutaryl-Coenzyme A synthase 1 (HMGCS1) 1.70 1.1E-10 Sterol-C4-methyl oxidase-like (SC4MOL) 1.67 3.7E-18 3-Hydroxy-3-methylglutaryl-Coenzyme A reductase (HMGCR) 1.64 <1.0E-45 Isopentenyl-diphosphate delta isomerase (IDI1) 1.53 2.9E-11 Lanosterol synthase (LSS) 1.50 5.1E-18 Low density lipoprotein receptor (LDLR) 1.38 <1.0E-45 Squalene epoxidase (SQLE) 1.36 8.8E-34 7-Dehydrocholesterol reductase (DHCR7) 1.28 8.0E-17 RAB33A, member of RAS oncogene family (RAB33A) 1.24 1.2E-19 Hypothetical protein MAC30 1.20 4.3E-15 5,10-Methylenetetrahydrofolate reductase (NADPH) 1.15 2.3E-10 Hydroxysteroid (17-beta) dehydrogenase 7 (HSD17B7) 1.12 1.2E-08 Hypothetical protein MAC30 (MAC30) 1.08 1.2E-10 Chloride channel 6 (CLCN6), transcript variant ClC-6a 1.08 5.4E-12 Acetyl-Coenzyme A acetyltransferase 2 (ACAT2) 1.03 8.3E-38 24-Dehydrocholesterol reductase (DHCR24) 1.01 1.0E-07 START domain containing 4, sterol regulated (STARD4) 1.00 6.1E-09 Stearoyl-CoA desaturase (delta-9-desaturase) (SCD) 0.98 2.1E-08 Fatty acid desaturase 1 (FADS1) 0.86 9.5E-26 MCM3 minichromosome maintenance deficient 3 (S. cerevisiae) 0.82 1.3E-07 Spondin 2, extracellular matrix protein (SPON2) 0.76 8.3E-08 Farnesyl-diphosphate farnesyltransferase 1 (FDFT1) 0.72 1.6E-07 Cyclin G2 (CCNG2) 0.70 1.7E-07 C/EBP-induced protein (LOC81558) 0.65 2.3E-08

5. Mechanisms underlying the Toxicity of AZAs _________________________________________________________________________________________
85
Table 5.7. Known differentially expressed genes in lymphocyte T cells induced by AZA1 (10 nM) exposure for 24 hr. Ratio data are the ratio of expression relative to controls.
24 hr Sequence Description Ratio P-value
Serine/threonine kinase 11 interacting protein (STK11IP) 3.26 2.8E-45 Lanosterol synthase (LSS) 3.06 <1.0E-45 Acetyl-Coenzyme A synthetase 2 (ADP forming) (ACAS2) 3.05 <1.0E-45 Hypothetical protein MAC30 2.80 <1.0E-45 Hypothetical protein MAC30 (MAC30) 2.73 <1.0E-45 3-Hydroxy-3-methylglutaryl-Coenzyme A reductase (HMGCR) 2.63 2.2E-43 3-Hydroxy-3-methylglutaryl-Coenzyme A synthase 1 (HMGCS1) 2.63 <1.0E-45 Isopentenyl-diphosphate delta isomerase (IDI1) 2.60 <1.0E-45 Acetyl CoA transferase-like protein 2.58 <1.0E-45 Acetyl-Coenzyme A acetyltransferase 2 (ACAT2) 2.50 <1.0E-45 24-Dehydrocholesterol reductase (DHCR24) 2.42 <1.0E-45 Insulin induced gene 1 (INSIG1), transcript variant 1 2.35 <1.0E-45 Sterol-C4-methyl oxidase-like (SC4MOL) 2.30 <1.0E-45 Glucan (1,4-alpha-), branching enzyme 1 (GBE1) 2.28 1.2E-41 Sialidase 1 (lysosomal sialidase) (NEU1) 2.27 9.0E-44 Farnesyl diphosphate synthase (FDPS) 2.27 <1.0E-45 Squalene epoxidase (SQLE) 2.04 2.0E-43 Mevalonate kinase (MVK) 2.04 <1.0E-45 Chitinase 3-like 2 (CHI3L2) 1.91 <1.0E-45 5,10-Methylenetetrahydrofolate reductase (NADPH) 1.89 <1.0E-45 Emopamil binding protein (sterol isomerase) (EBP) 1.85 <1.0E-45 Transmembrane 7 superfamily member 2 (TM7SF2) 1.83 <1.0E-45 Dihydropyrimidinase-like 2 (DPYSL2) 1.81 <1.0E-45 Cyclin G2 (CCNG2) 1.78 <1.0E-45 Similar to delta-6 fatty acid desaturase 1.70 <1.0E-45 Fatty acid desaturase 2 (FADS2) 1.64 <1.0E-45 Niemann-Pick disease, type C2 (NPC2) 1.64 <1.0E-45 Cytoplasmic FMR1 interacting protein 2 (CYFIP2) 1.59 <1.0E-45 Chloride channel 6 (CLCN6), transcript variant ClC-6a 1.34 3.9E-44
Early (1 hr) responding genes consisted of known T cell genes (TCF7L2), membrane proteins (CLDN5, NNAT), receptors (GCGR, FZD9), and inflammatory genes (S100A4, COX IV) (Table 5.3). At 4 hr, responding genes included transcription factors (RAB33A) and cell growth genes (CCNG2) in addition to 16 genes involved in fatty acid and cholesterol synthesis (i.e. LDLR, HMGCR, SQLE, LSS, FADS1) (Table 5.4). Similarly, at 24 hr, 17 of the top 35 signature genes were involved in fatty acid and cholesterol synthesis (i.e. HMGCR, SQLE, FADS2, DHCR24) as well as genes for ion channels (CLCN6) and kinase interacting proteins (STK11IP) (Table 5.5). Use of Gene Map Annotator and Pathway Profiler (GenMAPP) software further identified and confirmed cell signalling effects targeted toward cholesterol biosynthesis pathways, particularly at the 4 and 24 hr time points (Figure 5.29).

5. Mechanisms underlying the Toxicity of AZAs _________________________________________________________________________________________
86
Figure 5.30. Differential gene expression of the cholesterol biosynthesis pathway in human lymphocyte T cells exposed to AZA1 (10 nM) for 24 hr. Enzyme names are abbreviated and illustrated in italics and bolded.
Of the most significant genes identified for the 4 and 24 hr time points, there are 16 genes in common, many of which are known to be involved in fatty acid and/or cholesterol synthesis. For annotated genes of known function, there are 16 fatty acid/cholesterol synthesis genes up regulated at 4 hr, and 17 similar functioning genes up regulated at 24 hr. This remarkable clustering of genes of similar function and regulation prompted further illustration of this biological pathway in detail (Figure 5.30). In a time-dependent trend, at least one isoform of nearly all the genes necessary to synthesize cholesterol are significantly up regulated at 4 and 24 hr. The lone exception is the fourth step of the synthesis where phosphomevalonate kinase (PMVK; NM_006556) catalyses the phosphorylation of mevelonate-5-P into mevalonate-5-PP. Gene expression and enzymatic activity of PMVK has been shown to correspond with cellular sterol levels (Olivier et al., 1999), however, PMVK is not differentially expressed at any of the time points assessed in this study. With continued AZA1 exposure, dramatic and coordinated up regulation of nearly all cholesterol and fatty acid synthesis genes is observed. While this study has not identified the exact mechanism of action, it is clear that in lymphocyte cells, a sensitive cell/tissue type identified from in vivo studies (Ito et al., 2000; Ito et al., 2002; Ito et al., 2006), specific and related, transcriptionally-controlled pathways are differentially expressed by AZA1 in a time-dependent manner. Not only will these data lead future hypothesis driven investigations for determining the exact molecular target of AZA1, but the data can also be used for the development of exposure biomarkers and for an assessment of the potential therapeutic properties of AZA1. 5.2.3. Gene expression summary Bioinformatic analysis has highlighted many biological pathways from our gene microarray data. Some of those identified are reported to be involved in response to stress, growth, differentiation, metabolism and structural integrity. It should be noted that information on the function of many of the genes identified is as yet unknown or of limited availability. Thus patterns of expression may be of more use when functions are identified. Further analysis of these genes and their associated pathways, in combination with hypothesis driven

5. Mechanisms underlying the Toxicity of AZAs _________________________________________________________________________________________
87
experimental studies are necessary to attribute specific mechanisms to AZA1. By defining more clearly the mode of action of AZA1 these studies will aid in the development of alternative in vitro AZA detection assays.
The expression profile generated from the Caco-2 model has highlighted several genes involved in reparative processes after exposure to AZA1. Due to the disruption that AZA1 causes to the intestinal barrier this is unsurprising. Increased wound healing would compensate for damage/disruption to surface gastrointestinal epithelial cells. The increase in EPHA2 gene expression may contribute to the regulation of claudin-4 observed at the protein level affecting the structural integrity of the cell barrier. This observation would correlate well with the findings at the protein level in our Caco-2 cells, where claudin-4 levels are increased. Wound healing requires the reorganisation of cytoskeletal components, this would be reflected in alterations in TEER. It was observed that genes involved in fatty acid and cholesterol synthesis were altered in both Caco-2 and lymphocyte T cells exposed to AZA1. Similar patterns in two different cell models utilising human cells coupled with evidence of fatty changes in mice in vivo (Ito et al., 2000) supports a role for AZA1 in altering fatty acid and cholesterol regulation. 5.3. Design of in vivo studies 5.3.1. Defining the objectives of in vivo studies The primary purpose of in vivo toxicological studies is to assess and evaluate the risk involved in the consumption of potentially harmful marine toxins. The risk of a marine toxin that accumulates in shellfish is determined by studies that establish the intrinsic toxicity of the toxin in addition to evaluating conditions of exposure (acute vs. chronic, route). Risk identification should take into account observations from in vitro systems, accidental human exposures, and in vivo studies. Future AZA studies need to address the lack of data from controlled in vivo studies. The foremost objective for in vivo studies involving AZA should be to establish a NOAEL for AZA1. NOAEL is defined by IUPAC as the greatest concentration or amount of a substance, found by experiment or observation, which causes no detectable adverse alteration of morphology, functional capacity, growth, development, or life span of the target organism under defined conditions of exposure. NOAEL should not be confused with LD50 and AZA congener activity relationships should be established for all available AZA congeners. Secondary objectives to be examined during NOAEL experiments should include pharmacokinetic behaviour of AZA, carcinogenicity observations, and hypothesis-driven mode of action testing. Blood and urine sampling and analysis will aid in determining in vivo rates of metabolism and elimination for the exposed AZA congener, and histological studies may solidify past reports of the carcinogenic potential of AZA1. Additionally, in vivo studies may confirm one or more of the putative modes of action proposed through the use of the gene expression microarray experiments detailed above. 5.3.2. Requirements for in-vivo studies Initially it was planned to carry out detailed comparison and statistically valid NOAEL studies for AZAs using mouse and rat bioassays as indicated in WP6. Consideration was given to designing these studies and a number of discussions on details for these studies took place.
5. Mechanisms underlying the Toxicity of AZAs _________________________________________________________________________________________
88
A key block to proceeding with in vivo studies was the lack of availability of pure AZA. The amount of material required is in the mg range for in vivo studies. A major contibutary factor for in vivo studies was the fact that relatively few outbreaks of AZA poisoning occurred during the period of the project. In addition, major issues and questions arose in terms of the design of possibel in vivo studies. Those involved possible route of administration. Some questions have been raised about gavage as the route for oral administration as gavage itself may have some deleterious effects on the gastrointestinal tract. The mouse bioassay is based on lethality which reflects more on LD50 rather than a NOAEL.
5.4. Synopsis of knowledge gained on AZA toxicology 5.4.1. Cellular functions
• AZA1 does not inhibit protein phosphatase 2A. • All cell types tested to date are sensitive to AZA1-induced cytotoxicity in a time- and
concentration-dependent manner. • Cytotoxicity EC50 values are in the low nM range. • Immune type cells (i.e., lymphocyte T cells; Jurkat cell line) appear to be particularly
sensitive to AZA1. • Exposure of Jurkat cells to AZA1 causes reorganisation in the arrangement of
cellular F-actin and the loss of pseudopodial extensions in these cells as revealed by light and fluorescence microscopy.
• Acute exposure of Jurkat cells to AZA1 is equally cytotoxic as continuous exposure. • A preliminary AZA-Pseudopodial Assay (AZAPA) has been developed to quantify
AZA in shellfish extracts. • AZA1 does not induce apoptosis in Jurkat cells via caspase-3 induction. • AZA1 inhibits spike rates in spinal cord neurons in a concentration-dependent
manner. • No significant effects of AZA1 were observed on voltage-gated sodium and calcium
currents in spinal cord neurons. • Microinjection of AZA1 into medaka fish embryos caused dramatic teratogenic
effects on development, cardiac function, hatching success, and viability. • Gene expression data from 2 laboratories using different cells and different gene
array systems indicate some genes in common affected by AZA. • AZA was very effective in reducing TEER in human gastrointestinal cells at nM
concentrations. • This effect on TEER occurred without producing cell death. • The effect in TEER may have been due to upregulation of a funtional protein
claudin-2 • A dose-dependent effect of AZA on claudin-2 was demonstrated. • Claudin-2 may act as a ‘pore’ in the epithelial cell barrier and thus more claudin-2
implied more leakiness. • AZA appeared to activate a number of signaling pathways including ERK 1/2.

5. Mechanisms underlying the Toxicity of AZAs _________________________________________________________________________________________
89
5.4.2. Genetic interactions Some very interesting and novel findings have been developed from the gene array studies. In the Caco-2 cell line, genes involved in ‘wound healing’ which represents a differentiation from epithelial-cell characterisatics to more mesenchymal-like (epithelial-mesenchymal transition EMT) were upregulated and this finding ties in with the reduction in TEER. Results from the Caco-2 and lymphocytes indicated that genes involved in fatty acid and cholesterol synthesis were also altered and upregulated. 5.4.3. Comparison of in-vitro and in-vivo studies Mainly due to limitations of insufficient amounts of AZA no in vivo studies were carred out in this project. The in vitro studies with the human gastrointestinal cells may well reflect in vivo toxicity. The gene array studies highlighted some interesting genes, which may have counterparts in in vivo studies such as fatty acid and cholesterol and previous reportes of fatty liver in mice treated with AZA. 5.4.4. Functional assays as a non-animal method to detect AZA The current biological detection method for AZAs in shellfish is the in vivo mouse bioassay. Current limitations of the existing model are those of species differences, the justification of using animals for a testing method and limit of detection. The creation of in vitro model systems that closely mimic the in vivo state would be a step forward. The rationale in the development of a functional assay is that functional alterations may occur in the absence of cellular death resulting in the manifestation of adverse effects in humans which obviously do not involve death. These functional parameters can reflect more accurately the kind of gastrointestinal disturbances that could occur upon exposure to AZAs. There are several benefits of in vitro cell models. Animal to animal variability between tests is eliminated due to the use of a single cell type. In addition, the use of human cells eliminates species-species differences. In vitro assays also allow the use of calibration curves to identify the quantity of toxin present more accurately, unlike the mouse bioassay where a positive or negative result is obtained. In this project the use of TEER as a functional assay is believed to be of value in the prediction of gastrointestinal injury. This particular functional assay correlates the permeability of a barrier of cells by the use of an electrical current to that of the integrity of the gastrointestinal tract. The ability of this assay to detect alterations in paracellular permeability when exposed to AZA1 highlights the uses this assay could have in the detection of AZA1 in shellfish. By examining functional assays associated with particular organ types it may be possible to identify specific organ effects. Correlating this with standard cytotoxicity cell models, temporary functional changes can be compared to cytotoxic damage. 5.4.5. Functional assays as a validation tool for other non-animal methods With the current need to eliminate the use of animals in testing the development of alternative techniques has proven essential. The retention of a biological model may prove necessary for the detection of potentially undiscovered biotoxins. The functional assay also has the advantage that it can detect toxic equivalents rather than individual molecules compared to chemical detection. This may be especially relevant where marine biotoxins co-occur.
5. Mechanisms underlying the Toxicity of AZAs _________________________________________________________________________________________
90
5.4.6. Gaps and future developments To date information on AZA toxicity and mode of action is still limited. The work outlined in this report has significantly increased the available knowledge. The question about the potential carcinogenic action or tumour promoting ability of AZA1 can not be accurately addressed using in vitro models. Definitive answers to this can only be addressed through increased availability of epidemiological data and more extensive in vivo studies. The generation of risk assessments and determination of revised regulatory limits is based upon available evidence with greater weight being given to human epidemiological data. An extensive in vivo study would aid in reducing the safety factor applied in the calculation of regulatory levels.

6. Risk Assessment of AZAs _________________________________________________________________________________________
91
6. Risk Assessment of AZAs 6.1. Risk assessments prior to ASTOX 6.1.1. FSAI risk assessment 2001 Several risk assessments for AZAs have been carried out since the initial Irish assessment. The outcome of the original assessment was based on a probabilistic approach as well as a deterministic approach. However, the incomplete nature of the epidemiological data required several assumptions to be made in order to calculate the tolerable AZA threshold value in mussels. Limited data regarding the quantity of mussels consumed as well as the concentration of AZA at the time were available. An additional assumption was the specific tissues in mussels where AZA could accumulate. It was believed that AZA could migrate from the HP to the whole flesh over time affecting distribution, which in turn influenced the calculation of AZA. Expert opinion at the time suggested that the concentration of toxin would be reduced on heating of the mussels. It has now been reported that steaming of mussels as a sample pre-treatment can result in a two-fold higher concentration of AZAs than the uncooked flesh. This applied to both whole flesh and for digestive gland tissue and was attributed to the loss of water/juice from the matrix (Hess et al., 2005). Finally the threshold level calculated was based on Irish consumption data of 93 g of cooked mussels. The levels of AZA believed to have caused human intoxication based on the original assumptions were between 6.7 µg and 24.86 µg. 6.1.2. EU review in 2001 The report of the meeting of the working group on toxicology of DSP and AZP (2001) re-examined the initial Irish risk assessment. The availability of new data on heat stability resulted in a recalculated range of the lowest observed adverse effect level (LOAEL). This resulted in a recalculated LOAEL of between 23 and 86 µg per person assuming a maximum consumption of 100 g shellfish/meal with a mean value of 51.7 µg. A safety factor of 3 was applied to convert the LOAEL to a NOAEL to account for individual variation, producing a range of 7.7 µg to 28.7 µg with a mean of 17.2 µg. Based on the LOAEL of 7.7 µg this yielded an ARfD of 0.127 µg/kg. Based on an intake level of a maximum of 100 g shellfish meat/meal, and the lowest LOAEL divided by three, it was stated that an allowance level of 8 µg AZAs/100 g of shellfish should result in no appreciable risk for human health. To allow for detection by the mouse bioassay a level of 0.16 mg/kg was proposed. However, with a shellfish consumption of 300 g/meal, a person will consume a quantity of AZAs equal to the LOAEL in humans. It should be noted that the remaining assumptions of the Irish risk assessment were still applied. 6.1.3. FAO/IOC/Codex expert consultation 2004 The evaluation of the joint FAO/IOC/WHO expert consultation in Oslo, 2004, established a provisional acute reference dose of 0.04 g/kg b.w., based on the LOAEL of 23 g per person in humans and a body weight of 60 kg, using a ten fold safety factor to take into consideration the small number of people involved. Based on the consumption of 250 g of shellfish meat, a derived guidance level of 0.0096 mg/kg was achieved. As there were insufficient data on the chronic effects of AZA, no tolerable daily intake (TDI) could be established. Several observations were made regarding the preliminary studies, in which AZA was administered by gavage. This indicated the possibility of severe and prolonged toxic effects at low doses. Administration by gavage may, however, have contributed to the observed severe erosive effects in the gastrointestinal tract. Repeat studies involving administration of the test material by feeding are urgently required. To establish a TDI, data on long-term/carcinogenicity and genotoxicity and reproductive toxicity are needed.

6. Risk Assessment of AZAs _________________________________________________________________________________________
92
Information on absorption, excretion and metabolism is also required. 6.1.4. CRLMB working group on toxicology 2005 The most recent conclusions and recommendations were those of the Working Group on Toxicology (Community Reference Laboratory on Marine Toxins (CRLMB)) where a guidance level of 32 µg/kg shellfish meat for AZAs was considered appropriate (subject to future re-evaluation). This level was arrived at based on the existing lowest LOAEL from epidemiological studies of 0.38 g/kg b.w., a portion size of 250 g and a safety factor of three (Anonymous, 2005). 6.2. Risk assessment supported by ASTOX 6.2.1. FSAI risk assessment 2006 The initial risk assessment carried out in 2001 was based on an upper consumption level of 93.1 g of fresh mussels. The average serving suggestion has been revised upwards to 250 g to account for European consumption levels. All conclusions and recommendations since the initial Irish risk assessment have based their conclusions on the initial Arranmore incident. While several assessments have addressed the issue of heat stability and increased portion sizes, none have examined the impact of the distribution of AZA in tissue or the increase in toxin concentration when steamed due to water loss. The revised risk assessment carried out by the FSAI has revisited the initial data and addressed the initial assumptions made based on the availability of new data. The revised FSAI risk assessment completed in August 2006 had significant input from members of the ASTOX research team and this approach to developing a revised risk assessment effectively replaced the proposed animal studies in ASTOX to establish a NOAEL. Again, in developing the revised risk assessment, it was decided that the main decisions be based on human exposure to AZA. All animal studies to date have very little statistical power, mainly due to the very limited availability of sufficient AZA to carry out adequate statistical studies in animals. New scientific evidence, arising mainly from the work in the ASTOX project, was taken into account in the revised FSAI risk assessment. This evidence included the following:
1. New information on the tissue distribution of AZA 2. New information on the different ratios of AZAs in mussel flesh
3. New information on the effects of cooking on AZA The use of the new data on the above key parameters and a simplified calculation approach has resulted in an increased estimate of AZA intake that led to AZP on Arranmore. The revised estimates of AZA intakes believed to have caused human intoxication are now between 50.1 g (5%) and 253.3 g (95%) per person. The comparable intakes of AZA reported in the original Irish risk assessment were between 6.7 g (5%) and 24.9 g (95%) per person. The median ARfD for AZA, derived from the above distribution of intake estimates, is 0.63 g/kg b.w., obtained by application of a safety factor of three to the estimates of the lowest observable adverse effect level (LOAEL) for AZAs based on the Arranmore AZP incident. This is comparable to the maximum intake value of 0.67 g/kg b.w. for a 60 kg person consuming 250 g mussels contaminated with AZAs at the current regulatory limit of 0.16 mg/kg. The validity of an ARfD of 0.63 g/kg b.w. is supported by the absence of

6. Risk Assessment of AZAs _________________________________________________________________________________________
93
reported incidents of AZP since the adoption of the 0.16 mg/kg maximum regulatory limit for AZAs in shellfish and strengthening of national biotoxin monitoring programmes to enforce it.

7. Additional Research and Potential Outcomes _________________________________________________________________________________________
94
7. Additional Research and Potential Outcomes 7.1. Toxicity of DTX2 relative to OA
As mentioned in section 3 of this report, DTX2 is a toxin that was discovered in Ireland in 1992, and, similar to AZAs, neither a certified pure standard nor a CRM was available for this compound prior to the ASTOX project. DTX2 is in many ways related to AZAs: firstly, DTX2 may co-occur with AZAs in Irish shellfish as repeatly observed since 2001, secondly, both give similar symptoms including diarrhea upon oral exposure in mammals, and lastly, these compounds would traditionally have been detected by the global toxicity assays using rats or mice. Furthermore, toxicological information on DTX2 was only indirectly available from mouse bioassays in the routine monitoring. Hence isolation of this compound was also written into the aims of the project. While the isolation is described under section 4.2.8 of this report, we describe here the progress in addition to the planned work under ASTOX, progress that was only possible thanks to the additional collaboration with the NSVS. Detailed comparison of the mouse bioassay with data obtained from LC-MS analysis suggested, independently in Ireland and more recently Norway, that DTX2 may be less toxic than OA. Therefore, a study was designed to compare the toxicity of DTX2 to that of OA, using both the intraperitoneal route of exposure in mice and the functional PP2A assay. DTX2 was isolated at the MI as described under 4.2.8 of this report and toxicological studies were conducted at the NSVS.
The animal study suggested that DTX2 is only half as toxic as OA as illustrated by the prevalence of death in mice injected with varying doses of OA and DTX2 (Fig. 7.1).
Figure 7.1. The prevalence of death as a function of A) DTX2 dose and B) OA dose, predicted by use of second degree polynome.
The functional PP2A assay confirmed these results within the error of measurement, since a relative effective dose of 0.6 was found for DTX2 compared to OA. Results were published by Aune et al., 2007. Overall, this reduced toxicity of DTX2 compared to OA is important when implementing methods which are not based on detecting toxicity, such is the case for LC-MS. Hence, this study facilitates the use of LC-MS in monitoring of shellfish toxins.
0,00
0,20
0,40
0,60
0,80
Pre
vale
nce
300 350 400 450Dose
0,0
0,2
0,4
0,6
0,8
Pre
vale
nce
200 220 240Dose
A) DTX2 B) OA
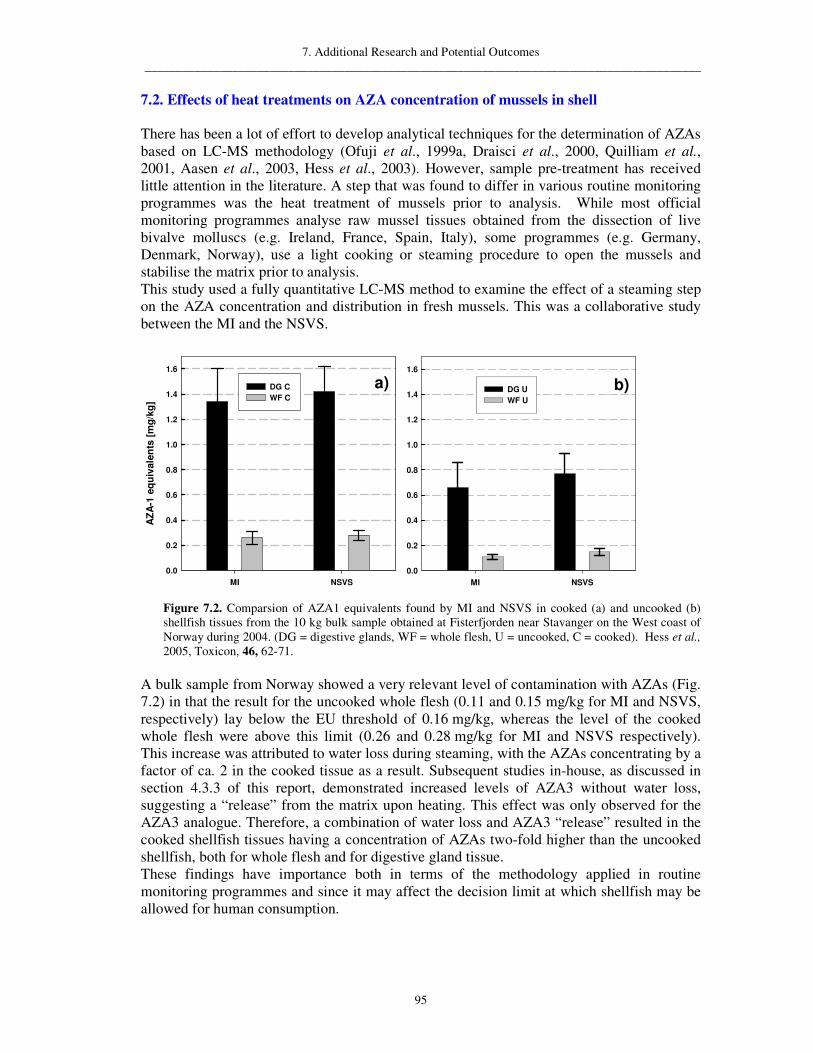
7. Additional Research and Potential Outcomes _________________________________________________________________________________________
95
7.2. Effects of heat treatments on AZA concentration of mussels in shell There has been a lot of effort to develop analytical techniques for the determination of AZAs based on LC-MS methodology (Ofuji et al., 1999a, Draisci et al., 2000, Quilliam et al., 2001, Aasen et al., 2003, Hess et al., 2003). However, sample pre-treatment has received little attention in the literature. A step that was found to differ in various routine monitoring programmes was the heat treatment of mussels prior to analysis. While most official monitoring programmes analyse raw mussel tissues obtained from the dissection of live bivalve molluscs (e.g. Ireland, France, Spain, Italy), some programmes (e.g. Germany, Denmark, Norway), use a light cooking or steaming procedure to open the mussels and stabilise the matrix prior to analysis. This study used a fully quantitative LC-MS method to examine the effect of a steaming step on the AZA concentration and distribution in fresh mussels. This was a collaborative study between the MI and the NSVS.
a)
MI NSVS
AZA
-1 e
quiv
alen
ts [m
g/kg
]
0.0
0.2
0.4
0.6
0.8
1.0
1.2
1.4
1.6
DG C WF C
b)
MI NSVS0.0
0.2
0.4
0.6
0.8
1.0
1.2
1.4
1.6
DG UWF U
Figure 7.2. Comparsion of AZA1 equivalents found by MI and NSVS in cooked (a) and uncooked (b) shellfish tissues from the 10 kg bulk sample obtained at Fisterfjorden near Stavanger on the West coast of Norway during 2004. (DG = digestive glands, WF = whole flesh, U = uncooked, C = cooked). Hess et al., 2005, Toxicon, 46, 62-71.
A bulk sample from Norway showed a very relevant level of contamination with AZAs (Fig. 7.2) in that the result for the uncooked whole flesh (0.11 and 0.15 mg/kg for MI and NSVS, respectively) lay below the EU threshold of 0.16 mg/kg, whereas the level of the cooked whole flesh were above this limit (0.26 and 0.28 mg/kg for MI and NSVS respectively). This increase was attributed to water loss during steaming, with the AZAs concentrating by a factor of ca. 2 in the cooked tissue as a result. Subsequent studies in-house, as discussed in section 4.3.3 of this report, demonstrated increased levels of AZA3 without water loss, suggesting a “release” from the matrix upon heating. This effect was only observed for the AZA3 analogue. Therefore, a combination of water loss and AZA3 “release” resulted in the cooked shellfish tissues having a concentration of AZAs two-fold higher than the uncooked shellfish, both for whole flesh and for digestive gland tissue. These findings have importance both in terms of the methodology applied in routine monitoring programmes and since it may affect the decision limit at which shellfish may be allowed for human consumption.

7. Additional Research and Potential Outcomes _________________________________________________________________________________________
96
7.3. Effects of heat treatments on DA concentration of mussels in shell
HPLC methodology is applied to the official control of DA in shellfish in member states of the EU; however, similarly to AZAs, sample pre-treatments vary between the monitoring programmes of different countries. Previous studies have shown that cooking can have a significant effect on the concentration and distribution of various toxin groups. For hydrophilic compounds such as the PSP and ASP toxins, studies examining the influence of various heat treatments on a variety of shellfish and molluscs, such as lobsters, clams, crabs and scallops, have shown that various heat treatments generally lower the toxin concentrations (Berengeur et al., 1993, Lawrence et al., 1994, Liera et al., 1998, Vieites et al., 1999). The aim of this study was to examine the effect of cooking, as well as a more extreme heat treatment on the concentration and tissue distribution of DA in fresh mussels.
Figure 7.3. Mean DA + epi-DA concentrations in uncooked, steamed (A & B) and autoclaved (B) whole flesh (WF) tissues of two mussel samples. Also shown is the tissue distribution of DA between hepatopancreas (HP) and remainder tissues (Rem) for the various sub-samples (B). Error bars represent +/- 1 SD (n = 3). McCarron et al., 2006, Toxicon 47, 473-479.
The effect of cooking on the concentration, and tissue distribution of DA in two fresh mussel samples was examined (Fig 7.3). While in one sample no differences were observed after cooking (A), studies on a second sample (B) showed that the concentrations of DA in the processed whole flesh were higher than in the uncooked tissue (ca. 20%). DA concentration decreased in the HP and increased in tissue remainder suggesting some organ disruption of mussels during heat treatment (B). These findings suggest that heat treatments using either conventional steaming or autoclaving at 121 °C are not appropriate techniques to reduce DA in mussels during commercial processing. The study also shows that sample pre-treatment has a minimal effect on the result of a DA analysis on whole mussel tissues. This is important in terms of routine monitoring programmes with regard to the influence of sample pre-treatment on results. In addition it is important information for the commercial processing of shellfish, since these results suggest that processing techniques involving heat treatment are unlikely to be useful in the reduction of the DA content. However, the results also suggest that processing procedures are unlikely to lead to any increase in DA content in shellfish lots.
15
17
19
21
23
25
27
29
Uncooked Steamed
DA
+ e
pi-D
A c
onc.
(mg/
kg)
0
5
10
15
20
25
30
35
40
Uncooked Steamed Autoclaved
WF Rem HP
A B

7. Additional Research and Potential Outcomes _________________________________________________________________________________________
97
7.4. Feasibility and production of CRMs for AZAs 7.4.1. NRC-IMB The NRC-IMB is the main supplier of CRMs for marine toxins internationally. Due to the increased occurrence of AZAs around the UK, the NRC-IMB was contracted by the UK Food Safety Authority, through the Fisheries Research Centre Aberdeen, to carry out a project on AZAs (Quilliam et al., 2006). The project involved development and validation of an LC-MS method for AZAs, and preparation of pilot scale calibration standard, and tissue matrix RMs. In late 2005 a collaborative project was arranged between the MI and the NRC-IMB. The project focused on the preparation of CRMs for AZAs. This included preparation of individual calibration solutions for AZA1, -2 and -3, and a mussel tissue material to be certified for at least AZA1, -2 and -3. This collaboration made use of all the experience gained at both laboratories in the separate AZA projects. 7.4.1.1. Mussel tissue CRM While good stability and homogeneity was achieved in trials with a freeze dried RM for AZAs (4.3.3), it was decided that for AZAs a wet frozen mussel material would be most appropriate, as this was most representative of the day-to-day samples analysed in routine monitoring programmes for AZAs and also because the NRC-IMB has extensive experience in this form of material. As heat treatment had been shown to be unsuitable, irradiation was selected as a stabilisation technique. An AZA material collected during a toxic event in August 2005 (section 4.1) was determined to have a concentration of 4.33 mg/kg when analysed by LC-MS. This material was selected for preparation of the mussel material. After harvesting, the mussels were processed by steaming at 90 °C (10 min) to facilitate removal from the shell and to stabilise the matrix. Heating at this temperature would have caused most of the bound AZA3 to be released. However, to ensure that there was no risk of further release, a sample of the bulk material was homogenised and portions were heated at 90 °C for 15 min. It was shown that additional heating of the tissue was not required, as no detectable increases were observed. A 32 kg batch of material was prepared by mixing contaminated mussels in a 1:2 ratio with uncontaminated mussels (steamed), and adjusting the moisture content to 85%. This dilution was chosen to have a concentration closer to the regulatory level, yet still being high enough for an accurate certification. Antioxidants and a mixture of antibiotics were added as 0.02% by weight to the homogenate. The material was homogenised using a Comitrol 3600 food cutter and dispensed as 8 g portions using a peristaltic pump. In total, ca. 3,700 bottles were filled, purged with argon and hermetically sealed using trilaminate strips. The bottles were capped and stored at -80 °C until irradiation. A target dose of 15 kGy was selected, and doses measured in the range of 14.3-19.2 kGy were applied to the entire fill series. The bottles were then sealed inside trilaminate pouches and stored again at -80 °C. Extraction procedures were optimised to achieve maximum recovery of AZAs from the mussel material and will be used in the certification exercise, which is on-going. Certification of the mussel material is dependant on final certification of AZA1, -2 and -3 calibration solutions.

7. Additional Research and Potential Outcomes _________________________________________________________________________________________
98
7.4.1.2. Calibration solution CRM Collaboration with the NRC-IMB has enabled the MI to prepare pure toxins standards for machine calibration and biological matrix RMs for quality assurance purposes. Through the ASTOX project the MI has obtained a considerable amount of highly contaminated mussel matrix. This material has enabled the production of a highly pure toxin standard for AZA1 and will further be used to produce standards for AZA2 and AZA3. The NRC-IMB has worked on the certification of a standard for AZA1 from this material and more than 3,500 ampoules were produced for commercial distribution. The calibration solution has an approximate concentration of 1.5 µM and was proven to be highly homogenous throughout all ampoules. Purity has been assessed by both LC-MS and NMR analysis. The availability of such a material will be used not only for routine monitoring, but can also aid interlaboratory studies and further method development in the future. The high purity of this material will also be useful for future toxicological evaluations of AZA1. During the production of the NRC-CRM-AZA1 additional AZA1 was obtained which will be used for replacement CRMs. This work ensures availability of AZA calibration standards for future use. 7.4.2. IRMM In section 4.3 the influence and suitability of various stabilisation procedures (heat treatment, use of additives, irradiation, freeze-drying) are described for the preparation of mussel tissue RMs for AZAs. In addition to AZAs the studies described have also been carried out for a range of other toxins. The findings indicate that freeze-drying may be the technique facilitating stability of all the phycotoxins examined. This means that while it would be a suitable method for AZAs, it would be ideal for use in the preparation of a multi-toxin material. Currently CRMs are only available for single phycotoxin groups. A multi-toxin material would reflect the increasing use of multitoxin LC-MS techniques for the routine determination of shellfish toxins. A multi-toxin material could contain OA group toxins, AZAs, PTXs, YTXs and SPXs, or subsets of those. Following from the collaborative study carried out with the IRMM, discussions have commenced with regard to the possible preparation of a multitoxin RM. As the IRMM is the main supplier of CRMs in the European Union, and because of their expertise in the preparation of homogeneous freeze-dried RMs for a variety of analytes and matrices, they would be the ideal collaborator in such a project. In addition to the CRM preparations described in 7.4.1, the NRC-IMB would also be a desirable partner for this project as characterisation and certification of the material could take place at their facilities. If such a project were to proceed the breakdown of the work involved could be envisioned as follows: MI: Supply of bulk shellfish tissues, composing the material, adjusting concentrations and bulk mixing, initial stabilisation (heat treatment/additives). IRMM: Programmed freeze-drying, adjustment of water contents, grinding, milling, sieving, inert atmosphere packaging, characterisation of final water content and particle size. NRC-IMB: Contribution of some toxins (contaminated shellfish or plankton pellets), toxin characterisation of material, stability studies, certification, storage and distribution. If this collaborative multi-toxin RM project were to proceed it is possible that preparation and characterisation could take place during 2007.

7. Additional Research and Potential Outcomes _________________________________________________________________________________________
99
7.5. Structure activity relationships of AZA1 and synthetic analogues in mice An additional collaboration of Dr. Ito (Chiba University, Japan) with the group of Prof. Nicolaou (Scripps Research Institute, USA) focused on determining which part of the AZA molecule was responsible for the toxic action (Ito et al., 2006). Synthetic AZA1 had been previously shown to be the same product as the naturally occurring AZA1 (Nicolaou et al., 2004 a and b). Synthetic AZA1 (AZA1, 1), 6-, 10-, 13-, 14-, 16-, 17-, 19-, 20-epi-AZA-1 (C1–C20-epi-AZA1, 2), and twelve truncated AZA1 analogues (3–14) were synthesized and tested for their toxicity effects in mice.
Figure 7.4. Molecular structures of synthetic AZA1 (1), C1-C20-epi-AZA1 (2) and truncated analogues (3-14).
Figure 7.4 shows AZA1 and the analogues used in this study. Note that C1-C20-epi-AZA1 is a molecule with the atoms and mass of AZA1; however, the stereochemistry is changed for the spiro-ring assembly.

7. Additional Research and Potential Outcomes _________________________________________________________________________________________
100
Figure 7.5. shows the toxic effects of AZA1 and C1-C20-epi-AZA1 in small intestines of mice.
Figure 7.5. Small intestinal changes after 24 hr, by treatment with C1–C20-epi-AZA1 (2) and synthetic AZA1 (1) by oral administration. (a) C1–C20-epi-AZA1 (2) at 3 mg/kg, did not induce injury. The small intestinal villi had almost normal appearances except for some increases in mucous secretions. Scanning electron microscopy (SEM). (b) Treatment with synthetic AZA1 (1) at 0.7 mg/kg: villi became eroded and shorter, and the epithelial cells (E) degenerated, exposing the lamina propria (L). SEM.
The present studies suggest the pathological activity of synthetic AZA1 is very similar to natural AZA1. These investigations also clearly demonstrate the importance of the entire AZA skeleton, as truncated analogues (3–14) exhibited no measurable toxicity in mice. Furthermore, this work reveals the importance of stereochemistry, as stereochemical changes such as those in C1–C20-epi-AZA1 (2) yielded significantly decreased toxicity as compared to that of synthetic AZA1 (1). Synthetic AZA1 (1) is expected to serve a useful tool in further studies directed toward elucidation of the mode of action as well as other key biological properties of the AZAs.
8. Recommendation to Regulators, Risk Managers and Shellfish Industry _________________________________________________________________________________________
101
8. Recommendation to Regulators, Risk Managers and Shellfish Industry 8.1. Safe levels of AZAs in shellfish In section 6 of this report, we reviewed previous risk assessments carried out by Irish and international working groups, as well as the most recent work where scientists from this project collaborated with the FSAI to establish safe levels for AZAs in shellfish intended for human consumption. All studies so far have pointed towards AZAs producing effects at levels similar to or lower than those where OA would cause its effect:
1. The initial LD50s reported by Satake et al. (1998), and Ofuji et al. (1999), suggest that some AZA-analogues may be marginally more effective in killing mice than OA.
2. The studies of the effects of AZAs on TEER of human colon cells suggest that AZAs are 20 times more toxic than OA.
3. Studies by Twiner et al. (2005), investigating a number of human cell lines showed the toxicity of AZA1 at very low doses of ca. 1-5 nM.
Therefore, results from this study demand some caution in the establishment of an action level, particularly if it is to be based on a safety factor of three, the same factor as applied in the risk evaluation of OA. However, despite the efforts in this project, we were not able to clarify definitively the mode of action of AZAs, and it seems not reasonable to set limits for AZAs in shellfish for human consumption from cellular or animal studies alone. Thus, we note again that the most recent evaluation has taken into account both the initial human poisoning incidents and the information available gathered in the Irish routine monitoring since the first established legal limit in 2000. The more recently available data include the experience of Irish risk management since 2001, which showed that no poisoning was reported when the current legal EU limit of 0.16 mg/kg was implemented. This experience is strengthened by chemical analysis during the last 5-6 years, which clearly showed that a large number of shellfish lots produced and consumed (without apparent ill health effect) contained values significantly above the limit of detection but below this level of 0.16 mg/kg. Therefore, we recommend that – until a definitive mode of action is clarified for AZAs – the level of 0.16 mg/kg be used in the interim as a management level for AZAs in shellfish for human consumption. This recommendation should also be seen in light of the findings described under section 7.2.

8. Recommendation to Regulators, Risk Managers and Shellfish Industry _________________________________________________________________________________________
102
8.2. Pitfalls of commercial processing and gaps in current EU legislation. Due to the phenomena described in section 4.3.3.1 and section 7.2, it is obvious that the concentration of AZAs in raw shellfish may increase by approximately a factor of two upon heat treatments applied in commercial processing. Since the current management practices for shellfish production, in most EU countries, involve only monitoring for live bivalve molluscs prior to harvest, this increase in concentration must be considered a risk to the shellfish processing industry as well as shellfish consumers. While the increase in toxin concentrations can still be detected in end product testing, the added value spent on processing the shellfish is lost as is the product, which may have been safe for processing at a later stage. This increase in concentration may also be a good reason to use quantitative techniques in the detection of shellfish toxins, where concentrations at half the regulatory limit can be detected. LC-MS provides this level of quantitation, thereby allowing shellfish processors to make informed decisions on purchase of shellfish, while the MBA cannot give this level of warning. Similarly albeit less pronounced, increases of up to 50% were also observed for other lipophilic toxins of the okadaic acid group posing similar risks to the shellfish consumer and industry (McCarron et al., 2007c).

9. Dissemination _________________________________________________________________________________________
103
9. Dissemination 9.1. List of publications arising from the project
• Aune T., Larsen S., Aasen J., Rehmann N., Satake M., Hess P., 2007. Relative toxicity of
dinophysistoxin-2 (DTX2) compared with okadaic acid, based on acute intraperitoneal toxicity in mice. Toxicon, 49, 1-7.
• Colman J.R., Twiner M.J., Hess P., McMahon T., Doucette G.J. and Ramsdell J.S., 2005. Teratogenic effects of AZA-1 identified by microinjection of Japanese Medaka Oryzias latipes embryos. Toxicon, 45, 881-890.
• Hess P., McCarron P., Quilliam M.A., 2007. Fit for purpose shellfish RMs for internal
and external QC in the analysis of phycotoxins. Anal. Bioanal. Chem., 387, 2463-2474. • Hess P., Nguyen L., Aasen J., Keogh M., Kilcoyne J., McCarron P., Aune, T., 2005.
Tissue distribution, effects of cooking and parameters affecting the extraction of AZAs from mussels, Mytilus edulis, prior to analysis by liquid chromatography coupled to mass spectrometry. Toxicon, 46, 62-71.
• Kulagina N.V., Twiner M.J., Doucette G.J., Ramsdell J.S., Hess P., McMahon T.,
O'Shaughnessy T.J., Ma W., 2006. AZA-1 inhibits bioelectrical activity of spinal cord neuronal networks. Toxicon, 47, 766-773.
• McCarron P., Hess P., 2006. Tissue distribution and effects of heat treaments on the content of DA in blue mussels, Mytilis edulis. Toxicon, 47, 473-479.
• McCarron P., Kotterman M., de Boer. J., Rehmann R., Hess P., 2007a. Feasibility of
gamma irradiation as a stabilisation technique in the preparation of tissue RMs for a range of shellfish toxins. Anal. Bioanal. Chem., 387, 2487-2493.
• McCarron P., Emteborg H., Hess P., 2007b. Freeze-drying for the stabilisation of
shellfish toxins in mussel tissue (Mytilus edulis) RMs. Anal. Bioanal. Chem., 387, 2475-2486.
• McCarron P., Kilcoyne J., Hess P., 2007c. Effects of cooking and heat treatment on
concentration and tissue distribution of AZAs, okadaic acid and dinophysistoxin-2 in mussels (Mytilus edulis). Submitted to Toxicon, Feb 2007, (TOXCON-D-07-00056).
• McCarron P., Burrell S., Hess P., 2007d. Effect of addition of antibiotics and an
antioxidant, on the stability of tissue RMs for DA, the amnesic shellfish poison. Anal. Bioanal. Chem., 387, 2495-2502.
• Twiner M.J., Hess P., Bottein Dechraoui M.-Y., McMahon T., Ramsdell J.S., Samons
M.S., Satake M., Yasumoto T., and Doucette G.J., 2005. Cytotoxic and cytoskeletal effects of AZA-1 on multiple mammalian cell lines. Toxicon, 45, 891-900.

9. Dissemination _________________________________________________________________________________________
104
• Wilkins A.L., Rehmann N., Torgersen T., Rundberget T., Keogh M., Petersen D., Hess
P., Rise F., Miles C., 2006. Identification of fatty acid esters of pectenotoxins-2 seco acid in blue mussels (Mytilus edulis) from Ireland. J. Agric. Food Chem., 54, 5672-5678
9.2. List of conferences at which results from ASTOX were presented
1. Twiner M.J., Hess P., Bottein Dechraoui M.-Y., McMahon T., Ramsdell J.S., and
Doucette G.J.; AZA-1 induced cytotoxicity of mammalian cell lines. Gordon Conference on Mycotoxins and Phycotoxins, Colby College, Waterville, Maine, USA, June 15-20, 2003. (invited oral and poster presentations by M. Twiner).
2. Rehmann N., Kilcoyne J., Yasumoto T., Satake M., Hess P.; Development of a
multitoxin isolation scheme for the marine biotoxins dinophysistoxin-2 and AZA-1, -2 and -3 from mussels. 11th Intl. Conf. on Marine Natural Products, Sorrento, Italy, 4-8 September, 2004. Poster presentation.
3. Twiner M.J.; Effects of AZA-1 on human immune cells and fish embryos. Center for
Coastal Environmental Health and Biomolecular Research, Charleston, USA, November 19, 2003. Invited departmental seminar by M. Twiner.
4. Twiner M.J.; Cytotoxic and developmental effects of AZA-1, a newly identified
phycotoxin that causes shellfish poisonings in Europe. Department of Biology, Woods Hole Oceanographic Institute, December 3, 2003. Invited departmental seminar by M. Twiner.
5. Kulagina N.V., Smith L. Mikulski C.M, Twiner M.J., Doucette G.J., Ramsdell J.S., and
Pancrazio J.J.; Application of cultured neuronal networks for identification of toxic algae. Second Symposium on Harmful Marine Algae in the U.S. Woods Hole, Massachusetts, USA, December 9-13, 2003. Oral Presentation.
6. Twiner M.J., Hess P., Bottein Dechraoui M.-Y., McMahon T., Ramsdell J.S., Samons
M.S., and Doucette G.J.; Cytotoxic and cytoskeletal effects of AZA-1 on seven mammalian cell lines. 5th International conference on molluscan shellfish safety, Galway, Ireland. June 14-18, 2004. Oral Presentation.
7. Colman J.R., Twiner M.J., Hess P., McMahon T., Doucette G.J. and Ramsdell J.S.;
Teratogenic effects of AZA-1 identified by microinjection of Japanese Medaka Oryzias latipes embryos. 5th International conference on molluscan shellfish safety, Galway, Ireland. June 14-18, 2004. Poster presentation.
8. McCarron P., Kilcoyne J., Hess P.; Preparation of stable, homogenous shellfish tissue
materials naturally contaminated with dinophysistoxins and AZAs, 5th International conference on molluscan shellfish safety, Galway, Ireland. June 14-18, 2004. Poster presentation.
9. Rehmann N., Kilcoyne J., Hess P., Yasumoto T.; Isolation and purification of AZA1, -2
and -3, 5th International conference on molluscan shellfish safety, Galway, Ireland. June 14-18, 2004. Poster presentation.

9. Dissemination _________________________________________________________________________________________
105
10. Kulagina N.V., Twiner M.J., Doucette G.J., Ramsdell J.S., Hess P., McMahon T.,
O'Shaughnessy T.J., Ma W.; Effect of AZA-1 on action potential generation and voltage-gated currents in cultured spinal cord neuronal networks. 5th International conference on molluscan shellfish safety, Galway, Ireland. June 14-18, 2004. Poster presentation.
11. Ryan G.E., Hess P., Ryan M.P.; Development of a functional in vitro bioassay for AZAs
(AZA) using human colonic epithelial cells. 5th International Conference on Molluscan Shellfish Safety, June 2004. Oral Presentation.
12. Hess P., Rehmann N., Kilcoyne J., McCarron P., Bender K., Ryan G., Ryan M.; Biotoxin
chemical and toxicological research. Proceedings of the 5th Irish Shellfish Safety Scientific Workshop, Rosscarbery, October 2004. Oral Presentation.
13. Twiner M.J., Hess P., Bottein Dechraoui M.-Y., McMahon T., Ramsdell J.S., Samons
M.S., and Doucette G.J.; Cytotoxic and cytoskeletal effects of AZA-1 on multiple mammalian cell lines. International conference on Harmful Algae, Cape Town, South Africa. November 15-19, 2004. Oral Presentation.
14. Kulagina N.V., Twiner M.J., O'Shaughnessy T.J., Hess P., McMahon T., Ramsdell J.S.,
Doucette G.J., and Ma W.; Pharmacological effect of AZA-1 on spinal cord neuronal networks. Gordon Conference on Mycotoxins and Phycotoxins, Colby College, Waterville, Maine, USA, June 19-24, 2005. Poster presentation.
15. Twiner M.J.; DNA microarrays and their application to the toxicology of the harmful
algal bloom toxin AZA. Department of Microbiology, University of Tennessee, October 31, 2005. Invited departmental seminar by M. Twiner.
16. Hess P., Rehmann N., McCarron P., Ryan G. , Ryan M., Ito E., Satake M., Doucette G.,
Twiner M., Yasumoto T., Aasen J., Aune T., Larsen S.; Progress report on ASTOX – research on AZA standards and toxicology. 6th Irish shellfish safety scientific workshop, Galway, Ireland, Dec 2005. Oral presentation.
17. Hess P., McCarron P., Quilliam M. A.; Fit-for-purpose Shellfish Tissue RMs for
Phycotoxins in Internal and External QC. Berm 2006. Oral presentation.
18. McCarron P., Burrell S., Hess P.; Effect of Addition of Antibiotics and an Antioxidant, on the Stability of Tissue RMs for DA, the Amnesic Shellfish Poison. Berm 2006, Poster presentation.
19. McCarron P., Emteborg H., Hess P.; Evaluation of Freeze-drying as a Stabilisation
Technique for Mussel (Mytilus edulis) Tissue RMs Containing Hydrophilic and Lipophilic Phycotoxins: DA, Okadaic Acid, Dinophysistoxin 2, and AZA 1, 2 and 3. Berm 2006. Oral presentation.
20. McCarron P., Kotterman M., de Boer J., Rehmann N., Hess P.; Effect of γ-Irradiation on
Standards and Tissue RMs for DA, Okadaic Acid, Dinophysistoxin 2, and AZA 1, 2 and 3, Pectenotoxin-2 and Yessotoxin. Berm 2006. Poster presentation.
9. Dissemination _________________________________________________________________________________________
106
21. McCarron P., Hess P., Quilliam M.; Stability Issues in the Development of Certified
Reference Materials for the Shellfish Toxins, AZAs. AOAC 2006. Oral presentation. 22. McCarron P., Hess P., Quilliam M.; Development of Extraction Methods for LC-MS
analysis of AZA Toxins and Application to the Development of a Certified RM. AOAC 2006. Oral presentation.
9.3. Proceedings of the ASTOX dissemination workshop
The ASTOX workshop was held from the 31st October – 1st November 2006 at which a number of presentations were given by contributors to the project and from other scientists working in the field. The workshop was attended by members of the shellfish industry, FSAI and interested scientists. Following discussions held over the two days proposals for additional research were outlined. 9.3.1. Presentations given (related research)
AZA-1 INDUCES MOLECULAR AND FUNCTIONAL ALTERATIONS IN CULTURED EPITHELIAL CELLS Gian Paolo Rossini and Giuseppe Ronzitti Dipartimento di Scienze Biomediche, Università di Modena e Reggio Emilia, Via Campi 287, I-41100 Modena, Italy. E-mail: [email protected] AZAs have been shown to cause relevant alterations in the gastrointestinal tract, including the destruction of villi in the small intestine. The integrity of epithelia is based on proper cell-cell adhesive structures, primarily involving the E-cadherin cell-cell adhesion protein, and marine biotoxins often affect this molecular system in epithelial cells, calling our attention to the possibility that the effects induced by AZAs in the small intestine might include alterations of E-cadherin. We have then investigated the effects of AZA-1 (AZA1) on two epithelial cell lines, the MCF7 and Caco 2 cells, that have been obtained from human breast and colon cancers, respectively. Nanomolar concentrations of AZA1 reduced MCF7 cell proliferation and impaired cell-cell adhesion. AZA1 altered the cellular pool of E-cadherin by inducing a dose- and time-dependent accumulation of an E-cadherin fragment (ECRA100), with an EC50 of 0.47 nM. The immunological characterisation of ECRA100 revealed that it consists of an E-cadherin molecule lacking the intracellular domain, and these data showed that the effect induced by AZA1 in MCF-7 cells is undistinguishable from that induced by yessotoxin in the same experimental system. A comparison of toxin effects in MCF-7 and Caco 2 cells confirmed that the effects induced by AZA1 and yessotoxin are undistinguishable in these cells. Treatment of fibroblasts with AZA1 did not affect the cellular pool of N-cadherin, showing that the toxin effect is cadherin-specific. A comparison of the effects induced by AZA1, YTX and OA on F-actin and E-cadherin in MCF7 and Caco 2 cells showed that 1 nM AZA1 did not cause significant changes in F-actin and that accumulation of ECRA100 did not correlate with decreased levels of F-actin under our experimental conditions. Matching our results with those available in literature, we notice that, when molecular effects induced by AZA1 and YTX have been studied in the same in vitro systems, experimental data show they are undistinguishable in terms of sensitive parameters, effective doses, and kinetics of responses in several cell lines. Available experimental data then pose the question of whether AZAs and YTXs might share their molecular mechanism(s) of action in some target cells and/or biological settings, and it

9. Dissemination _________________________________________________________________________________________
107
seems important that future investigations will approach a comparative analysis aimed at clarifying this aspect. Since those two classes of algal toxins display notable structural differences, and have distinct properties in toxicity studies involving oral administration of the toxins in mouse models, it would be very important achieving a better understanding of the molecular mechanism of action of AZAs and YTXs, as a ratonal basis for a better management of risks related to human ingestion of seafood contaminated by those two classes of compounds. Moreover, the possible agonistic/antagonistic roles reciprocally played by AZAs and YTXs under some biological settings must be clarified, including knowledge of relative activities of different AZA analogues in sensitive systems. The results of this study are in publication: Ronzitti G., Hess P., Rehmann N., Rossini G.P.; AZA1 alters the E-cadherin pool in epithelial cells; Toxicological Sciences, 95 (2), 427-435, 2007. RECENT PROGRESS ON THE DEVELOPMENT OF ANTIBODIES FOR AZAS Ingunn A. Samdal,1 Lyn R. Briggs,2 Christopher O. Miles,*1,2 Craig J. Forsyth,3 Son T. Nguyen,3 Jianyan Xu,3 Thomas Rundberget,1 Morten Sandvik1 1National Veterinary Institute, Oslo, Norway; 2AgResearch, Hamilton, New Zealand; 3Department of Chemistry, University of Minnesota, USA. AZAs have recurred regularly in Northern European shellfish since their discovery in November 1995 in Irish mussels. Their presence in shellfish poses a risk of acute nausea, vomiting and severe diarrhoea in human consumers and chronic effects are suspected. AZAs are currently monitored by either the mouse bioassay, which is not sensitive or specific and is ethically questionable, or by LC-MS, which is highly sensitive and specific but requires specialised equipment. There is a need for rapid, simple, sensitive, affordable methods with a high sample throughput. In this presentation we report the first production of antibodies recognising AZAs, opening the possibility for development of immunological methods for various purposes. One of the most important limitations for raising antibodies using AZA1 has been the limited world supply of pure AZAs. The other concern is that the variable groups in the AZA structure (Figure 9.1) indicate that antibodies to the whole AZA1 molecule may not necessarily be ideal for ELISA. This because antibodies recognising this variable region of the AZA might recognize the other analogues poorly, because of steric hindrance or a poor fit – resulting in antibodies with limited cross-reactivity to some AZA analogues. Such antibodies may lead to underestimation of the levels of AZAs in samples.
Figure 9.1. Structure of the AZAs toxins, indicating the variable and the conserved parts of the AZA structure.
R1 R2 R3 R4 AZA-1 H Me H HAZA-2 Me Me H HAZA-3 H H H HAZA-4 H H OH HAZA-5 H H H OHAZA-6 Me H H HAZA-7 H Me OH HAZA-8 H Me H OHAZA-9 Me H OH HAZA-10 Me H H OHAZA-11 Me Me OH H
HOO
O
O OO
OO
HN
H
R2O
H
OHOH H
H
HO
H
H
27
40
R3R1
R4
3
8
2223
Variable region Constant region

9. Dissemination _________________________________________________________________________________________
108
Therefore, our approach has been to raise antibodies to the constant region of the AZA structure (Figure 9.1). This has been accomplished by using a synthetic hapten (Forsyth et al., 2006) constituting of the common C-28–C-40 domain of AZA. The synthetic hapten was conjugated to a carrier protein, and used to immunise sheep for antibody production in both Norway and New Zealand. Preliminary characterisation of the resulting polyclonal antibodies shows that they do indeed recognize the hapten and AZA1. Preliminary attempts of immunoaffinity chromatography show that the antibodies also recognise and bind specifically to the AZA analogues AZA2, -3 & -6. These results confirm the success of the hapten design strategy, although as yet we have only been able to test the antibodies on a limited array of AZAs (AZA1, AZA2, AZA3, and AZA6) as a mixture and on pure AZA1. A competitive ELISA is under development and preliminary results indicate that the assay distinguishes between samples that are positive and negative by LC-MS analysis. Further optimisation of the application of the antibodies in immunoassays is under way. The antibodies we have developed can be used in various applications, including ELISA and affinity purification, and also in many other formats – among them dipsticks analysis, immunohistochemistry, and the Biacore/Spreeta biosensor analysis. Many of these applications can be used to analyse shellfish, SPATTs, and algal extracts for AZAs. They can also be used to search for the AZA producer, for purification of AZAs and for searching for unknown analogues. 9.3.2. Future research directions Through discussion with workshop participants, a number of remaining questions around AZAs were identified. These items also have international importance and should be incorporated in international research calls and collaborative efforts: Oral toxicity in vivo: Due to the lack of human epidemiology data, it is desirable to obtain more information on the oral toxicity caused by AZAs in mammals physiologically as close to humans as possible such as pigs e.g. GÖttingen minipigs. The oral feeding studies should be conducted using shellfish matrix and could be combined with bioavailability and biomarker studies. Bioavailability: The term “bioavailability” has been used in environmental contexts as well as in pharmacology. The proposed studies should aim at the phenomenon in a pharmacological sense: the absorption of AZAs from the shellfish matrix consumed into the human gastrointestinal system may influence the actual toxicity and the absorption may differ depending on the duration for which AZAs reside in shellfish prior to the shellfish being consumed. This hypothesis is strengthened by the fact that shellfish depurate toxins at different rates during different times of a toxic event. Therefore, prolonged closures may be shortened if it could be demonstrated that bioavailability were reduced in the late phase of a toxic episode. Biomarkers for human exposure: As the occurrence of shellfish poisoning is typically not reported due to mild symptoms (diarrhea and vomiting), usually disappearing after two days post exposure, it is desirable to have other biomarkers for human exposure. A survey of such biomarkers could also serve as indirect epidemiology data.
9. Dissemination _________________________________________________________________________________________
109
Causative organism of AZAs: As P. crassipes and other Protoperidinium spp. are heterotrophic algae, a doubt remains on whether these algae actually produce AZAs or whether they merely act as a vector amongst others. It would potentially be of importance for the effective monitoring of shellfish production if the causative organism(s) and mechanisms of distribution in the marine environment were understood. Mode of action of AZA1: This project was successful in outlining major routes of toxic effects both in vivo and and in vitro, and a systematic approach was used to pinpoint possible molecular targets. However, the direct molecular target(s) of AZAs to exerce their toxic effect(s) was not identified unequivocally. This target remains an object of future research in order to fully evaluate the toxic potential of AZAs. Differential toxicity of AZA2 and –3: Different modes of action have been proposed for AZA2 and -3 by other scientists in the field, although structural similarity suggests similar toxic action. Therefore, it is important to investigate whether these analogues indeed have similar or different toxicities compared to AZA1. Even the acute effect in mice should be reproduced by additional studies, as the use of low numbers of mice in the initial trials has little statistical significance. This information is directly relevant to the establishment of toxic equivalence factors, which are required for LC-MS based testing. Effects of exposure to combined groups of toxins: As AZAs have been shown to co-occur with other toxin groups (e.g. OA/DTX2 in Ireland, or YTX in Norway), it is important to understand whether the effects from oral exposure to mixtures of toxin groups would be additive, synergistic or antagonistic. Antibody-based detection tools for AZAs: The current detection tool of choice for AZAs is LC-MS as it provides a clear picture of the levels and analogues present. Animal tests are applicable but give little information on actual levels present and may not be effective at the concentrations required. Hence, it would be advantageous to develop more alternative tests that can be used as quantitative tools, without having drawbacks of expensive, specialised equipment such as LC-MS. Such tools could be developed based on the antibodies, e.g. through improvement of the antibody developed by Forsyth et al., 2006.
10. References _________________________________________________________________________________________
110
10. References Aasen J., Torgersen T., Dahl E., Naustvoll L.J., Aune T., 2006. Confirmation of Azaspiracids in mussels in Norwegian coastal areas, and full profile at one location. In Proceedings of the 5th International Conference of Molluscan Shellfish Safety, 14–18 June 2004, Galway, Ireland (ed. Deegan B, Butler C, Cusack C, Henshilwood K, Hess P, Keaveney S, McMahon T, O’Cinneide M, Silke J). Galway, Ireland: MI, ISBN 1-902895-33-9. Aasen J., Torgersen T., and Aune T., 2003. Application of an improved method for the detection of lipophilic marine algal toxins (OA/DTXs, PTXs, YTXs and AZAs). In Proceedings of the 4th International Conference on Molluscan Shellfish Safety June 4-8, 2002, Xunta De Galicia, IOC of UNESCO, ISBN: 84-453-3638-X. 2003:49-55. Abraham A., Plakas S., Wang M., Jester E., Said K., Granade H., Dickey R., Pierce R., Henry M., 2005. Characterisation of brevetoxin derivatives from Karenia brevis natural blooms and laboratory cultures. Toxin Sympsia and Task Force meeting at AOAC Annual Meeting, Orlando, Florida, USA, 2005. Anderson W.A., Whelan P., Ryan M., McMahon T., James K.J., 2001. Risk Assessment of AZAs (AZAs) in shellfish. Food Safety Authority Ireland, 2001.
Anon., 2005. CRLMB Report of the meeting of the working group on toxicology. 24th - 25th October, 2005, Cesenatico, Italy.
Anon., 2004. Report of the Joint FAO/IOC/WHO ad hoc Expert Consultation on Biotoxins in Molluscan Bivalves (Oslo, Norway, 26–30 September 2004), 31pp. Rome, Italy: Food and Agriculture Organization. Website http://www.fao.org/es/esn/food/risk_biotoxin_en.stm (Accessed 17.01.2006).
Anon., 2002. Commission Decision 2002/225/EC of 15 March 2002 laying down detailed rules for the implementation of Council Directive 91/492/EEC as regards the maximum levels and the methods of analysis of certain marine biotoxins in bivalve molluscs, echinoderms, tunicates and marine gastropods. Official Journal of the European Communities L75, 62-64.
Anon., 2002. Commission Decision 2002/226/EC of 15 March 2002 establishing special health checks for the harvesting and processing of certain bivalve molluscs with a level of amnesic shellfish poison (ASP) exceeding the limit laid down by Council Directive 91/492/EEC (notified under document number C(2002) 1009). Official Journal of the European Communities L75, 65–66. Anon., 1997. Council Directive 97/61/EC of 20 October 1997 amending the Annex to Directive 91/492/EEC laying down the health conditions for the production and placing on the market of live bivalve molluscs. Official Journal of the European Communities L295, 35–36. Aune T., Larsen S., Aasen J., Rehmann N., Satake M., Hess P., 2007. Relative toxicity of dinophysistoxin-2 (DTX2) compared with okadaic acid, based on acute intraperitoneal toxicity in mice. Toxicon, 49, 1-7.

10. References _________________________________________________________________________________________
111
Ben Porath I. & Benvenisty N., 1996. Characterization of a tumor-associated gene, a member of a novel family of genes encoding membrane glycoproteins. Gene, 183, 69-75.
Berenguer J.A., Gonzalez L., Jimenez I., Legarda T.M., Olmedo J.B., Burdaspal P.A., 1993. The effect of commercial processing on the paralytic shellfish poison (PSP) content of naturally contaminated Acanthocardia tuberculatum l. Food Addit. Contam., 10: 217-30.
Bermudo E., Busquets R., Barcelo-Barrachina E., Puignou L., Santos F.J., Galceran M.T., 2003. Preparation of a beef extract as a laboratory RM for the determination of heterocyclic amines. J. Chromatogr. B., 802, 61-68. Bhalla U.S., Ram P.T., & Iyengar R., 2002. MAP kinase phosphatase as a locus of flexibility in a mitogen-activated protein kinase signaling network. Science, 297, 1018-1023. Boenke A., 1997. The food and feed chains-a possible strategy for the production of Certified RMs (CRMs) in the area of mycotoxins? Food Chem., 60 (2), 255-262. Boogaard P.J., Nagelkerke J.F., & Mulder G.J., 1990. Renal proximal tubular cells in suspension or in primary culture as in vitro models to study nephrotoxicity. Chem. Biol. Interact., 76, 251-291.
Brana Magdalena A., Lehane M., Moroney C., Furey A., James K., 2003. Food safety implications of the distribution of AZAs in the tissue compartments of scallops (Pecten maximus). Food Addit. Contam., 20 (2), 154-160. Brombacher S., Edmonds S., Volmer D., 2002. Studies on AZA biotoxins. II. Mass spectral behaviour and structural elucidation of AZA analogues. Rapid Commun. Mass Spectrom., 16, 2306-2316. Brown M.S., Goldstein J.L., 1974. Familial hypercholesterolemia: defective binding of lipoproteins to cultured fibroblasts associated with impaired regulation of 3-hydroxy-3-methylglutaryl coenzyme A reductase activity. Proc. Natl. Acad. Sci., 71, 788-792.
Bruewer M., Luegering A., Kucharzik T., Parkos C.A., Madara J.L., Hopkins A.M., & Nusrat A., 2003. Proinflammatory cytokines disrupt epithelial barrier function by apoptosis-independent mechanisms. J. Immunol., 171, 6164-6172.
Brondello J.M., Pouyssegur J., McKenzie F.R., 1999. Reduced MAP kinase phosphatase-1 degradation after p42/p44MAPK-dependent phosphorylation. Science, 286, 2514-2517.
Burton I., Quilliam M., Walter J., 2005. Quantitative H NMR with external standards: Use in preparation of calibration solutions for algal toxins and other natural products. Anal. Chem., 77, 3123-3131. Clancy V., Willie S., 2004. Preparation and Certification of a RM for the Determination of Nutrients in Seawater. Anal. Bioanal. Chem., 378, no. 5: 1239-42. Collington G.K., Booth I.W., & Knutton S., 1998. Rapid modulation of electrolyte transport in Caco-2 cell monolayers by enteropathogenic Escherichia coli (EPEC) infection. Gut, 42, 200-207.

10. References _________________________________________________________________________________________
112
Colman J.R., Twiner M.J., Hess P., McMahon T., Doucette G.J. and Ramsdell J.S., 2005. Teratogenic effects of AZA-1 identified by microinjection of Japanese Medaka Oryzias latipes embryos. Toxicon, 45, 881-890. Dell’Aversano C., Hess P., Quilliam M.A., 2005. Hydrophilic Interaction Liquid Chromatography-Mass Spectrometry for the Analysis of Paralytic Shellfish Poisoning (PSP) Toxins. J. Chromatogr., 1081, 190-201. Draisci R., Palleschi L., Ferretti E., Furey A., James K., Satake M., Yasumoto T., 2000. Development of a method for the identification of AZA in shellfish by liquid chromatography-tandem mass spectrometry. J. Chromatogr., 871, 12-21.
de Boer J., McGovern E., 2001. Certified RMs for organic contaminants for use in monitoring of the aquatic environment. Trends Anal. Chem., 20 (3), 140-159.
Emons H., Fajgelj A., van der Veen A.M.H., Watters R., 2006. New definitions on reference materials. Accred. Qual. Assur., 2006, 10, 576-578.
Emons H., 2005. The 'RM family'-Identification of all of its members, Accred. Qual. Assur., 10, 690 – 691. Emons H., Linsinger T.P.J., Gawlik B.M., 2004. RMs: terminology and use. Can't one see the woods for the trees? Trends Anal. Chem., 23 (6), 442-449. European Commission (Standards, Measurement and Testing Programme) (1997) Guidelines for the production and certification of BCR RMs. Doc BCR/01/97 1 September 1997. EU/SANCO, 2001. Report of the meeting of the working group on toxicology of DSP and AZP. 21st - 23rd May, Brussels, Belgium.
FAO/IOC/WHO, 2004. Report of the Joint FAO/IOC/WHO ad hoc Expert Consultation on Biotoxins in Bivalve Molluscs. 36th - 30th September, Oslo, Norway. Faure U., Wagstaffe P.J., 1993. Stability of RMs. Fresenius J. Anal. Chem., 345, 124-126. Flanagan A. F., Callanan K. R., Donlon J., Palmer R., Forde A., Kane M., 2001. Cytotoxicity assay for the detection and differentiation of two families of shellfish toxins. Toxicon, 39 (7), 1021-1027. Forsyth C.J., Xu J., Nguyen S.T., Samdal I. A., Briggs J.R., Rundberget T., Sandvik M., Miles C.O., 2006. Antibodies with broad specificity to azaspiracids by use of synthetic haptens. J. Am.Chem. Soc., 128, 15114-15116. Gstraunthaler G.J., 1998. Epithelial cells in tissue culture. Ren. Physiol. Biochem., 11, 1-42.
Hafner C., Meyer S., Langmann T., Schmitz G., Bataille F., Hagen I., Becker B., Roesch A., Rogler G., Landthaler M., & Vogt T., 2005. Ephrin-B2 is differentially expressed in the intestinal epithelium in Crohn's disease and contributes to accelerated epithelial wound healing in vitro. World J. Gastroenterol., 11, 4024-4031.

10. References _________________________________________________________________________________________
113
Hardstaff W. R., Jamieson W. D., Milley J. E., Quilliam M., Sim P. G., 1990. RMs for DA, a marine neurotoxin. Fresenius. J. Anal. Chem., 338, 520-5. Hess P., McCarron P., Quilliam M.A., 2007. Fit for purpose shellfish RMs for internal and external QC in the analysis of phycotoxins. Anal. Bioanal. Chem., 387, 2463-2474. Hess P., Grune B., Anderson D.B., Aune T., Botana L.M., Caricato P., van Egmond H.P., Halder M., Hall S., Lawrence J.F., Moffat C., Poletti R., Richmond J., Rossini G.P., Seamer C., Serratosa Vilageliu J., 2006a. Three Rs approaches in marine biotoxin testing - The report and recommendations of a joint ECVAM/DG SANCO workshop (ECVAM Workshop 55). Alternatives to Laboratory Animals (ATLA) 34, 193-224. Hess P., Scurfield J., Wells D.E., 2006b. Proficiency Testing for the quantitative determination of DA, the amnesic shellfish poisoning toxin. In Proceedings of the 5th International Conference of Molluscan Shellfish Safety, 14–18 June 2004, Galway, Ireland (ed. B. Deegan, C. Butler, C. Cusack, K. Henshilwood, P. Hess, S. Keaveney, T. McMahon, M. O’Cinneide & J. Silke). Galway, Ireland: MI, ISBN 1-902895-33-9. Hess P., Kilcoyne J., Swords D., Mulcahy N., McCarron M., Keogh M., Gibbons B., Ronan J., 2006c. Impact of HPLC-UV Methods (Solid-Phase Extraction/UV Detection and Photodiode-Array Detection) for the Determination of DA on Quality of Results and Sample Turn-Around Time. In Proceedings of the 5th International Conference of Molluscan Shellfish Safety, 14–18 June 2004, Galway, Ireland (ed. Deegan B, Butler C, Cusack C, Henshilwood K, Hess P, Keaveney S, McMahon T, O’Cinneide M, Silke J). Galway, Ireland: MI, ISBN 1-902895-33-9. Hess P., Nguyen L., Aasen J., Keogh M., Kilcoyne J., McCarron P., Aune T., 2005. Tissue distribution, effects of cooking and parameters affecting the extraction of AZAs from mussels, Mytilus edulis, prior to analysis by liquid chromatography coupled to mass spectrometry. Toxicon, 46, 62-71. Hess P., Rehmann N., Kilcoyne J., McCarron P., Bender K., Ryan G., Ryan M., 2004. Biotoxin chemical and toxicological research. Proceedings of the 5th Irish Shellfish Safety Workshop, Cork, 2004. Hess P., McMahon T., Slattery D., Swords D., Dowling G., McCarron M., Clarke D., Gibbons W., Silke J., O Cinneide M., 2003. Use of LC-MS testing to identify lipophilic toxins, to establish local trends and interspecies differences and to test the comparability of LC-MS testing with the mouse bioassay: an example from the Irish biotoxin monitoring programme 2001. Proc. 4th Intl. Conf. Molluscan Shellfish Safety June 4-8, 2002, Xunta De Galicia, IOC of UNESCO, ISBN: 84-453-3638-X. 2003: 57-65. Hess P., McMahon T., O'Cinneide M., 2002. AZA toxins - current and proposed research projects. Proceedings of the 3rd Irish Marine Biotoxin Science Workshop, Galway 14-November-2002. Hess P., McMahon T., Slattery D., Swords D., Dowling D., McCarron M., Clarke D., Devilly L., Gibbons W., Silke J., O'Cinneide M., 2001. Biotoxin Chemical Monitoring in Ireland 2001. Proceedings of the 2nd Irish Marine Biotoxin Science Workshop, Galway, October 11th 2001.

10. References _________________________________________________________________________________________
114
Hippo Y., Yashiro M., Ishii M., Taniguchi H., Tsutsumi S., Hirakawa K., Kodama T., & Aburatani H., 2001. Differential gene expression profiles of scirrhous gastric cancer cells with high metastatic potential to peritoneum or lymph nodes. Cancer Res., 61, 889-895.
Holdsworth S.R., Kitching A.R., & Tipping P.G., 1999. Th1 and Th2 T helper cell subsets affect patterns of injury and outcomes in glomerulonephritis. Kidney Int., 55, 1198-1216.
Hu T., Doyle J., Jackson D., Marr J., Nixon E., Pleasance S., Quilliam M.A., Walter J.A., Wright J.L.C., 1992. Isolation of a New Diarrhetic Shellfish Poison from Irish Mussels. J. Chem. Soc. Chem. Commun. 30, 39-41.
Inagi R., Nangaku M., Onogi H., Ueyama H., Kitao Y., Nakazato K., Ogawa S., Kurokawa K., Couser W.G., & Miyata T., 2005. Involvement of endoplasmic reticulum (ER) stress in podocyte injury induced by excessive protein accumulation. Kidney Int., 68, 2639-2650.
In't Veld P.H., 1998. The use of RMs in quality assurance programmes in food microbiology laboratories. Int. J. Food Microbiol., 45, 35-41. Ishibashi T., Bottaro D.P., Michieli P., Kelley C.A., & Aaronson S.A., 1994. A novel dual specificity phosphatase induced by serum stimulation and heat shock. J. Biol. Chem., 269, 29897-29902.
Ishikawa Y., Nishiyama S., 2003. Synthesis of the BCD ring system of AZA : construction of the trispiro ring structure by the thioether approach. Tetrahedron lett., 45, 351-354. ISO., 2000. Uses of certified RMs. ISO, 2 (33). ISO., 1997. Calibration in analytical chemistry and use of certified RMs. ISO, 1 (32). ISO guide 30, 1992. Terms and definitions used in connection with RMs. ISO, 2nd edn., Geneva. Ito E., Frederick M. O., Koftis T., Tang W., Petrovic G., Ling T., Nicolaou K., 2006. Structure toxicity relationships of synthetic AZA-1 and analogues in mice. Harmful Algae, 5:586-591.
Ito E., Satake M., Ofuji K., Higashi M., Harigaya K., McMahon T., Yasumoto T., 2002. Chronic effects in mice caused by oral administration of sublethal doses of AZA, a new marine toxin isolated from mussels. Toxicon, 40 (2), 193-203. Ito E., Satake M., Ofuji K., Kurita N., McMahon T., James K., Yasumoto T., 2000. Multiple organ damage caused by a new toxin AZA, isolated from mussels produced in Ireland. Toxicon, 38 (7), 917-930.
Ito E.,Terao K., McMahon T., Silke J., Yasumoto T., 1998. Acute pathological changes in mice caused by crude extracts of novel toxins isolated from Irish mussels. In: Reguera, B.; Blanco, J.; Fernandez, M. L., and Wyatt, T., Eds. Proc. 8th Intl. Conf. Harmful AlgaeVigo: Xunta de Galicia and IOC/UNESCO; 1998, 588-589. Jain A., Tindell C.A., Laux I., Hunter J.B., Curran J., Galkin A., Afar D.E., Aronson N., Shak S., Natale R.B., & Agus D.B., 2005. Epithelial membrane protein-1 is a biomarker of gefitinib resistance. Proc. Natl. Acad. Sci., 102, 11858-11863.

10. References _________________________________________________________________________________________
115
James K., Diaz-Sierra M., Lehane M., Brana-Magdalena A., Furey A., 2003a. Detection of five new hydroxyl analogues of AZA in shellfish using multiple tandem mass spectrometry. Toxicon, 41, 277-283. James K.J., Moroney C. Roden C. Satake M. Yasumoto T. Lehane M. Furey A., 2003b. Ubiquitious 'benign' alga emerges as the cause of shellfish contamination responsible for the human toxic syndrome, azaspiracid poisoning. Toxicon. 41:145-151. James K.J., Furey A., Lehane M., Ramstad H., Aune T., Hovgaard P., Morris S., Higman W., Satake M., Yasumoto T., 2002. First evidence of an extensive northern European distribution of AZP (AZP) toxins in shellfish. Toxicon, 40, 909-915. James K.J., Furey A., Satake M., Yasumoto T., 2001. AZA poisoning (AZP): A new shellfish toxic syndrome in Europe. Harmful Algal blooms, 250-253. Jorhem Lars., 2004. Proper use of certified RMs? Accred. Qual. Assur., 9, 507-508. Josephs R. D., Koeber R., linsinger T. P. J., Bernreuther A., Ulberth F., Schimmel H., 2004. Production of certified RMs for mycotoxins: IRMM's view on the assessment of uncertainties. Anal. Bioanal. Chem., 378 (5), 1190-1197. Kulagina N.V., Twiner M.J., Doucette G.J., Ramsdell J.S., Hess P., McMahon T., O'Shaughnessy T.J., Ma W., 2006. AZA-1 inhibits bioelectrical activity of spinal cord neuronal networks. Toxicon, 47, 766-773. Kramer K.J.M., Kramer G.N., Muntau H., 2003. Practical manual for the production of laboratory RMs; 2nd edition of report initially prepared for EU Commission DG Sanco from project “Training on production and use of laboratory RMs for use in QC”, TRAP-LRM G6MA-CT2000-02006, Mermayde Publications, Bergen (Netherlands) P.O. Box 109, 1860 AC Bergen, The Netherlands. Lamberty A., Schimmel H., Pauwels J., 1998. The study of the stability of RMs by isochronous measurements. Fresenius. J. Anal. Chem., 360, 359-361. Landsberg J.H., 2002. The effects of harmful algal blooms on aquatic organisms. Res Fish. Sci., 10 (2), 113-390. Lawrence J. F., Maher M., Watson-Wright W., 1994. Effect of cooking on the concentration of toxins associated with paralytic shellfish poison in lobster hepatopancreas. Toxicon, 32: 57-64. Leira F. J., Vieites J.M., Botana L.M., Vyeites L. M., 1998. DA levels of naturally contaminated scallops as affected by canning. J. Food Sci., 63, no. 6: 1081-83. Lehane M., Brana-Magdalena A., Moroney C., Furey A., James K.J., 2002. Liquid chromatography with electrospray ion trap mass spectrometry for the determination of five AZAs in shellfish. J. Chromatogr. A, 2002, 950, 139-147.

10. References _________________________________________________________________________________________
116
Lehane M., Saez M.J.F., Magdalena A.B., Canas I.R., Sierra M.D., Hamilton B., Furey A., James K.J., 2004. Liquid chromatography-multiple tandem mass spectrometry for the determination of ten AZAs, including hydroxyl analogues in shellfish. J. Chromatogr. A, 1024, 63-70. Lin K.Y., Pan J.P., Yang D.L., Huang K.T., Chang M.S., Ding P.Y., & Chiang A.N, 2001. Evidence for inhibition of low density lipoprotein oxidation and cholesterol accumulation by apolipoprotein H (beta2-glycoprotein I). Life Sci., 69, 707-719. Linsinger T.P.J., Pauwels J., Van der Veen A.M.H., Schimmel H., Lamberty A., 2004. Homogeneity and stability of RMs. Accred. Qual. Assur., 6, 20-25. MacKenzie L., Beuzenberg V., Holland P., McNabb P., Selwood A., 2004. Solid phase adsorption toxin tracking (SPATT): a new monitoring tool that simulates the biotoxin contamination of filter feeding bivalves. Toxicon, 44, 901-918. Magdalena A., Lehane M., Krys S., Fernandez M., Furey A., James K, 2003. The first identification of azaspiracids in shellfish from France and Spain. Toxicon, 42, 105-108. Maier E.A., Boenke A., Mériguet P., 1997. Importance of Certified RMs Programmes for the European Union. Trends Anal. Chem., 16 (9), 496-503. Matthais R., Heinze Grobecker K., 1999. Homogeneity studies of RMs by solid sampling - AAS and INAA. Accred. Qual. Assur., 4, 498-503. McCarron P., Kotterman M., de Boer. J., Rehmann R., Hess P., 2007a. Feasibility of irradiation as a stabilisation technique in the preparation of tissue RMs for a range of shellfish toxins. Anal. Bioanal. Chem., 387, 2487-2493. McCarron P., Emteborg H., Hess P., 2007b. Freeze-drying for the stabilisation of shellfish toxins in mussel tissue (Mytilus edulis) RMs. Anal. Bioanal. Chem., 387, 2475-2486. McCarron P., Kilcoyne J., Hess P., 2007c. Effects of cooking and heat treatment on concentration and tissue distribution of AZAs, okadaic acid and dinophysistoxin-2 in mussels (Mytilus edulis). Submitted to Toxicon, Feb 2007, (TOXCON-D-07-00056). McCarron P., Burrell S., Hess P., 2007d. Effect of addition of antibiotics and an antioxidant, on the stability of tissue RMs for DA, the amnesic shellfish poison. Anal. Bioanal. Chem., 387, 2495-2502. McCarron P., Kilcoyne J., Hess P., 2006. Preparation of stable, homogenous shellfish tissue materials, naturally contaminated with dinophysistoxins and AZAs. In Proc. 5th Intl. Conf. Molluscan Shellfish Safety, 14–18 June 2004, Galway, Ireland (ed. B. Deegan, C. Butler, C. Cusack, K. Henshilwood, P. Hess, S. Keaveney, T. McMahon, M. O’Cinneide & J. Silke). MI, ISBN 1-902895-33-9. McCarron P., Hess P., 2006. Tissue distribution and effects of heat treatments on the content of DA in blue mussels, Mytilus edulis. Toxicon, 2006, 47, 473-479. McMahon T., Silke J., 1996. Winter toxicity of unknown aetiology in mussels. Harmful Algal News, 14.

10. References _________________________________________________________________________________________
117
McMahon T., Silke J., 1998. Re-occurrence of winter toxicity. Harmful Algal News, 17. McNamara B.P., Koutsouris A., O'Connell C.B., Nougayrede J.P., Donnenberg M.S., & Hecht G., 2001. Translocated EspF protein from enteropathogenic Escherichia coli disrupts host intestinal barrier function. J. Clin. Invest, 107, 621-9. Miles C.O., Wilkins A.L., Munday R., Dines M.H., Hawkes A.D., Briggs L.R., Sanvik M., Jensen D.J., Cooney J.M., Holland P.T., Quilliam M.A., MacKenzie A.L., Beuzenberg V., Towers N., 2004. Isolation of pectenotoxin-2 from Dinophysis acuta and its conversion to pectenotoxin-2 seco acid and preliminary assessment of their acute toxicities. Toxicon, 43, 1-9. Morel P.A. & Oriss T.B., 1998. Crossregulation between Th1 and Th2 cells. Crit. Rev.Immunol., 18, 275-303.
Mosmann T.R. & Sad S., 1996. The expanding universe of T-cell subsets: Th1, Th2 and more. Immunol. Today, 17, 138-146.
Morabito R., P. Massanisso C. Cámara T. Larsson W. Frech K.J.M. Kramer M. Bianchi, H. Muntau, O.F.X. Donard, R. Lobinski, S. McSheehy, F. Pannier, M. Potin-Gautier, B.M. Gawlik, S. Bowadt, Ph. Quevauviller., 2004. Towards a new Certified RM for butylins, methylmercury and arsenobetaine in oyster tissue. Trends Anal. Chem., 23 (9), 664-676. Muda M., Boschert U., Dickinson R., Martinou J.C., Martinou I., Camps M., Schlegel W., & Arkinstall S., 1996. MKP-3, a novel cytosolic protein-tyrosine phosphatase that exemplifies a new class of mitogen-activated protein kinase phosphatase. J. Biol. Chem., 271, 4319-4326.
Nagase H., Barrett A.J., & Woessner J.F., Jr., 1992. Nomenclature and glossary of the matrix metalloproteinases. Matrix Suppl., 1, 421-424.
Nicolaou K., Yamada Y., Petrovic G., Koftis T., Vyskosil S., Ling T., Tang W., Qian W., Frederick M., Chen D., Satake M., 2004a. Structural revision and total synthesis of AZA-1, Part1: Intelligence gathering and tentative proposal; Angew. Chem., 116, 4412-4418. Nicolaou K., Yamada Y., Petrovic G., Koftis T., Vyskosil S., Ling T., Tang W., Qian W., Frederick M., Chen D., 2004b. Structural revision and total synthesis of AZA-1, Part2: Definition of the ABCD domain and total synthesis; Angew. Chem., 116, 4418-4424. Nicolaou K., Li Y., Uesaka N., Koftis T., Vyskosil S., Ling T., Govindasamy M., Qian W., Bernal F., Chen D., 2003a. Total synthesis of the proposed AZA-1 structure, Part1: Construction of the enantiomerically pure C1-C20, C21-C27, and C28-C40 fragments; Angew. Chem., 115, 3771-3776. Nicolaou K., Li Y., Uesaka N., Koftis T., Vyskosil S., Ling T., Govindasamy M., Qian W., Bernal F., Chen D., 2003b. Total synthesis of the proposed AZA-1 structure, Part2: Coupling of the C1-C21, C21-C27, and C28-C40 fragments and the completion of the synthesis; Angew. Chem., 115, 3777-3781. NRC-CNRC, Institute for Marine Biosciences, 2005. NRC CRM-ASP-Mus-c (2005) and NRC CRM-DSP-mus-b. Certificates of Analysis.

10. References _________________________________________________________________________________________
118
Ofuji K., Satake M., McMahon T., James K., Naoki H., Oshima Y., Yasumoto T., 2001. Structures of AZA analogues, AZA-4 and AZA-5, causative toxins of AZP in Europe; Biosci. Biochem. Biotech., 65 (3), 740-742. Ofuji K.; Satake M.; Oshima Y.; McMahon T.; James K.J., and Yasumoto T., 1999. A sensitive and specific determination method for AZAs by liquid chromatography mass spectrometry. Nat. Toxins, 7, 247-250. Ofuji K., Satake M., McMahon T., Silke J., James K., Naoki H., Oshima Y., Yasumoto T., 1999. Two analogues of AZA isolated from mussels, Mytilus edulis, involved in human intoxication in Ireland; Nat. Toxins, 7, 99-102. Olivier L. M., Chambliss K. L., Gibson K. M., Krisans S. K., 1999. Characterization of phosphomevalonate kinase: chromosomal localization, regulation, and subcellular targeting. J. Lipid Res., 40 (4), 672-679. Ozawa K., Kondo T., Hori O., Kitao Y., Stern D.M., Eisenmenger W., Ogawa S., & Ohshima T., 2001. Expression of the oxygen-regulated protein ORP150 accelerates wound healing by modulating intracellular VEGF transport. J. Clin. Invest, 108, 41-50.
Pober J.S. & Cotran R.S., 1990. The role of endothelial cells in inflammation. Transplantation, 50, 537-544.
QUASIMEME, 2006. Report “DE-10 Shellfish Toxins Round 43 – Exercise 696 November – December 2005”, report version 1.0 of 9-March-2006, accessed on sharepoint-part of the website: (www.quasimeme.org), last accessed: 02 June 2006. Quevauviller Ph., 2001. RMs: A gap in the quality systems? Fresenius J. Anal. Chem., 368, 737-738. Quevauviller P., Maier E.A., 1999. Interlaboratory studies and certified RMs for environmental analysis; 558 pp., vol. 22 in series: “Techniques and Instrumentation in Analytical Chemistry”, Elsevier Science B.V. ISBN: 0-444-82389-1. Quevauviller Ph., 1999. RMs: an inquiry into their use and prospects in Europe. Trends Anal. Chem., 18 (2), 76-85. Quilliam M.A., Reeves K., MacKinnon S., Craft C., Whyte H., Walter J., Stobo L., Gallacher S., 2006. Preparation of RMs for AZAs. In Proceedings of the 5th International Conference of Molluscan Shellfish Safety, 14–18 June 2004, Galway, Ireland (ed. Deegan B, Butler C, Cusack C, Henshilwood K, Hess P, Keaveney S, McMahon T, O’Cinneide M, Silke J). Galway, Ireland: MI, ISBN 1-902895-33-9. Quilliam M.A.; Hess P., Dell'Aversano C., 2001. Recent developments in the analysis of phycotoxins by liquid chromatography - mass spectrometry. Chapter 11 in "Mycotoxins and Phycotoxins in Perspective at the Turn of the Millenium", Editors: Willem J. De Koe, Robert A. Samson, Hans P. Van Egmond, John Gilbert and Myrna Sabino. Proceedings of the Xth International IUPAC Symposium on Mycotoxins and Phycotoxins - 21-25 May, 2000 Guaruja (Brazil): 383-391, ISBN: 90-9014801-9. Quilliam M., Wright J., 1989. The amnesic shellfish poisoning mystery; Anal. Chem., 1989, 61, (18), 1053-1060.

10. References _________________________________________________________________________________________
119
Riegler M., Sedivy R., Pothoulakis C., Hamilton G., Zacherl J., Bischof G., Cosentini E., Feil W., Schiessel R., LaMont J.T., & et al., 1995. Clostridium difficile toxin B is more potent than toxin A in damaging human colonic epithelium in vitro. J. Clin. Invest, 95, 2004-11. Roy H., Bhardwaj S., & Yla-Herttuala S., 2006. Biology of vascular endothelial growth factors. FEBS Lett., 580, 2879-2887. Román Y., Alfonso A., Vieytes M. R., Ofuji K., Satake M., Yasumoto T., Botana L.M., 2004. Effects of AZAs 2 and 3 on Intracellular cAMP [Ca2+], and pH. Chem. Res. Toxicology, 17, 1338-1349. Roman Y., Alfonso A., Louzao M. C., de la Rosa L. A., Leira F., Vieites J. M., Vieytes M. R., Ofuji K., Satake M., Yasumoto T., Botana L. M., 2002. AZA-1, a potent, nonapoptotic new phycotoxin with several cell targets. Cell. Signal., 14 (8), 703-716. Ronzitti G., Hess P., Rehmann N., Rossini G.P., 2007. AZA1 alters the E-cadherin pool in epithelial cells; Toxicol. Sci., 95 (2), 427-435. Ruckold S., Heinz Grobecker K., Isengard H.D., 2001. The effects of drying on biological matrices and the consequences for RMs. Food Control, 12, 401-407. Satake M., Ofuji K., Naoki H., James K., Furey A., McMahon T., Silke J., Yasumoto T., 1998a. AZA, a new marine toxin having unique spiro ring assemblies, isolated from Irish mussels, Mytilus edulis. J. Am. Chem. Soc., 120, 9967-9968. Satake M.; Ofuji K.; James K.; Furey A., and Yasumoto T., 1998b. New toxic event caused by Irish mussels. In: Reguera, B.; Blanco, J.; Fernandez, M. L., and Wyatt, T., Eds. Proc. 8th Intl. Conf. Harmful AlgaeVigo: Xunta de Galicia and IOC/UNESCO; 1998: 468-469. Schor A.P., Carvalho F.M., Kemp C., Silva I.D., & Russo J., 2006. S100P calcium-binding protein expression is associated with high-risk proliferative lesions of the breast. Oncol. Rep., 15, 3-6.
Schrijver De K., Maes I., Man De L., Michelet J., 2002. An outbreak of diarrhoeic shellfish poisoning in Antwerp, Belgium. Eurosurveillance, 7(10), 139-141. Sier C.F., Quax P.H., Vloedgraven H.J., Verheijen J.H., Griffioen G., Ganesh S., Lamers C.B., & Verspaget H.W., 1993. Increased urokinase receptor levels in human gastrointestinal neoplasia and related liver metastases. Invasion Metastasis, 13, 277-288. Stobo L.A., Lacaze J.P., Scott C.L., Gallagher S., Smith E.A., Quilliam M.A., 2005. Lipid Chromatography with Mass Spectrometry-Detection of lipophilic Shellfish Toxins. J. AOAC Int., 88(5), 1371-1382. Taleb H., Vale P., Amanhir R., Benhadouch A., Sagou R., Chafik, A., 2006. First detection of AZAs in North West Africa. J. Shell. Res. 25(3), 1067-1071. Tanaka M., Kamata R., Sakai R., 2005. EphA2 phosphorylates the cytoplasmic tail of Claudin-4 and mediates paracellular permeability. J. Biol. Chem., 280, 42375-42382.

10. References _________________________________________________________________________________________
120
Thompson M., 2004. Test for ‘sufficient homogeneity’ in a RM. AMC recommendation. Twiner M.J., Hess P., Bottein Dechraoui M.Y., McMahon T., Ramsdell J.S., Samons M.S., Satake M., Yasumoto T., Doucette G.J., 2005. Cytotoxic and cytoskeletal effects of AZA-1 on multiple mammalian cell lines. Toxicon, 45, 891-900. Van der Veen A. M. H., 2004. Trends in the certification of RMs. Accred. Qual. Assur., 9 (4), 232-236. Van Egmond H.P., 2005. Validation Issues and CRMs, Oral presentation at Wiley Award Symposium of the 2005 Annual Conference of the AOAC, Orlando, 2005, FL, US. Van Egmond H.P., Mourino A., Burdaspal P.A., Bustos J., Legarda T., Mesego A., Paulsch W.E., Salgado C., Top H.J.van den, Boenke A., 1998. The certification of the mass fractions of saxitoxin and dc-saxitoxin in two mussel RMs (CRMs 542 & 543) including the identification of other PSP-toxins and a spiking procedure based on an enrichment solution (CRM 663) with a certified mass concentration of saxitoxin. European Commission, 1998, EUR 18318EN. Van Egmond H.P., Wagstaffe P.J., 1988. Development of milk powder RMs certified for aflatoxin M1 content (part II): certification of milk powder RM 283. J. AOAC Int., 71, 1180-1182. Van Egmond H.P., Wagstaffe P.J., 1987. Development of milk powder RMs certified for aflatoxin M1 content (part I). J. AOAC Int., 70, 605-610.
Van Kooten C., van, d.L., X, Woltman A.M., van Es L.A., & Daha M.R., 1999. Synergistic effect of interleukin-1 and CD40L on the activation of human renal tubular epithelial cells. Kidney Int., 56, 41-51.
Venelinov T., Sahuquillo A., 2006. Optimizing the uses and the costs of RMs in analytical laboratories. Trends Anal. Chem., 25, 528-533. Venelinov T., Quevauviller Ph., 2001. Are certified RMs really expensive? Trends Anal. Chem., 22 (1). Vieites J.M., Botana L.M., Vieytes M.R., Leira F.J., 1999. Canning process that diminishes paralytic shellfish poison in naturally contaminated mussels (Mytilus galloprovincialis). J. Food Protect., 62: 515-19. Vieytes M. R., Fontal O. L., Leira F., Baptista de Sousa J. M. V., Botana L. M., 1997. A fluorescent microplate assay for diarrheic shellfish toxins. Anal. Biochem., 248, 258-264.
Volmer D. A., Brombacher S., Whitehead B., 2002. Studies of AZA biotoxins. I. Ultrafast high-resolution liquid chromatography/mass spectrometry separations using monolithic columns. Rapid Commun. Mass Spectrom., 16, 2298-2305. Wang H., Yang L., Jamaluddin M.S., & Boyd D.D., 2004. The Kruppel-like KLF4 transcription factor, a novel regulator of urokinase receptor expression, drives synthesis of this binding site in colonic crypt luminal surface epithelial cells. J. Biol. Chem., 279, 22674-22683.

10. References _________________________________________________________________________________________
121
Wilkins A.L., Rehmann N., Torgersen T., Rundberget T., Keogh M., Petersen D., Hess P., Rise F., Miles C., 2006. Identification of fatty acid esters of pectenotoxins-2 seco acid in blue mussels (Mytilus edulis) from Ireland. J. Agric. Food Chem., 54, 5672-5678. Wolka M., 2000. How do accreditors deal with the providers of proficiency tests and with producers of RMs. Accred. Qual. Assur., 5, 504-505. Yazgan S., Bernreuther A.., Ulberth F., Isengard H.D., 2005. Water - an important parameter for the preparation and proper use of certified RMs. Food Chem., 96, 411-417. Yu D., Jing T., Liu B., Yao J., Tan M., McDonnell T.J., Hung M.C., 1998. Overexpression of ErbB 2 blocks Taxol-induced apoptosis by upregulation of p21Cip1, which inhibits p34Cdc 2 kinase. Mol. Cell, 2, 581-591. Zhao W., Hisamuddin I.M., Nandan M.O., Babbin B.A., Lamb N.E., Yang V.W., 2004. Identification of Krupple-like factor 4 as a potential tumor suppressor gene in colorectal cancer. Oncogene, 23, 395-402.