ISOLATION AND CHARACTERIZATION OF Proteus mirabilis …eprints.usm.my/31440/1/IAW_THESIS_23.pdf ·...
45
ISOLATION AND CHARACTERIZATION OF Proteus mirabilis AND Escherichia coli BACTERIOPHAGES IRA ARYANI BINTI WIRJON UNIVERSITI SAINS MALAYSIA 2015
Transcript of ISOLATION AND CHARACTERIZATION OF Proteus mirabilis …eprints.usm.my/31440/1/IAW_THESIS_23.pdf ·...

ISOLATION AND CHARACTERIZATION OF
Proteus mirabilis AND Escherichia coli
BACTERIOPHAGES
IRA ARYANI BINTI WIRJON
UNIVERSITI SAINS MALAYSIA
2015
ISOLATION AND CHARACTERIZATION OF
Proteus mirabilis AND Escherichia coli
BACTERIOPHAGES
by
IRA ARYANI BINTI WIRJON
Thesis submitted in fulfillment of the requirements for the degree of
Doctor of Philosophy
OCTOBER 2015

ii
ACKNOWLEDGEMENT
In the name of Allah, the Most Gracious and the Most Merciful
Prayers and peace be upon His Prophet Muhammad S.A.W.
Alhamdulillah, all praises to Allah for the strengths and His blessing in completing
the works and thesis of this research. My deepest appreciation goes to my supervisor, Assoc.
Prof Dr. Yahya Mat Arip for his constant supervision, assistance and encouragement. His
invaluable help of providing constructive comments and suggestions throughout the
experimental and thesis works have contributed to the success of this valuable research. This
thesis would not have been possible without his steadfast support and intellectual guidance.
Not forgotten, my appreciation to all technicians and office staff of the School of Biological
Sciences. I am sincerely grateful to the Institute of Postgraduate Studies staff who have
directly or indirectly lent a helping hand in this venture. I would like to express my heartfelt
thanks to all fellow laboratory colleagues from Lab 218 for their kindness, guidance, morale
support and advice during the research period. Thanks again to my colleagues for the
friendship and memories. My earnest gratitude also goes to my beloved husband and family,
especially my parents, Mr. Wirjon bin Saharuddin and Mrs. Emiyati binti Amir for their
endless love, prayers and encouragement. To those who indirectly contributed in this
research, your kindness means a lot to me. Thank you very much. Finally, I would like to
wholeheartedly acknowledge that this research also would not have been possible without
the financial assistance of the MyPhD scholarship, research grant and my position as a USM
graduate assistant, thus hereto expressing my gratitude to those agencies.
Ira Aryani Wirjon
October 2015
iii
TABLE OF CONTENTS
PAGE
ACKNOWLEDGEMENT ..................................................................................................... ii
TABLE OF CONTENTS ..................................................................................................... iii
LIST OF TABLES ................................................................................................................ ix
LIST OF FIGURES .............................................................................................................. xi
LIST OF ABBREVIATIONS ............................................................................................ xiii
LIST OF SYMBOLS .......................................................................................................... xvi
ABSTRAK .......................................................................................................................... xvii
ABSTRACT ......................................................................................................................... xix
1 GENERAL INTRODUCTION ..................................................................................... 2
1.1 Problem statement .................................................................................................... 2
1.2 Objectives ................................................................................................................ 4
1.3 Outline of thesis ....................................................................................................... 4
2 LITERATURE REVIEW ............................................................................................. 7
2.1 Virus definition ........................................................................................................ 7
2.2 Nature of the virion .................................................................................................. 9
2.2.1 Virion size ........................................................................................................ 9
2.2.2 Virion genome ................................................................................................ 11
2.2.3 Virion architecture .......................................................................................... 11
2.3 Overview of phages ............................................................................................... 13
2.3.1 The discovery of phages ................................................................................. 13

iv
2.3.2 Phage diversity ............................................................................................... 14
2.3.3 Classification of phages .................................................................................. 15
2.3.4 Phage life cycle .............................................................................................. 19
2.3.5 Genomics and evolution of phages................................................................. 22
2.4 Phage-host interactions .......................................................................................... 24
2.4.1 Bacterial hosts evolution: the role of phages .................................................. 24
2.4.2 Phage contribution to the virulence of the host .............................................. 25
2.5 Proteus mirabilis .................................................................................................... 26
2.6 Escherichia coli O157:H7 ...................................................................................... 31
2.7 Phage therapy ......................................................................................................... 37
2.7.1 Phage therapy versus antibiotics .................................................................... 42
2.8 Other applications .................................................................................................. 44
3 GENERAL MATERIALS AND METHODS ........................................................... 47
3.1 Materials ................................................................................................................ 47
3.2 Bacterial strains, plasmids and competent cells ..................................................... 48
3.3 Phages T4 and T7 .................................................................................................. 51
3.4 General methods .................................................................................................... 51
3.4.1 Sterilization .................................................................................................... 51
3.4.2 Bacterial culture ............................................................................................. 51
3.4.3 Bacterial storage ............................................................................................. 52
3.4.4 Centrifugation ................................................................................................. 52
3.4.5 Optical density (OD) measurement ................................................................ 53
3.5 General analytical method ..................................................................................... 53
3.5.1 Plaque assays .................................................................................................. 53
3.6 Sequencing analysis ............................................................................................... 54

v
4 ISOLATION OF PHAGES FROM RAW SEWAGE TREATMENT
FACILITY .................................................................................................................... 56
4.1 Introduction ............................................................................................................ 56
4.2 Materials and methods ........................................................................................... 59
4.2.1 Bacterial hosts ................................................................................................ 59
4.2.1.1 Verification of Proteus mirabilis ................................................................ 59
4.2.1.1.1 BactiDropTM
Oxidase ........................................................................... 59
4.2.1.1.2 RapIDTM
ONE System ......................................................................... 60
4.2.2 Sample collection and processing .................................................................. 61
4.2.3 Phage isolation ............................................................................................... 61
4.2.4 Phage screening .............................................................................................. 61
4.2.5 Phage purification........................................................................................... 62
4.2.6 Phage enrichment ........................................................................................... 63
4.2.7 Phage titration and plaque morphology .......................................................... 63
4.2.8 Transmission electron microscopy (TEM) ..................................................... 64
4.3 Results .................................................................................................................... 65
4.3.1 Verification of Proteus mirabilis ................................................................... 65
4.3.2 Phage isolation, titration and plaque morphology .......................................... 67
4.3.3 TEM observation ............................................................................................ 73
4.4 Discussion .............................................................................................................. 78
4.5 Conclusion ............................................................................................................. 85
5 CHARACTERIZATION OF THE ISOLATED PHAGES ..................................... 87
5.1 Introduction ............................................................................................................ 87
5.2 Materials and methods ........................................................................................... 90
5.2.1 Host range analysis ......................................................................................... 90

vi
5.2.2 Genomic characterization ............................................................................... 90
5.2.2.1 Extraction of genome ................................................................................. 90
5.2.2.2 Determination of nucleic acid type ............................................................. 91
5.2.2.3 DNA restriction analysis and size estimation ............................................. 92
5.2.2.4 Genomic profile comparison of isolated phages with phages λ, T4
and T7 ......................................................................................................... 94
5.2.3 Protein profiling ............................................................................................. 94
5.2.3.1 Gels preparation.......................................................................................... 95
5.2.3.2 Sample preparation ..................................................................................... 96
5.2.3.3 SDS-PAGE analysis procedures ................................................................. 97
5.2.4 Effects of physicochemical attributes on phage infectivity ............................ 98
5.2.4.1 Effect of pH ................................................................................................ 98
5.2.4.2 Effect of temperature .................................................................................. 99
5.2.4.3 Effect of salinity ......................................................................................... 99
5.2.5 Single-step growth curve analysis ................................................................ 100
5.2.6 DNA cloning ................................................................................................ 101
5.2.6.1 DNA library preparation for cloning ........................................................ 101
5.2.6.2 DNA purification ...................................................................................... 102
5.2.6.3 DNA cloning into pUC18 plasmid vector ................................................ 103
5.2.6.4 DNA cloning into pSMART-LCKan plasmid vector ............................... 104
5.2.6.5 Colony PCR .............................................................................................. 106
5.2.6.6 Plasmid isolation ...................................................................................... 107
5.2.6.7 Sequencing analysis of clones .................................................................. 108
5.2.7 Verification of the insert genomic DNA sequences ..................................... 108
5.2.7.1 Primer design ............................................................................................ 109

vii
5.2.7.2 PCR amplification .................................................................................... 109
5.3 Results .................................................................................................................. 111
5.3.1 Host range analysis ....................................................................................... 111
5.3.2 Determination of nucleic acid type............................................................... 113
5.3.3 Genome restriction analysis and size estimation .......................................... 115
5.3.4 Genomic comparison of isolated phages with well-studied phages T4,
T7 and λ ........................................................................................................ 122
5.3.5 SDS-PAGE analysis ..................................................................................... 124
5.3.6 The effect of pH on the infectivity of phages ............................................... 127
5.3.7 The effect of temperature on the infectivity of phages ................................. 129
5.3.8 The effect of salinity on the infectivity of phages ........................................ 131
5.3.9 Single-step growth curve analysis ................................................................ 133
5.3.10 Colony PCR of positive clones carrying the inserts genomic DNA
from random ligation of digested DNA into plasmid vectors ...................... 136
5.3.11 DNA sequencing analysis of the clones ....................................................... 138
5.3.12 Verification of inserts genomic DNA sequences ......................................... 140
5.4 Discussions .......................................................................................................... 142
5.5 Conclusion ........................................................................................................... 155
6 GENOMIC AND in vitro ANALYSIS OF PHAGE pPM_01 INFECTING
Proteus mirabilis ......................................................................................................... 157
6.1 Introduction .......................................................................................................... 157
6.2 Materials and methods ......................................................................................... 159
6.2.1 Primer walking ............................................................................................. 159
6.2.1.1 Genomic library preparation for PCR enrichment of Genome
Walker™ .................................................................................................. 159
6.2.1.2 DNA ligation to GenomeWalkerTM
adaptors............................................ 160
6.2.1.3 PCR enrichment using GenomeWalkerTM
Universal kit .......................... 160
viii
6.2.1.4 Blunt-ended PCR product generation for DNA cloning into
pSMART-LCKan plasmid vector ............................................................. 161
6.2.1.5 Colony PCR of pSMART-LCKan clones ................................................ 162
6.2.1.6 Primer walking sequencing method ......................................................... 162
6.2.1.7 Primer walking sequences assembly and analysis .................................... 163
6.2.2 Genome sequencing and annotation of phage pPM_01 ............................... 166
6.2.3 In vitro analysis ............................................................................................ 167
6.3 Results .................................................................................................................. 168
6.3.1 PCR enrichment using Genome WalkerTM
for primer walking .................... 168
6.3.2 Colony PCR of pSMART-LCKan clones carrying inserts genomic
DNA of secondary PCR products................................................................. 170
6.3.3 DNA sequencing analysis of assembled primer walking sequences of
phage pPM_01 .............................................................................................. 172
6.3.4 Genome analysis of phage pPM_01 ............................................................. 174
6.3.5 Alignment of DNA fragment sequences against whole genome
sequence of phage pPM_01 .......................................................................... 185
6.3.6 In vitro analysis ............................................................................................ 194
6.4 Discussion ............................................................................................................ 197
6.5 Conclusion ........................................................................................................... 208
7 CONCLUSION .......................................................................................................... 210
RECOMMENDATION ..................................................................................................... 211
REFERENCES ................................................................................................................... 212
APPENDICES .................................................................................................................... 227

ix
LIST OF TABLES
PAGE
Table 2.1: Overview of phage families ............................................................................ 17
Table 2.2: Potential virulence factors in EHEC/VTEC isolates from human and
cattle origin. .................................................................................................... 34
Table 2.3: Human phage therapy studies performed in the former Soviet Union. ........... 38
Table 3.1: Sources of materials ........................................................................................ 47
Table 3.2: Sources of bacterial strains ............................................................................. 48
Table 3.3: Plasmids .......................................................................................................... 50
Table 3.4: Competent cells ............................................................................................... 50
Table 4.1: Physiological characteristics of P. mirabilis based on RapIDTM
ONE
System test kit analysis ................................................................................... 66
Table 4.2: Determination of phage titer ........................................................................... 71
Table 4.3: Morphology of the plaque ............................................................................... 72
Table 5.1: Treatment of the extracted genome using DNase I and RNase A ................... 92
Table 5.2: Restriction enzyme analysis of phage genomes .............................................. 93
Table 5.3: Solutions for SDS-PAGE analysis .................................................................. 94
Table 5.4: Recipes for Polyacrylamide Resolving and Stacking Gels ............................. 96
Table 5.5: Preparation of blunt-ended DNA fragments ................................................. 102
Table 5.6: Primers used for verification of the insert DNA sequences .......................... 109
Table 5.7: Host range analysis of the isolated phages toward various bacteria ............. 112
Table 5.8: Estimation of phage pPM_01 genome size based on the standard
graph ............................................................................................................. 118
Table 5.9: Estimation of phage pEC_02 genome size based on the standard graph ...... 119
Table 5.10: Estimation of phage pEC_03 genome size based on the standard graph ...... 121

x
Table 5.11: NCBI BLAST using sequence obtained from clone 1 of phage
pPM_01 ......................................................................................................... 139
Table 5.12: NCBI BLAST using sequence obtained from clone 2 of phage
pEC_02 ......................................................................................................... 139
Table 6.1: Adaptor primers ............................................................................................ 160
Table 6.2: Primers used for primer walking ................................................................... 164
Table 6.3: NCBI BLAST of assembled primer walking sequences for phage
pPM_01 ......................................................................................................... 173
Table 6.4: NCBI BLASTn hits for whole genome sequence of phage pPM_01 ........... 177
Table 6.5: Annotated open reading frames (ORFs) of phage pPM_01 whole
genome sequence .......................................................................................... 178

xi
LIST OF FIGURES
PAGE
Figure 2.1: The general structure of a virus in the infectious form. .................................... 8
Figure 2.2: Relative sizes of various biological cells and other components. ................... 10
Figure 2.3: Schematic diagram of virus particles. ............................................................. 12
Figure 2.4: The basic structure of Myoviridae members. .................................................. 18
Figure 2.5: Typical life cycle of a phage. .......................................................................... 20
Figure 2.6: Electron micrographs of Proteus mirabilis. .................................................... 27
Figure 2.7: Swarming cycle of Proteus bacilli growing on solid media. .......................... 27
Figure 2.8: The causes of P. mirabilis urinary tract infections (UTI) in humans. ............. 28
Figure 2.9: Schematic illustration of verocytoxin genes role in pathogenesis. ................. 34
Figure 3.1: Maps of plasmid used in the cloning procedures. ........................................... 49
Figure 4.1: Plaques formation of phage pPM_01 infecting P. mirabilis on
bacterial lawn. ................................................................................................. 68
Figure 4.2: Plaques formation of phage pEC_02 infecting E. coli O157:H7 on
bacterial lawn. ................................................................................................. 69
Figure 4.3: Plaques formation of phage pEC_03 infecting E. coli ATCC 13706 on
bacterial lawn. ................................................................................................. 70
Figure 4.4: Transmission electron micrographs of phage pPM_01. .................................. 75
Figure 4.5: Transmission electron micrographs of phage pEC_02. .................................. 76
Figure 4.6: Transmission electron micrographs of phage pEC_03. .................................. 77
Figure 4.7: Electron micrograph comparison of phage pPM_01 with previously
isolated phages targeting Proteus species and strain. ..................................... 83
Figure 5.1: Identification of phage nucleic acids............................................................. 114
Figure 5.2: Genome restriction analysis of the isolated phages. ..................................... 116
xii
Figure 5.3: Comparison of genome restriction profiles between isolated phages
and well-studied phages T4, T7 and λ. ......................................................... 123
Figure 5.4: Protein profiles of all isolates against phages T4 and T7. ............................. 126
Figure 5.5: Effect of pH on phage infectivity. ................................................................. 128
Figure 5.6: Effect of temperature on phage infectivity. ................................................... 130
Figure 5.7: Effect of salinity (NaCl) on phage infectivity. .............................................. 132
Figure 5.8: Single step growth curve of isolated phages. ................................................ 135
Figure 5.9: Colony PCR of positive clones. .................................................................... 137
Figure 5.10: Verification of the inserts DNA sequences using phage genomes as
templates. ...................................................................................................... 141
Figure 5.11: Electron micrograph comparison by negatively stained phage. .................... 151
Figure 5.12: Comparison of genomic restriction profiles between Escherichia
phage vB_EcoM_PhAPEC2 and phage pEC_02. ......................................... 152
Figure 6.1: Flowchart of phage pPM_01 genomic analysis. ........................................... 166
Figure 6.2: PCR enrichment of phage pPM_01 DNA fragments using Genome
WalkerTM
Universal kit. ................................................................................ 169
Figure 6.3: Colony PCR of pSMART-LCKan clones carrying inserts genomic
DNA of secondary PCR products. ................................................................ 171
Figure 6.4: Quality control reports of whole genome sequencing result for phage
pPM_01 sequenced with the Illumina sequencing. ....................................... 175
Figure 6.5: Genome map of phage pPM_01. ................................................................... 183
Figure 6.6: Sequence alignment of Clone 1 (DNA cloning using random ligation
of HpaI-digested DNA) (bottom sequence) against whole genome
sequence of phage pPM_01 (middle sequence). ........................................... 187
Figure 6.7: Sequence alignment of Clone 4 (EcoRV-digested) (bottom sequence)
against whole genome sequence of phage pPM_01 (middle sequence) ....... 193
Figure 6.8: In vitro test of phage pPM_01 infecting P. mirabilis. ................................... 196
Figure 6.9: Comparison of schematic representation of the genomes. ............................ 203

xiii
LIST OF ABBREVIATIONS
APS Ammonium persulfate
ATCC American Type Culture Collection
BLASTx Basic Local Alignment Search Tool-standard
BLASTn Basic Local Alignment Search Tool-nucleotide
BSA Bovine serum albumin
bp Base pair
CDC Centers for Disease Control and Prevention
Cfu Colony forming unit
ddH2O Deionized distilled water
DNA Deoxyribonucleic acid
DNase I Deoxyribonuclease I
dNTP Deoxynucleotide triphosphates
dsDNA Double stranded deoxyribonucleic acid
E. coli Escherichia coli
EB Elution buffer
EDTA Ethylenediaminetetraacetic acid
EHEC Enterohaemorrhagic E. coli
FDA Food and Drug Administration
HC Hemorrhagic colitis
HCl Hydrochloride acid
HUS Hemorrhagic uremic syndrome
ICTV International Committee on Taxonomy of Viruses
IPTG Isopropyl β-D-1-thiogalactopyranoside
kb/kbp Kilobase pair
kDa Kilodalton
LB Luria-Bertani
LPS Lipopolysaccharide
MgCl2 Magnesium chloride

xiv
MOI Multiple of infection
mRNA messenger RNA
NaCl Sodium chloride
NaOH Sodium hydroxide
NaOAc.3H2O Sodium acetate trihydrate
NCBI National Center for Biotechnological Information
NGS Next Generation Sequencing
OD Optical density
ORFs Open reading frames
Pfu Plaque forming unit
PCR Polymerase Chain Reaction
P. mirabilis Proteus mirabilis
RAST Rapid Annotations using Subsystems Technology
RNA Ribonucleic Acid
RNase A Ribonuclease A
Rpm Rotations/revolutions per minute
SAP Shrimp alkaline phosphatase
SDS Sodium dodecyl sulphate
SDS-PAGE Sodium dodecyl sulfate polyacrylamide gel electrophoresis
ssDNA Single stranded deoxyribonucleic acid
STEC Shiga toxin-producing E. coli
Stx Shiga toxins
Taq Thermus aquaticus
TBE Tris-Borate-EDTA
TEM Transmission electron microscope
TEMED Tetramethylethylenediamine
TMS Tris-Magnesium-Sodium
Tris base Tris (hydroxymethyl)-aminomethane
Tris-HCl Tris hydrochloric acid
tRNA Transfer ribonucleic acid
UTIs Urinary tract infections
xv
UV Ultraviolet
VTEC Verotoxin-producing E. coli
Vt Verocytoxin
WHO World Health Organization
w/v Weight/volume
v/v Volume/volume

xvi
LIST OF SYMBOLS
Β Beta
Φ Phi
g Gravity acceleration
L Litre
µg microgram
µl microliter
ml milliliter
mm millimeter
mM millimolar
ng nanogram
nm nanometer
M molar
u unit
V volt

xvii
PEMENCILAN DAN PENCIRIAN BAKTERIOFAJ Proteus mirabilis dan
BAKTERIOFAJ Escherichia coli
ABSTRAK
Malaysia mempunyai kepelbagaian faj yang luas yang masih belum diterokai
daripada segi aplikasi dan ini termasuk terapi faj untuk merawat bakteria yang merintang
kesan antibiotik. Dalam kajian ini, tiga faj iaitu pPM_01, pEC_02 dan pEC_03 masing-
masing khusus kepada Proteus mirabilis, Escherichia coli O157:H7 dan Escherichia coli
ATCC 13706 telah berjaya dipencilkan dari loji rawatan kumbahan mentah di Batu Maung,
Pulau Pinang, Malaysia. Mikroskopi pancaran elektron mencadangkan bahawa faj pPM_01
tergolong dalam keluarga Siphoviridae, manakala faj pEC_02 dan pEC_03 tergolong dalam
keluarga Myoviridae. Pencilan mempunyai julat perumah yang sempit dan DNA bebenang
ganda dua sebagai bahan genetik. Selain itu, analisis enzim pembatasan DNA dan profil
protein separa menunjukkan faj jelas berbeza antara satu sama lain dan juga berbeza
daripada faj yang umum seperti T4, T7 dan λ. Faj pPM_01 dan faj pEC_02 dikelaskan
sebagai faj lisis manakala pEC_03 dipercayai sebagai faj lisogenik. Untuk langkah pencirian
seterusnya, hanya faj lisis pPM_01 dan pEC_02 dipilih. Kejangkitan tertinggi faj pPM_01
dicatatkan pada pH 6, 37°C dan kepekatan garam 0.17M, manakala untuk faj pEC_02,
kejangkitan tertinggi dicatatkan pada pH 7, julat suhu daripada 10°C sehingga 45°C dan
kepekatan garam 0.17M. Analisis keluk pertumbuhan selangkah faj pPM_01 mendedahkan
tempoh gerhana, tempoh pendam dan saiz letusan masing-masing adalah 20 min, 25 min,
dan 32 partikel faj bagi setiap sel yang dijangkiti. Sebaliknya, analisis ke atas faj pEC_02
menunjukkan tempoh gerhana, tempoh pendam dan saiz letusan masing-masing adalah 25
min, 30 min, dan 18 partikel faj bagi setiap sel yang dijangkiti. Dalam kajian genomik
separa, analisis jujukan DNA menunjukkan faj pEC_02 berkongsi identiti dengan faj
Escherichia vB_EcoM_PhAPEC2. Anotasi dan analisis fungsian jujukan genom penuh faj
pPM_01 mendedahkan bahawa faj tersebut berkait rapat secara evolusi kepada faj

xviii
Enterobacter Enc34 dengan 67% identiti dalam 14% liputan pertanyaan. Identiti yang
rendah dengan jujukan dalam pangkalan data mencadangkan bahawa faj pPM_01 berpotensi
sebagai pencilan yang baru. Panjang jujukan genom penuh faj pPM_01 adalah 58,546 bp dan
keseluruhan komposisi bes guanina-sitosina (GC) adalah 46.9%. Sebanyak tujuh puluh
rangka bacaan terbuka (ORFs) dianotasi berdasarkan pangkalan data NCBI untuk protein
fungsian tersebut. Sebanyak 20 ORFs telah ditetapkan fungsi berdasarkan jujukan protein
homolog yang diketahui; ORFs yang dianotasi ini kebanyakannya adalah komponen
berstruktur dan protein pemasangan kepala dan ekor, serta enzim yang terlibat dalam
replikasi, pemulihan, pembungkusan dan pengubahsuaian DNA. ORFs yang selebihnya
adalah protein yang ditetapkan sebagai protein hipotetikal, yang mana menunjukkan lanjutan
kajian genomik faj pPM_01 diperlukan untuk menjelaskan lebih banyak lagi penemuan yang
novel. Ketiadaan gen virulen atau toksik dalam jujukan genom penuh membuktikan faj lisis
pPM_01 adalah selamat untuk digunakan dalam kajian lanjutan melibatkan terapi faj. Ujian
in vitro menunjukkan faj pPM_01 adalah sangat lisis dan virulen untuk mengurangkan
pertumbuhan P. mirabilis di dalam kultur kaldu daripada ~0.51 kepada ~0.08 OD600 dalam
masa 250 minit.
xix
ISOLATION AND CHARACTERIZATION OF Proteus mirabilis AND Escherichia
coli BACTERIOPHAGES
ABSTRACT
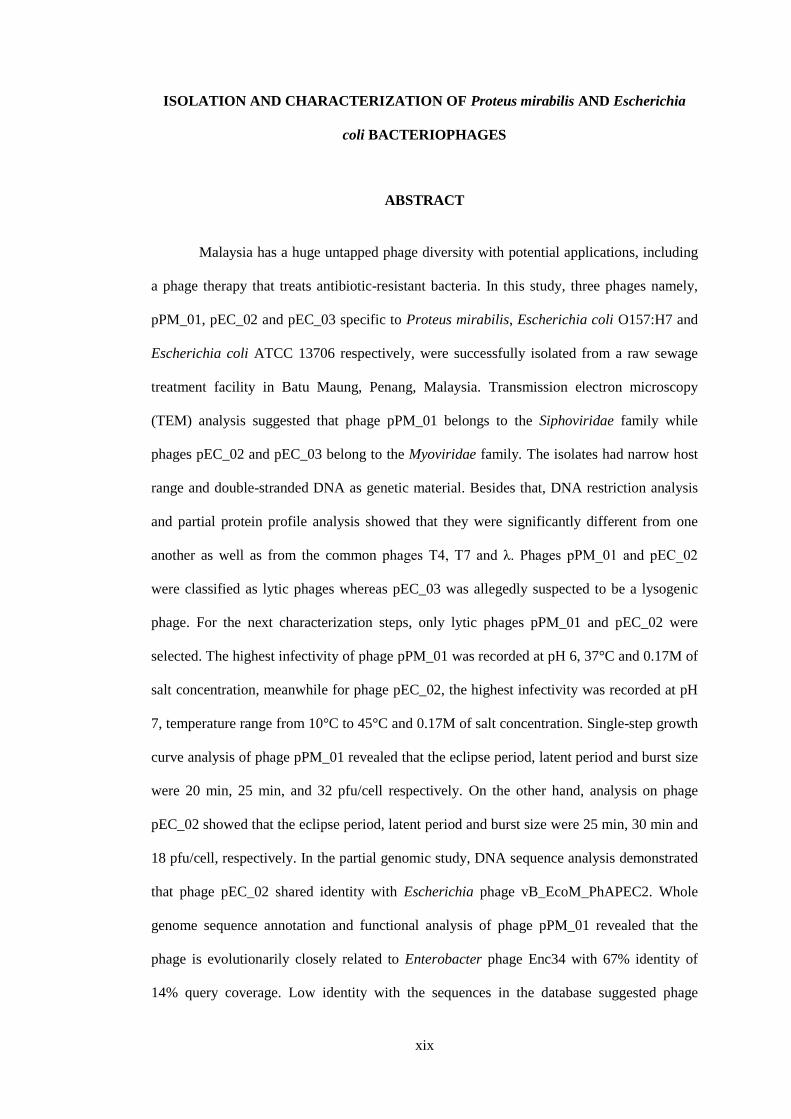
Malaysia has a huge untapped phage diversity with potential applications, including
a phage therapy that treats antibiotic-resistant bacteria. In this study, three phages namely,
pPM_01, pEC_02 and pEC_03 specific to Proteus mirabilis, Escherichia coli O157:H7 and
Escherichia coli ATCC 13706 respectively, were successfully isolated from a raw sewage
treatment facility in Batu Maung, Penang, Malaysia. Transmission electron microscopy
(TEM) analysis suggested that phage pPM_01 belongs to the Siphoviridae family while
phages pEC_02 and pEC_03 belong to the Myoviridae family. The isolates had narrow host
range and double-stranded DNA as genetic material. Besides that, DNA restriction analysis
and partial protein profile analysis showed that they were significantly different from one
another as well as from the common phages T4, T7 and λ. Phages pPM_01 and pEC_02
were classified as lytic phages whereas pEC_03 was allegedly suspected to be a lysogenic
phage. For the next characterization steps, only lytic phages pPM_01 and pEC_02 were
selected. The highest infectivity of phage pPM_01 was recorded at pH 6, 37°C and 0.17M of
salt concentration, meanwhile for phage pEC_02, the highest infectivity was recorded at pH
7, temperature range from 10°C to 45°C and 0.17M of salt concentration. Single-step growth
curve analysis of phage pPM_01 revealed that the eclipse period, latent period and burst size
were 20 min, 25 min, and 32 pfu/cell respectively. On the other hand, analysis on phage
pEC_02 showed that the eclipse period, latent period and burst size were 25 min, 30 min and
18 pfu/cell, respectively. In the partial genomic study, DNA sequence analysis demonstrated
that phage pEC_02 shared identity with Escherichia phage vB_EcoM_PhAPEC2. Whole
genome sequence annotation and functional analysis of phage pPM_01 revealed that the
phage is evolutionarily closely related to Enterobacter phage Enc34 with 67% identity of
14% query coverage. Low identity with the sequences in the database suggested phage

xx
pPM_01 as a potentially new isolate. The whole genome sequence of phage pPM_01 was
58,546 bp in length and the overall guanine-cytosine (GC) base composition was 46.9%.
Seventy open reading frames (ORFs) were annotated based on the NCBI database for their
functional proteins. Twenty ORFs were designated functions according to their known
homologous protein sequences; these annotated ORFs were mainly head and tail structural
components and assembly proteins, as well as enzymes that were involved in DNA
replication, repairing, packaging, and modification. The remaining ORFs were proteins
assigned as hypothetical proteins, which indicate further genomic study of phage pPM_01 is
required to elucidate more novel discoveries. The absence of virulent or toxic genes in the
whole genome sequence indicated that the lytic phage pPM_01 is safe to proceed with
further research involving phage therapy. In vitro testing showed that phage pPM_01 was
highly lytic and virulent in reducing the growth of P. mirabilis in broth culture from ~0.51 to
~0.08 OD600 within 250 minutes.

CHAPTER 1

2
1 GENERAL INTRODUCTION
1.1 Problem statement
Malaysia, ranked 14th in the top seventeen mega-diverse countries list, has more than
70% of the biosphere’s biodiversity. Currently, this mega-diversity concept focuses only on
flora and fauna (Greenpeace International, 2004), where microbes, also included as part of
the mega-diversity in Malaysia, lack attention and were involved in few studies. Microbial
communities are interconnected to flora and fauna through various relationships
(Nihorimbere et al., 2011); therefore, the biodiversity in Malaysia could support a vast range
of microbial communities. However, microbes, particularly phages are less explored and
uncovered (Ackermann, 2001; Ackermann, 2011; Rohwer, 2003). Malaysia, as one of the
mega-diverse countries, could harbor a novel and putatively potential phage applicable in
numerous sectors.
Over the past decades, phages were applied as entities able to fight disease-causing
bacteria (Verbeken et al., 2014). Even though phage therapy has been practiced in Europe
and the former Soviet Union, clinical settings for therapeutic use of phages were largely
abandoned in Western Europe due to the introduction of conventional antibiotics, such as
penicillin (Kutateladze and Adamia, 2010; Verbeken et al., 2014). Due to the worldwide
crisis associated with the continuous emergence of multidrug resistance in bacteria, modern
medicine has once again started showing interest in phage therapy, particularly among
countries that used antibiotics as antimicrobial agents: Western Europe and the United States
(Deresinski, 2009; Inal, 2003). In the European Union (EU), the annual number of infections
caused by multidrug-resistant bacteria was more than 400 000 cases, resulting in 25 000
deaths with losses greater than 1.5 billion Euros (Verbeken et al., 2014).
In this study, three common bacteria that resisted several antibiotics and caused
severe diseases in humans were studied: Proteus mirabilis, Escherichia coli O157:H7 and
Escherichia coli ATCC 13706 (Chen et al., 2012; Nguyen and Sperandio, 2012; Srivastava

3
and Vasudev, 2011; Wendel et al., 2009). P. mirabilis and a number of E. coli strains
(including serotypes) have been well documented in scientific literature as etiologic agents
of severe diseases associated with urinary tract infections (UTIs) and other various
complications. Moreover, these bacteria contributed to unacceptably high rates of
nosocomial infections in hospitals and clinic due to their resistance towards present
antibiotics (Luzzaro et al., 2011). Furthermore, biofilm formation by these pathogens render
them too difficult to be controlled or eradicated by antibiotics (Carson et al., 2010). The
more virulent E. coli serotype, E. coli O157:H7 also causes bloody diarrhea, haemorrhagic
colitis (HC) and haemorrhagic uremic syndrome (HUS) in humans (Mount and Pollak,
2007). Annually, approximately eight out of 100 000 humans were infected by this
pathogenic bacterium in Washington, North America and the cases were sporadic
(Guandalini, 2004; MacDonald et al., 1988; Mount and Pollak, 2007)
Access to phage therapy remains problematic due to the fact that published reports
of well-established and commercialized phages were restricted to the Soviet Union (Chibani-
Chennoufi et al., 2004c). This issue proved difficult for scientific communities to approach
phage therapy. In order to develop new isolated phages into phage therapy, phage
background studies need to be considered. Background studies are crucial since various
factors, such as safety analysis, medical parameters and phage stability, would affect phage
therapy in clinical settings (Cairns et al., 2009; Jończyk et al., 2011).
In this study, an assessment on isolated phages infecting P. mirabilis and E. coli
O157:H7 were extensively analyzed, including in vitro testing of phage pPM_01 infecting P.
mirabilis. Work regarding these isolated phages would help scientific communities
worldwide in developing phage applications particularly phage therapy. This study could be
the starting point of a sustainable phage research program in Malaysia.

4
1.2 Objectives
Realizing the potential of Malaysian biodiversity in harboring an assorted phage
community and contributing to the issues of multidrug resistant bacteria, research on phages
was conducted. The overall objectives of this study are summarized as follows:
i. To isolate potentially new phages infecting P. mirabilis, E. coli O157:H7 and E. coli
ATCC 13706 from raw sewage.
ii. To perform physicochemical characterization including the effects of pH,
temperature, and salt concentration on the infectivity of the selected phages.
iii. To conduct biological characterization including morphological structure, single-
step growth curve, host range analysis, proteomic and genomic of selected phages.
iv. To analyze the effects of phage pPM_01 on the growth of P. mirabilis during in
vitro study.
1.3 Outline of thesis
This thesis consists of seven chapters. Following the general introductory chapter,
Chapter 2 outlines the literature review that includes the introduction of virus, overview of
phages, interaction between phage and host, and significance of P. mirabilis and E. coli
O157:H7. The final part is the potential application of phages and the advantages of phage
therapy over conventional medicine.
Chapter 3 describes the general materials and methods, which includes experimental
materials and procedures adopted from previous studies.
Isolation of phages specific to P. mirabilis, E. coli O157:H7 and E. coli ATCC
13706 from Malaysian environment are described in Chapter 4. The whole process of sample
collection, phage isolation and phage morphological structure determination are clearly
illustrated.

5
Chapter 5 entitled “Characterization of the isolated phages” presents data analysis of
the phage isolates. The focus points are the physicochemical (the effect of pH, temperature,
NaCl concentration on the infectivity of the selected phages) as well as biological (host
range analysis, single-step growth curve, proteomic and partial genomic analysis) features of
selected phages.
Following characterization of the isolated phages chapter, Chapter 6 describes the
genomic and in vitro analysis of phage pPM_01 infecting P. mirabilis. For genomic study,
this includes primer walking sequencing method and the Illumina sequencing technology.
Finally, Chapter 7 of the thesis summarizes the work done and suggests future work
in the light of the findings from the present work.

CHAPTER 2
7
2 LITERATURE REVIEW
2.1 Virus definition
Viruses are the smallest and simplest life forms particles (when growing inside their
hosts) on the Earth (Acheson, 2007) and at the borderline of living and nonliving organism
(Pelczar et al., 2010). Viruses are natural obligate intracellular parasites that possess their
own genetic information; however, they rely on the host metabolic machinery to carry out
replication cycle (Madigan et al., 2008; Voyles, 2002; Willey, 2008).
Viral replication is not the only process that would involve host cell for vital
metabolic function (Pelczar et al., 2010). In fact, viruses are unable to generate usable
chemical energy (ATP) (Cann, 2001) and it is incapable to directly synthesize their own
proteins since they do not encode a complete translation system (ribosomes, tRNAs and
associated enzymatic machinery). Moreover, they lack enzyme systems that could generate
molecular building blocks of life, such as nucleotides, amino acids, carbohydrates and lipids
(Acheson, 2007).
Basically, they could exist in two different forms: extracellular and intracellular
(Madigan et al., 2008). Once inside a host cell, viruses exist as replicating nucleic acids that
usurp the host’s metabolism to synthesize their own protein components in order to produce
matured virus particles (Willey, 2008). Whereas, in the extracellular form, a complete virus
entity comprises of one or more DNA or RNA molecules enclosed in a capsid (coat protein)
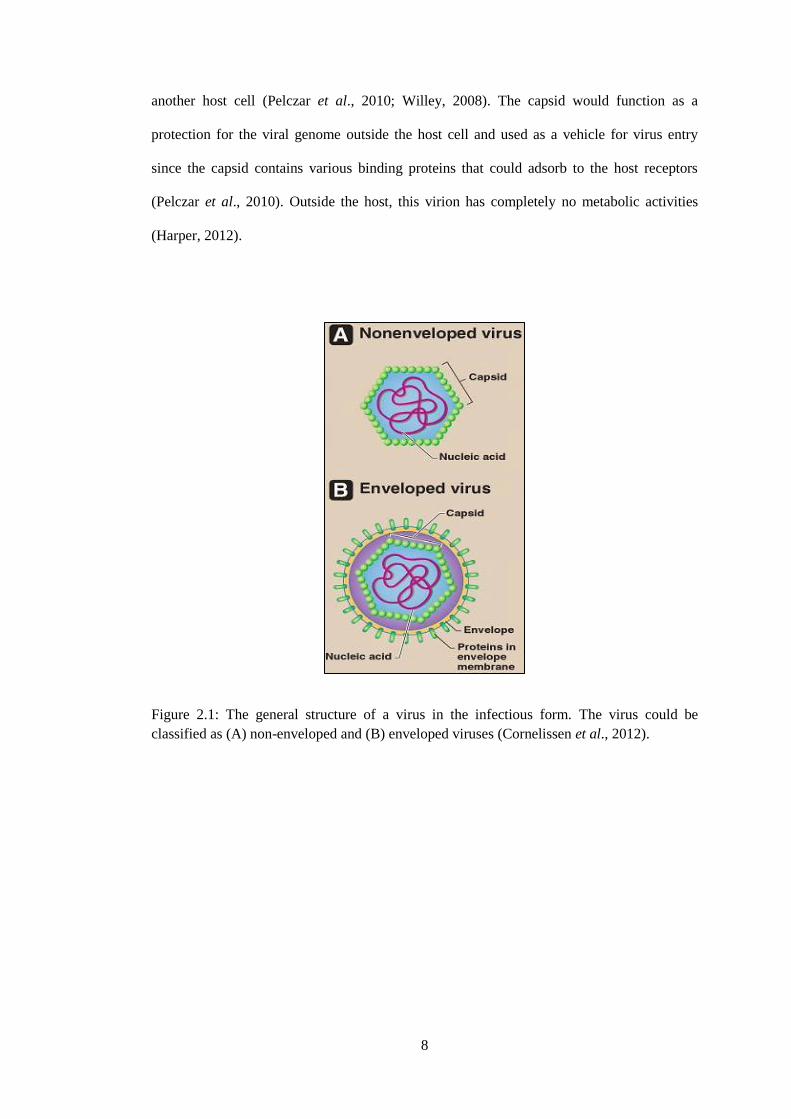
(Pelczar et al., 2010). In this infectious form of viruses,a nucleic acid that wrapped in the
capsid is called as a virion (Acheson, 2007).
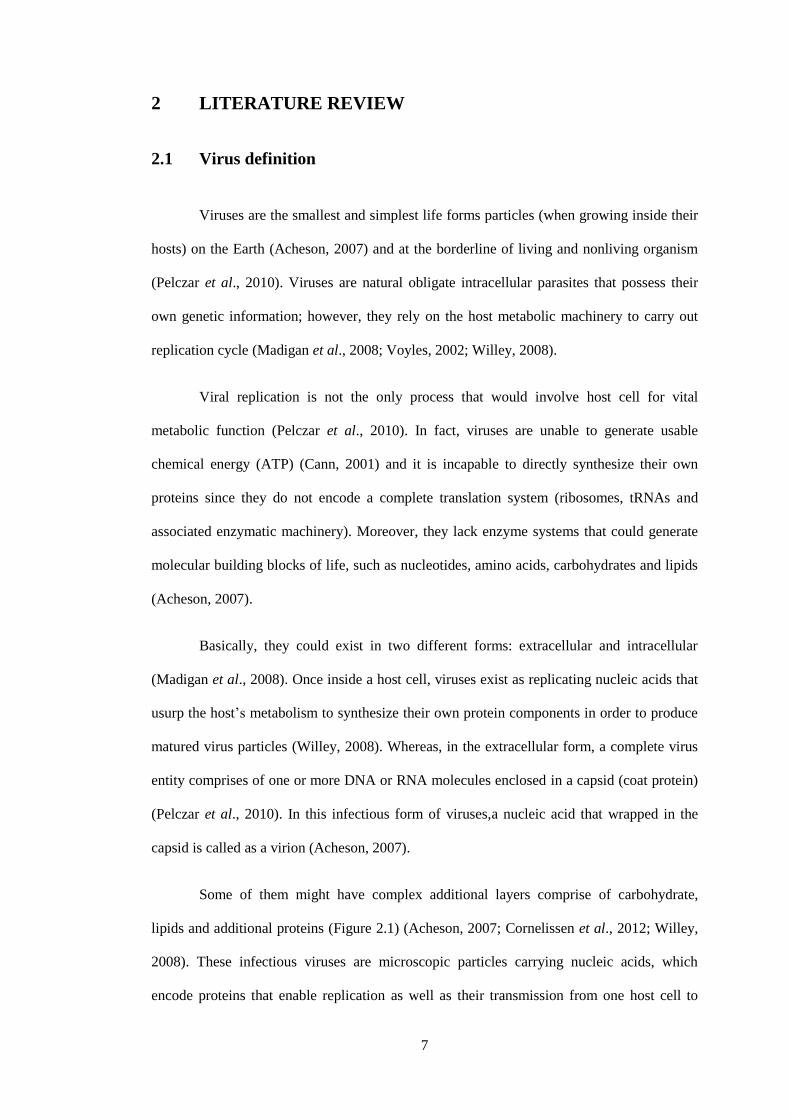
Some of them might have complex additional layers comprise of carbohydrate,
lipids and additional proteins (Figure 2.1) (Acheson, 2007; Cornelissen et al., 2012; Willey,
2008). These infectious viruses are microscopic particles carrying nucleic acids, which
encode proteins that enable replication as well as their transmission from one host cell to
8
another host cell (Pelczar et al., 2010; Willey, 2008). The capsid would function as a
protection for the viral genome outside the host cell and used as a vehicle for virus entry
since the capsid contains various binding proteins that could adsorb to the host receptors
(Pelczar et al., 2010). Outside the host, this virion has completely no metabolic activities
(Harper, 2012).
Figure 2.1: The general structure of a virus in the infectious form. The virus could be
classified as (A) non-enveloped and (B) enveloped viruses (Cornelissen et al., 2012).
9
2.2 Nature of the virion
Viruses are found everywhere in nature and tend to appear wherever cellular life
occurs (Voyles, 2002). They are well known to cause various diseases in humans via
infection of the human cells as well as infecting all the kingdom of Animalia, including both
vertebrates and invertebrates (Pelczar et al., 2010; Voyles, 2002). Viruses have also been
described by their ability to infect plant (Plantae), filamentous fungi and yeast, all types of
algae, protozoans, phytoplankton and zooplankton as well as bacteria (Acheson, 2007;
Voyles, 2002).
Disease outbreaks in domesticated animals and plants by viruses could lead to the
destruction of thousands or millions of animals and plants for avoidance even more
widespread epidemics (Acheson, 2007). Bacterial viruses are the viruses that have been
investigated in details and produced wealth of information in the fundamental process of
molecular genetics (Acheson, 2007; Cann, 2001; Voyles, 2002).
2.2.1 Virion size
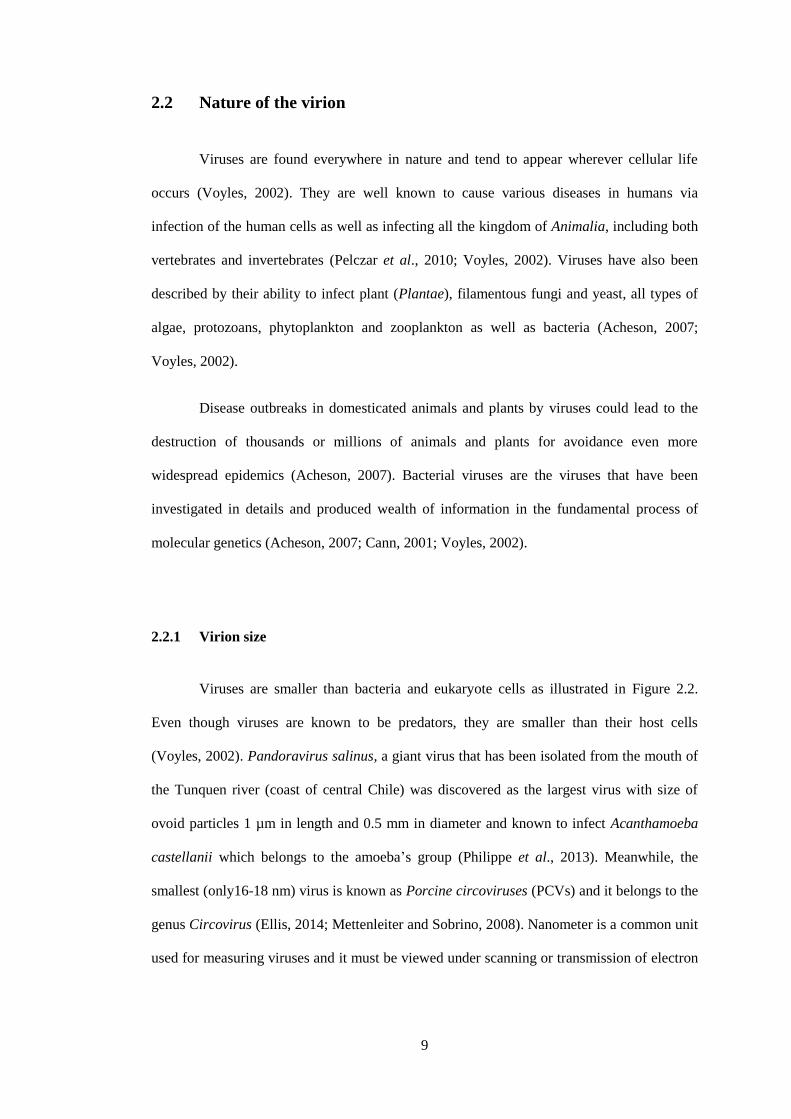
Viruses are smaller than bacteria and eukaryote cells as illustrated in Figure 2.2.
Even though viruses are known to be predators, they are smaller than their host cells
(Voyles, 2002). Pandoravirus salinus, a giant virus that has been isolated from the mouth of
the Tunquen river (coast of central Chile) was discovered as the largest virus with size of
ovoid particles 1 µm in length and 0.5 mm in diameter and known to infect Acanthamoeba
castellanii which belongs to the amoeba’s group (Philippe et al., 2013). Meanwhile, the
smallest (only16-18 nm) virus is known as Porcine circoviruses (PCVs) and it belongs to the
genus Circovirus (Ellis, 2014; Mettenleiter and Sobrino, 2008). Nanometer is a common unit
used for measuring viruses and it must be viewed under scanning or transmission of electron
10
microscopy to examine their basic morphological structures (Acheson, 2007; Madigan et al.,
2008; Willey, 2008).
Figure 2.2: Relative sizes of various biological cells and other components. Viruses are far
smaller than their host cells. Note that the vertical scale of this figure is logarithmic to
accommodate a vast range of sizes depicted. The diagram is an adaptation from Voyles
(2002).
11
2.2.2 Virion genome
Nucleic acid type of virus particle is the most fundamental of viral components
(Cornelissen et al., 2012). The genome of a virus particle could either be DNA or RNA, of
which could either be single-stranded or double-stranded. Single-stranded RNA and double-
stranded DNA are the most common types of virus genomes that are found in nature
(Cornelissen et al., 2012; Willey, 2008). Mostly, plant viruses contain single-stranded RNA,
whereas majority of the bacterial viruses consist of double-stranded DNA (Willey, 2008).
Single-stranded RNA compose of a base sequence identical to mRNA sense in
which it serves as a template for direct protein synthesis and is called a plus strand or
positive strand. The negative strand or antisense (complementary strand) however, could not
be used as a template for protein synthesis (Cornelissen et al., 2012; Willey, 2008). The
largest size of the virus genome 2.77 Mb belongs to the DNA of Pandoravirus salinus and
correspond to its size as the largest virus among all known viruses (Philippe et al., 2013).
In addition, the smallest size of the viral genome is less than 1800 nucleotides that
possessed by the smallest virus known as Porcine circoviruses (PCVs) (Mettenleiter and
Sobrino, 2008; Wen et al., 2014). Generally, all the host cells genomes are in the form of
double-stranded DNA (Voyles, 2002).
2.2.3 Virion architecture
Structures of virion are relatively diverse since they have different size, shape as
well as chemical composition (Madigan et al., 2008). At the most basic structure, a virion
contains a central core of nucleic acid genome. It is surrounded by a capsid protein and the
resulting structure is called as a nucleocapsid (Harper, 2012). The virion surface often
possesses complex proteins and sugars known as glycoproteins and sometimes might be
embedded in the envelope (Parasion et al., 2014). The capsid protein that enclosed the viral

12
genome is built from repeating protein subunits called capsomers (Pelczar et al., 2010).
These small protein subunits actually reduce the amount of genetic coding capacity of the
viral genome that is used to encode the capsid proteins (Acheson, 2007).
The architecture of virion is usually made up of two simple forms: helix and
icosahedral (Figure 2.3) (Harper, 2012). The capsid with helical symmetry form contains
proteins that are aligned in a helix, which surrounds the viral genome and appears as a rod-
like. One of the best studied plant virus was tobacco mosaic virus that possesses a capsid in
helical shape orientation (Cann, 2001). Meanwhile, for capsid protein with icosahedral
symmetry, capsomers proteins form an outer shell that enclose the viral genome in the center
(Harper, 2012). Three-dimensional (3D) structure of a virus composes of 20 triangular facets
and 12 vertices. Each triangular facet is made up of an equilateral triangle and each of the 12
vertices is the intersection of five triangular facets (Voyles, 2002). Some of the bacterial
viruses have icosahedral heads that are greater in length than in width, resulting in the
icosahedral shape distortion (Harper, 2012; Pelczar et al., 2010).
Figure 2.3: Schematic diagram of virus particles. Illustrated are two types of the most
common capsid morphologies: (A) A capsid with helical symmetry, proteins aligned in a
helix around the nucleic acid and appears as rod-like. (B) 3D of symmetry icosahedron
structure that show axes of rotation; the proteins form an outer shell around the nucleic acids
in the center. The diagram is an adaptation from Harper (2012).
A B
13
2.3 Overview of phages
2.3.1 The discovery of phages
Bacterial virus or bacteriophage (phages for short) was discovered independently by
a British pathologist Frederick William Twort in England in 1915 (Adams, 1959; Parasion et
al., 2014). Twort described an acute infectious disease of staphylococci that showed marked
changes in the colonial morphology. Sometimes, bacterial colonies dissolve and disappear
due to the cells being lysed by an unknown agent (Pelczar et al., 2010).
Twort found that the lytic agent was a filterable infectious agent and indefinitely
transmitted in series from colonies to other colonies (Ackermann, 2003; Adams, 1959;
Sulakvelidze et al., 2001). The highly diluted form of this lytic agent could lyse other
bacteria; however, heating the filtrates destruct the lytic property of the infectious agent
(Pelczar et al., 2010). Twort, then described the concept of phage nature in a remarkable
paper (Inal, 2003); yet, the paper remained unnoticed by scientists at that time and he failed
to continue his discovery since he had wartime missions in the British Army (Adams, 1959).
In 1917, a French Canadian bacteriologist, Felix Hubert d’Herelle who was working
at the Pasteur Institute in Paris observed the lysed Shigella cultures in broth (Ackermann,
2003). He filtered the lysed cultures and inoculated again the fresh cultures of Shigella with
the filtrates. The bacterial culture was grown separately as a control. He found that the
control culture was turbid as predicted, whilst, the bacterial culture mixed with the filtrate
was completely cleared (Adams, 1959).
He summarized the filterable lytic agent as a virus with invisible entities that are
parasitic to bacteria (Sulakvelidze et al., 2001). Upon the discovery of this phenomenon, also
called as Twort-d’Herelle phenomenon, he coined the term of “bacteriophage” which means
bacteria eater and introduced the phages to treat bacterial infectious diseases (Abedon, 2005;
Gravitz, 2012).
14
2.3.2 Phage diversity
Phage is a virus of prokaryote (Ackermann, 2011). Phages are known to be the
largest group of viruses and they use most of the bacteria and archae species as hosts for
propagation (Brovko et al., 2012; Parasion et al., 2014). They are obligate parasites that
could be found in all habitats in the world where bacteria or archae proliferate (Grath and
van Sinderen, 2007). In the size range from 20 to 200 nm (Sulcius et al., 2011), phages are
believed to be the most diverse life form on the planet (Hatfull, 2008, Rohwer, 2003) and
occupying the biosphere with an estimated of 1 X 10⁸ species. The predicted global viral
population is 1 X 1030
to 1 X 1031
phage particles or approximately 10 million per cubic
centimeter of every environmental niche (Breitbart and Rohwer, 2005; Brovko et al., 2012;
Deresinski, 2009; Grath and van Sinderen, 2007; Hendrix, 2003; McAuliffe et al., 2007).
Sea water is the biggest and densest natural source for phages, which up to 107
phages particles per milliliter could be found in the coastal seawater (Hendrix, 2003).
However, the phage concentrations fluctuate according to the seasons and the geographical
locations (Chibani-Chennoufi et al., 2004a). They exert substantial control on communities
of marine bacteria and phytoplankton in both species composition and biological production.
These phages directly affect the matter pathways as well as energy transfer in this system
(McAuliffe et al., 2007).
In fact, there is an estimation that 70% marine bacteria might be killed by the phages
predator (Prescott, 1993). For every second, it was predicted that approximately 1025
phages
might start an infection (Yamamoto et al., 2014). Hence, it is not surprising that phages
actually contribute to the ecological balance of microbial life in the biosphere (McAuliffe et
al., 2007). Their ubiquitous could be illustrated as following examples: per drop of seawater,
it is estimated there are 106 phage particles and per gram of soil, 10
8 phage particles are
predicted (Deresinski, 2009).

15
The comparison of nucleotide sequences of phage genomes actually discovers them
to be enormously diverse entities in this biosphere (Hendrix, 2003). It is impossible to find
highly similar nucleotide sequence to other database entries except the genome of the phage
has a known close relative phage and infect the same host or is closely related temperate
phage. This observation suggest that the host preferences as a substantial barrier for genetic
exchange to occur (Brüssow and Hendrix, 2002; Hatfull and Hendrix, 2011).
Hence, based on the phage diversity, they might play an important role in the
bacterial evolution in the biosphere (Hendrix, 2003; McAuliffe et al., 2007). Phage, which
kills almost one-half of the bacterial population worldwide every 48 hours, has contributed
to the acceleration of bacterial mutation rates. This leads to the constant emergence of
bacteria resistance to the phages (Pal et al., 2007). Nevertheless, antagonistic coevolution
evolved by this parasite would able to overcome bacteria resistance since phages mutate at
higher rates (Buckling and Rainey, 2002; Comeau and Krisch, 2005). The evolution that
takes place for billions of years derived from the relationship of prey-predator reveals the
phages as rich potential candidates for antimicrobial compounds (Deresinski, 2009; Sau et
al., 2008).
2.3.3 Classification of phages
Like other viruses, phage nucleic acid is surrounded by a capsid in order to protect
the core from nucleases and other harmful materials (Voyles, 2002). Mostly, phage genome
comprises of a single copy of a nucleic acid molecule, and it could be either single- or
double-stranded linear or circular DNA, or single-stranded linear RNA (Madigan et al.,
2008). The genome size of phages varies starting from approximately 3300 nucleotides
single-stranded RNA viruses of Escherichia coli to almost 500 kb of Bacillus megaterium
phage G genome. The smallest genome size for the double-stranded DNA tailed phages were
Mycoplasma phage P1 (Podoviridae) with ~11.5 kb, Lactococcus phage c2 (Siphoviridae)

16
with ~21 kb as well as Pasteurella phage F108 (Myoviridae) with ~30 kb (Hatfull and
Hendrix, 2011).
Phages structures might be physically differentiated by shape: tailed, polyhedral
(icosahedral or quasi-icosahedral bodies), filamentous as well as pleomorphic. Of the 6000
viruses examined by transmission electron microscopy, 5360 of them are tailed phages and
only 179 are cubic, filamentous or pleomorphic phages (Ackermann, 2011; Parasion et al.,
2014). Currently, the International Committee on Taxonomy of Viruses (ICTV) classifies
phages in a hierarchical and holistic system into one order with 10 families (Table 2.1)
(Ackermann, 2011).
The double-stranded DNA tailed phages account for more than 96% reported phages
in the scientific literature and presumably constitute the majority of phages on the Earth
(Ackermann, 2011; Grath and van Sinderen, 2007). Tailed phages that belong to order
Caudovirales consist of three families: Myoviridae, Siphoviridae and Podoviridae. They
could be characterized as contractile, long and non-contractile, or short tails, respectively
(Ackermann, 2011). In both families Myoviridae (e. g., T4-like phages) and Siphoviridae (e.
g., λ-like phages), six genera have been created, separately as well as three genera in the
family Podoviridae (e. g., T7-like phages) (Ackermann, 1998).
Members of Caudovirales comprise a cubic symmetry head and a helical tail that
form binary symmetry. They contain no envelope and often possess capsid protein and the
DNA only. Sometimes, icosahedral head of phages might elongate; however, 85% of them
were found to be isometric heads (Abedon, 2005; Ackermann, 2003). Uniquely, tailed
phages consist of tail with a hollow tube that allows the phage nucleic acid to pass through
into the host cytoplasm (Brovko et al., 2012; Lobocka and Szybalski, 2012). The tail sizes
are diverse and some of the phages do not possess this structure (Brovko et al., 2012).

17
Table 2.1: Overview of phage families (Ackermann, 2011)
18
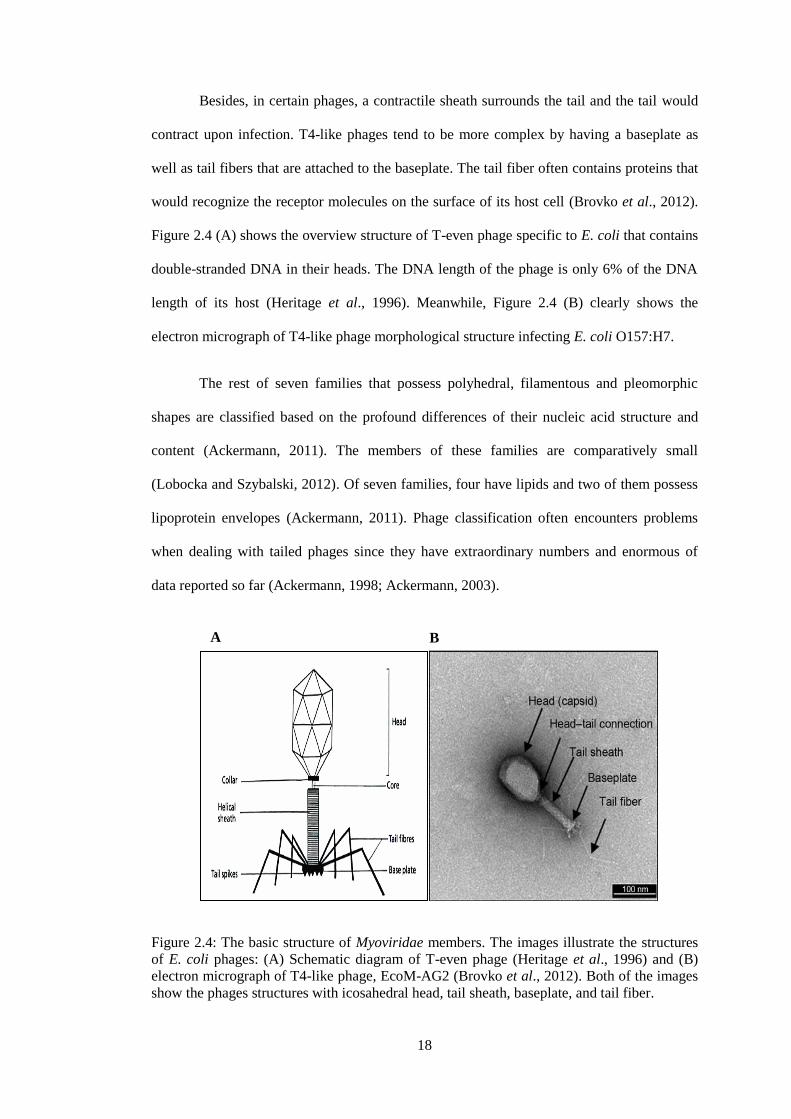
Besides, in certain phages, a contractile sheath surrounds the tail and the tail would
contract upon infection. T4-like phages tend to be more complex by having a baseplate as
well as tail fibers that are attached to the baseplate. The tail fiber often contains proteins that
would recognize the receptor molecules on the surface of its host cell (Brovko et al., 2012).
Figure 2.4 (A) shows the overview structure of T-even phage specific to E. coli that contains
double-stranded DNA in their heads. The DNA length of the phage is only 6% of the DNA
length of its host (Heritage et al., 1996). Meanwhile, Figure 2.4 (B) clearly shows the
electron micrograph of T4-like phage morphological structure infecting E. coli O157:H7.
The rest of seven families that possess polyhedral, filamentous and pleomorphic
shapes are classified based on the profound differences of their nucleic acid structure and
content (Ackermann, 2011). The members of these families are comparatively small
(Lobocka and Szybalski, 2012). Of seven families, four have lipids and two of them possess
lipoprotein envelopes (Ackermann, 2011). Phage classification often encounters problems
when dealing with tailed phages since they have extraordinary numbers and enormous of
data reported so far (Ackermann, 1998; Ackermann, 2003).
Figure 2.4: The basic structure of Myoviridae members. The images illustrate the structures
of E. coli phages: (A) Schematic diagram of T-even phage (Heritage et al., 1996) and (B)
electron micrograph of T4-like phage, EcoM-AG2 (Brovko et al., 2012). Both of the images
show the phages structures with icosahedral head, tail sheath, baseplate, and tail fiber.
A B
19
2.3.4 Phage life cycle
Two types of phages are found in nature: lytic (or virulent) and lysogenic (or
temperate) (Madigan et al., 2008; Maramorosch and Shatkin, 2006; Parasion et al., 2014;
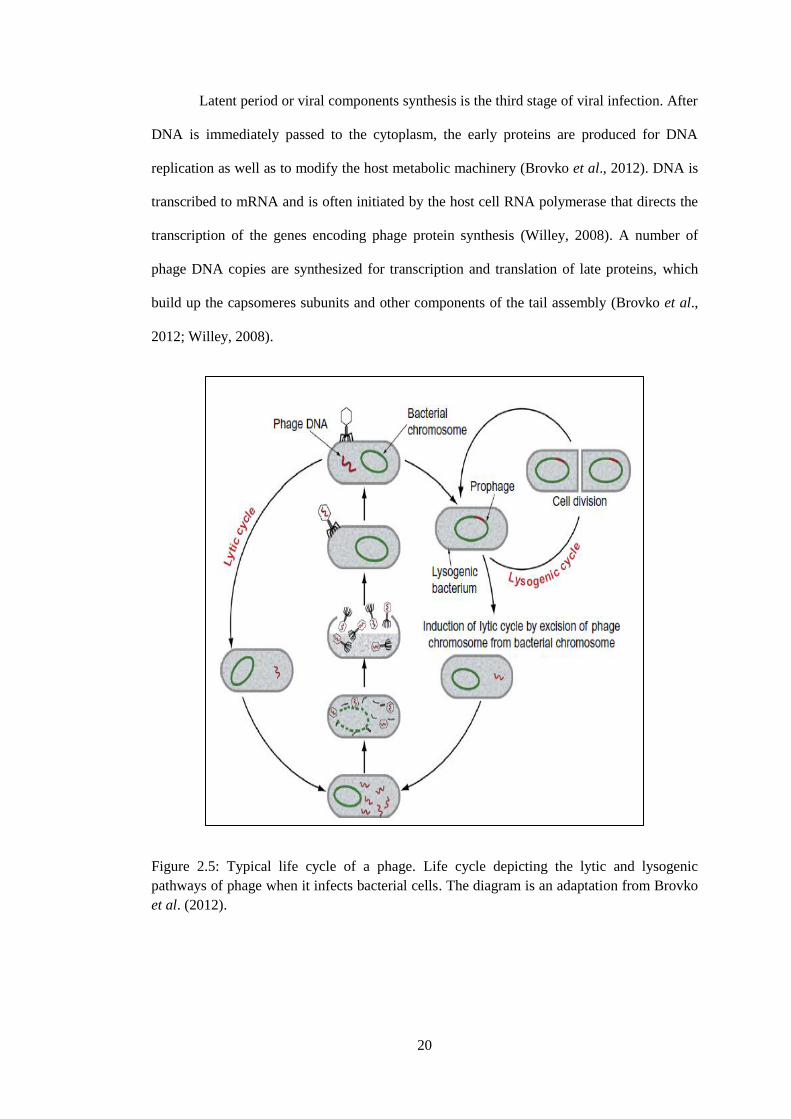
Willey, 2008). Typical life cycle of a phage is illustrated in Figure 2.5 (Brovko et al., 2012).
By simple definition, lytic phages would destroy or kill their host cells. In the lytic infective
process, lytic phage infects host cells and replicates abundantly. They cause disruption to the
host cell metabolism by subverting it to form progeny of the phage (Pelczar et al., 2010).
Host cells then burst or lyses, releasing new phages progeny that eventually spreads to infect
other bacterial host cells (Brovko et al., 2012; Pelczar et al., 2010). The time taken for a
whole phage life cycle to complete usually within one to two hours and the number of
phages released depend on the type of phage (Brovko et al., 2012).
A basic lytic cycle of phages contains the following five steps: adsorption
(attachment), penetration, latent period, maturation and lysis (Brovko et al., 2012; Madigan
et al., 2008; Willey, 2008). The initial step of the lytic cycle for dsDNA tailed phage begins
with adsorption of the phage towards specific bacterial host cell (Cann, 2001; Parasion et al.,
2014). The infection starts when the specialized adsorption structures that present at the tip
of the phage such as tail fibers or spikes bind to the specific receptor on the surface of the
host cell (Brovko et al., 2012). Bacterial mutants that do not have the ability to synthesize
specific receptors for phage binding or attachment would eventually become resistant to
infections by specific phages (Pelczar et al., 2010).
The second step of the lytic cycle is penetration. Phages with different
morphological structures might have different mechanisms of nucleic acid injection towards
the bacteria (Willey, 2008). Phage produce an enzyme called lysozyme to puncture the cell
wall of the bacteria (Madigan et al., 2008) and the DNA genome located in the phage head is
then injected through the tube of the tail into the host cytoplasm upon tail sheath contractions
(e. g., T4 phage) (Brovko et al., 2012; Pelczar et al., 2010).
20
Latent period or viral components synthesis is the third stage of viral infection. After
DNA is immediately passed to the cytoplasm, the early proteins are produced for DNA
replication as well as to modify the host metabolic machinery (Brovko et al., 2012). DNA is
transcribed to mRNA and is often initiated by the host cell RNA polymerase that directs the
transcription of the genes encoding phage protein synthesis (Willey, 2008). A number of
phage DNA copies are synthesized for transcription and translation of late proteins, which
build up the capsomeres subunits and other components of the tail assembly (Brovko et al.,
2012; Willey, 2008).
Figure 2.5: Typical life cycle of a phage. Life cycle depicting the lytic and lysogenic
pathways of phage when it infects bacterial cells. The diagram is an adaptation from Brovko
et al. (2012).
21
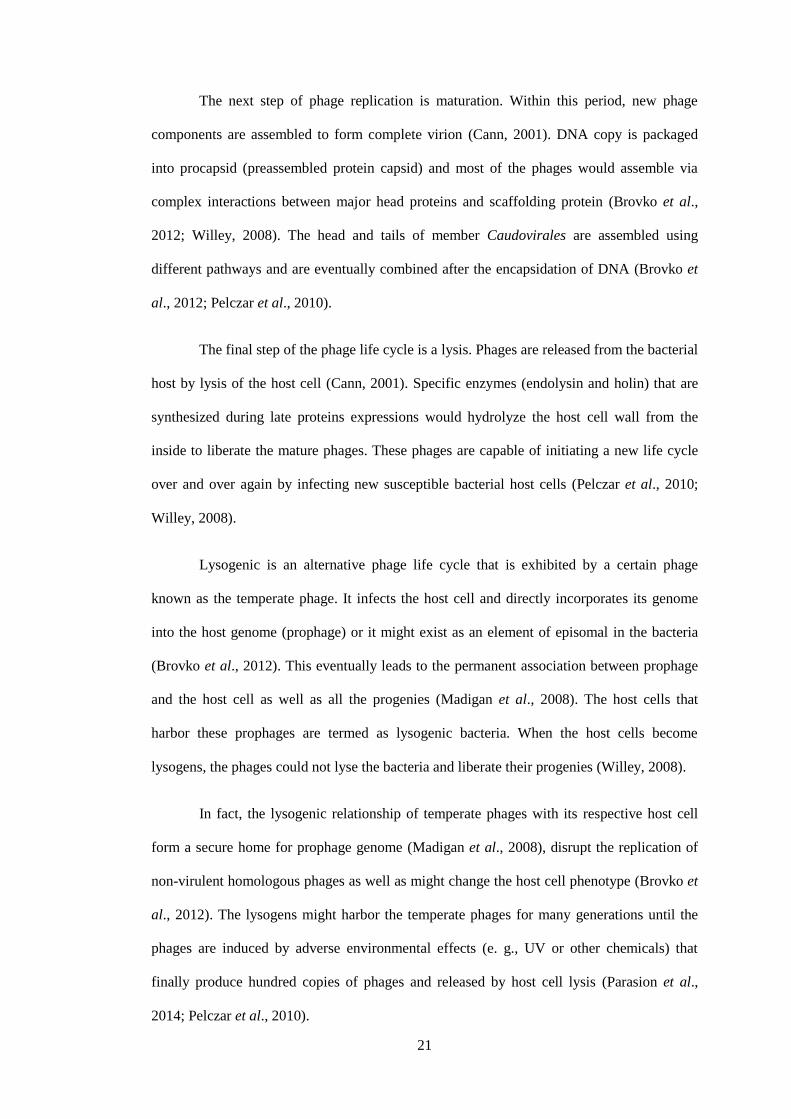
The next step of phage replication is maturation. Within this period, new phage
components are assembled to form complete virion (Cann, 2001). DNA copy is packaged
into procapsid (preassembled protein capsid) and most of the phages would assemble via
complex interactions between major head proteins and scaffolding protein (Brovko et al.,
2012; Willey, 2008). The head and tails of member Caudovirales are assembled using
different pathways and are eventually combined after the encapsidation of DNA (Brovko et
al., 2012; Pelczar et al., 2010).
The final step of the phage life cycle is a lysis. Phages are released from the bacterial
host by lysis of the host cell (Cann, 2001). Specific enzymes (endolysin and holin) that are
synthesized during late proteins expressions would hydrolyze the host cell wall from the
inside to liberate the mature phages. These phages are capable of initiating a new life cycle
over and over again by infecting new susceptible bacterial host cells (Pelczar et al., 2010;
Willey, 2008).
Lysogenic is an alternative phage life cycle that is exhibited by a certain phage
known as the temperate phage. It infects the host cell and directly incorporates its genome
into the host genome (prophage) or it might exist as an element of episomal in the bacteria
(Brovko et al., 2012). This eventually leads to the permanent association between prophage
and the host cell as well as all the progenies (Madigan et al., 2008). The host cells that
harbor these prophages are termed as lysogenic bacteria. When the host cells become
lysogens, the phages could not lyse the bacteria and liberate their progenies (Willey, 2008).
In fact, the lysogenic relationship of temperate phages with its respective host cell
form a secure home for prophage genome (Madigan et al., 2008), disrupt the replication of
non-virulent homologous phages as well as might change the host cell phenotype (Brovko et
al., 2012). The lysogens might harbor the temperate phages for many generations until the
phages are induced by adverse environmental effects (e. g., UV or other chemicals) that
finally produce hundred copies of phages and released by host cell lysis (Parasion et al.,
2014; Pelczar et al., 2010).

22
2.3.5 Genomics and evolution of phages
The elucidation of the first reported genome sequence of phage ΦX174 has left a
significant impact in the genomic era in 1977 (McAuliffe et al., 2007). The number of
isolated phages is more than 5000 but only approximately 750 of these have been completely
published in the public database entries and the numbers keep increasing every day (Hatfull
and Hendrix, 2011). Apparently, the available information obtained would be useful to
understand the contribution of phages towards evolution, ecological balance, virulence as
well as therapeutic aspects (McAuliffe et al., 2007).
However, these available database only reflect a minor proportion of the phages
diversity in the biosphere (McAuliffe et al., 2007). The introduction of metagenomic
analysis to study viral population reveals an amazing diversity of phages, primarily from
seawater, soil and gut communities (Breitbart and Rohwer, 2005; Hatfull and Hendrix,
2011). Abundance of novel genes has been identified and it is proposed that uncultured
phage communities are the largest untapped source of genetic information present in the
biosphere (McAuliffe et al., 2007; Rohwer, 2003).
Phage genomics are always the best tracks to explore fundamental genomics. All the
problems that have been encountered in the bacterial genomics are always discussed based
on the phage genomics perspectives: origin unity and diversity, vertical and horizontal
(lateral) genes transfer, non-orthologous gene displacement, synteny versus instability of the
genes order, tree versus web-like phylogeny as well as gene-splitting against domain
accretion (McAuliffe et al., 2007).
As mentioned before, double-stranded DNA tailed phages are believed to be the
largest group of entities in the biosphere and perhaps they are a very ancient group of virus
(Ackermann, 2011; Brüssow and Hendrix, 2002). Comparative genomic analysis of phage
groups has discovered that the mechanisms of phage evolution include lateral gene transfer,
non-homologous recombination of different genomes, and reassortment of variant sequences

23
created by homologous recombination. Tailed phages which belong to Caudovirales that
have been sequenced so far allow an access of large common genetic pool (Grath and van
Sinderen, 2007; Hendrix et al., 1999).
Presumably, high frequency of horizontal gene exchange is accountable for genetic
mosaicism and evidently emerge from non-homologous recombination of ancestral genes
sequences. Modules of mosaicism are varied, which are often individual genes, but could be
large blocks of genes corresponding to protein domains (Hendrix, 2003). By means of
temperate phages, the probabilities for a genetic exchange to occur might exist among
phages and prophages as well as bacterial genomes that they proliferate (Brüssow and
Kutter, 2005).
Vertical gene transfer might play an important role for evolution in the phage
families, especially those of virulent phages. Gene recombination could only recombine
among virulent phages with other phages upon simultaneous infection, or via homologs
sequences of resident prophages on the bacterial genomes or with complementary sequences
on the plasmid (Brüssow and Kutter, 2005). For example, the members of T4-like phages has
a few notably genetic exchange and they form quite a distinct group, but still there is an
evidence of lateral exchange reported for those of non-essential genes (Grath and van
Sinderen, 2007). Short conserved sequences have been revealed at the functional units
boundaries in some lambdoid phages proposing that the homologous or site-specific
recombination leads to lateral gene exchange among these phages (Grath and van Sinderen,
2007; Hendrix, 2003).
However, mycobacteriophages comparative genomic analysis proposed that lateral
gene exchange through non-homologous recombination might cause the evolution of this
group (Pedulla et al., 2003). Non-homologous recombination happens randomly throughout
the genome and the appearance of this event might be due to natural selection, which
eliminates the progeny that possesses the DNA inserted at the middle sequence of functional
relevant genes (Hendrix et al., 2000). Thus, this leads to the elucidation of new module

24
junctions as well as generation of coding sequences in which it reveals the creativity of the
process and a dominant force in the evolution of phage genomes (Brüssow and Hendrix,
2002; Grath and van Sinderen, 2007).
2.4 Phage-host interactions
2.4.1 Bacterial hosts evolution: the role of phages
Bacterial evolution is often associated with the continuous generation of genetic
variants and the major contributions of this constantly evolving processes are point
mutations, genetic rearrangements as well as lateral gene transfer. Extensive dynamic
genomes produced by lateral gene exchange results in huge amounts of DNA are being
inserted and deleted from the bacterial chromosomes (McAuliffe et al., 2007). Besides, this
kind of genetic exchange is responsible for the majority of intraspecies genetic variation
(Hambly and Suttle, 2005) and is found to leave a substantial impact on the evolution of the
bacterial host genomes (McAuliffe et al., 2007).
In some species of bacteria, prophages account for a major contribution of bacterial
genomic diversity. Meanwhile, transposons, pathogenicity islands (PAIs) as well as
integrative plasmids might involve in other species (McAuliffe et al., 2007). Undoubtedly,
the integration of the phage DNA into the bacterial genome (prophage) has become an
extremely common phenomenon; prophage increasing the metabolic burden of the host as
well as causing the bacteria to lyse when induction occurs (Pelczar et al., 2010).
Lysogenic conversion genes might happen in certain conditions, in which the
prophage tends to express some of their genes in the lysogen, thus alter the phenotype of the
host by providing selective benefit (Brüssow and Hendrix, 2002; Madigan et al., 2008).
These genes might increase cell fitness, or protect the hosts from other phage infection as
well as increasing the host’s virulence (Waldor and Mekalanos, 1996).