iSOFT Group Limited Annual Report 2010 - ABN...
146
ABN 66 063 539 702 iSOFT Group Limited Annual Report 2010
Transcript of iSOFT Group Limited Annual Report 2010 - ABN...

ABN 66 063 539 702
iSOFT Group Limited Annual Report 2010


Chairman’s Report
Acting Chief Executive Officer’s Report
Group Finance Director’s Report
Corporate Governance Statement
Financial Report
02
04
09
13
17
Contents
01iSOFT Group Limited Annual Report 2010

“We are actively tackling the issues that have affected our performance. We expect that we will exit 2011 with a considerably more robust business.”
As you are now well aware, FY2010 was a difficult year for iSOFT. We hit a number of hurdles and encountered unforeseen challenges that had a significant adverse impact on our financial performance and share price. They did not, however, in any way erode the quality and standing of our portfolio of products in the international healthcare market place.
Currency fluctuations, with the Australian dollar rising strongly against the British Pound and Euro, had a significant negative effect on reported revenue and profitability. The prevailing difficult economic times also had a negative impact on our expected growth, particularly in the UK and Continental Europe where Governments were compelled to defer planned expenditures and rein in existing ones. With hindsight, we should have acted sooner to recognise this risk. The simple fact is we allowed our expenses to rise in anticipation of revenues that did not materialise.
A shortfall in expected revenues from the UK National Programme for IT (NPfIT) this year was another disappointing factor. The implementation of the NPfIT has been slower than we expected, which meant we have not yet received a number of milestone payments associated with that programme and other related revenues have been delayed. However, we are encouraged by the
Robert MoranNon-Executive Chairman
Chairman’s Report
02 iSOFT Group Limited Annual Report 2010

Department of Health’s recent decision to continue with national applications already procured while moving to a more locally-led plural system for new contracts.
Nevertheless, all these factors have caused issues with our capital structure.
As your new Chairman, it is particularly disappointing that I am writing to you for the first time under such circumstances. However, I want to assure you that we are actively tackling the issues that have affected our performance and have implemented a three-pronged action plan. First, we are restructuring the way we do business to decrease our operating expenses and to make us a more nimble organisation. Secondly, we are also considering selling some assets and closing some outlying business units. Thirdly, we are working towards strengthening our balance sheet.
We have already begun implementing cost reductions as a result of the review of our operating structure. We expect to achieve very significant cost reductions by June 2011. We have also frozen the salaries of key management personnel and have reduced Directors’ fees by 10 percent for FY2011. I have also waived my fees as Chairman for FY2011 to assist with planned cost reductions.
We are also in the process of rationalising our product line and geographic exposure to ensure we are focused solely on the areas that will provide the greatest profitable growth and that generate operating cash flow. Our research and development will be more focused, and will aim to achieve greater flexibility and speed to market. Overall, we have tried to strike a balance between simplification and downsizing, while not sacrificing the many business and growth opportunities that exist. However, our ability to pursue the wider set of opportunities remains unchanged.
We have also made some changes to the management team and Board. Gary Cohen stepped down as Executive Chairman in June and as CEO on August 31 to allow a new team to take the business through this next phase. Although Gary has now left the Company, I want to thank him for his tremendous contribution to this business over the past 13 years. It was Gary’s leadership and vision that turned this business into a multinational organisation and a very significant participant in the healthcare IT segment globally.
Andrea Fiumicelli has been appointed Acting CEO while we conduct an executive search for a permanent replacement. Andrea has been Chief Operating Officer for the past two years and his report on the operational side of the business, and in particular the roll-out of Lorenzo to other countries outside the UK, follows this report.
We are also in the middle of a Board renewal process under which a number of additional and replacement Board members will be nominated. Ronald Series has already accepted an invitation to join the Board as an Executive Director and is overseeing the operational restructure and transformation of the Company. We
are pleased to have secured the services of such an experienced executive, and you can find details of Ronald’s experience in the Directors’ report.
We have successfully renegotiated our debt facilities with our banking syndicate. Under our new facilities we are incentivised to reduce the level of gearing as quickly as possible and, accordingly, we are undergoing a comprehensive review of our capital structure in order to achieve this aim. We hope to update you on the results of the review in the not too distant future.
The 2011 financial year will be a transitional year as we proceed through this restructure. We expect that we will exit 2011 with a considerably more robust business. We started the 2011 financial year with $300 million in contracted and recurring revenue and a strong pipeline of new business which is testament to our brand and loyal customer base.
We must acknowledge the support of our customers and suppliers. Our footprint, being our installed base, is an important asset of the company and is only as strong as our customer service and engagement, which we have been working hard on improving. I take this opportunity to thank our customers for their continued loyalty and support.
As you know, I have been a Non-Executive Director of the company since November 2008 and am currently Managing Director of Oceania Capital Partners, which is a cornerstone investor and strong supporter of iSOFT. I believe that this is a company that will soon be back on track, delivering its world class product and once again providing shareholders with appropriate returns.
It is customary at this point to thank our loyal executives and employees for their efforts throughout the year just passed. In this instance, however, this sentiment must be underlined. The challenges which the company has been navigating fundamentally affect our employees and morale. It is a testament to the culture of the organisation that they have knuckled down and just kept the business running while others have dealt with the business review and capital issues. Many have already seen friends and colleagues depart the business and, on behalf of the Board, management and shareholders, I thank all our employees for their dedication and commitment.
Robert MoranNon-Executive Chairman
03iSOFT Group Limited Annual Report 2010

“iSOFT needs to be in the best possible position to take advantage of the ongoing opportunities globally. In my new position as Acting CEO, I am focused on restructuring the Company to improve profitability.”
Reducing the cost of healthcare continues to be a pressing economic problem for Governments worldwide, and the estimated $7 trillion it consumes a year globally represents an increasing share of national incomes.
Investment in modern healthcare IT systems creates value by raising productivity and improving the economics of care delivery. The billions of dollars being invested in regional and national level IT programmes across Europe, the US and Australia is a clear affirmation of this. To cite just some examples, the Electronic Medical Records market in Europe is expected to grow to over $1.7 billion by 2016, while US$35 billion has been allocated under the American Recovery and Reinvestment Act. In the UK, the National Programme for IT will continue to procure and implement IT solutions that are providing integrated care management to deliver clinical and business improvements.
The weak global economy slowed the pace of public sector investments in the last 12 months, and this negatively affected iSOFT’s business; however, we are confident that Governments around the world recognise the importance of investing in IT to deliver high quality, accessible and financially sustainable healthcare to increasingly demanding consumers.
Andrea FiumicelliActing Chief Executive Officer
Acting Chief Executive Officer’s Report
04 iSOFT Group Limited Annual Report 2010

iSOFT needs to be in the best possible position to take advantage of the ongoing opportunities globally. In my new position as Acting CEO, I am focused on restructuring the Company to improve profitability. As such, we are conducting a strategic review of its business operations and a range of changes are already being implemented. These include more efficient utilisation of our people, reducing duplication and simplifying internal processes. We are reducing the number of management layers and increasing the operational focus of our management team. We are simplifying and improving the way we develop and deliver products to ensure we can anticipate fluctuations in market dynamics and respond accordingly. We have established five Development Centres of Excellence to enable iSOFT to develop and deliver solutions closer to clients.
Rationalising our product base will eliminate investments in products that do not generate significant returns while carefully transitioning customers to other products in a way that minimises the impact on our customers and iSOFT’s businesses.
Geographically, we are focusing on core markets where we can achieve sufficient scale to generate positive cash flow in the business.
Our investment in research and development will be more targeted to segments where there is high and growing demand in order to capitalise on areas governments are looking to invest in, namely clinical process enhancement, clinical decision support, chronic disease management, patient safety and cross-sector health information exchange. We will invest in core areas that optimise the use of resources, such as labour, bed management and equipment scheduling, as well as clinical and financial outcome measurement. These are areas governments recognise as most likely to deliver productivity and operational savings.
In total we expect to achieve approximately $50 million in annualised cost savings by June 2011, compared with the annualised cost structure of the fourth quarter of FY2010.
FY2010 highlights In the United Kingdom, the roll-out of Lorenzo clinical and patient management solutions to 3,500 users across the five sites of the University Hospitals of Morecambe Bay - NHS Trust was a significant milestone. User numbers are expected to double by the end of 2010.
Lorenzo is our ground-breaking enterprise-wide healthcare software platform that provides the foundation from which next-generation healthcare applications can be built. Lorenzo solutions address the administrative and clinical information management requirements of all healthcare and connect patients, organisations and healthcare professionals. It supports the need for accurate, on-demand information across organisational and care setting boundaries for the delivery of more timely and consistent care. The ability to adapt the solution to new workflows and evolving requirements is a competitive advantage.
Lorenzo is the intellectual property output of one of the most demanding national procurements. While developed for the National Programme in the United Kingdom, iSOFT owns the Lorenzo intellectual property and is able to benefit from deploying it elsewhere. Changes announced by the Department of Health in September 2010 expand the potential opportunities available to iSOFT.
The Patient JourneyiSOFT solutions support the delivery of personalised services to patients; they connect organisations and individuals across regions and healthcare settings, ensuring a safe, seamless patient journey, whatever their needs, wherever they are.
Acting Chief Executive Officer’s Report
05iSOFT Group Limited Annual Report 2010
Community Health Data
Community Health Data
Community Health Data
Community Health Data
Community Health Data
UPDATE UPDATE UPDATE UPDATE UPDATE UPDATE UPDATEUPDATE UPDATE UPDATE UPDATEUPDATE UPDATE UPDATE UPDATE UPDATE
Primary Care Physician reviews latest clinical details and sends referral to cardiologist
Cardiologist reviews referral and
checks test resultsAcute Care Nursemonitors Angela’s
progress and administers medications
Vital signsout of range
General Practionernotified vital signsare out of range Angela’s
prescriptionupdated
Quality Manageralerted
Healthcare Teamorganise follow ups
with Angela
Angela is notified via SMS of follow up appointments
Diagnostic testsperformed
Angela recovers well at home
Angela falls out of bedand fractures her hip
Angela is moved to ICUfor post-op monitoring
Angela is admittedto hospital
Angela updatespre admission details
Angela presentsfor further testing
Angela advised ifcondition does not
improve to go to hospital
Care Coordinatormonitors Angela’s readings
CONSOLIDATED DASHBOARD VIEW
Abnormal resultsCardiologist recommends
Angela is admitted General Practionerviews discharge
information
Discharge summary
Mrs Angela Santos Mrs Santos admitted for management of Acute on Chronic Heart Failure.
Echo showed unchanged ejection fraction. Responded well to medical management.
Patient fell from bed day 2 resulting in fractured right neck of femur. Required surgical intervention.
Monitored post op in intensive care.
Discharged day 7 for rehab.
Follow up appointments with cardiologist, physiotherapist and PCP.
Care Coordinatormonitors Angela’s health status
Quality Manager reviews incident
Angela’s Health Data
Cardiologistreceives referral
Angela monitorscondition at home
UPDATE
Chronic heart failure and cardiovascular disease Monitors vital signs at home: weight, blood pressure, pulse rate Documents medication and symptoms
Name: Mrs Angela Santos
Sex: Female
Age: 67
IHI: 8003601234567899
Medical History
Patient Details
Fall incident detailscaptured in AIMS
Your journey with iSOFT
General Practioner:Dr Sarah Milson
Cardiologist:Dr Alex Fraser
Acute Care Nurse:Irena PetricRegistered Nurse
Care Coordinator:Peter Carson Registered Nurse at the Monitoring Ops Centre
Quality Manager:Sam Teo
Healthcare Team
Health Information Exchange
DashboardRehabilitationIncidentAdmissionMonitoring

Community Health Data
Community Health Data
Community Health Data
Community Health Data
Community Health Data
UPDATE UPDATE UPDATE UPDATE UPDATE UPDATE UPDATEUPDATE UPDATE UPDATE UPDATEUPDATE UPDATE UPDATE UPDATE UPDATE
Primary Care Physician reviews latest clinical details and sends referral to cardiologist
Cardiologist reviews referral and
checks test resultsAcute Care Nursemonitors Angela’s
progress and administers medications
Vital signsout of range
General Practionernotified vital signsare out of range Angela’s
prescriptionupdated
Quality Manageralerted
Healthcare Teamorganise follow ups
with Angela
Angela is notified via SMS of follow up appointments
Diagnostic testsperformed
Angela recovers well at home
Angela falls out of bedand fractures her hip
Angela is moved to ICUfor post-op monitoring
Angela is admittedto hospital
Angela updatespre admission details
Angela presentsfor further testing
Angela advised ifcondition does not
improve to go to hospital
Care Coordinatormonitors Angela’s readings
CONSOLIDATED DASHBOARD VIEW
Abnormal resultsCardiologist recommends
Angela is admitted General Practionerviews discharge
information
Discharge summary
Mrs Angela Santos Mrs Santos admitted for management of Acute on Chronic Heart Failure.
Echo showed unchanged ejection fraction. Responded well to medical management.
Patient fell from bed day 2 resulting in fractured right neck of femur. Required surgical intervention.
Monitored post op in intensive care.
Discharged day 7 for rehab.
Follow up appointments with cardiologist, physiotherapist and PCP.
Care Coordinatormonitors Angela’s health status
Quality Manager reviews incident
Angela’s Health Data
Cardiologistreceives referral
Angela monitorscondition at home
UPDATE
Chronic heart failure and cardiovascular disease Monitors vital signs at home: weight, blood pressure, pulse rate Documents medication and symptoms
Name: Mrs Angela Santos
Sex: Female
Age: 67
IHI: 8003601234567899
Medical History
Patient Details
Fall incident detailscaptured in AIMS
Your journey with iSOFT
General Practioner:Dr Sarah Milson
Cardiologist:Dr Alex Fraser
Acute Care Nurse:Irena PetricRegistered Nurse
Care Coordinator:Peter Carson Registered Nurse at the Monitoring Ops Centre
Quality Manager:Sam Teo
Healthcare Team
Health Information Exchange
DashboardRehabilitationIncidentAdmissionMonitoring
We are now capitalising on Lorenzo’s success in other parts of the United Kingdom as well as across Europe.
The St Jansdal Hospital in the Netherlands, a key partner in the development of innovative iSOFT solutions, extended its investment in Lorenzo. The hospital is also collaborating on one of our iPhone applications that enable nurses to register general patient data, including pulse and temperature readings, directly into the electronic patient record.
The flexibility of the architecture is the key to our entry into new markets and segments, allowing us to build new solutions, target specific areas of healthcare or localise applications more rapidly. We now have six organisations in Germany that have adopted a Lorenzo-based strategy. Using our Smart Solution development approach we have the ability to be agile in the way we design solutions that meet departmental or business needs and deploy them to an organisation in an incremental way. A recent example of this is the new Lorenzo Nursing Management solution that is being delivered to complement an organisation’s existing solutions while providing the framework to deploy further Lorenzo solutions.
We continue to develop products based on Lorenzo, each of which will generate revenue in different markets in their own right. These include Health Information Exchange, Health Intelligence and the Health Studio development toolkit.
The architecture also allows us to offer the Lorenzo solutions under a software-as-a-service (SaaS) model. In the US, and elsewhere, there is a definite trend towards SaaS, driven by the costs of IT support and expensive infrastructure. The move to cloud computing too, with applications virtualised at data centres, will only accelerate.
“Lorenzo was developed for the National Programme in the United Kingdom. iSOFT owns the intellectual property and is able to benefit from deploying it elsewhere.”
Acting Chief Executive Officer’s Report CONTiNuEd
06 iSOFT Group Limited Annual Report 2010

Community Health Data
Community Health Data
Community Health Data
Community Health Data
Community Health Data
UPDATE UPDATE UPDATE UPDATE UPDATE UPDATE UPDATEUPDATE UPDATE UPDATE UPDATEUPDATE UPDATE UPDATE UPDATE UPDATE
Primary Care Physician reviews latest clinical details and sends referral to cardiologist
Cardiologist reviews referral and
checks test resultsAcute Care Nursemonitors Angela’s
progress and administers medications
Vital signsout of range
General Practionernotified vital signsare out of range Angela’s
prescriptionupdated
Quality Manageralerted
Healthcare Teamorganise follow ups
with Angela
Angela is notified via SMS of follow up appointments
Diagnostic testsperformed
Angela recovers well at home
Angela falls out of bedand fractures her hip
Angela is moved to ICUfor post-op monitoring
Angela is admittedto hospital
Angela updatespre admission details
Angela presentsfor further testing
Angela advised ifcondition does not
improve to go to hospital
Care Coordinatormonitors Angela’s readings
CONSOLIDATED DASHBOARD VIEW
Abnormal resultsCardiologist recommends
Angela is admitted General Practionerviews discharge
information
Discharge summary
Mrs Angela Santos Mrs Santos admitted for management of Acute on Chronic Heart Failure.
Echo showed unchanged ejection fraction. Responded well to medical management.
Patient fell from bed day 2 resulting in fractured right neck of femur. Required surgical intervention.
Monitored post op in intensive care.
Discharged day 7 for rehab.
Follow up appointments with cardiologist, physiotherapist and PCP.
Care Coordinatormonitors Angela’s health status
Quality Manager reviews incident
Angela’s Health Data
Cardiologistreceives referral
Angela monitorscondition at home
UPDATE
Chronic heart failure and cardiovascular disease Monitors vital signs at home: weight, blood pressure, pulse rate Documents medication and symptoms
Name: Mrs Angela Santos
Sex: Female
Age: 67
IHI: 8003601234567899
Medical History
Patient Details
Fall incident detailscaptured in AIMS
Your journey with iSOFT
General Practioner:Dr Sarah Milson
Cardiologist:Dr Alex Fraser
Acute Care Nurse:Irena PetricRegistered Nurse
Care Coordinator:Peter Carson Registered Nurse at the Monitoring Ops Centre
Quality Manager:Sam Teo
Healthcare Team
Health Information Exchange
DashboardRehabilitationIncidentAdmissionMonitoring
Cloud computing is a game-changer for the sector, and iSOFT plans to be an early adopter among large healthcare service providers in this area. Leveraging cloud computing, with the application running at a data centre but available to thousands of users across multiple sites, offers tremendous savings from an IT management perspective. Crucially, Lorenzo can be scaled depending on demand and charged on a pay-per-user or pay-per-click basis, making it an affordable proposition for any healthcare provider.
During FY2010, we completed a number of strategic acquisitions which have provided us with important complementary solutions which are core to our global offerings.
The acquisition of UltraGenda has provided an enterprise level scheduling solution that enables the scheduling, appointment management and resource allocation within increasingly complex multi-disciplinary health service organisations. It is proven in over 100 installations across Europe, including Belgium, Denmark, France, the Netherlands, Norway, Spain, Switzerland and the UK. Our first contract has recently been secured in Germany. As more patients move between various sectors and providers, its sophisticated appointment and scheduling capability, combined with its patient and clinician portals, provides us with a real market leading advantage as we introduce it into our other regions, on its own or as a key element in expanding the patient and facility management capabilities of our existing solutions. The BridgeForward acquisition provided an integration engine technology which is widely used in the United Kingdom and United States, and which we are delivering as a core component of our offerings across all regions. Recently opened in Australia, the new $250 million Macquarie University Hospital has deployed iSOFT applications for patient flow, clinical and medication management, as well as finance, purchasing and management reporting. With
the Viaduct integration engine the solutions are fully integrated with third party systems for radiology, laboratory and pharmacy to guarantee that changes are reflected across all applications in real time. This acquisition is a good example of how we have leveraged a range of our strategic solutions to deliver an integrated paperless solution for an entire facility within a record time of 20 weeks.
Recognising the importance organisations are placing on the monitoring and reporting of incidents and their need for objective information to inform corrective strategies, we also acquired the Patient Safety International business. The incident monitoring solution is recognised by the World Health Organization and the US Institute of Medicine for its comprehensive and standardised classification of incidents and its ability to facilitate benchmarking and monitoring improvements over time.
We are seeing significant opportunities emerging from our investment in these and earlier products such as medication management. We expect revenue growth from our existing customer base and beyond, capitalising on our leadership position in the UK, Europe, Asia, Latin America as well as Australia and New Zealand.
New markets, segments and regional implementationsiSOFT completed two state-wide installations in Australia in Tasmania and Victoria during the year, including Victoria’s HealthSMART programme which is possibly the largest in the southern hemisphere, covering 122 hospital sites. Together with systems in Tasmania, we currently manage over 13 million patient records with close to 90,000 registered users across 130 hospitals.
Despite the economic downturn, our Central European business unit increased its market share with a 27 percent increase in order intake.
Acting Chief Executive Officer’s Report CONTiNuEd
07iSOFT Group Limited Annual Report 2010

Revenues from the Southern Europe and Latin America business unit increased 30 percent during the year. We have expanded our Latin American business, securing three new contracts in Mexico and entering new markets in the Dominican Republic and Peru.
Our internationalised laboratory solution has continued to be sold across Germany and the UK and has been further extended through Russia. It has been successfully introduced into Asia, the Netherlands and New Zealand. This forms a strong foundation for significant state-wide laboratory opportunities emerging in Australia. The Integra suite of Web-enabled financial and purchasing solutions has expanded its footprint in Australia since it was introduced in 2008 and our business intelligence solution was part of the suite implemented at the Macquarie University Hospital.
The year aheadThe challenges we experienced in FY2010 have had a significant impact on our business. The initiatives already in place are working to address many areas of vulnerability. We will continue to strive to improve overall efficiency and cost-effectiveness across the company. We are confident that our ongoing activities at the product management, R&D and customer service levels will ensure a strong product pipeline that will only improve as healthcare IT expenditure recovers globally.
Andrea FiumicelliActing Chief Executive Officer
Acting Chief Executive Officer’s Report CONTiNuEd
08 iSOFT Group Limited Annual Report 2010
Community Health Data
Community Health Data
Community Health Data
Community Health Data
Community Health Data
UPDATE UPDATE UPDATE UPDATE UPDATE UPDATE UPDATEUPDATE UPDATE UPDATE UPDATEUPDATE UPDATE UPDATE UPDATE UPDATE
Primary Care Physician reviews latest clinical details and sends referral to cardiologist
Cardiologist reviews referral and
checks test resultsAcute Care Nursemonitors Angela’s
progress and administers medications
Vital signsout of range
General Practionernotified vital signsare out of range Angela’s
prescriptionupdated
Quality Manageralerted
Healthcare Teamorganise follow ups
with Angela
Angela is notified via SMS of follow up appointments
Diagnostic testsperformed
Angela recovers well at home
Angela falls out of bedand fractures her hip
Angela is moved to ICUfor post-op monitoring
Angela is admittedto hospital
Angela updatespre admission details
Angela presentsfor further testing
Angela advised ifcondition does not
improve to go to hospital
Care Coordinatormonitors Angela’s readings
CONSOLIDATED DASHBOARD VIEW
Abnormal resultsCardiologist recommends
Angela is admitted General Practionerviews discharge
information
Discharge summary
Mrs Angela Santos Mrs Santos admitted for management of Acute on Chronic Heart Failure.
Echo showed unchanged ejection fraction. Responded well to medical management.
Patient fell from bed day 2 resulting in fractured right neck of femur. Required surgical intervention.
Monitored post op in intensive care.
Discharged day 7 for rehab.
Follow up appointments with cardiologist, physiotherapist and PCP.
Care Coordinatormonitors Angela’s health status
Quality Manager reviews incident
Angela’s Health Data
Cardiologistreceives referral
Angela monitorscondition at home
UPDATE
Chronic heart failure and cardiovascular disease Monitors vital signs at home: weight, blood pressure, pulse rate Documents medication and symptoms
Name: Mrs Angela Santos
Sex: Female
Age: 67
IHI: 8003601234567899
Medical History
Patient Details
Fall incident detailscaptured in AIMS
Your journey with iSOFT
General Practioner:Dr Sarah Milson
Cardiologist:Dr Alex Fraser
Acute Care Nurse:Irena PetricRegistered Nurse
Care Coordinator:Peter Carson Registered Nurse at the Monitoring Ops Centre
Quality Manager:Sam Teo
Healthcare Team
Health Information Exchange
DashboardRehabilitationIncidentAdmissionMonitoring

Martin dedaGroup Finance director
“ iSOFT expanded its costs in FY2010 in anticipation of a growth in revenues which did not materialise. We are now bringing our capital and cost structure in line with revenues.”
Key Financials• Total revenue down 20% to $431 million (or 7% in constant
currency terms)
• Reported EBITDA down 77% to $30.1 million (or 78% in constant currency terms)
• EBITDA pre exceptional and one-off items down 69% to $41.5 million
• Operating cash was negative $0.7 million
• One-off impairment loss of $341 million primarily goodwill
• Statutory loss of $383 million
Note: Constant currency or constant exchange rates in this section refer to the conversion of local currencies into Australian Dollars at a fixed exchange rate.
Group Finance director’s Report
09iSOFT Group Limited Annual Report 2010
Acting Chief Executive Officer’s Report CONTiNuEd
Community Health Data
Community Health Data
Community Health Data
Community Health Data
Community Health Data
UPDATE UPDATE UPDATE UPDATE UPDATE UPDATE UPDATEUPDATE UPDATE UPDATE UPDATEUPDATE UPDATE UPDATE UPDATE UPDATE
Primary Care Physician reviews latest clinical details and sends referral to cardiologist
Cardiologist reviews referral and
checks test resultsAcute Care Nursemonitors Angela’s
progress and administers medications
Vital signsout of range
General Practionernotified vital signsare out of range Angela’s
prescriptionupdated
Quality Manageralerted
Healthcare Teamorganise follow ups
with Angela
Angela is notified via SMS of follow up appointments
Diagnostic testsperformed
Angela recovers well at home
Angela falls out of bedand fractures her hip
Angela is moved to ICUfor post-op monitoring
Angela is admittedto hospital
Angela updatespre admission details
Angela presentsfor further testing
Angela advised ifcondition does not
improve to go to hospital
Care Coordinatormonitors Angela’s readings
CONSOLIDATED DASHBOARD VIEW
Abnormal resultsCardiologist recommends
Angela is admitted General Practionerviews discharge
information
Discharge summary
Mrs Angela Santos Mrs Santos admitted for management of Acute on Chronic Heart Failure.
Echo showed unchanged ejection fraction. Responded well to medical management.
Patient fell from bed day 2 resulting in fractured right neck of femur. Required surgical intervention.
Monitored post op in intensive care.
Discharged day 7 for rehab.
Follow up appointments with cardiologist, physiotherapist and PCP.
Care Coordinatormonitors Angela’s health status
Quality Manager reviews incident
Angela’s Health Data
Cardiologistreceives referral
Angela monitorscondition at home
UPDATE
Chronic heart failure and cardiovascular disease Monitors vital signs at home: weight, blood pressure, pulse rate Documents medication and symptoms
Name: Mrs Angela Santos
Sex: Female
Age: 67
IHI: 8003601234567899
Medical History
Patient Details
Fall incident detailscaptured in AIMS
Your journey with iSOFT
General Practioner:Dr Sarah Milson
Cardiologist:Dr Alex Fraser
Acute Care Nurse:Irena PetricRegistered Nurse
Care Coordinator:Peter Carson Registered Nurse at the Monitoring Ops Centre
Quality Manager:Sam Teo
Healthcare Team
Health Information Exchange
DashboardRehabilitationIncidentAdmissionMonitoring

Revenue 430.5 400.9 538.9 430.0
Reported EBITDA 30.1 21.5 132.4 97.0
Underlying EBITDA 1 41.5 32.7 132.5 97.1
Reported NPAT (382.9) 34.7
Operating cash flow (0.7) 64.3
Net cash flow (49.2) 29.2
Actual exchange
rates
Constant exchange
rates
Actual exchange
rates
Constant exchange
ratesA$m
Results summary
RevenuesThe appreciation of the Australian dollar against the Euro and the GBP of approximately 25% at its peak played a big part in the decline in iSOFT’s earnings, eroding reported revenues by $108 million from prior year levels. Although iSOFT is an Australian company whose shares are listed on the ASX, the majority of its business is in the UK and Europe, with earnings exposed to translation risk due to reporting in AUD. In FY2010, over 70% of iSOFT’s revenues were denominated in GBP and Euro.
The actual fall in underlying revenue (when measured on a constant currency basis) was around $30 million, most of which was attributable to delays in the implementation of the UK NPfIT. Most other regions had flat revenues, with Southern Europe and Latin America (SELA) showing strong growth.
1. Underlying EBITDA is EBITDA before exceptional and one off items of $11.4m (Restructuring $5.1m, Exceptional items $4.0m, Other one-off items $2.3m)
* SELA Southern Europe and Latin America
AUD relative to the EUR and GBP
FY2010 FY2009
iUK
NPfIT
Total UKI
Central Europe
SELA*
Other
Total
Total excl NPfIT
FY10 FY09% chg.
y.o.y
104.0
65.0
169.0
97.4
20.7
113.8
400.9
335.9
107.7
95.1
202.8
96.6
15.8
114.8
430.0
334.9
-3%
-32%
-17%
1%
31%
-1%
-7%
0%
Revenues by segment - constant currency
0.45
0.5
0.55
0.6
0.65
0.7
0.75
GBPEUR
Jul09
Aug09
Sep09
Oct09
Nov09
Dec09
Jan10
Feb10
Mar10
Apr10
May10
Jun10
25% appreciation at peak from July 1, 2009
(A$m)
Group Finance director’s Report CONTiNuEd
10 iSOFT Group Limited Annual Report 2010

There were no major changes in the breakdown of our revenues in FY2010. Maintenance and support revenues, which are largely recurring, remained the largest component of revenue, at almost 40% of revenues. In FY2010, we have separated managed services from maintenance and support. Adding this back for a comparison with FY2009 showed very little change from the prior year.
CostsiSOFT expanded its costs in FY2010 in anticipation of a growth in revenues which did not materialise. In particular, iSOFT boosted its sales and marketing efforts and R&D expenditure. A large proportion of iSOFT’s costs are fixed in nature and, as a result, the decline in revenues flows largely through to the bottom line.
Given the slower than expected top line growth, iSOFT is now winding back these costs, and made significant progress in this area in Q42010.
Revenue ($Am)
Licences
National Programme for IT
Professional Services
Maintenance and support
Managed services
Third party hardware
Third party software
Other
Total
FY10 FY09 % change
83.9
65.0
58.0
158.6
17.0
8.9
8.0
1.5
400.9
83.4
95.1
55.2
173.3
-
12.7
8.4
2.0
430.1
0%
-32%
5%
-8%
-30%
-5%
-25%
-7%
External COGS
% of revenues
Operations support and implementation
% of revenues
Sales and marketing
% of revenues
R&D
% of revenues
G&A (excluding ICT, facilities)
% of revenues
ICT
Facilities
Bad debts
FY10 FY09
48.9
12%
124.2
31%
56.4
14%
85.3
21%
43.5
11%
21.7
21.1
1.7
49.8
12%
130.8
30%
45.1
10%
63.3
15%
32.6
7%
18.8
16.8
0.8
Costs by function: Constant currency
$Am
11iSOFT Group Limited Annual Report 2010

Operating cash flowsOperating cash flows in FY2010 were marginally negative overall at -$0.7 million. As was the case in previous years, second half cash flow was stronger than the first half. Second half FY2010 operating cash flow was $11.4 million. This is due to the nature of the business where maintenance fees are paid in advance, making operating cash flows lumpy and seasonal.
BorrowingsWe have successfully renegotiated our debt facilities with our banking syndicate. We have also reset our debt covenants as part of the negotiation. Under the new facilities we are incentivised to reduce debt levels going forward. As at June 30, FY2010, our net debt position was $195 million.
Opening cash 85.7 54.2
Change in cash (49.2) 29.2
Forex (4.9) 2.3
Closing cash 31.6 85.7
Term Loan (87.1) (118.5)
Revolving Credit Facility (82.1) (54.4)
Total bank loans (169.2) (172.9)
Contract and other funding (21.7) (38.8)
Finance lease (3.2) (1.1)
OCP convertible note (32.2) (29.4)
Total gross debt (226.3) (242.2)
Net debt (194.7) (156.5)
FY10 FY09$Am
Net debt position
ImpairmentAs a result of the more subdued economic environment in iSOFT’s markets, the company has reduced its internal projections for growth in Central Europe, Middle East and Africa, South East Asia and Australia. This has resulted in the company recording a significant impairment of its carrying values of intangibles (primarily goodwill associated with the iSOFT acquisition) and deferred tax assets.
Consequently, the Company recorded a total impairment of these items of $341 million in FY2010. As a result of the impairment, iSOFT reported a statutory of loss $383 million in FY2010.
The Company will not be paying a dividend for the FY2010 year.
Martin DedaGroup Finance Director
Group Finance director’s Report CONTiNuEd
12 iSOFT Group Limited Annual Report 2010

Corporate Governance Statement
13iSOFT Group Limited Annual Report 2010
iSOFT Group Limited (“iSOFT” or “Company”) and the Board are committed to achieving and demonstrating the highest standards of corporate governance, consistent with the size and nature of the Company. This Statement outlines the Company’s main corporate governance practices as at 30 June 2010. All these practices, unless otherwise stated, were in place for the entire year.
The Company considers that it has substantially met the best practice recommendations contained within the ASX Corporate Governance Council’s Corporate Governance Principles and Recommendations (2nd Edition) (“ASX Recommendations”). In those circumstances where the Company has not followed an ASX Recommendation, the Company considers that the recommendation is not appropriate for a company of iSOFT Group Limited’s size and nature. This Statement also provides additional explanation as to why the Company has departed from particular ASX Recommendations.
Board responsibilities and objectives The objective of the Board is to increase shareholder value within an appropriate framework that ensures the Company’s affairs are properly managed and controlled. The Board sets the strategic business direction to be followed and is responsible for the overall corporate governance of the Company. The Board has also established a framework of controls and a set of procedures and delegations of authority to the Chief Executive Officer and other Senior Executives.
The Board operates in accordance with the Company’s Constitution. The powers reserved to the Board include the following:
• the selection, appointment and, if necessary, the replacement of the Chief Executive;
• establishment of the control environment to provide for meaningful and timely information;
• facilitate a communication capability to all stakeholders in accordance with the continuous disclosure provisions and to comply with relevant legal obligations;
• reviewing and ratifying systems of risk management;• establishing a basis for approvals of capital expenditure, acquisitions
and divestment; and• the review and oversight of the Company’s strategic plan.
With the exception of the powers reserved for the Board, all other powers are delegated to management through the Chief Executive and the management team.
Board composition The policy is to maintain a broad base of business skills on the Board and expertise relevant to the Company’s objectives. There are six Directors of the Company, five of whom are non-executive Directors and three are considered “Independent” in terms of the ASX Recommendations. There is also one other Director who acts as an alternate to two of the non-executive OCP nominated Directors.
The term of office, the skills, experience and expertise relevant to the position of Director held by each Director in office at the date of this report are set out on pages 21-22.
The Chairman (Mr Moran) and two other members of the Board (Messrs Series and Tsicalas) are not considered “independent” Directors.
Messrs Moran and Tsicalas are representative Directors of OCP. As OCP is a “substantial shareholder”, they are not considered independent under the ASX Recommendations.
Professor Jackson, Mr Wise and Mr Sherlock are considered “independent” in terms of the ASX Recommendations. Shareholdings are detailed on pages 21 to 22 of this report.
OCP has a substantial shareholding in the Company. It has a significant interest in the Company’s continued success. They are entitled to appoint two Directors to the Company resulting from their capital contributions to the Company. Therefore it is appropriate that OCP be well represented on the Board. The Company recognises that the ASX Recommendations recommend that a listed company should have a majority of Directors who are independent and that the Chairman should be an independent Director. The Board, as currently comprised, does not comply with these recommendations. Notwithstanding the ASX Recommendation that the majority of the Board should be independent Directors and the Chairman should be an independent Director, the Board considers that the independence of Directors is reflected by their capacity and intent to put the best interests of the Company and its shareholders ahead of all other interests, and that they are capable of exercising objective, independent judgment.
iSOFT believes the Board, as currently composed, has the necessary skill and motivation to ensure that the Company continues to perform strongly, notwithstanding that its overall composition does not meet the ASX Recommendations. Notwithstanding this, the Board is currently undertaking a review of its composition and will be taking into account the need for a majority of independent Directors in connection with the review.
The Board maintains strict protocols to ensure that any potential or actual conflicts of interest and duty are properly identified and managed, and to ensure Directors act in accordance with their fiduciary responsibilities. Each Director has also agreed with the Company to comply with the Company’s established policy on dealing in shares in iSOFT and the relevant disclosure requirements.

Corporate Governance Statement CONTiNuEd
14 iSOFT Group Limited Annual Report 2010
Diversity policyThe Company is currently establishing a diversity policy and will report against the new ASX recommendations in respect of the year commencing 1 July 2010. The policy will include requirements for the Board to establish measurable objectives for achieving gender diversity for the board and will require an annual assessment of both the objectives and progress in achieving the objectives.
Directors’ independent advice and access to Company informationWith the consent of the Chairman, Directors or committees of the Board may seek external professional advice, as considered necessary, at the Company’s expense. Each Director also has the right of access to all relevant Company information and to the Company’s executives.
Board CommitteesThe Board has established four committees of Directors to carry out certain tasks. These are the Audit and Compliance Committee, the Remuneration Committee and the Nominations Committee to carry out certain tasks. Each committee has a documented charter approved by the Board, copies of which can be found on the Company’s website, www.isofthealth.com. There is also the Strategic Options Committee.
The Board does not believe that additional committees are appropriate or necessary for iSOFT in its current form.
The Board does not have a formal risk management committee as the Board believes risk management is a significant responsibility of the entire Board and, in the first instance, risk management policies and procedures are specifically included in the charter of the Audit and Compliance Committee.
Audit and Compliance Committee The Audit and Compliance Committee consists, at the date of this report, of the following Directors: Mr Anthony Sherlock (Chairman) Mr Ian TsicalasMr Peter Wise Mr Lachlan MacGregor (Alternate Director) The primary objective of the Audit and Compliance Committee is to assist the Board of iSOFT in discharging the Board’s responsibilities as they relate to:
• financial reporting and audit practices;• accounting policies;• the management of compliance; • adequacy and effectiveness of internal controls; and• monitoring risk management practices.
The Committee’s role is to make appropriate recommendations and/or determine any matter delegated or referred to it by the Board, either specifically, or as contained within its Charter.
In addition, the Committee will:• oversee and appraise the quality of the audits conducted by both the
internal and external auditors;• provide, through regular meetings, a forum for communication
between the Board, senior management and both the internal and external auditors;
• review financial information prior to approval by the Board for presentation to shareholders and/or release to regulatory bodies;
• oversee and determine the adequacy of iSOFT’s operating and accounting controls;
• oversee and determine the adequacy of iSOFT’s compliance management strategies, policies, systems and procedures;
• review for consistency, wherever appropriate and practical, with the policies and procedures of iSOFT and facilitate the proper discharge of iSOFT’s financial reporting requirements and responsibilities; and
• assist in the preparation of the governance statements and policies for incorporation on the Company’s website, public documents and financial statements.
The Committee meets at least four times each year and reports to the Board following each meeting. The member attendance at meetings of the Committee during the year is set out on page 23 of the Director’s Report.
The Company’s external auditors PKF are invited to attend the meetings of the Audit and Compliance Committee as is the Chief Executive Officer, Finance Director and certain other finance executives. All Directors are permitted to attend meetings of the Audit and Compliance Committee if they so wish.
Financial reporting The Chief Executive Officer and the Finance Director provide the Board with written confirmation that the Company’s financial reports present a true and fair view, in all material respects, of the Company’s financial position and operational results and are prepared in accordance with relevant accounting standards. The Company adopted this reporting structure for the year ended 30 June 2010.
Remuneration Committee The Remuneration Committee consists, at the date of this report, of the following Directors:
Mr Robert Moran (Chairman)Mr Ian Tsicalas Mr Peter Wise
The role of the Committee as described in its charter is to review arrangements for and make recommendations to the Board on: • all human resources policies proposed or applying within the
Company; • the performance of the senior executives;

15iSOFT Group Limited Annual Report 2010
• the remuneration packages and policies applicable to the Chairman, non-executive Directors and senior executives and annual salary reviews throughout the Company;
• the incentive plans; • the retirement and termination entitlements of the Chairman, non-
executive Directors and senior executives; • human resource strategy and policy; • the Charter of the Committee; • the changes in best practice, legislation and market trends in respect
of employment and remuneration matters on which the Committee makes determinations or makes recommendations to the Board; and
• other topics as nominated by the Board from time to time.
In particular, the Committee has reviewed the remuneration and incentive structure to make the remuneration for management more performance based and to align management’s interests more closely with those of the Company’s shareholders through growth in shareholder returns. Further details regarding the structure of Directors’ and Executives’ remuneration are contained in the Directors’ Report. Non-Executive Directors are remunerated by way of fees and currently do not participate in schemes designed for the remuneration of executives other than options. They do not receive bonus payments.
The committee meets at least twice per annum and reports to the Board following each meeting. The member attendance at meetings of the committee during the year is set out on page 23 of the Director’s Report.
Nominations CommitteeThe Nominations Committee was recently established by the Board. All Directors are members of the Committee.
The Role and focus of the Committee is to assist in ensuring the Board is comprised of individuals who are best able to discharge the responsibilities of a Director, having regard to the highest standards of governance. It does so by critically reviewing:
• the corporate governance procedures of the Company;• the performance of the Board; and• the composition and effectiveness of the Board and, in the course
there of: - devise criteria for board membership; - review size and membership of the Company’s Board; - when necessary, propose candidates for consideration by the
Company’s Board; and - review Chief Executive Officer succession planning and advise the
Board of progress.
Strategic Options CommitteeThe Board has also established the Strategic Options Committee to analyse potential strategic options for the company, including capital raisings, cost saving tactics and other matters. All Directors are members of the Strategic Options Committee and this is chaired by Peter Wise who is an independent Director.
Risk assessment and management Management of risk is an essential element of the Company’s strategy. The identification and management of risk is central to achieving the objective of delivering long-term value to shareholders. Each year, the Board reviews and considers the risk profile for the whole business. This risk profile covers both operational and strategic risks. The Audit and Compliance Committee has the responsibility of ensuring that the policy framework and control mechanisms are in place to identify, assess and control material risks across iSOFT, including reporting to the Board on the risk management issues. The Company is responsible for implementing policies and procedures to manage those risks.
Management reports to the Audit and Compliance Committee on the Company’s key risks and the extent to which it believes these risks are being managed. This is performed on a six monthly basis, or more frequently, as required by the Board. A standardised approach to risk assessment is used across the Group to ensure risks are consistently assessed and reported to an appropriate level of management, and to the Board if required. Strategic and operational risks are reviewed at least annually by all operating divisions as part of the annual strategic planning, business planning, forecasting and budgeting process.
Detailed internal control questionnaires are completed by all major business units and key finance managers in relation to financial and other reporting on a six monthly basis. These are reviewed by our senior finance team and our external auditors as part of our half yearly reporting to the market and to achieve compliance with section 295A of the Corporations Act and Recommendation 7.3 of the ASX Corporate Governance Council’s Corporate Governance Principles and recommendations.
The Acting Chief Executive Officer and Group Finance Director provide the Board with written confirmation that:
• the statement given to the Board on the integrity of the Company’s financial statements is founded on a sound system of financial reporting, risk management and internal compliance and control which implements the policies adopted by the Board; and
• the Company’s risk management and internal compliance and control system is operating efficiently and effectively in all material respects.
The Company adopted this reporting structure for the year ended 30 June 2010.

Corporate Governance Statement CONTiNuEd
16 iSOFT Group Limited Annual Report 2010
Code of conduct As part of the Board’s commitment to the highest standard of conduct, the Company has established protocols to deal with various issues including: • conflicts of interest; • employment practices; • fair trading; • health and safety; • confidentiality;• whistleblowing; • relations with customers and suppliers.
In addition, ethical and responsible decision-making relies on a strong control environment to provide discipline and structure. The control environment of the Company focuses on having clear policies and procedures, a commitment to competence and development of employees, the responsible assignment of authority and accountability, and the general control awareness of senior management and employees.
Share trading policySince 2001, the Company has had a formal share trading policy in place applicable to Directors, both executive and non-executive, to senior managers and to trading by their family members and associates. The policy restricts Directors and senior managers from acting on price sensitive information which is not generally available to the market. In addition to this requirement, the Company prohibits Directors and senior managers from engaging in short-term trading.
The share trading policy excludes trading from the end of the applicable reporting period (i.e. 30 June or 31 December) until three days after the announcement of the full year and half year results. Exclusions are also implemented prior to the Annual General Meeting. Subject always to the share trading policy, Directors and senior managers may trade in the Company’s shares at other times.
Continuous disclosure and communication with shareholdersThe Company has a procedure in place to ensure that comprehensive and accurate market relevant information, and in particular price sensitive information, is released in a timely and controlled manner. The Company Secretary has been nominated as the person responsible for communications with the ASX. This role includes responsibility for ensuring compliance with the continuous disclosure requirements in the ASX listing rules and overseeing and coordinating information disclosure to the ASX, analysts, the media and the public.
If information is disclosable, an announcement is prepared and sent, via the Chairman’s office, electronically to the ASX. After receipt is confirmed, the announcement is posted on the Company’s website (www.isofthealth.com) and sent electronically to shareholders who have provided the Company with their email address. When analysts are briefed on aspects of the Company’s operations, the material used in the presentation is released to the ASX and posted to the Company’s website simultaneously.
The Company aims to keep shareholders informed of its performance and all major developments in an ongoing manner. Information is communicated through:
• the Annual Report which is distributed to all shareholders (unless specifically requested otherwise);
• the Half-Year Report;• other correspondence regarding matters impacting on shareholders
as required; and • the engagement partner of the Company’s external auditor PKF
who has been requested to attend the Company’s Annual General Meeting and is available to answer questions from shareholders about the external audit.

18
25
45
46
138
139
Directors’ Report
Remuneration Report
Auditor’s independence declaration
Financial Statements
Directors’ Declaration
Independent auditor’s report
This financial report covers the consolidated financial statements of the Consolidated Entity consisting of iSOFT Group Limited, its subsidiaries and interests in jointly controlled entities for the year ended 30 June 2010. The financial report is presented in Australian currency.
iSOFT Group Limited is an ASX listed public company (ASX code: ISF) limited by shares, incorporated and domiciled in Australia. Its registered office and principal place of business is:
Darling Park, Tower 2Level 27201 Sussex StreetSydney NSW 2000
A description of the nature of the Consolidated Entity’s operations and its principal activities is included in the review of operations and activities on pages 4 to 8 and is not part of this financial report.
The financial report was authorised for issue by the Directors on 30 September. The Directors have the power to amend and reissue the financial report.
Through the use of internet, we have ensured that our corporate reporting is timely and complete. All press releases, financial reports and other information are available at our Investor Relations centre on our website: www.isofthealth.com
17iSOFT Group Limited Annual Report 2010 Financial Report for the year ended 30 June 2010
Financial Report

The Directors present their report together with the financial report of the Consolidated Entity, comprising iSOFT Group Limited (“the Company” or “iSOFT”) and its controlled entities (together “the Consolidated Entity” or “the Group”) and jointly controlled entities for the year ended 30 June 2010 and the Auditor’s report thereon.
DirectorsThe Directors of the Company at any time during or since the end of the financial year are:Robert Moran Non-Executive Chairman (Chairmanship
appointment on 15 June 2010)Claire Jackson Independent DirectorAnthony Sherlock Independent Directorian Tsicalas Non-Executive Director Peter Wise Independent DirectorRonald Series Executive Director
(Appointed 24 September 2010)
Former DirectorsGary Cohen Executive Director (Resigned at 30 September
2010), Chief Executive Officer (to 30 August 2010), Chairman (to June 15, 2010)
Jim Fox Independent Director (Resigned at 15 June 2010)Steve Garrington Executive Director (Resigned at 15 June 2010)
Alternate DirectorLachlan MacGregor Non-Executive Alternate Director to Robert
Moran and Ian Tsicalas
Principal activitiesThe principal activity of the Consolidated Entity during the course of the current and prior periods was the development and licensing of computer software and the supply of services to the health industry. There were no significant changes in the nature of the Consolidated Entity’s principal activities during the financial year.
Operating and financial review The operating loss after tax for the year was -$382,914,000 (2009: $34,731,000 profit). Further information is contained in the Chairman’s Report, Acting Chief Executive Officer’s Report and Group Finance Director’s Report.
In June 2010, the Company commenced discussions with its senior lenders and their advisors in connection with the reorganisation of its senior debt facilities and equity capital raising strategies for the Company in light of the Company’s prospective financing requirements.
As a result of these discussions, the senior lenders have issued fully underwritten, credit approved and binding commitment documentation setting out the terms on which the senior lenders have agreed to extend the Company’s existing senior debt facilities and advance a new senior debt facility to the Company of up to GBP40 million. This provides stability in the financing of the Company and will facilitate the ongoing business operations of the Company. The
financial covenants under the senior debt facilities have been reset in accordance with the terms of the commitment documentation. Final documentation is expected to be completed before 20 October 2010.
After consideration of the agreement reached with the Company’s senior lenders and in light of all other relevant circumstances, including all of the conditions to the restructured facilities and the matters set out in the following paragraphs, the Directors have confidence in the availability of adequate financing for the Company for the Directors to be of the opinion that the Company will be able to continue to pay all of its debts as and when they fall due and accordingly that the financial report is correctly prepared on a going concern basis.
As part of the arrangements with the senior lenders, the Company is undertaking a cash management and cost mitigation exercise and is also investigating the initiatives described below.
The Company is undertaking a review of its capital structure with the assistance of financial and legal advisers, with the objective of reducing the overall level of indebtedness of the Company.
The Company is also in the process of completing a detailed review of its operations and business activities. In connection with this review, the Company is considering the disposal of certain assets and has, subsequent to the reporting date, commenced a sale process for one asset with a number of prospective purchasers. The timing and outcome of such disposal is still being determined.
DividendsDuring the reporting period, the Directors did not declare a dividend. A dividend of 1 cent per share was paid during the reporting period. The Directors have not declared a dividend for the year ended 30 June 2010.
Significant changes in the state of affairsCurrency fluctuations, difficult economic times, particularly in Continental Europe and the UK, delays in the NPfIT and increased costs had significant adverse effects on the Company’s financial performance.
The impacts of these factors manifested themselves in the second half of the fiscal year and resulted in the Company issuing downgrades to its earnings forecast. Further, the factors listed above have caused issues with the capital structure of the Company.
To address these issue the Company has implemented a three-pronged action plan. 1) Restructuring to reduce operating expenses; 2) Considering selling assets and closing outlying business units; 3) Strengthening our balance sheet.
Changes made to the management team and Board include Gary Cohen stepping down as Executive Chairman in June and as CEO on 31 August. Ronald Series has joined the Board as an Executive Director to oversee the operational restructure and transformation of the Company.
directors’ Report
18 iSOFT Group Limited Annual Report 2010Financial Report for the year ended 30 June 2010

19iSOFT Group Limited Annual Report 2010Financial Report for the year ended 30 June 2010
Events subsequent to reporting dateIssuance of equity
Since the reporting date, the Company issued 32,601,849 shares to YA
Global Master SPV Ltd under the Yorkville Agreement, raising $4,631,583.
Reorganisation of Senior Debt Facilities
Owing to the recent trading position of the Consolidated Entity, a
restructure of the Consolidated Entity’s senior debt facilities is required
as well as a review of its capital structure. On 29 September 2010, the
Consolidated Entity received a commitment letter from the senior lenders,
which is a fully underwritten, credit approved and binding commitment
documentation setting out the terms on which the senior lenders have
agreed to extend the Consolidated Entity’s existing senior debt facilities
and advance a new senior debt facility to the Consolidated Entity of up to
GBP40 million. Final documentation is expected to be completed before
20 October 2010. The Consolidated Entity’s ability to access the additional
funding will be subject to a number of conditions. In the Directors’ view,
these conditions are either procedural in nature, in which case they believe
the Consolidated Entity will be able to satisfy the conditions within the
required time frame, or they are otherwise capable of being complied with
by the Consolidated Entity. The Consolidated Entity anticipates that these
conditions will be satisfied by 20 October 2010.
Total facilities
Senior secured term loan A 23 June 2013 15 March 2012 52,500 92,332
Senior secured term loan B 15 March 2012 N/A 30,000 52,761
Senior secured revolver 23 June 2013 15 March 2012 30,000 52,761
Senior secured bridge revolver 31 December 2011 N/A 40,000 70,348
152,500 268,202
$’000GBP’000BFT
maturity 1Maximum
maturity
The new senior debt facilities will provide unrestricted access to the following lines of credit, with unchanged ranking of security:
Term loan A amortises at GBP3.75m per quarter with a bullet at maturity.
Amortisation is deferred until the Bridge facility is discharged or 31
December 2011 whichever is earlier. During that time the Term loan is
divided into two tranches: Tranche A being the original term facility and
attracts UK Libor plus a margin of 500bps plus 6% PIK. Tranche B is the
deferred amortisation payments which attracts UK Libor plus a margin
of 550bps + 6% PIK; the PIK increases from 1 January 2011 by 125bps
per quarter.
Term loan B and revolver attract UK Libor plus a margin of 450bps plus
5% PIK. There is bullet repayment at maturity. The bridge revolver attracts
UK Libor plus a margin of 550bps plus 14% PIK; the PIK increases from 1
January 2011 by 125bps per quarter. There is bullet repayment at maturity.
1. Certain conditions subsequent, if not met by 15 November 2010, would
shorten the maturity of certain tranches as a result of a bring forward
trigger (BFT).
The Board has appointed financial and legal advisers to undertake a
comprehensive review of the Company’s capital and debt structure and
talks are ongoing with prospective strategic and institutional investors.
In addition, the Consolidated Entity is considering potential asset disposals.
Any such asset sales would be structured so as not to damage the
Company’s core business assets. The Consolidated Entity has, subsequent
to the reporting date, commenced a sale process with a number of
prospective purchasers, although there is no assurance that any sale
transaction will occur.
The Consolidated Entity has commenced an in-depth review of the
Consolidated Entity’s business operations and a number of aspects of that
review are already in the process of implementation. With a focus on key
geographies with the best growth prospects, it has already targeted:
• operational cost savings to be achieved by end of June 2011, over half
of them through headcount reductions. These are targeted reductions
and are not expected to jeopardise the growth prospects of the
Consolidated Entity.
• accelerating the streamlining and harmonisation of its product portfolio,
which has already been reduced from more than 200 to 150 products.
• a reorientation of business development and R&D to achieve greater
flexibility and speed to market for new products.
No other matters or circumstances have arisen since 30 June 2010 that
have significantly affected, or may significantly affect, the Consolidated
Entity’s operations in future financial years, the results of those operations
in future financial years or the Consolidated Entity’s state of affairs in future
financial years.

directors’ Report CONTiNuEd
20 iSOFT Group Limited Annual Report 2010Financial Report for the year ended 30 June 2010
Likely developments and prospectsInformation on likely developments in the operations of the Consolidated Entity and the expected results of operations have not been included in this annual report because the Directors believe it would be likely to result in unreasonable prejudice to the Consolidated Entity.
Environmental regulationThe Consolidated Entity is not subject to any significant environmental regulations under the laws of the Commonwealth, States or other territories.

21iSOFT Group Limited Annual Report 2010Financial Report for the year ended 30 June 2010
Information on DirectorsRobert Bernard Moran LLB, B.Ec, MAICD Non-Executive ChairmanRobert Moran was appointed Non-Executive Chairman in June 2010 having been a Director of iSOFT since November 2008 and having acted as an Alternate Director since May 2008. Currently the Managing Director of Oceania Capital Partners Limited, he has been involved as a principal investor for over ten years and has been involved at a Board and strategic level in a variety of businesses and sectors, taking an active involvement in the underlying businesses. Robert has a long involvement in the heath IT sector, having been involved with IBA Health before its initial IPO. He is experienced in investment banking activities, including financings, capital raisings and mergers and acquisitions and has practiced corporate and commercial law at a senior level and was previously responsible for the private equity business within the Allco Group. Robert is also a Director of Trans Tasman Collections Holdings Pty Limited, Krispy Kreme Group and Chairman of Signature Security Group. Other current public company directorships: Oceania Capital Partners Limited, AWA Limited, Tag Pacific Limited.Former public company directorships (in last three years): None.Special responsibilities: Chairman of the Remuneration Committee, Member of Nomination CommitteeInterests in shares: 580,937 ordinary shares.
Prof. Claire Jackson MD MBBS (Uni of QLD) MPH (UQ) CertHEcon (Monash) GradCert Management (QUT) FRACGP GAICD RACGPNon-Executive DirectorProfessor Claire Jackson was appointed a Director of iSOFT in November 2004. She is a Professor of General Practice at the University of Queensland and has been a member of the Royal Australian College of General Practitioners (RACGP) Federal Council and served as Chair of the RACGP in 2002 and 2003 during a period of significant restructure. She was a member of Healthconnect Steering Committee in Brisbane South and has a long history of healthcare reform policy involvement at both state and national levels. A practicing GP with over 20 years experience in the delivery of primary care, general practice and primary health education, Claire was appointed to the National Primary Care Strategy Reference Group in June 2008.Other current public company directorships: None.Former public company directorships (in last three years): None. Special responsibilities: Member of Nomination Committee.Interests in shares: 39,620 ordinary shares.
Anthony Gardiner Sherlock B.Ec FCANon-Executive DirectorAnthony Sherlock was appointed a Director of iSOFT in February 2000. A former senior partner of Coopers & Lybrand (now PricewaterhouseCoopers) with over 25 years experience in providing strategic and risk management advice to companies in a variety of industries, he has been appointed by both the Federal and NSW State Governments to a number of industry committees.Other current public company directorships: Director of Stockland Capital Partners Limited, Director of Export Finance Insurance Corporation Limited.Former public company directorships (in last three years): Director of Sydney Attractions Group Ltd (formerly Sydney Aquarium Ltd) (1997 – 2008).Special responsibilities: Chairman of the Audit and Compliance Committee, Member of Nomination Committee.Interests in shares: 60,000 ordinary shares.
Ian Tsicalas BA, B.Com Non-Executive Director Appointed a Director in May 2008, Ian has significant operational and management experience with both public and private companies. Ian is the former Managing Director of Australian Discount Retail. Prior to this he was Chief Executive of the Warehouse Group Limited and a Managing Director at Commander Communications Limited and Howard Smith Limited.Other current public company directorships: Independent Chairman of Oceania Capital Partners Limited, Independent Director of STW Communications Group Limited.Former public company directorships (in last three years): Independent Chairman of Allco Managed Investment Funds Limited.Special responsibilities: Member of the Remuneration Committee, Member of Audit and Compliance Committee, Member of Nomination Committee.Interests in shares: None.

Directors’ Report cOnTinueD
22 iSOFT Group Limited Annual Report 2010Financial Report for the year ended 30 June 2010
Peter Wise DipID Non-Executive DirectorPeter Wise was appointed a Director of iSOFT in September 1999. He serves as a member of the Remuneration and the Audit and Compliance Committees and is chairman of the Nomination Committee. He has over 35 years experience in both executive and non-executive capacities for public and private companies and is currently the Chairman of Tag Pacific Limited.Other current public company directorships: Chairman of Tag Pacific Limited.Former public company directorships (in last three years): None.Special responsibilities: Chairman of Nomination Committee, Chairman of Strategic Options Committee, Member of the Audit and Compliance Committee, Member of the Remuneration Committee.Interests in shares: 11,266,913 ordinary shares.
Ronald Charles Series B.Com, CA, MBA, H. Dip Tax Law Executive DirectorRonald Series was appointed Executive Director in September 2010. Over the past 20 years, Ronald has been on the Board of several international companies with operations in transport, logistics, shipping real estate and information technology, including UK-listed companies such as Davies and Newman plc and Lep Group plc, and a number of Private Equity backed businesses. He has operated in North America, Europe, the Far East, Australasia and Africa. In most recent instances this has involved businesses going through a period of change and restructuring. Most recently, he has been instrumental in the successful restructuring of Nakheel PJSC, the real estate arm of Dubai World. Ronald has a strong financial and corporate management background. His specific area of expertise is in optimising the management and financial structure of companies and developing the most effective strategies to create value for all stakeholders in a company. He brings proven capabilities in engaging with customers, management, suppliers, banks and other financial stakeholders to develop the right management, plans, strategies and action agendas to drive the business forward and achieve its goals.Other current public company directorships: None.Former public company directorships (in last three years): None.Special responsibilities: Member of Nominations Committee.Interests in shares: None.
Alternate DirectorLachlan MacGregor BCom Alternate Director to Robert Moran and Ian TsicalasLachlan MacGregor was appointed as Alternate Director of iSOFT on 9 January 2009. He is a Director in the investment management team for Oceania Capital Partners Limited (OCP) having joined in 2006. Mr MacGregor has extensive experience in the investment banking and private equity industries having spent eight years at UBS Investment Bank prior to joining OCP. At UBS he was a Director focused on advising the private equity industry on mergers and acquisitions, equity capital markets and leveraged finance. Mr MacGregor is also a Director of leading Australian and New Zealand debt recovery firm, Baycorp (Trans Tasman Collections Holdings Pty Limited).Other current public company directorships: None.Former public company directorships (in last three years): None.Special responsibilities: Member of the Audit and Compliance Committee.Interests in shares: None.
General Counsel and Company Secretary Howard T. Edelman BA JDHoward Edelman joined iSOFT in November 2006. He has extensive experience in finance, mergers and acquisitions and general corporate law. Prior to joining iSOFT, Mr Edelman was a senior lawyer at Allens Arthur Robinson in their Corporate & Commercial Department after having worked in the Regulatory Policy Branch of ASIC. In addition to being an Australian qualified solicitor, Mr Edelman is US qualified and was a partner at Pillsbury Winthrop in Sydney after having spent seven years with Skadden Arps in Sydney, New York and Hong Kong.

23iSOFT Group Limited Annual Report 2010Financial Report for the year ended 30 June 2010
Meetings of DirectorsThe following table sets out the number of Directors’ meetings (including meetings of Board committees) held during the year and the number of meetings attended by each Director:
Notes:
(A) = Number of meetings eligible to attend.
(B) = Number of meetings attended.
1. Ronald Series joined as a Director on 24 September 2010
2. Stephen Garrington resigned as a Director on 15 June 2010.
3. James Fox resigned as a Director on 15 June 2010.
4. Gary Cohen resigned as a Director on 30 September 2010.
Current Directors
Robert Moran
Claire Jackson
Anthony Sherlock
Peter Wise
Ian Tsicalas
Ronald Series 1
Former Director
Stephen Garrington 2
James Fox 3
Gary Cohen 4
Alternate Director
Lachlan MacGregor
Full Board
Remuneration Committee
Nomination Committee
Audit and Compliance Committee
19
19
19
19
19
-
17
17
19
-
19
16
18
19
19
-
17
15
19
-
-
-
8
8
8
-
-
-
-
8
-
-
8
7
8
-
-
-
-
7
5
-
-
5
5
-
-
4
-
-
5
-
-
5
5
-
-
4
-
-
1
1
1
1
1
-
1
1
1
-
1
0
1
1
1
-
1
1
1
-
A B A B A B A B

directors’ Report CONTiNuEd
24 iSOFT Group Limited Annual Report 2010
• All non-audit services have been reviewed and approved to ensure that they do not impact the integrity and objectivity of the auditor, and
• None of the services undermine the general principles relating to auditor independence as set out in the Code of Conduct APES 110 Code of Ethics of Professional Accountants issued by the Accounting Professional and Ethical Standards Board, including reviewing or auditing the auditor’s own work, acting in management or decision-making capacity for the Company, acting as advocate for the Company or jointly sharing economic risks and rewards.
Lead auditor’s independence declaration under Section 307C of the Corporations Act 2001The lead auditor’s independence declaration is set out on page 45 and forms part of the Directors’ Report for the year ended 30 June 2010.
Rounding-offThe Company is of a kind referred to in ASIC Class Order 98/100 dated 10 July 1998 and in accordance with that Class Order, all financial information presented in Australian Dollars in the financial report and Directors’ Report have been rounded to the nearest thousand dollars, unless otherwise stated.
This report is made in accordance with a resolution of the Directors.
Robert Moran Anthony SherlockNon-Executive Chairman Non-Executive Director
Dated at Sydney, 30 September 2010
Insurance of officersThe constitution of the Company provides an indemnity (to the maximum extent permitted by law) in favour of current and past Directors, Company Secretaries, and all other past and present Executive Officers when acting in these capacities in respect of: (a) all liabilities to another person (other than the Company or related
entities) if the relevant officers have acted in good faith; and(b) the costs and expenses of successfully defending legal proceedings.
Under Deeds of Access and indemnity, the Company has agreed to indemnify each current Director and each Company Secretary for all liabilities, including legal costs, that may arise as a result of the Director or Company Secretary acting in that capacity to the full extent permitted by law. The indemnities are subject to certain exceptions, including if the person did not act in good faith.
During the financial year, the Company paid a premium in respect of a contract to insure the Directors of the Company in line with the constitution. The contract of insurance prohibits disclosure of the nature of liability and the amount of the premium.
Remuneration Report The Remuneration Report is set out on pages 25 to 44 and forms part of the Directors’ Report for the year ended 30 June 2010.
Non-audit servicesDetails of amounts paid or payable to the auditors for non-audit services provided during the financial year by the auditors are outlined in Note 29 in the financial report.
The Directors are of the opinion that the provision of non-audit services as disclosed in Note 29 in the financial report does not compromise the external auditor’s independence as outlined in the Corporations Act 2001 for the following reasons:
Shares under optionUnissued ordinary shares of iSOFT Group Limited under option at the date of this report are as follows:
31 July 2006
20 February 2007
20 February 2007
24 September 2008
18 November 2009
6 April 2010
26 July 2011
9 November 2010
9 November 2011
4 September 2013
18 November 2014
6 April 2015
$0.85
$1.00
$1.00
$0.6911
$0.7874
$0.578
5,000,000
300,000
300,000
11,900,000
7,000,000
2,000,000
Grant date Issue price of sharesExpiry date Number under option

Whilst FY2010 has been a difficult year for iSOFT, the Remuneration practices in place throughout 2010 have focused on attracting and engaging talented executives in order to sustain operational performance and continue to support shareholder interests.
We remain committed to turning the business and financial results around and the following are some of the measures we are taking at the Executive level: • We have implemented a freeze on Key Management Personnel
(KMP) salaries for FY2011;• Performance Hurdles for shares and options were changed during
FY2010 to reflect market best practice for our shareholders and this year, we will continue to evaluate and where necessary modify these to ensure we offer plans which engage our executives and drive shareholder returns;
• With the full support of the Board members, our Board of Director Fees have been reduced by 10% for FY2011;
• Fees for the Chairman of the Board have been waived to assist the cost reduction planned for FY2011;
• No STI payment will be made to KMPs and other executives in relation to FY2010 results (with the exception of Central Europe, where we have a contractual requirement); and
• To secure continued focus of our current leadership team, we have implemented an executive retention scheme (following Gary Cohen stepping down as Executive Chairman and CEO), which aims to retain and focus our executives through our restructure. The arrangement offers a retention bonus to selected executives to be paid after September 2011.
With the business undergoing significant restructure and change in the next year, we will continue to review and focus our short term and long term remuneration structures and practices to drive; profitable revenue, cost management and iSOFT’s strategy for long-term success. In addition, we will expand the global skill set of our executive team to further enable them to engage iSOFT management and employees as we execute the business strategy during this critical time.
Robert MoranChairman of the Remuneration Committee
This report offers a transparent view of the remuneration arrangements in place for Directors and executives of the iSOFT Consolidated Entity, as detailed in the following sections.
Section 1: Key Management Personnel and other Executives
Section 2: Remuneration GovernanceSection 3: Executive Remuneration PhilosophySection 4: Executive Remuneration ApproachSection 5: Relationship with Company PerformanceSection 6: Executive Remuneration Details and
other DisclosuresSection 7: Non-executive Director Remuneration
FrameworkSection 8: Relevant interest in ordinary shares of the
Directors and Other Executives
Remuneration Report (audited)
25iSOFT Group Limited Annual Report 2010 Financial Report for the year ended 30 June 2010

Remuneration Report (audited) cOnTinued
26 iSOFT Group Limited Annual Report 2010 Financial Report for the year ended 30 June 2010
Non-Executive Directors
Executive Director
Alternate Non-Executive Director
Non-Executive Directors
Group Executives
Other Executives 3
Robert Moran chairman – Appointed 15 June 2010 (previously director)
claire Jackson independent
Anthony Sherlock independent
ian Tsicalas
Peter Wise independent
Gary cohen 2 chief executive Officer ceased as executive chairman 15 June 2010 ceased as a director 30 September 2010
Ronald Series Appointed 24 September 2010
Lachlan MacGregor Alternate to Robert Moran & ian Tsicalas
James Fox independent. Appointed 6 July 2009. Appointed deputy chairman 28 May 2010 and ceased as a director 15 June 2010
Andrea Fiumicelli 2 chief Operating Officer
Brian cohen chief Technology Officer
Martin deda Group Finance director
Stephen Garrington director, Business development ceased as executive director 15 June 2010
Mike Jackman executive Vice President, Operations Appointed 22 February 2010
Peter Herrmann Managing director – central europe
Wim Botermans Managing director – Asia Region
SECTION 1: Key Management Personnel 1 (KMP) and other Executives
The following executive ceased to be a member of Key Management Personnel during the financial year ended 30 June 2010:
1. Key Management Personnel (KMP) of the Consolidated entity are defined as those persons having authority and management responsibility for planning, directing, and controlling the major activities of the Company and the Consolidated Entity, directly or indirectly, including any Director (whether executive or otherwise) of the Company.
2. From 31 August 2010, Gary Cohen stepped down as Chief Executive Officer, and Andrea Fiumicelli has assumed responsibility as acting Chief Executive Officer.
3. Denotes two of the five highest paid executives of the Consolidated Entity as required to be disclosed under the Corporations Act 2001.

SECTION 2: Remuneration Governance
The Board has delegated oversight of the Consolidated Entity’s remuneration policies and practices to the Remuneration Committee. The responsibilities and membership of the Remuneration Committee are set out in the Corporate Governance Statement. The operational role and responsibility of the Remuneration Committee is established in the Committee’s Charter which was revised in the financial year to ensure that it was “fit for purpose”.
The Remuneration Committee reviews executive remuneration and other terms of employment in relation to: • the performance of the of the Consolidated Entity and individual
performance;• independent expert advice on market terms, conditions and
compensation levels and relevant external comparative information for the regions – using independent external advisors; and
• industries and professions in which the Consolidated Entity operates and competes.
As part of its ongoing responsibility for reviewing the remuneration framework, this financial year the Remuneration Committee has overseen the:• review of performance hurdles and allocation of awards under the
Consolidated Entity’s Long-Term Incentive Schemes (LTI’s) for the 2010 financial year;
• independent review of the Consolidated Entity’s remuneration framework, to determine the most effective structure to retain and incentivise employees to build value in a manner that is in the best interest of shareholders.
SECTION 3: Executive Remuneration Philosophy
The objectives of the Consolidated Entity’s executive remuneration philosophy are to:1. Promote alignment of executive interests with shareholder
interests; 2. Attract, motivate and retain the talent required to lead the
Consolidated Entity’s operations and execute the strategy;3. Focus executives on the outcomes and behaviours required to
deliver business results;4. Pay for performance and contribution to value building; and 5. Create a sense of ownership in iSOFT with a focus on building
Long-Term value.
The principles guiding the remuneration framework to deliver these objectives are:1. Total Remuneration (TR) including both fixed and “at risk”, is
market competitive;2. Remuneration is differentiated based on performance;3. Proportion of remuneration “at risk” increases with the level of
impact on strategic direction and business results; and 4. Remuneration policies are flexible, simple, relevant and
transparent.
Performance Linked “At Risk” RemunerationFundamental to the Consolidated Entity’s remuneration philosophy is the principle that a significant amount of an executive’s remuneration is at risk and focused on building a sustainable organization over the long-term.
The Remuneration Committee believes that in order to deliver the principle of aligning executive interests with the interests of shareholders and investors, it is essential that a significant proportion of the executive team’s remuneration continues to be dependent upon the Consolidated Entity’s overall performance as well as the individual’s relative performance and contribution to these outcomes.
The combination of a Short Term Incentive and a Long Term Incentive (LTI) is designed to achieve three objectives:-• Reward executives for meeting or exceeding their financial and
non-financial objectives;• Retain executives within the business to provide for consistent
organisation performance; and• encourage behaviours that will enable shareholder wealth creation.
The objectives and guiding principles for executive remuneration have been reviewed and considered appropriate by external remuneration consultants during 2009 financial year, this was implemented and monitored in 2010. We will do a further review in 2011. The close alignment of the interests of the executive team and other employees with the interests of our shareholders continues to underpin the executive remuneration strategy. To this end, the composition of our executive remuneration has evolved with the implementation of the Consolidated Entity’s LTI option scheme in 2009 to drive a greater emphasis for long-term outcomes.
27iSOFT Group Limited Annual Report 2010 Financial Report for the year ended 30 June 2010

Remuneration Report (audited) cOnTinued
28 iSOFT Group Limited Annual Report 2010 Financial Report for the year ended 30 June 2010
SECTION 4: Executive Remuneration Approach
PurposeThe Consolidated Entity aims to reward executives with a level and mix of remuneration commensurate with their position and responsibilities within the Consolidated Entity so as to:• Reward executives for the achievement of the budgeted targets required at three levels: – Consolidated Entity; – Business unit; and – Individual performance • Align the interests of executives with those of shareholders; and • Ensure Total Remuneration is competitive by market standards.
StructureThe Consolidated Entity’s remuneration policies are achieved through a combination of three core elements which when combined form Total Remuneration.
Total Fixed Remuneration (TFR)TFR consists of base remuneration, calculated on a total cost to company including non-monetary employee benefits and the cost of employer contributions to superannuation, pension or national social security funds. The amount of TFR takes into consideration:• An executive’s role;• Career experience, skills acquired and qualifications; • Business and individual performance; and• Industry conditions and market practice for roles of similar scope both internally and externally.
Short-Term Incentives (STI)The aim of the STI plan is to link the achievement of the Consolidated Entity’s financial and operational performance with the remuneration of the executives responsible for those targets. The total potential STI available is set at a level which provides sufficient incentive to the executive to achieve the operational objectives, and which is affordable for the Consolidated Entity in the circumstances.
Total Fixed Remuneration (TFR) Variable Remuneration:Short Term Incentives (STI)
Variable Remuneration:Long Term Incentives (LTI)
Base salary, pension, superannuation and non-monetary benefits
To reflect capabilities and expertise
Share/ option equity based plans
Aligns reward with key medium and long-term performance outcomes; and provides for ad hoc attraction and retention through share/option grants for business critical executives
AT RiSK And PeRFORMAnce ReLATed
cash, deferred equity plans
Rewards achievement and balances organisation/ individual performance

29iSOFT Group Limited Annual Report 2010 Financial Report for the year ended 30 June 2010
StructureActual STI payments granted to each executive depend upon the extent to which specific targets set at the beginning of the financial year are met. The targets consist of a number of Key Performance Indicators (KPIs) covering financial and non-financial, Consolidated Entity, Regional Business Unit and individual measures of performance. Typically included are measures such as:• Consolidated Entity/Regional Business Unit EBITDA; • Consolidated Entity/Regional Business Unit Cash Collection;• Team Objectives; and• Individual Objectives.
These measures were chosen as they represent the key drivers of the short-term success of the Consolidated Entity and provide a framework for delivering Long-Term value.
The Consolidated Entity has predetermined financial gateways that must be met in order to trigger payments under the STI scheme. On an annual basis, after consideration of performance against KPIs, the Remuneration Committee, in line with their responsibilities, approves the amount, if any, of the STI to be paid to each executive. The process usually occurs within 3 months after the reporting date, once the Consolidated Entity releases its financial results and performance is assessed.
Long-Term Incentive (LTI)The objective of the LTI plans is to reward executives in a manner that aligns remuneration with the creation of shareholder wealth and the long-term interest of Group executives with those of the shareholders. LTI issued is of sufficient value to facilitate the retention of the talent required to achieve the long term growth of the organisation.
StructureLTI grants to executives are delivered in the form of shares, options or performance rights under the following LTI Plans:
In financial year 2010 Relative Total Shareholder Return was introduced as a performance hurdle (replacing SPG) as it is widely recognised as one of the most appropriate indicators of shareholder value creation. The Consolidated Entity has continued the use of combined performance hurdles weighted equally, to focus executives on the long term performance of the organisation.
In relation to the new TSR hurdle a comparator group of 15 ASX listed companies was adopted and the vesting of shares is based on iSOFT’s performance compared to that comparator group.
Given the significant drop in the company share price during FY2010, the remuneration committee will review the executive holdings and performance measures of the plan and make changes if deemed necessary to ensure the continued focus by our Executives.
A detailed explanation of each of the above plans, and performance hurdle requirements can be found in this report.
Plan Description Performance Hurdles for the three plans listed
Employee Loan Plan (ELP 3 Year Shares)
Employee Incentive Plan (EIP)
Employee Incentive Performance Rights (EIPR)
For grants issued after 1 July 2009
1. 50% earnings Per Share (ePS); and2. 50% Relative Total Shareholder Return
(TSR)
For grants issued prior to 1 July 2009
1. 50% earnings Per Share (ePS); and2. 50% Share Price Growth (SPG)
Shares with vesting over a period of three years subject to meeting performance hurdles, with no opportunity to retest
Options with vesting over a period of three years subject to meeting performance hurdles, with no opportunity to retest. executives are able to exercise options for up to two years after vesting before the options lapse
Options vesting over a period of three years subject to meeting performance hurdles, with no opportunity to retest

Remuneration Report (audited) cOnTinued
30 iSOFT Group Limited Annual Report 2010 Financial Report for the year ended 30 June 2010
Participants in the ELP, EIP or EIPR must not enter into transactions or arrangements, including by way of derivatives or similar financial products, which limit the economic risk of holding unvested awards.
All ELP shares, EIP options and EIPR rights grants are subject to Remuneration Committee approval.
Structure and details of Long-Term Incentive plans
ELP 3 Year Share Options
Nature
Grant frequency
Eligibility criteria
Exercise price
Performance hurdles(Grants prior to 1 July 2009)
Performance hurdles(Grants after 1 July 2009)
Vesting period
Exercise period and expiry
Right to Dividends (Prior to 1 July 2009)
Right to Dividends (Post 1 July 2009)
Comparator Group
each eLP share entitles the participant to one share in the company upon vesting, subject to payment of the limited recourse note.
Annual grant and ad-hoc on commencement of employment and employee promotion.
Selected executives, in line with past contribution and future potential.
5-day VWAP preceding grant date.
Earnings Per Share (EPS) - 50% of eLP Share grantBased on the average annual compound ePS growth over a three year measurement period against a comparator group (15 comparable ASX 200 organisations):
• Below Median (50th percentile) of comparator group – 0% of shares vest;• Median of comparator group – 25% of share options vest• 62.5nd percentile of comparator group – 50% of share options vest;• 75th percentile of comparator group – 75% of share options vest;• 80th percentile of comparator group – 100% of share options vest; and• Share option vesting levels are interpolated between each percentile above.
Share Price Growth (SPG) - 50% of eLP Share grantBased on relative SPG performance over a three year measurement period against a comparator group (15 comparable ASX 200 organisations):
• Below Median (50th percentile) of comparator group – 0% of share options vest;• Median of comparator group – 25% of share options vest• 62.5nd percentile of comparator group – 50% of share options vest;• 75th percentile of comparator group – 75% of share options vest;• 80th percentile of comparator group – 100% of share options vest; and• Share option vesting levels are interpolated between each percentile above.
Earnings Per Share (EPS) - 50% of eLP Share grant
Based on achieving 15% or more ePS compound growth over a 3 year period.• Less than 15% ePS compound growth – 0% of shares vest; and• 15% or greater ePS compound growth – 100% of shares vest
Relative Total Shareholder Return (TSR) - 50% of eLP Share grantBased on relative TSR performance over a three year measurement period against a comparator group (15 comparable ASX 200 organisation):• Below Median (50th percentile) of comparator group - 0% of shares vest; • Median of comparator group - 25% of shares vest• 62.5nd percentile of comparator group - 50% of shares vest;• 75th percentile of comparator group - 75% of shares vest;• 80th percentile of comparator group - 100% of shares vest; and• Share option vesting levels are interpolated between each percentile above.
Three years from grant date. no retesting.
exercisable upon vesting with no lapse restriction.
Right to dividends.
Right to dividends are split 40% cash to employees and 60% applied to eLP loan.
Please see comparator Group Listing in this section

EIP Options
Nature
Grant frequency
Eligibility Criteria
Exercise price
Performance hurdles(Grants prior to 1 July 2009)
Performance hurdles(Grants after 1 July 2009)
Vesting Period
Exercise period and expiry
Right to Dividends
Comparator Group
each eiP Option entitles the participant to one share in the company upon vesting, subject to payment of an exercise price.
Annual grant and ad-hoc on commencement of employment and employee promotion.
Selected executives, in line with past contribution and future potential.
5-day VWAP preceding grant date.
Earnings Per Share (EPS) - 50% of eiP Option grant
Based on the average annual compound ePS growth over a three year measurement period against a comparator group (15 comparable ASX 200 organisations):• Below Median (50th percentile) of comparator group – 0% of shares vest;• Median of comparator group – 25% of share options vest• 62.5nd percentile of comparator group – 50% of share options vest;• 75th percentile of comparator group – 75% of share options vest;• 80th percentile of comparator group – 100% of share options vest; and• Share option vesting levels are interpolated between each percentile above.
Share Price Growth (SPG) - 50% of eiP Option grant
Based on relative SPG performance over a three year measurement period against a comparator group (15 comparable ASX 200 organisations):• Below Median (50th percentile) of comparator group – 0% of share options vest;• Median of comparator group – 25% of share options vest• 62.5nd percentile of comparator group – 50% of share options vest;• 75th percentile of comparator group – 75% of share options vest;• 80th percentile of comparator group – 100% of share options vest; and• Share option vesting levels are interpolated between each percentile above.
Earnings Per Share (EPS) - 50% of eiP option grant Based on achieving 15% or more ePS compound growth over 3 year period.• Less than 15% ePS compound growth – 0% of options vest; and• 15% or greater ePS compound growth – 100% of options vest.
Relative Total Shareholder Return (TSR) - 50% of eiP Option grant
Based on TSR performance over a three year measurement period against a comparator group (15 comparable ASX 200 organisation):• Below Median (50th percentile) of comparator group - 0% of options vest; • Median of comparator group - 25% of options vest• 62.5nd percentile of comparator group - 50% of options vest;• 75th percentile of comparator group - 75% of options vest;• 80th percentile of comparator group - 100% of options vest; and• Share option vesting levels are interpolated between each percentile above.
Three years from grant date. no retesting.
exercisable upon vesting with lapse 5 years after grant date.
no dividend rights until option exercised.
Please see comparator Group Listing in this section.
31iSOFT Group Limited Annual Report 2010 Financial Report for the year ended 30 June 2010

Remuneration Report (audited) cOnTinued
32 iSOFT Group Limited Annual Report 2010 Financial Report for the year ended 30 June 2010
EIP – Performance Rights
Nature
Grant frequency
Eligibility Criteria
Exercise price
Performance hurdles
Vesting Period
Exercise period and expiry
Right to Dividends
Comparator Group
ELP 15 Month Share Options
Nature
Grant frequency
Eligibility Criteria
Exercise price
Performance hurdles
Vesting Period
Exercise period and expiry
Right to Dividends
each eiP performance right entitles the participant to one share in the company upon vesting, or equivalent cash award.
Annual grant and ad-hoc on commencement of employment and employee promotion.
Selected executives, broadly in line with past contribution and future potential.
$0.00
Earnings Per Share (EPS) - 50% of eiP performance rights grant Based on achieving 15% or more ePS compound growth over 3 year period.• Less than 15% ePS compound growth – 0% of rights vest; and• 15% or greater ePS compound growth – 100% 0% of rights vest.
Relative Total Shareholder Return (TSR) - 50% of eiP performance rights grant
Based on TSR performance over a three year measurement period against a comparator group (15 comparable ASX 200 organisation):
• Below Median (50th percentile) of comparator group - 0% of performance rights vest; • Median of comparator group - 25% of performance rights vest• 62.5nd percentile of comparator group - 50% of performance rights vest;• 75th percentile of comparator group - 75% of performance rights vest;• 80th percentile of comparator group - 100% of performance rights vest; and• Performance right vesting levels are interpolated between each percentile above.
Three years from grant date. no retesting.
exercised upon vesting in the form of a share or equivalent cash award.
no right to dividends until shares received.
Please see comparator Group Listing in this note.
each eLP share entitles the participant to one share in the company upon vesting, subject to payment of the limited recourse note.
Quarterly/Annual grant based upon contractual obligations and performance of employees. This is not currently being offered.
Selected executives, broadly in line with performance and future potential.
5-day VWAP preceding grant date.
Time based vesting.
Fifteen months from grant date.
exercisable upon vesting with no lapse restriction.
Right to dividends.

33iSOFT Group Limited Annual Report 2010 Financial Report for the year ended 30 June 2010
ASX Company Name
Relationship with Company Performance
ASX Company Name
ASX Company Name ASX Company Name
1 ALS Alesco corporation Limited
2 eHL emeco Holdings Limited
3 HSP Healthscope Limited
4 HST Hastie Group Limited
5 idL industrea Limited
6 iRe iReSS Market Technology Limited
7 MYO MYOB Limited
8 OKn Oakton Limited
9 PXS Pharmaxis Ltd
10 SGT Singapore Telecommunications Limited
11 SKe Skilled Group Limited
12 SLM Salmat Limited
13 SLX Silex Systems Limited
14 SPT Spotless Group Limited
15 WTF Wotif.com Holdings Limited
Year-on-year performance
2010 2009 2008 2007 2006 2005
Revenue ($millions) 434.9 540.1 360.9 74.8 59.2 42.4
net Profit After Tax (nPAT) attributable to ordinary equity holders ($millions) (381.8) 35.1 14.4 22.9 14.5 14.5
earnings Per Share (cents) (37.93) 4.30 2.08 6.76 5.5 3.6
dividends Per Share (cents) - 1.0 - 1.0 1.0 0.5
Share Price Growth (%) (73.6) 18.8 (47.8) 57.8 50.1 n/a
Share price as at 30 June ($) 0.17 0.645 0.543 1.04 0.659 0.439
1 FWd Fleetwood corporation Limited
2 GWT GWA international Limited
3 iFL iOOF Holdings Limited
4 TAL Tower Australia Group Limited
1 AHd Amalgamated Holdings Limited
2 Ann Ansell Limited
3 cdu cudeco Limited
4 cXP corporate express Australia Limited
5 eHL emeco Holdings Limited
6 FPH Fisher & Paykel Healthcare corporation Limited
7 HSP Healthscope Limited
8 iRe iReSS Market Technology Limited
9 PXS Pharmaxis Ltd
10 SAi SAi Global Limited
11 SiP Sigma Pharmaceuticals Limited
12 SLM Salmat Limited
13 SOT SP Telemedia Limited
14 SPT Spotless Group Limited
15 WTF Wotif.com Holdings Limited
1 cRG crane Group Limited
2 FWd Fleetwood corporation Limited
3 GWT GWA international Limited
4 iFL iOOF Holdings Limited
5 TAL Tower Australia Group Limited
Note: For future issues, the Board reserves the right to review the composition of the comparator group and hurdles to ensure it is appropriate as a relative measure of performance of the Company.
SECTION 5: Relationship with Company Performance
Comparator Group for grants prior to 1 July 2009
Reserve list Reserve list
Comparator Group for grants from to 1 July 2009

Remuneration Report (audited) cOnTinued
34 iSOFT Group Limited Annual Report 2010 Financial Report for the year ended 30 June 2010
1. Annualised Base Remuneration in respect of the 12 months ending 30 June 2010 and is inclusive of statutory superannuation for Australian based employees.
2. All Australian Dollar equivalent amounts. 3. Non-monetary benefits may include car parking/allowance, health/life/salary
continuance insurance and pension scheme contributions.
4. Expatriate benefits are included in non-monetary benefits and are provided to executives as a result of secondment/ fixed term assignment. The expatriate benefit may include housing, health insurance, tax equalisation and other standard expatriate benefits, if appropriate.
5. From 1 July 2010, Brian Cohen’s package has been localised to Singapore. His secondment arrangement to India has been terminated.
6. Gary Cohen stepped down as Chief Executive Officer effective 31 August 2010.
NamePosition(Residence)
Gary Cohen 6
Chief Executive Officer(Australia)
Stephen GarringtonDirector, Business Development (Australia)
Andrea FiumicelliChief Operating Officer(Italy / United Kingdom)
Brian CohenChief Technology Officer(Singapore)
Martin DedaGroup Finance Director(Australia)
Mike JackmanExecutive Vice President, Operations(United States of America)
Peter HerrmannManaging Director, Central Europe (Germany)
Wim BotermansManaging Director, Asia Region (Malaysia)
Term of Agreement
Open ended Commencing 1-Jul-09
Open ended Commencing 12-Jul-04
Open endedCommencing 7-Apr-08
Open endedCommencing 15-Feb-00
Open endedCommencing 14-Jul-08
Open ended Commencing 22-Feb-10
3 year contract from 1 May 2006 with the option for the company to extend a further 2 years. Contract extended to 1 May 2011
Open endedCommencing15-Aug-00
Annualised Base Remuneration 1 (effective from1 July 2009) 2
$659,944
$460,368
$317,395
$456,125
$564,461
$316,473
$427,055
$478,292
Special Arrangements 2,3
• Other non-monetary benefits $14,896 p.a.
• Other non-monetary benefits $55,503 p.a.
• Other non-monetary 4 benefits $558,018 p.a.
• Other non-monetary 4 benefits $158,499 p.a.
• Other non-monetary benefits $13,682 p.a.
• Other non-monetary benefits $61,039 p.a.
• Other non-monetary benefits $97,776 p.a.
• Other non-monetary 4 benefits $153,129 p.a.
Termination of Employment
• 12 months notice by either party• Company may elect term of Garden Leave
during which it is obliged to pay ongoing remuneration entitlements including short term incentives to the extent of time worked
• Non-solicitation and non-competition clauses
• 6 months notice by either party• Non-solicitation and non-competition clauses
• 6 months notice by either party• Company may elect term of Garden Leave
during which it is obliged to pay ongoing remuneration entitlements excluding bonus and LTI payments
• Non-solicitation and non-competition clauses
• 3 months notice by either party• Non-solicitation and non-competition clauses
• 6 months notice by either party• Company may elect to pay 6 months in lieu of
notice• Non-solicitation and non-competition clauses
• 30 Days notice by either party• Non-solicitation and non-competition clauses• Company may elect term of Garden Leave
during which it is obliged to pay ongoing remuneration entitlements including short term incentives to the extent time worked
• Involuntary termination or death/disability then entitled to 12 months severance payment
• Non-compete 12 months following termination with Company discretion to give 3 months notice in advance to cease non compete clause early
• Non-compete indemnity payment equal to 50% of remuneration, bonuses and fringe benefits received reduced by amounts received by employment elsewhere (or maliciously fails to earn)
• Employment contract ceases at age 66 years
• Voluntary termination 3 months notice• Involuntary termination 5 months severance pay
SECTION 6: Executive Remuneration Details and other DisclosuresExecutive Directors and Executives Contractual Entitlements and Termination Arrangements Remuneration and other terms of employment for all Key Management Personnel are formalised in Employment Service Agreements (ESA). As well as base salary, remuneration arrangements include superannuation, pension and social security obligations, termination entitlements and fringe benefits. All Employment Service Agreements are compliant with the legal framework in which the Executive is resident and operating. Unless the ESA has provisions to the contrary, Key Management Personnel are eligible to participate in Short Term (bonus) and Long-Term (equity) incentive schemes. Other major provisions of the agreements of Executive Directors and other executives relating to remuneration and position as at 30 June 2010 are set out below:

Remuneration of Executive Director, Group Executives and other Executives
AUD dollars
Executive Director
Gary Cohen 645,483 - 14,896 28,155 399,805 14,461 1,102,800 38.8% 38.8%
645,484 645,000 10,708 (201,365) - 13,745 1,113,572 39.9% 0.00%
Group Executives
Stephen 445,907 - 55,503 (55,839) 33,317 14,461 493,349 0.0% 0.0%
Garrington10 431,640 282,000 51,315 (110,444) - 13,745 668,256 25.8% 0.0%
Andrea Fiumicelli 4 316,942 - 558,018 - 337,738 - 1,212,698 27.9% 27.9%
333,794 431,500 571,429 - 73,552 - 1,410,275 35.8% 5.2%
Brian Cohen 4 426,283 - 158,499 142,527 99,951 - 827,260 29.3% 29.3%
416,208 280,000 97,257 50,332 - - 843,797 39.1% 5.9%
Martin Deda 4 550,000 - 13,682 76,513 - 14,461 654,656 11.7% 11.7%
533,780 412,000 43,169 36,776 - 13,745 1,039,470 43.2% 3.5%
Mike Jackman 3 112,084 - - - 19,221 - 131,305 14.6% 14.6%
Other Executives
Peter Herrmann 4 427,055 208,188 97,776 - 41,748 - 774,767 32.3% 5.4%
496,220 387,448 126,046 - 29,421 - 1,039,135 40.1% 2.9%
Wim Botermans 4 446,553 - 153,129 - 47,940 31,739 679,361 7.1% 7.1%
466,471 - 392,200 - 36,776 - 895,447 4.1% 4.1%
Short-term employee benefits Share-based payments1Post - employment
% Remuneration
that consists of options
% Remuneration
Performance relatedTotal
Superan-nuation
EIP Options 9
ELP Shares 2,5
Non-Monetary
Benefits 6,8Cash
Bonus 7
Base Salary
and Fees
1. The fair value of equity grants for each individual are measured at the grant dates and recognised evenly over the vesting period. The expense recognised in the income statement and disclosed in the remuneration tables is not adjusted in the event the equity grants do not vest due to failure to meet a market condition. Similarly, the amount is not reversed to reflect the ultimate value (if any) provided to KMP. However, if it is considered probable that a KMP will not meet a service condition or probable that a non-market condition will no longer be satisfied, the expense is adjusted.
2. Under the Employee Loan Plan (ELP), share grants would be transferred to the participant provided a limited recourse loan is paid. ELP shares are in substance options and are separately disclosed from Employee Incentive Plan option grants.
3. Mike Jackman joined iSOFT on 22 February 2010 - the salary represented is pro-rated from his start date 4. Denotes one of the five highest paid executives of the Consolidated Entity as required to be disclosed under the Corporations Act 2001. 5. Remuneration in the form of ELP shares includes negative amounts for share grants for which it is no longer probable that a non-market condition will be
satisfied.6. Non-monetary benefits may include car parking/allowance, health/life/salary continuance insurance, pension scheme contributions, and various standard
expatriate benefits as appropriate.7. Short-term incentives payable in cash awarded under iSOFT’s annual discretionary bonus scheme is funded from the bonus pool and based on the
Consolidated Entity’s performance and relevant Regional Business Unit performance where applicable based on achievement of agreed objectives set at the beginning of the performance year. In 2010, a bonus will be payable to Peter Herrmann due to a contractual obligation in Germany.
8. Expatriate benefits are included in non-monetary benefits and are provided to executives as a result of secondment/ fixed term assignment. The expatriate benefit may include housing, health insurance, tax equalisation and other standard expatriate benefits, if appropriate.
9. EIP includes Options and Performance Rights.10. Stephen Garrington ceased to be a Director on 15 June 2010.
35iSOFT Group Limited Annual Report 2010 Financial Report for the year ended 30 June 2010
2010
2009
2010
2009
2010
2009
2010
2009
2010
2009
2010
2010
2009
2010
2009

Remuneration Report (audited) cOnTinued
36 iSOFT Group Limited Annual Report 2010 Financial Report for the year ended 30 June 2010
Equity Based Compensation of Key Management Personnel and other Executives Employee Loan Plan 2010
Equity Based Compensation of Key Management Personnel and other Executives Employee Loan Plan 2009
Executive Director
Gary Cohen 2,554,347 2,000,000 (1,374,673) (277,500) - 2,902,174 -
Group Executives
Brian Cohen 573,952 1,500,000 - (59,249) - 2,014,703 -
Martin Deda 500,000 500,000 - - - 1,000,000 -
Stephen Garrington 2 1,320,040 500,000 (700,694) (223,979) - 895,367 -
Total 4,948,339 4,500,000 (2,075,367) (560,728) - 6,812,244 -
Executive Director
Gary Cohen 3,304,347 - (375,000) (375,000) - 2,554,347 -
Stephen Garrington 1,804,049 48,652 (250,000) (282,661) - 1,320,040 -
Group Executives
Brian Cohen 49,645 573,952 - (49,645) - 573,952 -
Martin Deda - 500,000 - - - 500,000 -
Ceased to be a KMP during the year:
Executives
Gordon Mackay 2 728,152 - - - (728,152) - -
Total 5,886,193 1,122,604 (625,000) (707,306) (728,152) 4,948,339 -
For the year ended 30 June 2010
For the year ended 30 June 2009
Fair value 1 of unvested
shares at end of the
year
Fair value 1 of unvested
shares at end of the
year
Balance of unvested
ELP shares at end of the year
Balance of unvested
ELP shares at end of the year
Transferred out during
the year
Transferred out during
the year
Vested during
the year
Vested during
the year
Forfeited during
the year
Forfeited during
the year
Granted as compensation
during the year
Granted as compensation
during the year
Balance of unvested ELP shares at the start of the year
Balance of unvested ELP shares at the start of the year
1. Fair value is determined by taking the market value of the Company shares as at 30 June 2010 and reducing them by the outstanding note at that date. 2. Stephen Garrington ceased to be an Executive Director effective 15 June 2010.
1. Fair value is determined by taking the market value of the Company shares as at 30 June 2009 and reducing them by the outstanding note at that date. 2. Transferred out does not mean that the individual has left the Consolidated Entity, or that the grants have vested or been exercised.

37iSOFT Group Limited Annual Report 2010 Financial Report for the year ended 30 June 2010
Equity Based Compensation of Key Management Personnel and other Executives Employee Incentive Plan Options and Performance Rights 2010
Equity Based Compensation of Key Management Personnel and other Executives Employee Incentive Plan Options and Performance Rights 2009
Executive Director
Gary Cohen - 3,000,000 - - - 3,000,000
Group Executives
Andrea Fiumicelli 1,000,000 3,000,000 - - - 4,000,000
Brian Cohen - 750,000 - - - 750,000
Stephen Garrington - 250,000 - - - 250,000
Mike Jackman - 800,000 - - - 800,000
Other Executives
Wim Botermans 500,000 - - - - 500,000
Peter Herrmann 400,000 100,000 - - - 500,000
Total 1,900,000 7,900,000 - - - 9,800,000
Group Executives
Andrea Fiumicelli - 1,000,000 - - - 1,000,000
Other Executives
Wim Botermans - 500,000 - - - 500,000
Peter Herrmann - 400,000 - - - 400,000
Total - 1,900,000 - - - 1,900,000
For the year ended 30 June 2010
For the year ended 30 June 2009
Balance of unvested
EIP optionsat the end
of the year
Balance of unvested
EIP optionsat the end
of the year
Vestedduring
the year
Vestedduring
the year
Exercisedduring the
year
Exercisedduring the
year
Forfeited during
the year
Forfeited during
the year
Granted as compensation
during the year
Granted as compensation
during the year
Balance of unvested EIP
options1 at the start
of the year
Balance of unvested EIP
options at the start
of the year
1. Performance Rights were issued for the first time during FY2010

Remuneration Report (audited) cOnTinued
EIP Option Holdings of Key Management Personnel and other Executives 2010
EIP Performance Rights Holdings of Key Management Personnel and other Executives 2010
For the year ended 30 June 2010
For the year ended 30 June 2010
Balance of unvested
options at the end of
the year
Balance of unvested
options at the end of
the year
Granted during
the year
Granted during
the year
Weighted grant date fair value 3
per option ($)
Weighted grant date fair value 3
per option ($)
Options balance at
the start of the year
Options balance at
the start of the year
Hurdle type 2
Hurdle type 2
Weighted option
exercise price ($) 4
Options exercise
price ($) 4,5
Plan type 1
Plan type 1
1. For plan types, refer structure and details of Long-Term incentive plans in earlier section of this Remuneration Report.2. For performance hurdles, refer structure and details of Long-Term incentive plans in earlier section of this Remuneration Report.3. Weighted grant date fair value. For details of EIP option remuneration fair values, please refer to earlier section of this Remuneration Report.4. Weighted option exercise price.
1. For plan types, refer structure and details of Long-Term incentive plans in earlier section of this Remuneration Report.2. For performance hurdles, refer structure and details of Long-Term incentive plans in earlier section of this Remuneration Report.3. Weighted grant date fair value. For details of EIP option remuneration fair values, please refer to earlier section of this Remuneration Report.4. Weighted option exercise price. 5. Options with a zero exercise price are shown with a dash (-).
38 iSOFT Group Limited Annual Report 2010 Financial Report for the year ended 30 June 2010
Group Executives
Andrea Fiumicelli EIP EPS 0.2776 0.7553 500,000 1,000,000 1,500,000
SPG 0.2703 0.6911 500,000 - 500,000
TSR 0.1953 0.7874 - 1,000,000 1,000,000
Mike Jackman EIP EPS 0.1999 0.5780 - 200,000 200,000
TSR 0.1593 0.5780 - 200,000 200,000
Other Executives
Wim Botermans EIP EPS 0.3016 0.6911 250,000 - 250,000
SPG 0.2703 0.6911 250,000 - 250,000
Peter Hermann EIP EPS 0.3016 0.6911 200,000 - 200,000
SPG 0.2703 0.6911 200,000 - 200,000
Total 1,900,000 2,400,000 4,300,000
Executive Director
Gary Cohen EIP Performance Rights EPS 0.7509 - - 1,500,000 1,500,000
TSR 0.3804 - - 1,500,000 1,500,000
Group Executives
Andrea Fiumicelli EIP Performance Rights EPS 0.7509 - - 500,000 500,000
TSR 0.3804 - - 500,000 500,000
Brian Cohen EIP Performance Rights EPS 0.7509 - - 375,000 375,000
TSR 0.3804 - - 375,000 375,000
Stephen Garrington EIP Performance Rights EPS 0.7509 - - 125,000 125,000
TSR 0.3804 - - 125,000 125,000
Mike Jackman EIP Performance Rights EPS 0.5517 - - 200,000 200,000
TSR 0.3139 - - 200,000 200,000
Other Executives
Peter Herrmann EIP Performance Rights EPS 0.5614 - - 50,000 50,000
TSR 0.3190 - - 50,000 50,000
Total 5,500,000 5,500,000

39iSOFT Group Limited Annual Report 2010 Financial Report for the year ended 30 June 2010
Executive Director
Gary Cohen ELP EPS 0.4145 0.9611 1,652,174 1,000,000 (472,500) - 2,179,674
SPG 0.3645 1.0699 2,277,173 - (902,173) - 1,375,000
Other 0.2974 0.6686 1,000,000 - - - 1,000,000
TSR 0.1938 0.7874 - 1,000,000 - - 1,000,000
Group Executives
Brian Cohen ELP EPS 0.2913 0.7730 250,000 750,000 - - 1,000,000
SPG 0.2703 0.7297 250,000 - - - 250,000
Other 0.1810 0.3885 777,110 - - - 777,110
TSR 0.1938 0.7874 - 750,000 - - 750,000
ELP 15m n/a 0.1460 0.4295 575,152 - - - 575,152
Martin Deda ELP EPS 0.2965 0.7586 250,000 250,000 - - 500,000
SPG 0.2703 0.7297 250,000 - - - 250,000
TSR 0.1938 0.7874 - 250,000 - - 250,000
Stephen Garrington ELP EPS 0.5273 1.1436 885,694 250,000 (315,000) - 820,694
SPG 0.3541 0.6996 1,635,694 - (385,694) - 1,250,000
Other 0.4301 0.3500 3,000,000 - - 3,000,000
TSR 0.1938 0.7874 - 250,000 - - 250,000
ELP 15m n/a 0.2343 0.6840 191,889 - - - 191,889
Total 12,994,886 4,500,000 (2,075,367) - 15,419,519
ELP Option Holdings of Key Management Personnel and other Executives 2010
For the period ending 30 June 2010
Balance of vested and
unvested options at the end of
the year
Transferred out during
the year
Balance of vested and
unvested options at
the start of the year
Lapsed or forfeited
during the year
Weightedoption
exercise price ($) 4
Hurdle type 2
Granted during
the year
Weighted grant date fair value 3
per optionPlan
type 1
1. For plan types, refer structure and details of Long-Term incentive plans in earlier section of this Remuneration Report. The ELP Shares are granted with a limited recourse loan of which the outstanding amount can be determined by multiplying the number of vested and unvested shares with the ELP exercise price. As such, ELP Shares are in substance options.
2. For performance hurdles, refer structure and details of Long-Term incentive plans in earlier section of this Remuneration Report.3. Weighted grant date fair value. For details of ELP option fair values, please refer to earlier section of this Remuneration Report.4. ELP exercise price reflects the amount payable in relation to the limited recourse loan attached to the ELP Share grant.

40 iSOFT Group Limited Annual Report 2010 Financial Report for the year ended 30 June 2010
Executive Directors
Gary Cohen ELP EPS 0.3705 0.7914 1,652,174 - - - 1,652,174
SPG 0.2962 0.8137 2,652,173 - (375,000) - 2,277,173
Other 0.2974 0.6686 1,000,000 - - - 1,000,000
Stephen Garrington ELP EPS 0.4064 0.8374 885,694 - - - 885,694
SPG 0.3412 0.6903 1,885,694 - (250,000) - 1,635,694
Other 0.4301 0.3500 3,000,000 - - - 3,000,000
ELP 15m n/a 0.2343 0.7000 143,237 48,652 - - 191,889
Group Executives
Brian Cohen ELP EPS 0.3016 0.7297 - 250,000 - - 250,000
SPG 0.2703 0.7297 - 250,000 - - 250,000
Other 0.1810 0.3885 777,110 - - - 777,110
ELP 15m n/a 0.1460 0.4300 501,200 73,952 - - 575,152
Martin Deda ELP EPS 0.3016 0.7297 - 250,000 - - 250,000
SPG 0.2703 0.7297 - 250,000 - - 250,000
Ceased to be a KMP during the year:
Other Executives
Gordon Mackay ELP EPS 0.4064 0.8374 354,278 - - (354,278) -
SPG 0.4560 1.1667 354,277 - - (354,277) -
Other - - - - - - -
ELP 15m n/a 0.2095 0.6000 312,284 - - (312,284) -
Total 13,518,121 1,122,604 (625,000) (1,020,839) 12,994,886
ELP Option Holdings of Key Management Personnel and other Executives 2009
For the period ending 30 June 2009
Balance of vested and
unvested options at the end of
the year
Transferred out during
the year
Balance of vested and
unvested options at
the start of the year
Lapsed or forfeited
during the year
Weightedoption
exercise price ($) 4
Hurdle type 2
Granted during
the year
Weighted grant date fair value 3
per optionPlan
type 1
Note: Vested ELP grants are also included in this table. The exercise period is unlimited.
1. For plan types, refer structure and details of Long-Term incentive plans in earlier section of this Remuneration Report. The ELP Shares are granted with a limited recourse loan of which the outstanding amount can be determined by multiplying the number of vested and unvested shares with the ELP exercise price. As such, ELP Shares are in substance options.
2. For performance hurdles, refer to structure and details of Long-Term incentive plans in earlier section of this Remuneration Report.3. Weighted grant date fair value. For details of ELP option fair values, please refer to earlier section of this Remuneration Report.4. ELP exercise price reflects the amount payable in relation to the limited recourse loan attached to the ELP Share grant. 5. Shares sold or transferred out of the ELP Plan. Transferred out does not mean that the individual has left the Consolidated Entity.
Loans to Executive Directors and other Executives
Employee Loan Plans Under the ELP plans, the trustee of the ELP provides participants with a limited recourse loan (non-interest bearing). The loans are limited in their recourse to the underlying shares granted and the trustee of the ELP plans has the option of taking ownership of the shares and using them to satisfy other share awards in the event of forfeiture/non-vesting by the Executive. ELP shares are in substance options, refer to equity based compensation earlier in the remuneration report.
Other Transactions with Executive Directors and other Executives There are no other transactions with Executive Directors and other executives.
Remuneration Report (audited) cOnTinued

41iSOFT Group Limited Annual Report 2010 Financial Report for the year ended 30 June 2010
Chairman 2011 160,000 30,000 25,000
2010 - 30,000 25,000
Member 2011 85,000 15,000 15,000
2010 85,000 15,000 15,000
Chairman - 27,000 22,500
Member 76,500 13,500 13,500
BoardRemunera-
tionCommittee
$
BoardRemunera-
tionCommittee
$
Board Audit and
ComplianceCommittee
$
Board Audit and
ComplianceCommittee
$
Board$
Board$2011
SECTION 7: Non-executive Director Remuneration Framework
ObjectiveThe remuneration arrangements for Non-executive Directors aims to attract and retain suitably qualified Non-executive Directors, and reward them appropriately for their role and commitment in providing sound governance and in representing the interests of shareholders.
The Non-executive Director remuneration framework comprises Director fees paid in cash and statutory superannuation contributions.
In order to maintain their independence and impartiality, the remuneration of the Non-executive Directors by the Company is not linked to the performance of the Consolidated Entity. As a result, they do not receive any performance related bonus or participate in any Short-Term or Long-Term incentive scheme from the Company.
iSOFT does not provide termination benefits or operate a retirement schemes for Non-executive Directors other than compulsory superannuation contributions comprising part of their remuneration.
Director Fees Non-executive Directors receive annual fees that are reviewed periodically by the Board taking into account:
• advice from independent external remuneration consultants on competitive market practice; • experience and responsibilities of the Directors and the Board Committees; and • demands placed on Non-executive Directors in light of the size and complexity of the Consolidated Entity.
Fee Structure Director Fees are set within an aggregate maximum pool determined by Shareholders and for 2010 the total was $1,000,000.
The schedule of fees (inclusive of statutory superannuation where appropriate) for the Board and Board Committees for the 2010 and 2011 financial year was as follows:
To emphasise the Board’s strong support for the business whilst it undergoes cost reductions, it has been agreed that there will be a 10% reduction (from the above) in all Director and Committee membership fees for FY11. In addition, fees related to the services of Robert Moran (Chairman), will be waived for FY2011.
Applicable rates are shown below:

Remuneration Report (audited) cOnTinued
Non-executive Directors Remuneration and other Disclosures
Remuneration Entitlements and Termination Arrangements
Remuneration is viewed as a total package, comprising fees paid in cash and statutory superannuation contributions (where appropriate). Non-executive Directors do not receive performance- related cash bonuses or termination payments. The remuneration arrangements of Non-executive Directors relating to remuneration are set out below:
Total$
Post-employmentsuperannuation
$
Short-term basesalary and fees
$
1. Robert Moran, Lachlan MacGregor and Peter Wise have their remuneration paid to an employer entity.
2. On 9 November 2004, 100,000 options were granted and approved by Shareholders, with an exercise price of $0.72 and an expiry date of 4 November 2009.
These options have all vested and have been exercised.
3. James Fox was appointed 6 July 2009 and resigned at 15 June 2010.
42 iSOFT Group Limited Annual Report 2010 Financial Report for the year ended 30 June 2010
Non-Executive Directors
Claire Jackson 2010 77,982 7,018 85,000
2009 70,417 6,337 76,754
Robert Moran 1 2010 110,000 - 110,000
2009 55,452 - 55,452
Anthony Sherlock 2 2010 105,505 9,495 115,000
2009 90,000 8,100 98,100
Ian Tsicalas 2010 105,505 9,495 115,000
2009 87,897 7,911 95,808
Peter Wise 1 2010 115,000 - 115,000
2009 90,000 8,100 98,100
Alternate Non-Executive Director
Lachlan MacGregor 1 2010 15,000 - 15,000
2009 6,493 - 6,493
Ceased to be KMP:
James Fox 3 2010 92,943 8,257 101,200

2010 Relevant interest in ordinary shares of the Directors and other ExecutivesThe movement during the reporting period in the number of ordinary securities in the Company held directly, indirectly or beneficially, by each Key Management Person, including their related parties is as follows:
Balance at30 Sep 10
Balance atthe end of
the year
Transferredout during
the year
Disposedduring
the year
Acquiredduring
the yearIssued
under DRP
Balance atthe start of
the year A
1. Dr James Fox resigned as a Director on 15 June 2010.
2. Stephen Garrington resigned as a Director on 15 June 2010 and remained a Key Management Person.
3. Mike Jackman became a Key Management Person as at 22 February 2010.
4. Includes 100,000 shares acquired during the year by Anthony Sherlock upon exercise of EIP options.
A. All the shares are inclusive of vested and unvested shares under the iSOFT Employee Loan Plan where applicable. The balance of vested and unvested shares held by
individuals is disclosed in the Employee Loan Plan section of this Report.
B. The balance at 30 June 2010 includes the relevant interest in securities of the RJL Investments Pty Limited Group of Companies, of which Brian Cohen and Gary Cohen
each have a 50% stake of 30,375,042 shares. This amount also includes the relevant interest in vested and unvested shares under the share award plans for Gary Cohen
and Brian Cohen. This amount does not include the relevant interests pursuant to a Pre-emption Deed under which RJL Investments Pty Ltd and Oceania Healthcare
Technology Investments Pty Limited each grant pre-emptive rights over their shares in the Company in favour of the other. Pre-emptive rights do not attach to more
shares than the number which, when added to the person’s existing voting power, equals 19.9%.
43iSOFT Group Limited Annual Report 2010 Financial Report for the year ended 30 June 2010
Executive Director
Gary Cohen B 69,483,502 577,270 45,173,156 (61,148,788) (1,446,113) 52,639,027 52,639,027
Non-executive Directors
Claire Jackson 39,620 - - - - 39,620 39,620
Robert Moran 580,937 - - - - 580,937 580,937
Anthony Sherlock 4 10,000 100,000 (50,000) - 60,000 60,000
Ian Tsicalas - - - - - - -
Peter Wise 11,516,913 - - (250,000) - 11,266,913 11,266,913
James Fox 1 - - 100,000 - (100,000) - -
Alternate Director
Lachlan MacGregor - - - - - - -
Group Executives
Stephen Garrington2 5,841,542 - 750,000 - (700,694) 5,890,848 5,890,848
Brian Cohen B 67,074,676 577,270 35,044,242 (53,453,015) (1,374,673) 47,868,500 47,868,500
Martin Deda 527,273 - 500,000 - - 1,027,273 1,027,273
Andrea Fiumicelli 62,780 - - - - 62,780 62,780
Mike Jackman 3 - - 40,000 - - 40,000 40,000
Other Executives
Wim Botermans 209,525 - - - - 209,525 209,525
Peter Herrmann - - - - - - -

Remuneration Report (audited) cOnTinued
2009 Relevant interest in ordinary shares of the Directors and other ExecutivesThe movement during the reporting period in the number of ordinary securities in the Company held directly, indirectly or beneficially, by each Key Management Person, including their related parties is as follows:
Balance at18-Aug-09
Balance atthe end of
the year
Transferredout during
the year
Disposedduring
the year
Acquiredduring
the year
Pro-rataentitle-
mentApr-09
Balance atthe start of
the year A
1. Robert Moran was appointed a full Director on 6 November 2008.
2. Donald Conway resigned on 6 November 2008.
3. Lachlan MacGregor was appointed as an Alternate Director on 9 January 2009.
4. Martin Deda became a Key Management Person as at 14 July 2009.
5. Gordon Mackay ceased to be a Key Management Person as at 13 July 2009 but remains employed by the Consolidated Entity.
A. All the shares are inclusive of vested and unvested shares under the iSOFT Employee Loan Plan where applicable. The balance of vested and unvested shares held by
individuals is disclosed in the Employee Loan Plan section of this report.
B. This amount includes the relevant interest in securities of the RJL Investments Pty Limited Group of Companies, of which Brian Cohen and Gary Cohen each have a
50% stake of 60,330,299 shares. This amount also includes the relevant interest in vested and unvested shares under the share award plans for Gary Cohen and Brian
Cohen. This amount does not include the relevant interests pursuant to a Pre-emption. Deed under which RJL Investments Pty Ltd and Oceania Healthcare Technology
Investments Pty Limited each grant pre-emptive rights over their shares in the Company in favour of the other. Pre-emptive rights do not attach to more shares than the
number which, when added to the person’s existing voting power, equals 19.9%.
44 iSOFT Group Limited Annual Report 2010 Financial Report for the year ended 30 June 2010
Executive Director
Gary Cohen B 72,546,550 3,514,285 8,326,602 (14,528,935) (375,000) 69,483,502 69,483,502
Stephen Garrington 6,463,594 - 227,948 (600,000) (250,000) 5,841,542 5,841,542
Non-executive Directors
Claire Jackson 39,620 - - - - 39,620 39,620
Robert Moran 1 672,773 140,000 - - (231,836) 580,937 580,937
Anthony Sherlock 10,000 - - - - 10,000 10,000
Ian Tsicalas - - - - - - -
Peter Wise 12,688,443 1,100,000 - (2,271,530) - 11,516,913 11,516,913
Donald Conway 2 250,000 - - - (250,000) - -
Alternate Director
Lachlan MacGregor 3 - - - - - - -
Key Management Personnel
Wim Botermans - - 209,525 - - 209,525 209,525
Brian Cohen B 71,362,526 3,514,285 3,605,765 (11,032,900) (375,000) 67,074,676 67,074,676
Martin Deda 4 - 27,273 500,000 - - 527,273 527,273
Andrea Fiumicelli - - 78,222 (15,442) - 62,780 62,780
Peter Herrmann - - - - - - -
Gordon Mackay 5 437,829 - - - (437,829) - -

45iSOFT Group Limited Annual Report 2010 Financial Report for the year ended 30 June 2010
To: The Directors iSOFT Group Limited
As lead auditor for the audit of iSOFT Group Limited for the year ended 30 June 2010, I declare that to the best of my knowledge and belief there have been:
(a) no contraventions of the auditor independence requirements of the Corporations Act 2001 in relation to the audit; and
(b) no contraventions of any applicable code of professional conduct in relation to the audit.
This declaration is in respect of iSOFT Group Limited and the entities it controlled during the year.
PKF
Bruce Gordon Partner
30 September 2010
Auditor’s independence declaration
Tel: 61 2 9251 4100 | Fax: 61 2 9240 9821 | www.pkf.com.au
PKF | ABN 83 236 985 726
Level 10, 1 Margaret Street | Sydney | New South Wales 2000 | Australia
DX 10173 | Sydney Stock Exchange | New South Wales
The PKF East Coast Practice is a member of the PKF International Limited network of legally independent member firms. The PKF East Coast Practice is also a member of
the PKF Australia Limited national network of legally independent firms each trading as PKF. PKF East Coast Practice has offices in NSW, Victoria and Brisbane. PKF East
Coast Practice does not accept responsibility or liability for the actions or inactions on the part of any other individual member firm or firms.
Liability limited by a scheme approved under Professional Standards Legislation.

Financial Statements
46 iSOFT Group Limited Annual Report 2010 Financial Report for the year ended 30 June 2010

Consolidated income statement
Consolidated statement of comprehensive income
Consolidated statement of financial position
Consolidated statement of changes in equity
Consolidated statement of cashflows
Notes to the Financial Statements
48
49
50
51
52
53
47iSOFT Group Limited Annual Report 2010 Financial Report for the year ended 30 June 2010

consolidated income statement FOR THe YeAR ended 30 June 2010
The above consolidated income statement should be read in conjunction with the accompanying notes.
Sales revenue 430,513 538,851
Gain on sale of land and buildings 1,200 -
Other revenue 3,192 1,273
Revenue 4 434,905 540,124
Expenses excluding finance costs, depreciation, 5 (404,844) (407,736)
amortisation and impairment
EBITDA 7 30,061 132,388
Depreciation 14 (6,894) (8,351)
Amortisation of intangible assets 15 (37,153) (45,612)
Impairment of intangible assets 15 (341,059) -
Finance costs 6 (21,350) (34,006)
(Loss)/earnings before income tax expense (376,395) 44,419
Income tax expense 8 (6,519) (9,688)
(Loss)/profit for the year (382,914) 34,731
Attributable to:
Equity holders of the parent entity (381,870) 35,086
Non-controlling interest (1,044) (355)
(Loss)/profit for the year (382,914) 34,731
Cents Cents
Basic earnings per share attributable to ordinary equity holders 37 (37.93) 4.30
Diluted earnings per share attributable to ordinary equity holders 37 (37.93) 4.26
2010$’000
2009$’000Notes
48 iSOFT Group Limited Annual Report 2010 Financial Report for the year ended 30 June 2010

consolidated statement of comprehensive income FOR THe YeAR ended 30 June 2010
The above statement of comprehensive income should be read in conjunction with the accompanying notes.
(Loss)/profit for the year (382,914) 34,731
Other comprehensive income/(expense)
Changes in the fair value of cash flow hedges 26 (1,374) -
Defined benefit plan actuarial (losses)/gains 23,26 (3,560) 1,711
Irrecoverable element of minimum funding requirement 23,26 3,979 (2,339)
Foreign currency translation differences 26 (103,623) 3,071
Tax effects 26 3,190 51
Total other comprehensive (expense)/income for the year (101,388) 2,494
Total comprehensive (expense)/income for the year (484,302) 37,225
Total comprehensive (expense)/income for the year is attributable to:
Equity holders of the parent entity (483,258) 37,580
Non-controlling interest (1,044) (355)
Total comprehensive (expense)/income for the year (484,302) 37,225
2010$’000
2009$’000Notes
49iSOFT Group Limited Annual Report 2010 Financial Report for the year ended 30 June 2010

consolidated statement of financial position AS AT 30 June 2010
The above statement of financial position should be read in conjunction with the accompanying notes.
50 iSOFT Group Limited Annual Report 2010 Financial Report for the year ended 30 June 2010
Current Assets
Cash and cash equivalents 9 31,577 85,737
Trade and other receivables 10 71,949 73,884
Inventories 11 564 192
Income tax receivable 16 1,590 2,007
Accrued revenue 12 56,120 73,220
Other current assets 13 16,316 15,019
Total Current Assets 178,116 250,059
Non-Current Assets
Property, plant and equipment 14 25,146 24,461
Intangible assets 15 480,687 920,484
Deferred tax assets 16 53,450 91,282
Accrued revenue 17 20,127 13,815
Total Non-Current Assets 579,410 1,050,042
Total Assets 757,526 1,300,101
Current Liabilities
Trade and other payables 18 89,841 108,136
Borrowings 19 34,978 55,788
Derivative financial instruments 28 996 -
Income tax liabilities 16 3,374 2,028
Provisions 20 7,877 5,740
Deferred income 21 58,938 67,898
Total Current Liabilities 196,004 239,590
Non-Current Liabilities
Trade and other payables 24 8,342 812
Borrowings 22 191,265 186,382
Derivative financial instruments 28 378 -
Deferred tax liabilities 16 71,251 100,439
Provisions 20 832 630
Retirement benefit obligations 23 24,996 30,710
Total Non-Current Liabilities 297,064 318,973
Total Liabilities 493,068 558,563
Net Assets 264,458 741,538
Equity
Contributed equity 25 747,441 728,960
Reserves 26 (106,527) (4,478)
Retained earnings/accumulated losses 26 (375,407) 17,061
Total equity attributable to equity holders of the parent entity 265,507 741,543
Non-controlling interest 26 (1,049) (5)
Total Equity 264,458 741,538
2010$’000
2009$’000Notes

consolidated statement of changes in equity FOR THe YeAR ended 30 June 2010
The above statement of changes in equity should be read in conjunction with the accompanying notes.
51iSOFT Group Limited Annual Report 2010 Financial Report for the year ended 30 June 2010
Total equity at the beginning of the year 741,538 578,183
Total comprehensive (expense)/income for the year (484,302) 37,225
Transactions with equity holders in their capacity as equity holders:
Contributions of equity 26 18,846 131,569
Cost of raising capital 26 (365) (4,937)
Dividends - ordinary shares 26 (10,138) -
Dividends - convertible notes 26 (460) -
Other equity movements:
Share based payments 26,39 2,507 1,424
Net issue of treasury shares 26 (3,168) (3,373)
Warrants issued 26 - 1,447
Total equity at the end of the year 264,458 741,538
2010$’000
2009$’000Notes

consolidated statement of cash flows FOR THe YeAR ended 30 June 2010
52 iSOFT Group Limited Annual Report 2010 Financial Report for the year ended 30 June 2010
The above cash flow statements should be read in conjunction with the accompanying notes
Cash flows from operating activities
Receipts from customers (inclusive of GST/purchase tax) 479,081 589,461
Payments to suppliers and employees (inclusive of GST/purchase tax) (471,189) (516,320)
Interest received 352 1,619
Income tax paid (8,938) (10,509)
Net cash from operating activities 35 (694) 64,251
Cash flows from investing activities
Payment for purchase of property, plant and equipment 14 (6,655) (9,216)
Payment for acquisition of business entity, net of cash 32 (18,882) (4,696)
Payment for development expenditure 15 (22,380) (17,989)
Payment for deferred consideration - (918)
Proceeds from sales of property, plant and equipment 1,593 202
Net cash from investing activities (46,324) (32,617)
Cash flows from financing activities
Proceeds from issue of shares 25 12,863 116,448
Proceeds from issue of convertible notes 22 - 7,224
Share issue costs (365) (4,490)
Proceeds from borrowings 54,801 31,210
Debt establishment fees (6,640) -
Repayment of borrowings (26,730) (88,910)
Finance costs paid (11,887) (25,660)
Repayment of contract funding and other funding (14,634) (37,552)
Finance lease principal repayments (627) (677)
Dividends paid - ordinary shares 27 (8,520) -
Dividends paid - convertible notes 27 (460) -
Net cash from financing activities (2,199) (2,407)
Net (decrease)/increase in cash and cash equivalents (49,217) 29,227
Cash and cash equivalents held at 1 July 9 85,737 54,218
Effect of exchange rate changes on cash and cash equivalents (4,943) 2,292
Cash and cash equivalents held at 30 June 31,577 85,737
2010$’000
2009$’000Notes

Note
1
2
3
4
5
6
7
8
9
10
11
12
13
14
15
16
17
18
19
20
21
22
23
24
25
26
27
28
29
30
31
32
33
34
35
36
37
38
39
40
41
42
43
Content
Summary of significant accounting policies
Critical accounting estimates and judgements
Segment information
Revenue
Expenses
Finance costs
EBITDA calculation
Income tax expense
Cash and cash equivalents
Trade and other receivables – current
Inventories
Accrued revenue – current
Other assets – current
Property, plant and equipment
Intangible assets
Tax assets and liabilities
Accrued revenue – non-current
Trade and other payables – current
Borrowings – current
Provisions – current and non-current
Deferred income – current
Borrowings – non-current
Retirement and post-employment benefit obligations – non-current
Trade and other payables – non-current
Contributed equity
Reconciliation of movement in capital, reserves, retained earnings and non-controlling interest
Dividends
Financial instruments
Remuneration of auditors
Contingent liabilities
Commitments
Business combinations
Subsidiaries
Jointly controlled entities
Reconciliation of profit/(loss) after income tax to net cash flows from operating activities
Non-cash investing and financing activities
Earnings per share
Key Management Personnel disclosures
Share-based payments
Related party transactions
Exchange rates
Parent entity disclosures
Events occurring after balance date
Page
54
66
67
71
72
72
73
73
74
74
74
74
74
75
76
80
81
81
82
83
84
84
87
92
93
94
97
97
104
105
106
107
110
112
113
113
114
115
122
134
136
136
137
contents
53iSOFT Group Limited Annual Report 2010 Financial Report for the year ended 30 June 2010

Note 1. Summary of significant accounting policiesThe principal accounting policies adopted in the preparation of the financial report are set out below. These policies have been consistently applied by the Consolidated Entity to all the years presented, unless otherwise stated.
This financial report as at and for the year ended 30 June 2010 comprises the consolidated financial statements of iSOFT Group Limited (the “Company”) and its controlled entities/subsidiaries (together referred to as the “Consolidated Entity” or “Group”) and interests in jointly controlled entities for the year ended 30 June 2010.
The Revised Corporations Act 2001, as amended by the Corporations Amendment Regulations 2010 (No. 6) no longer requires an entity to prepare parent entity financial statements, provided the entity prepares consolidated financial statements, however, key parent entity disclosures are required by way of a separate note. As a result of this change the Consolidated Entity has not prepared separate parent entity financial statements and the required parent entity disclosures are included in Note 42.
(a) Basis of preparation(i) Statement of complianceThis financial report is a general purpose financial report which has been prepared in accordance with Australian Accounting Standards (“AASBs”) (including Australian Interpretations) adopted by the Australian Accounting Standards Board (“AASB”) and the Corporations Act 2001. The financial report of the Consolidated Entity complies with the International Financial Reporting Standards (“IFRSs”) and interpretations adopted by the International Accounting Standards Board (“IASB”).
(ii) Going concernIn June 2010, the Group commenced discussions with its senior lenders and their advisors in connection with the reorganisation of its senior debt facilities and equity capital raising strategies for the Group in light of the Group’s prospective financing requirements.
As a result of these discussions, the senior lenders have issued fully underwritten, credit approved and binding commitment documentation setting out the terms on which the senior lenders have agreed to extend the Group’s existing senior debt facilities and advance a new senior debt facility to the Group of up to GBP40 million. This provides stability in the financing of the Group and will facilitate the ongoing business operations of the Group (refer to Note 22 and Note 43). The financial covenants under the senior debt facilities have been reset in accordance with the terms of the commitment documentation. Final documentation is expected to be completed before 20 October 2010.
After consideration of the agreement reached with the Group’s senior lenders and in light of all other relevant circumstances, including all of the conditions to the restructured facilities and the matters set out in the following paragraphs, the Directors have
confidence in the availability of adequate financing for the Group for the Directors to be of the opinion that the Group will be able to continue to pay all of its debts as and when they fall due and accordingly that the financial report is correctly prepared on a going concern basis.
As part of the arrangements with the senior lenders, the Group is undertaking a cash management and cost mitigation exercise and is also investigating the initiatives described below.
The Group is undertaking a review of its capital structure with the assistance of financial and legal advisers, with the objective of reducing the overall level of indebtedness of the Group.
The Group is also in the process of completing a detailed review of its operations and business activities. In connection with this review, the Group is considering the disposal of certain assets and has, subsequent to the reporting date, commenced a sale process for one asset with a number of prospective purchasers. The timing and outcome of such disposal is still being determined.
(iii) Rounding of amountsThe Consolidated Entity is of a kind referred to in ASIC Class Order 98/100 dated 10 July 1998 and in accordance with that Class Order, all financial information presented in Australian Dollars in the financial report have been rounded off to the nearest thousand dollars, unless otherwise stated.
(iv) Adoption of new Standards and Interpretations, reclassifications and corrections of errorsThe Consolidated Entity has applied the pronouncements to the comparatives in accordance with AASB 108 Accounting Policies, Changes in Accounting Estimates and Errors.
As a result of the Consolidated Entity applying AASB 101 Presentation of Financial Statements (revised from 1 July 2009), the financial report includes a Consolidated Statement of Comprehensive Income (which replaces the Statement of Recognised Income and Expense), a Consolidated Statement of Financial Position (which replaces the Balance Sheet) and a Consolidated Statement of Changes in Equity. The revised standard does not change the recognition, measurement or disclosure of transactions and events that are required by other AASBs.
The Consolidated Entity has restated the prior period balance sheet and equity for an adjustment relating to recognition of a defined benefit pension scheme in the Netherlands in accordance with AASB 119 Employee Benefits. The prior period adjustment causes an increase to prior period opening equity and prior period closing equity of $3.2 million, net of tax (refer Note 23).
The Consolidated Entity has made reclassifications in prior year comparatives in order to align with the presentation in this financial report.
54 iSOFT Group Limited Annual Report 2010 Financial Report for the year ended 30 June 2010
notes to the Financial Statements cOnTinued

With effect from 1 July 2009, the Consolidated Entity has adopted AASB 8 Operating Segments. This is a new disclosure standard which has lead to a change in the Consolidated Entity’s reportable segments and has introduced certain new disclosures as set out in Note 3. As part of the Annual Improvements to Australian Accounting Standards 2009, the AASB modified the requirement to disclose total assets and liabilities for each reportable segment. This disclosure is now required only if a measure of total assets by segment is reported to the CODM. The amendment to AASB 8 is mandatory for accounting periods commencing on or after 1 January 2010 however can be early adopted which the Consolidated Entity has elected to do. Comparative information of segmental reporting has been restated to reflect current reportable segments.
(v) Historical cost conventionThis financial report has been prepared under the historical cost convention, as modified where applicable by the revaluation of financial instruments.
(vi) Critical accounting estimatesThe preparation of this financial report in conformity with Australian Accounting Standards requires the use of certain critical accounting estimates. It also requires management to exercise its judgement in the process of applying the Consolidated Entity’s accounting policies. The areas involving a higher degree of judgement or complexity, or areas where assumptions and estimates are significant to the financial report are disclosed in Note 2.
(b) Principles of consolidation(i) SubsidiariesThe consolidated financial report incorporates the assets and liabilities of all subsidiaries of the Company as at 30 June 2010 and the results and cash flows of all subsidiaries for the year then ended.
Subsidiaries are all those entities (including special purpose entities) over which the Consolidated Entity has the power to govern the financial and operating policies, generally accompanying a shareholding of more than one-half of the voting rights. The existence of potential voting rights that are currently exercisable or convertible are considered when assessing whether the Consolidated Entity controls another entity.
Subsidiaries are fully consolidated from the date on which control is transferred to the Consolidated Entity. They are de-consolidated from the date that control ceases. The accounting policies of the new subsidiaries have been amended where necessary to match those of the Consolidated Entity.
The purchase method of accounting is used to account for the acquisition of subsidiaries by the Consolidated Entity (refer Note 1(cc)).
Non-controlling interests in the results and equity of subsidiaries are shown separately in the consolidated income statement and consolidated statement of financial position of the Consolidated Entity.
Investments in subsidiaries are accounted for at cost, less any impairment, in the parent entity.
(ii) iSOFT Group Employee Loan Plan The Consolidated Entity has formed iSOFT Group ELP Trust (the “Trust”) to administer the Consolidated Entity’s employee loan plan (ELP). The Trust is consolidated as the substance of the relationship is that the trust is controlled by the Consolidated Entity.
Shares held by the trust are disclosed as treasury shares and deducted from equity (refer Note 26).
(iii) Jointly controlled entitiesJointly controlled entities are those entities over whose activities the Consolidated Entity has joint control, established by contractual agreement and requiring unanimous consent for strategic financial and operating decisions. Jointly controlled entities are accounted for in the consolidated financial statements using the proportional consolidation method and are carried at cost by the parent entity.
Under the proportional consolidation method, the proportionate beneficial interest in the individual assets, liabilities and equity reserves are recognised in the consolidated statement of financial position and the proportionate beneficial interest in revenues and expenses are recognised in the consolidated income statement.
(iv)Transactions eliminated on consolidationInter-company transactions, balances and unrealised gains on transactions between subsidiaries in the Consolidated Entity are eliminated. Unrealised losses are also eliminated unless the transaction provides evidence of the impairment of the asset transferred.
Profits and losses on transactions establishing jointly controlled entities and transactions with the jointly controlled entities are eliminated to the extent of the Consolidated Entity’s ownership interest until such time as they are realised by the jointly controlled entities on consumption or sale, unless they relate to an unrealised loss that provides evidence of the impairment of an asset transferred.
55iSOFT Group Limited Annual Report 2010 Financial Report for the year ended 30 June 2010

(c) Segment reportingThe Consolidated Entity applies AASB 8 Operating Segments and determines its operating segments to be based on its geographical locations as this is the how the business is organised and reported internally. Operating segments are subject to risks and returns that are different to those of segments operating in other economic environments.
(d) Foreign currency translation (i) Functional and presentation currencyItems included in the financial statements of each of the Consolidated Entity’s subsidiaries and jointly controlled entities are measured using the currency of the primary economic environment in which they operate (“the functional currency”). The consolidated financial statements are presented in Australian Dollars, which is the Company’s functional and presentation currency.
(ii) Transaction and balancesForeign currency transactions are translated into the functional currency using the exchange rates prevailing at the date of the transactions. Foreign exchange gains and losses resulting from the settlement of such transactions and from the translation of year-end exchange rates of monetary assets and liabilities denominated in foreign currencies are recognised in the consolidated income statement, except where they are deferred in equity as qualifying cash flow hedges and qualifying net investment hedges or are attributable to part of the net investment in a foreign operation. Translation differences on assets and liabilities carried at fair value are reported as part of their fair value gain or loss.
The results and the financial position of all subsidiaries and jointly controlled entities (none of which has the currency of a hyperinflationary economy) that have a functional currency different from the presentation currency are translated into the presentation currency as follows:• assets and liabilities for each consolidated statement of financial
position presented are translated at the closing rate at the date of that consolidated statement of financial position
• income and expenses for each consolidated income statement are translated at average exchange rates (unless this is not a reasonable approximation of the cumulative effect of the rates prevailing on the transaction dates, in which case income and expenses are translated at the dates of the transactions), and
• all resulting foreign exchange differences are recognised in the foreign currency translation reserve in equity.
Goodwill and fair value adjustments arising on the acquisition of a foreign entity are treated as assets and liabilities of the foreign entities and translated at the closing rate.
(e) Revenue recognitionRevenue represents the fair value of consideration received or receivable from clients for goods and services provided by the Consolidated Entity, net of discounts and sales taxes.
Revenue from software sales is recognised when a signed contract exists, delivery to a customer has occurred with no significant vendor obligations remaining and where the collection of the resulting receivable is considered probable. In instances where a significant vendor obligation exists, revenue recognition is delayed until the obligation has been satisfied.
Revenue from implementation services is generally recognised on a percentage of completion basis over the duration of the implementation.
Revenue received in relation to support and maintenance services is initially credited to deferred revenue and is then recognised on a straight line basis over the life of the contract.
The National Programme for IT contract in the UK consists of a product development contract with additional development, implementation and maintenance services. Revenue for product development is recognised on a percentage of completion basis, as licence revenue. Revenue for additional development services and implementation is recognised as earned. Maintenance services are recognised on a straight line basis over the life of the maintenance and support component of the contract.
The Consolidated Entity enters into certain arrangements involving the delivery and implementation of a given software product against predetermined milestones and anticipated future maintenance and support. In arrangements where the revenue from the sale of product software licences is not clearly separable from the revenue for installation and services, then the revenue is recognised on a percentage completion basis over the period of implementation with due regard for future anticipated costs. Support revenues in such cases are recognised from implementation over the remaining period of the arrangement. Where a loss is expected to occur it is recognised immediately and a provision is made in relation to any future work or delivery of goods.
The Consolidated Entity also enters into bundled service arrangements whereby it agrees to make certain software applications available for the duration of the arrangement. As the fair values of the services deliverable and maintenance and support to be provided under such supply arrangements are not clearly separable from the software supply, total revenue in relation to the supply arrangements is recognised on a percentage of completion basis over the period of the arrangement.
Interest income is recognised on a time proportion basis using the effective interest method, including amortisation of any discount or premium. When a receivable is impaired, the Consolidated Entity reduces the carrying amount to its recoverable amount, being the estimated future cash flow discounted at the original effective interest rate of the instruments, and continues unwinding the discount as interest income. Interest income on impaired loans is recognised using the original effective interest rate.
notes to the Financial Statements cOnTinued
56 iSOFT Group Limited Annual Report 2010 Financial Report for the year ended 30 June 2010

Other revenue, including dividends, is recognised when it is received or when the right to receive payment is established. All revenue is stated net of the amount of goods and services tax (GST), value added tax (VAT) and any other similar taxes in the respective countries.
(f) Government grantsGrants from governments are recognised at their fair value where there is a reasonable assurance that the grant will be received and the Consolidated Entity will comply with all attached conditions.
Government grants relating to costs are deferred and recognised in the consolidated income statements over the period necessary to match them with the costs that they are intended to compensate.
Government grants relating to the purchase of property, plant and equipment are included in non-current liabilities as deferred income and are credited to the consolidated income statement on a straight line basis over the expected lives of the related assets.
(g) Income taxThe income tax expense or credit for the period is the tax payable on the current year’s taxable income based on the applicable income tax rate for each jurisdiction adjusted by changes in deferred tax assets and liabilities attributable to temporary differences and to unused tax losses where applicable.
Deferred income tax is provided in full, using the liability method, on temporary differences arising between the tax bases of assets and liabilities and their carrying amounts in the consolidated financial statements. However, the deferred income tax is not accounted for if it arises from initial recognition of an asset or liability in a transaction other than a business combination that at the time of the transaction affects neither accounting, nor taxable profit or loss. Deferred income tax is determined using tax rates (and laws) that have been enacted or substantially enacted by the reporting date and are expected to apply when the related deferred income tax asset is realised or the deferred income tax liability is settled.
Deferred tax assets are recognised for deductible temporary differences and unused tax losses only if it is probable that future taxable amounts will be available to utilise those temporary differences and losses.
(i) Tax consolidationThe Company and its wholly-owned Australian resident entities are part of a tax-consolidated group. As a consequence, all members of the tax-consolidated group are taxed as a single entity. The head entity within the tax-consolidated group is iSOFT Group Limited.
Current tax expense/income, deferred tax liabilities and deferred tax assets arising from temporary differences of the members of the tax-consolidated group are recognised in the separate financial
statements of the members of the tax-consolidated group using the ‘separate taxpayer within group’ approach by reference to the carrying amounts of assets and liabilities in the separate financial statements of each entity and the tax values applying under tax consolidation.
Any current tax liabilities (or assets) and deferred tax assets arising from unused tax losses of the subsidiaries are assumed by the head entity in the tax-consolidated group and are recognised by the Company as amounts payable (receivable) to/(from) other entities in the tax-consolidated group in conjunction with any tax funding arrangement amounts (refer below). Any difference between these amounts is recognised by the Company as an equity contribution or distribution.
The Company recognises deferred tax assets arising from unused tax losses of the tax-consolidated group to the extent that it is probable that future taxable profits of the tax-consolidated group will be available against which the asset can be utilised.
Any subsequent period adjustments to deferred tax assets arising from unused tax losses as a result of revised assessments of the probability of recoverability is recognised by the head entity only.
(ii) Nature of tax funding and tax sharing arrangementsThe head entity, in conjunction with other members of the tax-consolidated group, has entered into a tax funding arrangement which sets out the funding obligations of members of the tax consolidated group in respect of tax amounts.
The tax funding arrangements require payments to/from the head entity equal to the current tax liability/(asset) assumed by the head entity recognising an inter-entity receivable/(payable) equal in amount to the tax liability/(asset) assumed. The inter-entity receivables/ (payables) are at call.
Contributions to fund the current tax liabilities are payable as per the tax funding arrangement and reflect the timing of the head entity’s obligation to make payments for tax liabilities to the relevant tax authorities.
The head entity in conjunction with other members of the tax-consolidated group has also entered into a tax sharing agreement. The tax sharing agreement provides for the determination of the allocation of income tax liabilities between the entities should the head entity default on its tax payment obligations. No amounts have been recognised in the financial statements in respect of this agreement as payment of any amounts under the tax sharing agreement is considered remote.
57iSOFT Group Limited Annual Report 2010 Financial Report for the year ended 30 June 2010

(h) Cash and cash equivalentsFor cash flow statement presentation purposes, cash and cash equivalents includes cash on hand, deposits held at call with financial institutions, other short-term, highly liquid investments with original maturities of three months or less that are readily convertible to known amounts of cash and which are subject to an insignificant risk of changes in value. Bank overdrafts are shown within borrowings in current liabilities on the consolidated statement of financial position.
(i) Trade receivablesAll trade debtors are recognised at the amounts receivable as they are due for settlement by no more than 90 days, except where extended terms have been agreed.
Collectability of trade debtors is reviewed on an ongoing basis. Debts which are known to be uncollectible are written off. A provision for impairment of receivables is raised when some doubt as to collection exists.
(j) Loans and receivablesLoans and receivables are non-derivative financial assets with fixed or determinable payments that are not quoted in an active market and are stated at amortised cost using the effective interest rate method. The carrying amount of loans and receivables is reviewed annually to ensure it is not in excess of the recoverable amount from these assets. An asset’s carrying amount is written down immediately to its recoverable amount if the asset’s carrying amount is greater than its estimated recoverable amount (refer note 1 (s)).
(k) InventoriesFinished goods are stated at the lower of cost and net realisable value. Cost comprises purchase and delivery costs, net of rebates and discounts received or receivable. Costs of purchased inventory are determined after deducting rebates and discounts. Net realisable value is the estimated selling price in the ordinary course of business less the estimated costs of completion and the estimated costs necessary to make the sale.
(l) Derivative financial instrumentsThe Consolidated Entity has used derivative financial instruments to hedge its foreign currency exposures and interest rate exposures. Embedded derivatives are separated from the host contract and accounted for separately if the economic characteristics and risks of the host contract and the embedded derivative are not closely related, a separate instrument with the same terms as the embedded derivative would meet the definition of a derivative, and the combined instrument is not measured at fair value through profit or loss. Derivatives are recognised initially at fair value. Attributable transaction costs are recognised in profit or loss when incurred. Subsequent to initial recognition, derivatives are measured at fair value and changes therein are accounted for as described below in sections (m) and (n).
(m) Cash flow hedgesThe portion of the gain or loss on the hedging instrument that is determined to be an effective hedge is recognised directly in equity through the consolidated statement of changes in equity. The ineffective portion is recognised in profit or loss. When the forecast transaction results in the recognition of a non-financial asset or a non-financial liability (or a firm commitment to acquire or assume such an asset or liability) the associated gains or losses are either:• reclassified from equity during the period the asset is acquired or the
liability assumed affects profit or loss. Any portion not expected to be recovered in future periods is reclassified to profit or loss; or
• removed from equity and included in the carrying amount of the asset or liability.
(n) Fair value hedgesThe gain or loss from remeasuring the hedging instrument at fair value is recognised in profit or loss. The gain or loss on the hedged item adjusts the carrying amount of the item and is also recognised in profit or loss.
(o) Investments and other financial assetsInvestments and other financial assets are stated at the lower of their carrying amount and fair value less costs to sell. The fair values of quoted investments are based on current bid prices. For unlisted investments, the Consolidated Entity establishes fair value by using valuation techniques. These include the use of recent arms length transactions, reference to other instruments that are substantially the same, discounted cash flow analysis, and option pricing models. The carrying amount of investments and other financial assets is reviewed annually to ensure it is not in excess of the recoverable amount from these assets. An asset’s carrying amount is written down immediately to its recoverable amount if the asset’s carrying amount is greater than its estimated recoverable amount (refer note 1 (s)).
(p) Property, plant and equipmentEach class of property, plant and equipment is carried at cost or, if acquired through a business combination, at fair value less any accumulated depreciation. The carrying amount of property, plant and equipment is reviewed annually to ensure it is not in excess of the recoverable amount from these assets. An asset’s carrying amount is written down immediately to its recoverable amount if the asset’s carrying amount is greater than its estimated recoverable amount (refer note 1 (s)).
Depreciation is calculated on either a straight line or diminishing value basis as considered appropriate to write off the net cost (or revalued) amount of each item of property, plant and equipment over its expected useful life to the Consolidated Entity. The expected useful life of buildings is 3 to 20 years and purchased plant and equipment is 2 to 12 years. Where items of plant and equipment have separately identifiable components which are subject to regular replacement, those components are assigned useful lives distinct from the item of plant and equipment to which they now relate.
notes to the Financial Statements cOnTinued
58 iSOFT Group Limited Annual Report 2010 Financial Report for the year ended 30 June 2010

(q) LeasesA distinction is made between finance leases which effectively transfer from the lessor to the lessee substantially all the risks and benefits incident to ownership of leased non-current assets, and operating leases under which the lessor effectively retains substantially all such risks and benefits.
Finance leases are capitalised. A lease asset and liability are established at the present value of minimum lease payments. Lease payments are allocated between the principal component of the lease liability and the finance costs. The leased asset is depreciated on a straight line basis over the term of the lease, or where it is likely that the Consolidated Entity will obtain ownership of the asset, the life of the asset. Operating lease payments are charged to the consolidated income statement in the periods in which they are incurred, as this represents the pattern of benefits derived from the leased assets.
(r) Intangible assets(i) GoodwillGoodwill represents the excess of the cost of an acquisition over the fair value of the entity’s share of the net identifiable assets of the acquired subsidiary/associate at the date of acquisition. Goodwill on acquisitions of subsidiaries is included in intangible assets. Goodwill acquired in business combinations is not amortised. Instead, goodwill is tested for impairment annually, or more frequently if events or changes in circumstances indicate that it might be impaired, and is carried at cost less accumulated impairment losses. Gains and losses on the disposal of an entity include the carrying amount of goodwill relating to the entity sold.
(ii) Capitalised developmentExpenditure on research activities, undertaken with the prospect of obtaining new or scientific or technical knowledge and understanding, is recognised in the consolidated income statement as an expense when it is incurred.
Development activities involve the application of research findings or other knowledge to a plan or design for the production of new or substantially improved products or services before the start of commercial production or use. The bulk of the development activity of the Consolidated Entity relates to the development of software.
Development expenditure is capitalised only if development costs can be measured reliably, the product or process is technically and commercially feasible, future economic benefits are probable, and the Consolidated Entity intends to and has adequate resources to complete development and to use or sell the asset. The expenditure capitalised comprises all costs, including costs of materials, services and direct labour costs that are directly attributable to preparing the asset for its intended use. Other development expenditure is recognised in the consolidated income statement as expense incurred. Capitalised development expenditure stated at cost less accumulated amortisation
and impairment. Amortisation is calculated using the straight line method to allocate cost over the period of the expected benefit, which varies from 4 to 7 years.
(iii) Intellectual propertyIntellectual property is recognised at the cost on acquisition and has a finite useful life. Intellectual property is carried at cost less any accumulated amortisation and impairment losses. Amortisation is charged on a straight line basis over its useful life ranging from 5 to 20 years.
(iv) Customer contracts and relationshipsCustomer contracts and relationships are recognised at cost on acquisition and have a finite useful life. Customer contracts and relationships are carried at cost less any accumulated amortisation and impairment losses. Amortisation is charged on a straight line basis over their useful lives from 7 to 20 years.
(v) Patents and trademarksPatents and trademarks are recognised at cost on acquisition and have a finite useful life. Patents and trademarks are carried at cost less any accumulated amortisation and impairment losses. Amortisation is charged on a straight line basis over their useful lives of 5 years.
(s) Impairment of assets(i) Non financial assetsThe carrying amounts of the Consolidated Entity’s non financial assets and deferred tax assets, are reviewed at each reporting date to determine whether there is any indication of impairment. If any such indication exists then the asset’s recoverable amount is estimated.
Goodwill and intangible assets that have an indefinite useful life or that are not yet available for use are not subject to amortisation and are tested annually for impairment, or more frequently if events or changes in the circumstances indicate that they might be impaired. The recoverable amount is estimated each year at the same time.
The recoverable amount of an asset or cash-generating unit is the greater of its value in use and its fair value less costs to sell. In assessing value in use and fair value less costs to sell, the estimated future cash flows are discounted to their present value using a pre-tax discount rate that reflects current market assessments of the time value of money and the risks specific to the asset. For the purpose of impairment testing, assets are grouped together into the smallest group of assets that generate cash inflows from continuing use that are large independent of the cash inflows of other assets or groups of assets (the “cash-generating unit”). The goodwill acquired in a business combination, for the purpose of impairment testing, is allocated to cash-generating units that are expected to benefit from the synergies of the combination.
59iSOFT Group Limited Annual Report 2010 Financial Report for the year ended 30 June 2010

An impairment loss is recognised if the carrying amount of an asset or its cash-generating unit exceeds its recoverable amount. Impairment losses are recognised in profit or loss. Impairment losses recognised in respect of cash-generating units are allocated first to reduce the carrying amount of any goodwill allocated to the units and then to reduce the carrying amount of the other assets in the unit (group of units) on a pro rata basis.
An impairment loss in respect of goodwill is not reversed. In respect of other assets, impairment losses recognised in prior periods are assessed at each reporting date for any indications that the loss has decreased or no longer exists. An impairment loss is reversed if there has been a change in the estimates used to determine the recoverable amount. An impairment loss is reversed only to the extent that the asset’s carrying amount does not exceed the carrying amount that would have been determined, net of depreciation or amortisation, if no impairment loss had been recognised.
(ii) Financial assetsA financial asset is assessed at each reporting date to determine whether there is any objective evidence that it is impaired. A financial asset is considered to be impaired if objective evidence indicates that one or more events have had a negative effect on the estimated future cash flows of that asset.
An impairment loss in respect of a financial asset measured at amortised cost is calculated as the difference between its carrying amount, and the present value of the estimated future cash flows discounted at the original effect interest rate. An impairment loss in respect of an available-for-sale financial asset is calculated by reference to its fair value.
Individually significant financial assets are tested for impairment on an individual basis. The remaining financial assets are assessed collectively in groups that share similar credit risk characteristics.
All impairment losses are recognised in profit or loss. An impairment loss is reversed if the reversal can be related objectively to an event occurring after the impairment loss was recognised. For financial assets measured at amortised cost, the reversal is recognised in profit or loss.
(t) Trade and other payablesThese amounts represent liabilities for goods and services provided to the Consolidated Entity prior to the end of the financial year and which are unpaid. The amounts are unsecured and are usually paid within 30 days of recognition.
(u) BorrowingsBorrowings are initially recognised at fair value, net of transaction costs incurred. Borrowings are subsequently measured at amortised cost. Any difference between the proceeds (net of transaction costs) and the redemption amount is recognised in the consolidated income statement over the period of the borrowings using effective interest method. Fees paid on establishment of loan facilities, which are not an
incremental cost relating to the actual draw-down of the facility, are recognised as prepayments and amortised on a straight-line basis over the term of the facility. Borrowings are classified as current liabilities unless the Consolidated Entity has an unconditional right to defer settlement of the liability for at least 12 months after the reporting date.
(v) Compound financial instrumentsCompound financial instruments issued by the Consolidated Entity comprise convertible notes that can be converted to share capital at the option of the holder, and the number of shares to be issued does not vary with changes in their fair value. The liability component of a compound financial instrument is recognised initially at the fair value of a similar liability that does not have an equity conversion option. The equity component is recognised initially at the difference between the fair value of the compound financial instrument as a whole and the fair value of the liability component. This is recognised and included in equity, net of income tax effects. Any directly attributable transaction costs are allocated to the liability and equity components in proportion to their initial carry amounts.
Subsequent to initial recognition, the liability component of a compound financial instrument is measured at amortised cost using the effective interest method until extinguished on conversion or upon the instruments reaching maturity. The equity component of a compound financial instrument is not remeasured subsequent to initial recognition. Distributions to the convertible note holders are recognised against equity, net of any tax benefit, as the distributions are discretionary in nature on the basis that these are payable only when a dividend is paid to ordinary shareholders. Convertible notes do not have a mandatory conversion feature and are therefore excluded from basic EPS.
(w) Finance costsFinance costs are recognised as expenses in the period in which they are incurred, except where fees or charges are prepaid, in which case they are amortised over the period they relate to. Finance costs include interest on:– short term and long term borrowings– finance leases– defined benefit superannuation obligations
(x) ProvisionsProvisions are recognised when the Consolidated Entity has a present obligation (legal or constructive) as a result of a past event, it is probable the Consolidated Entity will be required to settle the obligation, and a reliable estimate can be made of the amount of the obligation. The amount recognised as a provision is the best estimate of the consideration required to settle the present obligation at reporting date, taking into account the risks and uncertainties surrounding the obligation.
notes to the Financial Statements cOnTinued
60 iSOFT Group Limited Annual Report 2010 Financial Report for the year ended 30 June 2010
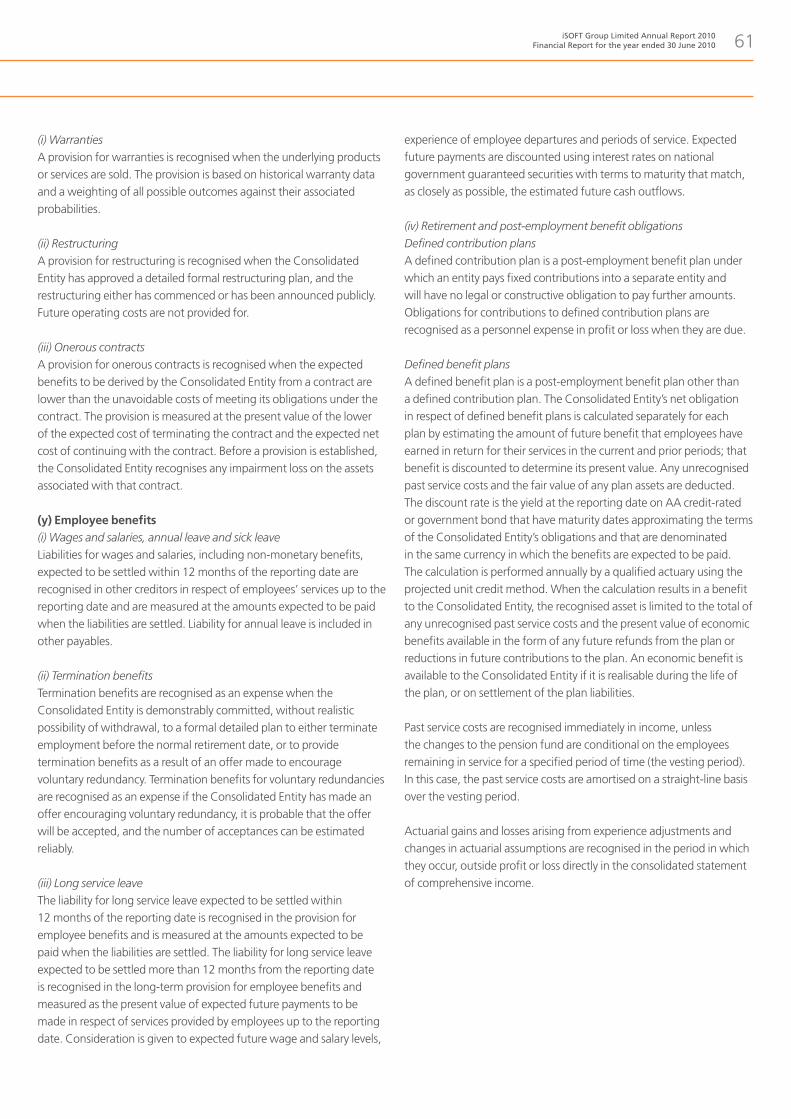
(i) WarrantiesA provision for warranties is recognised when the underlying products or services are sold. The provision is based on historical warranty data and a weighting of all possible outcomes against their associated probabilities.
(ii) RestructuringA provision for restructuring is recognised when the Consolidated Entity has approved a detailed formal restructuring plan, and the restructuring either has commenced or has been announced publicly. Future operating costs are not provided for.
(iii) Onerous contractsA provision for onerous contracts is recognised when the expected benefits to be derived by the Consolidated Entity from a contract are lower than the unavoidable costs of meeting its obligations under the contract. The provision is measured at the present value of the lower of the expected cost of terminating the contract and the expected net cost of continuing with the contract. Before a provision is established, the Consolidated Entity recognises any impairment loss on the assets associated with that contract.
(y) Employee benefits(i) Wages and salaries, annual leave and sick leaveLiabilities for wages and salaries, including non-monetary benefits, expected to be settled within 12 months of the reporting date are recognised in other creditors in respect of employees’ services up to the reporting date and are measured at the amounts expected to be paid when the liabilities are settled. Liability for annual leave is included in other payables.
(ii) Termination benefitsTermination benefits are recognised as an expense when the Consolidated Entity is demonstrably committed, without realistic possibility of withdrawal, to a formal detailed plan to either terminate employment before the normal retirement date, or to provide termination benefits as a result of an offer made to encourage voluntary redundancy. Termination benefits for voluntary redundancies are recognised as an expense if the Consolidated Entity has made an offer encouraging voluntary redundancy, it is probable that the offer will be accepted, and the number of acceptances can be estimated reliably.
(iii) Long service leaveThe liability for long service leave expected to be settled within 12 months of the reporting date is recognised in the provision for employee benefits and is measured at the amounts expected to be paid when the liabilities are settled. The liability for long service leave expected to be settled more than 12 months from the reporting date is recognised in the long-term provision for employee benefits and measured as the present value of expected future payments to be made in respect of services provided by employees up to the reporting date. Consideration is given to expected future wage and salary levels,
experience of employee departures and periods of service. Expected future payments are discounted using interest rates on national government guaranteed securities with terms to maturity that match, as closely as possible, the estimated future cash outflows.
(iv) Retirement and post-employment benefit obligationsDefined contribution plansA defined contribution plan is a post-employment benefit plan under which an entity pays fixed contributions into a separate entity and will have no legal or constructive obligation to pay further amounts. Obligations for contributions to defined contribution plans are recognised as a personnel expense in profit or loss when they are due.
Defined benefit plansA defined benefit plan is a post-employment benefit plan other than a defined contribution plan. The Consolidated Entity’s net obligation in respect of defined benefit plans is calculated separately for each plan by estimating the amount of future benefit that employees have earned in return for their services in the current and prior periods; that benefit is discounted to determine its present value. Any unrecognised past service costs and the fair value of any plan assets are deducted. The discount rate is the yield at the reporting date on AA credit-rated or government bond that have maturity dates approximating the terms of the Consolidated Entity’s obligations and that are denominated in the same currency in which the benefits are expected to be paid. The calculation is performed annually by a qualified actuary using the projected unit credit method. When the calculation results in a benefit to the Consolidated Entity, the recognised asset is limited to the total of any unrecognised past service costs and the present value of economic benefits available in the form of any future refunds from the plan or reductions in future contributions to the plan. An economic benefit is available to the Consolidated Entity if it is realisable during the life of the plan, or on settlement of the plan liabilities.
Past service costs are recognised immediately in income, unless the changes to the pension fund are conditional on the employees remaining in service for a specified period of time (the vesting period). In this case, the past service costs are amortised on a straight-line basis over the vesting period.
Actuarial gains and losses arising from experience adjustments and changes in actuarial assumptions are recognised in the period in which they occur, outside profit or loss directly in the consolidated statement of comprehensive income.
61iSOFT Group Limited Annual Report 2010 Financial Report for the year ended 30 June 2010

The Consolidated Entity has applied the pronouncement in accordance with IFRIC 14, AASB 119 – The Limit on a Defined Benefit Asset, Minimum Funding Requirements and their Interaction. This interpretation sets out when refunds or reductions in future contributions to a defined benefit scheme should be regarded as available in accordance with AASB 119 Employee Benefits, how a minimum funding requirement might affect the availability of reductions in future contributions and when a minimum funding requirement might give rise to a liability. In accordance with the Consolidated Entity’s accounting policy for defined benefit plans under AASB 119, the movement in the irrecoverable element of the minimum funding requirement is taken directly to the consolidated statement of comprehensive income.
(v) Other post-employment defined benefit plansThe Consolidated Entity’s net obligation in respect of other long-term post-employment employee benefits other than retirement defined benefit plans is the amount of future benefit that employees have earned in return for their service in the current and prior periods plus related on-costs; that benefit is discounted to determine its present value, and the fair value of any related assets is deducted. The discounted rate is the yield at the reporting date on AA credit-rated or government bonds that have maturity dates approximating the terms of the Consolidated Entity’s obligations. The calculation is performed using the projected unit credit method. Any actuarial gains or losses are recognised in the consolidated statement of comprehensive income (refer Note 23).
(vi) Share-based paymentsShare-based compensation benefits are equity settled and are provided to employees via the iSOFT Group Employee Loan Plan and Employee Incentive Plan (refer note 39).
The fair value of shares and options granted is recognised as an employee benefit expense with a corresponding increase in equity. The fair value is measured at grant date and recognised over the period during which the employees become unconditionally entitled to the shares.
The fair value at grant date is independently determined using option pricing models that takes into account the exercise price, the term of the share, the vesting and performance criteria, the impact of dilution, the non-tradeable nature of the share, the share price at grant date and expected price volatility of the underlying share, the expected dividend yield and the risk-free interest rate for the term of the share.
At each reporting date, the Consolidated Entity revises its estimate of the number of equity instruments expected to vest. The impact of the revision of the original estimates, if any, is recognised in profit or loss over the remaining vesting period, with a corresponding adjustment to the options reserve.
(vii) Bonus plansThe Consolidated Entity recognises a liability and expense for bonuses on a formula that takes into consideration the profit attributable to the Company’s shareholders after certain adjustments. Such obligations are measured on an undiscounted basis and are expensed as the related service is provided. The Consolidated Entity recognises a provision where contractually obliged or where there is a past practice that has created a constructive obligation to pay this amount as a result of past service provided by the employee and the obligation can be estimated reliably.
(z) Contributed equityOrdinary shares are classified as equity. Incremental costs directly attributable to the issue of new shares or options are shown in equity as a deduction, net of tax, from the proceeds. Incremental costs directly attributable to the acquisition of a business are included in the cost of the acquisition as part of the purchase consideration.
(aa) Treasury sharesOwn equity instruments which are purchased and held by the iSOFT Group ELP Trust to meet future distributions to employees under the Consolidated Entity’s share option and share award schemes are deducted from contributed equity. In the Company’s financial report the transactions of the Company sponsored employee share plan trust are treated as being executed directly by the Trust.
When share capital recognised as equity is purchased by the employee share plan trust, the amount of the consideration paid, which includes directly attributable costs, is net of any tax effects, and is recognised as a deduction from equity. Purchased shares are classified as treasury shares and are presented as a deduction from contributed equity. When treasury shares are sold subsequently, the amount received is recognised as an increase in contributed equity, and the resulting surplus or deficit on the transaction is transferred to/from retained earnings. No gain or loss on the purchase, sale, issue or cancellation of the Consolidated Entity’s own equity instruments is recognised.
(bb) DividendsProvision is made for the amount of any dividend declared, being appropriately authorised and no longer at the discretion of the company, on or before the end of the financial year but not distributed at balance date.
(cc) Business combinations Subsequent to 1 July 2009Business combinations are accounted for using the acquisition method. The consideration transferred in a business combination is measured at fair value, which is calculated as the sum of the acquisition date fair values of the assets transferred by the acquirer, the liabilities assumed by the acquirer to former owners of the acquiree and the equity issued by the acquirer, and the amount of any non-controlling interest in the acquiree. For each business
notes to the Financial Statements cOnTinued
62 iSOFT Group Limited Annual Report 2010 Financial Report for the year ended 30 June 2010

combination, the acquirer measures the non-controlling interest in the acquiree at the proportionate share of the acquiree’s identifiable net assets. Acquisition-related costs are expensed as incurred.
When the Consolidated Entity acquires a business, it assesses the financial assets and liabilities assumed for appropriate classification and designation in accordance with the contractual terms, economic conditions, the Consolidated Entity’s operating or accounting policies and other pertinent conditions as at the acquisition date. This includes the separation of embedded derivatives in host contracts of the acquiree. If the business combination is achieved in stages, the acquisition date fair value of the acquirer’s previously held equity interest in the acquiree is remeasured at fair value as at the acquisition date through profit or loss.
Any contingent consideration to be transferred by the acquirer will be recognised at fair value at the acquisition date. Subsequent changes to the fair value of the contingent consideration, which is deemed to be a liability, will be recognised in accordance with AASB 139 in the consolidated income statement. If the contingent consideration is classified as equity, it is not remeasured.
Prior to 1 July 2009The purchase method of accounting was used to account for all business combinations, including business combinations involving entities or businesses under common control, regardless of whether equity instruments or other assets were acquired. The consideration transferred in a business combination was measured at fair value, which was calculated as the sum of the acquisition date fair values of the assets transferred by the acquirer, the liabilities assumed by the acquirer to former owners of the acquiree and the equity issued by the acquirer. Where equity instruments were issued in an acquisition, the fair value of the instruments was their published market price as at the date of exchange unless, in rare circumstances, it can be demonstrated that the published price at date of exchange was an unreliable indicator of fair value and that other evidence and valuation methods provided a more reliable measure of fair value. Transaction costs arising on the issue of equity instruments were recognised directly in equity.
Identifiable assets acquired and liabilities and contingent liabilities assumed in a business combination were measured initially at their fair values at the acquisition date, irrespective of the extent of any non-controlling interest. The excess of the cost of acquisition over the fair value of the Consolidated Entity’s share of the identifiable net assets acquired was recorded as goodwill (refer to note 1(r) ). If the cost of acquisition was less than the Consolidated Entity’s share of the fair value of the identifiable net assets of the subsidiary acquired, the difference was recognised directly in the consolidated income statement, but only after reassessment of the identification and measurement of the net assets acquired.
Where settlement of any part of cash consideration was deferred, the amounts payable in the future were discounted to their present value as at the date of exchange. The discount rate used is the entity’s incremental borrowing rate, being the rate at which similar borrowing could be obtained from an independent financier under comparable terms and conditions. Any contingent consideration to be transferred by the acquirer was recognised at fair value at the acquisition date. Contingent consideration from a business combination that occurred before the effective date of AASB 3 Revised was not restated.
Acquisitions from entities under common controlBusiness combinations arising from transfers of interests in entities that are under the control of the shareholder that controls the Consolidated Entity were accounted for as if the acquisition had occurred at the beginning of the earliest comparative period presented or, if later, at the date that common control was established; for this purpose comparatives were restated. The assets and liabilities acquired were recognised at the carrying amounts recognised previously in the Consolidated Entity’s controlling shareholder’s consolidated financial statements. The components of equity of the acquired entities were added to the same components within Consolidated Entity equity. Any cash paid for the acquisition was recognised directly in equity.
(dd) Earnings per share(i) Basic earnings per shareBasic earnings per share is calculated by dividing the profit attributable to equity holders of the Company, excluding any costs of servicing equity other than ordinary shares, by the weighted average number of ordinary shares outstanding during the financial year, adjusted for bonus elements in ordinary shares issued during the year and excluding treasury shares (refer Note 37).
(ii) Diluted earnings per shareDiluted earnings per share adjusts the figures used in the determination of basic earnings per share to take into account the after income tax effect of interest and other financing costs associated with dilutive potential ordinary shares and the weighted average number of shares that would have been outstanding assuming the conversion of all dilutive potential ordinary shares.
(ee) Goods and Services Tax (GST) and Value Added Tax (VAT) Revenues, expenses and assets are recognised net of the amount of associated GST/VAT, unless the GST/VAT incurred is not recoverable from the taxation authorities. In this case it is recognised as part of the cost of acquisition of the asset or as part of the expense.
Receivables and payables are stated inclusive of the amount of GST/VAT receivable or payable. The net amount of GST/VAT recoverable from, or payable to, taxation authorities is included in other receivables or other payables in the consolidated statement of financial position.
63iSOFT Group Limited Annual Report 2010 Financial Report for the year ended 30 June 2010

Cash flows are presented on a gross basis. The GST/VAT components of cash flows arising from investing or financing activities which are recoverable from, or payable to taxation authorities, are presented as operating cash flows.
(ff) Determination of fair valueA number of the Consolidated Entity’s accounting policies and disclosures require the determination of fair value, for both financial and non-financial assets and liabilities. Fair values have been determined for measurement and/or disclosure purposes based on the following methods. When applicable, further information about the assumptions made in determining fair value is disclosed in the notes specific to that asset or liability.
(i) IntangiblesThe fair value of patents and trademarks acquired in a business combination is based on the discounted estimated royalty payments that have been avoided as a result of the patent or trademark being owned. The fair value of customer relationships acquired in a business combination is determined using the multi-period excess earnings method, whereby the subject asset is valued after deducting a fair return on all other assets that are part of creating the related cash flows. The fair value of other intangible assets including goodwill is based on the discounted cash flows expected to be derived from the use or in rare occasion eventual sale of the assets.
(ii) InventoriesThe net realisable value of inventories is determined based on its estimated selling price in the ordinary course of business less the estimated costs of completion and sale, and a reasonable profit margin based on the effort required to complete and sell the inventories.
(iii) Trade and other receivablesThe fair value of trade and other receivables, excluding construction work in progress, but including service concession receivables, is estimated as the present value of future cash flows, discounted at the market rate of interest at the reporting date.
(iv) DerivativesThe fair value of forward exchange contracts is based on their listed market price, if available. If a listed market price is not available, then fair value is estimated by discounting the difference between the contractual forward price and the current forward price for the residual maturity of the contract using a risk-free interest rate (based on government bonds). The fair value of interest rate swaps is based on broker quotes. Those quotes are tested for reasonableness by discounting estimated future cash flows based on the terms and maturity of each contract and using market interest rates of a similar instrument at the measurement date.
(v) Non-derivative financial liabilitiesFair value, which is determined for disclosure purposes, is calculated
based on the present value of future principal and interest cash flows, discounted at the market rate of interest at the reporting date. In respect of the liability component of convertible notes, the market rate of interest is determined by reference to similar liabilities that do not have a conversion option. For finance leases the market rate of interest is determined by reference to similar lease agreements.
(vi) Share-based payment transactionsThe fair value of employee share options is measured using a binomial lattice model for EPS hurdled options and using the Monte Carlo simulation model for SPG or TSR hurdled options (refer Note 39). The same valuation techniques have been used in determining grant date fair value of in substance options such as shares granted under the limited recourse loan plan. Measurement inputs include share price on measurement date, exercise price of the instrument, expected volatility (based on weighted average historic volatility adjusted for changes expected due to publicly available information), weighted average expected life of the instruments (based on historical experience and general option holder behaviour), expected dividends, and the risk-free interest rate (based on government bonds). Service and non-market performance conditions attached to the transactions are not taken into account in determining fair value.
(vii) Financial guaranteesFor financial guarantee contract liabilities, the fair value at initial recognition is determined using a probability weighted discounted cash flow approach. This method takes into account the probability of default by the guaranteed party over the term of the contract, the loss given default (being the proportion of the exposure that is not expected to be recovered in the event of default) and exposure at default (being the maximum loss at the time of default).
(gg) New accounting standards and interpretation in issue not yet adopted The following standards, amendments to standards and interpretations have been identified as those which may impact the Consolidated Entity in the period of initial application. They are accounting standards issued but not yet effective as at 30 June 2010.
• AASB 2009-5 Further Amendments to Australian Accounting Standards arising from the Annual Improvements Project [AASB 5, 101, 107, 117, 118, 136 & 139] (effective from 1 January 2010). The amendments to some Standards result in accounting changes for presentation, recognition or measurement purposes, while some amendments that relate to terminology and editorial changes are expected to have no or minimal effect on accounting except for the following:
• The amendment to AASB 117 removes the specific guidance on classifying land as a lease so that only the general guidance remains. Assessing land leases based on the general criteria may result in more land leases being classified as finance leases and if so, the type of asset which is to be recorded (intangible vs. property, plant and equipment) needs to be determined.
notes to the Financial Statements cOnTinued
64 iSOFT Group Limited Annual Report 2010 Financial Report for the year ended 30 June 2010

• The amendment to AASB 101 stipulates that the terms of a liability that could result, at anytime, in its settlement by the issuance of equity instruments at the option of the counterparty do not affect its classification.
• The amendment to AASB 107 explicitly states that only expenditure that results in a recognised asset can be classified as a cash flow from investing activities.
• The amendment to AASB 118 provides additional guidance to determine whether an entity is acting as a principal or as an agent. The features indicating an entity is acting as a principal are whether the entity:
i. has primary responsibility for providing the goods or service;
ii. has inventory risk; iii. has discretion in establishing prices; iv. bears the credit risk. • The amendment to AASB 136 clarifies that the largest unit
permitted for allocating goodwill acquired in a business combination is the operating segment, as defined in AASB 8 before aggregation for reporting purposes.
• The main change to AASB 139 clarifies that a prepayment option is considered closely related to the host contract when the exercise price of a prepayment option reimburses the lender up to the approximate present value of lost interest for the remaining term of the host contract.
• The other changes clarify the scope exemption for business combination contracts and provide clarification in relation to accounting for cash flow hedges.
The Consolidated Entity has not yet determined the potential effect of the amendment.
• AASB 2009-8 Amendments to Australian Accounting Standards – Group Cash-Settled Share Based Payment Transactions [AASB 2] (effective from 1 January 2010) The amendments made by the AASB to AASB 2 confirm that an entity receiving goods or services in a group share-based payment arrangement must recognise an expense for those goods or services regardless of which entity in the group settles the transaction or whether the transaction is settled in shares or cash. They also clarify how the Consolidated Entity share-based payment arrangement should be measured, that is, whether it is measured as an equity or a cash-settled transaction. The Consolidated Entity will apply these amendments retrospectively for the financial reporting period commencing on 1 July 2010. There will be no impact on the Consolidated Entity’s financial report.
• AASB 2009-10 Amendments to Australian Accounting Standards – Classification of Rights Issues [AASB 132] (effective from 1 February 2010) In October 2009, the AASB issued an amendment to AASB 132 Financial Instruments: Presentation which addresses the accounting for rights issues that are denominated in a currency other than the functional currency of the issuer. Provided certain conditions are met, such rights issues are now classified as equity regardless of the currency in which the exercise price
is denominated. Previously, these issues had to be accounted for as derivative liabilities. The amendment must be applied retrospectively in accordance with AASB 108 Accounting Policies, Changes in Accounting Estimates and Errors. The Consolidated Entity will apply the amended standard from 1 July 2010. As the Consolidated Entity has not made any such rights issues, the amendment will not have any effect on the Consolidated Entity’s financial report.
• AASB 9 Financial Instruments and AASB 2009-11 Amendments to Australian Accounting Standards arising from AASB 9 (effective from 1 January 2013) AASB 9 Financial Instruments addresses the classification and measurement of financial assets and is likely to affect the Consolidated Entity’s accounting for its financial assets. The standard is not applicable until 1 January 2013 but is available for early adoption. The Consolidated Entity is yet to assess its full impact. However, initial indications are that it is unlikely to materially affect the Consolidated Entity’s accounting for its financial assets. The Consolidated Entity has not yet decided when to adopt AASB 9.
• Revised AASB 124 Related Party Disclosures and AASB 2009-12 Amendments to Australian Accounting Standards (effective from 1 January 2011) In December 2009, the AASB issued a revised AASB 124 Related Party Disclosures. It is effective for accounting periods beginning on or after 1 January 2011 and must be applied retrospectively. The amendment removes the requirement for government-related entities to disclose details of all transactions with the government and other government-related entities and clarifies and simplifies the definition of a related party. The Consolidated Entity will apply the amended standard from 1 July 2011. When the amendments are applied, the Consolidated Entity will need to disclose any transactions between its subsidiaries and its jointly controlled entities. However, it has yet to put systems into place to capture the necessary information. It is therefore not possible to disclose the financial impact, if any, of the amendment on the related party disclosures.
• Revised AASB 8 Operating Segments and AASB 2009 -12 Amendments to Australian Accounting Standards (effective from 1 January 2011). In December 2009, the AASB issued a revised AASB 8 Operating Segments. The amendment makes numerous editorial changes to a range of Australian Accounting Standards and Interpretations. In particular, it amends AASB 8 Operating Segments to require an entity to exercise judgment in assessing whether a government and entities known to be under the control of that government are considered a single customer for
the purposes of certain operating segment disclosures. It also makes numerous editorial amendments to a range of Australian Accounting Standards and Interpretations, including amendments to reflect changes made to the text of IFRSs by the IASB. The Consolidated Entity has not yet determined the potential effect of the amendment.
65iSOFT Group Limited Annual Report 2010 Financial Report for the year ended 30 June 2010

• AASB Interpretation 19 Extinguishing financial liabilities with equity instruments and AASB 2009-13 Amendments to Australian Accounting Standards arising from Interpretation 19 (effective from 1 July 2010). AASB Interpretation 19 clarifies the accounting when an entity renegotiates the terms of its debt with the result that the liability is extinguished by the debtor issuing its own equity instruments to the creditor (debt for equity swap). It requires a gain or loss to be recognised in profit or loss which is measured as the difference between the carrying amount of the financial liability and the fair value of the equity instruments issued. The Consolidated Entity will apply the interpretation from 1 July 2010. It is not expected to have any impact on the Consolidated Entity’s financial statements since it is only retrospectively applied from the beginning of the earliest period presented (1 July 2009) and the Consolidated Entity has not entered into any debt for equity swaps since that date.
• AASB 2009-14 Amendments to Australian Interpretation – Prepayments of a Minimum Funding Requirement (effective from 1 January 2011). In December 2009, the AASB made an amendment to Interpretation 14 The Limit on a Defined Benefit Asset, Minimum Funding Requirements and their Interaction. The amendment removes an unintended consequence of the interpretation related to voluntary prepayments when there is a minimum funding requirement in regard to the Consolidated Entity’s defined benefit scheme. It permits entities to recognise an asset for a prepayment of contributions made to cover minimum funding requirements. The Consolidated Entity does not make any such prepayments. The amendment is therefore not expected to have any impact on the Consolidated Entity’s financial statements. The Consolidated Entity intends to apply the amendment from 1 July 2011.
• AASB 2010-3 Further Amendments to Australian Accounting Standards arising from the Annual Improvements Project [AASB3, AASB7, AASB 121, AASB128, AASB131, AASB 132 and AASB 139]. The amendments are summarised as below and will be effective from 1 July 2010:
• Limit the scope of the measurement choices of non-controlling interest at proportionate share of net assets in the event of liquidation. Other components of NCI are measured at fair value.
• Requires an entity (in a business combination) to account for the replacement of the acquiree’s share-based payment transactions (whether obliged or voluntarily), i.e., split between consideration and post combination expenses.
• Clarifies that contingent consideration from a business combination that occurred before the effective date of AASB 3 Revised is not restated.
• Eliminates the requirement to restate financial statements for a reporting period when significant influence or joint control is lost and the reporting entity accounts for the remaining investment under AASB 139. This includes the effect on accumulated foreign exchange differences on such investments.
The Consolidated Entity has not yet determined the potential effect of the amendments.
• AASB 2010-4 Further Amendments to Australian Accounting Standards arising from the Annual Improvements Project [AASB 7 and AASB 134]. In April 2010, the AASB made amendments to AASB7 Financial Instrument: Disclosure and AASB 134 Interim Financial Reporting, and is effective from 1 July 2011. Listed below are the summaries:
• Emphasises the interaction between quantitative and qualitative AASB 7 disclosures and the nature and extent of risks associated with financial instruments.
• Provides guidance to illustrate how to apply disclosure principles in AASB 134 for significant events and transactions
The Consolidated Entity has not yet determined the potential effect of the amendments for interim reporting at the half year.
Note 2. Critical accounting estimates and judgementsThe preparation of a financial report in conformity with Australian Accounting Standards requires Management to make judgements, estimates and assumptions that affect the application of accounting policies and reported amounts of assets, liabilities, income and expenses. The estimates and associated assumptions are based on historical experience and various other factors, including expectations of future events that may have a financial impact on the Consolidated Entity and that are believed to be reasonable under the circumstances, the results of which form the basis of making judgements about carrying values of assets and liabilities that are not readily apparent from other sources.
The Consolidated Entity makes estimates and assumptions concerning the future. The resulting accounting estimates will, by definition, seldom equal the related actual results. In preparing this consolidated financial report of the Consolidated Entity, the significant judgements made by Management in applying accounting policies were the same as those that applied to the financial report for the comparative period.
The Consolidated Entity assesses impairment at each reporting date by evaluating conditions specific to the Consolidated Entity that may lead to impairment of assets. Where an impairment trigger exists, the recoverable amount of the asset is determined. Fair value less cost to sell calculations performed in assessing recoverable amounts incorporate a number of key estimates. Should the projected turnover figures differ significantly from the budgeted figures incorporated in the fair value less cost to sell calculations then an impairment loss would be recognised, up to the maximum carrying value of goodwill and intangibles at 30 June 2010.
Accrued revenue represents earned revenue which has been calculated on a percentage of completion basis and which has not yet been invoiced. The calculation of revenue recognised on a percentage of completion basis over the period of installation,
notes to the Financial Statements cOnTinued
66 iSOFT Group Limited Annual Report 2010 Financial Report for the year ended 30 June 2010

implementation and provision of services requires accurate forecasts of costs to completion which are generally difficult to ascertain and are therefore subject to judgement.
The Consolidated Entity’s largest customer contract is with Computer Sciences Corporation (“CSC”) in relation to the deployment of the National Programme for IT (NPfIT) for the National Health Service (NHS) in England. The contract with CSC consists of a product development contract with additional development services, implementation and maintenance services. Revenue for product development is booked as earned and on a percentage of completion basis, as licence revenue. Revenue for additional development services and implementation is booked as earned. Maintenance services will be booked on a straight line basis over the life of the maintenance and support component of the contract. Refer accounting policy Note 1 (e). The CSC Contract contributed approximately 16.8% (2009: 23.5%) to the Consolidated Entity’s total revenue in the year to 30 June 2010. The CSC Contract is primarily a time and materials contract with a set of arrangements regarding the timing and delivery of Lorenzo modules. The revenue recognised is based on estimation of future cost to expected completion and inflation rates have been assumed for the relevant period. If CSC were to terminate the CSC Contract for failure of the Consolidated Entity to meet material obligations under the CSC Contract or if there were material disputes regarding obligations, including scope of delivery or payments, these could have an adverse effect on the Consolidated Entity’s operating and financial performance.
Apart from CSC, the largest customer of the Consolidated Entity, the Consolidated Entity does not have significant credit risk exposure to any single counterparty or any group of counterparties having similar characteristics. The Consolidated Entity defines counterparties as having similar characteristics if they are related entities. Concentration of credit risk related to CSC did not exceed 20% of gross monetary assets at any time during the year. Concentration of credit risk to any other counterparty did not exceed 5% of gross monetary assets at any time during the year.
Note 3. Segment informationThe Consolidated Entity has implemented AASB 8 Operating segments with effect from 1 July 2009. AASB 8 requires operating segments to be identified on the basis of internal reports about components of the entity which are regularly reviewed by the ‘chief operating decision maker’ (determined by iSOFT to be the Board of Directors) in order to allocate resources to the segments and to assess their performance. The Consolidated Entity operates in various geographical regions and for the purposes of risk management procedures and internal reporting to the CODM, reports the various geographical countries together into segments according to their location and economic characteristics. Each operating segment has a segment manager who reports into the CODM and is responsible for the reporting of the financial results. Applying the new requirements
of AASB 8 has led to operating segments being determined to exist at a lower geographical level than previously reported under the requirements of AASB 114. Comparative information has been restated to reflect the current reportable segments.
Each reportable segment below includes earnings derived from development and licensing of computer software and the supply of services to the health industry.
UKI – United Kingdom and IrelandCE – Central EuropeSELA – Southern Europe and Latin AmericaANZ – Australia and New ZealandOther – The remaining operations of the Consolidated Entity are aggregated and included within the ‘Other’ category to reconcile to the consolidated results. This also includes intersegment and eliminations not allocated to other operating segments.
Segment revenues, expenses and results include transfers between segments. Such transfers are priced on an arm’s length basis and are eliminated on consolidation. Segment results include items directly attributable to a segment as well as those that can be allocated on a reasonable basis.
Performance is measured based on EBITDA (refer Note 7) which is defined as the operating profit or loss before depreciation, amortisation, net finance expense and taxation. EBITDA is considered to be a useful measure of the operating performance of the different segments because it reflects the underlying cash by eliminating depreciation and amortisation. Amortisation is recognised and allocated on the basis of the location of where future economic benefits are expected to flow. Finance costs are not allocated to the reportable segments as this cost is managed by the treasury function which manages the overall net debt position of the group. Similarly, tax expense is not allocated as this is managed by the Group Tax function centrally. Group costs are allocated in proportion to the amount of revenue they generate as this most accurately matches the cash flows which are generated in each operating segment. The allocation of Group R&D costs has changed this year. Previously Group R&D costs were allocated in proportion to a reasonable estimate of usage consumption. In 2010 this has changed to being allocated on the basis of direct effort expended on each product according to where those products earn revenue. The 2009 allocation has not been restated.
67iSOFT Group Limited Annual Report 2010 Financial Report for the year ended 30 June 2010

notes to the Financial Statements cOnTinued
68 iSOFT Group Limited Annual Report 2010 Financial Report for the year ended 30 June 2010
Note 3. Segment information - continued
Sales to external customers 186,443 105,041 63,510 21,951 53,568 430,513
Other income 2,845 144 124 22 57 3,192
Gain on sale of land and buildings - - - - 1,200 1,200
Total segment revenue 189,288 105,185 63,634 21,973 54,825 434,905
% of total revenue 44% 24% 15% 5% 13% 100%
RBU contribution 101,258 30,023 24,117 7,270 12,218 174,886
Group R&D allocated 1 (31,997) (9,635) (9,635) (1,676) (11,729) (64,672)
Group costs allocated 2 (32,409) (18,258) (11,039) (3,816) (9,308) (74,830)
Adjusted segment EBITDA pre exceptional items 36,852 2,130 3,443 1,778 (8,819) 35,384
Restructuring (1,505) (980) (1,982) (215) (293) (4,975)
Other 3 1,952 - (2,300) - - (348)
Segment EBITDA 37,299 1,150 (839) 1,563 (9,112) 30,061
EBITDA margin % 20% 1% -1% 7% -17% 7%
Impairment 4 (110,493) (50,374) (63,088) (721) (116,383) (341,059)
Depreciation (1,653) (1,032) (1,977) (1,013) (1,219) (6,894)
Amortisation 5 (17,553) (5,856) (10,034) (1,341) (2,369) (37,153)
Segment result (92,400) (56,112) (75,938) (1,512) (129,083) (355,045)
Finance costs (21,350)
Income tax expense (6,519)
Loss for the year (382,914)
Total assets 286,935 171,938 116,131 96,941 85,581 757,526
Total liabilities (297,994) (51,186) (93,557) (13,842) (36,489) (493,068)
Australia and New Zealand
$’000
Southern Europe and
Latin America
$’000
UnitedKingdom
and Ireland$’0002010
CentralEurope
$’000Other$’000
Consolidated $’000
1. Research and development costs expensed during the year.
2. Group costs include Corporate Head Office and other global costs.
3. Other exceptional items relate to: in UK & Ireland this is a reversal of the FSA provision no longer required, in ANZ these include litigation and other settlement provision
(refer to Note 20).
4. Impairment includes goodwill acquired arising from acquisitions (refer Note 15).
5. Amortisation includes acquired intangibles amortisation arising from acquisitions and other intangibles.

69iSOFT Group Limited Annual Report 2010 Financial Report for the year ended 30 June 2010
Note 3. Segment information - continued
Sales to external customers 268,840 122,693 62,997 20,119 64,202 538,851
Other income 191 400 452 50 180 1,273
Total segment revenue 269,031 123,093 63,449 20,169 64,382 540,124
% of total revenue 50% 23% 12% 4% 12% 100%
RBU contribution 152,165 40,467 25,630 4,945 28,759 251,966
Group R&D allocated 1 (45,729) (2,847) (6,627) (467) (10,604) (66,274)
Group costs allocated 2 (26,594) (12,137) (6,232) (1,990) (6,351) (53,304)
Adjusted segment EBITDA pre exceptional items 79,842 25,483 12,771 2,488 11,804 132,388
Other 3 - - - - - -
Segment EBITDA 79,842 25,483 12,771 2,488 11,804 132,388
EBITDA margin % 30% 21% 20% 12% 18% 25%
Depreciation (2,179) (744) (1,312) (148) (3,968) (8,351)
Amortisation 4 (21,747) (9,472) (6,655) (1,541) (6,197) (45,612)
Segment result 55,917 15,267 4,804 799 1,638 78,425
Finance costs (34,006)
Income tax expense (9,688)
Profit for the year 34,731
Total assets 522,845 274,117 187,008 110,423 205,708 1,300,101
Total liabilities (338,033) (66,619) (97,651) (16,031) (40,029) (558,563)
Australia and New Zealand
$’000
Southern Europe and
Latin America
$’000
UnitedKingdom
and Ireland$’0002009
CentralEurope
$’000Other$’000
Consolidated $’000
1. Research and development costs expensed during the year.
2. Group costs include Corporate Head Office and other global costs.
3. There were no exceptional items in the comparative period.
4. Amortisation includes acquired intangibles amortisation arising from acquisitions and other intangibles. There was no impairment in the comparative period.

notes to the Financial Statements cOnTinued
Revenue by products and services
Revenue split by products and services is shown in note 4 together with comparatives.
Geographic information
Australia is the Consolidated Entity’s country of domicile. The geographic analysis of revenue is on the basis of the country of origin in which the customer
is invoiced.
70 iSOFT Group Limited Annual Report 2010 Financial Report for the year ended 30 June 2010
Note 3. Segment information - continued
PPE 2,140 1,684 2,231 136 3,469 9,660
Intangible assets 22,736 10,877 9,130 2,770 8,165 53,678
Capital expenditure 24,876 12,561 11,361 2,906 11,634 63,338
Year ended 30 June 2009
PPE 1,735 1,727 7,843 657 2,123 14,085
Intangible assets 14,118 3,848 2,244 186 7,032 27,428
Capital expenditure 15,853 5,575 10,087 843 9,155 41,513
United Kingdom and Ireland 1 218,109 305,328
Central Europe 105,041 122,693
Australia 56,749 55,374
Southern Europe and Latin America 21,951 20,119
Asia, Middle East and Africa 20,104 27,714
New Zealand 6,761 7,623
North America 1,798 -
Total 430,513 538,851
Australia and New Zealand
Southern Europe and
Latin America
UnitedKingdom
and Ireland
Capital expenditure Year ended 30 June 2010
External RevenueAt 30 June
CentralEurope Other
2010$’000
Consolidated
2009$’000
1. Includes revenue from operating segments UKI and IBS whose revenue are both derived from United Kingdom and Ireland. IBS is not a reportable segment and has
been included within the “Other” column. The revenue from IBS is $31.7 million (2009 $36.5 million).

71iSOFT Group Limited Annual Report 2010 Financial Report for the year ended 30 June 2010
Note 3. Segment information - continued
Note 4. Revenue
United Kingdom and Ireland 260,812 476,637
Central Europe 143,965 231,894
Australia 86,215 142,494
Southern Europe and Latin America 7,546 101,064
Asia, Middle East and Africa 76,293 93,686
New Zealand 4,557 4,267
North America 22 -
Total 579,410 1,050,402
Non-current assets other than derivative financial instruments and deferred tax assets are allocated based on the location of the assets.
Information about major customers
The Consolidated Entity earns revenue from the NPfIT contract in the UK which is greater than 10% of total revenue (refer Note 2). Revenue of $72.5
million (2009: $126.7 million) was recognised in the year and this is reported in the UKI segment.
Sales Revenue
Licences 134,289 185,925
Implementation 87,592 106,109
Maintenance and Support 188,425 215,761
Third party hardware 9,461 16,577
Third party software 8,715 10,529
Other 2,031 3,950
430,513 538,851
Gain on sale of land and buildings 1,200 -
Other revenue
Interest income 3,192 1,273
3,192 1,273
Total revenue 434,905 540,124
Non- current assetsAt 30 June
2010$’000
2010$’000
2009$’000
2009$’000

notes to the Financial Statements cOnTinued
72 iSOFT Group Limited Annual Report 2010 Financial Report for the year ended 30 June 2010
Note 5. Expenses
Note 6. Finance Costs
Expense excluding finance costs, amortisation, depreciation and impairment is comprised as follows:
Consultancy, insurance and professional fees 22,549 23,499
Consumables 59,283 66,861
Doubtful debts 4,005 973
Employee benefits expense 238,385 247,823
Marketing 12,968 6,619
Occupancy 20,548 21,649
Telecommunications 7,988 7,509
Travel 18,816 22,797
Other 15,327 10,006
Restructuring costs 4,975 -
404,844 407,736
Employee Benefit Expense
Salaries and bonuses 218,101 231,499
Termination benefits - 1,498
Associated personnel expenses 9,433 8,565
Defined contribution superannuation contributions 7,667 7,280
Defined benefit superannuation contributions (refer Note 23) 533 (2,443)
Share-based payments expense 2,651 1,424
238,385 247,823
Rental expense relating to operating leases
Minimum lease payments 14,266 12,556
Finance costs
Interest and finance charges paid/payable
Senior secured borrowings 11,732 20,027
Subordinated secured borrowings - 8,517
Convertible notes 2,767 2,527
Contract Funding 1,759 3,242
Finance lease interest 50 1,532
Other 4,570 3,509
20,878 39,354
Net foreign exchange (gains)/losses - realised (731) (10,688)
Net foreign exchange (gains)/losses - unrealised 1,203 5,340
21,350 34,006
Other finance costs include interest cost of defined benefit obligations (refer Note 23).
2010$’000
2010$’000
2009$’000
2009$’000

73iSOFT Group Limited Annual Report 2010 Financial Report for the year ended 30 June 2010
Note 8. Income tax expense
Note 7. EBITDA calculation
a) Income tax expense recognised in the income statement
Current tax 9,133 14,903
Deferred tax (3,709) (845)
Under/(over) provision in prior years 1,095 (4,370)
Aggregate income tax expense 6,519 9,688
Deferred income tax expense included in income tax expense companies:
Decrease/(increase) in deferred tax assets (note 16) 13,632 8,325
(Decrease)/increase in deferred tax liabilities (note 16) (17,341) (9,170)
(3,709) (845)
b) Numerical reconciliation of income tax expense to prima facie tax payable
Profit/(loss) before income tax expense (376,395) 44,419
Tax at the Australian tax rate of 30% (112,919) 13,325
Tax effect amounts which are not deductible/(taxable) in calculating taxable income:
Non-deductible depreciation and amortisation (2,223) 37
Non-deductible entertainment and legal 516 499
Other non-deductible/(non-assessable) items 93,512 6,679
(21,114) 20,540
Under/(over) provision in prior years 1,111 (4,370)
Current year tax losses not recognised 11,614 1,427
Prior year tax losses not recognised now recouped 7,782 (1,388)
Prior year temporary differences not recognised now recognised 9,136 (717)
Difference in overseas tax rates (5,008) (5,942)
Temporary differences not brought to account 2,254 138
Irrecoverable withholding tax 744 -
Income tax expense 6,519 9,688
c) Amounts recognised directly in equity
The aggregate current and deferred tax arising in the period and not recognised in net profit or loss but directly debited or (credited) to equity is as follows:
Current tax (4,549) 1,305
Deferred tax 1,359 (1,356)
(3,190) (51)
d) Tax losses not recognised
Unused tax losses for which no deferred tax asset has been recognised 431,036 217,544
Potential tax benefit at regional rates between 12.5% and 39 % 120,986 62,920
(Loss)/profit before tax (376,395) 44,419
Amortisation of intangible assets 37,153 45,612
Impairment of intangible assets 341,059 -
Depreciation 6,894 8,351
Finance costs 21,350 34,006
30,061 132,388
EBITDA is earnings before income tax, finance costs, depreciation, amortisation and impairment expense.
2010$’000
2010$’000
2009$’000
2009$’000

notes to the Financial Statements cOnTinued
74 iSOFT Group Limited Annual Report 2010 Financial Report for the year ended 30 June 2010
Note 9. Cash and cash equivalents
Note 11. Inventories
Note 12. Accrued Revenue – current
Note 13. Other assets – current
Note 10. Trade and other receivables – current
Cash at bank 30,979 82,786
Cash on deposit 598 2,951
31,577 85,737
Included in cash is an amount of $2.1 million (2009: $2.3 million) which serves as collateral for bank guarantees.
Finished goods - carried at cost 564 192
Total finished goods 564 192
Accrued Revenue 56,120 73,220
56,120 73,220
Accrued revenue represents the current portion of revenue recognised but not yet invoiced (refer Note 1 (e) and 2).
Prepayments and sundry debtors 16,316 15,019
16,316 15,019
Prepayments and other debtors represent the aggregate of prepaid expenses including insurance premiums, hardware and software support contracts,
rent, rates and utilities.
Trade receivables 85,514 84,951
Less: Provision for doubtful debts (13,565) (11,067)
71,949 73,884
Bad and doubtful trade receivables
The Consolidated Entity has recognised a loss of $4.0 million (2009: $1.0 million) in respect of bad and doubtful trade receivables during the year ended 30
June 2010. The loss has been included in “other expenses” in the income statement. The Consolidated Entity utilised $1.6 million of provisions (2009: $0.6
million).
The majority of customers are government related entities and therefore management considers that the overall credit risk is low. For all customers,
management have in place credit terms and conditions and procedures to monitor outstanding balances, on a regular basis, to identify credit risks. The
increase in provisions is a result of changes in the collectability assessments with respect to a number of customers.
2010$’000
2010$’000
2010$’000
2010$’000
2010$’000
2009$’000
2009$’000
2009$’000
2009$’000
2009$’000

75iSOFT Group Limited Annual Report 2010 Financial Report for the year ended 30 June 2010
Note 14. Property, plant and equipment
Opening balance at 1 July 2008
Cost 2,884 6,216 27,907 1,487 38,494
Accumulated depreciation (422) (392) (16,758) (809) (18,381)
Accumulated currency translation adjustments (4) (923) 775 - (152)
Net carrying amount 2,458 4,901 11,924 678 19,961
Movement during the year ended 30 June 2009
Additions 84 7,563 6,056 382 14,085
Depreciation (48) (870) (7,085) (348) (8,351)
Disposals - cost - - (2,923) - (2,923)
Disposals - accumulated depreciation - - 1,175 - 1,175
Effect of foreign exchange movements 2 49 449 14 514
38 6,742 (2,328) 48 4,500
Balance at 1 July 2009
Cost 2,969 13,778 32,215 1,869 50,831
Accumulated depreciation (471) (1,261) (23,843) (1,157) (26,732)
Accumulated currency translation adjustments (2) (874) 1,224 14 362
Net carrying amount 2,496 11,643 9,596 726 24,461
Movement during the year ended 30 June 2010
Additions - 1,705 4,885 1,939 8,529
Fair value recognised from business combinations 980 - 151 - 1,131
Depreciation (34) (1,444) (5,067) (349) (6,894)
Disposals - cost (378) - (1,512) - (1,890)
Disposals - accumulated depreciation 154 - 1,373 - 1,527
Effect of foreign exchange movements (372) (646) (664) (36) (1,718)
350 (385) (834) 1,554 685
Balance at 30 June 2010
Cost 3,571 15,483 34,332 3,701 57,087
Accumulated depreciation (351) (2,705) (26,026) (1,323) (30,405)
Accumulated currency translation adjustments (374) (1,520) 456 (98) (1,536)
Net carrying amount 2,846 11,258 8,762 2,280 25,146
The reconciliation between additions and the cash outflow in respect of property plant and equipment is set out below:
Property, plant and equipment additions 8,529 14,085
Property, plant and equipment from lease incentive (911) (3,200)
Paid in respect of prior year accrued amounts 1,669 -
Acquired for but not yet paid at the reporting date (2,632) (1,669)
Cash outflow in respect of property, plant and equipment 6,655 9,216
LeasedPlant &
Equipment$’000
Plant &Equipment
$’000
LeaseholdImprovements
$’000
Land & Buildings
$’000
2010$’000
Total$’000
2009$’000

Note 15. Intangible assetsIntangible assets include goodwill, capitalised software development, intellectual property (including in process R&D acquired), customer contracts and patents and trademarks. Goodwill and intangibles are recognised in different functional currencies of the Consolidated Entity’s subsidiaries and cash generating units (CGUs) they have been allocated to. The movement in these currencies against the Australian Dollar can be significant and is recognised in the Foreign Currency Translation Reserve in equity.
Intangible assets other than goodwill have finite useful lives. The current amortisation charge in respect of intangible assets is included under amortisation expense in the consolidated income statements. There is impairment during the reporting period. Information on impairment testing for CGUs containing goodwill is contained further in this Note.
IntellectualProperty
$’000
CustomerContracts
$’000
Patents andtrademarks
$’000
Total
$’000
Capitalised Development
$’000 Goodwill
$’000
notes to the Financial Statements cOnTinued
76 iSOFT Group Limited Annual Report 2010 Financial Report for the year ended 30 June 2010
Opening balance at 1 July 2008
Cost 507,764 36,294 343,957 44,807 61,195 994,017
Accumulated amortisation and impairment - (20,143) (12,256) (16,465) (2,041) (50,905)
Accumulated currency translation adjustments (10,453) 1,210 (62) (757) - (10,062)
Net carrying amount 497,311 17,361 331,639 27,585 59,154 933,050
Movement during the year ended 30 June 2009
Additions 2,509 17,989 4,700 - - 25,198
Fair value recognised from business combinations 2,230 - - - - 2,230
Reallocation of fair value recognised from business 23,400 - (10,800) (5,900) (6,700) -
combinations
Adjustments to fair value recognised from business (4,034) - (115,670) 115,670 - (4,034)
combinations
Amortisation - (4,391) (16,055) (22,392) (2,774) (45,612)
Effect of foreign exchange movements 10,327 (1,199) (90) 659 (45) 9,652
34,432 12,399 (137,915) 88,037 (9,519) (12,566)
Balance at 1 July 2009
Cost 531,869 54,283 222,187 154,577 54,495 1,017,411
Accumulated amortisation and impairment - (24,534) 28,311) (38,857) (4,815) (96,517)
Accumulated currency translation adjustments (126) 11 (152) (98) (45) (410)
Net carrying amount 531,743 29,760 193,724 115,622 49,635 920,484
Movement during the year ended 30 June 2010
Additions - 22,380 - - - 22,380
Fair value recognised from business combinations 23,280 - 8,018 - - 31,298
Amortisation - (4,090) (11,782) (19,202) (2,079) (37,153)
Impairment1 (286,672) (16,867) (22,249) (14,533) (71) (340,392)
Effect of foreign exchange movements (63,054) (4,431) (20,397) (18,039) (10,009) (115,930)
(326,446) (3,008) (46,410) (51,774) (12,159) (439,797)
Balance at 30 June 2010
Cost 556,109 76,663 229,434 140,319 54,637 1,057,162
Accumulated amortisation and impairment (286,672) 45,491) (62,342) (58,059) (6,894) (459,458)
Accumulated currency translation adjustments (64,140) (4,420) (19,778) (18,412) (10,267) (117,017)
Net carrying amount 205,297 26,752 147,314 63,848 37,476 480,687
1. An additional $667,000 of impairment to deferred tax assets has been recognised this year which is not shown in this note. In total $341,059,000 has
been debited to the income statement.

Note 15. Intangible assets – continued
The Consolidated Entity acquired on 24 April 2009 Hatrix Pty Limited, a company domiciled in Australia. The initial purchase consideration was settled in the Company’s equity amounting to $1.2 million, which resulted in goodwill of $2.2 million. A further earn-out, capped at $13 million, may be paid over three years and payable in cash or shares at the Company’s election. No contingent consideration is recognised (refer Note 32).
On 11 August 2009, the Consolidated Entity acquired BridgeForward, Inc., a company that is domiciled in Boston, Massachusetts in United States. The purchase consideration was settled in US$4.5 million cash, with a further cash settled earn-out, which is capped at US$10 million payable over five years, if pre-determined sales revenue is achieved by the subsidiary. As at 30 June 2010, contingent consideration of approximately US$3.9 million has been recognised. The fair value estimates are based on a discount rate of 13.5%. The acquisition resulted in goodwill of US$8.4 million (refer Note 32).
On 26 November 2009, the Consolidated Entity acquired Patient Safety International Pty Ltd (“PSI”), a company domiciled in Australia. The initial purchase consideration was settled in 1.4 million shares of the Company’s equity at a fair value of $0.78 per share at the closing bid price, amounting to $1.1 million, which resulted in goodwill of $1.1 million. Further earn-out, capped at $5 million, may be paid over three years in cash or shares at the Consolidated Entity’s election upon achievement of minimum revenue targets as specified in the purchase agreement. As at 30 June 2010, a contingent consideration of approximately $3.9 million has been recognised. The fair value estimates are based on a discount rate of 13.5% (refer Note 32).
On 15 January 2010, the Consolidated Entity acquired TravelBlitz Pty Ltd (“TravelBlitz”), a company domiciled in Australia. The purchase consideration was settled in approximately $0.3 million in cash, which resulted in goodwill of $0.32 million. The goodwill is attributable to the cost savings on travel expenses as a result of this acquisition (refer Note 32).
On 19 February 2010, the Consolidated Entity acquired Ultragenda NV (“Ultragenda”), a company domiciled in Belgium. The initial purchase consideration was settled in cash of EUR11.5 million. A further cash settled earn-out which is capped at EUR 2.5 million may be payable over two years if pre-determined sales revenue is achieved by the subsidiary as defined in the purchase agreement. As at 30 June 2010, a contingent consideration of approximately EUR 0.35 million has been recognised. The total purchase consideration of EUR11.9 million has resulted in goodwill of approximately EUR5.7 million. Refer Note 32 for more detail of this acquisition.
Adjustments to fair values in the comparative period include the correction of a presentation error of $115.7 million between customer contracts and intellectual property relating to the acquisition of iSOFT Group on 31 October 2007.
Purchase price allocation for Hatrix Pty Limited is finalised but for all other recent acquisitions purchase price allocation has been provisionally determined at 30 June 2010.
Impairment testing for cash-generated units containing goodwill:For the purposes of impairment testing, goodwill is allocated to the Consolidated Entity’s operating divisions which represent the lowest level within the Consolidated Entity at which the goodwill is monitored for internal management purposes. The aggregate carrying amounts of goodwill allocated to each unit are as follows:
77iSOFT Group Limited Annual Report 2010 Financial Report for the year ended 30 June 2010
Goodwill is allocated to the following cash generating units:
Asia, Middle East and Africa - 60,095
Australia and New Zealand 25,926 82,486
United Kingdom and Ireland 43,396 163,871
IBS (iSOFT Business Solutions) 10,120 24,104
Southern Europe and Latin America 58,324 69,574
Central Europe 67,531 131,613
205,297 531,743
30 June 2010 $’000
30 June 2009 $’000
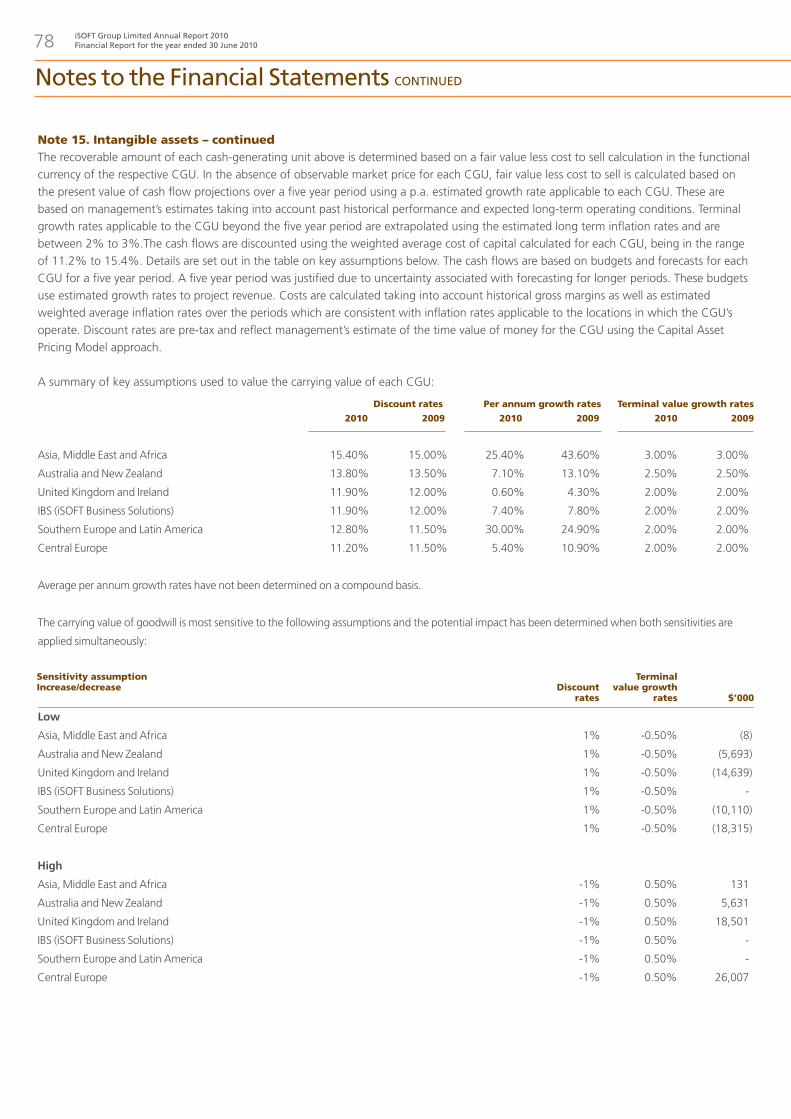
Note 15. Intangible assets – continuedThe recoverable amount of each cash-generating unit above is determined based on a fair value less cost to sell calculation in the functional currency of the respective CGU. In the absence of observable market price for each CGU, fair value less cost to sell is calculated based on the present value of cash flow projections over a five year period using a p.a. estimated growth rate applicable to each CGU. These are based on management’s estimates taking into account past historical performance and expected long-term operating conditions. Terminal growth rates applicable to the CGU beyond the five year period are extrapolated using the estimated long term inflation rates and are between 2% to 3%.The cash flows are discounted using the weighted average cost of capital calculated for each CGU, being in the range of 11.2% to 15.4%. Details are set out in the table on key assumptions below. The cash flows are based on budgets and forecasts for each CGU for a five year period. A five year period was justified due to uncertainty associated with forecasting for longer periods. These budgets use estimated growth rates to project revenue. Costs are calculated taking into account historical gross margins as well as estimated weighted average inflation rates over the periods which are consistent with inflation rates applicable to the locations in which the CGU’s operate. Discount rates are pre-tax and reflect management’s estimate of the time value of money for the CGU using the Capital Asset Pricing Model approach.
A summary of key assumptions used to value the carrying value of each CGU:
notes to the Financial Statements cOnTinued
78 iSOFT Group Limited Annual Report 2010 Financial Report for the year ended 30 June 2010
2010 2009
Discount rates
Sensitivity assumptionIncrease/decrease
2010
Terminal value growth
rates
2009
$’000
Terminal value growth ratesPer annum growth ratesDiscount rates
20092010
Asia, Middle East and Africa 15.40% 15.00% 25.40% 43.60% 3.00% 3.00%
Australia and New Zealand 13.80% 13.50% 7.10% 13.10% 2.50% 2.50%
United Kingdom and Ireland 11.90% 12.00% 0.60% 4.30% 2.00% 2.00%
IBS (iSOFT Business Solutions) 11.90% 12.00% 7.40% 7.80% 2.00% 2.00%
Southern Europe and Latin America 12.80% 11.50% 30.00% 24.90% 2.00% 2.00%
Central Europe 11.20% 11.50% 5.40% 10.90% 2.00% 2.00%
Average per annum growth rates have not been determined on a compound basis.
The carrying value of goodwill is most sensitive to the following assumptions and the potential impact has been determined when both sensitivities are
applied simultaneously:
Low
Asia, Middle East and Africa 1% -0.50% (8)
Australia and New Zealand 1% -0.50% (5,693)
United Kingdom and Ireland 1% -0.50% (14,639)
IBS (iSOFT Business Solutions) 1% -0.50% -
Southern Europe and Latin America 1% -0.50% (10,110)
Central Europe 1% -0.50% (18,315)
High
Asia, Middle East and Africa -1% 0.50% 131
Australia and New Zealand -1% 0.50% 5,631
United Kingdom and Ireland -1% 0.50% 18,501
IBS (iSOFT Business Solutions) -1% 0.50% -
Southern Europe and Latin America -1% 0.50% -
Central Europe -1% 0.50% 26,007

Note 15. Intangible assets – continuedThe Consolidated Entity has recognised material impairments in all its CGUs except Southern Europe and Latin America. During the reporting period economic conditions impacted the markets for the Consolidated Entity’s products and services in the CGUs where impairments have been recognised. Management has taken this impact as the basis for revising its projections for those markets going forward. The Consolidated Entity is only required to impair a CGU’s assets where the recoverable amount is lower than carrying value. As a result Other Intangibles including Deferred Tax Assets have been impaired, however for all other assets the carrying value is deemed to be lower than recoverable value.
In addition to market discount rates, a potential acquirer of the Company or of an individual CGU may consider other valuation methods such as trading multiples and transaction multiples. Therefore, in addition to the DCF impairment model the following have been considered to test whether this supports the DCF derived valuation and this was found to be the case:
• Review of valuation trading multiples of comparable companies• Considered whether there were comparable transactions that should be considered (no recent transactions were found that were
comparable)
79iSOFT Group Limited Annual Report 2010 Financial Report for the year ended 30 June 2010
CGU
Asia, Middle East and Africa 66,345 37,870 (104,215) (66,345) (37,870)
Australia and New Zealand 80,437 39,720 (54,511) (54,511) -
United Kingdom and Ireland 150,508 124,140 (107,114) (107,114) -
IBS (iSOFT Business Solutions) 20,787 22,010 (10,667) (10,667) -
Southern Europe and Latin America 58,326 17,154 - - -
Central Europe 114,885 72,367 (47,354) (47,354) -
491,288 313,261 (323,861) (285,991) (37,870)
In relation to Southern Europe and Latin America the critical changes in assumptions which would cause an impairment to be recognised when applied
simultaneously is as follows: Discount Rate +0.3%, Terminal Value Growth Rate -0.25%.
Impairment allocated
against goodwill
Carrying value of
Other Intangibles
2010
CGU impairment
2010
Carrying value of
goodwill 2010
Impairment allocated
against Other intangibles
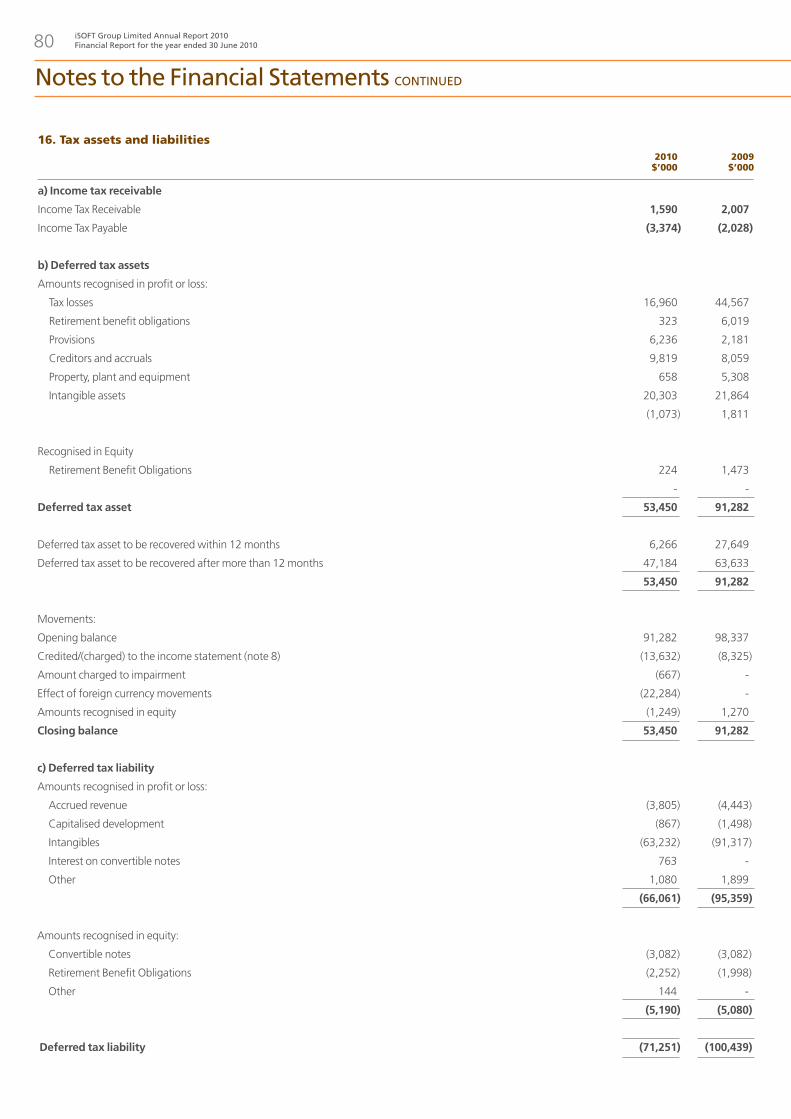
notes to the Financial Statements cOnTinued
80 iSOFT Group Limited Annual Report 2010 Financial Report for the year ended 30 June 2010
16. Tax assets and liabilities
a) Income tax receivable
Income Tax Receivable 1,590 2,007
Income Tax Payable (3,374) (2,028)
b) Deferred tax assets
Amounts recognised in profit or loss:
Tax losses 16,960 44,567
Retirement benefit obligations 323 6,019
Provisions 6,236 2,181
Creditors and accruals 9,819 8,059
Property, plant and equipment 658 5,308
Intangible assets 20,303 21,864
(1,073) 1,811
Recognised in Equity
Retirement Benefit Obligations 224 1,473
- -
Deferred tax asset 53,450 91,282
Deferred tax asset to be recovered within 12 months 6,266 27,649
Deferred tax asset to be recovered after more than 12 months 47,184 63,633
53,450 91,282
Movements:
Opening balance 91,282 98,337
Credited/(charged) to the income statement (note 8) (13,632) (8,325)
Amount charged to impairment (667) -
Effect of foreign currency movements (22,284) -
Amounts recognised in equity (1,249) 1,270
Closing balance 53,450 91,282
c) Deferred tax liability
Amounts recognised in profit or loss:
Accrued revenue (3,805) (4,443)
Capitalised development (867) (1,498)
Intangibles (63,232) (91,317)
Interest on convertible notes 763 -
Other 1,080 1,899
(66,061) (95,359)
Amounts recognised in equity:
Convertible notes (3,082) (3,082)
Retirement Benefit Obligations (2,252) (1,998)
Other 144 -
(5,190) (5,080)
Deferred tax liability (71,251) (100,439)
2010$’000
2009$’000

81iSOFT Group Limited Annual Report 2010 Financial Report for the year ended 30 June 2010
16. Tax assets and liabilities – continued
Note 17. Accrued Revenue – non-current
Note 18. Trade and other payables – current
Accrued Revenue 20,127 13,815
20,127 13,815
Accrued revenue represents the non-current portion of revenue recognised but not yet invoiced (refer Note 1 (e) and 2). The non-current position is
recognised initially at fair value, with any subsequent discount unwind recognised in interest income in the consolidated income statement.
Trade payables 22,999 28,283
Contingent consideration 1 2,521 2,271
Employee related 16,256 25,089
Payments received on account - 344
Cost of sales accruals 7,422 13,219
Exceptional cost accruals - 2,528
Purchase/Sales taxes 8,755 11,635
Other payables 31,888 24,767
89,841 108,136
1. Refer Note 32 for details of contingent consideration.
2010$’000
2010$’000
2010$’000
2009$’000
2009$’000
2009$’000
Deferred tax liability to be settled within 12 months (11,573) (13,140)
Deferred tax liability to be settled after more than 12 months (59,678) (87,299)
(71,251) (100,439)
Movements:
Opening balance (100,439) (117,289)
Credited/(charged) to the income statement (note 8) 17,341 9,170
Amounts recognised in equity (110) 86
Convertible notes issued - (123)
Effect of foreign currency movements 14,696 2,341
Acquired in business combinations (note 32) (2,739) 5,376
Closing balance (71,251) (100,439)
d) Net deferred tax (liabilities) (17,801) (9,157)

notes to the Financial Statements cOnTinued
82 iSOFT Group Limited Annual Report 2010 Financial Report for the year ended 30 June 2010
Note 19. Borrowings - current
Senior secured borrowings 22,456 39,597
Contract funding 11,157 15,193
Other borrowings 157 444
Finance lease liability 1,208 554
34,978 55,788
Senior secured borrowings:
Short term component of long term funding amounting to $22.5 million is provided by a syndicate of banks, consisting of Barclays, Clydesdale/Yorkshire
banks (wholly owned by National Australia Bank), Westpac, Bank of Ireland, KfW Group and Banco Santander.
At 30 December 2009 the Consolidated Entity refinanced its existing debt facility. The facility comprises a term loan and revolving credit facility. The
term loan is GBP 60 million (with the option to extend under an incremental accordion facility to GBP 80 million). The Revolving Credit Facility (RCF) was
increased to GBP 60 million from previously GBP 47.5 million. The facility reduced levels of debt servicing and provides additional working capital and
funding headroom through an increase in the revolver. Quarterly amortisation payments have been reduced from GBP 6.66 million per quarter to GBP 3.75
million commencing 31 March 2010. A balloon payment on the term loan of GBP 11.25 million is payable on the termination date of the facility which is
23 June 2013, extended from 21 August 2011. The RCF is repayable upon expiry of the facility being 23 June 2013 and GBP 25 million of cancellations that
existed in the RCF have been removed. Interest is at 3.75% above LIBOR for the period which can reduce to 3.25% depending on the Consolidated Entity’s
leverage ratio. During the current period, the Consolidated Entity made GBP7.5 million of term repayments and entered into an Interest rate swap (refer
Note 28).
The Consolidated Entity has recently completed negotiations with the Syndicate to amend the terms and conditions of the facility. The resulting
amendment has been disclosed in Note 22 and Note 43.
Contract funding:
Prior to the acquisition of iSOFT Group plc at 31 October 2007, iSOFT Group plc borrowed from third party lenders against expected future cash flows
from Maintenance and Support and other contracts. This practice ceased after the acquisition of iSOFT Group plc. The majority of contract funding is
denominated in Euros and GBP. During the year, the Consolidated Entity repaid $14.6 million (2009: $37.6 million) of contract funding.
Finance lease liability:
Finance lease liabilities are secured over specific equipment owned and capitalised by the Consolidated Entity.
Mortgage on property:
The Consolidated Entity has a $0.3 million (2009: Nil) facility secured by a mortgage over land and buildings in Belgium. The short-term component of the
facility amounted to $0.07 million. The land and buildings, acquired during the year (refer Note 32), have a fair value of $0.98 million and a net book value
of $0.94 million as at 30 June 2010. The facility has a fixed 4.0% interest rate and expires on 1 February 2014.
2010$’000
2009$’000

83iSOFT Group Limited Annual Report 2010 Financial Report for the year ended 30 June 2010
Note 20. Provisions – current and non-current
Current 2,038 3,702 - - - 5,740
Non-current - - - 630 - 630
Carrying amount at 1 July 2009 2,038 3,702 - 630 - 6,370
Movement during period
Additional provisions recognised - 1,425 4,065 202 3,370 9,062
Disposals - (2,253) - - - (2,253)
Utilisation (1,212) - (2,333) - - (3,545)
Foreign Exchange (313) (546) (66) - - (925)
Carrying amount at 30 June 2010 513 2,328 1,666 832 3,370 8,709
Current 513 2,328 1,666 - 3,370 7,877
Non-current - - - 832 - 832
Total carrying amount at end of period 513 2,328 1,666 832 3,370 8,709
Lease make good
This provision represents likely expenses to make good the premises leased by the Consolidated Entity. These claims are expected to be settled within
12 months.
Onerous contracts
This provision represents the accumulated losses on certain contracts not completed at reporting date. Management estimates provisions based on
historical claim information and any recent trends that may suggest future claims could differ from historical.
Restructuring
This provision represents the unavoidable cost of restructuring within the business. These are expected to be settled within 12 months.
Long Service Leave
This provision includes the estimated cost of additional holiday for staff payable after long periods of service within Australia and New Zealand. These are
expected to be settled after 12 months.
Other
This represents one off claim settlements, which the Consolidated Entity is expecting to settle within one year.
Reclassifications
The Consolidated Entity has reclassified provisions for onerous contracts as at 1 July 2009 from Trade and Other Payables (current), the amount being $3.9
million. This has had a nil impact on the income statement.
Other$’000
Long ServiceLeave$’000
Restructuring$’000
Onerouscontracts
$’000
Leasemake good
$’000Total$’000

notes to the Financial Statements cOnTinued
84 iSOFT Group Limited Annual Report 2010 Financial Report for the year ended 30 June 2010
Note 21. Deferred income - current
Note 22. Borrowings - non-current
Deferred income 58,938 67,898
58,938 67,898
Deferred income represents revenue invoiced to customers in accordance with contractual agreements. The amounts will be released to revenue as the
contracts are fulfilled.
Senior secured borrowings 146,721 133,271
Contract funding 9,819 23,136
Convertible notes payable 32,205 29,445
Other borrowings 522 -
Finance lease liability 1,998 530
191,265 186,382
Senior secured borrowings and contract funding refer Note 19.
Convertible notes:
Movements in convertible notes:
On 31 October 2007, Oceania Healthcare Technology Investments Pty Limited (OCP) subscribed for 121.9 million convertible notes in the Company at
an issue price of 86.4 cents each, for a total subscription amount of $105.3 million. On 19 November 2007, OCP received 2.8 million convertible notes in
the Company at an issue price of 86.4 cents each, for a value of $2.4 million in lieu of payment for ‘non-usage fees’. On 13 December 2007, 78.7 million
convertible notes were converted into ordinary shares. On 15 April 2009, OCP subscribed for 13.1 million convertible notes in the Company at an issue
price of 55 cents each taking up its non-renounceable pro-rata entitlement, which were subsequently converted on 14 June 2009. There have been no
movements in the reporting period.
1/07/2008 Opening balance at the beginning of the year 45,969,469 39,718
17/03/2009 Issued to OCP under pro-rata entitlement offer 13,134,134 0.550 7,224
14/06/2009 Conversion into ordinary shares by OCP (13,134,134) 0.550 (7,224)
30/06/2009 Closing balance at the end of the year 45,969,469 39,718
- -
30/06/2010 Closing balance at the end of the year 45,969,469 39,718
2010$’000
2010$’000
Issue Price$
Number ofNotesDetailsDate
2009$’000
2009$’000
Amount$’000

85iSOFT Group Limited Annual Report 2010 Financial Report for the year ended 30 June 2010
Note 22. Borrowings - non-current - continued
Significant terms and conditions: The significant terms and conditions of these convertible notes are as follows:
Subscription dates 31 October 2007, 19 November 2007
Subscription price 86.4 cents
Maturity date 5 years after the date of their issue (31 October 2012 and 19 November 2012)
Coupon equal to a dividend payment
Security unsecured
Ranking equally with unsecured debt provider
Conversion at any time, at the holder’s option
Conversion price none
Conversion ratio one note entitles the holder to convert into one ordinary share in the Company
Selling restrictions none
Anti-dilution clause included
Movements in carrying values of convertible notes
Carrying amount of liability at the beginning of the year 29,445 26,918
Accreted interest 2,760 2,527
Carrying amount of liability at the end of the year 32,205 29,445
Interest represents the discount unwind to maturity at a comparable interest rate of a debt instrument without a conversion option.
Assets pledged as security
The bank loans are secured by a fixed and floating charge over the assets and undertakings of the Consolidated Entity. Contract funding is secured only to
the revenue streams on the contracts that are funded. Land and buildings with a book value of $0.94 million is mortgaged with an amount of $0.3 million
(refer Note 19).
The lease liabilities are effectively secured as the rights to the leased assets recognised in the consolidated statement of financial position (refer Note 14)
revert to the lessor in the event of default.
Financing arrangements
Unrestricted access was available at balance date to the following lines of credit:
Total facilities
Senior secured term loan 52,500 60,000 92,332 123,127
Senior secured revolver 60,000 47,500 105,522 97,476
112,500 107,500 197,854 220,603
Used at balance date
Senior secured term loan 52,500 60,000 92,332 123,127
Senior secured revolver 54,312 32,675 95,519 67,052
106,812 92,675 187,851 190,179
Unused at balance date
Senior secured term loan - - - -
Senior secured revolver 5,688 14,825 10,003 30,424
5,688 14,825 10,003 30,424
2010$’000
2010$’000
2009GBP’000
2010GBP’000
2009$’000
2009$’000

notes to the Financial Statements cOnTinued
86 iSOFT Group Limited Annual Report 2010 Financial Report for the year ended 30 June 2010
Note 22. Borrowings – non-current (under Financing arrangements) - continued
Reorganisation of Senior Debt Facilities
Owing to the recent trading position of the Consolidated Entity, a restructure of the Consolidated Entity’s senior debt facilities is required as well as
a review of its capital structure. On 29 September 2010, the Consolidated Entity received a commitment letter from the senior lenders, which is fully
underwritten, credit approved and binding commitment documentation setting out the terms on which the senior lenders have agreed to extend
the Consolidated Entity’s existing senior debt facilities and advance a new senior debt facility to the Consolidated Entity of up to GBP40 million. Final
documentation is expected to be completed before 20 October 2010. The Consolidated Entity’s ability to access the additional funding will be subject
to a number of conditions. In the Directors’ view, these conditions are either procedural in nature, in which case they believe the Consolidated Entity will
be able to satisfy the conditions within the required time frame, or they are otherwise capable of being complied with by the Consolidated Entity. The
Consolidated Entity anticipates that these conditions will be satisfied by 20 October 2010.
Term loan A amortises at GBP3.75m per quarter with a bullet at maturity. Amortisation is deferred until the Bridge facility is discharged or 31 December
2011 whichever is earlier. During that time the Term loan is divided into two tranches: Tranche A being the original term facility and attracts UK Libor plus
a margin of 500bps plus 6% PIK. Tranche B is the deferred amortisation payments which attracts UK Libor plus a margin of 550bps + 6% PIK; the PIK
increases from 1 January 2011 by 125bps per quarter.
Term loan B and revolver attract UK Libor plus a margin of 450bps plus 5% PIK. There is bullet repayment at maturity.
The bridge revolver attracts UK Libor plus a margin of 550bps plus 14% PIK; the PIK increases from 1 January 2011 by 125bps per quarter. There is bullet
repayment at maturity.
1. Certain conditions subsequent, if not met by 15 November 2010, would shorten the maturity of certain tranches as a result of a bring forward
trigger (BFT).
Total facilities
Senior secured term loan A 23 June 2013 15 March 2012 52,500 92,332
Senior secured term loan B 15 March 2012 N/A 30,000 52,761
Senior secured revolver 23 June 2013 15 March 2012 30,000 52,761
Senior secured bridge revolver 31 December 2011 N/A 40,000 70,348
152,500 268,202
$’000GBP’000BFT
maturity 1Maximum
maturity
The new senior debt facilities will provide unrestricted access to the following lines of credit, with unchanged ranking of security:

87iSOFT Group Limited Annual Report 2010 Financial Report for the year ended 30 June 2010
(i) Defined contribution plans
The Consolidated Entity operates many defined contribution schemes.
Pension costs in respect of defined contribution schemes represented
contributions payable in the year and amounted to $7.2 million (2009:
$12.7 million). At 30 June 2010, there were $0.3 million (2009: $2.2
million) of outstanding contributions included in payables.
The Consolidated Entity provides in Australia statutory 9% superannuation
contributions to defined contribution superannuation funds, which
employees in Australia are free to choose. Pension costs in respect of these
superannuation funds represented contributions payable in the year and
amounted to $3.1 million (2009: $2.6 million). At 30 June 2010, there were
Nil (2009: $0.4 million) of outstanding contributions included in payables.
The pension scheme operating in the Netherlands is a multi-employer
funded defined benefit scheme (PGGM) which has been accounted for
as a defined contribution plan in accordance with AASB 119 on the basis
that proportionate plan assets and defined benefit obligation cannot be
determined and iSOFT cannot be held accountable for and be requested
to fund a deficit if this would exist. The pension scheme is a contractual
scheme pursuant to the Collective Labour Agreement with PGGM
(pension fund for Care & Welfare), which is the pension fund for the Dutch
healthcare industry and is based on the principle of average salary and
pensionable service and provides old-age pension, labour disability pension
as well as widow/widowers pension. The pension fund is governed by the
Dutch Pension and Savings law, which monitors the solvability of public
pension funds. As of 31 December 2009, the Dutch pension scheme had
a 108% statutory funding level cover, where legally a 105% minimum
funding level is required. Contributions are paid by both employer and
employees and remain unchanged.
(ii) Defined benefit plans - general
The Consolidated Entity operates funded and unfunded defined benefit
plans. Contributions to the defined benefit schemes are made in
accordance with the recommendation of the independent actuary of the
relevant scheme. The defined benefit plans receive fixed contributions from
subsidiaries of the Consolidated Entity and the Consolidated Entity’s legal
or constructive obligation is limited to these contributions.
There are four funded schemes: SMS Staff Benefits Plan in the United
Kingdom (UK) and three iSOFT Employee Group Gratuity Schemes in
India. The assets of these schemes are held separately from those of
the Consolidated Entity. These assets are managed by trustees, who are
required to act in the best interests of the schemes’ beneficiaries.
The SMS Staff Benefits Plan provides retirement benefits and is governed by
the UK Pensions Act 2004. The Board of Trustees comprises four trustees,
two nominated by the Consolidated Entity and two by the members. The
Trustees nominate the Chairman of the Trustee Committee. The last full
actuarial valuation of the Scheme for funding purposes was carried out
with a valuation date of 1 January 2008 by independent actuaries using the
projected unit credit method for valuing the liabilities. This latest valuation
has not made a significant change to the Scheme’s funding plan for the
next three years. The next statutory valuation date is 1 January 2011. The
assumptions that had the most effect on the results of this valuation for
funding purposes are those relating to the discount rate and inflation on
scheme liabilities and mortality assumptions.
The three Employee Gratuity Schemes in India provide post-employment
benefits or gratuity benefits on retirement, superannuation, termination or
resignation of an employee after 5 years of uninterrupted service as well as
gratuity benefit on death. The schemes are governed by the Payments of
Gratuity Act 1972 and also governed by the terms of employment of each
individual. As per the Act, an actuarial valuation is done on an annual basis
with the latest valuation date of 30 June 2010 by independent actuaries
using the projected unit credit method for valuing the liabilities. This latest
valuation has not made a significant change to the scheme’s funding plan
for the next three years. The Gratuity trustees Board is made up of three
trustees, nominated by the employees. At the meeting of the trustees, the
Chairman is appointed by mutual consent of the trustees present in the
meeting.
The pension scheme operated in Germany is an unfunded defined benefit
scheme providing post retirement benefits, invalidity pensions, widows/
widowers pension and orphanage pension. The scheme is governed
by an agreement between the Consolidated Entity and the workers
council and as stipulated by the German law (Gesetz zur Verbesserung
der betrieblichen Altersversorgung) the company is required to pay
contributions to the Pension-Sicherungsverein, which is a public body. The
levels of contributions to the Pension-Sicherungsverein are determined
in accordance with the above mentioned law and are invoiced to the
Consolidated Entity. As per German law, an actuarial valuation is done
on an annual basis with the latest valuation date of 30 June 2010 by
independent actuaries using the projected unit credit method for valuing
the liabilities. This latest valuation has not made a significant change to the
scheme’s funding plan for the next three years.
Note 23. Retirement and post-employment benefit obligations – non-current

notes to the Financial Statements cOnTinued
88 iSOFT Group Limited Annual Report 2010 Financial Report for the year ended 30 June 2010
A defined benefit pension scheme is operated in the Netherlands (Article 10.6 Pension Plan 2010 of Pensioenfonds Zorg & Welzjin) and is a Conditional
Career Average pension scheme (early retirement benefit scheme). This is an unfunded scheme and there are no assets available. iSOFT does not have to
pay any additional premiums for the Plan. Pension rights are vested in Pensioenfonds Zorg & Welzijn in case the participants become 55 years old before
1 January 2021 or at 1 January 2021 for all other participants. In case that iSOFT decides to terminate the contract with Pensioenfonds Zorg & Welzijn the
active participants lose the pension rights covered in the scheme. Only in that case iSOFT will be required to give compensation to the active members left
in the plan for the loss of those pension rights. The plan is closed to new entrants.
The SMS Staff Benefits Scheme operated in the UK is disclosed separately, with the plans operated in the Netherlands, Germany and India being aggregated.
This presentation is considered more meaningful than providing a split of funded and unfunded schemes on the basis that each of the plans is individually
insignificant.
The last full valuations of all schemes on an AASB 119 basis have been updated to 30 June 2010 to reflect market conditions and material events in the plans.
The Company does not operate a defined benefit plan.
(iii) Defined benefit plans – major assumptions
The major assumptions made when valuing the liabilities of defined benefit schemes under AASB 119 are as follows:
2010 2009 2010
2010
2010$’000Increase/(decrease)
2009
UK plan 2009
Defined Benefit
Obligation2009
$’000
Dutch and German plansIndian plansUK plan
20092010
Discount rate for scheme liabilities 5.55% 6.45% 8.10% 7.40% 4.60% 6.25%
Expected return on plan assets 6.29% 6.68% 7.50% 7.50% N/A N/A
Rate of increase in salaries N/A N/A 10.00% 9.00% 2.50% 2.50%
Rate of increase to pension in payment 3.55% 3.85% N/A N/A 2.00% 2.00%
SMS Staff Benefits Scheme – mortality
Standard actuarial morality tables PN00 were adopted using year of birth and medium cohort projections. Future improvements in life expectancy have
been allowed for in line with medium cohort improvements subject to a floor of 1.00% for males and females.
By way of illustration the impact of the application of these mortality tables on the expected longevity of pensioners is shown below:
Retiring today at age 65: Male N/A N/A
Female N/A N/A
Retiring in 20 years at age 65: Male 24.3 24.2
Female 26.7 26.6
SMS Staff Benefits Scheme – Sensitivities
The SMS Staff Benefits Scheme is the largest scheme within the Group, representing 91% (2009: 92%) of gross liabilities of all defined benefits schemes
operated by the Consolidated Entity. The principal sensitivities, with all other variables held constant, are illustrated below:
A 0.1% p.a. increase in the assumed discount rate would have the following effect: (1,407) (1,231)
A 0.1% p.a. increase in the assumed inflation rate would have the following effect: 879 1,026
Change in the mortality assumption to: “Long Cohort” allowance for future improvements (2,286) (2,052)
Note 23. Retirement and post-employment benefit obligations – non-current - continued

89iSOFT Group Limited Annual Report 2010 Financial Report for the year ended 30 June 2010
Note 23. Retirement and post-employment benefit obligations – non-current - continued
(iv) IFRIC 14
The table below shows the position at each of the subsequent statements of financial position dates:
2010$’000
2010$’000
2010$’000
2010$’000
2010$’000
2010$’000
2010$’000
2010$’000
2009$’000
2009$’000
2009$’000
2009$’000
2009$’000
2009$’000
Total2009
$’000
Total2009
$’000
Other plansUK plan
IAS 19 net defined benefit obligation 20,867 22,664 4,130 4,067
Future minimum funding requirements (21,293) (26,643) - -
Potential future pension surplus 426 3,979 4,130 4,067
Irrecoverable element of potential future pension surplus - (3,979) - -
Recoverable element of potential future pension surplus - - 4,130 4,067
Movement in irrecoverable element of potential future pension surplus before tax (3,979) 2,339 - -
The net pension liability at 30 June 2009 included the liability arising on the irrecoverable element of the potential pension surplus. During the financial
year, the Trustee of the SMS staff benefit plan amended the funding agreement with the Consolidated Entity which resulted in the removal of this
irrecoverable element of the minimum funding requirement. As a result, in accordance with IFRIC 14, the provision for the irrecoverable element of the
potential pension surplus is removed and taken directly to the consolidated statement of comprehensive income.
(v) Defined benefit schemes – income and expenses
The amounts that have been recognised in the consolidated income statement and consolidated statement of comprehensive income for the year ended
30 June 2010 and 30 June 2009 are set out below:
Amounts recognised in the consolidated income statement
Amounts recognised in the consolidated statement of comprehensive income
Other plans
Other plans
UK plan
UK plan
Current service cost - - 1,029 874 1,029 874
Interest cost 3,067 3,509 317 286 3,384 3,795
Expected return on plan assets (1,975) (2,499) (90) (67) (2,065) (2,566)
Curtailment losses/(gains) - - - 257 - 257
Total 1,092 1,010 1,256 1,350 2,348 2,360
Actual return on plan assets 4,432 (1,947) 70 59 4,502 (1,888)
Actuarial (loss)/gain recognised in the year (3,954) 1,553 394 158 (3,560) 1,711
Cumulative actuarial (losses)/gains recognised 218 4,172 852 458 1,070 4,630
Movement in irrecoverable amount of potential
future pension surplus (Note 23 (iv)) (3,979) 2,339 - - (3,979) 2,339
Interest cost is included in other finance cost in the consolidated income statement.

notes to the Financial Statements cOnTinued
90 iSOFT Group Limited Annual Report 2010 Financial Report for the year ended 30 June 2010
Note 23. Retirement and post-employment benefit obligations – non-current - continued
(vi) Defined benefit schemes – changes in present value of defined benefit obligations and fair value of plan assets
Changes in the present value of the defined benefit obligation for the year to 30 June 2010 were as follows:
(vii) Defined benefit plans – reconciliation of consolidated statement of financial position amounts
Reconciliation of assets and liabilities recognised in the consolidated statement of financial position at each of the subsequent balance dates:
2010$’000
2010$’000
2010$’000
2010$’000
2010$’000
2010$’000
2009$’000
2009$’000
2009$’000
2009$’000
2009$’000
2009$’000
Other plans
Other plans
Total
Total
UK plan
UK plan
Reconciliation of the present value of the defined benefit obligation, which is
Balance at the beginning of the year 55,436 59,701 5,023 3,925 60,459 63,626
Exchange adjustments (8,061) (637) (550) 166 (8,611) (471)
Current service cost - - 1,029 876 1,029 876
Interest cost 3,067 3,509 317 286 3,384 3,795
Actuarial losses/(gains) 6,411 (6,000) (414) (166) 5,997 (6,166)
Benefits paid (1,573) (1,137) (45) (64) (1,618) (1,201)
Balance at the end of the year 55,280 55,436 5,360 5,023 60,640 60,459
Reconciliation of the fair value of plan assets:
Balance at the beginning of the year 32,772 32,095 956 627 33,728 32,722
Exchange adjustments (4,795) (342) 47 46 (4,748) (296)
Expected return on plan assets 1,975 2,499 90 67 2,065 2,566
Actuarial gains/(losses) 2,457 (4,447) (20) (8) 2,437 (4,455)
Benefits paid (1,573) (1,137) (29) (50) (1,602) (1,187)
Employer contributions 3,578 4,104 186 274 3,764 4,378
Balance at the end of the year 34,414 32,772 1,230 956 35,644 33,728
Present value of the defined benefit obligation 55,280 55,436 5,360 5,023 60,640 60,459
Fair value of the defined benefit plan assets (34,414) (32,772) (1,230) (956) (35,644) (33,728)
Net liability before IFRIC 14 20,866 22,664 4,130 4,067 24,996 26,731
Irrecoverable element of potential future pension surplus - 3,979 - - - 3,979
Net liability 20,866 26,644 4,130 4,067 24,996 30,710
The net liability is presented on the balance sheet as follows:
Non-current retirement benefit obligations 20,866 26,644 4,130 4,067 24,996 30,710
Net liability 20,866 26,644 4,130 4,067 24,996 30,710

91iSOFT Group Limited Annual Report 2010 Financial Report for the year ended 30 June 2010
Note 23. Retirement and post-employment benefit obligations – non-current - continued
As required by AASB 119 liabilities for each scheme are determined using the projected unit credit valuation method. This is an accrued benefits valuation
method that discounts the best estimate of future cash flows and makes allowance for projected earnings. The Consolidated Entity has no legal obligation
to settle this liability with an immediate contribution or additional one-off contributions. The Consolidated Entity intends to continue to contribute to the
defined benefit section of the plan at a rate of $3.5 million (GBP 2.0 million) per annum in line with the actuary’s latest recommendations.
If the SMS Staff Benefits Plan were to be wound up, the relevant employers would be responsible, under section 75 of the Pensions Act 1995 to fund the
scheme up to the levels of cost of buying out the benefits for all scheme members with an insurer. This cost would be considerably more than the value
placed on the ongoing liabilities for accounting purposes. The deficit in the SMS Staff Benefits Plan calculated on a winding up basis (solvency valuation
basis) was approximately $49.9 million (GBP 27.4 million) as at 1 January 2008, the date of the latest actuarial valuation. This will be reviewed and updated
at the next valuation, which is due 1 January 2011.
(viii) Defined benefit plans – expected rate of return on plan assets
The expected long-term rate of return and market value of funded defined benefit schemes as at 30 June 2010 are:
2010$’000
2010$’000
2010$’000
2009$’000
2009$’000
2009$’000
Indian plans TotalUK plan
Equities 20,725 19,702 - - 20,725 19,702
Bonds 4,175 7,226 - - 4,175 7,226
Other assets 9,514 5,844 1,230 956 10,744 6,800
34,414 32,772 1,230 956 35,644 33,728
Equities 7.15% 7.30% N/A N/A
Bonds 4.93% 6.37% N/A N/A
Other assets 5.00% 5.00% 5.70% 8.76%
The Dutch early retirement benefit plan and the German pension plan are unfunded defined benefit plans.

notes to the Financial Statements cOnTinued
92 iSOFT Group Limited Annual Report 2010 Financial Report for the year ended 30 June 2010
Note 24. Trade and other payables – non-current
2010$’000
Total2009
$’000
Trade and other payables 1,161 812
Contingent consideration 1 7,181 -
8,342 812
1. Refer Note 32 for details of contingent considerations.
Note 23. Retirement and post-employment benefit obligations – non-current - continued
(ix) Defined benefit schemes – history of experience adjustments
All schemes were acquired iSOFT defined benefit plans. The disclosures provide the history of experience adjustments since acquisition on 31 October
2007.
$’000
Dutch and
German plans$’000
Unfunded schemes
Total$’000
Funded schemes
$’000UK plan Indian plans
Year ended 30 June 2010
Present value of defined benefit obligation 55,280 2,339 3,021 60,640
Fair value of plan assets (34,414) (1,230) - (35,644)
Deficits in the plan 20,866 1,109 3,021 24,996
Experience adjustments on plan liabilities 1,894 42 24 1,960
Experience adjustments on plan assets 2,457 (20) - 2,437
Year ended 30 June 2009
Present value of defined benefit obligation 55,436 1,776 3,247 60,459
Fair value of plan assets (32,772) (956) - (33,728)
Deficits in the plan 22,664 820 3,247 26,731
Experience adjustments on plan liabilities (349) 21 14 (314)
Experience adjustments on plan assets (4,447) (8) - (4,455)
Year ended 30 June 2008
Present value of defined benefit obligation 59,701 1,217 2,708 63,626
Fair value of plan assets (32,095) (627) - (32,722)
Deficits in the plan 27,606 590 2,708 30,904
Experience adjustments on plan liabilities 303 - - 303
Experience adjustments on plan assets (2,949) 1 - (2,948)
Cumulative actuarial gains and losses
The cumulative amounts of actuarial gains and losses recognised since 31 October 2007, which is the date of acquisition of iSOFT Group plc, in the
consolidated statement of comprehensive income is a loss of $10.9 million (2009: $7.4 million).

93iSOFT Group Limited Annual Report 2010 Financial Report for the year ended 30 June 2010
Note 25. Contributed equity
Ordinary shares
Ordinary shares entitle the holder to participate in dividends and the proceeds on winding up the Company in proportion to the number of and amounts
paid on the shares held. The fully paid ordinary shares have no par value. Movements in contributed equity are as follows:
1/07/2008 Opening balance at the beginning of the financial year 776,486,191 602,328
16/07/2008 Issued under iSOFT Group Employee Loan Plan 224,903 0.5900 132
24/09/2008 Issued under iSOFT Group Employee Loan Plan 4,100,000 0.7297 2,992
8/10/2008 Issued under iSOFT Group Employee Loan Plan 183,024 0.7250 133
28/11/2008 Issued under iSOFT Group Employee Deferred Incentive Plan 430,775 0.5606 241
10/12/2008 Issued under iSOFT Group Employee Loan Plan 200,000 0.5593 112
10/12/2008 Issued under iSOFT Group Employee Deferred Incentive Plan 5,208,843 0.5593 2,913
18/12/2008 Issued under iSOFT Group Employee Deferred Incentive Plan 56,705 0.5714 32
13/01/2009 Issued to Share Plan Managers for employee quarterly share allocation 205,574 0.6400 132
27/03/2009 Issued under non-renounceable rights issue to institutional investors 151,848,337 0.5500 83,517
15/04/2009 Issued under non-renounceable rights issue to retail shareholders 59,448,794 0.5500 32,697
5/05/2009 Issued under non-renounceable rights issue to retail shareholder 425,715 0.5500 234
19/05/2009 Issued in consideration for acquisition of Hatrix Pty Limited 1,804,893 0.6704 1,210
14/06/2009 Issued to Oceania Healthcare Technology Investments Pty Limited 13,134,134 0.5500 7,224
(OCP) on conversion of convertible notes
Less: transaction costs arising on non-renounceable rights issue, net of tax (4,937)
1/07/2009 Opening balance at the beginning of the financial year 1,013,757,888 728,960
3/07/2009 Issued to Share Plan Managers for employee quarterly share allocation 140,775 0.6400 90
6/10/2009 Issued under Dividend Reinvestment Plan to shareholders 1,887,026 0.8300 1,566
15/10/2009 Issued under Share Purchase Plan to shareholders 16,705,644 0.7700 12,863
11/11/2009 Issued on exercise of options from Employee Incentive Plan 100,000 0.7200 72
23/11/2009 Issued under iSOFT Group Employee Loan Plan 4,036,500 0.7900 3,189
26/11/2009 Issue in consideration for acquisition of Patient Safety International Pty Limited 1,366,190 0.7800 1,066
Less: transaction costs arising on non-renounceable rights issue, net of tax (365)
30/06/2010 Balance at the end of the financial year 1,037,994,023 747,441
Issue Price$
Number ofSharesDetailsDate
Amount$’000
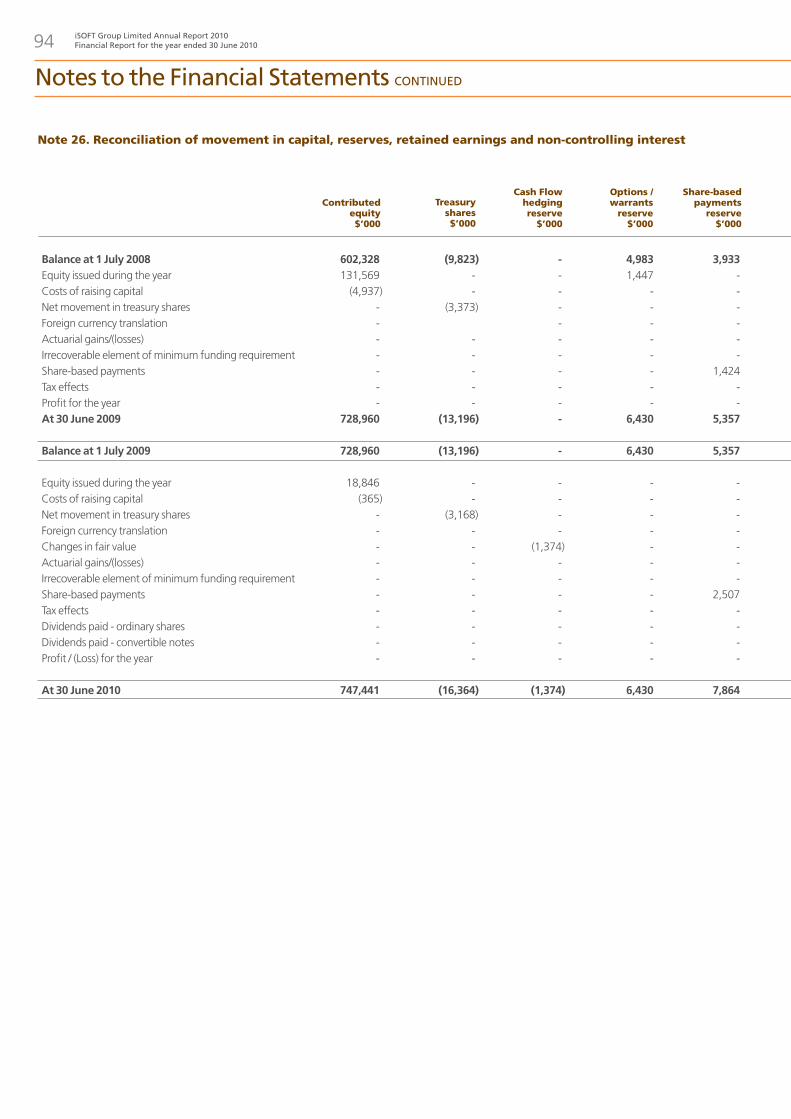
notes to the Financial Statements cOnTinued
94 iSOFT Group Limited Annual Report 2010 Financial Report for the year ended 30 June 2010
Note 26. Reconciliation of movement in capital, reserves, retained earnings and non-controlling interest
Share-basedpayments
reserve$’000
Cash Flowhedgingreserve
$’000
Contributed equity$’000
Options /warrants
reserve$’000
Treasury shares$’000
Balance at 1 July 2008 602,328 (9,823) - 4,983 3,933 (5,540) 10,273 (10,296) (6,470) (18,025) 577,833 350 578,183Equity issued during the year 131,569 - - 1,447 - - - - 1,447 - 133,016 - 133,016Costs of raising capital (4,937) - - - - - - - - - (4,937) - (4,937)Net movement in treasury shares - (3,373) - - - - - - (3,373) - (3,373) - (3,373)Foreign currency translation - - - - 3,071 - - 3,071 - 3,071 - 3,071Actuarial gains/(losses) - - - - - - - 1,711 1,711 1,711 1,711Irrecoverable element of minimum funding requirement - - - - - - - (2,339) (2,339) - (2,339) - (2,339) Share-based payments - - - - 1,424 - - - 1,424 - 1,424 - 1,424Tax effects - - - - - (389) - 440 51 - 51 - 51Profit for the year - - - - - - - - - 35,086 35,086 (355) 34,731At 30 June 2009 728,960 (13,196) - 6,430 5,357 (2,858) 10,273 (10,484) (4,478) 17,061 741,543 (5) 741,538 Balance at 1 July 2009 728,960 (13,196) - 6,430 5,357 (2,858) 10,273 (10,484) (4,478) 17,061 741,543 (5) 741,538 Equity issued during the year 18,846 - - - - - - - - - 18,846 - 18,846Costs of raising capital (365) - - - - - - - - - (365) - (365)Net movement in treasury shares - (3,168) - - - - - - (3,168) - (3,168) - (3,168)Foreign currency translation - - - - - (103,623) - - (103,623) - (103,623) - (103,623)Changes in fair value - - (1,374) - - - - - (1,374) - (1,374) - (1,374)Actuarial gains/(losses) - - - - - - - (3,560) (3,560) - (3,560) - (3,560)Irrecoverable element of minimum funding requirement - - - - - - - 3,979 3,979 - 3,979 - 3,979Share-based payments - - - - 2,507 - - - 2,507 - 2,507 - 2,507Tax effects - - - - - 3,444 - (254) 3,190 - 3,190 - 3,190Dividends paid - ordinary shares - - - - - - - - - (10,138) (10,138) - (10,138)Dividends paid - convertible notes - - - - - - - - - (460) (460) - (460)Profit / (Loss) for the year - - - - - - - - - (381,870) (381,870) (1,044) (382,914) At 30 June 2010 747,441 (16,364) (1,374) 6,430 7,864 (103,037) 10,273 (10,319) (106,527) (375,407) 265,507 (1,049) 264,458

95iSOFT Group Limited Annual Report 2010 Financial Report for the year ended 30 June 2010
Parent Interest
$’000
Totalreserves
$’000
Retained earnings
$’000
Optionpremium
reserve$’000
Foreigncurrency
translation$’000
Retirementbenefitsreserve
$’000
Balance at 1 July 2008 602,328 (9,823) - 4,983 3,933 (5,540) 10,273 (10,296) (6,470) (18,025) 577,833 350 578,183Equity issued during the year 131,569 - - 1,447 - - - - 1,447 - 133,016 - 133,016Costs of raising capital (4,937) - - - - - - - - - (4,937) - (4,937)Net movement in treasury shares - (3,373) - - - - - - (3,373) - (3,373) - (3,373)Foreign currency translation - - - - 3,071 - - 3,071 - 3,071 - 3,071Actuarial gains/(losses) - - - - - - - 1,711 1,711 1,711 1,711Irrecoverable element of minimum funding requirement - - - - - - - (2,339) (2,339) - (2,339) - (2,339) Share-based payments - - - - 1,424 - - - 1,424 - 1,424 - 1,424Tax effects - - - - - (389) - 440 51 - 51 - 51Profit for the year - - - - - - - - - 35,086 35,086 (355) 34,731At 30 June 2009 728,960 (13,196) - 6,430 5,357 (2,858) 10,273 (10,484) (4,478) 17,061 741,543 (5) 741,538 Balance at 1 July 2009 728,960 (13,196) - 6,430 5,357 (2,858) 10,273 (10,484) (4,478) 17,061 741,543 (5) 741,538 Equity issued during the year 18,846 - - - - - - - - - 18,846 - 18,846Costs of raising capital (365) - - - - - - - - - (365) - (365)Net movement in treasury shares - (3,168) - - - - - - (3,168) - (3,168) - (3,168)Foreign currency translation - - - - - (103,623) - - (103,623) - (103,623) - (103,623)Changes in fair value - - (1,374) - - - - - (1,374) - (1,374) - (1,374)Actuarial gains/(losses) - - - - - - - (3,560) (3,560) - (3,560) - (3,560)Irrecoverable element of minimum funding requirement - - - - - - - 3,979 3,979 - 3,979 - 3,979Share-based payments - - - - 2,507 - - - 2,507 - 2,507 - 2,507Tax effects - - - - - 3,444 - (254) 3,190 - 3,190 - 3,190Dividends paid - ordinary shares - - - - - - - - - (10,138) (10,138) - (10,138)Dividends paid - convertible notes - - - - - - - - - (460) (460) - (460)Profit / (Loss) for the year - - - - - - - - - (381,870) (381,870) (1,044) (382,914) At 30 June 2010 747,441 (16,364) (1,374) 6,430 7,864 (103,037) 10,273 (10,319) (106,527) (375,407) 265,507 (1,049) 264,458
Non-controlling
interest$’000
Total equity$’000

notes to the Financial Statements cOnTinued
96 iSOFT Group Limited Annual Report 2010 Financial Report for the year ended 30 June 2010
Note 26. Reconciliation of movement in capital, reserves, retained earnings and non-controlling interest - continued
Description of components of equity is set out below:
Contributed equity, refer to Note 25.
Treasury shares reserve
The treasury shares reserve for the Company’s own shares represents the cost of shares held by the trustee of an equity compensation plan that the
Consolidated Entity is required to include in the consolidated financial statements (refer Note 1 (aa) and (b) (ii)). At 30 June 2010, the Consolidated Entity
held 23.0 million of the Company’s shares (2009: 21.2 million). This reserve will be reversed with any surplus or deficit on sale shown as an adjustment to
retained earnings when the underlying shares are exercised under share options and in-substance share options (loan shares) (refer Note 39). No gain or
loss is recognised in profit or loss on the purchase, sale, issue or cancellation of the Company’s own equity instruments.
Options and warrants reserve
The options and warrants reserve comprises the fair value of options and warrants issued over ordinary shares of the Company. In total 5.6 million options
are outstanding over ordinary shares in the Company that were issued in previous years in consideration of acquisitions (2009: 5.6 million). On 31 July
2006, 5.0 million options were issued with an exercise price of $0.85 and expire on 31 July 2011. On 20 February 2007, two equal amounts of 300,000
options were issued which have an exercise price of $1.00 each and an expiry date of 9 November 2010 and 9 November 2011 respectively. Each option
entitles the holder to one ordinary share in the Company on conversion. Warrants were issued in relation to the subordinated secured borrowings provided
by Oceania Healthcare Technology Investments Pty Limited (OCP) (refer Note 40).
Share-based payments reserve
The share-based payments reserve comprises the amortised portion of grant date fair value of share-based payment grants made to employees under
equity compensation plans (refer Note 39).
Foreign currency translation reserve
The foreign currency translation reserve in the Consolidated Entity comprises all foreign currency differences arising from the translation of the financial
statement of foreign operations as well as from the translation of liabilities that hedge the Company’s net investment in a foreign subsidiary, net of tax.
Option premium reserve
The option premium reserve comprises the equity portion of convertible notes issued but not yet converted, net of any distributions paid (refer Note 1 (v)).
Retirement benefits reserve
The retirement benefits reserve comprises the cumulative amount of actuarial gains and losses as well as unrecoverable element of minimum funding
requirements of defined benefit plans (refer Note 23), net of income tax.
Retained earnings
Retained earnings comprise the cumulative amount of profits and losses of prior years and the current year.
Non-controlling interests
Non controlling interest is that portion of profit or loss and net assets of a subsidiary attributable to equity, interest that are not owned, directly or indirectly
through subsidiaries, by the Consolidated Entity.

97iSOFT Group Limited Annual Report 2010 Financial Report for the year ended 30 June 2010
Note 27. Dividends
Dividends paid
Dividends paid – ordinary shares 8,520 -
Dividends paid – convertible notes 460 -
8,980 -
Dividends reinvested in the reporting period - ordinary shares 1,617 -
10,597 -
Dividends proposed
Dividends (including convertible notes distributions) not recognised at the end of the year - 10,597
Franking credits
Franking credits available for subsequent financial years based on a tax rate of 30% 193 178
Exempting credits available for subsequent financial years based on a tax rate of 30% 13,584 13,510
2010$’000
2009$’000
Note 28. Financial instruments
Financial risk management objectives
The Consolidated Entity’s activities expose it to a variety of financial risks: market risk (including foreign currency risk and interest rate risk), credit risk
and liquidity risk. The Consolidated Entity’s overall risk management program focuses on the unpredictability of financial markets and seeks to minimise
potential adverse effects on the financial performance of the Consolidated Entity. The Consolidated Entity employed derivative financial instruments such
as foreign currency forward contracts and has interest rate swaps over GBP term debt.
Financial risk management is carried out by senior finance executives (Group Finance) under policies approved by the Board of Directors. Group Finance
identifies and evaluates financial risks within the Consolidated Entity’s subsidiaries. Those findings are reported to the Audit and Compliance Committee
who authorises the appropriate action to be taken.
The Consolidated Entity’s principal financial instruments comprise bank and other loans, cash and cash equivalents, other financial assets, trade and other
receivables and trade and other payables. The Consolidated Entity also enters into derivative transactions, primarily forward currency contracts and interest
rate swaps. This note explains the nature and extent of the risks arising from financial instruments; how those risks arise; the objectives, policies and
processes used by the Consolidated Entity for managing the risks; and the methods used to measure the risks.
Overview of treasury policy
The Consolidated Entity manages its exposure to risks arising from its use of financial instruments by the application of its treasury policy. The Consolidated
Entity’s treasury policy is approved by the Board and seeks to ensure that:
- appropriate financial resources are available for the maintenance and development of the Consolidated Entity’s businesses;
- the financial risk of currency, interest rate and counterparty credit exposure is understood, measured and managed appropriately; and
- no speculative transactions are undertaken.
There have been no significant changes in the Consolidated Entity’s exposures to risk, and its approach to managing those exposures, in the year ended 30
June 2010 compared to the year ended 30 June 2009.

notes to the Financial Statements cOnTinued
98 iSOFT Group Limited Annual Report 2010 Financial Report for the year ended 30 June 2010
Note 28. Financial instruments - continued
Policy in respect of the major areas of treasury management is set out below.
Liquidity risk
Liquidity risk is the risk that the Consolidated Entity will encounter difficulty in meeting its financial obligations as they fall due.
Operating within the strict controls of the Consolidated Entity’s treasury policy, the Treasury Function manages this risk, ensuring that sufficient funding
and liquidity is available to meet the expected needs of the Consolidated Entity. In addition to the free cash flow of the Consolidated Entity, the Treasury
Function adopts a prudent approach to liquidity management using a mixture of long-term debt facilities and short-term cash deposits. Core funding and
guarantee issuance is provided by a renegotiated syndicated bank facility which matures on 23 June 2013. This new senior debt facility is described further
in Note 22, including the amount of undrawn new committed GBP 40 million bridge revolving facility which is a key measure of the Consolidated Entity’s
liquidity (also refer Note 43).
Liquidity management is centralised through inter-company funding structures, under the control of the Treasury Function. Cash balances are monitored
to ensure that surplus amounts are repatriated and deficits adequately funded. The Treasury Function maintains sufficient back-up liquidity in the form of
available cash balances and committed facilities.
Standard business practices include the strict application of credit control procedures to ensure the collection of cash from customers in accordance with
agreed credit periods and terms that result in positive cash flows over the life of a development or long-term service provision contract whenever possible.
The following table summarises the maturity profile of the Consolidated Entity’s financial liabilities at 30 June 2010 and 30 June 2009 based on contractual
undiscounted payments:
Carrying Amount 1
$’000
Up to 1 year$’000
2-5 Years$’000
1 - 2 Years$’000
Expected cash flows
$’000
More than
5 years$’000
2010
Trade & other payables 1 98,182 94,268 88,599 2,901 2,768 -
Other borrowings 679 1,190 667 90 224 209
Bank loans 169,177 200,202 34,793 33,324 132,085 -
Contract funding 20,976 22,263 11,431 9,759 1,073 -
Convertible notes 32,205 39,718 - - 39,718 -
Derivative financial instruments 1,374 1,390 681 463 246 -
Lease liability 3,206 3,449 893 1,198 1,358 -
Unrecognised loan commitments;
Letters of credit - 8,050 8,050 - - -
Total 325,799 370,530 145,114 47,735 177,472 209
2009
Trade & other payables 108,948 108,948 108,084 864 - -
Other borrowings 444 444 444 - -
Bank loans 172,868 208,874 51,599 86,180 71,095 -
Contract funding 38,329 41,627 15,995 13,307 12,325 -
Convertible notes 29,445 39,718 - - 39,718 -
Lease liability 1,084 1,114 578 536 - -
Unrecognised loan commitments:
Letters of credit - 10,104 10,104 - - -
Total 351,118 410,829 186,804 100,887 123,138 -
1. Carrying amount includes an equity settled contingent consideration of $3.9 million which is not reflected in the expected cashflows.

99iSOFT Group Limited Annual Report 2010 Financial Report for the year ended 30 June 2010
Note 28. Financial instruments - continued
Interest rate risk
The Consolidated Entity is exposed to risk arising from the effect of changes in floating interest rates on the level of interest it pays on its borrowings and
receives on its cash deposits.
The Consolidated Entity’s policy is to set the proportion of fixed- and floating-rate debt, taking into account several factors including:
• the financial leverage of the Consolidated Entity;
• the profitability of the Consolidated Entity in relation to the business cycle; and
• the absolute levels of interest rates.
To implement this policy the Consolidated Entity may use fixed-rate borrowings, interest rate swaps, forward rate agreements and currency swaps to
manage its interest rate exposure.
As at 30 June 2010 and 30 June 2009, in line with the Consolidated Entity having a net cash position, iSOFT Group Limited had no significant fixed rate
borrowings. From 1 July 2010 to the end of the Facility, GBP interest is hedged against movements in Libor with interest rate swaps.
The interest rate profiles of the Consolidated Entity’s cash and cash equivalents and short and long-term borrowings are set out in Notes 9, 19 and 22
respectively. All other financial assets and liabilities of the Consolidated Entity are non-interest bearing and a statement has been made to that effect in the
relevant consolidated statement of financial position notes.
Interest rate risk sensitivity analysis
The following table demonstrates the sensitivity to a reasonably possible change in the LIBOR rate, with all other variables held constant, of the
Consolidated Entity’s profit before tax (through the impact on floating rate cash and borrowings). There is no impact on the Consolidated Entity’s equity.
The same assumptions have been used for the years ended 30 June 2010 and 2009.
Currency risk
Transaction exposure
Currency transaction exposure arises when the Consolidated Entity’s businesses face revenues or costs in a currency other than their own. The incidence
of this risk varies across the Group and is subject to change. Usually however, the majority of revenues and costs will be in the functional currency of the
business unit undertaking the transaction. Where this is not the case and the exposure is significant, it is the Consolidated Entity’s policy for businesses to
hedge their exposure.
The Consolidated Entity is also subject to exchange risk in making bids, particularly on major contracts. The assumption of a specific exchange rate within a
bid would lead to a change in the anticipated margin on the contract should a bid be successful; this risk is hedged if significant.
The Consolidated Entity predominantly uses forward currency contracts to manage transaction exposure.
LIBOR Increase / decrease
Effect on profit before tax increase / (decrease)
2010$’000
Effect on profit before tax increase / (decrease)
2009$’000
Borrowings - 1% 874 1,579
Borrowings + 1% (874) (1,579)

notes to the Financial Statements cOnTinued
100 iSOFT Group Limited Annual Report 2010 Financial Report for the year ended 30 June 2010
Note 28. Financial instruments - continued
Translation exposure
The majority of the Consolidated Entity’s operating capital is employed in overseas locations and is denominated in foreign currencies, particularly Pound
Sterling. As a consequence, changes in exchange rates affect both net asset values and reported results. This risk is not hedged directly, but to the extent
that the Consolidated Entity has debt, any that is held in foreign currency would reduce the level of net assets exposed to currency fluctuations. The
interest expense of any such debt would then also reduce the level of earnings exposed to exchange rate movements.
The Consolidated Entity and the parent entity undertake certain transactions in denominated in foreign currency and are exposed to foreign currency risk
through foreign exchange rate fluctuations.
The Consolidated Entity’s exposure to foreign currency risk is as follows:
Other (exclAUD)2009
$’000
Malaysia Ringgit
2009$’000
Euro2009
$’000
GBP2009
$’000
Other (excl AUD)
2010$’000
Malaysia Ringgit
2010$’000
Euro2010
$’000
GBP2010
$’000
Net financial assets on (166,305) 5,395 6,490 11,493 (172,095) 2,995 10,065 11,516
non-AUD functional
currency entities
Net unhedged monetary 289 (7,654) - 8,003 56 (14,771) - 762
assets not held in entities’
functional currencies
Gross exposure (166,016) (2,259) 6,490 19,496 (172,039) (11,776) 10,065 12,278

101iSOFT Group Limited Annual Report 2010 Financial Report for the year ended 30 June 2010
Note 28. Financial instruments - continued
The exchange rates of significant revenue generating countries of the Consolidated Entity that applied during the year are set out in Note 41.
Currency risk sensitivity analysis
The following table demonstrates the sensitivity to a reasonably possible change in the Pound Sterling, Euro and Malaysian Ringgit exchange rate, with all
other variables held constant, of:
- the Consolidated Entity’s profit before tax due to changes in the value of monetary assets and liabilities not held in entities’ functional currencies
(assuming year end levels of such items are held constant); and
- the Consolidated Entity’s equity due to changes in the value of year end net assets held by non-AUD functional currency entities.
The effect on profit is derived by applying the assumed strengthening/weakening percentage to the net amount of unhedged monetary assets held
in a currency that is not the functional currency of the controlled entity holding those assets. The effect on equity is derived by applying the assumed
strengthening/weakening percentage to the net assets of the Consolidated Entity’s entities whose functional currency is other than Australian Dollar.
Price risk
The consolidated entity is not exposed to equity price risk.
Credit risk
The Consolidated Entity is exposed to risk if counterparty to a financial instrument fails to meet its contractual obligations. Such a risk arises principally in
relation to receivables due from customers and cash deposited with banks or other financial institutions.
The Consolidated Entity monitors the identity of the counterparties with whom it deposits cash and transacts other financial instruments so as to control
exposure to any territory or institution. As far as it is both feasible and practical to do so, cash is held centrally by treasury. Risk is assessed using ratings from
major credit rating agencies.
The maximum credit risk exposure relating to financial assets is represented by their respective carrying values as at the consolidated statement of financial
position date.
Effect on profit before tax: increase
/ (decrease)2009
$’000
Effect on equity:
increase / (decrease)
2009$’000
Effect on profit before tax: increase
/ (decrease)2010
$’000
Effect on equity:
increase / (decrease)
2010$’000
Strength-ening /
weakening of currency
rate
Pound Sterling +10% (16,630) 29 (17,210) 6
Pound Sterling -10% 15,119 (26) 15,645 (5)
Euro +10% 625 (765) 300 (1,477)
Euro -10% (568) 696 (272) 1,343
Malaysian Ringgit +10% 649 - 1,007 -
Malaysian Ringgit -10% (590) - (915) -

notes to the Financial Statements cOnTinued
102 iSOFT Group Limited Annual Report 2010 Financial Report for the year ended 30 June 2010
Note 28. Financial instruments - continued
The following table summarises the aging profile of the Consolidated Entity’s financial assets at 30 June 2010 and 2009:
Derivatives
The Consolidated Entity is party to derivative financial instruments in the normal course of business in order to hedge
exposure to fluctuations in interest and foreign exchange rates in accordance with the group’s financial risk management policies (refer to note 2).
Capital management
The credit facility in place at 30 June 2010 provides liquidity for the Consolidated Entity until 23 June 2013 and supports the objectives of the Consolidated
Entity. This facility is described further in Note 19 and 22. Investigations are continually undertaken to review alternative financing arrangements. In
making those considerations the Board takes into account the cost of any refinancing compared to the benefits, which include terms and conditions, the
cost of funding and repayment schedules. Reference is made to the reorganisation of senior debt facilities as set out in Note 22 and Note 43.
There were no significant changes in the Consolidated Entity’s approach to capital management during the years ended 30 June 2010 and 2009.
The Consolidated Entity’s capital structure is as follows:
The Consolidated Entity’s objectives when managing capital is to safeguard its ability to continue as a going concern, so that it can continue to provide
returns for shareholders and benefits for other stakeholders and to maintain an optimum capital structure to reduce the cost of capital. During the year,
the Company raised $16.7 million under a Share Purchase Plan. In 2009, $123 million of equity was raised under a non-renounceable rights issue. With
those proceeds, the Consolidated Entity repaid the $61.9 million bridge-to-equity loan inclusive of interest provided by OCP, $9 million loans provided by
HSBC and $20 million on the RBS revolving credit facility.
The Consolidated Entity has a process of monitoring overall cash balances on a strategic long term basis and at an operational level on a weekly basis.
This is to ensure ongoing liquidity, prompt decision making and allow proactive communication with its funders.
Individually impaired
$’000
2009$’000
Collectively impaired
$’000
2010$’000
> 120 days
$’000
90 - 120 days
$’000
60 - 90 days
$’000
30 - 60 days
$’000
< 30 days
$’000
Neither past
due nor impaired
$’000
Total carrying
value$’000
Total gross
amount$’000
Past due but not impaired
2010
Cash and cash equivalents 31,577 31,577 31,577 - - - - - - -
Receivables 85,514 71,949 25,203 24,124 8,292 3,796 2,590 7,944 106 13,459
Total 117,091 103,526 56,780 24,124 8,292 3,796 2,590 7,944 106 13,459
2009
Cash and cash equivalents 85,737 85,737 85,737 - - - - - - -
Receivables 84,951 73,884 38,599 15,466 5,292 4,153 3,764 6,610 51 11,016
Total 170,688 159,621 124,336 15,466 5,292 4,153 3,764 6,610 51 11,016
Capital employed 459,124 897,971
Cash and cash equivalents 31,577 85,737
Borrowings (226,243) (242,170)
Net borrowings (194,666) (156,433)
Total equity - funds 264,458 741,538

103iSOFT Group Limited Annual Report 2010 Financial Report for the year ended 30 June 2010
Note 28. Financial instruments - continued
Historically acquisition of other businesses has been one of the key
growth strategies for the Consolidated Entity. In the future, the
Consolidated Entity may continue to make further acquisitions depending
on market conditions and the availability of suitable strategic targets. The
Consolidated Entity has used a mixture of debt and equity to fund these
activities, taking into account the cost of each source of finance, the costs
of raising the funds and the overall gearing of the Consolidated Entity. It is
expected these same considerations would be relevant going forward.
In order to maintain or adjust the capital structure, the Consolidated Entity
may adjust the amount of dividends paid to shareholders, return capital to
shareholders, issue new shares or sell assets to reduce debt.
The Consolidated Entity’s current focus is to pay dividends with free cash
flows after scheduled and pre-committed debt repayments and other
capital commitments, after forecasting future cash flows. Also, financial
covenants are taken into account before any dividend is declared to ensure
that these are not breached. Subject to restrictions in the facility agreement
with the Consolidated Entity’s bankers, the Consolidated Entity may
issue new shares or sell assets to either reduce debt or to invest in income
producing assets. This is decided on the basis of maximising shareholder
returns over the long term.
The Consolidated Entity’s overall capital risk management strategy remains
unchanged from the previous financial year.
The Consolidated Entity entered into an Agreement on 14 May 2010 for a
$30 million equity line of credit facility with US-Based Investment fund YA
Global Master SPV Ltd (YA Global). The Consolidated Entity plans to use
the facility in order to provide flexibility in cash management. It will initially
be used to replenish cash balances drawn down to fund acquisitions and
other capital investments undertaken during the 2010 financial year. Under
the terms of the facility, the Consolidated Entity may, as its discretion,
issue shares to YA Global at any time over the 60 months duration of
the Agreement up to a total of $30 million and may draw down these in
tranches of up to $2.5 million, although this may be varied by agreement
with YA Global.
Shares issued to YA Global will be priced based on a formula that takes the
lowest daily VWAP over the pricing period and applies a discount of 3% to
the price. The Company can set a minimum acceptable price. The shares
issued will be ordinary shares and be entitled to dividends.
(i) Classification and fair values of financial assets and liabilities
The carrying value of financial instruments reflects their fair value.
(ii) Derivative financial instruments
The Consolidated Entity’s derivative financial instruments as at 30 June
2010 is as follows:
Interest rate swaps
Bank loans of the Consolidated Entity currently bear an average variable
interest rate of 4.3% over the year ended 2010. It is policy to protect part
of the loans from exposure to fluctuations in interest rates. Accordingly,
the Consolidated Entity has entered into interest rate swap contracts under
which it is obliged to receive interest at variable rates and to pay interest at
fixed rates.
Swaps currently in place cover 100% (2009 - Nil) of the variable GBP term
loan principal outstanding and are timed to expire as each loan repayment
falls due. From 1 July 2010, the interest rates are set at 5.6% and the
variable rates are 3.75% above the one month LIBOR rate which at the end
of the reporting period was 0.35%.
The contract requires settlement of net interest receivable or payable
monthly. The settlement dates coincide with the dates on which interest is
payable on the underlying debt. The contracts are settled on a net basis.
The gain or loss from remeasuring the hedging instruments at fair value is
recognised in other comprehensive income and deferred in equity in the
hedging reserve, to the extent that the hedge is effective. In the year ended
30 June 2010, $1.4 million was recognised in other comprehensive income
and deferred in equity in the hedging reserve. It is reclassified into profit or
loss when the hedged interest expense is recognised. In the year ended 30
June 2010 Nil was reclassified into profit or loss (2009 - Nil) and included in
finance costs. There was no hedge ineffectiveness in the current year.
Foreign exchange swaps and forwards used to hedge transaction
exposure
The Consolidated Entity uses foreign exchange swaps and forwards
to hedge currency exposure arising from sales and purchases made by
the Consolidated Entity’s businesses in currencies other than their own
functional currency.
In 2010, the Consolidated Entity held INR/GBP forward contracts during the
year ended 30 June 2010 and 30 June 2009 to hedge the intercompany
purchases of software development services from the Indian subsidiaries. At
the end of the year, no forward contracts were in place.
(iii) Ineffectiveness recognised in the income statement
No amounts were recognised in the income statement relating to the
ineffectiveness of cash flow hedges (2009: Nil).

notes to the Financial Statements cOnTinued
104 iSOFT Group Limited Annual Report 2010 Financial Report for the year ended 30 June 2010
Note 29. Remuneration of auditors
During the year the following fees were paid or payable for services provided by PKF, the auditors of the Company, and its related practices:
Audit services - PKF
Audit or review of the financial report 1,004,963 720,514
1,004,963 720,514
Other services - PKF
Advisory services - 55,590
Taxation 375,572 410,467
375,572 466,057
1,380,535 1,186,571
Audit services - related practices
Audit or review of the financial report 1,457,227 1,232,281
1,457,227 1,232,281
Audit services - other than PKF
Audit or review of the financial report 10,025 46,028
Other services - other than PKF
Advisory services 77,561 121,937
87,585 167,965
It is the Consolidated Entity’s policy to employ PKF on assignments additional to their statutory audit duties where PKF’s expertise and experience with
the Consolidated Entity are important. These assignments are principally compliance tax advice, or financial due diligence in respect of possible corporate
acquisitions.
2010$’000
2009$’000

105iSOFT Group Limited Annual Report 2010 Financial Report for the year ended 30 June 2010
Note 30. Contingent liabilities
Contingent liabilities in respect of claims and potential claims:
The following are material claims that have been raised against the
Consolidated Entity:
a) iSOFT Health Management (India) Private Limited (formerly IBA Health
(India) Private Limited) is the subject of a petition to windup the entity,
over an alleged failure to pay a USD 1 million ($ 1.13 million) claim. The
wind up petition is currently stayed by the highest court in India, and
is awaiting a decision after a final hearing was heard in August. The
Consolidated Entity does not expect to be judged liable for any payments
in relation to this matter nor that the wind up petition will be allowed to
proceed;
b) The proceedings in the Supreme Court of Queensland, Brisbane Registry
(Proceedings No.BS9769/06), between the Australian Church in
Australia Property Trust in Australia (Q) (as plaintiff) and iSOFT Australia
Pty Limited (as defendant). The plaintiff alleges that iSOFT Australia Pty
Limited breached a software supply agreement dated 17 September
2001 and made misleading and deceptive representations, such that the
plaintiff has suffered loss and damage in the amount of approximately
$4.6 million (excluding legal costs). In the view of the Directors, the
outcome is unknown and they cannot estimate the likelihood of an
unfavourable decision; and
c) The proceedings under case number CIV-2006-404-004502 filed in
the High Court at Auckland, New Zealand, between I-Health Limited
(as plaintiff) and iSOFT NZ Limited and iSOFT Australia Pty Limited (as
first and second respondents respectively). The proceedings arose
out of a business and asset sale agreement entered into by iSOFT NZ
Limited (as purchaser), iSOFT Australia Pty Limited (as the purchaser’s
guarantor) and I-Health Limited (as vendor), whereby iSOFT NZ Limited
acquired the business and assets of I-Health Limited (including I-Health
Limited’s software known as “healthviews”). Payment for the business
included payments based on revenue earned by iSOFT NZ Limited from
the healthviews software over a five-year period following settlement
of the sale. I-Health Limited claims that iSOFT NZ Limited has breached
its obligations under the business and asset sale agreement to, inter
alia, promote and develop the healthviews software thus negatively
impacting on the earn-out payments due to I-Health Limited. The
maximum payable under the earn-out agreement is $24.9 million. In the
view of the Directors, the outcome is unknown and they cannot estimate
the likelihood of an unfavourable decision. As a result, no provision has
been made as at 30 June 2010.
Contingencies arising from contractual obligations:
The Consolidated Entity from time to time incurs delays in delivery of
project implementations. Such delays may trigger penalty clauses under
contracts. The contingent liability from such contractual obligations
has been estimated at $2.5 million as at 30 June 2010. In the view of
the Directors, the likelihood of a payment is remote and as a result, no
provision has been made as at 30 June 2010.
Unrecognised loan commitments
The Consolidated Entity has letters of credit amounting to $8.1 million with
financial institutions as at 30 June 2010 (2009: $10.1 million), refer Note
28.
Contingent considerations
Acquisition of Hatrix Pty Limited: the total maximum earn out is $13 million
over three years commencing from the date of acquisition on 24 April
2009. There is no earn-out payment due in respect of the period ended 30
June 2010.
Other
The Consolidated Entity has provided an indemnity to the purchaser of the
land and buildings (refer Note 14) in respect of losses that could arise from
the wind up petition of iSOFT Health Management (India) Private Limited
with respect of this property sale.

notes to the Financial Statements cOnTinued
106 iSOFT Group Limited Annual Report 2010 Financial Report for the year ended 30 June 2010
Note 31. Commitments
Lease commitments - operating
Committed at reporting date but not recognised as liabilities, payable:
Within one year 13,952 12,952
One to five years 30,314 32,547
More than five years 35,225 30,684
79,491 76,183
Lease commitments - finance
Committed at reporting date and recognised as liabilities, payable:
Within one year 1,213 578
One to five years 2,004 536
More than five years - -
Total commitment 3,217 1,114
Less: Future finance charges (11) (30)
Net commitment recognised as liabilities 3,206 1,084
Representing:
Lease liability - current (refer Note 19) 1,208 554
Lease liability - non-current (refer Note 22) 1,998 530
3,206 1,084
Lease commitments are operating leases on plant and equipment. Property leases are non-cancellable with rent payable monthly in advance. Contingent
rental provisions within lease agreements generally require minimum lease payments be increased by CPI or a percentage factor. Certain agreements have
option arrangements to renew the lease for an additional term.
During the reporting period, the Consolidated Entity entered into a new lease in Leiden, the Netherlands, with a lease term of 10 years expiring 31
December 2020. The Consolidated Entity will be receiving a lease incentive of $3.8 million (EUR2.7 million) worth of leasehold improvements.
In the year ended 30 June 2009, the Company entered into a lease in Sydney with a lease term of 10 years expiring in February 2019. The Consolidated
Entity received a lease incentive of $3.2 million worth of leasehold improvements (refer Note 14) during the comparative period.
Jointly controlled entities do not have commitments as at 30 June 2010 and 30 June 2009.
The Consolidated Entity has no capital commitments as at 30 June 2010 and 30 June 2009.
2010$’000
2009$’000

107iSOFT Group Limited Annual Report 2010 Financial Report for the year ended 30 June 2010
Note 32. Business combinations
Prior year acquisition
Hatrix Pty Limited
The Consolidated Entity acquired on 24 April 2009 100% of the equity
and voting rights of Hatrix Pty Ltd, a company domiciled in Australia.
This company develops electronic medication management solutions for
acute care, aged care and community health care providers in Australia
and New Zealand. Hatrix Pty Ltd has been renamed iSOFT Systems Pty Ltd
subsequent to acquisition. The Consolidated Entity will leverage its global
customer base to boost sales of Hatrix’s flagship MedChart medication
management solution. Medchart is already integrated with iSOFT software
products at a number of iSOFT’s installed customer sites and will be
particularly relevant for customers in Australia, New Zealand, U.K. and
Southeast Asia. The Consolidated Entity will also use Hatrix’s expertise in
further developing its own Lorenzo medication management solution.
The initial purchase consideration was settled in 1.8 million of the
Company’s equity at a fair value of $0.67 per share at the closing bid price
amounting to $1.2 million, which resulted in goodwill of $2.2 million.
A further earn-out, capped at $13 million, may be paid over three years
and payable in cash or shares at the Company’s election. No contingent
consideration has been recognised as performance cannot be measured
reliably. Any subsequent recognition will be in accordance with AASB 3
applicable at the date of transaction and won’t affect profit or loss. The
cost of the acquisition includes $0.1 million of directly attributable costs,
such as due diligence and legal fees.
Current year acquisitions
BridgeForward, Inc.
On 11 August 2009, the Consolidated Entity obtained control through
acquiring 100% of the issued share capital and voting rights of
BridgeForward, Inc., a company that is domiciled in Boston, Massachusetts.
This company develops and sells interoperability software for the global
health industry. The acquisition is expected to provide the Consolidated
Entity with the ability to integrate health information from all sources
through access to the acquiree’s newly developed SOA compliant
technology and a first step into the United States market. The Consolidated
Entity also expects to reduce internal development and maintenance
service costs through economies of scale that will be achieved by a
modern and standardised approach to the growing market demands for
interoperability. BridgeForward, Inc. has been renamed iSOFT Integration
Systems, Inc. subsequent to acquisition.
The purchase consideration was settled in US$4.5 million cash. A
further cash settled earn-out, which is capped at US$10 million may be
payable over five years, if pre-determined sales revenue are achieved
by the subsidiary. As at 30 June 2010, a contingent consideration of
approximately US$3.9 million has been recognised, the fair value estimates
based on a discount rate of 12.5%. The acquisition resulted in goodwill
of US$8.4 million, and is attributable to an embryonic presence in
United States, and expected cost savings in development function in the
integration product area as a result of acquisition.
Patient Safety International Pty Ltd
On 26 November 2009, the Consolidated Entity acquired 100% of the
issued share capital and voting rights of Patient Safety International Pty
Ltd (PSI), a company domiciled in Australia. PSI is a leading provider of
incident management software and provides the Consolidated Entity
with state-of-the-art patient safety software that will enable it to record,
monitor and take relevant management action to minimise future adverse
medical events. PSI’s AIMS solution software captures adverse event and
near miss information across acute care, community care, disability care,
mental health and residential aged care (nursing homes). Unlike other
systems, AIMS includes a standardised classification (ontology) that is
recognised by the World Health Organization and the US Institute of
Medicine. In addition to facilitating benchmarking, the AIMS Classification
enables use of business intelligence and decision support tools for a truly
strategic approach to patient safety and quality improvement. Currently
used in Australia, South Africa and the United States, the AIMS solution
can be applied in most markets including the emerging Patient Safety
Organizations in the United States. PSI has been renamed iSOFT Solutions
(International) Pty Ltd subsequent to acquisition.
The initial purchase consideration was settled in 1.4 million of the
Company’s equity at a fair value of $0.78 per share at the closing bid
price, amounting to $1.1 million, which resulted in goodwill of $1.1
million. Further earn-out, capped at $5 million may be paid over three
years and payable in cash or shares at the Consolidated Entity’s election
upon achievement of minimum revenue target as specified in the
purchase agreement. As at 30 June 2010, a contingent consideration of
approximately $3.9 million has been recognised, the fair value estimates
being based on a discount rate of 13.5%. Goodwill is attributable to the
workforce and synergies acquired. No detailed disclosures are made in this
Note because of the relatively insignificant size of the acquisition.

notes to the Financial Statements cOnTinued
108 iSOFT Group Limited Annual Report 2010 Financial Report for the year ended 30 June 2010
Note 32. Business combinations - continued
TravelBlitz Pty Ltd
On 15 January 2010, the Consolidated Entity acquired 100% of the
issued share capital and voting rights of TravelBlitz Pty Ltd (“TravelBlitz”),
a company domiciled in Australia. TravelBlitz is a travel agent providing
airlines and hotels reservation services. The acquisition is expected to
provide the Consolidated Entity with the ability to access to a travel agency
online bookings system and hence minimise cost on agency fees.
The purchase consideration was settled in approximately $0.30 million
in cash, which resulted in goodwill of $0.32 million. The goodwill is
attributable to the cost savings on travel expenses as a result of this
acquisition. No detailed disclosures are made in this Note because of the
relatively insignificant size of the acquisition.
UltraGenda NV
On 19 February 2010, the Consolidated Entity acquired 100% of the
issued share capital and voting rights of Ultragenda NV (“Ultragenda”), a
company domiciled in Belgium. Ultragenda provides a software solution
that enables health care organisations to schedule resources on an
enterprise wide basis and therefore improve operational efficiency within
operational provider organisations. The software is an enterprise-wide
scheduling solution which is highly configurable and therefore meets the
requirements of all departments and clinics. It acts as the primary planning
layer in the healthcare organisation and is web native. Via the softwares
developed by Ultragenda, family doctors (or other authorised personnel)
can make an online referral to a hospital in accordance with all the specific
referral rules of the clinic (or even individual physician) involved. The patient
can make his appointment either by phone (the hospital picks up the
referral and converts it) or online. Certain patients (dialysis patients, for
example) or patient groups can even be granted the right to book a specific
appointment online without prior referral. All the bookings take into
consideration the specific rules of the clinic.
The initial purchase consideration was settled in EUR11.5 million cash. A
further cash settled earn-out which is capped at EUR 2.5 million may be
payable over two years if pre-determined sales revenue is achieved by the
subsidiary as defined in the purchase agreement. As at 30 June 2010, a
contingent consideration fair value of approximately EUR 0.35 million has
been recognised. The total purchase consideration of EUR11.9 million has
resulted in goodwill of approximately EUR5.7 million, which is attributable
to workforce and synergies in cost saving as a result of this acquisition.

109iSOFT Group Limited Annual Report 2010 Financial Report for the year ended 30 June 2010
Note 32. Business combinations – continued
Current Assets
Cash and cash equivalents 4,169 4,169 15 15 137 137 4,321 4,321
Trade receivables 2,632 2,632 673 673 87 87 3,392 3,392
Investments 608 619 - - - - 608 619
Income tax receivable - - - - 13 13 13 13
Accrued revenue - - 182 182 6 6 188 188
Other current assets 43 27 212 346 - - 255 373
Total Current Assets 7,452 7,447 1,082 1,216 243 243 8,777 8,906
Non-Current Assets
Property, plant and equipment 1,098 1,098 10 10 64 64 1,172 1,172
Organisational Cost - - 32 - - - 32 -
Intangible assets - capitalised development - - - - 1,551 - 1,551 -
Intangible assets - Intellectual Property 12 5,322 - 1,626 - 1,070 12 8,018
Total Non-Current Assets 1,110 6,420 42 1,636 1,615 1,134 2,767 9,190
Total Assets 8,562 13,867 1,124 2,852 1,858 1,377 11,544 18,096
Current Liabilities
Trade payables (97) (97) (309) (309) (5) (5) (411) (411)
Other payables (603) (734) (1,077) (1,324) (194) (194) (1,874) (2,252)
Borrowings (328) (328) - - - - (328) (328)
Deferred income (1,615) (1,615) (465) (466) (175) (175) (2,255) (2,256)
Total Current Liabilities (2,643) (2,774) (1,851) (2,099) (374) (374) (4,868) (5,247)
Non-Current Liabilities
Deferred tax liabilities - (1,795) - (623) - (321) - (2,739)
Total Non-Current Liabilities - (1,795) - (623) - (321) - (2,739)
Total Liabilities (2,643) (4,569) (1,851) (2,722) (374) (695) (4,868) (7,986)
Net Assets 5,919 9,298 (727) 130 1,484 682 6,676 10,110
Provisional fair value of identifiable net assets 9,298 130 682 10,110
Goodwill arising on acquisition 8,717 9,938 4,621 23,276
18,015 10,068 5,303 33,386
Acquisition date fair value of consideration transferred:
Shares issued, at fair value - - 1,066 1,066
Cash paid 17,482 5,398 323 23,203
Contingent consideration transferred 533 4,670 3,914 9,117
Consideration transferred 18,015 10,068 5,303 33,386
Direct cost relating to acquisition 163 221 - 384
Total cash outflow on acquisition is as follow:
Net cash acquired with the subsidiary 4,169 15 137 4,321
Cash paid (17,482) (5,398) (323) (23,203)
Net consolidated cash inflow (13,313) (5,383) (186) (18,882)
Undiscounted potential future payment 533 5,611 3,930 10,074
Carrying amount
$’000
Carrying amount
$’000
Carrying amount
$’000
Carrying amount
$’000
Fair value $’000
TotalOtherBridgeForwardUltraGenda
Fair value $’000
Fair value $’000
Fair value $’000
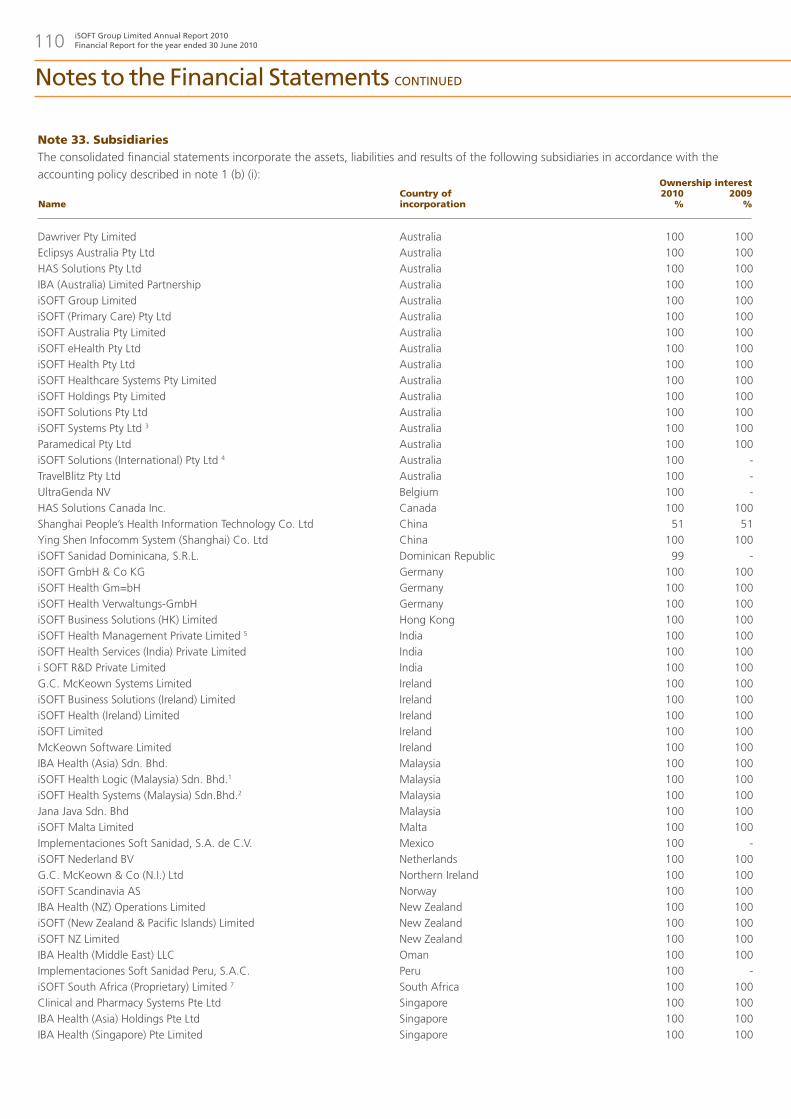
Dawriver Pty Limited Australia 100 100Eclipsys Australia Pty Ltd Australia 100 100HAS Solutions Pty Ltd Australia 100 100IBA (Australia) Limited Partnership Australia 100 100iSOFT Group Limited Australia 100 100iSOFT (Primary Care) Pty Ltd Australia 100 100iSOFT Australia Pty Limited Australia 100 100iSOFT eHealth Pty Ltd Australia 100 100iSOFT Health Pty Ltd Australia 100 100iSOFT Healthcare Systems Pty Limited Australia 100 100iSOFT Holdings Pty Limited Australia 100 100iSOFT Solutions Pty Ltd Australia 100 100iSOFT Systems Pty Ltd 3 Australia 100 100Paramedical Pty Ltd Australia 100 100iSOFT Solutions (International) Pty Ltd 4 Australia 100 -TravelBlitz Pty Ltd Australia 100 -UltraGenda NV Belgium 100 -HAS Solutions Canada Inc. Canada 100 100Shanghai People’s Health Information Technology Co. Ltd China 51 51Ying Shen Infocomm System (Shanghai) Co. Ltd China 100 100iSOFT Sanidad Dominicana, S.R.L. Dominican Republic 99 -iSOFT GmbH & Co KG Germany 100 100iSOFT Health Gm=bH Germany 100 100iSOFT Health Verwaltungs-GmbH Germany 100 100iSOFT Business Solutions (HK) Limited Hong Kong 100 100iSOFT Health Management Private Limited 5 India 100 100iSOFT Health Services (India) Private Limited India 100 100i SOFT R&D Private Limited India 100 100G.C. McKeown Systems Limited Ireland 100 100iSOFT Business Solutions (Ireland) Limited Ireland 100 100iSOFT Health (Ireland) Limited Ireland 100 100iSOFT Limited Ireland 100 100McKeown Software Limited Ireland 100 100IBA Health (Asia) Sdn. Bhd. Malaysia 100 100iSOFT Health Logic (Malaysia) Sdn. Bhd.1 Malaysia 100 100iSOFT Health Systems (Malaysia) Sdn.Bhd.2 Malaysia 100 100Jana Java Sdn. Bhd Malaysia 100 100iSOFT Malta Limited Malta 100 100Implementaciones Soft Sanidad, S.A. de C.V. Mexico 100 -iSOFT Nederland BV Netherlands 100 100G.C. McKeown & Co (N.I.) Ltd Northern Ireland 100 100iSOFT Scandinavia AS Norway 100 100IBA Health (NZ) Operations Limited New Zealand 100 100iSOFT (New Zealand & Pacific Islands) Limited New Zealand 100 100iSOFT NZ Limited New Zealand 100 100IBA Health (Middle East) LLC Oman 100 100Implementaciones Soft Sanidad Peru, S.A.C. Peru 100 -iSOFT South Africa (Proprietary) Limited 7 South Africa 100 100Clinical and Pharmacy Systems Pte Ltd Singapore 100 100IBA Health (Asia) Holdings Pte Ltd Singapore 100 100IBA Health (Singapore) Pte Limited Singapore 100 100
notes to the Financial Statements cOnTinued
110 iSOFT Group Limited Annual Report 2010 Financial Report for the year ended 30 June 2010
Note 33. SubsidiariesThe consolidated financial statements incorporate the assets, liabilities and results of the following subsidiaries in accordance with the accounting policy described in note 1 (b) (i):
Ownership interest 2009
%2010
%Country of incorporationName

iSOFT Health (Asia) Pte Ltd Singapore 100 100iSOFT Holdings (Singapore) Pte Ltd Singapore 100 100Ying Shen Pte Ltd Singapore 100 100 iSOFT Iberia, S.L. Spain 100 100iSOFT Sanidad SA Spain 100 100iSOFT Solutions (Thailand) Limited Thailand 100 100ACT Medisys Limited United Kingdom 100 100BIT (Holdings) Limited United Kingdom 100 100Eclipsys Limited United Kingdom 100 100HAS Solutions (UK) Limited United Kingdom 100 100Hollowbrook Computer Services Limited United Kingdom 100 100iSOFT plc United Kingdom 100 100IBA Health (Europe) Holdings Limited United Kingdom 100 100IBA Health (UK) Holdings Limited United Kingdom 100 100IBA Health (UK) Limited United Kingdom 100 100IBA Health (UK) Maintenance Limited United Kingdom 100 100iSOFT Applications Limited United Kingdom 100 100iSOFT Business Solutions (UK) Ltd United Kingdom 100 100iSOFT Europe (Holdings) Limited United Kingdom 100 100iSOFT Europe Limited United Kingdom 100 100iSOFT Group plc United Kingdom 100 100iSOFT Health (Germany) Limited United Kingdom 100 100iSOFT Health (Holdings) Limited United Kingdom 100 100iSOFT Health Limited United Kingdom 100 100iSOFT Laboratory Systems Ltd. United Kingdom 100 100iSOFT Medical Systems Limited United Kingdom 100 100iSOFT Netherlands (Holdings) Limited United Kingdom 100 100iSOFT Operations Limited United Kingdom 100 100iSOFT Overseas Holdings Limited United Kingdom 100 100iSOFT Protos Limited United Kingdom 100 100iSOFT Radiology Systems Limited United Kingdom 100 100iSOFT Solutions Limited United Kingdom 100 100iSOFT Technology Limited United Kingdom 100 100Oxhealth.com Limited United Kingdom 100 100Revive Group Limited United Kingdom 100 100Revive Health Limited United Kingdom 100 100Smart Terminals Limited United Kingdom 100 100SMS Datacare Limited United Kingdom 100 100Terranova Pacific Services Limited United Kingdom 100 100The Warwick Bepos Group Limited United Kingdom 100 100iSOFT Integration Systems, Inc. 6 USA 100 -iSOFT, Inc USA 100 -iHealthcare Information Systems Corporation USA 100 100
1. Formerly known as HealthLogic (Malaysia) Sdn. Bhd.2. Formerly known as IBA Health (Malaysia) Sdn. Bhd.3. Formerly known as Hatrix Pty Limited4. Formerly known as Patient Safety International Pty Ltd5. Formerly known as IBA Health (India) Private Ltd6. Formerly known as BridgeForward, Inc.7. Formerly known as iSOFT Health (South Africa) (Proprietary) Limited
111iSOFT Group Limited Annual Report 2010 Financial Report for the year ended 30 June 2010
Note 33. Subsidiaries – continued
Ownership interest 2009
%2010
%Country of incorporationName

notes to the Financial Statements cOnTinued
112 iSOFT Group Limited Annual Report 2010 Financial Report for the year ended 30 June 2010
Note 34. Jointly controlled entities (JCE’s)The Consolidated Entity operates several projects in Spain with joint venture partners and consolidates JCE’s on a proportional basis (refer Note 1 (b) (iii)). The proportional interest in results, cash flows, assets, liabilities and net assets is insignificant to the Consolidated Entity of which a summary is set out below:
UTE Indra sistemas, Everis,
Isoft y Telvent Interactiva
STERIA
Isoft Sanidad SA e Informatica
El Corte Inglés SA UTE
Novasoft Sanidad y Selective
Outsourcing Information
Technologies SA UTE
Guadaltel- Novasoft Sanidad
SA UTE- Project 7577
Guadaltel- Novasoft Sanidad
SA UTE- Project 7578
Novasoft Servicios
Inforamticos SA y RSI-Ross
system Iberica SL UTE
Novasoft Sanidad y Bull
España UTE
Isoft Sanidad SA y Bull España
UTE
Novasoft Servicios
Inforamticos SA- Indra
Sistemas UTE
Novasoft Sanidad e Infinity
Systems UTE
UTE Indra- Novasoft-Sadiel
Novasoft Sanidad SA-
Servinform SA UTE
Spain
Spain
Spain
Spain
Spain
Spain
Spain
Spain
Spain
Spain
Spain
Spain
Spain
-
(99.3)
(137.9)
-
13.5
-
-
-
-
-
(27.7)
-
-
(251.4)
-
-
-
(0.1)
-
-
-
-
-
(0.3)
(0.4)
-
-
(0.8)
22%
50%
60%
50%
45%
40%
50%
80%
50%
50%
50%
33%
50%
22%
-
60%
50%
45%
40%
50%
80%
50%
50%
50%
33%
50%
-
(98.8)
(159.2)
(13.5)
(0.1)
(4.7)
-
-
-
15.2
(277.8)
(13.8)
(29.7)
(582.4)
-
-
-
64.7
-
-
96.5
-
141.0
6.5
221.5
0.9
26.7
557.8
Maintenance, development and
implementation of Diraya project for Sevicio
Andaluz de Salud
Implementation of Electronic Prescription for
Conselleria de Sanidad Valenciana
Implementation of Electronic Prescription for
Servicio Navarro de Salud
Maintenance services for Information system
for Tortosa Hospital.
System control development for waste
management fo Consejeria de Medio Ambiente
de la Junta de Andalucia.
Project Wonda development for Consejeria
de Justicia y Admon Publica de la Junta de
Andalucia
Service of equipment acquisition and
developments
Technical maintenance for Abucasi I project
Technical maintenance for Abucasi I project
Consultancy for design, installation and go live
for Public health system for Andalucia (CEIS).
Equipment installation, maintenance, repair
and systems as well as staff for Servicio de Salud
de Castilla La Mancha
Professional services for Information centre and
for the province.
Service of Management and Digital archive
2009$’000
2009$’000
2009$’000
2010$’000
2010$’000
2010$’000
Country of incorpo-rationPrincipal activitiesName
Consolidated amount of net assets
Consolidated ownership
interest
Share of JCE’s net results recognised

113iSOFT Group Limited Annual Report 2010 Financial Report for the year ended 30 June 2010
Note 35. Reconciliation of profit/(loss) after income tax to net cash flows from operating activities
Note 36. Non-cash investing and financing activities
(Loss)/profit after income tax expense (382,914) 34,731
Adjustments for:
Depreciation and amortisation 44,047 53,963
Impairment of intangibles 341,059 -
Net (profit)/loss on sale of non-current assets (1,119) 127
Non cash employee benefits expense - share based payments 5,39 2,507 1,092
Income tax expense 8 6,519 9,688
Finance costs 6 21,350 34,006
Reserve movements (1,754) -
Operating profit before changes in working capital and provisions 29,695 133,607
Change in operating assets and liabilities:
(Increase)/decrease in trade and other receivables (3,680) 3,455
(Increase)/decrease in inventories (439) 217
(Increase)/decrease in accrued revenue (2,305) 7,149
(Increase)/decrease in other operating assets 1,107 (6,121)
Increase/(decrease) in trade and other payables (9,089) 10,955
Increase/(decrease) in deferred income (3,820) (18,115)
Increase/(decrease) in other provisions 1,977 (5,912)
Increase/(decrease) in other operating liabilities (5,202) (50,475)
8,244 74,760
Income taxes paid (8,938) (10,509)
Net cash (outflow)/inflow from operating activities (694) 64,251
Shares issued in part consideration for business combinations 1,066 1,210
Shares issued under employee loan plan 3,279 6,687
4,345 7,897
2010$’000
2010$’000
Notes2009
$’000
2009$’000

notes to the Financial Statements cOnTinued
114 iSOFT Group Limited Annual Report 2010 Financial Report for the year ended 30 June 2010
Note 37. Earnings per share
Basic (37.93) 4.30
Diluted (37.93) 4.26
(Loss)/profit for the period (382,914) 34,731
(Loss)/profit attributable to non-controlling interest (1,044) (355)
Total earnings used in the calculation of basic earnings per share (381,870) 35,086
Weighted average number of ordinary shares used in calculating basic EPS 1,006,841,063 816,034,299
Adjustments for calculation of diluted EPS:
Options - 3,532,398
Convertible notes - 45,969,469
Weighted average number of ordinary shares used in calculating diluted EPS 1,006,841,063 865,536,166
Basic earnings per share for the year has been calculated using the above mentioned weighted average number of shares in issue during the year, excluding
those held as treasury shares which are treated as cancelled, and the profit after taxation and non-controlling interest as shown above.
For the current year, 50.5 million options, 4.2 million warrants and 45.9 million convertible notes are outstanding at 30 June 2010 and are antidilutive
because the conversion would decrease loss per share and are therefore excluded from the weighted average number of ordinary shares for the purposes
of diluted earnings per share. These options, warrants and convertible notes could potentially dilute basic EPS in the future.
In the comparative period, 4.2 million warrants outstanding were not included in the calculation of diluted EPS as they were antidilutive for the year ended
30 June 2009.
For terms and conditions of convertible notes, refer Note 22. For terms and conditions of warrants, refer Note 26. ELP and EIP disclosure, refer Note 39.
Since the reporting date, the Company issued 32,601,849 shares to YA Global Master SPV Ltd under the Yorkville Agreement, raising $4,631,583 refer
Note 43.
Earnings used in the calculation of basic earnings per share (381,870) 35,086
Add interest saving on convertible notes - 1,769
Total earnings used in the calculation of dilutive earnings per share (381,870) 36,855
2010Cents
$’000
Number
Earnings per share (EPS) attributable to ordinary equity holders
Reconciliation of earnings used in the calculation of basic earnings per share
Reconciliation of earnings used in the calculation of diluted earnings per share
2009Cents
$’000
Number

Note 38. Key management personnel disclosures
(i) Key Management PersonnelKey Management Personnel (KMP) of the Consolidated entity are defined as those persons having authority and management responsibility for planning, directing, and controlling the major activities of the Company and the Consolidated Entity, directly or indirectly, including any Director (whether executive or otherwise) of the Company. The following persons were KMP during the year or have been appointed after 30 June 2010:
• Non-Executive Directors;• Executive Directors; and• Group Executives
Non-Executive Directors:Robert Moran Appointed as Chairman on 15 June 2010 (previously Director)Claire Jackson IndependentAnthony Sherlock IndependentIan Tsicalas Peter Wise IndependentLachlan MacGregor Alternate to Robert Moran & Ian Tsicalas
Executive Directors:Ronald Series Appointed 24 September 2010
Former Executive Director:Gary Cohen 1 Chief Executive Officer Ceased to be Executive Chairman effective 15 June 2010 Ceased as a Director 30 September 2010
Other Key Management Personnel (Group Executives):Andrea Fiumicelli 1 Chief Operating OfficerBrian Cohen Chief Technology OfficerMike Jackman Executive Vice President, Operations Appointed 22 February 2010Martin Deda Group Finance DirectorStephen Garrington Director, Business Development Ceased to be an Executive Director effective 15 June 2010
(ii) Former Key Management PersonnelThe following executive ceased to be a member of key management personnel during the financial year ended 30 June 2010:
Non-Executive Directors:James Fox Independent Appointed 6 July 2009 Appointed Deputy Chairman 28 May 2010 Ceased as Director from 15 June 2010
Where applicable, where these individuals had balances in relation to shares or loans as at 30 June 2009, their balances have been included in the opening balances of the current financial year. Other than noted in this section, there have been no changes in KMP during the reporting period and in the period after reporting date and prior to the date when the financial report is authorised for issue. KMP for the Company and the Consolidated Entity are the same. Hence there are no separate parent or consolidated disclosures.
1. From 31 August 2010, Gary Cohen stepped down as Chief Executive Officer. Andrea Fiumicelli has assumed responsibility as acting Chief Executive Officer.
115iSOFT Group Limited Annual Report 2010 Financial Report for the year ended 30 June 2010

Notes to the Financial Statements cONTiNued
116 iSOFT Group Limited Annual Report 2010 Financial Report for the year ended 30 June 2010
2010 3,118,634 - 800,598 1,081,388 77,648 5,078,268
2009 2,810,231 2,050,500 752,620 (147,531) 72,173 5,537,993
Executive Director
Gary Cohen B 69,483,502 577,270 45,173,156 (61,148,788) (1,446,113) 52,639,027 52,639,027
Non-executive Directors
Anthony Sherlock 10,000 - 100,000 (50,000) - 60,000 60,000
Peter Wise 11,516,913 - - (250,000) - 11,266,913 11,266,913
Claire Jackson 39,620 - - - - 39,620 39,620
Robert Moran 580,937 - - - - 580,937 580,937
Ian Tsicalas - - - - - - -
James Fox 1 - - 100,000 - (100,000) - -
Alternate Director
Lachlan MacGregor - - - - - - -
Key management personnel during the year
Brian Cohen B 67,074,676 577,270 35,044,242 (53,453,015) (1,374,673) 47,868,500 47,868,500
Martin Deda 527,273 - 500,000 - - 1,027,273 1,027,273
Andrea Fiumicelli 62,780 - - - - 62,780 62,780
Mike Jackman 2 - - 40,000 - - 40,000 40,000
Stephen Garrington 3 5,841,542 - 750,000 - (700,694) 5,890,848 5,890,848
Ronald Series, appointed 24 September 2010 as an Executive Director, holds no equity instruments in the Company.
1. Dr James Fox resigned as a Director on 15 June 2010.
2. Mike Jackman commenced with iSOFT on 22 February 2010, as a Key Management Person.
3. Stephen Garrington resigned as a Director on 15 June 2010 and continues to be a Key Management Person.
A All the shares are inclusive of vested and unvested shares under the iSOFT Employee Loan Plan where applicable. The balance of vested and unvested
shares held by an individual is disclosed in the Employee Loan plan section of this Report
B This amount includes the relevant interest in securities of the RJL Investments Pty Limited group of Companies, of which Brian Cohen and Gary Cohen each
have a 50% stake of 30,375,042 shares. This amount also includes the relevant interest in vested and unvested shares under the share award plans for
Gary Cohen and Brian Cohen. This amount does not include the relevant interests pursuant to a Pre-emption Deed under which RJL Investments Pty Ltd
and Oceania Healthcare Technology Investments Pty Limited each grant pre-emptive rights over their shares in the Company in favour of the other.
Pre-emptive rights do not attach to more shares than the number which, when added to the person’s existing voting power, equals 19.9%.
Note 38. Key management personnel disclosures - continued
(iii) Compensation
The aggregate compensation made to Directors and other members of Key Management Personnel of the Consolidated Entity is set out below:
(iv) Equity instrument disclosures relating to Key Management Personnel
Shareholding
The movement during the reporting period in the number of ordinary securities in the Company held directly, indirectly or beneficially, by each Key
Management Person, including their personally related parties, is as follows:
Total$
Balance at 30-Sept-10
Shares & options
$
Transferred out during
the year
Share-basedpayments
(equity settled)
Cash bonus
$
Acquired during
the year
Super-annuation
$
Balance at the end of
the year
Post-employment
Non- monetary
benefits$
Disposed during
the year
Short-term
Base Salary and fees
$
Issued under DRP
Balance at the start of
the year A
For the year ended 30 June 2010

117iSOFT Group Limited Annual Report 2010 Financial Report for the year ended 30 June 2010
Executive Directors
Gary Cohen B 72,546,550 3,514,285 8,326,602 (14,528,935) (375,000) 69,483,502 69,483,502
Stephen Garrington 6,463,594 - 227,948 (600,000) (250,000) 5,841,542 5,841,542
Non-executive Directors
Anthony Sherlock 10,000 - - - - 10,000 10,000
Peter Wise 12,688,443 1,100,000 - (2,271,530) - 11,516,913 -
Claire Jackson 39,620 - - - - 39,620 39,620
Robert Moran 1 672,773 140,000 - - (231,836) 580,937 580,937
Ian Tsicalas - - - - - - -
Donald Conway 2 250,000 - - - (250,000) - -
Alternate Director
Lachlan MacGregor 3 - - - - - - -
Key management personnel during the year
Brian Cohen B 71,362,526 3,514,285 3,605,765 (11,032,900) (375,000) 67,074,676 67,074,676
Martin Deda 4 - 27,273 500,000 - - 527,273 527,273
Andrea Fiumicelli - - 78,222 (15,442) - 62,780 62,780
Gordon Mackay 5 437,829 - - - (437,829) - -
1. Robert Moran was appointed a full director on 6 November 2008.
2. Donald Conway resigned on 6 November 2008.
3. Lachlan MacGregor was appointed as an alternate Director on 9 January 2009.
4. Martin Deda became a Key Management Person as at 13 July 2009.
5. Gordon Mackay ceased to be a Key Management Person as at 13 July 2009. Transfer out does not confirm the individual has disposed of the relevant
interest or ceased employment with the Group.
A. All the shares are inclusive of vested and unvested shares under the iSOFT Employee Loan Plan where applicable. The balance of unvested shares held by
an individual is disclosed in this Report
B. This amount includes the relevant interest in securities of the RJL Investments Pty Limited group of Companies, of which Brian Cohen and Gary Cohen
each have a 50% stake of 60,330,299 shares. This amount also includes the share and incentive plans in respect of Brian Cohen. This amount does not
include the relevant interests pursuant to a Pre-emption Deed under which RJL Investments Pty Ltd and Oceania Healthcare Technology Investments Pty
Limited each grant pre-emptive rights over their shares in the Company in favour of the other. Pre-emptive rights do not attach to more shares than the
number which, when added to the person’s existing voting power, equals 19.9%.
Note 38. Key management personnel disclosures - continued
The movement during the 2009 financial year in the number of ordinary securities in the Company held directly, indirectly or beneficially, by each Key
Management Person, including their personally related parties, is as follows:
Balance at 18-Aug-09
Transferred out during
the year
Acquired during
the year
Balance at the end of
the year
Disposed during
the year
Pro-rata entitlement
Apr-09
Balance at the start of
the year A
For the year ended 30 June 2009

Notes to the Financial Statements cONTiNued
118 iSOFT Group Limited Annual Report 2010 Financial Report for the year ended 30 June 2010
Executive Director
Gary Cohen ELP EPS 0.4145 0.9611 1,652,174 1,000,000 (472,500) - 2,179,674
SPG 0.3645 1.0699 2,277,173 - (902,173) - 1,375,000
Other 0.2974 0.6686 1,000,000 - - - 1,000,000
TSR 0.1938 0.7874 - 1,000,000 - - 1,000,000
Group Executives
Brian Cohen ELP EPS 0.2939 0.7730 250,000 750,000 - - 1,000,000
SPG 0.2703 0.7297 250,000 - - - 250,000
Other 0.1810 0.3885 777,110 - - - 777,110
TSR 0.1938 0.7874 - 750,000 - 750,000
ELP 15m n/a 0.1460 0.4295 575,152 - - - 575,152
Martin Deda ELP EPS 0.2965 0.7586 250,000 250,000 - - 500,000
SPG 0.2703 0.7297 250,000 - - - 250,000
TSR 0.1938 0.7874 - 250,000 - - 250,000
Stephen Garrington ELP EPS 0.5273 1.1436 885,694 250,000 (315,000) - 820,694
SPG 0.3541 0.6996 1,635,694 - (385,694) - 1,250,000
Other 0.4301 0.3500 3,000,000 - - - 3,000,000
TSR 0.1938 0.7874 - 250,000 - - 250,000
ELP 15m n/a 0.2343 0.6840 191,889 - - - 191,889
Total 12,994,886 4,500,000 (2,075,367) - 15,419,519
1. For plan types, structure and details of Long-Term Incentive plans, refer Note 39. The ELP Shares are granted with a limited recourse loan of which the
outstanding amount can be determined by multiplying the number of (un)vested shares with the ELP exercise price. As such, ELP Shares are in substance
options.
2. For performance hurdles, structure and details of ELP options, refer Note 39.
3. Weighted grant date fair value. For details of individual ELP option fair values, refer Note 39.
4. Weighted option exercise price reflects the amount payable in relation to the limited recourse loan attached to the ELP Share grant. For details of
individual ELP Share exercise prices refer Note 39.
5. Shares sold or transferred out of the ELP Plan. Transferred out does not mean that the individual has left the Consolidated Entity.
Note 38. Key management personnel disclosures - continued
Vested and unvested shareholding under the Employee Loan Plan (ELP)
The number of vested, but not yet exercised and unvested ELP shares in the Company held during the financial year by each Director and other members of
Key Management Personnel of the Consolidated Entity, held directly, indirectly or beneficially, by each Key Management Person, including their personally
related parties, is set out below:
Balance of vested and
unvestedoptions atthe end of
the year
Lapsed orforfeited
during the year
Balance of vested and
unvestedoptions at
the start of the year
Transferred out during the year5
Grantedduring
the year
Weightedoption
exerciseprice ($)4
Weighted grant datefair value3 per option
($)Hurdletype 2
Plantype 1
For the year ended 30 June 2010

119iSOFT Group Limited Annual Report 2010 Financial Report for the year ended 30 June 2010
Executive Director
Gary Cohen ELP EPS 0.3705 0.7914 1,652,174 - - - 1,652,174
SPG 0.2962 0.8137 2,652,173 - (375,000) - 2,277,173
Other 0.2974 0.6686 1,000,000 - - - 1,000,000
Stephen Garrington ELP EPS 0.4064 0.8374 885,694 - - - 885,694
SPG 0.3412 0.6903 1,885,694 - (250,000) - 1,635,694
Other 0.4301 0.3500 3,000,000 - - - 3,000,000
ELP 15m n/a 0.2343 0.70 143,237 48,652 - - 191,889
Group Executives
Brian Cohen ELP EPS 0.3016 0.7297 - 250,000 - - 250,000
SPG 0.2703 0.7297 - 250,000 - - 250,000
Other 0.1810 0.3885 777,110 - - - 777,110
ELP 15m n/a 0.1460 0.43 501,200 73,952 - - 575,152
Martin Deda ELP EPS 0.3016 0.7297 - 250,000 - - 250,000
SPG 0.2703 0.7297 - 250,000 - - 250,000
Ceased to be a KMP during the year:
Group Executives
Gordon Mackay ELP EPS 0.4064 0.8374 354,278 - - (354,278) -
SPG 0.4560 1.1667 354,277 - - (354,277) -
ELP 15m n/a 0.2095 0.60 312,284 - - (312,284) -
Total 13,518,121 1,122,604 (625,000) (1,020,839) 12,994,886
Note: Vested ELP grants are also included in this table. The exercise period is unlimited.
1. For plan types, structure and details of Long-Term Incentive plans, refer Note 39. The ELP Shares are granted with a limited recourse loan of which the
outstanding amount can be determined by multiplying the number of (un)vested shares with the ELP exercise price. As such, ELP Shares are in substance
options.
2. For performance hurdles, structure and details of ELP options, refer Note 39.
3. Weighted grant date fair value. For details of individual ELP option fair values, refer Note 39.
4. Weighted option exercise price reflects the amount payable in relation to the limited recourse loan attached to the ELP Share grant. For details of
individual ELP Share exercise prices refer Note 39.
5. Shares sold or transferred out of the ELP Plan. Transferred out does not mean that the individual has left the Consolidated Entity.
Note 38. Key management personnel disclosures - continued
Vested and unvested shareholding under the Employee Loan Plan (ELP)
The number of vested, but not yet exercised and unvested ELP shares in the Company held during the financial year by each Director and other members of
Key Management Personnel of the Consolidated Entity, held directly, indirectly or beneficially, by each Key Management Person, including their personally
related parties, is set out below:
Balance of vested and
unvestedoptions atthe end of
the year
Lapsed orforfeited
during the year
Balance of vested and
unvestedoptions at
the start of the year
Transferred out during the year5
Grantedduring
the year
Weightedoption
exerciseprice ($)4
Weighted grant datefair value3 per option
($)Hurdletype 2
Plantype 1
For the year ended 30 June 2009
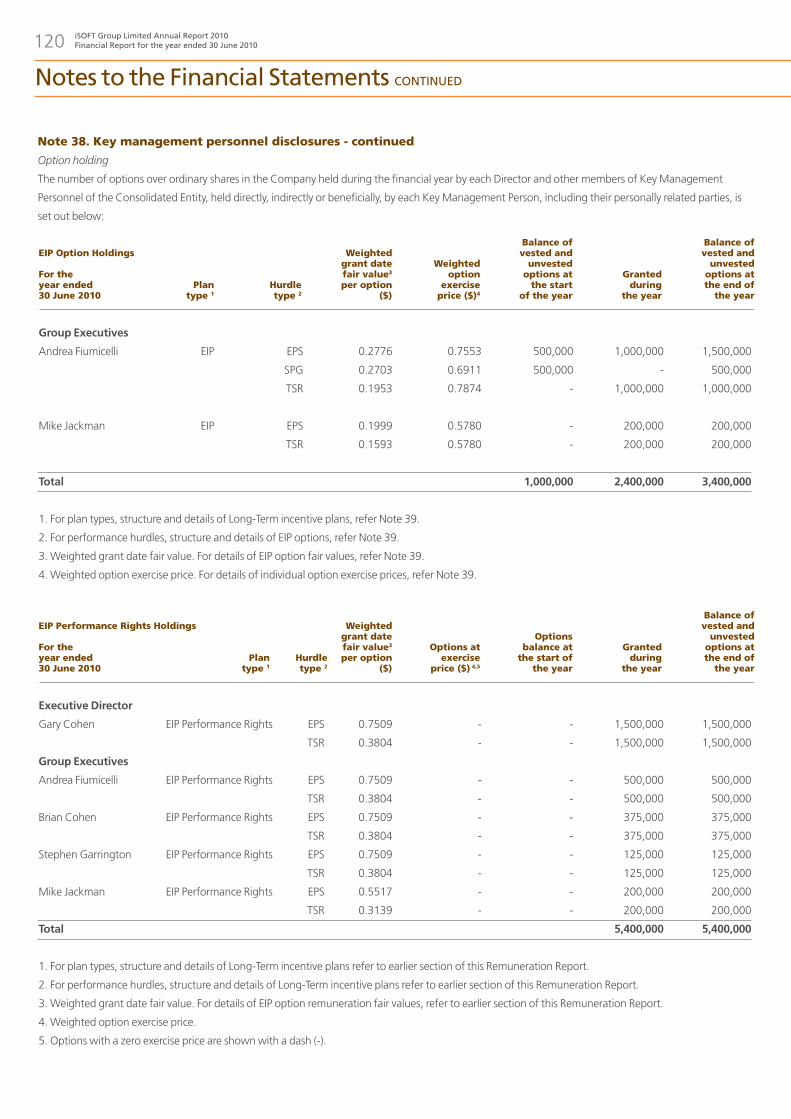
Notes to the Financial Statements cONTiNued
120 iSOFT Group Limited Annual Report 2010 Financial Report for the year ended 30 June 2010
Group Executives
Andrea Fiumicelli EIP EPS 0.2776 0.7553 500,000 1,000,000 1,500,000
SPG 0.2703 0.6911 500,000 - 500,000
TSR 0.1953 0.7874 - 1,000,000 1,000,000
Mike Jackman EIP EPS 0.1999 0.5780 - 200,000 200,000
TSR 0.1593 0.5780 - 200,000 200,000
Total 1,000,000 2,400,000 3,400,000
1. For plan types, structure and details of Long-Term incentive plans, refer Note 39.
2. For performance hurdles, structure and details of EIP options, refer Note 39.
3. Weighted grant date fair value. For details of EIP option fair values, refer Note 39.
4. Weighted option exercise price. For details of individual option exercise prices, refer Note 39.
Executive Director
Gary Cohen EIP Performance Rights EPS 0.7509 - - 1,500,000 1,500,000
TSR 0.3804 - - 1,500,000 1,500,000
Group Executives
Andrea Fiumicelli EIP Performance Rights EPS 0.7509 - - 500,000 500,000
TSR 0.3804 - - 500,000 500,000
Brian Cohen EIP Performance Rights EPS 0.7509 - - 375,000 375,000
TSR 0.3804 - - 375,000 375,000
Stephen Garrington EIP Performance Rights EPS 0.7509 - - 125,000 125,000
TSR 0.3804 - - 125,000 125,000
Mike Jackman EIP Performance Rights EPS 0.5517 - - 200,000 200,000
TSR 0.3139 - - 200,000 200,000
Total 5,400,000 5,400,000
1. For plan types, structure and details of Long-Term incentive plans refer to earlier section of this Remuneration Report.
2. For performance hurdles, structure and details of Long-Term incentive plans refer to earlier section of this Remuneration Report.
3. Weighted grant date fair value. For details of EIP option remuneration fair values, refer to earlier section of this Remuneration Report.
4. Weighted option exercise price.
5. Options with a zero exercise price are shown with a dash (-).
Note 38. Key management personnel disclosures - continued
Option holding
The number of options over ordinary shares in the Company held during the financial year by each Director and other members of Key Management
Personnel of the Consolidated Entity, held directly, indirectly or beneficially, by each Key Management Person, including their personally related parties, is
set out below:
Balance of vested and
unvestedoptions atthe end of
the year
Balance of vested and
unvestedoptions atthe end of
the year
Balance of vested and
unvestedoptions at
the start of the year
Options balance at
the start of the year
Grantedduring
the year
Grantedduring
the year
Weightedoption
exerciseprice ($)4
Options at exercise
price ($) 4,5
Weighted grant datefair value3 per option
($)
Weighted grant datefair value3 per option
($)
Hurdletype 2
Hurdletype 2
Plantype 1
Plantype 1
EIP Option Holdings
For the year ended 30 June 2010
EIP Performance Rights Holdings
For the year ended 30 June 2010

121iSOFT Group Limited Annual Report 2010 Financial Report for the year ended 30 June 2010
Group Executives
Andrea Fiumicelli 5 EIP EPS 0.3016 0.6911 - 500,000 500,000
SPG 0.2703 0.6911 - 500,000 500,000
Total - 1,000,000 1,000,000
1. For plan types, structure and details of Long-Term incentive plans, refer Note 39.
2. For performance hurdles, structure and details of EIP options, refer Note 39.
3. Weighted grant date fair value. For details of EIP option fair values, refer Note 39.
4. Weighted option exercise price. For details of individual EIP option exercise prices, refer Note 39.
5. Option exercise price was reset in accordance with ASX listing rule 6.22.
Anthony Sherlock held 100,000 options under the Employee Incentive Plan. These options with an exercise price of $0.72 and an expiry date of 4
November 2009 had all vested and were exercised on 4 November 2009.
Note 38. Key management personnel disclosures - continued
Balance of vested and
unvestedoptions atthe end of
the year
Balance of vested and
unvestedoptions at
the start of the year
Grantedduring
the year
Weighted option
exercise price ($) 4,5
Weighted grant datefair value
per option3
($)Hurdletype 2
Plantype 1
EIP Option Holdings
For the year ended 30 June 2009

Notes to the Financial Statements cONTiNued
122 iSOFT Group Limited Annual Report 2010 Financial Report for the year ended 30 June 2010
Note 39. Share-based payments
Selected employees are eligible to participate in the iSOFT employee share schemes, comprising the iSOFT Employee Loan Plan, iSOFT Employee Incentive
Plan, the iSOFT Employee Deferred Incentive Plan and the iSOFT Exempt Employee Share Plan. These plans are equity settled share-based payments plans.
Employee Loan Plan (ELP)
The ELP was last approved by shareholders on 6 November 2008 for the purpose of providing incentives and is a limited recourse loan share plan. The ELP
is managed by iSOFT Group ESP Managers Pty Limited, as trustee of the iSOFT Group ELP Trust under which employees of the Consolidated Entity may
acquire an interest in the Company’s shares.
It was established to provide equity incentives to selected employees including Executive Directors and is used as an LTI. Non-executive Directors are not
eligible to participate in the ELP. The Remuneration Committee determines the maximum amount of equity under the program to be issued with the
allocation to individual executives broadly in line with their past contribution and potential.
Limited recourse loans are provided interest free under the ELP to employees selected by the Remuneration Committee to enable them to acquire the
shares. Subject to satisfying any relevant performance or vesting conditions specified by the Remuneration Committee, the employee, after repaying the
loan, may direct that the trustee sell the shares or that the shares be transferred to them.
The Trustee will either subscribe for a new issue of shares or purchase shares on the ASX. Shares will be held on trust until the participant withdraws from
the ELP. Shares will either be purchased on-market at the prevailing market value or issued by the Company at the weighted average price at which the
shares were traded on the ASX during the one week period up to and including the date of issue or such other basis as the Remuneration Committee
determines.
Shares issued under the ELP carry full shareholder rights in relation to rights and bonus issues, voting and dividends, but will not participate in any dividend
reinvestment plan. From November 2009, rights to dividends are split; 40% cash to employees and 60% applied to the ELP loan.
Participants in the ELP must not enter into transactions or arrangements, including by way of derivatives or similar financial products, which limit the
economic risk of holding unvested awards.
In financial year 2010 Relative Total Shareholder Return was introduced as a performance hurdle given that it is widely recognised as one of the best
indicators of shareholder value creation. Additionally, the continued use of the combined performance hurdles weighted equally, motivate executives with
a clear line of sight to a shareholder focussed result. A comparator group of 15 ASX listed companies was adopted and the vesting of shares is based on
iSOFT’s performance compared to the comparator group, in relation to the TSR hurdle.
The performance hurdles of the ELP 3 year share plan were changed as outlined below.
Performance Hurdles
FY2009 FY2010
1. 50% Earnings Per Share (EPS); and 1. 50% Earnings Per Share (EPS) hurdle; and
2. 50% Share Price Growth (SPG) 2. 50% Relative Total Shareholder Return (TSR)

123iSOFT Group Limited Annual Report 2010 Financial Report for the year ended 30 June 2010
Note 39. Share-based payments - continued
The structure and details of shares or options issued to employees under the ELP are summarised in the following tables:
ELP 3 Year Share Options
Nature
Grant frequency
Eligibility criteria
Exercise price
Performance hurdles(Grants prior to 1 July 2009)
Performance hurdles(Grants after 1 July 2009)
Vesting period
Exercise period and expiry
Right to Dividends (Prior to 1 July 2009)
Right to Dividends (Post 1 July 2009)
Comparator Group
each eLP share entitles the participant to one share in the company upon vesting, subject to payment of the limited recourse note.
Annual grant and ad-hoc on commencement of employment and employee promotion.
Selected executives, in line with past contribution and future potential.
5-day VWAP preceding grant date
Earnings Per Share (EPS) - 50% of eLP Share grant
Based on the average annual compound ePS growth over a three year measurement period against a comparator group (15 comparable ASX 200 organisations): • Below Median (50th percentile) of comparator group – 0% of shares vest; • Median of comparator group – 25% of share options vest • 62.5nd percentile of comparator group – 50% of share options vest; • 75th percentile of comparator group – 75% of share options vest; • 80th percentile of comparator group – 100% of share options vest; and • Share option vesting levels are interpolated between each percentile above.
Share Price Growth (SPG) - 50% of eLP Share grant
Based on relative SPG performance over a three year measurement period against a comparator group (15 comparable ASX 200 organisations): • Below Median (50th percentile) of comparator group – 0% of share options vest; • Median of comparator group – 25% of share options vest • 62.5nd percentile of comparator group – 50% of share options vest; • 75th percentile of comparator group – 75% of share options vest; • 80th percentile of comparator group – 100% of share options vest; and • Share option vesting levels are interpolated between each percentile above.
Earnings Per Share (EPS) - 50% of eLP Share grant
Based on achieving 15% or more ePS compound growth over a 3 year period. • Less than 15% ePS compound growth – 0% of shares vest; and • 15% or greater ePS compound growth – 100% of shares vest
Relative Total Shareholder Return (TSR) - 50% of eLP Share grant
Based on relative TSR performance over a three year measurement period against a comparator group (15 comparable ASX 200 organisation): • Below Median (50th percentile) of comparator group - 0% of shares vest; • Median of comparator group - 25% of shares vest • 62.5nd percentile of comparator group - 50% of shares vest; • 75th percentile of comparator group - 75% of shares vest; • 80th percentile of comparator group - 100% of shares vest; and • Share option vesting levels are interpolated between each percentile above.
Three years from grant date. No retesting.
exercisable upon vesting with no lapse restriction.
Right to dividends.
Right to dividends are split 40% cash to employees and 60% applied to eLP loan.
Please see comparator Group Listing in this note.

Notes to the Financial Statements cONTiNued
124 iSOFT Group Limited Annual Report 2010 Financial Report for the year ended 30 June 2010
Note 39. Share-based payments - continued
The structure and details of shares or options issued to employees under the ELP are summarised in the following tables:
Shares held in trust are acquired on-market on or around the grant date or are newly issued. The trust issues a loan with limited recourse to the granted
shares to the individual executives. The trust has been consolidated in accordance with Note 1 (b) (ii). The on-market purchase price or closing bid price on
date of issue of the shares held by the trust and not yet issued to the employees at the reporting date are shown as treasury shares in equity (see note 26).
Loan shares are in substance options. Similarly to EIP grants, fair value of loan shares granted with an EPS hurdle are independently determined using
binomial option pricing model; those with a SPG or TSR hurdle using a Monte Carlo simulation model that takes into account the market condition,
expected volatility of the shares in the peer group and correlation of the underlying share price movements and those of the shares in the peer group. Both
valuation models take into account term of loan shares (for grants without an expiry date, 12 months exercise period has been assumed), the impact of
dilution and the following model inputs as detailed below:
ELP 15 Month Share Options
Nature
Grant frequency
Eligibility criteria
Exercise price
Performance hurdles
Vesting period
Exercise period and expiry
Right to Dividends
each eLP share entitles the participant to one share in the company upon vesting, subject to payment of the limited recourse note.
Quarterly/Annual grant based upon contractual obligations and performance of employees. This is not currently being offered
Selected executives, broadly in line with performance and future potential.
5-day VWAP preceding grant date
Time based vesting.
Fifteen months from grant date
exercisable upon vesting with no lapse restriction.
Right to dividends.
18-Nov-09 ELP EPS 0.7800 42.07 1.495 4.909 0.7874
18-Nov-09 ELP TSR 0.7800 42.07 1.495 4.909 0.7874
18-Dec-09 ELP EPS 0.7300 39.94 1.495 4.489 0.7083
18-Dec-09 ELP TSR 0.7300 39.94 1.495 4.489 0.7083
18-Dec-09 ELP EPS 0.7300 39.94 1.495 4.489 0.7083
18-Dec-09 ELP TSR 0.7300 39.94 1.495 4.489 0.7083
Option exerciseprice ($)
Expected dividend yield (%)
Risk free rate (%)
Expectedvolatility
(%)
Share price at Grant date ($)
Hurdletype
Plantype
Option model inputs for Loan Shares granted in the ELP during the year ended 30 June 2010
Grant date

ELP Grants during the year ended 30 June 2010
Hurdle type
ELP Grants during the year ended 30 June 2009
Hurdle type
125iSOFT Group Limited Annual Report 2010 Financial Report for the year ended 30 June 2010
Note 39. Share-based payments - continued
EPS 0.3268 0.7696 5,367,146 2,506,625 (1,263,500) (536,500) 6,073,771
Service only 0.2140 0.6427 581,017 - - (466,319) 114,698
SPG 0.2262 0.6714 3,917,144 - (1,792,144) - 2,125,000
TSR 0.1836 0.7793 - 2,506,625 - - 2,506,625
9,865,307 5,013,250 (3,055,644) (1,002,819) 10,820,094
EPS 0.3450 0.7651 2,892,146 2,475,000 - - 5,367,146
Service only 0.2473 0.7380 529,519 581,017 - (529,519) 581,017
SPG 0.2473 0.7380 2,892,144 2,475,000 (725,000) (725,000) 3,917,144
6,313,809 5,531,017 (725,000) (1,254,519) 9,865,307
16-Jul-08 ELP 15 m Service only 0.5798 47.61 0 7.77 0.5900
24-Sep-08 ELP 3yr EPS 0.7202 45.9 0 5.5 0.7297
24-Sep-08 ELP 3yr SPG 0.7202 45.9 0 5.5 0.7297
08-Oct-08 ELP 15 m Service only 0.7602 51.73 0 5.22 0.7250
10-Dec-08 ELP 3yr EPS 0.5593 49.21 0 3.5 0.5593
10-Dec-08 ELP 3yr SPG 0.5593 49.21 0 3.5 0.5593
12-Jan-09 ELP 15 m Service only 0.6034 53.14 0 3.22 0.6400
02-Apr-09 ELP 15 m Service only 0.6050 54.36 0 2.9 0.6250
30-Jun-09 ELP 15 m Service only 0.6450 54.03 0 3.43 0.6461
30-Jun-09 ELP 3yr EPS 0.6450 49.46 0 4.57 0.6424
30-Jun-09 ELP 3yr SPG 0.6450 49.46 0 4.57 0.6424
Expected volatility is based on the implied volatility of publicly traded options over the Company’s share, the historic volatility of the market price of the
Company’s share and the mean reversion tendency of volatilities. Expected volatility of each company in the peer group is determined on the historic
volatility of the companies’ share prices. Each of these assumptions has been based on two years’ historic volatility data.
The weighted average fair value of the loan shares granted during the year was $0.2357 (2009: $0.2758). The weighted average exercise price is $0.7793
(2009: $0.7041). The weighted average remaining contractual life of the loan shares is unlimited as ELP grants have no expiry once vested. The following
table provides additional information of 2010 and 2009 grants by hurdle type
Unvested ELP shares at
the end of the year
Unvested ELP shares at
the end of the year
Option exerciseprice ($)
Lapsed or forfeited
during the year
Lapsed or forfeited
during the year
Expected dividend yield (%)
Vested during
the year
Vested during
the year
Risk free rate (%)
Granted as compensation
during the year
Granted as compensation
during the year
Expectedvolatility
(%)
Unvested ELP shares at
the start of the year
Unvested ELP shares at
the start of the year
Share price at Grant date ($)
Weighted Average exercise
price
Weighted Average exercise price ($)
Hurdletype
Grant date weighted aver-
age fair value per ELP share
Grant date weighted aver-
age fair value per ELP share ($)
Plantype
Option model inputs for Loan Shares granted in the ELP during the year ended 30 June 2009
Grant date

Unvested ELP Grants for the year ended 30 June 2010
Grant date
Notes to the Financial Statements cONTiNued
126 iSOFT Group Limited Annual Report 2010 Financial Report for the year ended 30 June 2010
09-Nov-06 30-Sep-09 EPS 0.5477 1.0184 1,450,000 - (913,500) (536,500) -
03-Mar-08 30-Sep-10 EPS 0.2232 0.6027 1,442,146 - - - 1,442,146
03-Mar-08 30-Jun-10 SPG 0.1529 0.6027 1,442,144 - (1,442,144) - -
16-Jul-08 30-Sep-09 Service only 0.1936 0.5900 123,582 - - (123,582) -
24-Sep-08 30-Sep-11 EPS 0.3016 0.7297 2,050,000 - (200,000) - 1,850,000
24-Sep-08 04-Sep-11 SPG 0.2703 0.7297 2,050,000 - (200,000) - 1,850,000
08-Oct-08 31-Dec-09 Service only 0.2732 0.7250 104,297 - - (104,297) -
10-Dec-08 04-Sep-11 EPS 0.2278 0.5593 100,000 - - - 100,000
10-Dec-08 04-Sep-11 SPG 0.1970 0.5593 100,000 - - - 100,000
12-Jan-09 31-Mar-10 Service only 0.1936 0.6400 117,733 - - (117,733) -
02-Apr-09 30-Jun-10 Service only 0.1980 0.6250 120,707 - - (120,707) -
30-Jun-09 30-Sep-10 Service only 0.2199 0.6461 114,698 - - - 114,698
30-Jun-09 30-Jun-12 EPS 0.2909 0.6424 325,000 - (150,000) - 175,000
30-Jun-09 30-Jun-12 SPG 0.2824 0.6424 325,000 - (150,000) - 175,000
18-Nov-09 30-Jun-12 EPS 0.2913 0.7874 - 2,250,000 - - 2,250,000
18-Nov-09 30-Jun-12 TSR 0.1938 0.7874 - 2,250,000 - - 2,250,000
18-Dec-09 01-Mar-12 EPS 0.2570 0.7083 - 231,625 - - 231,625
18-Dec-09 01-Mar-12 TSR 0.0867 0.7083 - 231,625 - - 231,625
18-Dec-09 30-Jun-12 EPS 0.2671 0.7083 - 25,000 - - 25,000
18-Dec-09 30-Jun-12 TSR 0.1614 0.7083 - 25,000 - - 25,000
9,865,307 5,013,250 (3,055,644) (1,002,819) 10,820,094
As at 30 June 2010, the following ELP shares are outstanding and are held by the trust: 23,034,947 ELP shares in the Company (2009: 21,180,090),
of which 10,820,094 are unvested (2009: 9,865,307), with the balance amounting to 12,214,853 shares vested and currently exercisable (2009:
11,314,783). No ELP shares expire as the life is unlimited.
Grant Date fair value
per ELP share ($)
Exercise Price
Unvested ELP shares at
the start of the year
Granted as compensa-
tion during the year
Lapsed or forfeited
during the year
Vested during
the year
Unvested ELP shares at the end
of the yearVesting date
Hurdle type
Note 39. Share-based payments - continued
The following tables summarised information about loan shares held by employees as at 30 June 2010 and 30 June 2009:

Unvested ELP Grants for the year ended 30 June 2009
Grant date
127iSOFT Group Limited Annual Report 2010 Financial Report for the year ended 30 June 2010
09-Nov-06 30-Jun-09 SPG 0.4618 1.0184 1,450,000 - (725,000) (725,000) -
09-Nov-06 30-Sep-09 EPS 0.5477 1.0184 1,450,000 - - - 1,450,000
09-Jul-07 30-Sep-08 Service only 0.3837 1.2150 60,804 - - (60,804) -
09-Jul-07 09-Jul-08 Service only 0.3564 1.2150 60,058 - - (60,058) -
28-Sep-07 31-Dec-08 Service only 0.3044 0.9335 81,362 - - (81,362) -
28-Sep-07 28-Sep-08 Service only 0.2866 0.9335 78,316 - - (78,316) -
17-Jan-08 31-Mar-09 Service only 0.2723 0.7400 104,180 - - (104,180) -
03-Mar-08 30-Sep-10 EPS 0.2232 0.6027 1,442,146 - - - 1,442,146
03-Mar-08 30-Jun-10 SPG 0.1529 0.6027 1,442,144 - - - 1,442,144
17-Apr-08 30-Jun-09 Service only 0.2071 0.5050 144,799 - - (144,799) -
16-Jul-08 30-Sep-09 Service only 0.1936 0.5900 - 123,582 - - 123,582
24-Sep-08 30-Sep-11 EPS 0.3016 0.7297 - 2,050,000 - - 2,050,000
24-Sep-08 04-Sep-11 SPG 0.2703 0.7297 - 2,050,000 - - 2,050,000
08-Oct-08 31-Dec-09 Service only 0.2732 0.7250 - 104,297 - - 104,297
10-Dec-08 04-Sep-11 EPS 0.2278 0.5593 - 100,000 - - 100,000
10-Dec-08 04-Sep-11 SPG 0.1970 0.5593 - 100,000 - - 100,000
12-Jan-09 31-Mar-10 Service only 0.1936 0.6400 - 117,733 - - 117,733
02-Apr-09 30-Jun-10 Service only 0.1980 0.6250 - 120,707 - - 120,707
30-Jun-09 30-Sep-10 Service only 0.2199 0.6461 - 114,698 - - 114,698
30-Jun-09 30-Jun-12 EPS 0.2909 0.6424 - 325,000 - - 325,000
30-Jun-09 30-Jun-12 SPG 0.2824 0.6424 - 325,000 - - 325,000
Total 6,313,809 5,531,017 (725,000) (1,254,519) 9,865,307
Grant Date fair value
per ELP share ($)
Exercise Price
Unvested ELP shares at
the start of the year
Granted as compensa-
tion during the year
Lapsed or forfeited
during the year
Vested during
the year
Unvested ELP shares at the end
of the yearVesting date
Hurdle type
Note 39. Share-based payments - continued
Employee Incentive Plan (EIP)
The EIP was established in 2008 to provide equity incentives to executives including Executive Directors and key employees. Awards granted under the EIP
may include options, performance rights, cash rights and stock appreciation rights. From 2008 EIP options have been granted. In 2009 the Remuneration
Committee also approved the issuing of performance rights under the EIP plan. No cash rights and stock appreciation rights have been granted.
The Remuneration Committee determines the maximum amount of equity under the program to be issued with the allocation to executives broadly in
line with their potential (as a sign-on award) or past contribution (as a performance reward/retention tool). In FY2010 iSOFT introduced Relative Total
Shareholder Return as a performance hurdle since it is widely recognised as one of the best indicators of shareholder value creation. Additionally, the
continued use of the combined performance hurdles weighted equally, motivate executives with a clear line of sight to a shareholder focussed result. A
comparator group of 15 ASX listed companies was adopted and the vesting of options is based on iSOFT’s performance compared to the comparator
group, in relation to the relative TSR hurdle.
The performance hurdles of the EIP were changed as outlined below.
Performance Hurdles
FY2009 FY2010
1. 50% Earnings Per Share (EPS); and 1. 50% Earnings Per Share (EPS) hurdle; and
2. 50% Share Price Growth (SPG) 2. 50% Relative Total Shareholder Return (TSR)

Notes to the Financial Statements cONTiNued
128 iSOFT Group Limited Annual Report 2010 Financial Report for the year ended 30 June 2010
Note 39. Share-based payments - continued
The structure and details of EIP Options and Performance Rights issued to executives under the Plan are summarised in the following table:
EIP Options
Nature
Grant frequency
Eligibility Criteria
Exercise price
Performance hurdles(Grants prior to 1 July 2009)
Performance hurdles(Grants after 1 July 2009)
Vesting Period
Exercise period and expiry
Right to Dividends
Comparator Group
each eiP Option entitles the participant to one share in the company upon vesting, subject to payment of an exercise price.
Annual grant and ad-hoc on commencement of employment and future potential grants.
Selected executives, broadly in line with past contribution and future potential.
5-day VWAP preceding grant date.
Earnings Per Share (EPS) - 50% of eiP Option grant
Based on the average annual compound ePS growth over a three year measurement period against a comparator group (15 comparable ASX 200 organisations): • Below Median (50th percentile) of comparator group – 0% of shares vest; • Median of comparator group – 25% of share options vest • 62.5nd percentile of comparator group – 50% of share options vest; • 75th percentile of comparator group – 75% of share options vest; • 80th percentile of comparator group – 100% of share options vest; and • Share option vesting levels are interpolated between each percentile above.
Share Price Growth (SPG) - 50% of eiP Option grant
Based on relative SPG performance over a three year measurement period against a comparator group (15 comparable ASX 200 organisations): • Below Median (50th percentile) of comparator group – 0% of share options vest; • Median of comparator group – 25% of share options vest • 62.5nd percentile of comparator group – 50% of share options vest; • 75th percentile of comparator group – 75% of share options vest; • 80th percentile of comparator group – 100% of share options vest; and • Share option vesting levels are interpolated between each percentile above.
Earnings Per Share (EPS) - 50% of eiP option grant Based on achieving 15% or more ePS compound growth over 3 year period. • Less than 15% ePS compound growth – 0% of options vest; and • 5% or greater ePS compound growth – 100% of options vest.
Relative Total Shareholder Return (TSR) - 50% of eiP Option grant
Based on TSR performance over a three year measurement period against a comparator group (15 comparable ASX 200 organisation):
• Below Median (50th percentile) of comparator group - 0% of options vest; • Median of comparator group - 25% of options vest • 62.5nd percentile of comparator group - 50% of options vest; • 75th percentile of comparator group - 75% of options vest; • 80th percentile of comparator group - 100% of options vest; and • Share option vesting levels are interpolated between each percentile above.
Three years from grant date. No retesting.
exercisable upon vesting with lapse 5 years after grant date.
No dividend rights until option exercised.
Please see comparator Group Listing in this note.

129iSOFT Group Limited Annual Report 2010 Financial Report for the year ended 30 June 2010
Note 39. Share-based payments - continued
EIP – Performance Rights
Nature
Grant frequency
Eligibility Criteria
Exercise price
Performance hurdles
Vesting Period
Exercise period and expiry
Right to Dividends
Comparator Group
each eiP performance right entitles the participant to one share in the company upon vesting, or equivalent cash award.
Annual grant and ad-hoc on commencement of employment and future potential grants.
Selected executives, broadly in line with past contribution and future potential.
$0.00
Earnings Per Share (EPS) - 50% of eiP performance rights grant
Based on achieving 15% or more ePS compound growth over 3 year period. • Less than 15% ePS compound growth – 0% of rights vest; and • 15% or greater ePS compound growth – 100% 0% of rights vest.
Relative Total Shareholder Return (TSR) - 50% of eiP performance rights grant
Based on TSR performance over a three year measurement period against a comparator group (15 comparable ASX 200 organisation): • Below Median (50th percentile) of comparator group - 0% of performance rights vest; • Median of comparator group - 25% of performance rights vest • 62.5nd percentile of comparator group - 50% of performance rights vest; • 75th percentile of comparator group - 75% of performance rights vest; • 80th percentile of comparator group - 100% of performance rights vest; and • Performance right vesting levels are interpolated between each percentile above.
Three years from grant date. No retesting.
exercised upon vesting in the form of a share or equivalent cash award.
No right to dividends until shares received.
Please see comparator Group Listing in this note.

Notes to the Financial Statements cONTiNued
130 iSOFT Group Limited Annual Report 2010 Financial Report for the year ended 30 June 2010
Note 39. Share-based payments - continued
Fair value of granted with an EPS hurdle is independently determined using binomial option pricing model; those with a SPG or TSR hurdle using Monte
Carlo simulation model that takes into account the market condition, expected volatility of the shares in the peer group and correlation of the underlying
share price movements and those of the shares in the peer group. Both valuation models take into account term of options, the impact of dilution and the
following model inputs as follows:
18-Nov-09 EIP EPS 0.7800 42.07 1.495 4.909 -
18-Nov-09 EIP TSR 0.7800 42.07 1.495 4.909 -
18-Nov-09 EIP EPS 0.7800 42.07 1.495 4.909 -
18-Nov-09 EIP TSR 0.7800 42.07 1.495 4.909 -
18-Nov-09 EIP EPS 0.7800 42.07 1.495 4.909 0.7874
18-Nov-09 EIP TSR 0.7800 42.07 1.495 4.909 0.7874
06-Apr-10 EIP EPS 0.5700 40.34 1.156 5.341 0.5780
06-Apr-10 EIP TSR 0.5700 40.34 1.156 5.341 0.5780
06-Apr-10 EIP EPS 0.5700 40.34 1.156 5.341 -
06-Apr-10 EIP TSR 0.5700 40.34 1.156 5.341 -
13-Apr-10 EIP EPS 0.5800 40.61 1.156 5.250 0.5800
13-Apr-10 EIP TSR 0.5800 40.61 1.156 5.250 0.5800
13-Apr-10 EIP EPS 0.5800 40.61 1.156 5.250 -
13-Apr-10 EIP TSR 0.5800 40.61 1.156 5.250 -
1 Options with a zero exercise price are shown with a dash (-).
24-Sep-08 EIP EPS 0.7202 45.9 0 5.5 0.7297
24-Sep-08 EIP SPG 0.7202 45.9 0 5.5 0.7297
Expected volatility is based on the implied volatility of publicly traded options over the Company’s share, the historic volatility of the market price of the
Company’s share and the mean reversion tendency of volatilities. Expected volatility of each company in the peer group is determined on the historic
volatility of the companies’ share prices. Each of these assumptions has been based on two years’ historic volatility data.
Option exercise1
price ($)
Option exercise1
price ($)
Expected dividend yield (%)
Expected dividend yield (%)
Risk free rate (%)
Risk free rate (%)
Expectedvolatility
(%)
Expectedvolatility
(%)
Share price at Grant date ($)
Share price at Grant date ($)
Hurdletype
Hurdletype
Plantype
Plantype
Option model inputs for Options granted in the EIP during the year ended 30 June 2010
Grant date
Option model inputs for Options granted in the EIP during the year ended 30 June 2009
Grant date

131iSOFT Group Limited Annual Report 2010 Financial Report for the year ended 30 June 2010
Note 39. Share-based payments - continued
The weighted average fair value of the share options granted during the year was $0.3481 (2009: $0.2860). The weighted average exercise price is
$0.5282 (2009: $0.7202). The weighted average remaining contractual life of the share options at 30 June 2010 is 4.97 years (2009: 4.95 years). The
following table summarised information about outstanding options held by employees, which are all non-exercisable, as at 30 June 2010 and 30 June
2009:
30-Sep-11 04-Sep-13 EPS 0.7297 0.3016 6,600,000 - (150,000) 6,450,000
30-Sep-11 04-Sep-13 SPG 0.7297 0.2703 6,600,000 - (150,000) 6,450,000
30-Jun-12 18-Nov-14 EPS - 0.7509 - 1,500,000 - 1,500,000
30-Jun-12 18-Nov-14 TSR - 0.3804 - 1,500,000 - 1,500,000
30-Jun-12 18-Nov-14 EPS - 0.7509 - 1,000,000 - 1,000,000
30-Jun-12 18-Nov-14 TSR - 0.3804 - 1,000,000 - 1,000,000
30-Jun-12 18-Nov-14 EPS 0.7874 0.2913 - 1,000,000 - 1,000,000
30-Jun-12 18-Nov-14 TSR 0.7874 0.1938 - 1,000,000 - 1,000,000
06-Apr-13 06-Apr-15 EPS 0.5780 0.1999 - 350,000 - 350,000
06-Apr-13 06-Apr-15 TSR 0.5780 0.1593 - 350,000 - 350,000
06-Apr-13 06-Apr-15 EPS - 0.5517 - 500,000 - 500,000
06-Apr-13 06-Apr-15 TSR - 0.3139 - 500,000 - 500,000
06-Apr-13 06-Apr-15 EPS 0.5780 0.2066 - 100,000 - 100,000
06-Apr-13 06-Apr-15 TSR 0.5780 0.1664 - 100,000 - 100,000
06-Apr-13 06-Apr-15 EPS - 0.5614 - 50,000 - 50,000
06-Apr-13 06-Apr-15 TSR - 0.3190 - 50,000 - 50,000
13,200,000 9,000,000 (300,000) 21,900,000
1. Options with a zero exercise price are shown with a dash (-).
30-Sep-11 04-Sep-13 EPS 0.7297 0.3016 - 6,950,000 (350,000) 6,600,000
04-Sep-11 04-Sep-13 SPG 0.7297 0.2703 - 6,950,000 (350,000) 6,600,000
- 13,900,000 (700,000) 13,200,000
On 9 November 2004, 100,000 options were granted and approved by Shareholders, with an exercise price of $0.72 and an expiry date of 4 November
2009. These options have all vested and were exercised on 4 November 2009 (refer Note 38).
Balance of options at the end of
the year
Balance of options at the end of
the year
Options granted as compensa-
tion during the year
Options granted as compensa-
tion during the year
Options lapsed or forfeited
during the year
Options lapsed or forfeited
during the year
Grant date fair value
per option ($)
Grant date fair value
per option ($)
Balance of options at
the start of the year
Balance of options at
the start of the year
Option Exercise
price ($)1
Option Exercise
price ($)1
Expiry Date
Expiry Date
For the year ended 30 June 2010
Vesting date
For the year ended 30 June 2009
Vesting date
Hurdle type
Hurdle type

Notes to the Financial Statements cONTiNued
132 iSOFT Group Limited Annual Report 2010 Financial Report for the year ended 30 June 2010
Note 39. Share-based payments - continued
Employee Deferred Incentive Plan (EDIP)
The EDIP, last approved by shareholders 6 November 2008, is a unit trust under which employees of the Consolidated Entity may acquire an interest in the
Company’s shares. It was established to allow eligible employees the opportunity to invest in the Company’s shares by sacrificing salary or bonuses. The
Remuneration Committee may invite full or part time employees of the Consolidated Entity (including Executive Directors of the Company) to participate in
the EDIP. Non-executive Directors are not eligible to participate in the EDIP. Contributions to the EDIP will be determined by the Remuneration Committee
from time to time in consultation with the participant.
Shares will either be purchased on-market at the prevailing market value or issued by the Company at the weighted average price at which the shares
were traded on the ASX during the one week period up to and including the date of issue or such other basis as the Remuneration Committee determines.
Shares will be held on trust until the participant withdraws from the EDIP. Generally, a participant may withdraw their shares from the EDIP (or authorise
the trustee to sell the shares on the ASX and pass the proceeds to the participant) at any time subject to the Company’s share trading policy and any
administrative restrictions imposed. Shares issued under the EDIP carry full shareholder rights such as in relation to rights and bonus issues, voting and
dividends but will not participate in any dividend reinvestment plan. From 30 June 2009, offers under the EDIP have been indefinitely suspended.
Further information is summarised in the below table for the year ended 30 June 2010 and 30 June 2009:
Exempt Employee Share Plan (EESP)
The EESP, last approved by shareholders 5 November 2005, is a trust-based plan under which employees of the Company and its subsidiaries may acquire
an interest in the Company’s shares. It was established to allow eligible employees the opportunity to invest in the Company’s shares by sacrificing salary
and so access the tax concessions available for Australian tax residents. The Plan is not currently operational.
Other share-based payments
For warrants issued or outstanding during the period and comparative period, refer to Note 26. In total 0.6 million options are outstanding over ordinary
shares in the Company that were issued in previous years in consideration of acquisitions (2009: 5.6 million); refer note 26.
4,162,424 - (412,179) 3,750,245
2,498,352 6,404,097 (4,740,025) 4,162,424
Balance at start of the
year
Balance at start of the
year
Acquisitions during the
year
Acquisitions during the
year
Disposals during the
year
Disposals during the
year
Balance at the end of
the year
Balance at the end of
the year
For the year ended 30 June 2010
For the year ended 30 June 2009

133iSOFT Group Limited Annual Report 2010 Financial Report for the year ended 30 June 2010
Note 39. Share-based payments - continued
Summary
The following table is a summary of loan shares and options granted pursuant to the plans and the related expenses recognised in the period:
Fair value of loan shares granted under the ELP to participating employees during the year 1,182 1,526
Fair value of options granted under the EIP to participating employees during the year 3,929 3,975
5,111 5,501
Loan shares granted under the ELP 831 768
Options granted under the EIP 1,676 656
2,507 1,424
Share-based payments expense arising from:
2009$’000
2009$’000
2010$’000
2010$’000
ASX Company Name ASX Company Name
Reserve list ASX Company Name
Reserve list ASX Company Name
1 ALS Alesco corporation Limited
2 eHL emeco Holdings Limited
3 HSP Healthscope Limited
4 HST Hastie Group Limited
5 idL industrea Limited
6 iRe iReSS Market Technology Limited
7 MYO MYOB Limited
8 OKN Oakton Limited
9 PXS Pharmaxis Ltd
10 SGT Singapore Telecommunications Limited
11 SKe Skilled Group Limited
12 SLM Salmat Limited
13 SLX Silex Systems Limited
14 SPT Spotless Group Limited
15 WTF Wotif.com Holdings Limited
1 AHd Amalgamated Holdings Limited
2 ANN Ansell Limited
3 cdu cudeco Limited
4 cXP corporate express Australia Limited
5 eHL emeco Holdings Limited
6 FPH Fisher & Paykel Healthcare corporation Limited
7 HSP Healthscope Limited
8 iRe iReSS Market Technology Limited
9 PXS Pharmaxis Ltd
10 SAi SAi Global Limited
11 SiP Sigma Pharmaceuticals Limited
12 SLM Salmat Limited
13 SOT SP Telemedia Limited
14 SPT Spotless Group Limited
15 WTF Wotif.com Holdings Limited
1 cRG crane Group Limited
2 FWd Fleetwood corporation Limited
3 GWT GWA international Limited
4 iFL iOOF Holdings Limited
5 TAL Tower Australia Group Limited
Note: For future issues, the Board reserves the right to review the composition of the comparator group and hurdles to ensure it is appropriate as a relative measure of performance of the Company.
Comparator Group for grants prior to 1 July 2009 Comparator Group for grants from 1 July 2009
1 FWd Fleetwood corporation Limited
2 GWT GWA international Limited
3 iFL iOOF Holdings Limited
4 TAL Tower Australia Group Limited

Notes to the Financial Statements cONTiNued
134 iSOFT Group Limited Annual Report 2010 Financial Report for the year ended 30 June 2010
Note 40. Related party transactions
(i) Ultimate parent
The ultimate parent entity of the Consolidated Entity is iSOFT Group Limited, a company domiciled in Australia. The registered office is Darling Park, Tower
2, Level 27, 201 Sussex Street, Sydney, New South Wales, Australia.
(ii) Subsidiaries
The Consolidated Entity’s interest in subsidiaries is set out in Note 33. Transactions between the Consolidated Entity and its subsidiaries principally arise
from granting loans, the provision of administrative services and provision of rights to use Intellectual Property and Trademarks in connection with the sale
of iSOFT products and rendering of services to customers.
During the year, the following transactions occurred and have been made on behalf of employees to defined contribution and defined benefit plans:
Expenses
Superannuation contributions paid on behalf of employees 11,431 11,627
(iii) Jointly controlled entities
The Consolidated Entity has interest in 13 jointly controlled entities (refer Note 34). There were no significant transactions with these entities during the
current and comparative period.
(iv)Special purpose entities
In connection with the operation of the Employee Loan Plan, the Company has an unsecured, zero coupon loan amounting to $4.1 million (2009: $11.3
million) with the iSOFT Group ESP Managers Pty Limited, as trustee of the iSOFT Group ELP Trust. During the year, the Company advanced Nil (2009: $3.8
million) to the trustee in connection with shares made available to the trustee representing share grants made.
(v) Key management personnel
Disclosures relating to key management personnel are set out in Note 38.
(vi) Transactions with Oceania Healthcare Technology Investments Pty Limited
Oceania Healthcare Technology Investments Pty Limited (OCP), has significant influence over the Consolidated Entity by virtue of its ability to appoint
two Directors on the Board of Directors and as at 30 June 2010, a 25.3% (2009: 25.9%) equity interest in the Company. During the year, the following
transactions occurred with OCP:
Expenses
Directors fee (refer Note 38) 240 186
Finance costs
Interest on subordinated secured borrowings1 - 8,517
Interest on convertible notes2 2,760 2,257
1. Including amortised fees
2. Imputed interest at comparable interest rate, non-payable (refer Note 22)
2009$’000
2009$’000
2010$’000
2010$’000

135iSOFT Group Limited Annual Report 2010 Financial Report for the year ended 30 June 2010
Note 40. Related party transactions - continued
Convertible notes and ordinary shares transactions with the Company
Subscription to convertible notes - 7,224
Conversion into ordinary shares in the Company - (7,224)
Non-renounceable rights issue subscription to ordinary shares in the Company - 58,405,141
During the year ended 30 June 2009, the Company agreed with OCP to pay a funding advisory and structuring fee amounting to $0.5 million.
Subordinated secured borrowings
On 29 October 2008, the Consolidated Entity extended its loan with OCP amounting to $57 million to 30 June 2009. The loan was transferred from
iSOFT Group plc to the Company on that day and a fee was agreed and capitalised onto the loan amounting to $1.6 million. On 29 March 2009, the loan
principal of $60.0 million and interest of $1.9 million was repaid from the proceeds of the non-renounceable rights issue.
Warrants
During the reporting period, no warrants were issued (2009: 2,923,751) in connection with the terms and conditions of the subordinated secured
borrowings from OCP, which were repaid during the corresponding period. The warrants initially had an exercise price of $0.20 per warrant, which was
reset to $0.1614 following the exercise of the anti-dilution clause under the terms and conditions of the warrants.
The significant terms and conditions of the 4,203,747 warrants on issue are as follows:
Subscription dates monthly from 29 October 2008 to 27 March 2009
Subscription price none
Nominal value $0.90
Maturity date 3 years after the date of their issue
Conversion at any time, at the holder’s option
Strike ratio one warrant entitles the holder to subscribe to one ordinary share in the Company
Conversion price initially $0.20 but reset to $0.1614 from pro-rata entitlement offer
Anti-dilution clause included
Trading restrictions none
Dividend entitlement none
2009$’000
2009Number of
Shares
2010$’000
2010
Number of Shares

Notes to the Financial Statements cONTiNued
136 iSOFT Group Limited Annual Report 2010 Financial Report for the year ended 30 June 2010
Note 41. Exchange rates
The Consolidated Entity’s financial performance and financial position is significantly influenced by foreign exchange rate fluctuations. The exchange rates
of significant operating countries of the Consolidated Entity that applied during the year are as follows:
Note 42. Parent entity disclosures
For the year ended 30 June 2010, the parent company of the Group was iSOFT Group Limited.
Information relating to the parent entity
AUD to 1 GBP 1.8054 2.1720 1.7587 2.0521
AUD to 1 Euro 1.5737 1.8577 1.4247 1.7455
AUD to 1 Malaysian Ringgit 0.3386 0.3791 0.3589 0.3510
AUD to 1 Indian Rupee 0.0244 0.0270 0.0251 0.0255
The average exchange rates have been calculated by applying a weighted average according to the revenue of the Consolidated Entity.
Current assets 72,422 101,098
Total assets 318,290 742,562
Current liabilities 12,915 16,323
Total liabilities 53,888 51,564
Issued capital 747,441 728,960
Retained earnings (507,633) (59,988)
Options & Warrants reserve 6,430 6,430
Share-based payments reserve 7,863 5,357
Foreign currency translation reserve 28 (34)
Option premium reserve 10,273 10,273
Total shareholders’ equity 264,402 690,998
(Loss) or profit of the parent entity (437,048) 14,257
Other comprehensive income/(expense)
Foreign currency translation differences 62 28
Total comprehensive income of the parent entity (436,986) 14,285
Impairment expense amounting to $405 million was recognised in the parent company (2009: NIL).
Parent Entity contingencies
The parent entity entered into Letters of Credit and guarantees amounting to $5.39 million as at 30 June 2010 (2009: $2.4 million).
Parent Entity capital commitments
The parent entity has not entered into any capital commitments as at 30 June 2010 (2009: NIL).
Parent Entity guarantees in respect of debts of its subsidiaries
The parent entity entered into guarantees in respect of debts of its subsidiaries amounting to $1.74 million as at 30 June 2010 (2009: $1.74 million).
As at 30 June
2009Closing
2009$’000
As at 30 June
2010Closing
2010$’000
Year end 30 June
2009Average
Year ended 30 June
2010Average

137iSOFT Group Limited Annual Report 2010 Financial Report for the year ended 30 June 2010
Note 43. Events occurring after balance date
Issuance of equity
Since the reporting date, the Company issued 32,601,849 shares to YA Global Master SPV Ltd under the Yorkville Agreement, raising $4,631,583.
Reorganisation of Senior Debt Facilities
Owing to the recent trading position of the Consolidated Entity, a restructure of the Consolidated Entity’s senior debt facilities is required as well as a review
of its capital structure. On 29 September 2010, the Consolidated Entity received a commitment letter from the senior lenders, which is fully underwritten,
credit approved and binding commitment documentation setting out the terms on which the senior lenders have agreed to extend the Consolidated
Entity’s existing senior debt facilities and advance a new senior debt facility to the Consolidated Entity of up to GBP40 million. Final documentation is
expected to be completed before 20 October 2010. The Consolidated Entity’s ability to access the additional funding will be subject to a number of
conditions. In the Directors’ view, these conditions are either procedural in nature, in which case they believe the Consolidated Entity will be able to satisfy
the conditions within the required time frame, or they are otherwise capable of being complied with by the Consolidated Entity. The Consolidated Entity
anticipates that these conditions will be satisfied by 20 October 2010.
The new senior debt facilities will provide unrestricted access to the following lines of credit, with unchanged ranking of security:
Total facilities
Senior secured term loan A 23 June 2013 15 March 2012 52,500 92,332
Senior secured term loan B 15 March 2012 N/A 30,000 52,761
Senior secured revolver 23 June 2013 15 March 2012 30,000 52,761
Senior secured bridge revolver 31 December 2011 N/A 40,000 70,348
152,500 268,202
Term loan A amortises at GBP3.75m per quarter with a bullet at maturity. Amortisation is deferred until the Bridge facility is discharged or 31 December
2011 whichever is earlier. During that time the Term loan is divided into two tranches: Tranche A being the original term facility and attracts UK Libor plus
a margin of 500bps plus 6% PIK. Tranche B is the deferred amortisation payments which attracts UK Libor plus a margin of 550bps + 6% PIK; the PIK
increases from 1 January 2011 by 125bps per quarter.
Term loan B and revolver attract UK Libor plus a margin of 450bps plus 5% PIK. There is bullet repayment at maturity. The bridge revolver attracts UK Libor
plus a margin of 550bps plus 14% PIK; the PIK increases from 1 January 2011 by 125bps per quarter. There is bullet repayment at maturity.
1. Certain conditions subsequent, if not met by 15 November 2010, would shorten the maturity of certain tranches as a result of a bring forward trigger
(BFT).
The Board has appointed financial and legal advisers to undertake a comprehensive review of the Consolidated Entity’s capital and debt structure and
talks are ongoing with prospective strategic and institutional investors. In addition, the Consolidated Entity is considering potential asset disposals. Any
such asset sales would be structured so as not to damage the Consolidated Entity’s core business assets. The Consolidated Entity has, subsequent to the
reporting date, commenced a sale process with a number of prospective purchasers, although there is no assurance that any sale transaction will occur.
The Consolidated Entity has commenced an in-depth review of the Consolidated Entity’s business operations and a number of aspects of that review are
already in the process of implementation. With a focus on key geographies with the best growth prospects, it has already targeted:
• operational cost savings to be achieved by end of June 2011, over half of which through headcount reductions. These are targeted reductions and are
not expected to jeopardise the growth prospects of the Consolidated Entity
• accelerating the streamlining and harmonisation of its product portfolio, which has already been reduced from more than 200 to 150 products
• a reorientation of business development and R&D to achieve greater flexibility and speed to market for new products
No other matters or circumstances have arisen since 30 June 2010 that has significantly affected, or may significantly affect the Consolidated Entity’s
operations in future financial years, the results of those operations in future financial years, or the Consolidated Entity’s state of affairs in future financial years.
$’000GBP’000BFT
maturity1Maximum
maturity

Directors’ Declaration
138 iSOFT Group Limited Annual Report 2010 Financial Report for the year ended 30 June 2010
30 June 2010
In the Directors’ opinion:
• the financial statements and notes set out on pages 46 to 137 and the remuneration disclosures that are contained in pages 25 to 44 of the Directors’ Report are in accordance with the Corporations Act 2001, including:
i. complying with Australian Accounting Standards (including the Australian Accounting interpretations) and the Corporations Regulations 2001, and
ii. giving a true and fair view of the Consolidated Entity’s financial position as at 30 June 2010, and of its performance and cash flows for the financial year ended on that date, and
iii. compliance with International Financial Reporting Standards issued by the International Accounting Standards Board as per Note 1(a) to the financial statements, and
• there are reasonable grounds to believe that the Consolidated Entity will be able to pay its debts as and when they become due and payable.
The Directors have been given the declarations by the Acting Chief Executive Officer and Group Finance Director required by section 295A of the Corporations Act 2001 for the financial year ended 30 June 2010.
Signed in accordance with a resolution of Directors made pursuant to section 295(5) of the Corporations Act 2001.
On behalf of the Directors
Robert MoranNon-Executive Chairman Dated this 30th day of September 2010Sydney
Anthony SherlockNon-Executive Director

139iSOFT Group Limited Annual Report 2010 Financial Report for the year ended 30 June 2010
independent auditor’s report
To the members of iSOFT Group Limited
Report on the Financial ReportWe have audited the accompanying financial report of iSOFT Group Limited, which comprises the statement of financial position as at 30 June 2010, and the income statement, the statement of comprehensive income, statement of changes in equity and statement of cash flows for the year ended on that date, selected explanatory notes and the directors’ declaration of iSOFT Group Limited (the consolidated entity). The consolidated entity comprises the entity and the entities it controlled at the year’s end or from time to time during the financial year.
Directors’ Responsibility for the Financial ReportThe directors of iSOFT Group Limited are responsible for the preparation and fair presentation of the financial report in accordance with Australian Accounting Standards (including the Australian Accounting Interpretations) and the Corporations Act 2001. This responsibility includes establishing and maintaining internal controls relevant to the preparation and fair presentation of the financial report that is free from material misstatement, whether due to fraud or error; selecting and applying appropriate accounting policies; and making accounting estimates that are reasonable in the circumstances. In Note 1, the directors also state, in accordance with Accounting Standard AASB 101 Presentation of Financial Statements, that compliance with Australian Equivalents to International Financial Reporting Standards ensures that the financial report, comprising the financial statements and notes, complies with International Financial Reporting Standards.
Auditors’ Responsibility Our responsibility is to express an opinion on the financial report based on our audit. We conducted our audit in accordance with Australian Auditing Standards. These Auditing Standards require that we comply with relevant ethical requirements relating to audit engagements and plan and perform the audit to obtain reasonable assurance whether the financial report is free from material misstatement.
An audit involves performing procedures to obtain audit evidence about the amounts and disclosures in the financial report. The procedures selected depend on the auditors’ judgement, including the assessment of the risks of material misstatement of the financial report whether due to fraud or error. In making those risk assessments, the auditor considers internal control relevant to the entity’s preparation and fair presentation of the financial report in order to design audit procedures that are appropriate in the circumstances, but not for the purpose of expressing an opinion on the effectiveness of the entity’s internal control. An audit also includes evaluating the appropriateness of accounting policies used and the reasonableness of accounting estimates made by the directors, as well as evaluating the overall presentation of the financial report.
We believe that the audit evidence we have obtained is sufficient and appropriate to provide a basis for our audit opinion.
Tel: 61 2 9251 4100 | Fax: 61 2 9240 9821 | www.pkf.com.au
PKF | ABN 83 236 985 726
Level 10, 1 Margaret Street | Sydney | New South Wales 2000 | Australia
DX 10173 | Sydney Stock Exchange | New South Wales
The PKF East Coast Practice is a member of the PKF International Limited network of legally independent member firms. The PKF East Coast Practice is also a member of
the PKF Australia Limited national network of legally independent firms each trading as PKF. PKF East Coast Practice has offices in NSW, Victoria and Brisbane. PKF East
Coast Practice does not accept responsibility or liability for the actions or inactions on the part of any other individual member firm or firms.
Liability limited by a scheme approved under Professional Standards Legislation.

independent auditor’s report
140 iSOFT Group Limited Annual Report 2010 Financial Report for the year ended 30 June 2010
IndependenceIn conducting our audit, we have complied with the independence requirements of the Corporations Act 2001.
Auditors’ Opinion In our opinion: (a) the financial report of iSOFT Group Limited is in accordance with the Corporations Act 2001, including: (i) giving a true and fair view of the consolidated entity’s financial position as at 30 June 2010 and of its performance for the year ended
on that date; and (ii) complying with Australian Accounting Standards (including the Australian Accounting Interpretations) and the Corporations
Regulations 2001; and (b) the consolidated financial statements also comply with International Financial Reporting Standards as disclosed in Note 1.
Report on the Remuneration ReportWe have audited the Remuneration Report included in the directors’ report for the year ended 30 June 2010. The directors of the company are responsible for the preparation and presentation of the Remuneration Report in accordance with section 300A of the Corporations Act 2001. Our responsibility is to express an opinion on the Remuneration Report, based on our audit conducted in accordance with Australian Auditing Standards.
Auditors’ OpinionIn our opinion the Remuneration Report of iSOFT Group Limited for the year ended 30 June 2010, complies with section 300A of the Corporations Act 2001.
PKF
Bruce GordonPartner
30 September 2010

Shareholder information
141iSOFT Group Limited Annual Report 2010 Financial Report for the year ended 30 June 2010
The shareholder information set out below was applicable as at 22 September, 2010.
Distribution of equitable securitiesAnalysis of number of equitable security holders by size of holding
1 - 1,000 1,561
1,001 - 5,000 3,204
5,001 - 10,000 1,992
10,001 - 100,000 4,476
100,001 and over 710
Total 11,943
Lessthanamarketableparcel 3,772
Oceania Healthcare Technology Investments Pty Limited 262,823,130 24.64
J P Morgan Nominees Australia Limited 119,827,131 11.23
HSBC Custody Nominees (Australia) Limited 94,502,113 8.86
National Nominees Limited 47,616,867 4.46
iSOFT Group ESP Managers Pty Limited 28,526,407 2.67
Mr Mohammad Al Zubair 23,682,104 2.22
ANZ Nominees Limited 22,683,055 2.13
Citicorp Nominees Pty Limited 22,153,927 2.08
RJL Investments Pty Ltd 20,307,773 1.90
Techno Holdings Pty Limited 10,816,913 1.01
Quatro Capital Pty Ltd 7,615,545 0.71
JP Morgan Nominees Australia Limited 6,829,629 0.64
Bellite Pty Ltd 5,324,767 0.50
Garsu Holdings Pty Ltd 5,292,302 0.50
Monet Technologies Pty Ltd 3,007,000 0.28
Citicorp Nominees Pty Limited 2,979,132 0.28
Pan Australian Nominees Pty Limited 2,538,502 0.24
Evanston Investments Limited 2,462,605 0.23
Mr Peter James Bald 2,400,000 0.22
Queensland Investment Corporation 2,305,260 0.22
693,694,162 65.02
Ordinary sharesRange
Name
Equity security holdersTwenty largest quoted equity security holdersThe names of the twenty largest security holders of quoted equity securities are listed below:
% of total shares Shares held

Options over ordinary shares issued 21,900,000 76
Warrants over ordinary shares issued 4,203,747 1
Oceania Healthcare Technology Investments Pty Limited 262,823,130 24.64
RJL Investments Pty Limited 212,270,019 19.9
Orbis Investment Management 1 74,672,299 7.2
BlackRock Investment Management Group 2 65,164,129 6.2
RJL Investments Pty Ltd (“RJL”, associated with Gary and Brian Cohen) is a substantial holder of the Company, holding 1.9% of the total number of
ordinary shares. In addition, RJL has an agreement with Oceania Healthcare Technology Investments Pty Limited (“OCP”) which grants RJL a preemptive
right over up to 19.9% of OCP’s shares; taking its voting power in the Company to 19.9%.
1. As notified to ASX on 7 July 20102. As notified to ASX on 28 July 2010
Voting rightsThe voting rights attached to ordinary shares such that on a show of hands every member present at a meeting in person or by proxy shall have one vote and upon a poll each share shall have one vote.
There are no other classes of equity securities.
Number on issue
Ordinary sharesNumber held
Number of holders
% of total shares issued
Shareholder information
Unquoted equity securities
Substantial holders
142 iSOFT Group Limited Annual Report 2010 Financial Report for the year ended 30 June 2010

corporate directory
Corporate and Registered OfficeiSOFT Group LimitedDarling Park, Tower Two, Level 27201 Sussex StreetSydney NSW 2000 AustraliaTel: +61 2 8251 6700Fax: +61 2 8251 6801
Board of DirectorsRobert B MoranNon-Executive Chairman
Ronald C SeriesExecutive Director
Prof Claire L JacksonNon-Executive Director
Ian TsicalasNon-Executive Director
Peter H WiseNon-Executive Director
Anthony G SherlockNon-Executive Director
Lachlan R MacGregorAlternate Director
Company SecretaryHoward T Edelman
Share registryComputershare Investor Services Pty Limited Level 4, 60 Carrington StreetSydney NSW 2000 AustraliaTel: +61 3 9415 4000 (outside Australia)Tel: 1300 855 080 (within Australia)
AuditorPKFLevel 10, 1 Margaret StreetSydney NSW 2000 Australia
Stock exchange listingiSOFT Group Limited shares are listed on the Australian Securities Exchange as code: “ISF”.
Website addresswww.isofthealth.com

iSOFT Group LimitedDarling Park, Tower 2, Level 27201 Sussex Street, Sydney, NSW 2000, AustraliaABN 66 063 539 702
www.isofthealth.com
Copyright © 2010 iSOFT Group Limited. All rights reserved.