ISO New England Slides Used During Jan 16, 2016 Webinar
40
ISO-NE PUBLIC JANUARY 26, 2016 Gordon van Welie PRESIDENT & CEO, ISO NEW ENGLAND INC. ISO on Background State of the Grid: 2016
-
Upload
marcellus-drilling-news -
Category
News & Politics
-
view
501 -
download
2
Transcript of ISO New England Slides Used During Jan 16, 2016 Webinar
ISO-NE PUBLIC
J A N U A R Y 2 6 , 2 0 1 6
Gordon van Welie P R E S I D E N T & C E O , I S O N E W E N G L A N D I N C .
ISO on Background
State of the Grid: 2016

ISO-NE PUBLIC
About the ISO on Background Series
• Informal opportunity for media to learn more about trends affecting New England’s electricity industry
• Hosted by ISO New England senior management
• Content is on the record
• Please hold questions until the Q&A session at the end of the presentation
• Presentation and remarks will be posted at www.iso-ne.com>About Us>News and Media>Press Releases
2

ISO-NE PUBLIC 3
Agenda
• 10:30 -10:40 a.m. Welcome and Introductions Ellen Foley, director, Corporate Communications
• 10:40 a.m. -11:30 a.m. State of the Grid: 2016 Gordon van Welie, president and CEO
• 11:30 a.m. – 12:00 p.m. Question-and-Answer Session

ISO-NE PUBLIC
Overview of Presentation
• About ISO New England
• State of the Grid – Setting the Stage – 2015 Highlights – Preparing for the Hybrid Grid – Conclusions
• Questions and Answers
4

ISO-NE PUBLIC ISO-NE PUBLIC
ABOUT ISO NEW ENGLAND
5

ISO-NE PUBLIC
Two Decades of Experience Overseeing the Region’s Restructured Electric Power System
• ISO New England’s three core responsibilities include: – Operating the regional power system – Administering the region’s competitive wholesale
electricity markets – Planning for the regional power system
• Regulated by the Federal Energy Regulatory Commission (FERC)
• Independent of companies in the marketplace
• ISO-NE does not: – Buy or sell power – Own generation or transmission equipment – Have any involvement in the natural gas industry – Take any position on any pipeline or elective
transmission project proposal
6

ISO-NE PUBLIC
• Resources & consumer demand: – 350 generators; 31,000 MW of generating
capacity – 600 MW of demand response & 1,700 MW
of energy efficiency – 15,000 MW of new generation since 1997 – All-time peak demand: 28,130 MW on
August 2, 2006
• Transmission system: – 8,600 miles of high-voltage transmission
lines – $7.4 billion invested since 2002 to improve
reliability – 13 transmission ties to neighboring power
systems (NY & Canada)
• Markets: – Energy: daily market for electricity – Capacity: annual forward auction for long-
term resource availability; obligation for one year or seven years for new resources
– Ancillary services: daily market for real-time reliability services
7
Snapshot of New England’s Power System and Wholesale Electricity Markets
NERC North American
Electric Reliability Corporation
Western Interconnection
ERCOT Interconnection
Eastern Interconnection
NPCC Northeast
Power Coordinating
Council
Québec Interconnection

ISO-NE PUBLIC ISO-NE PUBLIC
STATE OF THE GRID: SETTING THE STAGE
8

ISO-NE PUBLIC 9
Transformation of Region’s Resource Mix Continues
0
2,000
4,000
6,000
8,000
10,000
12,000
14,000
16,000
1997 1999 2001 2003 2005 2007 2009 2011 2013 2015 2017
Oil Wind Nuclear Biomass Solar Hydro Fuel Cell Natural Gas
Natural gas
• Low natural gas prices – Gas is the most economic fuel
for new, conventional resources • 80% of new capacity since
1997 runs on natural gas • Nearly 65% of all proposed
new generation would use natural gas
– Demand for natural gas is rising – Gas pipelines are constrained
during high demand periods, particularly winter
• Creates grid reliability concerns and price volatility
• Low prices are putting financial pressure on coal, oil and nuclear baseload generators; some are retiring
Cumulative New Generating Capacity in New England (MW) 1997-2018

ISO-NE PUBLIC
• State policies drive renewable resource development – Mostly large-scale wind and
behind-the-meter solar – Other, fast & flexible resources will
be needed to balance intermittent resources’ variable output
– New transmission needed to bring wind farms’ energy from their remote locations to population centers
• Distributed generation and the “hybrid” grid – A significant portion of New
England’s future grid could be “behind-the-meter” (solar facilities on distribution system)
– That will change how much and when power is used by consumers
10
Shift to Cleaner Energy Sources Continues
ISO-NE PUBLIC
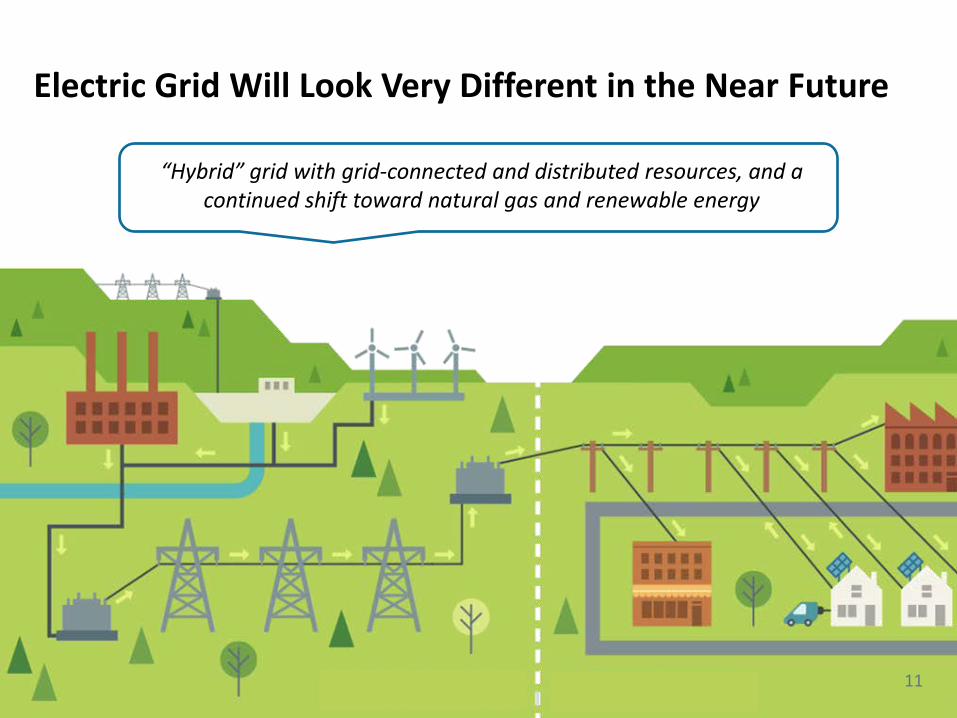
Electric Grid Will Look Very Different in the Near Future
“Hybrid” grid with grid-connected and distributed resources, and a continued shift toward natural gas and renewable energy
11

ISO-NE PUBLIC ISO-NE PUBLIC
STATE OF THE GRID: 2015 HIGHLIGHTS
12

ISO-NE PUBLIC
Natural Gas Used Most Often to Generate Region’s Power The fuels used to produce the region’s electric energy have shifted as a result of economic and environmental factors
31%
22% 18%
15% 13% 2%
30%
2% 4%
49%
15%
1%
Nuclear Oil Coal Natural Gas Hydro and Other
Renewables
Pumped Storage
2000 2015
Percent of Total Electric Energy Production by Fuel Type (2000 vs. 2015)
Source: ISO New England Net Energy and Peak Load by Source Other renewables include landfill gas, biomass, other biomass gas, wind, solar, municipal solid waste, and miscellaneous fuels
13

ISO-NE PUBLIC
Natural Gas and Wholesale Electricity Prices Are Linked With natural gas the primary fuel used to produce electricity, natural-gas-fired power plants typically set the price for wholesale electricity
Elec
tric
Ene
rgy
$/M
Wh
Fuel $/MM
Btu
Monthly Average Natural Gas and Wholesale Electricity Prices in New England
Hurricanes in Gulf of Mexico
Strong Global
Demand
Marcellus Shale Boom
Winter Pipeline Constraints
Recession
14
Summer: pipelines unconstrained
Underlying natural gas data furnished by:

ISO-NE PUBLIC
Winter vs. Summer Prices: With Pipeline Constraints, the Price Spread is Growing When pipelines are unconstrained, generators can access low-priced natural gas
15
$0
$5
$10
$15
$20
$25
$30
$35
$40
$0
$20
$40
$60
$80
$100
$120
$140
$160
$ per MM
Btu $
per m
egaw
att-
hour
Average seasonal power and natural gas prices, summer vs. winter
Summer Winter Natural gas
Underlying natural gas data furnished by:

ISO-NE PUBLIC 16
When Pipelines are Unconstrained: New England’s Wholesale Prices are Competitive with Other Regions
Underlying natural gas data furnished by:

ISO-NE PUBLIC
$124.94
$19.76
$99.28
$24.08
$67.27
$29.82
$0
$20
$40
$60
$80
$100
$120
$140
New England Real-Time System Price New York Real-Time System Price PJM Real-Time System Price
Elec
tric
Ene
rgy
$/M
Wh
Monthly Average Wholesale Electricity Prices for New England, New York, and PJM January 2015 – June 2015
(Real-Time System Prices per $/MWh)
When Pipelines are Unconstrained: New England’s Wholesale Power Prices are Competitive with Other Regions
17
Underlying natural gas data furnished by:

ISO-NE PUBLIC
Wholesale Electricity Costs Reflect Market Conditions Total annual wholesale market costs have ranged from $6 billion to $14 billion
12.1
5.9 7.3
6.7
5.2
8.0 9.1
5.9
1.5
1.8 1.6
1.3
1.2
1.1 1.1
1.1
$0
$2
$4
$6
$8
$10
$12
$14
$16
2008 2009 2010 2011 2012 2013 2014 2015*
Energy Market
Ancillary Markets
Capacity Market
Annual Value of Wholesale Electricity Markets (in billions)
* Preliminary data subject to reconciliation.
18

ISO-NE PUBLIC
Putting Competitive Wholesale Markets to Work for New England
• Markets reveal a resource’s true operating cost – Fuel is the primary driver of operating costs – The dollar value of New England’s energy markets fell from 2008 to
2012 as low-cost natural gas displaced older, fossil fuel-fired units
• Gas-fired generators are becoming more efficient – Improvements in technology have made newer generators more
economic than older generators
• Region has invested in cleaner technologies ahead of much of the rest of the country and has seen regional air emissions decline significantly over the past decade
19

ISO-NE PUBLIC
Power Plant Emissions Have Declined with Changes in the Fuel Mix
Year NOx SO2 CO2
2001 59.73 200.01 52,991
2014 20.49 11.68 39,317
% Reduction, 2001–2014 66% 94% 26%
Year NOx SO2 CO2
1999 1.36 4.52 1,009
2014 0.38 0.22 726
% Reduction, 1999–2014 72% 95% 28%
Source: 2014 ISO New England Electric Generator Air Emissions Report, January 2016
Reduction in Aggregate Emissions (ktons/yr)
Reduction in Average Emission Rates (lb/MWh)
20

ISO-NE PUBLIC
New England Shifts to Coal and Oil in the Winter Da
ily E
nerg
y M
Wh
0
50,000
100,000
150,000
200,000
250,000
D b 1 2014 J 1 2015 F b 1 2015
Oil
Coal
Natural Gas / LNG
Winter 2014‒2015 Fossil Fuel Mix
21

ISO-NE PUBLIC
Winter Operations Highlight Natural Gas Pipeline Constraints as a Continuing Reliability Challenge
• Close to half—13,650 MW, or 44%—of the total generating capacity in New England uses natural gas as its primary fuel
• 2015/16 winter outlook identifies up to 4,220 MW of natural gas-fired generation at risk of not being able to get fuel when needed
• To address continuing concerns about natural gas pipeline constraints, the ISO will administer Winter Reliability Programs until 2018 to help improve fuel security and protect power system reliability
22

ISO-NE PUBLIC
12/1 thru 1/18
Winter 13/14
Winter 14/15
Winter 15/16
Ave monthly temp (°F) 29.1 30.7 37.9
Total energy consumption (GWh)
18,339 17,818 16,470
Peak demand (MW) 21,448 20,556 19,227
Date of peak and temp
12/17/13 15°F
1/8/15 20°F
1/5/16 22°F
Ave. real-time energy price ($/MWh)
$105.66 $53.27 $26.01
Ave. natural gas price ($/MMBtu)
$13.58 $7.36 $3.22
Total value of energy market (billions)
$2.024 $1.038 $0.464
23
Winter 2015/2016 So Far December 1, 2015 through January 18, 2016
• Mildest December since at least 1960 – Even milder than December
2014 – Lowest December energy usage
since 2003 (10,160 GWh) – Second-lowest wholesale
power price at $21.35 per megawatt-hour
• June 2015 was lowest, at $19.61/MWh
• Beginning of January was also mild
• When weather is mild: – Natural gas demand is lower – Pipelines are less constrained – Prices of natural gas and
electricity fall Underlying natural gas data furnished by:

ISO-NE PUBLIC
More Than 4,200 MW of Generation Have Retired or Will Retire in Less Than Five Years
• Salem Harbor Station (749 MW) – 4 units (coal & oil)
• Vermont Yankee Station (604 MW) – 1 unit (nuclear)
• Norwalk Harbor Station (342 MW) – 3 units (oil)
• Brayton Point Station (1,535 MW) – 4 units (coal & oil)
• Mount Tom Station (143 MW) – 1 unit (coal)
• Pilgrim Nuclear Power Station (677 MW) – 1 unit (nuclear)
• Additional retirements are looming
Major Generator Retirements:
24

ISO-NE PUBLIC 25
Generator Retirements and Higher Capacity Prices Signal the Need for New Supply Resources
0
2,000
4,000
6,000
8,000
10,000
12,000
14,000
January 2014 January 2015 January 2016
Meg
awat
ts
Other
Wind
Natural Gas (including dual-fuel units)
Proposed Capacity in ISO's Generator Interconnection Queue

ISO-NE PUBLIC
Wallingford (90 MW) Combustion Turbines
Commercial: June 1, 2018
• More than 1,600 MW of new gas-fired generation have come forward in the last few auctions; 147 new resources representing 6,700 MW have qualified for the next auction
Footprint (674 MW) Combined-Cycle Gas Turbine
Commercial: June 1, 2017
Towantic (725 MW) Combined-Cycle Gas Turbine
Commercial: June 1, 2018
Medway (195 MW) Combustion Turbine
Commercial: June 1, 2018 CT
MA
Forward Capacity Market Is Attracting Efficient and Fast-Starting Resources
26

ISO-NE PUBLIC ISO-NE PUBLIC
STATE OF THE GRID: PREPARING FOR THE HYBRID GRID
27

ISO-NE PUBLIC
Market Enhancements Are Providing Benefits
• Provide proper signals to market participants to improve their resource’s performance, retire, or build new resources
• Price signals promoting investment, reflecting fundamentals – Guiding New England’s transition through a gas and renewables
system – Attracting new entry, at competitive, transparent prices
• Benefits of well-designed capacity and energy markets – Greater return on investments for
resources that perform reliably – Simpler, more predictable
capacity market design – Promotes flexibility, innovation,
and cost-effective development
28

ISO-NE PUBLIC
• Negative offer price: allows generators like wind resources the opportunity to operate during low-load conditions when their output otherwise might be curtailed
• Do-not-exceed dispatch order: allows the ISO to better manage transmission congestion to maximize the use of low-cost renewable resources and alleviate the need for curtailments
• Elective transmission upgrade rules: contain options for strengthening electrically weak portions of the grid to help integrate distant resources like wind
Market Changes Allow Variable Resources to More Effectively Participate in the Wholesale Markets
29

ISO-NE PUBLIC
State Policy Requirements Drive Proposals for Renewable Energy
10% 11% 12.5%
15%
20%
59%*
0%
5%
10%
15%
20%
25%
ME NH RI MA CT VT
State Renewable Portfolio Standard (RPS)* for Class I or New Renewable Energy by 2020
* State Renewable Portfolio Standards (RPS) promote the development of renewable energy resources by requiring electricity providers (electric distribution companies and competitive suppliers) to serve a minimum percentage of their retail load using renewable energy. Vermont’s new Renewable Energy Standard has a ‘total renewable energy’ requirement (reflected above), which recognizes large-scale hydro and all other classes of renewable energy.
30

ISO-NE PUBLIC
Renewable and EE Resources Are Trending Up
800
4,000
Existing Proposed
Wind (MW)
Nameplate capacity of existing wind resources and proposals in the ISO-NE Generator Interconnection Queue; megawatts (MW).
900
2,400
PV thru 2014 PV in 2024
Solar (MW)
2015 ISO-NE Solar PV Forecast, nameplate capacity, based on state policies.
1,500
3,600
EE thru 2014 EE in 2024
Energy Efficiency (MW)
2015 CELT Report, EE through 2014 includes EE resources participating in the Forward Capacity Market (FCM). EE in 2024 includes an ISO-NE forecast of incremental EE beyond the FCM.
31

ISO-NE PUBLIC
Source: Final ISO New England EE Forecast for 2019-2024 (April 2015)
Energy Efficiency Is Slowing Peak Demand Growth and Flattening Energy Use
28,000
29,000
30,000
31,000
32,000
33,000
34,000
35,000 Summer Peak (MW)
125,000
130,000
135,000
140,000
145,000
150,000
155,000
Annual Energy (GWh)
The gross forecast of peak demand and energy use
The forecast minus the impact of EE participating in the Forward Capacity Market (FCM) to date
The forecast minus anticipated EE growth beyond FCM years
32

ISO-NE PUBLIC
• Long-term solar forecast – Tracking historical growth; predicting
solar development 10 years ahead – Used in transmission planning
and market needs assessments – In 2015, PV forecast used for first
time in Installed Capacity Requirement time, reducing 2019/2020 need by 390 MW
• Short-term solar forecast – ISO creates daily forecasts of solar
PV production to improve daily load forecasts
• Interconnection rules improvements – ISO is helping develop new interconnection
standards to reduce reliability concerns
The ISO is Leading Efforts to Account for Solar Resources Connected to the Distribution System
33
40
900
2,400
0
500
1,000
1,500
2,000
2,500
3,000
January 2010 Thru 2014 2024
Meg
awat
ts (M
W)
Cumulative Growth in Solar PV through 2024 (MW*)
Source: Final PV Forecast (April 2015); Note: MW values are AC nameplate

ISO-NE PUBLIC 34
Solar Power’s Effect on Hourly Electricity Demand May 23, 2015

ISO-NE PUBLIC
Transmission Developers Are Proposing to Move Renewable Energy to New England Load Centers
35
Source: ISO Interconnection Queue (January 2016) http://www.iso-ne.com/system-planning/transmission-planning/interconnection-request-queue
Representative of the types of projects announced for the region in recent years
• As of January 1, 2016, eleven elective transmission projects had been proposed in the ISO Interconnection Queue, totaling more than 7,000 MW of potential transfer capability
– Primarily large-scale hydro resources from eastern Canada and wind resources from northern New England
• These merchant projects seek to address public policy goals, not reliability needs

ISO-NE PUBLIC
MA 480 MW
ME 3,080 MW
NH 65
MW
VT 30
MW
All Proposed Generation Developers are proposing to build 13,000 MW of generation, including nearly 8,200 MW of gas-fired generation and more than 4,200 MW of wind
Wind Proposals
Infrastructure Will Be Needed to Deliver Energy from Proposed Resources
Source: ISO Generator Interconnection Queue (January 2016) FERC Jurisdictional Proposals Only
ME 3,641 MW
NH 91
MW
VT 47
MW
MA 464 MW
Natural gas 63%
Wind 33%
Other 4%
36
ISO-NE PUBLIC ISO-NE PUBLIC
STATE OF THE GRID: CONCLUSIONS
37

ISO-NE PUBLIC
Conclusions • Competitive wholesale electricity markets have resulted in significant
efficiencies & have driven billions of dollars of investment in New England’s power system
• New England’s generation fleet is changing rapidly – the use of natural gas for power generation is increasing dramatically; older, fossil-fired units are retiring; and renewables and demand-side resources are growing
• New England needs additional energy infrastructure – rising demand for natural gas drives the need for additional natural gas infrastructure; increasing wind development in remote areas will require additional transmission; and growing levels of variable generation will require a fleet of flexible resources to successfully integrate
• Wholesale power prices are directly related to natural gas prices – when natural gas pipelines are unconstrained, natural gas and wholesale power prices drop
• ISO New England has taken major steps to address these challenges to reliability through financial incentives provided in the wholesale market and in changes to transmission planning processes, and will continue to work with regional stakeholders to help manage the continuing transition in the regional resource mix
38

ISO-NE PUBLIC 39

ISO-NE PUBLIC
For More Information…
• Subscribe to the ISO Newswire – ISO Newswire is your source for regular news
about ISO New England and the wholesale electricity industry within the six-state region
• Log on to ISO Express – ISO Express provides real-time data on New
England’s wholesale electricity markets and power system operations
• Follow the ISO on Twitter – @isonewengland
• Download the ISO to Go App – ISO to Go is a free mobile application that puts
real-time wholesale electricity pricing and power grid information in the palm of your hand
40