Regulation and-supervision-of-islamic-banks-and-financial-institutions-bangladesh-perspective

Review of Economics & Finance
Submitted on 11/08/2016
Article ID: 1923-7529-2017-01-80-18 Osama M. Al-Hares, and Kashif Saleem
~ 80 ~
Islamic Banks Financial Performance and Implications of
Basel III Standards in the GCC: An Empirical Analysis
Dr. Osama M. Al-Hares (Correspondnce author)
Faculty of Business - University of Wollongong in Dubai
Knowledge Park, P.O. Box 20183, Dubai, UAE
Tel: +971-4 278-1972 E-mail: [email protected]
Dr. Kashif Saleem
Faculty of Business - University of Wollongong in Dubai
Knowledge Park, P.O. Box 20183, Dubai, UAE
Tel: +971-4 278-1947 E-mail: [email protected]
Abstract: This study empirically evaluates Islamic banks financial performance and implications
of Basel III regulations in the Gulf Cooperation Council (GCC) region. We utilize bank-level data
for 24 Islamic Banks based in six GCC countries (namely, Kuwait, United Arab Emirates, Kingdom
of Saudi Arabia, Oman, Qatar, and Bahrain) for the period of 2006 to 2015. Financial performance
is measured by using both Internal–based performance measure (Return on Assets) and Market-
based performance measure (Tobin’s Q model). We employ regression analysis to capture the
impact of bank size, credit risk, operational efficiency and asset management on performance
measured by the two indicators. Moreover, to control for the implications of Basel III standards, we
run our model with a dummy ‘control’ variable. The results reveal that the explanatory power of
the internal–based performance model is higher than the market-based performance model. Not
surprisingly, the results also indicate that financial performance of GCC Islamic banks is highly
sensitive to Basel III regulations. We argue that findings of this study highly useful for capital-
market participants who are interested in Islamic banking industry, in particular, GCC region.
Keywords: Gulf Cooperation Council (GCC); Islamic banks; Basel III standards; Tobin’s Q Model
JEL Classifications: M40, M41, G20, G21, G28
1. Introduction
Islamic finance has emerged in recent decades as one interesting trend in the financial world.
Islamic financial institutions have taken the form of commercial banks, investment banks,
investment and finance companies, insurance companies, and financial service companies. Islamic
banks follow different banking models, such as private institutions in a conventional economy (as in
the most of Arab countries and the West), national Islamic banking systems (as in Sudan and Iran),
and dual banking models (as in Malaysia). They also take different forms, such as Islamic
subsidiaries of conventional banking groups, and Islamic banking windows within conventional
banks.
Islamic banks play roles similar to conventional banks, however, fundamental differences exist
between the two models. Conventional banking allows for risk transfer and is mainly debt-based
Review of Economics & Finance, Volume 7, Issue 1
~ 81 ~
practice centered on the debtor-creditor relationship between the depositors and the bank on one
hand, and between the borrowers and the bank on the other. The money is used as a commodity,
which is bought and sold, and on such two-way transactions, they charge interest on it and make
profits. In contrast, Islamic banking is asset based, and centers on risk sharing. Islamic banks use
the money as a vehicle of exchange to facilitate trade transactions and investment in assets. Central
to Islamic finance is the fact that money itself has no intrinsic value. This means that interest
(known as Riba in Islam) is not allowed and making money from money is forbidden. The principal
means of Islamic finance are based on trading. Any trading gains are shared between the party
providing the capital and the party providing the expertise. As a result, Islamic banks have
developed four main Islamic financing techniques, which are: Mudaraba, Musharaka, Ijara and
Murabaha (Chapra, 1998; Haron, 2000; Schaik, 2001; Pomeranz, 1997; Suleiman, 2000; Al-
Gzaairi, 1979; Al-Jinde, 1986; Shehatah, 1987; El-Galfy, 1991; and Accounting and Auditing
Organization for Islamic Financial Institution (AAOIFI), 2010).
There has been much questioning of the effect of 2008-2009 financial crisis on Islamic
companies, especially banks, compared to conventional institutions. It has been strongly argued that
if global financial practices adhere to the principles of Islamic finance that are based on noble ideas
of entrepreneurship and transparency, then such global crisis would have been prevented. This
argument is simply built on the fact that most, if not all, the factors that have caused or contributed
to the development and the spread of the recent global financial crisis are not allowed under the
rules and guidance of Islamic finance. Islamic finance has remained relatively positive, resilient and
largely shielded from the crisis despite the gloom and volatility of the prevailing global financial
environment (Hamdan, 2009). The growth rates of 28% even during the global financial crisis
verify the strength of Islamic banking. Wilson (2009) argues that the financial crisis faced the
conventional banking sector worldwide has directed attention to Islamic banking sector where
banks which emphasize transparency and undue risk avoidance, has been largely insulated from the
crisis.
This study starts by descriptive analysis on financial performance of Islamic Banks in the GCC
region using Financial Ratio Analysis (FRA) in terms of profitability, liquidity, efficiency,
solvency, and growth. The analysis then proceeds to empirical evaluation of the financial
performance and implications of Basel III standards (endorsed and launched in 2013, but will
become effective by 2019) on GCC Islamic banks. We measure the financial performance
empirically by using two indicators; Internal–based performance measured by Return on Assets
(ROA), and Market-based performance measured by Tobin’s Q model (Price / Book value of
Equity). We use regression analysis to capture the impact of bank size, credit risk, operational
efficiency and asset management on financial performance and to create a good-fit regression
model to predict the future financial performance of these banks.
The choice of the GCC zone is justified by the fact that these countries that are the heart of the
Islamic world are experiencing a significant increase in the number of Islamic banks, a high growth
rate of Shariah-compliant global financial assets, and sound financial health. Islamic financial
institutions in the GCC region are taking an increasingly global perspective (i.e., expanding in
countries outside the GCC region mainly Malaysia, Singapore, Pakistan, Turkey, and Australia with
large number of subsidiaries and branches), and are more innovative than in other countries where
Islamic banks enjoy a monopoly of banking services in terms of product and development (e.g.,
Iran). Wilson (2009) argue that Islamic banks in the GCC region offer a much more diversified and
attractive range of services, perhaps because of the need to compete with conventional banks in
their local markets. According to Ernst & Young's World Islamic Banking Competitiveness Report

ISSNs: 1923-7529; 1923-8401 © 2017 Academic Research Centre of Canada
~ 82 ~
2016, Islamic banks expected to see strong growth across the GCC with total Shariah compliant
assets surging 18% ($91 billion) year on year last year. Globally, Islamic banking assets are set to
exceed $1.3 trillion, growing at a compounded annual growth rate of about 16%, with GCC having
$598.8 billion representing 46% of international Islamic banking assets. Islamic banking assets in
Qatar, Indonesia, Kingdom of Saudi Arabia (KSA), Malaysia, United Arab Emirates (UAE) and
Turkey exceeded $801 billion in 2015 representing 62% of international Islamic banking assets.
Our analysis is based on bank-level data for 24 Islamic Banks scattered over six GCC
countries (i.e., Kuwait, UAE, Kingdom of Saudi Arabia, Oman, Qatar, and Bahrain). We employ a
comprehensive and the most recent sample of data available in the GCC, consisting of cross-
sections from 2006 to 2015. In addition, to our best knowledge this study is the first to assess the
implications of Basel III standards on GCC Islamic banks. We argue that findings of this study
highly useful for capital-market participants who are interested in Islamic banking industry, in
particular, GCC region, as it provides empirical evidence on the financial performance of GCC
Islamic Banks. Further, as the full implementation of Basel III standards will not take place until
2019, the results of this study may convey information that should encourage banks to consider the
earlier implementation of Basel III regulations in order to provide themselves with a reputational
boost, as well as a competitive advantage.
The next section presents Basel III new capital and liquidity standards. Section 3 reviews
relevant prior research. Section 4 describes the methodology and models’ specification. Section 5
reports the results. Finally, section 6 concludes.
2. Basel III- Capital and Liquidity Standards
The Basel III Committee of Banking Supervision announced its endorsement of Basel III
standards (endorsed in 2013, but will become effective by 2019). The standards build on the
existing regulatory structures of Basel I and Basel II accords. The regulators’ intent with Basel III is
a future of more capital, more liquidity, and lower risk. It improves the ability of the banking sector
to absorb financial and economic shocks, improves risk management, and governance and
strengthen banks’ transparency and disclosures. Basel III establishes higher and better-quality
capital standards through additional capital buffers, more restrictive capital definitions, higher risk-
weighted assets (RWSs), and higher standards for minimum capital ratios.1 Higher capital standards
will primary help allow banks to use the build-up capital during boom times in periods of financial
stress and hence, reduce cyclicality in financial markets. In addition, Basel III establishes liquidity
standards through the introduction of Liquidity Coverage Ratio (LCR) and Net Stable Funding
Ratio (NSFR) targets.
The implications of increased capital standards would include significant effects across the
banking industry and capital markets. The reforms will fundamentally reduce industry profitability
(as measured by ROE) and require alteration of balance sheet management techniques for banks to
limit illiquid assets, restrict unstable sources of funding, and manage higher funding costs. These
forms will also require banks to transform their business models (i.e., due to higher capital costs),
and to undertake significant process and system changes to achieve upgrades in areas of stress
testing, counterparty risk, and capital management infrastructure.
1 Risk-Weighted Assets includes the total assets owned. The value of each asset is assigned a risk
weight (for example 100% for corporate loans and 50% for mortgage loans) and the credit equivalent amount of all off-balance sheet activities. Each credit equivalent amount is also assigned a risk weight.
Review of Economics & Finance, Volume 7, Issue 1
~ 83 ~
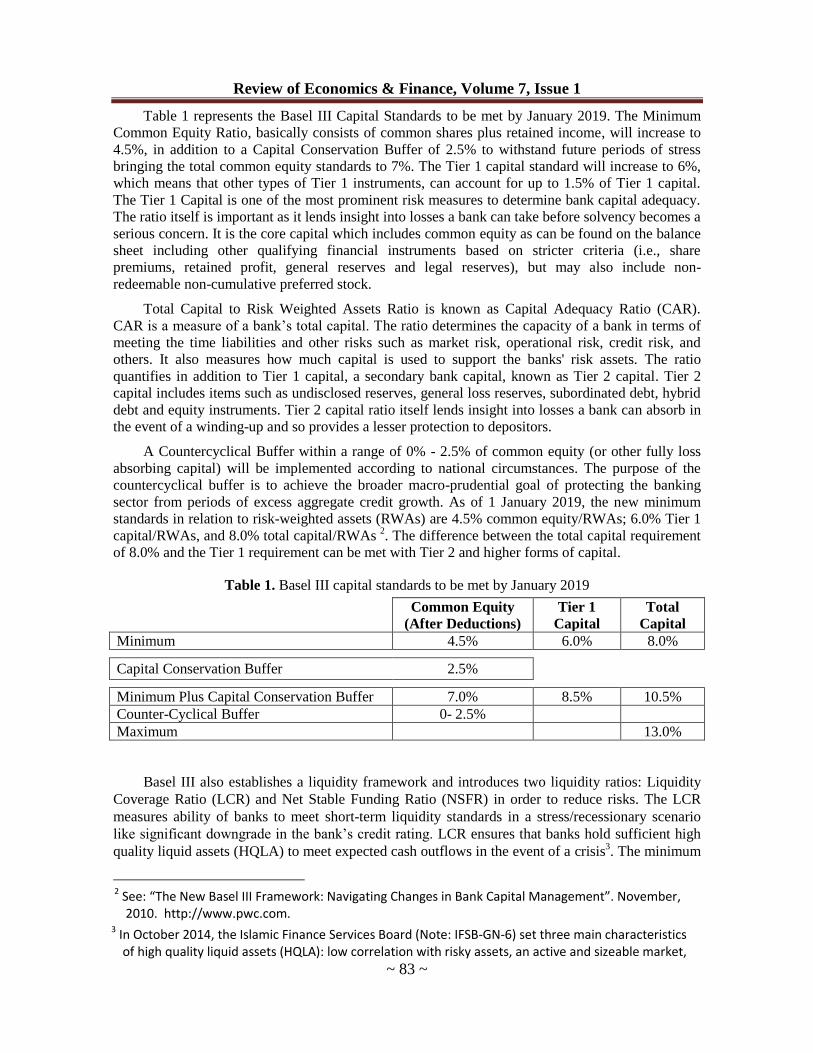
Table 1 represents the Basel III Capital Standards to be met by January 2019. The Minimum
Common Equity Ratio, basically consists of common shares plus retained income, will increase to
4.5%, in addition to a Capital Conservation Buffer of 2.5% to withstand future periods of stress
bringing the total common equity standards to 7%. The Tier 1 capital standard will increase to 6%,
which means that other types of Tier 1 instruments, can account for up to 1.5% of Tier 1 capital.
The Tier 1 Capital is one of the most prominent risk measures to determine bank capital adequacy.
The ratio itself is important as it lends insight into losses a bank can take before solvency becomes a
serious concern. It is the core capital which includes common equity as can be found on the balance
sheet including other qualifying financial instruments based on stricter criteria (i.e., share
premiums, retained profit, general reserves and legal reserves), but may also include non-
redeemable non-cumulative preferred stock.
Total Capital to Risk Weighted Assets Ratio is known as Capital Adequacy Ratio (CAR).
CAR is a measure of a bank’s total capital. The ratio determines the capacity of a bank in terms of
meeting the time liabilities and other risks such as market risk, operational risk, credit risk, and
others. It also measures how much capital is used to support the banks' risk assets. The ratio
quantifies in addition to Tier 1 capital, a secondary bank capital, known as Tier 2 capital. Tier 2
capital includes items such as undisclosed reserves, general loss reserves, subordinated debt, hybrid
debt and equity instruments. Tier 2 capital ratio itself lends insight into losses a bank can absorb in
the event of a winding-up and so provides a lesser protection to depositors.
A Countercyclical Buffer within a range of 0% - 2.5% of common equity (or other fully loss
absorbing capital) will be implemented according to national circumstances. The purpose of the
countercyclical buffer is to achieve the broader macro-prudential goal of protecting the banking
sector from periods of excess aggregate credit growth. As of 1 January 2019, the new minimum
standards in relation to risk-weighted assets (RWAs) are 4.5% common equity/RWAs; 6.0% Tier 1
capital/RWAs, and 8.0% total capital/RWAs 2. The difference between the total capital requirement
of 8.0% and the Tier 1 requirement can be met with Tier 2 and higher forms of capital.
Table 1. Basel III capital standards to be met by January 2019
Common Equity
(After Deductions)
Tier 1
Capital
Total
Capital
Minimum 4.5% 6.0% 8.0%
Capital Conservation Buffer 2.5%
Minimum Plus Capital Conservation Buffer 7.0% 8.5% 10.5%
Counter-Cyclical Buffer 0- 2.5%
Maximum 13.0%
Basel III also establishes a liquidity framework and introduces two liquidity ratios: Liquidity
Coverage Ratio (LCR) and Net Stable Funding Ratio (NSFR) in order to reduce risks. The LCR
measures ability of banks to meet short-term liquidity standards in a stress/recessionary scenario
like significant downgrade in the bank’s credit rating. LCR ensures that banks hold sufficient high
quality liquid assets (HQLA) to meet expected cash outflows in the event of a crisis3. The minimum
2 See: “The New Basel III Framework: Navigating Changes in Bank Capital Management”. November,
2010. http://www.pwc.com. 3 In October 2014, the Islamic Finance Services Board (Note: IFSB-GN-6) set three main characteristics
of high quality liquid assets (HQLA): low correlation with risky assets, an active and sizeable market,
ISSNs: 1923-7529; 1923-8401 © 2017 Academic Research Centre of Canada
~ 84 ~
LCR that banks must have under the new Basel III standards are phased in beginning at 70% in
2016 and steadily increasing to 100% by 2019. The year-by-year LCR standards for 2016, 2017,
2018 and 2019 are 70%, 80%, 90% and 100%, respectively.
The NSFR measures the liquidity management capabilities of a bank in the long term. NEFR
requires that long-term assets of a bank like loans to be supported by more stable sources of funds
such as retail deposits or Tier 1 capital over a period of one year. This ratio compares the assets and
liabilities of the bank to ensure that bank is not funding its main business lines with unsecured or
short term sources of funds. Latest NSFR standards (“NSFR Standards”) were released by the Basel
Committee on 31 October 2014. The NSFR is calculated by dividing a bank’s available stable
funding (“ASF”) by its required stable funding (“RSF”) 4. The ratio must always be greater than
100%. NSFR, will become a minimum standard by 1 January 2018.
All GCC countries opted to comply with Basel III standards. On the whole, GCC central banks
have all announced their rules, action plans or draft approach papers to steadily implement Basel III
starting by Saudi Arabia in 2013, followed by Kuwait, Oman, Qatar, Bahrain and UAE in 20145.
Stubing (2011) points that GCC banks are in a good position to meet Basel III capital
standards. GCC banks have high levels of high quality capital (equity) which will make it easier for
them to move to and comply with Basel III capital standards. The majority of banks in the GCC
have strong capital adequacy ratios, well above 10% and in fact, the average ratio for the region is
around 15% with some markets such as the UAE closer to 20%. Moreover, nearly all of banks’
capital consists of core tier 1 capital hence the new requirement of 7% will be comfortably met.
Stubing (2011) also argue that the new liquidity standards, in the form of the LCR and NSFR is one
area where GCC banks will realize an impact since GCC debt markets are not as deep or varied as
developed markets. Most Islamic Bank liquidity management instruments consist of low-
profitability assets, such as cash and central bank deposits. Sukuks are primarily offered as over-
the-counter instruments and only a limited amount of them are listed on developed and liquid
exchanges. It has been argued that the implementation of Basel III and its new LCR will increase
offerings of liquidity management instruments and could help address some of the industry’s long-
standing weaknesses, particularly the lack of HQLA, while issuers are likely to list more of their
Sukuk on exchanges and that some regulators will start to accept Sukuk as collateral for liquidity
provisions (Augustine, 2016). Nowadays, GCC central banks are in advanced stages of
implementation of the new liquidity standards. Regulators are working through the funding strategy
from a structural sense as well as from a shorter-term liquidity management perspective,
considering new liquidity tools to ensure banks will be able to implement new liquidity
standards. In a recent move, some GCC Central Banks started accepting a wide range of Sukuk as
collateral for banks to access its special lending facility.
and low volatility. The IFSB also publishes guidance for Islamic financial institutions specifying how Islamic banks should measure and implement the LCR and the NSFR related to Basel III, as well as the timeline for implementation.
4 “Available stable funding” is defined as the portion of capital and liabilities expected to be reliable over the time horizon considered by the NSFR, which extends to one year. The amount of such stable funding required ("Required stable funding") of a specific institution is a function of the liquidity characteristics and residual maturities of the various assets held by that institution as well as those of its off-balance sheet (OBS) exposures.
5 See: “Being Better Informed: FS regulatory, Accounting and Audit Bulletin, PwC”. Quarter 2, 2014. [Online] Available at: https://www.pwc.com/m1/en/publications/documents/being-better-informed-q2-2014.pdf.
Review of Economics & Finance, Volume 7, Issue 1
~ 85 ~
3. Literature Review
The literature starts by the claims researchers have raised whether Islamic banks are the
answer to any economic crisis. Studies on this stream focus into whether Islamic banking practice
are better off in terms of performance, financial position and risk level than conventional banking
practice during economic crises. Most studies support the Islamic banking practice to be more
stable than conventional banking with less fluctuation in rates of returns, inflation, and other
economic issues (e.g., Karim and Ali, 1989; Turen, 1996; and Cihak and Hesse, 2010).
The literature on assessing the performance of the banking sector uses various indexes and
concentrates on measuring and comparing performance of different banks across countries and over
time, usually known as bank efficiency studies. The research in this area mainly uses non-
parametric Data Envelopment Analysis (DEA) Approach (e.g., Bashir, 2003; Yudistira, 2004; and
Ramanathan, 2007). This method is used to examine how a particular bank operates relative to other
banks in the sample, and specify best practice (i.e., best level of output from the given inputs among
other banks in the sample).
Among different tools and techniques used as performance measure, financial ratios are used
quite commonly and extensively in the literature. One stream of research using financial ratios has
focused on the profitability of the banking sector in general, without comparison between Islamic
and conventional, in one or more countries in Islamic world (e.g., Ahmed and Khababa, 1999;
Islam, 2003; and Essayyad and Madani, 2003). Other stream of research has used financial ratios to
measure and compare Islamic bank and conventional banks performances (e.g., Karim and Ali,
1989; Olson and Zoubi, 2008; Parashar and Venkatesh, 2010; Hasan and Dridi, 2010; and Beck et
al., 2010,).
Olson and Zoubi (2008) investigate whether financial ratios will differ significantly between
the two categories of banks; Islamic banks versus conventional banks. They examine 16 financial
ratios commonly used in the banking industry and use logit, neural networks, and k-means nearest
neighbors to determine whether researchers or regulators could use these ratios to distinguish
between types of banks. The results reveal that characteristics such as profitability ratios, efficiency
ratios, assets quality indicators, and cash/liability ratios are good discriminators between Islamic
and conventional banks in the GCC region. They indicate that Islamic banks are, on average, more
profitable than conventional banks but less efficient. Karim and Ali (1989) also examine the
financial ratios of GCC Islamic banks and suggest that GCC Islamic banks are more profitable than
other GCC banks.
Furthermore, Parashar and Venkatesh (2010) compare the conventional and Islamic banks
performance in the GCC before and during the 2008 global financial crisis using the ratio
analysis. The study uses six ratios, spread across five bank performance parameters, namely,
capital, efficiency, profitability, liquidity and leverage. Their study covers the period 2006-2009
using a sample of 12 banks, 6 Islamic and 6 conventional. The results indicate that Islamic banks
have suffered more than conventional banks during global financial crisis in terms of capital ratio,
leverage and return on average equity, while conventional banks have suffered more than Islamic
banks in terms of return on average assets and liquidity. The results however reveal that despite the
hit in terms of certain ratios during crisis period, Islamic banks have performed better than
conventional banks during the study period. Similarly, Hasan and Dridi (2010) examine the impact
of the global financial crisis on profitability, credit and asset growth, and external ratings in a group
of countries where both Islamic and conventional banks have significant market share, including
Bahrain, Jordan, Kuwait, Malaysia, Qatar, Saudi Arabia, Turkey, and the UAE. The results reveal
that factors related to Islamic banks’ business model helped limit the negative impact on
profitability in 2008, while weaknesses in risk management practices in some Islamic banks led to a
larger decline in profitability in 2009 compared to conventional banks. The results also indicate that

ISSNs: 1923-7529; 1923-8401 © 2017 Academic Research Centre of Canada
~ 86 ~
Islamic banks have maintained stronger credit and asset growth compared to conventional banks in
almost all countries. Hasan and Dridi (2010) argue that the strong credit and asset growth suggest
that market share of Islamic banks is likely to continue to increase going forward and that Islamic
banks contributed more to macro stability by making more credit available and were less affected
by deleveraging.
On the other hand, Beck et al., (2010) use bank-level data to construct and compare indicators
of business model, efficiency, asset quality, and the stability of conventional and Islamic banks.
Their sample consists of over 2900 banks in 141 countries, focusing particularly on 20 countries
with both conventional and Islamic banks (a subset of 486 banks of which 89 are Islamic). They
compare the two types of banks and their performance during the 1995-2007 pre-crisis period, but
also compare the pre- and post-crisis performance of Islamic and conventional banks using more
recent data (2008-2010). The results reveal that both types of banks were affected by the financial
crisis. Islamic banks have higher capitalization during the 2005-2010 period, higher liquidity
reserves, and also significantly increased this liquidity during the crisis period, which resulted in
better performance of Islamic banks. The results also show that Islamic banks were more cost-
effective in a large sample of countries; however, conventional banks tend to be more cost-effective
than Islamic banks in countries where both banks exist. Further, Islamic banks were less cost-
effective but more stable in countries where the market share of Islamic banks is higher.
Recent literature argues that financial ratio analysis is retrospective not prospective
examination and it based on accounting rather than economic data. The literature suggest that a
comprehensive performance analysis should go beyond traditional measures and should employ
more forward-looking proxies while taking into account risk and profitability (e.g., Almazari, 2011;
Ali et al., 2011; Siddiqui and Shoaib, 2011; Al-Karim and Alam, 2013; Dawood, 2014; and
Lipunga, 2014).
Almazari (2011) investigates the financial performance of seven Jordanian commercial banks
using ROA as a measure of performance, and bank size, asset management and operational
efficiency as three independent variables affecting ROA. The results reveal a strong negative
correlation between ROA and banks’ size, a strong positive correlation between ROA and asset
management ratio, and a negative weak correlation between ROA and operational efficiency.
Ali et al., (2011) conduct a comprehensive study on public and private commercial banks of
Pakistan during the period 2006-2009 to identify the influence of macroeconomic factors on banks
profitability using the return on assets (ROA) and returns on equity (ROE). The results show that
asset management and economic growth establish positive and significant relationship with
profitability in both models. The results also indicate that high credit risk and capitalization lead to
lower profitability measured by ROA, while the operating efficiency tends to reveal the higher
profitability level as measured by ROE. Similarly, Siddiqui and Shoaib (2011) explore profit
efficiency and market value of 22 Pakistani banks during the period 2002-2009 through their
determinants; equity-capital ratio, earning risk, consumers’ loans as proportion of total assets, size
of each bank, market power of each bank, and banks investment in securities. Tobin’s Q model
(Price / Book Value of Equity) is incorporated as the representative of the market value (i.e.,
financial performance proxy). They provide evidence that the bank size, the leverage ratio and
investments carried out by the banks play significant role in determining the bank profitability.
Al-Karim and Alam (2013) measure the performance of five banks in Bangladesh using three
indicators namely, internal-based performance measured by ROA, market-based performance
measured by Tobin’s Q model (Price/Book ratio) and economic-based performance measured by
economic value add. Annual time series data from 2008-2012 are employed in multiple regression
analysis to evaluate the impact of bank size, credit risk, operational efficiency and asset manage-
Review of Economics & Finance, Volume 7, Issue 1
~ 87 ~
ment on financial performance measured by the three indicators. The results show that 90% of the
variation in ROA was due to the independent variables. In addition, seeing into the significance of
each of the independent variables, except for operational efficiency, the rest were found to have
impacts on ROA. The results also indicate 61% of the variation in economic value added was due to
the independent variables. However, in this case operational efficiency and credit risk did not have
impacts on the dependent variable. The market performance measuring model seemed to be the
least viable as only 31% of the variation in Tobin’s Q ratio was due to the independent variables.
Only bank size had some impact on the dependent variable while the other three were insignificant.
Dawood (2014) evaluates the profitability of the 23 Pakistani commercial banks during the
period of 2009 to 2012. He looks into the impact of cost efficiency, liquidity, capital adequacy,
deposits and bank size on the profitability (ROA) of the commercial banks. The empirical findings
indicate that liquidity, cost efficiency and capital adequacy are among those variables that decide
the profitability. However, deposits and size of the bank variables demonstrate no significant impact
on profitability. Moreover, Lipunga (2014) evaluates the determinants of profitability of listed
commercial banks in developing countries specifically focusing on Malawi during the period 2009-
2012 using internal-based and market-based profitability measurements. Return on Assets (ROA)
and Earnings Yield (EY) are used as proxies of internal and market profitability respectively. The
outcomes indicate that liquidity, bank size and management efficiency have a significant impact on
ROA, where capital adequacy has insignificant effect. Results also reveal that liquidity has
insignificant influence on profitability where bank size, capital adequacy and management
efficiency influence ROA significantly.
A number of recent studies (e.g., Rahman et al., 2015; Ashraf, Arshad, and Hu, 2016; and
Ashraf, Bibi, and Changjun, 2016) examine the impact of Basel-based regulations on different
practices of banks such as dividend policies and risk-taking banks.
Rahman et al., (2015) use panel data of 30 Bangladeshi commercial banks over the period
2008-2012 to study the impact of bank size on bank regulatory capital ratios and risk-taking
behavior. They also examine the relationship between bank regulatory capital ratios and bank risk.
Empirical results reveal that there is a significant negative relationship between regulatory capital
ratios and bank risk-taking implying that capital regulation (i.e., increasing capital ratios) is
effective in reducing risk of commercial banks in Bangladesh. The results also show that bank size
has a significant negative relationship with bank capital and a significant positive relationship with
bank risk-taking. These results signify that larger banks hold lower amount of capital and take
higher levels of risk, thus, large banks need special attention to increase their capital ratios and to
decrease their risk-taking (i.e., requiring larger banks to hold a buffer capital in addition to
minimum capital standards). The results also show that banks with more liquidity holds lower
capital ratio and take lower level of risk. Rahman et al., (2015) argue that commercial banks in
Bangladesh must manage their resources and expand their businesses, under the capital regulation,
in a way that safety, liquidity and earning level are integrated to attain the ongoing development.
Ashraf et al., (2016a) use a panel dataset of 21 listed commercial banks of Pakistan over the
period 2005-2012 to examine the empirical impact of risk-based capital standards on bank assets
portfolio risk. Pure regulatory measures of bank capital; capital adequacy ratio, and bank assets
portfolio risk; risk-weighted assets to total assets ratio are used to examine the relationship. Their
results favor the ongoing debate, which proposes that higher capital standards boost banking sector
stability.
Similarly, Ashraf et al., (2016b) examine whether common equity-based and stringent risk-
based capital standards force banks to restrict dividend payments. They use an international
sample of 8689 banks from 58 countries over the periods 1998–2007 (Pre-Crisis) and the extended
period from 1998 to 2012. The results reveal that common equity-based capital regulation is likely

ISSNs: 1923-7529; 1923-8401 © 2017 Academic Research Centre of Canada
~ 88 ~
to restrict bank dividends by limiting the sources of new capital for banks. Similarly, more stringent
risk-based capital standards are likely to force banks to retain profits to meet regulatory capital
standards. The results show that capital regulations are effective in restricting bank dividends in
good-times, but are less effective in crisis-period. Ashraf et al. (2016b) argue that regulators can
limit banks' options to raise new capital from non-common equity-based sources and can impose
stringent capital regulations to restrict banks from dividend over-payments in good times. However,
regulators can use blanket sector-wise dividend restrictions in crisis-periods.
The above discussion confirms that there are strong linkages among the profitability of banks
and its internal and external factors as identified by several research studies. However, a
comprehensive sample of data needs to be examined before any substantive conclusions can be
reached about the financial performance of Islamic banks currently operating the GCC region. This
study is the first to empirically evaluate the financial performance and implications of Basel III
standards on Islamic banks operating in the region using bank-level data for 24 Islamic Banks
scattered over six GCC countries (i.e., Kuwait, UAE, Kingdom of Saudi Arabia, Oman, Qatar, and
Bahrain) for a ten-year period (2006 to 2015). As per of our best knowledge, there is no empirical
study in the literature that evaluates the financial performance and implications of Basel III
standards on Islamic banks in the GCC region.
4. Research Methodology
The study uses bank-level data for 24 Islamic Banks over six GCC countries including Kuwait,
UAE, Kingdom of Saudi Arabia, Oman, Qatar, and Bahrain. We employ a comprehensive and the
most recent sample of data available in the GCC, consisting of annual cross-sections, 240
observations, from 2006 to 2015. Our central focus is on the GCC as one union. An individual
country-wise analysis does not lie within the scope of our study. We build up the model by using a
cross-sectional data of GCC Islamic banks suggesting that regional integration is non-negligible.
Maghyereh and Awartani (2012) argue that banking sector integration and harmonization measures
taken by the GCC central banks have had a significant impact on efficiency and homogeneity of
these countries’ banking sector. The World Bank report (2010) on economic integration in the
GCC, views the GCC region as one of the most important economic regions of the world where
countries are high-income, hydrocarbon-based economies, sharing historical and cultural ties and
similar regulations in various fields such as religion, finance, trade, customs, tourism, legislation,
and administration that largely reflect their common circumstances 6.
The basic financial data used in this study is obtained from the GCC stock markets’ annual
guides and corporate fact sheets, in addition to the annual reports of the banks that are available in
their websites. It is worth noting that some published annual reports of the GCC banks do not
contain adequate details for a comprehensive and in-depth financial analysis. They also do not use a
standard format for all GCC banks. The notes of the financial statements are examined to determine
whether all the banks in our study comply with the International Accounting Standards (IAS) during
the period 2006-2015. All banks in our sample comply with IAS. An individual country-wise
analysis is not intended here.
The annual data for all banks are used for calculating key financial ratios in order to assess the
performance of the banks. This starts with descriptive analysis on the financial performance of
Islamic banks in the GCC region using Financial Ratio Analysis (FRA) in terms of profitability,
liquidity, efficiency, solvency, and growth. We apply the same criteria used in previous studies to
6 See: The World Bank Report (2010), Middle East and North Africa Region: Economic Integration in the
GCC. [Online] Available at: http://siteresources.worldbank.org/INTMENA/Resources/GCCStudyweb.pdf

Review of Economics & Finance, Volume 7, Issue 1
~ 89 ~
assess the above 5 categories (e.g., Demirgue-Kunt and Hizinga, 1999; Samad and Kabir, 2000;
Yudistira, 2004; Rosly and Abu Baker, 2003; and Al-Hares et al., 2013). This study uses a
descriptive financial analysis to describe, measure, and compare the financial situations of all banks.
We calculate the average of each ratio. Table 2 represents the calculations of financial ratios used in
this study.
Table 2. Calculations of financial ratios employed in this study
Ratios
Calculation Remarks
Profitability Ratios
Return on Assets ROA = Net Profits after Tax / Total
Assets
High ROA indicates better
performance and assets utilization.
Return on Equity ROE = Net Profits after Tax / Owners’
Equity
High ROE indicates better performance. But, high ROE may be due to high financial leverage
Return on Deposits ROD = Net Profits after Tax / Total
Deposits
High ROD indicates better interest–
free lending contracts.
Liquidity Ratios
Total Loans to
Deposits
LD = Loans / Deposits
Here, Loans means financings
(receivables) for the Islamic Banks.
Higher LD indicates less liquidity and
more financial stress (risk).
Total Loans to Total
Assets LA = Loans (or financings) / Total Assets
The higher LA the less liquidity is of
the bank.
Cash and Bank
Balances to Deposits
CBBD = Cash and balances at the central
bank and other financial
institutions / Total Deposits
The higher CBBD the better is the
liquidity of the bank.
Cash and Portfolio
Investment to Deposits
CPID = Cash and Portfolio Investments /
Total Deposits
The higher CPID the better is the
liquidity of the bank.
Efficiency Ratios
Assets Utilization
(Turnover) AU = Total Revenue / Total Assets
High AU indicates efficiently in using
banks’ assets to their capacity.
Operating Efficiency OE = Total Operating Expenses / Total
Operating Revenue
The lower OE he better indicating more operating income and controlling operating expenses.
Solvency Ratios
Debt-Equity Ratio DE = Total Debt / Owners’ Equity
The lower DE the better is the bank capital to absorb financial shocks (i.e., creditors default in paying back their loans or decrease in assets values).
Debt to Total Assets DTA = Total Debt / Total Assets High DTA indicates high debt or the ability to obtain additional financing compared to the equity financing.
Equity Multiplier EM = Total Assets / Owners’ Equity High EM means that the bank has more debt to convert into assets (hence, greater risk).
Other
Internal Growth Rate IGR = Retained Profits of yeart / Owners’
Equity of yeart-1
The higher IGR the better is the annual growth rate of stockholders’ equity fund resulting from reinvesting the profits back.

ISSNs: 1923-7529; 1923-8401 © 2017 Academic Research Centre of Canada
~ 90 ~
In addition to assessing the financial performance of the full set of GCC Islamic banks using
ratio analysis, we empirically evaluate the financial performance and implications of Basel III
regulations on GCC Islamic banks. Financial performance is measured by using two indicators;
Internal–based performance measured by ROA, and Market-based performance measured by
Tobin’s Q model. We use regression analysis to capture the impact of bank size, credit risk,
operational efficiency and asset management on financial performance measured by the two
indicators, and to create a good-fit regression model to predict the future financial performance of
these banks. The models estimated in this study, referred to Models (1) and (2) are:
ROAit = β0 +β1BankSizeit +β2CreditRiskit +β3OperationalEfficiencyit +β4AssetManagementit +εit (1)
Tobin’s
Qit = β0 +β1BankSizeit +β2CreditRiskit +β3OperationalEfficiencyit +β4AssetManagementit +εit (2)
To control for the implications of Basel III regulations on Islamic banks, a dummy ‘control’
variable (BASEL) is included in the regression equations. The dummy variable is given the value of
0 for each observation before 2013 (pre-Basel III) and the value of 1 for observations during 2013 -
2015. Thus, Models (1) and (2) are restated, respectively, as
ROAit = β0 + β1Bank Sizeit + β2Credit Riskit + β3Operational Efficiencyit + β4Asset Managementit
+ β5BASELD[0,1] +εit (3)
Tobin’s
Qit = β0 + β1Bank Sizeit + β2Credit Riskit + β3Operational Efficiencyit + β4Asset Managementit
+ β5BASELD[0,1] +εit (4)
All models are estimated using ordinary least squares (OLS) techniques to estimate the
coefficients. White’s (1980) heteroscedasticity-corrected variances and standard errors are used to
diminish the effects of any remaining heteroscedasticity.
Tables 3 and 4 present the pair-wise correlations between the variables used in the regression
Models (I) and (II) respectively, for the pooled sample. The results reveal that the highest
correlation coefficient among independent variables is 0.357, suggesting that multicollinearity does
not appear to be a problem in this study. The results also show a significant positive correlation
between ROA and each of the independent variables Asset Management (+0.883) and Bank Size
(+0.694) and between Toboin’s Q and Bank Size (+0.790). The asterisks *, ** in tables 3 and 4
indicate statistical significance at the level of 0.10 and 0.05, respectively.
Table 3. Pearson correlations between all variables in model (I)
for the pooled sample (2006 to 2015)
ROA
Bank
Size
Credit
Risk
Operational
Efficiency
Asset
Management
ROA 1.00
Bank Size 0.694* 1.00
Credit Risk -0.422 -0.281 1.00
Operational Efficiency -0.313 -0.219 0.114 1.00
Asset Management 0.883**
0.357 0.087 -0.351 1.00

Review of Economics & Finance, Volume 7, Issue 1
~ 91 ~
Table 4. Pearson correlations between all variables model (II)
for the pooled sample (2006 to 2015)
Tobin’s
Q
Bank
Size
Credit
Risk
Operational
Efficiency
Asset
Management
Tobin’s Q 1.00
Bank Size 0.790**
1.00
Credit Risk -0.302 -0.281 1.00
Operational Efficiency -0.078 -0.219 0.114 1.00
Asset Management 0.416 0.357 0.087 -0.351 1.00
5. Results
We examine the financial performance of the Islamic banking industry in the GCC region
using financial ratios such as, profitability, liquidity, efficiency, solvency, and growth. Our
conclusions are drawn from evaluating the financial ratios of the annual cross-sections over the ten-
year period (2006-2015). However, due to the space limitations, we only report the results for the
pooled sample. Table 5 presents descriptive statistics for financial performance indicators of the
pooled sample of Islamic banks. The value of each ratio represents the average over the study
period 2006-2015.
The annual profitability ratios (not reported) indicate declining ROA, ROE, and ROD ratios of
Islamic banks from 2008 onwards, impacted by the financial crisis that exploded worldwide during
2008 (i.e., higher provisioning charges). However, Islamic banks report an increased profitability
from 2010 onwards. The increasing profitability of Islamic banks is mainly due to the higher net
income margin from financing activities resulting from investment deposits as the main and cheaper
source of funding compared to equity capital, money market, and inter-bank activities in
conventional banks. The increasing profitability of Islamic banks may also imply better assets
quality.
On the other hand, we found significant increase in annual liquidity ratios during 2006-2015.
Not surprisingly, the increase in annual liquidity ratios (not reported) indicates that Islamic banks
have significantly increased liquidity reserves during the 2006-2015 period in most GCC countries.
It can be argued that the increasing liquidity of Islamic banks was mainly due to shortage in the
money markets of Islamic financial instruments available for long term investments, and the limited
financing that these banks can provide (i.e., from Shariah compliance perspective) in order to place
their excess liquid funds. We also believe that GCC Islamic banks carefully hold more cash and
near cash assets relative to deposits to meet the risk of withdrawal of deposits.
The results considering banks’ efficiency show a decline in operating efficiency of Islamic
banks over the period 2006-2015. One interpretation of this result is that Islamic banks from a
macro level are less efficient in managing their overall costs (i.e. other operating and non-operating
expenses). Islamic banks in the GCC region report an increasing growth rate of operating expenses
(i.e., at a faster rate than the growth rate of operating income) overtime (e.g., Siraj and Pillai, 2012).
Our earlier finding on the increasing profitability of Islamic Banks is mainly due to lower costs of
funds and better assets quality.
The annual Solvency ratios of Islamic banks show better solvency (less risk). Islamic banks
depend more on equity funds (than on debts and liabilities) towards total assets. Hence, Islamic
banks are less leveraged (or more solvent). Samad (2004) argues that Islamic banks are more
cautious about selecting investments in which their long-term loans are a small percentage of the
total.

ISSNs: 1923-7529; 1923-8401 © 2017 Academic Research Centre of Canada
~ 92 ~
Finally, the Annual Internal Growth Rate (IGR) of Islamic banks (resulting from reinvesting
the profits back) increases over the study period 2006-2015. We argue that these reinvested funds
provide a better cushion (higher equity buffer) for the Islamic bank against any shocks, however it
would negatively affect the profitability of the bank as more than needed funds is booked under
equity.
Table 5. Descriptive statistics of “Islamic Banks” financial ratios (2006-2015)
Ratios Mean Std. Dev. Min Max
Profitability Ratios
Return on Assets (%) 1.36 1.61 -4.13 13.2
Return on Equity (%) 12.66 16.11 -58.21 47.06
Return on Deposits (%) 6.12 2.54 -61.79 37.45
Liquidity Ratios
Total Loans to Deposits (%) 51.21 27.85 19.05 287.41
Total Loans to Total Assets (%) 48.98 15.05 9.83 88.76
Cash and Bank Balances to Deposits (%) 23.99 12.09 1.99 85.00
Cash and Portfolio Investment to Deposits (%) 33.77 16.06 6.09 144.18
Efficiency Ratios
Assets Utilization (%) 5.11 4.01 1.89 91.19
Operating Efficiency (%) 38.13 12.33 21.07 88.65
Solvency Ratios
Debt-Equity Ratio (%) 611.77 215.87 14.38 1178.06
Debt to Total Assets (%) 84.99 55.24 44.61 101.44
Equity Multiplier A/E 7.11 6.19 2.01 16.28
Other
Internal Growth Rate (%) 14.32 9.11 -19.22 126.26
Table 6 presents descriptive statistics for Basel III capital and liquidity standards of the pooled
sample of GCC Islamic banks7. The value of each ratio represents the average over the period 2013-
2015 (post-Basel III) as reported by the banks. The results indicate that Islamic banks appear to be
sufficiently capitalized for Basel III. The average Capital Adequacy Ratio (CAR) over the period
2013-2015 (post-Basel III) for GCC Islamic banks comfortably satisfy the enhanced capital
standards of Basel III (17.89%). The results also indicate that nearly all of banks’ capital is actually
Tier 1 capital. Hence, the new Tier 1 requirement of 6% (or 8.5% including buffers) is securely met
(i.e., the average Tier 1 capital is 14.82%). The findings suggest that Basel III capital standards will
not require GCC Islamic banks to go through any additional forms of capitalization. GCC Islamic
banks are well-positioned to absorb higher provisions and impairment charges given the higher
capital adequacy ratios reported by most. It can also be argued that Basel III capital standards are
unlikely to materially add to the existing challenges faced by Islamic banks.
The average Liquidity Coverage Ratio (LCR) of GCC Islamic banks (171.13%) highlights
sound liquidity profiles and broad compliance with Basel III standards. In the GCC region, retail
customers tend to be more Shariah sensitive, providing Islamic banks with a large base of low-cost
retail savings deposits, hence supporting their stronger LCRs. According to Moody's Corporation
2015 report, retail deposits comprised around 67% of Islamic banks’ customer deposits.
7 We were not able to report the NSFR ratio due to non-availability of data.

Review of Economics & Finance, Volume 7, Issue 1
~ 93 ~
We believe that because of the limited availability of Shariah-compliant high-quality liquid
assets (HQLAs), Islamic banks commonly hold large, but low-yielding buffers of cash or bills, and
hence, face a profitability challenge. At the same time, sustained lower oil prices reduce the overall
domestic liquidity in GCC countries, creating funding and liquidity pressures for the banks. This
development could lead to a gradual weakening of the LCR for the banking sector. However, we
argue that liquidity for Islamic banks will continue to benefit from the expansion of their retail
businesses, while the development of domestic Sukuk markets will improve their access to HQLAs,
further boosting their LCRs.
Table 6. Descriptive statistics of “Islamic Banks” Basel III capital
standards and liquidity coverage ratio (2013-2015)
Ratios Mean Std. Dev. Min Max
Common Equity Ratio (%) 11.65 2.97 6.71 18.46
Tier I Capital Ratio (%) 14.82 3.01 9.24 20.87
Capital Adequacy Ratio (%) 17.02 4.37 13.66 23.15
Liquidity Coverage Ratio (%) 171.13 7.12 102.6 267.22
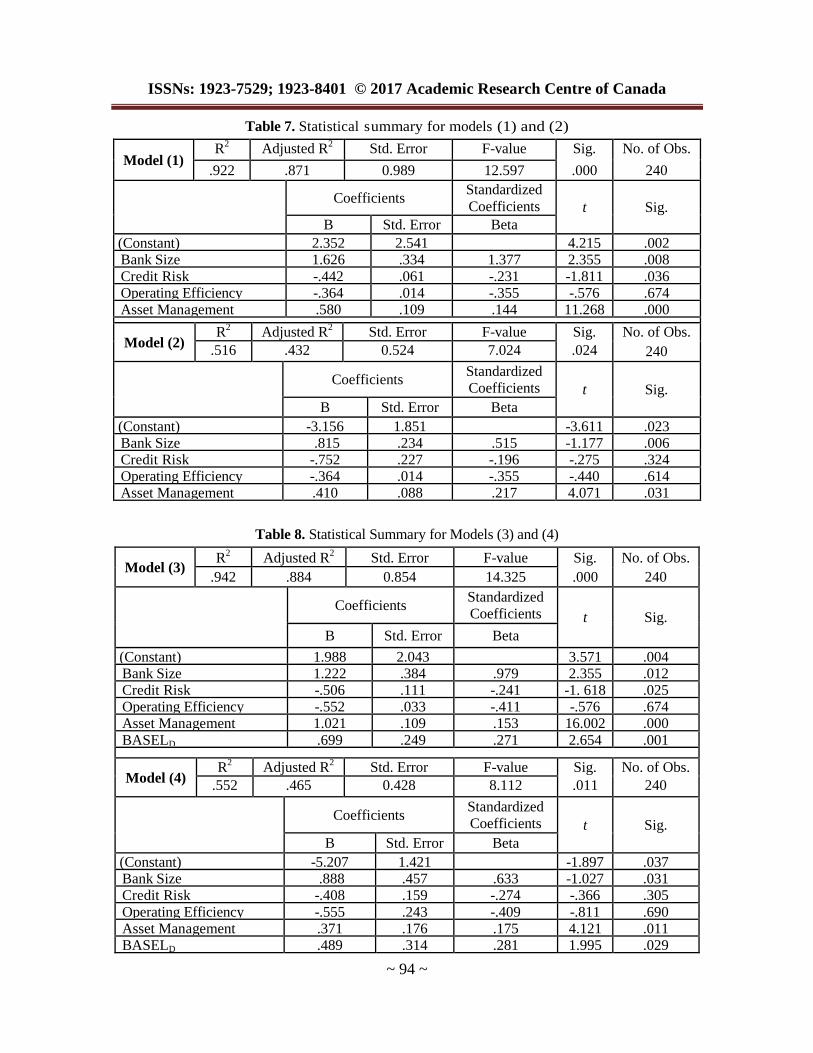
Results from estimating Models (1) and (2), and Models (3) and (4) for the pooled sample are
presented in Tables 7 and 8, respectively.
The results of Internal–based performance evaluation indicate a strong explanatory power (i.e.,
87.1% of the variation in ROA is explained by the independent variables). The estimated
coefficients on bank size and Assets Management are positive and significant (at the 1% level). The
results also show a negative and significant coefficient on credit risk (at the 5% level). The
estimated coefficient on operational efficiency is insignificant. These results reinforce previous
research findings (e.g., Ali et al., 2011; Almazari, 2011; Al-Karim and Alam, 2013; and Lipunga,
2014) and are consistent with the fact that Islamic banks are less efficient in managing their overall
costs due to the limited availability of Shariah-compliant HQLAs. The increasing profitability of
Islamic banks is mainly due to lower costs of funds, better assets quality, and better solvency (lower
risk).
The results of Market-based performance evaluation point towards an adequate explanatory
power (i.e., 43.2% of the variation in Tobin’s Q is explained by the independent variables). The
estimated coefficients on assets management and bank size are positive and significant (at the 5%
level). The estimated coefficient on credit risk and operational efficiency are insignificant. These
results reinforce previous research findings (e.g., Ali et al., 2011 and Siddiqui and Shoaib, 2011).
We argue that Islamic banks are on average well positioned in the market to absorb higher
provisions given the high capital adequacy ratios (i.e., assets quality) and superior low-cost
liquidity, reported by most. Nevertheless, due to the limited availability of Shariah-compliant
HQLAs the banks are less efficient, but more profitable, more solvent (less risky) and enjoy higher
internal growth rate.
The coefficient on the implications of Basel III dummy ‘control’ variable (BASEL) is positive
and significant in both estimated equations, which –not surprisingly- indicates that financial
performance of GCC Islamic banks is highly sensitive to the launch of Basel III regulations.
ISSNs: 1923-7529; 1923-8401 © 2017 Academic Research Centre of Canada
~ 94 ~
Table 7. Statistical summary for models (1) and (2)
Model (1) R
2 Adjusted R
2 Std. Error F-value Sig. No. of Obs.
.922 .871 0.989 12.597 .000 240
Coefficients
Standardized
Coefficients t Sig.
B Std. Error Beta
(Constant) 2.352 2.541 4.215 .002 Bank Size 1.626 .334 1.377 2.355 .008
Credit Risk -.442 .061 -.231 -1.811 .036 Operating Efficiency -.364 .014 -.355 -.576 .674 Asset Management .580 .109 .144 11.268 .000
Model (2)
R2 Adjusted R
2 Std. Error F-value Sig. No. of Obs.
.516 .432 0.524 7.024 .024 240
Coefficients
Standardized
Coefficients t Sig.
B Std. Error Beta
(Constant) -3.156 1.851 -3.611 .023 Bank Size .815 .234 .515 -1.177 .006 Credit Risk -.752 .227 -.196 -.275 .324 Operating Efficiency -.364 .014 -.355 -.440 .614 Asset Management .410 .088 .217 4.071 .031
Table 8. Statistical Summary for Models (3) and (4)
Model (3) R
2 Adjusted R
2 Std. Error F-value Sig. No. of Obs.
.942 .884 0.854 14.325 .000 240
Coefficients Standardized
Coefficients t Sig.
B Std. Error Beta
(Constant) 1.988 2.043 3.571 .004 Bank Size 1.222 .384 .979 2.355 .012 Credit Risk -.506 .111 -.241 -1. 618 .025 Operating Efficiency -.552 .033 -.411 -.576 .674 Asset Management 1.021 .109 .153 16.002 .000
BASELD .699 .249 .271 2.654 .001
Model (4) R
2 Adjusted R
2 Std. Error F-value Sig. No. of Obs.
.552 .465 0.428 8.112 .011 240
Coefficients
Standardized
Coefficients t Sig.
B Std. Error Beta
(Constant) -5.207 1.421 -1.897 .037 Bank Size .888 .457 .633 -1.027 .031 Credit Risk -.408 .159 -.274 -.366 .305
Operating Efficiency -.555 .243 -.409 -.811 .690 Asset Management .371 .176 .175 4.121 .011 BASELD .489 .314 .281 1.995 .029

Review of Economics & Finance, Volume 7, Issue 1
~ 95 ~
6. Summary and Conclusions
The purpose of this study is to empirically evaluate the financial performance of GCC Islamic
banks and to assess the implications of Basel III standards using bank-level data for 24 Islamic
Banks scattered over six GCC countries (i.e., Kuwait, UAE, Kingdom of Saudi Arabia, Oman,
Qatar, and Bahrain) for a ten-year period (2006 to 2015). We measure financial performance
empirically by using two indicators; Internal–based performance measured by ROA, and Market-
based performance measured by Tobin’s Q model. The results reveal that the explanatory power of
the internal–based performance model is higher than the market-based performance model. Except
for operational efficiency, the rest of independent variables have significant impacts on ROA.
However, in the case of market-based performance model, bank size and asset management have
significant impact on the dependent variable while operational efficiency and credit risk are
insignificant. Not surprisingly, the results also indicate that financial performance of GCC Islamic
banks is highly sensitive to the launch of Basel III regulations.
Findings of this study will be useful for capital-market participants, as it provides further
empirical evidence on the financial performance of Islamic Banks in the GCC region. Further, as
the full implementation of Basel III standards will not take place until 2019, the results of this study
may convey information that should encourage banks to consider the earlier implementation of
Basel III standards in order to provide themselves with a reputational boost, as well as a competitive
advantage. Future research may further examine the effect of Basel III regulations on bank
performance through equity and liquidity ratios when the full implementation is in place.
References
[1] AAOIFI 2010. Accounting, Auditing and Governance Standards for Islamic Financial
Institutions (Accounting and Auditing Organization for Islamic Financial Institutions), Bahrain.
[2] Ahmed, A. M. and Khababa, N. (1999). “Performance of the Banking Sector in Saudi Arabia”,
Journal of Financial Management and Analysis, 12(2): 30-36.
[3] Al-Gzaairi, A., (1979). The Muslim Route. Al-Klyat Al-Azhariah Bookshop, Cairo, Egypt.
[4] Al-Hares, O. M., AbuGhazaleh, N. M., and El-Galfy, A. M. (2013). “Financial Performance and
Compliance With Basel III Capital Standards: Conventional vs. Islamic Banks”, The Journal of
Applied Business Research, 29 (4): 1031-1048.
[5] Ali, K., Akhtar, M. and Ahmed, H. (2011). “Bank-Specific and Macroeconomic Indicators of
Profitability - Empirical Evidence from the Commercial Banks of Pakistan”, International
Journal of Business and Social Science, 2(6): 235-242.
[6] Al-Jinde, M. (1986). Murabaha Contract Between Islamic Fiqh and Bank Dealing. Dar Al-
Nahdah Al-Arabia, Cairo, Egypt.
[7] Al-Karim, R., and Alam, T. (2013). “An Evaluation of Financial Performance of Private
Commercial Banks in Bangladesh: Ratio Analysis”, Journal of Business Studies Quarterly,
5(2): 65-77.
[8] Almazari, A. A. (2011). “Financial Performance Evaluation of Some Selected Jordanian
Commercial Banks”, International Research Journal of Finance and Economics, 6(4): 50-63.
[9] Ashraf, B. N., Arshad, S., and Hu, Y. (2016a). “Capital Regulation and Bank Risk-Taking
Behavior: Evidence from Pakistan”, International Journal of Financial Studies, 4(3): 16.
[10] Ashraf, B. N., Bibi, B., and Changjun, Z. (2016b). “How to regulate bank dividends? Is capital
regulation an answer?”, Economic Modelling, 57: 281-293.
ISSNs: 1923-7529; 1923-8401 © 2017 Academic Research Centre of Canada
~ 96 ~
[11] Augustine, B. D. (2016, September 18). GCC’s Islamic banks have stronger liquidity profiles:
Retail focus provides Gulf banks access to cheaper funding. Gulf News [Online] Available at:
http://gulfnews.com/business/sectors/banking/gcc-s-islamic-banks-have-stronger-
liquidity-profiles-1.1897783
[12] Bashir, A., (2003). “Determinants of Profitability in Islamic Banks: Some Evidence from the
Middle East”, Journal of Islamic Economics Studies, 11 (1): pp. 31-53.
[13] Beck, T., Demirguc-Kunt, A., and Merrouche, O. (2010). Islamic vs. Conventional Banking
Business Model. World Bank - Efficiency and Stability Policy Research Working Paper, 5446,
October.
[14] Chapra, M. U. (1998). The Major Modes of Islamic Finance, Islamic Economics, Banking and
Finance. Working Paper, Islamic Foundation, Leicester, U.K.
[15] Cihak, M., and Hesse, H. (2010). “Islamic Banks and Financial Stability: An Empirical
Analysis”, Journal of Financial Services Research, 38 (2/3): 95-113.
[16] Dawood, U. (2014). “Factors Impacting Profitability of Commercial Banks in Pakistan for the
Period of (2009-2012)”, International Journal of Scientific and Research Publications, 4(3): 1-7
[17] Demirgue-Kunt, A., and Hizinga, H. (1999). “Determinants of Commercial Bank Interest
Margins and Profitability: Some International Evidence”, the World Bank Economic Review,
13 (2): 379-408.
[18] El-Galfy, A. (1991). The Bases Measurement of Murabaha in Islamic Banks, Cairo University,
Egypt.
[19] Ernst & Young's World Islamic Banking Competitiveness Report (2016): New realities. New
opportunities. [Online] Available at: http://www.ey.com/Publication/vwLUAssets/ey-
world-islamic-banking-competitiveness-report-2016/$FILE/ey-world-islamic-banking-
competitiveness-report-2016.pdf
[20] Essayyad, M., and Madani, H. (2003). “Investigating Bank Structure of an Open Petroleum
Economy: The Case of Saudi Arabia”, Managerial Finance, 29 (11): 73-92.
[21] Hamdan, C. (2009). “Banking on Islam: A Technology Perspective”, Islamic Finance News, 6
(19): 20-21
[22] Haron, S. (2000). “A Comparative Study of Islamic Banking Practices”, Islamic Economic, 10
(1): 1-31.
[23] Hasan, M., and Dridi, J. (2010). The Effects of the Global Crisis on Islamic and Conventional
Banks: A Comparative Study; IMF Working Paper, WP/10/201.
[24] Islam, M. (2003). “Development and Performance of Domestic and Foreign Banks in the GCC
Countries”, Managerial Finance, 29 (2/3): 42-72.
[25] Karim, R., and Ali, A. (1989). “Determinants of the Financial Strategy of Islamic Banks”,
Journal of Business Finance and Accounting, 16 (2): 193-212.
[26] Lipunga, A. M. (2014). “Determinants of Profitability of Listed Commercial Banks in
Developing Countries: Evidence from Malawi”, Research Journal of Finance and Accounting,
5 (6): 41-49.
[27] Maghyereh, A. I., and Awartani, B. (2012). “Financial Integration of GCC Banking Markets:
A Non-Parametric Bootstrap DEA Estimation Approach”. Research in International Business
and Finance, 26 (2):181-195

Review of Economics & Finance, Volume 7, Issue 1
~ 97 ~
[28] Moody's Corporation report (2015): Global Credit Research. [Online] Available at:
https://www.moodys.com/research/Moodys-Islamic-banks-strong-liquidity-profiles-
driven-by-retail-strengths--PR_355116
[29] Olson, D., and Zoubi, T. (2008). “Using Accounting Ratios to Distinguish Between Islamic
and Conventional Banks in the GCC Region”, The International Journal of Accounting, 43(1):
45-65.
[30] Parashar S.P., and Venkatesh, J. (2010). “How Did Islamic Banks Do During Global Financial
Crisis?”, Banks and Bank Systems, 5 (4): 54-62.
[31] Pomeranz, F. (1997). “The Accounting and Auditing Organization for Islamic Financial
Institutions”, Journal of International Accounting Auditing and Taxation, 6 (1): 1-7.
[32] Rahman, M. M., Changjun, Z., and ASHRAF, B. N. (2015). “Bank Size, Risk-taking and
Capital Regulation in Bangladesh”, Eurasian Journal of Business and Economics, 8 (15): 95-
114.
[33] Ramanathan, R. (2007). “Performance of Banks in Countries of the Gulf Cooperation
Council”, International Journal of Productivity and Performance Management, 56 (2): 137-154.
[34] Rosly, S. A., Abu Bakar, M. A. (2003). “Performance of Islamic and Mainstream Banks in
Malaysia”, International Journal of Social Economics, 30 (12): 1249-1265.
[35] Samad, A. (2004). “Performance of Interest Free Islamic Banks vis-à-vis Interest-Based
Conventional Banks of Bahrain”, Journal of Economics and Management, 12 (2): 1-25.
[36] Samad, A., and Kabir, H. (2000). “The performance of Malaysian Islamic Bank During 1984-
1997: An Exploratory Study”, Thoughts on Economics, 10 (1/2): 7-26.
[37] Schaik, D. (2001). “Islamic Banking” The Arab Bank Review, 3 (1): 45-52.
[38] Shehatah, S.I. (1987). The Accounting Theory in the Islamic View. Al-Zahrai for Arabic
Information, Cairo, Egypt.
[39] Siddiqui, M. A., and Shoaib, A. (2011). “Measuring performance through capital structure:
Evidence from banking sector of Pakistan”, African Journal of Business Management, 5(5):
1871-1879.
[40] Siraj, K., and Pillai, S. (2012). “Comparative Study on Performance of Islamic Banks and
Conventional Banks in GCC Region”. Journal of Applied Finance and Banking, 2 (3): 123-
161.
[41] Stubing, D. (2011, December 5). GCC Banks in Good Position for Basel III. Gulf News
[Online] Available at: http://gulfbusiness.com/gcc-banks-in-good-position-for-basel-iii/.
[42] Suleiman, N. M. (2000). “Corporate Governance in Islamic Bank”. Islamic Banking, 1 (1): 99-
116.
[43] Turen, S. (1996). “Performance and Risk Analysis of Islamic Banks: The Case of Bahrain
Islamic Bank”. Journal of King Abdulaziz University: Islamic Economics [Online], (8): 3-14.
Available from: http://www.kantakji.com/fiqh/Files/Banks/7001.pdf.
[44] Wilson, R. (2009). Why Islamic Banking is Successful? Islamic Banks are Unscathed Despite
of Financial Crisis. [Online], Available from:
http://www.isdbforum.org/Subjects/Islam_and_the_Financial_Crisis/rwilson.pdf.
[45] Yudistira, D. (2004). “Efficiency in Islamic Banking: An Empirical Analysis of 18 Banks”,
Islamic Economic Studies, 12 (1): 1-19.