iSensor PC-USB Evaluation System Preliminary Technical Data … · 2017-02-15 · iSensor ® PC-USB...
15
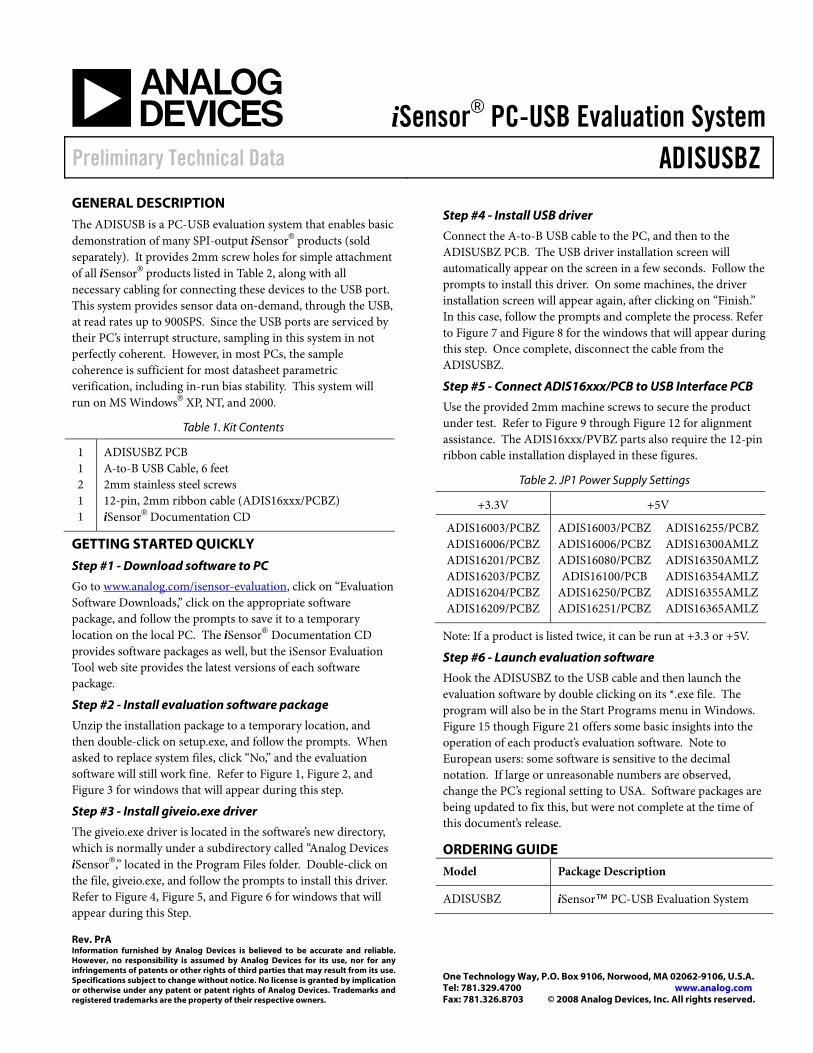
iSensor ® PC-USB Evaluation System Preliminary Technical Data ADISUSBZ Rev. PrA Information furnished by Analog Devices is believed to be accurate and reliable. However, no responsibility is assumed by Analog Devices for its use, nor for any infringements of patents or other rights of third parties that may result from its use. Specifications subject to change without notice. No license is granted by implication or otherwise under any patent or patent rights of Analog Devices. Trademarks and registered trademarks are the property of their respective owners. One Technology Way, P.O. Box 9106, Norwood, MA 02062-9106, U.S.A. Tel: 781.329.4700 www.analog.com Fax: 781.326.8703 © 2008 Analog Devices, Inc. All rights reserved. GENERAL DESCRIPTION The ADISUSB is a PC-USB evaluation system that enables basic demonstration of many SPI-output iSensor ® products (sold separately). It provides 2mm screw holes for simple attachment of all iSensor ® products listed in Table 2, along with all necessary cabling for connecting these devices to the USB port. This system provides sensor data on-demand, through the USB, at read rates up to 900SPS. Since the USB ports are serviced by their PC’s interrupt structure, sampling in this system in not perfectly coherent. However, in most PCs, the sample coherence is sufficient for most datasheet parametric verification, including in-run bias stability. This system will run on MS Windows ® XP, NT, and 2000. Table 1. Kit Contents 1 1 2 1 1 ADISUSBZ PCB A-to-B USB Cable, 6 feet 2mm stainless steel screws 12-pin, 2mm ribbon cable (ADIS16xxx/PCBZ) iSensor ® Documentation CD GETTING STARTED QUICKLY Step #1 - Download software to PC Go to www.analog.com/isensor-evaluation , click on “Evaluation Software Downloads,” click on the appropriate software package, and follow the prompts to save it to a temporary location on the local PC. The iSensor ® Documentation CD provides software packages as well, but the iSensor Evaluation Tool web site provides the latest versions of each software package. Step #2 - Install evaluation software package Unzip the installation package to a temporary location, and then double-click on setup.exe, and follow the prompts. When asked to replace system files, click “No,” and the evaluation software will still work fine. Refer to Figure 1, Figure 2, and Figure 3 for windows that will appear during this step. Step #3 - Install giveio.exe driver The giveio.exe driver is located in the software’s new directory, which is normally under a subdirectory called “Analog Devices iSensor ® ,” located in the Program Files folder. Double-click on the file, giveio.exe, and follow the prompts to install this driver. Refer to Figure 4, Figure 5, and Figure 6 for windows that will appear during this Step. Step #4 - Install USB driver Connect the A-to-B USB cable to the PC, and then to the ADISUSBZ PCB. The USB driver installation screen will automatically appear on the screen in a few seconds. Follow the prompts to install this driver. On some machines, the driver installation screen will appear again, after clicking on “Finish.” In this case, follow the prompts and complete the process. Refer to Figure 7 and Figure 8 for the windows that will appear during this step. Once complete, disconnect the cable from the ADISUSBZ. Step #5 - Connect ADIS16xxx/PCB to USB Interface PCB Use the provided 2mm machine screws to secure the product under test. Refer to Figure 9 through Figure 12 for alignment assistance. The ADIS16xxx/PVBZ parts also require the 12-pin ribbon cable installation displayed in these figures. Table 2. JP1 Power Supply Settings +3.3V +5V ADIS16003/PCBZ ADIS16006/PCBZ ADIS16201/PCBZ ADIS16203/PCBZ ADIS16204/PCBZ ADIS16209/PCBZ ADIS16003/PCBZ ADIS16006/PCBZ ADIS16080/PCBZ ADIS16100/PCB ADIS16250/PCBZ ADIS16251/PCBZ ADIS16255/PCBZ ADIS16300AMLZ ADIS16350AMLZ ADIS16354AMLZ ADIS16355AMLZ ADIS16365AMLZ Note: If a product is listed twice, it can be run at +3.3 or +5V. Step #6 - Launch evaluation software Hook the ADISUSBZ to the USB cable and then launch the evaluation software by double clicking on its *.exe file. The program will also be in the Start Programs menu in Windows. Figure 15 though Figure 21 offers some basic insights into the operation of each product’s evaluation software. Note to European users: some software is sensitive to the decimal notation. If large or unreasonable numbers are observed, change the PC’s regional setting to USA. Software packages are being updated to fix this, but were not complete at the time of this document’s release. ORDERING GUIDE Model Package Description ADISUSBZ iSensor™ PC-USB Evaluation System
Transcript of iSensor PC-USB Evaluation System Preliminary Technical Data … · 2017-02-15 · iSensor ® PC-USB...
iSensor® PC-USB Evaluation SystemPreliminary Technical Data ADISUSBZ
Rev. PrA Information furnished by Analog Devices is believed to be accurate and reliable. However, no responsibility is assumed by Analog Devices for its use, nor for any infringements of patents or other rights of third parties that may result from its use. Specifications subject to change without notice. No license is granted by implication or otherwise under any patent or patent rights of Analog Devices. Trademarks and registered trademarks are the property of their respective owners.
One Technology Way, P.O. Box 9106, Norwood, MA 02062-9106, U.S.A. Tel: 781.329.4700 www.analog.com Fax: 781.326.8703 © 2008 Analog Devices, Inc. All rights reserved.
GENERAL DESCRIPTION The ADISUSB is a PC-USB evaluation system that enables basic demonstration of many SPI-output iSensor® products (sold separately). It provides 2mm screw holes for simple attachment of all iSensor® products listed in Table 2, along with all necessary cabling for connecting these devices to the USB port. This system provides sensor data on-demand, through the USB, at read rates up to 900SPS. Since the USB ports are serviced by their PC’s interrupt structure, sampling in this system in not perfectly coherent. However, in most PCs, the sample coherence is sufficient for most datasheet parametric verification, including in-run bias stability. This system will run on MS Windows® XP, NT, and 2000.
Table 1. Kit Contents
1 1 2 1 1
ADISUSBZ PCB A-to-B USB Cable, 6 feet 2mm stainless steel screws 12-pin, 2mm ribbon cable (ADIS16xxx/PCBZ) iSensor® Documentation CD
GETTING STARTED QUICKLY
Step #1 - Download software to PC
Go to www.analog.com/isensor-evaluation, click on “Evaluation Software Downloads,” click on the appropriate software package, and follow the prompts to save it to a temporary location on the local PC. The iSensor® Documentation CD provides software packages as well, but the iSensor Evaluation Tool web site provides the latest versions of each software package.
Step #2 - Install evaluation software package
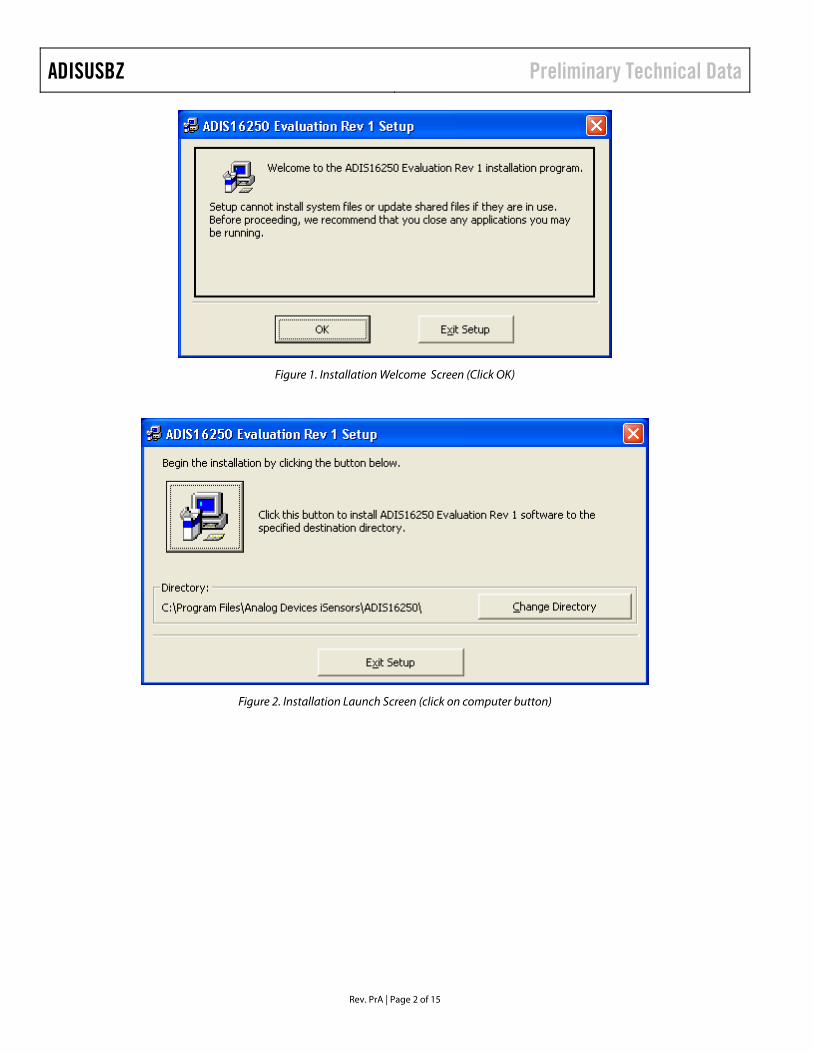
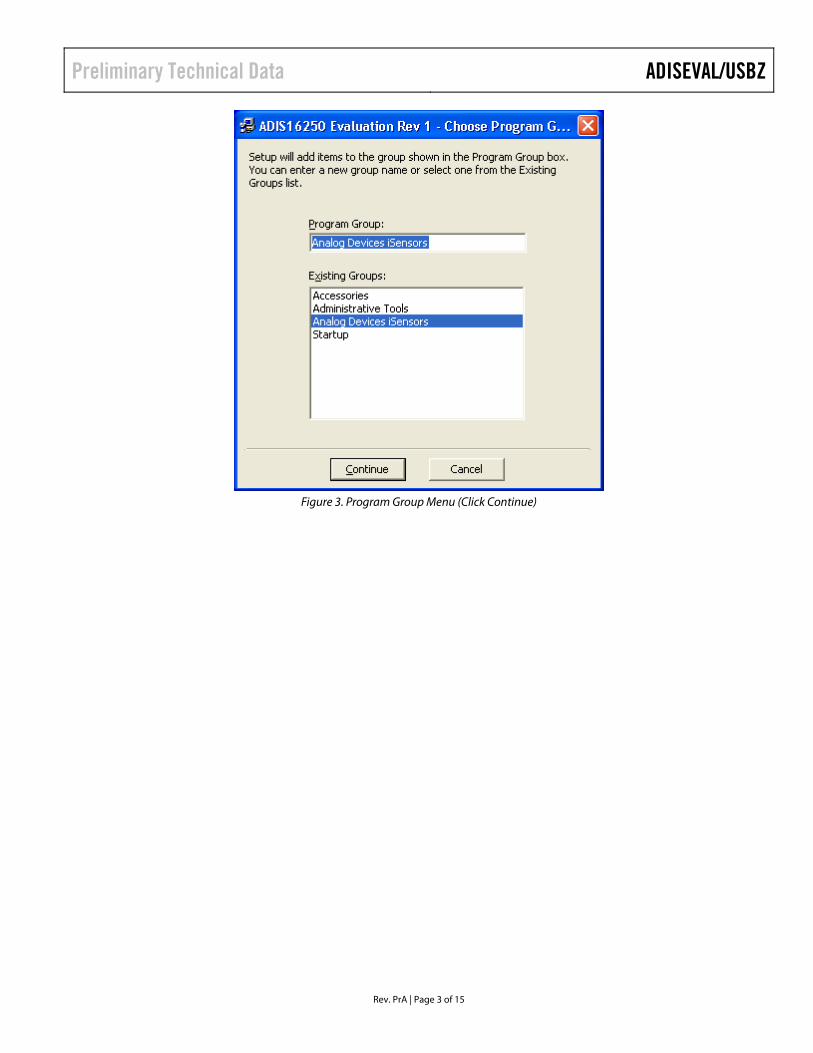
Unzip the installation package to a temporary location, and then double-click on setup.exe, and follow the prompts. When asked to replace system files, click “No,” and the evaluation software will still work fine. Refer to Figure 1, Figure 2, and Figure 3 for windows that will appear during this step.
Step #3 - Install giveio.exe driver
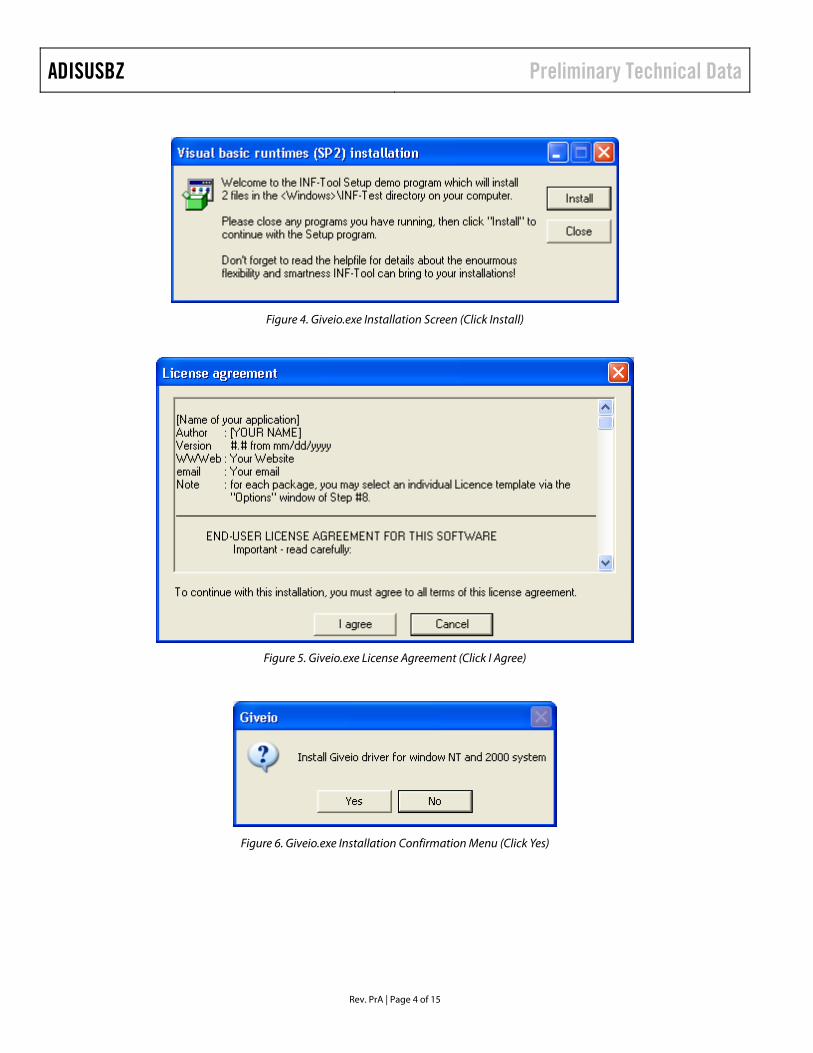
The giveio.exe driver is located in the software’s new directory, which is normally under a subdirectory called “Analog Devices iSensor®,” located in the Program Files folder. Double-click on the file, giveio.exe, and follow the prompts to install this driver. Refer to Figure 4, Figure 5, and Figure 6 for windows that will appear during this Step.
Step #4 - Install USB driver
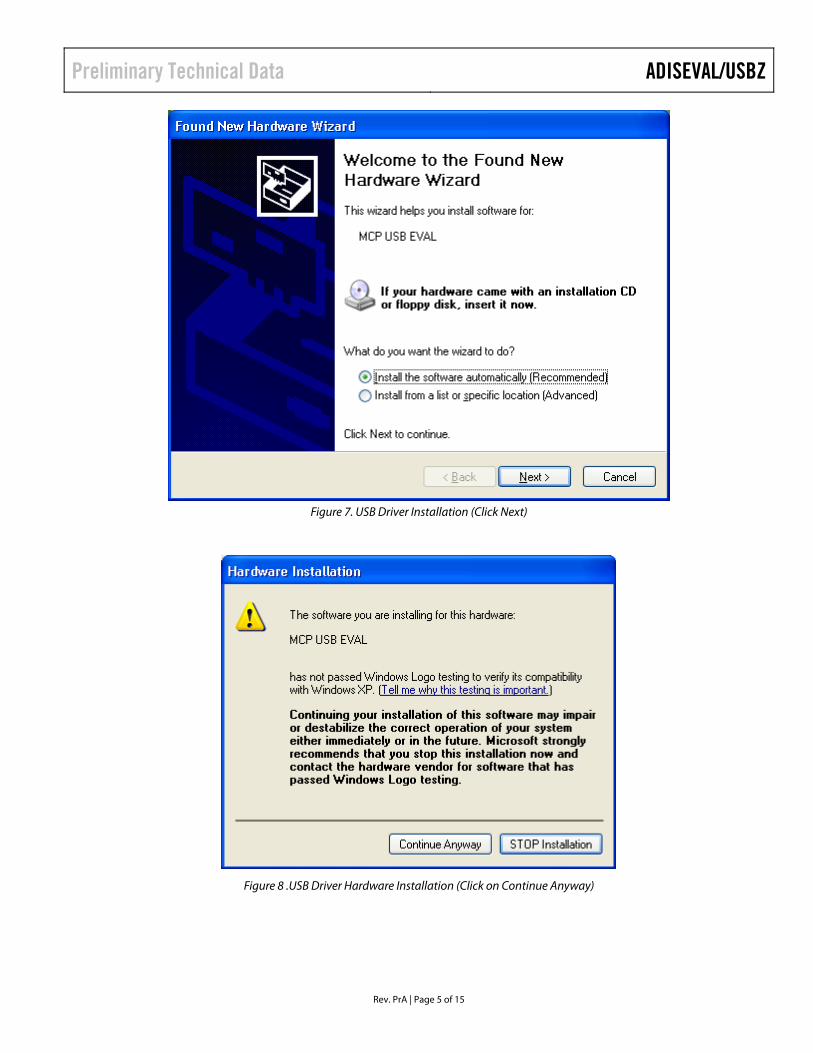
Connect the A-to-B USB cable to the PC, and then to the ADISUSBZ PCB. The USB driver installation screen will automatically appear on the screen in a few seconds. Follow the prompts to install this driver. On some machines, the driver installation screen will appear again, after clicking on “Finish.” In this case, follow the prompts and complete the process. Refer to Figure 7 and Figure 8 for the windows that will appear during this step. Once complete, disconnect the cable from the ADISUSBZ.
Step #5 - Connect ADIS16xxx/PCB to USB Interface PCB
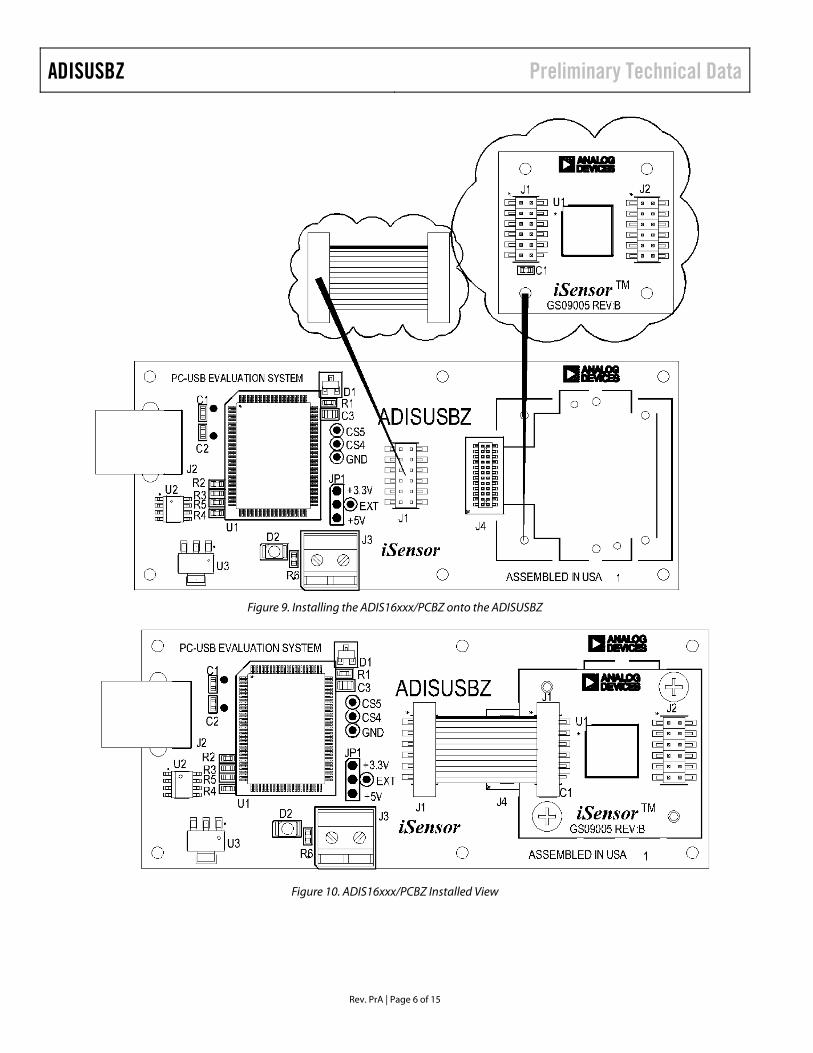
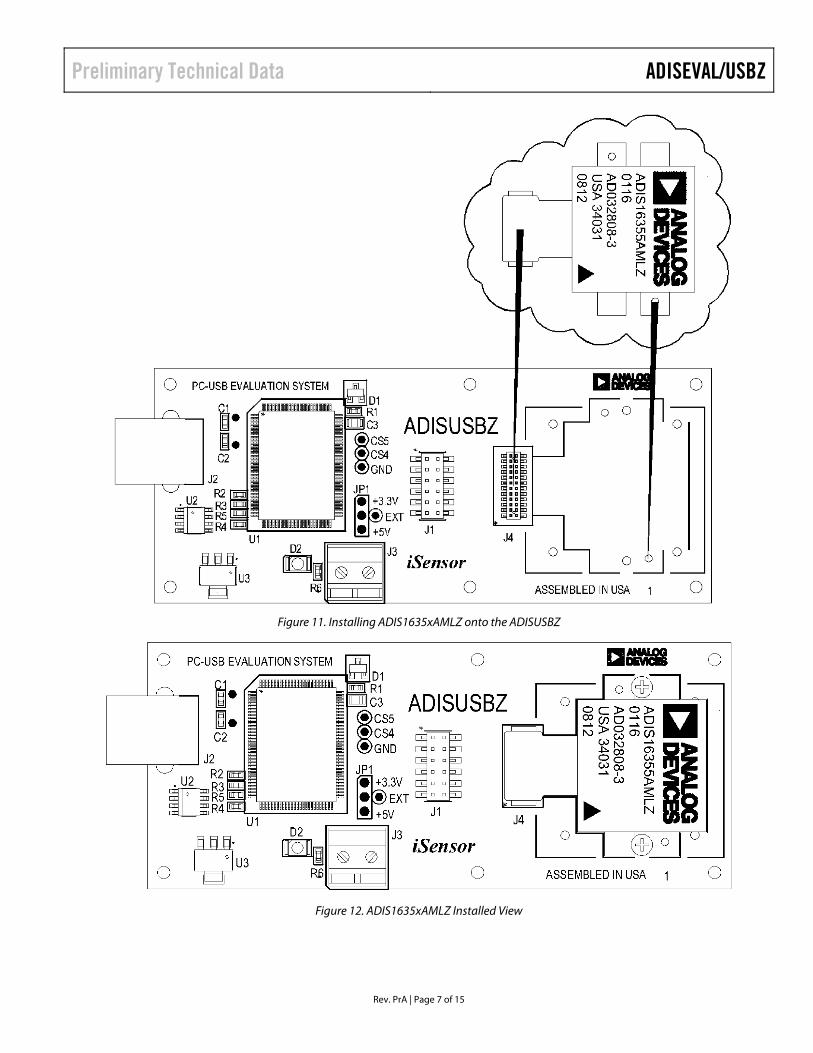
Use the provided 2mm machine screws to secure the product under test. Refer to Figure 9 through Figure 12 for alignment assistance. The ADIS16xxx/PVBZ parts also require the 12-pin ribbon cable installation displayed in these figures.
Table 2. JP1 Power Supply Settings
+3.3V +5V
ADIS16003/PCBZADIS16006/PCBZADIS16201/PCBZADIS16203/PCBZADIS16204/PCBZADIS16209/PCBZ
ADIS16003/PCBZ ADIS16006/PCBZ ADIS16080/PCBZ ADIS16100/PCB
ADIS16250/PCBZ ADIS16251/PCBZ
ADIS16255/PCBZADIS16300AMLZADIS16350AMLZADIS16354AMLZADIS16355AMLZADIS16365AMLZ
Note: If a product is listed twice, it can be run at +3.3 or +5V.
Step #6 - Launch evaluation software
Hook the ADISUSBZ to the USB cable and then launch the evaluation software by double clicking on its *.exe file. The program will also be in the Start Programs menu in Windows. Figure 15 though Figure 21 offers some basic insights into the operation of each product’s evaluation software. Note to European users: some software is sensitive to the decimal notation. If large or unreasonable numbers are observed, change the PC’s regional setting to USA. Software packages are being updated to fix this, but were not complete at the time of this document’s release.
ORDERING GUIDE
Model Package Description
ADISUSBZ iSensor™ PC-USB Evaluation System
ADISUSBZ Preliminary Technical Data
Rev. PrA | Page 2 of 15
Figure 1. Installation Welcome Screen (Click OK)
Figure 2. Installation Launch Screen (click on computer button)
Preliminary Technical Data ADISEVAL/USBZ
Rev. PrA | Page 3 of 15
Figure 3. Program Group Menu (Click Continue)
ADISUSBZ Preliminary Technical Data
Rev. PrA | Page 4 of 15
Figure 4. Giveio.exe Installation Screen (Click Install)
Figure 5. Giveio.exe License Agreement (Click I Agree)
Figure 6. Giveio.exe Installation Confirmation Menu (Click Yes)
Preliminary Technical Data ADISEVAL/USBZ
Rev. PrA | Page 5 of 15
Figure 7. USB Driver Installation (Click Next)
Figure 8 .USB Driver Hardware Installation (Click on Continue Anyway)
ADISUSBZ Preliminary Technical Data
Rev. PrA | Page 6 of 15
Figure 9. Installing the ADIS16xxx/PCBZ onto the ADISUSBZ
Figure 10. ADIS16xxx/PCBZ Installed View
Preliminary Technical Data ADISEVAL/USBZ
Rev. PrA | Page 7 of 15
Figure 11. Installing ADIS1635xAMLZ onto the ADISUSBZ
Figure 12. ADIS1635xAMLZ Installed View
ADISUSBZ Preliminary Technical Data
Rev. PrA | Page 8 of 15
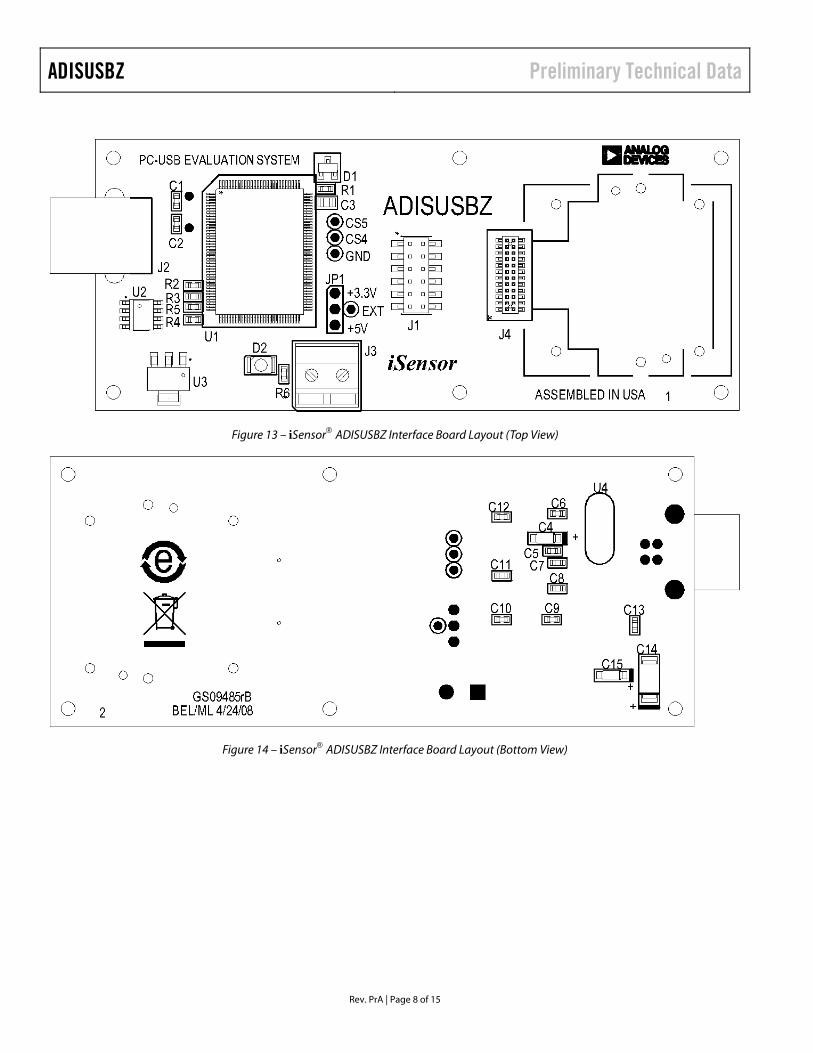
Figure 13 – iSensor® ADISUSBZ Interface Board Layout (Top View)
Figure 14 – iSensor® ADISUSBZ Interface Board Layout (Bottom View)
Preliminary Technical Data ADISEVAL/USBZ
Rev. PrA | Page 9 of 15
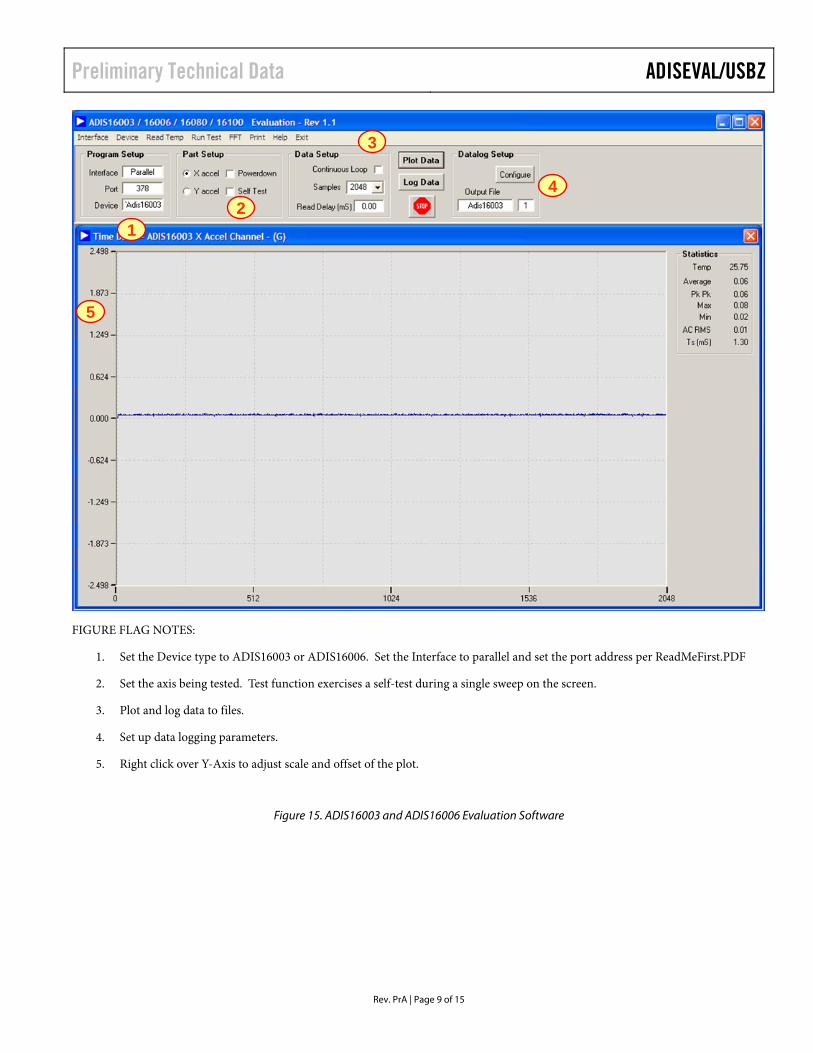
12
3
4
5
FIGURE FLAG NOTES:
1. Set the Device type to ADIS16003 or ADIS16006. Set the Interface to parallel and set the port address per ReadMeFirst.PDF
2. Set the axis being tested. Test function exercises a self-test during a single sweep on the screen.
3. Plot and log data to files.
4. Set up data logging parameters.
5. Right click over Y-Axis to adjust scale and offset of the plot.
Figure 15. ADIS16003 and ADIS16006 Evaluation Software
ADISUSBZ Preliminary Technical Data
Rev. PrA | Page 10 of 15
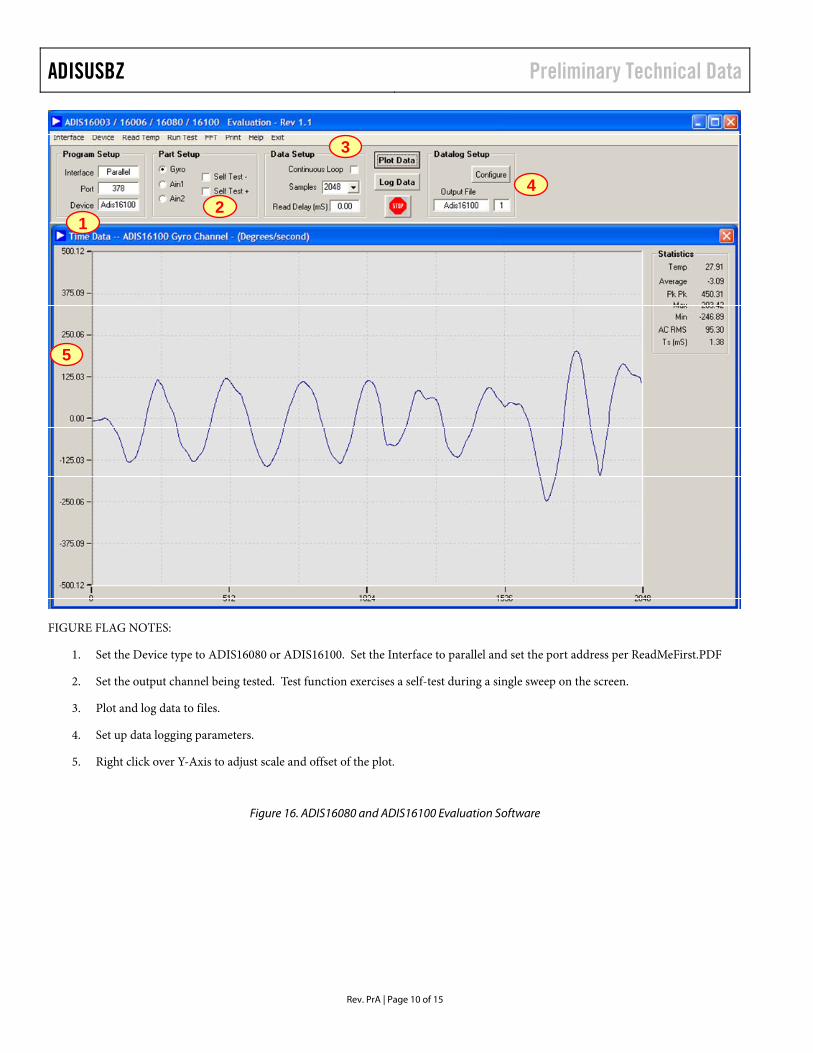
12
3
5
4
FIGURE FLAG NOTES:
1. Set the Device type to ADIS16080 or ADIS16100. Set the Interface to parallel and set the port address per ReadMeFirst.PDF
2. Set the output channel being tested. Test function exercises a self-test during a single sweep on the screen.
3. Plot and log data to files.
4. Set up data logging parameters.
5. Right click over Y-Axis to adjust scale and offset of the plot.
Figure 16. ADIS16080 and ADIS16100 Evaluation Software
Preliminary Technical Data ADISEVAL/USBZ
Rev. PrA | Page 11 of 15
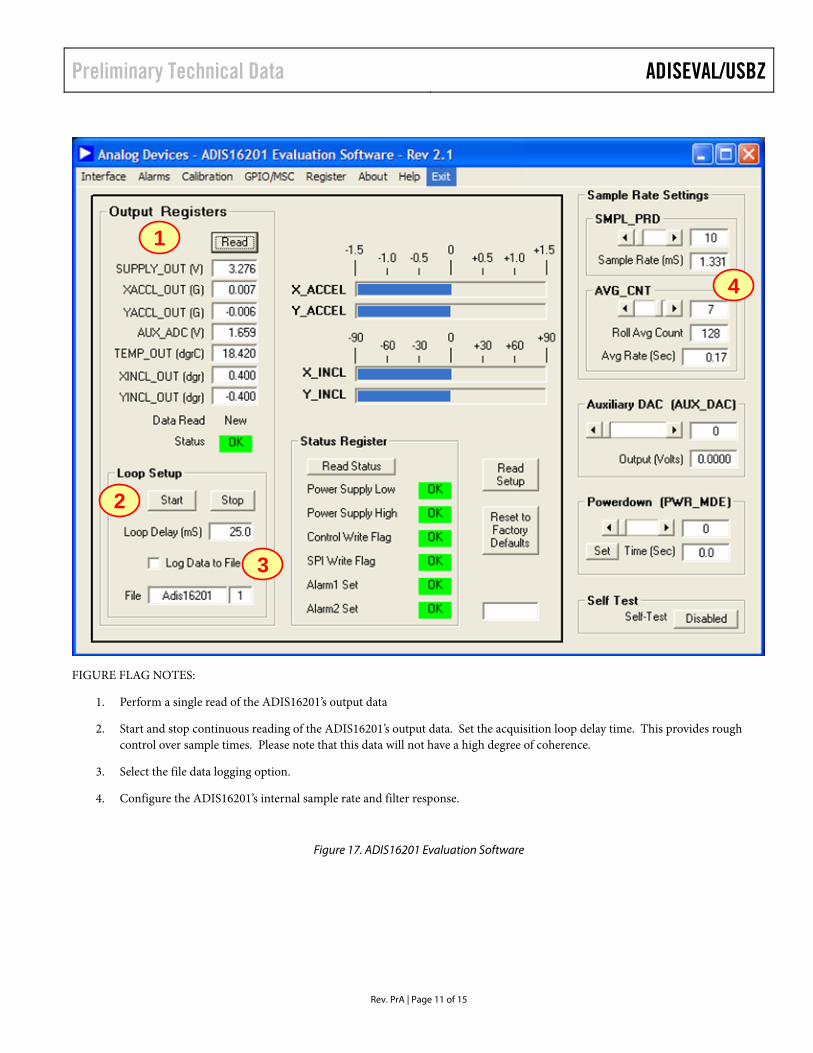
1
2
3
4
FIGURE FLAG NOTES:
1. Perform a single read of the ADIS16201’s output data
2. Start and stop continuous reading of the ADIS16201’s output data. Set the acquisition loop delay time. This provides rough control over sample times. Please note that this data will not have a high degree of coherence.
3. Select the file data logging option.
4. Configure the ADIS16201’s internal sample rate and filter response.
Figure 17. ADIS16201 Evaluation Software
ADISUSBZ Preliminary Technical Data
Rev. PrA | Page 12 of 15
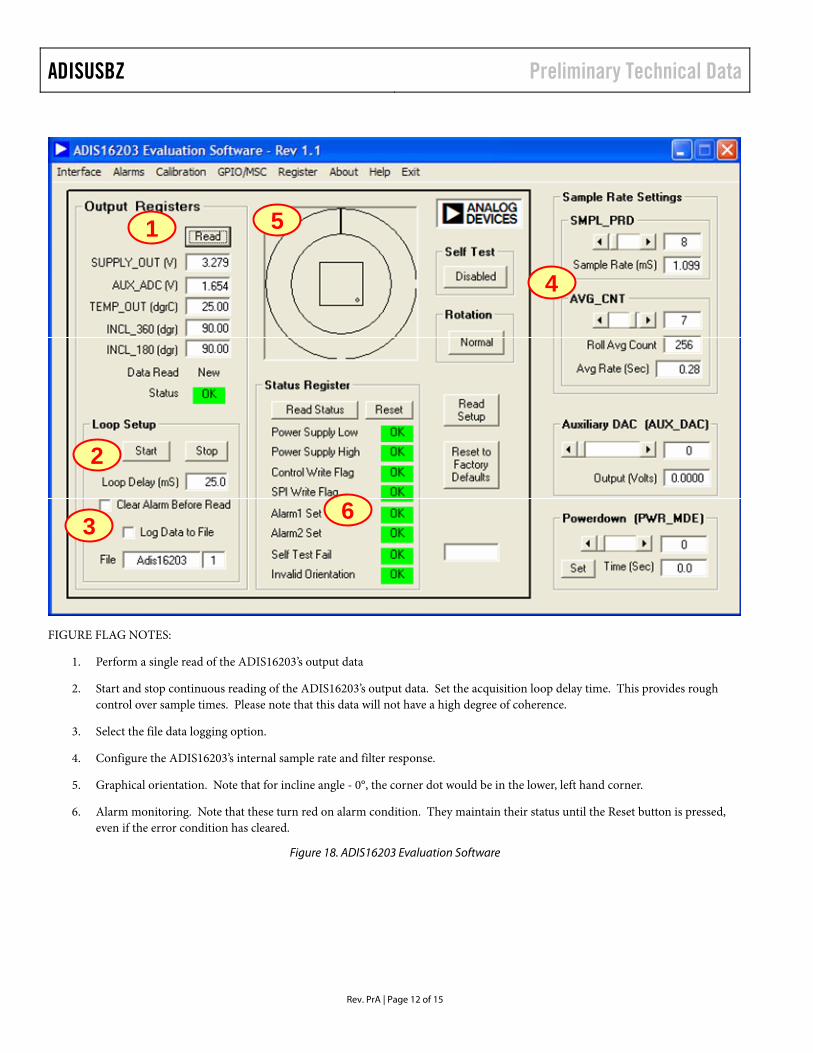
1
2
3
4
5
6
FIGURE FLAG NOTES:
1. Perform a single read of the ADIS16203’s output data
2. Start and stop continuous reading of the ADIS16203’s output data. Set the acquisition loop delay time. This provides rough control over sample times. Please note that this data will not have a high degree of coherence.
3. Select the file data logging option.
4. Configure the ADIS16203’s internal sample rate and filter response.
5. Graphical orientation. Note that for incline angle - 0°, the corner dot would be in the lower, left hand corner.
6. Alarm monitoring. Note that these turn red on alarm condition. They maintain their status until the Reset button is pressed, even if the error condition has cleared.
Figure 18. ADIS16203 Evaluation Software

Preliminary Technical Data ADISEVAL/USBZ
Rev. PrA | Page 13 of 15
1
2
4
5
3
6
FIGURE FLAG NOTES:
1. Perform a single read of the ADIS16209’s output data
2. XINCL_OUT and YINCL_OUT are horizontal incline outputs. ROTATION is the vertical-oriented rotational position measurement. This requires the X and Y axes to be in the vertical plane, with respect to the earth’s surface.
3. This graph displays the vertical oriented, rotational position. This requires the X and Y axes to be in the vertical plane, with respect to the earth’s surface.
4. Start and stop continuous reading of the ADIS16209’s output data. The acquisition loop time provides rough control over sample times. Please note that this data will not have a high degree of coherence.
5. The acquisition loop time provides rough control over sample times. Please note that this data will not have a high degree of coherence.
6. Configure the ADIS16209’s internal sample rate and filter response.
Figure 19. ADIS16209 Evaluation Software
ADISUSBZ Preliminary Technical Data
Rev. PrA | Page 14 of 15
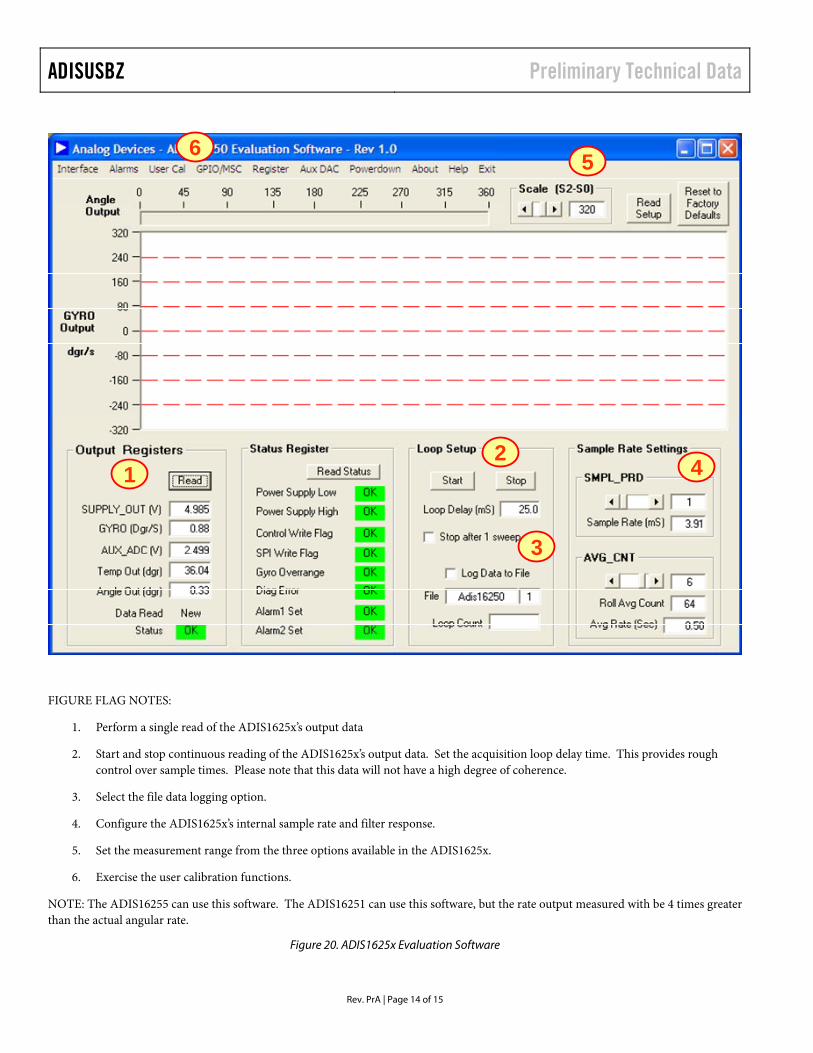
12
3
4
56
FIGURE FLAG NOTES:
1. Perform a single read of the ADIS1625x’s output data
2. Start and stop continuous reading of the ADIS1625x’s output data. Set the acquisition loop delay time. This provides rough control over sample times. Please note that this data will not have a high degree of coherence.
3. Select the file data logging option.
4. Configure the ADIS1625x’s internal sample rate and filter response.
5. Set the measurement range from the three options available in the ADIS1625x.
6. Exercise the user calibration functions.
NOTE: The ADIS16255 can use this software. The ADIS16251 can use this software, but the rate output measured with be 4 times greater than the actual angular rate.
Figure 20. ADIS1625x Evaluation Software
Preliminary Technical Data ADISEVAL/USBZ
Rev. PrA | Page 15 of 15 EB07693-0-7/08(PrA)
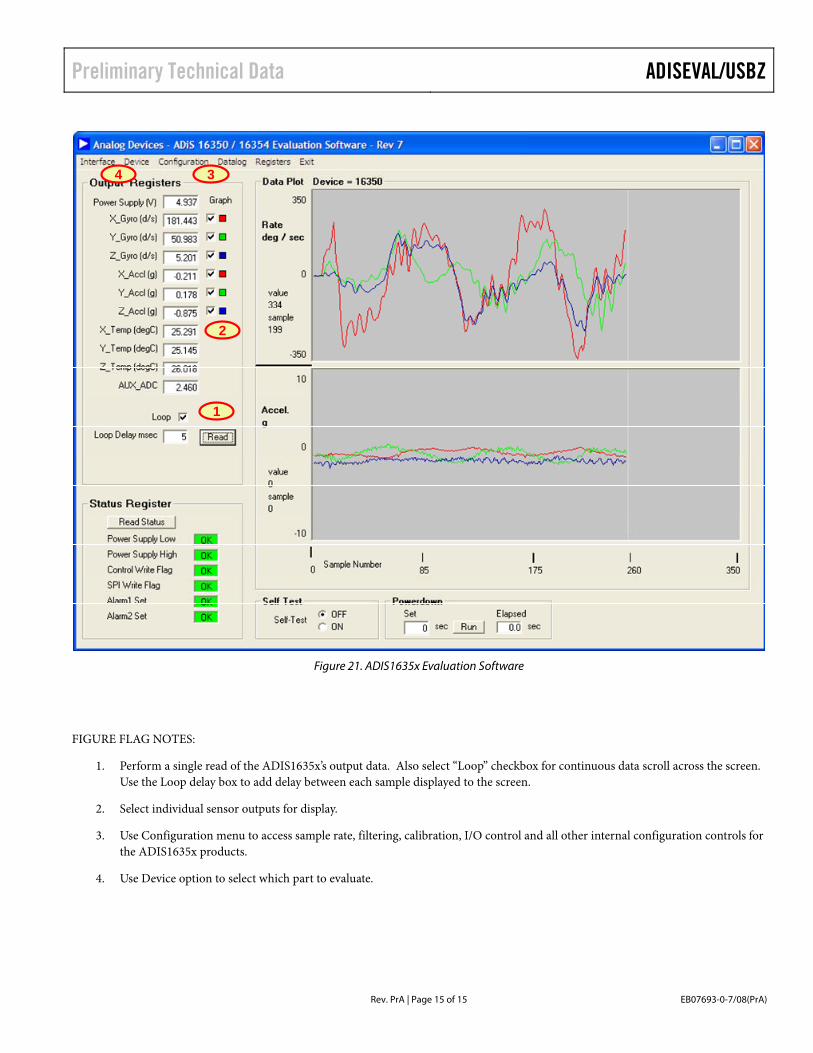
4 3
2
1
Figure 21. ADIS1635x Evaluation Software
FIGURE FLAG NOTES:
1. Perform a single read of the ADIS1635x’s output data. Also select “Loop” checkbox for continuous data scroll across the screen. Use the Loop delay box to add delay between each sample displayed to the screen.
2. Select individual sensor outputs for display.
3. Use Configuration menu to access sample rate, filtering, calibration, I/O control and all other internal configuration controls for the ADIS1635x products.
4. Use Device option to select which part to evaluate.