Ischemic Stroke Outcome 2012-13 Result Table - CA OSHPD · PDF fileHospital Risk-Adjusted...
31
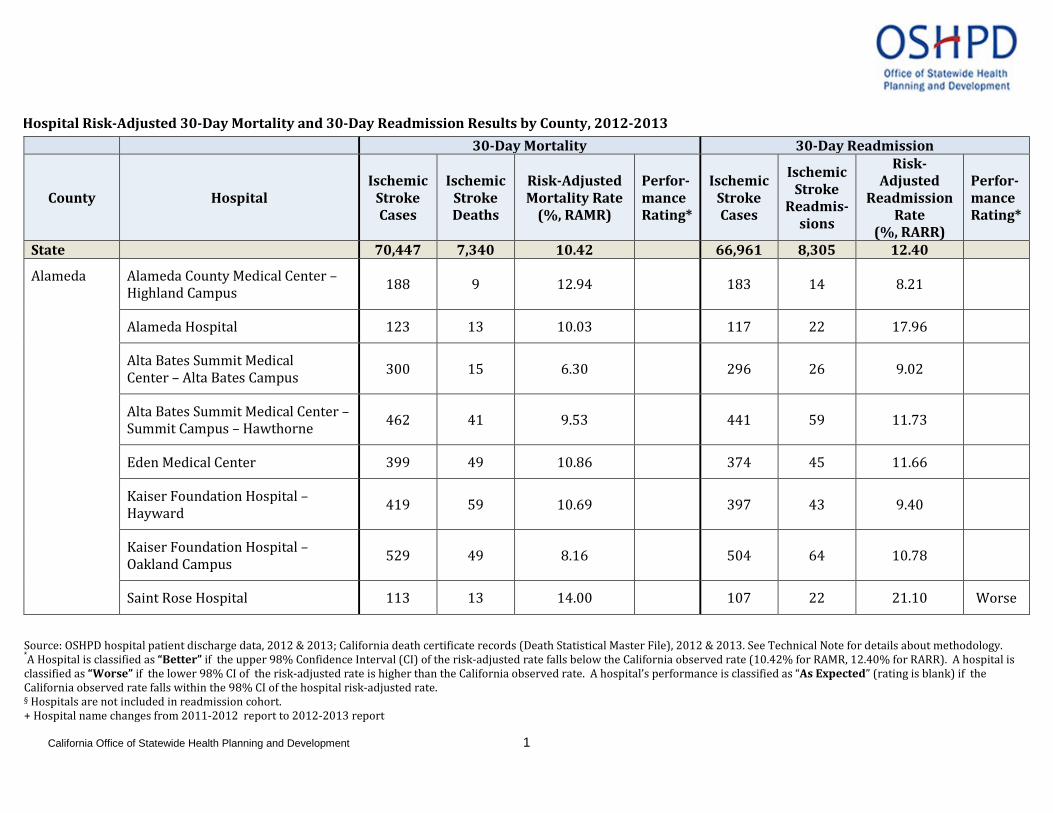
Hospital Risk-Adjusted 30-Day Mortality and 30-Day Readmission Results by County, 2012-2013 30-Day Mortality 30-Day Readmission County Hospital Ischemic Stroke Cases Ischemic Stroke Deaths Risk-Adjusted Mortality Rate (%, RAMR) Perfor- mance Rating* Ischemic Stroke Cases Ischemic Stroke Readmis- sions Risk- Adjusted Readmission Rate (%, RARR) Perfor- mance Rating* State 70,447 7,340 10.42 66,961 8,305 12.40 Alameda Alameda County Medical Center – Highland Campus 188 9 12.94 183 14 8.21 Alameda Hospital 123 13 10.03 117 22 17.96 Alta Bates Summit Medical Center – Alta Bates Campus 300 15 6.30 296 26 9.02 Alta Bates Summit Medical Center – Summit Campus – Hawthorne 462 41 9.53 441 59 11.73 Eden Medical Center 399 49 10.86 374 45 11.66 Kaiser Foundation Hospital – Hayward 419 59 10.69 397 43 9.40 Kaiser Foundation Hospital – Oakland Campus 529 49 8.16 504 64 10.78 Saint Rose Hospital 113 13 14.00 107 22 21.10 Worse Source: OSHPD hospital patient discharge data, 2012 & 2013; California death certificate records (Death Statistical Master File), 2012 & 2013. See Technical Note for details about methodology. * A Hospital is classified as “Better” if the upper 98% Confidence Interval (CI) of the risk-adjusted rate falls below the California observed rate (10.42% for RAMR, 12.40% for RARR). A hospital is classified as “Worse” if the lower 98% CI of the risk-adjusted rate is higher than the California observed rate. A hospital’s performance is classified as “As Expected” (rating is blank) if the California observed rate falls within the 98% CI of the hospital risk-adjusted rate. § Hospitals are not included in readmission cohort. + Hospital name changes from 2011-2012 report to 2012-2013 report California Office of Statewide Health Planning and Development 1
Transcript of Ischemic Stroke Outcome 2012-13 Result Table - CA OSHPD · PDF fileHospital Risk-Adjusted...
Hospital Risk-Adjusted 30-Day Mortality and 30-Day Readmission Results by County, 2012-2013 30-Day Mortality 30-Day Readmission
County Hospital Ischemic
Stroke Cases
Ischemic Stroke Deaths
Risk-Adjusted Mortality Rate
(%, RAMR)
Perfor- mance Rating*
Ischemic Stroke Cases
Ischemic Stroke
Readmis-sions
Risk-Adjusted
Readmission Rate
(%, RARR)
Perfor- mance Rating*
State 70,447 7,340 10.42 66,961 8,305 12.40
Alameda
Alameda County Medical Center –Highland Campus 188 9 12.94 183 14 8.21
Alameda Hospital 123 13 10.03 117 22 17.96
Alta Bates Summit Medical Center – Alta Bates Campus 300 15 6.30 296 26 9.02
Alta Bates Summit Medical Center – Summit Campus – Hawthorne 462 41 9.53 441 59 11.73
Eden Medical Center 399 49 10.86 374 45 11.66
Kaiser Foundation Hospital – Hayward 419 59 10.69 397 43 9.40
Kaiser Foundation Hospital – Oakland Campus 529 49 8.16 504 64 10.78
Saint Rose Hospital 113 13 14.00 107 22 21.10 Worse
Source: OSHPD hospital patient discharge data, 2012 & 2013; California death certificate records (Death Statistical Master File), 2012 & 2013. See Technical Note for details about methodology. *A Hospital is classified as “Better” if the upper 98% Confidence Interval (CI) of the risk-adjusted rate falls below the California observed rate (10.42% for RAMR, 12.40% for RARR). A hospital is classified as “Worse” if the lower 98% CI of the risk-adjusted rate is higher than the California observed rate. A hospital’s performance is classified as “As Expected” (rating is blank) if the California observed rate falls within the 98% CI of the hospital risk-adjusted rate. § Hospitals are not included in readmission cohort. + Hospital name changes from 2011-2012 report to 2012-2013 report
California Office of Statewide Health Planning and Development 1

Hospital Risk-Adjusted 30-Day Mortality and 30-Day Readmission Results by County, 2012-2013
30-Day Mortality 30-Day Readmission
County Hospital Ischemic
Stroke Cases
Ischemic Stroke Deaths
Risk-Adjusted Mortality Rate
(%, RAMR)
Perfor- mance Rating*
Ischemic Stroke Cases
Ischemic Stroke
Readmis-sions
Risk-Adjusted
Readmission Rate
(%, RARR)
Perfor- mance Rating*
State 70,447 7,340 10.42 66,961 8,305 12.40
Alameda (continued)
San Leandro Hospital 68 9 12.69 65 4 5.36
Valleycare Medical Center 112 7 9.02 111 10 10.57
Washington Hospital – Fremont 347 35 8.74 330 44 13.00
Amador Sutter Amador Hospital 111 13 11.50 107 8 7.83
Butte Enloe Medical Center – Esplanade Campus 464 52 9.48 438 43 11.20
Feather River Hospital 136 10 7.63 135 15 12.08
Oroville Hospital 172 8 6.25 166 26 16.88
Calaveras Mark Twain Medical Center+ 46 7 15.10 41 9 24.68
Contra Costa
Contra Costa Regional Medical Center 113 6 14.21 109 17 17.38
Source: OSHPD hospital patient discharge data, 2012 & 2013; California death certificate records (Death Statistical Master File), 2012 & 2013. See Technical Note for details about methodology. *A Hospital is classified as “Better” if the upper 98% Confidence Interval (CI) of the risk-adjusted rate falls below the California observed rate (10.42% for RAMR, 12.40% for RARR). A hospital is classified as “Worse” if the lower 98% CI of the risk-adjusted rate is higher than the California observed rate. A hospital’s performance is classified as “As Expected” (rating is blank) if the California observed rate falls within the 98% CI of the hospital risk-adjusted rate. § Hospitals are not included in readmission cohort. + Hospital name changes from 2011-2012 report to 2012-2013 report
California Office of Statewide Health Planning and Development 2

Hospital Risk-Adjusted 30-Day Mortality and 30-Day Readmission Results by County, 2012-2013
30-Day Mortality 30-Day Readmission
County Hospital Ischemic
Stroke Cases
Ischemic Stroke Deaths
Risk-Adjusted Mortality Rate
(%, RAMR)
Perfor- mance Rating*
Ischemic Stroke Cases
Ischemic Stroke
Readmis-sions
Risk-Adjusted
Readmission Rate
(%, RARR)
Perfor- mance Rating*
State 70,447 7,340 10.42 66,961 8,305 12.40
Contra Costa (continued)
Doctors Medical Center – San Pablo 249 20 8.25 238 33 12.39
John Muir Medical Center – Concord Campus 307 30 8.83 293 42 13.14
John Muir Medical Center – Walnut Creek Campus 444 64 9.18 408 42 10.51
Kaiser Foundation Hospital – Antioch 270 27 7.62 257 35 11.69
Kaiser Foundation Hospital – Walnut Creek 346 46 9.39 326 42 11.38
San Ramon Regional Medical Center 144 17 9.62 132 16 12.40
Sutter Delta Medical Center 167 10 6.48 163 25 13.99
Del Norte Sutter Coast Hospital 111 11 9.55 104 12 13.49
Source: OSHPD hospital patient discharge data, 2012 & 2013; California death certificate records (Death Statistical Master File), 2012 & 2013. See Technical Note for details about methodology. *A Hospital is classified as “Better” if the upper 98% Confidence Interval (CI) of the risk-adjusted rate falls below the California observed rate (10.42% for RAMR, 12.40% for RARR). A hospital is classified as “Worse” if the lower 98% CI of the risk-adjusted rate is higher than the California observed rate. A hospital’s performance is classified as “As Expected” (rating is blank) if the California observed rate falls within the 98% CI of the hospital risk-adjusted rate. § Hospitals are not included in readmission cohort. + Hospital name changes from 2011-2012 report to 2012-2013 report
California Office of Statewide Health Planning and Development 3

Hospital Risk-Adjusted 30-Day Mortality and 30-Day Readmission Results by County, 2012-2013
30-Day Mortality 30-Day Readmission
County Hospital Ischemic
Stroke Cases
Ischemic Stroke Deaths
Risk-Adjusted Mortality Rate
(%, RAMR)
Perfor- mance Rating*
Ischemic Stroke Cases
Ischemic Stroke
Readmis-sions
Risk-Adjusted
Readmission Rate
(%, RARR)
Perfor- mance Rating*
State 70,447 7,340 10.42 66,961 8,305 12.40
El Dorado Barton Memorial Hospital§ 31 2 8.39
Marshall Medical Center 177 26 9.84 163 16 10.07
Fresno
Clovis Community Medical Center 218 23 12.19 213 22 10.93
Community Regional Medical Center – Fresno 728 70 13.92 Worse 690 94 13.48
Kaiser Foundation Hospital – Fresno 316 38 11.64 301 34 10.34
Saint Agnes Medical Center 714 89 12.05 682 86 12.48
Humboldt
Mad River Community Hospital 48 10 18.24 46 4 10.58
Redwood Memorial Hospital 34 8 17.64 31 5 18.53
Saint Joseph Hospital – Eureka 185 17 8.70 174 16 9.12
Imperial El Centro Regional Medical Center 218 14 8.04 207 33 14.75
Source: OSHPD hospital patient discharge data, 2012 & 2013; California death certificate records (Death Statistical Master File), 2012 & 2013. See Technical Note for details about methodology. *A Hospital is classified as “Better” if the upper 98% Confidence Interval (CI) of the risk-adjusted rate falls below the California observed rate (10.42% for RAMR, 12.40% for RARR). A hospital is classified as “Worse” if the lower 98% CI of the risk-adjusted rate is higher than the California observed rate. A hospital’s performance is classified as “As Expected” (rating is blank) if the California observed rate falls within the 98% CI of the hospital risk-adjusted rate. § Hospitals are not included in readmission cohort. + Hospital name changes from 2011-2012 report to 2012-2013 report
California Office of Statewide Health Planning and Development 4

Hospital Risk-Adjusted 30-Day Mortality and 30-Day Readmission Results by County, 2012-2013
30-Day Mortality 30-Day Readmission
County Hospital Ischemic
Stroke Cases
Ischemic Stroke Deaths
Risk-Adjusted Mortality Rate
(%, RAMR)
Perfor- mance Rating*
Ischemic Stroke Cases
Ischemic Stroke
Readmis-sions
Risk-Adjusted
Readmission Rate
(%, RARR)
Perfor- mance Rating*
State 70,447 7,340 10.42 66,961 8,305 12.40
Imperial (continued)
Pioneers Memorial Healthcare District 133 8 8.26 126 14 12.08
Kern
Bakersfield Heart Hospital 80 3 4.14 79 5 6.76
Bakersfield Memorial Hospital 326 36 14.13 310 43 13.61
Kern Medical Center 40 0 0.00 40 3 8.76
Mercy Hospital – Bakersfield 208 26 12.23 195 28 15.48
Ridgecrest Regional Hospital§ 30 5 15.01
San Joaquin Community Hospital 694 70 12.78 669 89 14.00
Kings Adventist Medical Center 211 23 12.42 199 22 11.21
Lake Sutter Lakeside Hospital 56 9 11.96 55 4 7.43
Los Angeles Alhambra Hospital 101 8 7.53 97 9 8.23
Source: OSHPD hospital patient discharge data, 2012 & 2013; California death certificate records (Death Statistical Master File), 2012 & 2013. See Technical Note for details about methodology. *A Hospital is classified as “Better” if the upper 98% Confidence Interval (CI) of the risk-adjusted rate falls below the California observed rate (10.42% for RAMR, 12.40% for RARR). A hospital is classified as “Worse” if the lower 98% CI of the risk-adjusted rate is higher than the California observed rate. A hospital’s performance is classified as “As Expected” (rating is blank) if the California observed rate falls within the 98% CI of the hospital risk-adjusted rate. § Hospitals are not included in readmission cohort. + Hospital name changes from 2011-2012 report to 2012-2013 report
California Office of Statewide Health Planning and Development 5

Hospital Risk-Adjusted 30-Day Mortality and 30-Day Readmission Results by County, 2012-2013
30-Day Mortality 30-Day Readmission
County Hospital Ischemic
Stroke Cases
Ischemic Stroke Deaths
Risk-Adjusted Mortality Rate
(%, RAMR)
Perfor- mance Rating*
Ischemic Stroke Cases
Ischemic Stroke
Readmis-sions
Risk-Adjusted
Readmission Rate
(%, RARR)
Perfor- mance Rating*
State 70,447 7,340 10.42 66,961 8,305 12.40
Los Angeles (continued)
Antelope Valley Hospital 460 47 12.61 434 57 13.30
Beverly Hospital 161 19 11.52 148 27 15.60
California Hospital Medical Center – Los Angeles 252 13 9.58 243 35 13.87
Cedars Sinai Medical Center 759 56 6.51 Better 727 122 16.28 Worse
Centinela Hospital Medical Center 414 15 6.65 406 85 16.65 Worse
Citrus Valley Medical Center – Inter-Community Campus 158 7 5.40 157 23 14.59
Citrus Valley Medical Center – Queen of the Valley Campus 305 25 9.46 296 43 15.04
Community and Mission Hospital of Huntington Park – Slauson 38 1 5.34 38 6 15.22
Source: OSHPD hospital patient discharge data, 2012 & 2013; California death certificate records (Death Statistical Master File), 2012 & 2013. See Technical Note for details about methodology. *A Hospital is classified as “Better” if the upper 98% Confidence Interval (CI) of the risk-adjusted rate falls below the California observed rate (10.42% for RAMR, 12.40% for RARR). A hospital is classified as “Worse” if the lower 98% CI of the risk-adjusted rate is higher than the California observed rate. A hospital’s performance is classified as “As Expected” (rating is blank) if the California observed rate falls within the 98% CI of the hospital risk-adjusted rate. § Hospitals are not included in readmission cohort. + Hospital name changes from 2011-2012 report to 2012-2013 report
California Office of Statewide Health Planning and Development 6

Hospital Risk-Adjusted 30-Day Mortality and 30-Day Readmission Results by County, 2012-2013 30-Day Mortality 30-Day Readmission
County Hospital Ischemic
Stroke Cases
Ischemic Stroke Deaths
Risk-Adjusted Mortality Rate
(%, RAMR)
Perfor- mance Rating*
Ischemic Stroke Cases
Ischemic Stroke
Readmis-sions
Risk-Adjusted
Readmission Rate
(%, RARR)
Perfor- mance Rating*
State 70,447 7,340 10.42 66,961 8,305 12.40
Los Angeles (continued)
Community Hospital of Long Beach 50 4 7.21 49 3 5.67
Downey Regional Medical Center 252 25 10.47 241 35 13.62
Encino Hospital Medical Center 43 3 3.95 41 8 14.81
Foothill Presbyterian Hospital – Johnston Memorial 110 9 9.16 106 14 14.91
Garfield Medical Center 330 21 5.76 Better 319 51 14.25
Glendale Adventist Medical Center – Wilson Terrace ǂ 383 38 8.79 367 53 13.53
Glendale Memorial Hospital and Medical Center 155 11 8.53 149 23 15.83
Good Samaritan Hospital – Los Angeles 188 11 5.89 182 28 14.25
Source: OSHPD hospital patient discharge data, 2012 & 2013; California death certificate records (Death Statistical Master File), 2012 & 2013. See Technical Note for details about methodology. *A Hospital is classified as “Better” if the upper 98% Confidence Interval (CI) of the risk-adjusted rate falls below the California observed rate (10.42% for RAMR, 12.40% for RARR). A hospital isclassified as “Worse” if the lower 98% CI of the risk-adjusted rate is higher than the California observed rate. A hospital’s performance is classified as “As Expected” (rating is blank) if theCalifornia observed rate falls within the 98% CI of the hospital risk-adjusted rate.§ Hospitals are not included in readmission cohort.
California Office of Statewide Health Planning and Development 7
+ Hospital name changes from 2011-2012 report to 2012-2013 report.ǂ Hospitals submitted statements regarding this report. Click here for their statements.

Hospital Risk-Adjusted 30-Day Mortality and 30-Day Readmission Results by County, 2012-2013
30-Day Mortality 30-Day Readmission
County Hospital Ischemic
Stroke Cases
Ischemic Stroke Deaths
Risk-Adjusted Mortality Rate
(%, RAMR)
Perfor- mance Rating*
Ischemic Stroke Cases
Ischemic Stroke
Readmis-sions
Risk-Adjusted
Readmission Rate
(%, RARR)
Perfor- mance Rating*
State 70,447 7,340 10.42 66,961 8,305 12.40
Los Angeles (continued)
Greater El Monte Community Hospital 42 2 5.97 42 11 23.72
Henry Mayo Newhall Memorial Hospital 274 23 7.33 260 40 15.23
Hollywood Presbyterian Medical Center 272 30 9.62 253 56 20.13 Worse
Huntington Memorial Hospital 513 53 9.80 499 59 11.81
Kaiser Foundation Hospital – Baldwin Park 403 41 14.27 393 49 11.66
Kaiser Foundation Hospital – Downey 342 24 10.43 329 45 12.61
Kaiser Foundation Hospital – Panorama City 250 34 18.28 Worse 238 34 14.67
Kaiser Foundation Hospital – South Bay 267 30 12.29 250 42 13.98
Source: OSHPD hospital patient discharge data, 2012 & 2013; California death certificate records (Death Statistical Master File), 2012 & 2013. See Technical Note for details about methodology. *A Hospital is classified as “Better” if the upper 98% Confidence Interval (CI) of the risk-adjusted rate falls below the California observed rate (10.42% for RAMR, 12.40% for RARR). A hospital is classified as “Worse” if the lower 98% CI of the risk-adjusted rate is higher than the California observed rate. A hospital’s performance is classified as “As Expected” (rating is blank) if the California observed rate falls within the 98% CI of the hospital risk-adjusted rate. § Hospitals are not included in readmission cohort. + Hospital name changes from 2011-2012 report to 2012-2013 report
California Office of Statewide Health Planning and Development 8
Hospital Risk-Adjusted 30-Day Mortality and 30-Day Readmission Results by County, 2012-2013
30-Day Mortality 30-Day Readmission
County Hospital Ischemic
Stroke Cases
Ischemic Stroke Deaths
Risk-Adjusted Mortality Rate
(%, RAMR)
Perfor- mance Rating*
Ischemic Stroke Cases
Ischemic Stroke
Readmis-sions
Risk-Adjusted
Readmission Rate
(%, RARR)
Perfor- mance Rating*
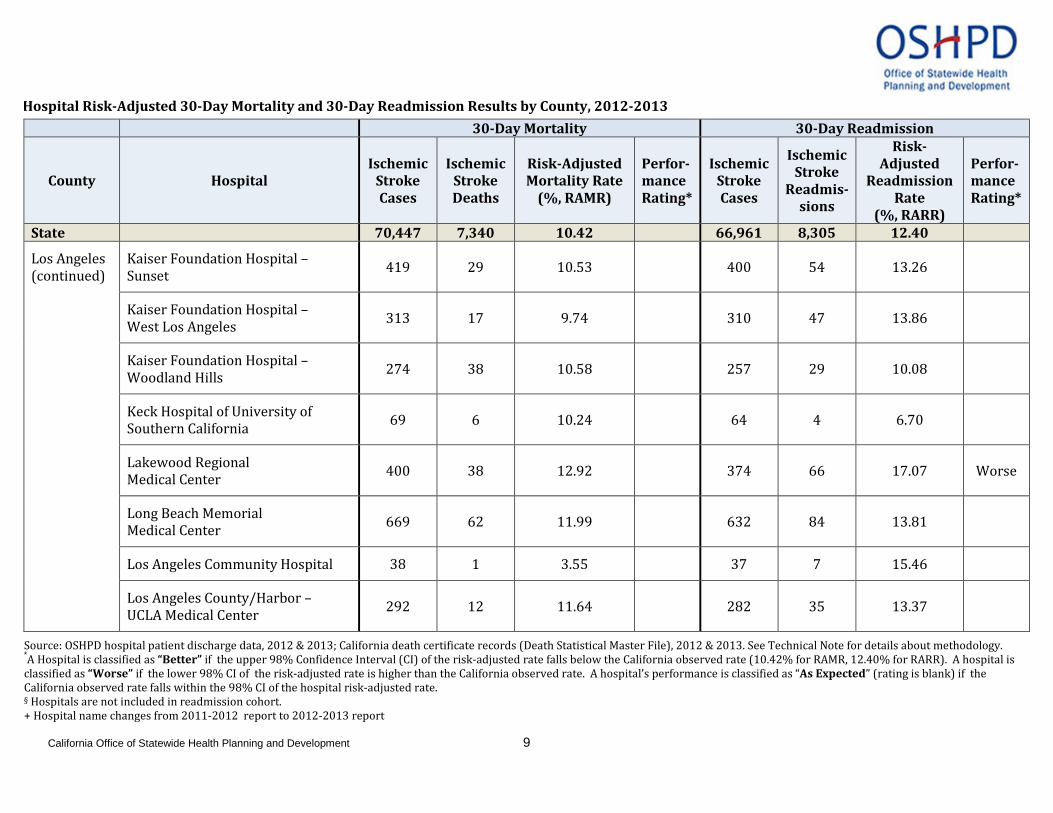
State 70,447 7,340 10.42 66,961 8,305 12.40
Los Angeles (continued)
Kaiser Foundation Hospital – Sunset 419 29 10.53 400 54 13.26
Kaiser Foundation Hospital – West Los Angeles 313 17 9.74 310 47 13.86
Kaiser Foundation Hospital – Woodland Hills 274 38 10.58 257 29 10.08
Keck Hospital of University of Southern California 69 6 10.24 64 4 6.70
Lakewood Regional Medical Center 400 38 12.92 374 66 17.07 Worse
Long Beach Memorial Medical Center 669 62 11.99 632 84 13.81
Los Angeles Community Hospital 38 1 3.55 37 7 15.46
Los Angeles County/Harbor – UCLA Medical Center 292 12 11.64 282 35 13.37
Source: OSHPD hospital patient discharge data, 2012 & 2013; California death certificate records (Death Statistical Master File), 2012 & 2013. See Technical Note for details about methodology. *A Hospital is classified as “Better” if the upper 98% Confidence Interval (CI) of the risk-adjusted rate falls below the California observed rate (10.42% for RAMR, 12.40% for RARR). A hospital is classified as “Worse” if the lower 98% CI of the risk-adjusted rate is higher than the California observed rate. A hospital’s performance is classified as “As Expected” (rating is blank) if the California observed rate falls within the 98% CI of the hospital risk-adjusted rate. § Hospitals are not included in readmission cohort. + Hospital name changes from 2011-2012 report to 2012-2013 report
California Office of Statewide Health Planning and Development 9

Hospital Risk-Adjusted 30-Day Mortality and 30-Day Readmission Results by County, 2012-2013
30-Day Mortality 30-Day Readmission
County Hospital Ischemic
Stroke Cases
Ischemic Stroke Deaths
Risk-Adjusted Mortality Rate
(%, RAMR)
Perfor- mance Rating*
Ischemic Stroke Cases
Ischemic Stroke
Readmis-sions
Risk-Adjusted
Readmission Rate
(%, RARR)
Perfor- mance Rating*
State 70,447 7,340 10.42 66,961 8,305 12.40
Los Angeles (continued)
Los Angeles County/Olive View – UCLA Medical Center 160 3 8.19 157 15 11.17
Los Angeles County/University of Southern California Medical Center 242 28 27.65 Worse 217 26 13.45
Marina Del Rey Hospital 83 6 8.16 82 9 11.31
Memorial Hospital of Gardena 90 3 5.73 87 14 15.28
Methodist Hospital of Southern California 567 78 11.73 545 78 13.55
Mission Community Hospital – Panorama Campus 44 1 2.50 43 6 11.16
Monterey Park Hospital 49 5 8.44 44 5 10.61
Northridge Hospital Medical Center 315 34 9.52 306 33 10.83
Olympia Medical Center 80 5 5.63 78 14 14.74
Source: OSHPD hospital patient discharge data, 2012 & 2013; California death certificate records (Death Statistical Master File), 2012 & 2013. See Technical Note for details about methodology. *A Hospital is classified as “Better” if the upper 98% Confidence Interval (CI) of the risk-adjusted rate falls below the California observed rate (10.42% for RAMR, 12.40% for RARR). A hospital is classified as “Worse” if the lower 98% CI of the risk-adjusted rate is higher than the California observed rate. A hospital’s performance is classified as “As Expected” (rating is blank) if the California observed rate falls within the 98% CI of the hospital risk-adjusted rate. § Hospitals are not included in readmission cohort. + Hospital name changes from 2011-2012 report to 2012-2013 report
California Office of Statewide Health Planning and Development 10

Hospital Risk-Adjusted 30-Day Mortality and 30-Day Readmission Results by County, 2012-2013
30-Day Mortality 30-Day Readmission
County Hospital Ischemic
Stroke Cases
Ischemic Stroke Deaths
Risk-Adjusted Mortality Rate
(%, RAMR)
Perfor- mance Rating*
Ischemic Stroke Cases
Ischemic Stroke
Readmis-sions
Risk-Adjusted
Readmission Rate
(%, RARR)
Perfor- mance Rating*
State 70,447 7,340 10.42 66,961 8,305 12.40
Los Angeles (continued)
Pacific Alliance Medical Center, Inc. 97 3 4.71 97 9 8.10
Pacific Hospital of Long Beach 35 2 5.28 35 6 12.42
Pacifica Hospital of the Valley§ 30 1 4.42
Palmdale Regional Medical Center 166 14 11.61 160 19 12.17
Pomona Valley Hospital Medical Center 578 61 11.13 552 61 11.63
Presbyterian Intercommunity Hospital 560 62 10.15 542 56 9.98
Providence Holy Cross Medical Center 387 32 8.12 376 52 12.73
Providence Little Company of Mary Medical Center – San Pedro 154 13 7.24 147 20 13.80
Providence Little Company of Mary Medical Center – Torrance 550 55 11.75 512 69 13.55
Source: OSHPD hospital patient discharge data, 2012 & 2013; California death certificate records (Death Statistical Master File), 2012 & 2013. See Technical Note for details about methodology. *A Hospital is classified as “Better” if the upper 98% Confidence Interval (CI) of the risk-adjusted rate falls below the California observed rate (10.42% for RAMR, 12.40% for RARR). A hospital is classified as “Worse” if the lower 98% CI of the risk-adjusted rate is higher than the California observed rate. A hospital’s performance is classified as “As Expected” (rating is blank) if the California observed rate falls within the 98% CI of the hospital risk-adjusted rate. § Hospitals are not included in readmission cohort. + Hospital name changes from 2011-2012 report to 2012-2013 report
California Office of Statewide Health Planning and Development 11

Hospital Risk-Adjusted 30-Day Mortality and 30-Day Readmission Results by County, 2012-2013
30-Day Mortality 30-Day Readmission
County Hospital Ischemic
Stroke Cases
Ischemic Stroke Deaths
Risk-Adjusted Mortality Rate
(%, RAMR)
Perfor- mance Rating*
Ischemic Stroke Cases
Ischemic Stroke
Readmis-sions
Risk-Adjusted
Readmission Rate
(%, RARR)
Perfor- mance Rating*
State 70,447 7,340 10.42 66,961 8,305 12.40
Los Angeles (continued)
Providence Saint Joseph Medical Center 538 71 10.79 507 69 13.68
Providence Tarzana Medical Center 260 23 7.31 248 35 13.71
Ronald Reagan UCLA Medical Center 457 59 8.46 417 63 14.87
Saint Francis Medical Center 208 8 5.39 200 31 13.56
Saint John’s Health Center 159 14 7.83 154 15 9.84
Saint Mary Medical Center 185 14 8.84 177 24 11.54
Saint Vincent Medical Center 146 6 5.58 142 19 13.19
San Dimas Community Hospital 68 8 13.81 67 12 18.75
San Gabriel Valley Medical Center 142 11 7.00 139 15 10.19
Source: OSHPD hospital patient discharge data, 2012 & 2013; California death certificate records (Death Statistical Master File), 2012 & 2013. See Technical Note for details about methodology. *A Hospital is classified as “Better” if the upper 98% Confidence Interval (CI) of the risk-adjusted rate falls below the California observed rate (10.42% for RAMR, 12.40% for RARR). A hospital is classified as “Worse” if the lower 98% CI of the risk-adjusted rate is higher than the California observed rate. A hospital’s performance is classified as “As Expected” (rating is blank) if the California observed rate falls within the 98% CI of the hospital risk-adjusted rate. § Hospitals are not included in readmission cohort. + Hospital name changes from 2011-2012 report to 2012-2013 report
California Office of Statewide Health Planning and Development 12
Hospital Risk-Adjusted 30-Day Mortality and 30-Day Readmission Results by County, 2012-2013
30-Day Mortality 30-Day Readmission
County Hospital Ischemic
Stroke Cases
Ischemic Stroke Deaths
Risk-Adjusted Mortality Rate
(%, RAMR)
Perfor- mance Rating*
Ischemic Stroke Cases
Ischemic Stroke
Readmis-sions
Risk-Adjusted
Readmission Rate
(%, RARR)
Perfor- mance Rating*
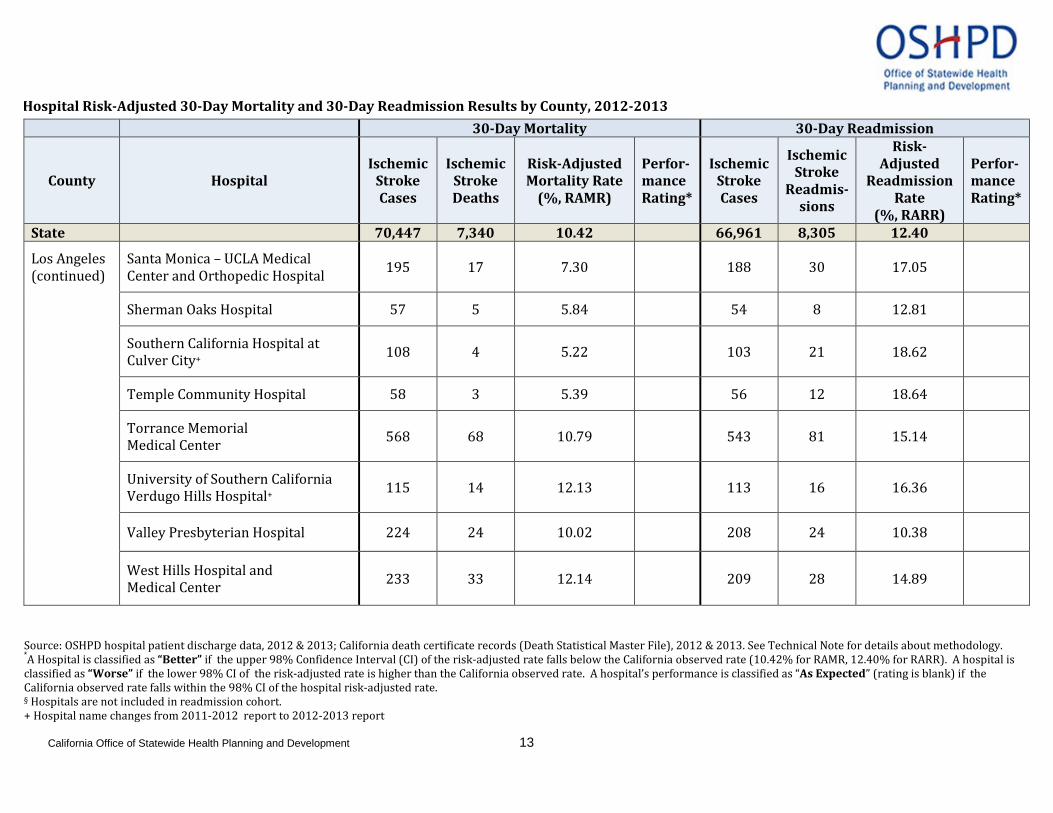
State 70,447 7,340 10.42 66,961 8,305 12.40
Los Angeles (continued)
Santa Monica – UCLA Medical Center and Orthopedic Hospital 195 17 7.30 188 30 17.05
Sherman Oaks Hospital 57 5 5.84 54 8 12.81
Southern California Hospital at Culver City+ 108 4 5.22 103 21 18.62
Temple Community Hospital 58 3 5.39 56 12 18.64
Torrance Memorial Medical Center 568 68 10.79 543 81 15.14
University of Southern California Verdugo Hills Hospital+ 115 14 12.13 113 16 16.36
Valley Presbyterian Hospital 224 24 10.02 208 24 10.38
West Hills Hospital and Medical Center 233 33 12.14 209 28 14.89
Source: OSHPD hospital patient discharge data, 2012 & 2013; California death certificate records (Death Statistical Master File), 2012 & 2013. See Technical Note for details about methodology. *A Hospital is classified as “Better” if the upper 98% Confidence Interval (CI) of the risk-adjusted rate falls below the California observed rate (10.42% for RAMR, 12.40% for RARR). A hospital is classified as “Worse” if the lower 98% CI of the risk-adjusted rate is higher than the California observed rate. A hospital’s performance is classified as “As Expected” (rating is blank) if the California observed rate falls within the 98% CI of the hospital risk-adjusted rate. § Hospitals are not included in readmission cohort. + Hospital name changes from 2011-2012 report to 2012-2013 report
California Office of Statewide Health Planning and Development 13

Hospital Risk-Adjusted 30-Day Mortality and 30-Day Readmission Results by County, 2012-2013
30-Day Mortality 30-Day Readmission
County Hospital Ischemic
Stroke Cases
Ischemic Stroke Deaths
Risk-Adjusted Mortality Rate
(%, RAMR)
Perfor- mance Rating*
Ischemic Stroke Cases
Ischemic Stroke
Readmis-sions
Risk-Adjusted
Readmission Rate
(%, RARR)
Perfor- mance Rating*
State 70,447 7,340 10.42 66,961 8,305 12.40
Los Angeles (continued)
White Memorial Medical Center 398 21 5.54 Better 385 69 14.69
Whittier Hospital Medical Center 101 3 3.32 Better 99 13 11.91
Madera Madera Community Hospital 63 7 21.69 58 6 11.28
Marin
Kaiser Foundation Hospital – San Rafael 209 17 6.06 Better 201 20 9.96
Marin General Hospital 239 31 10.05 226 23 10.77
Novato Community Hospital 51 9 14.56 48 5 10.03
Mendocino
Frank R. Howard Memorial Hospital 40 4 7.50 40 1 2.86
Mendocino Coast District Hospital 31 5 10.89 30 3 12.25
Ukiah Valley Medical Center 113 20 14.96 104 17 17.46
Merced Mercy Medical Center – Merced 275 32 8.22 258 29 10.30
Source: OSHPD hospital patient discharge data, 2012 & 2013; California death certificate records (Death Statistical Master File), 2012 & 2013. See Technical Note for details about methodology. *A Hospital is classified as “Better” if the upper 98% Confidence Interval (CI) of the risk-adjusted rate falls below the California observed rate (10.42% for RAMR, 12.40% for RARR). A hospital is classified as “Worse” if the lower 98% CI of the risk-adjusted rate is higher than the California observed rate. A hospital’s performance is classified as “As Expected” (rating is blank) if the California observed rate falls within the 98% CI of the hospital risk-adjusted rate. § Hospitals are not included in readmission cohort. + Hospital name changes from 2011-2012 report to 2012-2013 report
California Office of Statewide Health Planning and Development 14

Hospital Risk-Adjusted 30-Day Mortality and 30-Day Readmission Results by County, 2012-2013
30-Day Mortality 30-Day Readmission
County Hospital Ischemic
Stroke Cases
Ischemic Stroke Deaths
Risk-Adjusted Mortality Rate
(%, RAMR)
Perfor- mance Rating*
Ischemic Stroke Cases
Ischemic Stroke
Readmis-sions
Risk-Adjusted
Readmission Rate
(%, RARR)
Perfor- mance Rating*
State 70,447 7,340 10.42 66,961 8,305 12.40
Monterey
Community Hospital Monterey Peninsula 335 35 11.33 315 43 15.18
Natividad Medical Center 57 0 0.00 57 5 10.38
Salinas Valley Memorial Hospital 324 20 6.46 Better 312 36 11.61
Napa Queen of the Valley Hospital – Napa 175 34 16.67 Worse 157 18 11.01
Saint Helena Hospital 63 9 11.53 57 6 10.36
Nevada Sierra Nevada Memorial Hospital 166 25 11.21 156 23 16.48
Orange
AHMC Anaheim Regional Medical Center 227 17 11.09 221 32 15.21
Fountain Valley Regional Hospital and Medical Center – Euclid 480 35 6.88 Better 456 56 11.13
Garden Grove Hospital and Medical Center 81 4 6.30 79 7 8.82
Source: OSHPD hospital patient discharge data, 2012 & 2013; California death certificate records (Death Statistical Master File), 2012 & 2013. See Technical Note for details about methodology. *A Hospital is classified as “Better” if the upper 98% Confidence Interval (CI) of the risk-adjusted rate falls below the California observed rate (10.42% for RAMR, 12.40% for RARR). A hospital is classified as “Worse” if the lower 98% CI of the risk-adjusted rate is higher than the California observed rate. A hospital’s performance is classified as “As Expected” (rating is blank) if the California observed rate falls within the 98% CI of the hospital risk-adjusted rate. § Hospitals are not included in readmission cohort. + Hospital name changes from 2011-2012 report to 2012-2013 report
California Office of Statewide Health Planning and Development 15

Hospital Risk-Adjusted 30-Day Mortality and 30-Day Readmission Results by County, 2012-2013
30-Day Mortality 30-Day Readmission
County Hospital Ischemic
Stroke Cases
Ischemic Stroke Deaths
Risk-Adjusted Mortality Rate
(%, RAMR)
Perfor- mance Rating*
Ischemic Stroke Cases
Ischemic Stroke
Readmis-sions
Risk-Adjusted
Readmission Rate
(%, RARR)
Perfor- mance Rating*
State 70,447 7,340 10.42 66,961 8,305 12.40
Orange (continued)
Hoag Memorial Hospital Presbyterian 846 76 8.72 813 101 13.59
Huntington Beach Hospital 55 4 6.83 54 10 16.93
Kaiser Foundation Hospital – Anaheim 259 23 9.97 250 32 13.56
Kaiser Foundation Hospital –Lakeview+ 204 14 9.35 200 19 9.28
La Palma Intercommunity Hospital 78 4 6.96 76 4 5.10
Los Alamitos Medical Center 397 49 10.56 381 44 12.50
Mission Hospital Regional Medical Center 470 57 9.77 438 55 13.48
Orange Coast Memorial Medical Center 208 16 7.60 204 29 14.41
Placentia Linda Hospital 78 11 14.18 77 12 17.60
Source: OSHPD hospital patient discharge data, 2012 & 2013; California death certificate records (Death Statistical Master File), 2012 & 2013. See Technical Note for details about methodology. *A Hospital is classified as “Better” if the upper 98% Confidence Interval (CI) of the risk-adjusted rate falls below the California observed rate (10.42% for RAMR, 12.40% for RARR). A hospital is classified as “Worse” if the lower 98% CI of the risk-adjusted rate is higher than the California observed rate. A hospital’s performance is classified as “As Expected” (rating is blank) if the California observed rate falls within the 98% CI of the hospital risk-adjusted rate. § Hospitals are not included in readmission cohort. + Hospital name changes from 2011-2012 report to 2012-2013 report
California Office of Statewide Health Planning and Development 16

Hospital Risk-Adjusted 30-Day Mortality and 30-Day Readmission Results by County, 2012-2013
30-Day Mortality 30-Day Readmission
County Hospital Ischemic
Stroke Cases
Ischemic Stroke Deaths
Risk-Adjusted Mortality Rate
(%, RAMR)
Perfor- mance Rating*
Ischemic Stroke Cases
Ischemic Stroke
Readmis-sions
Risk-Adjusted
Readmission Rate
(%, RARR)
Perfor- mance Rating*
State 70,447 7,340 10.42 66,961 8,305 12.40
Orange (continued)
Saddleback Memorial Medical Center 432 72 12.12 405 54 14.31
Saint Joseph Hospital – Orange 447 53 11.65 426 56 14.31
Saint Jude Medical Center 560 70 9.12 533 62 11.42
UC Irvine Medical Center 369 47 11.71 338 41 12.05
West Anaheim Medical Center 123 14 10.00 118 16 12.06
Western Medical Center – Santa Ana 190 24 11.98 173 16 9.92
Placer
Kaiser Foundation Hospital – Roseville 500 66 10.33 479 49 9.67
Sutter Auburn Faith Hospital 177 20 9.78 174 11 6.57 Better
Sutter Roseville Medical Center 501 73 12.96 469 47 10.04
Source: OSHPD hospital patient discharge data, 2012 & 2013; California death certificate records (Death Statistical Master File), 2012 & 2013. See Technical Note for details about methodology. *A Hospital is classified as “Better” if the upper 98% Confidence Interval (CI) of the risk-adjusted rate falls below the California observed rate (10.42% for RAMR, 12.40% for RARR). A hospital is classified as “Worse” if the lower 98% CI of the risk-adjusted rate is higher than the California observed rate. A hospital’s performance is classified as “As Expected” (rating is blank) if the California observed rate falls within the 98% CI of the hospital risk-adjusted rate. § Hospitals are not included in readmission cohort. + Hospital name changes from 2011-2012 report to 2012-2013 report
California Office of Statewide Health Planning and Development 17

Hospital Risk-Adjusted 30-Day Mortality and 30-Day Readmission Results by County, 2012-2013
30-Day Mortality 30-Day Readmission
County Hospital Ischemic
Stroke Cases
Ischemic Stroke Deaths
Risk-Adjusted Mortality Rate
(%, RAMR)
Perfor- mance Rating*
Ischemic Stroke Cases
Ischemic Stroke
Readmis-sions
Risk-Adjusted
Readmission Rate
(%, RARR)
Perfor- mance Rating*
State 70,447 7,340 10.42 66,961 8,305 12.40
Riverside
Corona Regional Medical Center – Main 147 19 12.24 140 14 10.13
Desert Regional Medical Center 556 60 11.16 536 61 12.43
Eisenhower Medical Center 831 95 11.75 807 82 11.17
Hemet Valley Medical Center 374 61 12.00 351 49 13.76
John F. Kennedy Memorial Hospital 90 8 10.04 87 17 20.04
Kaiser Foundation Hospital – Moreno Valley 104 13 15.90 100 14 12.63
Kaiser Foundation Hospital – Riverside 237 23 13.25 227 21 8.92
Loma Linda University Medical Center – Murrieta 63 2 4.97 63 14 25.99 Worse
Menifee Valley Medical Center 85 12 11.44 82 16 20.01
Source: OSHPD hospital patient discharge data, 2012 & 2013; California death certificate records (Death Statistical Master File), 2012 & 2013. See Technical Note for details about methodology. *A Hospital is classified as “Better” if the upper 98% Confidence Interval (CI) of the risk-adjusted rate falls below the California observed rate (10.42% for RAMR, 12.40% for RARR). A hospital is classified as “Worse” if the lower 98% CI of the risk-adjusted rate is higher than the California observed rate. A hospital’s performance is classified as “As Expected” (rating is blank) if the California observed rate falls within the 98% CI of the hospital risk-adjusted rate. § Hospitals are not included in readmission cohort. + Hospital name changes from 2011-2012 report to 2012-2013 report
California Office of Statewide Health Planning and Development 18

Hospital Risk-Adjusted 30-Day Mortality and 30-Day Readmission Results by County, 2012-2013
30-Day Mortality 30-Day Readmission
County Hospital Ischemic
Stroke Cases
Ischemic Stroke Deaths
Risk-Adjusted Mortality Rate
(%, RAMR)
Perfor- mance Rating*
Ischemic Stroke Cases
Ischemic Stroke
Readmis-sions
Risk-Adjusted
Readmission Rate
(%, RARR)
Perfor- mance Rating*
State 70,447 7,340 10.42 66,961 8,305 12.40
Riverside (continued)
Parkview Community Hospital Medical Center 186 18 12.16 176 32 18.67
Riverside Community Hospital 487 50 12.00 470 72 14.96
Riverside County Regional Medical Center 286 16 9.13 276 32 12.17
San Gorgonio Memorial Hospital 93 10 10.57 89 10 11.73
Southwest Healthcare System – Murrieta 409 40 11.72 399 51 14.35
Sacramento
Kaiser Foundation Hospital – Sacramento 447 65 11.71 408 44 9.90
Kaiser Foundation Hospital – South Sacramento 463 46 9.49 445 54 10.30
Mercy General Hospital 345 35 9.41 325 36 10.11
Mercy Hospital – Folsom 126 7 6.82 123 18 16.98
Source: OSHPD hospital patient discharge data, 2012 & 2013; California death certificate records (Death Statistical Master File), 2012 & 2013. See Technical Note for details about methodology. *A Hospital is classified as “Better” if the upper 98% Confidence Interval (CI) of the risk-adjusted rate falls below the California observed rate (10.42% for RAMR, 12.40% for RARR). A hospital is classified as “Worse” if the lower 98% CI of the risk-adjusted rate is higher than the California observed rate. A hospital’s performance is classified as “As Expected” (rating is blank) if the California observed rate falls within the 98% CI of the hospital risk-adjusted rate. § Hospitals are not included in readmission cohort. + Hospital name changes from 2011-2012 report to 2012-2013 report
California Office of Statewide Health Planning and Development 19

Hospital Risk-Adjusted 30-Day Mortality and 30-Day Readmission Results by County, 2012-2013
30-Day Mortality 30-Day Readmission
County Hospital Ischemic
Stroke Cases
Ischemic Stroke Deaths
Risk-Adjusted Mortality Rate
(%, RAMR)
Perfor- mance Rating*
Ischemic Stroke Cases
Ischemic Stroke
Readmis-sions
Risk-Adjusted
Readmission Rate
(%, RARR)
Perfor- mance Rating*
State 70,447 7,340 10.42 66,961 8,305 12.40
Sacramento (continued)
Mercy San Juan Hospital 690 109 11.63 633 70 10.87
Methodist Hospital of Sacramento 350 38 11.39 331 49 13.66
Sutter General Hospital 437 42 11.91 419 46 11.17
Sutter Memorial Hospital 162 14 9.58 154 16 10.28
UC Davis Medical Center 439 37 11.64 413 51 13.02
San Benito Hazel Hawkins Memorial Hospital 41 7 14.60 38 4 12.01
San Bernardino
Arrowhead Regional Medical Center 452 21 11.63 443 50 12.92
Barstow Community Hospital 87 7 12.56 87 15 16.49
Chino Valley Medical Center 88 2 3.56 86 12 12.91
Community Hospital of San Bernardino 39 1 4.13 38 5 13.12
Source: OSHPD hospital patient discharge data, 2012 & 2013; California death certificate records (Death Statistical Master File), 2012 & 2013. See Technical Note for details about methodology. *A Hospital is classified as “Better” if the upper 98% Confidence Interval (CI) of the risk-adjusted rate falls below the California observed rate (10.42% for RAMR, 12.40% for RARR). A hospital is classified as “Worse” if the lower 98% CI of the risk-adjusted rate is higher than the California observed rate. A hospital’s performance is classified as “As Expected” (rating is blank) if the California observed rate falls within the 98% CI of the hospital risk-adjusted rate. § Hospitals are not included in readmission cohort. + Hospital name changes from 2011-2012 report to 2012-2013 report
California Office of Statewide Health Planning and Development 20
Hospital Risk-Adjusted 30-Day Mortality and 30-Day Readmission Results by County, 2012-2013
30-Day Mortality 30-Day Readmission
County Hospital Ischemic
Stroke Cases
Ischemic Stroke Deaths
Risk-Adjusted Mortality Rate
(%, RAMR)
Perfor- mance Rating*
Ischemic Stroke Cases
Ischemic Stroke
Readmis-sions
Risk-Adjusted
Readmission Rate
(%, RARR)
Perfor- mance Rating*
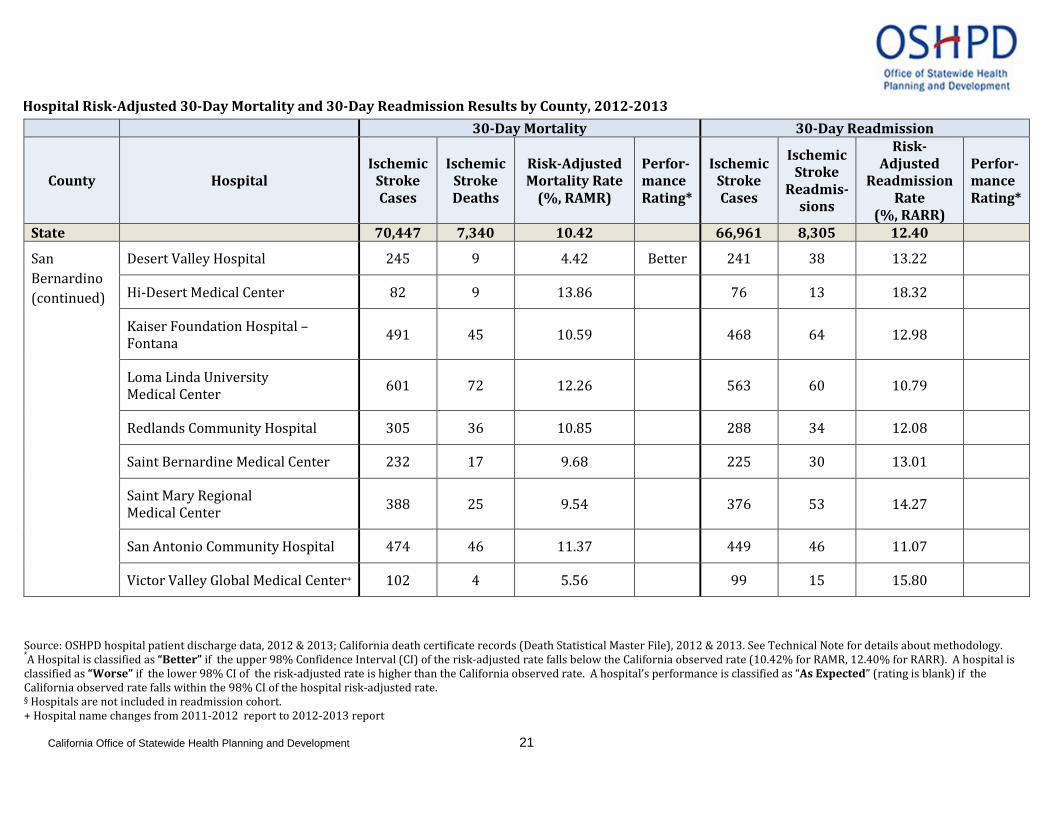
State 70,447 7,340 10.42 66,961 8,305 12.40
San Bernardino (continued)
Desert Valley Hospital 245 9 4.42 Better 241 38 13.22
Hi-Desert Medical Center 82 9 13.86 76 13 18.32
Kaiser Foundation Hospital – Fontana 491 45 10.59 468 64 12.98
Loma Linda University Medical Center 601 72 12.26 563 60 10.79
Redlands Community Hospital 305 36 10.85 288 34 12.08
Saint Bernardine Medical Center 232 17 9.68 225 30 13.01
Saint Mary Regional Medical Center 388 25 9.54 376 53 14.27
San Antonio Community Hospital 474 46 11.37 449 46 11.07
Victor Valley Global Medical Center+ 102 4 5.56 99 15 15.80
Source: OSHPD hospital patient discharge data, 2012 & 2013; California death certificate records (Death Statistical Master File), 2012 & 2013. See Technical Note for details about methodology. *A Hospital is classified as “Better” if the upper 98% Confidence Interval (CI) of the risk-adjusted rate falls below the California observed rate (10.42% for RAMR, 12.40% for RARR). A hospital is classified as “Worse” if the lower 98% CI of the risk-adjusted rate is higher than the California observed rate. A hospital’s performance is classified as “As Expected” (rating is blank) if the California observed rate falls within the 98% CI of the hospital risk-adjusted rate. § Hospitals are not included in readmission cohort. + Hospital name changes from 2011-2012 report to 2012-2013 report
California Office of Statewide Health Planning and Development 21

Hospital Risk-Adjusted 30-Day Mortality and 30-Day Readmission Results by County, 2012-2013
30-Day Mortality 30-Day Readmission
County Hospital Ischemic
Stroke Cases
Ischemic Stroke Deaths
Risk-Adjusted Mortality Rate
(%, RAMR)
Perfor- mance Rating*
Ischemic Stroke Cases
Ischemic Stroke
Readmis-sions
Risk-Adjusted
Readmission Rate
(%, RARR)
Perfor- mance Rating*
State 70,447 7,340 10.42 66,961 8,305 12.40
San Diego
Alvarado Hospital 149 19 9.76 137 14 9.57
Grossmont Hospital 887 102 10.74 821 130 15.85 Worse
Kaiser Foundation Hospital – San Diego 508 36 8.51 494 53 11.32
Palomar Health Downtown Campus 657 83 11.51 613 70 12.85
Paradise Valley Hospital 127 9 10.19 125 25 17.60
Pomerado Hospital 216 30 11.26 198 17 9.87
Scripps Green Hospital 185 20 10.06 174 23 13.91
Scripps Memorial Hospital – Encinitas 311 39 9.12 298 21 8.05
Scripps Memorial Hospital – La Jolla 395 50 9.22 362 46 13.40
Source: OSHPD hospital patient discharge data, 2012 & 2013; California death certificate records (Death Statistical Master File), 2012 & 2013. See Technical Note for details about methodology. *A Hospital is classified as “Better” if the upper 98% Confidence Interval (CI) of the risk-adjusted rate falls below the California observed rate (10.42% for RAMR, 12.40% for RARR). A hospital is classified as “Worse” if the lower 98% CI of the risk-adjusted rate is higher than the California observed rate. A hospital’s performance is classified as “As Expected” (rating is blank) if the California observed rate falls within the 98% CI of the hospital risk-adjusted rate. § Hospitals are not included in readmission cohort. + Hospital name changes from 2011-2012 report to 2012-2013 report
California Office of Statewide Health Planning and Development 22
Hospital Risk-Adjusted 30-Day Mortality and 30-Day Readmission Results by County, 2012-2013
30-Day Mortality 30-Day Readmission
County Hospital Ischemic
Stroke Cases
Ischemic Stroke Deaths
Risk-Adjusted Mortality Rate
(%, RAMR)
Perfor- mance Rating*
Ischemic Stroke Cases
Ischemic Stroke
Readmis-sions
Risk-Adjusted
Readmission Rate
(%, RARR)
Perfor- mance Rating*
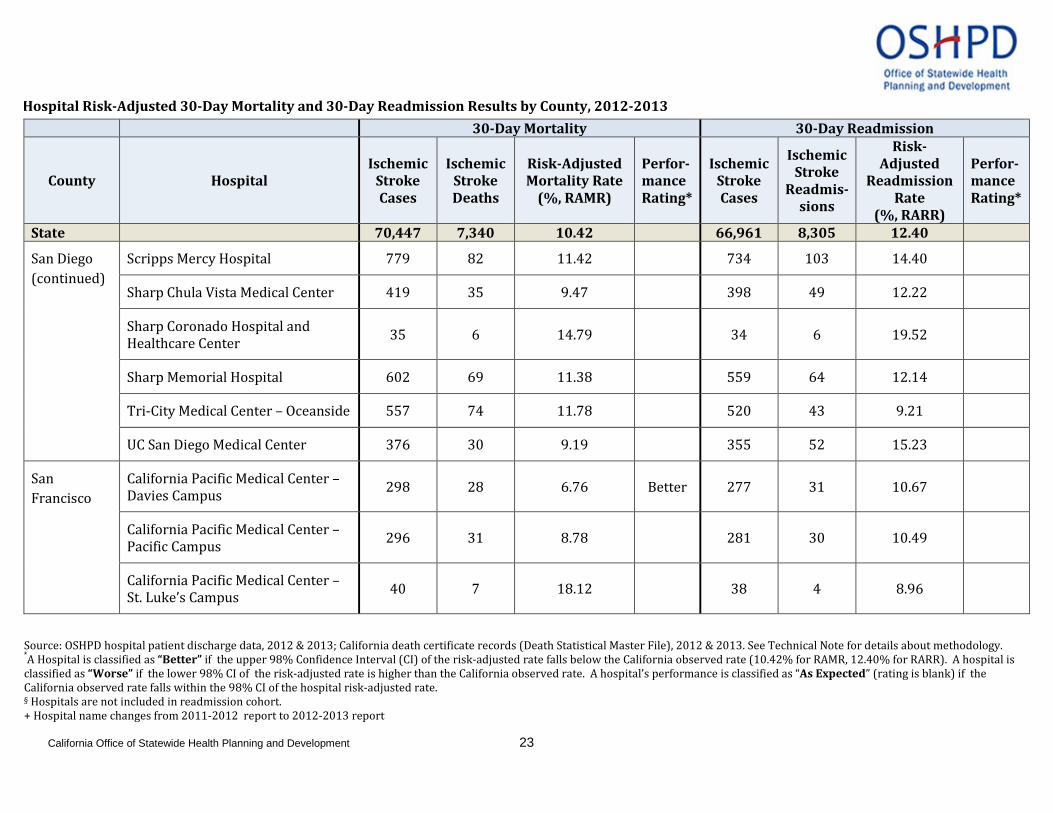
State 70,447 7,340 10.42 66,961 8,305 12.40
San Diego (continued)
Scripps Mercy Hospital 779 82 11.42 734 103 14.40
Sharp Chula Vista Medical Center 419 35 9.47 398 49 12.22
Sharp Coronado Hospital and Healthcare Center 35 6 14.79 34 6 19.52
Sharp Memorial Hospital 602 69 11.38 559 64 12.14
Tri-City Medical Center – Oceanside 557 74 11.78 520 43 9.21
UC San Diego Medical Center 376 30 9.19 355 52 15.23
San Francisco
California Pacific Medical Center – Davies Campus 298 28 6.76 Better 277 31 10.67
California Pacific Medical Center – Pacific Campus 296 31 8.78 281 30 10.49
California Pacific Medical Center – St. Luke’s Campus 40 7 18.12 38 4 8.96
Source: OSHPD hospital patient discharge data, 2012 & 2013; California death certificate records (Death Statistical Master File), 2012 & 2013. See Technical Note for details about methodology. *A Hospital is classified as “Better” if the upper 98% Confidence Interval (CI) of the risk-adjusted rate falls below the California observed rate (10.42% for RAMR, 12.40% for RARR). A hospital is classified as “Worse” if the lower 98% CI of the risk-adjusted rate is higher than the California observed rate. A hospital’s performance is classified as “As Expected” (rating is blank) if the California observed rate falls within the 98% CI of the hospital risk-adjusted rate. § Hospitals are not included in readmission cohort. + Hospital name changes from 2011-2012 report to 2012-2013 report
California Office of Statewide Health Planning and Development 23

Hospital Risk-Adjusted 30-Day Mortality and 30-Day Readmission Results by County, 2012-2013
30-Day Mortality 30-Day Readmission
County Hospital Ischemic
Stroke Cases
Ischemic Stroke Deaths
Risk-Adjusted Mortality Rate
(%, RAMR)
Perfor- mance Rating*
Ischemic Stroke Cases
Ischemic Stroke
Readmis-sions
Risk-Adjusted
Readmission Rate
(%, RARR)
Perfor- mance Rating*
State 70,447 7,340 10.42 66,961 8,305 12.40
San Francisco (continued)
Chinese Hospital 97 4 4.24 94 9 8.92
Kaiser Foundation Hospital – San Francisco 292 27 8.91 278 27 9.09
Saint Francis Memorial Hospital 165 15 9.09 157 25 15.46
Saint Mary’s Medical Center – San Francisco 156 15 8.01 151 17 11.07
San Francisco General Hospital 338 38 18.74 Worse 306 36 12.55
UC San Francisco Medical Center 337 32 10.20 323 41 13.26
San Joaquin
Dameron Hospital 148 12 12.67 143 19 13.01
Doctors Hospital of Manteca 86 11 11.87 79 12 14.24
Kaiser Foundation Hospital – Manteca 147 20 12.06 140 13 7.62
Lodi Memorial Hospital 132 24 14.47 127 18 15.15
Source: OSHPD hospital patient discharge data, 2012 & 2013; California death certificate records (Death Statistical Master File), 2012 & 2013. See Technical Note for details about methodology. *A Hospital is classified as “Better” if the upper 98% Confidence Interval (CI) of the risk-adjusted rate falls below the California observed rate (10.42% for RAMR, 12.40% for RARR). A hospital is classified as “Worse” if the lower 98% CI of the risk-adjusted rate is higher than the California observed rate. A hospital’s performance is classified as “As Expected” (rating is blank) if the California observed rate falls within the 98% CI of the hospital risk-adjusted rate. § Hospitals are not included in readmission cohort. + Hospital name changes from 2011-2012 report to 2012-2013 report
California Office of Statewide Health Planning and Development 24

Hospital Risk-Adjusted 30-Day Mortality and 30-Day Readmission Results by County, 2012-2013
30-Day Mortality 30-Day Readmission
County Hospital Ischemic
Stroke Cases
Ischemic Stroke Deaths
Risk-Adjusted Mortality Rate
(%, RAMR)
Perfor- mance Rating*
Ischemic Stroke Cases
Ischemic Stroke
Readmis-sions
Risk-Adjusted
Readmission Rate
(%, RARR)
Perfor- mance Rating*
State 70,447 7,340 10.42 66,961 8,305 12.40
San Joaquin (continued)
Saint Joseph’s Medical Center of Stockton 423 50 12.14 392 43 10.99
San Joaquin General Hospital 155 17 19.31 Worse 147 21 15.14
Sutter Tracy Community Hospital 88 12 13.45 82 14 16.87
San Luis Obispo
French Hospital Medical Center 94 10 12.28 92 5 6.21
Marian Regional Medical Center – Arroyo Grande+ 104 9 8.88 100 2 2.32 Better
Sierra Vista Regional Medical Center 143 21 14.76 137 13 11.43
Twin Cities Community Hospital 171 22 14.92 165 19 13.84
San Mateo
Kaiser Foundation Hospital – Redwood City 315 43 11.87 290 29 9.76
Source: OSHPD hospital patient discharge data, 2012 & 2013; California death certificate records (Death Statistical Master File), 2012 & 2013. See Technical Note for details about methodology. *A Hospital is classified as “Better” if the upper 98% Confidence Interval (CI) of the risk-adjusted rate falls below the California observed rate (10.42% for RAMR, 12.40% for RARR). A hospital is classified as “Worse” if the lower 98% CI of the risk-adjusted rate is higher than the California observed rate. A hospital’s performance is classified as “As Expected” (rating is blank) if the California observed rate falls within the 98% CI of the hospital risk-adjusted rate. § Hospitals are not included in readmission cohort. + Hospital name changes from 2011-2012 report to 2012-2013 report
California Office of Statewide Health Planning and Development 25

Hospital Risk-Adjusted 30-Day Mortality and 30-Day Readmission Results by County, 2012-2013
30-Day Mortality 30-Day Readmission
County Hospital Ischemic
Stroke Cases
Ischemic Stroke Deaths
Risk-Adjusted Mortality Rate
(%, RAMR)
Perfor- mance Rating*
Ischemic Stroke Cases
Ischemic Stroke
Readmis-sions
Risk-Adjusted
Readmission Rate
(%, RARR)
Perfor- mance Rating*
State 70,447 7,340 10.42 66,961 8,305 12.40
San Mateo (continued)
Kaiser Foundation Hospital – South San Francisco 228 19 8.69 216 27 11.34
Mills-Peninsula Medical Center+ 398 51 9.46 371 42 11.24
San Mateo Medical Center 33 1 6.28 33 1 3.35 Better
Sequoia Hospital 139 15 8.90 131 13 10.47
Seton Medical Center 291 33 10.00 273 22 7.56
Santa Barbara
Lompoc Valley Medical Center 71 10 13.96 65 2 3.28
Marian Regional Medical Center 256 34 14.06 240 24 10.36
Santa Barbara Cottage Hospital 558 81 11.55 517 45 10.02
Santa Clara
El Camino Hospital 369 36 8.09 350 35 10.69
Good Samaritan Hospital – San Jose 474 52 10.74 440 49 12.61
Source: OSHPD hospital patient discharge data, 2012 & 2013; California death certificate records (Death Statistical Master File), 2012 & 2013. See Technical Note for details about methodology. *A Hospital is classified as “Better” if the upper 98% Confidence Interval (CI) of the risk-adjusted rate falls below the California observed rate (10.42% for RAMR, 12.40% for RARR). A hospital is classified as “Worse” if the lower 98% CI of the risk-adjusted rate is higher than the California observed rate. A hospital’s performance is classified as “As Expected” (rating is blank) if the California observed rate falls within the 98% CI of the hospital risk-adjusted rate. § Hospitals are not included in readmission cohort. + Hospital name changes from 2011-2012 report to 2012-2013 report
California Office of Statewide Health Planning and Development 26

Hospital Risk-Adjusted 30-Day Mortality and 30-Day Readmission Results by County, 2012-2013
30-Day Mortality 30-Day Readmission
County Hospital Ischemic
Stroke Cases
Ischemic Stroke Deaths
Risk-Adjusted Mortality Rate
(%, RAMR)
Perfor- mance Rating*
Ischemic Stroke Cases
Ischemic Stroke
Readmis-sions
Risk-Adjusted
Readmission Rate
(%, RARR)
Perfor- mance Rating*
State 70,447 7,340 10.42 66,961 8,305 12.40
Santa Clara (continued)
Kaiser Foundation Hospital – San Jose 342 41 11.27 326 42 12.08
Kaiser Foundation Hospital – Santa Clara 452 35 8.04 436 53 11.80
O’Connor Hospital – San Jose 245 33 11.93 232 26 11.74
Regional Medical of San Jose 444 41 10.09 424 58 12.63
Saint Louise Regional Hospital 98 9 8.16 95 7 6.56
Santa Clara Valley Medical Center 360 13 9.19 355 48 14.82
Stanford Hospital 392 38 9.05 374 36 10.62
Santa Cruz Dominican Hospital – Santa Cruz/Soquel 284 29 9.29 269 20 8.71
Watsonville Community Hospital 111 15 14.02 107 11 10.84
Shasta Mercy Medical Center – Redding 382 63 14.35 Worse 348 33 10.29
Source: OSHPD hospital patient discharge data, 2012 & 2013; California death certificate records (Death Statistical Master File), 2012 & 2013. See Technical Note for details about methodology. *A Hospital is classified as “Better” if the upper 98% Confidence Interval (CI) of the risk-adjusted rate falls below the California observed rate (10.42% for RAMR, 12.40% for RARR). A hospital is classified as “Worse” if the lower 98% CI of the risk-adjusted rate is higher than the California observed rate. A hospital’s performance is classified as “As Expected” (rating is blank) if the California observed rate falls within the 98% CI of the hospital risk-adjusted rate. § Hospitals are not included in readmission cohort. + Hospital name changes from 2011-2012 report to 2012-2013 report
California Office of Statewide Health Planning and Development 27

Hospital Risk-Adjusted 30-Day Mortality and 30-Day Readmission Results by County, 2012-2013
30-Day Mortality 30-Day Readmission
County Hospital Ischemic
Stroke Cases
Ischemic Stroke Deaths
Risk-Adjusted Mortality Rate
(%, RAMR)
Perfor- mance Rating*
Ischemic Stroke Cases
Ischemic Stroke
Readmis-sions
Risk-Adjusted
Readmission Rate
(%, RARR)
Perfor- mance Rating*
State 70,447 7,340 10.42 66,961 8,305 12.40
Shasta (continued) Shasta Regional Medical Center 233 24 12.28 221 27 14.34
Siskiyou Fairchild Medical Center 49 2 3.93 48 4 10.34
Solano
Kaiser Foundation Hospital – Rehabilitation Center Vallejo 313 27 7.32 304 32 8.85
Kaiser Foundation Hospital – Vacaville 200 16 7.73 191 15 7.56
North Bay Medical Center 230 14 6.67 221 34 14.42
Sutter Solano Medical Center 148 11 8.23 144 13 8.30
Sonoma
Healdsburg District Hospital 47 5 11.18 47 4 10.54
Kaiser Foundation Hospital – Santa Rosa 257 46 11.92 238 23 8.71
Palm Drive Hospital 48 6 8.87 47 4 8.29
Source: OSHPD hospital patient discharge data, 2012 & 2013; California death certificate records (Death Statistical Master File), 2012 & 2013. See Technical Note for details about methodology. *A Hospital is classified as “Better” if the upper 98% Confidence Interval (CI) of the risk-adjusted rate falls below the California observed rate (10.42% for RAMR, 12.40% for RARR). A hospital is classified as “Worse” if the lower 98% CI of the risk-adjusted rate is higher than the California observed rate. A hospital’s performance is classified as “As Expected” (rating is blank) if the California observed rate falls within the 98% CI of the hospital risk-adjusted rate. § Hospitals are not included in readmission cohort. + Hospital name changes from 2011-2012 report to 2012-2013 report
California Office of Statewide Health Planning and Development 28

Hospital Risk-Adjusted 30-Day Mortality and 30-Day Readmission Results by County, 2012-2013
30-Day Mortality 30-Day Readmission
County Hospital Ischemic
Stroke Cases
Ischemic Stroke Deaths
Risk-Adjusted Mortality Rate
(%, RAMR)
Perfor- mance Rating*
Ischemic Stroke Cases
Ischemic Stroke
Readmis-sions
Risk-Adjusted
Readmission Rate
(%, RARR)
Perfor- mance Rating*
State 70,447 7,340 10.42 66,961 8,305 12.40
Sonoma (continued)
Petaluma Valley Hospital 69 7 8.19 64 6 10.40
Santa Rosa Memorial Hospital – Montgomery 285 44 13.08 262 22 8.91
Sonoma Valley Hospital 54 10 12.46 53 1 2.20
Sutter Medical Center of Santa Rosa 98 10 10.94 96 5 6.14
Stanislaus
Doctors Medical Center 471 53 13.55 451 41 9.38
Emanuel Medical Center, Inc. 133 16 15.20 129 10 8.99
Memorial Hospital Medical Center – Modesto 441 57 12.66 422 57 13.99
Oak Valley District Hospital 37 3 11.52 36 4 13.60
Tehama Saint Elizabeth Community Hospital 72 10 11.42 68 5 7.93
Source: OSHPD hospital patient discharge data, 2012 & 2013; California death certificate records (Death Statistical Master File), 2012 & 2013. See Technical Note for details about methodology. *A Hospital is classified as “Better” if the upper 98% Confidence Interval (CI) of the risk-adjusted rate falls below the California observed rate (10.42% for RAMR, 12.40% for RARR). A hospital is classified as “Worse” if the lower 98% CI of the risk-adjusted rate is higher than the California observed rate. A hospital’s performance is classified as “As Expected” (rating is blank) if the California observed rate falls within the 98% CI of the hospital risk-adjusted rate. § Hospitals are not included in readmission cohort. + Hospital name changes from 2011-2012 report to 2012-2013 report
California Office of Statewide Health Planning and Development 29

Hospital Risk-Adjusted 30-Day Mortality and 30-Day Readmission Results by County, 2012-2013
30-Day Mortality 30-Day Readmission
County Hospital Ischemic
Stroke Cases
Ischemic Stroke Deaths
Risk-Adjusted Mortality Rate
(%, RAMR)
Perfor- mance Rating*
Ischemic Stroke Cases
Ischemic Stroke
Readmis-sions
Risk-Adjusted
Readmission Rate
(%, RARR)
Perfor- mance Rating*
State 70,447 7,340 10.42 66,961 8,305 12.40
Tulare
Kaweah Delta Medical Center 475 58 13.93 Worse 446 50 11.72
Sierra View District Hospital 193 26 13.78 179 22 12.05
Tulare Regional Medical Center 74 12 17.96 71 12 17.67
Tuolumne Sonora Regional Medical Center – Greenley 149 24 13.01 137 13 9.76
Ventura
Community Memorial Hospital – San Buenaventura 327 33 9.17 316 38 13.06
Los Robles Hospital and Medical Center 285 39 12.29 267 29 12.27
Ojai Valley Community Hospital 32 5 10.66 31 2 6.29
Saint John’s Pleasant Valley Hospital 137 22 12.52 129 12 9.76
Source: OSHPD hospital patient discharge data, 2012 & 2013; California death certificate records (Death Statistical Master File), 2012 & 2013. See Technical Note for details about methodology. *A Hospital is classified as “Better” if the upper 98% Confidence Interval (CI) of the risk-adjusted rate falls below the California observed rate (10.42% for RAMR, 12.40% for RARR). A hospital is classified as “Worse” if the lower 98% CI of the risk-adjusted rate is higher than the California observed rate. A hospital’s performance is classified as “As Expected” (rating is blank) if the California observed rate falls within the 98% CI of the hospital risk-adjusted rate. § Hospitals are not included in readmission cohort. + Hospital name changes from 2011-2012 report to 2012-2013 report
California Office of Statewide Health Planning and Development 30
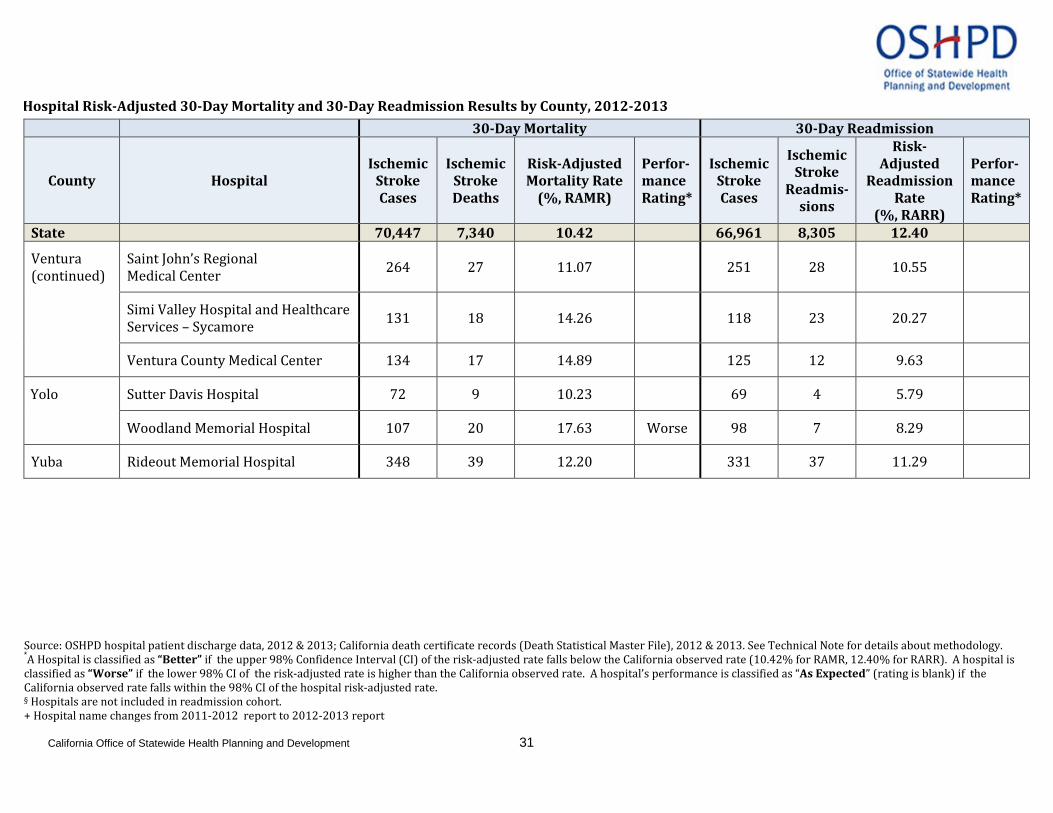
Hospital Risk-Adjusted 30-Day Mortality and 30-Day Readmission Results by County, 2012-2013
30-Day Mortality 30-Day Readmission
County Hospital Ischemic
Stroke Cases
Ischemic Stroke Deaths
Risk-Adjusted Mortality Rate
(%, RAMR)
Perfor- mance Rating*
Ischemic Stroke Cases
Ischemic Stroke
Readmis-sions
Risk-Adjusted
Readmission Rate
(%, RARR)
Perfor- mance Rating*
State 70,447 7,340 10.42 66,961 8,305 12.40
Ventura (continued)
Saint John’s Regional Medical Center 264 27 11.07 251 28 10.55
Simi Valley Hospital and Healthcare Services – Sycamore 131 18 14.26 118 23 20.27
Ventura County Medical Center 134 17 14.89 125 12 9.63
Yolo
Sutter Davis Hospital 72 9 10.23 69 4 5.79
Woodland Memorial Hospital 107 20 17.63 Worse 98 7 8.29
Yuba Rideout Memorial Hospital 348 39 12.20 331 37 11.29
Source: OSHPD hospital patient discharge data, 2012 & 2013; California death certificate records (Death Statistical Master File), 2012 & 2013. See Technical Note for details about methodology. *A Hospital is classified as “Better” if the upper 98% Confidence Interval (CI) of the risk-adjusted rate falls below the California observed rate (10.42% for RAMR, 12.40% for RARR). A hospital is classified as “Worse” if the lower 98% CI of the risk-adjusted rate is higher than the California observed rate. A hospital’s performance is classified as “As Expected” (rating is blank) if the California observed rate falls within the 98% CI of the hospital risk-adjusted rate. § Hospitals are not included in readmission cohort. + Hospital name changes from 2011-2012 report to 2012-2013 report
California Office of Statewide Health Planning and Development 31