Fakultas Teknologi Industri Pertanian Universitas Padjadjaran ...

Proceedings of the Asia Pacific Conference on Business and Social Sciences 2015, Kuala Lumpur
(in partnership with The Journal of Developing Areas)
ISBN 978-0-9925622-2-9
615
EFFICIENCY OF SHARIA AND CONVENTIONAL BANKS:
EVIDENCE FROM INDONESIA
Mokhamad Anwar
University of Padjadjaran, Indonesia
ABSTRACT
This study aims to evaluate the performance of Indonesian banking sector, comparing the technical efficiency of
sharia and conventional banks along with the determinants of its efficiency during the period 2002-2010. Data
Envelopment Analysis is employed to estimate banks technical efficiency and Tobit-regression is used to reveal
the determinants of the efficiency over the panel data of 116 banks, including 109 conventional banks and 7
sharia banks.
The result shows that sharia banks outperformed conventional banks in one model when it takes into account
small business finance (SBF) as one of the output components in the model. Sharia banks have higher average
SBF portfolio than those of conventional banks’ portfolio. The result indicates the efforts of Indonesian sharia
banks to obey one of the principles in Islamic banking, “the emphasis on Islamic principles of morality”.
By observing all models, it is concluded that the size of the bank, capital adequacy and liquidity are of banks
characteristic factors which are very important to increase banks’ efficiency.
JEL Classifications: G21, G28, C14
Keywords: efficiency, sharia banks, conventional banks
Corresponding Author’s Email Address: [email protected]
INTRODUCTION
Evaluating performance of a company or an institution is very important since the performance of an
institution/company is of the stakeholders‘ interests. Many parties, including management of the company,
employees, stockholders, external-financing parties, customers and government need the performance report of
the company (Gitman, 2009; Brealey, et al., 2011). Several performance measurements can be used to evaluate
the performance of a company. One of the popular measurements in evaluating a company is the efficiency
performance. This performance demonstrates the efficiency score of the company in employing inputs to
generate outputs. There are two popular techniques in measuring efficiency: non-parametric technique and
parametric technique. Both methods are very important in explaining efficiencies as they have their own
advantages and weaknesses. In this study, we employ DEA (data envelopment analysis), a non-parametric
technique using linear programming, to estimate technical efficiency of Indonesian banks.
In calculating efficiency, one of the most important aspects is to choose the components of inputs and
inputs. This study tries to build the model that takes into account small business finance (SBF) as one of the
output components. The reason of addressing SBF in the model is because small businesses (SBs) sector is one
of the important economic players in Indonesian economy up to present.
SBs sector has a great role in the development of Indonesia. Its contribution to the GDP of the country
is considerably significant. Department of Cooperative and SMEs (Small Medium Enterprises) Republic of
Indonesia has released the data that 99.91 percent of all business entities in Indonesia is micro and small
businesses (micro and SBs). In 2008, the contribution of micro and SBs to the Gross Domestic Product was
42.24 percent (Department of Cooperative and SMEs Republic of Indonesia). However, SBs still face the
fundamental matters that are still not fully covered. Those matters are regarding the accessibility to external
financing. Some commercial banks are still reluctant to finance SBs because of some internal problems of SBs:
lack of managerial skills and lack of covenants so that they could not effectively promote themselves to fund
owners.
The presence of sharia banks in Indonesia has not only enlarged the opportunity for SBs to have access
to external financing but also to cover the doubtness of dealing with conventional banks regarding the practice
of interest on loans. Those sharia banks have the unique missions to do banking practices with obeying to the
sharia compliance. Besides providing some transactions granted by sharia compliance, such as financing all
types of businesses which is in the correct manner in islam, it is also of the Islamic ethics that financing for SBs
is also important as well as financing for other sectors since the presence of islam itself as ―rahmatan lil-
alamiin‖ (the merciful for universe).
Proceedings of the Asia Pacific Conference on Business and Social Sciences 2015, Kuala Lumpur
(in partnership with The Journal of Developing Areas)
ISBN 978-0-9925622-2-9
616
Indeed, conventional banks have also great contribution to the development of SBs in Indonesia. They
provide lendings either with commercial scheme or with the credit programme scheme as the chanelling or
executing agent of the Government of Indonesia (GOI). Some big commercial banks such as PT. Bank BRI Tbk
and PT. PT Bank Danamon Tbk are well-known as the prominent banks for financing SBs. Moreover, PT. Bank
BRI Tbk has been regarded as one of the largest and most successful microfinance institution in the world
(Patten et al, 2001).
For commercial banks, providing financing to SBs is considered not only as a part of banks‘ corporate
social responsibilities, but also it is of banks‘ profitability and efficiency purposes. Commercial banks maintain
SBs finance portfolio a long with commercial and corporate loans/finance in order to generate profit and
manage the risks.
The significance of SBs finance has attracted us to incorporate it in the calculation of technical
efficiency in Indonesian banking industry. The aim of this research is to estimate the efficiency of commercial
banks in Indonesia with addressing SBF as one of the outputs, and then try to compare the performance of sharia
banks with conventional banks in terms of efficiency performance, and to investigate the determinants of banks
efficiency in Indonesia.
LITERATURE REVIEW
Base principles of Sharia/Islamic bank
Islamic banking refers to a system of banking or banking activity that is consistent with Islamic law/Shariah
principles and guided by Islamic economics. The most essential feature of Islamic banking is that it is interest-
free (Aburime and Felix, 2009:321-324). It means that Islamic banks are not allowed to charge nor pay interest
on their customers. Islam has prohibited moslems from taking or giving interest because that interest is regarded
as ―riba‖ which is a transaction that is not allowed by Allah (Qur’an, Al-Baqarah Ch.1: verse 275) regardless of
the purpose for which such loans are made and regardless of the rates at which interest is charged. Moreover, as
Aburime and Felix (2009) explained that there are some primary characteristics of Islamic banks: prohibition of
interest, profit and loss sharing. Prohibition of interest means that in any transactions undertaken, there is no
additional amount on paying debts. Profit and loss-sharing is of basic principles of Islamic banking in which
bank could make some transactions and share its profits/loss with both with their investors and their depositors.
Besides the prohibition of interest (riba), Molyneux (2010) has added some other principles such as the
prohibition of gambling and other activities forbidden under Islamic law (such as banks can not finance casino
firms, alcohol producers, and so on) and the prohibition of Gharar. The prohibition of Gharar refers to the acts
and conditions in the contract that the full implications are not clearly known by other parties. This is what
similar with the concept of ―asymmetric information‖ – differences in information between contracting parties.
When these are large and there is the opportunity for one party to take material advantage of this position then
the contract is regarded as anti-Islamic (Molyneux, 2010:3).
The difference between Islamic and conventional banks has also been elucidated by Aburime and Felix
(2009). They pointed out that there are 6 difference of operation between Islamic banks and conventional banks.
The first is the prohibition of interest. Islamic banks never charge and pay interest on loans. Their finance is
principally of the murabaha cost-plus or mark-up mode. The second is the emphasis on Islamic principles of
morality. Islamic banks will operate based on the rules of sharia known as fiqh al-muammalat Islamic rules on
transactions. These rules place a premium on morality, as it relates to Islam. By these, Islamic banks are
prohibited from investing in businesses that are considered immoral, or haraam e.g. businesses that sell alcohol
or pork, gambling, and businesses that produce media such as gossip columns or pornography. Third is the
emphasis on collateral. The difference between Islamic banks and conventional banks are also laid in this
matter. Conventional banks tend to finance on the projects that have strong collateral value, whrereas Islamic
banks tend to observe more on the viability of the projects and the profitability of the operations themselves, not
the size of collateral. The fourth is the certainty of deposits and return. For Islamic banks, there tends to be a
wider variation of rate of return since there is no predetermined interest rate. In other words, while conventional
banks guarantee depositors with the predetermined rates of return, Islamic banks do with the principle of profit
and loss sharing that it does not guarantee the profit for banks themselves or for customers. The fifth is the
liquidity and solvency risks. Islamic banks tend to have higher liquidity risk and lower solvency risks since they
specialize more on equity and trade financing.
Regarding the SBs finance and CSR (corporate social responsibility), some aouthors have done some
research. Saleh and Zeitun (2005) study the development of Islamic bank in Lebanon. They remarks that the
statistics of the Albaraka-bank reveals that of all the 15,000 customers they have, they are mostly SMEs. In
addition, the SMEs projects which are financed by Albaraka have always created jobs, therefore the the volume
of financing are expected to be increased in the future in order to overcome the major problem that currently

Proceedings of the Asia Pacific Conference on Business and Social Sciences 2015, Kuala Lumpur
(in partnership with The Journal of Developing Areas)
ISBN 978-0-9925622-2-9
617
faced by SMEs, it is namely the securing finance. It is also stated that even commercial banks generally tend to
finance larger business entities, Islamic banks are still willing to finance smaller enterprises on a profit and loss
sharing basis.
Qureshi and Herani (2011) conduct the surveys to identify the major constrains that SME face in
accessing finance from bank and financial instituton in Karachi, Pakistan. Through 500 respondents of SMEs,
the findings reveal that most people/SMEs feel hesitant to borrow from banks and financial institutions since
banks and financial institutions still impose stringent collateral requirements, high mark-up and the very long
and complicated process of documentary. Some other results reveal that they are still unable to enjoy banks and
financial institutions‘ financing because there is still lack of support from government institutions and policy
makers, and some internal weaknesses and flaws that still have been faced by SMEs in managing their
businesses.
Akram, et al. (2011) state the important of Islamic banks to emphasis on their role in regards to
corporate social responsibility (CSR). They remark by citing from (Uddin, 2003) that ―As the social
responsibility is emphasized by Islam; Islam said that you must take great care of others as you take care of
yourself. So, in Islamic banking sector there is also need of corporate social responsibility and it playing its role
by investing in the companies who deals mainly in that or by taking action or steps in the social responsibility of
corporate. In ethical principles of Islam social behavior is one of the principles and Islam takes care as a whole
of human wellbeing‖. From that explanation, it is very clear and we can understand why Islamic banks tend to
finance SBs, this is because they have highly regarded with their corporate social responsibility and CSR has
also highly recommended by Islamic ethics.
Sharia banking in Indonesia
The first modern experience of Islamic banking was undertaken in Egypt that was led by Ahmad El Najjar, who
took the form of a savings bank based on profit-sharing in the Egyptian town of Mit- Ghamr in 1963 (Aburime
and Alio, 2009: 322). The bank then became very popular and prospered until the experiment lasted in 1967,
when there were nine such banks in the country.Those banks operate with no interest and their investment were
concentrated on trade and industry.
Since then, the development of Islamic banks was spread over other regions in North Africa and the
Midle East. According to Aburime and Alio (2009), other isamic banks were established in the 1970s such as
Dubai Islamic Bank in 1975; Faisal Islamic Bank of Sudan in 1977; Faisal Islamic Bank of Egypt in 1977; and
Bahrain Islamic Bank in 1979.
The huge number of Islamic banks has grown up in the last the two decades. Indonesia itself has begun
the new era of Islamic banking since 1992 when Bank Muammalat Indonesia, the first sharia bank in Indonesia,
was built. Since then the term of sharia bank or Islamic bank has not been as the only wishful of thinking, but it
has come to the reality in the life of Indonesian society. For devout Islamic populace in the country, the presence
of sharia bank has fulfilled their needs in performing any transactions without any doubts in term of ―fiqh
muammalat‖ (the Islamic law). Of course, the presence of the only one Islamic bank cannot fulfill the desires of
all moslem-communities in Indonesia since the bank only has several branches in some major cities in Indonesia
so that they could not reach all moslem-communities in all over the country.
In order to ease the development of Islamic banks, the government of Indonesia (GOI) produced the
new act of Indonesian banking (UU No. 8/1998) which adopted many kinds of sharia banks terms such as
products, transaction system as well as the possibility of new sharia banks to be built and its branches in any
cities in Indonesia. The supports of government through that the new act has attracted the other Islamic banks
established in the following years, such as PT. Bank Syariah Mandiri in 1999, and PT. Bank Sharia Mega
Indonesia which was built in 2004. The total number of sharia banks in Indonesia today has been 11 full-pledge
Islamic banks with some conventional banks opened sharia window through dual banking system.
Small business finance and bank efficiency
Studies about SBF (small business finance) have been done by the couples of authors. They generally focus on
the investigation of the factors determining small business finance in commercial banks [(Strahan and Wetson,
1998); (Peek and Rosengren, 1998); (Berger et.al, 2001), (Scott and Dulkenberg, 2003), (Berry and Grant,
2004); (Clarke et.al, 2005)].
There are also abundant researches about bank performance. Many authors use two types of
measurements. The first is financial performance. This performance demonstrates how strong the financial
condition of the company in terms of profitability and the ability to make value added. ROA (return on assets),
ROE (return on equity), NIM (net interest margin) are the examples of this measurement. The second

Proceedings of the Asia Pacific Conference on Business and Social Sciences 2015, Kuala Lumpur
(in partnership with The Journal of Developing Areas)
ISBN 978-0-9925622-2-9
618
measurement is efficiency performance. This performance demonstrates how efficient is the company in using
inputs in order to get outputs. The measurement can be proxied by TE (technical efficiency), CE (cost
efficiency) and PE (profit efficiency). There are two popular techniques in measuring the efficiency: A non-
parametric technique DEA (data envelopment analysis) and a parametric technique SFA (stochastic frontier
approach). For this research, The DEA technique is employed to estimate the efficiency of Indonesian Banks.
Several researchers use this measurement [Bonin et al., 2005; Mamatzakis et al., 2008; Hamiltona et.al, 2010;
Chan and Abdul Karim, 2010; Margono, et.al, 2010; Fang et al., 2011; Fethi et.al, 2011; Hadad et.al, 2011].
This research employs the DEA with 3 models with different output variables and input variables (See
the methodology: specification of bank outputs). One of the most interesting of this research resides in the
decomposition of loans into small business loans (finance) and other finance in model 2 due to the fact that
small business finance is one of the most important financing portfolios in banking sector in Indonesia. Based
on those models, the technical efficiencies of Indonesian banks are then generated through DEA estimation and
the comparison of efficiency between sharia banks and conventional banks are revealed and elaborated. In
addition, the determinants of its efficiency either for sharia banks and conventional banks are derived through
TOBIT regressions.
From above discussion, the research questions of this study are as follows:
1. What are the technical efficiencies of conventional banks and sharia banks in Indonesia during the
period 2002-2010?
2. What factors affected the technical efficiencies of conventional banks and sharia banks in Indonesia
durng the period 2002-2010?
DATA AND METHODOLOGY
Data
This research employs the data of all commercial banks in Indonesia provided by Central Bank of Indonesia
(Bank Indonesia) and the data provided by PT. Ekofin Konsulindo with the criteria as follows : the samples are
all commercial banks operated in Indonesia, encompassing conventional banks and sharia banks. The data are in
annual basis and complete for each bank over the period of 2002-2010.
There are 116 banks that fulfilled the criteria consisting of 109 conventional banks and 7 sharia/islamic
banks. Those 109 conventional banks covers 4 State-owned banks, 33 private foreign exchange banks, 24
foreign non-exchange banks, 26 provincial-government banks, 15 joint-venture banks and 9 foreign-owned
banks. All sharia banks are privately-owned foreign exchange banks.
Methodology
This study operates in two stages. In the first stage, efficiency levels for each bank are estimated through Data
Envelopment Analysis and in the second stage the determinants of Indonesian banks efficiencies are derived
through TOBIT-regression.
Data envelopment analysis
Actually there are two extensive methods utilized by researchers to estimate efficiency, SFA (stochastic frontier
analysis) and DEA (data envelopment analysis). SFA is of parametric techniques, which is based on maximum
likelihood or other classical or Bayesian, whereas DEA is one of non-parametric techniques which uses linear
programming methods.
In this study, DEA is chosen to estimate the efficiency of each bank. DEA is widely used to measure
the efficiency of economic entities and has been adopted by many studies, for example in banking Industry
[Fethi et.al (2011), Shin and Kim (2011), Sufian (2010, 2011), Gardener et.al (2011), Kenjegalieva et al. (2009),
Yao et al. (2008), Kao and Liu (2004), Drake and Hall (2003)]. DEA is very popular to apply since it has some
advantages: 1) DEA is a mathematical linear programming model and it does not need pre-specification in the
model (function). 2) DEA is more flexible in terms of its ability to take into accounts for multiple outputs and
inputs in estimating the efficiency (Suzuki and Sastrosuwito, 2011). In addition, some other advantages are
DEA is that it works relatively well with small sample.
The explanation about the DEA efficiency will start with the very base concept of productivity with the
notion of ratio of output to input for firm ‗i‘ as follows:
⁄ (1)

Proceedings of the Asia Pacific Conference on Business and Social Sciences 2015, Kuala Lumpur
(in partnership with The Journal of Developing Areas)
ISBN 978-0-9925622-2-9
619
Where is the vector of M outputs and is the vector of K inputs. And then the optimal weights are
defined by the programming problem,
Maximize wrt α,β: ⁄ (2)
Subject to ⁄ (3)
(4)
(5)
In order to maximize the efficiency of firm s subject to the restriction that the efficiencies of all firms
are less than or equal to one and all weights are nonnegative, the optimal weight are required. The objective
function is homogeneous of degree zero, so that any various weights will produce the same solution, then that
condition need to be treated by a normalization such as with a restriction such as = 1.
By transforming and simplifying that problem, it will produce:
Maximize wrt α,β: (6)
Subject to (7)
(8)
(9)
β (10)
and for the minimizing form:
Minimize wrt: (11)
Subject to ∑ (12)
∑ (13)
(14)
Where is the input oriented technical efficiency score for ith firm.
= (15)
That measure exhibits the ability of the firm to reduce inputs in gaining the same output – reatively
compared to other firms in the sample. In the sample, it could be found that some firms will have the efficiency
score of 1.0. This points out that the firms are considered efficient, otherwise, In the estimation of efficiency, some assumptions can be used, namely CRS (constant returns to scale)
and VRS (variable return to scale). Those above formulations are constructed based on the CRS assumption.
That assumption f VRS can be applied by adding a restriction as follows:
∑ (16)
VRS assumption has been applied by many authors in their estimations. With those efficiency scores
derived from CRS and VRS assumptions, the ‗scale officiency‘ of each firm can be gauged.
⁄ (17)
Where is scale efficiency, denotes the technical efficiency measure gained under the CRS and
represents the efficiency under VRS counterpart.
The other alternative outlook of the optimization process is that the output oriented. Through this type
of the orientation, it is assumed that output could believably be increased by utilizing the same inputs,
corresponding with the standard of other firms in the sample. The output orientation of DEA can be produced by
this equation:
Maximize wrt : (18)
Subject to ∑ (19)
∑ (20)
(21)
Where is the output-oriented technical efficiency score for ith firm.

Proceedings of the Asia Pacific Conference on Business and Social Sciences 2015, Kuala Lumpur
(in partnership with The Journal of Developing Areas)
ISBN 978-0-9925622-2-9
620
= (22)
That equation was made under the assumption of CRS. The form of VRS can be applied by adding up
the restriction∑ . In this solution, the measurement of technical efficiency would be
⁄ . With that calculation, some firms would be identified to be technically efficient.
Specification of bank inputs and outputs
In estimating the efficiency of a bank, there are two prominent approach could be employed to determine the
inputs and outputs: production approach and intermediation approach. Production approach treats banking
industry similar to any indutries that produce goods and services. Therefore it views material, capital and human
resources as production factors to provide output. The inputs in this approach can be general and administrative
expenses, labor cost, price of capital, etc and the output are deposits, loans and others. On the other hand,
intermediation approach considers bank as financial intermediary between depositors and lenders so that
deposits are placed as input beside other resources used, and loans and any other income are put as the output.
In this study intermediation approach was chosen with total loans/finance, small business finance and
other finance as outputs, and general and administrative expenses, fixed assets, and total deposits are treated as
inputs. Three models would be used with the model 1 incorporate total finance and securities and investments as
output. Model 2 decomposed total finance into small business finance and other finance, along with securities
and investments as outputs. Model 3 excludes small business finance and left other finance, and securities &
investments as outputs. Those three models employs the same components of inputs, namely general and
administrative expenses, fixed assets, total-deposits.
Multiple regressions
It is also of considerable interest to estimate the determinants of Indonesian banking efficiency which have been
gained from the DEA technique. By utilizing the efficiency scores as the dependent variable, the following
model is employed:
∑ (23)
Where is a technical efficiency of ith bank in period-t derived through DEA. Bank characteristics factors
are a set of bank characteristics which indicate the specific feature of banking operation. Economic factors are a
vector of macroeconomic factors that represent the condition of economy in the country (Indonesia).
In this stage, since the efficiency scores are constrained between zero and one, the TOBIT-regression
is employed. Some authors adopt the regression in their research [(Chang et.al (1998); Nikiel and Opiela
(2002); Casu and Molyneux (2003); Havrylchyk (2005); Grigorian and Manole (2006); Ariff and Can (2008);
Sufian (2010); Gardener et.al (2011)].
The standard Tobit-regression model is defined as follows:
(24)
(25)
Where is a latent variable, is technical efficiency score obtained from DEA approach. is a set of
parameters to be estimated and denotes the error term.
The equation of the regression is specified as follows:
= b0 + b1 + b2 + b3 + b4 + b5 + b6 + b7 + b8
+ b9 + . (26)
Where:
Technical efficiency of ith bank in period t derived from the DEA approach.
Natural logarithm of total assets (LNTA) as a proxy for the bank’s size.
Return on assets (ROA) is assigned to represent the bank’s profit.
Capital adequacy ratio has been assigned to embody the bank capital. Capital adequacy
ratio (CAR) is measured by calculating bank capital divided by risky-weighted assets.
Bank liquidity means the ability of a bank to cover its short-tem liabilities. Loans to

Proceedings of the Asia Pacific Conference on Business and Social Sciences 2015, Kuala Lumpur
(in partnership with The Journal of Developing Areas)
ISBN 978-0-9925622-2-9
621
deposits ratio (LDR) is allocated to demonstrate the bank liquidity.
Non-performing loans (NPL) is assign to for signify the bank’s risk.
Annual inflation rate. This measures the overall percentage increase in the consumer price
index for all goods and services n Indonesia.
Annual real GDP (gross domestic product) growth rate. The growth of Indonesia‘s total
goods and services adjusted for inflation.
Annual unemployment rate in Indonesia.
US Dollar exchange rate
Error term
EMPIRICAL RESULTS
Descriptive statistics
The data of variables that generates technical efficiency of Indonesian commercial banks over the period 2002-
2010 are as follows:
TABEL 1. INPUTS AND OUTPUTS
IDR Millions
Total
Finance
SBs
Finance
Other
Finance
Securiti
es &
Investm
ents
Genera
l &
Admin
Fixed
Assets
Total
Deposits
Mean
8,170,70
9.25
1,005,9
95.23
7,164,71
4.02
5,498,72
7.87
463,404
.59
224,99
9.65
12,294,227.
45
Std
Dev
22,376,6
35.79
4,376,5
27.03
19,388,3
70.60
16,975,9
06.96
1,260,6
03.31
656,03
6.67
35,659,342.
17
Maxi
mum
246,968,
128.00
75,374,
672.67
207,555,
180.89
137,260,
529.00
15,645,
936.00
5,290,3
84.00
332,727,856
.00
Mini
mum
1,229.00
0.00
53.00
5,981.00
2,060.0
0
112.00
156.00
Sources: Data Observed
The above table demonstrates the descriptive statistics of DEA inputs and outputs employed in this
study covering minimum, maximum, mean, and standard deviation. The table points out the disparity of banking
operation in Indonesia from the small scale banks and the large banks. The data are spread from small scale
banks until big banks which employ the large amount of resources. Other intriguing information that could be
revealed from the data is that there are some commercial banks having zero balance (null finance portfolio) for
SBs finance even the Central Bank of Indonesia imposed all commercial banks to maintain the minimum of 20
percent in their loans/financing portfolios. Those banks may still not aware of the importance of SBs finance in
supporting the development of SBs in Indonesia. The reason of not financing SBs may be due to the
characteristic of SBs which are still lack of managerial skills and less of collateral. In percentage, out of all 116
commercial banks‘ finance within the period 2002-2012, the proportion of small business finance is only 15.64
percent, meaning that the concentration of commercial banks finance/lending was still on other financing which
are fragmented in corporate finance and consumer finance. Unfortunately the data of the portfolio financings for
corporate and consumer sectors are not available in details.

Proceedings of the Asia Pacific Conference on Business and Social Sciences 2015, Kuala Lumpur
(in partnership with The Journal of Developing Areas)
ISBN 978-0-9925622-2-9
622
TABLE 2. THE PORTION OF SMALL BUSINESS FINANCE (% OF TOTAL FINANCE)
Type 2002 2003 2004 2005 2006 2007 2008 2009 2010 Avg.
FB 0.00% 0.00% 0.00% 0.00% 0.00% 0.20% 0.27% 0.05% 0.28% 0.09%
JVB 3.01% 3.46% 1.79% 1.62% 1.11% 1.39% 1.23% 1.04% 1.56% 1.80%
LGOB 43.73
%
39.94
%
34.39
%
31.29
%
23.19
%
19.60
%
17.84
%
16.93
%
16.85
%
27.09
%
PB 19.64
%
18.66
%
18.23
%
16.67
%
15.81
%
14.42
%
12.47
%
13.04
%
11.16
%
15.57
%
SHARI
A
19.21
%
16.79
%
13.76
%
11.84
%
30.80
%
32.78
%
27.02
%
30.41
%
27.58
% 23.35
%
SOB 29.00
%
26.78
%
25.85
%
24.43
%
25.47
%
25.76
%
24.62
%
24.96
%
26.47
%
25.93
%
Avg 19.10
%
17.61
%
15.67
%
14.31
%
16.06
%
15.69
%
13.91
%
14.41
%
13.98
%
15.64
%
Notes: For the ownership, there are state-owned banks (SOB), foreign-owned banks (FB), joint-
venture banks (JVB), private banks (PB), and local government-owned banks (LGOB). For the
operation, there are conventional banks (CONV) and islamic banks (SHARIA). For the foreign
exchange (FEB) operation, there are also two groups of banks, namely foreign exchange banks (FEB)
and non foreign exchange banks (NFEB).
The table reveals that LGOB (local government-owned banks), SHARIA (sharia banks) and SOB
(state-owned banks) have fulfilled the minimum requirement requested by CBI (central bank of Indonesia/BI)
proven that they recorded more than 20 percent of their finance are in small business finance. The highest
average SBs finance is achieved by LGOB. It is sensible that those banks are particularly located in their own
provinces and They have many branches throughout many regencies/municipalities. They succesfully use their
locations as their advantage to provide financing for SBs more easily. SOB has also been recorded as the second
highest group of banks that provide financing for SBs. The achievement of SOBs is highly supported by the
high reputation of PT. Bank Rakyat Indonesia (BRI). PT. BRI has been recognized as one of the largest and
most successful microfinance institutions in the world (Patten, et al., 2001). SHARIA banks has become the
third group of banks which has average portfolio SBs finance of more than 20% during 2002-2010. They have
proven that the operation of SHARIA banks is not only to make profit but also to contribute to the social
improvement of Indonesian society through SBs considering that they are as the great majority of the economic
players in Indonesia. The SHARIA banks‘ contribution to finance SBS has become one of their CSR (corporate
social responsibility) actions.
On the other hand, FB and JVB seems to have a very low average of SBs financing during the period with 0.09
percent and 1.80 percent respectively. They may be still reluctant to finance SBs because They seems to assess
that SBs are of less feasible than other sectors.
Efficiency estimation
The average technical efficiency of commercial banks in Indonesia for all models are provided in figure 1a,
figure 1b, and figure 1c.

Proceedings of the Asia Pacific Conference on Business and Social Sciences 2015, Kuala Lumpur
(in partnership with The Journal of Developing Areas)
ISBN 978-0-9925622-2-9
623
FIGURE 1A. AVERAGE TECHNICAL EFFICIENCY (MODEL 1)
FIGURE 1B. AVERAGE TECHNICAL EFFICIENCY (MODEL 2)
FIGURE 1C. AVERAGE TECHNICAL EFFICIENCY (MODEL 3)
These the three figures show that the efficiency of Indonesian commercial banks tended to decline
over the period 2002-2010. The decline tendencies occured in 2006, 2008 and 2009 and they started to rise in
2010. The mini financial crisis (2004/2005) and global financial crisis (2007-2008) seems to contribute to the
decline of Indonesian banking efficiency. These results confirm the findings of the previous studies (Suzuki and
Sastrosuwito, 2011; Hadad et.al, 2011b).
It can be observed from those figures, that after suffering the decline in 2008 and 2009, those average
efficiencies tend to rise in 2010. The good environment through some improvements in macroeconomic
indicators and the condition of Indonesian banking industry in 2010 have helped Indonesian banking efficiency
to recover. Table 3 shows the evidence of Indonesian economic recovery has supported the Indonesian banking
0.6924 0.6812 0.6962 0.6905 0.6678 0.6647 0.5807
0.5232 0.5371
-
0.1000
0.2000
0.3000
0.4000
0.5000
0.6000
0.7000
0.8000
2002 2003 2004 2005 2006 2007 2008 2009 2010
EFFI
CIE
NC
Y SC
OR
E
YEAR
average technical efficiency - model 1
0.8070 0.7964 0.7755 0.7799 0.7412 0.7371 0.6679 0.6347 0.6475
-
0.2000
0.4000
0.6000
0.8000
1.0000
2002 2003 2004 2005 2006 2007 2008 2009 2010
EFFI
CIE
NC
Y SC
OR
E
YEAR
average technical efficiency - model 2
0.6563 0.6481 0.6472 0.6593 0.6379 0.6332 0.5524
0.4901 0.5060
-
0.1000
0.2000
0.3000
0.4000
0.5000
0.6000
0.7000
2002 2003 2004 2005 2006 2007 2008 2009 2010
EFFI
CIE
NC
Y SC
OR
E
YEAR
average technical efficiency - model 3

Proceedings of the Asia Pacific Conference on Business and Social Sciences 2015, Kuala Lumpur
(in partnership with The Journal of Developing Areas)
ISBN 978-0-9925622-2-9
624
efficiency. Unless the rise of inflation rate, the lending rate went down from 14.36 percent to 13.21 percent,
GDP growth rose from 4.60 percent to 6.10 percent, LDR rose from 83.93 percent to 87.18 percent, and CAR
rose from 25.08 percent to 27.39 percent. All those indicators has strengthened the Indonesian banking
efficiency in 2010.
TABLE 3. INDONESIAN ECONOMIC & BANKING INDICATORS
Year Inflation Lending Rate GDP
Growth
LDR CAR
2002 10.00% 18.76% 4.50% 65.18% 23.05%
2003 5.10% 16.48% 4.80% 67.47% 23.88%
2004 6.40% 14.68% 5.00% 73.30% 22.10%
2005 17.10% 16.24% 5.70% 75.56% 21.76%
2006 6.60% 15.92% 5.50% 73.22% 24.67%
2007 6.60% 14.05% 6.30% 77.18% 25.82%
2008 11.10% 15.34% 6.00% 89.06% 23.89%
2009 2.80% 14.36% 4.60% 83.93% 25.08%
2010 7.00% 13.21% 6.10% 87.18% 27.39%
Sources: Bank Indonesia
In terms of the average level of technical efficiency scores, table 4 demonstrates the average efficency
scores and their rankings based on ownership, operation, and FX exposure for model 1, model 2, and model 3.
From the table, it can be seen that the group of SOB are the most efficient banks in Indonesia within the period
in the model 1 and model 2 with the average efficiency scores of 0.966 and 0.989, and in the second place, FOB
with the average efficiency scores of 0.912 and 0.914. Those results confirmed the previous studies (Suzuki and
Sastrosuwito, 2011; Haddad, 2011a). The least efficient banks are PB and LGOB which have average
efficiency scores of below 0.750. Those estimations are under the assumption that all finance or loans are
included in the calculation of efficiency.
The different results are obtained in the model 3. When SBs finance was excluded in the estimation,
FB have become the most efficient ones, followed by SOB and JVB. The result can be understood since FOB
have only a small amount of SBs finance. The other result that can be revealed from this model is that almost all
groups of banks have lower efficiency scores compared to they obtained in model 1 and model 2. That result is
very interesting considering that when they considered SBs finance in their portfolios, their efficiency scores
became higher than those of excluding small business finance. This can be one recommendation that SBs
finance is also important in enhancing bank efficiency.
TABLE 4. RANKINGS OF INDONESIAN BANKS EFFICIENCY
Ownership TE_Model 1 Ranking TE_Model 2 Rankin
g
TE_Model 3 Ranking
SOB 0.966 1 0.989 1 0.861 2
FB 0.912 2 0.914 2 0.914 1
JVB 0.773 3 0.785 3 0.770 3
PB 0.574 4 0.678 5 0.535 4
LGOB 0.545 5 0.706 4 0.500 5
Operation TE_Model 1 Ranking TE_Model 2 Rankin
g
TE_Model 3 Ranking
CONV 0.636 1 0.725 2 0.604 1
SHARIA 0.595 2 0.834 1 0.465 2
FX Operation TE_Model 1 Ranking TE_Model 2 Rankin
g
TE_Model 3 Ranking
FEB 0.663 1 0.742 1 0.632 1
NFEB 0.534 2 0.678 2 0.482 2

Proceedings of the Asia Pacific Conference on Business and Social Sciences 2015, Kuala Lumpur
(in partnership with The Journal of Developing Areas)
ISBN 978-0-9925622-2-9
625
Notes: For the ownership, there are state-owned banks (SOB), foreign-owned banks (FB), joint-venture banks
(JVB), private banks (PB), and local government-owned banks (LGOB). For the operation, there are
conventional banks (CONV) and islamic banks (SHARIA). For the foreign exchange (FEB) operation, there are
also two groups of banks, namely foreign exchange banks (FEB) and non foreign exchange banks (NFEB).
In terms of their operations, SHARIA banks proves that when they consider SBs finance into their
account, they gain a higher efficiency score and they outperform conventional banks. SHARIA banks obtain
more effciency scores in model 2 instead of model 1 and model 3. When small business finance was excluded in
the estimation, their average efficiency dropped form 0.834 to 0.465. Sharia banks tend to finance SBs since
they engange with the business financing with lower risk (El-Gamal, 2005). SBs finance is considered to be
lower risk since the portfolios of SBs will spread over more accounts and as the portfolio theory explained that
the investment risk could be reduced by portfolio. In addition, Foreign exchange banks tend to have higher
efficiency scores than those of non foreign-exchange.
It is very interesting to explore why Sharia banks can have better efficiency scores when they paid
attention in providing finance for SBs in Indonesia during the period (in Model 2). This figure may be able to
answer the question.
FIGURE 2A. NUMBERS OF SHARIA BANKS AND THEIR EFFICIENCY (MODEL 2)
Figure 2a demonstrates that the number of sharia banks in Indonesia has grown up during the period
and the incline of numbers tend to have association with the attainment of their efficiency scores. Their
efficiency scores are below 0.800 for the period 2002-2005 but they tend to get their best performance within
2006-2009 before going down in 2009 and 2010.
FIGURE 2B. SBF PERCENTAGE AND BANK EFFICIENCY (MODEL 2)
Figure 2b demonstrates the average percentage of SBs finance of all finance portfolio for SHARIA and
conventional banks. SBFPEC (small business finance percentage) for conventional banks tend to decrease from
21.82 percent in 2002 to 10.86 percent in 2010 with the average SBFPEC of 15.52 percent, while SBFPEC for
sharia banks tend to increase even the decline occurred in 2002-2005. The average SBFPEC for Sharia banks in
2002 was 19.21 percent and in 2010 was 27.58 percent with the average of 23.35 percent. The figure also shows
that when Sharia banks added the proportion of small business finance in 2006, the efficiency scores also
0.632
0.801
0
1
2
3
4
5
6
7
8
0.000
0.200
0.400
0.600
0.800
1.000
1.200
2002 2003 2004 2005 2006 2007 2008 2009 2010
No. of SHARIA Banks
CONV
SHARIA
0
0.05
0.1
0.15
0.2
0.25
0.3
0.35
0
0.2
0.4
0.6
0.8
1
1.2
2002 2003 2004 2005 2006 2007 2008 2009 2010
CONV_SBFPEC
SHARIA_SBFPEC
Proceedings of the Asia Pacific Conference on Business and Social Sciences 2015, Kuala Lumpur
(in partnership with The Journal of Developing Areas)
ISBN 978-0-9925622-2-9
626
increased until the drop occurred in 2009 and 2010. From the figure, it can be concluded that the efficiency
score of Sharia banks tend to increase when they increase the proportion of their small business finance.
Another finding from that figure is that the decrease of SBs finance proportion of conventional banks has caused
also the deterioration in their efficiency within the period.
REGRESSION RESULTS
Descriptive statistics
Table 6. Descriptive statistics of bank specific explanatory variables
Description CONV SHARIA
mean(lnta) 14.8896 15.4790
mean(roa) 0.0230 0.0165
mean(car) 0.2446 0.1563
mean(ldr) 0.7650 0.9271
mean(npl) 0.0224 0.0239
st dev(lnta) 1.8463 0.9863
st dev(roa) 0.0649 0.0139
st dev(car) 0.1891 0.0959
st dev(ldr) 0.3772 0.1533
st dev(npl) 0.0301 0.0135
It can be observed from the data above, that conventional banks are better in some indicators such as
ROA, CAR and NPL/NPF (non-perforing loans/non peforming financing). Convetional banks have higher
profitability and capial adequacy than those of SHARIA banks. In terms of NPL/NPF, conventional banks has
less than that of SHARIA banks. However, those groups of banks have generally good performances since their
capital adequacy are more than 20 percent, and their non-performing loans/non-performing financings are less
than 5 percent.
Assets and LNTA (the natural logarithm of total assets) represents the size of bank. Since from the
bigger scale of banks it is expected to be more efficient, the expected direction from LNTA with efficiency is
positive. ROA (return on asstets) indicates a bank profitability which is expected that the more profitable the
bank, it is expected to be more efficient, so that the associatin between those variable are positive. CAR (capital
adequacy ratio) is a proxy for the bank capital and LDR (loans to deposits ratio) is a representative for the bank
liquidity. They are expected to have positive signs on bank efficiency. NPL (non performing loan) as the
indicator for bank risk is presumed to have a negative sign on the bank efficiency.
Some macroeconomic factors are employed in this study namely INF (inflation), GDPGR (economic
growth) and UNEMP (unemployment rate), USDRATE (USD rate against Indonesian Rupiah) as environmental
variables that are also presumed to affect the bank efficiency.
Determinants of Efficiency
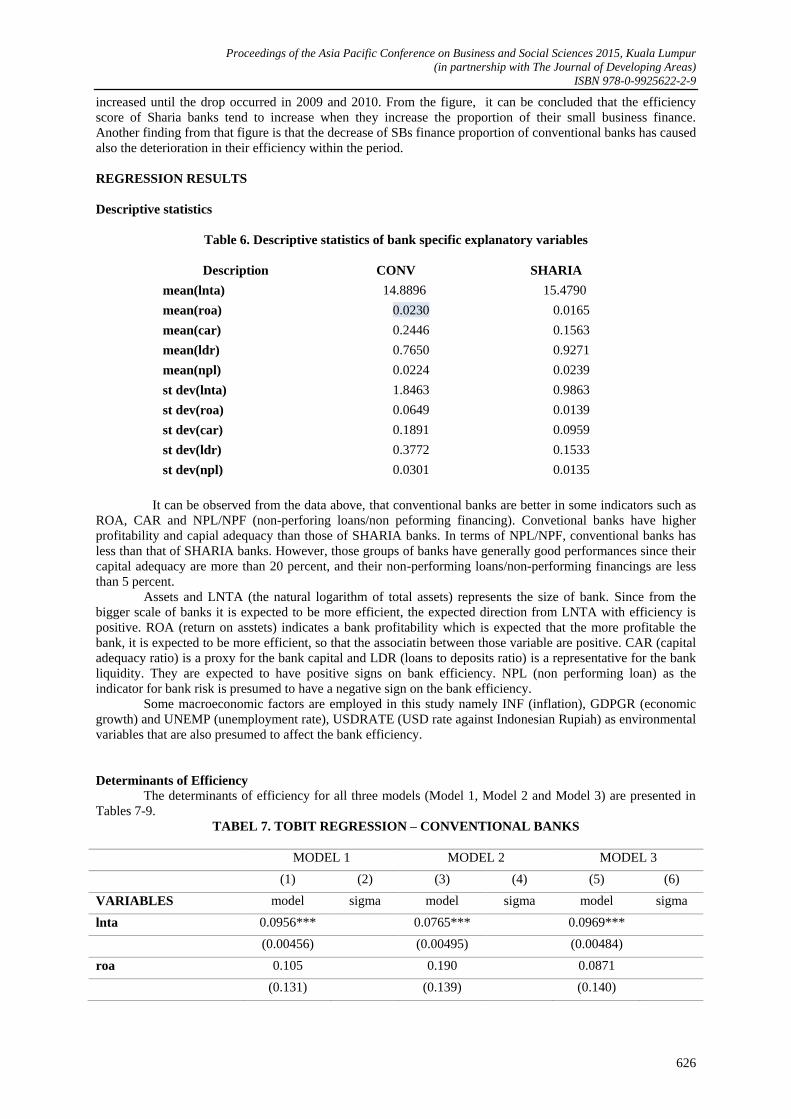
The determinants of efficiency for all three models (Model 1, Model 2 and Model 3) are presented in
Tables 7-9.
TABEL 7. TOBIT REGRESSION – CONVENTIONAL BANKS
MODEL 1 MODEL 2 MODEL 3
(1) (2) (3) (4) (5) (6)
VARIABLES model sigma model sigma model sigma
lnta 0.0956*** 0.0765*** 0.0969***
(0.00456) (0.00495) (0.00484)
roa 0.105 0.190 0.0871
(0.131) (0.139) (0.140)

Proceedings of the Asia Pacific Conference on Business and Social Sciences 2015, Kuala Lumpur
(in partnership with The Journal of Developing Areas)
ISBN 978-0-9925622-2-9
627
car 0.496*** 0.365*** 0.570***
(0.0503) (0.0532) (0.0540)
ldr 0.0987*** 0.122*** 0.0782***
(0.0221) (0.0245) (0.0235)
npl 0.680** 0.115 0.802**
(0.329) (0.350) (0.352)
infl 0.00852*** 0.0124*** 0.00823***
(0.00267) (0.00288) (0.00285)
gdpgr -0.0845*** -0.120*** -0.0776***
(0.0145) (0.0157) (0.0155)
unemp 0.0518*** 0.0366*** 0.0517***
(0.00847) (0.00911) (0.00906)
usdrate -
0.000120***
-
0.000133***
-
0.000115***
(1.74e-05) (1.88e-05) (1.86e-05)
Constant 0.0557 0.231*** 0.893*** 0.245*** -0.0831 0.248**
*
(0.237) (0.00606) (0.256) (0.00682) (0.254) (0.00645
)
No. of Observations 981 981 981 981 981 981
Pseudo R-square 0.6203 0.4085 0.5249
*** p<0.01, ** p<0.05, *
p<0.1
In the model 1-3 regressions for CONVENTIONAL Banks, it can be seen that LNTA, CAR, and LDR are
conclusive for the three models with the positive sign. The result indicates that the size of banks has
significantly a positive association with the technical efficiency. Capital adequacy has also a positive association
with the technical efficiency and liquidity has also a positive association with the efficiency. All macroeconomic
factors included in this model have also significant impact on bank efficiency.
TABLE 8. TOBIT REGRESSION – SHARIA BANKS
MODEL 1 MODEL 2 MODEL 3
(1) (2) (3) (4) (5) (6)
VARIABLES model sigma model sigma model sigma
lnta 0.0456 -0.110** 0.0990*
(0.0456) (0.0505) (0.0491)
roa -0.0597 10.08** -4.488
(2.998) (4.398) (3.227)
car 0.238 -0.562 0.523
(0.477) (0.431) (0.515)
ldr 0.379 0.360 0.231
(0.262) (0.240) (0.281)
npl 6.762** 12.35*** 4.963
(3.065) (3.400) (3.283)
infl -0.0183 -0.0405* -0.00704

Proceedings of the Asia Pacific Conference on Business and Social Sciences 2015, Kuala Lumpur
(in partnership with The Journal of Developing Areas)
ISBN 978-0-9925622-2-9
628
(0.0141) (0.0210) (0.0151)
gdpgr 0.139 0.414*** 0.0862
(0.0878) (0.138) (0.0937)
unemp 0.132*** 0.0800 0.121**
(0.0411) (0.0538) (0.0435)
usdrate -2.54e-05 0.000215** -1.59e-05
(8.76e-05) (9.28e-05) (9.45e-05)
Constant -2.193 0.180*** -2.774 0.150*** -2.737* 0.194***
(1.392) (0.0250) (1.618) (0.0261) (1.490) (0.0265)
No. of Observations 30 30 30 30 30 30
*** p<0.01, ** p<0.05, *
p<0.1
In the model 1-3 regressions for SHARIA Banks, it can be seen that from bank specific factors, there is no
variables which have significantly affects bank efficiency for all model. It is noted that LNTA is significant for
model 2 with alpha 5% and for model 3 with alpha 10%. The direction of association is negative for model 2
and positive for model 3. ROA has a positive significant association with the technical efficiency for the only
model 2. The positive association between ROA and TE-model2 means that as much higher the profitability of a
bank, the efficiency of the bank would also increase. NPL or NPF (non performing loans/financing) exhibits
significant positive association with the technical efficiency in the model 1 and model 2. For macroecoomic
variables, there are no conclusive results for the three models. However, it is noting that UNEMP
(unemployment) has a positive significant either in model 1 and model 3.
TABLE 9. TOBIT REGRESSION (CONVENTIONAL AND SHARIA BANKS WITH DUMMY
VARIABLE)
MODEL 1 MODEL 2 MODEL 3
(1) (2) (3) (4) (5) (6)
VARIABLES model sigma model sigma model sigma
lnta 0.0955*** 0.0760*** 0.0969***
(0.00453) (0.00497) (0.00480)
roa 0.114 0.213 0.0871
(0.130) (0.140) (0.140)
car 0.487*** 0.345*** 0.566***
(0.0499) (0.0532) (0.0535)
ldr 0.101*** 0.125*** 0.0783***
(0.0220) (0.0247) (0.0233)
npl 0.729** 0.218 0.842**
(0.327) (0.351) (0.349)
infl 0.00777*** 0.0113*** 0.00785***
(0.00262) (0.00287) (0.00280)
gdpgr -0.0797*** -0.111*** -0.0741***
(0.0143) (0.0157) (0.0153)
unemp 0.0542*** 0.0376*** 0.0531***
(0.00829) (0.00904) (0.00885)
usdrate -0.000118*** -0.000127*** -0.000112***
(1.71e-05) (1.86e-05) (1.82e-05)
d 0.0473 -0.138*** 0.140***
(0.0435) (0.0491) (0.0464)
Proceedings of the Asia Pacific Conference on Business and Social Sciences 2015, Kuala Lumpur
(in partnership with The Journal of Developing Areas)
ISBN 978-0-9925622-2-9
629
Constant -0.0524 0.230*** 0.933*** 0.248*** -0.274 0.247***
(0.237) (0.00594) (0.259) (0.00681) (0.254) (0.00631)
Observations 1,011 1,011 1,011 1,011 1,011 1,011
Pseudo R-square 0.6241 0.3898 0.5344
*** p<0.01, ** p<0.05, * p<0.1
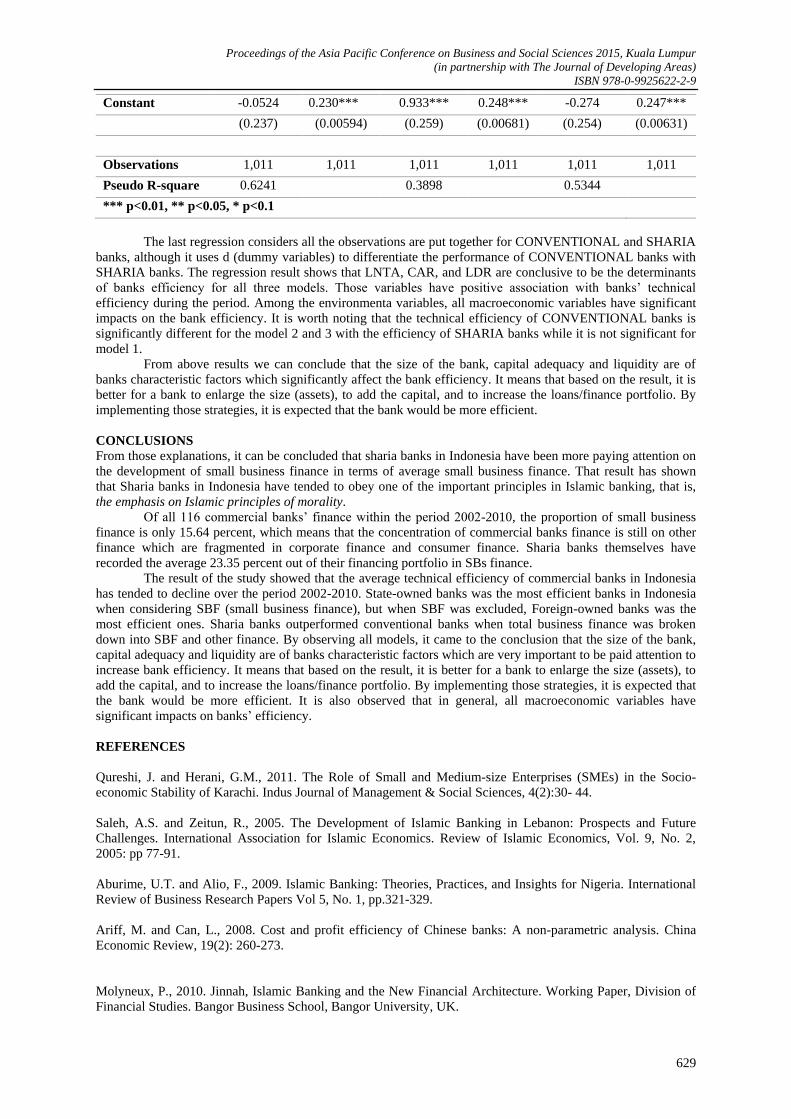
The last regression considers all the observations are put together for CONVENTIONAL and SHARIA
banks, although it uses d (dummy variables) to differentiate the performance of CONVENTIONAL banks with
SHARIA banks. The regression result shows that LNTA, CAR, and LDR are conclusive to be the determinants
of banks efficiency for all three models. Those variables have positive association with banks‘ technical
efficiency during the period. Among the environmenta variables, all macroeconomic variables have significant
impacts on the bank efficiency. It is worth noting that the technical efficiency of CONVENTIONAL banks is
significantly different for the model 2 and 3 with the efficiency of SHARIA banks while it is not significant for
model 1.
From above results we can conclude that the size of the bank, capital adequacy and liquidity are of
banks characteristic factors which significantly affect the bank efficiency. It means that based on the result, it is
better for a bank to enlarge the size (assets), to add the capital, and to increase the loans/finance portfolio. By
implementing those strategies, it is expected that the bank would be more efficient.
CONCLUSIONS
From those explanations, it can be concluded that sharia banks in Indonesia have been more paying attention on
the development of small business finance in terms of average small business finance. That result has shown
that Sharia banks in Indonesia have tended to obey one of the important principles in Islamic banking, that is,
the emphasis on Islamic principles of morality.
Of all 116 commercial banks‘ finance within the period 2002-2010, the proportion of small business
finance is only 15.64 percent, which means that the concentration of commercial banks finance is still on other
finance which are fragmented in corporate finance and consumer finance. Sharia banks themselves have
recorded the average 23.35 percent out of their financing portfolio in SBs finance.
The result of the study showed that the average technical efficiency of commercial banks in Indonesia
has tended to decline over the period 2002-2010. State-owned banks was the most efficient banks in Indonesia
when considering SBF (small business finance), but when SBF was excluded, Foreign-owned banks was the
most efficient ones. Sharia banks outperformed conventional banks when total business finance was broken
down into SBF and other finance. By observing all models, it came to the conclusion that the size of the bank,
capital adequacy and liquidity are of banks characteristic factors which are very important to be paid attention to
increase bank efficiency. It means that based on the result, it is better for a bank to enlarge the size (assets), to
add the capital, and to increase the loans/finance portfolio. By implementing those strategies, it is expected that
the bank would be more efficient. It is also observed that in general, all macroeconomic variables have
significant impacts on banks‘ efficiency.
REFERENCES
Qureshi, J. and Herani, G.M., 2011. The Role of Small and Medium-size Enterprises (SMEs) in the Socio-
economic Stability of Karachi. Indus Journal of Management & Social Sciences, 4(2):30- 44.
Saleh, A.S. and Zeitun, R., 2005. The Development of Islamic Banking in Lebanon: Prospects and Future
Challenges. International Association for Islamic Economics. Review of Islamic Economics, Vol. 9, No. 2,
2005: pp 77-91.
Aburime, U.T. and Alio, F., 2009. Islamic Banking: Theories, Practices, and Insights for Nigeria. International
Review of Business Research Papers Vol 5, No. 1, pp.321-329.
Ariff, M. and Can, L., 2008. Cost and profit efficiency of Chinese banks: A non-parametric analysis. China
Economic Review, 19(2): 260-273.
Molyneux, P., 2010. Jinnah, Islamic Banking and the New Financial Architecture. Working Paper, Division of
Financial Studies. Bangor Business School, Bangor University, UK.

Proceedings of the Asia Pacific Conference on Business and Social Sciences 2015, Kuala Lumpur
(in partnership with The Journal of Developing Areas)
ISBN 978-0-9925622-2-9
630
Akram, M.; and Rafique, M.; and Alam, H.M., 2011. Prospects of Islamic Banking: Reflections from Pakistan.
Australian Journal of Business and Management Research. Vol.1 No.2 May-2011.
Ametefe, F.; Aboagye, A.Q.Q.; and Kuman-koma, E.S., 2011. Housing and Contraction Finance, Deposit
Mobilisation, and Bank Performance in Ghana. Journal of Property Research, 28: 2, 151 — 165.
Athanasoglou, P. P.; Brissimis, S.N., and Delis, M.D., 2008. Bank-specific, Industry-specific and
Macroeconomic Determinants of Bank Profitability. Journal of International Financial Markets, Institutions &
Money 18 : 121-136.
Berger, A.N.; Klapper, L.F., and Udell, G.F., 2001. The Ability of Banks to Lend to Informationally Opaque
Small Businesses. Journal of Banking & Finance 25: 2127-2167.
Berger, A.N.; Hasan, I., and Zhou, M., 2010. The Effects of Focus versus Diversification on Bank Performance:
Evidence from Chinese Banks. Journal of Banking & Finance 34: 1417-1435.
Berry, A. and Grant, P., 2004. European Bank Lending to the UK SME Sector. International Small Business
Journal Vol. 22 (2): 115-130.
Bikker, J. A., and Haaf, K., 2002. Competition, Concentration and Their Relationship: An Empirical Analysis of
the Banking Industry. Journal of Banking and Finance 26: 2191-2214.
Bonin, J.P.; Hasan, I. and Paul W., 2005. Bank Performance, Efficiency and Ownership in Transition Countries.
Journal of Banking & Finance 29: 31-53.
Brealey, R.A., Myers, S.C., and Allen, F. (2011). Principles of corporate finance. 10th Edition. McGraw-
Hill/Irwin.
Casu, B. and Molyneux, P., 2003. A comparative study of efficiency in European Banking. Applied Economics,
35: 1865-1876.
Chan, S.G, and Abd Karim, M.Z., 2010. Bank Efficiency and Macroeconomic Factors: the Case of Developing
Countries. Global Economic Review, 39:3, 269-289.
Chang, C.E., Hasan, I., & Hunter, W., 1998. Efficiency of multinational banks: An empirical investigation.
Applied Financial Economics, 8: 689-696.
Clarke, G; Cull, R.; Peria, M.S. M., and Sanchez, S.M., 2005. Bank Lending to Small Businesses in Latin
America: Does Bank Origin Matter?. Journal of Money, Credit and Banking, Vol. 37, No. 1 (Feb, 2005), pp. 83-
118.
Devaney, M. and Weber, W.L., 2002. Small-Business Lending and Profit Efficiency in Commercial Banking.
Journal of Financial Services Research 22:3, 225-246.
Drake, L. and Hall, M.J.B., 2003. Efficiency in Japanese banking: An empirical analysis. Journal of Banking &
Finance 27 (2003) : 891-917.
Dunkelberg, W. C., 1998. Credit, Banks and Small Business in America. Journal of Banking & Finance 22 :
1085-1088.
El-Gamal, M. A, 2005. Islamic Bank Corporate Governance and Regulation: A Call for Mutualization. Rice
University.
Fang, Y.; Hasan, I, and Marton, K., 2011. Bank Efficiency in South-Eastern Europe: The Role of Ownership,
Market Power, and Institutional Development. Economics of Transition Volume 19 (3), 495-520.
Fethi, M. D. and Pasioras, F., 2010. Assessing Bank Efficiency and Performance with Operational research and
Artificial Intelligence Techniques: A Survey. European Journal of operation Research 204: 189-198.

Proceedings of the Asia Pacific Conference on Business and Social Sciences 2015, Kuala Lumpur
(in partnership with The Journal of Developing Areas)
ISBN 978-0-9925622-2-9
631
Fethi, M.D.; Shaban, M., and Jones, T. W., 2011. Liberalisation, Privatisation, and the Productivity of Egyptian
banks: A Non-parametric Approach. The Service Industries Journal, 31:7, 1143-1163.
Fu, X. (Maggie) and Heffernan, S., 2009. The Effects of Reform on China‘s Bank Structure and Performance.
Journal of Banking & Finance 33: 39-52.
Gardener, E., Molyneux, P. and Nguyen-Linh, Hoai, 2011. Determinants of efficiency in South East Asian
Banking. The Service Industries Journal. 31:16, 2693-2719.
Gitman, L.J. (2011). Principles of managerial finance. 13th Edition, Global Edition, Pearson Education.
Grigorian, D.A. and Manole, V., 2006. Determinants of commercial banks performance in transition: An
application of data envelopment analysis. Comparative Economic Studies, 48: 497-522.
Haas, R.D.; Ferreira, D., and Taci, A., 2010. What Determines the Composition of Banks‘ Loan Portfolios?
Evidence from Transition Countries. Journal of Banking & Finance 34: 388-398.
Hadad, M.D.; Hall, M. J.B.; Kenjegalieva, K.A.; Santoso, W.; Satria, R., and Simper, R., 2011. Banking
Efficiency and Stock Market Performance: An Analysis of Listed Indonesian Banks. Rev Quant Finan Acc
37:1-20.
Hadad, M.D.; Hall, M.J.B.; Kenjegalieva, K.A.; Santoso, W., and Simper, R., 2011. Productivity Changes and
Risk Management in Indonesian banking: Malmquist Analysis. Applied Financial Economics, 21: 847-861.
Hamiltona, R., and Qasrawib, W., and Al-jarrah, I.M., 2010. Cost and Profit Efficiency in the Jordan Banking
Sector 1993-2006: A Parametric Approach. International Research Journal of Finance and Economics, ISSN
1450-2887 Issue 56.
Hasan, I. and Marton, K., 2003. Development and Efficiency of the Banking Sector in A Transitional Economy:
Hungarian Experience. Journal of Banking & Finance 27: 2249-2271.
Havrylchyk, O., 2005. Efficiency of the Polish banking Industry: Foreign versus domestic banks. Journal of
Banking and Finance, 30: 1975-1996.
Heffernan, S. A., and Fu, X., 2010. Determinants of Financial Performance in Chinese Banking. Applied
Financial Economics, 20: 20, 1585-1600.
Holden, K. and El-Bannany, M., 2004. Investment in Information Technology Systems and Other Determinants
of Bank Profitability in UK. Applied Financial Economics, 14: 5, 361-365.
Jayaratne, J. and Wolken, J., 1999. How important are Small Banks to Small Business Lending? New Evidence
from a Survey of Small Firms. Journal of Banking and Finance 23: 427-458.
Kannan, R.; Narain, A. and Gosh, S., 2001. Determnants of Net Interest Margin under Regulatory
Requirements: An Econometric Study. Economic and Political Weekly, Vol. 36, No. 4, Money, Banking &
Finance (Jan. 27 – Feb. 2, 2001), pp. 337-339+341-344.
Kao, C. and Liu, S.T., 2004. Predicting bank performance with financial forecasts: A case of Taiwan
commercial banks. Journal of Banking & Finance 28 (2004): 2353-2368.
Kenjegalieva, K.A.; Simper, R.; and Jones, T.G.W., 2009. Efficiency of transition banks: inter-country banking
industry trends. Applied Financial Economics, 2009, 19, 1531-1546.
Kunt, A.D. And Huizinga, H., 1999. Determinants of Commercial Bank Interest Margins and Profitability:
Some International Evidence. The World Bank Economic Review, Vol. 13, No. 2 (May, 1999), pp. 379-408.
Mamatzakis, E; Staikouras, C. and Filippaki, A.K., 2008. Bank Efficiency in the New European Union Member
States: Is There Convergence? International Review of Financial Analysis, 1156-1172.

Proceedings of the Asia Pacific Conference on Business and Social Sciences 2015, Kuala Lumpur
(in partnership with The Journal of Developing Areas)
ISBN 978-0-9925622-2-9
632
Margono, H.; Sharma, S.C., and Melvin II, P.D., 2010. Cost Efficiency, Economies of Scale, Technological
Progress and Productivity in Indonesian Banks. Journal of Asian Economics 21: 53-65.
Maudos, J.; Guevara, D; and Fernandez, J., 2004. Factors Explaining the Interest Margin in the Banking Sectors
of the European Union. Journal of Banking & Finance 28: 2259-2281.
Miller, S.M., and Noulas, A.G., 1997. Portfolio Mix and Large-bank Profitability in the USA. Applied
Economics, 29: 4, 505-512.
Molyneux, P. and Thornton, J., 1992. Determinants of European Bank Profitability: A Note. Journal of Banking
& Finance 16: 1173-1178.
Nikiel, E.M.and Opiela, T.P. 2002. Customer type and bank efficiency in Poland: Implications for emerging
banking market. Contemporary Economic Policy, 20: 255-271.
Patten, R.H.; Rosengard, J.K.; and Johnston, D.E., 2001. Microfinance success amidst macroeconomic failure:
The experience of Bank Rakyat Indonesia during the East Asian crisis. World Development Vol. 29, No. 6, pp.
1057-1069.
Peek, J. and Rosengren, E.S., 1998. Bank Consolidation and Small Business Lending: It‘s not just Bank Size
that Matters. Journal of Banking & Finance 22: 799-819.
Scott, J.A. and Dunkelberg, W.C., 2003. Bank Mergers and Small Firm Financing. Journal of Money, Credit
and Banking, Vol. 35, No. 6, Part 1 (Dec, 2003), pp. 999-1017.
Shaban, M., 2008. Financial Liberalisation, Privatisation, and Productivity in Banking: The Experience in Two
Emerging Economies. PhD Thesis, School of Management, University of Leicester, UK.
Shin, D.J. and Kim, B.H.S., 2011. Efficiency of the Banking Industry Structure in Korea. Asian Economic
Journal 2011, Vol. 25 No. 4, 355-373.
Strahan, P.E., and Weston, J.P., 1998. Small Business Lending and the Changing Structure of the Banking
Industry. Journal of Banking & Finance 22: 821-845.
Sufian, F. and Habibullah, M.S., 2009. Determinants of Bank Profitability in a Developing Economy: Empirical
Evidence from Bangladesh. Journal of Business Economics and Management, 10: 3, 207-217.
Sufian, F., 2010. The Impact of the Asian financial crisis on bank efficiency: the 1997 experience of Malaysia
and Thailand. Journal of International Development, 22, 866-889.
Sufian, F., 2011. Benchmarking the efficiency of the Korean banking sector: a DEA approach. Benchmarking:
An International journal Vo. 18 No. 1, 2011 pp. 107-127.
Suzuki, Y., and Sastrosuwito, S., 2011. Efficiency and Productivity Change of the Indonesian Commercial
Banks. 2011 International Conference on economics, Trade and development IPEDR vol.7, IACSIT, Singapore.
Timberg, T.A., 1999. Small and Micro-Enterprise Finance in Indonesia: What Do We Know?. USAID-funded
Partnership for Economic Growth (PEG) Projects. ECG, USAID Jakarta.
Valverde, S.C. and Fernandez, F.R., 2007.). The Determinants of Bank Margins in European Banking. Journal
of Banking & Finance 31: 2043-2063.
Williams, B., 1998. Factors Affecting the Performance of Foreign-owned Banks in Australia: A Cross Sectional
Study. Journal of Banking & Finance 22: 197-219.
Yao, S.; Han, Z.; and Feng, G., 2008. Ownership reform, foreign competition and efficiency of Chinese
Commercial Banks: A non-parametric approach. The World Economy: 1310-1326.
Greene, W.H. (2003). Econometrics Analysis, 5th Edition. Upper Saddle River: Prentice Hall.

Proceedings of the Asia Pacific Conference on Business and Social Sciences 2015, Kuala Lumpur
(in partnership with The Journal of Developing Areas)
ISBN 978-0-9925622-2-9
633
Department of Cooperative and Small Medium Enterprises, Republic of Indonesia, Jakarta Indonesia.
http://www.depkop.go.id/
Departemen Koperasi Republik Indonesia. Situs: http://www.depkop.go.id/
Statistik Perbankan Indonesia - Vol. 7, No. 1, Desember 2008, Bank Indonesia.
Undang-Undang Republik Indonesia Nomor 9 Tahun 1995 tentang Usaha Kecil.
APPENDICES
Table A. Business Entities Profile in Indonesia
No Description 2006 2007 2008 Growth
Total % Total % Total % %
1 Business
Unit
Micro and
Small
48,985,040 99.92 50,107,518 99.91 51,369,895 99.91 2.41%
Medium 36,763 0.07 38,282 0.08 39,717 0.08 3.94%
Large 4,577 0.01 4,463 0.01 4,650 0.01 0.85%
Total 49,026,380 100 50,150,263 100 51,414,262 100 2.41%
2 Contribution
to GDP
Micro and
small
1,346,654 42.46 1,596,027 42.61 1,982,886 42.24 21.38%
Medium 436,770 13.77 511,841 13.67 630,340 13.43 20.17%
Large 1,387,993 43.77 1,637,681 43.72 2,080,583 44.33 22.52%
Total 3,171,417 100 3,745,549 100 4,693,809 100 21.71%
Source: Department of Cooperative Republic of Indonesia
Figure A. The percentage of business entities numbers in Indonesia over the period 2006-2008
Source: Department of Cooperative Republic of Indonesia
Figure B. The Contribution of Business Entities in Indonesia over the period 2006-2008
0.00%
10.00%
20.00%
30.00%
40.00%
50.00%
60.00%
70.00%
80.00%
90.00%
100.00%
2006 2007 2008
99.92% 99.91% 99.91%
0.07% 0.08% 0.08% 0.01% 0.01% 0.01%
Micro and Small
Medium
Large
0.00%
10.00%
20.00%
30.00%
40.00%
50.00%
2006 2007 2008
Micro and small
Medium
Large

Proceedings of the Asia Pacific Conference on Business and Social Sciences 2015, Kuala Lumpur
(in partnership with The Journal of Developing Areas)
ISBN 978-0-9925622-2-9
634
Source: Department of Cooperative Republic of Indonesia


![UNIVERSITAS PADJADJARAN INDONESIA – TEAM 11 · PDF fileUNIVERSITAS PADJADJARAN INDONESIA – TEAM 11 ... Bowater v. Rowley Regis Corp. [1944] KB 476 (CA ... Kuwait Airways Corp v](https://static.fdocuments.in/doc/165x107/5a9db6b27f8b9abd0a8c4163/universitas-padjadjaran-indonesia-team-11-padjadjaran-indonesia-team.jpg)